| | | | |
| | | | OMB APPROVAL |
| | | | OMB Number: 3235-0570 Expires: August 31, 2020 Estimated average burden hours per response: 20.6 |
UNITED STATES
SECURITIES AND EXCHANGE COMMISSION
Washington, D.C. 20549
FORM N-CSR
CERTIFIED SHAREHOLDER REPORT OF REGISTERED
MANAGEMENT INVESTMENT COMPANIES
| | |
| Investment Company Act file number | | 811-05426 |
|
AIM Investment Funds (Invesco Investment Funds) |
| (Exact name of registrant as specified in charter) |
|
11 Greenway Plaza, Suite 1000 Houston, Texas 77046 |
| (Address of principal executive offices) (Zip code) |
|
Sheri Morris 11 Greenway Plaza, Suite 1000 Houston, Texas 77046 |
| (Name and address of agent for service) |
|
|
| Registrant’s telephone number, including area code: (713) 626-1919 |
|
| Date of fiscal year end: 10/31 |
|
| Date of reporting period: 10/31/17 |
Item 1. Report to Stockholders.
Letters to Shareholders
| | | | |

Philip Taylor | | | | Dear Shareholders: This annual report includes information about your Fund, including performance data and a complete list of its investments as of the close of the reporting period. Inside is a discussion of how your Fund was managed and the factors that affected its performance during the reporting period. American voters went to the polls just days after the start of the reporting period, and their decisions quickly affected markets. The US stock market rallied strongly after the election, with major market indexes rising, and setting record highs, throughout the reporting period. Generally positive economic data, strong corporate earnings and hope for tax and regulatory reform contributed to the rally. US and global bond markets, as well as emerging market equities, sold off immediately following the election – with the US bond market eventually recovering most of its |
losses. Overseas, economic data were mixed, prompting the European Central Bank and central banks in China and Japan, among other countries, to maintain extraordinarily accommodative monetary policies. Citing positive economic trends – specifically, realized and expected labor market conditions and inflation – the US Federal Reserve raised interest rates three times during the reporting period: first in December 2016, and then again in March and June 2017. Health care and tax reform proved to be more difficult than expected to enact, with little progress achieved by the end of the reporting period.
Short-term market volatility can prompt some investors to abandon their investment plans – and can cause others to settle for whatever returns the market has to offer. The investment professionals at Invesco, in contrast, invest with high conviction. This means that, no matter the asset class or the strategy, each investment team has a passion to exceed. We want to help investors achieve better outcomes, such as seeking higher returns, helping mitigate risk and generating income. Of course, investing with high conviction can’t guarantee a profit or ensure success; no investment strategy can. To learn more about how we invest with high conviction, visit invesco.com/HighConviction.
You, too, can invest with high conviction by maintaining a long-term investment perspective and by working with your financial adviser on a regular basis. During periods of short-term market volatility or uncertainty, your financial adviser can keep you focused on your long-term investment goals – a new home, a child’s college education or a secure retirement. He or she also can share research about the economy, the markets and individual investment options.
Visit our website for more information on your investments
Our website, invesco.com/us, offers a wide range of market insights and investment perspectives. On the website, you’ll find detailed information about our funds, including performance, holdings and portfolio manager commentaries. You can access information about your account by completing a simple, secure online registration. To do so, select “Log In” on the right side of the homepage, and then select “Register for Individual Account Access.”
In addition to the resources accessible on our website and through our mobile app, you can obtain timely updates to help you stay informed about the markets and the economy by connecting with Invesco on Twitter, LinkedIn or Facebook. You can access our blog at blog.invesco.us.com. Our goal is to provide you the information you want, when and where you want it.
Finally, I’m pleased to share with you Invesco’s commitment to both the Principles for Responsible Investment and to considering environmental, social and governance issues in our robust investment process. I invite you to learn more at invesco.com/esg.
Have questions?
For questions about your account, contact an Invesco client services representative at 800 959 4246. For Invesco-related questions or comments, please email me directly at phil@invesco.com.
All of us at Invesco look forward to serving your investment management needs. Thank you for investing with us.
Sincerely,

Philip Taylor
Senior Managing Director, Invesco Ltd.
|
| 2 Invesco All Cap Market Neutral Fund |
| | | | |

Bruce Crockett | | | | Dear Fellow Shareholders: Among the many important lessons I’ve learned in more than 40 years in a variety of business endeavors is the value of a trusted advocate. As independent chair of the Invesco Funds Board, I can assure you that the members of the Board are strong advocates for the interests of investors in Invesco’s mutual funds. We work hard to represent your interests through oversight of the quality of the investment management services your funds receive and other matters important to your investment, including but not limited to: ∎ Ensuring that Invesco offers a diverse lineup of mutual funds that your financial adviser can use to strive to meet your financial needs as your investment goals change over time. ∎ Monitoring how the portfolio management teams of the Invesco funds are performing in light of changing economic and market conditions. |
| ∎ | Assessing each portfolio management team’s investment performance within the context of the investment strategy described in the fund’s prospectus. |
| ∎ | Monitoring for potential conflicts of interests that may impact the nature of the services that your funds receive. |
We believe one of the most important services we provide our fund shareholders is the annual review of the funds’ advisory and sub-advisory contracts with Invesco Advisers and its affiliates. This review is required by the Investment Company Act of 1940 and focuses on the nature and quality of the services Invesco provides as the adviser to the Invesco funds and the reasonableness of the fees that it charges for those services. Each year, we spend months carefully reviewing information received from Invesco and a variety of independent sources, such as performance and fee data prepared by Lipper, Inc. (a subsidiary of Broadridge Financial Solutions, Inc.), an independent, third-party firm widely recognized as a leader in its field. We also meet with our independent legal counsel and other independent advisers to review and help us assess the information that we have received. Our goal is to assure that you receive quality investment management services for a reasonable fee.
I trust the measures outlined above provide assurance that you have a worthy advocate when it comes to choosing the Invesco Funds.
As always, please contact me at bruce@brucecrockett.com with any questions or concerns you may have. On behalf of the Board, we look forward to continuing to represent your interests and serving your needs.
Sincerely,

Bruce L. Crockett
Independent Chair
Invesco Funds Board of Trustees
|
| 3 Invesco All Cap Market Neutral Fund |
Management’s Discussion of Fund Performance
Performance summary
For the fiscal year ended October 31, 2017, Class A shares of Invesco All Cap Market Neutral Fund (the Fund), at net asset value (NAV), outperformed the Citi US Three-Month Treasury Bill Index, the Fund’s broad market/style-specific benchmark.
Your Fund’s long-term performance appears later in this report.
Fund vs. Indexes
Total returns, 10/31/16 to 10/31/17, at net asset value (NAV). Performance shown does not include applicable contingent deferred sales charges (CDSC) or front-end sales charges, which would have reduced performance.
| | | | | |
| Class A Shares | | | | 2.81 | % |
| Class C Shares | | | | 2.14 | |
| Class R Shares | | | | 2.63 | |
| Class Y Shares | | | | 3.10 | |
| Class R5 Shares | | | | 3.20 | |
| Class R6 Shares | | | | 3.20 | |
| Citi US Three-Month Treasury Bill Index▼ (Broad Market/Style-Specific Index) | | | | 0.71 | |
| Lipper Alternative Equity Market Neutral Funds Index∎ (Peer Group Index) | | | | 4.34 | |
Source(s): ▼FactSet Research Systems Inc., ∎Lipper Inc. | | | | | |
Market conditions and your Fund
Despite highly destructive hurricanes that threatened to derail a year-long recovery, the US economy continued to expand throughout the fiscal year ended October 31, 2017. Gross domestic product (GDP) – the value of all goods and services produced in the US – grew by 1.8% in the fourth quarter of 2016, and by 1.2% in the first quarter and 3.1% in the second quarter of 2017.1 Inflation remained subdued even as the labor market continued to strengthen. Unemployment continued its multiyear decline, hitting just 4.2% in September – a 16-year low.2
Given signs of an improving economy, the US Federal Reserve (the Fed) raised interest rates three times during the reporting period, most recently in June 2017.3 The Fed pledged that “realized and expected economic conditions relative to its objectives of maximum employment and 2 percent inflation” will guide its future actions. At the close of the reporting period, Fed policy remained accommodative, and the fed funds target rate stood at a range of 1.00% to 1.25% – up 75 basis points for the reporting period.3 (A basis point is 0.01%)
Despite the Fed’s actions, major US stock market indexes repeatedly hit all-time highs throughout the reporting
| | | | | | | | | | | | | | | | | | | | |
| Portfolio Composition | | | | | | | | | | | | | | | | | | | | |
| By sector, based on total net assets | | | | | | | | | | | | | | | | | | | | |
| | | | Equity Securities | | | | | | | | | | | |
| | | Long1 | | Short2 | | Gross Exposure3 | | Net Exposure4 |
| Health Care | | | | 33.4 | % | | | | 32.5 | % | | | | 65.9 | % | | | | 0.9 | % |
| Information Technology | | | | 11.6 | | | | | 11.5 | | | | | 23.1 | | | | | 0.1 | |
| Consumer Discretionary | | | | 19.9 | | | | | 20.6 | | | | | 40.5 | | | | | -0.7 | |
| Energy | | | | 6.2 | | | | | 7.1 | | | | | 13.3 | | | | | -0.9 | |
| Materials | | | | 2.0 | | | | | 1.4 | | | | | 3.4 | | | | | 0.6 | |
| Industrials | | | | 8.4 | | | | | 9.0 | | | | | 17.4 | | | | | -0.6 | |
| Financials | | | | 4.5 | | | | | 5.7 | | | | | 10.2 | | | | | -1.2 | |
| Consumer Staples | | | | 2.2 | | | | | 1.6 | | | | | 3.8 | | | | | 0.6 | |
| Real Estate | | | | 2.0 | | | | | 1.1 | | | | | 3.1 | | | | | 0.9 | |
| Telecommunication Services | | | | 0.3 | | | | | – | | | | | 0.3 | | | | | 0.3 | |
Money Market Funds Plus Other Assets Less Liabilities | | | | 9.5 | | | | | – | | | | | 9.5 | | | | | 9.5 | |
| Total | | | | 100.0 | | | | | 90.5 | | | | | 190.5 | | | | | 9.5 | |
| 1 | Represents the value of the equity securities in the portfolio. |
| 2 | Represents the value of the equity securities underlying the Fund’s equity short portfolio swap. |
| 3 | Represents the cumulative exposure of the Fund’s long and short positions. |
| 4 | Represents the net exposure of the Fund’s long and short positions. |
period. The stock market rally began immediately following the outcome of the US presidential election in November 2016, based on investors’ hopes for reduced regulation, lowered corporate and personal tax rates and increased infrastructure spending. The stock market rally continued throughout the reporting period, fueled by generally positive economic data, strong corporate earnings and improved consumer confidence – even as the prospect for health care and tax reform faded somewhat.
The Fund follows a market neutral strategy, which is intended to produce a portfolio that experiences minimal influence from the return patterns of the general US stock market. The Fund seeks neutral positioning in terms of beta (market exposure) by seeking to maintain neutral sector and industry exposures. The Fund uses a systematic model that evaluates fundamental and behavioral factors to forecast individual security returns and risks and ranks these securities based on their attractiveness relative to industry peers. Implementation occurs by establishing a portfolio with long positions in highly ranked stocks and shorting those that are poorly ranked. As such, the goal is to provide absolute risk-adjusted returns over a full market cycle, regardless of the directions of equity markets.
In a market neutral construct, a positive spread between the top- and bottom-ranked stocks (long and short candidates for the portfolio) is intended to result in the Fund’s outperformance relative to the Citi US Three-Month Treasury Bill Index.
| | | | | |
| Total Net Assets | | | | $128.7 million | |
Data presented here are as of October 31, 2017.
|
| 4 Invesco All Cap Market Neutral Fund |
During the fiscal year, the Fund benefited the most from a positive long/short spread in seven of the 11 market sectors, led by the information technology (IT), consumer discretionary, materials and industrials sectors. However, the long/ short spread in the energy and financials sectors partially offset those gains and detracted from the Fund’s returns during the reporting period.
During the fiscal year, the strongest contributors to absolute Fund performance were holdings in the consumer discretionary sector. Specifically, the long holdings in consumer services were up over 40%, while the short positions marginally declined, generating positive returns from both sides. The Fund’s short holdings in the consumer durables and apparel industry performed as expected and were also additive to Fund returns. In the strong-performing IT sector, the Fund’s short positions rose in price, detracting from returns, but were more than offset by stronger gains in the long positions. This was most evident in the computers/electronics and semiconductor industries.
The energy sector was the largest detractor from Fund performance for the reporting period as its long/short spread was negative, mostly due to short positions in the oil, gas and consumable fuels industry. In addition, losses in long positions in the energy sector hampered Fund performance. In the financials sector, the Fund’s short positions – specifically, those in the banking and insurance industries – negatively impacted performance primarily in the fourth quarter of 2016 as the election of Donald Trump led to a broad-based rally in these industries. This rally was reversed somewhat in the following two quarters of 2017.
Please note that the Fund may utilize derivative instruments that include equity-related total return swaps and futures contracts. During the reporting period, the Fund utilized equity-related total return swaps to efficiently implement its strategy and gain long and/or short exposure to the various sectors/ industries described above, but did not use future contracts. The implementation impact of using equity-related total return swaps is a component of transaction costs. Certain derivatives may amplify traditional investment risks through the creation of leverage and may be less liquid than traditional securities.
Thank you for your investment in Invesco All Cap Market Neutral Fund.
| 1 | Source: Bureau of Economic Analysis |
| 2 | Source(s): Bureau of Labor Statistics, Bloomberg |
| 3 | Source: US Federal Reserve |
The views and opinions expressed in management’s discussion of Fund performance are those of Invesco Advisers, Inc. These views and opinions are subject to change at any time based on factors such as market and economic conditions. These views and opinions may not be relied upon as investment advice or recommendations, or as an offer for a particular security. The information is not a complete analysis of every aspect of any market, country, industry, security or the Fund. Statements of fact are from sources considered reliable, but Invesco Advisers, Inc. makes no representation or warranty as to their completeness or accuracy. Although historical performance is no guarantee of future results, these insights may help you understand our investment management philosophy.
See important Fund and, if applicable, index disclosures later in this report.
| | |
 | | Michael Abata Chartered Financial Analyst, Portfolio Manager, is manager of Invesco All Cap Market Neutral Fund. He joined Invesco in 2011. |
| Mr. Abata earned a BA in economics from Binghamton University. |
| |
 | | Anthony Munchak Chartered Financial Analyst, Portfolio Manager, is manager of Invesco All Cap Market Neutral Fund. He joined Invesco in 2000. |
| Mr. Munchak earned a BS and an MS in finance from Boston College and an MBA from Bentley College. |
| |
 | | Glen Murphy Chartered Financial Analyst, Portfolio Manager, is manager of Invesco All Cap Market Neutral Fund. He joined Invesco in 1995. |
| Mr. Murphy earned a BA from the University of Massachusetts at Amherst and an MS in finance from Boston College. |
| |
 | | Francis Orlando Chartered Financial Analyst, Portfolio Manager, is manager of Invesco All Cap Market Neutral Fund. He joined Invesco in 1987. |
| Mr. Orlando earned a BA in business administration from Merrimack College and an MBA from Boston University. |
| | |
| |
 | | Donna Chapman Wilson Portfolio Manager and Director of Portfolio Management, is manager of Invesco All Cap Market Neutral |
| Fund. She joined Invesco in 1997. Ms. Chapman Wilson earned a BA in economics from Hampton University and an MBA in finance from the Wharton School of the University of Pennsylvania. |
|
| 5 Invesco All Cap Market Neutral Fund |
Your Fund’s Long-Term Performance
Results of a $10,000 Investment – Oldest Share Class(es) since Inception
Fund and index data from 12/17/13
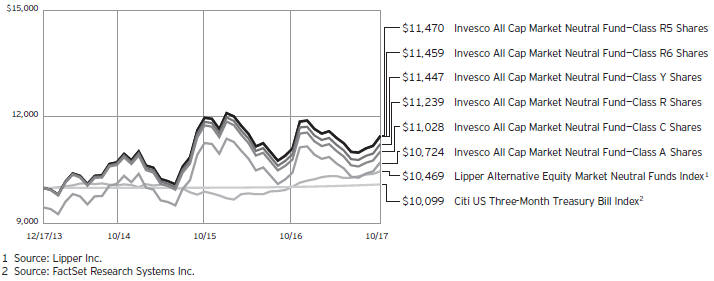
Past performance cannot guarantee comparable future results.
The data shown in the chart include reinvested distributions, applicable sales charges and Fund expenses including
management fees. Index results include reinvested dividends,
but they do not reflect sales charges. Performance of the peer group, if applicable, reflects fund expenses and management fees; performance
of a market index does not. Performance shown in the chart and table(s) does not reflect deduction of taxes a shareholder would pay on Fund distributions or sale of Fund shares.
continued from page 8
| | shorting. If the Fund holds both long and short positions, and both positions decline simultaneously, the short positions will not provide any buffer (hedge) from declines in value of the Fund’s long positions. Certain types of short positions involve leverage, which may exaggerate any losses, potentially more than the actual cost of the investment, and will increase the volatility of the Fund’s returns. |
| ∎ | | Small- and mid-capitalization companies risks. Small- and mid-capitalization companies tend to be more vulnerable to changing market conditions, may have little or no operating history or track record of success, and may have more limited product lines and markets, less experienced management and fewer financial resources than larger companies. These companies’ securities may be more volatile and less liquid than those of more established companies, and their returns may vary, sometimes significantly, from the overall securities market. |
About indexes used in this report
| ∎ | | The Citi US Three-Month Treasury Bill Index is an unmanaged index representative of three-month US Treasury bills. |
| ∎ | | The Lipper Alternative Equity Market Neutral Funds Index is an unmanaged index considered representative of alternative equity market neutral funds tracked by Lipper. |
| ∎ | | The Fund is not managed to track the performance of any particular index, including the index(es) described here, and consequently, the performance of the Fund may deviate significantly from the performance of the index(es). |
| ∎ | | A direct investment cannot be made in an index. Unless otherwise indicated, index results include reinvested dividends, and they do not reflect sales charges. Performance of the peer group, if applicable, reflects fund expenses; performance of a market index does not. |
Other information
| ∎ | | The returns shown in management’s discussion of Fund performance are based on net asset values (NAVs) calculated for shareholder transactions. Generally accepted accounting principles require adjustments to be made to the net assets of the Fund at period end for financial reporting purposes, and as such, the NAVs for shareholder transactions and the returns based on those NAVs may differ from the NAVs and returns reported in the Financial Highlights. |
| ∎ | | Industry classifications used in this report are generally according to the Global Industry Classification Standard, which was developed by and is the exclusive property and a service mark of MSCI Inc. and Standard & Poor’s. |
|
| 6 Invesco All Cap Market Neutral Fund |
| | | | |
| |
Average Annual Total Returns | |
As of 10/31/17, including maximum applicable sales charges | |
| |
| Class A Shares | | | | |
| Inception (12/17/13) | | | 1.82 | % |
| 1 Year | | | -2.84 | |
| |
| Class C Shares | | | | |
| Inception (12/17/13) | | | 2.56 | % |
| 1 Year | | | 1.14 | |
| |
| Class R Shares | | | | |
| Inception (12/17/13) | | | 3.06 | % |
| 1 Year | | | 2.63 | |
| |
| Class Y Shares | | | | |
| Inception (12/17/13) | | | 3.55 | % |
| 1 Year | | | 3.10 | |
| |
| Class R5 Shares | | | | |
| Inception (12/17/13) | | | 3.61 | % |
| 1 Year | | | 3.20 | |
| |
| Class R6 Shares | | | | |
| Inception (12/17/13) | | | 3.58 | % |
| 1 Year | | | 3.20 | |
| | | | |
| |
Average Annual Total Returns | |
| As of 9/30/17, the most recent calendar quarter end, including maximum applicable sales charges | |
| |
| Class A Shares | | | | |
| Inception (12/17/13) | | | 1.22 | % |
| 1 Year | | | -3.38 | |
| |
| Class C Shares | | | | |
| Inception (12/17/13) | | | 1.98 | % |
| 1 Year | | | 0.43 | |
| |
| Class R Shares | | | | |
| Inception (12/17/13) | | | 2.47 | % |
| 1 Year | | | 1.94 | |
| |
| Class Y Shares | | | | |
| Inception (12/17/13) | | | 2.98 | % |
| 1 Year | | | 2.54 | |
| |
| Class R5 Shares | | | | |
| Inception (12/17/13) | | | 3.01 | % |
| 1 Year | | | 2.54 | |
| |
| Class R6 Shares | | | | |
| Inception (12/17/13) | | | 2.98 | % |
| 1 Year | | | 2.54 | |
The performance data quoted represent past performance and cannot guarantee comparable future results; current performance may be lower or higher. Please visit invesco.com/performance for the most recent month-end performance. Performance figures reflect reinvested distributions, changes in net asset value and the effect of the maximum sales charge unless otherwise stated. Investment return and principal value will fluctuate so that you may have a gain or loss when you sell shares.
The net annual Fund operating expense ratio set forth in the most recent Fund prospectus as of the date of this report for Class A, Class C, Class R, Class Y, Class R5 and Class R6 shares was 1.45%, 2.20%, 1.70%, 1.20%, 1.05% and 1.04%, respectively.1 The total annual Fund operating expense ratio set forth in the most recent Fund prospectus as of the date of this report for Class A, Class C, Class R, Class Y, Class R5 and Class R6 shares was 1.47%, 2.22%, 1.72%, 1.22%, 1.07% and 1.06%, respectively. The expense ratios presented above may vary from the expense ratios presented in other sections of this report that are based on expenses incurred during the period covered by this report.
Class A share performance reflects the maximum 5.50% sales charge, and Class C share performance reflects the applicable contingent deferred sales charge (CDSC) for the period involved. The CDSC on Class C shares is 1% for the first year after purchase. Class R, Class Y, Class R5 and Class R6 class shares do not have a front-end sales charge or a CDSC; therefore, performance is at net asset value.
The performance of the Fund’s share classes will differ primarily due to different sales charge structures and class expenses.
Fund performance reflects any applicable fee waivers and/or expense reimbursements. Had the adviser not waived fees and/or reimbursed expenses currently or in the past, returns would have been lower. See current prospectus for more information.
| 1 | Total annual Fund operating expenses after any contractual fee waivers and/or expense reimbursements by the adviser in effect through at least June 30, 2019. See current prospectus for more information. |
|
| 7 Invesco All Cap Market Neutral Fund |
Invesco All Cap Market Neutral Fund’s investment objective is to seek to provide a positive return over a full market cycle from a broadly diversified portfolio of stocks while seeking to limit exposure to the general risks associated with stock market investing.
| ∎ | | Unless otherwise stated, information presented in this report is as of October 31, 2017, and is based on total net assets. |
| ∎ | | Unless otherwise noted, all data provided by Invesco. |
| ∎ | | To access your Fund’s reports/prospectus, visit invesco.com/fundreports. |
About share classes
| ∎ | | Class R shares are generally available only to employer sponsored retirement and benefit plans. Please see the prospectus for more information. |
| ∎ | | Class Y shares are available only to certain investors. Please see the prospectus for more information. |
| ∎ | | Class R5 shares and Class R6 shares are available for use by retirement plans that meet certain standards and for institutional investors. Class R6 shares are also available through intermediaries that have established an agreement with Invesco Distributors, Inc. to make such shares available for use in retail omnibus accounts. Please see the prospectus for more information. |
Principal risks of investing in the Fund
| ∎ | | Active trading risk. Active trading of portfolio securities may result in added expenses, a lower return and increased tax liability. |
| ∎ | | Derivatives risk. The value of a derivative instrument depends largely on (and is derived from) the value of an underlying security, currency, commodity, interest rate, index or other asset (each referred to as an underlying asset). In addition to risks relating to the underlying assets, the use of derivatives may include other, possibly greater, risks, including counterparty, leverage and liquidity risks. Counterparty risk is the risk that the counterparty to the derivative contract will default on its obligation to pay the Fund the amount owed or otherwise perform under the derivative contract. Derivatives create leverage risk because they do not require payment up front equal to the economic exposure created by owning the derivative. As a result, an adverse change in the value of the underlying asset could result in the Fund sustaining a loss that is substantially greater than |
| | | the amount invested in the derivative, which may make the Fund’s returns more volatile and increase the risk of loss. Derivative instruments may also be less liquid than more traditional investments and the Fund may be unable to sell or close out its derivative positions at a desirable time or price. This risk may be more acute under adverse market conditions, during which the Fund may be most in need of liquidating its derivative positions. Derivatives may also be harder to value, less tax efficient and subject to changing government regulation that could impact the Fund’s ability to use certain derivatives or their cost. The SEC has proposed new regulations related to the use of derivatives and related instruments by registered investment companies. If adopted as proposed, these regulations would limit the Fund’s ability to engage in derivatives transactions and may result in increased costs or require the Fund to modify its investment strategies or to liquidate. Also, derivatives used for hedging or to gain or limit exposure to a particular market segment may not provide the expected benefits, particularly during adverse market conditions. These risks are greater for the Fund than most other mutual funds because the Fund will implement its investment strategy primarily through derivative instruments rather than direct investments in stocks/bonds. |
| ∎ | | Management risk. The Fund is actively managed and depends heavily on the Adviser’s judgment about markets, interest rates or the attractiveness, relative values, liquidity, or potential appreciation of particular investments made for the Fund’s portfolio. The Fund could experience losses if these judgments prove to be incorrect. Additionally, legislative, regulatory, or tax developments may adversely affect management of the Fund and, therefore, the ability of the Fund to achieve its investment objective. In particular, there is no |
|
This report must be accompanied or preceded by a currently effective Fund prospectus, which contains more complete information, including sales charges and expenses. Investors should read it carefully before investing. |
|
|
| NOT FDIC INSURED | MAY LOSE VALUE | NO BANK GUARANTEE |
| | guarantee that the portfolio manager’s stock selection process will produce a market neutral portfolio that reduces or eliminates the Fund’s exposure to general US stock market risk, sector or industry-specific risk or market capitalization risk. In addition, the Fund’s market neutral investment strategy will likely cause the Fund to underperform the broader US equity market during market rallies. Such underperformance could be significant during sudden or significant market rallies. |
| ∎ | | Market risk. The market values of the Fund’s investments, and therefore the value of the Fund’s shares, will go up and down, sometimes rapidly or unpredictably. Market risk may affect a single issuer, industry or section of the economy, or it may affect the market as a whole. Individual stock prices tend to go up and down more dramatically than those of certain other types of investments, such as bonds. During a general downturn in the financial markets, multiple asset classes may decline in value. When markets perform well, there can be no assurance that specific investments held by the Fund will rise in value. |
| ∎ | | Sector focus risk. The Fund may from time to time invest a significant amount of its assets (i.e. over 25%) in one market sector or group of related industries. In this event, the Fund’s performance will depend to a greater extent on the overall condition of the sector or group of industries and there is increased risk that the Fund will lose significant value if conditions adversely affect that sector or group of industries. |
| ∎ | | Short position risk. Because the Fund’s potential loss on a short position arises from increases in the value of the asset sold short, the Fund will incur a loss on a short position, which is theoretically unlimited, if the price of the asset sold short increases from the short sale price. The counterparty to a short position or other market factors may prevent the Fund from closing out a short position at a desirable time or price and may reduce or eliminate any gain or result in a loss. In a rising market, the Fund’s short positions will cause the Fund to underperform the overall market and its peers that do not engage in |
continued on page 6
|
| 8 Invesco All Cap Market Neutral Fund |
Schedule of Investments(a)
October 31, 2017
| | | | | | | | |
| | | Shares | | | Value | |
Common Stocks & Other Equity Interests–90.57% | |
| Aerospace & Defense–1.50% | |
Boeing Co. (The) | | | 7,500 | | | $ | 1,934,850 | |
|
| Airlines–0.62% | |
Copa Holdings, S.A.–Class A (Panama) | | | 6,500 | | | | 800,735 | |
|
| Apparel Retail–1.50% | |
Tailored Brands, Inc. | | | 84,000 | | | | 1,297,800 | |
Tilly’s Inc.–Class A | | | 53,150 | | | | 633,016 | |
| | | | | | | | 1,930,816 | |
|
| Application Software–0.26% | |
Upland Software, Inc.(b) | | | 15,000 | | | | 329,550 | |
|
| Auto Parts & Equipment–0.44% | |
BorgWarner, Inc. | | | 5,250 | | | | 276,780 | |
Stoneridge, Inc.(b) | | | 12,725 | | | | 289,367 | |
| | | | | | | | 566,147 | |
|
| Biotechnology–19.97% | |
Acorda Therapeutics Inc.(b) | | | 64,850 | | | | 1,723,389 | |
Akebia Therapeutics, Inc.(b) | | | 79,400 | | | | 1,441,110 | |
Applied Genetic Technologies Corp.(b) | | | 1,681 | | | | 5,715 | |
Arena Pharmaceuticals, Inc.(b) | | | 58,600 | | | | 1,642,558 | |
Array BioPharma, Inc.(b) | | | 186,050 | | | | 1,944,222 | |
BioSpecifics Technologies Corp.(b) | | | 17,800 | | | | 814,706 | |
Calithera Biosciences, Inc.(b) | | | 65,350 | | | | 1,052,135 | |
Celgene Corp.(b) | | | 12,250 | | | | 1,236,883 | |
ChemoCentryx, Inc.(b) | | | 76,450 | | | | 502,277 | |
Conatus Pharmaceuicals, Inc.(b) | | | 48,600 | | | | 223,074 | |
CytomX Therapeutics, Inc.(b) | | | 62,100 | | | | 1,242,000 | |
Exelixis, Inc.(b) | | | 50,050 | | | | 1,240,739 | |
FibroGen, Inc.(b) | | | 41,500 | | | | 2,317,775 | |
ImmunoGen, Inc.(b) | | | 177,950 | | | | 1,032,110 | |
Ionis Pharmaceuticals, Inc.(b) | | | 36,900 | | | | 2,107,359 | |
PDL BioPharma Inc. | | | 96,450 | | | | 285,492 | |
Repligen Corp.(b) | | | 6,000 | | | | 223,200 | |
Sangamo Therapeutics, Inc.(b) | | | 140,950 | | | | 1,747,780 | |
Spectrum Pharmaceuticals, Inc.(b) | | | 104,450 | | | | 2,046,175 | |
Verastem, Inc.(b) | | | 60,050 | | | | 229,391 | |
Vertex Pharmaceuticals, Inc.(b) | | | 15,200 | | | | 2,222,696 | |
Xencor, Inc.(b) | | | 6,002 | | | | 118,720 | |
XOMA Corp.(b) | | | 12,300 | | | | 298,767 | |
| | | | | | | | 25,698,273 | |
|
| Broadcasting–0.19% | |
Beasley Broadcast Group, Inc.–Class A | | | 26,550 | | | | 250,898 | |
|
| Casinos & Gaming–1.85% | |
Scientific Games Corp.–Class A(b) | | | 49,900 | | | | 2,375,240 | |
|
| Coal & Consumable Fuels–0.27% | |
Hallador Energy Co. | | | 66,300 | | | | 343,434 | |
| | | | | | | | |
| | | Shares | | | Value | |
| Commercial Printing–0.41% | |
Ennis, Inc. | | | 9,300 | | | $ | 187,395 | |
Quad/Graphics, Inc. | | | 14,700 | | | | 335,013 | |
| | | | | | | | 522,408 | |
|
| Communications Equipment–0.89% | |
Comtech Telecommunications Corp. | | | 43,500 | | | | 935,685 | |
PC-Tel, Inc. | | | 31,350 | | | | 208,477 | |
| | | | | | | | 1,144,162 | |
|
| Computer & Electronics Retail–3.08% | |
Best Buy Co., Inc. | | | 37,950 | | | | 2,124,441 | |
Conn’s, Inc.(b) | | | 48,850 | | | | 1,502,137 | |
Rent-A-Center, Inc. | | | 34,600 | | | | 343,924 | |
| | | | | | | | 3,970,502 | |
|
| Construction & Engineering–0.22% | |
Goldfield Corp. (The)(b) | | | 49,350 | | | | 283,763 | |
|
| Construction Machinery & Heavy Trucks–1.79% | |
Commercial Vehicle Group, Inc.(b) | | | 45,000 | | | | 365,400 | |
Wabash National Corp. | | | 86,050 | | | | 1,936,125 | |
| | | | | | | | 2,301,525 | |
|
| Consumer Electronics–0.55% | |
ZAGG, Inc.(b) | | | 45,350 | | | | 709,727 | |
|
| Consumer Finance–0.08% | |
Nelnet, Inc.–Class A | | | 1,800 | | | | 105,372 | |
|
| Copper–0.47% | |
Freeport-McMoRan Inc.(b) | | | 43,700 | | | | 610,926 | |
|
| Data Processing & Outsourced Services–0.98% | |
Everi Holdings Inc.(b) | | | 127,150 | | | | 1,054,073 | |
StarTek, Inc.(b) | | | 17,850 | | | | 213,129 | |
| | | | | | | | 1,267,202 | |
|
| Department Stores–0.07% | |
Dillard’s, Inc.–Class A | | | 1,800 | | | | 91,440 | |
|
| Diversified Chemicals–0.87% | |
Chemours Co. (The) | | | 19,850 | | | | 1,123,708 | |
|
| Diversified Metals & Mining–0.59% | |
Teck Resources Ltd.–Class B (Canada) | | | 37,350 | | | | 763,434 | |
|
| Education Services–0.32% | |
Cambium Learning Group Inc.(b) | | | 9,300 | | | | 56,916 | |
K12 Inc.(b) | | | 21,600 | | | | 350,352 | |
| | | | | | | | 407,268 | |
|
| Electronic Components–0.14% | |
Bel Fuse, Inc.–Class B | | | 5,450 | | | | 176,308 | |
|
| Electronic Equipment & Instruments–1.03% | |
Control4 Corp.(b) | | | 45,200 | | | | 1,331,140 | |
See accompanying Notes to Financial Statements which are an integral part of the financial statements.
9 Invesco All Cap Market Neutral Fund
| | | | | | | | |
| | | Shares | | | Value | |
| Electronic Manufacturing Services–1.76% | |
KEMET Corp.(b) | | | 88,350 | | | $ | 2,269,711 | |
| |
| Financial Exchanges & Data–0.06% | | | | |
Donnelley Financial Solutions, Inc.(b) | | | 3,650 | | | | 78,475 | |
| |
| Food Distributors–0.69% | | | | |
Chefs Warehouse, Inc. (The)(b) | | | 44,600 | | | | 889,770 | |
| |
| Footwear–0.80% | | | | |
Wolverine World Wide, Inc. | | | 37,650 | | | | 1,027,845 | |
| |
| Health Care Equipment–2.73% | | | | |
Cutera, Inc.(b) | | | 23,600 | | | | 927,480 | |
Fonar Corp.(b) | | | 1,600 | | | | 51,040 | |
LeMaitre Vascular, Inc. | | | 18,900 | | | | 604,989 | |
Novocure Ltd.(b) | | | 89,550 | | | | 1,934,280 | |
| | | | | | | | 3,517,789 | |
| |
| Health Care Facilities–0.85% | | | | |
Community Health Systems, Inc.(b) | | | 185,900 | | | | 1,096,810 | |
| |
| Health Care Services–0.15% | | | | |
Psychemedics Corp. | | | 11,350 | | | | 198,625 | |
| |
| Health Care Supplies–2.92% | | | | |
Lantheus Holdings, Inc.(b) | | | 88,400 | | | | 1,759,160 | |
OraSure Technologies, Inc.(b) | | | 100,950 | | | | 1,993,762 | |
| | | | | | | | 3,752,922 | |
| |
| Health Care Technology–0.45% | | | | |
Tabula Rasa Healthcare, Inc.(b) | | | 19,835 | | | | 572,835 | |
| |
| Home Entertainment Software–0.15% | | | | | |
PolarityTE, Inc.(b) | | | 7,650 | | | | 197,906 | |
| |
| Homebuilding–0.94% | | | | |
Beazer Homes USA, Inc.(b) | | | 57,800 | | | | 1,212,644 | |
| |
| Homefurnishing Retail–5.08% | | | | |
Aaron’s, Inc. | | | 42,900 | | | | 1,578,720 | |
Pier 1 Imports, Inc. | | | 116,750 | | | | 485,680 | |
RH(b) | | | 26,750 | | | | 2,405,360 | |
Select Comfort Corp.(b) | | | 63,550 | | | | 2,065,375 | |
| | | | | | | | 6,535,135 | |
| |
| Household Appliances–0.55% | | | | |
iRobot Corp.(b) | | | 10,450 | | | | 702,136 | |
| |
| Household Products–0.41% | | | | |
HRG Group, Inc.(b) | | | 32,300 | | | | 523,906 | |
| |
| Industrial Machinery–2.06% | | | | |
Harsco Corp.(b) | | | 106,000 | | | | 2,252,500 | |
LB Foster Co.–Class A(b) | | | 16,050 | | | | 399,645 | |
| | | | | | | | 2,652,145 | |
|
| Internet & Direct Marketing Retail–2.49% | |
Nutrisystem, Inc. | | | 36,750 | | | | 1,835,662 | |
PetMed Express, Inc. | | | 38,900 | | | | 1,375,504 | |
| | | | | | | | 3,211,166 | |
| | | | | | | | |
| | | Shares | | | Value | |
| Internet Software & Services–1.23% | | | | |
Blucora, Inc.(b) | | | 43,200 | | | $ | 937,440 | |
QuinStreet, Inc.(b) | | | 72,450 | | | | 644,805 | |
| | | | | | | | 1,582,245 | |
|
| IT Consulting & Other Services–0.09% | |
Teradata Corp.(b) | | | 3,650 | | | | 122,093 | |
| |
| Leisure Facilities–0.22% | | | | |
Town Sports International Holdings, Inc.(b) | | | 46,900 | | | | 281,400 | |
| |
| Leisure Products–0.16% | | | | |
Johnson Outdoors Inc.–Class A | | | 2,800 | | | | 210,588 | |
| |
| Life & Health Insurance–0.74% | | | | |
Lincoln National Corp. | | | 12,500 | | | | 947,250 | |
| |
| Managed Health Care–0.24% | | | | |
WellCare Health Plans Inc.(b) | | | 1,550 | | | | 306,497 | |
| |
| Marine–0.07% | | | | |
Genco Shipping & Trading Ltd.(b) | | | 7,000 | | | | 84,070 | |
| |
| Metal & Glass Containers–0.08% | | | | |
Myers Industries, Inc.(b) | | | 4,700 | | | | 101,520 | |
| |
| Office REITs–0.13% | | | | |
JBG SMITH Properties(b) | | | 5,250 | | | | 163,853 | |
| |
| Oil & Gas Drilling–1.57% | | | | |
Diamond Offshore Drilling, Inc. | | | 14,300 | | | | 239,239 | |
Noble Corp. PLC(b) | | | 32,950 | | | | 137,072 | |
Rowan Cos. PLC–Class A(b) | | | 64,700 | | | | 927,151 | |
Unit Corp.(b) | | | 38,050 | | | | 712,296 | |
| | | | | | | | 2,015,758 | |
|
| Oil & Gas Exploration & Production–4.22% | |
Bill Barrett Corp.(b) | | | 175,250 | | | | 863,983 | |
Comstock Resources, Inc.(b) | | | 30,250 | | | | 142,780 | |
Devon Energy Corp. | | | 31,800 | | | | 1,173,420 | |
Enerplus Corp. (Canada) | | | 127,250 | | | | 1,166,882 | |
Evolution Petroleum Corp. | | | 66,000 | | | | 488,400 | |
Panhandle Oil & Gas, Inc.–Class A | | | 15,997 | | | | 386,328 | |
Whiting Petroleum Corp.(b) | | | 200,850 | | | | 1,207,108 | |
| | | | | | | | 5,428,901 | |
|
| Oil & Gas Storage & Transportation–0.14% | |
Overseas Shipholding Group, Inc.–Class A(b) | | | 76,500 | | | | 181,305 | |
| |
| Packaged Foods & Meats–0.48% | | | | |
Sanderson Farms, Inc. | | | 4,150 | | | | 620,716 | |
| |
| Personal Products–0.49% | | | | |
Medifast, Inc. | | | 10,200 | | | | 636,480 | |
| |
| Pharmaceuticals–6.11% | | | | |
Corcept Therapeutics Inc.(b) | | | 119,050 | | | | 2,344,094 | |
Innoviva, Inc.(b) | | | 120,800 | | | | 1,478,592 | |
Intersect ENT, Inc.(b) | | | 32,950 | | | | 976,968 | |
MyoKardia, Inc.(b) | | | 33,200 | | | | 1,276,540 | |
Supernus Pharmaceuticals Inc.(b) | | | 42,850 | | | | 1,782,560 | |
| | | | | | | | 7,858,754 | |
See accompanying Notes to Financial Statements which are an integral part of the financial statements.
10 Invesco All Cap Market Neutral Fund
| | | | | | | | |
| | | Shares | | | Value | |
| Property & Casualty Insurance–0.35% | |
Ambac Financial Group, Inc.(b) | | | 8,850 | | | $ | 144,078 | |
Assured Guaranty Ltd. | | | 8,250 | | | | 306,075 | |
| | | | | | | | 450,153 | |
|
| Real Estate Development–0.43% | |
Maui Land & Pineapple Co., Inc.(b) | | | 35,100 | | | | 559,845 | |
|
| Real Estate Services–0.17% | |
Altisource Asset Management Corp.(b) | | | 2,650 | | | | 223,594 | |
|
| Regional Banks–0.11% | |
Central Valley Community Bancorp | | | 7,150 | | | | 144,430 | |
|
| Reinsurance–0.29% | |
Blue Capital Reinsurance Holdings Ltd. (Bermuda)(b) | | | 4,400 | | | | 58,300 | |
Third Point Reinsurance Ltd. (Bermuda)(b) | | | 18,950 | | | | 316,465 | |
| | | | | | | | 374,765 | |
|
| Research & Consulting Services–0.13% | |
RPX Corp.(b) | | | 12,750 | | | | 166,005 | |
|
| Semiconductor Equipment–2.40% | |
Amtech Systems, Inc.(b) | | | 21,850 | | | | 318,136 | |
SolarEdge Technologies, Inc.(b) | | | 36,600 | | | | 1,202,310 | |
Ultra Clean Holdings, Inc.(b) | | | 61,700 | | | | 1,574,584 | |
| | | | | | | | 3,095,030 | |
|
| Semiconductors–2.20% | |
Micron Technology, Inc.(b) | | | 56,800 | | | | 2,516,808 | |
Pixelworks, Inc.(b) | | | 56,950 | | | | 318,350 | |
| | | | | | | | 2,835,158 | |
|
| Specialized Consumer Services–1.65% | |
H&R Block, Inc. | | | 13,250 | | | | 327,805 | |
Weight Watchers International, Inc. | | | 39,850 | | | | 1,790,062 | |
| | | | | | | | 2,117,867 | |
|
| Specialized REITs–1.26% | |
CoreCivic, Inc. | | | 65,750 | | | | 1,621,395 | |
| | |
| Technology Distributors–0.25% | | | | | | | | |
Systemax, Inc.(b) | | | 11,150 | | | | 318,333 | |
| | | | | | | | |
| | | Shares | | | Value | |
| Technology Hardware, Storage & Peripherals–0.24% | |
Intevac, Inc.(b) | | | 27,850 | | | $ | 233,940 | |
Quantum Corp.(b) | | | 13,500 | | | | 71,550 | |
| | | | | | | | 305,490 | |
|
| Thrifts & Mortgage Finance–2.85% | |
Charter Financial Corp. | | | 5,900 | | | | 113,103 | |
Federal Agricultural Mortgage Corp.–Class C | | | 19,550 | | | | 1,451,392 | |
FS Bancorp, Inc.(b) | | | 1,450 | | | | 78,706 | |
Walker & Dunlop, Inc.(b) | | | 36,800 | | | | 2,019,952 | |
| | | | | | | | 3,663,153 | |
|
| Tobacco–0.13% | |
Alliance One International, Inc.(b) | | | 15,050 | | | | 161,035 | |
|
| Trading Companies & Distributors–1.25% | |
CAI International, Inc.(b) | | | 35,950 | | | | 1,330,869 | |
Titan Machinery, Inc.(b) | | | 18,550 | | | | 276,209 | |
| | | | | | | | 1,607,078 | |
|
| Trucking–0.38% | |
YRC Worldwide, Inc.(b) | | | 35,850 | | | | 482,900 | |
|
| Wireless Telecommunication Services–0.33% | |
Boingo Wireless, Inc.(b) | | | 18,050 | | | | 422,009 | |
Total Common Stocks & Other Equity Interests
(Cost $104,076,900) | | | | 116,568,318 | |
|
Money Market Funds–9.11% | |
Invesco Government & Agency Portfolio–Institutional Class, 0.95%(c) | | | 7,039,791 | | | | 7,039,791 | |
Invesco Treasury Portfolio–Institutional Class, 0.94%(c) | | | 4,693,194 | | | | 4,693,194 | |
Total Money Market Funds
(Cost $11,732,985) | | | | 11,732,985 | |
TOTAL INVESTMENTS IN SECURITIES–99.68%
(Cost $115,809,885) | | | | 128,301,303 | |
OTHER ASSETS LESS LIABILITIES–0.32% | | | | 408,495 | |
NET ASSETS–100.00% | | | $ | 128,709,798 | |
Investment Abbreviations:
| | |
| REIT | | – Real Estate Investment Trust |
Notes to Schedule of Investments:
| (a) | Industry and/or sector classifications used in this report are generally according to the Global Industry Classification Standard, which was developed by and is the exclusive property and a service mark of MSCI Inc. and Standard & Poor’s. |
| (b) | Non-income producing security. |
| (c) | The money market fund and the Fund are affiliated by having the same investment adviser. The rate shown is the 7-day SEC standardized yield as of October 31, 2017. |
| | | | | | | | | | | | | | | | | | | | | | | | | | | | | | |
| Open Over-The-Counter Total Return Swap Agreements — Equity Risk | |
| Reference Entity | | Counterparty | | Expiration Date | | | Floating Rate Index(1) | | Payment
Frequency | | Notional
Amount | | | Upfront
Payments
Paid
(Received) | | | Value | | | Unrealized Appreciation | | | Net Value of
Reference
Entities | |
Equity Securities – Short | | Morgan Stanley & Co. LLC | | | 04/24/2019 | | | Federal Funds floating rate | | Monthly | | $ | (117,349,003 | ) | | $ | — | | | $ | 856,299 | (2) | | $ | 856,299 | (2) | | $ | (116,463,863 | ) |
| (1) | The Fund receives or pays the total return on the short positions underlying the total return swap and receives a specific Federal Funds floating rate. |
| (2) | Amount includes $(28,841) of dividends payable and financing fees related to the reference entities. |
See accompanying Notes to Financial Statements which are an integral part of the financial statements.
11 Invesco All Cap Market Neutral Fund
The following table represents the individual short positions and related values of equity securities underlying the total return swap with Morgan Stanley & Co. LLC, as of October 31, 2017.
| | | | | | | | | | | | |
| | | Shares | | | Value | | | Percentage
of Reference
Entities | |
Equity Securities — Short–(100.00)% | | | | | |
| Aerospace & Defense–(1.14)% | | | | | |
KeyW Holding Corp. (The) | | | (80,800 | ) | | $ | (610,040 | ) | | | (0.53 | ) |
Wesco Aircraft Holdings, Inc. | | | (75,000 | ) | | | (678,750 | ) | | | (0.61 | ) |
| | | | | (1,288,790 | ) | | | (1.14 | ) |
| |
| Airlines–(0.19)% | | | | | |
Spirit Airlines, Inc. | | | (6,400 | ) | | | (237,376 | ) | | | (0.19 | ) |
| |
| Apparel Retail–(1.72)% | | | | | |
Boot Barn Holdings, Inc. | | | (42,450 | ) | | | (349,364 | ) | | | (0.30 | ) |
L Brands Inc. | | | (38,950 | ) | | | (1,676,408 | ) | | | (1.42 | ) |
| | | | | (2,025,772 | ) | | | (1.72 | ) |
| |
| Apparel, Accessories & Luxury Goods–(2.09)% | | | | | |
G-III Apparel Group, Ltd. | | | (23,650 | ) | | | (599,291 | ) | | | (0.53 | ) |
Under Armour, Inc.–Class A | | | (73,050 | ) | | | (914,586 | ) | | | (1.05 | ) |
Under Armour, Inc.–Class C | | | (39,550 | ) | | | (456,012 | ) | | | (0.51 | ) |
| | | | | (1,969,889 | ) | | | (2.09 | ) |
| |
| Application Software–(1.95)% | | | | | |
Digimarc Corp. | | | (18,000 | ) | | | (642,600 | ) | | | (0.55 | ) |
Ellie Mae, Inc. | | | (15,450 | ) | | | (1,389,727 | ) | | | (1.17 | ) |
SITO Mobile Ltd. | | | (35,550 | ) | | | (271,957 | ) | | | (0.23 | ) |
| | | | | (2,304,284 | ) | | | (1.95 | ) |
| |
| Asset Management & Custody Banks–(0.58)% | | | | | |
Fifth Street Asset Management, Inc. | | | (24,250 | ) | | | (99,425 | ) | | | (0.08 | ) |
Safeguard Scientifics, Inc. | | | (10,250 | ) | | | (144,525 | ) | | | (0.11 | ) |
WisdomTree Investments, Inc. | | | (40,000 | ) | | | (443,600 | ) | | | (0.39 | ) |
| | | | | (687,550 | ) | | | (0.58 | ) |
| |
| Automobile Manufacturers–(1.53)% | | | | | |
Tesla, Inc. | | | (5,360 | ) | | | (1,777,001 | ) | | | (1.53 | ) |
| |
| Automotive Retail–(5.55)% | | | | | |
Advance Auto Parts, Inc. | | | (17,300 | ) | | | (1,414,102 | ) | | | (1.27 | ) |
AutoZone Inc. | | | (2,920 | ) | | | (1,721,340 | ) | | | (1.46 | ) |
Monro, Inc. | | | (8,200 | ) | | | (404,670 | ) | | | (0.35 | ) |
Murphy USA Inc. | | | (17,100 | ) | | | (1,271,556 | ) | | | (1.07 | ) |
OReilly Automotive Inc. | | | (8,000 | ) | | | (1,687,600 | ) | | | (1.40 | ) |
| | | | | (6,499,268 | ) | | | (5.55 | ) |
| |
| Biotechnology–(21.64)% | | | | | |
ACADIA Pharmaceuticals Inc. | | | (45,350 | ) | | | (1,579,541 | ) | | | (1.38 | ) |
Advaxis, Inc. | | | (60,650 | ) | | | (206,210 | ) | | | (0.18 | ) |
Agios Pharmaceuticals, Inc. | | | (23,500 | ) | | | (1,510,345 | ) | | | (1.34 | ) |
Alder Biopharmaceuticals, Inc. | | | (93,100 | ) | | | (1,047,375 | ) | | | (0.88 | ) |
Ardelyx, Inc. | | | (71,150 | ) | | | (380,652 | ) | | | (0.31 | ) |
Atara Biotherapeutics, Inc. | | | (20,450 | ) | | | (290,390 | ) | | | (0.25 | ) |
Bellicum Pharmaceuticals, Inc. | | | (53,750 | ) | | | (506,325 | ) | | | (0.44 | ) |
bluebird bio, Inc. | | | (12,350 | ) | | | (1,717,885 | ) | | | (1.48 | ) |
| | | | | | | | | | | | |
| | | Shares | | | Value | | | Percentage
of Reference
Entities | |
| Biotechnology–(continued) | | | | | |
Cascadian Therapeutics, Inc. | | | (37,450 | ) | | $ | (171,895 | ) | | | (0.14 | ) |
Coherus Biosciences, Inc. | | | (68,450 | ) | | | (770,062 | ) | | | (0.67 | ) |
Corbus Pharmaceuticals Holdings, Inc. | | | (79,700 | ) | | | (565,870 | ) | | | (0.50 | ) |
Dynavax Technologies Corp. | | | (80,250 | ) | | | (1,765,500 | ) | | | (1.36 | ) |
Eiger BioPharmaceuticals, Inc. | | | (11,400 | ) | | | (127,110 | ) | | | (0.12 | ) |
Flexion Therapeutics, Inc. | | | (51,800 | ) | | | (1,140,118 | ) | | | (0.97 | ) |
Ellie Mae Therapeutics, Inc. | | | (85,850 | ) | | | (1,317,797 | ) | | | (1.12 | ) |
Intercept Pharmaceuticals, Inc. | | | (12,100 | ) | | | (745,723 | ) | | | (0.68 | ) |
Juno Therapeutics, Inc. | | | (38,050 | ) | | | (1,708,826 | ) | | | (1.46 | ) |
La Jolla Pharmaceutical Co. | | | (20,375 | ) | | | (700,085 | ) | | | (0.59 | ) |
Mirati Therapeutics, Inc. | | | (39,375 | ) | | | (513,844 | ) | | | (0.48 | ) |
Neurocrine Biosciences, Inc. | | | (28,000 | ) | | | (1,739,080 | ) | | | (1.40 | ) |
Novavax, Inc. | | | (119,000 | ) | | | (129,710 | ) | | | (0.10 | ) |
Radius Health, Inc. | | | (53,550 | ) | | | (1,719,491 | ) | | | (1.59 | ) |
Sarepta Therapeutics, Inc. | | | (36,150 | ) | | | (1,782,557 | ) | | | (1.59 | ) |
T2 Biosystems, Inc. | | | (49,850 | ) | | | (185,940 | ) | | | (0.16 | ) |
TESARO, Inc. | | | (15,050 | ) | | | (1,742,339 | ) | | | (1.46 | ) |
Ultragenyx Pharmaceutical Inc. | | | (19,900 | ) | | | (917,191 | ) | | | (0.86 | ) |
Vital Therapies, Inc. | | | (27,175 | ) | | | (160,332 | ) | | | (0.13 | ) |
| | | | | (25,142,193 | ) | | | (21.64 | ) |
| |
| Casinos & Gaming–(0.05)% | | | | | |
Empire Resorts, Inc. | | | (2,550 | ) | | | (56,865 | ) | | | (0.05 | ) |
| |
| Communications Equipment–(1.72)% | | | | | |
Finisar Corp. | | | (55,450 | ) | | | (1,305,293 | ) | | | (1.09 | ) |
Lumentum Holdings, Inc. | | | (11,850 | ) | | | (748,328 | ) | | | (0.63 | ) |
| | | | | (2,053,621 | ) | | | (1.72 | ) |
| |
| Construction & Engineering–(0.33)% | | | | | |
Dycom Industries, Inc. | | | (4,350 | ) | | | (382,060 | ) | | | (0.33 | ) |
| |
| Construction Machinery & Heavy Trucks–(1.48)% | | | | | |
Wabtec Corp./DE | | | (22,750 | ) | | | (1,740,375 | ) | | | (1.48 | ) |
| |
| Distributors–(1.47)% | | | | | |
Core-Mark Holding Co., Inc. | | | (51,750 | ) | | | (1,762,605 | ) | | | (1.47 | ) |
| |
| Diversified Chemicals–(0.29)% | | | | | |
LSB Industries, Inc. | | | (43,950 | ) | | | (331,822 | ) | | | (0.29 | ) |
| |
| Diversified Metals & Mining–(0.92)% | | | | | |
Compass Minerals International, Inc. | | | (16,450 | ) | | | (1,079,120 | ) | | | (0.92 | ) |
| |
| Electrical Components & Equipment–(2.92)% | | | | | |
Acuity Brands Inc. | | | (10,150 | ) | | | (1,697,080 | ) | | | (1.38 | ) |
American Superconductor Corp. | | | (27,275 | ) | | | (114,555 | ) | | | (0.10 | ) |
Energous Corp. | | | (34,150 | ) | | | (335,012 | ) | | | (0.34 | ) |
Revolution Lighting Technologies, Inc. | | | (30,200 | ) | | | (167,912 | ) | | | (0.14 | ) |
Sunrun Inc. | | | (166,100 | ) | | | (953,414 | ) | | | (0.76 | ) |
See accompanying Notes to Financial Statements which are an integral part of the financial statements.
12 Invesco All Cap Market Neutral Fund
| | | | | | | | | | | | |
| | | Shares | | | Value | | | Percentage
of Reference
Entities | |
| Electrical Components & Equipment–(continued) | | | | | |
Vivint Solar, Inc. | | | (59,300 | ) | | $ | (222,375 | ) | | | (0.20 | ) |
| | | | | (3,490,348 | ) | | | (2.92 | ) |
| |
| Electronic Equipment & Instruments–(0.03)% | | | | | |
Mesa Laboratories, Inc. | | | (250 | ) | | | (39,862 | ) | | | (0.03 | ) |
| |
| Electronic Manufacturing Services–(1.45)% | | | | | |
Fabrinet (Thailand) | | | (46,000 | ) | | | (1,710,280 | ) | | | (1.45 | ) |
| |
| Environmental & Facilities Services–(0.71)% | | | | | |
Aqua Metals, Inc. | | | (32,500 | ) | | | (129,350 | ) | | | (0.12 | ) |
Covanta Holding Corp. | | | (9,550 | ) | | | (153,755 | ) | | | (0.12 | ) |
Team, Inc. | | | (45,700 | ) | | | (562,110 | ) | | | (0.47 | ) |
| | | | | (845,215 | ) | | | (0.71 | ) |
| |
| Food Retail–(0.15)% | | | | | |
Natural Grocers by Vitamin Cottage, Inc. | | | (33,450 | ) | | | (164,239 | ) | | | (0.15 | ) |
| |
| General Merchandise Stores–(0.25)% | | | | | |
Fred’s, Inc.–Class A | | | (23,300 | ) | | | (102,753 | ) | | | (0.09 | ) |
Tuesday Morning Corp. | | | (65,250 | ) | | | (202,275 | ) | | | (0.16 | ) |
| | | | | (305,028 | ) | | | (0.25 | ) |
| |
| Health Care Equipment–(6.99)% | | | | | |
ConforMIS Inc. | | | (65,100 | ) | | | (230,454 | ) | | | (0.20 | ) |
CytoSorbents Corp. | | | (43,400 | ) | | | (266,910 | ) | | | (0.22 | ) |
DexCom, Inc. | | | (39,050 | ) | | | (1,756,079 | ) | | | (1.49 | ) |
Entellus Medical, Inc. | | | (40,900 | ) | | | (692,437 | ) | | | (0.63 | ) |
Invacare Corp. | | | (51,000 | ) | | | (790,500 | ) | | | (0.65 | ) |
InVivo Therapeutics Holdings Corp. | | | (44,300 | ) | | | (57,590 | ) | | | (0.06 | ) |
Invuity, Inc. | | | (26,750 | ) | | | (239,412 | ) | | | (0.21 | ) |
Nevro Corp. | | | (14,300 | ) | | | (1,252,394 | ) | | | (1.12 | ) |
NuVasive, Inc. | | | (24,800 | ) | | | (1,406,904 | ) | | | (1.21 | ) |
Oxford Immunotec Global PLC | | | (39,200 | ) | | | (518,224 | ) | | | (0.53 | ) |
ViewRay Inc. | | | (92,350 | ) | | | (636,292 | ) | | | (0.54 | ) |
Viveve Medical, Inc. | | | (26,000 | ) | | | (141,960 | ) | | | (0.13 | ) |
| | | | | (7,989,156 | ) | | | (6.99 | ) |
| |
| Health Care Facilities–(0.27)% | | | | | |
AAC Holdings, Inc. | | | (37,350 | ) | | | (295,812 | ) | | | (0.27 | ) |
| |
| Health Care Supplies–(0.99)% | | | | | |
Cerus Corp. | | | (165,650 | ) | | | (475,416 | ) | | | (0.41 | ) |
Endologix, Inc. | | | (133,000 | ) | | | (704,900 | ) | | | (0.58 | ) |
| | | | | (1,180,316 | ) | | | (0.99 | ) |
| |
| Heavy Electrical Equipment–(0.17)% | | | | | |
Babcock & Wilcox Enterprises, Inc. | | | (46,800 | ) | | | (204,984 | ) | | | (0.17 | ) |
| |
| Hotels, Resorts & Cruise Lines–(0.07)% | | | | | |
Red Lion Hotels Corp. | | | (9,400 | ) | | | (82,720 | ) | | | (0.07 | ) |
| | | | | | | | | | | | |
| | | Shares | | | Value | | | Percentage
of Reference
Entities | |
| Household Products–(0.18)% | | | | | |
Orchids Paper Products Co. | | | (16,900 | ) | | $ | (207,532 | ) | | | (0.18 | ) |
| |
| Industrial Machinery–(0.24)% | | | | | |
ExOne Co. (The) | | | (26,700 | ) | | | (283,821 | ) | | | (0.24 | ) |
| |
| Internet & Direct Marketing Retail–(3.32)% | | | | | |
Duluth Holdings, Inc.–Class B | | | (42,250 | ) | | | (872,885 | ) | | | (0.73 | ) |
Overstock.com, Inc. | | | (39,800 | ) | | | (1,826,820 | ) | | | (1.19 | ) |
Wayfair, Inc.–Class A | | | (24,450 | ) | | | (1,709,055 | ) | | | (1.40 | ) |
| | | | | (4,408,760 | ) | | | (3.32 | ) |
| |
| Internet Software & Services–(0.80)% | | | | | |
Liquidity Services, Inc. | | | (15,250 | ) | | | (86,925 | ) | | | (0.07 | ) |
Pandora Media, Inc. | | | (118,600 | ) | | | (866,966 | ) | | | (0.73 | ) |
| | | | | (953,891 | ) | | | (0.80 | ) |
| |
| Leisure Products–(1.64)% | | | | | |
Mattel Inc. | | | (124,350 | ) | | | (1,755,822 | ) | | | (1.64 | ) |
| |
| Life & Health Insurance–(1.13)% | | | | | |
Trupanion, Inc. | | | (47,150 | ) | | | (1,327,744 | ) | | | (1.13 | ) |
| |
| Life Sciences Tools & Services–(0.47)% | | | | | |
Pacific Biosciences of California, Inc. | | | (129,550 | ) | | | (547,996 | ) | | | (0.47 | ) |
| |
| Movies & Entertainment–(0.87)% | | | | | |
Global Eagle Entertainment Inc. | | | (111,300 | ) | | | (270,459 | ) | | | (0.31 | ) |
IMAX Corp. | | | (31,200 | ) | | | (756,600 | ) | | | (0.56 | ) |
| | | | | (1,027,059 | ) | | | (0.87 | ) |
| |
| Oil & Gas Equipment & Services–(1.87)% | | | | | |
Bristow Group, Inc. | | | (56,150 | ) | | | (530,056 | ) | | | (0.42 | ) |
Frank’s International N.V. | | | (80,600 | ) | | | (532,766 | ) | | | (0.45 | ) |
Key Energy Services, Inc. | | | (4,900 | ) | | | (52,136 | ) | | | (0.04 | ) |
US Silica Holdings, Inc. | | | (39,450 | ) | | | (1,203,620 | ) | | | (0.96 | ) |
| | | | | (2,318,578 | ) | | | (1.87 | ) |
| |
| Oil & Gas Exploration & Production–(5.04)% | | | | | |
Callon Petroleum Co. | | | (95,150 | ) | | | (1,055,213 | ) | | | (0.85 | ) |
Gulfport Energy Corp. | | | (57,850 | ) | | | (792,545 | ) | | | (0.67 | ) |
Halcon Resources Corp. | | | (238,500 | ) | | | (1,569,330 | ) | | | (1.24 | ) |
Lilis Energy, Inc. | | | (82,350 | ) | | | (410,103 | ) | | | (0.33 | ) |
Resolute Energy Corp. | | | (35,350 | ) | | | (1,061,561 | ) | | | (0.85 | ) |
Sanchez Energy Corp. | | | (92,650 | ) | | | (401,174 | ) | | | (0.30 | ) |
SM Energy Co. | | | (52,550 | ) | | | (1,120,892 | ) | | | (0.80 | ) |
| | | | | (6,410,818 | ) | | | (5.04 | ) |
| |
| Oil & Gas Storage & Transportation–(0.35)% | | | | | |
Frontline Ltd. (Norway) | | | (55,950 | ) | | | (340,735 | ) | | | (0.29 | ) |
Nordic American Tankers Ltd. | | | (15,050 | ) | | | (66,822 | ) | | | (0.06 | ) |
| | | | | (407,557 | ) | | | (0.35 | ) |
| |
| Personal Products–(1.39)% | | | | | |
Coty, Inc.–Class A | | | (105,400 | ) | | | (1,623,160 | ) | | | (1.39 | ) |
See accompanying Notes to Financial Statements which are an integral part of the financial statements.
13 Invesco All Cap Market Neutral Fund
| | | | | | | | | | | | |
| | | Shares | | | Value | | | Percentage
of Reference
Entities | |
| Pharmaceuticals–(5.82)% | | | | | |
Adamis Pharmaceuticals Corp. | | | (47,950 | ) | | $ | (249,340 | ) | | | (0.23 | ) |
Axsome Therapeutics, Inc. | | | (36,300 | ) | | | (172,425 | ) | | | (0.15 | ) |
Collegium Pharmaceutical, Inc. | | | (46,650 | ) | | | (481,895 | ) | | | (0.45 | ) |
Dermira, Inc. | | | (65,700 | ) | | | (1,758,789 | ) | | | (1.56 | ) |
Egalet Corp. | | | (35,100 | ) | | | (34,398 | ) | | | (0.03 | ) |
Lipocine Inc. | | | (31,850 | ) | | | (112,430 | ) | | | (0.10 | ) |
Medicines Co. (The) | | | (36,750 | ) | | | (1,056,195 | ) | | | (1.03 | ) |
Nektar Therapeutics, Inc. | | | (68,050 | ) | | | (1,639,325 | ) | | | (1.42 | ) |
Neos Therapeutics, Inc. | | | (42,900 | ) | | | (446,160 | ) | | | (0.27 | ) |
Ocular Therapeutix, Inc. | | | (46,500 | ) | | | (267,840 | ) | | | (0.22 | ) |
TherapeuticsMD, Inc. | | | (56,550 | ) | | | (266,916 | ) | | | (0.24 | ) |
WaVe Life Sciences Ltd. | | | (5,950 | ) | | | (137,147 | ) | | | (0.12 | ) |
| | | | | (6,622,860 | ) | | | (5.82 | ) |
| |
| Property & Casualty Insurance–(0.98)% | | | | | |
AmTrust Financial Services Inc. | | | (83,200 | ) | | | (1,044,992 | ) | | | (0.98 | ) |
| |
| Real Estate Operating Companies–(0.06)% | | | | | |
Trinity Place Holdings, Inc. | | | (9,400 | ) | | | (67,680 | ) | | | (0.06 | ) |
| |
| Regional Banks–(1.68)% | | | | | |
Bank of California, Inc. | | | (41,600 | ) | | | (875,680 | ) | | | (0.72 | ) |
MidSouth Bancorp, Inc. | | | (26,800 | ) | | | (351,080 | ) | | | (0.30 | ) |
Pacific Mercantile Bancorp | | | (772 | ) | | | (7,218 | ) | | | (0.01 | ) |
United Bankshares, Inc. | | | (20,750 | ) | | | (745,963 | ) | | | (0.65 | ) |
| | | | | (1,979,941 | ) | | | (1.68 | ) |
| |
| Reinsurance–(0.47)% | | | | | |
Maiden Holdings Ltd. | | | (67,600 | ) | | | (557,700 | ) | | | (0.47 | ) |
| |
| Research & Consulting Services–(0.34)% | | | | | |
Cogint, Inc. | | | (86,400 | ) | | | (393,120 | ) | | | (0.34 | ) |
| |
| Restaurants–(3.47)% | | | | | |
Chipotle Mexican Grill, Inc. | | | (6,300 | ) | | | (1,712,970 | ) | | | (1.68 | ) |
Habit Restaurants, Inc. (The)–Class A | | | (41,100 | ) | | | (505,530 | ) | | | (0.42 | ) |
Jamba, Inc. | | | (6,950 | ) | | | (57,129 | ) | | | (0.05 | ) |
Noodles & Co. | | | (65,634 | ) | | | (285,508 | ) | | | (0.25 | ) |
Papa John’s International, Inc. | | | (12,050 | ) | | | (820,002 | ) | | | (0.71 | ) |
Shake Shack Inc.–Class A | | | (1,350 | ) | | | (51,246 | ) | | | (0.04 | ) |
Zoe’s Kitchen, Inc. | | | (30,400 | ) | | | (373,312 | ) | | | (0.32 | ) |
| | | | | (3,805,697 | ) | | | (3.47 | ) |
| |
| Retail REITs–(1.06)% | | | | | |
CBL & Associates Properties, Inc. | | | (12,200 | ) | | | (95,648 | ) | | | (0.09 | ) |
Pennsylvania Real Estate Investment Trust | | | (110,900 | ) | | | (1,077,948 | ) | | | (0.97 | ) |
| | | | | (1,173,596 | ) | | | (1.06 | ) |
| | | | | | | | | | | | |
| | | Shares | | | Value | | | Percentage
of Reference
Entities | |
| Semiconductor Equipment–(0.89)% | | | | | |
CyberOptics Corp. | | | (11,300 | ) | | $ | (162,720 | ) | | | (0.13 | ) |
PDF Solutions, Inc. | | | (57,650 | ) | | | (844,572 | ) | | | (0.76 | ) |
| | | | | (1,007,292 | ) | | | (0.89 | ) |
| |
| Semiconductors–(4.05)% | | | | | |
Advanced Micro Devices Inc. | | | (134,950 | ) | | | (1,482,426 | ) | | | (1.62 | ) |
Impinj, Inc. | | | (32,800 | ) | | | (1,119,792 | ) | | | (0.97 | ) |
MACOM Technology Solutions Holdings, Inc. | | | (30,400 | ) | | | (1,242,752 | ) | | | (1.02 | ) |
NeoPhotonics Corp. | | | (68,150 | ) | | | (355,061 | ) | | | (0.33 | ) |
SunPower Corp. | | | (19,000 | ) | | | (135,280 | ) | | | (0.11 | ) |
| | | | | (4,335,311 | ) | | | (4.05 | ) |
| |
| Soft Drinks–(0.04)% | | | | | |
Celsius Holdings, Inc. | | | (7,750 | ) | | | (40,610 | ) | | | (0.04 | ) |
| |
| Specialized Finance–(0.39)% | | | | | |
On Deck Capital, Inc. | | | (91,600 | ) | | | (451,588 | ) | | | (0.39 | ) |
| |
| Specialized REITs–(0.15)% | | | | | |
Life Storage, Inc. | | | (2,150 | ) | | | (173,763 | ) | | | (0.15 | ) |
| |
| Specialty Chemicals–(0.38)% | | | | | |
Flotek Industries, Inc. | | | (92,100 | ) | | | (453,132 | ) | | | (0.38 | ) |
| |
| Specialty Stores–(0.78)% | | | | | |
MarineMax, Inc. | | | (38,600 | ) | | | (716,030 | ) | | | (0.55 | ) |
Sportsmans Warehouse Holdings, Inc. | | | (62,600 | ) | | | (256,660 | ) | | | (0.23 | ) |
| | | | | (972,690 | ) | | | (0.78 | ) |
| |
| Systems Software–(0.57)% | | | | | |
SecureWorks Corp.–Class A | | | (61,900 | ) | | | (620,238 | ) | | | (0.57 | ) |
|
| Technology Hardware, Storage & Peripherals–(1.58)% | |
3D Systems Corp. | | | (55,450 | ) | | | (686,471 | ) | | | (0.55 | ) |
Diebold Nixdorf, Inc. | | | (36,800 | ) | | | (710,240 | ) | | | (0.66 | ) |
USA Technologies, Inc. | | | (69,050 | ) | | | (438,468 | ) | | | (0.37 | ) |
| | | | | (1,835,179 | ) | | | (1.58 | ) |
| |
| Thrifts & Mortgage Finance–(1.08)% | | | | | |
Meta Financial Group, Inc. | | | (15,150 | ) | | | (1,321,838 | ) | | | (1.08 | ) |
| |
| Trading Companies & Distributors–(0.79)% | | | | | |
Huttig Building Products, Inc. | | | (39,050 | ) | | | (262,416 | ) | | | (0.24 | ) |
NOW Inc. | | | (52,450 | ) | | | (656,674 | ) | | | (0.55 | ) |
| | | | | (919,090 | ) | | | (0.79 | ) |
| |
| Trucking–(1.47)% | | | | | |
Hertz Global Holdings, Inc. | | | (71,100 | ) | | | (1,768,257 | ) | | | (1.47 | ) |
Total Equity Securities — Short | | | $ | (116,463,863 | ) | | | (100.00 | ) |
See accompanying Notes to Financial Statements which are an integral part of the financial statements.
14 Invesco All Cap Market Neutral Fund
Statement of Assets and Liabilities
October 31, 2017
| | | | |
Assets: | |
Investments in securities, at value (Cost $104,076,900) | | | $116,568,318 | |
Investments in affiliated money market funds, at value and cost | | | 11,732,985 | |
Other investments: | | | | |
Unrealized appreciation on swap agreements — OTC | | | 856,299 | |
Deposits with brokers: | | | | |
Cash collateral — OTC derivatives | | | 50,811 | |
Foreign currencies, at value (Cost $51) | | | 53 | |
Receivable for: | | | | |
Investments sold | | | 12,793,437 | |
Fund shares sold | | | 417,064 | |
Dividends and interest | | | 34,499 | |
Investment for trustee deferred compensation and retirement plans | | | 7,476 | |
Other assets | | | 58,038 | |
Total assets | | | 142,518,980 | |
| |
Liabilities: | | | | |
Other investments: | | | | |
Swaps payable — OTC | | | 174,079 | |
Payable for: | | | | |
Investments purchased | | | 13,398,032 | |
Fund shares reacquired | | | 153,988 | |
Accrued fees to affiliates | | | 25,061 | |
Accrued trustees’ and officers’ fees and benefits | | | 2,113 | |
Accrued other operating expenses | | | 48,433 | |
Trustee deferred compensation and retirement plans | | | 7,476 | |
Total liabilities | | | 13,809,182 | |
Net assets applicable to shares outstanding | | | $128,709,798 | |
| |
Net assets consist of: | | | | |
Shares of beneficial interest | | | $101,297,766 | |
Undistributed net investment income (loss) | | | (862,941 | ) |
Undistributed net realized gain | | | 14,927,254 | |
Net unrealized appreciation | | | 13,347,719 | |
| | | | $128,709,798 | |
| | | | |
Net Assets: | |
Class A | | $ | 11,085,105 | |
Class C | | $ | 4,855,923 | |
Class R | | $ | 109,368 | |
Class Y | | $ | 40,874,699 | |
Class R5 | | $ | 10,359 | |
Class R6 | | $ | 71,774,344 | |
|
Shares outstanding, no par value,
with an unlimited number of shares authorized: | |
Class A | | | 1,100,478 | |
Class C | | | 495,633 | |
Class R | | | 10,963 | |
Class Y | | | 4,025,590 | |
Class R5 | | | 1,018 | |
Class R6 | | | 7,065,375 | |
Class A: | | | | |
Net asset value per share | | $ | 10.07 | |
Maximum offering price per share | | | | |
(Net asset value of $10.07 ¸ 94.50%) | | $ | 10.66 | |
Class C: | | | | |
Net asset value and offering price per share | | $ | 9.80 | |
Class R: | | | | |
Net asset value and offering price per share | | $ | 9.98 | |
Class Y: | | | | |
Net asset value and offering price per share | | $ | 10.15 | |
Class R5: | | | | |
Net asset value and offering price per share | | $ | 10.18 | |
Class R6: | | | | |
Net asset value and offering price per share | | $ | 10.16 | |
See accompanying Notes to Financial Statements which are an integral part of the financial statements.
15 Invesco All Cap Market Neutral Fund
Statement of Operations
For the year ended October 31, 2017
| | | | |
Investment income: | |
Dividends (net of foreign withholding taxes of $6,038) | | $ | 1,313,667 | |
Dividends from affiliated money market funds | | | 80,212 | |
Total investment income | | | 1,393,879 | |
| |
Expenses: | | | | |
Advisory fees | | | 1,391,916 | |
Administrative services fees | | | 50,000 | |
Custodian fees | | | 9,751 | |
Distribution fees: | | | | |
Class A | | | 63,564 | |
Class C | | | 74,645 | |
Class R | | | 584 | |
Transfer agent fees — A, C, R and Y | | | 92,386 | |
Transfer agent fees — R5 | | | 2 | |
Transfer agent fees — R6 | | | 313 | |
Trustees’ and officers’ fees and benefits | | | 22,248 | |
Registration and filing fees | | | 90,496 | |
Reports to shareholders | | | 38,993 | |
Professional services fees | | | 62,710 | |
Other | | | 11,051 | |
Total expenses | | | 1,908,659 | |
Less: Fees waived, expenses reimbursed and expense offset arrangement(s) | | | (54,255 | ) |
Net expenses | | | 1,854,404 | |
Net investment income (loss) | | | (460,525 | ) |
| |
Realized and unrealized gain (loss) from: | | | | |
Net realized gain (loss) from: | | | | |
Investment securities | | | 32,809,799 | |
Foreign currencies | | | 25 | |
Swap agreements | | | (24,129,094 | ) |
| | | | 8,680,730 | |
Change in net unrealized appreciation (depreciation) of: | | | | |
Investment securities | | | 3,611,051 | |
Foreign currencies | | | 2 | |
Swap agreements | | | (7,067,258 | ) |
| | | | (3,456,205 | ) |
Net realized and unrealized gain | | | 5,224,525 | |
Net increase in net assets resulting from operations | | $ | 4,764,000 | |
See accompanying Notes to Financial Statements which are an integral part of the financial statements.
16 Invesco All Cap Market Neutral Fund
Statement of Changes in Net Assets
For the years ended October 31, 2017 and 2016
| | | | | | | | |
| | | 2017 | | | 2016 | |
Operations: | | | | | |
Net investment income (loss) | | $ | (460,525 | ) | | $ | (225,004 | ) |
Net realized gain (loss) | | | 8,680,730 | | | | (31,472,934 | ) |
Change in net unrealized appreciation (depreciation) | | | (3,456,205 | ) | | | 15,439,146 | |
Net increase (decrease) in net assets resulting from operations | | | 4,764,000 | | | | (16,258,792 | ) |
| | |
Distributions to shareholders from net investment income: | | | | | | | | |
Class A | | | — | | | | (1,996,674 | ) |
Class C | | | — | | | | (342,508 | ) |
Class R | | | — | | | | (5,987 | ) |
Class Y | | | — | | | | (2,153,585 | ) |
Class R5 | | | — | | | | (67,476 | ) |
Class R6 | | | — | | | | (84,398 | ) |
Total distributions from net investment income | | | — | | | | (4,650,628 | ) |
| | |
Distributions to shareholders from net realized gains: | | | | | | | | |
Class A | | | (23,299 | ) | | | — | |
Class C | | | (5,884 | ) | | | — | |
Class R | | | (63 | ) | | | — | |
Class Y | | | (23,998 | ) | | | — | |
Class R5 | | | (290 | ) | | | — | |
Class R6 | | | (40,229 | ) | | | — | |
Total distributions from net realized gains | | | (93,763 | ) | | | — | |
| | |
Share transactions–net: | | | | | | | | |
Class A | | | (32,641,294 | ) | | | 37,820,319 | |
Class C | | | (5,491,479 | ) | | | 9,875,981 | |
Class R | | | 3,532 | | | | 106,118 | |
Class Y | | | (1,328,111 | ) | | | 30,769,232 | |
Class R5 | | | (484,975 | ) | | | — | |
Class R6 | | | (4,100,374 | ) | | | 77,562,633 | |
Net increase (decrease) in net assets resulting from share transactions | | | (44,042,701 | ) | | | 156,134,283 | |
Net increase (decrease) in net assets | | | (39,372,464 | ) | | | 135,224,863 | |
| | |
Net assets: | | | | | | | | |
Beginning of year | | | 168,082,262 | | | | 32,857,399 | |
End of year (includes undistributed net investment income (loss) of $(862,941) and $(7,969,348), respectively) | | $ | 128,709,798 | | | $ | 168,082,262 | |
Notes to Financial Statements
October 31, 2017
NOTE 1—Significant Accounting Policies
Invesco All Cap Market Neutral Fund (the “Fund”) is a series portfolio of AIM Investment Funds (Invesco Investment Funds) (the “Trust”). The Trust is organized as a Delaware statutory trust and is registered under the Investment Company Act of 1940, as amended (the “1940 Act”), as an open-end series management investment company consisting of twenty separate series portfolios, each authorized to issue an unlimited number of shares of beneficial interest. The assets, liabilities and operations of each portfolio are accounted for separately. Information presented in these financial statements pertains only to the Fund. Matters affecting each portfolio or class will be voted on exclusively by the shareholders of such portfolio or class.
The Fund’s investment objective is to provide a positive return over a full market cycle from a broadly diversified portfolio of stocks while seeking to limit exposure to the general risks associated with stock market investing.
The Fund currently consists of six different classes of shares: Class A, Class C, Class R, Class Y, Class R5 and Class R6. Class Y shares are available only to certain investors. Class A shares are sold with a front-end sales charge unless certain waiver criteria are met and under certain circumstances load waived shares may be subject to contingent deferred sales charges (“CDSC”). Class C shares are sold with a CDSC. Class R, Class Y, Class R5 and Class R6 shares are sold at net asset value.
See accompanying Notes to Financial Statements which are an integral part of the financial statements.
17 Invesco All Cap Market Neutral Fund
The Fund is an investment company and accordingly follows the investment company accounting and reporting guidance in accordance with Financial Accounting Standards Board Accounting Standards Codification Topic 946, Financial Services — Investment Companies.
The following is a summary of the significant accounting policies followed by the Fund in the preparation of its financial statements.
| A. | Security Valuations — Securities, including restricted securities, are valued according to the following policy. |
A security listed or traded on an exchange (except convertible securities) is valued at its last sales price or official closing price as of the close of the customary trading session on the exchange where the security is principally traded, or lacking any sales or official closing price on a particular day, the security may be valued at the closing bid price on that day. Securities traded in the over-the-counter market are valued based on prices furnished by independent pricing services or market makers. When such securities are valued by an independent pricing service they may be considered fair valued. Futures contracts are valued at the final settlement price set by an exchange on which they are principally traded. Listed options are valued at the mean between the last bid and asked prices from the exchange on which they are principally traded. Options not listed on an exchange are valued by an independent source at the mean between the last bid and asked prices. For purposes of determining net asset value (“NAV”) per share, futures and option contracts generally are valued 15 minutes after the close of the customary trading session of the New York Stock Exchange (“NYSE”).
Investments in open-end and closed-end registered investment companies that do not trade on an exchange are valued at the end-of-day net asset value per share. Investments in open-end and closed-end registered investment companies that trade on an exchange are valued at the last sales price or official closing price as of the close of the customary trading session on the exchange where the security is principally traded.
Debt obligations (including convertible securities) and unlisted equities are fair valued using an evaluated quote provided by an independent pricing service. Evaluated quotes provided by the pricing service may be determined without exclusive reliance on quoted prices, and may reflect appropriate factors such as institution-size trading in similar groups of securities, developments related to specific securities, dividend rate (for unlisted equities), yield (for debt obligations), quality, type of issue, coupon rate (for debt obligations), maturity (for debt obligations), individual trading characteristics and other market data. Pricing services generally value debt obligations assuming orderly transactions of institutional round lot size, but a fund may hold or transact in the same securities in smaller, odd lot sizes. Odd lots often trade at lower prices than institutional round lots. Debt obligations are subject to interest rate and credit risks. In addition, all debt obligations involve some risk of default with respect to interest and/or principal payments.
Foreign securities’ (including foreign exchange contracts) prices are converted into U.S. dollar amounts using the applicable exchange rates as of the close of the NYSE. If market quotations are available and reliable for foreign exchange-traded equity securities, the securities will be valued at the market quotations. Because trading hours for certain foreign securities end before the close of the NYSE, closing market quotations may become unreliable. If between the time trading ends on a particular security and the close of the customary trading session on the NYSE, events occur that the investment adviser determines are significant and make the closing price unreliable, the Fund may fair value the security. If the event is likely to have affected the closing price of the security, the security will be valued at fair value in good faith using procedures approved by the Board of Trustees. Adjustments to closing prices to reflect fair value may also be based on a screening process of an independent pricing service to indicate the degree of certainty, based on historical data, that the closing price in the principal market where a foreign security trades is not the current value as of the close of the NYSE. Foreign securities’ prices meeting the approved degree of certainty that the price is not reflective of current value will be priced at the indication of fair value from the independent pricing service. Multiple factors may be considered by the independent pricing service in determining adjustments to reflect fair value and may include information relating to sector indices, American Depositary Receipts and domestic and foreign index futures. Foreign securities may have additional risks including exchange rate changes, potential for sharply devalued currencies and high inflation, political and economic upheaval, the relative lack of issuer information, relatively low market liquidity and the potential lack of strict financial and accounting controls and standards.
Securities for which market prices are not provided by any of the above methods may be valued based upon quotes furnished by independent sources. The last bid price may be used to value equity securities. The mean between the last bid and asked prices is used to value debt obligations, including corporate loans.
Securities for which market quotations are not readily available or became unreliable are valued at fair value as determined in good faith by or under the supervision of the Trust’s officers following procedures approved by the Board of Trustees. Issuer specific events, market trends, bid/asked quotes of brokers and information providers and other market data may be reviewed in the course of making a good faith determination of a security’s fair value.
The Fund may invest in securities that are subject to interest rate risk, meaning the risk that the prices will generally fall as interest rates rise and, conversely, the prices will generally rise as interest rates fall. Specific securities differ in their sensitivity to changes in interest rates depending on their individual characteristics. Changes in interest rates may result in increased market volatility, which may affect the value and/or liquidity of certain Fund investments.
Valuations change in response to many factors including the historical and prospective earnings of the issuer, the value of the issuer’s assets, general economic conditions, interest rates, investor perceptions and market liquidity. Because of the inherent uncertainties of valuation, the values reflected in the financial statements may materially differ from the value received upon actual sale of those investments.
| B. | Securities Transactions and Investment Income — Securities transactions are accounted for on a trade date basis. Realized gains or losses on sales are computed on the basis of specific identification of the securities sold. Interest income (net of withholding tax, if any) is recorded on the accrual basis from settlement date. Bond premiums and discounts are amortized and/or accreted over the lives of the respective securities. Pay-in-kind income received in the form of securities in-lieu of cash is recorded as interest income. Dividend income and dividend expense on short sales are recorded on the ex-dividend date. |
The Fund may periodically participate in litigation related to Fund investments. As such, the Fund may receive proceeds from litigation settlements. Any proceeds received are included in the Statement of Operations as realized gain (loss) for investments no longer held and as unrealized gain (loss) for investments still held.
Brokerage commissions and mark ups are considered transaction costs and are recorded as an increase to the cost basis of securities purchased and/or a reduction of proceeds on a sale of securities. Such transaction costs are included in the determination of net realized and unrealized gain (loss) from investment securities reported in the Statement of Operations and the Statement of Changes in Net Assets and the net realized and unrealized gains (losses) on securities per share in the Financial Highlights. Transaction costs are included in the calculation of the
18 Invesco All Cap Market Neutral Fund
Fund’s net asset value and, accordingly, they reduce the Fund’s total returns. These transaction costs are not considered operating expenses and are not reflected in net investment income reported in the Statement of Operations and the Statement of Changes in Net Assets, or the net investment income per share and the ratios of expenses and net investment income reported in the Financial Highlights, nor are they limited by any expense limitation arrangements between the Fund and the investment adviser.
The Fund allocates income and realized and unrealized capital gains and losses to a class based on the relative net assets of each class.
| C. | Country Determination — For the purposes of making investment selection decisions and presentation in the Schedule of Investments, the investment adviser may determine the country in which an issuer is located and/or credit risk exposure based on various factors. These factors include the laws of the country under which the issuer is organized, where the issuer maintains a principal office, the country in which the issuer derives 50% or more of its total revenues and the country that has the primary market for the issuer’s securities, as well as other criteria. Among the other criteria that may be evaluated for making this determination are the country in which the issuer maintains 50% or more of its assets, the type of security, financial guarantees and enhancements, the nature of the collateral and the sponsor organization. Country of issuer and/or credit risk exposure has been determined to be the United States of America, unless otherwise noted. |
| D. | Distributions — Distributions from net investment income and net realized capital gain, if any, are generally declared and paid annually and recorded on the ex-dividend date. The Fund may elect to treat a portion of the proceeds from redemptions as distributions for federal income tax purposes. |
| E. | Federal Income Taxes — The Fund intends to comply with the requirements of Subchapter M of the Internal Revenue Code of 1986, as amended (the “Internal Revenue Code”), necessary to qualify as a regulated investment company and to distribute substantially all of the Fund’s taxable earnings to shareholders. As such, the Fund will not be subject to federal income taxes on otherwise taxable income (including net realized capital gain) that is distributed to shareholders. Therefore, no provision for federal income taxes is recorded in the financial statements. |
The Fund recognizes the tax benefits of uncertain tax positions only when the position is more likely than not to be sustained. Management has analyzed the Fund’s uncertain tax positions and concluded that no liability for unrecognized tax benefits should be recorded related to uncertain tax positions. Management is not aware of any tax positions for which it is reasonably possible that the total amounts of unrecognized tax benefits will change materially in the next 12 months.
The Fund files tax returns in the U.S. Federal jurisdiction and certain other jurisdictions. Generally, the Fund is subject to examinations by such taxing authorities for up to three years after the filing of the return for the tax period.
| F. | Expenses — Fees provided for under the Rule 12b-1 plan of a particular class of the Fund are charged to the operations of such class. Transfer agency fees and expenses and other shareholder recordkeeping fees and expenses attributable to Class R5 and Class R6 are allocated to each share class based on relative net assets. Sub-accounting fees attributable to Class R5 are charged to the operations of the class. Transfer agency fees and expenses and other shareholder recordkeeping fees and expenses relating to all other classes are allocated among those classes based on relative net assets. All other expenses are allocated among the classes based on relative net assets. |
| G. | Accounting Estimates — The preparation of financial statements in conformity with accounting principles generally accepted in the United States of America (“GAAP”) requires management to make estimates and assumptions that affect the reported amounts of assets and liabilities at the date of the financial statements and the reported amounts of revenues and expenses during the reporting period including estimates and assumptions related to taxation. Actual results could differ from those estimates by a significant amount. In addition, the Fund monitors for material events or transactions that may occur or become known after the period-end date and before the date the financial statements are released to print. |
| H. | Indemnifications — Under the Trust’s organizational documents, each Trustee, officer, employee or other agent of the Trust is indemnified against certain liabilities that may arise out of the performance of their duties to the Fund. Additionally, in the normal course of business, the Fund enters into contracts, including the Fund’s servicing agreements, that contain a variety of indemnification clauses. The Fund’s maximum exposure under these arrangements is unknown as this would involve future claims that may be made against the Fund that have not yet occurred. The risk of material loss as a result of such indemnification claims is considered remote. |
| I. | Foreign Currency Translations — Foreign currency is valued at the close of the NYSE based on quotations posted by banks and major currency dealers. Portfolio securities and other assets and liabilities denominated in foreign currencies are translated into U.S. dollar amounts at date of valuation. Purchases and sales of portfolio securities (net of foreign taxes withheld on disposition) and income items denominated in foreign currencies are translated into U.S. dollar amounts on the respective dates of such transactions. The Fund does not separately account for the portion of the results of operations resulting from changes in foreign exchange rates on investments and the fluctuations arising from changes in market prices of securities held. The combined results of changes in foreign exchange rates and the fluctuation of market prices on investments (net of estimated foreign tax withholding) are included with the net realized and unrealized gain or loss from investments in the Statement of Operations. Reported net realized foreign currency gains or losses arise from (1) sales of foreign currencies, (2) currency gains or losses realized between the trade and settlement dates on securities transactions, and (3) the difference between the amounts of dividends, interest, and foreign withholding taxes recorded on the Fund’s books and the U.S. dollar equivalent of the amounts actually received or paid. Net unrealized foreign currency gains and losses arise from changes in the fair values of assets and liabilities, other than investments in securities at fiscal period end, resulting from changes in exchange rates. |
The Fund may invest in foreign securities, which may be subject to foreign taxes on income, gains on investments or currency repatriation, a portion of which may be recoverable. Foreign taxes, if any, are recorded based on the tax regulations and rates that exist in the foreign markets in which the Fund invests and are shown in the Statement of Operations.
| J. | Forward Foreign Currency Contracts — The Fund may engage in foreign currency transactions either on a spot (i.e. for prompt delivery and settlement) basis, or through forward foreign currency contracts, to manage or minimize currency or exchange rate risk. |
The Fund may also enter into forward foreign currency contracts for the purchase or sale of a security denominated in a foreign currency in order to “lock in” the U.S. dollar price of that security, or the Fund may also enter into forward foreign currency contracts that do not provide for physical settlement of the two currencies, but instead are settled by a single cash payment calculated as the difference between the agreed upon exchange rate and the spot rate at settlement based upon an agreed upon notional amount (non-deliverable forwards). The Fund will set aside liquid assets in an amount equal to the daily mark-to-market obligation for forward foreign currency contracts.
19 Invesco All Cap Market Neutral Fund
A forward foreign currency contract is an obligation between two parties (“Counterparties”) to purchase or sell a specific currency for an agreed-upon price at a future date. The use of forward foreign currency contracts does not eliminate fluctuations in the price of the underlying securities the Fund owns or intends to acquire but establishes a rate of exchange in advance. Fluctuations in the value of these contracts are measured by the difference in the contract date and reporting date exchange rates and are recorded as unrealized appreciation (depreciation) until the contracts are closed. When the contracts are closed, realized gains (losses) are recorded. Realized and unrealized gains (losses) on the contracts are included in the Statement of Operations. The primary risks associated with forward foreign currency contracts include failure of the Counterparty to meet the terms of the contract and the value of the foreign currency changing unfavorably. These risks may be in excess of the amounts reflected in the Statement of Assets and Liabilities.
| K. | Swap Agreements — The Fund may enter into various swap transactions, including interest rate, total return, volatility, variance, index, currency and credit default swap contracts (“CDS”) for investment purposes or to manage interest rate, equity, currency or credit risk. Such transactions are agreements between Counterparties. These agreements may contain among other conditions, events of default and termination events, and various covenants and representations such as provisions that require the Fund to maintain a pre-determined level of net assets, and/or provide limits regarding the decline of the Fund’s NAV over specific periods of time. If the Fund were to trigger such provisions and have open derivative positions at that time, the Counterparty may be able to terminate such agreement and request immediate payment in an amount equal to the net liability positions, if any. |
Interest rate, total return, volatility, variance, index, and currency swap agreements are two-party contracts entered into primarily to exchange the returns (or differentials in rates of returns) earned or realized on particular predetermined investments or instruments. The gross returns to be exchanged or “swapped” between the parties are calculated with respect to a notional amount, i.e., the return on or increase in value of a particular dollar amount invested at a particular interest rate or return of an underlying asset, in a particular foreign currency, or in a “basket” of securities representing a particular index.
A total return swap is an agreement in which one party makes payments based on a set rate, either fixed or variable, while the other party makes payments based on the return of an underlying asset, which includes both the income generated and capital gains, if any. The unrealized appreciation (depreciation) on total return swaps includes dividends on the underlying equity securities and financing rate payable from the Counterparty. At the maturity date, a net cash flow is exchanged where the total return is equivalent to the return of the underlying reference less a financing rate, if any. As a receiver, the Fund would receive payments based on any positive total return and would owe payments in the event of a negative total return. As the payer, the Fund would owe payments on any net positive total return, and would receive payment in the event of a negative total return.
Changes in the value of swap agreements are recognized as unrealized gains (losses) in the Statement of Operations by “marking to market” on a daily basis to reflect the value of the swap agreement at the end of each trading day. Payments received or paid at the beginning of the agreement are reflected as such on the Statement of Assets and Liabilities and may be referred to as upfront payments. The Fund accrues for the fixed payment stream and amortizes upfront payments, if any, on swap agreements on a daily basis with the net amount, recorded as a component of realized gain (loss) on the Statement of Operations. A liquidation payment received or made at the termination of a swap agreement is recorded as realized gain (loss) on the Statement of Operations. The Fund segregates cash or liquid securities having a value at least equal to the amount of the potential obligation of a Fund under any swap transaction. Cash held as collateral is recorded as deposits with brokers on the Statement of Assets and Liabilities. Entering into these agreements involves, to varying degrees, lack of liquidity and elements of credit, market, and Counterparty risk in excess of amounts recognized on the Statement of Assets and Liabilities. Such risks involve the possibility that a swap is difficult to sell or liquidate; the Counterparty does not honor its obligations under the agreement and unfavorable interest rates and market fluctuations. It is possible that developments in the swaps market, including potential government regulation, could adversely affect the Fund’s ability to terminate existing swap agreements or to realize amounts to be received under such agreements. A short position in a security poses more risk than holding the same security long. As there is no limit on how much the price of the security can increase, the Fund’s exposure is unlimited.
| L. | Leverage Risk — Leverage exists when the Fund can lose more than it originally invests because it purchases or sells an instrument or enters into a transaction without investing an amount equal to the full economic exposure of the instrument or transaction. |
| M. | Collateral — To the extent the Fund has designated or segregated a security as collateral and that security is subsequently sold, it is the Fund’s practice to replace such collateral no later than the next business day. |
NOTE 2—Advisory Fees and Other Fees Paid to Affiliates
The Trust has entered into a master investment advisory agreement with Invesco Advisers, Inc. (the “Adviser” or “Invesco”). Effective January 1, 2017, under the terms of the investment advisory agreement, the Fund accrues daily and pays monthly an advisory fee to the Adviser based on the annual rate of the Fund’s average daily net assets as follows:
| | | | |
| Average Daily Net Assets | | Rate | |
First $250 million | | | 0.85% | |
Next $250 million | | | 0.82% | |
Next $500 million | | | 0.80% | |
Next $1.5 billion | | | 0.77% | |
Next $2.5 billion | | | 0.75% | |
Next $2.5 billion | | | 0.72% | |
Next $2.5 billion | | | 0.70% | |
Over $10 billion | | | 0.67% | |
20 Invesco All Cap Market Neutral Fund
Prior to January 1, 2017, the Fund had paid an advisory fee to the Adviser based on the annual rate of the Fund’s average daily net assets as follows:
| | | | |
| Average Daily Net Assets | | Rate | |
First $10 billion | | | 1.25% | |
Over $10 billion | | | 1.15% | |
For the year ended October 31, 2017, the effective advisory fees incurred by the Fund was 0.93%.
Under the terms of a master sub-advisory agreement between the Adviser and each of Invesco Asset Management Deutschland GmbH, Invesco Asset Management Limited, Invesco Asset Management (Japan) Limited, Invesco Hong Kong Limited, Invesco Senior Secured Management, Inc. and Invesco Canada Ltd. and separate sub-advisory agreements with Invesco PowerShares Capital Management LLC and Invesco Asset Management (India) Private Limited (collectively, the “Affiliated Sub-Advisers”) the Adviser, not the Fund, will pay 40% of the fees paid to the Adviser to any such Affiliated Sub-Adviser(s) that provide(s) discretionary investment management services to the Fund based on the percentage of assets allocated to such Affiliated Sub-Adviser(s).
Effective January 1, 2017, the Adviser has contractually agreed, through at least February 28, 2019, to waive advisory fees and/or reimburse expenses to the extent necessary to limit total annual fund operating expenses after fee waiver and/or expense reimbursement (excluding certain items discussed below) of Class A, Class C, Class R, Class Y, Class R5 and Class R6 shares to 1.50%, 2.25%, 1.75%, 1.25%, 1.25% and 1.25%, respectively, of the Fund’s average daily net assets (the “expense limits”). Prior to January 1, 2017, the Adviser had contractually agreed to waive advisory fees and/or reimburse expenses to the extent necessary to limit total annual fund operating expenses after fee waiver and/or expense reimbursement (excluding certain items discussed below) of Class A, Class C, Class R, Class Y, Class R5 and Class R6 shares to 1.62%, 2.37%, 1.87%, 1.37%, 1.37% and 1.37%, respectively, of the Fund’s average daily net assets. In determining the Adviser’s obligation to waive advisory fees and/or reimburse expenses, the following expenses are not taken into account, and could cause the total annual fund operating expenses after fee waiver and/or expense reimbursement to exceed the numbers reflected above: (1) interest; (2) taxes; (3) dividend expense on short sales; (4) extraordinary or non-routine items, including litigation expenses; and (5) expenses that the Fund has incurred but did not actually pay because of an expense offset arrangement. Unless Invesco continues the fee waiver agreement, it will terminate on February 28, 2019. During its term, the fee waiver agreement cannot be terminated or amended to increase the expense limits or reduce the advisory fee waiver without approval of the Board of Trustees. The Adviser did not waive fees and/or reimburse expenses during the period under these expense limits.
Further, the Adviser has contractually agreed, through at least June 30, 2019, to waive the advisory fee payable by the Fund in an amount equal to 100% of the net advisory fees the Adviser receives from the affiliated money market funds on investments by the Fund of uninvested cash in such affiliated money market funds.
For the year ended October 31, 2017, the Adviser waived advisory fees of $33,021 and reimbursed class level expenses of $6,723, $1,974, $31, $11,905 and $49 of Class A, Class C, Class R, Class Y and Class R6 shares, respectively.
The Trust has entered into a master administrative services agreement with Invesco pursuant to which the Fund has agreed to pay Invesco for certain administrative costs incurred in providing accounting services to the Fund. For the year ended October 31, 2017, expenses incurred under the agreement are shown in the Statement of Operations as Administrative services fees.
The Trust has entered into a transfer agency and service agreement with Invesco Investment Services, Inc. (“IIS”) pursuant to which the Fund has agreed to pay IIS a fee for providing transfer agency and shareholder services to the Fund and reimburse IIS for certain expenses incurred by IIS in the course of providing such services. IIS may make payments to intermediaries that provide omnibus account services, sub-accounting services and/or networking services. All fees payable by IIS to intermediaries that provide omnibus account services or sub-accounting services are charged back to the Fund, subject to certain limitations approved by the Trust’s Board of Trustees. For the year ended October 31, 2017, expenses incurred under the agreement are shown in the Statement of Operations as Transfer agent fees.
The Trust has entered into master distribution agreements with Invesco Distributors, Inc. (“IDI”) to serve as the distributor for the Class A, Class C, Class R, Class Y, Class R5 and Class R6 shares of the Fund. The Trust has adopted plans pursuant to Rule 12b-1 under the 1940 Act with respect to the Fund’s Class A, Class C and Class R shares (collectively the “Plans”). The Fund, pursuant to the Plans, pays IDI compensation at the annual rate of 0.25% of the Fund’s average daily net assets of Class A shares, 1.00% of the average daily net assets of Class C shares and 0.50% of the average daily net assets of Class R shares. The fees are accrued daily and paid monthly. Of the Plan payments, up to 0.25% of the average daily net assets of each class of shares may be paid to furnish continuing personal shareholder services to customers who purchase and own shares of such classes. Any amounts not paid as a service fee under the Plans would constitute an asset-based sales charge. Rules of the Financial Industry Regulatory Authority (“FINRA”) impose a cap on the total sales charges, including asset-based sales charges, that may be paid by any class of shares of the Fund. For the year ended October 31, 2017, expenses incurred under the Plans are shown in the Statement of Operations as Distribution fees.
Front-end sales commissions and CDSC (collectively, the “sales charges”) are not recorded as expenses of the Fund. Front-end sales commissions are deducted from proceeds from the sales of Fund shares prior to investment in Class A shares of the Fund. CDSC are deducted from redemption proceeds prior to remittance to the shareholder. During the year ended October 31, 2017, IDI advised the Fund that IDI retained $4,290 in front-end sales commissions from the sale of Class A shares and $1,506 and $4,574 from Class A and Class C shares, respectively, for CDSC imposed upon redemptions by shareholders.
Certain officers and trustees of the Trust are officers and directors of the Adviser, IIS and/or IDI.
NOTE 3—Additional Valuation Information
GAAP defines fair value as the price that would be received to sell an asset or paid to transfer a liability in an orderly transaction between market participants at the measurement date, under current market conditions. GAAP establishes a hierarchy that prioritizes the inputs to valuation methods, giving the highest priority to readily available unadjusted quoted prices in an active market for identical assets (Level 1) and the lowest priority to significant unobservable inputs (Level 3), generally when market prices are not readily available or are unreliable. Based on the valuation inputs, the
21 Invesco All Cap Market Neutral Fund
securities or other investments are tiered into one of three levels. Changes in valuation methods may result in transfers in or out of an investment’s assigned level:
| | Level 1 — | Prices are determined using quoted prices in an active market for identical assets. |
| | Level 2 — | Prices are determined using other significant observable inputs. Observable inputs are inputs that other market participants may use in pricing a security. These may include quoted prices for similar securities, interest rates, prepayment speeds, credit risk, yield curves, loss severities, default rates, discount rates, volatilities and others. |
| | Level 3 — | Prices are determined using significant unobservable inputs. In situations where quoted prices or observable inputs are unavailable (for example, when there is little or no market activity for an investment at the end of the period), unobservable inputs may be used. Unobservable inputs reflect the Fund’s own assumptions about the factors market participants would use in determining fair value of the securities or instruments and would be based on the best available information. |
The following is a summary of the tiered valuation input levels, as of October 31, 2017. The level assigned to the securities valuations may not be an indication of the risk or liquidity associated with investing in those securities. Because of the inherent uncertainties of valuation, the values reflected in the financial statements may materially differ from the value received upon actual sale of those investments.
The Fund’s policy is to recognize transfers in and out of the valuation levels as of the end of the reporting period. During the year ended October 31, 2017, there were no material transfers between valuation levels.
| | | | | | | | | | | | | | | | |
| | | Level 1 | | | Level 2 | | | Level 3 | | | Total | |
Common Stocks & Other Equity Interests | | $ | 116,568,318 | | | $ | — | | | $ | — | | | $ | 116,568,318 | |
Money Market Funds | | | 11,732,985 | | | | — | | | | — | | | | 11,732,985 | |
| | | | 128,301,303 | | | | — | | | | — | | | | 128,301,303 | |
Swap Agreements* | | | — | | | | 856,299 | | | | — | | | | 856,299 | |
Total Investments | | $ | 128,301,303 | | | $ | 856,299 | | | $ | — | | | $ | 129,157,602 | |
| * | Unrealized appreciation. |
NOTE 4—Derivative Investments
The Fund may enter into an International Swaps and Derivatives Association Master Agreement (“ISDA Master Agreement”) under which a Fund may trade OTC derivatives. An OTC transaction entered into under an ISDA Master Agreement typically involves a collateral posting arrangement, payment netting provisions and close-out netting provisions. These netting provisions allow for reduction of credit risk through netting of contractual obligations. The enforceability of the netting provisions of the ISDA Master Agreement depends on the governing law of the ISDA Master Agreement, among other factors.
For financial reporting purposes, the Fund does not offset OTC derivative assets or liabilities that are subject to ISDA Master Agreements in the Statement of Assets and Liabilities.
Value of Derivative Investments at Period-End
The table below summarizes the value of the Fund’s derivative investments, detailed by primary risk exposure, held as of October 31, 2017:
| | | | |
| | | Value | |
| Derivative Assets | | Equity
Risk | |
Unrealized appreciation on swap agreements — OTC | | $ | 856,299 | |
Derivatives not subject to master netting agreements | | | — | |
Total Derivative Assets subject to master netting agreements | | $ | 856,299 | |
Offsetting Assets and Liabilities
The table below reflects the Fund’s exposure to Counterparties subject to either an ISDA Master Agreement or other agreement for OTC derivative transactions as of October 31, 2017.
| | | | | | | | | | | | | | | | | | | | | | | | |
| | | Financial
Derivative
Assets | | | Financial
Derivative
Liabilities | | | Net Value of
Derivatives | | | Collateral
(Received)/Pledged | | | Net
Amount | |
| Counterparty | | Swap
Agreements | | | Swap
Agreements | | | | Non-Cash | | | Cash | | |
Morgan Stanley & Co. LLC | | $ | 856,299 | | | $ | (174,079 | ) | | $ | 682,220 | | | $ | — | | | $ | — | | | $ | 682,220 | |
22 Invesco All Cap Market Neutral Fund
Effect of Derivative Investments for the year ended October 31, 2017
The table below summarizes the gains (losses) on derivative investments, detailed by primary risk exposure, recognized in earnings during the period:
| | | | |
| | | Location of Gain (Loss) on
Statement of Operations | |
| | | Equity
Risk | |
Realized Gain (Loss): | | | | |
Swap agreements | | $ | (24,129,094 | ) |
Change in Net Unrealized Appreciation (Depreciation): | | | | |
Swap agreements | | | (7,067,258 | ) |
Total | | $ | (31,196,352 | ) |
The table below summarizes the average notional value of swap agreements outstanding during the period.
| | | | |
| | | Swap
Agreements | |
Average notional value | | $ | 134,533,049 | |
NOTE 5—Expense Offset Arrangement(s)
The expense offset arrangement is comprised of transfer agency credits which result from balances in demand deposit accounts used by the transfer agent for clearing shareholder transactions. For the year ended October 31, 2017, the Fund received credits from this arrangement, which resulted in the reduction of the Fund’s total expenses of $552.
NOTE 6—Trustees’ and Officers’ Fees and Benefits
Trustees’ and Officers’ Fees and Benefits include amounts accrued by the Fund to pay remuneration to certain Trustees and Officers of the Fund. Trustees have the option to defer compensation payable by the Fund, and Trustees’ and Officers’ Fees and Benefits also include amounts accrued by the Fund to fund such deferred compensation amounts. Those Trustees who defer compensation have the option to select various Invesco Funds in which their deferral accounts shall be deemed to be invested. Obligations under the deferred compensation plan represent unsecured claims against the general assets of the Fund.
NOTE 7—Cash Balances
The Fund is permitted to temporarily carry a negative or overdrawn balance in its account with State Street Bank and Trust Company, the custodian bank. Such balances, if any at period-end, are shown in the Statement of Assets and Liabilities under the payable caption Amount due custodian. To compensate the custodian bank for such overdrafts, the overdrawn Fund may either (1) leave funds as a compensating balance in the account so the custodian bank can be compensated by earning the additional interest; or (2) compensate by paying the custodian bank at a rate agreed upon by the custodian bank and Invesco, not to exceed the contractually agreed upon rate.
NOTE 8—Distributions to Shareholders and Tax Components of Net Assets
Tax Character of Distributions to Shareholders Paid During the Fiscal Years Ended October 31, 2017 and 2016:
| | | | | | | | |
| | | 2017 | | | 2016 | |
Ordinary income | | $ | — | | | $ | 4,597,598 | |
Long-term capital gain | | | 93,763 | | | | 53,030 | |
Total distributions | | $ | 93,763 | | | $ | 4,650,628 | |
Tax Components of Net Assets at Period-End:
| | | | |
| | | 2017 | |
Undistributed long-term gain | | $ | 15,127,768 | |
Net unrealized appreciation — investments | | | 12,290,905 | |
Temporary book/tax differences | | | (6,641 | ) |
Shares of beneficial interest | | | 101,297,766 | |
Total net assets | | $ | 128,709,798 | |
The difference between book-basis and tax-basis unrealized appreciation (depreciation) is due to differences in the timing of recognition of gains and losses on investments for tax and book purposes. The Fund’s net unrealized appreciation difference is attributable primarily to wash sales and swap agreements.
The temporary book/tax differences are a result of timing differences between book and tax recognition of income and/or expenses. The Fund’s temporary book/tax differences are the result of the trustee deferral of compensation.
23 Invesco All Cap Market Neutral Fund
Capital loss carryforward is calculated and reported as of a specific date. Results of transactions and other activity after that date may affect the amount of capital loss carryforward actually available for the Fund to utilize. The ability to utilize capital loss carryforward in the future may be limited under the Internal Revenue Code and related regulations based on the results of future transactions.
The Fund does not have a capital loss carryforward as of October 31, 2017.
NOTE 9—Investment Transactions
The aggregate amount of investment securities (other than short-term securities, U.S. Treasury obligations and money market funds, if any) purchased and sold by the Fund during the year ended October 31, 2017 was $221,975,495 and $290,225,550, respectively. Cost of investments, including any derivatives, on a tax basis includes the adjustments for financial reporting purposes as of the most recently completed federal income tax reporting period-end.
| | | | |
| Unrealized Appreciation (Depreciation) of Investments on a Tax Basis | |
Aggregate unrealized appreciation of investments | | $ | 15,956,009 | |
Aggregate unrealized (depreciation) of investments | | | (3,665,104 | ) |
Net unrealized appreciation of investments | | $ | 12,290,905 | |
Cost of investments for tax purposes is $116,866,697.
NOTE 10—Reclassification of Permanent Differences
Primarily as a result of differing book/tax treatment of net operating losses and swap agreement income, on October 31, 2017, undistributed net investment income (loss) was increased by $7,566,932, undistributed net realized gain was increased by $6,818,945 and shares of beneficial interest was decreased by $14,385,877. This reclassification had no effect on the net assets of the Fund.
NOTE 11—Share Information
| | | | | | | | | | | | | | | | |
| | | Summary of Share Activity | |
| | | Years ended October 31, | |
| | | 2017(a) | | | 2016 | |
| | | Shares | | | Amount | | | Shares | | | Amount | |
Sold: | | | | | | | | | | | | | | | | |
Class A | | | 450,565 | | | $ | 4,530,754 | | | | 9,254,725 | | | $ | 98,705,258 | |
Class C | | | 58,328 | | | | 578,322 | | | | 1,785,156 | | | | 18,630,806 | |
Class R | | | 3,876 | | | | 38,742 | | | | 25,401 | | | | 266,205 | |
Class Y | | | 3,880,773 | | | | 39,331,445 | | | | 5,966,976 | | | | 62,854,381 | |
Class R6(b) | | | 941,211 | | | | 9,425,954 | | | | 8,048,947 | | | | 84,017,175 | |
| | | | |
Issued as reinvestment of dividends: | | | | | | | | | | | | | | | | |
Class A | | | 1,971 | | | | 20,639 | | | | 132,014 | | | | 1,395,381 | |
Class C | | | 573 | | | | 5,875 | | | | 32,714 | | | | 341,201 | |
Class R | | | 6 | | | | 57 | | | | 444 | | | | 4,665 | |
Class Y | | | 2,159 | | | | 22,736 | | | | 145,868 | | | | 1,547,659 | |
Class R6 | | | 3,792 | | | | 39,939 | | | | 1,595 | | | | 16,921 | |
| | | | |
Reacquired: | | | | | | | | | | | | | | | | |
Class A | | | (3,693,539 | ) | | | (37,192,687 | ) | | | (6,120,260 | ) | | | (62,280,320 | ) |
Class C | | | (618,543 | ) | | | (6,075,676 | ) | | | (913,301 | ) | | | (9,096,026 | ) |
Class R | | | (3,557 | ) | | | (35,267 | ) | | | (17,120 | ) | | | (164,752 | ) |
Class Y | | | (4,055,298 | ) | | | (40,682,292 | ) | | | (3,326,932 | ) | | | (33,632,808 | ) |
Class R5 | | | (48,983 | ) | | | (484,975 | ) | | | — | | | | — | |
Class R6 | | | (1,336,039 | ) | | | (13,566,267 | ) | | | (656,366 | ) | | | (6,471,463 | ) |
Net increase (decrease) in share activity | | | (4,412,705 | ) | | $ | (44,042,701 | ) | | | 14,359,861 | | | $ | 156,134,283 | |
| (a) | There are entities that are record owners of more than 5% of the outstanding shares of the Fund and in the aggregate own 27% of the outstanding shares of the Fund. IDI has an agreement with these entities to sell Fund shares. The Fund, Invesco and/or Invesco affiliates may make payments to these entities, which are considered to be related to the Fund, for providing services to the Fund, Invesco and/or Invesco affiliates including but not limited to services such as securities brokerage, distribution, third party record keeping and account servicing. The Fund has no knowledge as to whether all or any portion of the shares owned of record by these entities are also owned beneficially. |
| | In addition, 55% of the outstanding shares of the Fund are owned by the Adviser or an affiliate of the Adviser. |
| (b) | On February 18, 2016, 6,524,352 Class R6 shares valued at $68,766,670 were sold to affiliated mutual funds. |
24 Invesco All Cap Market Neutral Fund
NOTE 12—Financial Highlights
The following schedule presents financial highlights for a share of the Fund outstanding throughout the periods indicated.
| | | | | | | | | | | | | | | | | | | | | | | | | | | | | | | | | | | | | | | | | | | | | | | | | | | | | | | | | | | | | | | | |
| | | Net asset
value,
beginning
of period | | |
Net
investment
income
(loss)(a) | | | Net gains
(losses)
on securities
(both
realized and
unrealized) | | | Total from
investment
operations | | |
Dividends
from net
investment
income | | | Distributions
from net
realized
gains | | |
Total
distributions | | | Net asset
value, end
of period | | | Total
return(b) | | | Net assets,
end of period
(000’s omitted) | | | Ratio of expenses to average
net assets
(including
interest
expense and
dividends on
short sales
expense)
with fee waivers
and/or expenses
absorbed | | | Ratio of expenses to average
net assets
(including
interest
expense and
dividends on
short sales
expense)
without fee waivers
and/or expenses
absorbed | | | Ratio of expenses to average
net assets
(excluding
interest
expense and
dividends on
short sales
expense)
with fee waivers
and/or expenses absorbed | | | Ratio of expenses to average
net assets
(excluding
interest
expense and
dividends on
short sales
expense)
without fee waivers
and/or expenses absorbed | | | Ratio of net
investment
income (loss)
to average
net assets | | | Portfolio
turnover(c) | |
Class A | | | | | | | | | | | | | | | | | | | | | | | | | | | | | | | | | | | | | | | | | | | | | | | | | | | | | | | | | | | | | | | | |
Year ended 10/31/17 | | $ | 9.80 | | | $ | (0.05 | ) | | $ | 0.33 | | | $ | 0.28 | | | $ | — | | | $ | (0.01 | ) | | $ | (0.01 | ) | | $ | 10.07 | | | | 2.81 | % | | $ | 11,085 | | | | 1.43 | %(d) | | | 1.48 | %(d) | | | 1.43 | %(d) | | | 1.48 | %(d) | | | (0.50 | )%(d) | | | 162 | % |
Year ended 10/31/16 | | | 11.92 | | | | (0.03 | ) | | | (0.76 | ) | | | (0.79 | ) | | | (1.33 | ) | | | — | | | | (1.33 | ) | | | 9.80 | | | | (7.42 | ) | | | 42,539 | | | | 1.61 | | | | 1.85 | | | | 1.61 | | | | 1.85 | | | | (0.26 | ) | | | 168 | |
Year ended 10/31/15 | | | 10.70 | | | | (0.20 | ) | | | 1.42 | | | | 1.22 | | | | — | | | | — | | | | — | | | | 11.92 | | | | 11.40 | | | | 12,812 | | | | 3.69 | (e) | | | 4.62 | (e) | | | 1.60 | | | | 2.53 | | | | (1.85 | ) | | | 175 | |
Year ended 10/31/14(f) | | | 10.00 | | | | (0.27 | ) | | | 0.97 | | | | 0.70 | | | | — | | | | — | | | | — | | | | 10.70 | | | | 7.00 | | | | 9,742 | | | | 4.53 | (e)(g) | | | 7.28 | (e)(g) | | | 1.60 | (g) | | | 4.35 | (g) | | | (3.03 | )(g) | | | 105 | |
Class C | | | | | | | | | | | | | | | | | | | | | | | | | | | | | | | | | | | | | | | | | | | | | | | | | | | | | | | | | | | | | | | | |
Year ended 10/31/17 | | | 9.60 | | | | (0.12 | ) | | | 0.33 | | | | 0.21 | | | | — | | | | (0.01 | ) | | | (0.01 | ) | | | 9.80 | | | | 2.14 | | | | 4,856 | | | | 2.18 | (d) | | | 2.23 | (d) | | | 2.18 | (d) | | | 2.23 | (d) | | | (1.25 | )(d) | | | 162 | |
Year ended 10/31/16 | | | 11.76 | | | | (0.10 | ) | | | (0.76 | ) | | | (0.86 | ) | | | (1.30 | ) | | | — | | | | (1.30 | ) | | | 9.60 | | | | (8.19 | ) | | | 10,136 | | | | 2.36 | | | | 2.60 | | | | 2.36 | | | | 2.60 | | | | (1.01 | ) | | | 168 | |
Year ended 10/31/15 | | | 10.63 | | | | (0.28 | ) | | | 1.41 | | | | 1.13 | | | | — | | | | — | | | | — | | | | 11.76 | | | | 10.63 | | | | 1,772 | | | | 4.44 | (e) | | | 5.37 | (e) | | | 2.35 | | | | 3.28 | | | | (2.60 | ) | | | 175 | |
Year ended 10/31/14(f) | | | 10.00 | | | | (0.34 | ) | | | 0.97 | | | | 0.63 | | | | — | | | | — | | | | — | | | | 10.63 | | | | 6.30 | | | | 857 | | | | 5.28 | (e)(g) | | | 8.03 | (e)(g) | | | 2.35 | (g) | | | 5.10 | (g) | | | (3.78 | )(g) | | | 105 | |
Class R | | | | | | | | | | | | | | | | | | | | | | | | | | | | | | | | | | | | | | | | | | | | | | | | | | | | | | | | | | | | | | | | |
Year ended 10/31/17 | | | 9.73 | | | | (0.07 | ) | | | 0.33 | | | | 0.26 | | | | — | | | | (0.01 | ) | | | (0.01 | ) | | | 9.98 | | | | 2.63 | | | | 109 | | | | 1.68 | (d) | | | 1.73 | (d) | | | 1.68 | (d) | | | 1.73 | (d) | | | (0.75 | )(d) | | | 162 | |
Year ended 10/31/16 | | | 11.86 | | | | (0.05 | ) | | | (0.76 | ) | | | (0.81 | ) | | | (1.32 | ) | | | — | | | | (1.32 | ) | | | 9.73 | | | | (7.66 | ) | | | 104 | | | | 1.86 | | | | 2.10 | | | | 1.86 | | | | 2.10 | | | | (0.51 | ) | | | 168 | |
Year ended 10/31/15 | | | 10.68 | | | | (0.22 | ) | | | 1.40 | | | | 1.18 | | | | — | | | | — | | | | — | | | | 11.86 | | | | 11.05 | | | | 23 | | | | 3.94 | (e) | | | 4.87 | (e) | | | 1.85 | | | | 2.78 | | | | (2.10 | ) | | | 175 | |
Year ended 10/31/14(f) | | | 10.00 | | | | (0.29 | ) | | | 0.97 | | | | 0.68 | | | | — | | | | — | | | | — | | | | 10.68 | | | | 6.80 | | | | 40 | | | | 4.78 | (e)(g) | | | 7.53 | (e)(g) | | | 1.85 | (g) | | | 4.60 | (g) | | | (3.28 | )(g) | | | 105 | |
Class Y | | | | | | | | | | | | | | | | | | | | | | | | | | | | | | | | | | | | | | | | | | | | | | | | | | | | | | | | | | | | | | | | |
Year ended 10/31/17 | | | 9.85 | | | | (0.03 | ) | | | 0.34 | | | | 0.31 | | | | — | | | | (0.01 | ) | | | (0.01 | ) | | | 10.15 | | | | 3.10 | | | | 40,875 | | | | 1.18 | (d) | | | 1.23 | (d) | | | 1.18 | (d) | | | 1.23 | (d) | | | (0.25 | )(d) | | | 162 | |
Year ended 10/31/16 | | | 11.97 | | | | (0.00 | ) | | | (0.77 | ) | | | (0.77 | ) | | | (1.35 | ) | | | — | | | | (1.35 | ) | | | 9.85 | | | | (7.24 | ) | | | 41,369 | | | | 1.36 | | | | 1.60 | | | | 1.36 | | | | 1.60 | | | | (0.01 | ) | | | 168 | |
Year ended 10/31/15 | | | 10.72 | | | | (0.17 | ) | | | 1.42 | | | | 1.25 | | | | — | | | | — | | | | — | | | | 11.97 | | | | 11.66 | | | | 16,907 | | | | 3.44 | (e) | | | 4.37 | (e) | | | 1.35 | | | | 2.28 | | | | (1.60 | ) | | | 175 | |
Year ended 10/31/14(f) | | | 10.00 | | | | (0.25 | ) | | | 0.97 | | | | 0.72 | | | | — | | | | — | | | | — | | | | 10.72 | | | | 7.20 | | | | 14,651 | | | | 4.28 | (e)(g) | | | 7.03 | (e)(g) | | | 1.35 | (g) | | | 4.10 | (g) | | | (2.78 | )(g) | | | 105 | |
Class R5 | | | | | | | | | | | | | | | | | | | | | | | | | | | | | | | | | | | | | | | | | | | | | | | | | | | | | | | | | | | | | | | | |
Year ended 10/31/17 | | | 9.86 | | | | (0.02 | ) | | | 0.35 | | | | 0.33 | | | | — | | | | (0.01 | ) | | | (0.01 | ) | | | 10.18 | | | | 3.30 | | | | 10 | | | | 1.10 | (d) | | | 1.12 | (d) | | | 1.10 | (d) | | | 1.12 | (d) | | | (0.17 | )(d) | | | 162 | |
Year ended 10/31/16 | | | 11.97 | | | | (0.00 | ) | | | (0.76 | ) | | | (0.76 | ) | | | (1.35 | ) | | | — | | | | (1.35 | ) | | | 9.86 | | | | (7.15 | ) | | | 493 | | | | 1.36 | | | | 1.45 | | | | 1.36 | | | | 1.45 | | | | (0.01 | ) | | | 168 | |
Year ended 10/31/15 | | | 10.72 | | | | (0.17 | ) | | | 1.42 | | | | 1.25 | | | | — | | | | — | | | | — | | | | 11.97 | | | | 11.66 | | | | 599 | | | | 3.44 | (e) | | | 4.28 | (e) | | | 1.35 | | | | 2.19 | | | | (1.60 | ) | | | 175 | |
Year ended 10/31/14(f) | | | 10.00 | | | | (0.25 | ) | | | 0.97 | | | | 0.72 | | | | — | | | | — | | | | — | | | | 10.72 | | | | 7.20 | | | | 648 | | | | 4.28 | (e)(g) | | | 7.00 | (e)(g) | | | 1.35 | (g) | | | 4.07 | (g) | | | (2.78 | )(g) | | | 105 | |
Class R6 | | | | | | | | | | | | | | | | | | | | | | | | | | | | | | | | | | | | | | | | | | | | | | | | | | | | | | | | | | | | | | | | |
Year ended 10/31/17 | | | 9.85 | | | | (0.02 | ) | | | 0.34 | | | | 0.32 | | | | — | | | | (0.01 | ) | | | (0.01 | ) | | | 10.16 | | | | 3.20 | | | | 71,774 | | | | 1.10 | (d) | | | 1.12 | (d) | | | 1.10 | (d) | | | 1.12 | (d) | | | (0.17 | )(d) | | | 162 | |
Year ended 10/31/16 | | | 11.97 | | | | (0.00 | ) | | | (0.77 | ) | | | (0.77 | ) | | | (1.35 | ) | | | — | | | | (1.35 | ) | | | 9.85 | | | | (7.24 | ) | | | 73,442 | | | | 1.36 | | | | 1.44 | | | | 1.36 | | | | 1.44 | | | | (0.01 | ) | | | 168 | |
Year ended 10/31/15 | | | 10.72 | | | | (0.17 | ) | | | 1.42 | | | | 1.25 | | | | — | | | | — | | | | — | | | | 11.97 | | | | 11.66 | | | | 745 | | | | 3.44 | (e) | | | 4.28 | (e) | | | 1.35 | | | | 2.19 | | | | (1.60 | ) | | | 175 | |
Year ended 10/31/14(f) | | | 10.00 | | | | (0.25 | ) | | | 0.97 | | | | 0.72 | | | | — | | | | — | | | | — | | | | 10.72 | | | | 7.20 | | | | 584 | | | | 4.28 | (e)(g) | | | 6.99 | (e)(g) | | | 1.35 | (g) | | | 4.06 | (g) | | | (2.78 | )(g) | | | 105 | |
| (a) | Calculated using average shares outstanding. |
| (b) | Includes adjustments in accordance with accounting principles generally accepted in the United States of America and as such, the net asset value for financial reporting purposes and the returns based upon those net asset values may differ from the net asset value and returns for shareholder transactions. Does not include sales charges and is not annualized for periods less than one year, if applicable. |
| (c) | Portfolio turnover is calculated at the fund level and is not annualized for periods less than one year, if applicable. |
| (d) | Ratios are based on average daily net assets (000’s omitted) of $25,426, $7,465, $117, $45,023, $461 and $71,930 for Class A, Class C, Class R, Class Y, Class R5 and Class R6 shares, respectively. |
| (e) | Ratio of interest expense and dividends on short sales to average net assets for the years ended October 31, 2015 and October 31, 2014 were 2.09% and 2.93%, respectively. |
| (f) | Commencement date of December 17, 2013. |
25 Invesco All Cap Market Neutral Fund
Report of Independent Registered Public Accounting Firm
To the Board of Trustees of AIM Investment Funds (Invesco Investment Funds) and Shareholders of Invesco All Cap Market Neutral Fund:
In our opinion, the accompanying statement of assets and liabilities, including the schedule of investments, and the related statements of operations and of changes in net assets and the financial highlights present fairly, in all material respects, the financial position of Invesco All Cap Market Neutral Fund (one of the portfolios constituting the AIM Investment Funds (Invesco Investment Funds), hereafter referred to as the “Fund”) as of October 31, 2017, the results of its operations for the year then ended, the changes in its net assets for each of the two years in the period then ended and the financial highlights for each of the three years in the period then ended and for the period December 17, 2013 (commencement of investment operations) through October 31, 2014, in conformity with accounting principles generally accepted in the United States of America. These financial statements and financial highlights (hereafter referred to as “financial statements”) are the responsibility of the Fund’s management. Our responsibility is to express an opinion on these financial statements based on our audits. We conducted our audits of these financial statements in accordance with the standards of the Public Company Accounting Oversight Board (United States). Those standards require that we plan and perform the audit to obtain reasonable assurance about whether the financial statements are free of material misstatement. An audit includes examining, on a test basis, evidence supporting the amounts and disclosures in the financial statements, assessing the accounting principles used and significant estimates made by management, and evaluating the overall financial statement presentation. We believe that our audits, which included confirmation of securities as of October 31, 2017 by correspondence with the custodian, transfer agent and brokers, and when replies were not received from brokers, we performed other auditing procedures, provide a reasonable basis for our opinion.
PricewaterhouseCoopers LLP
Houston, Texas
December 21, 2017
26 Invesco All Cap Market Neutral Fund
Calculating your ongoing Fund expenses
Example
As a shareholder of the Fund, you incur two types of costs: (1) transaction costs, which may include sales charges (loads) on purchase payments or contingent deferred sales charges on redemptions, if any; and (2) ongoing costs, including management fees, distribution and/or service (12b-1) fees, and other Fund expenses. This example is intended to help you understand your ongoing costs (in dollars) of investing in the Fund and to compare these costs with ongoing costs of investing in other mutual funds. The example is based on an investment of $1,000 invested at the beginning of the period and held for the entire period May 1, 2017 through October 31, 2017.
Actual expenses
The table below provides information about actual account values and actual expenses. You may use the information in this table, together with the amount you invested, to estimate the expenses that you paid over the period. Simply divide your account value by $1,000 (for example, an $8,600 account value divided by $1,000 = 8.6), then multiply the result by the number in the table under the heading entitled “Actual Expenses Paid During Period” to estimate the expenses you paid on your account during this period.
Hypothetical example for comparison purposes
The table below also provides information about hypothetical account values and hypothetical expenses based on the Fund’s actual expense ratio and an assumed rate of return of 5% per year before expenses, which is not the Fund’s actual return.
The hypothetical account values and expenses may not be used to estimate the actual ending account balance or expenses you paid for the period. You may use this information to compare the ongoing costs of investing in the Fund and other funds. To do so, compare this 5% hypothetical example with the 5% hypothetical examples that appear in the shareholder reports of the other funds.
Please note that the expenses shown in the table are meant to highlight your ongoing costs only and do not reflect any transaction costs, such as sales charges (loads) on purchase payments or contingent deferred sales charges on redemptions, if any. Therefore, the hypothetical information is useful in comparing ongoing costs only, and will not help you determine the relative total costs of owning different funds. In addition, if these transaction costs were included, your costs would have been higher.
| | | | | | | | | | | | | | | | | | | | | | | | |
| Class | | Beginning
Account Value
(05/01/17) | | | ACTUAL | | | HYPOTHETICAL
(5% annual return before
expenses) | | | Annualized
Expense
Ratio | |
| | | Ending
Account Value
(10/31/17)1 | | | Expenses
Paid During
Period2 | | | Ending
Account Value
(10/31/17) | | | Expenses
Paid During
Period2 | | |
| A | | $ | 1,000.00 | | | $ | 1,003.00 | | | $ | 7.17 | | | $ | 1,018.05 | | | $ | 7.22 | | | | 1.42 | % |
| C | | | 1,000.00 | | | | 999.00 | | | | 10.93 | | | | 1,014.27 | | | | 11.02 | | | | 2.17 | |
| R | | | 1,000.00 | | | | 1,002.00 | | | | 8.43 | | | | 1,016.79 | | | | 8.49 | | | | 1.67 | |
| Y | | | 1,000.00 | | | | 1,004.00 | | | | 5.91 | | | | 1,019.31 | | | | 5.96 | | | | 1.17 | |
| R5 | | | 1,000.00 | | | | 1,004.90 | | | | 5.26 | | | | 1,019.96 | | | | 5.30 | | | | 1.04 | |
| R6 | | | 1,000.00 | | | | 1,004.90 | | | | 5.26 | | | | 1,019.96 | | | | 5.30 | | | | 1.04 | |
| 1 | The actual ending account value is based on the actual total return of the Fund for the period May 1, 2017 through October 31, 2017, after actual expenses and will differ from the hypothetical ending account value which is based on the Fund’s expense ratio and a hypothetical annual return of 5% before expenses. |
| 2 | Expenses are equal to the Fund’s annualized expense ratio as indicated above multiplied by the average account value over the period, multiplied by 184/365 to reflect the most recent fiscal half year. |
27 Invesco All Cap Market Neutral Fund
Approval of Investment Advisory and Sub-Advisory Contracts
The Board of Trustees (the Board) of AIM Investment Funds (Invesco Investment Funds) is required under the Investment Company Act of 1940, as amended, to approve annually the renewal of Invesco All Cap Market Neutral Fund’s (the Fund) investment advisory agreements. During contract renewal meetings held on June 12-13, 2017, the Board as a whole, and the disinterested or “independent” Trustees, who comprise over 75% of the Board, voting separately, approved the continuance for the Fund of the Master Investment Advisory Agreement with Invesco Advisers, Inc. (Invesco Advisers and the investment advisory agreement) and the Master Intergroup Sub-Advisory Contract for Mutual Funds with Invesco Asset Management Deutschland GmbH, Invesco Asset Management Limited, Invesco Asset Management (Japan) Limited, Invesco Hong Kong Limited, Invesco Senior Secured Management, Inc. and Invesco Canada Ltd. and separate Sub-Advisory Contracts with Invesco PowerShares Capital Management LLC and Invesco Asset Management (India) Private Limited (collectively, the Affiliated Sub-Advisers and the sub-advisory contracts) for another year, effective July 1, 2017.
In evaluating the fairness and reasonableness of compensation under the Fund’s investment advisory agreement and sub-advisory contracts, the Board considered, among other things, the factors discussed below. The Board determined that continuation of the Fund’s investment advisory agreement and the sub-advisory contracts is in the best interest of the Fund and its shareholders and that the compensation payable to Invesco Advisers and the Affiliated Sub-Advisers under the agreements is fair and reasonable.
The Board’s Fund Evaluation Process
The Board’s Investments Committee has established three Sub-Committees, which meet throughout the year to review the performance of funds advised by Invesco Advisers (the Invesco Funds). Over the course of each year, the Sub-Committees meet with portfolio managers for their assigned Invesco Funds and other members of management to review the performance, investment objective(s), policies, strategies, limitations and investment risks of these funds. The Board had the benefit of reports from the Sub-Committees and Investments Committee throughout the year in considering approval of the continuance of each Invesco Fund’s investment advisory agreement and sub-advisory contracts for another year.
During the contract renewal process, the Board receives comparative performance and fee data regarding the Invesco Funds prepared by Invesco Advisers and Broadridge Financial Solutions, Inc. (Broadridge), an independent provider of investment company data. The Board also receives an independent written
evaluation from the Senior Officer, an officer of the Invesco Funds who reports directly to the independent Trustees. The Senior Officer’s evaluation is prepared as part of his responsibility to manage the process by which the Invesco Funds’ proposed management fees are negotiated during the annual contract renewal process to ensure they are negotiated in a manner that is at arms’ length and reasonable. In addition to meetings with Invesco Advisers and fund counsel, the independent Trustees also discuss the continuance of the investment advisory agreement and sub-advisory contracts in separate sessions with the Senior Officer and with independent legal counsel.
The Trustees recognized that the advisory fee rates for the Invesco Funds are, in most cases, the result of years of review and negotiation. The Trustees’ deliberations and conclusions in a particular year may be based in part on their deliberations and conclusions regarding these arrangements throughout the year and in prior years. The Trustees’ review and conclusions are based on the comprehensive consideration of all information presented to them and are not the result of any single determinative factor. Moreover, one Trustee may have weighed a particular piece of information or factor differently than another Trustee.
The discussion below is a summary of the Senior Officer’s independent written evaluation with respect to the Fund’s investment advisory agreement as well as a discussion of the material factors and related conclusions that formed the basis for the Board’s approval of the Fund’s investment advisory agreement and sub-advisory contracts. This information is current as of June 13, 2017, and does not reflect consideration of factors that became known to the Board after that date.
Factors and Conclusions and Summary of Independent Written Fee Evaluation
| A. | Nature, Extent and Quality of Services Provided by Invesco Advisers and the Affiliated Sub-Advisers |
The Board reviewed the advisory services provided to the Fund by Invesco Advisers under the Fund’s investment advisory agreement, the performance of Invesco Advisers in providing these services, and the credentials and experience of the officers and employees of Invesco Advisers who provide these services, including the Fund’s portfolio manager or managers. The Board’s review included consideration of Invesco Advisers’ investment process oversight, credit analysis and investment risk management. The Board also considered non-advisory services that Invesco Advisers and its affiliates provide to the Invesco Funds such as various back office support functions, trading operations, internal audit, valuation and legal and compliance.
In determining whether to continue the Fund’s investment advisory agreement, the Board considered the benefits of reapproving an existing relationship as contrasted with the greater uncertainty that may be associated with entering into a new relationship. The Board concluded that the nature, extent and quality of the services provided to the Fund by Invesco Advisers are appropriate and satisfactory.
The Board reviewed the services that may be provided by the Affiliated Sub-Advisers under the sub-advisory contracts and the credentials and experience of the officers and employees of the Affiliated Sub-Advisers who provide these services. The Board noted that the Affiliated Sub-Advisers have offices and personnel that are located in financial centers around the world. As a result, the Board noted that the Affiliated Sub-Advisers can provide research and investment analysis on the markets and economies of various countries in which the Fund may invest, make recommendations regarding securities and assist with security trades. The Board concluded that the sub-advisory contracts may benefit the Fund and its shareholders by permitting Invesco Advisers to use the resources and talents of the Affiliated Sub-Advisers in managing the Fund. The Board concluded that the nature, extent and quality of the services that may be provided by the Affiliated Sub-Advisers are appropriate and satisfactory.
| B. | Fund Investment Performance |
The Board considered Fund investment performance as a relevant factor in considering whether to approve the investment advisory agreement. The Board did not view Fund performance as a relevant factor in considering whether to approve the sub-advisory contracts for the Fund, as no Affiliated Sub-Adviser currently manages assets of the Fund.
The Board noted that the Fund only had three years of performance history and compared the Fund’s investment performance during the past one and three calendar years to the performance of funds in the Broadridge performance universe and against the Lipper Alternative Equity Market Neutral Funds Index. The Board noted that performance of Class A shares of the Fund was in the third quintile of its performance universe for the one year period and the first quintile for the three year period (the first quintile being the best performing funds and the fifth quintile being the worst performing funds). The Board noted that performance of Class A shares of the Fund was below the performance of the Index for the one year period and above the performance of the Index for the three year period. The Trustees also reviewed more recent Fund performance and this review did not change their conclusions.
28 Invesco All Cap Market Neutral Fund
| C. | Advisory and Sub-Advisory Fees |
The Board compared the Fund’s contractual management fee rate to the contractual management fee rates of funds in the Fund’s Broadridge expense group at a common asset level. The Board noted that the contractual management fee rate for Class A shares of the Fund was below the median contractual management fee rate of funds in its expense group. The Board noted that the term “contractual management fee” for funds in the expense group may include both advisory and certain administrative services fees, but that Broadridge does not provide information on a fund by fund basis as to what is included. The Board noted that Invesco Advisers does not separately charge the Invesco Funds for the administrative services included in the term as defined by Broadridge. The Board also reviewed the methodology used by Broadridge in providing expense group information, which includes using each fund’s contractual management fee schedule (including any applicable breakpoints) as reported in the most recent prospectus or statement of additional information for each fund in the expense group.
The Board noted that Invesco Advisers has contractually agreed to waive fees and/or limit expenses of the Fund through at least February 28, 2018 in an amount necessary to limit total annual operating expenses to a specified percentage of average daily net assets for each class of the Fund.
The Board also compared the Fund’s effective advisory fee rate (the advisory fee rate after advisory fee waivers and before other expense limitations/waivers) to the effective advisory fee rates of other mutual funds advised by Invesco Advisers and its affiliates with investment strategies comparable to those of the Fund, based on asset balances as of December 31, 2016. The Board noted how the Fund’s rate compared to the effective sub-adviser fee rate of one fund sub-advised by Invesco Advisers. The Board noted that Invesco Advisers and its affiliates do not manage other client accounts with investment strategies comparable to those of the Fund.
The Board also considered the services that may be provided by the Affiliated Sub-Advisers pursuant to the sub-advisory contracts, as well as the fees payable by Invesco Advisers to the Affiliated Sub-Advisers pursuant to the sub-advisory contracts. The Board also noted that the sub-advisory fees are not paid directly by the Fund, but rather, are payable by Invesco Advisers to the Affiliated Sub-Advisers.
| D. | Economies of Scale and Breakpoints |
The Board considered the extent to which there are economies of scale in the provision of advisory services to the Fund. The Board also considered that the Fund may benefit from economies of scale through contractual breakpoints in the Fund’s advisory fee schedule. The Board noted that the Fund shares directly in economies of scale through lower fees charged by third party service providers based on the
combined size of the Invesco Funds advised by Invesco Advisers.
| E. | Profitability and Financial Resources |
The Board reviewed information from Invesco Advisers concerning the costs of the advisory and other services that Invesco Advisers and its affiliates provide to the Fund and the Invesco Funds and the profitability of Invesco Advisers and its affiliates in providing these services. The Board noted that Invesco Advisers continues to operate at a net profit from services Invesco Advisers and its affiliates provide to the Invesco Funds and the Fund. The Board did not deem the level of profits realized by Invesco Advisers and its affiliates from providing services to the Fund to be excessive given the nature, quality and extent of the services provided. The Board received and accepted information from Invesco Advisers demonstrating that Invesco Advisers and each Affiliated Sub-Adviser are financially sound and have the resources necessary to perform their obligations under the investment advisory agreement and sub-advisory contracts.
| F. | Collateral Benefits to Invesco Advisers and its Affiliates |
The Board considered various other benefits received by Invesco Advisers and its affiliates from the relationship with the Fund, including the fees received for providing transfer agency and distribution services to the Fund. The Board considered comparative information regarding fees charged for these services, including information provided by Broadridge and other independent sources. The Board considered the performance of Invesco Advisers and its affiliates in providing these services and the organizational structure employed to provide these services. The Board also considered that these services are provided to the Fund pursuant to written contracts that are reviewed and approved on an annual basis by the Board; and that the services are required for the operation of the Fund.
The Board considered the benefits realized by Invesco Advisers and the Affiliated Sub-Advisers as a result of portfolio brokerage transactions executed through “soft dollar” arrangements. The Board noted that soft dollar arrangements may result in the Fund bearing costs to purchase research that may be used by Invesco Advisers or the Affiliated Sub-Advisers with other clients and may reduce Invesco Adviser’s or the Affiliated Sub-Adviser’s expenses. The Board also considered that it receives periodic reports from the Chief Compliance Officer of the Invesco Funds demonstrating that these arrangements are consistent with regulatory requirements. The Board did not deem the soft dollar arrangements to be inappropriate.
The Board considered that the Fund’s uninvested cash and cash collateral from any securities lending arrangements may be invested in money market funds advised by Invesco Advisers pursuant to procedures approved by the Board. The Board noted that Invesco Advisers receives advisory fees from these affiliated money market funds attributable to such investments, although
Invesco Advisers has contractually agreed to waive through varying periods the advisory fees payable by the Invesco Funds with respect to certain investments in the affiliated money market funds. The waiver is in an amount equal to 100% of the net advisory fee Invesco Advisers receives from the affiliated money market funds with respect to the Fund’s investment in the affiliated money market funds of uninvested cash, but not cash collateral. The Board concluded that the amount of advisory fees received by Invesco Advisers from the Fund’s investment of cash collateral from any securities lending arrangements in the affiliated money market funds is fair and reasonable.
The Board also considered that the Fund may use an affiliated broker to execute certain trades for the Fund to, among other things, control information leakage, and was advised that such trades would be executed in compliance with rules under the federal securities laws and consistent with best execution obligations.
29 Invesco All Cap Market Neutral Fund
Tax Information
Form 1099-DIV, Form 1042-S and other year-end tax information provide shareholders with actual calendar year amounts that should be included in their tax returns. Shareholders should consult their tax advisors.
The following distribution information is being provided as required by the Internal Revenue Code or to meet a specific state’s requirement.
The Fund designates the following amounts or, if subsequently determined to be different, the maximum amount allowable for its fiscal year ended October 31, 2017:
| | | | |
Federal and State Income Tax | |
Long-Term Capital Gain Distributions | | $ | 93,763 | |
Qualified Dividend Income* | | | 0.00 | % |
Corporate Dividends Received Deduction* | | | 0.00 | % |
U.S. Treasury Obligations* | | | 0.00 | % |
| | * | The above percentages are based on ordinary income dividends paid to shareholders during the Fund’s fiscal year. |
30 Invesco All Cap Market Neutral Fund
Trustees and Officers
The address of each trustee and officer is AIM Investment Funds (Invesco Investment Funds) (the “Trust”), 11 Greenway Plaza, Suite 1000, Houston, Texas 77046-1173. The trustees serve for the life of the Trust, subject to their earlier death, incapacitation, resignation, retirement or removal as more specifically provided in the Trust’s organizational documents. Each officer serves for a one year term or until their successors are elected and qualified. Column two below includes length of time served with predecessor entities, if any.
| | | | | | | | |
Name, Year of Birth and Position(s) Held with the Trust | | Trustee and/
or Officer Since | | Principal Occupation(s)
During Past 5 Years | | Number of
Funds in Fund
Complex
Overseen by
Trustee | | Other Directorship(s)
Held by Trustee During Past 5 Years |
| Interested Persons | | | | | | | | |
| Martin L. Flanagan1 — 1960 Trustee | | 2007 | | Executive Director, Chief Executive Officer and President, Invesco Ltd. (ultimate parent of Invesco and a global investment management firm); Trustee, The Invesco Funds; Vice Chair, Investment Company Institute; and Member of Executive Board, SMU Cox School of Business Formerly: Advisor to the Board, Invesco Advisers, Inc. (formerly known as Invesco Institutional (N.A.), Inc.); Chairman and Chief Executive Officer, Invesco Advisers, Inc. (registered investment adviser); Director, Chairman, Chief Executive Officer and President, Invesco Holding Company (US), Inc. (formerly IVZ Inc.) (holding company), Invesco Group Services, Inc. (service provider) and Invesco North American Holdings, Inc. (holding company); Director, Chief Executive Officer and President, Invesco Holding Company Limited (parent of Invesco and a global investment management firm); Director, Invesco Ltd.; Chairman, Investment Company Institute and President, Co-Chief Executive Officer, Co-President, Chief Operating Officer and Chief Financial Officer, Franklin Resources, Inc. (global investment management organization) | | 158 | | None |
Philip A. Taylor2 — 1954 Trustee and Senior Vice President | | 2006 | | Head of the Americas and Senior Managing Director, Invesco Ltd.; Director, Invesco Advisers, Inc. (formerly known as Invesco Institutional (N.A.), Inc.) (registered investment adviser); Director, Chairman, Chief Executive Officer and President, Invesco Management Group, Inc. (formerly known as Invesco Aim Management Group, Inc.) (financial services holding company); Director and Chairman, Invesco Investment Services, Inc. (formerly known as Invesco Aim Investment Services, Inc.) (registered transfer agent); Chief Executive Officer, Invesco Corporate Class Inc. (corporate mutual fund company); Director, Chairman and Chief Executive Officer, Invesco Canada Ltd. (formerly known as Invesco Trimark Ltd./Invesco Trimark Ltèe) (registered investment adviser and registered transfer agent); Trustee and Senior Vice President, The Invesco Funds; Director, Invesco Investment Advisers LLC (formerly known as Van Kampen Asset Management). Formerly: Co-Chairman, Co-President and Co-Chief Executive Officer, Invesco Advisers, Inc. (formerly known as Invesco Institutional (N.A.), Inc.) (registered investment adviser); Director, Chief Executive Officer and President, Van Kampen Exchange Corp; President and Principal Executive Officer, The Invesco Funds (other than AIM Treasurer’s Series Trust (Invesco Treasurer’s Series Trust), Short-Term Investments Trust and Invesco Management Trust); Executive Vice President, The Invesco Funds (AIM Treasurer’s Series Trust (Invesco Treasurer’s Series Trust), Short-Term Investments Trust and Invesco Management Trust only); Director and President, INVESCO Funds Group, Inc. (registered investment adviser and registered transfer agent); Director and Chairman, IVZ Distributors, Inc. (formerly known as INVESCO Distributors, Inc.) (registered broker dealer); Director, President and Chairman, Invesco Inc. (holding company), Invesco Canada Holdings Inc. (holding company), Trimark Investments Ltd./Placements Trimark Ltèe and Invesco Financial Services Ltd/Services Financiers Invesco Ltèe; Chief Executive Officer, Invesco Canada Fund Inc. (corporate mutual fund company); Director and Chairman, Van Kampen Investor Services Inc.; Director, Chief Executive Officer and President, 1371 Preferred Inc. (holding company) and Van Kampen Investments Inc.; Director and President, AIM GP Canada Inc. (general partner for limited partnerships) and Van Kampen Advisors, Inc.; Director and Chief Executive Officer, Invesco Trimark Dealer Inc. (registered broker dealer); Director, Invesco Distributors, Inc. (formerly known as Invesco Aim Distributors, Inc.) (registered broker dealer); Manager, Invesco PowerShares Capital Management LLC; Director, Chief Executive Officer and President, Invesco Advisers, Inc.; Director, Chairman, Chief Executive Officer and President, Invesco Aim Capital Management, Inc.; President, Invesco Trimark Dealer Inc. and Invesco Trimark Ltd./Invesco Trimark Ltèe; Director and President, AIM Trimark Corporate Class Inc. and AIM Trimark Canada Fund Inc.; Senior Managing Director, Invesco Holding Company Limited; Director and Chairman, Fund Management Company (former registered broker dealer); President and Principal Executive Officer, The Invesco Funds (AIM Treasurer’s Series Trust (Invesco Treasurer’s Series Trust), and Short-Term Investments Trust only); President, AIM Trimark Global Fund Inc. and AIM Trimark Canada Fund Inc. | | 158 | | None |
| 1 | Mr. Flanagan is considered an interested person (within the meaning of Section 2(a)(19) of the 1940 Act) of the Trust because he is an officer of the Adviser to the Trust, and an officer and a director of Invesco Ltd., ultimate parent of the Adviser. |
| 2 | Mr. Taylor is considered an interested person (within the meaning of Section 2(a)(19) of the 1940 Act) of the Trust because he is an officer and a director of the Adviser. |
T-1 Invesco All Cap Market Neutral Fund
Trustees and Officers—(continued)
| | | | | | | | |
Name, Year of Birth and Position(s) Held with the Trust | | Trustee and/
or Officer Since | | Principal Occupation(s) During Past 5 Years | | Number of
Funds in Fund
Complex
Overseen by
Trustee | | Other Directorship(s)
Held by Trustee During Past 5 Years |
| Independent Trustees | | | | | | | | |
Bruce L. Crockett — 1944 Trustee and Chair | | 2001 | | Chairman, Crockett Technologies Associates (technology consulting company) Formerly: Director, Captaris (unified messaging provider); Director, President and Chief Executive Officer, COMSAT Corporation; Chairman, Board of Governors of INTELSAT (international communications company); ACE Limited (insurance company); Independent Directors Council and Investment Company Institute: Member of the Audit Committee, Investment Company Institute; Member of the Executive Committee and Chair of the Governance Committee, Independent Directors Council | | 158 | | Director and Chairman of the Audit Committee, ALPS (Attorneys Liability Protection Society) (insurance company); Director and Member of the Audit Committee, Ferroglobe PLC (metallurgical company) |
David C. Arch — 1945 Trustee | | 2010 | | Chairman of Blistex Inc. (consumer health care products manufacturer); Member, World Presidents’ Organization | | 158 | | Board member of the Illinois Manufacturers’ Association |
James T. Bunch — 1942 Trustee | | 2003 | | Managing Member, Grumman Hill Group LLC (family office/private equity investments) Formerly: Chairman of the Board, Denver Film Society; Chairman of the Board of Trustees, Evans Scholarship Foundation; Chairman, Board of Governors, Western Golf Association | | 158 | | Trustee, Evans Scholarship Foundation |
Jack M. Fields — 1952 Trustee | | 2001 | | Chief Executive Officer, Twenty First Century Group, Inc. (government affairs company); and Discovery Learning Alliance (non-profit) Formerly: Owner and Chief Executive Officer, Dos Angeles Ranch L.P. (cattle, hunting, corporate entertainment); Director, Insperity, Inc. (formerly known as Administaff) (human resources provider); Chief Executive Officer, Texana Timber LP (sustainable forestry company); Director of Cross Timbers Quail Research Ranch (non-profit); and member of the U.S. House of Representatives | | 158 | | None |
Cynthia Hostetler — 1962 Trustee | | 2017 | | Non-Executive Director and Trustee of a number of public and private business corporations Formerly: Head of Investment Funds and Private Equity, Overseas Private Investment Corporation; President, First Manhattan Bancorporation, Inc.; Attorney, Simpson Thacher & Bartlett LLP | | 158 | | Vulcan Materials Company (construction materials company); Trilinc Global Impact Fund; Aberdeen Investment Funds (4 portfolios); Artio Global Investment LLC (mutual fund complex); Edgen Group, Inc. (specialized energy and infrastructure products distributor) |
Eli Jones — 1961 Trustee | | 2016 | | Professor and Dean, Mays Business School — Texas A&M University Formerly: Professor and Dean, Walton College of Business, University of Arkansas and E.J. Ourso College of Business, Louisiana State University; Director, Arvest Bank | | 158 | | Insperity, Inc. (formerly known as Administaff) (human resources provider) |
Prema Mathai-Davis — 1950 Trustee | | 2001 | | Retired. Formerly: Chief Executive Officer, YWCA of the U.S.A. | | 158 | | None |
Teresa M. Ressel — 1962 Trustee | | 2017 | | Non-executive director and trustee of a number of public and private business corporations Formerly: Chief Financial Officer, Olayan America, The Olayan Group (international investor/commercial/industrial); Chief Executive Officer, UBS Securities LLC; Group Chief Operating Officer, Americas, UBS AG; Assistant Secretary for Management & Budget and CFO, US Department of the Treasury; Chief Compliance Officer, Kaiser Permanente (healthcare consortium); Program Manager, Hewlett-Packard; Nuclear Engineering, General Dynamics Corporation (aerospace and defense company) | | 158 | | Atlantic Power Corporation (power generation company); ON Semiconductor Corp. (semiconductor supplier) |
Larry Soll — 1942 Trustee | | 2003 | | Retired. Formerly: Chairman, Chief Executive Officer and President, Synergen Corp. (a biotechnology company) | | 158 | | None |
Ann Barnett Stern — 1957 Trustee | | 2017 | | President and Chief Executive Officer, Houston Endowment Inc. (private philanthropic institution) Formerly: Executive Vice President and General Counsel, Texas Children’s Hospital; Attorney, Beck, Redden and Secrest, LLP; Business Law Instructor, University of St. Thomas; Attorney, Andrews & Kurth LLP | | 158 | | Federal Reserve Bank of Dallas |
Raymond Stickel, Jr. — 1944 Trustee | | 2005 | | Retired. Formerly: Director, Mainstay VP Series Funds, Inc. (25 portfolios); Partner, Deloitte & Touche | | 158 | | None |
Robert C. Troccoli — 1949 Trustee | | 2016 | | Adjunct Professor, University of Denver — Daniels College of Business Formerly: Senior Partner, KPMG LLP | | 158 | | None |
T-2 Invesco All Cap Market Neutral Fund
Trustees and Officers—(continued)
| | | | | | | | |
Name, Year of Birth and Position(s) Held with the Trust | | Trustee and/
or Officer Since | | Principal Occupation(s) During Past 5 Years | | Number of
Funds in Fund
Complex
Overseen by
Trustee | | Other Directorship(s)
Held by Trustee During Past 5 Years |
| Independent Trustees—(continued) |
Christopher L. Wilson — 1957 Trustee | | 2017 | | Managing Partner, CT2, LLC (investing and consulting firm) Formerly: President/Chief Executive Officer, Columbia Funds, Bank of America Corporation; President/Chief Executive Officer, CDC IXIS Asset Management Services, Inc.; Principal & Director of Operations, Scudder Funds, Scudder, Stevens & Clark, Inc.; Assistant Vice President, Fidelity Investments | | 158 | | TD Asset Management USA Inc. (mutual fund complex) (22 portfolios); ISO New England, Inc. (non-profit organization managing regional electricity market) |
| Other Officers | | | | | | | | |
Sheri Morris — 1964 President, Principal Executive Officer and Treasurer | | 1999 | | President, Principal Executive Officer and Treasurer, The Invesco Funds; Vice President, Invesco Advisers, Inc. (formerly known as Invesco Institutional (N.A.), Inc.) (registered investment adviser); and Vice President, PowerShares Exchange-Traded Fund Trust, PowerShares Exchange-Traded Fund Trust II, PowerShares India Exchange-Traded Fund Trust, PowerShares Actively Managed Exchange-Traded Fund Trust and PowerShares Actively Managed Exchange-Traded Commodity Fund Trust Formerly: Vice President and Principal Financial Officer, The Invesco Funds; Vice President, Invesco Aim Advisers, Inc., Invesco Aim Capital Management, Inc. and Invesco Aim Private Asset Management, Inc.; Assistant Vice President and Assistant Treasurer, The Invesco Funds and Assistant Vice President, Invesco Advisers, Inc., Invesco Aim Capital Management, Inc. and Invesco Aim Private Asset Management, Inc.; and Treasurer, PowerShares Exchange-Traded Fund Trust, PowerShares Exchange-Traded Fund Trust II, PowerShares India Exchange-Traded Fund Trust and PowerShares Actively Managed Exchange-Traded Fund Trust | | N/A | | N/A |
Russell C. Burk — 1958 Senior Vice President and Senior Officer | | 2005 | | Senior Vice President and Senior Officer, The Invesco Funds | | N/A | | N/A |
John M. Zerr — 1962 Senior Vice President, Chief Legal Officer and Secretary | | 2006 | | Director, Senior Vice President, Secretary and General Counsel, Invesco Management Group, Inc. (formerly known as Invesco AIM Management Group, Inc.); Senior Vice President, Invesco Advisers, Inc. (formerly known as Invesco Institutional (N.A.), Inc.) (registered investment adviser); Senior Vice President and Secretary, Invesco Distributors, Inc. (formerly known as Invesco AIM Distributors, Inc.); Director, Vice President and Secretary, Invesco Investment Services, Inc. (formerly known as Invesco AIM Investment Services, Inc.) Senior Vice President, Chief Legal Officer and Secretary, The Invesco Funds; Managing Director, Invesco PowerShares Capital Management LLC; Director, Secretary and General Counsel, Invesco Investment Advisers LLC (formerly known as Van Kampen Asset Management); Secretary and General Counsel, Invesco Capital Markets, Inc. (formerly known as Van Kampen Funds Inc.) and Chief Legal Officer, PowerShares Exchange-Traded Fund Trust, PowerShares Exchange-Traded Fund Trust II, PowerShares India Exchange-Traded Fund Trust, PowerShares Actively Managed Exchange-Traded Fund Trust and PowerShares Actively Managed Exchange-Traded Commodity Fund Trust; Manager and Secretary, Invesco Indexing LLC Formerly: Director, Secretary, General Counsel and Senior Vice President, Van Kampen Exchange Corp.; Director, Vice President and Secretary, IVZ Distributors, Inc. (formerly known as INVESCO Distributors, Inc.); Director and Vice President, INVESCO Funds Group, Inc.; Director and Vice President, Van Kampen Advisors Inc.; Director, Vice President, Secretary and General Counsel, Van Kampen Investor Services Inc.; Director, Invesco Distributors, Inc. (formerly known as Invesco AIM Distributors, Inc.); Director, Senior Vice President, General Counsel and Secretary, Invesco AIM Advisers, Inc. and Van Kampen Investments Inc.; Director, Vice President and Secretary, Fund Management Company; Director, Senior Vice President, Secretary, General Counsel and Vice President, Invesco AIM Capital Management, Inc.; Chief Operating Officer and General Counsel, Liberty Ridge Capital, Inc. (an investment adviser); Vice President and Secretary, PBHG Funds (an investment company) and PBHG Insurance Series Fund (an investment company); Chief Operating Officer, General Counsel and Secretary, Old Mutual Investment Partners (a broker-dealer); General Counsel and Secretary, Old Mutual Fund Services (an administrator) and Old Mutual Shareholder Services (a shareholder servicing center); Executive Vice President, General Counsel and Secretary, Old Mutual Capital, Inc. (an investment adviser); and Vice President and Secretary, Old Mutual Advisors Funds (an investment company) | | N/A | | N/A |
Gregory G. McGreevey — 1962 Senior Vice President | | 2012 | | Senior Managing Director, Invesco Ltd.; Director, Chairman, President, and Chief Executive Officer, Invesco Advisers, Inc. (formerly known as Invesco Institutional (N.A.), Inc.) (registered investment adviser); Senior Vice President, Invesco Management Group, Inc.; Director, Invesco Mortgage Capital, Inc. and Invesco Senior Secured Management, Inc.; and Senior Vice President, The Invesco Funds Formerly: Assistant Vice President, The Invesco Funds | | N/A | | N/A |
T-3 Invesco All Cap Market Neutral Fund
Trustees and Officers—(continued)
| | | | | | | | |
Name, Year of Birth and Position(s) Held with the Trust | | Trustee and/
or Officer Since | | Principal Occupation(s) During Past 5 Years | | Number of
Funds in Fund
Complex
Overseen by
Trustee | | Other Directorship(s)
Held by Trustee During Past 5 Years |
| Other Officers—(continued) | | | | | | | | |
Kelli Gallegos — 1970 Vice President, Principal Financial Officer and Assistant Treasurer | | 2008 | | Vice President, Principal Financial Officer and Assistant Treasurer, The Invesco Funds; Assistant Treasurer, Invesco PowerShares Capital Management LLC, PowerShares Exchange-Traded Fund Trust, PowerShares Exchange-Traded Fund Trust II, PowerShares India Exchange-Traded Fund Trust, PowerShares Actively Managed Exchange-Traded Fund Trust and PowerShares Actively Managed Exchange-Traded Commodity Fund Trust Formerly: Assistant Vice President, The Invesco Funds | | N/A | | N/A |
Tracy Sullivan — 1962 Vice President, Chief Tax Officer and Assistant Treasurer | | 2008 | | Vice President, Chief Tax Officer and Assistant Treasurer, The Invesco Funds; Assistant Treasurer, Invesco PowerShares Capital Management LLC, PowerShares Exchange-Traded Fund Trust, PowerShares Exchange-Traded Fund Trust II, PowerShares India Exchange-Traded Fund Trust, PowerShares Actively Managed Exchange-Traded Fund Trust and PowerShares Actively Managed Exchange-Traded Commodity Fund Trust Formerly: Assistant Vice President, The Invesco Funds | | N/A | | N/A |
Crissie M. Wisdom — 1969 Anti-Money Laundering Compliance Officer | | 2013 | | Anti-Money Laundering Compliance Officer, Invesco Advisers, Inc. (formerly known as Invesco Institutional (N.A.), Inc.) (registered investment adviser), Invesco Capital Markets, Inc. (formerly known as Van Kampen Funds Inc.), Invesco Distributors, Inc., Invesco Investment Services, Inc., Invesco Management Group, Inc., The Invesco Funds, and PowerShares Exchange-Traded Fund Trust, PowerShares Exchange-Traded Fund Trust II, PowerShares India Exchange-Traded Fund Trust, PowerShares Actively Managed Exchange-Traded Fund Trust and PowerShares Actively Managed Exchange-Traded Commodity Fund Trust; Anti-Money Laundering Compliance Officer and Bank Secrecy Act Officer, INVESCO National Trust Company and Invesco Trust Company; and Fraud Prevention Manager and Controls and Risk Analysis Manager for Invesco Investment Services, Inc. Formerly: Anti-Money Laundering Compliance Officer, Van Kampen Exchange Corp. | | N/A | | N/A |
Robert R. Leveille — 1969 Chief Compliance Officer | | 2016 | | Chief Compliance Officer, Invesco Advisers, Inc. (registered investment adviser); and Chief Compliance Officer, The Invesco Funds Formerly: Chief Compliance Officer, Putnam Investments and the Putnam Funds | | N/A | | N/A |
The Statement of Additional Information of the Trust includes additional information about the Fund’s Trustees and is available upon request, without charge, by calling 1.800.959.4246. Please refer to the Fund’s Statement of Additional Information for information on the Fund’s sub-advisers.
| | | | | | |
Office of the Fund 11 Greenway Plaza, Suite 1000 Houston, TX 77046-1173 | | Investment Adviser Invesco Advisers, Inc. 1555 Peachtree Street, N.E. Atlanta, GA 30309 | | Distributor Invesco Distributors, Inc. 11 Greenway Plaza, Suite 1000 Houston, TX 77046-1173 | | Auditors PricewaterhouseCoopers LLP 1000 Louisiana Street, Suite 5800 Houston, TX 77002-5678 |
| | | |
| | | | | | |
Counsel to the Fund Stradley Ronon Stevens & Young, LLP 2005 Market Street, Suite 2600 Philadelphia, PA 19103-7018 | | Counsel to the Independent Trustees Goodwin Procter LLP 901 New York Avenue, N.W. Washington, D.C. 20001 | | Transfer Agent Invesco Investment Services, Inc. 11 Greenway Plaza, Suite 1000 Houston, TX 77046-1173 | | Custodian State Street Bank and Trust Company 225 Franklin Street Boston, MA 02110-2801 |
T-4 Invesco All Cap Market Neutral Fund
Explore High-Conviction Investing with Invesco

Go paperless with eDelivery
Visit invesco.com/edelivery to enjoy the convenience and security of anytime electronic access to your investment documents. With eDelivery, you can elect to have any or all of the following materials delivered straight to your inbox to download, save and print from your own computer:
| ∎ | | Fund reports and prospectuses |
Invesco mailing information
Send general correspondence to Invesco Investment Services, Inc., P.O. Box 219078, Kansas City, MO 64121-9078.
Important notice regarding delivery of security holder documents
To reduce Fund expenses, only one copy of most shareholder documents may be mailed to shareholders with multiple accounts at the same address (Householding). Mailing of your shareholder documents may be householded indefinitely unless you instruct us otherwise. If you do not want the mailing of these documents to be combined with those for other members of your household, please contact Invesco Investment Services, Inc. at 800 959 4246 or contact your financial institution. We will begin sending you individual copies for each account within 30 days after receiving your request.
Fund holdings and proxy voting information
The Fund provides a complete list of its holdings four times in each fiscal year, at the quarter ends. For the second and fourth quarters, the lists appear in the Fund’s semiannual and annual reports to shareholders. For the first and third quarters, the Fund files the lists with the Securities and Exchange Commission (SEC) on Form N-Q. The most recent list of portfolio holdings is available at invesco.com/completeqtrholdings. Shareholders can also look up the Fund’s Forms N-Q on the SEC website at sec.gov. Copies of the Fund’s Forms N-Q may be reviewed and copied at the SEC Public Reference Room in Washington, D.C. You can obtain information on the operation of the Public Reference Room, including information about duplicating fee charges, by calling 202 551 8090 or 800 732 0330, or by electronic request at the following email address: publicinfo@sec.gov. The SEC file numbers for the Fund are shown below.
A description of the policies and procedures that the Fund uses to determine how to vote proxies relating to portfolio securities is available without charge, upon request, from our Client Services department at 800 959 4246 or at invesco.com/proxyguidelines. The information is also available on the SEC website, sec.gov.
| | |
Information regarding how the Fund voted proxies related to its portfolio securities during the most recent 12-month period ended June 30 is available at invesco.com/proxysearch. The information is also available on the SEC website, sec.gov. Invesco Advisers, Inc. is an investment adviser; it provides investment advisory services to individual and institutional clients and does not sell securities. Invesco Distributors, Inc. is the US distributor for Invesco Ltd.’s retail mutual funds, exchange-traded funds and institutional money market funds. Both are wholly owned, indirect subsidiaries of Invesco Ltd. | |  |
| | | | | | | | |
| SEC file numbers: 811-05426 and 033-19338 | | Invesco Distributors, Inc. | | ACMN-AR-1 | | 12202017 | | 1506 |
Letters to Shareholders
| | | | |

Philip Taylor | | | | Dear Shareholders: This annual report includes information about your Fund, including performance data and a complete list of its investments as of the close of the reporting period. Inside is a discussion of how your Fund was managed and the factors that affected its performance during the reporting period. American voters went to the polls just days after the start of the reporting period, and their decisions quickly affected markets. The US stock market rallied strongly after the election, with major market indexes rising, and setting record highs, throughout the reporting period. Generally positive economic data, strong corporate earnings and hope for tax and regulatory reform contributed to the rally. US and global bond markets, as well as emerging market equities, sold off immediately following the election – with the US bond market eventually recovering most of its |
losses. Overseas, economic data were mixed, prompting the European Central Bank and central banks in China and Japan, among other countries, to maintain extraordinarily accommodative monetary policies. Citing positive economic trends – specifically, realized and expected labor market conditions and inflation – the US Federal Reserve raised interest rates three times during the reporting period: first in December 2016, and then again in March and June 2017. Health care and tax reform proved to be more difficult than expected to enact, with little progress achieved by the end of the reporting period.
Short-term market volatility can prompt some investors to abandon their investment plans – and can cause others to settle for whatever returns the market has to offer. The investment professionals at Invesco, in contrast, invest with high conviction. This means that, no matter the asset class or the strategy, each investment team has a passion to exceed. We want to help investors achieve better outcomes, such as seeking higher returns, helping mitigate risk and generating income. Of course, investing with high conviction can’t guarantee a profit or ensure success; no investment strategy can. To learn more about how we invest with high conviction, visit invesco.com/HighConviction.
You, too, can invest with high conviction by maintaining a long-term investment perspective and by working with your financial adviser on a regular basis. During periods of short-term market volatility or uncertainty, your financial adviser can keep you focused on your long-term investment goals – a new home, a child’s college education or a secure retirement. He or she also can share research about the economy, the markets and individual investment options.
Visit our website for more information on your investments
Our website, invesco.com/us, offers a wide range of market insights and investment perspectives. On the website, you’ll find detailed information about our funds, including performance, holdings and portfolio manager commentaries. You can access information about your account by completing a simple, secure online registration. To do so, select “Log In” on the right side of the homepage, and then select “Register for Individual Account Access.”
In addition to the resources accessible on our website and through our mobile app, you can obtain timely updates to help you stay informed about the markets and the economy by connecting with Invesco on Twitter, LinkedIn or Facebook. You can access our blog at blog.invesco.us.com. Our goal is to provide you the information you want, when and where you want it.
Finally, I’m pleased to share with you Invesco’s commitment to both the Principles for Responsible Investment and to considering environmental, social and governance issues in our robust investment process. I invite you to learn more at invesco.com/esg.
Have questions?
For questions about your account, contact an Invesco client services representative at 800 959 4246. For Invesco-related questions or comments, please email me directly at phil@invesco.com.
All of us at Invesco look forward to serving your investment management needs. Thank you for investing with us.
Sincerely,

Philip Taylor
Senior Managing Director, Invesco Ltd.
|
| 2 Invesco Balanced-Risk Allocation Fund |
| | | | |

Bruce Crockett | | | | Dear Fellow Shareholders: Among the many important lessons I’ve learned in more than 40 years in a variety of business endeavors is the value of a trusted advocate. As independent chair of the Invesco Funds Board, I can assure you that the members of the Board are strong advocates for the interests of investors in Invesco’s mutual funds. We work hard to represent your interests through oversight of the quality of the investment management services your funds receive and other matters important to your investment, including but not limited to: ∎ Ensuring that Invesco offers a diverse lineup of mutual funds that your financial adviser can use to strive to meet your financial needs as your investment goals change over time. ∎ Monitoring how the portfolio management teams of the Invesco funds are performing in light of changing economic and market conditions. |
| ∎ | | Assessing each portfolio management team’s investment performance within the context of the investment strategy described in the fund’s prospectus. |
| ∎ | | Monitoring for potential conflicts of interests that may impact the nature of the services that your funds receive. |
We believe one of the most important services we provide our fund shareholders is the annual review of the funds’ advisory and sub-advisory contracts with Invesco Advisers and its affiliates. This review is required by the Investment Company Act of 1940 and focuses on the nature and quality of the services Invesco provides as the adviser to the Invesco funds and the reasonableness of the fees that it charges for those services. Each year, we spend months carefully reviewing information received from Invesco and a variety of independent sources, such as performance and fee data prepared by Lipper, Inc. (a subsidiary of Broadridge Financial Solutions, Inc.), an independent, third-party firm widely recognized as a leader in its field. We also meet with our independent legal counsel and other independent advisers to review and help us assess the information that we have received. Our goal is to assure that you receive quality investment management services for a reasonable fee.
I trust the measures outlined above provide assurance that you have a worthy advocate when it comes to choosing the Invesco Funds.
As always, please contact me at bruce@brucecrockett.com with any questions or concerns you may have. On behalf of the Board, we look forward to continuing to represent your interests and serving your needs.
Sincerely,

Bruce L. Crockett
Independent Chair
Invesco Funds Board of Trustees
|
| 3 Invesco Balanced-Risk Allocation Fund |
Management’s Discussion of Fund Performance
Performance summary
For the fiscal year ended October 31, 2017, Class A shares of Invesco Balanced-Risk Allocation Fund (the Fund), at net asset value (NAV), underperformed the Fund’s custom style-specific benchmark, the Custom Invesco Balanced-Risk Allocation Style Index.
Your Fund’s long-term performance appears later in this report.
Fund vs. Indexes
Total returns, 10/31/16 to 10/31/17, at net asset value (NAV). Performance shown does not include applicable contingent deferred sales charges (CDSC) or front-end sales charges, which would have reduced performance.
| | | | | |
| Class A Shares | | | | 7.66 | % |
| Class B Shares | | | | 6.95 | |
| Class C Shares | | | | 6.95 | |
| Class R Shares | | | | 7.48 | |
| Class Y Shares | | | | 8.06 | |
| Class R5 Shares | | | | 8.12 | |
| Class R6 Shares | | | | 8.11 | |
| S&P 500 Index▼ (Broad Market Index) | | | | 23.63 | |
| Custom Invesco Balanced-Risk Allocation Style Index∎ (Style-Specific Index) | | | | 13.58 | |
| Lipper Alternative Global Macro Funds Index t (Peer Group Index) | | | | 10.84 | |
| Source(s): ▼FactSet Research Systems Inc.; ∎Invesco, FactSet Research Systems Inc.; tLipper Inc. | |
Market conditions and your Fund
During the fiscal year ended October 31, 2017, each of the asset classes in which the Fund invests (directly or indirectly through derivatives), with the exception of fixed income, provided positive contributions to Fund performance. For the reporting period, the Fund at NAV reported positive absolute performance. The Fund invests in derivatives, such as swaps and futures, which are expected to correspond to the performance of US and international fixed income, equity and commodity markets. The strategic allocation portion of the investment process involves first selecting representative assets for each asset class from a universe of more than 50 assets. Next, we seek to construct the portfolio so that an approximately equal amount of risk comes from our equity, fixed income and commodity allocations. Tactical adjustments to the Fund’s portfolio are then made on a monthly basis to try
and take advantage of short-term market dynamics.
The Fund’s strategic exposure to equities, obtained through the use of swaps and futures, led results for the reporting period, with all six markets in which the Fund invests posting positive returns. Asian equities were the leading contributor as Japanese equity prices were boosted by increased exports. Hong Kong equities provided further positive influence from the Asian region, rising in sympathy with emerging markets, which enjoyed a substantial rally. While the prospect of less accommodative monetary policy from the European Central Bank (ECB) and Brexit (the UK’s plan to leave the European Union) remained sources of political and economic uncertainty, European and UK equities performed strongly due to improved economic data and positive confidence surveys. US equities (both large- and small-caps) also contributed to the Fund’s
Performance. The reporting period began with most major US stock market indexes hitting record highs following the US presidential election. Investors believed the new administration’s plans to reduce tax rates, scale back regulations and increase infrastructure spending had the potential to stimulate economic growth. However, that was called into question after the first quarter of 2017, when it appeared that enacting significant regulatory and tax reform might be more difficult than previously anticipated. Tactical positioning in US equities, obtained through the use of swaps and futures, contributed to Fund performance for the reporting period as overweight exposure to the asset class proved timely.
The Fund’s exposure to commodities, obtained through the use of swaps, futures and commodity-linked notes, also contributed to Fund performance for the fiscal year, as gains in industrial metals and energy outweighed losses in agriculture and precious metals. Strategic positioning in industrial metals was the leading performer within the asset class, with gains in both aluminum and copper. Increased industrial metals prices were supported by strong manufacturing and import growth data out of China and by indications that China intended to cut production to curb pollution. The Fund’s strategic positioning within energy was also favorable as all assets, with the exception of natural gas, experienced gains. The energy commodity sector started the fiscal year plagued by high inventory levels and rising US production and rig counts. These conditions lasted throughout much of the first half of 2017. Oil and distillate prices rebounded in the third quarter of 2017 as the US rig count declined and expectations rose for an extension of OPEC’s production cuts. Severe weather also affected energy prices in the third quarter of 2017 as
| | | | | | | | | | |
Target Risk Allocation and
Notional Asset Weights as of 10/31/17 | |
By asset class | | | | | | | | | | |
| Asset Class | | |
| Target Risk
Allocation* |
| | |
| Notional Asset
Weights** |
|
| Equities | | | | 49.23% | | | | | 42.33% | |
| Fixed Income | | | | 16.67 | | | | | 54.08 | |
| Commodities | | | | 34.10 | | | | | 31.90 | |
| Total | | | | 100.00 | | | | | 128.31 | |
| | * | Reflects the risk that each asset class is expected to contribute to the overall risk of the Fund as measured by standard deviation and estimates of risk based on historical data. Standard deviation measures the annualized fluctuations (volatility) of monthly returns. |
| ** | Proprietary models determine the Notional Asset Weights necessary to achieve the Target Risk Allocations. Total Notional Asset Weight greater than 100% is achieved through derivatives and other instruments that create leverage. |
| | | | | |
| Total Net Assets | | | | $5.0 billion | |
|
| 4 Invesco Balanced-Risk Allocation Fund |
hurricanes forced refinery shutdowns that further boosted prices. Natural gas prices rose at the beginning of the fiscal year, but those gains were not enough to outweigh the losses from rising US output at the end of the fiscal year. Strategic positioning in precious metals detracted from Fund performance with both gold and silver posting negative results. Precious metals were pressured as the US Federal Reserve raised short-term interest rates three times during the reporting period – in December 2016, and in March and June 2017 – and by expectations for another increase in December 2017. Strategic positioning in agriculture was the leading detractor within the sector. Most agriculture assets posted losses, lean hogs and live cattle posted gains, and cotton was flat. Lean hogs and live cattle rose due to strong US export demand. Sugar was by far the leading detractor as production increased despite softer global demand. Tactical positioning within commodities, obtained through the use of futures, swaps and commodity-linked notes, slightly detracted from Fund results for the reporting period.
The Fund’s exposure to global government bonds, obtained through the use of swaps and futures, detracted from results for the reporting period. Despite expectations that the ECB would likely begin tapering its monetary policy accommodation, German government bonds were the sole contributor to performance within the fixed income asset class. Canadian government bonds were the largest detractor within the fixed income asset class as yields rose after the Central Bank of Canada raised rates in July. Yields spiked again in the third quarter of 2017 in response to a surprise rate hike by the Central Bank of Canada. The Fund’s tactical positioning within bonds detracted from performance as losses from overweight exposure to Canadian and UK government bonds, coupled with underweight exposure to German government bonds, outweighed gains from underweight exposure to Australian and US government bonds.
Please note that our strategy is principally implemented with derivative instruments that include futures, commodity-linked notes and total return swaps. Therefore, all or most of the performance of the strategy, both positive and negative, can be attributed to these instruments. Derivatives can be a cost-effective way to gain exposure to asset classes. However, derivatives may amplify traditional investment risks through the creation of leverage and may be less liquid than traditional securities.
Thank you for your continued investment in Invesco Balanced-Risk Allocation Fund.
The views and opinions expressed in management’s discussion of Fund performance are those of Invesco Advisers, Inc. These views and opinions are subject to change at any time based on factors such as market and economic conditions. These views and opinions may not be relied upon as investment advice or recommendations, or as an offer for a particular security. The information is not a complete analysis of every aspect of any market, country, industry, security or the Fund. Statements of fact are from sources considered reliable, but Invesco Advisers, Inc. makes no representation or warranty as to their completeness or accuracy. Although historical performance is no guarantee of future results, these insights may help you understand our investment management philosophy.
See important Fund and, if applicable, index disclosures later in this report.
| | |
 | | Mark Ahnrud Chartered Financial Analyst, Portfolio Manager, is manager of Invesco Balanced-Risk Allocation Fund. He joined Invesco in |
2000. Mr. Ahnrud earned a BS in finance and investments from Babson College and an MBA from Duke University Fuqua School of Business.
| | |
 | | Chris Devine Chartered Financial Analyst, Portfolio Manager, is manager of Invesco Balanced-Risk Allocation Fund. He joined Invesco in |
1998. Mr. Devine earned a BA in economics from Wake Forest University and an MBA from the University of Georgia.
| | |
 | | Scott Hixon Chartered Financial Analyst, Portfolio Manager, is manager of Invesco Balanced-Risk Allocation Fund. He joined Invesco in |
1994. Mr. Hixon earned a BBA in finance from Georgia Southern University and an MBA in finance from Georgia State University.
| | |
 | | Christian Ulrich Chartered Financial Analyst, Portfolio Manager, is manager of Invesco Balanced-Risk Allocation Fund. He joined Invesco in |
2000. Mr. Ulrich earned the equivalent of a BBA from the KV Zurich Business School in Zurich, Switzerland.
| | |
 | | Scott Wolle Chartered Financial Analyst, Portfolio Manager, is manager of Invesco Balanced-Risk Allocation Fund. He joined Invesco in |
1999. Mr. Wolle earned a BS in finance from Virginia Polytechnic Institute and State University and an MBA from Duke University Fuqua School of Business.
Assisted by Invesco’s Global Asset Allocation Team
|
| 5 Invesco Balanced-Risk Allocation Fund |
Your Fund’s Long-Term Performance
Results of a $10,000 Investment – Oldest Share Class(es) since Inception
Fund and index data from 6/2/09
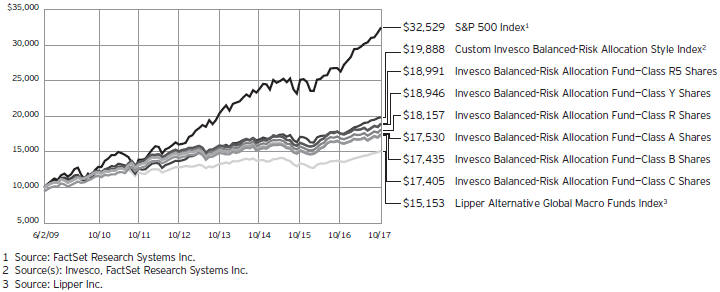
Past performance cannot guarantee comparable future results.
The data shown in the chart include reinvested distributions, applicable sales charges and Fund expenses including management fees. Results for Class B shares are calculated as if a hypothetical shareholder had liquidated his entire investment in the Fund at the close of the reporting period and paid the contingent deferred sales charges, if applicable.
Index results include reinvested dividends, but they do not reflect sales charges. Performance of the peer group, if applicable, reflects fund expenses and management fees; performance of a market index does not. Performance shown in the chart and table(s) does not reflect deduction of taxes a shareholder would pay on Fund distributions or sale of Fund shares.
|
| 6 Invesco Balanced-Risk Allocation Fund |
| | | | |
Average Annual Total Returns | |
As of 10/31/17, including maximum applicable sales charges | | | | |
| |
| Class A Shares | | | | |
| Inception (6/2/09) | | | 6.90 | % |
| 5 Years | | | 3.22 | |
| 1 Year | | | 1.74 | |
| |
| Class B Shares | | | | |
| Inception (6/2/09) | | | 6.83 | % |
| 5 Years | | | 3.33 | |
| 1 Year | | | 1.99 | |
| |
| Class C Shares | | | | |
| Inception (6/2/09) | | | 6.81 | % |
| 5 Years | | | 3.63 | |
| 1 Year | | | 5.96 | |
| |
| Class R Shares | | | | |
| Inception (6/2/09) | | | 7.35 | % |
| 5 Years | | | 4.16 | |
| 1 Year | | | 7.48 | |
| |
| Class Y Shares | | | | |
| Inception (6/2/09) | | | 7.89 | % |
| 5 Years | | | 4.67 | |
| 1 Year | | | 8.06 | |
| |
| Class R5 Shares | | | | |
| Inception (6/2/09) | | | 7.92 | % |
| 5 Years | | | 4.72 | |
| 1 Year | | | 8.12 | |
| |
| Class R6 Shares | | | | |
| Inception | | | 7.86 | % |
| 5 Years | | | 4.79 | |
| 1 Year | | | 8.11 | |
Class R6 shares incepted on September 24, 2012. Performance shown prior to that date is that of Class A shares and includes the 12b-1 fees applicable to Class A shares.
The performance data quoted represent past performance and cannot guarantee comparable future results; current performance may be lower or higher. Please visit invesco.com/performance for the most recent month-end performance. Performance figures reflect reinvested distributions, changes in net asset value and the effect of the maximum sales charge unless otherwise stated. Investment return and principal value will fluctuate so that you may have a gain or loss when you sell shares.
The net annual Fund operating expense ratio set forth in the most recent Fund prospectus as of the date of this report for Class A, Class B, Class C,
| | | | |
Average Annual Total Returns | |
| As of 9/30/17, the most recent calendar quarter end, including maximum applicable sales charges | | | | |
| |
| Class A Shares | | | | |
| Inception (6/2/09) | | | 6.66 | % |
| 5 Years | | | 2.41 | |
| 1 Year | | | –2.33 | |
| |
| Class B Shares | | | | |
| Inception (6/2/09) | | | 6.59 | % |
| 5 Years | | | 2.52 | |
| 1 Year | | | –2.16 | |
| |
| Class C Shares | | | | |
| Inception (6/2/09) | | | 6.58 | % |
| 5 Years | | | 2.82 | |
| 1 Year | | | 1.65 | |
| |
| Class R Shares | | | | |
| Inception (6/2/09) | | | 7.11 | % |
| 5 Years | | | 3.32 | |
| 1 Year | | | 3.11 | |
| |
| Class Y Shares | | | | |
| Inception (6/2/09) | | | 7.66 | % |
| 5 Years | | | 3.87 | |
| 1 Year | | | 3.69 | |
| |
| Class R5 Shares | | | | |
| Inception (6/2/09) | | | 7.68 | % |
| 5 Years | | | 3.88 | |
| 1 Year | | | 3.67 | |
| |
| Class R6 Shares | | | | |
| Inception | | | 7.63 | % |
| 5 Years | | | 3.97 | |
| 1 Year | | | 3.84 | |
Class R, Class Y, Class R5 and Class R6 shares was 1.28%, 2.03%, 2.03%, 1.53%, 1.03%, 0.97% and 0.90%, respectively.1 The total annual Fund operating expense ratio set forth in the most recent Fund prospectus as of the date of this report for Class A, Class B, Class C, Class R, Class Y, Class R5 and Class R6 shares was 1.35%, 2.10%, 2.10%, 1.60%, 1.10%, 1.04% and 0.97%, respectively. The expense ratios presented above may vary from the expense ratios presented in other sections of this report that are based on expenses incurred during the period covered by this report.
Class A share performance reflects the maximum 5.50% sales charge, and Class B and Class C share performance reflects the applicable contingent deferred sales charge (CDSC) for the period involved. The CDSC on Class B shares declines from 5% beginning at
the time of purchase to 0% at the beginning of the seventh year. The CDSC on Class C shares is 1% for the first year after purchase. Class R, Class Y, Class R5 and Class R6 shares do not have a front-end sales charge or a CDSC; therefore, performance is at net asset value.
The performance of the Fund’s share classes will differ primarily due to different sales charge structures and class expenses.
Fund performance reflects any applicable fee waivers and/or expense reimbursements. Had the adviser not waived fees and/or reimbursed expenses currently or in the past, returns would have been lower. See current prospectus for more information.
| 1 | Total annual Fund operating expenses after any contractual fee waivers and/or expense reimbursements by the adviser in effect through at least June 30, 2019. See current prospectus for more information. |
|
| 7 Invesco Balanced-Risk Allocation Fund |
Invesco Balanced-Risk Allocation Fund’s investment objective is to provide total return with a low to moderate correlation to traditional financial market indices.
| ∎ | | Unless otherwise stated, information presented in this report is as of October 31, 2017, and is based on total net assets. |
| ∎ | | Unless otherwise noted, all data provided by Invesco. |
| ∎ | | To access your Fund’s reports/prospectus, visit invesco.com/fundreports. |
About share classes
| ∎ | | Class B shares may not be purchased for new or additional investments. Please see the prospectus for more information. |
| ∎ | | Class R shares are generally available only to employer sponsored retirement and benefit plans. Please see the prospectus for more information. |
| ∎ | | Class Y shares are available only to certain investors. Please see the prospectus for more information. |
| ∎ | | Class R5 shares and Class R6 shares are available for use by retirement plans that meet certain standards and for institutional investors. Class R6 shares are also available through intermediaries that have established an agreement with Invesco Distributors, Inc. to make such shares available for use in retail omnibus accounts. Please see the prospectus for more information. |
Principal risks of investing in the Fund
| ∎ | | Changing fixed income market conditions risk. The current low interest rate environment was created in part by the Federal Reserve Board (FRB) and certain foreign central banks keeping the federal funds and equivalent foreign rates near, at or below zero. Increases in the federal funds and equivalent foreign rates may expose fixed income markets to heightened volatility and reduced liquidity for certain fixed income investments, particularly those with longer maturities. In addition, decreases in fixed income dealer market-making capacity may also potentially lead to heightened volatility and reduced liquidity in the fixed income markets. As a result, the value of the Fund’s investments and share price may decline. Changes in central bank policies could also result in higher than normal shareholder redemptions, which could potentially increase portfolio turnover and the Fund’s transaction costs. |
| ∎ | | Commodities tax risk. The tax treatment of commodity-linked derivative instruments may be adversely affected by changes in legislation, regulations or other legally binding authority. If, as a result of any such adverse action, the income of the Fund from certain commodity-linked derivatives was treated as non-qualifying income, the Fund might fail to qualify as a regulated investment company and be subject to federal income tax at the Fund level. As a result of a recent announcement by the Internal Revenue Service, the Fund intends to invest in commodity-linked notes: (a) directly, generally only to the extent that it obtains an opinion of counsel confirming that income from such investments should be qualifying income because such commodity-linked notes constitute securities under section 2(a)(36) of the 1940 Act or (b) indirectly through the Subsidiary. Should the Internal Revenue Service issue further guidance, or Congress enact legislation, that adversely affects the tax treatment of the Fund’s use of commodity-linked notes or the Subsidiary (which guidance might be applied to the Fund retroactively), it could, among other consequences, limit the Fund’s ability to pursue its investment strategy. |
| ∎ | | Commodity-linked notes risk. In addition to risks associated with the underlying commodities, investments in commodity-linked notes may be subject to additional risks, such as non-payment of interest and loss of principal, counterparty risk, lack of a secondary market and risk of greater volatility than traditional equity and debt securities. The value of the commodity-linked notes the Fund buys may fluctuate significantly because the values of the underlying investments to which they are linked are themselves volatile. Additionally, certain commodity-linked notes employ “economic” leverage by requiring payment by the issuer of an amount that is a multiple of the price increase or decrease of the underlying commodity, commodity index, or other economic variable. Such |
|
This report must be accompanied or preceded by a currently effective Fund prospectus, which contains more complete information, including sales charges and expenses. Investors should read it carefully before investing. |
|
|
| NOT FDIC INSURED | MAY LOSE VALUE | NO BANK GUARANTEE |
| | economic leverage will increase the volatility of the value of these commodity-linked notes and the Fund to the extent it invests in such notes. |
| ∎ | | Commodity risk. The Fund may have investment exposure to the commodities markets and/or a particular sector of the commodities markets, which may subject the Fund to greater volatility than investments in traditional securities, such as stocks and bonds. Volatility in the commodities markets may be caused by changes in overall market movements, domestic and foreign political and economic events and policies, war, acts of terrorism, changes in domestic or foreign interest rates and/or investor expectations concerning interest rates, domestic and foreign inflation rates, investment and trading activities of mutual funds, hedge funds and commodities funds, and factors such as drought, floods, weather, livestock disease, embargoes, tariffs and other regulatory developments or supply and demand disruptions. Because the Fund’s performance may be linked to the performance of volatile commodities, investors should be willing to assume the risks of potentially significant fluctuations in the value of the Fund’s shares. |
| ∎ | | Correlation risk. Because the Fund’s investment strategy seeks to balance risk across three asset classes and, within each asset class, across different countries and investments, to the extent either the asset classes or the selected countries and investments become correlated in a way not anticipated by the Adviser, the Fund’s risk allocation process may result in magnified risks and loss instead of balancing (reducing) the risk of loss. |
| ∎ | | Debt securities risk. The prices of debt securities held by the Fund will be affected by changes in interest rates, the creditworthiness of the issuer and other factors. An increase in prevailing interest rates typically causes the value of existing debt securities to fall and often has a greater impact on longer-duration debt securities and higher quality debt securities. Falling interest rates will cause the Fund to reinvest the proceeds of debt securities that have been repaid by the issuer at lower interest rates. Falling interest rates may also reduce the Fund’s distributable income because |
|
| 8 Invesco Balanced-Risk Allocation Fund |
| | interest payments on floating rate debt instruments held by the Fund will decline. The Fund could lose money on investments in debt securities if the issuer or borrower fails to meet its obligations to make interest payments and/or to repay principal in a timely manner. Changes in an issuer’s financial strength, the market’s perception of such strength or in the credit rating of the issuer or the security may affect the value of debt securities. The Adviser’s credit analysis may fail to anticipate such changes, which could result in buying a debt security at an inopportune time or failing to sell a debt security in advance of a price decline or other credit event. |
| ∎ | | Derivatives risk. The value of a derivative instrument depends largely on (and is derived from) the value of an underlying security, currency, commodity, interest rate, index or other asset (each referred to as an underlying asset). In addition to risks relating to the underlying assets, the use of derivatives may include other, possibly greater, risks, including counterparty, leverage and liquidity risks. Counterparty risk is the risk that the counterparty to the derivative contract will default on its obligation to pay the Fund the amount owed or otherwise perform under the derivative contract. Derivatives create leverage risk because they do not require payment up front equal to the economic exposure created by owning the derivative. As a result, an adverse change in the value of the underlying asset could result in the Fund sustaining a loss that is substantially greater than the amount invested in the derivative, which may make the Fund’s returns more volatile and increase the risk of loss. Derivative instruments may also be less liquid than more traditional investments and the Fund may be unable to sell or close out its derivative positions at a desirable time or price. This risk may be more acute under adverse market conditions, during which the Fund may be most in need of liquidating its derivative positions. Derivatives may also be harder to value, less tax efficient and subject to changing government regulation that could impact the Fund’s ability to use certain derivatives or their cost. The SEC has proposed new regulations related to the use of derivatives |
| | and related instruments by registered investment companies. If adopted as proposed, these regulations would limit the Fund’s ability to engage in derivatives transactions and may result in increased costs or require the Fund to modify its investment strategies or to liquidate. Also, derivatives used for hedging or to gain or limit exposure to a particular market segment may not provide the expected benefits, particularly during adverse market conditions. These risks are greater for the Fund than most other mutual funds because the Fund will implement its investment strategy primarily through derivative instruments rather than direct investments in stocks/bonds. |
| ∎ | | Emerging markets securities risk. Emerging markets (also referred to as developing markets) are generally subject to greater market volatility, political, social and economic instability, uncertain trading markets and more governmental limitations on foreign investment than more developed markets. In addition, companies operating in emerging markets may be subject to lower trading volume and greater price fluctuations than companies in more developed markets. Securities law and the enforcement of systems of taxation in many emerging market countries may change quickly and unpredictably. In addition, investments in emerging markets securities may also be subject to additional transaction costs, delays in settlement procedures, and lack of timely information. |
| ∎ | | Exchange-traded funds risk. In addition to the risks associated with the underlying assets held by the exchange-traded fund, investments in exchange-traded funds are subject to the following additional risks: (1) an exchange-traded fund’s shares may trade above or below its net asset value; (2) an active trading market for the exchange-traded fund’s shares may not develop or be maintained; (3) trading an exchange-traded fund’s shares may be halted by the listing exchange; (4) a passively managed exchange-traded fund may not track the performance of the reference asset; and (5) a passively managed exchange-traded fund may hold troubled securities. Investment in exchange-traded funds may involve duplication of management fees and certain |
| | other expenses, as the Fund indirectly bears its proportionate share of any expenses paid by the exchange-traded funds in which it invests. Further, certain exchange-traded funds in which the Fund may invest are leveraged, which may result in economic leverage, permitting the Fund to gain exposure that is greater than would be the case in an unlevered instrument and potentially resulting in greater volatility. |
| ∎ | | Exchange-traded notes risk. Exchange-traded notes are subject to credit risk, counterparty risk, and the risk that the value of the exchange-traded note may drop due to a downgrade in the issuer’s credit rating. The value of an exchange-traded note may also be influenced by time to maturity, level of supply and demand for the exchange-traded note, volatility and lack of liquidity in the underlying market, changes in the applicable interest rates, and economic, legal, political, or geographic events that affect the referenced underlying market or assets. The Fund will bear its proportionate share of any fees and expenses borne by an exchange-traded note in which it invests. For certain exchange-traded notes, there may be restrictions on the Fund’s right to redeem its investment, which is meant to be held until maturity. |
| ∎ | | Foreign government debt risk. Investments in foreign government debt securities (sometimes referred to as sovereign debt securities) involve certain risks in addition to those relating to foreign securities or debt securities generally. The issuer of the debt or the governmental authorities that control the repayment of the debt may be unable or unwilling to repay principal or interest when due in accordance with the terms of such debt, and the Fund may have limited recourse in the event of a default against the defaulting government. Without the approval of debt holders, some governmental debtors have in the past been able to reschedule or restructure their debt payments or declare moratoria on payments. |
| ∎ | | Foreign securities risk. The Fund’s foreign investments may be adversely affected by political and social instability, changes in economic or taxation policies, difficulty in enforcing obligations, decreased liquidity or increased volatility. Foreign investments also involve |
continued on page 10
|
| 9 Invesco Balanced-Risk Allocation Fund |
continued from page 9
| | the risk of the possible seizure, nationalization or expropriation of the issuer or foreign deposits (in which the Fund could lose its entire investments in a certain market) and the possible adoption of foreign governmental restrictions such as exchange controls. Unless the Fund has hedged its foreign securities risk, foreign securities risk also involves the risk of negative foreign currency rate fluctuations, which may cause the value of securities denominated in such foreign currency (or other instruments through which the Fund has exposure to foreign currencies) to decline in value. Currency exchange rates may fluctuate significantly over short periods of time. Currency hedging strategies, if used, are not always successful. |
| ∎ | | Management risk. The Fund is actively managed and depends heavily on the Adviser’s judgment about markets, interest rates or the attractiveness, relative values, liquidity, or potential appreciation of particular investments made for the Fund’s portfolio. The Fund could experience losses if these judgments prove to be incorrect. Because the Fund’s investment process relies heavily on its asset allocation process, market movements that are counter to the portfolio managers’ expectations may have a significant adverse effect on the Fund’s net asset value. Additionally, legislative, regulatory, or tax developments may adversely affect management of the Fund and, therefore, the ability of the Fund to achieve its investment objective. |
| ∎ | | Market risk. The market values of the Fund’s investments, and therefore the value of the Fund’s shares, will go up and down, sometimes rapidly or unpredictably. Market risk may affect a single issuer, industry or section of the economy, or it may affect the market as a whole. Individual stock prices tend to go up and down more dramatically than those of certain other types of investments, such as bonds. During a general downturn in the financial markets, multiple asset classes may decline in value. When markets perform well, there can be no assurance that specific investments held by the Fund will rise in value. |
| ∎ | | Short position risk. Because the Fund’s potential loss on a short position arises from increases in the value of the asset sold short, the Fund will incur a loss on a short position, which is theoretically unlimited, if the price of the asset sold short increases from the short sale price. The counterparty to a short position or other market factors may prevent |
| | the Fund from closing out a short position at a desirable time or price and may reduce or eliminate any gain or result in a loss. In a rising market, the Fund’s short positions will cause the Fund to underperform the overall market and its peers that do not engage in shorting. If the Fund holds both long and short positions, and both positions decline simultaneously, the short positions will not provide any buffer (hedge) from declines in value of the Fund’s long positions. Certain types of short positions involve leverage, which may exaggerate any losses, potentially more than the actual cost of the investment, and will increase the volatility of the Fund’s returns. |
| ∎ | | Subsidiary risk. By investing in the Subsidiary, the Fund is indirectly exposed to risks associated with the Subsidiary’s investments. The Subsidiary is not registered under the Investment Company Act of 1940, as amended (1940 Act), and, except as otherwise noted in this prospectus, is not subject to the investor protections of the 1940 Act. Changes in the laws of the United States and/or the Cayman Islands, under which the Fund and the Subsidiary, respectively, are organized, could result in the inability of the Fund and/or the Subsidiary to operate as described in this prospectus and the SAI, and could negatively affect the Fund and its shareholders. |
| ∎ | | US government obligations risk. Obligations of US government agencies and authorities receive varying levels of support and may not be backed by the full faith and credit of the US government, which could affect the Fund’s ability to recover should they default. No assurance can be given that the US government will provide financial support to its agencies and authorities if it is not obligated by law to do so. |
| ∎ | | Volatility risk. Although the Fund’s investment strategy targets a specific volatility level, certain of the Fund’s investments may appreciate or decrease significantly in value over short periods of time. This may cause the Fund’s net asset value per share to experience significant increases or declines in value over short periods of time. |
About indexes used in this report
| ∎ | | The S&P 500® Index is an unmanaged index considered representative of the US stock market. |
| ∎ | | The Custom Invesco Balanced-Risk Allocation Style Index consists of 60% MSCI World Index and 40% Bloomberg Barclays U.S. Aggregate Index. Effective December 1, 2009, the |
| | fixed income component of the Custom Balanced-Risk Allocation Style Index changed from the JP Morgan Global (Traded) Index to the Bloomberg Barclays U.S. Aggregate Index. |
| ∎ | | The Lipper Alternative Global Macro Funds Index is an unmanaged index considered representative of alternative global macro funds tracked by Lipper. |
| ∎ | | The MSCI World IndexSM is an unmanaged index considered representative of stocks of developed countries. The index return is computed using the net return, which withholds applicable taxes for non-resident investors. |
| ∎ | | The Bloomberg Barclays U.S. Aggregate Index is an unmanaged index considered representative of the US investment grade, fixed-rate bond market. The index return is computed using the net return, which withholds applicable taxes for non-resident investors. |
| ∎ | | The JP Morgan Global (Traded) Index is a total return, market capitalization-weighted index, rebalanced monthly, consisting of the following countries: Australia, Germany, Spain, Belgium, Italy, Sweden, Canada, Japan, the United Kingdom, Denmark, the Nether-lands and the United States. |
| ∎ | | The Fund is not managed to track the performance of any particular index, including the index(es) described here, and consequently, the performance of the Fund may deviate significantly from the performance of the index(es). |
| ∎ | | A direct investment cannot be made in an index. Unless otherwise indicated, index results include reinvested dividends, and they do not reflect sales charges. Performance of the peer group, if applicable, reflects fund expenses; performance of a market index does not. |
Other information
| ∎ | | The returns shown in management’s discussion of Fund performance are based on net asset values (NAVs) calculated for shareholder transactions. Generally accepted accounting principles require adjustments to be made to the net assets of the Fund at period end for financial reporting purposes, and as such, the NAVs for shareholder transactions and the returns based on those NAVs may differ from the NAVs and returns reported in the Financial Highlights. |
|
| 10 Invesco Balanced-Risk Allocation Fund |
Consolidated Schedule of Investments
October 31, 2017
| | | | | | | | | | | | | | | | |
| | | Interest
Rate | | | Maturity
Date | | | Principal
Amount | | | Value | |
U.S. Treasury Securities–32.59% | | | | | | | | | |
| U.S. Treasury Bills–12.64%(a) | | | | | | | | | |
U.S. Treasury Bills | | | 0.94 | % | | | 12/14/2017 | | | $ | 260,000,000 | | | $ | 259,700,714 | |
U.S. Treasury Bills | | | 1.02 | % | | | 01/04/2018 | | | | 100,000,000 | | | | 99,815,780 | |
U.S. Treasury Bills | | | 1.12 | % | | | 01/04/2018 | | | | 61,000,000 | | | | 60,887,626 | |
U.S. Treasury Bills | | | 1.11 | % | | | 02/08/2018 | | | | 62,700,000 | | | | 62,507,749 | |
U.S. Treasury Bills | | | 1.12 | % | | | 02/08/2018 | | | | 150,000,000 | | | | 149,540,070 | |
| | | | | | | | | | | | | | | | 632,451,939 | |
| | | | |
| U.S. Treasury Notes–19.95% | | | | | | | | | | | | | | | | |
U.S. Treasury Floating Rate Notes (3 mo. U.S. Treasury Bill Money Market Yield Rate + 0.27%)(b) | | | 1.38 | % | | | 01/31/2018 | | | | 413,350,000 | | | | 413,674,273 | |
U.S. Treasury Floating Rate Notes (3 mo. U.S. Treasury Bill Money Market Yield Rate + 0.17%)(b) | | | 1.30 | % | | | 04/30/2018 | | | | 346,240,000 | | | | 346,635,198 | |
U.S. Treasury Floating Rate Notes (3 mo. U.S. Treasury Bill Money Market Yield Rate + 0.19%)(b) | | | 1.28 | % | | | 07/31/2018 | | | | 237,520,000 | | | | 237,883,406 | |
| | | | | | | | | | | | | | | | 998,192,877 | |
Total U.S. Treasury Securities (Cost $1,629,564,557) | | | | | | | | | | | | | | | 1,630,644,816 | |
| | | | |
| | | | | | Expiration
Date | | | | | | | |
| | | | |
Commodity-Linked Securities–3.31% | | | | | | | | | | | | | | | | |
Canadian Imperial Bank of Commerce EMTN, U.S. Federal Funds Effective Rate minus 0.03% (linked to the Canadian Imperial Bank of Commerce Custom 5 Agriculture Commodity Index, multiplied by 2) (Canada)(c) | | | | | | | 09/24/2018 | | | | 70,700,000 | | | | 74,093,485 | |
RBC Capital Markets, LLC, Commodity-Linked Notes, U.S. Federal Funds Effective Rate minus 0.04% (linked to the RBC Enhanced Agricultural Basket 05 Excess Return Index)(c) | | | | | | | 09/17/2018 | | | | 96,500,000 | | | | 91,468,476 | |
Total Commodity-Linked Securities (Cost $167,200,000) | | | | | | | | | | | | | | | 165,561,961 | |
| | | | |
| | | | | | | | | Shares | | | | |
| | | | |
Money Market Funds–59.51% | | | | | | | | | | | | | | | | |
Government & Agency Portfolio–Institutional Class, 0.95%(d) | | | | | | | | | | | 1,265,641,681 | | | | 1,265,641,681 | |
STIC (Global Series) PLC–U.S. Dollar Liquidity Portfolio (Ireland)–Institutional Class, 1.25%(d) | | | | | | | | | | | 250,189,540 | | | | 250,189,540 | |
Treasury Obligations Portfolio–Institutional Class, 0.92%(d) | | | | | | | | | | | 1,000,000,000 | | | | 1,000,000,000 | |
Treasury Portfolio–Institutional Class, 0.94%(d) | | | | | | | | | | | 462,043,788 | | | | 462,043,788 | |
Total Money Market Funds (Cost $2,977,875,009) | | | | | | | | | | | | | | | 2,977,875,009 | |
TOTAL INVESTMENTS–95.41% (Cost $4,774,639,566) | | | | | | | | | | | | | | | 4,774,081,786 | |
OTHER ASSETS LESS LIABILITIES–4.59% | | | | | | | | | | | | | | | 229,574,570 | |
NET ASSETS–100.00% | | | | | | | | | | | $ | 5,003,656,356 | |
| | | | | | | | | | | | | | | | | | | | |
| Open Futures Contracts(e) | |
| Long Futures Contracts | | Number of
Contracts | | | Expiration
Month | | | Notional
Value | | | Value | | | Unrealized
Appreciation
(Depreciation) | |
Brent Crude | | | 1,545 | | | | January-2018 | | | $ | 94,152,300 | | | $ | 7,961,917 | | | $ | 7,961,917 | |
Gasoline Reformulated Blendstock Oxygenate Blending | | | 2,132 | | | | December-2017 | | | | 155,134,980 | | | | 12,426,702 | | | | 12,426,702 | |
Heating Oil | | | 725 | | | | April-2018 | | | | 56,417,760 | | | | 4,000,138 | | | | 4,000,138 | |
Silver | | | 1,495 | | | | December-2017 | | | | 124,780,175 | | | | (3,830,435 | ) | | | (3,830,435 | ) |
WTI Crude | | | 965 | | | | April-2018 | | | | 52,756,550 | | | | 3,294,384 | | | | 3,294,384 | |
Subtotal — Commodity Risk | | | | | | | | | | | | | | | 23,852,706 | | | | 23,852,706 | |
See accompanying Notes to Consolidated Financial Statements which are an integral part of the financial statements.
11 Invesco Balanced-Risk Allocation Fund
| | | | | | | | | | | | | | | | | | | | |
| Open Futures Contracts(e)—(continued) | |
| Long Futures Contracts | | Number of
Contracts | | | Expiration
Month | | | Notional
Value | | | Value | | | Unrealized
Appreciation
(Depreciation) | |
Dow Jones EURO STOXX 50 Index | | | 8,800 | | | | December-2017 | | | $ | 377,036,194 | | | $ | 22,260,502 | | | $ | 22,260,502 | |
E-Mini Russell 2000 Index | | | 3,600 | | | | December-2017 | | | | 270,486,000 | | | | 14,732,507 | | | | 14,732,507 | |
E-Mini S&P 500 Index | | | 2,260 | | | | December-2017 | | | | 290,715,100 | | | | 9,815,610 | | | | 9,815,610 | |
FTSE 100 Index | | | 3,870 | | | | December-2017 | | | | 383,897,305 | | | | 5,031,538 | | | | 5,031,538 | |
Hang Seng Index | | | 1,685 | | | | November-2017 | | | | 304,541,493 | | | | (148,892 | ) | | | (148,892 | ) |
Tokyo Stock Price Index | | | 2,765 | | | | December-2017 | | | | 428,770,780 | | | | 42,808,784 | | | | 42,808,784 | |
Subtotal — Equity Risk | | | | | | | | | | | | | | | 94,500,049 | | | | 94,500,049 | |
Australia 10 Year Bonds | | | 5,290 | | | | December-2017 | | | | 521,721,578 | | | | (2,799,728 | ) | | | (2,799,728 | ) |
Canada 10 Year Bonds | | | 8,500 | | | | December-2017 | | | | 905,476,320 | | | | (2,269,982 | ) | | | (2,269,982 | ) |
Euro Bonds | | | 1,980 | | | | December-2017 | | | | 375,383,201 | | | | 1,330,970 | | | | 1,330,970 | |
Long Gilt | | | 2,530 | | | | December-2017 | | | | 417,854,729 | | | | (9,532,842 | ) | | | (9,532,842 | ) |
U.S. Treasury Long Bonds | | | 2,875 | | | | December-2017 | | | | 438,347,656 | | | | (7,695,778 | ) | | | (7,695,778 | ) |
Subtotal — Interest Rate Risk | | | | | | | | | | | | | | | (20,967,360 | ) | | | (20,967,360 | ) |
Total Futures Contracts | | | | | | | | | | | | | | $ | 97,385,395 | | | $ | 97,385,395 | |
| | | | | | | | | | | | | | | | | | | | | | | | | | | | | | | | | | | | | | |
| Open Over-The-Counter Total Return Swap Agreements(f) | |
| Counterparty | | Pay/
Receive | | Reference Entity(g) | | | Fixed
Rate | | | Payment
Frequency | | | Number of
Contracts | | | Maturity
Date | | | Notional
Value | | | Upfront
Payments
Paid
(Received) | | | Value | | | Unrealized
Appreciation
(Depreciation) | |
Canadian Imperial Bank of Commerce | | Receive | |
| Canadian Imperial Bank of
Commerce Dynamic Roll
LME Copper Excess
Return Index 2 |
| | | 0.30 | % | | | Monthly | | | | 1,200,000 | | | | April-2018 | | | $ | 103,234,560 | | | $ | — | | | $ | 335,400 | | | $ | 335,400 | |
Cargill, Inc. | | Receive | |
| Monthly Rebalance
Commodity Excess Return
Index |
| | | 0.47 | | | | Monthly | | | | 129,500 | | | | July-2018 | | | | 104,968,556 | | | | — | | | | 0 | | | | 0 | |
Cargill, Inc. | | Receive | |
| Single Commodity Index
Excess Return |
| | | 0.12 | | | | Monthly | | | | 53,500 | | | | January-2018 | | | | 47,259,455 | | | | — | | | | 0 | | | | 0 | |
Goldman Sachs International | | Receive | |
| Goldman Sachs Alpha
Basket B823 Excess
Return Strategy |
| | | 0.40 | | | | Monthly | | | | 585,000 | | | | July-2018 | | | | 46,823,096 | | | | — | | | | 331,923 | | | | 331,923 | |
J.P. Morgan Chase Bank, N.A. | | Receive | |
| J.P. Morgan Contag Beta
Gas Oil Excess Return
Index |
| | | 0.25 | | | | Monthly | | | | 265,000 | | | | April-2018 | | | | 57,654,778 | | | | — | | | | 2,699,555 | | | | 2,699,555 | |
Merrill Lynch International | | Receive | |
| Merrill Lynch Gold Excess
Return Index |
| | | 0.14 | | | | Monthly | | | | 527,000 | | | | June-2018 | | | | 85,447,885 | | | | — | | | | 0 | | | | 0 | |
Merrill Lynch International | | Receive | |
| MLCX Aluminum Annual
Excess Return Index |
| | | 0.28 | | | | Monthly | | | | 91,000 | | | | September-2018 | | | | 10,907,023 | | | | — | | | | 0 | | | | 0 | |
Merrill Lynch International | | Receive | |
| MLCX Natural Gas Annual
Excess Return Index |
| | | 0.25 | | | | Monthly | | | | 1,200,000 | | | | September-2018 | | | | 53,267,916 | | | | — | | | | 0 | | | | 0 | |
Morgan Stanley Capital Services LLC | | Receive | |
| S&P GSCI Aluminum
Dynamic Roll Index
Excess Return |
| | | 0.38 | | | | Monthly | | | | 605,000 | | | | October-2018 | | | | 70,487,280 | | | | — | | | | 667,618 | | | | 667,618 | |
Subtotal — Appreciation — Commodity Risk | | | | | | | | | | | | | | | | | | | | | | | | — | | | | 4,034,496 | | | | 4,034,496 | |
Barclays Bank PLC | | Receive | |
| Barclays Commodity
Strategy 1452 Excess
Return Index |
| | | 0.33 | | | | Monthly | | | | 183,500 | | | | October-2018 | | | | 104,466,440 | | | | — | | | | (2,554,504 | ) | | | (2,554,504 | ) |
J.P. Morgan Chase Bank, N.A. | | Receive | |
| S&P GSCI Gold Index
Excess Return |
| | | 0.09 | | | | Monthly | | | | 660,000 | | | | October-2018 | | | | 68,841,366 | | | | — | | | | (559,020 | ) | | | (559,020 | ) |
Macquarie Bank Ltd. | | Receive | |
| Macquarie Aluminum
Dynamic Selection Index |
| | | 0.30 | | | | Monthly | | | | 815,000 | | | | December-2017 | | | | 48,131,048 | | | | — | | | | (546,702 | ) | | | (546,702 | ) |
Subtotal — Commodity Risk | | | | | | | | | | | | | | | | | | | | | | | | | | | — | | | | (3,660,226 | ) | | | (3,660,226 | ) |
See accompanying Notes to Consolidated Financial Statements which are an integral part of the financial statements.
12 Invesco Balanced-Risk Allocation Fund
| | | | | | | | | | | | | | | | | | | | | | | | | | | | | | | | | | | | | | | | |
| Open Over-The-Counter Total Return Swap Agreements(f)—(continued) | |
| Counterparty | | Pay/
Receive | | | Reference Entity(g) | | | Fixed
Rate | | | Payment
Frequency | | | Number of
Contracts | | | Maturity
Date | | | Notional
Value | | | Upfront
Payments
Paid
(Received) | | | Value | | | Unrealized
Appreciation
(Depreciation) | |
Goldman Sachs International | | | Receive | | | | Hang Seng Index Futures | | | | — | | | | Monthly | | | | 475 | | | | November-2017 | | | $ | 85,849,976 | | | $ | — | | | $ | (101,959 | ) | | $ | (101,959 | ) |
Subtotal — Equity Risk | | | | | | | | | | | | | | | | | | | | | | | | | | | | — | | | | (101,959 | ) | | | (101,959 | ) |
Subtotal — Depreciation | | | | | | | | | | | | | | | | | | | | | | | | | | | | — | | | | (3,762,185 | ) | | | (3,762,185 | ) |
Total — Total Return Swap Agreements | | | | | | | | | | | | | | | $ | — | | | $ | 272,311 | | | $ | 272,311 | |
Investments Abbreviations:
| | |
| EMTN | | – European Medium-Term Notes |
Index Information:
| | |
Canadian Imperial Bank of Commerce Custom 5
Agriculture Commodity Index | | – a basket of indices that provide exposure to various components of the agriculture markets. The underlying commodities comprising the indices are: Cocoa, Coffee, Corn, Cotton, Lean Hogs, Live Cattle, Soybean Meal, Soybean Oil, Soybeans, Sugar and Wheat. |
RBC Enhanced Agricultural Basket 05 Excess
Return Index | | – a commodity index composed of futures contracts on Cocoa, Coffee, Corn, Cotton, Lean Hogs, Live Cattle, Soybean Meal, Soybean Oil, Soybeans, Sugar and Wheat. |
Notes to Consolidated Schedule of Investments:
| (a) | Securities traded on a discount basis. The interest rates shown represent the discount rates at the time of purchase by the Fund. |
| (b) | Interest or dividend rate is redetermined periodically. Rate shown is the rate in effect on October 31, 2017. |
| (c) | Security purchased or received in transaction exempt from registration under the Securities Act of 1933, as amended (the “1933 Act”). The security may be resold pursuant to an exemption from registration under the 1933 Act, typically to qualified institutional buyers. The aggregate value of these securities at October 31, 2017 was $165,561,961, which represented 3.31% of the Fund’s Net Assets. |
| (d) | The money market fund and the Fund are affiliated by having the same investment adviser. The rate shown is the 7-day SEC standardized yield as of October 31, 2017. |
| (e) | Futures contracts collateralized by $171,220,000 cash held with Bank of America Merrill Lynch, the futures commission merchant. |
| (f) | The Fund receives or pays payments based on any positive or negative return on the Reference Entity, respectively. |
| (g) | The table below includes additional information regarding the underlying components of certain reference entities that are not publicly available. |
| | | | | | |
| Reference Entity Components | |
| Reference Entity | | Underlying Components | | Percentage | |
Canadian Imperial Bank of Commerce Dynamic Roll LME Copper Excess Return Index 2 | |
| | Long Futures Contracts | | | | |
| | Copper | | | 100.00 | % |
|
Monthly Rebalance Commodity Excess Return Index | |
| | Long Futures Contracts | | | | |
| | Cocoa | | | 0.17 | % |
| | Coffee ‘C’ | | | 5.28 | |
| | Corn | | | 7.70 | |
| | Cotton No. 2 | | | 18.88 | |
| | Lean Hogs | | | 0.52 | |
| | Live Cattle | | | 1.24 | |
| | Soybean Meal | | | 18.81 | |
| | Soybean Oil | | | 4.79 | |
| | Soybeans | | | 18.38 | |
| | Sugar No. 11 | | | 19.42 | |
| | Wheat | | | 4.81 | |
| | Total | | | 100.00 | % |
|
Single Commodity Index Excess Return | |
| | Long Futures Contracts | | | | |
| | Gold | | | 100.00 | % |
See accompanying Notes to Consolidated Financial Statements which are an integral part of the financial statements.
13 Invesco Balanced-Risk Allocation Fund
| | | | | | |
| Reference Entity Components—(continued) | |
| Reference Entity | | Underlying Components | | Percentage | |
|
Goldman Sachs Alpha Basket B823 Excess Return Strategy | |
| | Long Futures Contracts | | | | |
| | Cocoa | | | 0.17 | % |
| | Coffee ‘C’ | | | 5.28 | |
| | Corn | | | 7.70 | |
| | Cotton No. 2 | | | 18.88 | |
| | Lean Hogs | | | 0.52 | |
| | Live Cattle | | | 1.24 | |
| | Soybean Meal | | | 18.81 | |
| | Soybean Oil | | | 4.79 | |
| | Soybeans | | | 18.38 | |
| | Sugar No. 11 | | | 19.42 | |
| | Wheat | | | 4.81 | |
| | Total | | | 100.00 | % |
|
J.P. Morgan Contag Beta Gas Oil Excess Return Index | |
| | Long Futures Contracts | | | | |
| | Gas Oil | | | 100.00 | % |
|
MLCX Aluminum Annual Excess Return Index | |
| | Long Futures Contracts | | | | |
| | Aluminum | | | 100.00 | % |
|
Merrill Lynch Gold Excess Return Index | |
| | Long Futures Contracts | | | | |
| | Gold | | | 100.00 | % |
MLCX Natural Gas Annual Excess Return Index | |
| | Long Futures Contracts | | | | |
| | Natural Gas | | | 100.00 | % |
|
S&P GSCI Aluminum Dynamic Roll Index Excess Return | |
| | Long Futures Contracts | | | | |
| | Aluminum | | | 100.00 | % |
|
Barclays Commodity Strategy 1452 Excess Return Index | |
| | Long Futures Contracts | | | | |
| | Copper | | | 100.00 | % |
|
S&P GSCI Gold Index Excess Return | |
| | Long Futures Contracts | | | | |
| | Gold | | | 100.00 | % |
|
Macquarie Aluminum Dynamic Selection Index | |
| | Long Futures Contracts | | | | |
| | Aluminum | | | 100.00 | % |
See accompanying Notes to Consolidated Financial Statements which are an integral part of the financial statements.
14 Invesco Balanced-Risk Allocation Fund
Consolidated Statement of Assets and Liabilities
October 31, 2017
| | | | |
Assets: | | | | |
Investments in securities, at value (Cost $1,796,764,557) | | $ | 1,796,206,777 | |
Investments in affiliated money market funds, at value and cost | | | 2,977,875,009 | |
Other investments: | | | | |
Variation margin receivable- futures | | | 6,876,122 | |
Swaps receivable — OTC | | | 3,107,298 | |
Unrealized appreciation on swap agreements — OTC | | | 4,034,496 | |
Deposits with brokers: | | | | |
Cash collateral — exchange-traded futures contracts | | | 171,220,000 | |
Cash collateral — OTC derivatives | | | 42,311,962 | |
Cash | | | 12,661,544 | |
Receivable for: | | | | |
Fund shares sold | | | 3,949,351 | |
Dividends and interest | | | 2,803,873 | |
Fund expenses absorbed | | | 39,864 | |
Investment for trustee deferred compensation and retirement plans | | | 631,115 | |
Other assets | | | 99,521 | |
Total assets | | | 5,021,816,932 | |
| |
Liabilities: | | | | |
Other investments: | | | | |
Swaps payable — OTC | | | 4,560,730 | |
Unrealized depreciation on swap agreements — OTC | | | 3,762,185 | |
Payable for: | | | | |
Dividends | | | 11 | |
Fund shares reacquired | | | 6,683,566 | |
Accrued fees to affiliates | | | 2,358,702 | |
Accrued trustees’ and officers’ fees and benefits | | | 8,807 | |
Accrued other operating expenses | | | 62,343 | |
Trustee deferred compensation and retirement plans | | | 724,232 | |
Total liabilities | | | 18,160,576 | |
Net assets applicable to shares outstanding | | $ | 5,003,656,356 | |
| |
Net assets consist of: | | | | |
Shares of beneficial interest | | $ | 4,665,229,938 | |
Undistributed net investment income (loss) | | | (1,050,892 | ) |
Undistributed net realized gain | | | 242,377,384 | |
Net unrealized appreciation | | | 97,099,926 | |
| | | $ | 5,003,656,356 | |
| | | | |
Net Assets: | | | | |
Class A | | $ | 1,337,537,170 | |
Class B | | $ | 4,902,521 | |
Class C | | $ | 1,051,038,352 | |
Class R | | $ | 23,518,065 | |
Class Y | | $ | 2,147,497,289 | |
Class R5 | | $ | 119,102,862 | |
Class R6 | | $ | 320,060,097 | |
|
Shares outstanding, no par value,
with an unlimited number of shares authorized: | |
Class A | | | 118,565,480 | |
Class B | | | 452,699 | |
Class C | | | 97,052,639 | |
Class R | | | 2,116,142 | |
Class Y | | | 187,917,801 | |
Class R5 | | | 10,418,534 | |
Class R6 | | | 27,975,290 | |
Class A: | | | | |
Net asset value per share | | $ | 11.28 | |
Maximum offering price per share | | | | |
(Net asset value of $11.28 ¸ 94.50%) | | $ | 11.94 | |
Class B: | | | | |
Net asset value and offering price per share | | $ | 10.83 | |
Class C: | | | | |
Net asset value and offering price per share | | $ | 10.83 | |
Class R: | | | | |
Net asset value and offering price per share | | $ | 11.11 | |
Class Y: | | | | |
Net asset value and offering price per share | | $ | 11.43 | |
Class R5: | | | | |
Net asset value and offering price per share | | $ | 11.43 | |
Class R6: | | | | |
Net asset value and offering price per share | | $ | 11.44 | |
See accompanying Notes to Consolidated Financial Statements which are an integral part of the financial statements.
15 Invesco Balanced-Risk Allocation Fund
Consolidated Statement of Operations
For the year ended October 31, 2017
| | | | |
Investment income: | | | | |
Interest | | $ | 19,281,365 | |
Dividends from affiliated money market funds | | | 18,504,718 | |
Total investment income | | | 37,786,083 | |
| |
Expenses: | | | | |
Advisory fees | | | 44,756,087 | |
Administrative services fees | | | 634,340 | |
Custodian fees | | | 56,363 | |
Distribution fees: | | | | |
Class A | | | 3,873,324 | |
Class B | | | 68,072 | |
Class C | | | 11,555,875 | |
Class R | | | 128,956 | |
Transfer agent fees — A, B, C, R and Y | | | 5,698,869 | |
Transfer agent fees — R5 | | | 95,100 | |
Transfer agent fees — R6 | | | 11,075 | |
Trustees’ and officers’ fees and benefits | | | 97,408 | |
Registration and filing fees | | | 252,689 | |
Reports to shareholders | | | 745,774 | |
Professional services fees | | | 75,304 | |
Other | | | 33,032 | |
Total expenses | | | 68,082,268 | |
Less: Fees waived and expense offset arrangement(s) | | | (3,070,964 | ) |
Net expenses | | | 65,011,304 | |
Net investment income (loss) | | | (27,225,221 | ) |
| |
Realized and unrealized gain (loss) from: | | | | |
Net realized gain (loss) from: | | | | |
Investment securities | | | (52,326,256 | ) |
Foreign currencies | | | (1,839,858 | ) |
Futures contracts | | | 209,989,737 | |
Swap agreements | | | 58,617,311 | |
| | | | 214,440,934 | |
Change in net unrealized appreciation (depreciation) of: | | | | |
Investment securities | | | 8,712,874 | |
Futures contracts | | | 192,484,930 | |
Swap agreements | | | (6,469,466 | ) |
| | | | 194,728,338 | |
Net realized and unrealized gain | | | 409,169,272 | |
Net increase in net assets resulting from operations | | $ | 381,944,051 | |
See accompanying Notes to Consolidated Financial Statements which are an integral part of the financial statements.
16 Invesco Balanced-Risk Allocation Fund
Consolidated Statement of Changes in Net Assets
For the years ended October 31, 2017 and 2016
| | | | | | | | |
| | | 2017 | | | 2016 | |
Operations: | | | | | | | | |
Net investment income (loss) | | $ | (27,225,221 | ) | | $ | (54,791,123 | ) |
Net realized gain | | | 214,440,934 | | | | 591,803,421 | |
Change in net unrealized appreciation (depreciation) | | | 194,728,338 | | | | (188,727,657 | ) |
Net increase in net assets resulting from operations | | | 381,944,051 | | | | 348,284,641 | |
| | |
Distributions to shareholders from net investment income: | | | | | | | | |
Class A | | | (66,255,742 | ) | | | (57,902,283 | ) |
Class B | | | (237,993 | ) | | | (224,978 | ) |
Class C | | | (36,855,169 | ) | | | (26,864,376 | ) |
Class R | | | (922,264 | ) | | | (541,614 | ) |
Class Y | | | (66,982,783 | ) | | | (65,220,904 | ) |
Class R5 | | | (5,634,379 | ) | | | (4,519,268 | ) |
Class R6 | | | (11,414,824 | ) | | | (12,605,397 | ) |
Total distributions from net investment income | | | (188,303,154 | ) | | | (167,878,820 | ) |
| | |
Distributions to shareholders from net realized gains: | | | | | | | | |
Class A | | | (74,624,430 | ) | | | (83,448,580 | ) |
Class B | | | (342,193 | ) | | | (487,027 | ) |
Class C | | | (52,991,448 | ) | | | (58,155,269 | ) |
Class R | | | (1,119,513 | ) | | | (878,445 | ) |
Class Y | | | (70,271,304 | ) | | | (84,286,403 | ) |
Class R5 | | | (5,814,960 | ) | | | (5,762,170 | ) |
Class R6 | | | (11,561,935 | ) | | | (15,388,645 | ) |
Total distributions from net realized gains | | | (216,725,783 | ) | | | (248,406,539 | ) |
| | |
Share transactions-net: | | | | | | | | |
Class A | | | (502,289,546 | ) | | | (494,455,959 | ) |
Class B | | | (3,444,466 | ) | | | (4,653,827 | ) |
Class C | | | (214,072,180 | ) | | | (302,047,491 | ) |
Class R | | | (3,615,578 | ) | | | 1,391,792 | |
Class Y | | | 376,209,099 | | | | (804,827,082 | ) |
Class R5 | | | (24,107,384 | ) | | | (13,958,529 | ) |
Class R6 | | | 32,561,955 | | | | (120,976,238 | ) |
Net increase (decrease) in net assets resulting from share transactions | | | (338,758,100 | ) | | | (1,739,527,334 | ) |
Net increase (decrease) in net assets | | | (361,842,986 | ) | | | (1,807,528,052 | ) |
| | |
Net assets: | | | | | | | | |
Beginning of year | | | 5,365,499,342 | | | | 7,173,027,394 | |
End of year (includes undistributed net investment income (loss) of $ (1,050,892) and $179,178,674, respectively) | | $ | 5,003,656,356 | | | $ | 5,365,499,342 | |
Notes to Consolidated Financial Statements
October 31, 2017
NOTE 1—Significant Accounting Policies
Invesco Balanced-Risk Allocation Fund (the “Fund”) is a series portfolio of AIM Investment Funds (Invesco Investment Funds) (the “Trust”). The Trust is organized as a Delaware statutory trust and is registered under the Investment Company Act of 1940, as amended (the “1940 Act”), as an open-end series management investment company consisting of twenty separate series portfolios, each authorized to issue an unlimited number of shares of beneficial interest. The assets, liabilities and operations of each portfolio are accounted for separately. Information presented in these consolidated financial statements pertains only to the Fund. Matters affecting each portfolio or class will be voted on exclusively by the shareholders of such portfolio or class.
The Fund will seek to gain exposure to the commodity markets primarily through investments in the Invesco Cayman Commodity Fund I Ltd. (the “Subsidiary”), a wholly-owned subsidiary of the Fund organized under the laws of the Cayman Islands. The Subsidiary was organized by the Fund to
17 Invesco Balanced-Risk Allocation Fund
invest in commodity-linked derivatives and other securities that may provide leveraged and non-leveraged exposure to commodities. The Fund may invest up to 25% of its total assets in the Subsidiary.
The Fund’s investment objective is to provide total return with a low to moderate correlation to traditional financial market indices.
The Fund currently consists of seven different classes of shares: Class A, Class B, Class C, Class R, Class Y, Class R5 and Class R6. Class Y shares are available only to certain investors. Class A shares are sold with a front-end sales charge unless certain waiver criteria are met and under certain circumstances load waived shares may be subject to contingent deferred sales charges (“CDSC”). Class C shares are sold with a CDSC. Class R, Class Y, Class R5 and Class R6 shares are sold at net asset value. Effective November 30, 2010, new or additional investments in Class B shares are no longer permitted. Existing shareholders of Class B shares may continue to reinvest dividends and capital gains distributions in Class B shares until they convert to Class A shares. Also, shareholders in Class B shares will be able to exchange those shares for Class B shares of other Invesco Funds offering such shares until they convert to Class A shares. Generally, Class B shares will automatically convert to Class A shares on or about the month-end, which is at least eight years after the date of purchase. Redemption of Class B shares prior to the conversion date will be subject to a CDSC.
The Fund is an investment company and accordingly follows the investment company accounting and reporting guidance in accordance with Financial Accounting Standards Board Accounting Standards Codification Topic 946, Financial Services — Investment Companies.
The following is a summary of the significant accounting policies followed by the Fund in the preparation of its consolidated financial statements.
| A. | Security Valuations — Securities, including restricted securities, are valued according to the following policy. |
Debt obligations (including convertible securities) and unlisted equities are fair valued using an evaluated quote provided by an independent pricing service. Evaluated quotes provided by the pricing service may be determined without exclusive reliance on quoted prices, and may reflect appropriate factors such as institution-size trading in similar groups of securities, developments related to specific securities, dividend rate (for unlisted equities), yield (for debt obligations), quality, type of issue, coupon rate (for debt obligations), maturity (for debt obligations), individual trading characteristics and other market data. Pricing services generally value debt obligations assuming orderly transactions of institutional round lot size, but a fund may hold or transact in the same securities in smaller, odd lot sizes. Odd lots often trade at lower prices than institutional round lots. Debt obligations are subject to interest rate and credit risks. In addition, all debt obligations involve some risk of default with respect to interest and/or principal payments.
A security listed or traded on an exchange (except convertible securities) is valued at its last sales price or official closing price as of the close of the customary trading session on the exchange where the security is principally traded, or lacking any sales or official closing price on a particular day, the security may be valued at the closing bid price on that day. Securities traded in the over-the-counter market are valued based on prices furnished by independent pricing services or market makers. When such securities are valued by an independent pricing service they may be considered fair valued. Futures contracts are valued at the final settlement price set by an exchange on which they are principally traded. Listed options are valued at the mean between the last bid and asked prices from the exchange on which they are principally traded. Options not listed on an exchange are valued by an independent source at the mean between the last bid and asked prices. For purposes of determining net asset value (“NAV”) per share, futures and option contracts generally are valued 15 minutes after the close of the customary trading session of the New York Stock Exchange (“NYSE”).
Investments in open-end and closed-end registered investment companies that do not trade on an exchange are valued at the end-of-day net asset value per share. Investments in open-end and closed-end registered investment companies that trade on an exchange are valued at the last sales price or official closing price as of the close of the customary trading session on the exchange where the security is principally traded.
Swap agreements are fair valued using an evaluated quote, if available, provided by an independent pricing service. Evaluated quotes provided by the pricing service are valued based on a model which may include end-of-day net present values, spreads, ratings, industry, company performance and returns of referenced assets. Centrally cleared swap agreements are valued at the daily settlement price determined by the relevant exchange or clearinghouse.
Foreign securities’ (including foreign exchange contracts) prices are converted into U.S. dollar amounts using the applicable exchange rates as of the close of the NYSE. If market quotations are available and reliable for foreign exchange-traded equity securities, the securities will be valued at the market quotations. Because trading hours for certain foreign securities end before the close of the NYSE, closing market quotations may become unreliable. If between the time trading ends on a particular security and the close of the customary trading session on the NYSE, events occur that the investment adviser determines are significant and make the closing price unreliable, the Fund may fair value the security. If the event is likely to have affected the closing price of the security, the security will be valued at fair value in good faith using procedures approved by the Board of Trustees. Adjustments to closing prices to reflect fair value may also be based on a screening process of an independent pricing service to indicate the degree of certainty, based on historical data, that the closing price in the principal market where a foreign security trades is not the current value as of the close of the NYSE. Foreign securities’ prices meeting the approved degree of certainty that the price is not reflective of current value will be priced at the indication of fair value from the independent pricing service. Multiple factors may be considered by the independent pricing service in determining adjustments to reflect fair value and may include information relating to sector indices, American Depositary Receipts and domestic and foreign index futures. Foreign securities may have additional risks including exchange rate changes, potential for sharply devalued currencies and high inflation, political and economic upheaval, the relative lack of issuer information, relatively low market liquidity and the potential lack of strict financial and accounting controls and standards.
Securities for which market prices are not provided by any of the above methods may be valued based upon quotes furnished by independent sources. The last bid price may be used to value equity securities. The mean between the last bid and asked prices is used to value debt obligations, including corporate loans.
Securities for which market quotations are not readily available or became unreliable are valued at fair value as determined in good faith by or under the supervision of the Trust’s officers following procedures approved by the Board of Trustees. Issuer specific events, market trends, bid/asked quotes of brokers and information providers and other market data may be reviewed in the course of making a good faith determination of a security’s fair value.
The Fund may invest in securities that are subject to interest rate risk, meaning the risk that the prices will generally fall as interest rates rise and, conversely, the prices will generally rise as interest rates fall. Specific securities differ in their sensitivity to changes in interest rates depending on their individual characteristics. Changes in interest rates may result in increased market volatility, which may affect the value and/or liquidity of certain Fund investments.
18 Invesco Balanced-Risk Allocation Fund
Valuations change in response to many factors including the historical and prospective earnings of the issuer, the value of the issuer’s assets, general economic conditions, interest rates, investor perceptions and market liquidity. Because of the inherent uncertainties of valuation, the values reflected in the consolidated financial statements may materially differ from the value received upon actual sale of those investments.
| B. | Securities Transactions and Investment Income — Securities transactions are accounted for on a trade date basis. Realized gains or losses on sales are computed on the basis of specific identification of the securities sold. Interest income (net of withholding tax, if any) is recorded on the accrual basis from settlement date. Bond premiums and discounts are amortized and/or accreted over the lives of the respective securities. Pay-in-kind income received in the form of securities in-lieu of cash is recorded as interest income. Dividend income (net of withholding tax, if any) is recorded on the ex-dividend date. |
The Fund may periodically participate in litigation related to Fund investments. As such, the Fund may receive proceeds from litigation settlements. Any proceeds received are included in the Consolidated Statement of Operations as realized gain (loss) for investments no longer held and as unrealized gain (loss) for investments still held.
Brokerage commissions and mark ups are considered transaction costs and are recorded as an increase to the cost basis of securities purchased and/or a reduction of proceeds on a sale of securities. Such transaction costs are included in the determination of net realized and unrealized gain (loss) from investment securities reported in the Consolidated Statement of Operations and the Consolidated Statement of Changes in Net Assets and the net realized and unrealized gains (losses) on securities per share in the Financial Highlights. Transaction costs are included in the calculation of the Fund’s net asset value and, accordingly, they reduce the Fund’s total returns. These transaction costs are not considered operating expenses and are not reflected in net investment income reported in the Consolidated Statement of Operations and the Consolidated Statement of Changes in Net Assets, or the net investment income per share and the ratios of expenses and net investment income reported in the Financial Highlights, nor are they limited by any expense limitation arrangements between the Fund and the investment adviser.
The Fund allocates income and realized and unrealized capital gains and losses to a class based on the relative net assets of each class.
| C. | Country Determination — For the purposes of making investment selection decisions and presentation in the Consolidated Schedule of Investments, the investment adviser may determine the country in which an issuer is located and/or credit risk exposure based on various factors. These factors include the laws of the country under which the issuer is organized, where the issuer maintains a principal office, the country in which the issuer derives 50% or more of its total revenues and the country that has the primary market for the issuer’s securities, as well as other criteria. Among the other criteria that may be evaluated for making this determination are the country in which the issuer maintains 50% or more of its assets, the type of security, financial guarantees and enhancements, the nature of the collateral and the sponsor organization. Country of issuer and/or credit risk exposure has been determined to be the United States of America, unless otherwise noted. |
| D. | Distributions — Distributions from net investment income and net realized capital gain, if any, are generally declared and paid annually and recorded on the ex-dividend date. The Fund may elect to treat a portion of the proceeds from redemptions as distributions for federal income tax purposes. |
| E. | Federal Income Taxes — The Fund intends to comply with the requirements of Subchapter M of the Internal Revenue Code of 1986, as amended (the “Internal Revenue Code”), necessary to qualify as a regulated investment company and to distribute substantially all of the Fund’s taxable earnings to shareholders. As such, the Fund will not be subject to federal income taxes on otherwise taxable income (including net realized capital gain) that is distributed to shareholders. Therefore, no provision for federal income taxes is recorded in the consolidated financial statements. |
The Fund recognizes the tax benefits of uncertain tax positions only when the position is more likely than not to be sustained. Management has analyzed the Fund’s uncertain tax positions and concluded that no liability for unrecognized tax benefits should be recorded related to uncertain tax positions. Management is not aware of any tax positions for which it is reasonably possible that the total amounts of unrecognized tax benefits will change materially in the next 12 months.
The Subsidiary is classified as a controlled foreign corporation under Subchapter N of the Internal Revenue Code. Therefore, the Fund is required to increase its taxable income by its share of the Subsidiary’s income. Net investment losses of the Subsidiary cannot be deducted by the Fund in the current period nor carried forward to offset taxable income in future periods.
The Fund files tax returns in the U.S. Federal jurisdiction and certain other jurisdictions. Generally the Fund is subject to examinations by such taxing authorities for up to three years after the filing of the return for the tax period.
| F. | Expenses — Fees provided for under the Rule 12b-1 plan of a particular class of the Fund are charged to the operations of such class. Transfer agency fees and expenses and other shareholder recordkeeping fees and expenses attributable to Class R5 and Class R6 are allocated to each share class based on relative net assets. Sub-accounting fees attributable to Class R5 are charged to the operations of the class. Transfer agency fees and expenses and other shareholder recordkeeping fees and expenses relating to all other classes are allocated among those classes based on relative net assets. All other expenses are allocated among the classes based on relative net assets. |
| G. | Accounting Estimates — The financial statements are prepared on a consolidated basis in conformity with accounting principles generally accepted in the United States of America (“GAAP”), which requires management to make estimates and assumptions that affect the reported amounts of assets and liabilities at the date of the financial statements and the reported amounts of revenues and expenses during the reporting period including estimates and assumptions related to taxation. Actual results could differ from those estimates by a significant amount. The accompanying financial statements reflect the financial position of the Fund and its Subsidiary and the results of operations on a consolidated basis. All inter-company accounts and transactions have been eliminated in consolidation. |
In addition, the Fund monitors for material events or transactions that may occur or become known after the period-end date and before the date the consolidated financial statements are released to print.
| H. | Indemnifications — Under the Trust’s organizational documents, each Trustee, officer, employee or other agent of the Trust, and under the Subsidiary’s organizational documents, the directors and officers of the Subsidiary, are indemnified against certain liabilities that may arise out of the performance of their duties to the Fund and/or the Subsidiary, respectively. Additionally, in the normal course of business, the Fund enters into contracts, including the Fund’s servicing agreements, that contain a variety of indemnification clauses. The Fund’s maximum exposure under these arrangements is unknown as this would involve future claims that may be made against the Fund that have not yet occurred. The risk of material loss as a result of such indemnification claims is considered remote. |
19 Invesco Balanced-Risk Allocation Fund
| I. | Structured Securities — The Fund may invest in structured securities. Structured securities are a type of derivative security whose value is determined by reference to changes in the value of underlying securities, currencies, interest rates, commodities, indices or other financial indicators (“reference instruments”). Most structured securities are fixed-income securities that have maturities of three years or less. Structured securities may be positively or negatively indexed (i.e., their principal value or interest rates may increase or decrease if the underlying reference instrument appreciates) and may have return characteristics similar to direct investments in the underlying reference instrument. |
Structured securities may entail a greater degree of market risk than other types of debt securities because the investor bears the risk of the reference instruments. In addition to the credit risk of structured securities and the normal risks of price changes in response to changes in interest rates, the principal amount of structured notes or indexed securities may decrease as a result of changes in the value of the underlying reference instruments. Changes in the daily value of structured securities are recorded as unrealized gains (losses) in the Consolidated Statement of Operations. When the structured securities mature or are sold, the Fund recognizes a realized gain (loss) on the Consolidated Statement of Operations.
| J. | Foreign Currency Translations — Foreign currency is valued at the close of the NYSE based on quotations posted by banks and major currency dealers. Portfolio securities and other assets and liabilities denominated in foreign currencies are translated into U.S. dollar amounts at date of valuation. Purchases and sales of portfolio securities (net of foreign taxes withheld on disposition) and income items denominated in foreign currencies are translated into U.S. dollar amounts on the respective dates of such transactions. The Fund does not separately account for the portion of the results of operations resulting from changes in foreign exchange rates on investments and the fluctuations arising from changes in market prices of securities held. The combined results of changes in foreign exchange rates and the fluctuation of market prices on investments (net of estimated foreign tax withholding) are included with the net realized and unrealized gain or loss from investments in the Consolidated Statement of Operations. Reported net realized foreign currency gains or losses arise from (1) sales of foreign currencies, (2) currency gains or losses realized between the trade and settlement dates on securities transactions, and (3) the difference between the amounts of dividends, interest, and foreign withholding taxes recorded on the Fund’s books and the U.S. dollar equivalent of the amounts actually received or paid. Net unrealized foreign currency gains and losses arise from changes in the fair values of assets and liabilities, other than investments in securities at fiscal period end, resulting from changes in exchange rates. |
The Fund may invest in foreign securities, which may be subject to foreign taxes on income, gains on investments or currency repatriation, a portion of which may be recoverable. Foreign taxes, if any, are recorded based on the tax regulations and rates that exist in the foreign markets in which the Fund invests and are shown in the Consolidated Statement of Operations.
| K. | Forward Foreign Currency Contracts — The Fund may engage in foreign currency transactions either on a spot (i.e. for prompt delivery and settlement) basis, or through forward foreign currency contracts, to manage or minimize currency or exchange rate risk. |
The Fund may also enter into forward foreign currency contracts for the purchase or sale of a security denominated in a foreign currency in order to “lock in” the U.S. dollar price of that security, or the Fund may also enter into forward foreign currency contracts that do not provide for physical settlement of the two currencies, but instead are settled by a single cash payment calculated as the difference between the agreed upon exchange rate and the spot rate at settlement based upon an agreed upon notional amount (non-deliverable forwards). The Fund will set aside liquid assets in an amount equal to the daily mark-to-market obligation for forward foreign currency contracts.
A forward foreign currency contract is an obligation between two parties (“Counterparties”) to purchase or sell a specific currency for an agreed-upon price at a future date. The use of forward foreign currency contracts does not eliminate fluctuations in the price of the underlying securities the Fund owns or intends to acquire but establishes a rate of exchange in advance. Fluctuations in the value of these contracts are measured by the difference in the contract date and reporting date exchange rates and are recorded as unrealized appreciation (depreciation) until the contracts are closed. When the contracts are closed, realized gains (losses) are recorded. Realized and unrealized gains (losses) on the contracts are included in the Consolidated Statement of Operations. The primary risks associated with forward foreign currency contracts include failure of the Counterparty to meet the terms of the contract and the value of the foreign currency changing unfavorably. These risks may be in excess of the amounts reflected in the Consolidated Statement of Assets and Liabilities.
| L. | Futures Contracts — The Fund may enter into futures contracts to equitize the Fund’s cash holdings or to manage exposure to interest rate, equity and market price movements and/or currency risks. A futures contract is an agreement between Counterparties to purchase or sell a specified underlying security, currency or commodity (or delivery of a cash settlement price, in the case of an index future) for a fixed price at a future date. The Fund currently invests only in exchange-traded futures and they are standardized as to maturity date and underlying financial instrument. Initial margin deposits required upon entering into futures contracts are satisfied by the segregation of specific securities or cash as collateral at the futures commission merchant (broker). During the period the futures contracts are open, changes in the value of the contracts are recognized as unrealized gains or losses by recalculating the value of the contracts on a daily basis. Subsequent or variation margin payments are received or made depending upon whether unrealized gains or losses are incurred. These amounts are reflected as receivables or payables on the Consolidated Statement of Assets and Liabilities. When the contracts are closed or expire, the Fund recognizes a realized gain or loss equal to the difference between the proceeds from, or cost of, the closing transaction and the Fund’s basis in the contract. The net realized gain (loss) and the change in unrealized gain (loss) on futures contracts held during the period is included on the Consolidated Statement of Operations. The primary risks associated with futures contracts are market risk and the absence of a liquid secondary market. If the Fund were unable to liquidate a futures contract and/or enter into an offsetting closing transaction, the Fund would continue to be subject to market risk with respect to the value of the contracts and continue to be required to maintain the margin deposits on the futures contracts. Futures contracts have minimal Counterparty risk since the exchange’s clearinghouse, as Counterparty to all exchange-traded futures, guarantees the futures against default. Risks may exceed amounts recognized in the Consolidated Statement of Assets and Liabilities. |
| M. | Swap Agreements — The Fund may enter into various swap transactions, including interest rate, total return, index, currency and credit default swap contracts (“CDS”) for investment purposes or to manage interest rate, currency or credit risk. Such transactions are agreements between Counterparties. These agreements may contain among other conditions, events of default and termination events, and various covenants and representations such as provisions that require the Fund to maintain a pre-determined level of net assets, and/or provide limits regarding the decline of the Fund’s NAV over specific periods of time. If the Fund were to trigger such provisions and have open derivative positions at that time, the Counterparty may be able to terminate such agreement and request immediate payment in an amount equal to the net liability positions, if any. |
20 Invesco Balanced-Risk Allocation Fund
Interest rate, total return, index, and currency swap agreements are two-party contracts entered into primarily to exchange the returns (or differentials in rates of returns) earned or realized on particular predetermined investments or instruments. The gross returns to be exchanged or “swapped” between the parties are calculated with respect to a notional amount, i.e., the return on or increase in value of a particular dollar amount invested at a particular interest rate or return of an underlying asset, in a particular foreign currency, or in a “basket” of securities representing a particular index. At the maturity date, a net cash flow is exchanged where the total return is equivalent to the return of the underlying reference less a financing rate, if any. As a receiver, the Fund would receive payments based on any positive total return and would owe payments in the event of a negative total return. As the payer, the Fund would owe payments on any net positive total return, and would receive payment in the event of a negative total return.
Changes in the value of swap agreements are recognized as unrealized gains (losses) in the Consolidated Statement of Operations by “marking to market” on a daily basis to reflect the value of the swap agreement at the end of each trading day. Payments received or paid at the beginning of the agreement are reflected as such on the Consolidated Statement of Assets and Liabilities and may be referred to as upfront payments. The Fund accrues for the fixed payment stream and amortizes upfront payments, if any, on swap agreements on a daily basis with the net amount, recorded as a component of realized gain (loss) on the Consolidated Statement of Operations. A liquidation payment received or made at the termination of a swap agreement is recorded as realized gain (loss) on the Consolidated Statement of Operations. The Fund segregates cash or liquid securities having a value at least equal to the amount of the potential obligation of a Fund under any swap transaction. Cash held as collateral is recorded as deposits with brokers on the Consolidated Statement of Assets and Liabilities. Entering into these agreements involves, to varying degrees, lack of liquidity and elements of credit, market, and Counterparty risk in excess of amounts recognized on the Consolidated Statement of Assets and Liabilities. Such risks involve the possibility that a swap is difficult to sell or liquidate; the Counterparty does not honor its obligations under the agreement and unfavorable interest rates and market fluctuations. It is possible that developments in the swaps market, including potential government regulation, could adversely affect the Fund’s ability to terminate existing swap agreements or to realize amounts to be received under such agreements. A short position in a security poses more risk than holding the same security long. As there is no limit on how much the price of the security can increase, the Fund’s exposure is unlimited.
| N. | Other Risks — The Fund will seek to gain exposure to commodity markets primarily through an investment in the Subsidiary and through investments in exchange-traded funds and commodity-linked derivatives. The Subsidiary, unlike the Fund, may invest without limitation in commodities, commodity-linked derivatives and other securities, such as exchange-traded and commodity-linked notes, that may provide leveraged and non-leveraged exposure to commodity markets. The Fund is indirectly exposed to the risks associated with the Subsidiary’s investments. |
| O. | Leverage Risk — Leverage exists when the Fund can lose more than it originally invests because it purchases or sells an instrument or enters into a transaction without investing an amount equal to the full economic exposure of the instrument or transaction. |
| P. | Collateral — To the extent the Fund has designated or segregated a security as collateral and that security is subsequently sold, it is the Fund’s practice to replace such collateral no later than the next business day. |
NOTE 2—Advisory Fees and Other Fees Paid to Affiliates
The Trust has entered into a master investment advisory agreement with Invesco Advisers, Inc. (the “Adviser” or “Invesco”). Under the terms of the investment advisory agreement, the Fund accrues daily and pays monthly an advisory fee to the Adviser less the amount paid by the Subsidiary to the Adviser based on the annual rate of the Fund’s average daily net assets as follows:
| | | | | | | | |
| Average Daily Net Assets | | Rate | |
First $250 million | | | 0 | .95% | | | | |
Next $250 million | | | 0 | .925% | | | | |
Next $500 million | | | 0 | .90% | | | | |
Next $1.5 billion | | | 0 | .875% | | | | |
Next $2.5 billion | | | 0 | .85% | | | | |
Next $2.5 billion | | | 0 | .825% | | | | |
Next $2.5 billion | | | 0 | .80% | | | | |
Over $10 billion | | | 0 | .775% | | | | |
For the year ended October 31, 2017, the effective advisory fees incurred by the Fund was 0.87%.
The Subsidiary has entered into a separate contract with the Adviser whereby the Adviser provides investment advisory and other services to the Subsidiary. In consideration of these services, the Subsidiary pays an advisory fee to the Adviser based on the annual rate of the Subsidiary’s average daily net assets as set forth in the table above.
Under the terms of a master sub-advisory agreement between the Adviser and each of Invesco Asset Management Deutschland GmbH, Invesco Asset Management Limited, Invesco Asset Management (Japan) Limited, Invesco Hong Kong Limited, Invesco Senior Secured Management, Inc. and Invesco Canada Ltd. and separate sub-advisory agreements with Invesco PowerShares Capital Management LLC and Invesco Asset Management (India) Private Limited (collectively, the “Affiliated Sub-Advisers”) the Adviser, not the Fund, will pay 40% of the fees paid to the Adviser to any such Affiliated Sub-Adviser(s) that provide(s) discretionary investment management services to the Fund based on the percentage of assets allocated to such Affiliated Sub-Adviser(s).
The Adviser has contractually agreed, through at least June 30, 2018, to waive advisory fees and/or reimburse expenses to the extent necessary to limit total annual fund operating expenses after fee waiver and/or expense reimbursement (excluding certain items discussed below) of Class A, Class B, Class C, Class R, Class Y, Class R5 and Class R6 shares to 2.00%, 2.75%, 2.75%, 2.25%, 1.75%, 1.75% and 1.75%, respectively, of the Fund’s average daily net assets (the “expense limits”). In determining the Adviser’s obligation to waive advisory fees and/or reimburse expenses, the following expenses are not taken into account, and could cause the total annual fund operating expenses after fee waiver and/or expense reimbursement to exceed the numbers reflected above: (1) interest; (2) taxes; (3) dividend expense on short sales; (4) extraordinary or non-routine items, including litigation expenses; and (5) expenses that the Fund has incurred but did not actually pay because of an expense offset arrangement.
21 Invesco Balanced-Risk Allocation Fund
Acquired Fund Fees and Expenses are not operating expenses of the Fund directly, but are fees and expenses, including management fees of the investment companies in which the Fund invests. As a result, the total annual fund operating expenses after expense reimbursement may exceed the expense limits above. Unless Invesco continues the fee waiver agreement, it will terminate on June 30, 2018. During its term, the fee waiver agreement cannot be terminated or amended to increase the expense limits or reduce the advisory fee waiver without approval of the Board of Trustees. The Adviser did not waive fees and/or reimburse expenses during the period under these expense limits
Further, the Adviser has contractually agreed, through at least June 30, 2019, to waive the advisory fee payable by the Fund in an amount equal to 100% of the net advisory fees the Adviser receives from the affiliated money market funds on investments by the Fund of uninvested cash in such affiliated money market funds.
For the year ended October 31, 2017, the Adviser waived advisory fees of $3,045,950.
The Trust has entered into a master administrative services agreement with Invesco pursuant to which the Fund has agreed to pay Invesco for certain administrative costs incurred in providing accounting services to the Fund. For the year ended October 31, 2017, expenses incurred under the agreement are shown in the Consolidated Statement of Operations as Administrative services fees.
The Trust has entered into a transfer agency and service agreement with Invesco Investment Services, Inc. (“IIS”) pursuant to which the Fund has agreed to pay IIS a fee for providing transfer agency and shareholder services to the Fund and reimburse IIS for certain expenses incurred by IIS in the course of providing such services. IIS may make payments to intermediaries that provide omnibus account services, sub-accounting services and/or networking services. All fees payable by IIS to intermediaries that provide omnibus account services or sub-accounting services are charged back to the Fund, subject to certain limitations approved by the Trust’s Board of Trustees. For the year ended October 31, 2017, expenses incurred under the agreement are shown in the Consolidated Statement of Operations as Transfer agent fees.
The Trust has entered into master distribution agreements with Invesco Distributors, Inc. (“IDI”) to serve as the distributor for the Class A, Class B, Class C, Class R, Class Y, Class R5 and Class R6 shares of the Fund. The Trust has adopted plans pursuant to Rule 12b-1 under the 1940 Act with respect to the Fund’s Class A, Class B, Class C and Class R shares (collectively, the “Plans”). The Fund, pursuant to the Plans, pays IDI compensation at the annual rate of 0.25% of the Fund’s average daily net assets of Class A shares, 1.00% of the average daily net assets of Class B and Class C shares and 0.50% of the average daily net assets of Class R shares. The fees are accrued daily and paid monthly. Of the Plan payments, up to 0.25% of the average daily net assets of each class of shares may be paid to furnish continuing personal shareholder services to customers who purchase and own shares of such classes. Any amounts not paid as a service fee under the Plans would constitute an asset-based sales charge. Rules of the Financial Industry Regulatory Authority (“FINRA”) impose a cap on the total sales charges, including asset-based sales charges, that may be paid by any class of shares of the Fund. For the year ended October 31, 2017, expenses incurred under the Plans are shown in the Consolidated Statement of Operations as Distribution fees.
Front-end sales commissions and CDSC (collectively, the “sales charges”) are not recorded as expenses of the Fund. Front-end sales commissions are deducted from proceeds from the sales of Fund shares prior to investment in Class A shares of the Fund. CDSC are deducted from redemption proceeds prior to remittance to the shareholder. During the year ended October 31, 2017, IDI advised the Fund that IDI retained $287,069 in front-end sales commissions from the sale of Class A shares and $3,410, $5 and $61,915 from Class A, Class B and Class C shares, respectively, for CDSC imposed on redemptions by shareholders.
Certain officers and trustees of the Trust are officers and directors of the Adviser, IIS and/or IDI.
NOTE 3—Additional Valuation Information
GAAP defines fair value as the price that would be received to sell an asset or paid to transfer a liability in an orderly transaction between market participants at the measurement date, under current market conditions. GAAP establishes a hierarchy that prioritizes the inputs to valuation methods, giving the highest priority to readily available unadjusted quoted prices in an active market for identical assets (Level 1) and the lowest priority to significant unobservable inputs (Level 3), generally when market prices are not readily available or are unreliable. Based on the valuation inputs, the securities or other investments are tiered into one of three levels. Changes in valuation methods may result in transfers in or out of an investment’s assigned level:
| | Level 1 — | Prices are determined using quoted prices in an active market for identical assets. |
| | Level 2 — | Prices are determined using other significant observable inputs. Observable inputs are inputs that other market participants may use in pricing a security. These may include quoted prices for similar securities, interest rates, prepayment speeds, credit risk, yield curves, loss severities, default rates, discount rates, volatilities and others. |
| | Level 3 — | Prices are determined using significant unobservable inputs. In situations where quoted prices or observable inputs are unavailable (for example, when there is little or no market activity for an investment at the end of the period), unobservable inputs may be used. Unobservable inputs reflect the Fund’s own assumptions about the factors market participants would use in determining fair value of the securities or instruments and would be based on the best available information. |
The following is a summary of the tiered valuation input levels, as of October 31, 2017. The level assigned to the securities valuations may not be an indication of the risk or liquidity associated with investing in those securities. Because of the inherent uncertainties of valuation, the values reflected in the financial statements may materially differ from the value received upon actual sale of those investments.
22 Invesco Balanced-Risk Allocation Fund
The Fund’s policy is to recognize transfers in and out of the valuation levels as of the end of the reporting period. During the year ended October 31, 2017, there were no material transfers between valuation levels.
| | | | | | | | | | | | | | | | |
| | | Level 1 | | | Level 2 | | | Level 3 | | | Total | |
U.S. Treasury Securities | | $ | — | | | $ | 1,630,644,816 | | | $ | — | | | $ | 1,630,644,816 | |
Commodity-Linked Securities | | | — | | | | 165,561,961 | | | | — | | | | 165,561,961 | |
Money Market Funds | | | 2,977,875,009 | | | | — | | | | — | | | | 2,977,875,009 | |
| | | | 2,977,875,009 | | | | 1,796,206,777 | | | | — | | | | 4,774,081,786 | |
Futures Contracts* | | | 97,385,395 | | | | — | | | | — | | | | 97,385,395 | |
Swap Agreements* | | | — | | | | 272,311 | | | | — | | | | 272,311 | |
Total Investments | | $ | 3,075,260,404 | | | $ | 1,796,479,088 | | | $ | — | | | $ | 4,871,739,492 | |
| * | Unrealized appreciation. |
NOTE 4—Derivative Investments
The Fund may enter into an International Swaps and Derivatives Association Master Agreement (“ISDA Master Agreement”) under which a fund may trade OTC derivatives. An OTC transaction entered into under an ISDA Master Agreement typically involves a collateral posting arrangement, payment netting provisions and close-out netting provisions. These netting provisions allow for reduction of credit risk through netting of contractual obligations. The enforceability of the netting provisions of the ISDA Master Agreement depends on the governing law of the ISDA Master Agreement, among other factors.
For financial reporting purposes, the Fund does not offset OTC derivative assets or liabilities that are subject to ISDA Master Agreements in the Consolidated Statement of Assets and Liabilities.
Value of Derivative Investments at Period-End
The table below summarizes the value of the Fund’s derivative investments, detailed by primary risk exposure, held as of October 31, 2017:
| | | | | | | | | | | | | | | | |
| | | Value | |
| Derivative Assets | | Commodity
Risk | | | Equity
Risk | | | Interest Rate
Risk | | | Total | |
Unrealized appreciation on futures contracts — Exchange-Traded(a) | | $ | 27,683,141 | | | $ | 94,648,941 | | | $ | 1,330,970 | | | $ | 123,663,052 | |
Unrealized appreciation on swap agreements — OTC | | | 4,034,496 | | | | — | | | | — | | | | 4,034,496 | |
Total Derivative Assets | | | 31,717,637 | | | | 94,648,941 | | | | 1,330,970 | | | | 127,697,548 | |
Derivatives not subject to master netting agreements | | | (27,683,141 | ) | | | (94,648,941 | ) | | | (1,330,970 | ) | | | (123,663,052 | ) |
Total Derivative Assets subject to master netting agreements | | $ | 4,034,496 | | | $ | — | | | $ | — | | | $ | 4,034,496 | |
| | | | | | | | | | | | | | | | |
| | | Value | |
| Derivative Liabilities | | Commodity
Risk | | | Equity
Risk | | | Interest Rate
Risk | | | Total | |
Unrealized depreciation on futures contracts — Exchange-Traded(a) | | $ | (3,830,435 | ) | | $ | (148,892 | ) | | $ | (22,298,330 | ) | | $ | (26,277,657 | ) |
Unrealized depreciation on swap agreements — OTC | | | (3,660,226 | ) | | | (101,959 | ) | | | — | | | | (3,762,185 | ) |
Total Derivative Liabilities | | | (7,490,661 | ) | | | (250,851 | ) | | | (22,298,330 | ) | | | (30,039,842 | ) |
Derivatives not subject to master netting agreements | | | 3,830,435 | | | | 148,892 | | | | 22,298,330 | | | | 26,277,657 | |
Total Derivative Liabilities subject to master netting agreements | | $ | (3,660,226 | ) | | $ | (101,959 | ) | | $ | — | | | $ | (3,762,185 | ) |
| (a) | The daily variation margin receivable at period-end is recorded in the Consolidated Statement of Assets and Liabilities. |
23 Invesco Balanced-Risk Allocation Fund
Offsetting Assets and Liabilities
The table below reflects the Fund’s exposure to Counterparties subject to either an ISDA Master Agreement or other agreement for OTC derivative transactions as of October 31, 2017.
| | | | | | | | | | | | | | | | | | | | | | | | |
| | | Financial
Derivative
Assets | | | Financial
Derivative
Liabilities | | | | | | Collateral
(Received)/Pledged | | | | |
| Counterparty | | Swap
Agreements | | | Swap
Agreements | | | Net Value of
Derivatives | | | Non-Cash | | | Cash | | | Net Amount(a) | |
Parent | | | | | | | | | | | | | | | | | |
Goldman Sachs International | | $ | 2,229,133 | | | $ | (719,695 | ) | | $ | 1,509,438 | | | $ | — | | | $ | (1,509,438 | ) | | $ | — | |
| | | | | | |
Subsidiary | | | | | | | | | | | | | | | | | | | | | | | | |
Barclays Bank PLC | | | — | | | | (2,563,004 | ) | | | (2,563,004 | ) | | | — | | | | 2,563,004 | | | | — | |
Canadian Imperial Bank of Commerce | | | 361,440 | | | | (47,579 | ) | | | 313,861 | | | | — | | | | (313,861 | ) | | | — | |
Cargill, Inc. | | | 560,502 | | | | (576,959 | ) | | | (16,457 | ) | | | — | | | | 16,457 | | | | — | |
Goldman Sachs International | | | 352,582 | | | | (48,808 | ) | | | 303,774 | | | | — | | | | (303,774 | ) | | | — | |
J.P. Morgan Chase Bank, N.A. | | | 2,700,195 | | | | (564,837 | ) | | | 2,135,358 | | | | — | | | | — | | | | 2,135,358 | |
Macquarie Bank Ltd. | | | — | | | | (549,471 | ) | | | (549,471 | ) | | | — | | | | 549,471 | | | | — | |
Merrill Lynch International | | | 267,631 | | | | (3,237,935 | ) | | | (2,970,304 | ) | | | — | | | | 2,970,304 | | | | — | |
Morgan Stanley Capital Services LLC | | | 670,311 | | | | (14,627 | ) | | | 655,684 | | | | — | | | | (655,684 | ) | | | — | |
Subtotal — Subsidiary | | $ | 4,912,661 | | | $ | (7,603,220 | ) | | $ | (2,690,559 | ) | | $ | — | | | $ | 4,825,917 | | | $ | 2,135,358 | |
Total | | $ | 7,141,794 | | | $ | (8,322,915 | ) | | $ | (1,181,121 | ) | | $ | — | | | $ | 3,316,479 | | | $ | 2,135,358 | |
| (a) | The Fund and the Subsidiary are recognized as separate legal entities and as such are subject to separate netting arrangements with the Counterparty. |
Effect of Derivative Investments for the year ended October 31, 2017
The table below summarizes the gains (losses) on derivative investments, detailed by primary risk exposure, recognized in earnings during the period:
| | | | | | | | | | | | | | | | |
| | | Location of Gain (Loss) on
Consolidated Statement of Operations | |
| | | Commodity
Risk | | | Equity
Risk | | | Interest Rate
Risk | | | Total | |
Realized Gain (Loss): | | | | | | | | | | | | | | | | |
Futures contracts | | $ | (22,923,979 | ) | | $ | 358,154,308 | | | $ | (125,240,592 | ) | | $ | 209,989,737 | |
Swap agreements | | | 44,614,876 | | | | 17,142,187 | | | | (3,139,752 | ) | | | 58,617,311 | |
Change in Net Unrealized Appreciation (Depreciation): | | | | | | | | | | | | | | | | |
Futures contracts | | | 47,611,081 | | | | 76,666,192 | | | | 68,207,657 | | | | 192,484,930 | |
Swap agreements | | | (8,300,285 | ) | | | 1,561,370 | | | | 269,449 | | | | (6,469,466 | ) |
Total | | $ | 61,001,693 | | | $ | 453,524,057 | | | $ | (59,903,238 | ) | | $ | 454,622,512 | |
The table below summarizes the average notional value of futures contracts and swap agreements outstanding during the period.
| | | | | | | | |
| | | Futures Contracts | | | Swap Agreements | |
Average notional value | | $ | 5,811,749,924 | | | $ | 1,017,416,903 | |
NOTE 5—Expense Offset Arrangement(s)
The expense offset arrangement is comprised of transfer agency credits which result from balances in demand deposit accounts used by the transfer agent for clearing shareholder transactions. For the year ended October 31, 2017, the Fund received credits from this arrangement, which resulted in the reduction of the Fund’s total expenses of $25,014.
NOTE 6—Trustees’ and Officers’ Fees and Benefits
Trustees’ and Officers’ Fees and Benefits include amounts accrued by the Fund to pay remuneration to certain Trustees and Officers of the Fund. Trustees have the option to defer compensation payable by the Fund, and Trustees’ and Officers’ Fees and Benefits also include amounts accrued by the Fund to fund such deferred compensation amounts. Those Trustees who defer compensation have the option to select various Invesco Funds in which their deferral accounts shall be deemed to be invested. Finally, certain current Trustees were eligible to participate in a retirement plan that provided for benefits to be paid upon retirement to Trustees over a period of time based on the number of years of service. The Fund may have certain former Trustees who also participate in a retirement plan and receive benefits under such plan. Trustees’ and Officers’ Fees and Benefits include amounts accrued by the Fund to fund such retirement benefits. Obligations under the deferred compensation and retirement plans represent unsecured claims against the general assets of the Fund.
24 Invesco Balanced-Risk Allocation Fund
NOTE 7—Cash Balances
The Fund is permitted to temporarily carry a negative or overdrawn balance in its account with State Street Bank and Trust Company, the custodian bank. Such balances, if any at period-end, are shown in the Consolidated Statement of Assets and Liabilities under the payable caption Amount due custodian. To compensate the custodian bank for such overdrafts, the overdrawn Fund may either (1) leave funds as a compensating balance in the account so the custodian bank can be compensated by earning the additional interest; or (2) compensate by paying the custodian bank at a rate agreed upon by the custodian bank and Invesco, not to exceed the contractually agreed upon rate.
NOTE 8—Distributions to Shareholders and Tax Components of Net Assets
Tax Character of Distributions to Shareholders Paid During the Fiscal Years Ended October 31, 2017 and 2016:
| | | | | | | | |
| | | 2017 | | | 2016 | |
Ordinary income | | $ | 276,778,756 | | | $ | 304,855,039 | |
Long-term capital gain | | | 128,250,181 | | | | 111,430,320 | |
Total distributions | | $ | 405,028,937 | | | $ | 416,285,359 | |
Tax Components of Net Assets at Period-End:
| | | | |
| | | 2017 | |
Undistributed ordinary income | | $ | 150,471,658 | |
Undistributed long-term gain | | | 151,700,940 | |
Net unrealized appreciation — investments | | | 36,930,443 | |
Temporary book/tax differences | | | (676,623 | ) |
Shares of beneficial interest | | | 4,665,229,938 | |
Total net assets | | $ | 5,003,656,356 | |
The difference between book-basis and tax-basis unrealized appreciation (depreciation) is due to differences in the timing of recognition of gains and losses on investments for tax and book purposes. The Fund’s net unrealized appreciation difference is attributable primarily to futures contracts and swap agreements.
The temporary book/tax differences are a result of timing differences between book and tax recognition of income and/or expenses. The Fund’s temporary book/tax differences are the result of the trustee deferral of compensation and retirement plan benefits.
Capital loss carryforward is calculated and reported as of a specific date. Results of transactions and other activity after that date may affect the amount of capital loss carryforward actually available for the Fund to utilize. Capital losses generated in years beginning after December 22, 2010 can be carried forward for an unlimited period, whereas previous losses expire in eight tax years. Capital losses with an expiration period may not be used to offset capital gains until all net capital losses without an expiration date have been utilized. Capital loss carryforwards with no expiration date will retain their character as either short-term or long-term capital losses instead of as short-term capital losses as under prior law. The ability to utilize capital loss carryforwards in the future may be limited under the Internal Revenue Code and related regulations based on the results of future transactions.
The Fund does not have a capital loss carryforward as of October 31, 2017.
NOTE 9—Investment Transactions
The aggregate amount of investment securities (other than short-term securities, U.S. Treasury obligations and money market funds, if any) purchased and sold by the Fund during the year ended October 31, 2017 was $167,200,000 and $214,127,570, respectively. During the same period, purchases and sales of U.S. Treasury obligations were $0 and $326,186,405, respectively. Cost of investments, including any derivatives, on a tax basis includes the adjustments for financial reporting purposes as of the most recently completed federal income tax reporting period-end.
| | | | |
| Unrealized Appreciation (Depreciation) of Investments on a Tax Basis | |
Aggregate unrealized appreciation of investments | | $ | 72,172,341 | |
Aggregate unrealized (depreciation) of investments | | | (35,241,898 | ) |
Net unrealized appreciation of investments | | $ | 36,930,443 | |
Cost of investments for tax purposes is $4,834,809,049.
NOTE 10—Reclassification of Permanent Differences
Primarily as a result of differing book/tax treatment of income and distributions from the subsidiary, futures contracts, net operating losses and swap income, on October 31, 2017, undistributed net investment income (loss) was increased by $35,298,809, undistributed net realized gain was decreased by $35,298,857 and shares of beneficial interest was increased by $48. This reclassification had no effect on the net assets of the Fund.
25 Invesco Balanced-Risk Allocation Fund
NOTE 11—Share Information
| | | | | | | | | | | | | | | | |
| | | Summary of Share Activity | |
| | | Years ended October 31, | |
| | | 2017(a) | | | 2016 | |
| | | Shares | | | Amount | | | Shares | | | Amount | |
Sold: | | | | | | | | | | | | | | | | |
Class A | | | 18,344,979 | | | $ | 199,052,527 | | | | 22,578,985 | | | $ | 245,970,130 | |
Class B | | | 17,226 | | | | 180,479 | | | | 23,520 | | | | 246,424 | |
Class C | | | 7,991,905 | | | | 83,300,692 | | | | 9,157,449 | | | | 95,744,113 | |
Class R | | | 613,374 | | | | 6,597,183 | | | | 854,075 | | | | 9,171,029 | |
Class Y | | | 91,480,150 | | | | 1,002,638,508 | | | | 45,959,002 | | | | 505,120,404 | |
Class R5 | | | 367,417 | | | | 4,048,073 | | | | 713,325 | | | | 7,891,295 | |
Class R6 | | | 5,656,103 | | | | 62,767,897 | | | | 1,685,506 | | | | 18,696,169 | |
| | | | |
Issued as reinvestment of dividends: | | | | | | | | | | | | | | | | |
Class A | | | 12,977,593 | | | | 136,394,509 | | | | 12,003,891 | | | | 123,039,883 | |
Class B | | | 57,085 | | | | 579,412 | | | | 68,184 | | | | 676,382 | |
Class C | | | 7,791,943 | | | | 79,088,220 | | | | 6,816,812 | | | | 67,622,773 | |
Class R | | | 164,218 | | | | 1,702,944 | | | | 117,113 | | | | 1,186,352 | |
Class Y | | | 10,355,586 | | | | 109,976,321 | | | | 8,632,272 | | | | 89,344,012 | |
Class R5 | | | 1,071,434 | | | | 11,378,630 | | | | 972,969 | | | | 10,070,231 | |
Class R6 | | | 2,159,386 | | | | 22,932,683 | | | | 2,695,857 | | | | 27,902,119 | |
| | | | |
Automatic conversion of Class B shares to Class A shares: | | | | | | | | | | | | | | | | |
Class A | | | 254,966 | | | | 2,780,044 | | | | 285,285 | | | | 3,100,212 | |
Class B | | | (264,857 | ) | | | (2,780,044 | ) | | | (295,706 | ) | | | (3,100,212 | ) |
| | | | |
Reacquired: | | | | | | | | | | | | | | | | |
Class A | | | (77,488,915 | ) | | | (840,516,626 | ) | | | (80,825,479 | ) | | | (866,566,184 | ) |
Class B | | | (135,528 | ) | | | (1,424,313 | ) | | | (238,135 | ) | | | (2,476,421 | ) |
Class C | | | (35,969,659 | ) | | | (376,461,092 | ) | | | (44,870,865 | ) | | | (465,414,377 | ) |
Class R | | | (1,109,646 | ) | | | (11,915,705 | ) | | | (833,996 | ) | | | (8,965,589 | ) |
Class Y | | | (66,911,066 | ) | | | (736,405,730 | ) | | | (129,540,888 | ) | | | (1,399,291,498 | ) |
Class R5 | | | (3,647,987 | ) | | | (39,534,087 | ) | | | (2,976,458 | ) | | | (31,920,055 | ) |
Class R6 | | | (4,816,169 | ) | | | (53,138,625 | ) | | | (16,039,347 | ) | | | (167,574,526 | ) |
Net increase (decrease) in share activity | | | (31,040,462 | ) | | $ | (338,758,100 | ) | | | (163,056,629 | ) | | $ | (1,739,527,334 | ) |
| (a) | There are entities that are record owners of more than 5% of the outstanding shares of the Fund and in the aggregate own 49% of the outstanding shares of the Fund. IDI has an agreement with these entities to sell Fund shares. The Fund, Invesco and/or Invesco affiliates may make payments to these entities, which are considered to be related to the Fund, for providing services to the Fund, Invesco and/or Invesco affiliates including but not limited to services such as securities brokerage, distribution, third party record keeping and account servicing. The Fund has no knowledge as to whether all or any portion of the shares owned of record by these entities are also owned beneficially. |
26 Invesco Balanced-Risk Allocation Fund
NOTE 12—Financial Highlights
The following schedule presents financial highlights for a share of the Fund outstanding throughout the periods indicated.
| | | | | | | | | | | | | | | | | | | | | | | | | | | | | | | | | | | | | | | | | | | | | | | | | | | | | | | | |
| | | Net asset
value,
beginning
of period | | | Net
investment
income
(loss)(a) | | | Net gains
(losses) on
securities
(both
realized and
unrealized) | | | Total from
investment
operations | | | Dividends
from net
investment
income | | | Distributions
from net
realized
gains | | | Total
distributions | | | Net asset
value, end
of period | | | Total
return(b) | | | Net assets,
end of period
(000’s omitted) | | | Ratio of
expenses
to average
net assets
with fee waivers
and/or expenses
absorbed | | | Ratio of
expenses
to average net
assets without
fee waivers
and/or expenses
absorbed | | | Ratio of net
investment
income (loss)
to average
net assets | | | Portfolio
turnover(c) | |
Class A | | | | | | | | | | | | | | | | | | | | | | | | | | | | | | | | | | | | | | | | | | | | | | | | | | | | | | | | |
Year ended 10/31/17 | | $ | 11.34 | | | $ | (0.05 | ) | | $ | 0.87 | | | $ | 0.82 | | | $ | (0.41 | ) | | $ | (0.47 | ) | | $ | (0.88 | ) | | $ | 11.28 | | | | 7.76 | % | | $ | 1,337,537 | | | | 1.22 | %(d) | | | 1.28 | %(d) | | | (0.49 | )%(d) | | | 12 | % |
Year ended 10/31/16 | | | 11.27 | | | | (0.10 | ) | | | 0.88 | | | | 0.78 | | | | (0.29 | ) | | | (0.42 | ) | | | (0.71 | ) | | | 11.34 | | | | 7.59 | | | | 1,864,271 | | | | 1.20 | | | | 1.27 | | | | (0.89 | ) | | | 96 | |
Year ended 10/31/15 | | | 12.36 | | | | (0.14 | ) | | | (0.05 | ) | | | (0.19 | ) | | | (0.24 | ) | | | (0.66 | ) | | | (0.90 | ) | | | 11.27 | | | | (1.64 | ) | | | 2,371,657 | | | | 1.21 | | | | 1.26 | | | | (1.16 | ) | | | 10 | |
Year ended 10/31/14 | | | 12.88 | | | | (0.14 | ) | | | 0.53 | | | | 0.39 | | | | — | | | | (0.91 | ) | | | (0.91 | ) | | | 12.36 | | | | 3.52 | | | | 2,938,957 | | | | 1.20 | | | | 1.24 | | | | (1.16 | ) | | | 72 | |
Year ended 10/31/13 | | | 12.88 | | | | (0.14 | ) | | | 0.78 | | | | 0.64 | | | | (0.29 | ) | | | (0.35 | ) | | | (0.64 | ) | | | 12.88 | | | | 5.15 | | | | 4,229,859 | | | | 1.14 | | | | 1.21 | | | | (1.07 | ) | | | 0 | |
Class B | | | | | | | | | | | | | | | | | | | | | | | | | | | | | | | | | | | | | | | | | | | | | | | | | | | | | | | | |
Year ended 10/31/17 | | | 10.90 | | | | (0.12 | ) | | | 0.84 | | | | 0.72 | | | | (0.32 | ) | | | (0.47 | ) | | | (0.79 | ) | | | 10.83 | | | | 7.05 | | | | 4,903 | | | | 1.97 | (d) | | | 2.03 | (d) | | | (1.24 | )(d) | | | 12 | |
Year ended 10/31/16 | | | 10.85 | | | | (0.17 | ) | | | 0.83 | | | | 0.66 | | | | (0.19 | ) | | | (0.42 | ) | | | (0.61 | ) | | | 10.90 | | | | 6.67 | | | | 8,491 | | | | 1.95 | | | | 2.02 | | | | (1.64 | ) | | | 96 | |
Year ended 10/31/15 | | | 11.92 | | | | (0.22 | ) | | | (0.05 | ) | | | (0.27 | ) | | | (0.14 | ) | | | (0.66 | ) | | | (0.80 | ) | | | 10.85 | | | | (2.40 | ) | | | 13,242 | | | | 1.96 | | | | 2.01 | | | | (1.91 | ) | | | 10 | |
Year ended 10/31/14 | | | 12.53 | | | | (0.23 | ) | | | 0.53 | | | | 0.30 | | | | — | | | | (0.91 | ) | | | (0.91 | ) | | | 11.92 | | | | 2.85 | | | | 20,853 | | | | 1.95 | | | | 1.99 | | | | (1.91 | ) | | | 72 | |
Year ended 10/31/13 | | | 12.59 | | | | (0.22 | ) | | | 0.75 | | | | 0.53 | | | | (0.24 | ) | | | (0.35 | ) | | | (0.59 | ) | | | 12.53 | | | | 4.34 | | | | 31,381 | | | | 1.89 | | | | 1.96 | | | | (1.82 | ) | | | 0 | |
Class C | | | | | | | | | | | | | | | | | | | | | | | | | | | | | | | | | | | | | | | | | | | | | | | | | | | | | | | | |
Year ended 10/31/17 | | | 10.90 | | | | (0.12 | ) | | | 0.84 | | | | 0.72 | | | | (0.32 | ) | | | (0.47 | ) | | | (0.79 | ) | | | 10.83 | | | | 7.05 | | | | 1,051,038 | | | | 1.97 | (d) | | | 2.03 | (d) | | | (1.24 | )(d) | | | 12 | |
Year ended 10/31/16 | | | 10.85 | | | | (0.17 | ) | | | 0.83 | | | | 0.66 | | | | (0.19 | ) | | | (0.42 | ) | | | (0.61 | ) | | | 10.90 | | | | 6.67 | | | | 1,278,218 | | | | 1.95 | | | | 2.02 | | | | (1.64 | ) | | | 96 | |
Year ended 10/31/15 | | | 11.91 | | | | (0.22 | ) | | | (0.04 | ) | | | (0.26 | ) | | | (0.14 | ) | | | (0.66 | ) | | | (0.80 | ) | | | 10.85 | | | | (2.32 | ) | | | 1,584,982 | | | | 1.96 | | | | 2.01 | | | | (1.91 | ) | | | 10 | |
Year ended 10/31/14 | | | 12.53 | | | | (0.23 | ) | | | 0.52 | | | | 0.29 | | | | — | | | | (0.91 | ) | | | (0.91 | ) | | | 11.91 | | | | 2.77 | | | | 1,930,318 | | | | 1.95 | | | | 1.99 | | | | (1.91 | ) | | | 72 | |
Year ended 10/31/13 | | | 12.59 | | | | (0.22 | ) | | | 0.75 | | | | 0.53 | | | | (0.24 | ) | | | (0.35 | ) | | | (0.59 | ) | | | 12.53 | | | | 4.34 | | | | 2,550,094 | | | | 1.89 | | | | 1.96 | | | | (1.82 | ) | | | 0 | |
Class R | | | | | | | | | | | | | | | | | | | | | | | | | | | | | | | | | | | | | | | | | | | | | | | | | | | | | | | | |
Year ended 10/31/17 | | | 11.18 | | | | (0.07 | ) | | | 0.85 | | | | 0.78 | | | | (0.38 | ) | | | (0.47 | ) | | | (0.85 | ) | | | 11.11 | | | | 7.48 | | | | 23,518 | | | | 1.47 | (d) | | | 1.53 | (d) | | | (0.74 | )(d) | | | 12 | |
Year ended 10/31/16 | | | 11.12 | | | | (0.12 | ) | | | 0.86 | | | | 0.74 | | | | (0.26 | ) | | | (0.42 | ) | | | (0.68 | ) | | | 11.18 | | | | 7.26 | | | | 27,359 | | | | 1.45 | | | | 1.52 | | | | (1.14 | ) | | | 96 | |
Year ended 10/31/15 | | | 12.20 | | | | (0.16 | ) | | | (0.05 | ) | | | (0.21 | ) | | | (0.21 | ) | | | (0.66 | ) | | | (0.87 | ) | | | 11.12 | | | | (1.86 | ) | | | 25,690 | | | | 1.46 | | | | 1.51 | | | | (1.41 | ) | | | 10 | |
Year ended 10/31/14 | | | 12.75 | | | | (0.17 | ) | | | 0.53 | | | | 0.36 | | | | — | | | | (0.91 | ) | | | (0.91 | ) | | | 12.20 | | | | 3.30 | | | | 28,166 | | | | 1.45 | | | | 1.49 | | | | (1.41 | ) | | | 72 | |
Year ended 10/31/13 | | | 12.77 | | | | (0.17 | ) | | | 0.77 | | | | 0.60 | | | | (0.27 | ) | | | (0.35 | ) | | | (0.62 | ) | | | 12.75 | | | | 4.89 | | | | 29,964 | | | | 1.39 | | | | 1.46 | | | | (1.32 | ) | | | 0 | |
Class Y | | | | | | | | | | | | | | | | | | | | | | | | | | | | | | | | | | | | | | | | | | | | | | | | | | | | | | | | |
Year ended 10/31/17 | | | 11.47 | | | | (0.02 | ) | | | 0.88 | | | | 0.86 | | | | (0.43 | ) | | | (0.47 | ) | | | (0.90 | ) | | | 11.43 | | | | 8.15 | | | | 2,147,497 | | | | 0.97 | (d) | | | 1.03 | (d) | | | (0.24 | )(d) | | | 12 | |
Year ended 10/31/16 | | | 11.41 | | | | (0.07 | ) | | | 0.87 | | | | 0.80 | | | | (0.32 | ) | | | (0.42 | ) | | | (0.74 | ) | | | 11.47 | | | | 7.75 | | | | 1,755,257 | | | | 0.95 | | | | 1.02 | | | | (0.64 | ) | | | 96 | |
Year ended 10/31/15 | | | 12.51 | | | | (0.11 | ) | | | (0.05 | ) | | | (0.16 | ) | | | (0.28 | ) | | | (0.66 | ) | | | (0.94 | ) | | | 11.41 | | | | (1.40 | ) | | | 2,600,015 | | | | 0.96 | | | | 1.01 | | | | (0.91 | ) | | | 10 | |
Year ended 10/31/14 | | | 12.99 | | | | (0.11 | ) | | | 0.54 | | | | 0.43 | | | | — | | | | (0.91 | ) | | | (0.91 | ) | | | 12.51 | | | | 3.81 | | | | 3,699,738 | | | | 0.95 | | | | 0.99 | | | | (0.91 | ) | | | 72 | |
Year ended 10/31/13 | | | 12.97 | | | | (0.10 | ) | | | 0.78 | | | | 0.68 | | | | (0.31 | ) | | | (0.35 | ) | | | (0.66 | ) | | | 12.99 | | | | 5.42 | | | | 4,846,950 | | | | 0.89 | | | | 0.96 | | | | (0.82 | ) | | | 0 | |
Class R5 | | | | | | | | | | | | | | | | | | | | | | | | | | | | | | | | | | | | | | | | | | | | | | | | | | | | | | | | |
Year ended 10/31/17 | | | 11.48 | | | | (0.01 | ) | | | 0.87 | | | | 0.86 | | | | (0.44 | ) | | | (0.47 | ) | | | (0.91 | ) | | | 11.43 | | | | 8.12 | | | | 119,103 | | | | 0.92 | (d) | | | 0.98 | (d) | | | (0.19 | )(d) | | | 12 | |
Year ended 10/31/16 | | | 11.41 | | | | (0.06 | ) | | | 0.88 | | | | 0.82 | | | | (0.33 | ) | | | (0.42 | ) | | | (0.75 | ) | | | 11.48 | | | | 7.88 | | | | 144,960 | | | | 0.89 | | | | 0.96 | | | | (0.58 | ) | | | 96 | |
Year ended 10/31/15 | | | 12.51 | | | | (0.10 | ) | | | (0.06 | ) | | | (0.16 | ) | | | (0.28 | ) | | | (0.66 | ) | | | (0.94 | ) | | | 11.41 | | | | (1.39 | ) | | | 158,826 | | | | 0.93 | | | | 0.98 | | | | (0.88 | ) | | | 10 | |
Year ended 10/31/14 | | | 12.99 | | | | (0.11 | ) | | | 0.54 | | | | 0.43 | | | | — | | | | (0.91 | ) | | | (0.91 | ) | | | 12.51 | | | | 3.81 | | | | 186,943 | | | | 0.93 | | | | 0.97 | | | | (0.89 | ) | | | 72 | |
Year ended 10/31/13 | | | 12.97 | | | | (0.10 | ) | | | 0.78 | | | | 0.68 | | | | (0.31 | ) | | | (0.35 | ) | | | (0.66 | ) | | | 12.99 | | | | 5.45 | | | | 206,573 | | | | 0.86 | | | | 0.93 | | | | (0.79 | ) | | | 0 | |
Class R6 | | | | | | | | | | | | | | | | | | | | | | | | | | | | | | | | | | | | | | | | | | | | | | | | | | | | | | | | |
Year ended 10/31/17 | | | 11.49 | | | | (0.00 | ) | | | 0.87 | | | | 0.87 | | | | (0.45 | ) | | | (0.47 | ) | | | (0.92 | ) | | | 11.44 | | | | 8.20 | | | | 320,060 | | | | 0.85 | (d) | | | 0.91 | (d) | | | (0.12 | )(d) | | | 12 | |
Year ended 10/31/16 | | | 11.43 | | | | (0.06 | ) | | | 0.88 | | | | 0.82 | | | | (0.34 | ) | | | (0.42 | ) | | | (0.76 | ) | | | 11.49 | | | | 7.93 | | | | 286,944 | | | | 0.82 | | | | 0.89 | | | | (0.51 | ) | | | 96 | |
Year ended 10/31/15 | | | 12.53 | | | | (0.09 | ) | | | (0.05 | ) | | | (0.14 | ) | | | (0.30 | ) | | | (0.66 | ) | | | (0.96 | ) | | | 11.43 | | | | (1.27 | ) | | | 418,615 | | | | 0.83 | | | | 0.88 | | | | (0.78 | ) | | | 10 | |
Year ended 10/31/14 | | | 12.99 | | | | (0.10 | ) | | | 0.55 | | | | 0.45 | | | | — | | | | (0.91 | ) | | | (0.91 | ) | | | 12.53 | | | | 3.97 | | | | 480,626 | | | | 0.83 | | | | 0.87 | | | | (0.79 | ) | | | 72 | |
Year ended 10/31/13 | | | 12.97 | | | | (0.09 | ) | | | 0.77 | | | | 0.68 | | | | (0.31 | ) | | | (0.35 | ) | | | (0.66 | ) | | | 12.99 | | | | 5.48 | | | | 521,099 | | | | 0.79 | | | | 0.86 | | | | (0.72 | ) | | | 0 | |
| (a) | Calculated using average shares outstanding. |
| (b) | Includes adjustments in accordance with accounting principles generally accepted in the United States of America and as such, the net asset value for financial reporting purposes and the returns based upon those net asset values may differ from the net asset value and returns for shareholder transactions. Does not include sales charges and is not annualized for periods less than one year, if applicable. |
| (c) | Portfolio turnover is calculated at the fund level and is not annualized for periods less than one year, if applicable. |
| (d) | Ratios are based on average daily net assets (000’s omitted) of $1,549,330, $6,807, $1,155,587, $25,791, $1,994,137, $125,508 and $287,517 for Class A, Class B, Class C, Class R, Class Y, Class R5 and Class R6 shares, respectively. |
Note 13—Subsequent Event
On December 1, 2017, the Fund’s Board of Trustees approved the early conversion of the remaining assets in the Fund’s Class B shares into Class A shares to occur on or about January 26, 2018. At the close of business on or about January 26, 2018, (the “Conversion Date”) all outstanding Class B shares of the Fund will be converted to Class A shares of the Fund, which is prior to the date the Class B shares would normally be converted to Class A shares. Once the conversion is completed, Class B shares will be closed and become inactive. No contingent deferred sales charges will be payable in connection with this early conversion. The conversion of the Fund’s Class B shares into Class A shares on the Conversion Date is not expected to be a taxable event for federal income tax purposes, and should not result in the recognition of gain or loss by converting shareholders, although each shareholder should consult with his or her own tax adviser.
27 Invesco Balanced-Risk Allocation Fund
Report of Independent Registered Public Accounting Firm
To the Board of Trustees of AIM Investment Funds (Invesco Investment Funds)
and Shareholders of Invesco Balanced-Risk Allocation Fund:
In our opinion, the accompanying consolidated statement of assets and liabilities, including the consolidated schedule of investments, and the related consolidated statements of operations and of changes in net assets and the financial highlights present fairly, in all material respects, the consolidated financial position of Invesco Balanced-Risk Allocation Fund and its subsidiary (one of the portfolios constituting the AIM Investment Funds (Invesco Investment Funds), hereafter referred to as the “Fund”) as of October 31, 2017, the results of their operations for the year then ended, the changes in their net assets for each of the two years in the period then ended and the financial highlights for each of the five years in the period then ended, in conformity with accounting principles generally accepted in the United States of America. These consolidated financial statements and financial highlights (hereafter referred to as “financial statements”) are the responsibility of the Fund’s management. Our responsibility is to express an opinion on these financial statements based on our audits. We conducted our audits of these financial statements in accordance with the standards of the Public Company Accounting Oversight Board (United States). Those standards require that we plan and perform the audit to obtain reasonable assurance about whether the financial statements are free of material misstatement. An audit includes examining, on a test basis, evidence supporting the amounts and disclosures in the financial statements, assessing the accounting principles used and significant estimates made by management, and evaluating the overall financial statement presentation. We believe that our audits, which included confirmation of securities as of October 31, 2017 by correspondence with the custodian, transfer agent and brokers, and when replies were not received from brokers, we performed other auditing procedures, provide a reasonable basis for our opinion.
PricewaterhouseCoopers LLP
Houston, Texas
December 21, 2017
28 Invesco Balanced-Risk Allocation Fund
Calculating your ongoing Fund expenses
Example
As a shareholder of the Fund, you incur two types of costs: (1) transaction costs, which may include sales charges (loads) on purchase payments or contingent deferred sales charges on redemptions, if any; and (2) ongoing costs, including distribution and/or service (12b-1) fees, and other Fund expenses. This example is intended to help you understand your ongoing costs (in dollars) of investing in the Fund and to compare these costs with ongoing costs of investing in other mutual funds. The example is based on an investment of $1,000 invested at the beginning of the period and held for the entire period May 1, 2017, through October 31, 2017.
In addition to the fees and expenses which the Fund bears directly, the Fund indirectly bears a pro rata share of the fees and expenses of the underlying funds in which the Fund invests. The amount of fees and expenses incurred indirectly by the Fund will vary because the underlying funds have varied expenses and fee levels and the Fund may own different proportions of the underlying funds at different times. Estimated underlying fund expenses are not expenses that are incurred directly by the Fund. They are expenses that are incurred directly by the underlying funds and are deducted from the value of the underlying funds the Fund invests in. The effect of the estimated underlying fund expenses that the Fund bears indirectly are included in the Fund’s total return.
Actual expenses
The table below provides information about actual account values and actual expenses. You may use the information in this table, together with the amount you invested, to estimate the expenses that you paid over the period. Simply divide your account value by $1,000 (for example, an $8,600 account value divided by $1,000 = 8.6), then multiply the result by the number in the table under the heading entitled “Actual Expenses Paid During Period” to estimate the expenses you paid on your account during this period.
Hypothetical example for comparison purposes
The table below also provides information about hypothetical account values and hypothetical expenses based on the Fund’s actual expense ratio and an assumed rate of return of 5% per year before expenses, which is not the Fund’s actual return.
The hypothetical account values and expenses may not be used to estimate the actual ending account balance or expenses you paid for the period. You may use this information to compare the ongoing costs of investing in the Fund and other funds. To do so, compare this 5% hypothetical example with the 5% hypothetical examples that appear in the shareholder reports of the other funds.
Please note that the expenses shown in the table are meant to highlight your ongoing costs only and do not reflect any transaction costs, such as sales charges (loads) on purchase payments or contingent deferred sales charges on redemptions, if any. Therefore, the hypothetical information is useful in comparing ongoing costs only, and will not help you determine the relative total costs of owning different funds. In addition, expenses shown in the table do not include the expenses of the underlying funds, which are borne indirectly by the Fund. If transaction costs and indirect expenses were included, your costs would have been higher.
| | | | | | | | | | | | | | | | | | | | | | | | |
| | | | | | ACTUAL | | | HYPOTHETICAL (5% annual return before
expenses) | | | Annualized
Expense
Ratio | |
| Class | | Beginning
Account Value
(05/01/17) | | | Ending
Account Value
(10/31/17)1 | | | Expenses
Paid During
Period2 | | | Ending
Account Value
(10/31/17) | | | Expenses
Paid During
Period2 | | |
| A | | $ | 1,000.00 | | | $ | 1,041.60 | | | $ | 6.33 | | | $ | 1,019.00 | | | $ | 6.26 | | | | 1.23 | % |
| B | | | 1,000.00 | | | | 1,037.40 | | | | 10.17 | | | | 1,015.22 | | | | 10.06 | | | | 1.98 | |
| C | | | 1,000.00 | | | | 1,037.40 | | | | 10.17 | | | | 1,015.22 | | | | 10.06 | | | | 1.98 | |
| R | | | 1,000.00 | | | | 1,041.20 | | | | 7.61 | | | | 1,017.74 | | | | 7.53 | | | | 1.48 | |
| Y | | | 1,000.00 | | | | 1,042.90 | | | | 5.05 | | | | 1,020.27 | | | | 4.99 | | | | 0.98 | |
| R5 | | | 1,000.00 | | | | 1,043.80 | | | | 4.79 | | | | 1,020.52 | | | | 4.74 | | | | 0.93 | |
| R6 | | | 1,000.00 | | | | 1,043.80 | | | | 4.43 | | | | 1,020.87 | | | | 4.38 | | | | 0.86 | |
| 1 | The actual ending account value is based on the actual total return of the Fund for the period May 1, 2017 through October 31, 2017, after actual expenses and will differ from the hypothetical ending account value which is based on the Fund’s expense ratio and a hypothetical annual return of 5% before expenses. |
| 2 | Expenses are equal to the Fund’s annualized expense ratio as indicated above multiplied by the average account value over the period, multiplied by 184/365 to reflect the most recent fiscal half year. |
29 Invesco Balanced-Risk Allocation Fund
Approval of Investment Advisory and Sub-Advisory Contracts
The Board of Trustees (the Board) of AIM Investment Funds (Invesco Investment Funds) Series is required under the Investment Company Act of 1940, as amended, to approve annually the renewal of Invesco Balanced-Risk Allocation Fund’s (the Fund) investment advisory agreements. During contract renewal meetings held on June 12-13, 2017, the Board as a whole, and the disinterested or “independent” Trustees, who comprise over 75% of the Board, voting separately, approved the continuance for the Fund of the Master Investment Advisory Agreement with Invesco Advisers, Inc. (Invesco Advisers and the investment advisory agreement) and the Master Intergroup Sub-Advisory Contract for Mutual Funds with Invesco Asset Management Deutschland GmbH, Invesco Asset Management Limited, Invesco Asset Management (Japan) Limited, Invesco Hong Kong Limited, Invesco Senior Secured Management, Inc. and Invesco Canada Ltd. and separate Sub-Advisory Contracts with Invesco PowerShares Capital Management LLC and Invesco Asset Management (India) Private Limited (collectively, the Affiliated Sub-Advisers and the sub-advisory contracts) for another year, effective July 1, 2017.
In evaluating the fairness and reasonableness of compensation under the Fund’s investment advisory agreement and sub-advisory contracts, the Board considered, among other things, the factors discussed below. The Board determined that continuation of the Fund’s investment advisory agreement and the sub-advisory contracts is in the best interest of the Fund and its shareholders and that the compensation payable to Invesco Advisers and the Affiliated Sub-Advisers under the agreements is fair and reasonable.
The Board’s Fund Evaluation Process
The Board’s Investments Committee has established three Sub-Committees, which meet throughout the year to review the performance of funds advised by Invesco Advisers (the Invesco Funds). Over the course of each year, the Sub-Committees meet with portfolio managers for their assigned Invesco Funds and other members of management to review the performance, investment objective(s), policies, strategies, limitations and investment risks of these funds. The Board had the benefit of reports from the Sub-Committees and Investments Committee throughout the year in considering approval of the continuance of each Invesco Fund’s investment advisory agreement and sub-advisory contracts for another year.
During the contract renewal process, the Board receives comparative performance and fee data regarding the Invesco Funds prepared by Invesco Advisers and Broadridge Financial Solutions, Inc. (Broadridge), an independent provider of investment company data. The
Board also receives an independent written evaluation from the Senior Officer, an officer of the Invesco Funds who reports directly to the independent Trustees. The Senior Officer’s evaluation is prepared as part of his responsibility to manage the process by which the Invesco Funds’ proposed management fees are negotiated during the annual contract renewal process to ensure they are negotiated in a manner that is at arms’ length and reasonable. In addition to meetings with Invesco Advisers and fund counsel, the independent Trustees also discuss the continuance of the investment advisory agreement and sub-advisory contracts in separate sessions with the Senior Officer and with independent legal counsel.
The Trustees recognized that the advisory fee rates for the Invesco Funds are, in most cases, the result of years of review and negotiation. The Trustees’ deliberations and conclusions in a particular year may be based in part on their deliberations and conclusions regarding these arrangements throughout the year and in prior years. The Trustees’ review and conclusions are based on the comprehensive consideration of all information presented to them and are not the result of any single determinative factor. Moreover, one Trustee may have weighed a particular piece of information or factor differently than another Trustee.
The discussion below is a summary of the Senior Officer’s independent written evaluation with respect to the Fund’s investment advisory agreement as well as a discussion of the material factors and related conclusions that formed the basis for the Board’s approval of the Fund’s investment advisory agreement and sub-advisory contracts. This information is current as of June 13, 2017, and does not reflect consideration of factors that became known to the Board after that date.
Factors and Conclusions and Summary of Independent Written Fee Evaluation
| A. | Nature, Extent and Quality of Services Provided by Invesco Advisers and the Affiliated Sub-Advisers |
The Board reviewed the advisory services provided to the Fund by Invesco Advisers under the Fund’s investment advisory agreement, the performance of Invesco Advisers in providing these services, and the credentials and experience of the officers and employees of Invesco Advisers who provide these services, including the Fund’s portfolio manager or managers. The Board’s review included consideration of Invesco Advisers’ investment process oversight, credit analysis and investment risk management. The Board also considered non-advisory services that Invesco Advisers and its affiliates provide to the Invesco Funds such as various back office support
functions, trading operations, internal audit, valuation and legal and compliance.
In determining whether to continue the Fund’s investment advisory agreement, the Board considered the benefits of reapproving an existing relationship as contrasted with the greater uncertainty that may be associated with entering into a new relationship. The Board concluded that the nature, extent and quality of the services provided to the Fund by Invesco Advisers are appropriate and satisfactory.
The Board reviewed the services that may be provided by the Affiliated Sub-Advisers under the sub-advisory contracts and the credentials and experience of the officers and employees of the Affiliated Sub-Advisers who provide these services. The Board noted that the Affiliated Sub-Advisers have offices and personnel that are located in financial centers around the world. As a result, the Board noted that the Affiliated Sub-Advisers can provide research and investment analysis on the markets and economies of various countries in which the Fund may invest, make recommendations regarding securities and assist with security trades. The Board concluded that the sub-advisory contracts may benefit the Fund and its shareholders by permitting Invesco Advisers to use the resources and talents of the Affiliated Sub-Advisers in managing the Fund. The Board concluded that the nature, extent and quality of the services that may be provided by the Affiliated Sub-Advisers are appropriate and satisfactory.
| B. | Fund Investment Performance |
The Board considered Fund investment performance as a relevant factor in considering whether to approve the investment advisory agreement. The Board did not view Fund performance as a relevant factor in considering whether to approve the sub-advisory contracts for the Fund, as no Affiliated Sub-Adviser currently manages assets of the Fund.
The Board compared the Fund’s investment performance during the past one, three and five calendar years to the performance of funds in the Broadridge performance universe and against the Lipper Alternative Global Macro Funds Index. The Board noted that performance of Class A shares of the Fund was in the first quintile of its performance universe for the one and three year periods and the second quintile for the five year period (the first quintile being the best performing funds and the fifth quintile being the worst performing funds). The Board noted that performance of Class A shares of the Fund was above the performance of the Index for the one, three and five year periods. The Trustees also reviewed more recent Fund performance and this review did not change their conclusions.
| C. | Advisory and Sub-Advisory Fees |
The Board compared the Fund’s contractual management fee rate to the contractual
30 Invesco Balanced-Risk Allocation Fund
management fee rates of funds in the Fund’s Broadridge expense group at a common asset level. The Board noted that the contractual management fee rate for Class A shares of the Fund was above the median contractual management fee rate of funds in its expense group. The Board noted that the term “contractual management fee” for funds in the expense group may include both advisory and certain administrative services fees, but that Broadridge does not provide information on a fund by fund basis as to what is included. The Board noted that Invesco Advisers does not separately charge the Invesco Funds for the administrative services included in the term as defined by Broadridge. The Board also reviewed the methodology used by Broadridge in providing expense group information, which includes using each fund’s contractual management fee schedule (including any applicable breakpoints) as reported in the most recent prospectus or statement of additional information for each fund in the expense group.
The Board compared the Fund’s effective advisory fee rate (the advisory fee rate after advisory fee waivers and before other expense limitations/waivers) to the effective advisory fee rates of other funds advised by Invesco Advisers and its affiliates with investment strategies comparable to those of the Fund, based on asset balances as of December 31, 2016. The Board noted that the Fund’s rate was below the rate of one such mutual fund and below the rates of two off-shore funds. The Board also noted how the Fund’s rate compared to the effective sub-adviser fee rate of one fund sub-advised by Invesco Advisers.
The Board also considered the fees charged by Invesco Advisers and the Affiliated Sub-Advisers to other client accounts with investment strategies comparable to those of the Fund. The Board noted that Invesco Advisers or the Affiliated Sub-Advisers may charge lower fees to large institutional clients. Invesco Advisers reviewed with the Board the significantly greater scope of services it provides to the Invesco Funds relative to certain other types of client accounts. These additional services include provision of administrative services, officers and office space, oversight of service providers, preparation of annual registration statement updates and financial information and regulatory compliance under the Investment Company Act of 1940, as amended.
Invesco Advisers also reviewed generally the higher frequency of shareholder purchases and redemptions in the Invesco Funds relative to the flow of assets for other client accounts. Invesco Advisers advised the Board that advance notice of redemptions is often provided to Invesco Advisers by institutional clients. The Board did note that sub-advisory fee rates charged by the Affiliated Sub-Advisers to manage the Invesco Funds and to manage other client accounts tended to be more comparable, reflecting a similar scope of services.
The Board also considered the services that may be provided by the Affiliated Sub-Advisers pursuant to the sub-advisory contracts, as well as the fees payable by Invesco Advisers to the Affiliated Sub-Advisers pursuant to the sub-advisory contracts. The Board also noted that the sub-advisory fees are not paid directly by the Fund, but rather, are payable by Invesco Advisers to the Affiliated Sub-Advisers.
| D. | Economies of Scale and Breakpoints |
The Board considered the extent to which there are economies of scale in the provision of advisory services to the Fund. The Board also considered that the Fund benefits from economies of scale through contractual breakpoints in the Fund’s advisory fee schedule. The Board noted that the Fund shares directly in economies of scale through lower fees charged by third party service providers based on the combined size of the Invesco Funds advised by Invesco Advisers.
| E. | Profitability and Financial Resources |
The Board reviewed information from Invesco Advisers concerning the costs of the advisory and other services that Invesco Advisers and its affiliates provide to the Fund and the Invesco Funds and the profitability of Invesco Advisers and its affiliates in providing these services. The Board noted that Invesco Advisers continues to operate at a net profit from services Invesco Advisers and its affiliates provide to the Invesco Funds and the Fund. The Board did not deem the level of profits realized by Invesco Advisers and its affiliates from providing services to the Fund to be excessive given the nature, quality and extent of the services provided. The Board received and accepted information from Invesco Advisers demonstrating that Invesco Advisers and each Affiliated Sub-Adviser are financially sound and have the resources necessary to perform their obligations under the investment advisory agreement and sub-advisory contracts.
| F. | Collateral Benefits to Invesco Advisers and its Affiliates |
The Board considered various other benefits received by Invesco Advisers and its affiliates from the relationship with the Fund, including the fees received for providing transfer agency and distribution services to the Fund. The Board considered comparative information regarding fees charged for these services, including information provided by Broadridge and other independent sources. The Board considered the performance of Invesco Advisers and its affiliates in providing these services and the organizational structure employed to provide these services. The Board also considered that these services are provided to the Fund pursuant to written contracts that are reviewed and approved on an annual basis by the Board; and that the services are required for the operation of the Fund.
31 Invesco Balanced-Risk Allocation Fund
Tax Information
Form 1099-DIV, Form 1042-S and other year–end tax information provide shareholders with actual calendar year amounts that should be included in their tax returns. Shareholders should consult their tax advisors.
The following distribution information is being provided as required by the Internal Revenue Code or to meet a specific state’s requirement.
The Fund designates the following amounts or, if subsequently determined to be different, the maximum amount allowable for its fiscal year ended October 31, 2017:
| | | | |
Federal and State Income Tax | |
Long-Term Capital Gain Distributions | | $ | 128,250,181 | |
Qualified Dividend Income* | | | 0.00 | % |
Corporate Dividends Received Deduction* | | | 0.00 | % |
U.S. Treasury Obligations* | | | 40.36 | % |
| | * | The above percentages are based on ordinary income dividends paid to shareholders during the Fund’s fiscal year. |
| | | | |
Non-Resident Alien Shareholders | |
Qualified Short-Term Gains | | $ | 88,513,706 | |
32 Invesco Balanced-Risk Allocation Fund
Trustees and Officers
The address of each trustee and officer is AIM Investment Funds (Invesco Investment Funds) (the “Trust”), 11 Greenway Plaza, Suite 1000, Houston, Texas 77046-1173. The trustees serve for the life of the Trust, subject to their earlier death, incapacitation, resignation, retirement or removal as more specifically provided in the Trust’s organizational documents. Each officer serves for a one year term or until their successors are elected and qualified. Column two below includes length of time served with predecessor entities, if any.
| | | | | | | | |
Name, Year of Birth and Position(s) Held with the Trust | | Trustee and/
or Officer Since | | Principal Occupation(s)
During Past 5 Years | | Number of
Funds in Fund
Complex
Overseen by
Trustee | | Other Directorship(s)
Held by Trustee During Past 5 Years |
| Interested Persons | | | | | | | | |
| Martin L. Flanagan1 — 1960 Trustee | | 2007 | | Executive Director, Chief Executive Officer and President, Invesco Ltd. (ultimate parent of Invesco and a global investment management firm); Trustee, The Invesco Funds; Vice Chair, Investment Company Institute; and Member of Executive Board, SMU Cox School of Business Formerly: Advisor to the Board, Invesco Advisers, Inc. (formerly known as Invesco Institutional (N.A.), Inc.); Chairman and Chief Executive Officer, Invesco Advisers, Inc. (registered investment adviser); Director, Chairman, Chief Executive Officer and President, Invesco Holding Company (US), Inc. (formerly IVZ Inc.) (holding company), Invesco Group Services, Inc. (service provider) and Invesco North American Holdings, Inc. (holding company); Director, Chief Executive Officer and President, Invesco Holding Company Limited (parent of Invesco and a global investment management firm); Director, Invesco Ltd.; Chairman, Investment Company Institute and President, Co-Chief Executive Officer, Co-President, Chief Operating Officer and Chief Financial Officer, Franklin Resources, Inc. (global investment management organization) | | 158 | | None |
Philip A. Taylor2 — 1954 Trustee and Senior Vice President | | 2006 | | Head of the Americas and Senior Managing Director, Invesco Ltd.; Director, Invesco Advisers, Inc. (formerly known as Invesco Institutional (N.A.), Inc.) (registered investment adviser); Director, Chairman, Chief Executive Officer and President, Invesco Management Group, Inc. (formerly known as Invesco Aim Management Group, Inc.) (financial services holding company); Director and Chairman, Invesco Investment Services, Inc. (formerly known as Invesco Aim Investment Services, Inc.) (registered transfer agent); Chief Executive Officer, Invesco Corporate Class Inc. (corporate mutual fund company); Director, Chairman and Chief Executive Officer, Invesco Canada Ltd. (formerly known as Invesco Trimark Ltd./Invesco Trimark Ltèe) (registered investment adviser and registered transfer agent); Trustee and Senior Vice President, The Invesco Funds; Director, Invesco Investment Advisers LLC (formerly known as Van Kampen Asset Management). Formerly: Co-Chairman, Co-President and Co-Chief Executive Officer, Invesco Advisers, Inc. (formerly known as Invesco Institutional (N.A.), Inc.) (registered investment adviser); Director, Chief Executive Officer and President, Van Kampen Exchange Corp; President and Principal Executive Officer, The Invesco Funds (other than AIM Treasurer’s Series Trust (Invesco Treasurer’s Series Trust), Short-Term Investments Trust and Invesco Management Trust); Executive Vice President, The Invesco Funds (AIM Treasurer’s Series Trust (Invesco Treasurer’s Series Trust), Short-Term Investments Trust and Invesco Management Trust only); Director and President, INVESCO Funds Group, Inc. (registered investment adviser and registered transfer agent); Director and Chairman, IVZ Distributors, Inc. (formerly known as INVESCO Distributors, Inc.) (registered broker dealer); Director, President and Chairman, Invesco Inc. (holding company), Invesco Canada Holdings Inc. (holding company), Trimark Investments Ltd./Placements Trimark Ltèe and Invesco Financial Services Ltd/Services Financiers Invesco Ltèe; Chief Executive Officer, Invesco Canada Fund Inc. (corporate mutual fund company); Director and Chairman, Van Kampen Investor Services Inc.; Director, Chief Executive Officer and President, 1371 Preferred Inc. (holding company) and Van Kampen Investments Inc.; Director and President, AIM GP Canada Inc. (general partner for limited partnerships) and Van Kampen Advisors, Inc.; Director and Chief Executive Officer, Invesco Trimark Dealer Inc. (registered broker dealer); Director, Invesco Distributors, Inc. (formerly known as Invesco Aim Distributors, Inc.) (registered broker dealer); Manager, Invesco PowerShares Capital Management LLC; Director, Chief Executive Officer and President, Invesco Advisers, Inc.; Director, Chairman, Chief Executive Officer and President, Invesco Aim Capital Management, Inc.; President, Invesco Trimark Dealer Inc. and Invesco Trimark Ltd./Invesco Trimark Ltèe; Director and President, AIM Trimark Corporate Class Inc. and AIM Trimark Canada Fund Inc.; Senior Managing Director, Invesco Holding Company Limited; Director and Chairman, Fund Management Company (former registered broker dealer); President and Principal Executive Officer, The Invesco Funds (AIM Treasurer’s Series Trust (Invesco Treasurer’s Series Trust), and Short-Term Investments Trust only); President, AIM Trimark Global Fund Inc. and AIM Trimark Canada Fund Inc. | | 158 | | None |
| 1 | Mr. Flanagan is considered an interested person (within the meaning of Section 2(a)(19) of the 1940 Act) of the Trust because he is an officer of the Adviser to the Trust, and an officer and a director of Invesco Ltd., ultimate parent of the Adviser. |
| 2 | Mr. Taylor is considered an interested person (within the meaning of Section 2(a)(19) of the 1940 Act) of the Trust because he is an officer and a director of the Adviser. |
T-1 Invesco Balanced-Risk Allocation Fund
Trustees and Officers—(continued)
| | | | | | | | |
Name, Year of Birth and Position(s) Held with the Trust | | Trustee and/
or Officer Since | | Principal Occupation(s) During Past 5 Years | | Number of
Funds in Fund
Complex
Overseen by
Trustee | | Other Directorship(s)
Held by Trustee During Past 5 Years |
| Independent Trustees | | | | | | | | |
Bruce L. Crockett — 1944 Trustee and Chair | | 2001 | | Chairman, Crockett Technologies Associates (technology consulting company) Formerly: Director, Captaris (unified messaging provider); Director, President and Chief Executive Officer, COMSAT Corporation; Chairman, Board of Governors of INTELSAT (international communications company); ACE Limited (insurance company); Independent Directors Council and Investment Company Institute: Member of the Audit Committee, Investment Company Institute; Member of the Executive Committee and Chair of the Governance Committee, Independent Directors Council | | 158 | | Director and Chairman of the Audit Committee, ALPS (Attorneys Liability Protection Society) (insurance company); Director and Member of the Audit Committee, Ferroglobe PLC (metallurgical company) |
David C. Arch — 1945 Trustee | | 2010 | | Chairman of Blistex Inc. (consumer health care products manufacturer); Member, World Presidents’ Organization | | 158 | | Board member of the Illinois Manufacturers’ Association |
James T. Bunch — 1942 Trustee | | 2003 | | Managing Member, Grumman Hill Group LLC (family office/private equity investments) Formerly: Chairman of the Board, Denver Film Society; Chairman of the Board of Trustees, Evans Scholarship Foundation; Chairman, Board of Governors, Western Golf Association | | 158 | | Trustee, Evans Scholarship Foundation |
Jack M. Fields — 1952 Trustee | | 2001 | | Chief Executive Officer, Twenty First Century Group, Inc. (government affairs company); and Discovery Learning Alliance (non-profit) Formerly: Owner and Chief Executive Officer, Dos Angeles Ranch L.P. (cattle, hunting, corporate entertainment); Director, Insperity, Inc. (formerly known as Administaff) (human resources provider); Chief Executive Officer, Texana Timber LP (sustainable forestry company); Director of Cross Timbers Quail Research Ranch (non-profit); and member of the U.S. House of Representatives | | 158 | | None |
Cynthia Hostetler — 1962 Trustee | | 2017 | | Non-Executive Director and Trustee of a number of public and private business corporations Formerly: Head of Investment Funds and Private Equity, Overseas Private Investment Corporation; President, First Manhattan Bancorporation, Inc.; Attorney, Simpson Thacher & Bartlett LLP | | 158 | | Vulcan Materials Company (construction materials company); Trilinc Global Impact Fund; Aberdeen Investment Funds (4 portfolios); Artio Global Investment LLC (mutual fund complex); Edgen Group, Inc. (specialized energy and infrastructure products distributor) |
Eli Jones — 1961 Trustee | | 2016 | | Professor and Dean, Mays Business School — Texas A&M University Formerly: Professor and Dean, Walton College of Business, University of Arkansas and E.J. Ourso College of Business, Louisiana State University; Director, Arvest Bank | | 158 | | Insperity, Inc. (formerly known as Administaff) (human resources provider) |
Prema Mathai-Davis — 1950 Trustee | | 2001 | | Retired. Formerly: Chief Executive Officer, YWCA of the U.S.A. | | 158 | | None |
Teresa M. Ressel — 1962 Trustee | | 2017 | | Non-executive director and trustee of a number of public and private business corporations Formerly: Chief Financial Officer, Olayan America, The Olayan Group (international investor/commercial/industrial); Chief Executive Officer, UBS Securities LLC; Group Chief Operating Officer, Americas, UBS AG; Assistant Secretary for Management & Budget and CFO, US Department of the Treasury; Chief Compliance Officer, Kaiser Permanente (healthcare consortium); Program Manager, Hewlett-Packard; Nuclear Engineering, General Dynamics Corporation (aerospace and defense company) | | 158 | | Atlantic Power Corporation (power generation company); ON Semiconductor Corp. (semiconductor supplier) |
Larry Soll — 1942 Trustee | | 2003 | | Retired. Formerly: Chairman, Chief Executive Officer and President, Synergen Corp. (a biotechnology company) | | 158 | | None |
Ann Barnett Stern — 1957 Trustee | | 2017 | | President and Chief Executive Officer, Houston Endowment Inc. (private philanthropic institution) Formerly: Executive Vice President and General Counsel, Texas Children’s Hospital; Attorney, Beck, Redden and Secrest, LLP; Business Law Instructor, University of St. Thomas; Attorney, Andrews & Kurth LLP | | 158 | | Federal Reserve Bank of Dallas |
Raymond Stickel, Jr. — 1944 Trustee | | 2005 | | Retired. Formerly: Director, Mainstay VP Series Funds, Inc. (25 portfolios); Partner, Deloitte & Touche | | 158 | | None |
Robert C. Troccoli — 1949 Trustee | | 2016 | | Adjunct Professor, University of Denver — Daniels College of Business Formerly: Senior Partner, KPMG LLP | | 158 | | None |
T-2 Invesco Balanced-Risk Allocation Fund
Trustees and Officers—(continued)
| | | | | | | | |
Name, Year of Birth and Position(s) Held with the Trust | | Trustee and/
or Officer Since | | Principal Occupation(s) During Past 5 Years | | Number of
Funds in Fund
Complex
Overseen by
Trustee | | Other Directorship(s)
Held by Trustee During Past 5 Years |
| Independent Trustees—(continued) |
Christopher L. Wilson — 1957 Trustee | | 2017 | | Managing Partner, CT2, LLC (investing and consulting firm) Formerly: President/Chief Executive Officer, Columbia Funds, Bank of America Corporation; President/Chief Executive Officer, CDC IXIS Asset Management Services, Inc.; Principal & Director of Operations, Scudder Funds, Scudder, Stevens & Clark, Inc.; Assistant Vice President, Fidelity Investments | | 158 | | TD Asset Management USA Inc. (mutual fund complex) (22 portfolios); ISO New England, Inc. (non-profit organization managing regional electricity market) |
| Other Officers | | | | | | | | |
Sheri Morris — 1964 President, Principal Executive Officer and Treasurer | | 1999 | | President, Principal Executive Officer and Treasurer, The Invesco Funds; Vice President, Invesco Advisers, Inc. (formerly known as Invesco Institutional (N.A.), Inc.) (registered investment adviser); and Vice President, PowerShares Exchange-Traded Fund Trust, PowerShares Exchange-Traded Fund Trust II, PowerShares India Exchange-Traded Fund Trust, PowerShares Actively Managed Exchange-Traded Fund Trust and PowerShares Actively Managed Exchange-Traded Commodity Fund Trust Formerly: Vice President and Principal Financial Officer, The Invesco Funds; Vice President, Invesco Aim Advisers, Inc., Invesco Aim Capital Management, Inc. and Invesco Aim Private Asset Management, Inc.; Assistant Vice President and Assistant Treasurer, The Invesco Funds and Assistant Vice President, Invesco Advisers, Inc., Invesco Aim Capital Management, Inc. and Invesco Aim Private Asset Management, Inc.; and Treasurer, PowerShares Exchange-Traded Fund Trust, PowerShares Exchange-Traded Fund Trust II, PowerShares India Exchange-Traded Fund Trust and PowerShares Actively Managed Exchange-Traded Fund Trust | | N/A | | N/A |
Russell C. Burk — 1958 Senior Vice President and Senior Officer | | 2005 | | Senior Vice President and Senior Officer, The Invesco Funds | | N/A | | N/A |
John M. Zerr — 1962 Senior Vice President, Chief Legal Officer and Secretary | | 2006 | | Director, Senior Vice President, Secretary and General Counsel, Invesco Management Group, Inc. (formerly known as Invesco AIM Management Group, Inc.); Senior Vice President, Invesco Advisers, Inc. (formerly known as Invesco Institutional (N.A.), Inc.) (registered investment adviser); Senior Vice President and Secretary, Invesco Distributors, Inc. (formerly known as Invesco AIM Distributors, Inc.); Director, Vice President and Secretary, Invesco Investment Services, Inc. (formerly known as Invesco AIM Investment Services, Inc.) Senior Vice President, Chief Legal Officer and Secretary, The Invesco Funds; Managing Director, Invesco PowerShares Capital Management LLC; Director, Secretary and General Counsel, Invesco Investment Advisers LLC (formerly known as Van Kampen Asset Management); Secretary and General Counsel, Invesco Capital Markets, Inc. (formerly known as Van Kampen Funds Inc.) and Chief Legal Officer, PowerShares Exchange-Traded Fund Trust, PowerShares Exchange-Traded Fund Trust II, PowerShares India Exchange-Traded Fund Trust, PowerShares Actively Managed Exchange-Traded Fund Trust and PowerShares Actively Managed Exchange-Traded Commodity Fund Trust; Manager and Secretary, Invesco Indexing LLC Formerly: Director, Secretary, General Counsel and Senior Vice President, Van Kampen Exchange Corp.; Director, Vice President and Secretary, IVZ Distributors, Inc. (formerly known as INVESCO Distributors, Inc.); Director and Vice President, INVESCO Funds Group, Inc.; Director and Vice President, Van Kampen Advisors Inc.; Director, Vice President, Secretary and General Counsel, Van Kampen Investor Services Inc.; Director, Invesco Distributors, Inc. (formerly known as Invesco AIM Distributors, Inc.); Director, Senior Vice President, General Counsel and Secretary, Invesco AIM Advisers, Inc. and Van Kampen Investments Inc.; Director, Vice President and Secretary, Fund Management Company; Director, Senior Vice President, Secretary, General Counsel and Vice President, Invesco AIM Capital Management, Inc.; Chief Operating Officer and General Counsel, Liberty Ridge Capital, Inc. (an investment adviser); Vice President and Secretary, PBHG Funds (an investment company) and PBHG Insurance Series Fund (an investment company); Chief Operating Officer, General Counsel and Secretary, Old Mutual Investment Partners (a broker-dealer); General Counsel and Secretary, Old Mutual Fund Services (an administrator) and Old Mutual Shareholder Services (a shareholder servicing center); Executive Vice President, General Counsel and Secretary, Old Mutual Capital, Inc. (an investment adviser); and Vice President and Secretary, Old Mutual Advisors Funds (an investment company) | | N/A | | N/A |
Gregory G. McGreevey — 1962 Senior Vice President | | 2012 | | Senior Managing Director, Invesco Ltd.; Director, Chairman, President, and Chief Executive Officer, Invesco Advisers, Inc. (formerly known as Invesco Institutional (N.A.), Inc.) (registered investment adviser); Senior Vice President, Invesco Management Group, Inc.; Director, Invesco Mortgage Capital, Inc. and Invesco Senior Secured Management, Inc.; and Senior Vice President, The Invesco Funds Formerly: Assistant Vice President, The Invesco Funds | | N/A | | N/A |
T-3 Invesco Balanced-Risk Allocation Fund
Trustees and Officers—(continued)
| | | | | | | | |
Name, Year of Birth and Position(s) Held with the Trust | | Trustee and/
or Officer Since | | Principal Occupation(s) During Past 5 Years | | Number of
Funds in Fund
Complex
Overseen by
Trustee | | Other Directorship(s)
Held by Trustee During Past 5 Years |
| Other Officers—(continued) | | | | | | | | |
Kelli Gallegos — 1970 Vice President, Principal Financial Officer and Assistant Treasurer | | 2008 | | Vice President, Principal Financial Officer and Assistant Treasurer, The Invesco Funds; Assistant Treasurer, Invesco PowerShares Capital Management LLC, PowerShares Exchange-Traded Fund Trust, PowerShares Exchange-Traded Fund Trust II, PowerShares India Exchange-Traded Fund Trust, PowerShares Actively Managed Exchange-Traded Fund Trust and PowerShares Actively Managed Exchange-Traded Commodity Fund Trust Formerly: Assistant Vice President, The Invesco Funds | | N/A | | N/A |
Tracy Sullivan — 1962 Vice President, Chief Tax Officer and Assistant Treasurer | | 2008 | | Vice President, Chief Tax Officer and Assistant Treasurer, The Invesco Funds; Assistant Treasurer, Invesco PowerShares Capital Management LLC, PowerShares Exchange-Traded Fund Trust, PowerShares Exchange-Traded Fund Trust II, PowerShares India Exchange-Traded Fund Trust, PowerShares Actively Managed Exchange-Traded Fund Trust and PowerShares Actively Managed Exchange-Traded Commodity Fund Trust Formerly: Assistant Vice President, The Invesco Funds | | N/A | | N/A |
Crissie M. Wisdom — 1969 Anti-Money Laundering Compliance Officer | | 2013 | | Anti-Money Laundering Compliance Officer, Invesco Advisers, Inc. (formerly known as Invesco Institutional (N.A.), Inc.) (registered investment adviser), Invesco Capital Markets, Inc. (formerly known as Van Kampen Funds Inc.), Invesco Distributors, Inc., Invesco Investment Services, Inc., Invesco Management Group, Inc., The Invesco Funds, and PowerShares Exchange-Traded Fund Trust, PowerShares Exchange-Traded Fund Trust II, PowerShares India Exchange-Traded Fund Trust, PowerShares Actively Managed Exchange-Traded Fund Trust and PowerShares Actively Managed Exchange-Traded Commodity Fund Trust; Anti-Money Laundering Compliance Officer and Bank Secrecy Act Officer, INVESCO National Trust Company and Invesco Trust Company; and Fraud Prevention Manager and Controls and Risk Analysis Manager for Invesco Investment Services, Inc. Formerly: Anti-Money Laundering Compliance Officer, Van Kampen Exchange Corp. | | N/A | | N/A |
Robert R. Leveille — 1969 Chief Compliance Officer | | 2016 | | Chief Compliance Officer, Invesco Advisers, Inc. (registered investment adviser); and Chief Compliance Officer, The Invesco Funds Formerly: Chief Compliance Officer, Putnam Investments and the Putnam Funds | | N/A | | N/A |
The Statement of Additional Information of the Trust includes additional information about the Fund’s Trustees and is available upon request, without charge, by calling 1.800.959.4246. Please refer to the Fund’s Statement of Additional Information for information on the Fund’s sub-advisers.
| | | | | | |
Office of the Fund 11 Greenway Plaza, Suite 1000 Houston, TX 77046-1173 | | Investment Adviser Invesco Advisers, Inc. 1555 Peachtree Street, N.E. Atlanta, GA 30309 | | Distributor Invesco Distributors, Inc. 11 Greenway Plaza, Suite 1000 Houston, TX 77046-1173 | | Auditors PricewaterhouseCoopers LLP 1000 Louisiana Street, Suite 5800 Houston, TX 77002-5678 |
| | | |
| | | | | | |
Counsel to the Fund Stradley Ronon Stevens & Young, LLP 2005 Market Street, Suite 2600 Philadelphia, PA 19103-7018 | | Counsel��to the Independent Trustees Goodwin Procter LLP 901 New York Avenue, N.W. Washington, D.C. 20001 | | Transfer Agent Invesco Investment Services, Inc. 11 Greenway Plaza, Suite 1000 Houston, TX 77046-1173 | | Custodian State Street Bank and Trust Company 225 Franklin Street Boston, MA 02110-2801 |
T-4 Invesco Balanced-Risk Allocation Fund
Explore High-Conviction Investing with Invesco

Go paperless with eDelivery
Visit invesco.com/edelivery to enjoy the convenience and security of anytime electronic access to your investment documents.
With eDelivery, you can elect to have any or all of the following materials delivered straight to your inbox to download, save and print from your own computer:
| ∎ | | Fund reports and prospectuses |
Invesco mailing information
Send general correspondence to Invesco Investment Services, Inc., P.O. Box 219078, Kansas City, MO 64121-9078.
Important notice regarding delivery of security holder documents
To reduce Fund expenses, only one copy of most shareholder documents may be mailed to shareholders with multiple accounts at the same address (Householding). Mailing of your shareholder documents may be householded indefinitely unless you instruct us otherwise. If you do not want the mailing of these documents to be combined with those for other members of your household, please contact Invesco Investment Services, Inc. at 800 959 4246 or contact your financial institution. We will begin sending you individual copies for each account within 30 days after receiving your request.
Fund holdings and proxy voting information
The Fund provides a complete list of its holdings four times in each fiscal year, at the quarter ends. For the second and fourth quarters, the lists appear in the Fund’s semiannual and annual reports to shareholders. For the first and third quarters, the Fund files the lists with the Securities and Exchange Commission (SEC) on Form N-Q. The most recent list of portfolio holdings is available at invesco.com/completeqtrholdings. Shareholders can also look up the Fund’s Forms N-Q on the SEC website at sec.gov. Copies of the Fund’s Forms N-Q may be reviewed and copied at the SEC Public Reference Room in Washington, D.C. You can obtain information on the operation of the Public Reference Room, including information about duplicating fee charges, by calling 202 551 8090 or 800 732 0330, or by electronic request at the following email address: publicinfo@sec.gov. The SEC file numbers for the Fund are shown below.
A description of the policies and procedures that the Fund uses to determine how to vote proxies relating to portfolio securities is available without charge, upon request, from our Client Services department at 800 959 4246 or at invesco.com/proxyguidelines. The information is also available on the SEC website, sec.gov.
| | |
Information regarding how the Fund voted proxies related to its portfolio securities during the most recent 12-month period ended June 30 is available at invesco.com/proxysearch. The information is also available on the SEC website, sec.gov. Invesco Advisers, Inc. is an investment adviser; it provides investment advisory services to individual and institutional clients and does not sell securities. Invesco Distributors, Inc. is the US distributor for Invesco Ltd.’s retail mutual funds, exchange-traded funds and institutional money market funds. Both are wholly owned, indirect subsidiaries of Invesco Ltd. | |  |
| | | | | | | | |
| SEC file numbers: 811-05426 and 033-19338 | | Invesco Distributors, Inc. | | IBRA-AR-1 | | 12192017 | | 1047 |

Letters to Shareholders
| | | | |

Philip Taylor | | | | Dear Shareholders: This annual report includes information about your Fund, including performance data and a complete list of its investments as of the close of the reporting period. Inside is a discussion of how your Fund was managed and the factors that affected its performance during the reporting period. American voters went to the polls just days after the start of the reporting period, and their decisions quickly affected markets. The US stock market rallied strongly after the election, with major market indexes rising, and setting record highs, throughout the reporting period. Generally positive economic data, strong corporate earnings and hope for tax and regulatory reform contributed to the rally. US and global bond markets, as well as emerging market equities, sold off immediately following the election – with the US bond market eventually recovering most of its losses. Overseas, economic data were mixed, prompting the European Central Bank and central |
banks in China and Japan, among other countries, to maintain extraordinarily accommodative monetary policies. Citing positive economic trends – specifically, realized and expected labor market conditions and inflation – the US Federal Reserve raised interest rates three times during the reporting period: first in December 2016, and then again in March and June 2017. Health care and tax reform proved to be more difficult than expected to enact, with little progress achieved by the end of the reporting period.
Short-term market volatility can prompt some investors to abandon their investment plans – and can cause others to settle for whatever returns the market has to offer. The investment professionals at Invesco, in contrast, invest with high conviction. This means that, no matter the asset class or the strategy, each investment team has a passion to exceed. We want to help investors achieve better outcomes, such as seeking higher returns, helping mitigate risk and generating income. Of course, investing with high conviction can’t guarantee a profit or ensure success; no investment strategy can. To learn more about how we invest with high conviction, visit invesco.com/HighConviction.
You, too, can invest with high conviction by maintaining a long-term investment perspective and by working with your financial adviser on a regular basis. During periods of short-term market volatility or uncertainty, your financial adviser can keep you focused on your long-term investment goals – a new home, a child’s college education or a secure retirement. He or she also can share research about the economy, the markets and individual investment options.
Visit our website for more information on your investments
Our website, invesco.com/us, offers a wide range of market insights and investment perspectives. On the website, you’ll find detailed information about our funds, including performance, holdings and portfolio manager commentaries. You can access information about your account by completing a simple, secure online registration. To do so, select “Log In” on the right side of the homepage, and then select “Register for Individual Account Access.”
In addition to the resources accessible on our website and through our mobile app, you can obtain timely updates to help you stay informed about the markets and the economy by connecting with Invesco on Twitter, LinkedIn or Facebook. You can access our blog at blog.invesco.us.com. Our goal is to provide you the information you want, when and where you want it.
Finally, I’m pleased to share with you Invesco’s commitment to both the Principles for Responsible Investment and to considering environmental, social and governance issues in our robust investment process. I invite you to learn more at invesco.com/esg.
Have questions?
For questions about your account, contact an Invesco client services representative at 800 959 4246. For Invesco-related questions or comments, please email me directly at phil@invesco.com.
All of us at Invesco look forward to serving your investment management needs. Thank you for investing with us.
Sincerely,

Philip Taylor
Senior Managing Director, Invesco Ltd.
|
| 2 Invesco Balanced-Risk Commodity Strategy Fund |
| | | | |

Bruce Crockett | | | | Dear Fellow Shareholders: Among the many important lessons I’ve learned in more than 40 years in a variety of business endeavors is the value of a trusted advocate. As independent chair of the Invesco Funds Board, I can assure you that the members of the Board are strong advocates for the interests of investors in Invesco’s mutual funds. We work hard to represent your interests through oversight of the quality of the investment management services your funds receive and other matters important to your investment, including but not limited to: ∎ Ensuring that Invesco offers a diverse lineup of mutual funds that your financial adviser can use to strive to meet your financial needs as your investment goals change over time. ∎ Monitoring how the portfolio management teams of the Invesco funds are performing in light of changing economic and market conditions. |
| ∎ | Assessing each portfolio management team’s investment performance within the context of the investment strategy described in the fund’s prospectus. |
| ∎ | Monitoring for potential conflicts of interests that may impact the nature of the services that your funds receive. |
We believe one of the most important services we provide our fund shareholders is the annual review of the funds’ advisory and sub-advisory contracts with Invesco Advisers and its affiliates. This review is required by the Investment Company Act of 1940 and focuses on the nature and quality of the services Invesco provides as the adviser to the Invesco funds and the reasonableness of the fees that it charges for those services. Each year, we spend months carefully reviewing information received from Invesco and a variety of independent sources, such as performance and fee data prepared by Lipper, Inc. (a subsidiary of Broadridge Financial Solutions, Inc.), an independent, third-party firm widely recognized as a leader in its field. We also meet with our independent legal counsel and other independent advisers to review and help us assess the information that we have received. Our goal is to assure that you receive quality investment management services for a reasonable fee.
I trust the measures outlined above provide assurance that you have a worthy advocate when it comes to choosing the Invesco Funds.
As always, please contact me at bruce@brucecrockett.com with any questions or concerns you may have. On behalf of the Board, we look forward to continuing to represent your interests and serving your needs.
Sincerely,

Broce L. Crockett
Independent Chair
Invesco Funds Board of Trustees
|
| 3 Invesco Balanced-Risk Commodity Strategy Fund |
Management’s Discussion of Fund Performance
Performance summary
For the fiscal year ended October 31, 2017, Class A shares of Invesco Balanced-Risk Commodity Strategy Fund (the Fund), at net asset value (NAV), underperformed the Bloomberg Commodity Index, the Fund’s broad market/style-specific benchmark.
Your Fund’s long-term performance appears later in this report.
Fund vs. Indexes
Total returns, 10/31/16 to 10/31/17, at net asset value (NAV). Performance shown does not include applicable contingent deferred sales charges (CDSC) or front-end sales charges, which would have reduced performance.
| | | | | |
| Class A Shares | | | | 0.47 | % |
| Class B Shares | | | | -0.19 | |
| Class C Shares | | | | -0.34 | |
| Class R Shares | | | | 0.35 | |
| Class Y Shares | | | | 0.80 | |
| Class R5 Shares | | | | 0.83 | |
| Class R6 Shares | | | | 1.04 | |
| Bloomberg Commodity Index▼ (Broad Market/Style-Specific Index) | | | | 2.35 | |
Source(s): ▼Bloomberg L.P. | | | | | |
Market conditions and your Fund
The fiscal year ended October 31, 2017, was a strong period for industrial metals and energy but a tough year for agriculture and, to a lesser extent, precious metals. The Fund’s ability to tactically adjust its exposure to assets did not have a meaningful impact on Fund performance, as gains in energy and industrial metals were offset by losses in precious metals and agriculture. The Fund invests with a long bias in four commodity complexes – agriculture, energy, industrial metals and precious metals – and makes tactical adjustments on a monthly basis to try and take advantage of short-term market dynamics.
Strategic positioning in industrial metals was the leading contribution to Fund performance during the fiscal year as gains in copper outpaced those of aluminum. Both metals started the fiscal year strongly due to solid Chinese manufacturing data and optimism for infrastructure spending under the newly elected Trump administration. Copper prices were further aided by mine strikes and fears of
inventory shortages, as well as a weaker US dollar. Aluminum benefited from similar trends as well as indications that the Chinese government was committed to cutting aluminum production in order to curb pollution. The Fund’s tactical exposure to industrial metals, obtained through the use of swaps, futures and commodity-linked notes, contributed to Fund performance as overweight allocations to aluminum, copper and zinc out weighed minor losses from nickel. Nickel and zinc are commodities the Fund trades only to a smaller degree within our tactical allocation due to their lower liquidity.
Strategic positioning in energy contributed to Fund performance due to gains in oil and distillates during the reporting period. Unleaded gasoline was the top contributor to Fund performance within the complex, followed by Brent crude oil. Energy prices and performance fluctuated throughout the fiscal year due to uncertainty around OPEC production cuts and a glut of global supply. The complex started the fiscal year on a positive note as OPEC agreed to cut crude oil production by 1.2 million barrels per day.1
However, high inventory levels and reports of rising US production and rig counts weighed on crude oil prices during the first half of 2017. Oil and distillate prices rebounded in the third quarter of 2017 as the rig count in the US declined and expectations for an extension of OPEC’s production cuts rose. Severe weather also affected energy prices in the third quarter of 2017 as hurricanes forced refinery shutdowns, further boosting prices. Within the energy complex, natural gas was the only asset to suffer losses, as temperate weather reduced demand. The Fund’s tactical exposure to energy, obtained through the use of swaps, futures and commodity-linked notes, contributed to performance due to an underweight position in natural gas and overweight allocations to Brent crude oil and heating oil.
The Fund’s strategic positioning in precious metals detracted from Fund performance as both gold and silver declined in price, with silver suffering the larger net loss. Despite signs of rising global inflation, a weaker US dollar and geopolitical tensions with North Korea, precious metals were pressured by the US Federal Reserve increasing interest rates three times during the fiscal year – and expectations for another increase in December 2017. The Fund’s tactical positioning within precious metals, obtained through the use of swaps, futures and commodity-linked notes, also detracted from Fund performance due to an overweight position in both gold and silver.
The Fund’s strategic positioning within agriculture was the main detractor from Fund performance for the fiscal year as most assets, with the exception of lean hogs and live cattle, posted losses. Lean hogs and live cattle prices rose due to strong US export demand and fears of supply shortages. Sugar was by far the worst-performing asset in the agriculture complex; prices were weighed down by
| | | | | | | | | | |
| Target Risk Allocation and Notional Asset Weights as of 10/31/17 | |
| By asset class | | | | | | | | | | |
Asset Class | | |
| Target Risk
Allocation* |
| | |
| Notional Asset
Weights** |
|
| Agriculture | | | | 28.21 | % | | | | 36.18 | % |
| Energy | | | | 35.76 | | | | | 31.72 | |
| Industrial Metals | | | | 21.88 | | | | | 26.59 | |
| Precious Metals | | | | 14.15 | | | | | 20.51 | |
| Total | | | | 100.00 | | | | | 115.00 | |
| * | Reflects the risk that each asset class is expected to contribute to the overall risk of the Fund as measured by standard deviation and estimates of risk based on historical data. Standard deviation measures the annualized fluctuations (volatility) of monthly returns. |
| ** | Proprietary models determine the Notional Asset Weights necessary to achieve the Target Risk Allocations. Total Notional Asset Weight greater than 100% is achieved through derivatives and other instruments that create leverage. |
| | | | | |
Total Net Assets | | | | $860.5 million | |
|
| 4 Invesco Balanced-Risk Commodity Strategy Fund |
rising global production even as demand fell. Losses in coffee also hurt the agriculture complex as the world’s largest grower, Brazil, had a good harvest. Soybeans and soymeal came under pressure due to a record Brazilian harvest that cut into US exports. Additionally, good weather and growing conditions in the US led to another strong harvest for grains; this put additional pressure on soybeans, soymeal, corn and wheat. Tactical agriculture exposure, obtained through the use of swaps, futures and commodity-linked notes, detracted from Fund performance as gains from exposure to sugar, soybeans and cotton weren’t enough to outweigh losses from coffee, lean hogs and wheat.
Please note that our strategy is principally implemented with derivative instruments that include futures, total return swaps and commodity-linked notes. Therefore, all or most of the performance of the strategy, both positive and negative, can be attributed to these instruments. Derivatives can be a cost-effective way to gain exposure to asset classes. However, derivatives may amplify traditional investment risks through the creation of leverage and may be less liquid than traditional securities.
Thank you for your continued investment in Invesco Balanced-Risk Commodity Strategy Fund.
The views and opinions expressed in management’s discussion of Fund performance are those of Invesco Advisers, Inc. These views and opinions are subject to change at any time based on factors such as market and economic conditions. These views and opinions may not be relied upon as investment advice or recommendations, or as an offer for a particular security. The information is not a complete analysis of every aspect of any market, country, industry, security or the Fund. Statements of fact are from sources considered reliable, but Invesco Advisers, Inc. makes no representation or warranty as to their completeness or accuracy. Although historical performance is no guarantee of future results, these insights may help you understand our investment management philosophy.
See important Fund and, if applicable, index disclosures later in this report.
| | |

| | Mark Ahnrud Chartered Financial Analyst, Portfolio Manager, is manager of Invesco Balanced-Risk Commodity Strategy Fund. He joined |
| Invesco in 2000. Mr. Ahnrud earned a BS in finance and investments from Babson College and an MBA from Duke University Fuqua School of Business. |
| | |
 | | Chris Devine Chartered Financial Analyst, Portfolio Manager, is manager of Invesco Balanced-Risk Commodity Strategy Fund. He joined |
| Invesco in 1998. Mr. Devine earned a BA in economics from Wake Forest University and an MBA from the University of Georgia. |
| | |
 | | Scott Hixon Chartered Financial Analyst, Portfolio Manager, is manager of Invesco Balanced-Risk Commodity Strategy Fund. He joined |
| Invesco in 1994. Mr. Hixon earned a BBA in finance from Georgia Southern University and an MBA in finance from Georgia State University. |
| | |
 | | Christian Ulrich Chartered Financial Analyst, Portfolio Manager, is manager of Invesco Balanced-Risk Commodity Strategy Fund. He joined |
| Invesco in 2000. Mr. Ulrich earned the equivalent of a BBA from the KV Zurich Business School in Zurich, Switzerland. |
| | |
 | | Scott Wolle Chartered Financial Analyst, Portfolio Manager, is manager of Invesco Balanced-Risk Commodity Strategy Fund. He joined |
| Invesco in 1999. Mr. Wolle earned a BS in finance from Virginia Polytechnic Institute and State University and an MBA from Duke University Fuqua School of Business. |
Assisted by Invesco’s Global Asset Allocation Team
|
| 5 Invesco Balanced-Risk Commodity Strategy Fund |
Your Fund’s Long-Term Performance
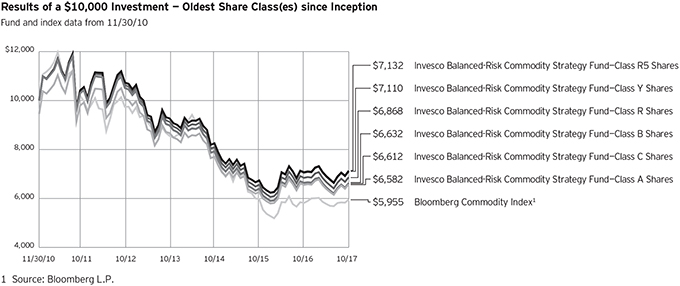
Past performance cannot guarantee comparable future results.
The data shown in the chart include reinvested distributions, applicable sales charges and Fund expenses including management fees. Results for Class B shares are calculated as if a hypothetical
shareholder had liquidated his entire investment in the Fund at the close of the reporting period and paid the contingent deferred sales charges, if applicable. Index results include reinvested dividends, but they do not reflect sales charges. Performance of the peer group, if
applicable, reflects fund expenses and management fees; performance of a market index does not. Performance shown in the chart and table(s) does not reflect deduction of taxes a shareholder would pay on Fund distributions or sale of Fund shares.
continued from page 9
∎ Subsidiary risk. By investing in the Subsidiary, the Fund is indirectly exposed to risks associated with the Subsidiary’s investments. The Subsidiary is not registered under the Investment Company Act of 1940, as amended (1940 Act), and, except as otherwise noted in this prospectus, is not subject to the investor protections of the 1940 Act. Changes in the laws of the United States and/ or the Cayman Islands, under which the Fund and the Subsidiary, respectively, are organized, could result in the inability of the Fund and/or the Subsidiary to operate as described in this prospectus and the SAI, and could negatively affect the Fund and its shareholders.
∎ US government obligations risk. Obligations of US government agencies and authorities receive varying levels of support and may not be backed by the full faith and credit of the US government, which could affect the Fund’s ability to recover should they default. No assurance can be given that the US government will provide financial support to its agencies and authorities if it is not obligated by law to do so.
About indexes used in this report
∎ The Bloomberg Commodity Index is an unmanaged index designed to be a highly liquid and diversified benchmark for the commodity futures market.
∎ The Fund is not managed to track the performance of any particular index, including the index(es) described here, and consequently, the performance of the Fund may deviate significantly from the performance of the index(es).
∎ A direct investment cannot be made in an index. Unless otherwise indicated, index results include reinvested dividends, and they do not reflect sales charges. Performance of the peer group, if applicable, reflects fund expenses; performance of a market index does not.
Other information
∎ The returns shown in management’s discussion of Fund performance are based on net asset values (NAVs) calculated for shareholder transactions. Generally accepted accounting principles require adjustments to be made to the net assets of the Fund at period end for financial reporting purposes, and as such, the NAVs for shareholder transactions and the returns based on those NAVs may differ from the NAVs and returns reported in the Financial Highlights.
|
| 6 Invesco Balanced-Risk Commodity Strategy Fund |
| | | | | |
Average Annual Total Returns | |
| As of 10/31/17, including maximum applicable sales charges | |
| | | | | |
| |
| Class A Shares | | | | | |
| Inception (11/30/10) | | | | -5.87 | % |
| 5 Years | | | | -9.17 | |
| 1 Year | | | | -5.08 | |
| |
| Class B Shares | | | | | |
| Inception (11/30/10) | | | | -5.76 | % |
| 5 Years | | | | -9.16 | |
| 1 Year | | | | -5.07 | |
| |
| Class C Shares | | | | | |
| Inception (11/30/10) | | | | -5.81 | % |
| 5 Years | | | | -8.85 | |
| 1 Year | | | | -1.32 | |
| |
| Class R Shares | | | | | |
| Inception (11/30/10) | | | | -5.29 | % |
| 5 Years | | | | -8.36 | |
| 1 Year | | | | 0.35 | |
| |
| Class Y Shares | | | | | |
| Inception (11/30/10) | | | | -4.81 | % |
| 5 Years | | | | -7.91 | |
| 1 Year | | | | 0.80 | |
| |
| Class R5 Shares | | | | | |
| Inception (11/30/10) | | | | -4.77 | % |
| 5 Years | | | | -7.84 | |
| 1 Year | | | | 0.83 | |
| |
| Class R6 Shares | | | | | |
| Inception | | | | -4.82 | % |
| 5 Years | | | | -7.77 | |
| 1 Year | | | | 1.04 | |
Class R6 shares incepted on September 24, 2012. Performance shown prior to that date is that of Class A shares and includes the 12b-1 fees applicable to Class A shares.
The performance data quoted represent past performance and cannot guarantee comparable future results; current performance may be lower or higher. Please visit invesco.com/performance for the most recent month-end performance. Performance figures reflect reinvested distributions, changes in net asset value and the effect of the maximum sales charge unless otherwise stated. Investment return and principal value will fluctuate so that you may have a gain or loss when you sell shares.
The net annual Fund operating expense ratio set forth in the most recent Fund prospectus as of the date of this report for Class A, Class B, Class C, Class R, Class Y, Class R5 and Class R6 shares was 1.56%, 2.31%, 2.31%,
| | | | | |
Average Annual Total Returns | |
| As of 9/30/17, the most recent calendar quarter end, including maximum applicable sales charges | |
| | | | | |
| |
| Class A Shares | | | | | |
| Inception (11/30/10) | | | | -6.33 | % |
| 5 Years | | | | -10.45 | |
| 1 Year | | | | -8.53 | |
| |
| Class B Shares | | | | | |
| Inception (11/30/10) | | | | -6.22 | % |
| 5 Years | | | | -10.44 | |
| 1 Year | | | | -8.56 | |
| |
| Class C Shares | | | | | |
| Inception (11/30/10) | | | | -6.25 | % |
| 5 Years | | | | -10.10 | |
| 1 Year | | | | -4.81 | |
| |
| Class R Shares | | | | | |
| Inception (11/30/10) | | | | -5.73 | % |
| 5 Years | | | | -9.64 | |
| 1 Year | | | | -3.38 | |
| |
| Class Y Shares | | | | | |
| Inception (11/30/10) | | | | -5.26 | % |
| 5 Years | | | | -9.19 | |
| 1 Year | | | | -2.84 | |
| |
| Class R5 Shares | | | | | |
| Inception (11/30/10) | | | | -5.22 | % |
| 5 Years | | | | -9.13 | |
| 1 Year | | | | -2.81 | |
| |
| Class R6 Shares | | | | | |
| Inception | | | | -5.29 | % |
| 5 Years | | | | -9.09 | |
| 1 Year | | | | -2.74 | |
1.81%, 1.31%, 1.22% and 1.12%, respectively.1 The total annual Fund operating expense ratio set forth in the most recent Fund prospectus as of the date of this report for Class A, Class B, Class C, Class R, Class Y, Class R5 and Class R6 shares was 1.64%, 2.39%, 2.39%, 1.89%, 1.39%, 1.30% and 1.20%, respectively. The expense ratios presented above may vary from the expense ratios presented in other sections of this report that are based on expenses incurred during the period covered by this report.
Class A share performance reflects the maximum 5.50% sales charge, and Class B and Class C share performance reflects the applicable contingent deferred sales charge (CDSC) for the period involved. The CDSC on Class B shares declines from 5% beginning at the time of purchase to 0% at the beginning of the seventh year. The CDSC on Class C shares is 1% for the first year after purchase. Class R, Class Y,
Class R5 and Class R6 shares do not have a front-end sales charge or a CDSC; therefore, performance is at net asset value.
The performance of the Fund’s share classes will differ primarily due to different sales charge structures and class expenses.
Fund performance reflects any applicable fee waivers and/or expense reimbursements. Had the adviser not waived fees and/or reimbursed expenses currently or in the past, returns would have been lower. See current prospectus for more information.
| 1 | Total annual Fund operating expenses after any contractual fee waivers and/or expense reimbursements by the adviser in effect through at least June 30, 2019. See current prospectus for more information. |
|
| 7 Invesco Balanced-Risk Commodity Strategy Fund |
Invesco Balanced-Risk Commodity Strategy Fund’s investment objective is to provide total return.
| ∎ | | Unless otherwise stated, information presented in this report is as of October 31, 2017, and is based on total net assets. |
| ∎ | | Unless otherwise noted, all data provided by Invesco. |
| ∎ | | To access your Fund’s reports/prospectus, visit invesco.com/fundreports. |
About share classes
| ∎ | | Class B shares may not be purchased for new or additional investments. Please see the prospectus for more information. |
| ∎ | | Class R shares are generally available only to employer sponsored retirement and benefit plans. Please see the prospectus for more information. |
| ∎ | | Class Y shares are available only to certain investors. Please see the prospectus for more information. |
| ∎ | | Class R5 shares and Class R6 shares are available for use by retirement plans that meet certain standards and for institutional investors. Class R6 shares are also available through intermediaries that have established an agreement with Invesco Distributors, Inc. to make such shares available for use in retail omnibus accounts. Please see the prospectus for more information. |
Principal risks of investing in the Fund
| ∎ | | Commodities tax risk. The tax treatment of commodity-linked derivative instruments may be adversely affected by changes in legislation, regulations or other legally binding authority. If, as a result of any such adverse action, the income of the Fund from certain commodity-linked derivatives was treated as non-qualifying income, the Fund might fail to qualify as a regulated investment company and be subject to federal income tax at the Fund level. As a result of a recent announcement by the Internal Revenue Service, the Fund intends to invest in commodity-linked notes: (a) directly, generally only to the extent that it obtains an opinion of counsel confirming that income from such investments should be qualifying income because such commodity-linked notes constitute securities under section 2(a)(36) of the 1940 Act or (b) indirectly through the Subsidiary. Should the Internal Revenue Service issue further guidance, or Congress enact legislation, that adversely affects the tax treatment of the Fund’s use of commodity-linked notes or the Subsidiary (which |
| | | guidance might be applied to the Fund retroactively), it could, among other consequences, limit the Fund’s ability to pursue its investment strategy. |
| ∎ | | Commodity-linked notes risk. In addition to risks associated with the underlying commodities, investments in commodity-linked notes may be subject to additional risks, such as non-payment of interest and loss of principal, counterparty risk, lack of a secondary market and risk of greater volatility than traditional equity and debt securities. The value of the commodity-linked notes the Fund buys may fluctuate significantly because the values of the underlying investments to which they are linked are themselves volatile. Additionally, certain commodity-linked notes employ “economic” leverage by requiring payment by the issuer of an amount that is a multiple of the price increase or decrease of the underlying commodity, commodity index, or other economic variable. Such economic leverage will increase the volatility of the value of these commodity-linked notes and the Fund to the extent it invests in such notes. |
| ∎ | | Commodity risk. The Fund will concentrate its investments in commodities markets and will therefore have investment exposure to the commodities markets and one or more sectors of the commodities markets, which may subject the Fund to greater volatility than investments in traditional securities, such as stocks and bonds. Volatility in the commodities markets may be caused by changes in overall market movements, domestic and foreign political and economic events and policies, war, acts of terrorism, changes in domestic or foreign interest rates and/or investor expectations concerning interest rates, domestic and foreign inflation rates, investment and trading activities of mutual funds, hedge funds and commodities funds, and factors such as drought, floods, weather, livestock disease, embargoes, tariffs and other |
| | | regulatory developments, or supply and demand disruptions. Because the Fund’s performance is linked to the performance of volatile commodities, investors should be willing to assume the risks of potentially significant fluctuations in the value of the Fund’s shares. |
| ∎ | | Correlation risk. Because the Fund’s investment strategy seeks to balance risk across the four sectors of the commodities market and, within each commodity sector, across different commodities, to the extent either the sectors of the commodities markets or the selected commodities become correlated in a way not anticipated by the Adviser the Fund’s risk allocation process may result in magnified risks and loss instead of balancing (reducing) the risk of loss. |
| ∎ | | Debt securities risk. The prices of debt securities held by the Fund will be affected by changes in interest rates, the creditworthiness of the issuer and other factors. An increase in prevailing interest rates typically causes the value of existing debt securities to fall and often has a greater impact on longer-duration debt securities and higher quality debt securities. Falling interest rates will cause the Fund to reinvest the proceeds of debt securities that have been repaid by the issuer at lower interest rates. Falling interest rates may also reduce the Fund’s distributable income because interest payments on floating rate debt instruments held by the Fund will decline. The Fund could lose money on investments in debt securities if the issuer or borrower fails to meet its obligations to make interest payments and/or to repay principal in a timely manner. Changes in an issuer’s financial strength, the market’s perception of such strength or in the credit rating of the issuer or the security may affect the value of debt securities. The Adviser’s credit analysis may fail to anticipate such changes, which could result in buying a debt security at an inopportune time or failing to sell a debt security in advance of a price decline or other credit event. |
| ∎ | | Derivatives risk. The value of a derivative instrument depends largely on (and is derived from) the value of an underlying security, currency, commodity, interest rate, index or other |
|
This report must be accompanied or preceded by a currently effective Fund prospectus, which contains more complete information, including sales charges and expenses. Investors should read it carefully before investing. |
|
|
| NOT FDIC INSURED | MAY LOSE VALUE | NO BANK GUARANTEE |
|
| 8 Invesco Balanced-Risk Commodity Strategy Fund |
asset (each referred to as an underlying asset). In addition to risks relating to the underlying assets, the use of derivatives may include other, possibly greater, risks, including counterparty, leverage and liquidity risks. Counterparty risk is the risk that the counterparty to the derivative contract will default on its obligation to pay the Fund the amount owed or otherwise perform under the derivative contract. Derivatives create leverage risk because they do not require payment up front equal to the economic exposure created by owning the derivative. As a result, an adverse change in the value of the underlying asset could result in the Fund sustaining a loss that is substantially greater than the amount invested in the derivative, which may make the Fund’s returns more volatile and increase the risk of loss. Derivative instruments may also be less liquid than more traditional investments and the Fund may be unable to sell or close out its derivative positions at a desirable time or price. This risk may be more acute under adverse market conditions, during which the Fund may be most in need of liquidating its derivative positions. Derivatives may also be harder to value, less tax efficient and subject to changing government regulation that could impact the Fund’s ability to use certain derivatives or their cost. The SEC has proposed new regulations related to the use of derivatives and related instruments by registered investment companies. If adopted as proposed, these regulations would limit the Fund’s ability to engage in derivatives transactions and may result in increased costs or require the Fund to modify its investment strategies or to liquidate. Also, derivatives used for hedging or to gain or limit exposure to a particular market segment may not provide the expected benefits, particularly during adverse market conditions. These risks are greater for the Fund than most other mutual funds because the Fund will implement its investment strategy primarily through derivative instruments
rather than direct investments in stocks/bonds.
| ∎ | | Exchange-traded funds risk. In addition to the risks associated with the underlying assets held by the exchange-traded fund, investments in exchange-traded funds are subject to the following additional risks: (1) an exchange-traded fund’s shares may trade above or below its net asset value; (2) an active trading market for the exchange-traded fund’s shares may not develop or be maintained; (3) trading an exchange-traded fund’s shares may be halted by the listing exchange; (4) a passively managed exchange-traded fund may not track the performance of the reference asset; and (5) a passively managed exchange-traded fund may hold troubled securities. Investment in exchange-traded funds may involve duplication of management fees and certain other expenses, as the Fund indirectly bears its proportionate share of any expenses paid by the exchange-traded funds in which it invests. Further, certain exchange-traded funds in which the Fund may invest are leveraged, which may result in economic leverage, permitting the Fund to gain exposure that is greater than would be the case in an unlevered instrument and potentially resulting in greater volatility. |
| ∎ | | Exchange-traded notes risk. Exchange-traded notes are subject to credit risk, counterparty risk, and the risk that the value of the exchange-traded note may drop due to a downgrade in the issuer’s credit rating. The value of an exchange-traded note may also be influenced by time to maturity, level of supply and demand for the exchange-traded note, volatility and lack of liquidity in the underlying market, changes in the applicable interest rates, and economic, legal, political, or geographic events that affect the referenced underlying market or assets. The Fund will bear its proportionate share of any fees and expenses borne by an exchange-traded note in which it invests. For certain exchange-traded notes, there may be restrictions on the Fund’s right to redeem its investment, which is meant to be held until maturity. |
| ∎ | | Management risk. The Fund is actively managed and depends heavily on the Adviser’s judgment |
| | | about markets, interest rates or the attractiveness, relative values, liquidity, or potential appreciation of particular investments made for the Fund’s portfolio. The Fund could experience losses if these judgments prove to be incorrect. Because the Fund’s investment process relies heavily on its asset allocation process, market movements that are counter to the portfolio managers’ expectations may have a significant adverse effect on the Fund’s net asset value. Additionally, legislative, regulatory, or tax developments may adversely affect management of the Fund and, therefore, the ability of the Fund to achieve its investment objective. |
| ∎ | | Market risk. The market values of the Fund’s investments, and therefore the value of the Fund’s shares, will go up and down, sometimes rapidly or unpredictably. Market risk may affect a single issuer, industry or section of the economy, or it may affect the market as a whole. Individual stock prices tend to go up and down more dramatically than those of certain other types of investments, such as bonds. During a general downturn in the financial markets, multiple asset classes may decline in value. When markets perform well, there can be no assurance that specific investments held by the Fund will rise in value. |
| ∎ | | Short position risk. Because the Fund’s potential loss on a short position arises from increases in the value of the asset sold short, the Fund will incur a loss on a short position, which is theoretically unlimited, if the price of the asset sold short increases from the short sale price. The counterparty to a short position or other market factors may prevent the Fund from closing out a short position at a desirable time or price and may reduce or eliminate any gain or result in a loss. In a rising market, the Fund’s short positions will cause the Fund to underperform the overall market and its peers that do not engage in shorting. If the Fund holds both long and short positions, and both positions decline simultaneously, the short positions will not provide any buffer (hedge) from declines in value of the Fund’s long positions. Certain types of short positions involve leverage, which may exaggerate any losses, potentially more than the actual cost of the investment, and will increase the volatility of the Fund’s returns. |
|
| 9 Invesco Balanced-Risk Commodity Strategy Fund |
Consolidated Schedule of Investments
October 31, 2017
| | | | | | | | | | | | | | | | |
| | | Interest
Rate | | | Maturity
Date | | | Principal
Amount | | | Value | |
U.S. Treasury Securities–32.59% | | | | | | | | | | | | | |
| U.S. Treasury Bills–14.00%(a) | | | | | | | | | | | | | |
U.S. Treasury Bills | | | 1.06 | % | | | 12/14/2017 | | | $ | 25,000,000 | | | $ | 24,971,223 | |
U.S. Treasury Bills | | | 1.10 | % | | | 12/14/2017 | | | | 14,680,000 | | | | 14,663,102 | |
U.S. Treasury Bills(b) | | | 1.12 | % | | | 01/04/2018 | | | | 21,300,000 | | | | 21,260,761 | |
U.S. Treasury Bills | | | 1.11 | % | | | 02/08/2018 | | | | 59,740,000 | | | | 59,556,825 | |
| | | | | | | | | | | | | | | | 120,451,911 | |
| | | |
| U.S. Treasury Notes–18.59%(c) | | | | | | | | | | | | | |
U.S. Treasury Floating Rate Notes (3 mo. U.S. Treasury Bill Money Market Yield Rate + 0.17%) | | | 1.28 | % | | | 07/31/2018 | | | | 43,910,000 | | | | 43,977,182 | |
U.S. Treasury Floating Rate Notes (3 mo. U.S. Treasury Bill Money Market Yield Rate + 0.19%) | | | 1.30 | % | | | 04/30/2018 | | | | 53,010,000 | | | | 53,070,506 | |
U.S. Treasury Floating Rate Notes (3 mo. U.S. Treasury Bill Money Market Yield Rate + 0.27%) | | | 1.38 | % | | | 01/31/2018 | | | | 62,880,000 | | | | 62,929,329 | |
| | | | | | | | | | | | | | | | 159,977,017 | |
Total U.S. Treasury Securities (Cost $280,245,275) | | | | | | | | | | | | | | | 280,428,928 | |
| | | | |
| | | | | | Expiration
Date | | | | | | | |
Commodity-Linked Securities–6.21% | | | | | | | | | | | | | | | | |
Barclays Bank PLC (United Kingdom) , U.S. Federal Funds (Effective) rate minus 0.06% (linked to the Barclays Diversified Energy-Metals Total Return Index, multiplied by 3)(d) | | | | | | | 07/19/2018 | | | | 21,150,000 | | | | 29,378,405 | |
International Bank for Reconstruction and Development, 6 month USD LIBOR rate minus 0.60% (linked to the Barclays Diversified Energy-Metals Total Return Index, multiplied by 2) | | | | | | | 04/26/2018 | | | | 20,000,000 | | | | 24,021,605 | |
Total Commodity-Linked Securities (Cost $41,150,000) | | | | | | | | | | | | | | | 53,400,010 | |
| | | | |
| | | | | | | | | Shares | | | | |
Exchange-Traded Fund–0.96% | | | | | | | | | | | | | | | | |
PowerShares DB Gold Fund (Cost $11,674,831)(e) | | | | | | | | | | | 205,000 | | | | 8,284,050 | |
| | | | |
Money Market Funds–54.32% | | | | | | | | | | | | | | | | |
Invesco Government & Agency Portfolio–Institutional Class, 0.95%(f) | | | | | | | | | | | 241,468,431 | | | | 241,468,431 | |
Invesco Treasury Portfolio–Institutional Class, 0.94%(f) | | | | | | | | | | | 142,210,288 | | | | 142,210,288 | |
STIC (Global Series) PLC–U.S. Dollar Liquidity Portfolio (Ireland)–Institutional Class, 1.25%(f) | | | | | | | | | | | 83,721,222 | | | | 83,721,222 | |
Total Money Market Funds (Cost $467,399,941) | | | | | | | | | | | | | | | 467,399,941 | |
TOTAL INVESTMENTS IN SECURITIES–94.08% (Cost $800,470,047) | | | | | | | | | | | | | | | 809,512,929 | |
OTHER ASSETS LESS LIABILITIES–5.92% | | | | | | | | | | | | | | | 50,949,348 | |
NET ASSETS–100.00% | | | | | | | | | | | | | | $ | 860,462,277 | |
See accompanying Notes to Consolidated Financial Statements which are an integral part of the financial statements.
10 Invesco Balanced-Risk Commodity Strategy Fund
| | | | | | | | | | | | | | | | | | | | |
| Open Futures Contracts | |
| Long Futures Contracts | | Number of
Contracts | | | Expiration
Month | | | Notional
Value | | | Value | | | Unrealized
Appreciation
(Depreciation) | |
Coffee C | | | 202 | | | | December-2017 | | | $ | 9,476,325 | | | $ | (1,296,235 | ) | | $ | (1,296,235 | ) |
Corn | | | 565 | | | | December-2017 | | | | 9,767,438 | | | | (1,173,008 | ) | | | (1,173,008 | ) |
Cotton No. 2 | | | 1,151 | | | | December-2017 | | | | 39,352,690 | | | | (2,011,364 | ) | | | (2,011,364 | ) |
Lean Hogs | | | 55 | �� | | | December-2017 | | | | 1,496,000 | | | | 145,330 | | | | 145,330 | |
LME Zinc | | | 356 | | | | January-2018 | | | | 29,156,400 | | | | 370,500 | | | | 370,500 | |
NYH RBOB Gasoline (Globex) | | | 1,000 | | | | December-2017 | | | | 72,765,000 | | | | 6,061,030 | | | | 6,061,030 | |
Natural Gas | | | 450 | | | | December-2017 | | | | 3,258,000 | | | | (241,380 | ) | | | (241,380 | ) |
Soybean | | | 757 | | | | July-2018 | | | | 38,313,663 | | | | 312,158 | | | | 312,158 | |
Wheat | | | 575 | | | | December-2017 | | | | 12,031,875 | | | | (3,508,331 | ) | | | (3,508,331 | ) |
Subtotal — Long | | | | | | | | | | | | | | | (1,341,300 | ) | | | (1,341,300 | ) |
| | | | | |
| Short Futures Contracts | | | | | | | | | | | | | | | |
Cocoa | | | 123 | | | | March-2018 | | | | (2,569,470 | ) | | | (39,293 | ) | | | (39,293 | ) |
Total Futures Contracts — Commodity Risk | | | | | | | | | | | | | | $ | (1,380,593 | ) | | $ | (1,380,593 | ) |
| | | | | | | | | | | | | | | | | | | | | | | | | | | | | | | | | | | | | | |
| Open Over-The-Counter Total Return Swap Agreements(g) | |
| Counterparty | | Pay/
Receive | | | Reference Entity(h) | | Fixed
Rate | | | Payment
Frequency | | | Number of
Contracts | | | Maturity
Date | | | Notional
Value | | | Upfront
Payments
Paid
(Received) | | | Value | | | Unrealized
Appreciation
(Depreciation) | |
Barclays Bank PLC | | | Receive | | | Barclays Heating Oil Roll Yield
Excess Return Index | | | 0.37 | % | | | Monthly | | | | 141,100 | | | | January-2018 | | | $ | 33,368,033 | | | $ | — | | | $ | 1,513,664 | | | $ | 1,513,664 | |
Barclays Bank PLC | | | Receive | | | Barclays Live Cattle Roll Yield
Excess Return Index | | | 0.47 | | | | Monthly | | | | 27,000 | | | | January-2018 | | | | 3,547,600 | | | | — | | | | 121,983 | | | | 121,983 | |
Barclays Bank PLC | | | Receive | | | Barclays WTI Crude Roll Yield
Excess Return Index | | | 0.35 | | | | Monthly | | | | 51,200 | | | | March-2018 | | | | 12,395,116 | | | | — | | | | 394,511 | | | | 394,511 | |
Canadian Imperial Bank of Commerce | | | Receive | | | CIBC Dynamic Roll LME
Copper Excess Return
Index 2 | | | 0.30 | | | | Monthly | | | | 447,000 | | | | April-2018 | | | | 38,454,874 | | | | — | | | | 124,937 | | | | 124,937 | |
Goldman Sachs International | | | Receive | | | Enhanced Strategy AB31 on
the S&P GSCI Cotton Excess
Return Index | | | 0.45 | | | | Monthly | | | | 862,000 | | | | October-2018 | | | | 32,752,191 | | | | — | | | | 319,378 | | | | 319,378 | |
Goldman Sachs International | | | Receive | | | Enhanced Strategy Sugar
A141 on the S&P GSCI Sugar
Excess Return Index | | | 0.37 | | | | Monthly | | | | 198,300 | | | | March-2018 | | | | 39,773,150 | | | | — | | | | 2,102,278 | | | | 2,102,278 | |
JPMorgan Chase Bank, N.A. | | | Receive | | | J.P. Morgan Contag Beta Gas
Oil Excess Return Index | | | 0.25 | | | | Monthly | | | | 92,000 | | | | April-2018 | | | | 20,015,998 | | | | — | | | | 937,204 | | | | 937,204 | |
Macquarie Bank Ltd. | | | Receive | | | Modified Macquarie Single
Commodity Sugar type A
Excess Return Index | | | 0.34 | | | | Monthly | | | | 114,000 | | | | January-2018 | | | | 21,219,379 | | | | — | | | | 838,003 | | | | 838,003 | |
Merrill Lynch International | | | Receive | | | Merrill Lynch Gold Excess
Return Index | | | 0.14 | | | | Monthly | | | | 10,900 | | | | June-2018 | | | | 1,767,328 | | | | — | | | | 0 | | | | 0 | |
Merrill Lynch International | | | Receive | | | Merrill Lynch Gold Excess
Return Index | | | 0.14 | | | | Monthly | | | | 253,600 | | | | June-2018 | | | | 41,118,755 | | | | — | | | | 0 | | | | 0 | |
Merrill Lynch International | | | Receive | | | MLCX Aluminum Annual
Excess Return Index | | | 0.28 | | | | Monthly | | | | 61,500 | | | | September-2018 | | | | 7,371,230 | | | | — | | | | 0 | | | | 0 | |
Merrill Lynch International | | | Receive | | | MLCX Dynamic Enhanced
Copper Excess Return Index | | | 0.25 | | | | Monthly | | | | 58,300 | | | | September-2018 | | | | 38,622,601 | | | | — | | | | 0 | | | | 0 | |
Merrill Lynch International | | | Receive | | | MLCX Natural Gas Annual
Excess Return Index | | | 0.25 | | | | Monthly | | | | 666,000 | | | | September-2018 | | | | 29,563,693 | | | | — | | | | 0 | | | | 0 | |
Morgan Stanley Capital Services LLC | | | Receive | | | MS Soybean Oil Dynamic Roll
Index | | | 0.30 | | | | Monthly | | | | 95,300 | | | | April-2018 | | | | 14,636,622 | | | | — | | | | 463,892 | | | | 463,892 | |
Royal Bank of Canada | | | Receive | | | RBC Enhanced Brent Crude Oil
01 Excess Return Index | | | 0.35 | | | | Monthly | | | | 92,600 | | | | March-2018 | | | | 26,717,656 | | | | — | | | | 0 | | | | 0 | |
Royal Bank of Canada | | | Receive | | | RBC Enhanced Brent Crude Oil
01 Excess Return Index | | | 0.35 | | | | Monthly | | | | 36,900 | | | | March-2018 | | | | 10,646,668 | | | | — | | | | 0 | | | | 0 | |
Royal Bank of Canada | | | Receive | | | RBC Enhanced Copper LME
01 Excess Return Index | | | 0.28 | | | | Monthly | | | | 35,700 | | | | June-2018 | | | | 22,296,792 | | | | — | | | | 0 | | | | 0 | |
Subtotal — Appreciation | | | | — | | | | 6,815,850 | | | | 6,815,850 | |
See accompanying Notes to Consolidated Financial Statements which are an integral part of the financial statements.
11 Invesco Balanced-Risk Commodity Strategy Fund
| | | | | | | | | | | | | | | | | | | | | | | | | | | | | | | | | | | | | | | | |
| Open Over-The-Counter Total Return Swap Agreements—(continued)(g) | |
| Counterparty | | Pay/
Receive | | | Reference Entity(h) | | | Fixed
Rate | | | Payment
Frequency | | | Number of
Contracts | | | Maturity
Date | | | Notional
Value | | | Upfront
Payments
Paid
(Received) | | | Value | | | Unrealized
Appreciation
(Depreciation) | |
Barclays Bank PLC | | | Receive | | |
| Barclays Soybeans Seasonal
Excess Return Index |
| | | 0.30 | % | | | Monthly | | | | 80,700 | | | | May-2018 | | | $ | 23,435,893 | | | $ | — | | | $ | (347,834 | ) | | $ | (347,834 | ) |
Goldman Sachs International | | | Receive | | |
| S&P GSCI Soybean Meal
Excess Return Index |
| | | 0.30 | | | | Monthly | | | | 56,700 | | | | January-2018 | | | | 61,606,081 | | | | — | | | | (722,471 | ) | | | (722,471 | ) |
JPMorgan Chase Bank, N.A. | | | Receive | | |
| S&P GSCI Gold Index Excess
Return |
| | | 0.09 | | | | Monthly | | | | 427,000 | | | | October-2018 | | | | 44,538,278 | | | | — | | | | (361,669 | ) | | | (361,669 | ) |
Macquarie Bank Ltd. | | | Receive | | |
| Macquarie Aluminum
Dynamic Selection Index |
| | | 0.30 | | | | Monthly | | | | 1,219,000 | | | | December-2017 | | | | 71,989,874 | | | | — | | | | (817,705 | ) | | | (817,705 | ) |
Macquarie Bank Ltd. | | | Receive | | |
| Macquarie Single
Commodity Silver type A
Excess Return Index |
| | | 0.16 | | | | Monthly | | | | 210,500 | | | | May-2018 | | | | 41,465,848 | | | | — | | | | (568,413 | ) | | | (568,413 | ) |
Subtotal — Depreciation | | | | | | | | | | | | | | | | | | | | | | | | | | | | | | | — | | | | (2,818,092 | ) | | | (2,818,092 | ) |
Total Swap Agreements — Commodity Risk | | | $ | — | | | $ | 3,997,758 | | | $ | 3,997,758 | |
Investment Abbreviations:
| | |
| Barclays Diversified Energy-Metals Total Return Index | | — a basket of indices that provide exposure to various components of the energy and metals markets. The underlying commodities comprising the indices are: Brent Crude Oil, Copper, Gasoil, Gold, Silver, Unleaded Gasoline, and WTI Crude Oil. |
| LIBOR | | — London Interbank Offered Rate |
| USD | | — U.S. Dollar |
Notes to Consolidated Schedule of Investments:
| (a) | Security traded on a discount basis. The interest rate shown represents the discount rate at the time of purchase by the Fund. |
| (b) | All or a portion of the value was pledged as collateral to cover margin requirements for open futures contracts. See Note 1J. |
| (c) | Interest or dividend rate is redetermined periodically. Rate shown is the rate in effect on October 31, 2017. |
| (d) | Security purchased or received in transaction exempt from registration under the Securities Act of 1933, as amended (the “1933 Act”). The security may be resold pursuant to an exemption from registration under the 1933 Act, typically to qualified institutional buyers. The value of this security, at October 31, 2017, represented 3.41% of the Fund’s Net Assets. |
| (e) | Affiliated company. The security and the Fund are affiliated by having the same investment adviser. See Note 5. |
| (f) | The money market fund and the Fund are affiliated by having the same investment adviser. The rate shown is the 7-day SEC standardized yield as of October 31, 2017. |
| (g) | The Fund receives or pays payments based on any positive or negative return on the Reference Entity, respectively. |
| (h) | The table below includes additional information regarding the underlying components of certain reference entities that are not publicly available. |
| | | | | | | | |
| Reference Entity Components | |
| Reference Entity | | Underlying Components | | | Percentage | |
Barclays Heating Oil Roll Yield Excess Return Index | | | | | | | | |
| | | Long Futures Contracts | | | | | |
| | | Heating Oil | | | | 100 | % |
Barclays Live Cattle Roll Yield Excess Return Index | | | | | | | | |
| | | Long Futures Contracts | | | | | |
| | | Live Cattle | | | | 100 | % |
Barclays WTI Crude Roll Yield Excess Return Index | | | | | | | | |
| | | Long Futures Contracts | | | | | |
| | | WTI Crude | | | | 100 | % |
CIBC Dynamic Roll LME Copper Excess Return Index 2 | | | | | | | | |
| | | Long Futures Contracts | | | | | |
| | | Copper | | | | 100 | % |
Enhanced Strategy AB31 on the S&P GSCI Cotton Excess Return Index | | | | | | | | |
| | | Long Futures Contracts | | | | | |
| | | Cotton No.2 | | | | 100 | % |
Enhanced Strategy Sugar A141 on the S&P GSCI Sugar Excess Return Index | | | | | | | | |
| | | Long Futures Contracts | | | | | |
| | | Sugar | | | | 100 | % |
See accompanying Notes to Consolidated Financial Statements which are an integral part of the financial statements.
12 Invesco Balanced-Risk Commodity Strategy Fund
| | | | | | | | |
| Reference Entity Components—(continued) | |
| Reference Entity | | Underlying Components | | | Percentage | |
J.P. Morgan Contag Beta Gas Oil Excess Return Index | | | | | | | | |
| | | Long Futures Contracts | | | | | |
| | | Gas Oil | | | | 100 | % |
Modified Macquarie Single Commodity Sugar type A Excess Return Index | | | | | | | | |
| | | Long Futures Contracts | | | | | |
| | | Sugar | | | | 100 | % |
Merrill Lynch Gold Excess Return Index | | | | | | | | |
| | | Long Futures Contracts | | | | | |
| | | Gold | | | | 100 | % |
MLCX Aluminum Annual Excess Return Index | | | | | | | | |
| | | Long Futures Contracts | | | | | |
| | | Aluminum | | | | 100 | % |
MLCX Dynamic Enhanced Copper Excess Return Index | | | | | | | | |
| | | Long Futures Contracts | | | | | |
| | | Copper | | | | 100 | % |
MLCX Natural Gas Annual Excess Return Index | | | | | | | | |
| | | Long Futures Contracts | | | | | |
| | | Natural Gas | | | | 100 | % |
MS Soybean Oil Dynamic Roll Index | | | | | | | | |
| | | Long Futures Contracts | | | | | |
| | | Soybean Oil | | | | 100 | % |
RBC Enhanced Brent Crude Oil 01 Excess Return Index | | | | | | | | |
| | | Long Futures Contracts | | | | | |
| | | Brent Crude | | | | 100 | % |
RBC Enhanced Copper LME 01 Excess Return Index | | | | | | | | |
| | | Long Futures Contracts | | | | | |
| | | Copper | | | | 100 | % |
Barclays Soybeans Seasonal Excess Return Index | | | | | | | | |
| | | Long Futures Contracts | | | | | |
| | | Soybeans | | | | 100 | % |
S&P GSCI Soybean Meal Excess Return Index | | | | | | | | |
| | | Long Futures Contracts | | | | | |
| | | Soybean Meal | | | | 100 | % |
S&P GSCI Gold Index Excess Return | | | | | | | | |
| | | Long Futures Contracts | | | | | |
| | | Gold | | | | 100 | % |
Macquarie Aluminum Dynamic Selection Index | | | | | | | | |
| | | Long Futures Contracts | | | | | |
| | | Aluminum | | | | 100 | % |
Macquarie Single Commodity Silver type A Excess Return Index | | | | | | | | |
| | | Long Futures Contracts | | | | | |
| | | Silver | | | | 100 | % |
See accompanying Notes to Consolidated Financial Statements which are an integral part of the financial statements.
13 Invesco Balanced-Risk Commodity Strategy Fund
Consolidated Statement of Assets and Liabilities
October 31, 2017
| | | | |
Assets: | | | | |
Investments in securities, at value
(Cost $321,395,275) | | $ | 333,828,938 | |
Investments in affiliates, at value (Cost $479,074,772) | | | 475,683,991 | |
Other investments: | |
Variation margin receivable — futures contracts | | | 346,393 | |
Unrealized appreciation on LME futures contracts | | | 370,500 | |
Swaps receivable — OTC | | | 5,754,430 | |
Unrealized appreciation on swap agreements — OTC | | | 6,815,850 | |
Cash | | | 4,970,383 | |
Deposits with brokers: | |
Cash collateral — OTC derivatives | | | 37,763,144 | |
Receivable for: | |
Fund shares sold | | | 1,390,595 | |
Dividends and interest | | | 505,035 | |
Fund expenses absorbed | | | 14,894 | |
Investment for trustee deferred compensation and retirement plans | | | 75,341 | |
Other assets | | | 79,629 | |
Total assets | | | 867,599,123 | |
| |
Liabilities: | | | | |
Other investments: | | | | |
LME futures contracts payable | | | 1,111,204 | |
Swaps payable — OTC | | | 1,873,984 | |
Unrealized depreciation on swap agreements — OTC | | | 2,818,092 | |
Payable for: | |
Fund shares reacquired | | | 796,279 | |
Accrued fees to affiliates | | | 287,988 | |
Accrued trustees’ and officers’ fees and benefits | | | 2,800 | |
Accrued other operating expenses | | | 111,055 | |
Trustee deferred compensation and retirement plans | | | 135,444 | |
Total liabilities | | | 7,136,846 | |
Net assets applicable to shares outstanding | | $ | 860,462,277 | |
| |
Net assets consist of: | | | | |
Shares of beneficial interest | | $ | 895,985,347 | |
Undistributed net investment income (loss) | | | (3,385,403 | ) |
Undistributed net realized gain (loss) | | | (43,797,714 | ) |
Net unrealized appreciation | | | 11,660,047 | |
| | | $ | 860,462,277 | |
| | | | |
Net Assets: | | | | |
Class A | | $ | 56,532,307 | |
Class B | | $ | 62,401 | |
Class C | | $ | 7,086,452 | |
Class R | | $ | 1,683,242 | |
Class Y | | $ | 577,236,107 | |
Class R5 | | $ | 205,568,275 | |
Class R6 | | $ | 12,293,493 | |
|
Shares outstanding, no par value,
with an unlimited number of shares authorized: | |
Class A | | | 8,437,543 | |
Class B | | | 9,723 | |
Class C | | | 1,106,565 | |
Class R | | | 254,298 | |
Class Y | | | 84,671,507 | |
Class R5 | | | 30,048,389 | |
Class R6 | | | 1,793,238 | |
Class A: | | | | |
Net asset value per share | | $ | 6.70 | |
Maximum offering price per share | | | | |
(Net asset value of $6.70 ¸ 94.50%) | | $ | 7.09 | |
Class B: | | | | |
Net asset value and offering price per share | | $ | 6.42 | |
Class C: | | | | |
Net asset value and offering price per share | | $ | 6.40 | |
Class R: | | | | |
Net asset value and offering price per share | | $ | 6.62 | |
Class Y: | | | | |
Net asset value and offering price per share | | $ | 6.82 | |
Class R5: | | | | |
Net asset value and offering price per share | | $ | 6.84 | |
Class R6: | | | | |
Net asset value and offering price per share | | $ | 6.86 | |
See accompanying Notes to Consolidated Financial Statements which are an integral part of the financial statements.
14 Invesco Balanced-Risk Commodity Strategy Fund
Consolidated Statement of Operations
For the year ended October 31, 2017
| | | | |
Investment income: | |
Dividends from affiliates | | $ | 2,938,455 | |
Interest | | | 3,117,598 | |
Total investment income | | | 6,056,053 | |
| |
Expenses: | | | | |
Advisory fees | | | 8,659,543 | |
Administrative services fees | | | 224,857 | |
Custodian fees | | | 38,740 | |
Distribution fees: | | | | |
Class A | | | 122,618 | |
Class B | | | 1,011 | |
Class C | | | 75,551 | |
Class R | | | 5,575 | |
Transfer agent fees — A, B, C, R and Y | | | 1,055,803 | |
Transfer agent fees — R5 | | | 163,008 | |
Transfer agent fees — R6 | | | 116 | |
Trustees’ and officers’ fees and benefits | | | 31,593 | |
Registration and filing fees | | | 141,811 | |
Reports to shareholders | | | 495,509 | |
Professional services fees | | | 100,815 | |
Other | | | 32,468 | |
Total expenses | | | 11,149,018 | |
Less: Fees waived and expense offset arrangement(s) | | | (554,248 | ) |
Net expenses | | | 10,594,770 | |
Net investment income (loss) | | | (4,538,717 | ) |
| |
Realized and unrealized gain (loss) from: | | | | |
Net realized gain (loss) from: | | | | |
Investment securities | | | 94,859 | |
Futures contracts | | | (9,816,300 | ) |
Swap agreements | | | 83,183 | |
| | | | (9,638,258 | ) |
Change in net unrealized appreciation (depreciation) of: | | | | |
Investment securities | | | 11,469,638 | |
Futures contracts | | | (2,206,000 | ) |
Swap agreements | | | 7,558,759 | |
| | | | 16,822,397 | |
Net realized and unrealized gain | | | 7,184,139 | |
Net increase in net assets resulting from operations | | $ | 2,645,422 | |
See accompanying Notes to Consolidated Financial Statements which are an integral part of the financial statements.
15 Invesco Balanced-Risk Commodity Strategy Fund
Consolidated Statement of Changes in Net Assets
For the years ended October 31, 2017 and 2016
| | | | | | | | |
| | | 2017 | | | 2016 | |
Operations: | | | | | |
Net investment income (loss) | | $ | (4,538,717 | ) | | $ | (5,571,393 | ) |
Net realized gain (loss) | | | (9,638,258 | ) | | | 26,118,397 | |
Change in net unrealized appreciation | | | 16,822,397 | | | | 9,295,204 | |
Net increase in net assets resulting from operations | | | 2,645,422 | | | | 29,842,208 | |
| | |
Distributions to shareholders from net investment income: | | | | | | | | |
Class A | | | (1,091,128 | ) | | | — | |
Class B | | | (3,367 | ) | | | — | |
Class C | | | (160,205 | ) | | | — | |
Class R | | | (18,396 | ) | | | — | |
Class Y | | | (16,712,187 | ) | | | — | |
Class R5 | | | (5,253,994 | ) | | | — | |
Class R6 | | | (56,525 | ) | | | — | |
Total distributions from net investment income | | | (23,295,802 | ) | | | — | |
| | |
Share transactions-net: | | | | | | | | |
Class A | | | 16,448,650 | | | | 3,941,729 | |
Class B | | | (85,660 | ) | | | (109,926 | ) |
Class C | | | 1,425,627 | | | | 3,261,855 | |
Class R | | | 892,561 | | | | 395,187 | |
Class Y | | | 19,012,305 | | | | 334,368,542 | |
Class R5 | | | 12,788,459 | | | | (77,810,884 | ) |
Class R6 | | | 10,313,107 | | | | (106,334,147 | ) |
Net increase in net assets resulting from share transactions | | | 60,795,049 | | | | 157,712,356 | |
Net increase in net assets | | | 40,144,669 | | | | 187,554,564 | |
| | |
Net assets: | | | | | | | | |
Beginning of year | | | 820,317,608 | | | | 632,763,044 | |
End of year (includes undistributed net investment income (loss) of $(3,385,403) and $33,321,004, respectively) | | $ | 860,462,277 | | | $ | 820,317,608 | |
Notes to Consolidated Financial Statements
October 31, 2017
NOTE 1—Significant Accounting Policies
Invesco Balanced-Risk Commodity Strategy Fund (the “Fund”) is a series portfolio of AIM Investment Funds (Invesco Investment Funds) (the “Trust”). The Trust is organized as a Delaware statutory trust and is registered under the Investment Company Act of 1940, as amended (the “1940 Act”), as an open-end series management investment company consisting of twenty separate series portfolios, each authorized to issue an unlimited number of shares of beneficial interest. The assets, liabilities and operations of each portfolio are accounted for separately. Information presented in these consolidated financial statements pertains only to the Fund. Matters affecting each portfolio or class will be voted on exclusively by the shareholders of such portfolio or class.
The Fund will seek to gain exposure to the commodity markets primarily through investments in the Invesco Cayman Commodity Fund III Ltd. (the “Subsidiary”), a wholly-owned subsidiary of the Fund organized under the laws of the Cayman Islands. The Subsidiary was organized by the Fund to invest in commodity-linked derivatives and other securities that may provide leveraged and non-leveraged exposure to commodities. The Fund may invest up to 25% of its total assets in the Subsidiary.
The Fund’s investment objective is to provide total return.
The Fund currently consists of seven different classes of shares: Class A, Class B, Class C, Class R, Class Y, Class R5 and Class R6. Class Y shares are available only to certain investors. Class A shares are sold with a front-end sales charge unless certain waiver criteria are met and under certain circumstances load waived shares may be subject to contingent deferred sales charges (“CDSC”). Class C shares are sold with a CDSC. Class R, Class Y, Class R5 and Class R6 shares are sold at net asset value. Effective November 30, 2010, new or additional investments in Class B shares are no longer permitted. Existing shareholders of Class B shares may continue to reinvest dividends and capital gains distributions in Class B shares until they convert to Class A shares. Also, shareholders in Class B shares will be able to exchange those shares for Class B shares of other Invesco Funds offering such shares until they convert to Class A shares. Generally, Class B shares will automatically convert to Class A shares on or about the month-end, which is at least eight years after the date of purchase. Redemption of Class B shares prior to the conversion date will be subject to a CDSC.
16 Invesco Balanced-Risk Commodity Strategy Fund
The Fund is an investment company and accordingly follows the investment company accounting and reporting guidance in accordance with Financial Accounting Standards Board Accounting Standards Codification Topic 946, Financial Services — Investment Companies.
The following is a summary of the significant accounting policies followed by the Fund in the preparation of its consolidated financial statements.
| A. | Security Valuations — Securities, including restricted securities, are valued according to the following policy. |
Debt obligations (including convertible securities) and unlisted equities are fair valued using an evaluated quote provided by an independent pricing service. Evaluated quotes provided by the pricing service may be determined without exclusive reliance on quoted prices, and may reflect appropriate factors such as institution-size trading in similar groups of securities, developments related to specific securities, dividend rate (for unlisted equities), yield (for debt obligations), quality, type of issue, coupon rate (for debt obligations), maturity (for debt obligations), individual trading characteristics and other market data. Pricing services generally value debt obligations assuming orderly transactions of institutional round lot size, but a fund may hold or transact in the same securities in smaller, odd lot sizes. Odd lots often trade at lower prices than institutional round lots. Debt obligations are subject to interest rate and credit risks. In addition, all debt obligations involve some risk of default with respect to interest and/or principal payments.
A security listed or traded on an exchange (except convertible securities) is valued at its last sales price or official closing price as of the close of the customary trading session on the exchange where the security is principally traded, or lacking any sales or official closing price on a particular day, the security may be valued at the closing bid price on that day. Securities traded in the over-the-counter market are valued based on prices furnished by independent pricing services or market makers. When such securities are valued by an independent pricing service they may be considered fair valued. Futures contracts are valued at the final settlement price set by an exchange on which they are principally traded. Listed options are valued at the mean between the last bid and asked prices from the exchange on which they are principally traded. Options not listed on an exchange are valued by an independent source at the mean between the last bid and asked prices. For purposes of determining net asset value (“NAV”) per share, futures and option contracts generally are valued 15 minutes after the close of the customary trading session of the New York Stock Exchange (“NYSE”).
Investments in open-end and closed-end registered investment companies that do not trade on an exchange are valued at the end-of-day net asset value per share. Investments in open-end and closed-end registered investment companies that trade on an exchange are valued at the last sales price or official closing price as of the close of the customary trading session on the exchange where the security is principally traded.
Swap agreements are fair valued using an evaluated quote, if available, provided by an independent pricing service. Evaluated quotes provided by the pricing service are valued based on a model which may include end-of-day net present values, spreads, ratings, industry, company performance and returns of referenced assets. Centrally cleared swap agreements are valued at the daily settlement price determined by the relevant exchange or clearinghouse.
Foreign securities’ (including foreign exchange contracts) prices are converted into U.S. dollar amounts using the applicable exchange rates as of the close of the NYSE. If market quotations are available and reliable for foreign exchange-traded equity securities, the securities will be valued at the market quotations. Because trading hours for certain foreign securities end before the close of the NYSE, closing market quotations may become unreliable. If between the time trading ends on a particular security and the close of the customary trading session on the NYSE, events occur that the investment adviser determines are significant and make the closing price unreliable, the Fund may fair value the security. If the event is likely to have affected the closing price of the security, the security will be valued at fair value in good faith using procedures approved by the Board of Trustees. Adjustments to closing prices to reflect fair value may also be based on a screening process of an independent pricing service to indicate the degree of certainty, based on historical data, that the closing price in the principal market where a foreign security trades is not the current value as of the close of the NYSE. Foreign securities’ prices meeting the approved degree of certainty that the price is not reflective of current value will be priced at the indication of fair value from the independent pricing service. Multiple factors may be considered by the independent pricing service in determining adjustments to reflect fair value and may include information relating to sector indices, American Depositary Receipts and domestic and foreign index futures. Foreign securities may have additional risks including exchange rate changes, potential for sharply devalued currencies and high inflation, political and economic upheaval, the relative lack of issuer information, relatively low market liquidity and the potential lack of strict financial and accounting controls and standards.
Securities for which market prices are not provided by any of the above methods may be valued based upon quotes furnished by independent sources. The last bid price may be used to value equity securities. The mean between the last bid and asked prices is used to value debt obligations, including corporate loans.
Securities for which market quotations are not readily available or became unreliable are valued at fair value as determined in good faith by or under the supervision of the Trust’s officers following procedures approved by the Board of Trustees. Issuer specific events, market trends, bid/asked quotes of brokers and information providers and other market data may be reviewed in the course of making a good faith determination of a security’s fair value.
The Fund may invest in securities that are subject to interest rate risk, meaning the risk that the prices will generally fall as interest rates rise and, conversely, the prices will generally rise as interest rates fall. Specific securities differ in their sensitivity to changes in interest rates depending on their individual characteristics. Changes in interest rates may result in increased market volatility, which may affect the value and/or liquidity of certain Fund investments.
Valuations change in response to many factors including the historical and prospective earnings of the issuer, the value of the issuer’s assets, general economic conditions, interest rates, investor perceptions and market liquidity. Because of the inherent uncertainties of valuation, the values reflected in the consolidated financial statements may materially differ from the value received upon actual sale of those investments.
| B. | Securities Transactions and Investment Income — Securities transactions are accounted for on a trade date basis. Realized gains or losses on sales are computed on the basis of specific identification of the securities sold. Interest income (net of withholding tax, if any) is recorded on the accrual basis from settlement date. Bond premiums and discounts are amortized and/or accreted over the lives of the respective securities. Pay-in-kind income received in the form of securities in-lieu of cash is recorded as interest income. Dividend income (net of withholding tax, if any) is recorded on the ex-dividend date. |
The Fund may periodically participate in litigation related to Fund investments. As such, the Fund may receive proceeds from litigation settlements. Any proceeds received are included in the Consolidated Statement of Operations as realized gain (loss) for investments no longer held and as unrealized gain (loss) for investments still held.
17 Invesco Balanced-Risk Commodity Strategy Fund
Brokerage commissions and mark ups are considered transaction costs and are recorded as an increase to the cost basis of securities purchased and/or a reduction of proceeds on a sale of securities. Such transaction costs are included in the determination of net realized and unrealized gain (loss) from investment securities reported in the Consolidated Statement of Operations and the Consolidated Statement of Changes in Net Assets and the net realized and unrealized gains (losses) on securities per share in the Financial Highlights. Transaction costs are included in the calculation of the Fund’s net asset value and, accordingly, they reduce the Fund’s total returns. These transaction costs are not considered operating expenses and are not reflected in net investment income reported in the Consolidated Statement of Operations and the Consolidated Statement of Changes in Net Assets, or the net investment income per share and the ratios of expenses and net investment income reported in the Financial Highlights, nor are they limited by any expense limitation arrangements between the Fund and the investment adviser.
The Fund allocates income and realized and unrealized capital gains and losses to a class based on the relative net assets of each class.
| C. | Country Determination — For the purposes of making investment selection decisions and presentation in the Consolidated Schedule of Investments, the investment adviser may determine the country in which an issuer is located and/or credit risk exposure based on various factors. These factors include the laws of the country under which the issuer is organized, where the issuer maintains a principal office, the country in which the issuer derives 50% or more of its total revenues and the country that has the primary market for the issuer’s securities, as well as other criteria. Among the other criteria that may be evaluated for making this determination are the country in which the issuer maintains 50% or more of its assets, the type of security, financial guarantees and enhancements, the nature of the collateral and the sponsor organization. Country of issuer and/or credit risk exposure has been determined to be the United States of America, unless otherwise noted. |
| D. | Distributions — Distributions from net investment income and net realized capital gain, if any, are generally declared and paid annually and recorded on the ex-dividend date. The Fund may elect to treat a portion of the proceeds from redemptions as distributions for federal income tax purposes. |
| E. | Federal Income Taxes — The Fund intends to comply with the requirements of Subchapter M of the Internal Revenue Code of 1986, as amended (the “Internal Revenue Code”), necessary to qualify as a regulated investment company and to distribute substantially all of the Fund’s taxable earnings to shareholders. As such, the Fund will not be subject to federal income taxes on otherwise taxable income (including net realized capital gain) that is distributed to shareholders. Therefore, no provision for federal income taxes is recorded in the consolidated financial statements. |
The Fund recognizes the tax benefits of uncertain tax positions only when the position is more likely than not to be sustained. Management has analyzed the Fund’s uncertain tax positions and concluded that no liability for unrecognized tax benefits should be recorded related to uncertain tax positions. Management is not aware of any tax positions for which it is reasonably possible that the total amounts of unrecognized tax benefits will change materially in the next 12 months.
The Subsidiary is classified as a controlled foreign corporation under Subchapter N of the Internal Revenue Code. Therefore, the Fund is required to increase its taxable income by its share of the Subsidiary’s income. Net investment losses of the Subsidiary cannot be deducted by the Fund in the current period nor carried forward to offset taxable income in future periods.
The Fund files tax returns in the U.S. Federal jurisdiction and certain other jurisdictions. Generally the Fund is subject to examinations by such taxing authorities for up to three years after the filing of the return for the tax period.
| F. | Expenses — Fees provided for under the Rule 12b-1 plan of a particular class of the Fund are charged to the operations of such class. Transfer agency fees and expenses and other shareholder recordkeeping fees and expenses attributable to Class R5 and Class R6 are allocated to each share class based on relative net assets. Sub-accounting fees attributable to Class R5 are charged to the operations of the class. Transfer agency fees and expenses and other shareholder recordkeeping fees and expenses relating to all other classes are allocated among those classes based on relative net assets. All other expenses are allocated among the classes based on relative net assets. |
| G. | Accounting Estimates — The financial statements are prepared on a consolidated basis in conformity with accounting principles generally accepted in the United States of America (“GAAP”), which requires management to make estimates and assumptions that affect the reported amounts of assets and liabilities at the date of the financial statements and the reported amounts of revenues and expenses during the reporting period including estimates and assumptions related to taxation. Actual results could differ from those estimates by a significant amount. The accompanying financial statements reflect the financial position of the Fund and its Subsidiary and the results of operations on a consolidated basis. All inter-company accounts and transactions have been eliminated in consolidation. |
In addition, the Fund monitors for material events or transactions that may occur or become known after the period-end date and before the date the consolidated financial statements are released to print.
| H. | Indemnifications — Under the Trust’s organizational documents, each Trustee, officer, employee or other agent of the Trust, and under the Subsidiary’s organizational documents, the directors and officers of the Subsidiary, are indemnified against certain liabilities that may arise out of the performance of their duties to the Fund and/or the Subsidiary, respectively. Additionally, in the normal course of business, the Fund enters into contracts, including the Fund’s servicing agreements, that contain a variety of indemnification clauses. The Fund’s maximum exposure under these arrangements is unknown as this would involve future claims that may be made against the Fund that have not yet occurred. The risk of material loss as a result of such indemnification claims is considered remote. |
| I. | Structured Securities — The Fund may invest in structured securities. Structured securities are a type of derivative security whose value is determined by reference to changes in the value of underlying securities, currencies, interest rates, commodities, indices or other financial indicators (“reference instruments”). Most structured securities are fixed-income securities that have maturities of three years or less. Structured securities may be positively or negatively indexed (i.e., their principal value or interest rates may increase or decrease if the underlying reference instrument appreciates) and may have return characteristics similar to direct investments in the underlying reference instrument. |
Structured securities may entail a greater degree of market risk than other types of debt securities because the investor bears the risk of the reference instruments. In addition to the credit risk of structured securities and the normal risks of price changes in response to changes in interest rates, the principal amount of structured notes or indexed securities may decrease as a result of changes in the value of the underlying reference instruments. Changes in the daily value of structured securities are recorded as unrealized gains (losses) in the Consolidated Statement of Operations. When the structured securities mature or are sold, the Fund recognizes a realized gain (loss) on the Consolidated Statement of Operations.
18 Invesco Balanced-Risk Commodity Strategy Fund
| J. | Futures Contracts — The Fund may enter into futures contracts to equitize the Fund’s cash holdings or to manage exposure to interest rate, equity, commodity and market price movements and/or currency risks. A futures contract is an agreement between two parties (“Counterparties”) to purchase or sell a specified underlying security, currency or commodity (or delivery of a cash settlement price, in the case of an index future) for a fixed price at a future date. The Fund currently invests only in exchange-traded futures and they are standardized as to maturity date and underlying financial instrument. Initial margin deposits required upon entering into futures contracts are satisfied by the segregation of specific securities or cash as collateral at the futures commission merchant (broker). During the period the futures contracts are open, changes in the value of the contracts are recognized as unrealized gains or losses by recalculating the value of the contracts on a daily basis. Subsequent or variation margin payments are received or made on non-LME futures contracts depending upon whether unrealized gains or losses are incurred. These amounts are reflected as receivables or payables on the Consolidated Statement of Assets and Liabilities. For LME contracts, subsequent or variation margin payments are not made and the value of the contracts is presented as unrealized appreciation or depreciation on the Consolidated Statement of Assets and Liabilities. When LME or non-LME contracts are closed or expire, the Fund recognizes a realized gain or loss equal to the difference between the proceeds from, or cost of, the closing transaction and the Fund’s basis in the contract. The net realized gain (loss) and the change in unrealized gain (loss) on futures contracts held during the period is included on the Consolidated Statement of Operations. The primary risks associated with futures contracts are market risk and the absence of a liquid secondary market. If the Fund were unable to liquidate a futures contract and/or enter into an offsetting closing transaction, the Fund would continue to be subject to market risk with respect to the value of the contracts and continue to be required to maintain the margin deposits on the futures contracts. Futures contracts have minimal Counterparty risk since the exchange’s clearinghouse, as Counterparty to all exchange-traded futures, guarantees the futures against default. Risks may exceed amounts recognized in the Consolidated Statement of Assets and Liabilities. |
| K. | Swap Agreements — The Fund may enter into various swap transactions, including interest rate, total return, index, currency and credit default swap contracts (“CDS”) for investment purposes or to manage interest rate, currency, commodity or credit risk. Such transactions are agreements between Counterparties. These agreements may contain among other conditions, events of default and termination events, and various covenants and representations such as provisions that require the Fund to maintain a pre-determined level of net assets, and/or provide limits regarding the decline of the Fund’s NAV over specific periods of time. If the Fund were to trigger such provisions and have open derivative positions at that time, the Counterparty may be able to terminate such agreement and request immediate payment in an amount equal to the net liability positions, if any. |
Interest rate, total return, index, and currency swap agreements are two-party contracts entered into primarily to exchange the returns (or differentials in rates of returns) earned or realized on particular predetermined investments or instruments. The gross returns to be exchanged or “swapped” between the parties are calculated with respect to a notional amount, i.e., the return on or increase in value of a particular dollar amount invested at a particular interest rate or return of an underlying asset, in a particular foreign currency, or in a “basket” of securities representing a particular index. At the maturity date, a net cash flow is exchanged where the total return is equivalent to the return of the underlying reference less a financing rate, if any. As a receiver, the Fund would receive payments based on any positive total return and would owe payments in the event of a negative total return. As the payer, the Fund would owe payments on any net positive total return, and would receive payment in the event of a negative total return.
Changes in the value of swap agreements are recognized as unrealized gains (losses) in the Consolidated Statement of Operations by “marking to market” on a daily basis to reflect the value of the swap agreement at the end of each trading day. Payments received or paid at the beginning of the agreement are reflected as such on the Consolidated Statement of Assets and Liabilities and may be referred to as upfront payments. The Fund accrues for the fixed payment stream and amortizes upfront payments, if any, on swap agreements on a daily basis with the net amount, recorded as a component of realized gain (loss) on the Consolidated Statement of Operations. A liquidation payment received or made at the termination of a swap agreement is recorded as realized gain (loss) on the Consolidated Statement of Operations. The Fund segregates cash or liquid securities having a value at least equal to the amount of the potential obligation of a Fund under any swap transaction. Cash held as collateral is recorded as deposits with brokers on the Consolidated Statement of Assets and Liabilities. Entering into these agreements involves, to varying degrees, lack of liquidity and elements of credit, market, and Counterparty risk in excess of amounts recognized on the Consolidated Statement of Assets and Liabilities. Such risks involve the possibility that a swap is difficult to sell or liquidate; the Counterparty does not honor its obligations under the agreement and unfavorable interest rates and market fluctuations. It is possible that developments in the swaps market, including potential government regulation, could adversely affect the Fund’s ability to terminate existing swap agreements or to realize amounts to be received under such agreements. A short position in a security poses more risk than holding the same security long. As there is no limit on how much the price of the security can increase, the Fund’s exposure is unlimited.
| L. | Other Risks — The Fund will seek to gain exposure to commodity markets primarily through an investment in the Subsidiary and through investments in exchange-traded funds and commodity-linked derivatives. The Subsidiary, unlike the Fund, may invest without limitation in commodities, commodity-linked derivatives and other securities, such as exchange-traded and commodity-linked notes, that may provide leveraged and non-leveraged exposure to commodity markets. The Fund is indirectly exposed to the risks associated with the Subsidiary’s investments. |
| M. | Leverage Risk — Leverage exists when the Fund can lose more than it originally invests because it purchases or sells an instrument or enters into a transaction without investing an amount equal to the full economic exposure of the instrument or transaction. |
| N. | Collateral — To the extent the Fund has designated or segregated a security as collateral and that security is subsequently sold, it is the Fund’s practice to replace such collateral no later than the next business day. |
19 Invesco Balanced-Risk Commodity Strategy Fund
NOTE 2—Advisory Fees and Other Fees Paid to Affiliates
The Trust has entered into a master investment advisory agreement with Invesco Advisers, Inc. (the “Adviser” or “Invesco”). Under the terms of the investment advisory agreement, the Fund accrues daily and pays monthly an advisory fee to the Adviser less the amount paid by the Subsidiary to the Adviser based on the annual rate of the Fund’s average daily net assets as follows:
| | | | | | | | |
| Average Daily Net Assets | | Rate | |
First $250 million | | | 1 | .05% | | | | |
Next $250 million | | | 1 | .025% | | | | |
Next $500 million | | | 1 | .00% | | | | |
Next $1.5 billion | | | 0 | .975% | | | | |
Next $2.5 billion | | | 0 | .95% | | | | |
Next $2.5 billion | | | 0 | .925% | | | | |
Next $2.5 billion | | | 0 | .90% | | | | |
Over $10 billion | | | 0 | .875% | | | | |
For the year ended October 31, 2017, the effective advisory fees incurred by the Fund was 1.02%.
The Subsidiary has entered into a separate contract with the Adviser whereby the Adviser provides investment advisory and other services to the Subsidiary. In consideration of these services, the Subsidiary pays an advisory fee to the Adviser based on the annual rate of the Subsidiary’s average daily net assets as set forth in the table above.
Under the terms of a master sub-advisory agreement between the Adviser and each of Invesco Asset Management Deutschland GmbH, Invesco Asset Management Limited, Invesco Asset Management (Japan) Limited, Invesco Hong Kong Limited, Invesco Senior Secured Management, Inc. and Invesco Canada Ltd. and separate sub-advisory agreements with Invesco PowerShares Capital Management LLC and Invesco Asset Management (India) Private Limited (collectively, the “Affiliated Sub-Advisers”) the Adviser, not the Fund, will pay 40% of the fees paid to the Adviser to any such Affiliated Sub-Adviser(s) that provide(s) discretionary investment management services to the Fund based on the percentage of assets allocated to such Affiliated Sub-Adviser(s).
The Adviser has contractually agreed, through at least June 30, 2018, to waive advisory fees and/or reimburse expenses to the extent necessary to limit total annual fund operating expenses after fee waivers and/or reimbursements (excluding certain items discussed below) of Class A, Class B, Class C, Class R, Class Y, Class R5 and Class R6 shares to 2.00%, 2.75%, 2.75%, 2.25%, 1.75%, 1.75% and 1.75%, respectively, of the Fund’s average daily net assets (the “expense limits”). In determining the Adviser’s obligation to waive advisory fees and/or reimburse expenses, the following expenses are not taken into account, and could cause the total annual fund operating expenses after fee waiver and/or expense reimbursement to exceed the numbers reflected above: (1) interest; (2) taxes; (3) dividend expense on short sales; (4) extraordinary or non-routine items, including litigation expenses; and (5) expenses that the Fund has incurred but did not actually pay because of an expense offset arrangement. Acquired Fund Fees and Expenses are not operating expenses of the Fund directly, but are fees and expenses, including management fees, of the investment companies in which the Fund invests. As a result, the total annual fund operating expenses after expense reimbursement may exceed the expense limits above. Unless Invesco continues the fee waiver agreement, it will terminate on June 30, 2018. During its term, the fee waiver agreement cannot be terminated or amended to increase the expense limits or reduce the advisory fee waiver without approval of the Board of Trustees. The Adviser did not waive fees and/or reimburse expenses during the period under these expense limits.
Further, the Adviser has contractually agreed, through at least June 30, 2019, to waive the advisory fee payable by the Fund in an amount equal to 100% of the net advisory fees the Adviser receives on the Fund’s investments in certain affiliated funds.
For the year ended October 31, 2017, the Adviser waived advisory fees of $553,213.
The Trust has entered into a master administrative services agreement with Invesco pursuant to which the Fund has agreed to pay Invesco for certain administrative costs incurred in providing accounting services to the Fund. For the year ended October 31, 2017, expenses incurred under the agreement are shown in the Consolidated Statement of Operations as Administrative services fees.
The Trust has entered into a transfer agency and service agreement with Invesco Investment Services, Inc. (“IIS”) pursuant to which the Fund has agreed to pay IIS a fee for providing transfer agency and shareholder services to the Fund and reimburse IIS for certain expenses incurred by IIS in the course of providing such services. IIS may make payments to intermediaries that provide omnibus account services, sub-accounting services and/or networking services. All fees payable by IIS to intermediaries that provide omnibus account services or sub-accounting services are charged back to the Fund, subject to certain limitations approved by the Trust’s Board of Trustees. For the year ended October 31, 2017, expenses incurred under the agreement are shown in the Consolidated Statement of Operations as Transfer agent fees.
The Trust has entered into master distribution agreements with Invesco Distributors, Inc. (“IDI”) to serve as the distributor for the Class A, Class B, Class C, Class R, Class Y, Class R5 and Class R6 shares of the Fund. The Trust has adopted plans pursuant to Rule 12b-1 under the 1940 Act with respect to the Fund’s Class A, Class B, Class C and Class R shares (collectively, the “Plans”). The Fund, pursuant to the Plans, pays IDI compensation at the annual rate of 0.25% of the Fund’s average daily net assets of Class A shares, 1.00% of the average daily net assets of Class B and Class C shares and 0.50% of the average daily net assets of Class R shares. The fees are accrued daily and paid monthly. Of the Plan payments, up to 0.25% of the average daily net assets of each class of shares may be paid to furnish continuing personal shareholder services to customers who purchase and own shares of such classes. Any amounts not paid as a service fee under the Plans would constitute an asset-based sales charge. Rules of the Financial Industry Regulatory Authority (“FINRA”) impose a cap on the total sales charges, including asset-based sales charges, that may be paid by any class of shares of the Fund. For the year ended October 31, 2017, expenses incurred under the Plans are shown in the Consolidated Statement of Operations as Distribution fees.
Front-end sales commissions and CDSC (collectively, the “sales charges”) are not recorded as expenses of the Fund. Front-end sales commissions are deducted from proceeds from the sales of Fund shares prior to investment in Class A shares of the Fund. CDSC are deducted from redemption proceeds prior to remittance to the shareholder. During the year ended October 31, 2017, IDI advised the Fund that IDI retained $18,947 in front-end sales commissions from the sale of Class A shares and $1,053, $62 and $4,720 from Class A, Class B and Class C shares, respectively, for CDSC imposed on redemptions by shareholders.
Certain officers and trustees of the Trust are officers and directors of the Adviser, IIS and/or IDI.
20 Invesco Balanced-Risk Commodity Strategy Fund
NOTE 3—Additional Valuation Information
GAAP defines fair value as the price that would be received to sell an asset or paid to transfer a liability in an orderly transaction between market participants at the measurement date, under current market conditions. GAAP establishes a hierarchy that prioritizes the inputs to valuation methods, giving the highest priority to readily available unadjusted quoted prices in an active market for identical assets (Level 1) and the lowest priority to significant unobservable inputs (Level 3), generally when market prices are not readily available or are unreliable. Based on the valuation inputs, the securities or other investments are tiered into one of three levels. Changes in valuation methods may result in transfers in or out of an investment’s assigned level:
| | Level 1 – | Prices are determined using quoted prices in an active market for identical assets. |
| | Level 2 – | Prices are determined using other significant observable inputs. Observable inputs are inputs that other market participants may use in pricing a security. These may include quoted prices for similar securities, interest rates, prepayment speeds, credit risk, yield curves, loss severities, default rates, discount rates, volatilities and others. |
| | Level 3 – | Prices are determined using significant unobservable inputs. In situations where quoted prices or observable inputs are unavailable (for example, when there is little or no market activity for an investment at the end of the period), unobservable inputs may be used. Unobservable inputs reflect the Fund’s own assumptions about the factors market participants would use in determining fair value of the securities or instruments and would be based on the best available information. |
The following is a summary of the tiered valuation input levels, as of October 31, 2017. The level assigned to the securities valuations may not be an indication of the risk or liquidity associated with investing in those securities. Because of the inherent uncertainties of valuation, the values reflected in the consolidated financial statements may materially differ from the value received upon actual sale of those investments.
The Fund’s policy is to recognize transfers in and out of the valuation levels as of the end of the reporting period. During the year ended October 31, 2017, there were no material transfers between valuation levels.
| | | | | | | | | | | | | | | | |
| | | Level 1 | | | Level 2 | | | Level 3 | | | Total | |
U.S. Treasury Securities | | $ | — | | | $ | 280,428,928 | | | $ | — | | | $ | 280,428,928 | |
Commodity-Linked Securities | | | — | | | | 53,400,010 | | | | — | | | | 53,400,010 | |
Exchange Traded Funds | | | 8,284,050 | | | | — | | | | — | | | | 8,284,050 | |
Money Market Funds | | | 467,399,941 | | | | — | | | | — | | | | 467,399,941 | |
| | | | 475,683,991 | | | | 333,828,938 | | | | — | | | | 809,512,929 | |
Futures Contracts* | | | (1,380,593 | ) | | | — | | | | — | | | | (1,380,593 | ) |
Swap Agreements* | | | — | | | | 3,997,758 | | | | — | | | | 3,997,758 | |
Total Investments | | $ | 474,303,398 | | | $ | 337,826,696 | | | $ | — | | | $ | 812,130,094 | |
| * | Unrealized appreciation (depreciation). |
NOTE 4—Derivative Investments
The Fund may enter into an International Swaps and Derivatives Association Master Agreement (“ISDA Master Agreement”) under which a fund may trade OTC derivatives. An OTC transaction entered into under an ISDA Master Agreement typically involves a collateral posting arrangement, payment netting provisions and close-out netting provisions. These netting provisions allow for reduction of credit risk through netting of contractual obligations. The enforceability of the netting provisions of the ISDA Master Agreement depends on the governing law of the ISDA Master Agreement, among other factors.
For financial reporting purposes, the Fund does not offset OTC derivative assets or liabilities that are subject to ISDA Master Agreements in the Consolidated Statement of Assets and Liabilities.
Value of Derivative Investments at Period-End
The table below summarizes the value of the Fund’s derivative investments, detailed by primary risk exposure, held as of October 31, 2017:
| | | | |
| | | Value | |
| Derivative Assets | | Commodity
Risk | |
Unrealized appreciation on futures contracts — Exchange-Traded(a) | | $ | 6,889,018 | |
Unrealized appreciation on swap agreements — OTC | | | 6,815,850 | |
Total Derivative Assets | | | 13,704,868 | |
Derivatives not subject to master netting agreements | | | (6,889,018 | ) |
Total Derivative Assets subject to master netting agreements | | $ | 6,815,850 | |
21 Invesco Balanced-Risk Commodity Strategy Fund
| | | | |
| | | Value | |
| Derivative Liabilities | | Commodity
Risk | |
Unrealized depreciation on futures contracts — Exchange-Traded(a) | | $ | (8,269,611 | ) |
Unrealized depreciation on swap agreements — OTC | | | (2,818,092 | ) |
Total Derivative Liabilities | | | (11,087,703 | ) |
Derivatives not subject to master netting agreements | | | 8,269,611 | |
Total Derivative Liabilities subject to master netting agreements | | $ | (2,818,092 | ) |
| (a) | The daily variation margin receivable (payable) at period-end is recorded in the Consolidated Statement of Assets and Liabilities. |
Offsetting Assets and Liabilities
The table below reflects the Fund’s exposure to Counterparties subject to either an ISDA Master Agreement or other agreement for OTC derivative transactions as of October 31, 2017.
| | | | | | | | | | | | | | | | | | | | | | | | |
| | | Financial
Derivative Assets | | | Financial
Derivative Liabilities | | | | | | Collateral | | | | |
| | | Swap | | | Swap | | | Net Value of | | | (Received)/Pledged | | | Net | |
| Counterparty | | Agreements | | | Agreements | | | Derivatives | | | Non-Cash | | | Cash | | | Amount | |
Subsidiary | | | | | | | | | | | | | | | | | | | | | | | | |
Barclays Bank PLC | | $ | 2,034,892 | | | $ | (364,518 | ) | | $ | 1,670,374 | | | $ | — | | | $ | — | | | $ | 1,670,374 | |
Canadian Imperial Bank of Commerce | | | 124,937 | | | | (6,637 | ) | | | 118,300 | | | | — | | | | — | | | | 118,300 | |
Goldman Sachs International | | | 2,445,116 | | | | (782,610 | ) | | | 1,662,506 | | | | — | | | | — | | | | 1,662,506 | |
JPMorgan Chase Bank, N.A. | | | 938,319 | | | | (365,146 | ) | | | 573,173 | | | | — | | | | — | | | | 573,173 | |
Macquarie Bank Ltd. | | | 839,426 | | | | (1,394,484 | ) | | | (555,058 | ) | | | — | | | | 555,058 | | | | — | |
Merrill Lynch International | | | 1,993,795 | | | | (1,761,329 | ) | | | 232,466 | | | | — | | | | — | | | | 232,466 | |
Morgan Stanley Capital Services LLC | | | 464,023 | | | | (2,069 | ) | | | 461,954 | | | | — | | | | — | | | | 461,954 | |
Royal Bank of Canada | | | 3,729,772 | | | | (15,283 | ) | | | 3,714,489 | | | | — | | | | — | | | | 3,714,489 | |
Total | | $ | 12,570,280 | | | $ | (4,692,076 | ) | | $ | 7,878,204 | | | $ | — | | | $ | 555,058 | | | $ | 8,433,262 | |
Effect of Derivative Investments for the year ended October 31, 2017
The table below summarizes the gains (losses) on derivative investments, detailed by primary risk exposure, recognized in earnings during the period:
| | | | |
| | | Location of Gain (Loss) on
Consolidated Statement
of Operations | |
| | | Commodity
Risk | |
Realized Gain (Loss): | | | | |
Futures contracts | | $ | (9,816,300 | ) |
Swap agreements | | | 83,183 | |
Change in Net Unrealized Appreciation (Depreciation): | | | | |
Futures contracts | | | (2,206,000 | ) |
Swap agreements | | | 7,558,759 | |
Total | | $ | (4,380,358 | ) |
The table below summarizes the average notional value of futures contracts and swap agreements outstanding during the period.
| | | | | | | | |
| | | Futures
Contracts | | | Swap
Agreements | |
Average notional value | | $ | 195,206,137 | | | $ | 636,753,584 | |
22 Invesco Balanced-Risk Commodity Strategy Fund
NOTE 5—Investments in Affiliates
The Fund’s Adviser and the adviser for PowerShares DB Gold Fund are subsidiaries of Invesco Ltd. and therefore, PowerShares DB Gold Fund is considered to be affiliated with the Fund. The following is a summary of the transactions in, and earnings from, investments in PowerShares DB Gold Fund for the year ended October 31, 2017.
| | | | | | | | | | | | | | | | | | | | | | | | | | | | |
| | | Value 10/31/2016 | | | Purchases
at Cost | | | Proceeds
from Sales | | | Change in
Unrealized
Appreciation | | | Realized
Gain (Loss) | | | Value 10/31/2017 | | | Dividend
Income | |
PowerShares DB Gold Fund | | $ | 15,900,500 | | | $ | 807,398 | | | $ | (7,724,630 | ) | | $ | 1,572,771 | | | $ | (2,271,989 | ) | | $ | 8,284,050 | | | $ | — | |
NOTE 6—Expense Offset Arrangement(s)
The expense offset arrangement is comprised of transfer agency credits which result from balances in demand deposit accounts used by the transfer agent for clearing shareholder transactions. For the year ended October 31, 2017, the Fund received credits from this arrangement, which resulted in the reduction of the Fund’s total expenses of $1,035.
NOTE 7—Trustees’ and Officers’ Fees and Benefits
Trustees’ and Officers’ Fees and Benefits include amounts accrued by the Fund to pay remuneration to certain Trustees and Officers of the Fund. Trustees have the option to defer compensation payable by the Fund, and Trustees’ and Officers’ Fees and Benefits also include amounts accrued by the Fund to fund such deferred compensation amounts. Those Trustees who defer compensation have the option to select various Invesco Funds in which their deferral accounts shall be deemed to be invested. Finally, certain current Trustees were eligible to participate in a retirement plan that provided for benefits to be paid upon retirement to Trustees over a period of time based on the number of years of service. The Fund may have certain former Trustees who also participate in a retirement plan and receive benefits under such plan. Trustees’ and Officers’ Fees and Benefits include amounts accrued by the Fund to fund such retirement benefits. Obligations under the deferred compensation and retirement plans represent unsecured claims against the general assets of the Fund.
NOTE 8—Cash Balances
The Fund is permitted to temporarily carry a negative or overdrawn balance in its account with State Street Bank and Trust Company, the custodian bank. Such balances, if any at period-end, are shown in the Consolidated Statement of Assets and Liabilities under the payable caption Amount due custodian. To compensate the custodian bank for such overdrafts, the overdrawn Fund may either (1) leave funds as a compensating balance in the account so the custodian bank can be compensated by earning the additional interest; or (2) compensate by paying the custodian bank at a rate agreed upon by the custodian bank and Invesco, not to exceed the contractually agreed upon rate.
NOTE 9—Distributions to Shareholders and Tax Components of Net Assets
Tax Character of Distributions to Shareholders Paid During the Fiscal Years Ended October 31, 2017 and 2016:
| | | | | | | | |
| | | 2017 | | | 2016 | |
Ordinary income | | $ | 23,295,802 | | | $ | — | |
Tax Components of Net Assets at Period-End:
| | | | |
| | | 2017 | |
Net unrealized appreciation — investments | | $ | 12,855,516 | |
Temporary book/tax differences | | | (128,690 | ) |
Late-year ordinary loss deferrals | | | (2,878,673 | ) |
Capital loss carryforward | | | (45,371,223 | ) |
Shares of beneficial interest | | | 895,985,347 | |
Total net assets | | $ | 860,462,277 | |
The difference between book-basis and tax-basis unrealized appreciation (depreciation) is due to differences in the timing of recognition of gains and losses on investments for tax and book purposes. The Fund’s net unrealized appreciation difference is attributable primarily to wash sales and partnership adjustments.
The temporary book/tax differences are a result of timing differences between book and tax recognition of income and/or expenses. The Fund’s temporary book/tax differences are the result of the trustee deferral of compensation and retirement plan benefits.
Capital loss carryforward is calculated and reported as of a specific date. Results of transactions and other activity after that date may affect the amount of capital loss carryforward actually available for the Fund to utilize. Capital losses generated in years beginning after December 22, 2010 can be carried forward for an unlimited period, whereas previous losses expire in eight tax years. Capital losses with an expiration period may not be used to offset capital gains until all net capital losses without an expiration date have been utilized. Capital loss carryforwards with no expiration date will retain their character as either short-term or long-term capital losses instead of as short-term capital losses as under prior law. The ability to utilize capital loss carryforwards in the future may be limited under the Internal Revenue Code and related regulations based on the results of future transactions.
23 Invesco Balanced-Risk Commodity Strategy Fund
The Fund has a capital loss carryforward as of October 31, 2017, which expires as follows:
| | | | | | | | | | | | |
| Capital Loss Carryforward* | |
| Expiration | | Short-Term | | | Long-Term | | | Total | |
Not subject to expiration | | $ | 40,365,516 | | | $ | 5,005,707 | | | $ | 45,371,223 | |
| * | Capital loss carryforward as of the date listed above is reduced for limitations, if any, to the extent required by the Internal Revenue Code and may be further limited depending upon a variety of factors, including the realization of net unrealized gains or losses as of the date of any reorganization. |
NOTE 10—Investment Transactions
The aggregate amount of investment securities (other than short-term securities, U.S. Treasury obligations and money market funds, if any) purchased and sold by the Fund during the year ended October 31, 2017 was $21,957,398 and $30,313,241, respectively. During the same period, purchases and sales of U.S. Treasury obligations were $0 and $21,091,285, respectively. Cost of investments, including any derivatives, on a tax basis includes the adjustments for financial reporting purposes as of the most recently completed federal income tax reporting period-end.
| | | | |
| Unrealized Appreciation (Depreciation) of Investments on a Tax Basis | |
Aggregate unrealized appreciation of investments | | $ | 53,479,582 | |
Aggregate unrealized (depreciation) of investments | | | (40,624,066 | ) |
Net unrealized appreciation of investments | | $ | 12,855,516 | |
Cost of investments for tax purposes is $799,274,578.
NOTE 11—Reclassification of Permanent Differences
Primarily as a result of differing book/tax treatment of subsidiary suspended passive losses, swap agreement income and net operating losses, on October 31, 2017, undistributed net investment income (loss) was decreased by $8,871,888, undistributed net realized gain (loss) was increased by $14,520,345 and shares of beneficial interest was decreased by $5,648,457. This reclassification had no effect on the net assets of the Fund.
24 Invesco Balanced-Risk Commodity Strategy Fund
NOTE 12—Share Information
| | | | | | | | | | | | | | | | |
| | | Summary of Share Activity | |
| | | Years ended October 31, | |
| | | 2017(a) | | | 2016 | |
| | | Shares | | | Amount | | | Shares | | | Amount | |
Sold: | | | | | | | | | | | | | | | | |
Class A | | | 4,563,865 | | | $ | 30,361,277 | | | | 3,954,842 | | | $ | 26,314,513 | |
Class B | | | — | | | | — | | | | 544 | | | | 3,483 | |
Class C | | | 632,764 | | | | 4,089,805 | | | | 626,084 | | | | 4,046,670 | |
Class R | | | 210,342 | | | | 1,356,759 | | | | 69,351 | | | | 459,130 | |
Class Y | | | 67,828,430 | | | | 461,730,692 | | | | 86,924,324 | | | | 575,119,186 | |
Class R5 | | | 2,861,151 | | | | 18,947,101 | | | | 1,680,206 | | | | 10,775,399 | |
Class R6 | | | 2,043,846 | | | | 13,792,890 | | | | 1,497,079 | | | | 9,823,548 | |
| | | | |
Issued as reinvestment of dividends: | | | | | | | | | | | | | | | | |
Class A | | | 149,749 | | | | 1,006,312 | | | | — | | | | — | |
Class B | | | 396 | | | | 2,565 | | | | — | | | | — | |
Class C | | | 22,851 | | | | 147,620 | | | | — | | | | — | |
Class R | | | 2,740 | | | | 18,221 | | | | — | | | | — | |
Class Y | | | 1,163,388 | | | | 7,934,306 | | | | — | | | | — | |
Class R5 | | | 763,850 | | | | 5,224,733 | | | | — | | | | — | |
Class R6 | | | 8,252 | | | | 56,525 | | | | — | | | | — | |
| | | | |
Automatic conversion of Class B shares to Class A shares: | | | | | | | | | | | | | | | | |
Class A | | | 7,534 | | | | 49,496 | | | | 11,168 | | | | 72,498 | |
Class B | | | (7,837 | ) | | | (49,496 | ) | | | (11,562 | ) | | | (72,498 | ) |
| | | | |
Reacquired: | | | | | | | | | | | | | | | | |
Class A | | | (2,258,911 | ) | | | (14,968,435 | ) | | | (3,328,683 | ) | | | (22,445,282 | ) |
Class B | | | (5,968 | ) | | | (38,729 | ) | | | (6,604 | ) | | | (40,911 | ) |
Class C | | | (449,948 | ) | | | (2,811,798 | ) | | | (127,332 | ) | | | (784,815 | ) |
Class R | | | (74,400 | ) | | | (482,419 | ) | | | (9,717 | ) | | | (63,943 | ) |
Class Y | | | (67,046,653 | ) | | | (450,652,693 | ) | | | (37,010,378 | ) | | | (240,750,644 | ) |
Class R5 | | | (1,674,504 | ) | | | (11,383,375 | ) | | | (12,695,346 | ) | | | (88,586,283 | ) |
Class R6(b) | | | (541,057 | ) | | | (3,536,308 | ) | | | (18,888,038 | ) | | | (116,157,695 | ) |
Net increase in share activity | | | 8,199,880 | | | $ | 60,795,049 | | | | 22,685,938 | | | $ | 157,712,356 | |
| (a) | There are entities that are record owners of more than 5% of the outstanding shares of the Fund and in the aggregate own 76% of the outstanding shares of the Fund. IDI has an agreement with these entities to sell Fund shares. The Fund, Invesco and/or Invesco affiliates may make payments to these entities, which are considered to be related to the Fund, for providing services to the Fund, Invesco and/or Invesco affiliates including but not limited to services such as securities brokerage, distribution, third party record keeping and account servicing. The Trust has no knowledge as to whether all or any portion of the shares owned of record by these entities are also owned beneficially. |
| (b) | On February 18, 2016, 18,209,594 Class R6 shares valued at $111,989,004 were redeemed by affiliated mutual funds. |
25 Invesco Balanced-Risk Commodity Strategy Fund
NOTE 13—Financial Highlights
The following schedule presents financial highlights for a share of the Fund outstanding throughout the periods indicated.
| | | | | | | | | | | | | | | | | | | | | | | | | | | | | | | | | | | | | | | | | | | | | | | | |
| | | Net asset
value,
beginning
of period | | | Net
investment
income
(loss)(a) | | | Net gains
(losses)
on securities
(both
realized and
unrealized) | | | Total from
investment
operations | | | Dividends
from net
investment
income | | | Net asset
value, end
of period | | | Total
return(b) | | | Net assets,
end of period
(000’s omitted) | | | Ratio of
expenses
to average
net assets with
fee waivers
and/or expenses
absorbed | | | Ratio of
expenses
to average net
assets without
fee waivers
and/or expenses
absorbed | | | Ratio of net
investment
income (loss)
to average
net assets | | | Portfolio
turnover(c) | |
Class A | | | | | | | | | | | | | | | | | | | | | | | | | | | | | | | | | | | | | | | | | | | | | | | | |
Year ended 10/31/17 | | $ | 6.84 | | | $ | (0.05 | ) | | $ | 0.08 | | | $ | 0.03 | | | $ | (0.17 | ) | | $ | 6.70 | | | | 0.47 | % | | $ | 56,532 | | | | 1.49 | %(d) | | | 1.56 | %(d) | | | (0.78 | )%(d) | | | 10 | % |
Year ended 10/31/16 | | | 6.54 | | | | (0.07 | ) | | | 0.37 | | | | 0.30 | | | | — | | | | 6.84 | | | | 4.59 | | | | 40,844 | | | | 1.47 | | | | 1.56 | | | | (1.11 | ) | | | 98 | |
Year ended 10/31/15 | | | 8.04 | | | | (0.10 | ) | | | (1.40 | ) | | | (1.50 | ) | | | — | | | | 6.54 | | | | (18.66 | ) | | | 34,892 | | | | 1.55 | | | | 1.59 | | | | (1.47 | ) | | | 17 | |
Year ended 10/31/14 | | | 9.05 | | | | (0.11 | ) | | | (0.90 | ) | | | (1.01 | ) | | | — | | | | 8.04 | | | | (11.16 | ) | | | 47,339 | | | | 1.30 | | | | 1.57 | | | | (1.25 | ) | | | 21 | |
Year ended 10/31/13 | | | 10.73 | | | | (0.11 | ) | | | (1.35 | ) | | | (1.46 | ) | | | (0.22 | ) | | | 9.05 | | | | (13.89 | ) | | | 69,350 | | | | 1.22 | | | | 1.47 | | | | (1.14 | ) | | | 47 | |
Class B | | | | | | | | | | | | | | | | | | | | | | | | | | | | | | | | | | | | | | | | | | | | | | | | |
Year ended 10/31/17 | | | 6.58 | | | | (0.10 | ) | | | 0.09 | | | | (0.01 | ) | | | (0.15 | ) | | | 6.42 | | | | (0.19 | ) | | | 62 | | | | 2.24 | (d) | | | 2.31 | (d) | | | (1.53 | )(d) | | | 10 | |
Year ended 10/31/16 | | | 6.34 | | | | (0.12 | ) | | | 0.36 | | | | 0.24 | | | | — | | | | 6.58 | | | | 3.79 | | | | 152 | | | | 2.22 | | | | 2.31 | | | | (1.86 | ) | | | 98 | |
Year ended 10/31/15 | | | 7.85 | | | | (0.16 | ) | | | (1.35 | ) | | | (1.51 | ) | | | — | | | | 6.34 | | | | (19.24 | ) | | | 258 | | | | 2.30 | | | | 2.34 | | | | (2.22 | ) | | | 17 | |
Year ended 10/31/14 | | | 8.91 | | | | (0.17 | ) | | | (0.89 | ) | | | (1.06 | ) | | | — | | | | 7.85 | | | | (11.90 | ) | | | 514 | | | | 2.05 | | | | 2.32 | | | | (2.00 | ) | | | 21 | |
Year ended 10/31/13 | | | 10.59 | | | | (0.18 | ) | | | (1.33 | ) | | | (1.51 | ) | | | (0.17 | ) | | | 8.91 | | | | (14.44 | ) | | | 1,096 | | | | 1.97 | | | | 2.22 | | | | (1.89 | ) | | | 47 | |
Class C | | | | | | | | | | | | | | | | | | | | | | | | | | | | | | | | | | | | | | | | | | | | | | | | |
Year ended 10/31/17 | | | 6.57 | | | | (0.10 | ) | | | 0.08 | | | | (0.02 | ) | | | (0.15 | ) | | | 6.40 | | | | (0.34 | ) | | | 7,086 | | | | 2.24 | (d) | | | 2.31 | (d) | | | (1.53 | )(d) | | | 10 | |
Year ended 10/31/16 | | | 6.33 | | | | (0.12 | ) | | | 0.36 | | | | 0.24 | | | | — | | | | 6.57 | | | | 3.79 | | | | 5,915 | | | | 2.22 | | | | 2.31 | | | | (1.86 | ) | | | 98 | |
Year ended 10/31/15 | | | 7.84 | | | | (0.15 | ) | | | (1.36 | ) | | | (1.51 | ) | | | — | | | | 6.33 | | | | (19.26 | ) | | | 2,544 | | | | 2.30 | | | | 2.34 | | | | (2.22 | ) | | | 17 | |
Year ended 10/31/14 | | | 8.89 | | | | (0.17 | ) | | | (0.88 | ) | | | (1.05 | ) | | | — | | | | 7.84 | | | | (11.81 | ) | | | 3,612 | | | | 2.05 | | | | 2.32 | | | | (2.00 | ) | | | 21 | |
Year ended 10/31/13 | | | 10.58 | | | | (0.18 | ) | | | (1.34 | ) | | | (1.52 | ) | | | (0.17 | ) | | | 8.89 | | | | (14.55 | ) | | | 4,948 | | | | 1.97 | | | | 2.22 | | | | (1.89 | ) | | | 47 | |
Class R | | | | | | | | | | | | | | | | | | | | | | | | | | | | | | | | | | | | | | | | | | | | | | | | |
Year ended 10/31/17 | | | 6.76 | | | | (0.07 | ) | | | 0.09 | | | | 0.02 | | | | (0.16 | ) | | | 6.62 | | | | 0.35 | | | | 1,683 | | | | 1.74 | (d) | | | 1.81 | (d) | | | (1.03 | )(d) | | | 10 | |
Year ended 10/31/16 | | | 6.48 | | | | (0.09 | ) | | | 0.37 | | | | 0.28 | | | | — | | | | 6.76 | | | | 4.32 | | | | 782 | | | | 1.72 | | | | 1.81 | | | | (1.36 | ) | | | 98 | |
Year ended 10/31/15 | | | 7.99 | | | | (0.12 | ) | | | (1.39 | ) | | | (1.51 | ) | | | — | | | | 6.48 | | | | (18.90 | ) | | | 363 | | | | 1.80 | | | | 1.84 | | | | (1.72 | ) | | | 17 | |
Year ended 10/31/14 | | | 9.02 | | | | (0.13 | ) | | | (0.90 | ) | | | (1.03 | ) | | | — | | | | 7.99 | | | | (11.42 | ) | | | 371 | | | | 1.55 | | | | 1.82 | | | | (1.50 | ) | | | 21 | |
Year ended 10/31/13 | | | 10.71 | | | | (0.13 | ) | | | (1.36 | ) | | | (1.49 | ) | | | (0.20 | ) | | | 9.02 | | | | (14.13 | ) | | | 504 | | | | 1.47 | | | | 1.72 | | | | (1.39 | ) | | | 47 | |
Class Y | | | | | | | | | | | | | | | | | | | | | | | | | | | | | | | | | | | | | | | | | | | | | | | | |
Year ended 10/31/17 | | | 6.95 | | | | (0.04 | ) | | | 0.10 | | | | 0.06 | | | | (0.19 | ) | | | 6.82 | | | | 0.80 | | | | 577,236 | | | | 1.24 | (d) | | | 1.31 | (d) | | | (0.53 | )(d) | | | 10 | |
Year ended 10/31/16 | | | 6.63 | | | | (0.06 | ) | | | 0.38 | | | | 0.32 | | | | — | | | | 6.95 | | | | 4.83 | | | | 574,878 | | | | 1.22 | | | | 1.31 | | | | (0.86 | ) | | | 98 | |
Year ended 10/31/15 | | | 8.13 | | | | (0.09 | ) | | | (1.41 | ) | | | (1.50 | ) | | | — | | | | 6.63 | | | | (18.45 | ) | | | 217,528 | | | | 1.30 | | | | 1.34 | | | | (1.22 | ) | | | 17 | |
Year ended 10/31/14 | | | 9.13 | | | | (0.09 | ) | | | (0.91 | ) | | | (1.00 | ) | | | — | | | | 8.13 | | | | (10.95 | ) | | | 268,106 | | | | 1.05 | | | | 1.32 | | | | (1.00 | ) | | | 21 | |
Year ended 10/31/13 | | | 10.81 | | | | (0.09 | ) | | | (1.36 | ) | | | (1.45 | ) | | | (0.23 | ) | | | 9.13 | | | | (13.69 | ) | | | 250,463 | | | | 0.97 | | | | 1.22 | | | | (0.89 | ) | | | 47 | |
Class R5 | | | | | | | | | | | | | | | | | | | | | | | | | | | | | | | | | | | | | | | | | | | | | | | | |
Year ended 10/31/17 | | | 6.97 | | | | (0.03 | ) | | | 0.09 | | | | 0.06 | | | | (0.19 | ) | | | 6.84 | | | | 0.83 | | | | 205,568 | | | | 1.16 | (d) | | | 1.23 | (d) | | | (0.45 | )(d) | | | 10 | |
Year ended 10/31/16 | | | 6.64 | | | | (0.05 | ) | | | 0.38 | | | | 0.33 | | | | — | | | | 6.97 | | | | 4.97 | | | | 195,777 | | | | 1.13 | | | | 1.22 | | | | (0.77 | ) | | | 98 | |
Year ended 10/31/15 | | | 8.13 | | | | (0.08 | ) | | | (1.41 | ) | | | (1.49 | ) | | | — | | | | 6.64 | | | | (18.33 | ) | | | 259,674 | | | | 1.15 | | | | 1.19 | | | | (1.07 | ) | | | 17 | |
Year ended 10/31/14 | | | 9.13 | | | | (0.09 | ) | | | (0.91 | ) | | | (1.00 | ) | | | — | | | | 8.13 | | | | (10.95 | ) | | | 269,490 | | | | 1.02 | | | | 1.19 | | | | (0.97 | ) | | | 21 | |
Year ended 10/31/13 | | | 10.80 | | | | (0.09 | ) | | | (1.35 | ) | | | (1.44 | ) | | | (0.23 | ) | | | 9.13 | | | | (13.61 | ) | | | 266,031 | | | | 0.97 | | | | 1.20 | | | | (0.89 | ) | | | 47 | |
Class R6 | | | | | | | | | | | | | | | | | | | | | | | | | | | | | | | | | | | | | | | | | | | | | | | | |
Year ended 10/31/17 | | | 6.98 | | | | (0.02 | ) | | | 0.09 | | | | 0.07 | | | | (0.19 | ) | | | 6.86 | | | | 1.04 | | | | 12,293 | | | | 1.08 | (d) | | | 1.15 | (d) | | | (0.37 | )(d) | | | 10 | |
Year ended 10/31/16 | | | 6.65 | | | | (0.04 | ) | | | 0.37 | | | | 0.33 | | | | — | | | | 6.98 | | | | 4.96 | | | | 1,971 | | | | 1.03 | | | | 1.12 | | | | (0.67 | ) | | | 98 | |
Year ended 10/31/15 | | | 8.13 | | | | (0.07 | ) | | | (1.41 | ) | | | (1.48 | ) | | | — | | | | 6.65 | | | | (18.20 | ) | | | 117,504 | | | | 1.05 | | | | 1.09 | | | | (0.97 | ) | | | 17 | |
Year ended 10/31/14 | | | 9.13 | | | | (0.08 | ) | | | (0.92 | ) | | | (1.00 | ) | | | — | | | | 8.13 | | | | (10.95 | ) | | | 131,076 | | | | 0.99 | | | | 1.10 | | | | (0.94 | ) | | | 21 | |
Year ended 10/31/13 | | | 10.80 | | | | (0.08 | ) | | | (1.36 | ) | | | (1.44 | ) | | | (0.23 | ) | | | 9.13 | | | | (13.61 | ) | | | 124,497 | | | | 0.97 | | | | 1.12 | | | | (0.89 | ) | | | 47 | |
| (a) | Calculated using average shares outstanding. |
| (b) | Includes adjustments in accordance with accounting principles generally accepted in the United States of America and as such, the net asset value for financial reporting purposes and the returns based upon those net asset values may differ from the net asset value and returns for shareholder transactions. Does not include sales charges and is not annualized for periods less than one year, if applicable. |
| (c) | Portfolio turnover is calculated at the fund level and is not annualized for periods less than one year, if applicable. |
| (d) | Ratios are based on average daily net assets (000’s omitted) of $49,047, $101, $7,555, $1,115, $583,064, $198,258 and $8,064 for Class A, Class B, Class C, Class R, Class Y, Class R5 and Class R6 shares, respectively. |
NOTE 14 --Subsequent Event
On December 1, 2017, the Fund’s Board of Trustees approved the early conversion of the remaining assets in the Fund’s Class B shares into Class A shares to occur on or about January 26, 2018. At the close of business on or about January 26, 2018, (the “Conversion Date”) all outstanding Class B shares of the Fund will be converted to Class A shares of the Fund, which is prior to the date the Class B shares would normally be converted to Class A shares. Once the conversion is completed, Class B shares will be closed and become inactive. No contingent deferred sales charges will be payable in connection with this early conversion. The conversion of the Fund’s Class B shares into Class A shares on the Conversion Date is not expected to be a taxable event for federal income tax purposes, and should not result in the recognition of gain or loss by converting shareholders, although each shareholder should consult with his or her own tax adviser.
26 Invesco Balanced-Risk Commodity Strategy Fund
Report of Independent Registered Public Accounting Firm
To the Board of Trustees of AIM Investment Funds (Invesco Investment Funds) and Shareholders of Invesco Balanced-Risk Commodity Strategy Fund:
In our opinion, the accompanying consolidated statement of assets and liabilities, including the consolidated schedule of investments, and the related consolidated statements of operations and of changes in net assets and the financial highlights present fairly, in all material respects, the consolidated financial position of Invesco Balanced-Risk Commodity Strategy Fund and its subsidiary (one of the portfolios constituting the AIM Investment Funds (Invesco Investment Funds), hereafter referred to as the “Fund”) as of October 31, 2017, the results of their operations for the year then ended, the changes in their net assets for each of the two years in the period then ended and the financial highlights for each of the five years in the period then ended, in conformity with accounting principles generally accepted in the United States of America. These consolidated financial statements and financial highlights (hereafter referred to as “financial statements”) are the responsibility of the Fund’s management. Our responsibility is to express an opinion on these financial statements based on our audits. We conducted our audits of these financial statements in accordance with the standards of the Public Company Accounting Oversight Board (United States). Those standards require that we plan and perform the audit to obtain reasonable assurance about whether the financial statements are free of material misstatement. An audit includes examining, on a test basis, evidence supporting the amounts and disclosures in the financial statements, assessing the accounting principles used and significant estimates made by management, and evaluating the overall financial statement presentation. We believe that our audits, which included confirmation of securities as of October 31, 2017 by correspondence with the custodian, transfer agent and brokers, and when replies were not received from brokers, we performed other auditing procedures, provide a reasonable basis for our opinion.
PricewaterhouseCoopers LLP
Houston, Texas
December 21, 2017
27 Invesco Balanced-Risk Commodity Strategy Fund
Calculating your ongoing Fund expenses
Example
As a shareholder of the Fund, you incur two types of costs: (1) transaction costs, which may include sales charges (loads) on purchase payments or contingent deferred sales charges on redemptions, if any; and (2) ongoing costs, including distribution and/or service (12b-1) fees, and other Fund expenses. This example is intended to help you understand your ongoing costs (in dollars) of investing in the Fund and to compare these costs with ongoing costs of investing in other mutual funds. The example is based on an investment of $1,000 invested at the beginning of the period and held for the entire period May 1, 2017, through October 31, 2017.
In addition to the fees and expenses which the Fund bears directly, the Fund indirectly bears a pro rata share of the fees and expenses of the underlying funds in which the Fund invests. The amount of fees and expenses incurred indirectly by the Fund will vary because the underlying funds have varied expenses and fee levels and the Fund may own different proportions of the underlying funds at different times. Estimated underlying fund expenses are not expenses that are incurred directly by the Fund. They are expenses that are incurred directly by the underlying funds and are deducted from the value of the underlying funds the Fund invests in. The effect of the estimated underlying fund expenses that the Fund bears indirectly are included in the Fund’s total return.
Actual expenses
The table below provides information about actual account values and actual expenses. You may use the information in this table, together with the amount you invested, to estimate the expenses that you paid over the period. Simply divide your account value by $1,000 (for example, an $8,600 account value divided by $1,000 = 8.6), then multiply the result by the number in the table under the heading entitled “Actual Expenses Paid During Period” to estimate the expenses you paid on your account during this period.
Hypothetical example for comparison purposes
The table below also provides information about hypothetical account values and hypothetical expenses based on the Fund’s actual expense ratio and an assumed rate of return of 5% per year before expenses, which is not the Fund’s actual return.
The hypothetical account values and expenses may not be used to estimate the actual ending account balance or expenses you paid for the period. You may use this information to compare the ongoing costs of investing in the Fund and other funds. To do so, compare this 5% hypothetical example with the 5% hypothetical examples that appear in the shareholder reports of the other funds.
Please note that the expenses shown in the table are meant to highlight your ongoing costs only and do not reflect any transaction costs, such as sales charges (loads) on purchase payments or contingent deferred sales charges on redemptions, if any. Therefore, the hypothetical information is useful in comparing ongoing costs only, and will not help you determine the relative total costs of owning different funds. In addition, expenses shown in the table do not include the expenses of the underlying funds, which are borne indirectly by the Fund. If transaction costs and indirect expenses were included, your costs would have been higher.
| | | | | | | | | | | | | | | | | | | | | | | | |
| Class | | Beginning
Account Value
(05/01/17) | | | ACTUAL | | | HYPOTHETICAL (5% annual return before
expenses) | | | Annualized
Expense
Ratio | |
| | | Ending
Account Value
(10/31/17)1 | | | Expenses
Paid During
Period2 | | | Ending
Account Value
(10/31/17) | | | Expenses
Paid During
Period2 | | |
| A | | $ | 1,000.00 | | | $ | 1,030.80 | | | $ | 8.09 | | | $ | 1,017.24 | | | $ | 8.03 | | | | 1.58 | % |
| B | | | 1,000.00 | | | | 1,027.20 | | | | 11.91 | | | | 1,013.46 | | | | 11.82 | | | | 2.33 | |
| C | | | 1,000.00 | | | | 1,025.60 | | | | 11.90 | | | | 1,013.46 | | | | 11.82 | | | | 2.33 | |
| R | | | 1,000.00 | | | | 1,029.50 | | | | 9.36 | | | | 1,015.98 | | | | 9.30 | | | | 1.83 | |
| Y | | | 1,000.00 | | | | 1,031.80 | | | | 6.81 | | | | 1,018.50 | | | | 6.77 | | | | 1.33 | |
| R5 | | | 1,000.00 | | | | 1,031.70 | | | | 6.09 | | | | 1,019.21 | | | | 6.06 | | | | 1.19 | |
| R6 | | | 1,000.00 | | | | 1,033.10 | | | | 5.79 | | | | 1,019.51 | | | | 5.75 | | | | 1.13 | |
| 1 | The actual ending account value is based on the actual total return of the Fund for the period May 1, 2017 through October 31, 2017, after actual expenses and will differ from the hypothetical ending account value which is based on the Fund’s expense ratio and a hypothetical annual return of 5% before expenses. |
| 2 | Expenses are equal to the Fund’s annualized expense ratio as indicated above multiplied by the average account value over the period, multiplied by 184/365 to reflect the most recent fiscal half year. |
28 Invesco Balanced-Risk Commodity Strategy Fund
Approval of Investment Advisory and Sub-Advisory Contracts
The Board of Trustees (the Board) of AIM Investment Funds (Invesco Investment Funds) is required under the Investment Company Act of 1940, as amended, to approve annually the renewal of Invesco Balanced-Risk Commodity Strategy Fund’s (the Fund) investment advisory agreements. During contract renewal meetings held on June 12-13, 2017, the Board as a whole, and the disinterested or “independent” Trustees, who comprise over 75% of the Board, voting separately, approved the continuance for the Fund of the Master Investment Advisory Agreement with Invesco Advisers, Inc. (Invesco Advisers and the investment advisory agreement) and the Master Intergroup Sub-Advisory Contract for Mutual Funds with Invesco Asset Management Deutschland GmbH, Invesco Asset Management Limited, Invesco Asset Management (Japan) Limited, Invesco Hong Kong Limited, Invesco Senior Secured Management, Inc. and Invesco Canada Ltd. and separate Sub-Advisory Contracts with Invesco PowerShares Capital Management LLC and Invesco Asset Management (India) Private Limited (collectively, the Affiliated Sub-Advisers and the sub-advisory contracts) for another year, effective July 1, 2017.
In evaluating the fairness and reasonableness of compensation under the Fund’s investment advisory agreement and sub-advisory contracts, the Board considered, among other things, the factors discussed below. The Board determined that continuation of the Fund’s investment advisory agreement and the sub-advisory contracts is in the best interest of the Fund and its shareholders and that the compensation payable to Invesco Advisers and the Affiliated Sub-Advisers under the agreements is fair and reasonable.
The Board’s Fund Evaluation Process
The Board’s Investments Committee has established three Sub-Committees, which meet throughout the year to review the performance of funds advised by Invesco Advisers (the Invesco Funds). Over the course of each year, the Sub-Committees meet with portfolio managers for their assigned Invesco Funds and other members of management to review the performance, investment objective(s), policies, strategies, limitations and investment risks of these funds. The Board had the benefit of reports from the Sub-Committees and Investments Committee throughout the year in considering approval of the continuance of each Invesco Fund’s investment advisory agreement and sub-advisory contracts for another year.
During the contract renewal process, the Board receives comparative performance and fee data regarding the Invesco Funds prepared by Invesco Advisers and Broadridge Financial Solutions, Inc. (Broadridge), an independent provider of investment company data. The Board also receives an independent written
evaluation from the Senior Officer, an officer of the Invesco Funds who reports directly to the independent Trustees. The Senior Officer’s evaluation is prepared as part of his responsibility to manage the process by which the Invesco Funds’ proposed management fees are negotiated during the annual contract renewal process to ensure they are negotiated in a manner that is at arms’ length and reasonable. In addition to meetings with Invesco Advisers and fund counsel, the independent Trustees also discuss the continuance of the investment advisory agreement and sub-advisory contracts in separate sessions with the Senior Officer and with independent legal counsel.
The Trustees recognized that the advisory fee rates for the Invesco Funds are, in most cases, the result of years of review and negotiation. The Trustees’ deliberations and conclusions in a particular year may be based in part on their deliberations and conclusions regarding these arrangements throughout the year and in prior years. The Trustees’ review and conclusions are based on the comprehensive consideration of all information presented to them and are not the result of any single determinative factor. Moreover, one Trustee may have weighed a particular piece of information or factor differently than another Trustee.
The discussion below is a summary of the Senior Officer’s independent written evaluation with respect to the Fund’s investment advisory agreement as well as a discussion of the material factors and related conclusions that formed the basis for the Board’s approval of the Fund’s investment advisory agreement and sub-advisory contracts. This information is current as of June 13, 2017, and does not reflect consideration of factors that became known to the Board after that date.
Factors and Conclusions and Summary of Independent Written Fee Evaluation
| A. | Nature, Extent and Quality of Services Provided by Invesco Advisers and the Affiliated Sub-Advisers |
The Board reviewed the advisory services provided to the Fund by Invesco Advisers under the Fund’s investment advisory agreement, the performance of Invesco Advisers in providing these services, and the credentials and experience of the officers and employees of Invesco Advisers who provide these services, including the Fund’s portfolio manager or managers. The Board’s review included consideration of Invesco Advisers’ investment process oversight, credit analysis and investment risk management. The Board also considered non-advisory services that Invesco Advisers and its affiliates provide to the Invesco Funds such as various back office support functions, trading operations, internal audit, valuation and legal and compliance.
In determining whether to continue the Fund’s investment advisory agreement, the Board considered the benefits of reapproving an existing relationship as contrasted with the greater uncertainty that may be associated with entering into a new relationship. The Board concluded that the nature, extent and quality of the services provided to the Fund by Invesco Advisers are appropriate and satisfactory.
The Board reviewed the services that may be provided by the Affiliated Sub-Advisers under the sub-advisory contracts and the credentials and experience of the officers and employees of the Affiliated Sub-Advisers who provide these services. The Board noted that the Affiliated Sub-Advisers have offices and personnel that are located in financial centers around the world. As a result, the Board noted that the Affiliated Sub-Advisers can provide research and investment analysis on the markets and economies of various countries in which the Fund may invest, make recommendations regarding securities and assist with security trades. The Board concluded that the sub-advisory contracts may benefit the Fund and its shareholders by permitting Invesco Advisers to use the resources and talents of the Affiliated Sub-Advisers in managing the Fund. The Board concluded that the nature, extent and quality of the services that may be provided by the Affiliated Sub-Advisers are appropriate and satisfactory.
| B. | Fund Investment Performance |
The Board considered Fund investment performance as a relevant factor in considering whether to approve the investment advisory agreement. The Board did not view Fund performance as a relevant factor in considering whether to approve the sub-advisory contracts for the Fund, as no Affiliated Sub-Adviser currently manages assets of the Fund.
The Board compared the Fund’s investment performance during the past one, three and five calendar years to the performance of funds in the Broadridge performance universe and against the Lipper Commodities General Funds Index. The Board noted that performance of Class A shares of the Fund was in the third quintile of its performance universe for the one year period and the second quintile for the three and five year periods (the first quintile being the best performing funds and the fifth quintile being the worst performing funds). The Board noted that performance of Class A shares of the Fund was below the performance of the Index for the one year period and above the performance of the Index for the three and five year periods. The Trustees also reviewed more recent Fund performance and this review did not change their conclusions.
| C. | Advisory and Sub-Advisory Fees |
The Board compared the Fund’s contractual management fee rate to the contractual management fee rates of funds in the Fund’s
29 Invesco Balanced-Risk Commodity Strategy Fund
Broadridge expense group at a common asset level. The Board noted that the contractual management fee rate for Class A shares of the Fund was above the median contractual management fee rate of funds in its expense group. The Board noted that the term “contractual management fee” for funds in the expense group may include both advisory and certain administrative services fees, but that Broadridge does not provide information on a fund by fund basis as to what is included. The Board noted that Invesco Advisers does not separately charge the Invesco Funds for the administrative services included in the term as defined by Broadridge. The Board also reviewed the methodology used by Broadridge in providing expense group information, which includes using each fund’s contractual management fee schedule (including any applicable breakpoints) as reported in the most recent prospectus or statement of additional information for each fund in the expense group.
The Board noted that Invesco Advisers and its affiliates do not manage other mutual funds with investment strategies comparable to those of the Fund.
The Board did consider the fees charged by Invesco Advisers and the Affiliated Sub-Advisers to other client accounts that are managed using an investment process substantially similar to the investment process use for the Fund. The Board noted that Invesco Advisers or the Affiliated Sub-Advisers may charge lower fees to large institutional clients. Invesco Advisers reviewed with the Board the significantly greater scope of services it provides to the Invesco Funds relative to certain other types of client accounts. These additional services include provision of administrative services, officers and office space, oversight of service providers, preparation of annual registration statement updates and financial information and regulatory compliance under the Investment Company Act of 1940, as amended.
Invesco Advisers also reviewed generally the higher frequency of shareholder purchases and redemptions in the Invesco Funds relative to the flow of assets for other client accounts. Invesco Advisers advised the Board that advance notice of redemptions is often provided to Invesco Advisers by institutional clients. The Board did note that sub-advisory fee rates charged by the Affiliated Sub-Advisers to manage the Invesco Funds and to manage other client accounts tended to be more comparable, reflecting a similar scope of services.
The Board also considered the services that may be provided by the Affiliated Sub-Advisers pursuant to the sub-advisory contracts, as well as the fees payable by Invesco Advisers to the Affiliated Sub-Advisers pursuant to the sub-advisory contracts. The Board also noted that the sub-advisory fees are not paid directly by the Fund, but rather, are payable by Invesco Advisers to the Affiliated Sub-Advisers.
| D. | Economies of Scale and Breakpoints |
The Board considered the extent to which there are economies of scale in the provision of
advisory services to the Fund. The Board also considered that the Fund benefits from economies of scale through contractual breakpoints in the Fund’s advisory fee schedule. The Board noted that the Fund shares directly in economies of scale through lower fees charged by third party service providers based on the combined size of the Invesco Funds advised by Invesco Advisers.
| E. | Profitability and Financial Resources |
The Board reviewed information from Invesco Advisers concerning the costs of the advisory and other services that Invesco Advisers and its affiliates provide to the Fund and the Invesco Funds and the profitability of Invesco Advisers and its affiliates in providing these services. The Board noted that Invesco Advisers continues to operate at a net profit from services Invesco Advisers and its affiliates provide to the Invesco Funds and the Fund. The Board did not deem the level of profits realized by Invesco Advisers and its affiliates from providing services to the Fund to be excessive given the nature, quality and extent of the services provided. The Board received and accepted information from Invesco Advisers demonstrating that Invesco Advisers and each Affiliated Sub-Adviser are financially sound and have the resources necessary to perform their obligations under the investment advisory agreement and sub-advisory contracts.
| F. | Collateral Benefits to Invesco Advisers and its Affiliates |
The Board considered various other benefits received by Invesco Advisers and its affiliates from the relationship with the Fund, including the fees received for providing transfer agency and distribution services to the Fund. The Board considered comparative information regarding fees charged for these services, including information provided by Broadridge and other independent sources. The Board considered the performance of Invesco Advisers and its affiliates in providing these services and the organizational structure employed to provide these services. The Board also considered that these services are provided to the Fund pursuant to written contracts that are reviewed and approved on an annual basis by the Board; and that the services are required for the operation of the Fund.
30 Invesco Balanced-Risk Commodity Strategy Fund
Tax Information
Form 1099-DIV, Form 1042-S and other year-end tax information provide shareholders with actual calendar year amounts that should be included in their tax returns. Shareholders should consult their tax advisors.
The following distribution information is being provided as required by the Internal Revenue Code or to meet a specific state’s requirement.
The Fund designates the following amounts or, if subsequently determined to be different, the maximum amount allowable for its fiscal year ended October 31, 2017:
| | | | |
Federal and State Income Tax | |
Qualified Dividend Income* | | | 0.00 | % |
Corporate Dividends Received Deduction* | | | 0.00 | % |
U.S. Treasury Obligations* | | | 51.11 | % |
| | * | The above percentages are based on ordinary income dividends paid to shareholders during the Fund’s fiscal year. |
31 Invesco Balanced-Risk Commodity Strategy Fund
Trustees and Officers
The address of each trustee and officer is AIM Investment Funds (Invesco Investment Funds) (the “Trust”), 11 Greenway Plaza, Suite 1000, Houston, Texas 77046-1173. The trustees serve for the life of the Trust, subject to their earlier death, incapacitation, resignation, retirement or removal as more specifically provided in the Trust’s organizational documents. Each officer serves for a one year term or until their successors are elected and qualified. Column two below includes length of time served with predecessor entities, if any.
| | | | | | | | |
Name, Year of Birth and Position(s) Held with the Trust | | Trustee and/
or Officer Since | | Principal Occupation(s)
During Past 5 Years | | Number of
Funds in Fund
Complex
Overseen by
Trustee | | Other Directorship(s)
Held by Trustee During Past 5 Years |
| Interested Persons | | | | | | | | |
| Martin L. Flanagan1 — 1960 Trustee | | 2007 | | Executive Director, Chief Executive Officer and President, Invesco Ltd. (ultimate parent of Invesco and a global investment management firm); Trustee, The Invesco Funds; Vice Chair, Investment Company Institute; and Member of Executive Board, SMU Cox School of Business Formerly: Advisor to the Board, Invesco Advisers, Inc. (formerly known as Invesco Institutional (N.A.), Inc.); Chairman and Chief Executive Officer, Invesco Advisers, Inc. (registered investment adviser); Director, Chairman, Chief Executive Officer and President, Invesco Holding Company (US), Inc. (formerly IVZ Inc.) (holding company), Invesco Group Services, Inc. (service provider) and Invesco North American Holdings, Inc. (holding company); Director, Chief Executive Officer and President, Invesco Holding Company Limited (parent of Invesco and a global investment management firm); Director, Invesco Ltd.; Chairman, Investment Company Institute and President, Co-Chief Executive Officer, Co-President, Chief Operating Officer and Chief Financial Officer, Franklin Resources, Inc. (global investment management organization) | | 158 | | None |
Philip A. Taylor2 — 1954 Trustee and Senior Vice President | | 2006 | | Head of the Americas and Senior Managing Director, Invesco Ltd.; Director, Invesco Advisers, Inc. (formerly known as Invesco Institutional (N.A.), Inc.) (registered investment adviser); Director, Chairman, Chief Executive Officer and President, Invesco Management Group, Inc. (formerly known as Invesco Aim Management Group, Inc.) (financial services holding company); Director and Chairman, Invesco Investment Services, Inc. (formerly known as Invesco Aim Investment Services, Inc.) (registered transfer agent); Chief Executive Officer, Invesco Corporate Class Inc. (corporate mutual fund company); Director, Chairman and Chief Executive Officer, Invesco Canada Ltd. (formerly known as Invesco Trimark Ltd./Invesco Trimark Ltèe) (registered investment adviser and registered transfer agent); Trustee and Senior Vice President, The Invesco Funds; Director, Invesco Investment Advisers LLC (formerly known as Van Kampen Asset Management). Formerly: Co-Chairman, Co-President and Co-Chief Executive Officer, Invesco Advisers, Inc. (formerly known as Invesco Institutional (N.A.), Inc.) (registered investment adviser); Director, Chief Executive Officer and President, Van Kampen Exchange Corp; President and Principal Executive Officer, The Invesco Funds (other than AIM Treasurer’s Series Trust (Invesco Treasurer’s Series Trust), Short-Term Investments Trust and Invesco Management Trust); Executive Vice President, The Invesco Funds (AIM Treasurer’s Series Trust (Invesco Treasurer’s Series Trust), Short-Term Investments Trust and Invesco Management Trust only); Director and President, INVESCO Funds Group, Inc. (registered investment adviser and registered transfer agent); Director and Chairman, IVZ Distributors, Inc. (formerly known as INVESCO Distributors, Inc.) (registered broker dealer); Director, President and Chairman, Invesco Inc. (holding company), Invesco Canada Holdings Inc. (holding company), Trimark Investments Ltd./Placements Trimark Ltèe and Invesco Financial Services Ltd/Services Financiers Invesco Ltèe; Chief Executive Officer, Invesco Canada Fund Inc. (corporate mutual fund company); Director and Chairman, Van Kampen Investor Services Inc.; Director, Chief Executive Officer and President, 1371 Preferred Inc. (holding company) and Van Kampen Investments Inc.; Director and President, AIM GP Canada Inc. (general partner for limited partnerships) and Van Kampen Advisors, Inc.; Director and Chief Executive Officer, Invesco Trimark Dealer Inc. (registered broker dealer); Director, Invesco Distributors, Inc. (formerly known as Invesco Aim Distributors, Inc.) (registered broker dealer); Manager, Invesco PowerShares Capital Management LLC; Director, Chief Executive Officer and President, Invesco Advisers, Inc.; Director, Chairman, Chief Executive Officer and President, Invesco Aim Capital Management, Inc.; President, Invesco Trimark Dealer Inc. and Invesco Trimark Ltd./Invesco Trimark Ltèe; Director and President, AIM Trimark Corporate Class Inc. and AIM Trimark Canada Fund Inc.; Senior Managing Director, Invesco Holding Company Limited; Director and Chairman, Fund Management Company (former registered broker dealer); President and Principal Executive Officer, The Invesco Funds (AIM Treasurer’s Series Trust (Invesco Treasurer’s Series Trust), and Short-Term Investments Trust only); President, AIM Trimark Global Fund Inc. and AIM Trimark Canada Fund Inc. | | 158 | | None |
| 1 | Mr. Flanagan is considered an interested person (within the meaning of Section 2(a)(19) of the 1940 Act) of the Trust because he is an officer of the Adviser to the Trust, and an officer and a director of Invesco Ltd., ultimate parent of the Adviser. |
| 2 | Mr. Taylor is considered an interested person (within the meaning of Section 2(a)(19) of the 1940 Act) of the Trust because he is an officer and a director of the Adviser. |
T-1 Invesco Balanced-Risk Commodity Strategy Fund
Trustees and Officers—(continued)
| | | | | | | | |
Name, Year of Birth and Position(s) Held with the Trust | | Trustee and/
or Officer Since | | Principal Occupation(s) During Past 5 Years | | Number of
Funds in Fund
Complex
Overseen by
Trustee | | Other Directorship(s)
Held by Trustee During Past 5 Years |
| Independent Trustees | | | | | | | | |
Bruce L. Crockett — 1944 Trustee and Chair | | 2001 | | Chairman, Crockett Technologies Associates (technology consulting company) Formerly: Director, Captaris (unified messaging provider); Director, President and Chief Executive Officer, COMSAT Corporation; Chairman, Board of Governors of INTELSAT (international communications company); ACE Limited (insurance company); Independent Directors Council and Investment Company Institute: Member of the Audit Committee, Investment Company Institute; Member of the Executive Committee and Chair of the Governance Committee, Independent Directors Council | | 158 | | Director and Chairman of the Audit Committee, ALPS (Attorneys Liability Protection Society) (insurance company); Director and Member of the Audit Committee, Ferroglobe PLC (metallurgical company) |
David C. Arch — 1945 Trustee | | 2010 | | Chairman of Blistex Inc. (consumer health care products manufacturer); Member, World Presidents’ Organization | | 158 | | Board member of the Illinois Manufacturers’ Association |
James T. Bunch — 1942 Trustee | | 2003 | | Managing Member, Grumman Hill Group LLC (family office/private equity investments) Formerly: Chairman of the Board, Denver Film Society; Chairman of the Board of Trustees, Evans Scholarship Foundation; Chairman, Board of Governors, Western Golf Association | | 158 | | Trustee, Evans Scholarship Foundation |
Jack M. Fields — 1952 Trustee | | 2001 | | Chief Executive Officer, Twenty First Century Group, Inc. (government affairs company); and Discovery Learning Alliance (non-profit) Formerly: Owner and Chief Executive Officer, Dos Angeles Ranch L.P. (cattle, hunting, corporate entertainment); Director, Insperity, Inc. (formerly known as Administaff) (human resources provider); Chief Executive Officer, Texana Timber LP (sustainable forestry company); Director of Cross Timbers Quail Research Ranch (non-profit); and member of the U.S. House of Representatives | | 158 | | None |
Cynthia Hostetler — 1962 Trustee | | 2017 | | Non-Executive Director and Trustee of a number of public and private business corporations Formerly: Head of Investment Funds and Private Equity, Overseas Private Investment Corporation; President, First Manhattan Bancorporation, Inc.; Attorney, Simpson Thacher & Bartlett LLP | | 158 | | Vulcan Materials Company (construction materials company); Trilinc Global Impact Fund; Aberdeen Investment Funds (4 portfolios); Artio Global Investment LLC (mutual fund complex); Edgen Group, Inc. (specialized energy and infrastructure products distributor) |
Eli Jones — 1961 Trustee | | 2016 | | Professor and Dean, Mays Business School — Texas A&M University Formerly: Professor and Dean, Walton College of Business, University of Arkansas and E.J. Ourso College of Business, Louisiana State University; Director, Arvest Bank | | 158 | | Insperity, Inc. (formerly known as Administaff) (human resources provider) |
Prema Mathai-Davis — 1950 Trustee | | 2001 | | Retired. Formerly: Chief Executive Officer, YWCA of the U.S.A. | | 158 | | None |
Teresa M. Ressel — 1962 Trustee | | 2017 | | Non-executive director and trustee of a number of public and private business corporations Formerly: Chief Financial Officer, Olayan America, The Olayan Group (international investor/commercial/industrial); Chief Executive Officer, UBS Securities LLC; Group Chief Operating Officer, Americas, UBS AG; Assistant Secretary for Management & Budget and CFO, US Department of the Treasury; Chief Compliance Officer, Kaiser Permanente (healthcare consortium); Program Manager, Hewlett-Packard; Nuclear Engineering, General Dynamics Corporation (aerospace and defense company) | | 158 | | Atlantic Power Corporation (power generation company); ON Semiconductor Corp. (semiconductor supplier) |
Larry Soll — 1942 Trustee | | 2003 | | Retired. Formerly: Chairman, Chief Executive Officer and President, Synergen Corp. (a biotechnology company) | | 158 | | None |
Ann Barnett Stern — 1957 Trustee | | 2017 | | President and Chief Executive Officer, Houston Endowment Inc. (private philanthropic institution) Formerly: Executive Vice President and General Counsel, Texas Children’s Hospital; Attorney, Beck, Redden and Secrest, LLP; Business Law Instructor, University of St. Thomas; Attorney, Andrews & Kurth LLP | | 158 | | Federal Reserve Bank of Dallas |
Raymond Stickel, Jr. — 1944 Trustee | | 2005 | | Retired. Formerly: Director, Mainstay VP Series Funds, Inc. (25 portfolios); Partner, Deloitte & Touche | | 158 | | None |
Robert C. Troccoli — 1949 Trustee | | 2016 | | Adjunct Professor, University of Denver — Daniels College of Business Formerly: Senior Partner, KPMG LLP | | 158 | | None |
T-2 Invesco Balanced-Risk Commodity Strategy Fund
Trustees and Officers—(continued)
| | | | | | | | |
Name, Year of Birth and Position(s) Held with the Trust | | Trustee and/
or Officer Since | | Principal Occupation(s) During Past 5 Years | | Number of
Funds in Fund
Complex
Overseen by
Trustee | | Other Directorship(s)
Held by Trustee During Past 5 Years |
| Independent Trustees—(continued) |
Christopher L. Wilson — 1957 Trustee | | 2017 | | Managing Partner, CT2, LLC (investing and consulting firm) Formerly: President/Chief Executive Officer, Columbia Funds, Bank of America Corporation; President/Chief Executive Officer, CDC IXIS Asset Management Services, Inc.; Principal & Director of Operations, Scudder Funds, Scudder, Stevens & Clark, Inc.; Assistant Vice President, Fidelity Investments | | 158 | | TD Asset Management USA Inc. (mutual fund complex) (22 portfolios); ISO New England, Inc. (non-profit organization managing regional electricity market) |
| Other Officers | | | | | | | | |
Sheri Morris — 1964 President, Principal Executive Officer and Treasurer | | 1999 | | President, Principal Executive Officer and Treasurer, The Invesco Funds; Vice President, Invesco Advisers, Inc. (formerly known as Invesco Institutional (N.A.), Inc.) (registered investment adviser); and Vice President, PowerShares Exchange-Traded Fund Trust, PowerShares Exchange-Traded Fund Trust II, PowerShares India Exchange-Traded Fund Trust, PowerShares Actively Managed Exchange-Traded Fund Trust and PowerShares Actively Managed Exchange-Traded Commodity Fund Trust Formerly: Vice President and Principal Financial Officer, The Invesco Funds; Vice President, Invesco Aim Advisers, Inc., Invesco Aim Capital Management, Inc. and Invesco Aim Private Asset Management, Inc.; Assistant Vice President and Assistant Treasurer, The Invesco Funds and Assistant Vice President, Invesco Advisers, Inc., Invesco Aim Capital Management, Inc. and Invesco Aim Private Asset Management, Inc.; and Treasurer, PowerShares Exchange-Traded Fund Trust, PowerShares Exchange-Traded Fund Trust II, PowerShares India Exchange-Traded Fund Trust and PowerShares Actively Managed Exchange-Traded Fund Trust | | N/A | | N/A |
Russell C. Burk — 1958 Senior Vice President and Senior Officer | | 2005 | | Senior Vice President and Senior Officer, The Invesco Funds | | N/A | | N/A |
John M. Zerr — 1962 Senior Vice President, Chief Legal Officer and Secretary | | 2006 | | Director, Senior Vice President, Secretary and General Counsel, Invesco Management Group, Inc. (formerly known as Invesco AIM Management Group, Inc.); Senior Vice President, Invesco Advisers, Inc. (formerly known as Invesco Institutional (N.A.), Inc.) (registered investment adviser); Senior Vice President and Secretary, Invesco Distributors, Inc. (formerly known as Invesco AIM Distributors, Inc.); Director, Vice President and Secretary, Invesco Investment Services, Inc. (formerly known as Invesco AIM Investment Services, Inc.) Senior Vice President, Chief Legal Officer and Secretary, The Invesco Funds; Managing Director, Invesco PowerShares Capital Management LLC; Director, Secretary and General Counsel, Invesco Investment Advisers LLC (formerly known as Van Kampen Asset Management); Secretary and General Counsel, Invesco Capital Markets, Inc. (formerly known as Van Kampen Funds Inc.) and Chief Legal Officer, PowerShares Exchange-Traded Fund Trust, PowerShares Exchange-Traded Fund Trust II, PowerShares India Exchange-Traded Fund Trust, PowerShares Actively Managed Exchange-Traded Fund Trust and PowerShares Actively Managed Exchange-Traded Commodity Fund Trust; Manager and Secretary, Invesco Indexing LLC Formerly: Director, Secretary, General Counsel and Senior Vice President, Van Kampen Exchange Corp.; Director, Vice President and Secretary, IVZ Distributors, Inc. (formerly known as INVESCO Distributors, Inc.); Director and Vice President, INVESCO Funds Group, Inc.; Director and Vice President, Van Kampen Advisors Inc.; Director, Vice President, Secretary and General Counsel, Van Kampen Investor Services Inc.; Director, Invesco Distributors, Inc. (formerly known as Invesco AIM Distributors, Inc.); Director, Senior Vice President, General Counsel and Secretary, Invesco AIM Advisers, Inc. and Van Kampen Investments Inc.; Director, Vice President and Secretary, Fund Management Company; Director, Senior Vice President, Secretary, General Counsel and Vice President, Invesco AIM Capital Management, Inc.; Chief Operating Officer and General Counsel, Liberty Ridge Capital, Inc. (an investment adviser); Vice President and Secretary, PBHG Funds (an investment company) and PBHG Insurance Series Fund (an investment company); Chief Operating Officer, General Counsel and Secretary, Old Mutual Investment Partners (a broker-dealer); General Counsel and Secretary, Old Mutual Fund Services (an administrator) and Old Mutual Shareholder Services (a shareholder servicing center); Executive Vice President, General Counsel and Secretary, Old Mutual Capital, Inc. (an investment adviser); and Vice President and Secretary, Old Mutual Advisors Funds (an investment company) | | N/A | | N/A |
Gregory G. McGreevey — 1962 Senior Vice President | | 2012 | | Senior Managing Director, Invesco Ltd.; Director, Chairman, President, and Chief Executive Officer, Invesco Advisers, Inc. (formerly known as Invesco Institutional (N.A.), Inc.) (registered investment adviser); Senior Vice President, Invesco Management Group, Inc.; Director, Invesco Mortgage Capital, Inc. and Invesco Senior Secured Management, Inc.; and Senior Vice President, The Invesco Funds Formerly: Assistant Vice President, The Invesco Funds | | N/A | | N/A |
T-3 Invesco Balanced-Risk Commodity Strategy Fund
Trustees and Officers—(continued)
| | | | | | | | |
Name, Year of Birth and Position(s) Held with the Trust | | Trustee and/
or Officer Since | | Principal Occupation(s) During Past 5 Years | | Number of
Funds in Fund
Complex
Overseen by
Trustee | | Other Directorship(s)
Held by Trustee During Past 5 Years |
| Other Officers—(continued) | | | | | | | | |
Kelli Gallegos — 1970 Vice President, Principal Financial Officer and Assistant Treasurer | | 2008 | | Vice President, Principal Financial Officer and Assistant Treasurer, The Invesco Funds; Assistant Treasurer, Invesco PowerShares Capital Management LLC, PowerShares Exchange-Traded Fund Trust, PowerShares Exchange-Traded Fund Trust II, PowerShares India Exchange-Traded Fund Trust, PowerShares Actively Managed Exchange-Traded Fund Trust and PowerShares Actively Managed Exchange-Traded Commodity Fund Trust Formerly: Assistant Vice President, The Invesco Funds | | N/A | | N/A |
Tracy Sullivan — 1962 Vice President, Chief Tax Officer and Assistant Treasurer | | 2008 | | Vice President, Chief Tax Officer and Assistant Treasurer, The Invesco Funds; Assistant Treasurer, Invesco PowerShares Capital Management LLC, PowerShares Exchange-Traded Fund Trust, PowerShares Exchange-Traded Fund Trust II, PowerShares India Exchange-Traded Fund Trust, PowerShares Actively Managed Exchange-Traded Fund Trust and PowerShares Actively Managed Exchange-Traded Commodity Fund Trust Formerly: Assistant Vice President, The Invesco Funds | | N/A | | N/A |
Crissie M. Wisdom — 1969 Anti-Money Laundering Compliance Officer | | 2013 | | Anti-Money Laundering Compliance Officer, Invesco Advisers, Inc. (formerly known as Invesco Institutional (N.A.), Inc.) (registered investment adviser), Invesco Capital Markets, Inc. (formerly known as Van Kampen Funds Inc.), Invesco Distributors, Inc., Invesco Investment Services, Inc., Invesco Management Group, Inc., The Invesco Funds, and PowerShares Exchange-Traded Fund Trust, PowerShares Exchange-Traded Fund Trust II, PowerShares India Exchange-Traded Fund Trust, PowerShares Actively Managed Exchange-Traded Fund Trust and PowerShares Actively Managed Exchange-Traded Commodity Fund Trust; Anti-Money Laundering Compliance Officer and Bank Secrecy Act Officer, INVESCO National Trust Company and Invesco Trust Company; and Fraud Prevention Manager and Controls and Risk Analysis Manager for Invesco Investment Services, Inc. Formerly: Anti-Money Laundering Compliance Officer, Van Kampen Exchange Corp. | | N/A | | N/A |
Robert R. Leveille — 1969 Chief Compliance Officer | | 2016 | | Chief Compliance Officer, Invesco Advisers, Inc. (registered investment adviser); and Chief Compliance Officer, The Invesco Funds Formerly: Chief Compliance Officer, Putnam Investments and the Putnam Funds | | N/A | | N/A |
The Statement of Additional Information of the Trust includes additional information about the Fund’s Trustees and is available upon request, without charge, by calling 1.800.959.4246. Please refer to the Fund’s Statement of Additional Information for information on the Fund’s sub-advisers.
| | | | | | |
Office of the Fund 11 Greenway Plaza, Suite 1000 Houston, TX 77046-1173 | | Investment Adviser Invesco Advisers, Inc. 1555 Peachtree Street, N.E. Atlanta, GA 30309 | | Distributor Invesco Distributors, Inc. 11 Greenway Plaza, Suite 1000 Houston, TX 77046-1173 | | Auditors PricewaterhouseCoopers LLP 1000 Louisiana Street, Suite 5800 Houston, TX 77002-5678 |
| | | |
| | | | | | |
Counsel to the Fund Stradley Ronon Stevens & Young, LLP 2005 Market Street, Suite 2600 Philadelphia, PA 19103-7018 | | Counsel to the Independent Trustees Goodwin Procter LLP 901 New York Avenue, N.W. Washington, D.C. 20001 | | Transfer Agent Invesco Investment Services, Inc. 11 Greenway Plaza, Suite 1000 Houston, TX 77046-1173 | | Custodian State Street Bank and Trust Company 225 Franklin Street Boston, MA 02110-2801 |
T-4 Invesco Balanced-Risk Commodity Strategy Fund
Explore High-Conviction Investing with Invesco

Go paperless with eDelivery
Visit invesco.com/edelivery to enjoy the convenience and security of anytime electronic access to your investment documents.
With eDelivery, you can elect to have any or all of the following materials delivered straight to your inbox to download, save and print from your own computer:
| ∎ | | Fund reports and prospectuses |
Invesco mailing information
Send general correspondence to Invesco Investment Services, Inc., P.O. Box 219078, Kansas City, MO 64121-9078.
Important notice regarding delivery of security holder documents
To reduce Fund expenses, only one copy of most shareholder documents may be mailed to shareholders with multiple accounts at the same address (Householding). Mailing of your shareholder documents may be householded indefinitely unless you instruct us otherwise. If you do not want the mailing of these documents to be combined with those for other members of your household, please contact Invesco Investment Services, Inc. at 800 959 4246 or contact your financial institution. We will begin sending you individual copies for each account within 30 days after receiving your request.
Fund holdings and proxy voting information
The Fund provides a complete list of its holdings four times in each fiscal year, at the quarter ends. For the second and fourth quarters, the lists appear in the Fund’s semiannual and annual reports to shareholders. For the first and third quarters, the Fund files the lists with the Securities and Exchange Commission (SEC) on Form N-Q. The most recent list of portfolio holdings is available at invesco.com/completeqtrholdings. Shareholders can also look up the Fund’s Forms N-Q on the SEC website at sec.gov. Copies of the Fund’s Forms N-Q may be reviewed and copied at the SEC Public Reference Room in Washington, D.C. You can obtain information on the operation of the Public Reference Room, including information about duplicating fee charges, by calling 202 551 8090 or 800 732 0330, or by electronic request at the following email address: publicinfo@sec.gov. The SEC file numbers for the Fund are shown below.
A description of the policies and procedures that the Fund uses to determine how to vote proxies relating to portfolio securities is available without charge, upon request, from our Client Services department at 800 959 4246 or at invesco.com/proxyguidelines. The information is also available on the SEC website, sec.gov.
| | |
Information regarding how the Fund voted proxies related to its portfolio securities during the most recent 12-month period ended June 30 is available at invesco.com/proxysearch. The information is also available on the SEC website, sec.gov. Invesco Advisers, Inc. is an investment adviser; it provides investment advisory services to individual and institutional clients and does not sell securities. Invesco Distributors, Inc. is the US distributor for Invesco Ltd.’s retail mutual funds, exchange-traded funds and institutional money market funds. Both are wholly owned, indirect subsidiaries of Invesco Ltd. | |  |
| | | | | | | | |
| SEC file number: 811-05426 and 033-19338 | | Invesco Distribution, Inc. | | BRCS-AR-1 | | 12122017 | | 1043 |
Letters to Shareholders
| | | | | | | | | |

Philip Taylor | | | | Dear Shareholders: This annual report includes information about your Fund, including performance data and a complete list of its investments as of the close of the reporting period. Inside is a discussion of how your Fund was managed and the factors that affected its performance during the reporting period. American voters went to the polls just days after the start of the reporting period, and their decisions quickly affected markets. The US stock market rallied strongly after the election, with major market indexes rising, and setting record highs, throughout the reporting period. Generally positive economic data, strong corporate earnings and hope for tax and regulatory reform contributed to the rally. US and global bond markets, as well as emerging market equities, sold off immediately following the election – with the US bond market eventually recovering most of its losses. Overseas, economic data were mixed, prompting the European Central Bank and central banks in China and Japan, among other countries, to maintain | | |
extraordinarily accommodative monetary policies. Citing positive economic trends – specifically, realized and expected labor market conditions and inflation – the US Federal Reserve raised interest rates three times during the reporting period: first in December 2016, and then again in March and June 2017. Health care and tax reform proved to be more difficult than expected to enact, with little progress achieved by the end of the reporting period.
Short-term market volatility can prompt some investors to abandon their investment plans – and can cause others to settle for whatever returns the market has to offer. The investment professionals at Invesco, in contrast, invest with high conviction. This means that, no matter the asset class or the strategy, each investment team has a passion to exceed. We want to help investors achieve better outcomes, such as seeking higher returns, helping mitigate risk and generating income. Of course, investing with high conviction can’t guarantee a profit or ensure success; no investment strategy can. To learn more about how we invest with high conviction, visit invesco.com/HighConviction.
You, too, can invest with high conviction by maintaining a long-term investment perspective and by working with your financial adviser on a regular basis. During periods of short-term market volatility or uncertainty, your financial adviser can keep you focused on your long-term investment goals – a new home, a child’s college education or a secure retirement. He or she also can share research about the economy, the markets and individual investment options.
Visit our website for more information on your investments
Our website, invesco.com/us, offers a wide range of market insights and investment perspectives. On the website, you’ll find detailed information about our funds, including performance, holdings and portfolio manager commentaries. You can access information about your account by completing a simple, secure online registration. To do so, select “Log In” on the right side of the homepage, and then select “Register for Individual Account Access.”
In addition to the resources accessible on our website and through our mobile app, you can obtain timely updates to help you stay informed about the markets and the economy by connecting with Invesco on Twitter, LinkedIn or Facebook. You can access our blog at blog.invesco.us.com. Our goal is to provide you the information you want, when and where you want it.
Finally, I’m pleased to share with you Invesco’s commitment to both the Principles for Responsible Investment and to considering environmental, social and governance issues in our robust investment process. I invite you to learn more at invesco.com/esg.
Have questions?
For questions about your account, contact an Invesco client services representative at 800 959 4246. For Invesco-related questions or comments, please email me directly at phil@invesco.com.
All of us at Invesco look forward to serving your investment management needs. Thank you for investing with us.
Sincerely,

Philip Taylor
Senior Managing Director, Invesco Ltd.
2 Invesco Developing Markets Fund
| | | | | | |

Bruce Crockett | | Dear Fellow Shareholders: Among the many important lessons I’ve learned in more than 40 years in a variety of business endeavors is the value of a trusted advocate. As independent chair of the Invesco Funds Board, I can assure you that the members of the Board are strong advocates for the interests of investors in Invesco’s mutual funds. We work hard to represent your interests through oversight of the quality of the investment management services your funds receive and other matters important to your investment, including but not limited to: |
| | | | ∎ | | Ensuring that Invesco offers a diverse lineup of mutual funds that your financial adviser can use to strive to meet your financial needs as your investment goals change over time. |
| | | | ∎ | | Monitoring how the portfolio management teams of the Invesco funds are performing in light of changing economic and market conditions. |
| ∎ | | Assessing each portfolio management team’s investment performance within the context of the investment strategy described in the fund’s prospectus. |
| ∎ | | Monitoring for potential conflicts of interests that may impact the nature of the services that your funds receive. |
We believe one of the most important services we provide our fund shareholders is the annual review of the funds’ advisory and sub-advisory contracts with Invesco Advisers and its affiliates. This review is required by the Investment Company Act of 1940 and focuses on the nature and quality of the services Invesco provides as the adviser to the Invesco funds and the reasonableness of the fees that it charges for those services. Each year, we spend months carefully reviewing information received from Invesco and a variety of independent sources, such as performance and fee data prepared by Lipper, Inc. (a subsidiary of Broadridge Financial Solutions, Inc.), an independent, third-party firm widely recognized as a leader in its field. We also meet with our independent legal counsel and other independent advisers to review and help us assess the information that we have received. Our goal is to assure that you receive quality investment management services for a reasonable fee.
I trust the measures outlined above provide assurance that you have a worthy advocate when it comes to choosing the Invesco Funds.
As always, please contact me at bruce@brucecrockett.com with any questions or concerns you may have. On behalf of the Board, we look forward to continuing to represent your interests and serving your needs.
Sincerely,

Bruce L. Crockett
Independent Chair
Invesco Funds Board of Trustees
3 Invesco Developing Markets Fund
Management’s Discussion of Fund Performance
Performance summary
For the fiscal year ended October 31, 2017, Class A shares of Invesco Developing Markets Fund (the Fund), at net asset value (NAV), underperformed the MSCI Emerging Markets Index, the Fund’s broad market/style-specific benchmark.
Your Fund’s long-term performance appears later in this report.
Fund vs. Indexes
Total returns, 10/31/16 to 10/31/17, at net asset value (NAV). Performance shown does not include applicable contingent deferred sales charges (CDSC) or front-end sales charges,which would have reduced performance.
| | | | | |
Class A Shares | | | | 20.58 | % |
Class B Shares | | | | 19.65 | |
Class C Shares | | | | 19.68 | |
Class Y Shares | | | | 20.87 | |
Class R5 Shares | | | | 21.01 | |
Class R6 Shares | | | | 21.07 | |
MSCI Emerging Markets Index▼ (Broad Market/Style-Specific Index) | | | | 26.45 | |
Lipper Emerging Market Funds Index∎ (Peer Group Index) | | | | 24.58 | |
| | | | | |
Source(s): ▼FactSet Research Systems Inc.; ∎Lipper Inc. | | | | | |
Market conditions and your Fund
The reporting period began with major US stock market indexes posting gains and most hitting record highs following the US presidential election. Investors believed that the new administration’s plans to reduce tax rates, scale back regulations and increase infrastructure spending had the potential to stimulate economic growth. However, that was called into question in the first quarter of 2017, when it appeared that enacting significant regulatory and tax reform might be more difficult than previously anticipated.
Outside the US, Brexit (the UK’s plan to leave the European Union) remained a source of political and economic uncertainty, while improved economic data and confidence surveys raised the prospect of less accommodative monetary policy in continental Europe. In Asia, increased exports helped Japan’s economy, while China’s economy continued to stabilize. Most emerging markets performed well
during the reporting period. In addition to an improving global economic outlook, other positive tailwinds for international markets included continued weakness in the US dollar and reduced expectations for a major shift in US trade policy.
Interestingly, while 2017 marked the eighth year of the global bull market, we saw a shift in leadership as international stocks outperformed US stocks in the first three quarters of 2017. International stocks had trailed US stocks for four consecutive years and in six of the last seven years. As the reporting period came to a close, both developed and emerging equity markets appeared somewhat fully valued despite material discounts to the US market. In addition, recent earnings growth and earnings revision trends improved for many non-US developed markets.
Regardless of the macroeconomic environment, we remain focused on our bottom-up investment approach of identifying attractive companies that fit our earnings, quality and valuation (EQV) process.
On a geographic basis, the Fund’s holdings in Russia, Brazil, Hong Kong and Thailand delivered double-digit gains, outperforming the MSCI Emerging Markets Index in each of these markets and contributing favorably to both absolute and relative Fund performance. Not having exposure to South Africa, a relatively weak market over the reporting period, supported relative results, as well. In contrast, Fund holdings in Israel and Mexico delivered negative returns and detracted from both absolute and relative Fund performance. Although the Fund delivered double-digit gains in China and South Korea, a meaningful underweight position in these strong markets detracted from relative returns.
From a sector perspective, the Fund’s holdings in the financials, consumer staples, consumer discretionary and energy sectors outperformed those of the MSCI Emerging Markets Index and contributed favorably to both relative and absolute returns. The Fund’s holdings in the information technology (IT) and telecommunication services sectors, however, underperformed those of the broad market/style-specific index and were among the most significant detractors from the Fund’s performance. Underweight exposure to the IT sector – one of the reporting period’s best-performing sectors – was a drag on relative returns. Within this sector, not owning two of the MSCI Emerging Markets Index’s best-performing stocks over the reporting period – China-based Tencent Holdings and Alibaba Group – was a meaningful drag on relative performance.
The market showed little concern for valuation over the fiscal year, with investors accepting very high valuations for these types of momentum growth stocks. The Fund did not hold these stocks because we believed elevated valuations did not offer attractive risk-reward profiles.
| | | | | |
| Portfolio Composition | |
By sector | | | | % of total net assets | |
| | | | | |
| Financials | | | | 29.3 | % |
| Consumer Staples | | | | 15.1 | |
| Information Technology | | | | 14.8 | |
| Consumer Discretionary | | | | 6.4 | |
| Telecommunication Services | | | | 4.8 | |
| Health Care | | | | 4.5 | |
| Real Estate | | | | 3.5 | |
| Materials | | | | 2.7 | |
| Energy | | | | 2.5 | |
| Industrials | | | | 1.8 | |
| Money Market Funds Plus Other Assets Less Liabilities | | | | 14.6 | |
| | | | | |
| Top 10 Equity Holdings* |
% of total net assets |
| | | | | |
1. B3 S.A. - Brasil, Bolsa, Balcao | | | | 4.0 | % |
2. Kasikornbank PCL | | | | 3.4 | |
3. WH Group Ltd. - REGS | | | | 3.1 | |
4. Haci Omer Sabanci Holding A.S. | | | | 2.9 | |
5. Sberbank of Russia PJSC - Preference Shares | | | | 2.8 | |
6. NAVER Corp. | | | | 2.8 | |
7. Banco Bradesco S.A. - ADR | | | | 2.8 | |
8. Inner Mongolia Yili Industrial Group Co., Ltd. - Class A | | | | 2.8 | |
9. Samsung Electronics Co., Ltd. | | | | 2.7 | |
10. Arcos Dorados Holdings, Inc. - Class A | | | | 2.6 | |
| | | | | |
| Total Net Assets | | | | $3.4 billion | |
| |
| Total Number of Holdings* | | | | 54 | |
The Fund’s holdings are subject to change, and there is no assurance that the Fund will continue to hold any particular security.
*Excluding money market fund holdings.
Data presented here are as of October 31, 2017.
4 Invesco Developing Markets Fund
The Fund’s cash exposure (which averaged around 15% over the reporting period), in a strong up-market, was a meaningful detractor from Fund performance versus the broad market/style-specific benchmark. It is important to note that similar to the Fund’s sector and regional allocations, cash is a residual of our bottom-up investment process and not the result of any top-down tactical asset allocation or risk-management allocation decision. Over the reporting period, cash tended to be higher than the long-term average (generally less than 10% of total net assets) primarily due to the valuation component of our EQV philosophy. As the market moved higher, we trimmed and/or sold a number of stocks based on valuation. Unfortunately, it has been challenging to redeploy the proceeds because valuation is such an integral part of our EQV approach and many high-quality stocks remained very expensive.
From an individual securities perspective, Kweichow Moutai, a Chinese spirits company, was the top contributor to Fund performance for the reporting period. Moutai’s strong performance was driven by a growing demand from young Chinese consumers for the company’s iconic grain liquor products. The company’s investment in marketing campaigns has been successful in attracting a new set of affluent consumers who buy Moutai for social events, leading to record revenues for the company. Toward the end of the reporting period, we took profits and trimmed our position in Moutai as we believed valuations started to look a little stretched.
In contrast, Israel-based pharmaceutical maker Teva Pharmaceutical Industries was among the most significant detractors from Fund performance for the reporting period. Teva reported disappointing results, largely due to a tough pricing environment for generic drugs. Management reduced revenue and cash flow guidance for the company’s fiscal year, citing the Food and Drug Administration’s delayed approval on new generic drugs. We reduced the Fund’s position due to these deteriorating fundamentals.
During the reporting period, we continued to look for opportunities to improve the growth potential and quality of the Fund’s portfolio by adding companies based on our EQV outlook for each company. New additions to the portfolio included Brazil-based educational company Kroton Educacional, Philippines-based shopping mall developer SM Investments, Brazil-based personal care
sales company Raia Drogasil and China-based milk products manufacturer Inner Mongolia Yili Industrial Group. We trimmed or sold several of the Fund’s holdings with EQV characteristics that were no longer as compelling as when we first initiated positions in them, including Fuyao Glass Industry Group, Cetip, US Energy Development and Perusahaan Gas Negara.
Over the reporting period, we continued to look for opportunities to improve the growth potential and quality of the Fund’s portfolio. As disconcerting as volatility may be, we believe it tends to create long-term opportunities for our shareholders and we caution investors against making investment decisions based on short-term performance. Our balanced EQV-focused approach aligns with our goal of delivering attractive returns over the long term.
We thank you for your continued investment in Invesco Developing Markets Fund.
The views and opinions expressed in management’s discussion of Fund performance are those of Invesco Advisers, Inc. These views and opinions are subject to change at any time based on factors such as market and economic conditions. These views and opinions may not be relied upon as investment advice or recommendations, or as an offer for a particular security. The information is not a complete analysis of every aspect of any market, country, industry, security or the Fund. Statements of fact are from sources considered reliable, but Invesco Advisers, Inc. makes no representation or warranty as to their completeness or accuracy. Although historical performance is no guarantee of future results, these insights may help you understand our investment management philosophy.
See important Fund and, if applicable, index disclosures later in this report.
| | |
 | | Shuxin (Steve) Cao Chartered Financial Analyst, Portfolio Manager, is lead manager of Invesco Developing Markets Fund. He joined Invesco in 1997. |
| Mr. Cao earned a BA in English from the Tianjin Foreign Language Institute and an MBA from Texas A&M University. He is also a Certified Public Accountant. |
| | |
 | | Borge Endresen Chartered Financial Analyst, Portfolio Manager, is lead manager of Invesco Developing Markets Fund. He joined Invesco in 1999. |
| Mr. Endresen earned a BS in finance from the University of Oregon and an MBA from The University of Texas at Austin. |
| | |
 | | Brent Bates Chartered Financial Analyst, Portfolio Manager, is manager of Invesco Developing Markets Fund. He joined Invesco in 1996. |
| Mr. Bates earned a BBA from Texas A&M University and is a Certified Public Accountant. |
| | |
 | | Mark Jason Chartered Financial Analyst, Portfolio Manager, is manager of Invesco Developing Markets Fund. He joined Invesco in 2001. |
| Mr. Jason earned a BS in finance and a BS in real estate from California State University, Northridge. |
5 Invesco Developing Markets Fund
Your Fund’s Long-Term Performance
Results of a $10,000 Investment – Oldest Share Class(es)
Fund and index data from 10/31/07
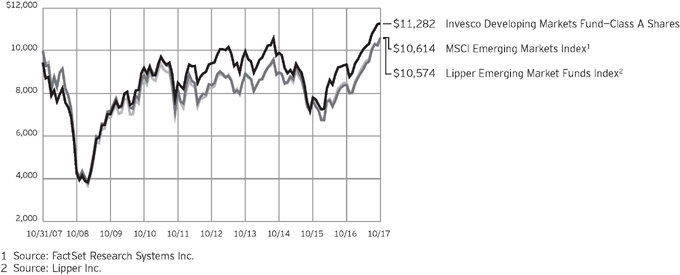
Past performance cannot guarantee comparable future results.
The data shown in the chart include reinvested distributions, applicable sales charges and Fund expenses including
management fees. Index
results include reinvested dividends, but they do not reflect sales charges. Performance of the peer group, if applicable, reflects fund expenses and management fees; performance of a market index does not. Performance
shown in the chart and table(s) does not reflect deduction of taxes a shareholder would pay on Fund distributions or sale of Fund shares.
6 Invesco Developing Markets Fund
| | | | | |
| Average Annual Total Returns |
| As of 10/31/17, including maximum applicable sales charges | |
| | | | | |
| Class A Shares | | | | | |
| Inception (1/11/94) | | | | 5.51 | % |
| 10 Years | | | | 1.21 | |
5 Years | | | | 2.52 | |
1 Year | | | | 13.93 | |
| |
| Class B Shares | | | | | |
| Inception (11/3/97) | | | | 6.68 | % |
| 10 Years | | | | 1.18 | |
5 Years | | | | 2.55 | |
1 Year | | | | 14.65 | |
| |
| Class C Shares | | | | | |
| Inception (3/1/99) | | | | 9.54 | % |
| 10 Years | | | | 1.03 | |
5 Years | | | | 2.92 | |
1 Year | | | | 18.68 | |
| |
| Class Y Shares | | | | | |
| 10 Years | | | | 2.02 | % |
5 Years | | | | 3.94 | |
1 Year | | | | 20.87 | |
| |
| Class R5 Shares | | | | | |
| Inception (10/25/05) | | | | 9.23 | % |
| 10 Years | | | | 2.21 | |
5 Years | | | | 4.08 | |
1 Year | | | | 21.01 | |
| |
| Class R6 Shares | | | | | |
| 10 Years | | | | 2.01 | % |
5 Years | | | | 4.13 | |
1 Year | | | | 21.07 | |
Class Y shares incepted on October 3, 2008. Performance shown prior to that date is that of Class A shares and includes the 12b-1 fees applicable to Class A shares.
Class R6 shares incepted on September 24, 2012. Performance shown prior to that date is that of Class A shares and includes the 12b-1 fees applicable to Class A shares.
The performance data quoted represent past performance and cannot guarantee comparable future results; current performance may be lower or higher. Please visit invesco.com/performance for the most recent month-end performance. Performance figures reflect reinvested distributions, changes in net asset value and the effect of the maximum sales charge unless otherwise stated. Investment return and principal value will fluctuate so that you may have a gain or loss when you sell shares.
| | | | | |
| Average Annual Total Returns |
| As of 9/30/17, the most recent calendar quarter end, including maximum applicable sales charges | |
| | | | | |
| Class A Shares | | | | | |
| Inception (1/11/94) | | | | 5.52 | % |
| 10 Years | | | | 2.10 | |
5 Years | | | | 2.58 | |
1 Year | | | | 14.11 | |
| |
| Class B Shares | | | | | |
| Inception (11/3/97) | | | | 6.70 | % |
| 10 Years | | | | 2.06 | |
5 Years | | | | 2.62 | |
1 Year | | | | 14.85 | |
| |
| Class C Shares | | | | | |
| Inception (3/1/99) | | | | 9.58 | % |
| 10 Years | | | | 1.91 | |
5 Years | | | | 2.98 | |
1 Year | | | | 18.88 | |
| |
| Class Y Shares | | | | | |
| 10 Years | | | | 2.90 | % |
5 Years | | | | 4.01 | |
1 Year | | | | 21.05 | |
| |
| Class R5 Shares | | | | | |
| Inception (10/25/05) | | | | 9.28 | % |
| 10 Years | | | | 3.10 | |
5 Years | | | | 4.14 | |
1 Year | | | | 21.20 | |
| |
| Class R6 Shares | | | | | |
| 10 Years | | | | 2.90 | % |
5 Years | | | | 4.19 | |
1 Year | | | | 21.26 | |
The net annual Fund operating expense ratio set forth in the most recent Fund prospectus as of the date of this report for Class A, Class B, Class C, Class Y, Class R5 and Class R6 shares was 1.42%, 2.17%, 2.17%, 1.17%, 1.05% and 1.00%, respectively.1 The total annual Fund operating expense ratio set forth in the most recent Fund prospectus as of the date of this report for Class A, Class B, Class C, Class Y, Class R5 and Class R6 shares was 1.43%, 2.18%, 2.18%, 1.18%, 1.06% and 1.01%, respectively. The expense ratios presented above may vary from the expense ratios presented in other sections of this report that are based on expenses incurred during the period covered by this report.
Class A share performance reflects the maximum 5.50% sales charge, and Class B and Class C share performance reflects the applicable contingent deferred sales charge (CDSC) for the period
involved. The CDSC on Class B shares declines from 5% beginning at the time of purchase to 0% at the beginning of the seventh year. The CDSC on Class C shares is 1% for the first year after purchase. Class Y, Class R5 and Class R6 shares do not have a front-end sales charge or a CDSC; therefore, performance is at net asset value.
The performance of the Fund’s share classes will differ primarily due to different sales charge structures and class expenses.
Fund performance reflects any applicable fee waivers and/or expense reimbursements. Had the adviser not waived fees and/or reimbursed expenses currently or in the past, returns would have been lower. See current prospectus for more information.
| 1 | Total annual Fund operating expenses after any contractual fee waivers and/or expense reimbursements by the adviser in effect through at least June 30, 2019. See current prospectus for more information. |
7 Invesco Developing Markets Fund
Invesco Developing Markets Fund’s investment objective is long-term growth of capital.
| ∎ | | Unless otherwise stated, information presented in this report is as of October 31, 2017, and is based on total net assets. |
| ∎ | | Unless otherwise noted, all data provided by Invesco. |
| ∎ | | To access your Fund’s reports/prospectus, visit invesco.com/fundreports. |
About share classes
| ∎ | | Class B shares may not be purchased for new or additional investments. Please see the prospectus for more information. |
| ∎ | | Class Y shares are available to only certain investors. Please see the prospectus for more information. |
| ∎ | | Class R5 shares and Class R6 shares are available for use by retirement plans that meet certain standards and for institutional investors. Class R6 shares are also available through intermediaries that have established an agreement with Invesco Distributors, Inc. to make such shares available for use in retail omnibus accounts. Please see the prospectus for more information. |
Principal risks of investing in the Fund
| ∎ | | Depositary receipts risk. Investing in depositary receipts involves the same risks as direct investments in foreign securities. In addition, the underlying issuers of certain depositary receipts are under no obligation to distribute shareholder communications or pass through any voting rights with respect to the deposited securities to the holders of such receipts. The Fund may therefore receive less timely information or have less control than if it invested directly in the foreign issuer. |
| ∎ | | Derivatives risk. The value of a derivative instrument depends largely on (and is derived from) the value of an underlying security, currency, commodity, interest rate, index or other asset (each referred to as an underlying asset). In addition to risks relating to the underlying assets, the use of derivatives may include other, possibly greater, risks, including counterparty, leverage and liquidity risks. |
| | Counterparty risk is the risk that the counterparty to the derivative contract will default on its obligation to pay the Fund the amount owed or otherwise perform under the derivative contract. Derivatives create leverage risk because |
| | they do not require payment up front equal to the economic exposure created by owning the derivative. As |
| | a result, an adverse change in the value of the underlying asset could result in the Fund sustaining a loss that is substantially greater than the amount invested in the derivative, which may make the Fund’s returns more volatile and increase the risk of loss. Derivative instruments may also be less liquid than more traditional investments and the Fund may be unable to sell or close out its derivative positions at a desirable time or price. This risk may be more acute under adverse market conditions, during which the Fund may be most in need of liquidating its derivative positions. Derivatives may also be harder to value, less tax efficient and subject to changing government regulation that could impact the Fund’s ability to use certain derivatives or their cost. Also, derivatives used for hedging or to gain or limit exposure to a particular market segment may not provide the expected benefits, particularly during adverse market conditions. |
| ∎ | | Emerging markets securities risk. Emerging markets (also referred to as developing markets) are generally subject to greater market volatility, political, social and economic instability, uncertain trading markets and more governmental limitations on foreign investment than more developed markets. In addition, companies operating in emerging markets may be subject to lower trading volume and greater price fluctuations than companies in more developed markets. Securities law and the enforcement of systems of taxation in many emerging market countries may change quickly and unpredictably. In addition, investments in emerging market securities may also be subject to additional transaction costs, delays in settlement procedures, and lack of timely information. |
| ∎ | | Foreign securities risk. The Fund’s foreign investments may be adversely affected by political and social instability, |
| | | changes in economic or taxation policies, difficulty in enforcing obligations, decreased liquidity or increased volatility. Foreign investments also involve the risk of the possible seizure, nationalization or expropriation of the issuer or foreign deposits (in which the Fund could lose its entire investments in a certain market) and the possible adoption of foreign governmental restrictions such as exchange controls. Unless the Fund has hedged its foreign securities risk, foreign securities risk also involves the risk of negative foreign currency rate fluctuations, which may cause the value of securities denominated in such foreign currency (or other instruments through which the Fund has exposure to foreign currencies) to decline in value. Currency exchange rates may fluctuate significantly over short periods of time. Currency hedging strategies, if used, are not always successful. |
| ∎ | | Geographic focus risk. The Fund may from time to time invest a substantial amount of its assets in securities of issuers located in a single country or a limited number of countries. Adverse economic, political or social conditions in those countries may therefore have a significant negative impact on the Fund’s investment performance. |
| ∎ | | Growth investing risk. Growth stocks tend to be more expensive relative to the issuing company’s earnings or assets compared with other types of stock. As a result, they tend to be more sensitive to changes in, or investors’ expectations of, the issuing company’s earnings and can be more volatile. |
| ∎ | | Management risk. The Fund is actively managed and depends heavily on the Adviser’s judgment about markets, interest rates or the attractiveness, relative values, liquidity, or potential appreciation of particular investments made for the Fund’s portfolio. The Fund could experience losses if these judgments prove to be incorrect. Additionally, legislative, regulatory, or tax developments may adversely affect management of the Fund and, therefore, the ability of the Fund to achieve its investment objective. |
| ∎ | | Market risk. The market values of the Fund’s investments, and therefore the value of the Fund’s shares, will go up and down, sometimes rapidly or unpre- |
|
This report must be accompanied or preceded by a currently effective Fund prospectus, which contains more complete information, including sales charges and expenses. Investors should read it carefully before investing. |
NOT FDIC INSURED | MAY LOSE VALUE | NO BANK GUARANTEE
8 Invesco Developing Markets Fund
dictably. Market risk may affect a single issuer, industry or section of the economy, or it may affect the market as a whole. Individual stock prices tend to go up and down more dramatically than those of certain other types of investments, such as bonds. During a general downturn in the financial markets, multiple asset classes may decline in value. When markets perform well, there can be no assurance that specific investments held by the Fund will rise in value.
| ∎ | | Preferred securities risk. Preferred securities are subject to issuer-specific and market risks applicable generally to equity securities. Preferred securities also may be subordinated to bonds or other debt instruments, subjecting them to a greater risk of non-payment, may be less liquid than many other securities, such as common stocks, and generally offer no voting rights with respect to the issuer. |
| ∎ | | Sector focus risk. The Fund may from time to time invest a significant amount of its assets (i.e. over 25%) in one market sector or group of related industries. In this event, the Fund’s performance will depend to a greater extent on the overall condition of the sector or group of industries and there is increased risk that the Fund will lose significant value if conditions adversely affect that sector or group of industries. |
| ∎ | | Small- and mid-capitalization companies risks. Small- and mid-capitalization companies tend to be more vulnerable to changing market conditions, may have little or no operating history or track record of success, and may have more limited product lines and markets, less experienced management and fewer financial resources than larger companies. These companies’ securities may be more volatile and less liquid than those of more established companies, and their returns may vary, sometimes significantly, from the overall securities market. |
About indexes used in this report
| ∎ | | The MSCI Emerging Markets IndexSM is an unmanaged index considered representative of stocks of developing countries. The index is computed using the net return, which withholds applicable taxes for non-resident investors. |
| ∎ | | The Lipper Emerging Market Funds Index is an unmanaged index considered representative of emerging market funds tracked by Lipper. |
| ∎ | | The Fund is not managed to track the performance of any particular index, including the index(es) described here, and consequently, the performance of the Fund may deviate significantly from the performance of the index(es). |
| ∎ | | A direct investment cannot be made in an index. Unless otherwise indicated, index results include reinvested dividends, and they do not reflect sales charges. Performance of the peer group, if applicable, reflects fund expenses; performance of a market index does not. |
Other information
| ∎ | | CPA® and Certified Public Accountant® are trademarks owned by the American Institute of Certified Public Accountants. |
| ∎ | | The returns shown in management’s discussion of Fund performance are based on net asset values (NAVs) calculated for shareholder transactions. Generally accepted accounting principles require adjustments to be made to the net assets of the Fund at period end for financial reporting purposes, and as such, the NAVs for shareholder transactions and the returns based on those NAVs may differ from the NAVs and returns reported in the Financial Highlights. |
| ∎ | | Industry classifications used in this report are generally according to the Global Industry Classification Standard, which was developed by and is the exclusive property and a service mark of MSCI Inc. and Standard & Poor’s. |
9 Invesco Developing Markets Fund
Schedule of Investments
October 31, 2017
| | | | | | | | |
| | | Shares | | | Value | |
Common Stocks & Other Equity Interests–85.43% | |
| Brazil–21.16% | |
Ambev S.A.–ADR | | | 12,317,006 | | | $ | 77,966,648 | |
Arcos Dorados Holdings, Inc.–
Class A(a)(b) | | | 9,068,694 | | | | 90,686,940 | |
B3 S.A. — Brasil, Bolsa, Balcão | | | 18,778,020 | | | | 137,880,366 | |
Banco Bradesco S.A.–ADR | | | 9,090,364 | | | | 96,085,148 | |
BR Malls Participacoes S.A. | | | 14,496,417 | | | | 56,367,323 | |
Cielo S.A. | | | 8,965,096 | | | | 61,223,442 | |
Duratex S.A. | | | 8,965,842 | | | | 26,311,278 | |
Fleury S.A. | | | 8,772,400 | | | | 77,016,271 | |
Kroton Educacional S.A. | | | 9,792,389 | | | | 54,300,717 | |
Raia Drogasil S.A. | | | 1,039,300 | | | | 25,009,536 | |
TOTVS S.A. | | | 1,387,900 | | | | 13,788,631 | |
Wilson Sons Ltd.–BDR | | | 962,600 | | | | 12,358,756 | |
| | | | | | | | 728,995,056 | |
|
| China–12.41% | |
Baidu, Inc.–ADR(b) | | | 98,098 | | | | 23,930,026 | |
China Mobile Ltd. | | | 6,938,000 | | | | 69,678,814 | |
Industrial & Commercial Bank of China Ltd.–Class H | | | 58,050,000 | | | | 46,059,618 | |
Inner Mongolia Yili Industrial Group Co., Ltd.–Class A | | | 21,385,039 | | | | 95,241,583 | |
Kweichow Moutai Co., Ltd.–Class A | | | 614,261 | | | | 57,216,537 | |
Lee & Man Paper Manufacturing Ltd. | | | 42,212,000 | | | | 51,511,042 | |
NetEase, Inc.–ADR | | | 160,737 | | | | 45,314,975 | |
Stella International Holdings Ltd. | | | 11,189,000 | | | | 18,173,662 | |
Want Want China Holdings Ltd. | | | 24,950,000 | | | | 20,404,158 | |
| | | | | | | | 427,530,415 | |
|
| Egypt–0.42% | |
Egyptian Financial Group-Hermes Holding Co. | | | 10,922,002 | | | | 14,521,651 | |
|
| France–0.92% | |
Bollore S.A. | | | 6,569,497 | | | | 31,759,149 | |
|
| Hong Kong–4.62% | |
Galaxy Entertainment Group Ltd. | | | 7,632,000 | | | | 51,946,984 | |
WH Group Ltd.–REGS(c) | | | 105,929,500 | | | | 107,268,317 | |
| | | | | | | | 159,215,301 | |
|
| Hungary–2.24% | |
Richter Gedeon Nyrt | | | 3,104,462 | | | | 77,254,321 | |
|
| Indonesia–5.82% | |
PT Bank Central Asia Tbk | | | 46,011,600 | | | | 71,072,417 | |
PT Bank Mandiri Persero Tbk | | | 121,820,700 | | | | 63,424,809 | |
PT Telekomunikasi Indonesia Persero Tbk | | | 221,321,600 | | | | 66,096,961 | |
| | | | | | | | 200,594,187 | |
|
| Israel–0.47% | |
Israel Chemicals Ltd. | | | 3,907,788 | | | | 16,291,698 | |
| | | | | | | | |
| | | Shares | | | Value | |
| Malaysia–1.89% | |
Public Bank Bhd. | | | 13,492,400 | | | $ | 65,211,810 | |
|
| Mexico–4.19% | |
Bolsa Mexicana de Valores, S.A.B. de C.V. | | | 20,598,400 | | | | 34,371,137 | |
Fomento Economico Mexicano, S.A.B. de C.V.–ADR | | | 894,371 | | | | 78,481,055 | |
Grupo Televisa S.A.B.–ADR | | | 241,465 | | | | 5,285,669 | |
Kimberly-Clark de Mexico, S.A.B. de C.V.–Class A | | | 15,332,703 | | | | 26,376,402 | |
| | | | | | | | 144,514,263 | |
|
| Nigeria–1.04% | |
Zenith Bank PLC | | | 504,865,834 | | | | 35,709,612 | |
|
| Peru–1.33% | |
Credicorp Ltd. | | | 218,960 | | | | 45,858,982 | |
|
| Philippines–1.52% | |
SM Investments Corp. | | | 964,330 | | | | 17,890,778 | |
SM Prime Holdings Inc. | | | 47,832,400 | | | | 34,369,355 | |
| | | | | | | | 52,260,133 | |
|
| Russia–9.71% | |
Gazprom PAO–ADR | | | 4,731,713 | | | | 20,320,342 | |
Gazprom PAO–ADR | | | 3,300,000 | | | | 14,241,810 | |
Mobile TeleSystems PJSC–ADR | | | 2,786,494 | | | | 29,564,701 | |
Sberbank of Russia PJSC | | | 25,812,144 | | | | 85,547,563 | |
Sberbank of Russia PJSC–Preference Shares | | | 35,854,175 | | | | 97,197,155 | |
Yandex N.V.–Class A(b) | | | 2,592,126 | | | | 87,691,623 | |
| | | | | | | | 334,563,194 | |
|
| South Korea–5.49% | |
NAVER Corp. | | | 121,105 | | | | 97,005,437 | |
Samsung Electronics Co., Ltd. | | | 37,427 | | | | 92,133,862 | |
| | | | | | | | 189,139,299 | |
|
| Taiwan–2.56% | |
Taiwan Semiconductor Manufacturing Co. Ltd. | | | 10,911,000 | | | | 88,119,849 | |
|
| Thailand–3.37% | |
Kasikornbank PCL | | | 16,868,700 | | | | 115,977,430 | |
|
| Turkey–5.43% | |
Anadolu Efes Biracilik ve Malt Sanayii A.S. | | | 3,181,985 | | | | 18,417,604 | |
EIS Eczacibasi Ilaç, Sinai ve Finansal Yatirimlar Sanayi ve Ticaret A.S. | | | 12,948,995 | | | | 15,734,019 | |
Haci Omer Sabanci Holding A.S. | | | 36,448,535 | | | | 101,256,605 | |
Tupras-Turkiye Petrol Rafinerileri A.S. | | | 1,435,357 | | | | 51,641,073 | |
| | | | | | | | 187,049,301 | |
See accompanying Notes to Financial Statements which are an integral part of the financial statements.
10 Invesco Developing Markets Fund
| | | | | | | | |
| | | Shares | | | Value | |
| United Arab Emirates–0.84% | |
Emaar Properties PJSC | | | 12,750,000 | | | $ | 28,854,460 | |
Total Common Stocks & Other Equity Interests
(Cost $2,275,005,393) | | | | 2,943,420,111 | |
|
Money Market Funds–15.08% | |
Invesco Government & Agency Portfolio–Institutional Class, 0.95%(d) | | | 311,611,429 | | | | 311,611,429 | |
Invesco Treasury Portfolio–Institutional Class, 0.94%(d) | | | 207,740,953 | | | | 207,740,953 | |
Total Money Market Funds
(Cost $519,352,382) | | | | 519,352,382 | |
TOTAL INVESTMENTS IN SECURITIES–100.51% (Cost $2,794,357,775) | | | | 3,462,772,493 | |
OTHER ASSETS LESS LIABILITIES–(0.51)% | | | | (17,452,799 | ) |
NET ASSETS–100.00% | | | $ | 3,445,319,694 | |
Investment Abbreviations:
| | |
| ADR | | – American Depositary Receipt |
| BDR | | – Brazilian Depositary Receipt |
| REGS | | – Regulation S |
Notes to Schedule of Investments:
| (a) | Affiliated company during the period. The Investment Company Act of 1940 defines an “affiliated person” as an issuance in which a fund holds 5% or more of the outstanding voting securities. The Fund has not owned enough of the outstanding voting securities of the issuer to have control (as defined in the Investment Company Act of 1940) of that issuer. The value of this security as of October 31, 2017 represented 2.63% of the Fund’s Net Assets. See Note 4. |
| (b) | Non-income producing security. |
| (c) | Security purchased or received in transaction exempt from registration under the Securities Act of 1933, as amended (the “1933 Act”). The security may be resold pursuant to an exemption from registration under the 1933 Act, typically to qualified institutional buyers. The value of this security at October 31, 2017 represented 3.11% of the Fund’s Net Assets. |
| (d) | The money market fund and the Fund are affiliated by having the same investment adviser. The rate shown is the 7-day SEC standardized yield as of October 31, 2017. |
See accompanying Notes to Financial Statements which are an integral part of the financial statements.
11 Invesco Developing Markets Fund
Statement of Assets and Liabilities
October 31, 2017
| | | | |
Assets: | | | | |
Investments in securities, at value (Cost $2,183,196,610) | | $ | 2,852,733,171 | |
Investments in affiliates, at value (Cost $611,161,165) | | | 610,039,322 | |
Foreign currencies, at value (Cost $1,321,421) | | | 1,171,072 | |
Receivable for: | | | | |
Investments sold | | | 624,821 | |
Fund shares sold | | | 4,679,547 | |
Dividends | | | 1,605,526 | |
Investment for trustee deferred compensation and retirement plans | | | 363,491 | |
Other assets | | | 84,275 | |
Total assets | | | 3,471,301,225 | |
| |
Liabilities: | | | | |
Payable for: | | | | |
Investments purchased | | | 9,861,132 | |
Fund shares reacquired | | | 4,131,566 | |
Accrued foreign taxes | | | 9,827,132 | |
Accrued fees to affiliates | | | 1,117,526 | |
Accrued trustees’ and officers’ fees and benefits | | | 5,138 | |
Accrued other operating expenses | | | 629,299 | |
Trustee deferred compensation and retirement plans | | | 409,738 | |
Total liabilities | | | 25,981,531 | |
Net assets applicable to shares outstanding | | $ | 3,445,319,694 | |
| |
Net assets consist of: | | | | |
Shares of beneficial interest | | $ | 2,852,010,074 | |
Undistributed net investment income | | | 29,482,876 | |
Undistributed net realized gain (loss) | | | (104,426,530 | ) |
Net unrealized appreciation | | | 668,253,274 | |
| | | $ | 3,445,319,694 | |
| | | | |
Net Assets: | | | | |
Class A | | $ | 878,910,065 | |
Class B | | $ | 5,098,320 | |
Class C | | $ | 88,231,235 | |
Class Y | | $ | 1,575,400,979 | |
Class R5 | | $ | 470,436,189 | |
Class R6 | | $ | 427,242,906 | |
|
Shares outstanding, no par value,
with an unlimited number of shares authorized: | |
Class A | | | 23,976,134 | |
Class B | | | 143,067 | |
Class C | | | 2,479,004 | |
Class Y | | | 42,884,980 | |
Class R5 | | | 12,826,942 | |
Class R6 | | | 11,651,543 | |
Class A: | | | | |
Net asset value per share | | $ | 36.66 | |
Maximum offering price per share | | | | |
(Net asset value of $36.66 ¸ 94.50%) | | $ | 38.79 | |
Class B: | | | | |
Net asset value and offering price per share | | $ | 35.64 | |
Class C: | | | | |
Net asset value and offering price per share | | $ | 35.59 | |
Class Y: | | | | |
Net asset value and offering price per share | | $ | 36.74 | |
Class R5: | | | | |
Net asset value and offering price per share | | $ | 36.68 | |
Class R6: | | | | |
Net asset value and offering price per share | | $ | 36.67 | |
See accompanying Notes to Financial Statements which are an integral part of the financial statements.
12 Invesco Developing Markets Fund
Statement of Operations
For the year ended October 31, 2017
| | | | |
Investment income: | | | | |
Dividends (net of foreign withholding taxes of $7,001,963) | | $ | 64,430,991 | |
Dividends from affiliates | | | 2,825,631 | |
Total investment income | | | 67,256,622 | |
| |
Expenses: | | | | |
Advisory fees | | | 25,743,189 | |
Administrative services fees | | | 559,250 | |
Custodian fees | | | 2,448,637 | |
Distribution fees: | | | | |
Class A | | | 2,045,413 | |
Class B | | | 69,929 | |
Class C | | | 835,866 | |
Transfer agent fees — A, B, C and Y | | | 3,851,186 | |
Transfer agent fees — R5 | | | 188,796 | |
Transfer agent fees — R6 | | | 13,357 | |
Trustees’ and officers’ fees and benefits | | | 62,550 | |
Registration and filing fees | | | 203,872 | |
Reports to shareholders | | | 781,849 | |
Professional services fees | | | 104,806 | |
Other | | | 52,003 | |
Total expenses | | | 36,960,703 | |
Less: Fees waived and expense offset arrangement(s) | | | (486,605 | ) |
Net expenses | | | 36,474,098 | |
Net investment income | | | 30,782,524 | |
| |
Realized and unrealized gain (loss) from: | | | | |
Net realized gain (loss) from: | | | | |
Investment securities | | | 119,991,436 | |
Foreign currencies | | | (351,182 | ) |
| | | | 119,640,254 | |
Change in net unrealized appreciation of: | | | | |
Investment securities (net of foreign taxes of $4,559,075) | | | 435,201,431 | |
Foreign currencies | | | 165,126 | |
| | | | 435,366,557 | |
Net realized and unrealized gain | | | 555,006,811 | |
Net increase in net assets resulting from operations | | $ | 585,789,335 | |
See accompanying Notes to Financial Statements which are an integral part of the financial statements.
13 Invesco Developing Markets Fund
Statement of Changes in Net Assets
October 31, 2017
| | | | | | | | |
| | | 2017 | | | 2016 | |
Operations: | | | | | | | | |
Net investment income | | $ | 30,782,524 | | | $ | 25,718,096 | |
Net realized gain (loss) | | | 119,640,254 | | | | (139,361,570 | ) |
Change in net unrealized appreciation | | | 435,366,557 | | | | 487,614,471 | |
Net increase in net assets resulting from operations | | | 585,789,335 | | | | 373,970,997 | |
| | |
Distributions to shareholders from net investment income: | | | | | | | | |
Class A | | | (6,465,840 | ) | | | (7,250,678 | ) |
Class B | | | (9,114 | ) | | | — | |
Class C | | | (88,315 | ) | | | — | |
Class Y | | | (11,463,530 | ) | | | (12,161,332 | ) |
Class R5 | | | (3,838,802 | ) | | | (4,959,683 | ) |
Class R6 | | | (2,041,422 | ) | | | (2,633,867 | ) |
Total distributions from net investment income | | | (23,907,023 | ) | | | (27,005,560 | ) |
| | |
Share transactions–net: | | | | | | | | |
Class A | | | (91,568,138 | ) | | | (99,784,850 | ) |
Class B | | | (4,910,609 | ) | | | (5,494,664 | ) |
Class C | | | (9,310,384 | ) | | | (12,607,620 | ) |
Class Y | | | 244,683,793 | | | | (99,163,924 | ) |
Class R5 | | | 64,225,172 | | | | (69,725,261 | ) |
Class R6 | | | 217,227,291 | | | | (37,179,196 | ) |
Net increase (decrease) in net assets resulting from share transactions | | | 420,347,125 | | | | (323,955,515 | ) |
Net increase in net assets | | | 982,229,437 | | | | 23,009,922 | |
| | |
Net assets: | | | | | | | | |
Beginning of year | | | 2,463,090,257 | | | | 2,440,080,335 | |
End of year (includes undistributed net investment income of $29,482,876 and $22,958,558, respectively) | | $ | 3,445,319,694 | | | $ | 2,463,090,257 | |
Notes to Financial Statements
October 31, 2017
NOTE 1—Significant Accounting Policies
Invesco Developing Markets Fund (the “Fund”) is a series portfolio of AIM Investment Funds (Invesco Investment Funds) (the “Trust”). The Trust is organized as a Delaware statutory trust and is registered under the Investment Company Act of 1940, as amended (the “1940 Act”), as an open-end series management investment company consisting of twenty separate series portfolios, each authorized to issue an unlimited number of shares of beneficial interest. The assets, liabilities and operations of each portfolio are accounted for separately. Information presented in these financial statements pertains only to the Fund. Matters affecting each portfolio or class will be voted on exclusively by the shareholders of such portfolio or class.
The Fund’s investment objective is long-term growth of capital.
As of the open of business on June 8, 2017, the Fund has closed public sales of its shares to new investors.
The Fund currently consists of six different classes of shares: Class A, Class B, Class C, Class Y, Class R5 and Class R6. Class Y shares are available only to certain investors. Class A shares are sold with a front-end sales charge unless certain waiver criteria are met and under certain circumstances load waived shares may be subject to contingent deferred sales charges (“CDSC”). Class C shares are sold with a CDSC. Class Y, Class R5 and Class R6 shares are sold at net asset value. Effective November 30, 2010, new or additional investments in Class B shares are no longer permitted. Existing shareholders of Class B shares may continue to reinvest dividends and capital gains distributions in Class B shares until they convert to Class A shares. Also, shareholders in Class B shares will be able to exchange those shares for Class B shares of other Invesco Funds offering such shares until they convert to Class A shares. Generally, Class B shares will automatically convert to Class A shares on or about the month-end, which is at least eight years after the date of purchase. Redemption of Class B shares prior to the conversion date will be subject to a CDSC.
The Fund is an investment company and accordingly follows the investment company accounting and reporting guidance in accordance with Financial Accounting Standards Board Accounting Standards Codification Topic 946, Financial Services — Investment Companies.
The following is a summary of the significant accounting policies followed by the Fund in the preparation of its financial statements.
| A. | Security Valuations — Securities, including restricted securities, are valued according to the following policy. |
A security listed or traded on an exchange (except convertible securities) is valued at its last sales price or official closing price as of the close of the customary trading session on the exchange where the security is principally traded, or lacking any sales or official closing price on a
14 Invesco Developing Markets Fund
particular day, the security may be valued at the closing bid price on that day. Securities traded in the over-the-counter market are valued based on prices furnished by independent pricing services or market makers. When such securities are valued by an independent pricing service they may be considered fair valued. Futures contracts are valued at the final settlement price set by an exchange on which they are principally traded. Listed options are valued at the mean between the last bid and asked prices from the exchange on which they are principally traded. Options not listed on an exchange are valued by an independent source at the mean between the last bid and asked prices. For purposes of determining net asset value (“NAV”) per share, futures and option contracts generally are valued 15 minutes after the close of the customary trading session of the New York Stock Exchange (“NYSE”).
Investments in open-end and closed-end registered investment companies that do not trade on an exchange are valued at the end-of-day net asset value per share. Investments in open-end and closed-end registered investment companies that trade on an exchange are valued at the last sales price or official closing price as of the close of the customary trading session on the exchange where the security is principally traded.
Debt obligations (including convertible securities) and unlisted equities are fair valued using an evaluated quote provided by an independent pricing service. Evaluated quotes provided by the pricing service may be determined without exclusive reliance on quoted prices, and may reflect appropriate factors such as institution-size trading in similar groups of securities, developments related to specific securities, dividend rate (for unlisted equities), yield (for debt obligations), quality, type of issue, coupon rate (for debt obligations), maturity (for debt obligations), individual trading characteristics and other market data. Pricing services generally value debt obligations assuming orderly transactions of institutional round lot size, but a fund may hold or transact in the same securities in smaller, odd lot sizes. Odd lots often trade at lower prices than institutional round lots. Debt obligations are subject to interest rate and credit risks. In addition, all debt obligations involve some risk of default with respect to interest and/or principal payments.
Foreign securities’ (including foreign exchange contracts) prices are converted into U.S. dollar amounts using the applicable exchange rates as of the close of the NYSE. If market quotations are available and reliable for foreign exchange-traded equity securities, the securities will be valued at the market quotations. Because trading hours for certain foreign securities end before the close of the NYSE, closing market quotations may become unreliable. If between the time trading ends on a particular security and the close of the customary trading session on the NYSE, events occur that the investment adviser determines are significant and make the closing price unreliable, the Fund may fair value the security. If the event is likely to have affected the closing price of the security, the security will be valued at fair value in good faith using procedures approved by the Board of Trustees. Adjustments to closing prices to reflect fair value may also be based on a screening process of an independent pricing service to indicate the degree of certainty, based on historical data, that the closing price in the principal market where a foreign security trades is not the current value as of the close of the NYSE. Foreign securities’ prices meeting the approved degree of certainty that the price is not reflective of current value will be priced at the indication of fair value from the independent pricing service. Multiple factors may be considered by the independent pricing service in determining adjustments to reflect fair value and may include information relating to sector indices, American Depositary Receipts and domestic and foreign index futures. Foreign securities may have additional risks including exchange rate changes, potential for sharply devalued currencies and high inflation, political and economic upheaval, the relative lack of issuer information, relatively low market liquidity and the potential lack of strict financial and accounting controls and standards.
Securities for which market prices are not provided by any of the above methods may be valued based upon quotes furnished by independent sources. The last bid price may be used to value equity securities. The mean between the last bid and asked prices is used to value debt obligations, including corporate loans.
Securities for which market quotations are not readily available or became unreliable are valued at fair value as determined in good faith by or under the supervision of the Trust’s officers following procedures approved by the Board of Trustees. Issuer specific events, market trends, bid/asked quotes of brokers and information providers and other market data may be reviewed in the course of making a good faith determination of a security’s fair value.
The Fund may invest in securities that are subject to interest rate risk, meaning the risk that the prices will generally fall as interest rates rise and, conversely, the prices will generally rise as interest rates fall. Specific securities differ in their sensitivity to changes in interest rates depending on their individual characteristics. Changes in interest rates may result in increased market volatility, which may affect the value and/or liquidity of certain Fund investments.
Valuations change in response to many factors including the historical and prospective earnings of the issuer, the value of the issuer’s assets, general economic conditions, interest rates, investor perceptions and market liquidity. Because of the inherent uncertainties of valuation, the values reflected in the financial statements may materially differ from the value received upon actual sale of those investments.
| B. | Securities Transactions and Investment Income — Securities transactions are accounted for on a trade date basis. Realized gains or losses on sales are computed on the basis of specific identification of the securities sold. Interest income (net of withholding tax, if any) is recorded on the accrual basis from settlement date. Dividend income (net of withholding tax, if any) is recorded on the ex-dividend date. |
The Fund may periodically participate in litigation related to Fund investments. As such, the Fund may receive proceeds from litigation settlements. Any proceeds received are included in the Statement of Operations as realized gain (loss) for investments no longer held and as unrealized gain (loss) for investments still held.
Brokerage commissions and mark ups are considered transaction costs and are recorded as an increase to the cost basis of securities purchased and/or a reduction of proceeds on a sale of securities. Such transaction costs are included in the determination of net realized and unrealized gain (loss) from investment securities reported in the Statement of Operations and the Statement of Changes in Net Assets and the net realized and unrealized gains (losses) on securities per share in the Financial Highlights. Transaction costs are included in the calculation of the Fund’s net asset value and, accordingly, they reduce the Fund’s total returns. These transaction costs are not considered operating expenses and are not reflected in net investment income reported in the Statement of Operations and the Statement of Changes in Net Assets, or the net investment income per share and the ratios of expenses and net investment income reported in the Financial Highlights, nor are they limited by any expense limitation arrangements between the Fund and the investment adviser.
The Fund allocates income and realized and unrealized capital gains and losses to a class based on the relative net assets of each class.
| C. | Country Determination — For the purposes of making investment selection decisions and presentation in the Schedule of Investments, the investment adviser may determine the country in which an issuer is located and/or credit risk exposure based on various factors. These factors include the laws of the country under which the issuer is organized, where the issuer maintains a principal office, the country in which the issuer |
15 Invesco Developing Markets Fund
| | derives 50% or more of its total revenues and the country that has the primary market for the issuer’s securities, as well as other criteria. Among the other criteria that may be evaluated for making this determination are the country in which the issuer maintains 50% or more of its assets, the type of security, financial guarantees and enhancements, the nature of the collateral and the sponsor organization. Country of issuer and/or credit risk exposure has been determined to be the United States of America, unless otherwise noted. |
| D. | Distributions — Distributions from net investment income and net realized capital gain, if any, are generally declared and paid annually and recorded on the ex-dividend date. The Fund may elect to treat a portion of the proceeds from redemptions as distributions for federal income tax purposes. |
| E. | Federal Income Taxes — The Fund intends to comply with the requirements of Subchapter M of the Internal Revenue Code of 1986, as amended (the “Internal Revenue Code”), necessary to qualify as a regulated investment company and to distribute substantially all of the Fund’s taxable earnings to shareholders. As such, the Fund will not be subject to federal income taxes on otherwise taxable income (including net realized capital gain) that is distributed to shareholders. Therefore, no provision for federal income taxes is recorded in the financial statements. |
The Fund recognizes the tax benefits of uncertain tax positions only when the position is more likely than not to be sustained. Management has analyzed the Fund’s uncertain tax positions and concluded that no liability for unrecognized tax benefits should be recorded related to uncertain tax positions. Management is not aware of any tax positions for which it is reasonably possible that the total amounts of unrecognized tax benefits will change materially in the next 12 months.
The Fund files tax returns in the U.S. Federal jurisdiction and certain other jurisdictions. Generally, the Fund is subject to examinations by such taxing authorities for up to three years after the filing of the return for the tax period.
| F. | Expenses — Fees provided for under the Rule 12b-1 plan of a particular class of the Fund are charged to the operations of such class. Transfer agency fees and expenses and other shareholder recordkeeping fees and expenses attributable to Class R5 and Class R6 are allocated to each share class based on relative net assets. Sub-accounting fees attributable to Class R5 are charged to the operations of the class. Transfer agency fees and expenses and other shareholder recordkeeping fees and expenses relating to all other classes are allocated among those classes based on relative net assets. All other expenses are allocated among the classes based on relative net assets. |
| G. | Accounting Estimates — The preparation of financial statements in conformity with accounting principles generally accepted in the United States of America (“GAAP”) requires management to make estimates and assumptions that affect the reported amounts of assets and liabilities at the date of the financial statements and the reported amounts of revenues and expenses during the reporting period including estimates and assumptions related to taxation. Actual results could differ from those estimates by a significant amount. In addition, the Fund monitors for material events or transactions that may occur or become known after the period-end date and before the date the financial statements are released to print. |
| H. | Indemnifications — Under the Trust’s organizational documents, each Trustee, officer, employee or other agent of the Trust is indemnified against certain liabilities that may arise out of the performance of their duties to the Fund. Additionally, in the normal course of business, the Fund enters into contracts, including the Fund’s servicing agreements, that contain a variety of indemnification clauses. The Fund’s maximum exposure under these arrangements is unknown as this would involve future claims that may be made against the Fund that have not yet occurred. The risk of material loss as a result of such indemnification claims is considered remote. |
| I. | Foreign Currency Translations — Foreign currency is valued at the close of the NYSE based on quotations posted by banks and major currency dealers. Portfolio securities and other assets and liabilities denominated in foreign currencies are translated into U.S. dollar amounts at date of valuation. Purchases and sales of portfolio securities (net of foreign taxes withheld on disposition) and income items denominated in foreign currencies are translated into U.S. dollar amounts on the respective dates of such transactions. The Fund does not separately account for the portion of the results of operations resulting from changes in foreign exchange rates on investments and the fluctuations arising from changes in market prices of securities held. The combined results of changes in foreign exchange rates and the fluctuation of market prices on investments (net of estimated foreign tax withholding) are included with the net realized and unrealized gain or loss from investments in the Statement of Operations. Reported net realized foreign currency gains or losses arise from (1) sales of foreign currencies, (2) currency gains or losses realized between the trade and settlement dates on securities transactions, and (3) the difference between the amounts of dividends, interest, and foreign withholding taxes recorded on the Fund’s books and the U.S. dollar equivalent of the amounts actually received or paid. Net unrealized foreign currency gains and losses arise from changes in the fair values of assets and liabilities, other than investments in securities at fiscal period end, resulting from changes in exchange rates. |
The Fund may invest in foreign securities, which may be subject to foreign taxes on income, gains on investments or currency repatriation, a portion of which may be recoverable. Foreign taxes, if any, are recorded based on the tax regulations and rates that exist in the foreign markets in which the Fund invests and are shown in the Statement of Operations.
| J. | Forward Foreign Currency Contracts — The Fund may engage in foreign currency transactions either on a spot (i.e. for prompt delivery and settlement) basis, or through forward foreign currency contracts, to manage or minimize currency or exchange rate risk. |
The Fund may also enter into forward foreign currency contracts for the purchase or sale of a security denominated in a foreign currency in order to “lock in” the U.S. dollar price of that security, or the Fund may also enter into forward foreign currency contracts that do not provide for physical settlement of the two currencies, but instead are settled by a single cash payment calculated as the difference between the agreed upon exchange rate and the spot rate at settlement based upon an agreed upon notional amount (non-deliverable forwards). The Fund will set aside liquid assets in an amount equal to the daily mark-to-market obligation for forward foreign currency contracts.
A forward foreign currency contract is an obligation between two parties (“Counterparties”) to purchase or sell a specific currency for an agreed-upon price at a future date. The use of forward foreign currency contracts does not eliminate fluctuations in the price of the underlying securities the Fund owns or intends to acquire but establishes a rate of exchange in advance. Fluctuations in the value of these contracts are measured by the difference in the contract date and reporting date exchange rates and are recorded as unrealized appreciation (depreciation) until the contracts are closed. When the contracts are closed, realized gains (losses) are recorded. Realized and unrealized gains (losses) on the contracts are included in the Statement of Operations. The primary risks associated with forward foreign currency contracts include failure of the Counterparty to meet the terms of the contract and the value of the foreign currency changing unfavorably. These risks may be in excess of the amounts reflected in the Statement of Assets and Liabilities.
16 Invesco Developing Markets Fund
NOTE 2—Advisory Fees and Other Fees Paid to Affiliates
The Trust has entered into a master investment advisory agreement with Invesco Advisers, Inc. (the “Adviser” or “Invesco”). Under the terms of the investment advisory agreement, the Fund accrues daily and pays monthly an advisory fee to the Adviser based on the annual rate of the Fund’s average daily net assets as follows:
| | | | | | | | |
| Average Daily Net Assets | | Rate | |
First $250 million | | | 0 | .935% | | | | |
Next $250 million | | | 0 | .91% | | | | |
Next $500 million | | | 0 | .885% | | | | |
Next $1.5 billion | | | 0 | .86% | | | | |
Next $2.5 billion | | | 0 | .835% | | | | |
Next $2.5 billion | | | 0 | .81% | | | | |
Next $2.5 billion | | | 0 | .785% | | | | |
Over $10 billion | | | 0 | .76% | | | | |
For the year ended October 31, 2017, the effective advisory fees incurred by the Fund was 0.87%.
Under the terms of a master sub-advisory agreement between the Adviser and each of Invesco Asset Management Deutschland GmbH, Invesco Asset Management Limited, Invesco Asset Management (Japan) Limited, Invesco Hong Kong Limited, Invesco Senior Secured Management, Inc. and Invesco Canada Ltd. and separate sub-advisory agreements with Invesco PowerShares Capital Management LLC and Invesco Asset Management (India) Private Limited (collectively, the “Affiliated Sub-Advisers”) the Adviser, not the Fund, will pay 40% of the fees paid to the Adviser to any such Affiliated Sub-Adviser(s) that provide(s) discretionary investment management services to the Fund based on the percentage of assets allocated to such Affiliated Sub-Adviser(s).
The Adviser has contractually agreed, through at least June 30, 2018, to waive advisory fees and/or reimburse expenses to the extent necessary to limit total annual fund operating expenses after fee waivers and/or reimbursements (excluding certain items discussed below) of Class A, Class B, Class C, Class Y, Class R5 and Class R6 shares to 2.25%, 3.00%, 3.00%, 2.00%, 2.00% and 2.00%, respectively, of the Fund’s average daily net assets (the “expense limits”). In determining the Adviser’s obligation to waive advisory fees and/or reimburse expenses, the following expenses are not taken into account, and could cause the total annual fund operating expenses after fee waiver and/or expense reimbursement to exceed the numbers reflected above: (1) interest; (2) taxes; (3) dividend expense on short sales; (4) extraordinary or non-routine items, including litigation expenses; and (5) expenses that the Fund has incurred but did not actually pay because of an expense offset arrangement. Unless Invesco continues the fee waiver agreement, it will terminate on June 30, 2018. During its term, the fee waiver agreement cannot be terminated or amended to increase the expense limits without approval of the Board of Trustees. The Adviser did not waive fees and/or reimburse expenses during the period under these expense limits.
Further, the Adviser has contractually agreed, through at least June 30, 2019, to waive the advisory fee payable by the Fund in an amount equal to 100% of the net advisory fees the Adviser receives from the affiliated money market funds on investments by the Fund of uninvested cash in such affiliated money market funds.
For the year ended October 31, 2017, the Adviser waived advisory fees of $471,767.
The Trust has entered into a master administrative services agreement with Invesco pursuant to which the Fund has agreed to pay Invesco for certain administrative costs incurred in providing accounting services to the Fund. For the year ended October 31, 2017, expenses incurred under the agreement are shown in the Statement of Operations as Administrative services fees.
The Trust has entered into a transfer agency and service agreement with Invesco Investment Services, Inc. (“IIS”) pursuant to which the Fund has agreed to pay IIS a fee for providing transfer agency and shareholder services to the Fund and reimburse IIS for certain expenses incurred by IIS in the course of providing such services. IIS may make payments to intermediaries that provide omnibus account services, sub-accounting services and/or networking services. All fees payable by IIS to intermediaries that provide omnibus account services or sub-accounting services are charged back to the Fund, subject to certain limitations approved by the Trust’s Board of Trustees. For the year ended October 31, 2017, expenses incurred under the agreement are shown in the Statement of Operations as Transfer agent fees.
The Trust has entered into master distribution agreements with Invesco Distributors, Inc. (“IDI”) to serve as the distributor for the Class A, Class B, Class C, Class Y, Class R5 and Class R6 shares of the Fund. The Trust has adopted plans pursuant to Rule 12b-1 under the 1940 Act with respect to the Fund’s Class A, Class B and Class C shares (collectively, the “Plans”). The Fund, pursuant to the Plans, pays IDI compensation at the annual rate of 0.25% of the Fund’s average daily net assets of Class A shares and 1.00% of the average daily net assets of Class B and Class C shares. Of the Plan payments, up to 0.25% of the average daily net assets of each class of shares may be paid to furnish continuing personal shareholder services to customers who purchase and own shares of such classes. Any amounts not paid as a service fee under the Plans would constitute an asset-based sales charge. Rules of the Financial Industry Regulatory Authority (“FINRA”) impose a cap on the total sales charges, including asset-based sales charges, that may be paid by any class of shares of the Fund. For the year ended October 31, 2017, expenses incurred under the Plans are shown in the Statement of Operations as Distribution fees.
Front-end sales commissions and CDSC (collectively, the “sales charges”) are not recorded as expenses of the Fund. Front-end sales commissions are deducted from proceeds from the sales of Fund shares prior to investment in Class A shares of the Fund. CDSC are deducted from redemption proceeds prior to remittance to the shareholder. During the year ended October 31, 2017, IDI advised the Fund that IDI retained $101,321 in front-end sales commissions from the sale of Class A shares and $47,086, $30 and $8,736 from Class A, Class B and Class C shares, respectively, for CDSC imposed on redemptions by shareholders.
Certain officers and trustees of the Trust are officers and directors of the Adviser, IIS and/or IDI.
17 Invesco Developing Markets Fund
NOTE 3—Additional Valuation Information
GAAP defines fair value as the price that would be received to sell an asset or paid to transfer a liability in an orderly transaction between market participants at the measurement date, under current market conditions. GAAP establishes a hierarchy that prioritizes the inputs to valuation methods, giving the highest priority to readily available unadjusted quoted prices in an active market for identical assets (Level 1) and the lowest priority to significant unobservable inputs (Level 3), generally when market prices are not readily available or are unreliable. Based on the valuation inputs, the securities or other investments are tiered into one of three levels. Changes in valuation methods may result in transfers in or out of an investment’s assigned level:
| | Level 1 — | Prices are determined using quoted prices in an active market for identical assets. |
| | Level 2 — | Prices are determined using other significant observable inputs. Observable inputs are inputs that other market participants may use in pricing a security. These may include quoted prices for similar securities, interest rates, prepayment speeds, credit risk, yield curves, loss severities, default rates, discount rates, volatilities and others. |
| | Level 3 — | Prices are determined using significant unobservable inputs. In situations where quoted prices or observable inputs are unavailable (for example, when there is little or no market activity for an investment at the end of the period), unobservable inputs may be used. Unobservable inputs reflect the Fund’s own assumptions about the factors market participants would use in determining fair value of the securities or instruments and would be based on the best available information. |
The following is a summary of the tiered valuation input levels, as of October 31, 2017. The level assigned to the securities valuations may not be an indication of the risk or liquidity associated with investing in those securities. Because of the inherent uncertainties of valuation, the values reflected in the financial statements may materially differ from the value received upon actual sale of those investments.
The Fund’s policy is to recognize transfers in and out of the valuation levels as of the end of the reporting period. During the year ended October 31, 2017, there were transfers from Level 1 to Level 2 of $302,880,113 and from Level 2 to Level 1 of $286,552,699 due to foreign fair value adjustments.
| | | | | | | | | | | | | | | | |
| | | Level 1 | | | Level 2 | | | Level 3 | | | Total | |
Brazil | | $ | 728,995,056 | | | $ | — | | | $ | — | | | $ | 728,995,056 | |
China | | | 409,356,753 | | | | 18,173,662 | | | | — | | | | 427,530,415 | |
Egypt | | | 14,521,651 | | | | — | | | | — | | | | 14,521,651 | |
France | | | 31,759,149 | | | | — | | | | — | | | | 31,759,149 | |
Hong Kong | | | 159,215,301 | | | | — | | | | — | | | | 159,215,301 | |
Hungary | | | 77,254,321 | | | | — | | | | — | | | | 77,254,321 | |
Indonesia | | | — | | | | 200,594,187 | | | | — | | | | 200,594,187 | |
Israel | | | 16,291,698 | | | | — | | | | — | | | | 16,291,698 | |
Malaysia | | | — | | | | 65,211,810 | | | | — | | | | 65,211,810 | |
Mexico | | | 144,514,263 | | | | — | | | | — | | | | 144,514,263 | |
Nigeria | | | 35,709,612 | | | | — | | | | — | | | | 35,709,612 | |
Peru | | | 45,858,982 | | | | — | | | | — | | | | 45,858,982 | |
Philippines | | | — | | | | 52,260,133 | | | | — | | | | 52,260,133 | |
Russia | | | 137,576,666 | | | | 196,986,528 | | | | — | | | | 334,563,194 | |
South Korea | | | — | | | | 189,139,299 | | | | — | | | | 189,139,299 | |
Taiwan | | | — | | | | 88,119,849 | | | | — | | | | 88,119,849 | |
Thailand | | | — | | | | 115,977,430 | | | | — | | | | 115,977,430 | |
Turkey | | | 187,049,301 | | | | — | | | | — | | | | 187,049,301 | |
United Arab Emirates | | | — | | | | 28,854,460 | | | | — | | | | 28,854,460 | |
Money Market Funds | | | 519,352,382 | | | | — | | | | — | | | | 519,352,382 | |
Total Investments | | $ | 2,507,455,135 | | | $ | 955,317,358 | | | $ | — | | | $ | 3,462,772,493 | |
NOTE 4—Investments in Other Affiliates
The 1940 Act defines an “affiliated person” as an issuance in which a fund holds 5% or more of the outstanding voting securities. The Fund has not owned enough of the outstanding voting securities of the issuer to have control (as defined in the 1940 Act) of that issuer. The following is a summary of the investments in other affiliates (excluding affiliated money market funds) for the year ended October 31, 2017.
| | | | | | | | | | | | | | | | | | | | | | | | | | | | |
| | | Value
10/31/16 | | | Purchases
at Cost | | | Proceeds
from Sales | | | Change in
Unrealized
Appreciation | | | Realized
Gain (Loss) | | | Value
10/31/17 | | | Dividend
Income | |
Arcos Dorados Holdings, Inc. — Class A | | $ | 34,984,330 | | | $ | 25,998,210 | | | $ | — | | | $ | 29,704,400 | | | $ | — | | | $ | 90,686,940 | | | $ | — | |
NOTE 5—Expense Offset Arrangement(s)
The expense offset arrangement is comprised of transfer agency credits which result from balances in demand deposit accounts used by the transfer agent for clearing shareholder transactions. For the year ended October 31, 2017, the Fund received credits from this arrangement, which resulted in the reduction of the Fund’s total expenses of $14,838.
18 Invesco Developing Markets Fund
NOTE 6—Trustees’ and Officers’ Fees and Benefits
Trustees’ and Officers’ Fees and Benefits include amounts accrued by the Fund to pay remuneration to certain Trustees and Officers of the Fund. Trustees have the option to defer compensation payable by the Fund, and Trustees’ and Officers’ Fees and Benefits also include amounts accrued by the Fund to fund such deferred compensation amounts. Those Trustees who defer compensation have the option to select various Invesco Funds in which their deferral accounts shall be deemed to be invested. Finally, certain current Trustees were eligible to participate in a retirement plan that provided for benefits to be paid upon retirement to Trustees over a period of time based on the number of years of service. The Fund may have certain former Trustees who also participate in a retirement plan and receive benefits under such plan. Trustees’ and Officers’ Fees and Benefits include amounts accrued by the Fund to fund such retirement benefits. Obligations under the deferred compensation and retirement plans represent unsecured claims against the general assets of the Fund.
NOTE 7—Cash Balances
The Fund is permitted to temporarily carry a negative or overdrawn balance in its account with State Street Bank and Trust Company, the custodian bank. Such balances, if any at period-end, are shown in the Statement of Assets and Liabilities under the payable caption Amount due custodian. To compensate the custodian bank for such overdrafts, the overdrawn Fund may either (1) leave funds as a compensating balance in the account so the custodian bank can be compensated by earning the additional interest; or (2) compensate by paying the custodian bank at a rate agreed upon by the custodian bank and Invesco, not to exceed the contractually agreed upon rate.
NOTE 8—Distributions to Shareholders and Tax Components of Net Assets
Tax Character of Distributions to Shareholders Paid During the Fiscal Years Ended October 31, 2017 and 2016:
| | | | | | | | |
| | | 2017 | | | 2016 | |
Ordinary income | | $ | 23,907,023 | | | $ | 27,005,560 | |
Tax Components of Net Assets at Period-End:
| | | | |
| | | 2017 | |
Undistributed ordinary income | | $ | 32,055,189 | |
Net unrealized appreciation — investments | | | 665,249,850 | |
Net unrealized appreciation (depreciation) — foreign currencies | | | (161,444 | ) |
Temporary book/tax differences | | | (380,994 | ) |
Capital loss carryforward | | | (103,452,981 | ) |
Shares of beneficial interest | | | 2,852,010,074 | |
Total net assets | | $ | 3,445,319,694 | |
The difference between book-basis and tax-basis unrealized appreciation (depreciation) is due to differences in the timing of recognition of gains and losses on investments for tax and book purposes. The Fund’s net unrealized appreciation difference is attributable primarily to passive foreign investment companies and wash sales.
The temporary book/tax differences are a result of timing differences between book and tax recognition of income and/or expenses. The Fund’s temporary book/tax differences are the result of the trustee deferral of compensation and retirement plan benefits.
Capital loss carryforward is calculated and reported as of a specific date. Results of transactions and other activity after that date may affect the amount of capital loss carryforward actually available for the Fund to utilize. Capital losses generated in years beginning after December 22, 2010 can be carried forward for an unlimited period, whereas previous losses expire in eight tax years. Capital losses with an expiration period may not be used to offset capital gains until all net capital losses without an expiration date have been utilized. Capital loss carryforwards with no expiration date will retain their character as either short-term or long-term capital losses instead of as short-term capital losses as under prior law. The ability to utilize capital loss carryforwards in the future may be limited under the Internal Revenue Code and related regulations based on the results of future transactions.
The Fund has a capital loss carryforward as of October 31, 2017 as follows:
| | | | | | | | | | | | |
| Capital Loss Carryforward* | |
| Expiration | | Short-Term | | | Long-Term | | | Total | |
Not subject to expiration | | $ | 7,328,822 | | | $ | 96,124,159 | | | $ | 103,452,981 | |
| * | Capital loss carryforward as of the date listed above is reduced for limitations, if any, to the extent required by the Internal Revenue Code and may be further limited depending upon a variety of factors, including the realization of net unrealized gains or losses as of the date of any reorganization. |
19 Invesco Developing Markets Fund
NOTE 9—Investment Transactions
The aggregate amount of investment securities (other than short-term securities, U.S. Treasury obligations and money market funds, if any) purchased and sold by the Fund during the year ended October 31, 2017 was $752,735,128 and $395,217,438 respectively. Cost of investments, including any derivatives, on a tax basis includes the adjustments for financial reporting purposes as of the most recently completed federal income tax reporting period-end.
| | | | |
| Unrealized Appreciation (Depreciation) of Investments on a Tax Basis | |
Aggregate unrealized appreciation of investments | | $ | 827,051,173 | |
Aggregate unrealized (depreciation) of investments | | | (161,801,323 | ) |
Net unrealized appreciation of investments | | $ | 665,249,850 | |
Cost of investments for tax purposes is $2,797,522,643.
NOTE 10—Reclassification of Permanent Differences
Primarily as a result of differing book/tax treatment of expired capital loss carryforward and foreign currency transactions, on October 31, 2017, undistributed net investment income was decreased by $351,183, undistributed net realized gain (loss) was increased by $47,690,009 and shares of beneficial interest was decreased by $47,338,826. This reclassification had no effect on the net assets of the Fund.
NOTE 11—Share Information
| | | | | | | | | | | | | | | | |
| | | Summary of Share Activity | |
| | | Years ended October 31, | |
| | | 2017(a) | | | 2016 | |
| | | Shares | | | Amount | | | Shares | | | Amount | |
Sold: | | | | | | | | | | | | | | | | |
Class A | | | 5,580,960 | | | $ | 179,300,415 | | | | 6,223,706 | | | $ | 172,445,345 | |
Class B | | | 3,460 | | | | 107,898 | | | | 3,413 | | | | 93,276 | |
Class C | | | 421,647 | | | | 13,192,183 | | | | 434,158 | | | | 12,231,991 | |
Class Y | | | 23,586,261 | | | | 742,795,060 | | | | 16,687,212 | | | | 462,805,113 | |
Class R5 | | | 5,214,837 | | | | 169,419,983 | | | | 2,612,537 | | | | 71,219,411 | |
Class R6 | | | 7,776,259 | | | | 262,410,342 | | | | 4,221,542 | | | | 115,075,056 | |
| | | | |
Issued as reinvestment of dividends: | | | | | | | | | | | | | | | | |
Class A | | | 204,009 | | | | 5,975,421 | | | | 263,221 | | | | 6,388,370 | |
Class B | | | 270 | | | | 7,751 | | | | — | | | | — | |
Class C | | | 2,815 | | | | 80,594 | | | | — | | | | — | |
Class Y | | | 224,203 | | | | 6,566,919 | | | | 256,399 | | | | 6,222,812 | |
Class R5 | | | 124,103 | | | | 3,625,047 | | | | 176,828 | | | | 4,281,012 | |
Class R6 | | | 69,519 | | | | 2,029,942 | | | | 108,882 | | | | 2,633,867 | |
| | | | |
Automatic conversion of Class B shares to Class A shares: | | | | | | | | | | | | | | | | |
Class A | | | 111,089 | | | | 3,668,845 | | | | 121,188 | | | | 3,279,616 | |
Class B | | | (113,940 | ) | | | (3,668,845 | ) | | | (124,281 | ) | | | (3,279,616 | ) |
| | | | |
Reacquired: | | | | | | | | | | | | | | | | |
Class A | | | (8,807,768 | ) | | | (280,512,819 | ) | | | (10,482,846 | ) | | | (281,898,181 | ) |
Class B | | | (43,418 | ) | | | (1,357,413 | ) | | | (89,538 | ) | | | (2,308,324 | ) |
Class C | | | (715,863 | ) | | | (22,583,161 | ) | | | (955,039 | ) | | | (24,839,611 | ) |
Class Y | | | (15,253,958 | ) | | | (504,678,186 | ) | | | (21,827,088 | ) | | | (568,191,849 | ) |
Class R5 | | | (3,301,481 | ) | | | (108,819,858 | ) | | | (5,620,816 | ) | | | (145,225,684 | ) |
Class R6 | | | (1,435,306 | ) | | | (47,212,993 | ) | | | (6,069,981 | ) | | | (154,888,119 | ) |
Net increase (decrease) in share activity | | | 13,647,698 | | | $ | 420,347,125 | | | | (14,060,503 | ) | | $ | (323,955,515 | ) |
| (a) | There are entities that are record owners of more than 5% of the outstanding shares of the Fund and in the aggregate own 53% of the outstanding shares of the Fund. IDI has an agreement with these entities to sell Fund shares. The Fund, Invesco and/or Invesco affiliates may make payments to these entities, which are considered to be related to the Fund, for providing services to the Fund, Invesco and/or Invesco affiliates including but not limited to services such as securities brokerage, distribution, third party record keeping and account servicing. The Fund has no knowledge as to whether all or any portion of the shares owned of record by these entities are also owned beneficially. |
20 Invesco Developing Markets Fund
NOTE 12—Financial Highlights
The following schedule presents financial highlights for a share of the Fund outstanding throughout the periods indicated.
| | | | | | | | | | | | | | | | | | | | | | | | | | | | | | | | | | | | | | | | | | | | | | | | | | | | | | | | |
| | | Net asset value, beginning of period | | | Net investment income(a) | | | Net gains (losses) on securities (both realized and unrealized) | | | Total from investment
operations | | | Dividends from net investment
income | | | Distributions from net realized
gains | | | Total distributions | | | Net asset value, end of period | | | Total
return(b) | | | Net assets,
end of period (000’s omitted) | | | Ratio of expenses
to average net assets with fee waivers
and/or expenses
absorbed | | | Ratio of expenses to average net
assets without
fee waivers and/or expenses absorbed | | | Ratio of net
investment income to average
net assets | | | Portfolio turnover(c) | |
Class A | | | | | | | | | | | | | | | | | | | | | | | | | | | | | | | | | | | | | | | | | | | | | | | | | | | | | | | | |
Year ended 10/31/17 | | $ | 30.67 | | | $ | 0.28 | | | $ | 5.96 | | | $ | 6.24 | | | $ | (0.25 | ) | | $ | — | | | $ | (0.25 | ) | | $ | 36.66 | | | | 20.55 | % | | $ | 878,910 | | | | 1.41 | %(d) | | | 1.43 | %(d) | | | 0.86 | %(d) | | | 16 | % |
Year ended 10/31/16 | | | 25.84 | | | | 0.27 | | | | 4.80 | | | | 5.07 | | | | (0.24 | ) | | | — | | | | (0.24 | ) | | | 30.67 | | | | 19.88 | | | | 824,702 | | | | 1.40 | | | | 1.41 | | | | 1.01 | | | | 3 | |
Year ended 10/31/15 | | | 33.77 | | | | 0.28 | | | | (7.32 | ) | | | (7.04 | ) | | | (0.33 | ) | | | (0.56 | ) | | | (0.89 | ) | | | 25.84 | | | | (21.20 | ) | | | 795,042 | | | | 1.43 | | | | 1.44 | | | | 0.96 | | | | 9 | |
Year ended 10/31/14 | | | 34.42 | | | | 0.38 | | | | (0.65 | ) | | | (0.27 | ) | | | (0.28 | ) | | | (0.10 | ) | | | (0.38 | ) | | | 33.77 | | | | (0.73 | ) | | | 1,251,018 | | | | 1.39 | | | | 1.41 | | | | 1.13 | | | | 13 | |
Year ended 10/31/13 | | | 32.70 | | | | 0.30 | | | | 1.66 | | | | 1.96 | | | | (0.24 | ) | | | — | | | | (0.24 | ) | | | 34.42 | | | | 6.03 | | | | 1,494,412 | | | | 1.38 | | | | 1.40 | | | | 0.89 | | | | 14 | |
Class B | | | | | | | | | | | | | | | | | | | | | | | | | | | | | | | | | | | | | | | | | | | | | | | | | | | | | | | | |
Year ended 10/31/17 | | | 29.82 | | | | 0.03 | | | | 5.82 | | | | 5.85 | | | | (0.03 | ) | | | — | | | | (0.03 | ) | | | 35.64 | | | | 19.65 | | | | 5,098 | | | | 2.16 | (d) | | | 2.18 | (d) | | | 0.11 | (d) | | | 16 | |
Year ended 10/31/16 | | | 25.06 | | | | 0.07 | | | | 4.69 | | | | 4.76 | | | | — | | | | — | | | | — | | | | 29.82 | | | | 18.99 | | | | 8,848 | | | | 2.15 | | | | 2.16 | | | | 0.26 | | | | 3 | |
Year ended 10/31/15 | | | 32.72 | | | | 0.06 | | | | (7.11 | ) | | | (7.05 | ) | | | (0.05 | ) | | | (0.56 | ) | | | (0.61 | ) | | | 25.06 | | | | (21.80 | ) | | | 12,710 | | | | 2.18 | | | | 2.19 | | | | 0.21 | | | | 9 | |
Year ended 10/31/14 | | | 33.31 | | | | 0.12 | | | | (0.61 | ) | | | (0.49 | ) | | | (0.00 | ) | | | (0.10 | ) | | | (0.10 | ) | | | 32.72 | | | | (1.46 | ) | | | 28,314 | | | | 2.14 | | | | 2.16 | | | | 0.38 | | | | 13 | |
Year ended 10/31/13 | | | 31.66 | | | | 0.04 | | | | 1.61 | | | | 1.65 | | | | — | | | | — | | | | — | | | | 33.31 | | | | 5.21 | | | | 44,403 | | | | 2.13 | | | | 2.15 | | | | 0.14 | | | | 14 | |
Class C | | | | | | | | | | | | | | | | | | | | | | | | | | | | | | | | | | | | | | | | | | | | | | | | | | | | | | | | |
Year ended 10/31/17 | | | 29.78 | | | | 0.03 | | | | 5.81 | | | | 5.84 | | | | (0.03 | ) | | | — | | | | (0.03 | ) | | | 35.59 | | | | 19.65 | | | | 88,231 | | | | 2.16 | (d) | | | 2.18 | (d) | | | 0.11 | (d) | | | 16 | |
Year ended 10/31/16 | | | 25.03 | | | | 0.07 | | | | 4.68 | | | | 4.75 | | | | — | | | | — | | | | — | | | | 29.78 | | | | 18.98 | | | | 82,513 | | | | 2.15 | | | | 2.16 | | | | 0.26 | | | | 3 | |
Year ended 10/31/15 | | | 32.68 | | | | 0.06 | | | | (7.10 | ) | | | (7.04 | ) | | | (0.05 | ) | | | (0.56 | ) | | | (0.61 | ) | | | 25.03 | | | | (21.80 | ) | | | 82,395 | | | | 2.18 | | | | 2.19 | | | | 0.21 | | | | 9 | |
Year ended 10/31/14 | | | 33.27 | | | | 0.12 | | | | (0.61 | ) | | | (0.49 | ) | | | (0.00 | ) | | | (0.10 | ) | | | (0.10 | ) | | | 32.68 | | | | (1.47 | ) | | | 137,867 | | | | 2.14 | | | | 2.16 | | | | 0.38 | | | | 13 | |
Year ended 10/31/13 | | | 31.62 | | | | 0.04 | | | | 1.61 | | | | 1.65 | | | | — | | | | — | | | | — | | | | 33.27 | | | | 5.22 | | | | 168,313 | | | | 2.13 | | | | 2.15 | | | | 0.14 | | | | 14 | |
Class Y | | | | | | | | | | | | | | | | | | | | | | | | | | | | | | | | | | | | | | | | | | | | | | | | | | | | | | | | |
Year ended 10/31/17 | | | 30.74 | | | | 0.37 | | | | 5.95 | | | | 6.32 | | | | (0.32 | ) | | | — | | | | (0.32 | ) | | | 36.74 | | | | 20.84 | | | | 1,575,401 | | | | 1.16 | (d) | | | 1.18 | (d) | | | 1.11 | (d) | | | 16 | |
Year ended 10/31/16 | | | 25.92 | | | | 0.35 | | | | 4.79 | | | | 5.14 | | | | (0.32 | ) | | | — | | | | (0.32 | ) | | | 30.74 | | | | 20.18 | | | | 1,055,132 | | | | 1.15 | | | | 1.16 | | | | 1.26 | | | | 3 | |
Year ended 10/31/15 | | | 33.90 | | | | 0.36 | | | | (7.35 | ) | | | (6.99 | ) | | | (0.43 | ) | | | (0.56 | ) | | | (0.99 | ) | | | 25.92 | | | | (21.00 | ) | | | 1,016,382 | | | | 1.18 | | | | 1.19 | | | | 1.21 | | | | 9 | |
Year ended 10/31/14 | | | 34.55 | | | | 0.46 | | | | (0.64 | ) | | | (0.18 | ) | | | (0.37 | ) | | | (0.10 | ) | | | (0.47 | ) | | | 33.90 | | | | (0.47 | ) | | | 1,463,586 | | | | 1.14 | | | | 1.16 | | | | 1.38 | | | | 13 | |
Year ended 10/31/13 | | | 32.83 | | | | 0.38 | | | | 1.66 | | | | 2.04 | | | | (0.32 | ) | | | — | | | | (0.32 | ) | | | 34.55 | | | | 6.27 | | | | 1,175,003 | | | | 1.13 | | | | 1.15 | | | | 1.14 | | | | 14 | |
Class R5 | | | | | | | | | | | | | | | | | | | | | | | | | | | | | | | | | | | | | | | | | | | | | | | | | | | | | | | | |
Year ended 10/31/17 | | | 30.69 | | | | 0.41 | | | | 5.94 | | | | 6.35 | | | | (0.36 | ) | | | — | | | | (0.36 | ) | | | 36.68 | | | | 20.97 | | | | 470,436 | | | | 1.04 | (d) | | | 1.06 | (d) | | | 1.23 | (d) | | | 16 | |
Year ended 10/31/16 | | | 25.90 | | | | 0.38 | | | | 4.79 | | | | 5.17 | | | | (0.38 | ) | | | — | | | | (0.38 | ) | | | 30.69 | | | | 20.33 | | | | 331,079 | | | | 1.03 | | | | 1.04 | | | | 1.38 | | | | 3 | |
Year ended 10/31/15 | | | 33.87 | | | | 0.40 | | | | (7.33 | ) | | | (6.93 | ) | | | (0.48 | ) | | | (0.56 | ) | | | (1.04 | ) | | | 25.90 | | | | (20.87 | ) | | | 352,779 | | | | 1.03 | | | | 1.04 | | | | 1.36 | | | | 9 | |
Year ended 10/31/14 | | | 34.52 | | | | 0.51 | | | | (0.66 | ) | | | (0.15 | ) | | | (0.40 | ) | | | (0.10 | ) | | | (0.50 | ) | | | 33.87 | | | | (0.35 | ) | | | 686,180 | | | | 0.99 | | | | 1.01 | | | | 1.53 | | | | 13 | |
Year ended 10/31/13 | | | 32.80 | | | | 0.42 | | | | 1.67 | | | | 2.09 | | | | (0.37 | ) | | | — | | | | (0.37 | ) | | | 34.52 | | | | 6.43 | | | | 666,769 | | | | 1.01 | | | | 1.03 | | | | 1.26 | | | | 14 | |
Class R6 | | | | | | | | | | | | | | | | | | | | | | | | | | | | | | | | | | | | | | | | | | | | | | | | | | | | | | | | |
Year ended 10/31/17 | | | 30.68 | | | | 0.42 | | | | 5.94 | | | | 6.36 | | | | (0.37 | ) | | | — | | | | (0.37 | ) | | | 36.67 | | | | 21.04 | | | | 427,243 | | | | 1.00 | (d) | | | 1.02 | (d) | | | 1.27 | (d) | | | 16 | |
Year ended 10/31/16 | | | 25.90 | | | | 0.39 | | | | 4.78 | | | | 5.17 | | | | (0.39 | ) | | | — | | | | (0.39 | ) | | | 30.68 | | | | 20.35 | | | | 160,816 | | | | 0.98 | | | | 0.99 | | | | 1.43 | | | | 3 | |
Year ended 10/31/15 | | | 33.87 | | | | 0.41 | | | | (7.33 | ) | | | (6.92 | ) | | | (0.49 | ) | | | (0.56 | ) | | | (1.05 | ) | | | 25.90 | | | | (20.84 | ) | | | 180,773 | | | | 1.00 | | | | 1.01 | | | | 1.39 | | | | 9 | |
Year ended 10/31/14 | | | 34.52 | | | | 0.52 | | | | (0.65 | ) | | | (0.13 | ) | | | (0.42 | ) | | | (0.10 | ) | | | (0.52 | ) | | | 33.87 | | | | (0.31 | ) | | | 179,467 | | | | 0.97 | | | | 0.99 | | | | 1.55 | | | | 13 | |
Year ended 10/31/13 | | | 32.81 | | | | 0.44 | | | | 1.66 | | | | 2.10 | | | | (0.39 | ) | | | — | | | | (0.39 | ) | | | 34.52 | | | | 6.46 | | | | 154,375 | | | | 0.97 | | | | 0.99 | | | | 1.30 | | | | 14 | |
| (a) | Calculated using average shares outstanding. |
| (b) | Includes adjustments in accordance with accounting principles generally accepted in the United States of America and as such, the net asset value for financial reporting purposes and the returns based upon those net asset values may differ from the net asset value and returns for shareholder transactions. Does not include sales charges and is not annualized for periods less than one year, if applicable. |
| (c) | Portfolio turnover is calculated at the fund level and is not annualized for periods less than one year, if applicable. |
| (d) | Ratios are based on average daily net assets (000’s omitted) of $818,165, $6,993, $83,587, $1,404,398, $396,958 and $245,670 for Class A, Class B, Class C, Class Y, Class R5 and Class R6 shares, respectively. |
Note 13—Subsequent Event
On December 1, 2017, the Fund’s Board of Trustees approved the early conversion of the remaining assets in the Fund’s Class B shares into Class A shares to occur on or about January 26, 2018. At the close of business on or about January 26, 2018, (the “Conversion Date”) all outstanding Class B shares of the Fund will be converted to Class A shares of the Fund, which is prior to the date the Class B shares would normally be converted to Class A shares. Once the conversion is completed, Class B shares will be closed and become inactive. No contingent deferred sales charges will be payable in connection with this early conversion. The conversion of the Fund’s Class B shares into Class A shares on the Conversion Date is not expected to be a taxable event for federal income tax purposes, and should not result in the recognition of gain or loss by converting shareholders, although each shareholder should consult with his or her own tax adviser.
21 Invesco Developing Markets Fund
Report of Independent Registered Public Accounting Firm
To the Board of Trustees of AIM Investment Funds (Invesco Investment Funds)
and Shareholders of Invesco Developing Markets Fund:
In our opinion, the accompanying statement of assets and liabilities, including the schedule of investments, and the related statements of operations and of changes in net assets and the financial highlights present fairly, in all material respects, the financial position of Invesco Developing Markets Fund (one of the portfolios constituting the AIM Investment Funds (Invesco Investment Funds), hereafter referred to as the “Fund”) as of October 31, 2017, the results of its operations for the year then ended, the changes in its net assets for each of the two years in the period then ended and the financial highlights for each of the five years in the period then ended, in conformity with accounting principles generally accepted in the United States of America. These financial statements and financial highlights (hereafter referred to as “financial statements”) are the responsibility of the Fund’s management. Our responsibility is to express an opinion on these financial statements based on our audits. We conducted our audits of these financial statements in accordance with the standards of the Public Company Accounting Oversight Board (United States). Those standards require that we plan and perform the audit to obtain reasonable assurance about whether the financial statements are free of material misstatement. An audit includes examining, on a test basis, evidence supporting the amounts and disclosures in the financial statements, assessing the accounting principles used and significant estimates made by management, and evaluating the overall financial statement presentation. We believe that our audits, which included confirmation of securities as of October 31, 2017 by correspondence with the custodian, transfer agent and brokers, and when replies were not received from brokers, we performed other auditing procedures, provide a reasonable basis for our opinion.
PricewaterhouseCoopers LLP
Houston, Texas
December 21, 2017
22 Invesco Developing Markets Fund
Calculating your ongoing Fund expenses
Example
As a shareholder of the Fund, you incur two types of costs: (1) transaction costs, which may include sales charges (loads) on purchase payments or contingent deferred sales charges on redemptions, if any; and (2) ongoing costs, including management fees, distribution and/or service (12b-1) fees, and other Fund expenses. This example is intended to help you understand your ongoing costs (in dollars) of investing in the Fund and to compare these costs with ongoing costs of investing in other mutual funds. The example is based on an investment of $1,000 invested at the beginning of the period and held for the entire period May 1, 2017 through October 31, 2017.
Actual expenses
The table below provides information about actual account values and actual expenses. You may use the information in this table, together with the amount you invested, to estimate the expenses that you paid over the period. Simply divide your account value by $1,000 (for example, an $8,600 account value divided by $1,000 = 8.6), then multiply the result by the number in the table under the heading entitled ��Actual Expenses Paid During Period” to estimate the expenses you paid on your account during this period.
Hypothetical example for comparison purposes
The table below also provides information about hypothetical account values and hypothetical expenses based on the Fund’s actual expense ratio and an assumed rate of return of 5% per year before expenses, which is not the Fund’s actual return.
The hypothetical account values and expenses may not be used to estimate the actual ending account balance or expenses you paid for the period. You may use this information to compare the ongoing costs of investing in the Fund and other funds. To do so, compare this 5% hypothetical example with the 5% hypothetical examples that appear in the shareholder reports of the other funds.
Please note that the expenses shown in the table are meant to highlight your ongoing costs only and do not reflect any transaction costs, such as sales charges (loads) on purchase payments or contingent deferred sales charges on redemptions, if any. Therefore, the hypothetical information is useful in comparing ongoing costs only, and will not help you determine the relative total costs of owning different funds. In addition, if these transaction costs were included, your costs would have been higher.
| | | | | | | | | | | | | | | | | | | | | | | | |
| Class | | Beginning Account Value (05/01/17) | | | ACTUAL | | | HYPOTHETICAL
(5% annual return before
expenses) | | | Annualized Expense Ratio | |
| | | Ending Account Value (10/31/17)1 | | | Expenses Paid During Period2 | | | Ending Account Value (10/31/17) | | | Expenses Paid During Period2 | | |
| A | | $ | 1,000.00 | | | $ | 1,119.40 | | | $ | 7.48 | | | $ | 1,018.15 | | | $ | 7.12 | | | | 1.40 | % |
| B | | | 1,000.00 | | | | 1,114.80 | | | | 11.46 | | | | 1,014.37 | | | | 10.92 | | | | 2.15 | |
| C | | | 1,000.00 | | | | 1,115.00 | | | | 11.46 | | | | 1,014.37 | | | | 10.92 | | | | 2.15 | |
| Y | | | 1,000.00 | | | | 1,120.50 | | | | 6.15 | | | | 1,019.41 | | | | 5.85 | | | | 1.15 | |
| R5 | | | 1,000.00 | | | | 1,121.00 | | | | 5.56 | | | | 1,019.96 | | | | 5.30 | | | | 1.04 | |
| R6 | | | 1,000.00 | | | | 1,121.40 | | | | 5.35 | | | | 1,020.16 | | | | 5.09 | | | | 1.00 | |
| 1 | The actual ending account value is based on the actual total return of the Fund for the period May 1, 2017 through October 31, 2017, after actual expenses and will differ from the hypothetical ending account value which is based on the Fund’s expense ratio and a hypothetical annual return of 5% before expenses. |
| 2 | Expenses are equal to the Fund’s annualized expense ratio as indicated above multiplied by the average account value over the period, multiplied by 184/365 to reflect the most recent fiscal half year. |
23 Invesco Developing Markets Fund
Approval of Investment Advisory and Sub-Advisory Contracts
The Board of Trustees (the Board) of AIM Investment Funds (Invesco Investment Funds) is required under the Investment Company Act of 1940, as amended, to approve annually the renewal of Invesco Developing Markets Fund’s (the Fund) investment advisory agreements. During contract renewal meetings held on June 12-13, 2017, the Board as a whole, and the disinterested or “independent” Trustees, who comprise over 75% of the Board, voting separately, approved the continuance for the Fund of the Master Investment Advisory Agreement with Invesco Advisers, Inc. (Invesco Advisers and the investment advisory agreement) and the Master Intergroup Sub-Advisory Contract for Mutual Funds with Invesco Asset Management Deutschland GmbH, Invesco Asset Management Limited, Invesco Asset Management (Japan) Limited, Invesco Hong Kong Limited, Invesco Senior Secured Management, Inc. and Invesco Canada Ltd. and separate Sub-Advisory Contracts with Invesco PowerShares Capital Management LLC and Invesco Asset Management (India) Private Limited (collectively, the Affiliated Sub-Advisers and the sub-advisory contracts) for another year, effective July 1, 2017.
In evaluating the fairness and reasonableness of compensation under the Fund’s investment advisory agreement and sub-advisory contracts, the Board considered, among other things, the factors discussed below. The Board determined that continuation of the Fund’s investment advisory agreement and the sub-advisory contracts is in the best interest of the Fund and its shareholders and that the compensation payable to Invesco Advisers and the Affiliated Sub-Advisers under the agreements is fair and reasonable.
The Board’s Fund Evaluation Process
The Board’s Investments Committee has established three Sub-Committees, which meet throughout the year to review the performance of funds advised by Invesco Advisers (the Invesco Funds). Over the course of each year, the Sub-Committees meet with portfolio managers for their assigned Invesco Funds and other members of management to review the performance, investment objective(s), policies, strategies, limitations and investment risks of these funds. The Board had the benefit of reports from the Sub-Committees and Investments Committee throughout the year in considering approval of the continuance of each Invesco Fund’s investment advisory agreement and sub-advisory contracts for another year.
During the contract renewal process, the Board receives comparative performance and fee data regarding the Invesco Funds prepared by Invesco Advisers and Broadridge Financial Solutions, Inc. (Broadridge), an independent provider of investment company data. The Board also receives an independent written
evaluation from the Senior Officer, an officer of the Invesco Funds who reports directly to the independent Trustees. The Senior Officer’s evaluation is prepared as part of his responsibility to manage the process by which the Invesco Funds’ proposed management fees are negotiated during the annual contract renewal process to ensure they are negotiated in a manner that is at arms’ length and reasonable. In addition to meetings with Invesco Advisers and fund counsel, the independent Trustees also discuss the continuance of the investment advisory agreement and sub-advisory contracts in separate sessions with the Senior Officer and with independent legal counsel.
The Trustees recognized that the advisory fee rates for the Invesco Funds are, in most cases, the result of years of review and negotiation. The Trustees’ deliberations and conclusions in a particular year may be based in part on their deliberations and conclusions regarding these arrangements throughout the year and in prior years. The Trustees’ review and conclusions are based on the comprehensive consideration of all information presented to them and are not the result of any single determinative factor. Moreover, one Trustee may have weighed a particular piece of information or factor differently than another Trustee.
The discussion below is a summary of the Senior Officer’s independent written evaluation with respect to the Fund’s investment advisory agreement as well as a discussion of the material factors and related conclusions that formed the basis for the Board’s approval of the Fund’s investment advisory agreement and sub-advisory contracts. This information is current as of June 13, 2017, and does not reflect consideration of factors that became known to the Board after that date.
Factors and Conclusions and Summary of Independent Written Fee Evaluation
| A. | Nature, Extent and Quality of Services Provided by Invesco Advisers and the Affiliated Sub-Advisers |
The Board reviewed the advisory services provided to the Fund by Invesco Advisers under the Fund’s investment advisory agreement, the performance of Invesco Advisers in providing these services, and the credentials and experience of the officers and employees of Invesco Advisers who provide these services, including the Fund’s portfolio manager or managers. The Board’s review included consideration of Invesco Advisers’ investment process oversight, credit analysis and investment risk management. The Board also considered non-advisory services that Invesco Advisers and its affiliates provide to the Invesco Funds such as various back office support functions, trading operations, internal audit, valuation and legal and compliance.
In determining whether to continue the Fund’s investment advisory agreement, the Board considered the benefits of reapproving an existing relationship as contrasted with the greater uncertainty that may be associated with entering into a new relationship. The Board concluded that the nature, extent and quality of the services provided to the Fund by Invesco Advisers are appropriate and satisfactory.
The Board reviewed the services that may be provided by the Affiliated Sub-Advisers under the sub-advisory contracts and the credentials and experience of the officers and employees of the Affiliated Sub-Advisers who provide these services. The Board noted that the Affiliated Sub-Advisers have offices and personnel that are located in financial centers around the world. As a result, the Board noted that the Affiliated Sub-Advisers can provide research and investment analysis on the markets and economies of various countries in which the Fund may invest, make recommendations regarding securities and assist with security trades. The Board concluded that the sub-advisory contracts may benefit the Fund and its shareholders by permitting Invesco Advisers to use the resources and talents of the Affiliated Sub-Advisers in managing the Fund. The Board concluded that the nature, extent and quality of the services that may be provided by the Affiliated Sub-Advisers are appropriate and satisfactory.
| B. | Fund Investment Performance |
The Board considered Fund investment performance as a relevant factor in considering whether to approve the investment advisory agreement. The Board did not view Fund performance as a relevant factor in considering whether to approve the sub-advisory contracts for the Fund, as no Affiliated Sub-Adviser currently manages assets of the Fund.
The Board compared the Fund’s investment performance over multiple time periods ending December 31, 2016 to the performance of funds in the Broadridge performance universe and against the Lipper Emerging Market Funds Index. The Board noted that performance of Class A shares of the Fund was in the first quintile of its performance universe for the one year period, the second quintile for the three year period and the third quintile for the five year period (the first quintile being the best performing funds and the fifth quintile being the worst performing funds). The Board noted that performance of Class A shares of the Fund was above the performance of the Index for the one and three year periods and below the performance of the Index for the five year period. The Trustees also reviewed more recent Fund performance and this review did not change their conclusions.
| C. | Advisory and Sub-Advisory Fees |
The Board compared the Fund’s contractual management fee rate to the contractual
24 Invesco Developing Markets Fund
management fee rates of funds in the Fund’s Broadridge expense group at a common asset level. The Board noted that the contractual management fee rate for Class A shares of the Fund was below the median contractual management fee rate of funds in its expense group. The Board noted that the term “contractual management fee” for funds in the expense group may include both advisory and certain administrative services fees, but that Broadridge does not provide information on a fund by fund basis as to what is included. The Board noted that Invesco Advisers does not separately charge the Invesco Funds for the administrative services included in the term as defined by Broadridge. The Board also reviewed the methodology used by Broadridge in providing expense group information, which includes using each fund’s contractual management fee schedule (including any applicable breakpoints) as reported in the most recent prospectus or statement of additional information for each fund in the expense group.
The Board also compared the Fund’s effective advisory fee rate (the advisory fee rate after advisory fee waivers and before other expense limitations/waivers) to the effective advisory fee rates of other mutual funds advised by Invesco Advisers and its affiliates with investment strategies comparable to those of the Fund, based on asset balances as of December 31, 2016. The Board noted that the Fund’s rate was below the rate of two such mutual funds.
The Board noted that Invesco Advisers and the Affiliated Sub-Advisers do not manage other client accounts with investment strategies comparable to those of the Fund.
The Board also considered the services that may be provided by the Affiliated Sub-Advisers pursuant to the sub-advisory contracts, as well as the fees payable by Invesco Advisers to the Affiliated Sub-Advisers pursuant to the sub-advisory contracts. The Board also noted that the sub-advisory fees are not paid directly by the Fund, but rather, are payable by Invesco Advisers to the Affiliated Sub-Advisers.
| D. | Economies of Scale and Breakpoints |
The Board considered the extent to which there are economies of scale in the provision of advisory services to the Fund. The Board also considered that the Fund benefits from economies of scale through contractual breakpoints in the Fund’s advisory fee schedule. The Board noted that the Fund shares directly in economies of scale through lower fees charged by third party service providers based on the combined size of the Invesco Funds advised by Invesco Advisers.
| E. | Profitability and Financial Resources |
The Board reviewed information from Invesco Advisers concerning the costs of the advisory and other services that Invesco Advisers and its affiliates provide to the Fund and the Invesco Funds and the profitability of Invesco Advisers and its affiliates in providing these services. The Board noted that Invesco Advisers continues to operate at a net profit from services Invesco
Advisers and its affiliates provide to the Invesco Funds and the Fund. The Board did not deem the level of profits realized by Invesco Advisers and its affiliates from providing services to the Fund to be excessive given the nature, quality and extent of the services provided. The Board received and accepted information from Invesco Advisers demonstrating that Invesco Advisers and each Affiliated Sub-Adviser are financially sound and have the resources necessary to perform their obligations under the investment advisory agreement and sub-advisory contracts.
| F. | Collateral Benefits to Invesco Advisers and its Affiliates |
The Board considered various other benefits received by Invesco Advisers and its affiliates from the relationship with the Fund, including the fees received for providing transfer agency and distribution services to the Fund. The Board considered comparative information regarding fees charged for these services, including information provided by Broadridge and other independent sources. The Board considered the performance of Invesco Advisers and its affiliates in providing these services and the organizational structure employed to provide these services. The Board also considered that these services are provided to the Fund pursuant to written contracts that are reviewed and approved on an annual basis by the Board; and that the services are required for the operation of the Fund.
The Board considered the benefits realized by Invesco Advisers and the Affiliated Sub-Advisers as a result of portfolio brokerage transactions executed through “soft dollar” arrangements. The Board noted that soft dollar arrangements may result in the Fund bearing costs to purchase research that may be used by Invesco Advisers or the Affiliated Sub-Advisers with other clients and may reduce Invesco Adviser’s or the Affiliated Sub-Adviser’s expenses. The Board also considered that it receives periodic reports from the Chief Compliance Officer of the Invesco Funds demonstrating that these arrangements are consistent with regulatory requirements. The Board did not deem the soft dollar arrangements to be inappropriate.
The Board considered that the Fund’s uninvested cash and cash collateral from any securities lending arrangements may be invested in money market funds advised by Invesco Advisers pursuant to procedures approved by the Board. The Board noted that Invesco Advisers receives advisory fees from these affiliated money market funds attributable to such investments, although Invesco Advisers has contractually agreed to waive through varying periods the advisory fees payable by the Invesco Funds with respect to certain investments in the affiliated money market funds. The waiver is in an amount equal to 100% of the net advisory fee Invesco Advisers receives from the affiliated money market funds with respect to the Fund’s investment in the affiliated money market funds of uninvested cash, but not cash collateral. The Board concluded that the amount of advisory
fees received by Invesco Advisers from the Fund’s investment of cash collateral from any securities lending arrangements in the affiliated money market funds is fair and reasonable.
The Board also considered that the Fund may use an affiliated broker to execute certain trades for the Fund to, among other things, control information leakage, and was advised that such trades would be executed in compliance with rules under the federal securities laws and consistent with best execution obligations.
25 Invesco Developing Markets Fund
Tax Information
Form 1099-DIV, Form 1042-S and other year-end tax information provide shareholders with actual calendar year amounts that should be included in their tax returns. Shareholders should consult their tax advisors.
The following distribution information is being provided as required by the Internal Revenue Code or to meet a specific state’s requirement.
The Fund designates the following amounts or, if subsequently determined to be different, the maximum amount allowable for its fiscal year ended October 31, 2017:
| | | | |
Federal and State Income Tax | |
Qualified Dividend Income* | | | 92.83 | % |
Corporate Dividends Received Deduction* | | | 0.00 | % |
U.S. Treasury Obligations* | | | 0.00 | % |
Foreign Taxes | | $ | 0.0743 | per share |
Foreign Source Income | | $ | 0.7641 | per share |
| | * | The above percentages are based on ordinary income dividends paid to shareholders during the Fund’s fiscal year. |
26 Invesco Developing Markets Fund
Trustees and Officers
The address of each trustee and officer is AIM Investment Funds (Invesco Investment Funds) (the “Trust”), 11 Greenway Plaza, Suite 1000, Houston, Texas 77046-1173. The trustees serve for the life of the Trust, subject to their earlier death, incapacitation, resignation, retirement or removal as more specifically provided in the Trust’s organizational documents. Each officer serves for a one year term or until their successors are elected and qualified. Column two below includes length of time served with predecessor entities, if any.
| | | | | | | | |
Name, Year of Birth and Position(s) Held with the Trust | | Trustee and/
or Officer Since | | Principal Occupation(s)
During Past 5 Years | | Number of
Funds in Fund
Complex
Overseen by
Trustee | | Other Directorship(s)
Held by Trustee During Past 5 Years |
| Interested Persons | | | | | | | | |
| Martin L. Flanagan1 — 1960 Trustee | | 2007 | | Executive Director, Chief Executive Officer and President, Invesco Ltd. (ultimate parent of Invesco and a global investment management firm); Trustee, The Invesco Funds; Vice Chair, Investment Company Institute; and Member of Executive Board, SMU Cox School of Business Formerly: Advisor to the Board, Invesco Advisers, Inc. (formerly known as Invesco Institutional (N.A.), Inc.); Chairman and Chief Executive Officer, Invesco Advisers, Inc. (registered investment adviser); Director, Chairman, Chief Executive Officer and President, Invesco Holding Company (US), Inc. (formerly IVZ Inc.) (holding company), Invesco Group Services, Inc. (service provider) and Invesco North American Holdings, Inc. (holding company); Director, Chief Executive Officer and President, Invesco Holding Company Limited (parent of Invesco and a global investment management firm); Director, Invesco Ltd.; Chairman, Investment Company Institute and President, Co-Chief Executive Officer, Co-President, Chief Operating Officer and Chief Financial Officer, Franklin Resources, Inc. (global investment management organization) | | 158 | | None |
Philip A. Taylor2 — 1954 Trustee and Senior Vice President | | 2006 | | Head of the Americas and Senior Managing Director, Invesco Ltd.; Director, Invesco Advisers, Inc. (formerly known as Invesco Institutional (N.A.), Inc.) (registered investment adviser); Director, Chairman, Chief Executive Officer and President, Invesco Management Group, Inc. (formerly known as Invesco Aim Management Group, Inc.) (financial services holding company); Director and Chairman, Invesco Investment Services, Inc. (formerly known as Invesco Aim Investment Services, Inc.) (registered transfer agent); Chief Executive Officer, Invesco Corporate Class Inc. (corporate mutual fund company); Director, Chairman and Chief Executive Officer, Invesco Canada Ltd. (formerly known as Invesco Trimark Ltd./Invesco Trimark Ltèe) (registered investment adviser and registered transfer agent); Trustee and Senior Vice President, The Invesco Funds; Director, Invesco Investment Advisers LLC (formerly known as Van Kampen Asset Management). Formerly: Co-Chairman, Co-President and Co-Chief Executive Officer, Invesco Advisers, Inc. (formerly known as Invesco Institutional (N.A.), Inc.) (registered investment adviser); Director, Chief Executive Officer and President, Van Kampen Exchange Corp; President and Principal Executive Officer, The Invesco Funds (other than AIM Treasurer’s Series Trust (Invesco Treasurer’s Series Trust), Short-Term Investments Trust and Invesco Management Trust); Executive Vice President, The Invesco Funds (AIM Treasurer’s Series Trust (Invesco Treasurer’s Series Trust), Short-Term Investments Trust and Invesco Management Trust only); Director and President, INVESCO Funds Group, Inc. (registered investment adviser and registered transfer agent); Director and Chairman, IVZ Distributors, Inc. (formerly known as INVESCO Distributors, Inc.) (registered broker dealer); Director, President and Chairman, Invesco Inc. (holding company), Invesco Canada Holdings Inc. (holding company), Trimark Investments Ltd./Placements Trimark Ltèe and Invesco Financial Services Ltd/Services Financiers Invesco Ltèe; Chief Executive Officer, Invesco Canada Fund Inc. (corporate mutual fund company); Director and Chairman, Van Kampen Investor Services Inc.; Director, Chief Executive Officer and President, 1371 Preferred Inc. (holding company) and Van Kampen Investments Inc.; Director and President, AIM GP Canada Inc. (general partner for limited partnerships) and Van Kampen Advisors, Inc.; Director and Chief Executive Officer, Invesco Trimark Dealer Inc. (registered broker dealer); Director, Invesco Distributors, Inc. (formerly known as Invesco Aim Distributors, Inc.) (registered broker dealer); Manager, Invesco PowerShares Capital Management LLC; Director, Chief Executive Officer and President, Invesco Advisers, Inc.; Director, Chairman, Chief Executive Officer and President, Invesco Aim Capital Management, Inc.; President, Invesco Trimark Dealer Inc. and Invesco Trimark Ltd./Invesco Trimark Ltèe; Director and President, AIM Trimark Corporate Class Inc. and AIM Trimark Canada Fund Inc.; Senior Managing Director, Invesco Holding Company Limited; Director and Chairman, Fund Management Company (former registered broker dealer); President and Principal Executive Officer, The Invesco Funds (AIM Treasurer’s Series Trust (Invesco Treasurer’s Series Trust), and Short-Term Investments Trust only); President, AIM Trimark Global Fund Inc. and AIM Trimark Canada Fund Inc. | | 158 | | None |
| 1 | Mr. Flanagan is considered an interested person (within the meaning of Section 2(a)(19) of the 1940 Act) of the Trust because he is an officer of the Adviser to the Trust, and an officer and a director of Invesco Ltd., ultimate parent of the Adviser. |
| 2 | Mr. Taylor is considered an interested person (within the meaning of Section 2(a)(19) of the 1940 Act) of the Trust because he is an officer and a director of the Adviser. |
T-1 Invesco Developing Markets Fund
Trustees and Officers—(continued)
| | | | | | | | |
Name, Year of Birth and Position(s) Held with the Trust | | Trustee and/
or Officer Since | | Principal Occupation(s) During Past 5 Years | | Number of
Funds in Fund
Complex
Overseen by
Trustee | | Other Directorship(s)
Held by Trustee During Past 5 Years |
| Independent Trustees | | | | | | | | |
Bruce L. Crockett — 1944 Trustee and Chair | | 2001 | | Chairman, Crockett Technologies Associates (technology consulting company) Formerly: Director, Captaris (unified messaging provider); Director, President and Chief Executive Officer, COMSAT Corporation; Chairman, Board of Governors of INTELSAT (international communications company); ACE Limited (insurance company); Independent Directors Council and Investment Company Institute: Member of the Audit Committee, Investment Company Institute; Member of the Executive Committee and Chair of the Governance Committee, Independent Directors Council | | 158 | | Director and Chairman of the Audit Committee, ALPS (Attorneys Liability Protection Society) (insurance company); Director and Member of the Audit Committee, Ferroglobe PLC (metallurgical company) |
David C. Arch — 1945 Trustee | | 2010 | | Chairman of Blistex Inc. (consumer health care products manufacturer); Member, World Presidents’ Organization | | 158 | | Board member of the Illinois Manufacturers’ Association |
James T. Bunch — 1942 Trustee | | 2003 | | Managing Member, Grumman Hill Group LLC (family office/private equity investments) Formerly: Chairman of the Board, Denver Film Society; Chairman of the Board of Trustees, Evans Scholarship Foundation; Chairman, Board of Governors, Western Golf Association | | 158 | | Trustee, Evans Scholarship Foundation |
Jack M. Fields — 1952 Trustee | | 2001 | | Chief Executive Officer, Twenty First Century Group, Inc. (government affairs company); and Discovery Learning Alliance (non-profit) Formerly: Owner and Chief Executive Officer, Dos Angeles Ranch L.P. (cattle, hunting, corporate entertainment); Director, Insperity, Inc. (formerly known as Administaff) (human resources provider); Chief Executive Officer, Texana Timber LP (sustainable forestry company); Director of Cross Timbers Quail Research Ranch (non-profit); and member of the U.S. House of Representatives | | 158 | | None |
Cynthia Hostetler — 1962 Trustee | | 2017 | | Non-Executive Director and Trustee of a number of public and private business corporations Formerly: Head of Investment Funds and Private Equity, Overseas Private Investment Corporation; President, First Manhattan Bancorporation, Inc.; Attorney, Simpson Thacher & Bartlett LLP | | 158 | | Vulcan Materials Company (construction materials company); Trilinc Global Impact Fund; Aberdeen Investment Funds (4 portfolios); Artio Global Investment LLC (mutual fund complex); Edgen Group, Inc. (specialized energy and infrastructure products distributor) |
Eli Jones — 1961 Trustee | | 2016 | | Professor and Dean, Mays Business School — Texas A&M University Formerly: Professor and Dean, Walton College of Business, University of Arkansas and E.J. Ourso College of Business, Louisiana State University; Director, Arvest Bank | | 158 | | Insperity, Inc. (formerly known as Administaff) (human resources provider) |
Prema Mathai-Davis — 1950 Trustee | | 2001 | | Retired. Formerly: Chief Executive Officer, YWCA of the U.S.A. | | 158 | | None |
Teresa M. Ressel — 1962 Trustee | | 2017 | | Non-executive director and trustee of a number of public and private business corporations Formerly: Chief Financial Officer, Olayan America, The Olayan Group (international investor/commercial/industrial); Chief Executive Officer, UBS Securities LLC; Group Chief Operating Officer, Americas, UBS AG; Assistant Secretary for Management & Budget and CFO, US Department of the Treasury; Chief Compliance Officer, Kaiser Permanente (healthcare consortium); Program Manager, Hewlett-Packard; Nuclear Engineering, General Dynamics Corporation (aerospace and defense company) | | 158 | | Atlantic Power Corporation (power generation company); ON Semiconductor Corp. (semiconductor supplier) |
Larry Soll — 1942 Trustee | | 2003 | | Retired. Formerly: Chairman, Chief Executive Officer and President, Synergen Corp. (a biotechnology company) | | 158 | | None |
Ann Barnett Stern — 1957 Trustee | | 2017 | | President and Chief Executive Officer, Houston Endowment Inc. (private philanthropic institution) Formerly: Executive Vice President and General Counsel, Texas Children’s Hospital; Attorney, Beck, Redden and Secrest, LLP; Business Law Instructor, University of St. Thomas; Attorney, Andrews & Kurth LLP | | 158 | | Federal Reserve Bank of Dallas |
Raymond Stickel, Jr. — 1944 Trustee | | 2005 | | Retired. Formerly: Director, Mainstay VP Series Funds, Inc. (25 portfolios); Partner, Deloitte & Touche | | 158 | | None |
Robert C. Troccoli — 1949 Trustee | | 2016 | | Adjunct Professor, University of Denver — Daniels College of Business Formerly: Senior Partner, KPMG LLP | | 158 | | None |
T-2 Invesco Developing Markets Fund
Trustees and Officers—(continued)
| | | | | | | | |
Name, Year of Birth and Position(s) Held with the Trust | | Trustee and/
or Officer Since | | Principal Occupation(s) During Past 5 Years | | Number of
Funds in Fund
Complex
Overseen by
Trustee | | Other Directorship(s)
Held by Trustee During Past 5 Years |
| Independent Trustees—(continued) |
Christopher L. Wilson — 1957 Trustee | | 2017 | | Managing Partner, CT2, LLC (investing and consulting firm) Formerly: President/Chief Executive Officer, Columbia Funds, Bank of America Corporation; President/Chief Executive Officer, CDC IXIS Asset Management Services, Inc.; Principal & Director of Operations, Scudder Funds, Scudder, Stevens & Clark, Inc.; Assistant Vice President, Fidelity Investments | | 158 | | TD Asset Management USA Inc. (mutual fund complex) (22 portfolios); ISO New England, Inc. (non-profit organization managing regional electricity market) |
| Other Officers | | | | | | | | |
Sheri Morris — 1964 President, Principal Executive Officer and Treasurer | | 1999 | | President, Principal Executive Officer and Treasurer, The Invesco Funds; Vice President, Invesco Advisers, Inc. (formerly known as Invesco Institutional (N.A.), Inc.) (registered investment adviser); and Vice President, PowerShares Exchange-Traded Fund Trust, PowerShares Exchange-Traded Fund Trust II, PowerShares India Exchange-Traded Fund Trust, PowerShares Actively Managed Exchange-Traded Fund Trust and PowerShares Actively Managed Exchange-Traded Commodity Fund Trust Formerly: Vice President and Principal Financial Officer, The Invesco Funds; Vice President, Invesco Aim Advisers, Inc., Invesco Aim Capital Management, Inc. and Invesco Aim Private Asset Management, Inc.; Assistant Vice President and Assistant Treasurer, The Invesco Funds and Assistant Vice President, Invesco Advisers, Inc., Invesco Aim Capital Management, Inc. and Invesco Aim Private Asset Management, Inc.; and Treasurer, PowerShares Exchange-Traded Fund Trust, PowerShares Exchange-Traded Fund Trust II, PowerShares India Exchange-Traded Fund Trust and PowerShares Actively Managed Exchange-Traded Fund Trust | | N/A | | N/A |
Russell C. Burk — 1958 Senior Vice President and Senior Officer | | 2005 | | Senior Vice President and Senior Officer, The Invesco Funds | | N/A | | N/A |
John M. Zerr — 1962 Senior Vice President, Chief Legal Officer and Secretary | | 2006 | | Director, Senior Vice President, Secretary and General Counsel, Invesco Management Group, Inc. (formerly known as Invesco AIM Management Group, Inc.); Senior Vice President, Invesco Advisers, Inc. (formerly known as Invesco Institutional (N.A.), Inc.) (registered investment adviser); Senior Vice President and Secretary, Invesco Distributors, Inc. (formerly known as Invesco AIM Distributors, Inc.); Director, Vice President and Secretary, Invesco Investment Services, Inc. (formerly known as Invesco AIM Investment Services, Inc.) Senior Vice President, Chief Legal Officer and Secretary, The Invesco Funds; Managing Director, Invesco PowerShares Capital Management LLC; Director, Secretary and General Counsel, Invesco Investment Advisers LLC (formerly known as Van Kampen Asset Management); Secretary and General Counsel, Invesco Capital Markets, Inc. (formerly known as Van Kampen Funds Inc.) and Chief Legal Officer, PowerShares Exchange-Traded Fund Trust, PowerShares Exchange-Traded Fund Trust II, PowerShares India Exchange-Traded Fund Trust, PowerShares Actively Managed Exchange-Traded Fund Trust and PowerShares Actively Managed Exchange-Traded Commodity Fund Trust; Manager and Secretary, Invesco Indexing LLC Formerly: Director, Secretary, General Counsel and Senior Vice President, Van Kampen Exchange Corp.; Director, Vice President and Secretary, IVZ Distributors, Inc. (formerly known as INVESCO Distributors, Inc.); Director and Vice President, INVESCO Funds Group, Inc.; Director and Vice President, Van Kampen Advisors Inc.; Director, Vice President, Secretary and General Counsel, Van Kampen Investor Services Inc.; Director, Invesco Distributors, Inc. (formerly known as Invesco AIM Distributors, Inc.); Director, Senior Vice President, General Counsel and Secretary, Invesco AIM Advisers, Inc. and Van Kampen Investments Inc.; Director, Vice President and Secretary, Fund Management Company; Director, Senior Vice President, Secretary, General Counsel and Vice President, Invesco AIM Capital Management, Inc.; Chief Operating Officer and General Counsel, Liberty Ridge Capital, Inc. (an investment adviser); Vice President and Secretary, PBHG Funds (an investment company) and PBHG Insurance Series Fund (an investment company); Chief Operating Officer, General Counsel and Secretary, Old Mutual Investment Partners (a broker-dealer); General Counsel and Secretary, Old Mutual Fund Services (an administrator) and Old Mutual Shareholder Services (a shareholder servicing center); Executive Vice President, General Counsel and Secretary, Old Mutual Capital, Inc. (an investment adviser); and Vice President and Secretary, Old Mutual Advisors Funds (an investment company) | | N/A | | N/A |
Gregory G. McGreevey — 1962 Senior Vice President | | 2012 | | Senior Managing Director, Invesco Ltd.; Director, Chairman, President, and Chief Executive Officer, Invesco Advisers, Inc. (formerly known as Invesco Institutional (N.A.), Inc.) (registered investment adviser); Senior Vice President, Invesco Management Group, Inc.; Director, Invesco Mortgage Capital, Inc. and Invesco Senior Secured Management, Inc.; and Senior Vice President, The Invesco Funds Formerly: Assistant Vice President, The Invesco Funds | | N/A | | N/A |
T-3 Invesco Developing Markets Fund
Trustees and Officers—(continued)
| | | | | | | | |
Name, Year of Birth and Position(s) Held with the Trust | | Trustee and/
or Officer Since | | Principal Occupation(s) During Past 5 Years | | Number of
Funds in Fund
Complex
Overseen by
Trustee | | Other Directorship(s)
Held by Trustee During Past 5 Years |
| Other Officers—(continued) | | | | | | | | |
Kelli Gallegos — 1970 Vice President, Principal Financial Officer and Assistant Treasurer | | 2008 | | Vice President, Principal Financial Officer and Assistant Treasurer, The Invesco Funds; Assistant Treasurer, Invesco PowerShares Capital Management LLC, PowerShares Exchange-Traded Fund Trust, PowerShares Exchange-Traded Fund Trust II, PowerShares India Exchange-Traded Fund Trust, PowerShares Actively Managed Exchange-Traded Fund Trust and PowerShares Actively Managed Exchange-Traded Commodity Fund Trust Formerly: Assistant Vice President, The Invesco Funds | | N/A | | N/A |
Tracy Sullivan — 1962 Vice President, Chief Tax Officer and Assistant Treasurer | | 2008 | | Vice President, Chief Tax Officer and Assistant Treasurer, The Invesco Funds; Assistant Treasurer, Invesco PowerShares Capital Management LLC, PowerShares Exchange-Traded Fund Trust, PowerShares Exchange-Traded Fund Trust II, PowerShares India Exchange-Traded Fund Trust, PowerShares Actively Managed Exchange-Traded Fund Trust and PowerShares Actively Managed Exchange-Traded Commodity Fund Trust Formerly: Assistant Vice President, The Invesco Funds | | N/A | | N/A |
Crissie M. Wisdom — 1969 Anti-Money Laundering Compliance Officer | | 2013 | | Anti-Money Laundering Compliance Officer, Invesco Advisers, Inc. (formerly known as Invesco Institutional (N.A.), Inc.) (registered investment adviser), Invesco Capital Markets, Inc. (formerly known as Van Kampen Funds Inc.), Invesco Distributors, Inc., Invesco Investment Services, Inc., Invesco Management Group, Inc., The Invesco Funds, and PowerShares Exchange-Traded Fund Trust, PowerShares Exchange-Traded Fund Trust II, PowerShares India Exchange-Traded Fund Trust, PowerShares Actively Managed Exchange-Traded Fund Trust and PowerShares Actively Managed Exchange-Traded Commodity Fund Trust; Anti-Money Laundering Compliance Officer and Bank Secrecy Act Officer, INVESCO National Trust Company and Invesco Trust Company; and Fraud Prevention Manager and Controls and Risk Analysis Manager for Invesco Investment Services, Inc. Formerly: Anti-Money Laundering Compliance Officer, Van Kampen Exchange Corp. | | N/A | | N/A |
Robert R. Leveille — 1969 Chief Compliance Officer | | 2016 | | Chief Compliance Officer, Invesco Advisers, Inc. (registered investment adviser); and Chief Compliance Officer, The Invesco Funds Formerly: Chief Compliance Officer, Putnam Investments and the Putnam Funds | | N/A | | N/A |
The Statement of Additional Information of the Trust includes additional information about the Fund’s Trustees and is available upon request, without charge, by calling 1.800.959.4246. Please refer to the Fund’s Statement of Additional Information for information on the Fund’s sub-advisers.
| | | | | | |
Office of the Fund 11 Greenway Plaza, Suite 1000 Houston, TX 77046-1173 | | Investment Adviser Invesco Advisers, Inc. 1555 Peachtree Street, N.E. Atlanta, GA 30309 | | Distributor Invesco Distributors, Inc. 11 Greenway Plaza, Suite 1000 Houston, TX 77046-1173 | | Auditors PricewaterhouseCoopers LLP 1000 Louisiana Street, Suite 5800 Houston, TX 77002-5678 |
| | | |
| | | | | | |
Counsel to the Fund Stradley Ronon Stevens & Young, LLP 2005 Market Street, Suite 2600 Philadelphia, PA 19103-7018 | | Counsel to the Independent Trustees Goodwin Procter LLP 901 New York Avenue, N.W. Washington, D.C. 20001 | | Transfer Agent Invesco Investment Services, Inc. 11 Greenway Plaza, Suite 1000 Houston, TX 77046-1173 | | Custodian State Street Bank and Trust Company 225 Franklin Street Boston, MA 02110-2801 |
T-4 Invesco Developing Markets Fund
Explore High-Conviction Investing with Invesco

Go paperless with eDelivery
Visit invesco.com/edelivery to enjoy the convenience and security of anytime electronic access to your investment documents.
With eDelivery, you can elect to have any or all of the following materials delivered straight to your inbox to download, save and print from your own computer:
| ∎ | | Fund reports and prospectuses |
Invesco mailing information
Send general correspondence to Invesco Investment Services, Inc., P.O. Box 219078, Kansas City, MO 64121-9078.
Important notice regarding delivery of security holder documents
To reduce Fund expenses, only one copy of most shareholder documents may be mailed to shareholders with multiple accounts at the same address (Householding). Mailing of your shareholder documents may be householded indefinitely unless you instruct us otherwise. If you do not want the mailing of these documents to be combined with those for other members of your household, please contact Invesco Investment Services, Inc. at 800 959 4246 or contact your financial institution. We will begin sending you individual copies for each account within 30 days after receiving your request.
Fund holdings and proxy voting information
The Fund provides a complete list of its holdings four times in each fiscal year, at the quarter ends. For the second and fourth quarters, the lists appear in the Fund’s semiannual and annual reports to shareholders. For the first and third quarters, the Fund files the lists with the Securities and Exchange Commission (SEC) on Form N-Q. The most recent list of portfolio holdings is available at invesco.com/completeqtrholdings. Shareholders can also look up the Fund’s Forms N-Q on the SEC website at sec.gov. Copies of the Fund’s Forms N-Q may be reviewed and copied at the SEC Public Reference Room in Washington, D.C. You can obtain information on the operation of the Public Reference Room, including information about duplicating fee charges, by calling 202 551 8090 or 800 732 0330, or by electronic request at the following email address: publicinfo@sec.gov. The SEC file numbers for the Fund are shown below.
A description of the policies and procedures that the Fund uses to determine how to vote proxies relating to portfolio securities is available without charge, upon request, from our Client Services department at 800 959 4246 or at invesco.com/proxyguidelines. The information is also available on the SEC website, sec.gov.
| | |
Information regarding how the Fund voted proxies related to its portfolio securities during the most recent 12-month period ended June 30 is available at invesco.com/proxysearch. The information is also available on the SEC website, sec.gov. Invesco Advisers, Inc. is an investment adviser; it provides investment advisory services to individual and institutional clients and does not sell securities. Invesco Distributors, Inc. is the US distributor for Invesco Ltd.’s retail mutual funds, exchange-traded funds and institutional money market funds. Both are wholly owned, indirect subsidiaries of Invesco Ltd. | |  |
| | | | | | | | |
| SEC file numbers: 811-05426 and 033-19338 | | Invesco Distributors, Inc. | | DVM-AR-1 | | 12122017 | | 0932 |
Letters to Shareholders
| | | | |

Philip Taylor | | | | Dear Shareholders: This annual report includes information about your Fund, including performance data and a complete list of its investments as of the close of the reporting period. Inside is a discussion of how your Fund was managed and the factors that affected its performance during the reporting period. American voters went to the polls just days after the start of the reporting period, and their decisions quickly affected markets. The US stock market rallied strongly after the election, with major market indexes rising, and setting record highs, throughout the reporting period. Generally positive economic data, strong corporate earnings and hope for tax and regulatory reform contributed to the rally. US and global bond markets, as well as emerging market equities, sold off immediately following the election – with the US bond market eventually recovering most of its losses. Overseas, economic data were mixed, prompting the European Central Bank and central banks in China and Japan, among other countries, to maintain extraordinarily accommodative |
monetary policies. Citing positive economic trends – specifically, realized and expected labor market conditions and inflation – the US Federal Reserve raised interest rates three times during the reporting period: first in December 2016, and then again in March and June 2017. Health care and tax reform proved to be more difficult than expected to enact, with little progress achieved by the end of the reporting period.
Short-term market volatility can prompt some investors to abandon their investment plans – and can cause others to settle for whatever returns the market has to offer. The investment professionals at Invesco, in contrast, invest with high conviction. This means that, no matter the asset class or the strategy, each investment team has a passion to exceed. We want to help investors achieve better outcomes, such as seeking higher returns, helping mitigate risk and generating income. Of course, investing with high conviction can’t guarantee a profit or ensure success; no investment strategy can. To learn more about how we invest with high conviction, visit invesco.com/HighConviction.
You, too, can invest with high conviction by maintaining a long-term investment perspective and by working with your financial adviser on a regular basis. During periods of short-term market volatility or uncertainty, your financial adviser can keep you focused on your long-term investment goals – a new home, a child’s college education or a secure retirement. He or she also can share research about the economy, the markets and individual investment options.
Visit our website for more information on your investments
Our website, invesco.com/us, offers a wide range of market insights and investment perspectives. On the website, you’ll find detailed information about our funds, including performance, holdings and portfolio manager commentaries. You can access information about your account by completing a simple, secure online registration. To do so, select “Log In” on the right side of the homepage, and then select “Register for Individual Account Access.”
In addition to the resources accessible on our website and through our mobile app, you can obtain timely updates to help you stay informed about the markets and the economy by connecting with Invesco on Twitter, LinkedIn or Facebook. You can access our blog at blog.invesco.us.com. Our goal is to provide you the information you want, when and where you want it.
Finally, I’m pleased to share with you Invesco’s commitment to both the Principles for Responsible Investment and to considering environmental, social and governance issues in our robust investment process. I invite you to learn more at invesco.com/esg.
Have questions?
For questions about your account, contact an Invesco client services representative at 800 959 4246. For Invesco-related questions or comments, please email me directly at phil@invesco.com.
All of us at Invesco look forward to serving your investment management needs. Thank you for investing with us.
Sincerely,

Philip Taylor
Senior Managing Director, Invesco Ltd.
|
| 2 Invesco Emerging Markets Flexible Bond Fund |
| | | | |

Bruce Crockett | | | | Dear Fellow Shareholders: Among the many important lessons I’ve learned in more than 40 years in a variety of business endeavors is the value of a trusted advocate. As independent chair of the Invesco Funds Board, I can assure you that the members of the Board are strong advocates for the interests of investors in Invesco’s mutual funds. We work hard to represent your interests through oversight of the quality of the investment management services your funds receive and other matters important to your investment, including but not limited to: ∎ Ensuring that Invesco offers a diverse lineup of mutual funds that your financial adviser can use to strive to meet your financial needs as your investment goals change over time. ∎ Monitoring how the portfolio management teams of the Invesco funds are performing in light of changing economic and market conditions. |
| ∎ | Assessing each portfolio management team’s investment performance within the context of the investment strategy described in the fund’s prospectus. |
| ∎ | Monitoring for potential conflicts of interests that may impact the nature of the services that your funds receive. |
We believe one of the most important services we provide our fund shareholders is the annual review of the funds’ advisory and sub-advisory contracts with Invesco Advisers and its affiliates. This review is required by the Investment Company Act of 1940 and focuses on the nature and quality of the services Invesco provides as the adviser to the Invesco funds and the reasonableness of the fees that it charges for those services. Each year, we spend months carefully reviewing information received from Invesco and a variety of independent sources, such as performance and fee data prepared by Lipper, Inc. (a subsidiary of Broadridge Financial Solutions, Inc.), an independent, third-party firm widely recognized as a leader in its field. We also meet with our independent legal counsel and other independent advisers to review and help us assess the information that we have received. Our goal is to assure that you receive quality investment management services for a reasonable fee.
I trust the measures outlined above provide assurance that you have a worthy advocate when it comes to choosing the Invesco Funds.
As always, please contact me at bruce@brucecrockett.com with any questions or concerns you may have. On behalf of the Board, we look forward to continuing to represent your interests and serving your needs.
Sincerely,

Bruce L. Crockett
Independent Chair
Invesco Funds Board of Trustees
|
| 3 Invesco Emerging Markets Flexible Bond Fund |
Management’s Discussion of Fund Performance
Performance summary
For the fiscal year ended October 31, 2017, Class A shares of Invesco Emerging Markets Flexible Bond Fund (the Fund), at net asset value (NAV), outperformed the 3-Month USD LIBOR Index, the Fund’s style-specific index.
Your Fund’s long-term performance appears later in this report.
Fund vs. Indexes
Total returns, 10/31/16 to 10/31/17, at net asset value (NAV). Performance shown does not include applicable contingent deferred sales charges (CDSC) or front-end sales charges, which would have reduced performance.
| | | | | |
| Class A Shares | | | | 6.62 | % |
| Class B Shares | | | | 5.82 | |
| Class C Shares | | | | 5.66 | |
| Class R Shares | | | | 6.20 | |
| Class Y Shares | | | | 6.89 | |
| Class R5 Shares | | | | 6.89 | |
| Class R6 Shares | | | | 6.73 | |
| JP Morgan EMBI Global Diversified Index▼ (Broad Market Index) | | | | 6.32 | |
| 3-month USD LIBOR Index∎ (Style-Specific Index) | | | | 1.12 | |
| Lipper Emerging Markets Hard Currency Debt Funds Index◆ (Peer Group Index) | | | | 7.70 | |
Source(s): ▼FactSet Research Systems Inc.; ∎Bloomberg L.P.; ◆Lipper Inc. | | | | | |
Market conditions and your Fund
Emerging market debt posted strong returns over the reporting period. Hard currency sovereign debt returned 6.32%, corporate debt returned 6.18% and local currency debt returned 5.18%.1 Price appreciation for US dollar-denominated debt was driven by a credit spread tightening that offset higher US Treasury yields. US 10-year Treasuries ended the fiscal year yielding 2.38%, 56 basis points higher than a year prior.2 (A basis
point is 0.01%.) Emerging market sovereign credit spreads tightened 57 basis points over the reporting period to end at 2.83%.1 Corporate credit spreads also tightened by 78 basis points.1 The change in US Treasuries reflected stronger expectations for US growth and inflation versus a year prior, while the tightening in emerging market credit spreads was largely the result of sustained flows into the asset class driven by a global hunt for yield in a low yield environment.
| | | | | |
| Portfolio Composition |
| By industry | | | | % of total net assets | |
| | | | | |
| |
| Sovereign Debt | | | | 41.8 | % |
| Diversified Banks | | | | 9.3 | |
| Integrated Oil & Gas | | | | 5.2 | |
| Diversified Metals & Mining | | | | 2.4 | |
| Oil & Gas Refining & Marketing | | | | 2.2 | |
| Packaged Foods & Meats | | | | 2.0 | |
| Industrial Conglomerates | | | | 2.0 | |
| Oil & Gas Storage & Transportation | | | | 2.0 | |
| Integrated Telecommunication Services | | | | 1.8 | |
| Airlines | | | | 1.8 | |
| Commodity Chemicals | | | | 1.7 | |
| Copper | | | | 1.5 | |
| Coal & Consumable Fuels | | | | 1.1 | |
| Renewable Electricity | | | | 1.1 | |
| Other Diversified Financial Services | | | | 1.0 | |
| Independent Power Producers & Energy Traders | | | | 1.0 | |
| Industry Type Each Less Than 1% of Portfolio | | | | 7.1 | |
| Money Market Funds Plus Other Assets Less Liabilities | | | | 15.0 | |
| | | | | | | |
| Top Five Debt Issuers* |
| | | | | | % of total net assets | |
| | | | | | | |
| | |
| 1. | | Mexican Bonos | | | | 7.9 | % |
| 2. | | Indonesia Treasury Bond | | | | 7.3 | |
| 3. | | Standard Chartered Bank | | | | 5.7 | |
| 4. | | Ecuador Government International Bond | | | | 4.7 | |
| 5. | | Brazil Notas do Tesouro Nacional | | | | 3.3 | |
| | | | | |
Total Net Assets | | | $ | 57.9 million | |
| |
Total Number of Holdings* | | | | 86 | |
The Fund’s holdings are subject to change, and there is no assurance that the Fund will continue to hold any particular security.
*Excluding money market fund holdings.
Data presented here are as of October 31, 2017.
For local currency debt, returns were driven by local rates. The return for the asset class in local currency terms was 6.17% for the fiscal year, while depreciation of emerging market currencies against the dollar detracted from performance in US dollar terms over the reporting period.1
Emerging market bonds had a difficult start to the fiscal year driven by the result of the US presidential election in November of 2016, which drove emerging markets broadly lower. However, the asset class rebounded strongly, delivering positive returns in 10 of the following 11 months. Over the reporting period, emerging markets benefited significantly from dovish global central bank policies, incremental improvements across several macroeconomic issues, a recovery in oil prices and continued inflows into the asset class.
For both sovereign and corporate debt, high yield bonds significantly outperformed investment grade bonds for the reporting period.1 For sovereign debt, the top-performing regions were Latin America and Africa, while Asia lagged. The top-performing countries included Iraq, Mozambique and Belize, while Venezuela, Bolivia and Slovakia were the worst performers. For corporate debt, Africa and Latin America were the top-performing regions, while the Middle East lagged. At the sector level, metals and mining, and oil and gas were the top performers for the reporting period, while the consumer and diversified sectors lagged. For local currency-denominated debt, the top-performing countries during the reporting period were Russia, Brazil and Peru, while Turkey, the Philippines and China were the only countries to post negative returns.
The Fund generated its return over the reporting period with less volatility than the underlying emerging markets themselves. The Fund’s returns were generated from exposure to US dollar-denominated sovereign and corporate debt, in addition to local market interest rate exposures. The Fund’s allocation to sovereign and corporate credit risk, as well as local rates risk, were positive contributors to Fund performance, while foreign exchange risk detracted from Fund returns for the reporting period. The top-contributing countries for credit were Mexico, Ecuador, Ghana and Zambia, while top-contributing local rates markets were Indonesia, India, Mexico and Russia.
|
| 4 Invesco Emerging Markets Flexible Bond Fund |
At the close of the reporting period, we believed the current backdrop of stable global growth, low inflation and accommodative financial conditions – in spite of the US Federal Reserve beginning to unwind its balance sheet – were supportive of emerging market asset prices, and we have seen an increase in idiosyncratic credit opportunities. While the macroeconomic backdrop remains supportive for emerging markets, we are closely monitoring geopolitical events in the Middle East, NAFTA negotiations and upcoming elections in Latin America, as such events have potential to weigh on the market. Market volatility globally remained exceptionally low during the reporting period. In local debt, the Fund’s positioning became more defensive, as we reduced some long duration positions and moved to reduced emerging market currency risk exposure. We continue to look for relative value opportunities intraregionally where monetary policy divergences are growing.
Please note that our strategy is implemented with derivative instruments. Therefore, some of the performance of the strategy, both positive and negative, can be attributed to these instruments. Derivatives can be a cost-effective way to gain exposure to asset classes. However, derivatives may amplify traditional investment risks through the creation of leverage and may be less liquid than traditional securities.
Thank you for your investment in Invesco Emerging Markets Flexible Bond Fund.
| 2 | Source: US Department of the Treasury |
The views and opinions expressed in management’s discussion of Fund performance are those of Invesco Advisers, Inc. These views and opinions are subject to change at any time based on factors such as market and economic conditions. These views and opinions may not be relied upon as investment advice or recommendations, or as an offer for a particular security. The information is not a complete analysis of every aspect of any market, country, industry, security or the Fund. Statements of fact are from sources considered reliable, but Invesco Advisers, Inc. makes no representation or warranty as to their completeness or accuracy. Although historical performance is no guarantee of future results, these insights may help you understand our investment management philosophy.
See important Fund and, if applicable, index disclosures later in this report.
| | |
 | | Avi Hooper Chartered Financial Analyst, Portfolio Manager, is co-lead manager of Invesco Emerging Markets Flexible Bond Fund. He |
| joined Invesco in 2010. Mr. Hooper earned a BAS with a focus in accounting and finance from York University. |
| | |
 | | Michael Hyman Portfolio Manager, is manager of Invesco Emerging Markets Flexible Bond Fund. He joined Invesco in 2013. Mr. Hyman earned a |
| BSE in finance from Pennsylvania State University and an MBA from the Stern School of Business at New York University. |
| | |
 | | Rashique Rahman Portfolio Manager, is co-lead manager of Invesco Emerging Markets Flexible Bond Fund. Mr. Rahman is the Head of Emerging Markets for Invesco |
| Fixed Income. He joined Invesco in 2014. Mr. Rahman did undergraduate work at the University of California, Los Angeles, and earned an MA and an MBA from Columbia University. |
| | |
 | | Rob Turner Portfolio Manager, is manager of Invesco Emerging Markets Flexible Bond Fund. He joined Invesco in 2017. Mr. Turner earned a |
| BA with a focus in political science from the University of Arizona and an MBA from Georgia State University. |
|
| 5 Invesco Emerging Markets Flexible Bond Fund |
Your Fund’s Long-Term Performance
Results of a $10,000 Investment – Oldest Share Class(es) since Inception
Fund and index data from 6/16/10
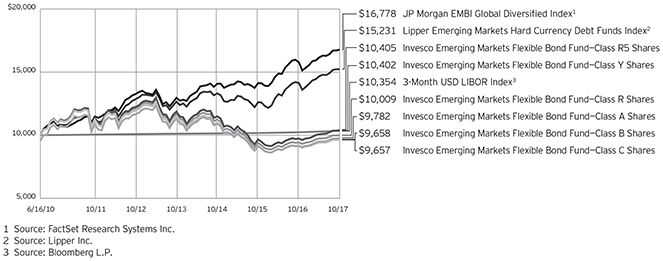
Past performance cannot guarantee comparable future results.
The data shown in the chart include reinvested distributions, applicable sales charges and Fund expenses including management fees. Results for Class B shares are calculated as if a hypothetical shareholder had liquidated his entire investment in the Fund at the close of the reporting period and paid the contingent deferred sales charges, if applicable. Index results include reinvested dividends,
but they do not reflect sales charges. Performance of the peer group, if applicable, reflects fund expenses and management fees; performance of a market index does not. Performance shown in the chart and table(s) does not reflect deduction of taxes a shareholder would pay on Fund distributions or sale of Fund shares.
|
| 6 Invesco Emerging Markets Flexible Bond Fund |
| | | | |
Average Annual Total Returns | |
As of 10/31/17, including maximum applicable sales charges | |
| |
| Class A Shares | | | | |
| Inception (6/16/10) | | | -0.30 | % |
| 5 Years | | | -4.30 | |
| 1 Year | | | 2.09 | |
| |
| Class B Shares | | | | |
| Inception (6/16/10) | | | -0.47 | % |
| 5 Years | | | -4.50 | |
| 1 Year | | | 0.82 | |
| |
| Class C Shares | | | | |
| Inception (6/16/10) | | | -0.47 | % |
| 5 Years | | | -4.20 | |
| 1 Year | | | 4.66 | |
| |
| Class R Shares | | | | |
| Inception (6/16/10) | | | 0.01 | % |
| 5 Years | | | -3.72 | |
| 1 Year | | | 6.20 | |
| |
| Class Y Shares | | | | |
| Inception (6/16/10) | | | 0.54 | % |
| 5 Years | | | -3.22 | |
| 1 Year | | | 6.89 | |
| |
| Class R5 Shares | | | | |
| Inception (6/16/10) | | | 0.54 | % |
| 5 Years | | | -3.19 | |
| 1 Year | | | 6.89 | |
| |
| Class R6 Shares | | | | |
| Inception | | | 0.44 | % |
| 5 Years | | | -3.22 | |
| 1 Year | | | 6.73 | |
Class R6 shares incepted on September 24, 2012. Performance shown prior to that date is that of Class A shares and includes the 12b-1 fees applicable to Class A shares.
The performance data quoted represent past performance and cannot guarantee comparable future results; current performance may be lower or higher. Please visit invesco.com/performance for the most recent month-end performance. Performance figures reflect reinvested distributions, changes in net asset value and the effect of the maximum sales charge unless otherwise stated. Investment return and principal value will fluctuate so that you may have a gain or loss when you sell shares.
The net annual Fund operating expense ratio set forth in the most recent Fund prospectus as of the date of this report for Class A, Class B, Class C, Class R, Class Y, Class R5 and Class
| | | | |
Average Annual Total Returns | |
As of 9/30/17, the most recent calendar quarter end, including maximum applicable sales charges | |
| |
| Class A Shares | | | | |
| Inception (6/16/10) | | | -0.34 | % |
| 5 Years | | | -4.24 | |
| 1 Year | | | 1.94 | |
| |
| Class B Shares | | | | |
| Inception (6/16/10) | | | -0.52 | % |
| 5 Years | | | -4.45 | |
| 1 Year | | | 0.67 | |
| |
| Class C Shares | | | | |
| Inception (6/16/10) | | | -0.50 | % |
| 5 Years | | | -4.12 | |
| 1 Year | | | 4.66 | |
| |
| Class R Shares | | | | |
| Inception (6/16/10) | | | -0.03 | % |
| 5 Years | | | -3.68 | |
| 1 Year | | | 6.21 | |
| |
| Class Y Shares | | | | |
| Inception (6/16/10) | | | 0.48 | % |
| 5 Years | | | -3.18 | |
| 1 Year | | | 6.74 | |
| |
| Class R5 Shares | | | | |
| Inception (6/16/10) | | | 0.48 | % |
| 5 Years | | | -3.16 | |
| 1 Year | | | 6.74 | |
| |
| Class R6 Shares | | | | |
| Inception | | | 0.41 | % |
| 5 Years | | | -3.16 | |
| 1 Year | | | 6.74 | |
R6 shares was 1.25%, 2.00%, 2.00%, 1.50%, 1.00%, 1.00% and 1.00%, respectively.1,2 The total annual Fund operating expense ratio set forth in the most recent Fund prospectus as of the date of this report for Class A, Class B, Class C, Class R, Class Y, Class R5 and Class R6 shares was 1.93%, 2.68%, 2.68%, 2.18%, 1.68%, 1.30% and 1.30%, respectively. The expense ratios presented above may vary from the expense ratios presented in other sections of this report that are based on expenses incurred during the period covered by this report.
Class A share performance reflects the maximum 4.25% sales charge, and Class B and Class C share performance reflects the applicable contingent deferred sales charge (CDSC) for the period involved. The CDSC on Class B shares declines from 5% beginning at the time of purchase to 0% at the beginning of the seventh year. The CDSC
on Class C shares is 1% for the first year after purchase. Class R, Class Y, Class R5 and Class R6 shares do not have a front-end sales charge or a CDSC; therefore, performance is at net asset value.
The performance of the Fund’s share classes will differ primarily due to different sales charge structures and class expenses.
Fund performance reflects any applicable fee waivers and/or expense reimbursements. Had the adviser not waived fees and/or reimbursed expenses currently or in the past, returns would have been lower. See current prospectus for more information.
| 1 | Total annual Fund operating expenses after any contractual fee waivers and/or expense reimbursements by the adviser in effect through at least February 28, 2019. See current prospectus for more information. |
| 2 | Total annual Fund operating expenses after any contractual fee waivers and/or expense reimbursements by the adviser in effect through at least June 30, 2019. See current prospectus for more information. |
|
| 7 Invesco Emerging Markets Flexible Bond Fund |
Invesco Emerging Markets Flexible Bond Fund’s investment objective is total return through growth of capital and current income.
| ∎ | | Unless otherwise stated, information presented in this report is as of October 31, 2017, and is based on total net assets. |
| ∎ | | Unless otherwise noted, all data provided by Invesco. |
| ∎ | | To access your Fund’s reports/prospectus, visit invesco.com/fundreports. |
About share classes
| ∎ | | Class B shares may not be purchased for new or additional investments. Please see the prospectus for more information. |
| ∎ | | Class R shares are generally available only to employer sponsored retirement and benefit plans. Please see the prospectus for more information. |
| ∎ | | Class Y shares are available only to certain investors. Please see the prospectus for more information. |
| ∎ | | Class R5 shares and Class R6 shares are available for use by retirement plans that meet certain standards and for institutional investors. Class R6 shares are also available through intermediaries that have established an agreement with Invesco Distributors, Inc. to make such shares available for use in retail omnibus accounts. Please see the prospectus for more information. |
Principal risks of investing in the Fund
| ∎ | | Active trading risk. Active trading of portfolio securities may result in added expenses, a lower return and increased tax liability. |
| ∎ | | Changing fixed income market conditions risk. The current low interest rate environment was created in part by the Federal Reserve Board (FRB) and certain foreign central banks keeping the federal funds and equivalent foreign rates near, at or below zero. Increases in the federal funds and equivalent foreign rates may expose fixed income markets to heightened volatility and reduced liquidity for certain fixed income investments, particularly those with longer maturities. In addition, decreases in fixed income dealer market-making capacity may also potentially lead to heightened volatility and reduced liquidity in the fixed income markets. As a result, the value of the Fund’s investments and share price may decline. Changes in central bank policies could also result in higher than normal shareholder |
| | redemptions, which could potentially increase portfolio turnover and the Fund’s transaction costs. |
| ∎ | | Commodities tax risk. The tax treatment of commodity-linked derivative instruments may be adversely affected by changes in legislation, regulations or other legally binding authority. If, as a result of any such adverse action, the income of the Fund from certain commodity-linked derivatives was treated as non-qualifying income, the Fund might fail to qualify as a regulated investment company and be subject to federal income tax at the Fund level. As a result of a recent announcement by the Internal Revenue Service, the Fund intends to invest in commodity-linked notes: (a) directly, generally only to the extent that it obtains an opinion of counsel confirming that income from such investments should be qualifying income because such commodity-linked notes constitute securities under section 2(a)(36) of the 1940 Act or (b) indirectly through the Subsidiary. Should the Internal Revenue Service issue further guidance, or Congress enact legislation, that adversely affects the tax treatment of the Fund’s use of commodity-linked notes or the Subsidiary (which guidance might be applied to the Fund retroactively), it could, among other consequences, limit the Fund’s ability to pursue its investment strategy. |
| ∎ | | Commodity risk. The Fund may have investment exposure to the commodities markets and/or a particular sector of the commodities markets, which may subject the Fund to greater volatility than investments in traditional securities, such as stocks and bonds. Volatility in the commodities markets may be caused by changes in overall market movements, domestic and foreign political and economic events and policies, war, acts of terrorism, changes in domestic or foreign interest rates and/or investor expectations concerning interest rates, domestic and foreign |
| | | inflation rates, investment and trading activities of mutual funds, hedge funds and commodities funds, and factors such as drought, floods, weather, livestock disease, embargoes, tariffs and other regulatory developments or supply and demand disruptions. Because the Fund’s performance may be linked to the performance of volatile commodities, investors should be willing to assume the risks of potentially significant fluctuations in the value of the Fund’s shares. |
| ∎ | | Credit linked notes risk. Risks of credit linked notes include those risks associated with the underlying reference obligation including but not limited to market risk, interest rate risk, credit risk, default risk and, in some cases, foreign currency risk. An investor in a credit linked note bears counterparty risk or the risk that the issuer of the credit linked note will default or become bankrupt and not make timely payment of principal and interest of the structured security. Credit linked notes may be less liquid than other investments and therefore harder to dispose of at the desired time and price. In addition, credit linked notes may be leveraged and, as a result, small changes in the value of the underlying reference obligation may produce disproportionate losses to the Fund. |
| ∎ | | Debt securities risk. The prices of debt securities held by the Fund will be affected by changes in interest rates, the creditworthiness of the issuer and other factors. An increase in prevailing interest rates typically causes the value of existing debt securities to fall and often has a greater impact on longer-duration debt securities and higher quality bet securities. Falling interest rates will cause the Fund to reinvest the proceeds of debt securities that have been repaid by the issuer at lower interest rates. Falling interest rates may also reduce the Fund’s distributable income because interest payments on floating rate debt instruments held by the Fund will decline. The Fund could lose money on investments in debt securities if the issuer or borrower fails to meet its obligations to make interest payments and/or to repay principal in a timely manner. Changes in an issuer’s financial strength, the market’s perception of such strength or in the credit rating |
|
This report must be accompanied or preceded by a currently effective Fund prospectus, which contains more complete information, including sales charges and expenses. Investors should read it carefully before investing. |
|
|
| NOT FDIC INSURED | MAY LOSE VALUE | NO BANK GUARANTEE |
|
| 8 Invesco Emerging Markets Flexible Bond Fund |
| | of the issuer or the security may affect the value of debt securities. The Adviser’s credit analysis may fail to anticipate such changes, which could result in buying a debt security at an inopportune time or failing to sell a debt security in advance of a price decline or other credit event. |
| ∎ | | Derivatives risk. The value of a derivative instrument depends largely on (and is derived from) the value of an underlying security, currency, commodity, interest rate, index or other asset (each referred to as an underlying asset). In addition to risks relating to the underlying assets, the use of derivatives may include other, possibly greater, risks, including counterparty, leverage and liquidity risks. Counterparty risk is the risk that the counterparty to the derivative contract will default on its obligation to pay the Fund the amount owed or otherwise perform under the derivative contract. Derivatives create leverage risk because they do not require payment up front equal to the economic exposure created by owning the derivative. As a result, an adverse change in the value of the underlying asset could result in the Fund sustaining a loss that is substantially greater than the amount invested in the derivative, which may make the Fund’s returns more volatile and increase the risk of loss. Derivative instruments may also be less liquid than more traditional investments and the Fund may be unable to sell or close out its derivative positions at a desirable time or price. This risk may be more acute under adverse market conditions, during which the Fund may be most in need of liquidating its derivative positions. Derivatives may also be harder to value, less tax efficient and subject to changing government regulation that could impact the Fund’s ability to use certain derivatives or their cost. Also, derivatives used for hedging or to gain or limit exposure to a particular market segment may not provide the expected benefits, particularly during adverse market conditions. These risks are greater for the Fund than mutual funds that do not use derivative instruments or that use derivative instruments to a lesser extent than the Fund to implement their investment strategies. |
| ∎ | | Emerging markets securities risk. Emerging markets (also referred to as developing markets) are generally subject to greater market volatility, political, social and economic instability, uncertain trading markets and more governmental limitations on foreign investment than more developed markets. In addition, companies operating in emerging markets may be subject to lower trading volume and greater price fluctuations than companies in more developed markets. Securities law and the enforcement of systems of taxation in many emerging market countries may change quickly and unpredictably. In addition, investments in emerging markets securities may also be subject to additional transaction costs, delays in settlement procedures, and lack of timely information. |
| ∎ | | Foreign currency tax risk. If the US Treasury Department were to exercise its authority to issue regulations that exclude from the definition of “qualifying income “foreign currency gains not directly related to the Fund’s business of investing in securities, the Fund may be unable to qualify as a regulated investment company for one or more years. In this event, the Fund’s Board of Trustees may authorize a significant change in investment strategy or other action. |
| ∎ | | Foreign government debt risk. Investments in foreign government debt securities (sometimes referred to as sovereign debt securities) involve certain risks in addition to those relating to foreign securities or debt securities generally. The issuer of the debt or the governmental authorities that control the repayment of the debt may be unable or unwilling to repay principal or interest when due in accordance with the terms of such debt, and the Fund may have limited recourse in the event of a default against the defaulting government. Without the approval of debt holders, some governmental debtors have in the past been able to reschedule or restructure their debt payments or declare moratoria on payments. |
| ∎ | | Foreign securities risk. The Fund’s foreign investments may be adversely affected by political and social instability, changes in economic or taxation policies, difficulty in enforcing obligations, decreased liquidity or increased volatility. |
| | Foreign investments also involve the risk of the possible seizure, nationalization or expropriation of the issuer or foreign deposits (in which the Fund could lose its entire investments in a certain market) and the possible adoption of foreign governmental restrictions such as exchange controls. Unless the Fund has hedged its foreign securities risk, foreign securities risk also involves the risk of negative foreign currency rate fluctuations, which may cause the value of securities denominated in such foreign currency (or other instruments through which the Fund has exposure to foreign currencies) to decline in value. Currency exchange rates may fluctuate significantly over short periods of time. Currency hedging strategies, if used, are not always successful. |
| ∎ | | Geographic focus risk. The Fund may from time to time invest a substantial amount of its assets in securities of issuers located in a single country or a limited number of countries. Adverse economic, political or social conditions in those countries may therefore have a significant negative impact on the Fund’s investment performance. |
| ∎ | | High yield debt securities (junk bond) risk. Investments in high yield debt securities (“junk bonds”) and other lower-rated securities will subject the Fund to substantial risk of loss. These securities are considered to be speculative with respect to the issuer’s ability to pay interest and principal when due, are more susceptible to default or decline in market value and are less liquid than investment grade debt securities. Prices of high yield debt securities tend to be very volatile. |
| ∎ | | Management risk. The Fund is actively managed and depends heavily on the Adviser’s judgment about markets, interest rates or the attractiveness, relative values, liquidity, or potential appreciation of particular investments made for the Fund’s portfolio. The Fund could experience losses if these judgments prove to be incorrect. Additionally, legislative, regulatory, or tax developments may adversely affect management of the Fund and, therefore, the ability of the Fund to achieve its investment objective. |
continued on page 10
|
| 9 Invesco Emerging Markets Flexible Bond Fund |
continued from page 9
| ∎ | | Market risk. The market values of the Fund’s investments, and therefore the value of the Fund’s shares, will go up and down, sometimes rapidly or unpredictably. Market risk may affect a single issuer, industry or section of the economy, or it may affect the market as a whole. Individual stock prices tend to go up and down more dramatically than those of certain other types of investments, such as bonds. During a general downturn in the financial markets, multiple asset classes may decline in value. When markets perform well, there can be no assurance that specific investments held by the Fund will rise in value. |
| ∎ | | Non-diversification risk. The Fund is non-diversified and can invest a greater portion of its assets in the obligations or securities of a small number of issuers or any single issuer than a diversified fund can. A change in the value of one or a few issuers’ securities will therefore affect the value of the Fund more than if it was a diversified fund. |
| ∎ | | Short position risk. Because the Fund’s potential loss on a short position arises from increases in the value of the asset sold short, the Fund will incur a loss on a short position, which is theoretically unlimited, if the price of the asset sold short increases from the short sale price. The counterparty to a short position or other market factors may prevent the Fund from closing out a short position at a desirable time or price and may reduce or eliminate any gain or result in a loss. In a rising market, the Fund’s short positions will cause the Fund to underperform the overall market and its peers that do not engage in shorting. If the Fund holds both long and short positions, and both positions decline simultaneously, the short positions will not provide any buffer (hedge) from declines in value of the Fund’s long positions. Certain types of short positions involve leverage, which may exaggerate any losses, potentially more than the actual cost of the investment, and will increase the volatility of the Fund’s returns. |
| ∎ | | Subsidiary risk. By investing in the Subsidiary, the Fund is indirectly exposed to risks associated with the Subsidiary’s investments. The Subsidiary is not registered under the Investment Company Act of 1940, as amended (1940 Act), and, except as otherwise noted in this prospectus, is not subject to the investor protections of the 1940 Act. Changes in the laws of the United States and/or the Cayman Islands, under which the |
| | | Fund and the Subsidiary, respectively, are organized, could result in the inability of the Fund and/or the Subsidiary to operate as described in this prospectus and the SAI, and could negatively affect the Fund and its shareholders. |
About indexes used in this report
| ∎ | | The JP Morgan EMBI Global Diversified Index is an unmanaged index that tracks the traded market for US-dollar-denominated Brady bonds, Eurobonds, traded loans and local market debt instruments issued by sovereign and quasi-sovereign entities. |
| ∎ | | The 3-month USD LIBOR Index is unmanaged index considered representative of the average interest rate at which a selection of banks in London are prepared to lend to one another in American dollars with a maturity of three months. |
| ∎ | | The Lipper Emerging Markets Hard Currency Debt Funds Index is an unmanaged index considered representative of emerging market debt funds tracked by Lipper. |
| ∎ | | The Fund is not managed to track the performance of any particular index, including the index(es) described here, and consequently, the performance of the Fund may deviate significantly from the performance of the index(es). |
| ∎ | | A direct investment cannot be made in an index. Unless otherwise indicated, index results include reinvested dividends, and they do not reflect sales charges. Performance of the peer group, if applicable, reflects fund expenses; performance of a market index does not. |
Other information
| ∎ | | The returns shown in management’s discussion of Fund performance are based on net asset values (NAVs) calculated for shareholder transactions. Generally accepted accounting principles require adjustments to be made to the net assets of the Fund at period end for financial reporting purposes, and as such, the NAVs for shareholder transactions and the returns based on those NAVs may differ from the NAVs and returns reported in the Financial Highlights. |
| ∎ | | Industry classifications used in this report are generally according to the Global Industry Classification Standard, which was developed by and is the exclusive property and a service mark of MSCI Inc. and Standard & Poor’s. |
|
| 10 Invesco Emerging Markets Flexible Bond Fund |
Consolidated Schedule of Investments
October 31, 2017
| | | | | | | | |
| | | Principal
Amount | | | Value | |
U.S. Dollar Denominated Bonds & Notes–55.29% | |
| Angola–0.57% | |
Angolan Government International Bond, REGS, Sr. Unsec. Euro Bonds, 9.50%, 11/12/2025(a) | | $ | 300,000 | | | $ | 327,876 | |
|
| Argentina–2.24% | |
Adecoagro S.A.,
Sr. Unsec. Notes,
6.00%, 09/21/2027(a) | | | 380,000 | | | | 383,990 | |
Argentine Republic Government International Bond, Sr. Unsec. Global Bonds,
6.63%, 07/06/2028 | | | 650,000 | | | | 691,600 | |
Provincia de Córdoba,
Sr. Unsec. Notes,
7.13%, 08/01/2027(a) | | | 205,000 | | | | 219,135 | |
| | | | | 1,294,725 | |
|
| Bahrain–2.03% | |
Bahrain Government International Bond
Sr. Unsec. Bonds,
7.50%, 09/20/2047(a) | | | 408,000 | | | | 398,380 | |
Sr. Unsec. Notes, 6.75%, 09/20/2029(a) | | | 286,000 | | | | 285,176 | |
Oil and Gas Holding Company B.S.C.C. (The),
Sr. Unsec. Notes,
7.50%, 10/25/2027(a) | | | 471,000 | | | | 489,849 | |
| | | | | 1,173,405 | |
|
| Brazil–9.14% | |
Banco do Brasil S.A., REGS, Jr. Unsec. Sub. Euro Notes,
9.00%(a)(b) | | | 800,000 | | | | 880,000 | |
Banco Nacional de Desenvolvimento Economico e Social, Sr. Unsec. Notes, 4.75%, 05/09/2024(a) | | | 324,000 | | | | 328,147 | |
Brazilian Government International Bond
Sr. Unsec. Global Bonds, 5.63%, 01/07/2041 | | | 250,000 | | | | 254,000 | |
Sr. Unsec. Global Notes, 4.63%, 01/13/2028 | | | 219,000 | | | | 217,741 | |
Cosan Ltd., Sr. Unsec. Notes, 5.95%, 09/20/2024(a) | | | 200,000 | | | | 207,060 | |
Cosan Overseas Ltd., REGS, Sr. Unsec. Gtd. Euro
Notes, 8.25%(a)(b) | | | 700,000 | | | | 717,675 | |
Klabin Finance S.A., Sr. Unsec. Gtd. Notes, 4.88%, 09/19/2027(a) | | | 238,000 | | | | 236,810 | |
Minerva Luxembourg S.A., REGS, Sr. Unsec. Gtd. Euro Notes, 6.50%, 09/20/2026(a) | | | 550,000 | | | | 571,477 | |
| | | | | | | | |
| | | Principal
Amount | | | Value | |
| Brazil–(continued) | |
Petrobras Global Finance B.V. Sr. Unsec. Gtd. Global Notes,
7.25%, 03/17/2044 | | $ | 996,000 | | | $ | 1,047,045 | |
Sr. Unsec. Gtd. Notes,
6.00%, 01/27/2028(a) | | | 600,000 | | | | 607,944 | |
Vale Canada Ltd., Sr. Unsec. Global Bonds, 7.20%, 09/15/2032 | | | 200,000 | | | | 225,500 | |
| | | | | 5,293,399 | |
|
| Chile–0.36% | |
GeoPark Ltd., Sr. Sec. First Lien Notes,
6.50%, 09/21/2024(a) | | | 200,000 | | | | 205,600 | |
|
| China–1.04% | |
Panda Green Energy Group Ltd., REGS, Sr. Unsec. Gtd. Euro Bonds,
8.25%, 01/25/2020(a) | | | 300,000 | | | | 306,820 | |
Ronshine China Holdings Ltd., REGS, Sr. Unsec. Gtd. Euro Bonds,
6.95%, 12/08/2018(a)(c) | | | 300,000 | | | | 295,559 | |
| | | | | 602,379 | |
|
| Colombia–3.07% | |
Avianca Holdings S.A./ Avianca Leasing LLC/ Grupo Taca Holdings, REGS, Sr. Unsec. Gtd. Euro Notes,
8.38%, 05/10/2020(a) | | | 1,000,000 | | | | 1,023,100 | |
Banco de Bogotá S.A.,
Sr. Unsec. Notes,
4.38%, 08/03/2027(a) | | | 430,000 | | | | 433,655 | |
Colombia Telecomunicaciones S.A. ESP, REGS, Jr. Unsec. Sub. Euro Notes, 8.50%(a)(b) | | | 300,000 | | | | 321,750 | |
| | | | | 1,778,505 | |
|
| Costa Rica–0.65% | |
Instituto Costarricense de Electricidad, REGS, Sr. Unsec. Euro Notes,
6.38%, 05/15/2043(a) | | | 400,000 | | | | 377,988 | |
|
| Ecuador–4.67% | |
Ecuador Government International Bond
REGS, Sr. Unsec. Euro Bonds, 10.75%, 03/28/2022(a) | | | 950,000 | | | | 1,075,875 | |
Sr. Unsec. Bonds, 8.75%,
06/02/2023(a) | | | 600,000 | | | | 630,900 | |
Sr. Unsec. Notes,
8.88%, 10/23/2027(a) | | | 550,000 | | | | 564,037 | |
9.63%, 06/02/2027(a) | | | 400,000 | | | | 431,000 | |
| | | | | | | | 2,701,812 | |
See accompanying Notes to Consolidated Financial Statements which are an integral part of the financial statements.
11 Invesco Emerging Markets Flexible Bond Fund
| | | | | | | | |
| | | Principal
Amount | | | Value | |
| El Salvador–2.06% | |
AES El Salvador Trust II, REGS, Sr. Unsec. Gtd. Euro Notes, 6.75%, 03/28/2023(a) | | $ | 600,000 | | | $ | 579,000 | |
El Salvador Government International Bond
REGS, Sr. Unsec. Euro Notes, 5.88%, 01/30/2025(a) | | | 475,000 | | | | 471,437 | |
Sr. Unsec. Notes,
8.63%, 02/28/2029(a) | | | 127,000 | | | | 144,145 | |
| | | | | | | | 1,194,582 | |
|
| Ghana–0.51% | |
Ghana Government International Bond, REGS, Sr. Unsec. Euro Notes, 7.88%, 08/07/2023(a) | | | 270,000 | | | | 292,592 | |
|
| India–1.86% | |
Vedanta Resources PLC REGS, Sr. Unsec. Euro Notes, 7.13%, 05/31/2023(a) | | | 400,000 | | | | 432,400 | |
Sr. Unsec. Notes,
6.13%, 08/09/2024(a) | | | 269,000 | | | | 275,120 | |
6.38%, 07/30/2022(a) | | | 350,000 | | | | 367,045 | |
| | | | | | | | 1,074,565 | |
|
| Indonesia–0.57% | |
Pertamina Persero PT, REGS, Sr. Unsec. Medium-Term Euro Notes, 5.63%, 05/20/2043(a) | | | 300,000 | | | | 329,268 | |
|
| Iraq–1.38% | |
Iraq International Bond, Sr. Unsec. Notes,
6.75%, 03/09/2023(a) | | | 793,000 | | | | 796,589 | |
|
| Jamaica–1.76% | |
Jamaica Government International Bond Sr. Unsec. Global Notes, 6.75%, 04/28/2028 | | | 505,000 | | | | 586,982 | |
7.88%, 07/28/2045 | | | 346,000 | | | | 429,905 | |
| | | | | | | | 1,016,887 | |
|
| Jordan–0.63% | |
Jordan Government International Bond, Sr. Unsec. Bonds, 7.38%, 10/10/2047(a) | | | 350,000 | | | | 367,386 | |
|
| Mexico–6.29% | |
Alfa S.A.B. de C.V., REGS, Sr. Unsec. Euro Notes, 6.88%, 03/25/2044(a) | | | 1,050,000 | | | | 1,153,688 | |
Alpek S.A.B. de C.V., REGS, Sr. Unsec. Gtd. Euro Notes, 5.38%, 08/08/2023(a) | | | 950,000 | | | | 1,007,000 | |
Petróleos Mexicanos, Sr. Unsec. Gtd. Notes, 6.50%, 03/13/2027(a) | | | 194,000 | | | | 211,974 | |
SixSigma Networks México, S.A. de C.V., REGS, Sr. Unsec. Gtd. Euro Notes, 8.25%, 11/07/2021(a) | | | 700,000 | | | | 740,250 | |
| | | | | | | | |
| | | Principal
Amount | | | Value | |
| Mexico–(continued) | |
Unifin Financiera, S.A.B. de C.V., SOFOM, E.N.R., Sr. Unsec. Gtd. Bonds, 7.25%, 09/27/2023(a) | | $ | 500,000 | | | $ | 526,250 | |
| | | | | 3,639,162 | |
|
| Morocco–0.78% | |
OCP S.A., REGS, Sr. Unsec. Euro Notes,
6.88%, 04/25/2044(a) | | | 400,000 | | | | 452,400 | |
|
| Oman–1.02% | |
Oman Government International Bond, Sr. Unsec. Notes, 6.50%, 03/08/2047(a) | | | 378,000 | | | | 390,057 | |
OmGrid Funding Ltd., Sr. Unsec. Gtd. Bonds,
5.20%, 05/16/2027(a) | | | 200,000 | | | | 201,002 | |
| | | | | 591,059 | |
|
| Peru–2.93% | |
Banco Internacional del Perú S.A.A. Interbank, REGS, Unsec. Sub. Euro Notes,
6.63%, 03/19/2029(a) | | | 300,000 | | | | 340,500 | |
Nexa Resources S.A., Sr. Unsec. Gtd. Notes,
5.38%, 05/04/2027(a) | | | 300,000 | | | | 318,300 | |
Peru Enhanced Pass-Through Finance Ltd., REGS, Class A-2, Sr. Sec. First Lien Pass Through Euro Ctfs.,
7.33%, 06/02/2025(a)(d) | | | 250,000 | | | | 217,813 | |
Petróleos del Perú S.A.
Sr. Unsec. Notes,
4.75%, 06/19/2032(a) | | | 595,000 | | | | 609,697 | |
5.63%, 06/19/2047(a) | | | 200,000 | | | | 211,040 | |
| | | | | | | | 1,697,350 | |
|
| Senegal–0.45% | |
Senegal Government International Bond, Unsec. Notes,
6.25%, 05/23/2033(a) | | | 250,000 | | | | 259,162 | |
|
| Singapore–0.62% | |
Puma International Financing S.A., Sr. Unsec. Gtd. Notes, 5.13%,
10/06/2024(a) | | | 350,000 | | | | 358,400 | |
|
| South Africa–0.58% | |
Petra Diamonds US Treasury PLC, Sec. Gtd. Second Lien Notes, 7.25%, 05/01/2022(a) | | | 340,000 | | | | 338,470 | |
|
| Turkey–2.05% | |
Turkey Government International Bond
Sr. Unsec. Global Bonds, 4.88%, 04/16/2043 | | | 550,000 | | | | 475,697 | |
Sr. Unsec. Global Notes, 6.88%, 03/17/2036 | | | 225,000 | | | | 248,295 | |
See accompanying Notes to Consolidated Financial Statements which are an integral part of the financial statements.
12 Invesco Emerging Markets Flexible Bond Fund
| | | | | | | | |
| | | Principal
Amount | | | Value | |
| Turkey–(continued) | |
Turkiye Garanti Bankasi A.S., Unsec. Sub. Notes,
6.13%, 05/24/2027(a) | | $ | 235,000 | | | $ | 232,768 | |
Yapi ve Kredi Bankasi A.S., Sr. Unsec. Notes,
5.85%, 06/21/2024(a) | | | 235,000 | | | | 232,290 | |
| | | | | 1,189,050 | |
|
| Ukraine–1.58% | |
Kernel Holding S.A., Sr. Unsec. Gtd. Notes,
8.75%, 01/31/2022(a) | | | 343,000 | | | | 379,066 | |
MHP S.E., Sr. Unsec. Gtd. Notes, 7.75%, 05/10/2024(a) | | | 200,000 | | | | 216,350 | |
Ukraine Government International Bond, REGS, Sr. Unsec. Euro Notes,
7.75%, 09/01/2021(a) | | | 300,000 | | | | 320,818 | |
| | | | | 916,234 | |
|
| United Arab Emirates–0.58% | |
Abu Dhabi Crude Oil Pipeline LLC, Sr. Sec. Notes,
3.65%, 11/02/2029(a) | | | 332,000 | | | | 333,660 | |
|
| United States–2.48% | |
NGPL PipeCo. LLC
Sr. Unsec. Bonds,
4.88%, 08/15/2027(a) | | | 112,000 | | | | 116,200 | |
Sr. Unsec. Notes,
4.38%, 08/15/2022(a) | | | 111,000 | | | | 114,469 | |
Plains All American Pipeline, L.P., Series B, Jr. Unsec. Sub. Notes, 6.13%(b) | | | 558,000 | | | | 570,164 | |
SunCoke Energy Partners, L.P./ SunCoke Energy Partners Finance Corp., Sr. Unsec. Gtd. Notes,
7.50%, 06/15/2025(a) | | | 600,000 | | | | 633,000 | |
| | | | | 1,433,833 | |
|
| Zambia–3.39% | |
First Quantum Minerals Ltd. Sr. Unsec. Gtd. Notes, | | | | | | | | |
7.25%, 04/01/2023(a) | | | 325,000 | | | | 345,312 | |
7.50%, 04/01/2025(a) | | | 500,000 | | | | 531,250 | |
Zambia Government International Bond
REGS, Sr. Unsec. Euro Notes,
8.50%, 04/14/2024(a) | | | 200,000 | | | | 214,500 | |
Sr. Unsec. Notes,
8.97%, 07/30/2027(a) | | | 800,000 | | | | 874,160 | |
| | | | | 1,965,222 | |
U.S. Dollar Denominated Bonds & Notes
(Cost $30,825,092) | | | | 32,001,560 | |
| | | | | | | | |
| | | Principal
Amount | | | Value | |
Non U.S. Dollar Denominated Bonds &
Notes–23.32%(e) | |
| Brazil–3.27% | |
Brazil Notas do Tesouro Nacional, Series F, Unsec. Notes, 10.00%, 01/01/2027 | | BRL | 6,000,000 | | | $ | 1,894,395 | |
|
| India–1.28% | |
Province of British Columbia, Sr. Unsec. Bonds,
6.60%, 01/09/2020(a) | | INR | 47,000,000 | | | | 738,818 | |
|
| Indonesia–7.25% | |
Indonesia Treasury Bond
Series FR54, Sr. Unsec. Bonds, 9.50%, 07/15/2031 | | IDR | 32,000,000,000 | | | | 2,810,378 | |
Series FR72, Sr. Unsec. Bonds, 8.25%, 05/15/2036 | | IDR | 7,000,000,000 | | | | 558,689 | |
Sr. Unsec. Bonds,
7.50%, 05/15/2038 | | IDR | 11,000,000,000 | | | | 828,062 | |
| | | | | | | | 4,197,129 | |
|
| Mexico–7.94% | |
Mexican Bonos, Sr. Unsec. Bonds, 6.50%, 06/09/2022 | | MXN | 90,000,000 | | | | 4,596,753 | |
|
| Netherlands–0.53% | |
IPD 3 B.V., Sr. Sec. Gtd. Notes, 4.50%, 07/15/2022(a) | | EUR | 250,000 | | | | 307,388 | |
|
| Peru–1.13% | |
Peru Government Bond, REGS, Sr. Unsec. Bonds,
6.15%, 08/12/2032(a) | | PEN | 2,026,000 | | | | 654,771 | |
|
| Russia–1.92% | |
Russian Federal Bond — OFZ,
Series 6218, Unsec. Bonds,
8.50%, 09/17/2031 | | RUB | 60,000,000 | | | | 1,112,783 | |
Total Non U.S. Dollar Denominated Bonds & Notes (Cost $13,290,262) | | | | 13,502,037 | |
| |
Credit-Linked Securities–5.65%(e) | | | | | |
Standard Chartered Bank
REGS, Sr. Unsec. Medium-Term Euro Notes (Credit-Linked to India Government Bonds, 8.28%, 09/21/2027), 8.28%, 09/23/2027(a) | | INR | 58,000,000 | | | | 963,639 | |
Sr. Unsec. Medium-Term Euro Notes (Credit-Linked to India Government Bonds,
8.12%, 12/10/2020), 8.12%, 12/14/2020(a) | | INR | 40,000,000 | | | | 645,789 | |
Sr. Unsec. Notes (Credit-Linked to India Government Bonds,
8.40%, 07/28/2024), 8.40%, 07/30/2024(a) | | INR | 100,000,000 | | | | 1,662,288 | |
Total Credit-Linked Securities
(Cost $3,238,045) | | | | 3,271,716 | |
See accompanying Notes to Consolidated Financial Statements which are an integral part of the financial statements.
13 Invesco Emerging Markets Flexible Bond Fund
| | | | | | | | |
| | | Shares | | | Value | |
Common Stocks–0.55% | |
Petróleo Brasileiro S.A.–ADR (Cost $301,866) | | | 30,000 | | | $ | 319,500 | |
|
Money Market Funds–9.82% | |
Invesco Government & Agency Portfolio–Institutional Class,
0.95%(f) | | | 3,412,001 | | | | 3,412,001 | |
Invesco Treasury Portfolio–Institutional Class, 0.94%(f) | | | 2,274,668 | | | | 2,274,668 | |
Total Money Market Funds
(Cost $5,686,669) | | | | 5,686,669 | |
| | | | | | | | |
| | | | | | Value | |
Options Purchased–0.15%(g) | | | | | |
(Cost $95,711) | | | | | | $ | 85,601 | |
TOTAL INVESTMENTS IN SECURITIES–94.78%
(Cost $53,437,645) | | | | 54,867,083 | |
OTHER ASSETS LESS LIABILITIES–5.22% | | | | 3,018,787 | |
NET ASSETS–100.00% | | | | | | $ | 57,885,870 | |
Investment Abbreviations:
| | |
| ADR | | – American Depositary Receipt |
| BRL | | – Brazilian Real |
| Ctfs. | | – Certificates |
| EUR | | – Euro |
| | |
| Gtd. | | – Guaranteed |
| IDR | | – Indonesian Rupiah |
| INR | | – Indian Rupee |
| Jr. | | – Junior |
| | |
| MXN | | – Mexican Peso |
| PEN | | – Peruvian Sol |
| REGS | | – Regulation S |
| RUB | | – Russian Ruble |
| | |
| Sec. | | – Secured |
| Sr. | | – Senior |
| Sub. | | – Subordinated |
| Unsec. | | – Unsecured |
Notes to Consolidated Schedule of Investments:
| (a) | Security purchased or received in a transaction exempt from registration under the Securities Act of 1933, as amended (the “1933 Act”). The security may be resold pursuant to an exemption from registration under the 1933 Act, typically to qualified institutional buyers. The aggregate value of these securities at October 31, 2017 was $32,227,324, which represented 55.67% of the Fund’s Net Assets. |
| (b) | Perpetual bond with no specified maturity date. |
| (c) | Security has an irrevocable call by the issuer or mandatory put by the holder. Maturity date reflects such call or put. |
| (d) | Zero coupon bond issued at a discount. The interest rate shown represents the yield to maturity at issue. |
| (e) | Foreign denominated security. Principal amount is denominated in the currency indicated. |
| (f) | The money market fund and the Fund are affiliated by having the same investment adviser. The rate shown is the 7-day SEC standardized yield as of October 31, 2017. |
| (g) | The table below details options purchased. See Notes 1M and 1N. |
| | | | | | | | | | | | | | | | | | | | | | | | | | | | | | |
| Open Over-The-Counter Foreign Currency Options Purchased | |
| Description | | Type of
Contract | | | Counterparty | | Expiration
Date | | | Exercise
Price | | | Notional
Value | | | Value | |
AUD versus JPY | | | Put | | | Goldman Sachs International | | | 11/06/2017 | | | | JPY | | | | 86.000 | | | | AUD | | | | 1,800,000 | | | $ | 1,110 | |
USD versus MXN | | | Put | | | Citigroup Global Markets Inc. | | | 07/17/2018 | | | | MXN | | | | 18.500 | | | | USD | | | | 1,700,000 | | | | 25,811 | |
Subtotal Foreign Currency Options Purchased — Currency Risk | | | | | | | $ | 26,921 | |
| | | | | | | | | | | | | | | | | | | | | | | | | | | | | | | | | | | | |
| Open Over-The-Counter Interest Rate Swaptions Purchased — Interest Rate Risk | |
| Description | | Type of
Contract | | | Counterparty | | | Exercise
Rate | | | Pay/
Receive
Exercise
Rate | | | Floating
Rate Index | | | Payment
Frequency | | | Expiration
Date | | | Notional
Value | | | Value | |
10 Year Interest Rate Swap | | | Put | | | | Morgan Stanley & Co. LLC | | | | 2.245 | % | | | Pay | | | | 3Month USD LIBOR | | | | Quarterly | | | | 03/26/2018 | | | $ | 2,600,000 | | | $ | 58,680 | |
Total Options Purchased (Cost $95,711) | | | $ | 85,601 | |
| | | | | | | | | | | | | | | | | | | | | | | | | | | | | | | | |
| Open Over-The-Counter Foreign Currency Options Written-Currency Risk | |
| Description | | Type of
Contract | | | Counterparty | | | Expiration
Date | | | Exercise
Price | | | Premiums
Received | | | Notional Value | | | Value | | | Unrealized
Appreciation | |
MXN versus USD | | | Call | | | | Citigroup Global Markets Inc. | | | | 07/17/2018 | | | | MXN 22.000 | | | $ | (38,411 | ) | | | USD 1,700,000 | | | $ | (37,453 | ) | | $ | 958 | |
| | | | | | | | | | | | | | | | | | | | |
| Open Futures Contracts(h) | |
| Short Futures Contracts | | Number of
Contracts | | | Expiration
Month | | | Notional
Value | | | Value | | | Unrealized Appreciation
(Depreciation) | |
Copper | | | 8 | | | | December-2017 | | | $ | (620,200 | ) | | $ | (528 | ) | | $ | (528 | ) |
Subtotal — Commodity Risk | | | | (528 | ) | | | (528 | ) |
U.S. Treasury 10 Year Bonds | | | 73 | | | | December-2017 | | | | (9,120,438 | ) | | | (42,377 | ) | | | (42,377 | ) |
Subtotal — Interest Rate Risk | | | | (42,377 | ) | | | (42,377 | ) |
Total Futures Contracts | | | $ | (42,905 | ) | | $ | (42,905 | ) |
| (h) | Futures contracts collateralized by $103,588 cash held with Bank of America Merrill Lynch, the futures commission merchant. |
See accompanying Notes to Consolidated Financial Statements which are an integral part of the financial statements.
14 Invesco Emerging Markets Flexible Bond Fund
| | | | | | | | | | | | | | | | | | | | | | |
| Open Forward Foreign Currency Contracts | |
Settlement Date | | Counterparty | | Contract to | | | Unrealized
Appreciation | |
| | | Deliver | | | Receive | | |
11/03/2017 | | Morgan Stanley & Co. LLC | | | BRL | | | | 6,200,000 | | | | USD | | | | 1,960,726 | | | $ | 66,211 | |
11/30/2017 | | Barclays Bank PLC | | | AUD | | | | 700,000 | | | | USD | | | | 556,898 | | | | 21,333 | |
11/30/2017 | | Barclays Bank PLC | | | CLP | | | | 615,000,000 | | | | USD | | | | 989,144 | | | | 21,455 | |
11/30/2017 | | Barclays Bank PLC | | | CNY | | | | 4,000,000 | | | | USD | | | | 608,440 | | | | 6,656 | |
11/30/2017 | | Barclays Bank PLC | | | HUF | | | | 675,000,000 | | | | USD | | | | 2,582,734 | | | | 53,744 | |
11/30/2017 | | Barclays Bank PLC | | | IDR | | | | 25,000,000,000 | | | | USD | | | | 1,853,225 | | | | 16,900 | |
11/30/2017 | | Barclays Bank PLC | | | JPY | | | | 127,000,000 | | | | USD | | | | 1,135,064 | | | | 16,574 | |
11/30/2017 | | Barclays Bank PLC | | | MXN | | | | 15,000,000 | | | | USD | | | | 827,489 | | | | 49,356 | |
11/30/2017 | | Barclays Bank PLC | | | RUB | | | | 60,000,000 | | | | USD | | | | 1,031,460 | | | | 10,584 | |
11/30/2017 | | Barclays Bank PLC | | | SEK | | | | 9,000,000 | | | | USD | | | | 1,104,052 | | | | 27,011 | |
11/30/2017 | | Barclays Bank PLC | | | TRY | | | | 9,300,000 | | | | USD | | | | 2,543,422 | | | | 113,664 | |
11/30/2017 | | Barclays Bank PLC | | | ZAR | | | | 20,700,000 | | | | USD | | | | 1,530,532 | | | | 74,375 | |
11/30/2017 | | Citigroup Global Markets Inc. | | | HUF | | | | 301,000,000 | | | | USD | | | | 1,174,222 | | | | 46,480 | |
11/30/2017 | | Citigroup Global Markets Inc. | | | PLN | | | | 8,400,000 | | | | USD | | | | 2,311,630 | | | | 3,741 | |
11/30/2017 | | Citigroup Global Markets Inc. | | | RUB | | | | 100,000,000 | | | | USD | | | | 1,726,519 | | | | 25,061 | |
11/30/2017 | | Citigroup Global Markets Inc. | | | USD | | | | 1,143,990 | | | | INR | | | | 75,000,000 | | | | 11,767 | |
11/30/2017 | | Citigroup Global Markets Inc. | | | USD | | | | 1,166,387 | | | | KRW | | | | 1,320,000,000 | | | | 14,626 | |
11/30/2017 | | Citigroup Global Markets Inc. | | | ZAR | | | | 53,400,000 | | | | USD | | | | 3,979,887 | | | | 223,424 | |
11/30/2017 | | Deutsche Bank Securities Inc. | | | AUD | | | | 1,000,000 | | | | USD | | | | 788,775 | | | | 23,683 | |
11/30/2017 | | Deutsche Bank Securities Inc. | | | EUR | | | | 350,000 | | | | USD | | | | 413,673 | | | | 5,300 | |
11/30/2017 | | Deutsche Bank Securities Inc. | | | HUF | | | | 220,000,000 | | | | USD | | | | 849,368 | | | | 25,105 | |
11/30/2017 | | Goldman Sachs International | | | AUD | | | | 520,000 | | | | USD | | | | 405,364 | | | | 7,517 | |
11/30/2017 | | Goldman Sachs International | | | CAD | | | | 2,160,000 | | | | USD | | | | 1,721,362 | | | | 46,593 | |
11/30/2017 | | Goldman Sachs International | | | CHF | | | | 1,710,000 | | | | USD | | | | 1,737,157 | | | | 19,576 | |
11/30/2017 | | Goldman Sachs International | | | CLP | | | | 730,000,000 | | | | USD | | | | 1,150,512 | | | | 1,874 | |
11/30/2017 | | Goldman Sachs International | | | CNY | | | | 5,500,000 | | | | USD | | | | 841,960 | | | | 14,506 | |
11/30/2017 | | Goldman Sachs International | | | COP | | | | 4,200,000,000 | | | | USD | | | | 1,396,982 | | | | 20,197 | |
11/30/2017 | | Goldman Sachs International | | | HUF | | | | 370,000,000 | | | | USD | | | | 1,430,803 | | | | 44,542 | |
11/30/2017 | | Goldman Sachs International | | | JPY | | | | 130,000,000 | | | | USD | | | | 1,173,027 | | | | 28,116 | |
11/30/2017 | | Goldman Sachs International | | | MXN | | | | 202,858,189 | | | | USD | | | | 11,090,412 | | | | 567,029 | |
11/30/2017 | | Goldman Sachs International | | | PLN | | | | 2,100,000 | | | | USD | | | | 577,129 | | | | 157 | |
11/30/2017 | | Goldman Sachs International | | | TRY | | | | 18,900,000 | | | | USD | | | | 5,044,412 | | | | 106,516 | |
11/30/2017 | | Goldman Sachs International | | | USD | | | | 1,068,828 | | | | CLP | | | | 680,000,000 | | | | 1,137 | |
11/30/2017 | | Goldman Sachs International | | | USD | | | | 666,419 | | | | RUB | | | | 40,000,000 | | | | 14,164 | |
11/30/2017 | | Goldman Sachs International | | | USD | | | | 737,353 | | | | ZAR | | | | 10,500,000 | | | | 1,277 | |
11/30/2017 | | Goldman Sachs International | | | ZAR | | | | 21,000,000 | | | | USD | | | | 1,531,594 | | | | 54,333 | |
11/30/2017 | | Merrill Lynch International | | | CLP | | | | 545,000,000 | | | | USD | | | | 868,941 | | | | 11,396 | |
11/30/2017 | | Merrill Lynch International | | | CNY | | | | 5,600,000 | | | | USD | | | | 846,104 | | | | 3,606 | |
11/30/2017 | | Merrill Lynch International | | | HUF | | | | 300,000,000 | | | | USD | | | | 1,137,313 | | | | 13,317 | |
11/30/2017 | | Merrill Lynch International | | | INR | | | | 110,000,000 | | | | USD | | | | 1,698,055 | | | | 2,944 | |
11/30/2017 | | Merrill Lynch International | | | USD | | | | 741,198 | | | | CLP | | | | 480,000,000 | | | | 14,071 | |
11/30/2017 | | Merrill Lynch International | | | USD | | | | 911,300 | | | | INR | | | | 60,000,000 | | | | 13,306 | |
11/30/2017 | | Morgan Stanley & Co. LLC | | | COP | | | | 2,700,000,000 | | | | USD | | | | 891,825 | | | | 6,749 | |
11/30/2017 | | Morgan Stanley & Co. LLC | | | IDR | | | | 44,000,000,000 | | | | USD | | | | 3,236,152 | | | | 4,221 | |
11/30/2017 | | Morgan Stanley & Co. LLC | | | MXN | | | | 17,000,000 | | | | USD | | | | 935,608 | | | | 53,724 | |
11/30/2017 | | Morgan Stanley & Co. LLC | | | PLN | | | | 4,100,000 | | | | USD | | | | 1,137,499 | | | | 11,029 | |
12/01/2017 | | Merrill Lynch International | | | PHP | | | | 150,000,000 | | | | USD | | | | 2,922,953 | | | | 30,036 | |
12/04/2017 | | Merrill Lynch International | | | BRL | | | | 4,000,000 | | | | USD | | | | 1,251,564 | | | | 34,246 | |
12/04/2017 | | Morgan Stanley & Co. LLC | | | BRL | | | | 7,000,000 | | | | USD | | | | 2,147,866 | | | | 17,558 | |
12/22/2017 | | Goldman Sachs International | | | USD | | | | 2,065,131 | | | | TWD | | | | 65,000,000 | | | | 97,559 | |
Subtotal | | | | | | | | | | | | | | | | | | | | | 2,098,346 | |
See accompanying Notes to Consolidated Financial Statements which are an integral part of the financial statements.
15 Invesco Emerging Markets Flexible Bond Fund
| | | | | | | | | | | | | | | | | | | | | | |
| Open Forward Foreign Currency Contracts—(continued) | |
Settlement Date | | Counterparty | | Contract to | | | Unrealized
Appreciation
(Depreciation) | |
| | | Deliver | | | Receive | | |
11/03/2017 | | Morgan Stanley & Co. LLC | | | USD | | | | 1,914,104 | | | | BRL | | | | 6,200,000 | | | $ | (19,590 | ) |
11/30/2017 | | Barclays Bank PLC | | | TWD | | | | 78,000,000 | | | | USD | | | | 2,586,207 | | | | (5,543 | ) |
11/30/2017 | | Barclays Bank PLC | | | USD | | | | 2,918,002 | | | | CLP | | | | 1,840,000,000 | | | | (22,803 | ) |
11/30/2017 | | Barclays Bank PLC | | | USD | | | | 1,147,834 | | | | HUF | | | | 300,000,000 | | | | (23,839 | ) |
11/30/2017 | | Barclays Bank PLC | | | USD | | | | 1,889,645 | | | | IDR | | | | 25,000,000,000 | | | | (53,320 | ) |
11/30/2017 | | Barclays Bank PLC | | | USD | | | | 1,142,122 | | | | JPY | | | | 125,000,000 | | | | (41,247 | ) |
11/30/2017 | | Barclays Bank PLC | | | USD | | | | 1,225,614 | | | | MXN | | | | 22,000,000 | | | | (84,352 | ) |
11/30/2017 | | Barclays Bank PLC | | | USD | | | | 2,149,681 | | | | RUB | | | | 126,000,000 | | | | (5,843 | ) |
11/30/2017 | | Barclays Bank PLC | | | USD | | | | 1,137,012 | | | | SEK | | | | 9,000,000 | | | | (59,970 | ) |
11/30/2017 | | Barclays Bank PLC | | | USD | | | | 3,969,962 | | | | TRY | | | | 14,206,658 | | | | (258,269 | ) |
11/30/2017 | | Barclays Bank PLC | | | USD | | | | 2,624,937 | | | | TWD | | | | 78,000,000 | | | | (33,187 | ) |
11/30/2017 | | Barclays Bank PLC | | | USD | | | | 1,976,225 | | | | ZAR | | | | 26,899,553 | | | | (83,956 | ) |
11/30/2017 | | Citigroup Global Markets Inc. | | | INR | | | | 290,000,000 | | | | USD | | | | 4,459,732 | | | | (9,197 | ) |
11/30/2017 | | Citigroup Global Markets Inc. | | | KRW | | | | 1,320,000,000 | | | | USD | | | | 1,167,780 | | | | (13,233 | ) |
11/30/2017 | | Citigroup Global Markets Inc. | | | USD | | | | 1,746,089 | | | | CAD | | | | 2,160,000 | | | | (71,320 | ) |
11/30/2017 | | Citigroup Global Markets Inc. | | | USD | | | | 1,183,232 | | | | COP | | | | 3,500,000,000 | | | | (35,911 | ) |
11/30/2017 | | Citigroup Global Markets Inc. | | | USD | | | | 2,903,321 | | | | CZK | | | | 63,000,000 | | | | (39,060 | ) |
11/30/2017 | | Citigroup Global Markets Inc. | | | USD | | | | 1,175,345 | | | | HUF | | | | 301,000,000 | | | | (47,603 | ) |
11/30/2017 | | Citigroup Global Markets Inc. | | | USD | | | | 2,903,238 | | | | PLN | | | | 10,500,000 | | | | (18,377 | ) |
11/30/2017 | | Citigroup Global Markets Inc. | | | USD | | | | 1,968,888 | | | | RUB | | | | 115,000,000 | | | | (12,210 | ) |
11/30/2017 | | Citigroup Global Markets Inc. | | | USD | | | | 2,738,121 | | | | ZAR | | | | 36,900,000 | | | | (142,363 | ) |
11/30/2017 | | Deutsche Bank Securities Inc. | | | USD | | | | 1,139,774 | | | | HUF | | | | 300,000,000 | | | | (15,779 | ) |
11/30/2017 | | Goldman Sachs International | | | CZK | | | | 25,000,000 | | | | USD | | | | 1,134,920 | | | | (1,691 | ) |
11/30/2017 | | Goldman Sachs International | | | USD | | | | 2,288,850 | | | | CNY | | | | 15,100,000 | | | | (17,114 | ) |
11/30/2017 | | Goldman Sachs International | | | USD | | | | 918,071 | | | | COP | | | | 2,700,000,000 | | | | (32,995 | ) |
11/30/2017 | | Goldman Sachs International | | | USD | | | | 1,197,269 | | | | JPY | | | | 132,000,000 | | | | (34,745 | ) |
11/30/2017 | | Goldman Sachs International | | | USD | | | | 4,733,020 | | | | MXN | | | | 87,000,000 | | | | (219,846 | ) |
11/30/2017 | | Goldman Sachs International | | | USD | | | | 2,021,833 | | | | TRY | | | | 7,400,000 | | | | (88,476 | ) |
11/30/2017 | | Morgan Stanley & Co. LLC | | | USD | | | | 853,242 | | | | COP | | | | 2,500,000,000 | | | | (33,727 | ) |
11/30/2017 | | Morgan Stanley & Co. LLC | | | USD | | | | 1,115,866 | | | | MXN | | | | 20,000,000 | | | | (78,355 | ) |
11/30/2017 | | Morgan Stanley & Co. LLC | | | USD | | | | 1,149,548 | | | | PLN | | | | 4,100,000 | | | | (23,078 | ) |
11/30/2017 | | Morgan Stanley & Co. LLC | | | USD | | | | 604,595 | | | | RUB | | | | 35,000,000 | | | | (9,084 | ) |
12/04/2017 | | Morgan Stanley & Co. LLC | | | USD | | | | 609,477 | | | | BRL | | | | 2,000,000 | | | | (818 | ) |
12/22/2017 | | Goldman Sachs International | | | TWD | | | | 65,000,000 | | | | USD | | | | 2,018,634 | | | | (144,056 | ) |
02/27/2018 | | Barclays Bank PLC | | | USD | | | | 666,667 | | | | EGP | | | | 12,000,000 | | | | (11,569 | ) |
Subtotal | | | | | | | | | | | | | | | | | | | | | (1,792,526 | ) |
Total Foreign Currency Contracts — Currency Risk | | | | | | | | | | | | | | | | | | $ | 305,820 | |
| | | | | | | | | | | | | | | | | | | | | | | | | | | | | | | | | | | | | | | | | | |
| Open Over-The-Counter Credit Default Swap Agreements | |
| Counterparty | | Reference Entity | | Buy/Sell
Protection | | | (Pay)/Receive
Fixed Rate | | | Payment
Frequency | | | Maturity Date | | | Implied
Credit
Spread(i) | | | Notional
Value | | | Upfront
Payments
Paid (Received) | | | Value | | | Unrealized
Appreciation | |
Barclays Bank PLC | | Republic of Turkey | | | Buy | | | | 1.00 | % | | | Quarterly | | | | 12/20/2022 | | | | 1.84 | % | | | USD | | | | (3,700,000 | ) | | $ | 141,867 | | | $ | 146,585 | | | $ | 4,718 | |
Goldman Sachs International | | Republic of South Africa | | | Buy | | | | 1.00 | | | | Quarterly | | | | 12/20/2022 | | | | 1.83 | | | | USD | | | | (4,000,000 | ) | | | 138,135 | | | | 157,322 | | | | 19,187 | |
Total Over-The-Counter Credit Default Swap Agreements — Credit Risk | | | $ | 280,002 | | | $ | 303,907 | | | $ | 23,905 | |
| (i) | Implied credit spreads represent the current level, as of October 31, 2017, at which protection could be bought or sold given the terms of the existing credit default swap agreement and serve as an indicator of the current status of the payment/performance risk of the credit default swap agreement. An implied credit spread that has widened or increased since entry into the initial agreement may indicate a deteriorating credit profile and increased risk of default for the reference entity. A declining or narrowing spread may indicate an improving credit profile or decreased risk of default for the reference entity. Alternatively, credit spreads may increase or decrease reflecting the general tolerance for risk in the credit markets generally. |
See accompanying Notes to Consolidated Financial Statements which are an integral part of the financial statements.
16 Invesco Emerging Markets Flexible Bond Fund
| | | | | | | | | | | | | | | | | | | | | | | | | | | | | | | | | | | | | | | | |
| | | Open Centrally Cleared Interest Rate Swap Agreements(j) | |
Pay/Receive
Floating Rate | | Floating Rate Index | | | Payment
Frequency | | | (Pay)/Receive
Fixed Rate | | | Payment
Frequency | | | Maturity Date | | | Notional Value | | | Upfront
Payments
Paid (Received) | | | Value | | | Unrealized
Appreciation
(Depreciation)(k) | |
Pay | | | 3 Month LIBOR | | | | Quarterly | | | | 2.49 | % | | | Semi-Annually | | | | 03/28/2028 | | | | USD | | | | 247,000 | | | $ | — | | | $ | 1,989 | | | $ | 1,989 | |
Pay | | | Overnight Brazil DI Rate | | | | At Maturity | | | | 8.51 | | | | At Maturity | | | | 01/02/2018 | | | | BRL | | | | 48,000,000 | | | | — | | | | 29,461 | | | | 29,461 | |
Subtotal | | | | | | | | | | | | | | | | | | | | | | | | — | | | | 31,450 | | | | 31,450 | |
Pay | | | 3 Month LIBOR | | | | Quarterly | | | | 2.37 | | | | Semi-Annually | | | | 03/28/2028 | | | | USD | | | | 259,000 | | | | — | | | | (629 | ) | | | (629 | ) |
Pay | | | 28 Day MXN TIIE | | | | 28 Day | | | | 6.72 | | | | 28 Day | | | | 06/23/2022 | | | | MXN | | | | 31,039,365 | | | | — | | | | (33,295 | ) | | | (33,295 | ) |
Pay | | | 3 Month LIBOR | | | | Quarterly | | | | 2.25 | | | | Semi-Annually | | | | 03/28/2028 | | | | USD | | | | 1,300,000 | | | | — | | | | (17,980 | ) | | | (17,980 | ) |
Receive | | | Overnight Brazil DI Rate | | | | At Maturity | | | | 8.38 | | | | At Maturity | | | | 01/02/2019 | | | | BRL | | | | (14,000,000 | ) | | | — | | | | (49,547 | ) | | | (49,547 | ) |
Receive | | | 6 Month BUBOR | | | | Half Yearly | | | | 2.42 | | | | Annually | | | | 08/21/2027 | | | | HUF | | | | (490,000,000 | ) | | | — | | | | (65,412 | ) | | | (65,412 | ) |
Subtotal | | | | — | | | | (166,863 | ) | | | (166,863 | ) |
Total Centrally Cleared Interest Rate Swap Agreements — Interest Rate Risk | | | $ | — | | | $ | (135,413 | ) | | $ | (135,413 | ) |
| (j) | Centrally cleared swap agreements collateralized by $265,000 cash held with Credit Suisse Securities (USA) LLC. |
| (k) | The daily variation margin receivable at period-end is recorded in the Consolidated Statement of Assets and Liabilities. |
Investment Abbreviations:
| | | | |
| | AUD | | | – Australian Dollar |
| | BRL | | | – Brazilian Real |
| | BUBOR | | | – Budapest Interbank Offered Rate |
| | CAD | | | – Canadian Dollar |
| | CHF | | | – Swiss Franc |
| | CLP | | | – Chilean Peso |
| | CNY | | | – Chinese Yuan |
| | COP | | | – Colombian Peso |
| | CZK | | | – Czech Koruna |
| | DI | | | – Interbank Deposit |
| | EGP | | | – Egyptian Pound |
| | EUR | | | – Euro |
| | HUF | | | – Hungarian Forint |
| | IDR | | | – Indonesian Rupiah |
| | INR | | | – Indian Rupee |
| | JPY | | | – Japanese Yen |
| | KRW | | | – South Korean Won |
| | LIBOR | | | – London Interbank Offered Rate |
| | MXN | | | – Mexican Peso |
| | PHP | | | – Philippine Peso |
| | PLN | | | – Poland Zloty |
| | RUB | | | – Russian Ruble |
| | SEK | | | – Swedish Krona |
| | TIIE | | | – Interbank Equilibrium Interest Rate |
| | TRY | | | – Turkish Lira |
| | TWD | | | – New Taiwan Dollar |
| | USD | | | – U.S. Dollar |
| | ZAR | | | – South African Rand |
| |
| | | | |
See accompanying Notes to Consolidated Financial Statements which are an integral part of the financial statements.
17 Invesco Emerging Markets Flexible Bond Fund
Consolidated Statement of Assets and Liabilities
October 31, 2017
| | | | |
Assets: | | | | |
Investments in securities, at value (Cost $47,750,976) | | $ | 49,180,414 | |
Investments in affiliated money market funds, at value and cost | | | 5,686,669 | |
Other investments: | | | | |
Variation margin receivable — futures | | | 5,704 | |
Variation margin receivable — centrally cleared swap agreements | | | 415 | |
Swaps receivable — Centrally Cleared | | | 142 | |
Swaps receivable — OTC | | | 8,361 | |
Premiums paid on swap agreements — OTC | | | 280,002 | |
Unrealized appreciation on forward foreign currency contracts outstanding | | | 2,098,346 | |
Unrealized appreciation on swap agreements — OTC (premiums paid (received) $280,002) | | | 23,905 | |
Cash | | | 652,830 | |
Deposits with brokers: | | | | |
Cash collateral — exchange-traded futures | | | 103,588 | |
Cash collateral — centrally cleared swap agreements | | | 265,000 | |
Foreign currencies, at value (Cost $249,766) | | | 248,112 | |
Receivable for: | | | | |
Investments sold | | | 917,955 | |
Fund shares sold | | | 4,164 | |
Dividends and interest | | | 819,185 | |
Fund expenses absorbed | | | 13,030 | |
Investment for trustee deferred compensation and retirement plans | | | 27,341 | |
Other assets | | | 41,054 | |
Total assets | | | 60,376,217 | |
| |
Liabilities: | | | | |
Other investments: | | | | |
Options written, at value (premiums received $38,411) | | | 37,453 | |
Swaps payable — Centrally Cleared | | | 136 | |
Swaps payable — OTC | | | 17,831 | |
Unrealized depreciation on forward foreign currency contracts outstanding | | | 1,792,526 | |
Payable for: | | | | |
Investments purchased | | | 530,252 | |
Fund shares reacquired | | | 2,351 | |
Accrued fees to affiliates | | | 6,915 | |
Accrued trustees’ and officers’ fees and benefits | | | 2,328 | |
Accrued other operating expenses | | | 72,087 | |
Trustee deferred compensation and retirement plans | | | 28,468 | |
Total liabilities | | | 2,490,347 | |
Net assets applicable to shares outstanding | | $ | 57,885,870 | |
| |
Net assets consist of: | | | | |
Shares of beneficial interest | | $ | 57,637,480 | |
Undistributed net investment income | | | 38,436 | |
Undistributed net realized gain (loss) | | | (1,358,867 | ) |
Net unrealized appreciation | | | 1,568,821 | |
| | | $ | 57,885,870 | |
| | | | |
Net Assets: | | | | |
Class A | | $ | 4,832,431 | |
Class B | | $ | 68,195 | |
Class C | | $ | 1,221,226 | |
Class R | | $ | 282,532 | |
Class Y | | $ | 1,976,967 | |
Class R5 | | $ | 6,860 | |
Class R6 | | $ | 49,497,659 | |
| |
Shares outstanding, no par value,
with an unlimited number of shares authorized: | | | | |
Class A | | | 720,212 | |
Class B | | | 10,168 | |
Class C | | | 181,925 | |
Class R | | | 42,158 | |
Class Y | | | 294,756 | |
Class R5 | | | 1,023 | |
Class R6 | | | 7,385,023 | |
Class A: | | | | |
Net asset value per share | | $ | 6.71 | |
Maximum offering price per share | | | | |
(Net asset value of $6.71 ¸ 95.75%) | | $ | 7.01 | |
Class B: | | | | |
Net asset value and offering price per share | | $ | 6.71 | |
Class C: | | | | |
Net asset value and offering price per share | | $ | 6.71 | |
Class R: | | | | |
Net asset value and offering price per share | | $ | 6.70 | |
Class Y: | | | | |
Net asset value and offering price per share | | $ | 6.71 | |
Class R5: | | | | |
Net asset value and offering price per share | | $ | 6.71 | |
Class R6: | | | | |
Net asset value and offering price per share | | $ | 6.70 | |
See accompanying Notes to Consolidated Financial Statements which are an integral part of the financial statements.
18 Invesco Emerging Markets Flexible Bond Fund
Consolidated Statement of Operations
For the year ended October 31, 2017
| | | | |
Investment income: | |
Interest (net of foreign withholding taxes of $67,475) | | $ | 3,986,456 | |
Dividends | | | 6,485 | |
Dividends from affiliated money market funds | | | 23,123 | |
Total investment income | | | 4,016,064 | |
| |
Expenses: | | | | |
Advisory fees | | | 464,862 | |
Administrative services fees | | | 50,000 | |
Custodian fees | | | 59,955 | |
Distribution fees: | | | | |
Class A | | | 11,343 | |
Class B | | | 772 | |
Class C | | | 11,780 | |
Class R | | | 1,335 | |
Transfer agent fees — A, B, C, R & Y | | | 24,856 | |
Transfer agent fees — R6 | | | 181 | |
Trustees’ and officers’ fees and benefits | | | 21,191 | |
Registration and filing fees | | | 89,636 | |
Reports to shareholders | | | 24,710 | |
Professional services fees | | | 72,218 | |
Other | | | 30,846 | |
Total expenses | | | 863,685 | |
Less: Fees waived, expenses reimbursed and expense offset arrangement(s) | | | (230,880 | ) |
Net expenses | | | 632,805 | |
Net investment income | | | 3,383,259 | |
| |
Realized and unrealized gain (loss) from: | | | | |
Net realized gain (loss) from: | | | | |
Investment securities | | | 2,415,420 | |
Foreign currencies | | | (124,993 | ) |
Forward foreign currency contracts | | | (1,758,113 | ) |
Futures contracts | | | 132,345 | |
Option contracts written | | | 22,349 | |
Swap agreements | | | (1,061,823 | ) |
| | | | (374,815 | ) |
Change in net unrealized appreciation (depreciation) of: | | | | |
Investment securities | | | 394,700 | |
Foreign currencies | | | (12,468 | ) |
Forward foreign currency contracts | | | 540,091 | |
Futures contracts | | | (170,233 | ) |
Option contracts written | | | 958 | |
Swap agreements | | | 325,536 | |
| | | | 1,078,584 | |
Net realized and unrealized gain | | | 703,769 | |
Net increase in net assets resulting from operations | | $ | 4,087,028 | |
See accompanying Notes to Consolidated Financial Statements which are an integral part of the financial statements.
19 Invesco Emerging Markets Flexible Bond Fund
Consolidated Statement of Changes in Net Assets
For the years ended October 31, 2017 and 2016
| | | | | | | | |
| | | 2017 | | | 2016 | |
Operations: | | | | | | | | |
Net investment income | | $ | 3,383,259 | | | $ | 2,669,690 | |
Net realized gain (loss) | | | (374,815 | ) | | | (12,112,677 | ) |
Change in net unrealized appreciation | | | 1,078,584 | | | | 10,940,289 | |
Net increase in net assets resulting from operations | | | 4,087,028 | | | | 1,497,302 | |
| | |
Distributions to shareholders from net investment income: | | | | | | | | |
Class A | | | (163,006 | ) | | | — | |
Class B | | | (2,408 | ) | | | — | |
Class C | | | (34,538 | ) | | | — | |
Class R | | | (9,158 | ) | | | — | |
Class Y | | | (46,029 | ) | | | — | |
Class R5 | | | (266 | ) | | | — | |
Class R6 | | | (2,155,646 | ) | | | — | |
Total distributions from net investment income | | | (2,411,051 | ) | | | — | |
| | |
Return of capital: | | | | | | | | |
Class A | | | — | | | | (225,952 | ) |
Class B | | | — | | | | (6,797 | ) |
Class C | | | — | | | | (37,979 | ) |
Class R | | | — | | | | (10,957 | ) |
Class Y | | | — | | | | (12,799 | ) |
Class R5 | | | — | | | | (284 | ) |
Class R6 | | | — | | | | (2,118,421 | ) |
Total return of capital | | | — | | | | (2,413,189 | ) |
| | |
Share transactions–net: | | | | | | | | |
Class A | | | (467,124 | ) | | | (865,850 | ) |
Class B | | | (54,285 | ) | | | (161,303 | ) |
Class C | | | (4,002 | ) | | | (141,744 | ) |
Class R | | | 11,179 | | | | (82,056 | ) |
Class Y | | | 1,593,643 | | | | 59,060 | |
Class R6 | | | (12,694,404 | ) | | | 23,922,971 | |
Net increase (decrease) in net assets resulting from share transactions | | | (11,614,993 | ) | | | 22,731,078 | |
Net increase (decrease) in net assets | | | (9,939,016 | ) | | | 21,815,191 | |
| | |
Net assets: | | | | | | | | |
Beginning of year | | | 67,824,886 | | | | 46,009,695 | |
End of year (includes undistributed net investment income of $38,436 and $9,583, respectively) | | $ | 57,885,870 | | | $ | 67,824,886 | |
Notes to Consolidated Financial Statements
October 31, 2017
NOTE 1—Significant Accounting Policies
Invesco Emerging Markets Flexible Bond Fund (the “Fund”) is a series portfolio of AIM Investment Funds (Invesco Investment Funds) (the “Trust”). The Trust is organized as a Delaware statutory trust and is registered under the Investment Company Act of 1940, as amended (the “1940 Act”), as an open-end series management investment company consisting of twenty separate series portfolios, each authorized to issue an unlimited number of shares of beneficial interest. The assets, liabilities and operations of each portfolio are accounted for separately. Information presented in these consolidated financial statements pertains only to the Fund. Matters affecting each portfolio or class will be voted on exclusively by the shareholders of such portfolio or class.
The Fund will seek to gain exposure to the commodity markets primarily through investments in the Invesco Emerging Markets Flexible Bond Cayman Ltd. (the “Subsidiary”), a wholly-owned subsidiary of the Fund organized under the laws of the Cayman Islands. The Subsidiary was organized by the Fund to invest in commodity-linked derivatives and other securities that may provide leveraged and non-leveraged exposure to commodities. The Fund may invest up to 25% of its total assets in the Subsidiary.
20 Invesco Emerging Markets Flexible Bond Fund
The Fund’s investment objective is total return through growth of capital and current income.
The Fund currently consists of seven different classes of shares: Class A, Class B, Class C, Class R, Class Y, Class R5 and Class R6. Class Y shares are available only to certain investors. Class A shares are sold with a front-end sales charge unless certain waiver criteria are met and under certain circumstances load waived shares may be subject to contingent deferred sales charges (“CDSC”). Class C shares are sold with a CDSC. Class R, Class Y, Class R5 and Class R6 shares are sold at net asset value. Effective November 30, 2010, new or additional investments in Class B shares are no longer permitted. Existing shareholders of Class B shares may continue to reinvest dividends and capital gains distributions in Class B shares until they convert to Class A shares. Also, shareholders in Class B shares will be able to exchange those shares for Class B shares of other Invesco Funds offering such shares until they convert to Class A shares. Generally, Class B shares will automatically convert to Class A shares on or about the month-end, which is at least eight years after the date of purchase. Redemption of Class B shares prior to the conversion date will be subject to a CDSC.
The Fund is an investment company and accordingly follows the investment company accounting and reporting guidance in accordance with Financial Accounting Standards Board Accounting Standards Codification Topic 946, Financial Services — Investment Companies.
The following is a summary of the significant accounting policies followed by the Fund in the preparation of its consolidated financial statements.
| A. | Security Valuations — Securities, including restricted securities, are valued according to the following policy. |
Debt obligations (including convertible securities) and unlisted equities are fair valued using an evaluated quote provided by an independent pricing service. Evaluated quotes provided by the pricing service may be determined without exclusive reliance on quoted prices, and may reflect appropriate factors such as institution-size trading in similar groups of securities, developments related to specific securities, dividend rate (for unlisted equities), yield (for debt obligations), quality, type of issue, coupon rate (for debt obligations), maturity (for debt obligations), individual trading characteristics and other market data. Pricing services generally value debt obligations assuming orderly transactions of institutional round lot size, but a fund may hold or transact in the same securities in smaller, odd lot sizes. Odd lots often trade at lower prices than institutional round lots. Debt obligations are subject to interest rate and credit risks. In addition, all debt obligations involve some risk of default with respect to interest and/or principal payments.
A security listed or traded on an exchange (except convertible securities) is valued at its last sales price or official closing price as of the close of the customary trading session on the exchange where the security is principally traded, or lacking any sales or official closing price on a particular day, the security may be valued at the closing bid price on that day. Securities traded in the over-the-counter market are valued based on prices furnished by independent pricing services or market makers. When such securities are valued by an independent pricing service they may be considered fair valued. Futures contracts are valued at the final settlement price set by an exchange on which they are principally traded. Listed options are valued at the mean between the last bid and asked prices from the exchange on which they are principally traded. Options not listed on an exchange are valued by an independent source at the mean between the last bid and asked prices. For purposes of determining net asset value (“NAV”) per share, futures and option contracts generally are valued 15 minutes after the close of the customary trading session of the New York Stock Exchange (“NYSE”).
Investments in open-end and closed-end registered investment companies that do not trade on an exchange are valued at the end-of-day net asset value per share. Investments in open-end and closed-end registered investment companies that trade on an exchange are valued at the last sales price or official closing price as of the close of the customary trading session on the exchange where the security is principally traded.
Swap agreements are fair valued using an evaluated quote, if available, provided by an independent pricing service. Evaluated quotes provided by the pricing service are valued based on a model which may include end-of-day net present values, spreads, ratings, industry, company performance and returns of referenced assets. Centrally cleared swap agreements are valued at the daily settlement price determined by the relevant exchange or clearinghouse.
Foreign securities’ (including foreign exchange contracts) prices are converted into U.S. dollar amounts using the applicable exchange rates as of the close of the NYSE. If market quotations are available and reliable for foreign exchange-traded equity securities, the securities will be valued at the market quotations. Because trading hours for certain foreign securities end before the close of the NYSE, closing market quotations may become unreliable. If between the time trading ends on a particular security and the close of the customary trading session on the NYSE, events occur that the investment adviser determines are significant and make the closing price unreliable, the Fund may fair value the security. If the event is likely to have affected the closing price of the security, the security will be valued at fair value in good faith using procedures approved by the Board of Trustees. Adjustments to closing prices to reflect fair value may also be based on a screening process of an independent pricing service to indicate the degree of certainty, based on historical data, that the closing price in the principal market where a foreign security trades is not the current value as of the close of the NYSE. Foreign securities’ prices meeting the approved degree of certainty that the price is not reflective of current value will be priced at the indication of fair value from the independent pricing service. Multiple factors may be considered by the independent pricing service in determining adjustments to reflect fair value and may include information relating to sector indices, American Depositary Receipts and domestic and foreign index futures. Foreign securities may have additional risks including exchange rate changes, potential for sharply devalued currencies and high inflation, political and economic upheaval, the relative lack of issuer information, relatively low market liquidity and the potential lack of strict financial and accounting controls and standards.
Securities for which market prices are not provided by any of the above methods may be valued based upon quotes furnished by independent sources. The last bid price may be used to value equity securities. The mean between the last bid and asked prices is used to value debt obligations, including corporate loans.
Securities for which market quotations are not readily available or became unreliable are valued at fair value as determined in good faith by or under the supervision of the Trust’s officers following procedures approved by the Board of Trustees. Issuer specific events, market trends, bid/asked quotes of brokers and information providers and other market data may be reviewed in the course of making a good faith determination of a security’s fair value.
The Fund may invest in securities that are subject to interest rate risk, meaning the risk that the prices will generally fall as interest rates rise and, conversely, the prices will generally rise as interest rates fall. Specific securities differ in their sensitivity to changes in interest rates depending on their individual characteristics. Changes in interest rates may result in increased market volatility, which may affect the value and/or liquidity of certain Fund investments.
Valuations change in response to many factors including the historical and prospective earnings of the issuer, the value of the issuer’s assets, general economic conditions, interest rates, investor perceptions and market liquidity. Because of the inherent uncertainties of valuation, the values reflected in the consolidated financial statements may materially differ from the value received upon actual sale of those investments.
21 Invesco Emerging Markets Flexible Bond Fund
| B. | Securities Transactions and Investment Income — Securities transactions are accounted for on a trade date basis. Realized gains or losses on sales are computed on the basis of specific identification of the securities sold. Interest income (net of withholding tax, if any) is recorded on the accrual basis from settlement date. Bond premiums and discounts are amortized and/or accreted over the lives of the respective securities. Pay-in-kind income received in the form of securities in-lieu of cash is recorded as interest income. Dividend income (net of withholding tax, if any) is recorded on the ex-dividend date. |
The Fund may periodically participate in litigation related to Fund investments. As such, the Fund may receive proceeds from litigation settlements. Any proceeds received are included in the Consolidated Statement of Operations as realized gain (loss) for investments no longer held and as unrealized gain (loss) for investments still held.
Brokerage commissions and mark ups are considered transaction costs and are recorded as an increase to the cost basis of securities purchased and/or a reduction of proceeds on a sale of securities. Such transaction costs are included in the determination of net realized and unrealized gain (loss) from investment securities reported in the Consolidated Statement of Operations and the Consolidated Statement of Changes in Net Assets and the net realized and unrealized gains (losses) on securities per share in the Financial Highlights. Transaction costs are included in the calculation of the Fund’s net asset value and, accordingly, they reduce the Fund’s total returns. These transaction costs are not considered operating expenses and are not reflected in net investment income reported in the Consolidated Statement of Operations and the Consolidated Statement of Changes in Net Assets, or the net investment income per share and the ratios of expenses and net investment income reported in the Financial Highlights, nor are they limited by any expense limitation arrangements between the Fund and the investment adviser.
The Fund allocates income and realized and unrealized capital gains and losses to a class based on the relative net assets of each class.
| C. | Country Determination — For the purposes of making investment selection decisions and presentation in the Consolidated Schedule of Investments, the investment adviser may determine the country in which an issuer is located and/or credit risk exposure based on various factors. These factors include the laws of the country under which the issuer is organized, where the issuer maintains a principal office, the country in which the issuer derives 50% or more of its total revenues and the country that has the primary market for the issuer’s securities, as well as other criteria. Among the other criteria that may be evaluated for making this determination are the country in which the issuer maintains 50% or more of its assets, the type of security, financial guarantees and enhancements, the nature of the collateral and the sponsor organization. Country of issuer and/or credit risk exposure has been determined to be the United States of America, unless otherwise noted. |
| D. | Distributions — Distributions from net investment income, if any, are declared and paid quarterly and are recorded on the ex-dividend date. Distributions from net realized capital gain, if any, are generally declared and paid annually and recorded on the ex-dividend date. |
| E. | Federal Income Taxes — The Fund intends to comply with the requirements of Subchapter M of the Internal Revenue Code of 1986, as amended (the “Internal Revenue Code”), necessary to qualify as a regulated investment company and to distribute substantially all of the Fund’s taxable earnings to shareholders. As such, the Fund will not be subject to federal income taxes on otherwise taxable income (including net realized capital gain) that is distributed to shareholders. Therefore, no provision for federal income taxes is recorded in the consolidated financial statements. |
The Fund recognizes the tax benefits of uncertain tax positions only when the position is more likely than not to be sustained. Management has analyzed the Fund’s uncertain tax positions and concluded that no liability for unrecognized tax benefits should be recorded related to uncertain tax positions. Management is not aware of any tax positions for which it is reasonably possible that the total amounts of unrecognized tax benefits will change materially in the next 12 months.
The Subsidiary is classified as a controlled foreign corporation under Subchapter N of the Internal Revenue Code. Therefore, the Fund is required to increase its taxable income by its share of the Subsidiary’s income. Net investment losses of the Subsidiary cannot be deducted by the Fund in the current period nor carried forward to offset taxable income in future periods.
The Fund files tax returns in the U.S. Federal jurisdiction and certain other jurisdictions. Generally the Fund is subject to examinations by such taxing authorities for up to three years after the filing of the return for the tax period.
| F. | Expenses — Fees provided for under the Rule 12b-1 plan of a particular class of the Fund are charged to the operations of such class. Transfer agency fees and expenses and other shareholder recordkeeping fees and expenses attributable to Class R5 and Class R6 are allocated to each share class based on relative net assets. Sub-accounting fees attributable to Class R5 are charged to the operations of the class. Transfer agency fees and expenses and other shareholder recordkeeping fees and expenses relating to all other classes are allocated among those classes based on relative net assets. All other expenses are allocated among the classes based on relative net assets. |
| G. | Accounting Estimates — The financial statements are prepared on a consolidated basis in conformity with accounting principles generally accepted in the United States of America (“GAAP”), which requires management to make estimates and assumptions that affect the reported amounts of assets and liabilities at the date of the financial statements and the reported amounts of revenues and expenses during the reporting period including estimates and assumptions related to taxation. Actual results could differ from those estimates by a significant amount. The accompanying financial statements reflect the financial position of the Fund and its Subsidiary and the results of operations on a consolidated basis. All inter-company accounts and transactions have been eliminated in consolidation. |
In addition, the Fund monitors for material events or transactions that may occur or become known after the period-end date and before the date the consolidated financial statements are released to print.
| H. | Indemnifications — Under the Trust’s organizational documents, each Trustee, officer, employee or other agent of the Trust, and under the Subsidiary’s organizational documents, the directors and officers of the Subsidiary, are indemnified against certain liabilities that may arise out of the performance of their duties to the Fund and/or the Subsidiary, respectively. Additionally, in the normal course of business, the Fund enters into contracts, including the Fund’s servicing agreements, that contain a variety of indemnification clauses. The Fund’s maximum exposure under these arrangements is unknown as this would involve future claims that may be made against the Fund that have not yet occurred. The risk of material loss as a result of such indemnification claims is considered remote. |
| I. | Structured Securities — The Fund may invest in structured securities. Structured securities are a type of derivative security whose value is determined by reference to changes in the value of underlying securities, currencies, interest rates, commodities, indices or other financial indicators (“reference instruments”). Most structured securities are fixed-income securities that have maturities of three years or less. Structured securities may be positively or negatively indexed (i.e., their principal value or interest rates may increase or decrease if the underlying reference instrument appreciates) and may have return characteristics similar to direct investments in the underlying reference instrument. |
22 Invesco Emerging Markets Flexible Bond Fund
Structured securities may entail a greater degree of market risk than other types of debt securities because the investor bears the risk of the reference instruments. In addition to the credit risk of structured securities and the normal risks of price changes in response to changes in interest rates, the principal amount of structured notes or indexed securities may decrease as a result of changes in the value of the underlying reference instruments. Changes in the daily value of structured securities are recorded as unrealized gains (losses) in the Consolidated Statement of Operations. When the structured securities mature or are sold, the Fund recognizes a realized gain (loss) on the Consolidated Statement of Operations.
| J. | Foreign Currency Translations — Foreign currency is valued at the close of the NYSE based on quotations posted by banks and major currency dealers. Portfolio securities and other assets and liabilities denominated in foreign currencies are translated into U.S. dollar amounts at date of valuation. Purchases and sales of portfolio securities (net of foreign taxes withheld on disposition) and income items denominated in foreign currencies are translated into U.S. dollar amounts on the respective dates of such transactions. The Fund does not separately account for the portion of the results of operations resulting from changes in foreign exchange rates on investments and the fluctuations arising from changes in market prices of securities held. The combined results of changes in foreign exchange rates and the fluctuation of market prices on investments (net of estimated foreign tax withholding) are included with the net realized and unrealized gain or loss from investments in the Consolidated Statement of Operations. Reported net realized foreign currency gains or losses arise from (1) sales of foreign currencies, (2) currency gains or losses realized between the trade and settlement dates on securities transactions, and (3) the difference between the amounts of dividends, interest, and foreign withholding taxes recorded on the Fund’s books and the U.S. dollar equivalent of the amounts actually received or paid. Net unrealized foreign currency gains and losses arise from changes in the fair values of assets and liabilities, other than investments in securities at fiscal period end, resulting from changes in exchange rates. |
The Fund may invest in foreign securities, which may be subject to foreign taxes on income, gains on investments or currency repatriation, a portion of which may be recoverable. Foreign taxes, if any, are recorded based on the tax regulations and rates that exist in the foreign markets in which the Fund invests and are shown in the Consolidated Statement of Operations.
| K. | Forward Foreign Currency Contracts — The Fund may engage in foreign currency transactions either on a spot (i.e. for prompt delivery and settlement) basis, or through forward foreign currency contracts, to manage or minimize currency or exchange rate risk. |
The Fund may also enter into forward foreign currency contracts for the purchase or sale of a security denominated in a foreign currency in order to “lock in” the U.S. dollar price of that security, or the Fund may also enter into forward foreign currency contracts that do not provide for physical settlement of the two currencies, but instead are settled by a single cash payment calculated as the difference between the agreed upon exchange rate and the spot rate at settlement based upon an agreed upon notional amount (non-deliverable forwards). The Fund will set aside liquid assets in an amount equal to the daily mark-to-market obligation for forward foreign currency contracts.
A forward foreign currency contract is an obligation between two parties (“Counterparties”) to purchase or sell a specific currency for an agreed-upon price at a future date. The use of forward foreign currency contracts does not eliminate fluctuations in the price of the underlying securities the Fund owns or intends to acquire but establishes a rate of exchange in advance. Fluctuations in the value of these contracts are measured by the difference in the contract date and reporting date exchange rates and are recorded as unrealized appreciation (depreciation) until the contracts are closed. When the contracts are closed, realized gains (losses) are recorded. Realized and unrealized gains (losses) on the contracts are included in the Consolidated Statement of Operations. The primary risks associated with forward foreign currency contracts include failure of the Counterparty to meet the terms of the contract and the value of the foreign currency changing unfavorably. These risks may be in excess of the amounts reflected in the Consolidated Statement of Assets and Liabilities.
| L. | Futures Contracts — The Fund may enter into futures contracts to equitize the Fund’s cash holdings or to manage exposure to interest rate, equity and market price movements and/or currency risks. A futures contract is an agreement between Counterparties to purchase or sell a specified underlying security, currency or commodity (or delivery of a cash settlement price, in the case of an index future) for a fixed price at a future date. The Fund currently invests only in exchange-traded futures and they are standardized as to maturity date and underlying financial instrument. Initial margin deposits required upon entering into futures contracts are satisfied by the segregation of specific securities or cash as collateral at the futures commission merchant (broker). During the period the futures contracts are open, changes in the value of the contracts are recognized as unrealized gains or losses by recalculating the value of the contracts on a daily basis. Subsequent or variation margin payments are received or made depending upon whether unrealized gains or losses are incurred. These amounts are reflected as receivables or payables on the Consolidated Statement of Assets and Liabilities. When the contracts are closed or expire, the Fund recognizes a realized gain or loss equal to the difference between the proceeds from, or cost of, the closing transaction and the Fund’s basis in the contract. The net realized gain (loss) and the change in unrealized gain (loss) on futures contracts held during the period is included on the Consolidated Statement of Operations. The primary risks associated with futures contracts are market risk and the absence of a liquid secondary market. If the Fund were unable to liquidate a futures contract and/or enter into an offsetting closing transaction, the Fund would continue to be subject to market risk with respect to the value of the contracts and continue to be required to maintain the margin deposits on the futures contracts. Futures contracts have minimal Counterparty risk since the exchange’s clearinghouse, as Counterparty to all exchange-traded futures, guarantees the futures against default. Risks may exceed amounts recognized in the Consolidated Statement of Assets and Liabilities. |
| M. | Call Options Purchased and Written — The Fund may write covered call options and/or buy call options. A covered call option gives the purchaser of such option the right to buy, and the writer the obligation to sell, the underlying security or foreign currency at the stated exercise price during the option period. Options written by the Fund normally will have expiration dates between three and nine months from the date written. The exercise price of a call option may be below, equal to, or above the current market value of the underlying security at the time the option is written. |
Additionally, the Fund may enter into an option on a swap agreement, also called a “swaption”. A swaption is an option that gives the buyer the right, but not the obligation, to enter into a swap on a future date in exchange for paying a market-based premium. A receiver swaption gives the owner the right to receive the total return of a specified asset, reference rate or index. Swaptions also include options that allow an existing swap to be terminated or extended by one of the Counterparties.
When the Fund writes a covered call option, an amount equal to the premium received by the Fund is recorded as an asset and an equivalent liability in the Consolidated Statement of Assets and Liabilities. The amount of the liability is subsequently “marked-to-market” to reflect the current market value of the option written. If a written covered call option expires on the stipulated expiration date, or if the Fund enters into a
23 Invesco Emerging Markets Flexible Bond Fund
closing purchase transaction, the Fund realizes a gain (or a loss if the closing purchase transaction exceeds the premium received when the option was written) without regard to any unrealized gain or loss on the underlying security, and the liability related to such option is extinguished. If a written covered call option is exercised, the Fund realizes a gain or a loss from the sale of the underlying security and the proceeds of the sale are increased by the premium originally received. Realized and unrealized gains and losses on call options written are included in the Consolidated Statement of Operations as Net realized gain (loss) from and Change in net unrealized appreciation (depreciation) of Option contracts written. A risk in writing a covered call option is that the Fund gives up the opportunity for profit if the market price of the security increases and the option is exercised.
When the Fund buys a call option, an amount equal to the premium paid by the Fund is recorded as an investment on the Consolidated Statement of Assets and Liabilities. The amount of the investment is subsequently “marked-to-market” to reflect the current value of the option purchased. Realized and unrealized gains and losses on call options purchased are included in the Consolidated Statement of Operations as Net realized gain (loss) from and Change in net unrealized appreciation (depreciation) of Investment securities. A risk in buying an option is that the Fund pays a premium whether or not the option is exercised. In addition, there can be no assurance that a liquid secondary market will exist for any option purchased.
| N. | Put Options Purchased and Written — The Fund may purchase and write put options including options on securities indexes, or foreign currency and/or futures contracts. By purchasing a put option, the Fund obtains the right (but not the obligation) to sell the option’s underlying instrument at a fixed strike price. In return for this right, the Fund pays an option premium. The option’s underlying instrument may be a security, securities index, or a futures contract. Put options may be used by the Fund to hedge securities it owns by locking in a minimum price at which the Fund can sell. If security prices fall, the put option could be exercised to offset all or a portion of the Fund’s resulting losses. At the same time, because the maximum the Fund has at risk is the cost of the option, purchasing put options does not eliminate the potential for the Fund to profit from an increase in the value of the underlying portfolio securities. The Fund may write put options to earn additional income in the form of option premiums if it expects the price of the underlying instrument to remain stable or rise during the option period so that the option will not be exercised. The risk in this strategy is that the price of the underlying securities may decline by an amount greater than the premium received. Put options written are reported as a liability in the Consolidated Statement of Assets and Liabilities. Realized and unrealized gains and losses on put options purchased and put options written are included in the Consolidated Statement of Operations as Net realized gain (loss) from and Change in net unrealized appreciation (depreciation) of Investment securities and Option contracts written, respectively. A risk in buying an option is that the Fund pays a premium whether or not the option is exercised. In addition, there can be no assurance that a liquid secondary market will exist for any option purchased. |
| O. | Swap Agreements — The Fund may enter into various swap transactions, including interest rate, total return, index, currency and credit default swap contracts (“CDS”) for investment purposes or to manage interest rate, currency or credit risk. Such transactions are agreements between Counterparties. A swap agreement may be negotiated bilaterally and traded over-the-counter (“OTC”) between two parties (“uncleared/OTC”) or, in some instances, must be transacted through a future commission merchant (“FCM”) and cleared through a clearinghouse that serves as a central Counterparty (“centrally cleared swap”). These agreements may contain among other conditions, events of default and termination events, and various covenants and representations such as provisions that require the Fund to maintain a pre-determined level of net assets, and/or provide limits regarding the decline of the Fund’s NAV over specific periods of time. If the Fund were to trigger such provisions and have open derivative positions at that time, the Counterparty may be able to terminate such agreement and request immediate payment in an amount equal to the net liability positions, if any. |
Interest rate, total return, index, and currency swap agreements are two-party contracts entered into primarily to exchange the returns (or differentials in rates of returns) earned or realized on particular predetermined investments or instruments. The gross returns to be exchanged or “swapped” between the parties are calculated with respect to a notional amount, i.e., the return on or increase in value of a particular dollar amount invested at a particular interest rate or return of an underlying asset, in a particular foreign currency, or in a “basket” of securities representing a particular index.
In a centrally cleared swap, the Fund’s ultimate Counterparty is a central clearinghouse. The Fund initially will enter into centrally cleared swaps through an executing broker. When a fund enters into a centrally cleared swap, it must deliver to the central Counterparty (via the FCM) an amount referred to as “initial margin.” Initial margin requirements are determined by the central Counterparty, but an FCM may require additional initial margin above the amount required by the central Counterparty. Initial margin deposits required upon entering into centrally cleared swaps are satisfied by cash or securities as collateral at the FCM. Securities deposited as initial margin are designated on the Consolidated Schedule of Investments and cash deposited is recorded on the Consolidated Statement of Assets and Liabilities. During the term of a cleared swap agreement, a “variation margin” amount may be required to be paid by the Fund or may be received by the Fund, based on the daily change in price of the underlying reference instrument subject to the swap agreement and is recorded as a receivable or payable for variation margin in the Consolidated Statement of Assets and Liabilities until the centrally cleared swap is terminated at which time a realized gain or loss is recorded.
A CDS is an agreement between Counterparties to exchange the credit risk of an issuer. A buyer of a CDS is said to buy protection by paying a fixed payment over the life of the agreement and in some situations an upfront payment to the seller of the CDS. If a defined credit event occurs (such as payment default or bankruptcy), the Fund as a protection buyer would cease paying its fixed payment, the Fund would deliver eligible bonds issued by the reference entity to the seller, and the seller would pay the full notional value, or the “par value”, of the referenced obligation to the Fund. A seller of a CDS is said to sell protection and thus would receive a fixed payment over the life of the agreement and an upfront payment, if applicable. If a credit event occurs, the Fund as a protection seller would cease to receive the fixed payment stream, the Fund would pay the buyer “par value” or the full notional value of the referenced obligation, and the Fund would receive the eligible bonds issued by the reference entity. In turn, these bonds may be sold in order to realize a recovery value. Alternatively, the seller of the CDS and its Counterparty may agree to net the notional amount and the market value of the bonds and make a cash payment equal to the difference to the buyer of protection. If no credit event occurs, the Fund receives the fixed payment over the life of the agreement. As the seller, the Fund would effectively add leverage to its portfolio because, in addition to its total net assets, the Fund would be subject to investment exposure on the notional amount of the CDS. In connection with these agreements, cash and securities may be identified as collateral in accordance with the terms of the respective swap agreements to provide assets of value and recourse in the event of default under the swap agreement or bankruptcy/insolvency of a party to the swap agreement. If a Counterparty becomes bankrupt or otherwise fails to perform its obligations due to financial difficulties, the
24 Invesco Emerging Markets Flexible Bond Fund
Fund may experience significant delays in obtaining any recovery in a bankruptcy or other reorganization proceeding. The Fund may obtain only limited recovery or may obtain no recovery in such circumstances. The Fund’s maximum risk of loss from Counterparty risk, either as the protection seller or as the protection buyer, is the value of the contract. The risk may be mitigated by having a master netting arrangement between the Fund and the Counterparty and by the designation of collateral by the Counterparty to cover the Fund’s exposure to the Counterparty.
Implied credit spreads represent the current level at which protection could be bought or sold given the terms of the existing CDS contract and serve as an indicator of the current status of the payment/performance risk of the CDS. An implied spread that has widened or increased since entry into the initial contract may indicate a deteriorating credit profile and increased risk of default for the reference entity. A declining or narrowing spread may indicate an improving credit profile or decreased risk of default for the reference entity. Alternatively, credit spreads may increase or decrease reflecting the general tolerance for risk in the credit markets.
An interest rate swap is an agreement between Counterparties pursuant to which the parties exchange a floating rate payment for a fixed rate payment based on a specified notional amount.
A total return swap is an agreement in which one party makes payments based on a set rate, either fixed or variable, while the other party makes payments based on the return of an underlying asset, which includes both the income generated and capital gains, if any. The unrealized appreciation (depreciation) on total return swaps includes dividends on the underlying securities and financing rate payable from the Counterparty. At the maturity date, a net cash flow is exchanged where the total return is equivalent to the return of the underlying reference less a financing rate, if any. As a receiver, the Fund would receive payments based on any positive total return and would owe payments in the event of a negative total return. As the payer, the Fund would owe payments on any net positive total return, and would receive payment in the event of a negative total return.
Changes in the value of centrally cleared and OTC swap agreements are recognized as unrealized gains (losses) in the Consolidated Statement of Operations by “marking to market” on a daily basis to reflect the value of the swap agreement at the end of each trading day. Payments received or paid at the beginning of the agreement are reflected as such on the Consolidated Statement of Assets and Liabilities and may be referred to as upfront payments. The Fund accrues for the fixed payment stream and amortizes upfront payments, if any, on swap agreements on a daily basis with the net amount, recorded as a component of realized gain (loss) on the Consolidated Statement of Operations. A liquidation payment received or made at the termination of a swap agreement is recorded as realized gain (loss) on the Consolidated Statement of Operations. The Fund segregates cash or liquid securities having a value at least equal to the amount of the potential obligation of a Fund under any swap transaction. Cash held as collateral is recorded as deposits with brokers on the Consolidated Statement of Assets and Liabilities. Entering into these agreements involves, to varying degrees, lack of liquidity and elements of credit, market, and Counterparty risk in excess of amounts recognized on the Consolidated Statement of Assets and Liabilities. Such risks involve the possibility that a swap is difficult to sell or liquidate; the Counterparty does not honor its obligations under the agreement and unfavorable interest rates and market fluctuations. It is possible that developments in the swaps market, including potential government regulation, could adversely affect the Fund’s ability to terminate existing swap agreements or to realize amounts to be received under such agreements. A short position in a security poses more risk than holding the same security long. As there is no limit on how much the price of the security can increase, the Fund’s exposure is unlimited.
Notional amounts of each individual credit default swap agreement outstanding as of October 31, 2017 for which the Fund is the seller of protection are disclosed in the open swap agreements table. These potential amounts would be partially offset by any recovery values of the respective referenced obligations, upfront payments received upon entering into the agreement, or net amounts received from the settlement of buy protection credit default swap agreements entered into by the Fund for the same referenced entity or entities.
| P. | Other Risks — The Fund will seek to gain exposure to commodity markets primarily through an investment in the Subsidiary and through investments in exchange-traded funds and commodity-linked derivatives. The Subsidiary, unlike the Fund, may invest without limitation in commodities, commodity-linked derivatives and other securities, such as exchange-traded and commodity-linked notes, that may provide leveraged and non-leveraged exposure to commodity markets. The Fund is indirectly exposed to the risks associated with the Subsidiary’s investments. |
The Fund is non-diversified and may invest in securities of fewer issuers than if it were diversified. Thus, the value of the Fund’s shares may vary more widely and the Fund may be subject to greater market and credit risk than if the Fund invested more broadly.
| Q. | Leverage Risk — Leverage exists when the Fund can lose more than it originally invests because it purchases or sells an instrument or enters into a transaction without investing an amount equal to the full economic exposure of the instrument or transaction. |
| R. | Collateral — To the extent the Fund has designated or segregated a security as collateral and that security is subsequently sold, it is the Fund’s practice to replace such collateral no later than the next business day. |
NOTE 2—Advisory Fees and Other Fees Paid to Affiliates
The Trust has entered into a master investment advisory agreement with Invesco Advisers, Inc. (the “Adviser” or “Invesco”). Under the terms of the investment advisory agreement, the Fund accrues daily and pays monthly an advisory fee to the Adviser based on the annual rate of the Fund’s average daily net assets as follows:
| | | | | | | | |
| Average Daily Net Assets | | Rate | |
First $500 million | | | 0 | .75% | | | | |
Next $500 million | | | 0 | .70% | | | | |
Next $500 million | | | 0 | .67% | | | | |
Over $1.5 billion | | | 0 | .65% | | | | |
For the year ended October 31, 2017, the effective advisory fees incurred by the Fund was 0.75%.
The Subsidiary has entered into a separate contract with the Adviser whereby the Adviser provides investment advisory and other services to the Subsidiary. In consideration of these services, the Subsidiary pays an advisory fee to the Adviser based on the annual rate of the Subsidiary’s average daily net assets as set forth in the table above.
25 Invesco Emerging Markets Flexible Bond Fund
Under the terms of a master sub-advisory agreement between the Adviser and each of Invesco Asset Management Deutschland GmbH, Invesco Asset Management Limited, Invesco Asset Management (Japan) Limited, Invesco Hong Kong Limited, Invesco Senior Secured Management, Inc. and Invesco Canada Ltd. and separate sub-advisory agreements with Invesco PowerShares Capital Management LLC and Invesco Asset Management (India) Private Limited (collectively, the “Affiliated Sub-Advisers”) the Adviser, not the Fund, will pay 40% of the fees paid to the Adviser to any such Affiliated Sub-Adviser(s) that provide(s) discretionary investment management services to the Fund based on the percentage of assets allocated to such Affiliated Sub-Adviser(s).
The Adviser has contractually agreed, through at least February 28, 2019, to waive advisory fees and/or reimburse expenses to the extent necessary to limit total annual fund operating expenses after fee waiver and/or expense reimbursement (excluding certain items discussed below) of Class A, Class B, Class C, Class R, Class Y, Class R5 and Class R6 shares to 1.24%, 1.99%, 1.99%, 1.49%, 0.99%, 0.99% and 0.99%, respectively, of the Fund’s average daily net assets (the “expense limits”). In determining the Adviser’s obligation to waive advisory fees and/or reimburse expenses, the following expenses are not taken into account, and could cause the total annual fund operating expenses after fee waiver and/or expense reimbursement to exceed the numbers reflected above: (1) interest; (2) taxes; (3) dividend expense on short sales; (4) extraordinary or non-routine items, including litigation expenses; and (5) expenses that the Fund has incurred but did not actually pay because of an expense offset arrangement. Acquired Fund Fees and Expenses are not operating expenses of the Fund directly, but are fees and expenses, including management fees, of the investment companies in which the Fund invests. As a result, the total annual fund operating expenses after expense reimbursement may exceed the expense limits above. Unless Invesco continues the fee waiver agreement, it will terminate on February 28, 2019. During its term, the fee waiver agreement cannot be terminated or amended to increase the expense limits or reduce the advisory fee waiver without approval of the Board of Trustees.
Further, the Adviser has contractually agreed, through at least June 30, 2019, to waive the advisory fee payable by the Fund in an amount equal to 100% of the net advisory fees the Adviser receives from the affiliated money market funds on investments by the Fund of uninvested cash in such affiliated money market funds.
For the year ended October 31, 2017, the Adviser waived advisory fees of $205,843 and reimbursed class level expenses of $15,521, $264, $4,030, $914, $3,727 and $181 of Class A, Class B, Class C, Class R, Class Y and Class R6 shares, respectively.
The Trust has entered into a master administrative services agreement with Invesco pursuant to which the Fund has agreed to pay Invesco for certain administrative costs incurred in providing accounting services to the Fund. For the year ended October 31, 2017, expenses incurred under the agreement are shown in the Consolidated Statement of Operations as Administrative services fees.
The Trust has entered into a transfer agency and service agreement with Invesco Investment Services, Inc. (“IIS”) pursuant to which the Fund has agreed to pay IIS a fee for providing transfer agency and shareholder services to the Fund and reimburse IIS for certain expenses incurred by IIS in the course of providing such services. IIS may make payments to intermediaries that provide omnibus account services, sub-accounting services and/or networking services. All fees payable by IIS to intermediaries that provide omnibus account services or sub-accounting services are charged back to the Fund, subject to certain limitations approved by the Trust’s Board of Trustees. For the year ended October 31, 2017, expenses incurred under the agreement are shown in the Consolidated Statement of Operations as Transfer agent fees.
The Trust has entered into master distribution agreements with Invesco Distributors, Inc. (“IDI”) to serve as the distributor for the Class A, Class B, Class C, Class R, Class Y, Class R5 and Class R6 shares of the Fund. The Trust has adopted plans pursuant to Rule 12b-1 under the 1940 Act with respect to the Fund’s Class A, Class B, Class C and Class R shares (collectively, the “Plans”). The Fund, pursuant to the Plans, pays IDI compensation at the annual rate of 0.25% of the Fund’s average daily net assets of Class A shares, 1.00% of the average daily net assets of Class B and Class C shares and 0.50% of the average daily net assets of Class R shares. The fees are accrued daily and paid monthly. Of the Plan payments, up to 0.25% of the average daily net assets of each class of shares may be paid to furnish continuing personal shareholder services to customers who purchase and own shares of such classes. Any amounts not paid as a service fee under the Plans would constitute an asset-based sales charge. Rules of the Financial Industry Regulatory Authority (“FINRA”) impose a cap on the total sales charges, including asset-based sales charges, that may be paid by any class of shares of the Fund. For the year ended October 31, 2017, expenses incurred under the Plans are shown in the Consolidated Statement of Operations as Distribution fees.
Front-end sales commissions and CDSC (collectively, the “sales charges”) are not recorded as expenses of the Fund. Front-end sales commissions are deducted from proceeds from the sales of Fund shares prior to investment in Class A shares of the Fund. CDSC are deducted from redemption proceeds prior to remittance to the shareholder. During the year ended October 31, 2017, IDI advised the Fund that IDI retained $982 in front-end sales commissions from the sale of Class A shares.
Certain officers and trustees of the Trust are officers and directors of the Adviser, IIS and/or IDI.
NOTE 3—Additional Valuation Information
GAAP defines fair value as the price that would be received to sell an asset or paid to transfer a liability in an orderly transaction between market participants at the measurement date, under current market conditions. GAAP establishes a hierarchy that prioritizes the inputs to valuation methods, giving the highest priority to readily available unadjusted quoted prices in an active market for identical assets (Level 1) and the lowest priority to significant unobservable inputs (Level 3), generally when market prices are not readily available or are unreliable. Based on the valuation inputs, the securities or other investments are tiered into one of three levels. Changes in valuation methods may result in transfers in or out of an investment’s assigned level:
| | Level 1 — | Prices are determined using quoted prices in an active market for identical assets. |
| | Level 2 — | Prices are determined using other significant observable inputs. Observable inputs are inputs that other market participants may use in pricing a security. These may include quoted prices for similar securities, interest rates, prepayment speeds, credit risk, yield curves, loss severities, default rates, discount rates, volatilities and others. |
| | Level 3 — | Prices are determined using significant unobservable inputs. In situations where quoted prices or observable inputs are unavailable (for example, when there is little or no market activity for an investment at the end of the period), unobservable inputs may be used. Unobservable inputs reflect the Fund’s own assumptions about the factors market participants would use in determining fair value of the securities or instruments and would be based on the best available information. |
26 Invesco Emerging Markets Flexible Bond Fund
The following is a summary of the tiered valuation input levels, as of October 31, 2017. The level assigned to the securities valuations may not be an indication of the risk or liquidity associated with investing in those securities. Because of the inherent uncertainties of valuation, the values reflected in the consolidated financial statements may materially differ from the value received upon actual sale of those investments.
The Fund’s policy is to recognize transfers in and out of the valuation levels as of the end of the reporting period. During the year ended October 31, 2017, there were no material transfers between valuation levels.
| | | | | | | | | | | | | | | | |
| | | Level 1 | | | Level 2 | | | Level 3 | | | Total | |
U.S. Dollar Denominated Bonds & Notes | | $ | — | | | $ | 32,001,560 | | | $ | — | | | $ | 32,001,560 | |
Non-U.S. Dollar Denominated Bonds & Notes | | | — | | | | 13,502,037 | | | | — | | | | 13,502,037 | |
Credit-Linked Securities | | | — | | | | 3,271,716 | | | | — | | | | 3,271,716 | |
Common Stocks | | | 319,500 | | | | — | | | | — | | | | 319,500 | |
Money Market Funds | | | 5,686,669 | | | | — | | | | — | | | | 5,686,669 | |
Options Purchased | | | — | | | | 85,601 | | | | — | | | | 85,601 | |
| | | | 6,006,169 | | | | 48,860,914 | | | | — | | | | 54,867,083 | |
Forward Foreign Currency Contracts* | | | — | | | | 305,820 | | | | — | | | | 305,820 | |
Futures Contracts* | | | (42,905 | ) | | | — | | | | — | | | | (42,905 | ) |
Options Written* | | | — | | | | (37,453 | ) | | | — | | | | (37,453 | ) |
Swap Agreements* | | | — | | | | (111,508 | ) | | | — | | | | (111,508 | ) |
Total Investments | | $ | 5,963,264 | | | $ | 49,017,773 | | | $ | — | | | $ | 54,981,037 | |
| * | Forward foreign currency contracts, futures contracts and swap agreements are valued at unrealized appreciation (depreciation). Options written are shown at value. |
NOTE 4—Derivative Investments
The Fund may enter into an International Swaps and Derivatives Association Master Agreement (“ISDA Master Agreement”) under which a fund may trade OTC derivatives. An OTC transaction entered into under an ISDA Master Agreement typically involves a collateral posting arrangement, payment netting provisions and close-out netting provisions. These netting provisions allow for reduction of credit risk through netting of contractual obligations. The enforceability of the netting provisions of the ISDA Master Agreement depends on the governing law of the ISDA Master Agreement, among other factors.
For financial reporting purposes, the Fund does not offset OTC derivative assets or liabilities that are subject to ISDA Master Agreements in the Consolidated Statement of Assets and Liabilities.
Value of Derivative Investments at Period-End
The table below summarizes the value of the Fund’s derivative investments, detailed by primary risk exposure, held as of October 31, 2017:
| | | | | | | | | | | | | | | | | | | | |
| | | Value | |
| Derivative Assets | | Commodity
Risk | | | Credit
Risk | | | Currency Risk | | | Interest
Rate Risk | | | Total | |
Unrealized appreciation on swap agreements — Centrally Cleared(a) | | $ | — | | | $ | — | | | $ | — | | | $ | 31,450 | | | $ | 31,450 | |
Unrealized appreciation on swap agreements — OTC | | | — | | | | 23,905 | | | | — | | | | — | | | | 23,905 | |
Options purchased, at value — OTC(b) | | | — | | | | — | | | | 26,921 | | | | 58,680 | | | | 85,601 | |
Unrealized appreciation on forward foreign currency contracts outstanding | | | — | | | | — | | | | 2,098,346 | | | | — | | | | 2,098,346 | |
Total Derivative Assets | | | — | | | | 23,905 | | | | 2,125,267 | | | | 90,130 | | | | 2,239,302 | |
Derivatives not subject to master netting agreements | | | — | | | | — | | | | — | | | | (31,450 | ) | | | (31,450 | ) |
Total Derivative Assets subject to master netting agreements | | $ | — | | | $ | 23,905 | | | $ | 2,125,267 | | | $ | 58,680 | | | $ | 2,207,852 | |
| | | | | | | | | | | | | | | | | | | | |
| | | Value | |
| Derivative Liabilities | | Commodity
Risk | | | Credit
Risk | | | Currency
Risk | | | Interest
Rate Risk | | | Total | |
Unrealized depreciation on futures contracts — Exchange-Traded(a) | | $ | (528 | ) | | $ | — | | | $ | — | | | $ | (42,377 | ) | | $ | (42,905 | ) |
Unrealized depreciation on swap agreements — Centrally Cleared(a) | | | — | | | | — | | | | — | | | | (166,863 | ) | | | (166,863 | ) |
Options written, at value — OTC | | | — | | | | — | | | | (37,453 | ) | | | — | | | | (37,453 | ) |
Unrealized depreciation on forward foreign currency contracts outstanding | | | — | | | | — | | | | (1,792,526 | ) | | | — | | | | (1,792,526 | ) |
Total Derivative Liabilities | | | (528 | ) | | | — | | | | (1,829,979 | ) | | | (209,240 | ) | | | (2,039,747 | ) |
Derivatives not subject to master netting agreements | | | 528 | | | | — | | | | — | | | | 209,240 | | | | 209,768 | |
Total Derivative Liabilities subject to master netting agreements | | $ | — | | | $ | — | | | $ | (1,829,979 | ) | | $ | — | | | $ | (1,829,979 | ) |
| (a) | The daily variation margin receivable at period-end is recorded in the Consolidated Statement of Assets and Liabilities. |
| (b) | Options purchased, at value, as reported in the Consolidated Schedule of Investments. |
27 Invesco Emerging Markets Flexible Bond Fund
Offsetting Assets and Liabilities
The table below reflects the Fund’s exposure to Counterparties subject to either an ISDA Master Agreement or other agreement for OTC derivative transactions as of October 31, 2017.
| | | | | | | | | | | | | | | | | | | | | | | | | | | | | | | | | | | | | | | | | | | | | | | | |
| | | Financial Derivative Assets | | | Financial Derivative Liabilities | | | | | | Collateral
(Received)/
Pledged | | | | |
| Counterparty | | Forward
Foreign
Currency
Contracts | | | Options
Purchased | | | Swap
Agreements | | | Total
Assets | | | Forward
Foreign
Currency
Contracts | | | Options
Written | | | Swap
Agreements | | | Total Liabilities | | | Net
Value of
Derivatives | | | Non-Cash | | | Cash | | | Net Amount | |
Parent | | | | | | | | | | | | | | | | | | | | | | | | | | | | | | | | | | | | | | | | | | | | | | | | |
Barclays Bank PLC | | $ | 411,652 | | | $ | — | | | $ | 154,946 | | | $ | 566,598 | | | $ | (683,898 | ) | | $ | — | | | $ | (17,831 | ) | | $ | (701,729 | ) | | $ | (135,131 | ) | | $ | — | | | $ | — | | | $ | (135,131 | ) |
Citigroup Global Markets Inc. | | | 325,099 | | | | 25,811 | | | | — | | | | 350,910 | | | | (389,274 | ) | | | (37,453 | ) | | | — | | | | (426,727 | ) | | | (75,817 | ) | | | — | | | | — | | | | (75,817 | ) |
Deutsche Bank Securities Inc. | | | 54,088 | | | | — | | | | — | | | | 54,088 | | | | (15,779 | ) | | | — | | | | — | | | | (15,779 | ) | | | 38,309 | | | | — | | | | — | | | | 38,309 | |
Goldman Sachs International | | | 1,025,093 | | | | 1,110 | | | | 157,322 | | | | 1,183,525 | | | | (538,923 | ) | | | — | | | | — | | | | (538,923 | ) | | | 644,602 | | | | — | | | | — | | | | 644,602 | |
Merrill Lynch International | | | 122,922 | | | | — | | | | — | | | | 122,922 | | | | — | | | | — | | | | — | | | | — | | | | 122,922 | | | | — | | | | — | | | | 122,922 | |
Morgan Stanley & Co. LLC | | | 159,492 | | | | 58,680 | | | | — | | | | 218,172 | | | | (164,652 | ) | | | — | | | | — | | | | (164,652 | ) | | | 53,520 | | | | — | | | | — | | | | 53,520 | |
Total | | $ | 2,098,346 | | | $ | 85,601 | | | $ | 312,268 | | | $ | 2,496,215 | | | $ | (1,792,526 | ) | | $ | (37,453 | ) | | $ | (17,831 | ) | | $ | (1,847,810 | ) | | $ | 648,405 | | | $ | — | | | $ | — | | | $ | 648,405 | |
Effect of Derivative Investments for the year ended October 31, 2017
The table below summarizes the gains (losses) on derivative investments, detailed by primary risk exposure, recognized in earnings during the period:
| | | | | | | | | | | | | | | | | | | | | | | | |
| | | Location of Gain (Loss) on Consolidated Statement of Operations | |
| | Commodity
Risk | | | Credit Risk | | | Currency Risk | | | Equity Risk | | | Interest
Rate Risk | | | Total | |
Realized Gain (Loss): | | | | | | | | | | | | | | | | | | | | | | | | |
Forward foreign currency contracts | | $ | — | | | $ | — | | | $ | (1,758,113 | ) | | $ | — | | | $ | — | | | $ | (1,758,113 | ) |
Futures contracts | | | 116,872 | | | | — | | | | — | | | | (32,203 | ) | | | 47,676 | | | | 132,345 | |
Options purchased(a) | | | — | | | | (38,067 | ) | | | (82,962 | ) | | | — | | | | (7,017 | ) | | | (128,046 | ) |
Options written | | | — | | | | 1,695 | | | | 20,654 | | | | — | | | | — | | | | 22,349 | |
Swap agreements | | | — | | | | (606,774 | ) | | | — | | | | (112,636 | ) | | | (342,413 | ) | | | (1,061,823 | ) |
Change in Net Unrealized Appreciation (Depreciation): | | | | | | | | | | | | | | | | | | | | | | | | |
Forward foreign currency contracts | | | — | | | | — | | | | 540,091 | | | | — | | | | — | | | | 540,091 | |
Futures contracts | | | (40,353 | ) | | | — | | | | — | | | | (28,629 | ) | | | (101,251 | ) | | | (170,233 | ) |
Options purchased(a) | | | — | | | | — | | | | (27,450 | ) | | | — | | | | 17,340 | | | | (10,110 | ) |
Options written | | | — | | | | — | | | | 958 | | | | — | | | | — | | | | 958 | |
Swap agreements | | | — | | | | 426,605 | | | | — | | | | 34,344 | | | | (135,413 | ) | | | 325,536 | |
Total | | $ | 76,519 | | | $ | (216,541 | ) | | $ | (1,306,822 | ) | | $ | (139,124 | ) | | $ | (521,078 | ) | | $ | (2,107,046 | ) |
| (a) | Options purchased are included in the net realized gain (loss) from investment securities and the change in net unrealized appreciation (depreciation) of investment securities. |
The table below summarizes the five-month average notional value of options written, the ten-month average notional value of futures contracts and the twelve-month average notional value of forward foreign currency contracts, options purchased and swap agreements.
| | | | | | | | | | | | | | | | | | | | |
| | | Forward
Foreign
Currency
Contracts | | | Futures
Contracts | | | Options
Purchased | | | Options
Written | | | Swap
Agreements | |
Average notional value | | $ | 102,931,807 | | | $ | 3,837,409 | | | $ | 119,319,421 | | | $ | 2,100,326 | | | $ | 21,907,181 | |
NOTE 5—Expense Offset Arrangement(s)
The expense offset arrangement is comprised of transfer agency credits which result from balances in demand deposit accounts used by the transfer agent for clearing shareholder transactions. For the year ended October 31, 2017, the Fund received credits from this arrangement, which resulted in the reduction of the Fund’s total expenses of $400.
28 Invesco Emerging Markets Flexible Bond Fund
NOTE 6—Trustees’ and Officers’ Fees and Benefits
Trustees’ and Officers’ Fees and Benefits include amounts accrued by the Fund to pay remuneration to certain Trustees and Officers of the Fund. Trustees have the option to defer compensation payable by the Fund, and Trustees’ and Officers’ Fees and Benefits also include amounts accrued by the Fund to fund such deferred compensation amounts. Those Trustees who defer compensation have the option to select various Invesco Funds in which their deferral accounts shall be deemed to be invested. Finally, certain current Trustees were eligible to participate in a retirement plan that provided for benefits to be paid upon retirement to Trustees over a period of time based on the number of years of service. The Fund may have certain former Trustees who also participate in a retirement plan and receive benefits under such plan. Trustees’ and Officers’ Fees and Benefits include amounts accrued by the Fund to fund such retirement benefits. Obligations under the deferred compensation and retirement plans represent unsecured claims against the general assets of the Fund.
NOTE 7—Cash Balances
The Fund is permitted to temporarily carry a negative or overdrawn balance in its account with State Street Bank and Trust Company, the custodian bank. Such balances, if any at period-end, are shown in the Consolidated Statement of Assets and Liabilities under the payable caption Amount due custodian. To compensate the custodian bank for such overdrafts, the overdrawn Fund may either (1) leave funds as a compensating balance in the account so the custodian bank can be compensated by earning the additional interest; or (2) compensate by paying the custodian bank at a rate agreed upon by the custodian bank and Invesco, not to exceed the contractually agreed upon rate.
NOTE 8—Distributions to Shareholders and Tax Components of Net Assets
Tax Character of Distributions to Shareholders Paid During the Fiscal Years Ended October 31, 2017 and 2016:
| | | | | | | | |
| | | 2017 | | | 2016 | |
Ordinary income | | $ | 2,411,051 | | | $ | — | |
Return of capital | | | — | | | | 2,413,189 | |
Total distributions | | $ | 2,411,051 | | | $ | 2,413,189 | |
Tax Components of Net Assets at Period-End:
| | | | |
| | | 2017 | |
Undistributed ordinary income | | $ | 886,199 | |
Net unrealized appreciation — investments | | | 1,114,567 | |
Net unrealized appreciation (depreciation) — foreign currencies | | | (12,984 | ) |
Temporary book/tax differences | | | (25,597 | ) |
Capital loss carryforward | | | (1,713,795 | ) |
Shares of beneficial interest | | | 57,637,480 | |
Total net assets | | $ | 57,885,870 | |
The difference between book-basis and tax-basis unrealized appreciation (depreciation) is due to differences in the timing of recognition of gains and losses on investments for tax and book purposes. The Fund’s net unrealized appreciation difference is attributable primarily to foreign currency contracts.
The temporary book/tax differences are a result of timing differences between book and tax recognition of income and/or expenses. The Fund’s temporary book/tax differences are the result of the trustee deferral of compensation and retirement plan benefits.
Capital loss carryforward is calculated and reported as of a specific date. Results of transactions and other activity after that date may affect the amount of capital loss carryforward actually available for the Fund to utilize. Capital losses generated in years beginning after December 22, 2010 can be carried forward for an unlimited period, whereas previous losses expire in eight tax years. Capital losses with an expiration period may not be used to offset capital gains until all net capital losses without an expiration date have been utilized. Capital loss carryforwards with no expiration date will retain their character as either short-term or long-term capital losses instead of as short-term capital losses as under prior law. The ability to utilize capital loss carryforwards in the future may be limited under the Internal Revenue Code and related regulations based on the results of future transactions.
The Fund has a capital loss carryforward as of October 31, 2017, as follows:
| | | | | | | | | | | | |
| Capital Loss Carryforward* | |
| Expiration | | Short-Term | | | Long-Term | | | Total | |
Not subject to expiration | | $ | — | | | $ | 1,713,795 | | | $ | 1,713,795 | |
| * | Capital loss carryforward as of the date listed above is reduced for limitations, if any, to the extent required by the Internal Revenue Code and may be further limited depending upon a variety of factors, including the realization of net unrealized gains or losses as of the date of any reorganization. |
29 Invesco Emerging Markets Flexible Bond Fund
NOTE 9—Investment Transactions
The aggregate amount of investment securities (other than short-term securities, U.S. Treasury obligations and money market funds, if any) purchased and sold by the Fund during the year ended October 31, 2017 was $136,680,986 and $144,690,495, respectively. During the same period, purchases and sales of U.S. Treasury obligations were $0 and $1,778,594, respectively. Cost of investments, including any derivatives, on a tax basis includes the adjustments for financial reporting purposes as of the most recently completed federal income tax reporting period-end.
| | | | |
| Unrealized Appreciation (Depreciation) of Investments on a Tax Basis | |
Aggregate unrealized appreciation of investments | | $ | 3,405,739 | |
Aggregate unrealized (depreciation) of investments | | | (2,291,172 | ) |
Net unrealized appreciation of investments | | $ | 1,114,567 | |
Cost of investments for tax purposes is $54,146,472.
NOTE 10—Reclassification of Permanent Differences
Primarily as a result of differing book/tax treatment of swap income and foreign currency transactions, on October 31, 2017, undistributed net investment income was decreased by $943,355, undistributed net realized gain (loss) was increased by $1,009,738 and shares of beneficial interest was decreased by $66,383. This reclassification had no effect on the net assets of the Fund.
NOTE 11—Share Information
| | | | | | | | | | | | | | | | |
| | | Summary of Share Activity | |
| | | Years ended October 31, | |
| | | 2017(a) | | | 2016 | |
| | | Shares | | | Amount | | | Shares | | | Amount | |
Sold: | | | | | | | | | | | | | | | | |
Class A | | | 231,935 | | | $ | 1,537,198 | | | | 143,177 | | | $ | 928,190 | |
Class B | | | 4,146 | | | | 27,896 | | | | — | | | | — | |
Class C | | | 57,250 | | | | 378,197 | | | | 35,582 | | | | 232,573 | |
Class R | | | 5,432 | | | | 35,646 | | | | 2,927 | | | | 18,832 | |
Class Y | | | 319,698 | | | | 2,114,044 | | | | 58,493 | | | | 379,745 | |
Class R6(b) | | | 2,029 | | | | 13,232 | | | | 4,090,830 | | | | 25,979,109 | |
| | | | |
Issued as reinvestment of dividends: | | | | | | | | | | | | | | | | |
Class A | | | 19,843 | | | | 130,341 | | | | 28,963 | | | | 185,353 | |
Class B | | | 320 | | | | 2,095 | | | | 1,048 | | | | 6,690 | |
Class C | | | 4,072 | | | | 26,779 | | | | 4,497 | | | | 28,821 | |
Class R | | | 1,353 | | | | 8,886 | | | | 1,675 | | | | 10,710 | |
Class Y | | | 4,509 | | | | 29,792 | | | | 1,801 | | | | 11,513 | |
Class R6 | | | 329,038 | | | | 2,155,646 | | | | 331,014 | | | | 2,118,421 | |
| | | | |
Automatic conversion of Class B shares to Class A shares: | | | | | | | | | | | | | | | | |
Class A | | | 8,303 | | | | 54,831 | | | | 20,241 | | | | 130,337 | |
Class B | | | (8,306 | ) | | | (54,831 | ) | | | (20,247 | ) | | | (130,337 | ) |
| | | | |
Reacquired: | | | | | | | | | | | | | | | | |
Class A | | | (332,849 | ) | | | (2,189,494 | ) | | | (326,629 | ) | | | (2,109,730 | ) |
Class B | | | (4,555 | ) | | | (29,445 | ) | | | (5,922 | ) | | | (37,656 | ) |
Class C | | | (62,177 | ) | | | (408,978 | ) | | | (61,797 | ) | | | (403,138 | ) |
Class R | | | (5,144 | ) | | | (33,353 | ) | | | (17,762 | ) | | | (111,598 | ) |
Class Y | | | (83,659 | ) | | | (550,193 | ) | | | (50,921 | ) | | | (332,198 | ) |
Class R6(c) | | | (2,245,209 | ) | | | (14,863,282 | ) | | | (645,466 | ) | | | (4,174,559 | ) |
Net increase (decrease) in share activity | | | (1,753,971 | ) | | $ | (11,614,993 | ) | | | 3,591,504 | | | $ | 22,731,078 | |
| (a) | 85% of the outstanding shares of the Fund are owned by the Adviser or an affiliate of the Adviser. |
| (b) | On February 18, 2016, 3,744,455 Class R6 shares valued at $23,739,847 were sold to affiliated mutual funds. |
| (c) | On May 1, 2017, 1,545,008 Class R6 shares valued at $10,243,403 were redeemed by affiliated mutual funds. |
30 Invesco Emerging Markets Flexible Bond Fund
NOTE 12—Financial Highlights
The following schedule presents financial highlights for a share of the Fund outstanding throughout the periods indicated.
| | | | | | | | | | | | | | | | | | | | | | | | | | | | | | | | | | | | | | | | | | | | | | | | | | | | | | | | |
| | | Net asset
value,
beginning
of period | | | Net
investment
income(a) | | | Net gains
(losses)
on securities
(both
realized and
unrealized) | | | Total from
investment
operations | | | Dividends
from net
investment
income | | | Return of
capital | | | Total
distributions | | | Net asset
value, end
of period | | | Total
return(b) | | | Net assets,
end of period
(000’s omitted) | | | Ratio of
expenses
to average
net assets
with fee waivers
and/or expenses
absorbed | | | Ratio of
expenses
to average net
assets without
fee waivers
and/or expenses
absorbed | | | Ratio of net
investment
income
to average
net assets | | | Portfolio
turnover(c) | |
Class A | | | | | | | | | | | | | | | | | | | | | | | | | | | | | | | | | | | | | | | | | | | | | | | | | | | | | | | | |
Year ended 10/31/17 | | $ | 6.53 | | | $ | 0.35 | | | $ | 0.07 | | | $ | 0.42 | | | $ | (0.24 | ) | | $ | — | | | $ | (0.24 | ) | | $ | 6.71 | | | | 6.62 | % | | $ | 4,832 | | | | 1.23 | %(d) | | | 1.91 | %(d) | | | 5.25 | %(d) | | | 245 | % |
Year ended 10/31/16 | | | 6.77 | | | | 0.27 | | | | (0.25 | ) | | | 0.02 | | | | — | | | | (0.26 | ) | | | (0.26 | ) | | | 6.53 | | | | 0.45 | | | | 5,182 | | | | 1.23 | | | | 1.91 | | | | 4.16 | | | | 266 | |
Year ended 10/31/15 | | | 8.49 | | | | 0.41 | | | | (1.76 | ) | | | (1.35 | ) | | | — | | | | (0.37 | ) | | | (0.37 | ) | | | 6.77 | | | | (16.20 | ) | | | 6,282 | | | | 1.24 | | | | 1.89 | | | | 5.46 | | | | 50 | |
Year ended 10/31/14 | | | 9.17 | | | | 0.46 | | | | (0.77 | ) | | | (0.31 | ) | | | (0.06 | ) | | | (0.31 | ) | | | (0.37 | ) | | | 8.49 | | | | (3.44 | ) | | | 9,379 | | | | 1.24 | | | | 1.84 | | | | 5.29 | | | | 69 | |
Year ended 10/31/13 | | | 9.88 | | | | 0.48 | | | | (0.79 | ) | | | (0.31 | ) | | | (0.29 | ) | | | (0.11 | ) | | | (0.40 | ) | | | 9.17 | | | | (3.25 | ) | | | 12,998 | | | | 1.24 | | | | 1.77 | | | | 4.96 | | | | 31 | |
Class B | | | | | | | | | | | | | | | | | | | | | | | | | | | | | | | | | | | | | | | | | | | | | | | | | | | | | | | | |
Year ended 10/31/17 | | | 6.53 | | | | 0.30 | | | | 0.07 | | | | 0.37 | | | | (0.19 | ) | | | — | | | | (0.19 | ) | | | 6.71 | | | | 5.82 | | | | 68 | | | | 1.98 | (d) | | | 2.66 | (d) | | | 4.50 | (d) | | | 245 | |
Year ended 10/31/16 | | | 6.77 | | | | 0.22 | | | | (0.25 | ) | | | (0.03 | ) | | | — | | | | (0.21 | ) | | | (0.21 | ) | | | 6.53 | | | | (0.37 | ) | | | 121 | | | | 1.98 | | | | 2.66 | | | | 3.41 | | | | 266 | |
Year ended 10/31/15 | | | 8.48 | | | | 0.35 | | | | (1.75 | ) | | | (1.40 | ) | | | — | | | | (0.31 | ) | | | (0.31 | ) | | | 6.77 | | | | (16.72 | ) | | | 296 | | | | 1.99 | | | | 2.64 | | | | 4.71 | | | | 50 | |
Year ended 10/31/14 | | | 9.16 | | | | 0.40 | | | | (0.78 | ) | | | (0.38 | ) | | | (0.05 | ) | | | (0.25 | ) | | | (0.30 | ) | | | 8.48 | | | | (4.17 | ) | | | 349 | | | | 1.99 | | | | 2.59 | | | | 4.54 | | | | 69 | |
Year ended 10/31/13 | | | 9.87 | | | | 0.41 | | | | (0.79 | ) | | | (0.38 | ) | | | (0.22 | ) | | | (0.11 | ) | | | (0.33 | ) | | | 9.16 | | | | (3.98 | ) | | | 570 | | | | 1.99 | | | | 2.52 | | | | 4.21 | | | | 31 | |
Class C | | | | | | | | | | | | | | | | | | | | | | | | | | | | | | | | | | | | | | | | | | | | | | | | | | | | | | | | |
Year ended 10/31/17 | | | 6.54 | | | | 0.30 | | | | 0.06 | | | | 0.36 | | | | (0.19 | ) | | | — | | | | (0.19 | ) | | | 6.71 | | | | 5.66 | | | | 1,221 | | | | 1.98 | (d) | | | 2.66 | (d) | | | 4.50 | (d) | | | 245 | |
Year ended 10/31/16 | | | 6.77 | | | | 0.22 | | | | (0.24 | ) | | | (0.02 | ) | | | — | | | | (0.21 | ) | | | (0.21 | ) | | | 6.54 | | | | (0.21 | ) | | | 1,195 | | | | 1.98 | | | | 2.66 | | | | 3.41 | | | | 266 | |
Year ended 10/31/15 | | | 8.49 | | | | 0.35 | | | | (1.75 | ) | | | (1.40 | ) | | | — | | | | (0.32 | ) | | | (0.32 | ) | | | 6.77 | | | | (16.82 | ) | | | 1,385 | | | | 1.99 | | | | 2.64 | | | | 4.71 | | | | 50 | |
Year ended 10/31/14 | | | 9.17 | | | | 0.40 | | | | (0.78 | ) | | | (0.38 | ) | | | (0.05 | ) | | | (0.25 | ) | | | (0.30 | ) | | | 8.49 | | | | (4.16 | ) | | | 2,244 | | | | 1.99 | | | | 2.59 | | | | 4.54 | | | | 69 | |
Year ended 10/31/13 | | | 9.88 | | | | 0.41 | | | | (0.79 | ) | | | (0.38 | ) | | | (0.22 | ) | | | (0.11 | ) | | | (0.33 | ) | | | 9.17 | | | | (3.97 | ) | | | 3,532 | | | | 1.99 | | | | 2.52 | | | | 4.21 | | | | 31 | |
Class R | | | | | | | | | | | | | | | | | | | | | | | | | | | | | | | | | | | | | | | | | | | | | | | | | | | | | | | | |
Year ended 10/31/17 | | | 6.53 | | | | 0.33 | | | | 0.07 | | | | 0.40 | | | | (0.23 | ) | | | — | | | | (0.23 | ) | | | 6.70 | | | | 6.20 | | | | 283 | | | | 1.48 | (d) | | | 2.16 | (d) | | | 5.00 | (d) | | | 245 | |
Year ended 10/31/16 | | | 6.76 | | | | 0.25 | | | | (0.24 | ) | | | 0.01 | | | | — | | | | (0.24 | ) | | | (0.24 | ) | | | 6.53 | | | | 0.33 | | | | 264 | | | | 1.48 | | | | 2.16 | | | | 3.91 | | | | 266 | |
Year ended 10/31/15 | | | 8.48 | | | | 0.39 | | | | (1.76 | ) | | | (1.37 | ) | | | — | | | | (0.35 | ) | | | (0.35 | ) | | | 6.76 | | | | (16.43 | ) | | | 363 | | | | 1.49 | | | | 2.14 | | | | 5.21 | | | | 50 | |
Year ended 10/31/14 | | | 9.17 | | | | 0.44 | | | | (0.78 | ) | | | (0.34 | ) | | | (0.06 | ) | | | (0.29 | ) | | | (0.35 | ) | | | 8.48 | | | | (3.79 | ) | | | 460 | | | | 1.49 | | | | 2.09 | | | | 5.04 | | | | 69 | |
Year ended 10/31/13 | | | 9.87 | | | | 0.46 | | | | (0.78 | ) | | | (0.32 | ) | | | (0.27 | ) | | | (0.11 | ) | | | (0.38 | ) | | | 9.17 | | | | (3.39 | ) | | | 776 | | | | 1.49 | | | | 2.02 | | | | 4.71 | | | | 31 | |
Class Y | | | | | | | | | | | | | | | | | | | | | | | | | | | | | | | | | | | | | | | | | | | | | | | | | | | | | | | | |
Year ended 10/31/17 | | | 6.53 | | | | 0.36 | | | | 0.08 | | | | 0.44 | | | | (0.26 | ) | | | — | | | | (0.26 | ) | | | 6.71 | | | | 6.89 | | | | 1,977 | | | | 0.98 | (d) | | | 1.66 | (d) | | | 5.50 | (d) | | | 245 | |
Year ended 10/31/16 | | | 6.77 | | | | 0.29 | | | | (0.25 | ) | | | 0.04 | | | | — | | | | (0.28 | ) | | | (0.28 | ) | | | 6.53 | | | | 0.72 | | | | 354 | | | | 0.98 | | | | 1.66 | | | | 4.41 | | | | 266 | |
Year ended 10/31/15 | | | 8.49 | | | | 0.45 | | | | (1.78 | ) | | | (1.33 | ) | | | — | | | | (0.39 | ) | | | (0.39 | ) | | | 6.77 | | | | (15.99 | ) | | | 304 | | | | 0.99 | | | | 1.64 | | | | 5.71 | | | | 50 | |
Year ended 10/31/14 | | | 9.17 | | | | 0.49 | | | | (0.78 | ) | | | (0.29 | ) | | | (0.06 | ) | | | (0.33 | ) | | | (0.39 | ) | | | 8.49 | | | | (3.20 | ) | | | 2,911 | | | | 0.99 | | | | 1.59 | | | | 5.54 | | | | 69 | |
Year ended 10/31/13 | | | 9.88 | | | | 0.51 | | | | (0.79 | ) | | | (0.28 | ) | | | (0.32 | ) | | | (0.11 | ) | | | (0.43 | ) | | | 9.17 | | | | (3.01 | ) | | | 1,529 | | | | 0.99 | | | | 1.52 | | | | 5.21 | | | | 31 | |
Class R5 | | | | | | | | | | | | | | | | | | | | | | | | | | | | | | | | | | | | | | | | | | | | | | | | | | | | | | | | |
Year ended 10/31/17 | | | 6.53 | | | | 0.36 | | | | 0.08 | | | | 0.44 | | | | (0.26 | ) | | | — | | | | (0.26 | ) | | | 6.71 | | | | 6.89 | | | | 7 | | | | 0.98 | (d) | | | 1.31 | (d) | | | 5.50 | (d) | | | 245 | |
Year ended 10/31/16 | | | 6.77 | | | | 0.29 | | | | (0.25 | ) | | | 0.04 | | | | — | | | | (0.28 | ) | | | (0.28 | ) | | | 6.53 | | | | 0.72 | | | | 7 | | | | 0.98 | | | | 1.28 | | | | 4.41 | | | | 266 | |
Year ended 10/31/15 | | | 8.48 | | | | 0.45 | | | | (1.77 | ) | | | (1.32 | ) | | | — | | | | (0.39 | ) | | | (0.39 | ) | | | 6.77 | | | | (15.89 | ) | | | 7 | | | | 0.99 | | | | 1.34 | | | | 5.71 | | | | 50 | |
Year ended 10/31/14 | | | 9.16 | | | | 0.49 | | | | (0.78 | ) | | | (0.29 | ) | | | (0.06 | ) | | | (0.33 | ) | | | (0.39 | ) | | | 8.48 | | | | (3.20 | ) | | | 186 | | | | 0.99 | | | | 1.31 | | | | 5.54 | | | | 69 | |
Year ended 10/31/13 | | | 9.87 | | | | 0.51 | | | | (0.79 | ) | | | (0.28 | ) | | | (0.32 | ) | | | (0.11 | ) | | | (0.43 | ) | | | 9.16 | | | | (3.01 | ) | | | 291 | | | | 0.99 | | | | 1.36 | | | | 5.21 | | | | 31 | |
Class R6 | | | | | | | | | | | | | | | | | | | | | | | | | | | | | | | | | | | | | | | | | | | | | | | | | | | | | | | | |
Year ended 10/31/17 | | | 6.53 | | | | 0.36 | | | | 0.07 | | | | 0.43 | | | | (0.26 | ) | | | — | | | | (0.26 | ) | | | 6.70 | | | | 6.73 | | | | 49,498 | | | | 0.98 | (d) | | | 1.31 | (d) | | | 5.50 | (d) | | | 245 | |
Year ended 10/31/16 | | | 6.77 | | | | 0.29 | | | | (0.25 | ) | | | 0.04 | | | | — | | | | (0.28 | ) | | | (0.28 | ) | | | 6.53 | | | | 0.73 | | | | 60,702 | | | | 0.98 | | | | 1.28 | | | | 4.41 | | | | 266 | |
Year ended 10/31/15 | | | 8.48 | | | | 0.43 | | | | (1.75 | ) | | | (1.32 | ) | | | — | | | | (0.39 | ) | | | (0.39 | ) | | | 6.77 | | | | (15.89 | ) | | | 37,373 | | | | 0.99 | | | | 1.33 | | | | 5.71 | | | | 50 | |
Year ended 10/31/14 | | | 9.16 | | | | 0.49 | | | | (0.78 | ) | | | (0.29 | ) | | | (0.06 | ) | | | (0.33 | ) | | | (0.39 | ) | | | 8.48 | | | | (3.21 | ) | | | 39,617 | | | | 0.99 | | | | 1.30 | | | | 5.54 | | | | 69 | |
Year ended 10/31/13 | | | 9.87 | | | | 0.50 | | | | (0.78 | ) | | | (0.28 | ) | | | (0.32 | ) | | | (0.11 | ) | | | (0.43 | ) | | | 9.16 | | | | (3.01 | ) | | | 33,125 | | | | 0.99 | | | | 1.29 | | | | 5.21 | | | | 31 | |
| (a) | Calculated using average shares outstanding. |
| (b) | Includes adjustments in accordance with accounting principles generally accepted in the United States of America and as such, the net asset value for financial reporting purposes and the returns based upon those net asset values may differ from the net asset value and returns for shareholder transactions. Does not include sales charges and is not annualized for periods less than one year, if applicable. |
| (c) | Portfolio turnover is calculated at the fund level and is not annualized for periods less than one year, if applicable. |
| (d) | Ratios are based on average daily net assets (000’s omitted) of $4,537, $77, $1,178, $267, $1,089, $7 and $54,826 for Class A, Class B, Class C, Class R, Class Y, Class R5 and Class R6 shares, respectively. |
Note 13—Subsequent Event
On December 1, 2017, the Fund’s Board of Trustees approved the early conversion of the remaining assets in the Fund’s Class B shares into Class A shares to occur on or about January 26, 2018. At the close of business on or about January 26, 2018, (the “Conversion Date”) all outstanding Class B shares of the Fund will be converted to Class A shares of the Fund, which is prior to the date the Class B shares would normally be converted to Class A shares. Once the conversion is completed, Class B shares will be closed and become inactive. No contingent deferred sales charges will be payable in connection with this early conversion. The conversion of the Fund’s Class B shares into Class A shares on the Conversion Date is not expected to be a taxable event for federal income tax purposes, and should not result in the recognition of gain or loss by converting shareholders, although each shareholder should consult with his or her own tax adviser.
31 Invesco Emerging Markets Flexible Bond Fund
Report of Independent Registered Public Accounting Firm
To the Board of Trustees of AIM Investment Funds (Invesco Investment Funds)
and Shareholders of Invesco Emerging Markets Flexible Bond Fund:
In our opinion, the accompanying consolidated statement of assets and liabilities, including the consolidated schedule of investments, and the related consolidated statements of operations and of changes in net assets and the financial highlights present fairly, in all material respects, the consolidated financial position of Invesco Emerging Markets Flexible Bond Fund and its subsidiary (one of the portfolios constituting the AIM Investment Funds (Invesco Investment Funds), hereafter referred to as the “Fund”) as of October 31, 2017, the results of their operations for the year then ended, the changes in their net assets for each of the two years in the period then ended and the financial highlights for each of the five years in the period then ended, in conformity with accounting principles generally accepted in the United States of America. These consolidated financial statements and financial highlights (hereafter referred to as “financial statements”) are the responsibility of the Fund’s management. Our responsibility is to express an opinion on these financial statements based on our audits. We conducted our audits of these financial statements in accordance with the standards of the Public Company Accounting Oversight Board (United States). Those standards require that we plan and perform the audit to obtain reasonable assurance about whether the financial statements are free of material misstatement. An audit includes examining, on a test basis, evidence supporting the amounts and disclosures in the financial statements, assessing the accounting principles used and significant estimates made by management, and evaluating the overall financial statement presentation. We believe that our audits, which included confirmation of securities as of October 31, 2017 by correspondence with the custodian, transfer agent and brokers, and when replies were not received from brokers, we performed other auditing procedures, provide a reasonable basis for our opinion.
PricewaterhouseCoopers LLP
Houston, Texas
December 21, 2017
32 Invesco Emerging Markets Flexible Bond Fund
Calculating your ongoing Fund expenses
Example
As a shareholder of the Fund, you incur two types of costs: (1) transaction costs, which may include sales charges (loads) on purchase payments or contingent deferred sales charges on redemptions, if any; and (2) ongoing costs, including management fees, distribution and/or service (12b-1) fees, and other Fund expenses. This example is intended to help you understand your ongoing costs (in dollars) of investing in the Fund and to compare these costs with ongoing costs of investing in other mutual funds. The example is based on an investment of $1,000 invested at the beginning of the period and held for the entire period May 1, 2017 through October 31, 2017.
Actual expenses
The table below provides information about actual account values and actual expenses. You may use the information in this table, together with the amount you invested, to estimate the expenses that you paid over the period. Simply divide your account value by $1,000 (for example, an $8,600 account value divided by $1,000 = 8.6), then multiply the result by the number in the table under the heading entitled “Actual Expenses Paid During Period” to estimate the expenses you paid on your account during this period.
Hypothetical example for comparison purposes
The table below also provides information about hypothetical account values and hypothetical expenses based on the Fund’s actual expense ratio and an assumed rate of return of 5% per year before expenses, which is not the Fund’s actual return.
The hypothetical account values and expenses may not be used to estimate the actual ending account balance or expenses you paid for the period. You may use this information to compare the ongoing costs of investing in the Fund and other funds. To do so, compare this 5% hypothetical example with the 5% hypothetical examples that appear in the shareholder reports of the other funds.
Please note that the expenses shown in the table are meant to highlight your ongoing costs only and do not reflect any transaction costs, such as sales charges (loads) on purchase payments or contingent deferred sales charges on redemptions, if any. Therefore, the hypothetical information is useful in comparing ongoing costs only, and will not help you determine the relative total costs of owning different funds. In addition, if these transaction costs were included, your costs would have been higher.
| | | | | | | | | | | | | | | | | | | | | | | | |
| Class | | Beginning
Account Value
(05/01/17) | | | ACTUAL | | | HYPOTHETICAL (5% annual return before
expenses) | | | Annualized
Expense
Ratio | |
| | | Ending
Account Value
(10/31/17)1 | | | Expenses
Paid During
Period2 | | | Ending
Account Value
(10/31/17) | | | Expenses
Paid During
Period2 | | |
| A | | $ | 1,000.00 | | | $ | 1,029.40 | | | $ | 6.29 | | | $ | 1,019.00 | | | $ | 6.26 | | | | 1.23 | % |
| B | | | 1,000.00 | | | | 1,027.10 | | | | 10.12 | | | | 1,015.22 | | | | 10.06 | | | | 1.98 | |
| C | | | 1,000.00 | | | | 1,025.60 | | | | 10.11 | | | | 1,015.22 | | | | 10.06 | | | | 1.98 | |
| R | | | 1,000.00 | | | | 1,028.20 | | | | 7.57 | | | | 1,017.74 | | | | 7.53 | | | | 1.48 | |
| Y | | | 1,000.00 | | | | 1,032.30 | | | | 5.02 | | | | 1,020.27 | | | | 4.99 | | | | 0.98 | |
| R5 | | | 1,000.00 | | | | 1,032.30 | | | | 5.04 | | | | 1,020.25 | | | | 5.01 | | | | 0.98 | |
| R6 | | | 1,000.00 | | | | 1,030.80 | | | | 5.03 | | | | 1,020.25 | | | | 5.01 | | | | 0.98 | |
| 1 | The actual ending account value is based on the actual total return of the Fund for the period May 1, 2017 through October 31, 2017, after actual expenses and will differ from the hypothetical ending account value which is based on the Fund’s expense ratio and a hypothetical annual return of 5% before expenses. |
| 2 | Expenses are equal to the Fund’s annualized expense ratio as indicated above multiplied by the average account value over the period, multiplied by 184/365 to reflect the most recent fiscal half year. |
33 Invesco Emerging Markets Flexible Bond Fund
Approval of Investment Advisory and Sub-Advisory Contracts
The Board of Trustees (the Board) of AIM Investment Funds (Invesco Investment Funds) is required under the Investment Company Act of 1940, as amended, to approve annually the renewal of Invesco Emerging Markets Flexible Bond Fund’s (the Fund) investment advisory agreements. During contract renewal meetings held on June 12-13, 2017, the Board as a whole, and the disinterested or “independent” Trustees, who comprise over 75% of the Board, voting separately, approved the continuance for the Fund of the Master Investment Advisory Agreement with Invesco Advisers, Inc. (Invesco Advisers and the investment advisory agreement) and the Master Intergroup Sub-Advisory Contract for Mutual Funds with Invesco Asset Management Deutschland GmbH, Invesco Asset Management Limited, Invesco Asset Management (Japan) Limited, Invesco Hong Kong Limited, Invesco Senior Secured Management, Inc. and Invesco Canada Ltd. and separate Sub-Advisory Contracts with Invesco PowerShares Capital Management LLC and Invesco Asset Management (India) Private Limited (collectively, the Affiliated Sub-Advisers and the sub-advisory contracts) for another year, effective July 1, 2017.
In evaluating the fairness and reasonableness of compensation under the Fund’s investment advisory agreement and sub-advisory contracts, the Board considered, among other things, the factors discussed below. The Board determined that continuation of the Fund’s investment advisory agreement and the sub-advisory contracts is in the best interest of the Fund and its shareholders and that the compensation payable to Invesco Advisers and the Affiliated Sub-Advisers under the agreements is fair and reasonable.
The Board’s Fund Evaluation Process
The Board’s Investments Committee has established three Sub-Committees, which meet throughout the year to review the performance of funds advised by Invesco Advisers (the Invesco Funds). Over the course of each year, the Sub-Committees meet with portfolio managers for their assigned Invesco Funds and other members of management to review the performance, investment objective(s), policies, strategies, limitations and investment risks of these funds. The Board had the benefit of reports from the Sub-Committees and Investments Committee throughout the year in considering approval of the continuance of each Invesco Fund’s investment advisory agreement and sub-advisory contracts for another year.
During the contract renewal process, the Board receives comparative performance and fee data regarding the Invesco Funds prepared by Invesco Advisers and Broadridge Financial Solutions, Inc. (Broadridge), an independent provider of investment company data. The Board also receives an independent written
evaluation from the Senior Officer, an officer of the Invesco Funds who reports directly to the independent Trustees. The Senior Officer’s evaluation is prepared as part of his responsibility to manage the process by which the Invesco Funds’ proposed management fees are negotiated during the annual contract renewal process to ensure they are negotiated in a manner that is at arms’ length and reasonable. In addition to meetings with Invesco Advisers and fund counsel, the independent Trustees also discuss the continuance of the investment advisory agreement and sub-advisory contracts in separate sessions with the Senior Officer and with independent legal counsel.
The Trustees recognized that the advisory fee rates for the Invesco Funds are, in most cases, the result of years of review and negotiation. The Trustees’ deliberations and conclusions in a particular year may be based in part on their deliberations and conclusions regarding these arrangements throughout the year and in prior years. The Trustees’ review and conclusions are based on the comprehensive consideration of all information presented to them and are not the result of any single determinative factor. Moreover, one Trustee may have weighed a particular piece of information or factor differently than another Trustee.
The discussion below is a summary of the Senior Officer’s independent written evaluation with respect to the Fund’s investment advisory agreement as well as a discussion of the material factors and related conclusions that formed the basis for the Board’s approval of the Fund’s investment advisory agreement and sub-advisory contracts. This information is current as of June 13, 2017, and does not reflect consideration of factors that became known to the Board after that date.
Factors and Conclusions and Summary of Independent Written Fee Evaluation
| A. | Nature, Extent and Quality of Services Provided by Invesco Advisers and the Affiliated Sub-Advisers |
The Board reviewed the advisory services provided to the Fund by Invesco Advisers under the Fund’s investment advisory agreement, the performance of Invesco Advisers in providing these services, and the credentials and experience of the officers and employees of Invesco Advisers who provide these services, including the Fund’s portfolio manager or managers. The Board’s review included consideration of Invesco Advisers’ investment process oversight, credit analysis and investment risk management. The Board also considered non-advisory services that Invesco Advisers and its affiliates provide to the Invesco Funds such as various back office support functions, trading operations, internal audit, valuation and legal and compliance.
In determining whether to continue the Fund’s investment advisory agreement, the Board considered the benefits of reapproving an existing relationship as contrasted with the greater uncertainty that may be associated with entering into a new relationship. The Board concluded that the nature, extent and quality of the services provided to the Fund by Invesco Advisers are appropriate and satisfactory.
The Board reviewed the services that may be provided by the Affiliated Sub-Advisers under the sub-advisory contracts and the credentials and experience of the officers and employees of the Affiliated Sub-Advisers who provide these services. The Board noted that the Affiliated Sub-Advisers have offices and personnel that are located in financial centers around the world. As a result, the Board noted that the Affiliated Sub-Advisers can provide research and investment analysis on the markets and economies of various countries in which the Fund may invest, make recommendations regarding securities and assist with security trades. The Board concluded that the sub-advisory contracts may benefit the Fund and its shareholders by permitting Invesco Advisers to use the resources and talents of the Affiliated Sub-Advisers in managing the Fund. The Board concluded that the nature, extent and quality of the services that may be provided by the Affiliated Sub-Advisers are appropriate and satisfactory.
| B. | Fund Investment Performance |
The Board noted that the Fund had changed its name, investment strategy and index on February 26, 2016. As a result, and since there was less than a calendar year of current performance, the Board did not consider past performance of the fund to be relevant. The Board did not view Fund performance as a relevant factor in considering whether to approve the sub-advisory contracts for the Fund, as no Affiliated Sub-Adviser currently manages assets of the Fund.
| C. | Advisory and Sub-Advisory Fees |
The Board compared the Fund’s contractual management fee rate to the contractual management fee rates of funds in the Fund’s Broadridge expense group at a common asset level. The Board noted that the contractual management fee rate for Class A shares of the Fund was at the median contractual management fee rate of funds in its expense group. The Board noted that the term “contractual management fee” for funds in the expense group may include both advisory and certain administrative services fees, but that Broadridge does not provide information on a fund by fund basis as to what is included. The Board noted that Invesco Advisers does not separately charge the Invesco Funds for the administrative services included in the term as defined by Broadridge. The Board also reviewed
34 Invesco Emerging Markets Flexible Bond Fund
the methodology used by Broadridge in providing expense group information, which includes using each fund’s contractual management fee schedule (including any applicable breakpoints) as reported in the most recent prospectus or statement of additional information for each fund in the expense group.
The Board noted that Invesco Advisers has contractually agreed to waive fees and/or limit expenses of the Fund through at least February 28, 2018 in an amount necessary to limit total annual operating expenses to a specified percentage of average daily net assets for each class of the Fund.
The Board also compared the Fund’s effective advisory fee rate (the advisory fee rate after advisory fee waivers and before other expense limitations/waivers) to the effective advisory fee rates of other mutual funds advised by Invesco Advisers and its affiliates with investment strategies comparable to those of the Fund, based on asset balances as of December 31, 2016. The Board also noted how the Fund’s rate compared to the effective advisory fee of six off-shore funds advised by Invesco Advisers and its affiliates.
The Board also considered the fees charged by Invesco Advisers and the Affiliated Sub-Advisers to other client accounts with investment strategies comparable to those of the Fund. The Board noted that Invesco Advisers or the Affiliated Sub-Advisers may charge lower fees to large institutional clients. Invesco Advisers reviewed with the Board the significantly greater scope of services it provides to the Invesco Funds relative to certain other types of client accounts. These additional services include provision of administrative services, officers and office space, oversight of service providers, preparation of annual registration statement updates and financial information and regulatory compliance under the Investment Company Act of 1940, as amended.
Invesco Advisers also reviewed generally the higher frequency of shareholder purchases and redemptions in the Invesco Funds relative to the flow of assets for other client accounts. Invesco Advisers advised the Board that advance notice of redemptions is often provided to Invesco Advisers by institutional clients. The Board did note that sub-advisory fee rates charged by the Affiliated Sub-Advisers to manage the Invesco Funds and to manage other client accounts tended to be more comparable, reflecting a similar scope of services.
The Board also considered the services that may be provided by the Affiliated Sub-Advisers pursuant to the sub-advisory contracts, as well as the fees payable by Invesco Advisers to the Affiliated Sub-Advisers pursuant to the sub-advisory contracts. The Board also noted that the sub-advisory fees are not paid directly by the Fund, but rather, are payable by Invesco Advisers to the Affiliated Sub-Advisers.
| D. | Economies of Scale and Breakpoints |
The Board considered the extent to which there are economies of scale in the provision of
advisory services to the Fund. The Board also considered that the Fund may benefit from economies of scale through contractual breakpoints in the Fund’s advisory fee schedule. The Board noted that the Fund shares directly in economies of scale through lower fees charged by third party service providers based on the combined size of the Invesco Funds advised by Invesco Advisers.
| E. | Profitability and Financial Resources |
The Board reviewed information from Invesco Advisers concerning the costs of the advisory and other services that Invesco Advisers and its affiliates provide to the Fund and the Invesco Funds and the profitability of Invesco Advisers and its affiliates in providing these services. The Board noted that Invesco Advisers continues to operate at a net profit from services Invesco Advisers and its affiliates provide to the Invesco Funds and the Fund. The Board did not deem the level of profits realized by Invesco Advisers and its affiliates from providing services to the Fund to be excessive given the nature, quality and extent of the eservices provided. The Board received and accepted information from Invesco Advisers demonstrating that Invesco Advisers and each Affiliated Sub-Adviser are financially sound and have the resources necessary to perform their obligations under the investment advisory agreement and sub-advisory contracts.
| F. | Collateral Benefits to Invesco Advisers and its Affiliates |
The Board considered various other benefits received by Invesco Advisers and its affiliates from the relationship with the Fund, including the fees received for providing transfer agency and distribution services to the Fund. The Board considered comparative information regarding fees charged for these services, including information provided by Broadridge and other independent sources. The Board considered the performance of Invesco Advisers and its affiliates in providing these services and the organizational structure employed to provide these services. The Board also considered that these services are provided to the Fund pursuant to written contracts that are reviewed and approved on an annual basis by the Board; and that the services are required for the operation of the Fund.
The Board considered the benefits realized by Invesco Advisers and the Affiliated Sub-Advisers as a result of portfolio brokerage transactions executed through “soft dollar” arrangements. Invesco Advisers noted that the Fund does not execute brokerage transactions through “soft dollar” arrangements to any significant degree.
The Board considered that the Fund’s uninvested cash and cash collateral from any securities lending arrangements may be invested in money market funds advised by Invesco Advisers pursuant to procedures approved by the Board. The Board noted that Invesco Advisers receives advisory fees from these affiliated money market funds attributable to such investments, although Invesco Advisers has contractually agreed to waive through varying periods the advisory fees
payable by the Invesco Funds with respect to certain investments in the affiliated money market funds. The waiver is in an amount equal to 100% of the net advisory fee Invesco Advisers receives from the affiliated money market funds with respect to the Fund’s investment in the affiliated money market funds of uninvested cash, but not cash collateral. The Board concluded that the amount of advisory fees received by Invesco Advisers from the Fund’s investment of cash collateral from any securities lending arrangements in the affiliated money market funds is fair and reasonable.
35 Invesco Emerging Markets Flexible Bond Fund
Tax Information
Form 1099-DIV, Form 1042-S and other year-end tax information provide shareholders with actual calendar year amounts that should be included in their tax returns. Shareholders should consult their tax advisors.
The following distribution information is being provided as required by the Internal Revenue Code or to meet a specific state’s requirement.
The Fund designates the following amounts or, if subsequently determined to be different, the maximum amount allowable for its fiscal year ended October 31, 2017:
| | | | |
Federal and State Income Tax | |
Qualified Dividend Income* | | | 0.36 | % |
Corporate Dividends Received Deduction* | | | 0.00 | % |
U.S. Treasury Obligations* | | | 0.01 | % |
| | * | The above percentages are based on ordinary income dividends paid to shareholders during the Fund’s fiscal year. |
36 Invesco Emerging Markets Flexible Bond Fund
Trustees and Officers
The address of each trustee and officer is AIM Investment Funds (Invesco Investment Funds) (the “Trust”), 11 Greenway Plaza, Suite 1000, Houston, Texas 77046-1173. The trustees serve for the life of the Trust, subject to their earlier death, incapacitation, resignation, retirement or removal as more specifically provided in the Trust’s organizational documents. Each officer serves for a one year term or until their successors are elected and qualified. Column two below includes length of time served with predecessor entities, if any.
| | | | | | | | |
Name, Year of Birth and Position(s) Held with the Trust | | Trustee and/
or Officer Since | | Principal Occupation(s)
During Past 5 Years | | Number of
Funds in Fund
Complex
Overseen by
Trustee | | Other Directorship(s)
Held by Trustee During Past 5 Years |
| Interested Persons | | | | | | | | |
| Martin L. Flanagan1 — 1960 Trustee | | 2007 | | Executive Director, Chief Executive Officer and President, Invesco Ltd. (ultimate parent of Invesco and a global investment management firm); Trustee, The Invesco Funds; Vice Chair, Investment Company Institute; and Member of Executive Board, SMU Cox School of Business Formerly: Advisor to the Board, Invesco Advisers, Inc. (formerly known as Invesco Institutional (N.A.), Inc.); Chairman and Chief Executive Officer, Invesco Advisers, Inc. (registered investment adviser); Director, Chairman, Chief Executive Officer and President, Invesco Holding Company (US), Inc. (formerly IVZ Inc.) (holding company), Invesco Group Services, Inc. (service provider) and Invesco North American Holdings, Inc. (holding company); Director, Chief Executive Officer and President, Invesco Holding Company Limited (parent of Invesco and a global investment management firm); Director, Invesco Ltd.; Chairman, Investment Company Institute and President, Co-Chief Executive Officer, Co-President, Chief Operating Officer and Chief Financial Officer, Franklin Resources, Inc. (global investment management organization) | | 158 | | None |
Philip A. Taylor2 — 1954 Trustee and Senior Vice President | | 2006 | | Head of the Americas and Senior Managing Director, Invesco Ltd.; Director, Invesco Advisers, Inc. (formerly known as Invesco Institutional (N.A.), Inc.) (registered investment adviser); Director, Chairman, Chief Executive Officer and President, Invesco Management Group, Inc. (formerly known as Invesco Aim Management Group, Inc.) (financial services holding company); Director and Chairman, Invesco Investment Services, Inc. (formerly known as Invesco Aim Investment Services, Inc.) (registered transfer agent); Chief Executive Officer, Invesco Corporate Class Inc. (corporate mutual fund company); Director, Chairman and Chief Executive Officer, Invesco Canada Ltd. (formerly known as Invesco Trimark Ltd./Invesco Trimark Ltèe) (registered investment adviser and registered transfer agent); Trustee and Senior Vice President, The Invesco Funds; Director, Invesco Investment Advisers LLC (formerly known as Van Kampen Asset Management). Formerly: Co-Chairman, Co-President and Co-Chief Executive Officer, Invesco Advisers, Inc. (formerly known as Invesco Institutional (N.A.), Inc.) (registered investment adviser); Director, Chief Executive Officer and President, Van Kampen Exchange Corp; President and Principal Executive Officer, The Invesco Funds (other than AIM Treasurer’s Series Trust (Invesco Treasurer’s Series Trust), Short-Term Investments Trust and Invesco Management Trust); Executive Vice President, The Invesco Funds (AIM Treasurer’s Series Trust (Invesco Treasurer’s Series Trust), Short-Term Investments Trust and Invesco Management Trust only); Director and President, INVESCO Funds Group, Inc. (registered investment adviser and registered transfer agent); Director and Chairman, IVZ Distributors, Inc. (formerly known as INVESCO Distributors, Inc.) (registered broker dealer); Director, President and Chairman, Invesco Inc. (holding company), Invesco Canada Holdings Inc. (holding company), Trimark Investments Ltd./Placements Trimark Ltèe and Invesco Financial Services Ltd/Services Financiers Invesco Ltèe; Chief Executive Officer, Invesco Canada Fund Inc. (corporate mutual fund company); Director and Chairman, Van Kampen Investor Services Inc.; Director, Chief Executive Officer and President, 1371 Preferred Inc. (holding company) and Van Kampen Investments Inc.; Director and President, AIM GP Canada Inc. (general partner for limited partnerships) and Van Kampen Advisors, Inc.; Director and Chief Executive Officer, Invesco Trimark Dealer Inc. (registered broker dealer); Director, Invesco Distributors, Inc. (formerly known as Invesco Aim Distributors, Inc.) (registered broker dealer); Manager, Invesco PowerShares Capital Management LLC; Director, Chief Executive Officer and President, Invesco Advisers, Inc.; Director, Chairman, Chief Executive Officer and President, Invesco Aim Capital Management, Inc.; President, Invesco Trimark Dealer Inc. and Invesco Trimark Ltd./Invesco Trimark Ltèe; Director and President, AIM Trimark Corporate Class Inc. and AIM Trimark Canada Fund Inc.; Senior Managing Director, Invesco Holding Company Limited; Director and Chairman, Fund Management Company (former registered broker dealer); President and Principal Executive Officer, The Invesco Funds (AIM Treasurer’s Series Trust (Invesco Treasurer’s Series Trust), and Short-Term Investments Trust only); President, AIM Trimark Global Fund Inc. and AIM Trimark Canada Fund Inc. | | 158 | | None |
| 1 | Mr. Flanagan is considered an interested person (within the meaning of Section 2(a)(19) of the 1940 Act) of the Trust because he is an officer of the Adviser to the Trust, and an officer and a director of Invesco Ltd., ultimate parent of the Adviser. |
| 2 | Mr. Taylor is considered an interested person (within the meaning of Section 2(a)(19) of the 1940 Act) of the Trust because he is an officer and a director of the Adviser. |
T-1 Invesco Emerging Markets Flexible Bond Fund
Trustees and Officers—(continued)
| | | | | | | | |
Name, Year of Birth and Position(s) Held with the Trust | | Trustee and/
or Officer Since | | Principal Occupation(s) During Past 5 Years | | Number of
Funds in Fund
Complex
Overseen by
Trustee | | Other Directorship(s)
Held by Trustee During Past 5 Years |
| Independent Trustees | | | | | | | | |
Bruce L. Crockett — 1944 Trustee and Chair | | 2001 | | Chairman, Crockett Technologies Associates (technology consulting company) Formerly: Director, Captaris (unified messaging provider); Director, President and Chief Executive Officer, COMSAT Corporation; Chairman, Board of Governors of INTELSAT (international communications company); ACE Limited (insurance company); Independent Directors Council and Investment Company Institute: Member of the Audit Committee, Investment Company Institute; Member of the Executive Committee and Chair of the Governance Committee, Independent Directors Council | | 158 | | Director and Chairman of the Audit Committee, ALPS (Attorneys Liability Protection Society) (insurance company); Director and Member of the Audit Committee, Ferroglobe PLC (metallurgical company) |
David C. Arch — 1945 Trustee | | 2010 | | Chairman of Blistex Inc. (consumer health care products manufacturer); Member, World Presidents’ Organization | | 158 | | Board member of the Illinois Manufacturers’ Association |
James T. Bunch — 1942 Trustee | | 2003 | | Managing Member, Grumman Hill Group LLC (family office/private equity investments) Formerly: Chairman of the Board, Denver Film Society; Chairman of the Board of Trustees, Evans Scholarship Foundation; Chairman, Board of Governors, Western Golf Association | | 158 | | Trustee, Evans Scholarship Foundation |
Jack M. Fields — 1952 Trustee | | 2001 | | Chief Executive Officer, Twenty First Century Group, Inc. (government affairs company); and Discovery Learning Alliance (non-profit) Formerly: Owner and Chief Executive Officer, Dos Angeles Ranch L.P. (cattle, hunting, corporate entertainment); Director, Insperity, Inc. (formerly known as Administaff) (human resources provider); Chief Executive Officer, Texana Timber LP (sustainable forestry company); Director of Cross Timbers Quail Research Ranch (non-profit); and member of the U.S. House of Representatives | | 158 | | None |
Cynthia Hostetler — 1962 Trustee | | 2017 | | Non-Executive Director and Trustee of a number of public and private business corporations Formerly: Head of Investment Funds and Private Equity, Overseas Private Investment Corporation; President, First Manhattan Bancorporation, Inc.; Attorney, Simpson Thacher & Bartlett LLP | | 158 | | Vulcan Materials Company (construction materials company); Trilinc Global Impact Fund; Aberdeen Investment Funds (4 portfolios); Artio Global Investment LLC (mutual fund complex); Edgen Group, Inc. (specialized energy and infrastructure products distributor) |
Eli Jones — 1961 Trustee | | 2016 | | Professor and Dean, Mays Business School — Texas A&M University Formerly: Professor and Dean, Walton College of Business, University of Arkansas and E.J. Ourso College of Business, Louisiana State University; Director, Arvest Bank | | 158 | | Insperity, Inc. (formerly known as Administaff) (human resources provider) |
Prema Mathai-Davis — 1950 Trustee | | 2001 | | Retired. Formerly: Chief Executive Officer, YWCA of the U.S.A. | | 158 | | None |
Teresa M. Ressel — 1962 Trustee | | 2017 | | Non-executive director and trustee of a number of public and private business corporations Formerly: Chief Financial Officer, Olayan America, The Olayan Group (international investor/commercial/industrial); Chief Executive Officer, UBS Securities LLC; Group Chief Operating Officer, Americas, UBS AG; Assistant Secretary for Management & Budget and CFO, US Department of the Treasury; Chief Compliance Officer, Kaiser Permanente (healthcare consortium); Program Manager, Hewlett-Packard; Nuclear Engineering, General Dynamics Corporation (aerospace and defense company) | | 158 | | Atlantic Power Corporation (power generation company); ON Semiconductor Corp. (semiconductor supplier) |
Larry Soll — 1942 Trustee | | 2003 | | Retired. Formerly: Chairman, Chief Executive Officer and President, Synergen Corp. (a biotechnology company) | | 158 | | None |
Ann Barnett Stern — 1957 Trustee | | 2017 | | President and Chief Executive Officer, Houston Endowment Inc. (private philanthropic institution) Formerly: Executive Vice President and General Counsel, Texas Children’s Hospital; Attorney, Beck, Redden and Secrest, LLP; Business Law Instructor, University of St. Thomas; Attorney, Andrews & Kurth LLP | | 158 | | Federal Reserve Bank of Dallas |
Raymond Stickel, Jr. — 1944 Trustee | | 2005 | | Retired. Formerly: Director, Mainstay VP Series Funds, Inc. (25 portfolios); Partner, Deloitte & Touche | | 158 | | None |
Robert C. Troccoli — 1949 Trustee | | 2016 | | Adjunct Professor, University of Denver — Daniels College of Business Formerly: Senior Partner, KPMG LLP | | 158 | | None |
T-2 Invesco Emerging Markets Flexible Bond Fund
Trustees and Officers—(continued)
| | | | | | | | |
Name, Year of Birth and Position(s) Held with the Trust | | Trustee and/
or Officer Since | | Principal Occupation(s) During Past 5 Years | | Number of
Funds in Fund
Complex
Overseen by
Trustee | | Other Directorship(s)
Held by Trustee During Past 5 Years |
| Independent Trustees—(continued) |
Christopher L. Wilson — 1957 Trustee | | 2017 | | Managing Partner, CT2, LLC (investing and consulting firm) Formerly: President/Chief Executive Officer, Columbia Funds, Bank of America Corporation; President/Chief Executive Officer, CDC IXIS Asset Management Services, Inc.; Principal & Director of Operations, Scudder Funds, Scudder, Stevens & Clark, Inc.; Assistant Vice President, Fidelity Investments | | 158 | | TD Asset Management USA Inc. (mutual fund complex) (22 portfolios); ISO New England, Inc. (non-profit organization managing regional electricity market) |
| Other Officers | | | | | | | | |
Sheri Morris — 1964 President, Principal Executive Officer and Treasurer | | 1999 | | President, Principal Executive Officer and Treasurer, The Invesco Funds; Vice President, Invesco Advisers, Inc. (formerly known as Invesco Institutional (N.A.), Inc.) (registered investment adviser); and Vice President, PowerShares Exchange-Traded Fund Trust, PowerShares Exchange-Traded Fund Trust II, PowerShares India Exchange-Traded Fund Trust, PowerShares Actively Managed Exchange-Traded Fund Trust and PowerShares Actively Managed Exchange-Traded Commodity Fund Trust Formerly: Vice President and Principal Financial Officer, The Invesco Funds; Vice President, Invesco Aim Advisers, Inc., Invesco Aim Capital Management, Inc. and Invesco Aim Private Asset Management, Inc.; Assistant Vice President and Assistant Treasurer, The Invesco Funds and Assistant Vice President, Invesco Advisers, Inc., Invesco Aim Capital Management, Inc. and Invesco Aim Private Asset Management, Inc.; and Treasurer, PowerShares Exchange-Traded Fund Trust, PowerShares Exchange-Traded Fund Trust II, PowerShares India Exchange-Traded Fund Trust and PowerShares Actively Managed Exchange-Traded Fund Trust | | N/A | | N/A |
Russell C. Burk — 1958 Senior Vice President and Senior Officer | | 2005 | | Senior Vice President and Senior Officer, The Invesco Funds | | N/A | | N/A |
John M. Zerr — 1962 Senior Vice President, Chief Legal Officer and Secretary | | 2006 | | Director, Senior Vice President, Secretary and General Counsel, Invesco Management Group, Inc. (formerly known as Invesco AIM Management Group, Inc.); Senior Vice President, Invesco Advisers, Inc. (formerly known as Invesco Institutional (N.A.), Inc.) (registered investment adviser); Senior Vice President and Secretary, Invesco Distributors, Inc. (formerly known as Invesco AIM Distributors, Inc.); Director, Vice President and Secretary, Invesco Investment Services, Inc. (formerly known as Invesco AIM Investment Services, Inc.) Senior Vice President, Chief Legal Officer and Secretary, The Invesco Funds; Managing Director, Invesco PowerShares Capital Management LLC; Director, Secretary and General Counsel, Invesco Investment Advisers LLC (formerly known as Van Kampen Asset Management); Secretary and General Counsel, Invesco Capital Markets, Inc. (formerly known as Van Kampen Funds Inc.) and Chief Legal Officer, PowerShares Exchange-Traded Fund Trust, PowerShares Exchange-Traded Fund Trust II, PowerShares India Exchange-Traded Fund Trust, PowerShares Actively Managed Exchange-Traded Fund Trust and PowerShares Actively Managed Exchange-Traded Commodity Fund Trust; Manager and Secretary, Invesco Indexing LLC Formerly: Director, Secretary, General Counsel and Senior Vice President, Van Kampen Exchange Corp.; Director, Vice President and Secretary, IVZ Distributors, Inc. (formerly known as INVESCO Distributors, Inc.); Director and Vice President, INVESCO Funds Group, Inc.; Director and Vice President, Van Kampen Advisors Inc.; Director, Vice President, Secretary and General Counsel, Van Kampen Investor Services Inc.; Director, Invesco Distributors, Inc. (formerly known as Invesco AIM Distributors, Inc.); Director, Senior Vice President, General Counsel and Secretary, Invesco AIM Advisers, Inc. and Van Kampen Investments Inc.; Director, Vice President and Secretary, Fund Management Company; Director, Senior Vice President, Secretary, General Counsel and Vice President, Invesco AIM Capital Management, Inc.; Chief Operating Officer and General Counsel, Liberty Ridge Capital, Inc. (an investment adviser); Vice President and Secretary, PBHG Funds (an investment company) and PBHG Insurance Series Fund (an investment company); Chief Operating Officer, General Counsel and Secretary, Old Mutual Investment Partners (a broker-dealer); General Counsel and Secretary, Old Mutual Fund Services (an administrator) and Old Mutual Shareholder Services (a shareholder servicing center); Executive Vice President, General Counsel and Secretary, Old Mutual Capital, Inc. (an investment adviser); and Vice President and Secretary, Old Mutual Advisors Funds (an investment company) | | N/A | | N/A |
Gregory G. McGreevey — 1962 Senior Vice President | | 2012 | | Senior Managing Director, Invesco Ltd.; Director, Chairman, President, and Chief Executive Officer, Invesco Advisers, Inc. (formerly known as Invesco Institutional (N.A.), Inc.) (registered investment adviser); Senior Vice President, Invesco Management Group, Inc.; Director, Invesco Mortgage Capital, Inc. and Invesco Senior Secured Management, Inc.; and Senior Vice President, The Invesco Funds Formerly: Assistant Vice President, The Invesco Funds | | N/A | | N/A |
T-3 Invesco Emerging Markets Flexible Bond Fund
Trustees and Officers—(continued)
| | | | | | | | |
Name, Year of Birth and Position(s) Held with the Trust | | Trustee and/
or Officer Since | | Principal Occupation(s) During Past 5 Years | | Number of
Funds in Fund
Complex
Overseen by
Trustee | | Other Directorship(s)
Held by Trustee During Past 5 Years |
| Other Officers—(continued) | | | | | | | | |
Kelli Gallegos — 1970 Vice President, Principal Financial Officer and Assistant Treasurer | | 2008 | | Vice President, Principal Financial Officer and Assistant Treasurer, The Invesco Funds; Assistant Treasurer, Invesco PowerShares Capital Management LLC, PowerShares Exchange-Traded Fund Trust, PowerShares Exchange-Traded Fund Trust II, PowerShares India Exchange-Traded Fund Trust, PowerShares Actively Managed Exchange-Traded Fund Trust and PowerShares Actively Managed Exchange-Traded Commodity Fund Trust Formerly: Assistant Vice President, The Invesco Funds | | N/A | | N/A |
Tracy Sullivan — 1962 Vice President, Chief Tax Officer and Assistant Treasurer | | 2008 | | Vice President, Chief Tax Officer and Assistant Treasurer, The Invesco Funds; Assistant Treasurer, Invesco PowerShares Capital Management LLC, PowerShares Exchange-Traded Fund Trust, PowerShares Exchange-Traded Fund Trust II, PowerShares India Exchange-Traded Fund Trust, PowerShares Actively Managed Exchange-Traded Fund Trust and PowerShares Actively Managed Exchange-Traded Commodity Fund Trust Formerly: Assistant Vice President, The Invesco Funds | | N/A | | N/A |
Crissie M. Wisdom — 1969 Anti-Money Laundering Compliance Officer | | 2013 | | Anti-Money Laundering Compliance Officer, Invesco Advisers, Inc. (formerly known as Invesco Institutional (N.A.), Inc.) (registered investment adviser), Invesco Capital Markets, Inc. (formerly known as Van Kampen Funds Inc.), Invesco Distributors, Inc., Invesco Investment Services, Inc., Invesco Management Group, Inc., The Invesco Funds, and PowerShares Exchange-Traded Fund Trust, PowerShares Exchange-Traded Fund Trust II, PowerShares India Exchange-Traded Fund Trust, PowerShares Actively Managed Exchange-Traded Fund Trust and PowerShares Actively Managed Exchange-Traded Commodity Fund Trust; Anti-Money Laundering Compliance Officer and Bank Secrecy Act Officer, INVESCO National Trust Company and Invesco Trust Company; and Fraud Prevention Manager and Controls and Risk Analysis Manager for Invesco Investment Services, Inc. Formerly: Anti-Money Laundering Compliance Officer, Van Kampen Exchange Corp. | | N/A | | N/A |
Robert R. Leveille — 1969 Chief Compliance Officer | | 2016 | | Chief Compliance Officer, Invesco Advisers, Inc. (registered investment adviser); and Chief Compliance Officer, The Invesco Funds Formerly: Chief Compliance Officer, Putnam Investments and the Putnam Funds | | N/A | | N/A |
The Statement of Additional Information of the Trust includes additional information about the Fund’s Trustees and is available upon request, without charge, by calling 1.800.959.4246. Please refer to the Fund’s Statement of Additional Information for information on the Fund’s sub-advisers.
| | | | | | |
Office of the Fund 11 Greenway Plaza, Suite 1000 Houston, TX 77046-1173 | | Investment Adviser Invesco Advisers, Inc. 1555 Peachtree Street, N.E. Atlanta, GA 30309 | | Distributor Invesco Distributors, Inc. 11 Greenway Plaza, Suite 1000 Houston, TX 77046-1173 | | Auditors PricewaterhouseCoopers LLP 1000 Louisiana Street, Suite 5800 Houston, TX 77002-5678 |
| | | |
| | | | | | |
Counsel to the Fund Stradley Ronon Stevens & Young, LLP 2005 Market Street, Suite 2600 Philadelphia, PA 19103-7018 | | Counsel to the Independent Trustees Goodwin Procter LLP 901 New York Avenue, N.W. Washington, D.C. 20001 | | Transfer Agent Invesco Investment Services, Inc. 11 Greenway Plaza, Suite 1000 Houston, TX 77046-1173 | | Custodian State Street Bank and Trust Company 225 Franklin Street Boston, MA 02110-2801 |
T-4 Invesco Emerging Markets Flexible Bond Fund
Explore High-Conviction Investing with Invesco

Go paperless with eDelivery
Visit invesco.com/edelivery to enjoy the convenience and security of anytime electronic access to your investment documents.
With eDelivery, you can elect to have any or all of the following materials delivered straight to your inbox to download, save and print from your own computer:
| ∎ | | Fund reports and prospectuses |
Invesco mailing information
Send general correspondence to Invesco Investment Services, Inc., P.O. Box 219078, Kansas City, MO 64121-9078.
Important notice regarding delivery of security holder documents
To reduce Fund expenses, only one copy of most shareholder documents may be mailed to shareholders with multiple accounts at the same address (Householding). Mailing of your shareholder documents may be householded indefinitely unless you instruct us otherwise. If you do not want the mailing of these documents to be combined with those for other members of your household, please contact Invesco Investment Services, Inc. at 800 959 4246 or contact your financial institution. We will begin sending you individual copies for each account within 30 days after receiving your request.
Fund holdings and proxy voting information
The Fund provides a complete list of its holdings four times in each fiscal year, at the quarter ends. For the second and fourth quarters, the lists appear in the Fund’s semiannual and annual reports to shareholders. For the first and third quarters, the Fund files the lists with the Securities and Exchange Commission (SEC) on Form N-Q. The most recent list of portfolio holdings is available at invesco.com/completeqtrholdings. Shareholders can also look up the Fund’s Forms N-Q on the SEC website at sec.gov. Copies of the Fund’s Forms N-Q may be reviewed and copied at the SEC Public Reference Room in Washington, D.C. You can obtain information on the operation of the Public Reference Room, including information about duplicating fee charges, by calling 202 551 8090 or 800 732 0330, or by electronic request at the following email address: publicinfo@sec.gov. The SEC file numbers for the Fund are shown below.
A description of the policies and procedures that the Fund uses to determine how to vote proxies relating to portfolio securities is available without charge, upon request, from our Client Services department at 800 959 4246 or at invesco.com/proxyguidelines. The information is also available on the SEC website,sec.gov.
| | |
Information regarding how the Fund voted proxies related to its portfolio securities during the most recent 12-month period ended June 30 is available at invesco.com/proxysearch. The information is also available on the SEC website, sec.gov. Invesco Advisers, Inc. is an investment adviser; it provides investment advisory services to individual and institutional clients and does not sell securities. Invesco Distributors, Inc. is the US distributor for Invesco Ltd.’s retail mutual funds, exchange-traded funds and institutional money market funds. Both are wholly owned, indirect subsidiaries of Invesco Ltd. | |  |
| | | | | | | | |
| SEC file numbers: 811-05426 and 033-19338 | | Invesco Distributors, Inc. | | EMFB-AR-1 | | 12212017 | | 1230 |

Letters to Shareholders
| | | | |

Philip Taylor | | | | Dear Shareholders: This annual report includes information about your Fund, including performance data and a complete list of its investments as of the close of the reporting period. Inside is a discussion of how your Fund was managed and the factors that affected its performance during the reporting period. American voters went to the polls just days after the start of the reporting period, and their decisions quickly affected markets. The US stock market rallied strongly after the election, with major market indexes rising, and setting record highs, throughout the reporting period. Generally positive economic data, strong corporate earnings and hope for tax and regulatory reform contributed to the rally. US and global bond markets, as well as emerging market equities, sold off immediately following the election – with the US bond market eventually recovering most of its losses. Overseas, economic data were mixed, prompting the European |
Central Bank and central banks in China and Japan, among other countries, to maintain extraordinarily accommodative monetary policies. Citing positive economic trends – specifically, realized and expected labor market conditions and inflation – the US Federal Reserve raised interest rates three times during the reporting period: first in December 2016, and then again in March and June 2017. Health care and tax reform proved to be more difficult than expected to enact, with little progress achieved by the end of the reporting period.
Short-term market volatility can prompt some investors to abandon their investment plans – and can cause others to settle for whatever returns the market has to offer. The investment professionals at Invesco, in contrast, invest with high conviction. This means that, no matter the asset class or the strategy, each investment team has a passion to exceed. We want to help investors achieve better outcomes, such as seeking higher returns, helping mitigate risk and generating income. Of course, investing with high conviction can’t guarantee a profit or ensure success; no investment strategy can. To learn more about how we invest with high conviction, visit invesco.com/HighConviction.
You, too, can invest with high conviction by maintaining a long-term investment perspective and by working with your financial adviser on a regular basis. During periods of short-term market volatility or uncertainty, your financial adviser can keep you focused on your long-term investment goals – a new home, a child’s college education or a secure retirement. He or she also can share research about the economy, the markets and individual investment options.
Visit our website for more information on your investments
Our website, invesco.com/us, offers a wide range of market insights and investment perspectives. On the website, you’ll find detailed information about our funds, including performance, holdings and portfolio manager commentaries. You can access information about your account by completing a simple, secure online registration. To do so, select “Log In” on the right side of the homepage, and then select “Register for Individual Account Access.”
In addition to the resources accessible on our website and through our mobile app, you can obtain timely updates to help you stay informed about the markets and the economy by connecting with Invesco on Twitter, LinkedIn or Facebook. You can access our blog at blog.invesco.us.com. Our goal is to provide you the information you want, when and where you want it.
Finally, I’m pleased to share with you Invesco’s commitment to both the Principles for Responsible Investment and to considering environmental, social and governance issues in our robust investment process. I invite you to learn more at invesco.com/esg.
Have questions?
For questions about your account, contact an Invesco client services representative at 800 959 4246. For Invesco-related questions or comments, please email me directly at phil@invesco.com.
All of us at Invesco look forward to serving your investment management needs. Thank you for investing with us.
Sincerely,

Philip Taylor
Senior Managing Director, Invesco Ltd.
|
| 2 Invesco Emerging Markets Equity Fund |
| | | | |

Bruce Crockett | | | | Dear Fellow Shareholders: Among the many important lessons I’ve learned in more than 40 years in a variety of business endeavors is the value of a trusted advocate. As independent chair of the Invesco Funds Board, I can assure you that the members of the Board are strong advocates for the interests of investors in Invesco’s mutual funds. We work hard to represent your interests through oversight of the quality of the investment management services your funds receive and other matters important to your investment, including but not limited to: ∎ Ensuring that Invesco offers a diverse lineup of mutual funds that your financial adviser can use to strive to meet your financial needs as your investment goals change over time. ∎ Monitoring how the portfolio management teams of the Invesco funds are performing in light of changing economic and market conditions. |
| ∎ | Assessing each portfolio management team’s investment performance within the context of the investment strategy described in the fund’s prospectus. |
| ∎ | Monitoring for potential conflicts of interests that may impact the nature of the services that your funds receive. |
We believe one of the most important services we provide our fund shareholders is the annual review of the funds’ advisory and sub-advisory contracts with Invesco Advisers and its affiliates. This review is required by the Investment Company Act of 1940 and focuses on the nature and quality of the services Invesco provides as the adviser to the Invesco funds and the reasonableness of the fees that it charges for those services. Each year, we spend months carefully reviewing information received from Invesco and a variety of independent sources, such as performance and fee data prepared by Lipper, Inc. (a subsidiary of Broadridge Financial Solutions, Inc.), an independent, third-party firm widely recognized as a leader in its field. We also meet with our independent legal counsel and other independent advisers to review and help us assess the information that we have received. Our goal is to assure that you receive quality investment management services for a reasonable fee.
I trust the measures outlined above provide assurance that you have a worthy advocate when it comes to choosing the Invesco Funds.
As always, please contact me at bruce@brucecrockett.com with any questions or concerns you may have. On behalf of the Board, we look forward to continuing to represent your interests and serving your needs.
Sincerely,

Bruce L. Crockett
Independent Chair
Invesco Funds Board of Trustees
|
| 3 Invesco Emerging Markets Equity Fund |
Management’s Discussion of Fund Performance
Performance summary
For the fiscal year ended October 31, 2017, Class A shares of Invesco Emerging Markets Equity Fund (the Fund), at net asset value (NAV), outperformed the Fund’s style-specific benchmark, the MSCI Emerging Markets Index.
Your Fund’s long-term performance appears later in this report.
Fund vs. Indexes
Total returns, 10/31/16 to 10/31/17, at net asset value (NAV). Performance shown does not include applicable contingent deferred sales charges (CDSC) or front-end sales charges, which would have reduced performance.
| | | | | |
| Class A Shares | | | | 30.57 | % |
| Class C Shares | | | | 29.56 | |
| Class R Shares | | | | 30.27 | |
| Class Y Shares | | | | 30.94 | |
| Class R5 Shares | | | | 30.94 | |
| Class R6 Shares | | | | 30.80 | |
| MSCI EAFE Index▼ (Broad Market Index) | | | | 23.44 | |
| MSCI Emerging Markets Index▼ (Style-Specific Index) | | | | 26.45 | |
| Lipper Emerging Market Funds Index∎ (Peer Group Index) | | | | 24.58 | |
Source(s): ▼FactSet Research Systems Inc.; ∎Lipper Inc. | | | | | |
Market conditions and your Fund
The reporting period began with major US stock market indexes posting gains and most hitting record highs following the US presidential election. Investors believed that the new administration’s plans to reduce tax rates, scale back regulations and increase infrastructure spending had the potential to stimulate economic growth. However, that was called into question in the first quarter of 2017, when it appeared that enacting significant regulatory and tax reform might be more difficult than previously anticipated.
Outside the US, Brexit (the UK’s plan to leave the European Union) remained a source of political and economic uncertainty, while improved economic data and confidence surveys raised the prospect of less accommodative monetary policy in continental Europe. In Asia, increased exports helped Japan’s economy, while China’s economy continued to stabilize. Most emerging markets performed well during the reporting period. In addition to
| | | | | |
| Portfolio Composition |
| By sector | | | | % of total net assets | |
| | | | | |
| |
| Financials | | | | 28.3 | % |
| Information Technology | | | | 28.1 | |
| Consumer Discretionary | | | | 22.7 | |
| Consumer Staples | | | | 8.6 | |
| Industrials | | | | 6.8 | |
| Energy | | | | 1.2 | |
| Telecommunication Services | | | | 1.1 | |
| Materials | | | | 0.8 | |
Money Market Funds Plus Other Assets Less Liabilities | | | | 2.4 | |
an improving global economic outlook, other positive tailwinds for international markets included continued weakness in the US dollar and reduced expectations for a major shift in US trade policy.
Interestingly, while 2017 marked the eighth year of the global bull market, we saw a shift in leadership as international stocks outperformed US stocks in the first three quarters of 2017. International stocks had trailed US stocks for four consecutive years and in six of the last seven years. As the reporting period came to a close, both developed and emerging equity markets appeared somewhat fully valued despite material discounts to the US market. In addition, recent earnings growth and earnings revision trends improved for many non-US developed markets.
The Fund stayed true to its process by emphasizing its quality orientation in stock selection. Our stock selection in the consumer discretionary, financials, health care and consumer staples sectors made the largest contributions to the Fund’s results versus its style-specific
| | | | | |
| Top 10 Equity Holdings* |
| | | | % of total net assets | |
| | | | | |
| |
| 1. Tencent Holdings Ltd. | | | | 5.4 | % |
| 2. Samsung Electronics Co., Ltd. | | | | 5.2 | |
3. Taiwan Semiconductor Manufacturing Co. Ltd. | | | | 4.7 | |
| 4. Naspers Ltd.-Class N | | | | 3.1 | |
| 5. Baidu, Inc.-ADR | | | | 3.0 | |
| 6. Sberbank of Russia PJSC-ADR | | | | 2.7 | |
| 7. Bank of China Ltd.-Class H | | | | 2.4 | |
| 8. Beauty Community PCL-NVDR | | | | 2.4 | |
| 9. AIA Group Ltd. | | | | 2.3 | |
| 10. HDFC Bank Ltd. | | | | 2.3 | |
benchmark. Holdings in the information technology (IT) and materials sectors detracted from relative performance for the reporting period. In addition, the Fund’s lack of holdings in the real estate sector hampered relative performance, as did the Fund’s cash position.
From a geographic perspective, stock selection in China, Hong Kong, India, Indonesia, Malaysia, Russia and Thailand contributed to the Fund’s performance relative to its style-specific benchmark. Conversely, stock selection in Brazil and Mexico detracted from relative performance.
The largest contributor to Fund performance was Samsung Electronics. During the fiscal year, the company reported record operating profits in spite of tumult at the management level. Also advancing within the Asia Pacific region was Tencent Holdings, which benefited from strong earnings and profits from its mobile game segment. In addition, Taiwan Semiconductor Manufacturing contributed to Fund performance due to major mobile product launches and healthy demand for its products during the reporting period.
Conversely, Gerdau, a Brazilian steel company, was the largest individual detractor from Fund performance for the reporting period. Gerdau’s stock was hurt by poor earnings and currency fluctuations. Also detracting from Fund performance was Brazilian power company Companhia Energetica de Minas Gerais (CEMIG). The stock performed poorly after a Brazilian court effectively blocked the company from continuing to operate a hydroelectric dam, one of several assets the company was seeking to sell to raise cash. We sold our positions in Gerdau and CEMIG during the reporting period.
Relative to its style-specific benchmark, the Fund ended the reporting period with overweight positions in the consumer discretionary, consumer staples, financials, industrials and IT sectors,
| | | | | |
Total Net Assets | | | $ | 42.4 million | |
| |
Total Number of Holdings* | | | | 55 | |
The Fund’s holdings are subject to change, and there is no assurance that the Fund will continue to hold any particular security.
*Excluding money market fund holdings.
Data presented here are as of October 31, 2017.
|
| 4 Invesco Emerging Markets Equity Fund |
and underweight positions in the energy, health care, materials, telecommunication services and utilities sectors.
Geographically, the Fund maintained overweight positions in Brazil, India, Indonesia, Peru, Russia and Thailand throughout the reporting period. Conversely, the Fund maintained underweight positions in Taiwan, South Korea and Malaysia.
As always, we continue to focus on high quality companies with attractive valuations and strong future growth prospects.
Thank you for your investment in Invesco Emerging Markets Equity Fund.
The views and opinions expressed in management’s discussion of Fund performance are those of Invesco Advisers, Inc. These views and opinions are subject to change at any time based on factors such as market and economic conditions. These views and opinions may not be relied upon as investment advice or recommendations, or as an offer for a particular security. The information is not a complete analysis of every aspect of any market, country, industry, security or the Fund. Statements of fact are from sources considered reliable, but Invesco Advisers, Inc. makes no representation or warranty as to their completeness or accuracy. Although historical performance is no guarantee of future results, these insights may help you understand our investment management philosophy.
See important Fund and, if applicable, index disclosures later in this report.
| | |
 | | Ingrid Baker Chartered Financial Analyst, Portfolio Manager, is manager of Invesco Emerging Markets Equity Fund. |
| She joined Invesco in 1999. Ms. Baker earned a BA in international politics from Oberlin College and an MBA from the IESE Business School in Barcelona, Spain. |
Assisted by Invesco’s Global Core Equity Team
|
| 5 Invesco Emerging Markets Equity Fund |
Your Fund’s Long-Term Performance
Results of a $10,000 Investment – Oldest Share Class(es) since Inception
Fund and index data from 5/31/11
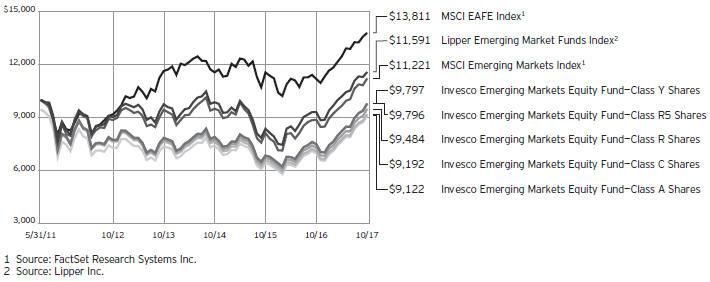
Past performance cannot guarantee comparable future results.
The data shown in the chart include reinvested distributions, applicable sales charges and Fund expenses including
management fees. Index results include reinvested dividends, but they do not reflect sales charges. Performance of the peer group, if applicable, reflects fund expenses and management fees; performance
of a market index does not. Performance shown in the chart and table(s) does not reflect deduction of taxes a shareholder would pay on Fund distributions or sale of Fund shares.
|
| 6 Invesco Emerging Markets Equity Fund |
| | | | |
Average Annual Total Returns | |
As of 10/31/17, including maximum applicable sales charges | |
| |
| Class A Shares | | | | |
| Inception (5/31/11) | | | -1.42 | % |
| 5 Years | | | 3.43 | |
| 1 Year | | | 23.47 | |
| |
| Class C Shares | | | | |
| Inception (5/31/11) | | | -1.30 | % |
| 5 Years | | | 3.81 | |
| 1 Year | | | 28.56 | |
| |
| Class R Shares | | | | |
| Inception (5/31/11) | | | -0.82 | % |
| 5 Years | | | 4.34 | |
| 1 Year | | | 30.27 | |
| |
| Class Y Shares | | | | |
| Inception (5/31/11) | | | -0.32 | % |
| 5 Years | | | 4.87 | |
| 1 Year | | | 30.94 | |
| |
| Class R5 Shares | | | | |
| Inception (5/31/11) | | | -0.32 | % |
| 5 Years | | | 4.87 | |
| 1 Year | | | 30.94 | |
| |
| Class R6 Shares | | | | |
| Inception | | | -0.39 | % |
| 5 Years | | | 4.82 | |
| 1 Year | | | 30.80 | |
Class R6 shares incepted on September 24, 2012. Performance shown prior to that date is that of Class A shares and includes the 12b-1 fees applicable to Class A shares.
The performance data quoted represent past performance and cannot guarantee comparable future results; current performance may be lower or higher. Please visit invesco.com/performance for the most recent month-end performance. Performance figures reflect reinvested distributions, changes in net asset value and the effect of the maximum sales charge unless otherwise stated. Investment return and principal value will fluctuate so that you may have a gain or loss when you sell shares.
The net annual Fund operating expense ratio set forth in the most recent Fund prospectus as of the date of this report for Class A, Class C, Class R, Class Y, Class R5 and Class R6 shares was 1.34%, 2.09%, 1.59%, 1.09%, 1.09% and 1.09%, respectively.1 The total annual Fund operating expense ratio set forth in the most recent Fund prospectus as of the date of this report for Class A, Class C, Class R, Class Y, Class R5 and Class R6 shares was
| | | | |
Average Annual Total Returns | |
| As of 9/30/17, the most recent calendar quarter end, including maximum applicable sales charges | |
| |
| Class A Shares | | | | |
| Inception (5/31/11) | | | -2.11 | % |
| 5 Years | | | 2.15 | |
| 1 Year | | | 16.28 | |
| |
| Class C Shares | | | | |
| Inception (5/31/11) | | | -1.95 | % |
| 5 Years | | | 2.54 | |
| 1 Year | | | 21.29 | |
| |
| Class R Shares | | | | |
| Inception (5/31/11) | | | -1.49 | % |
| 5 Years | | | 3.03 | |
| 1 Year | | | 22.81 | |
| |
| Class Y Shares | | | | |
| Inception (5/31/11) | | | -0.99 | % |
| 5 Years | | | 3.58 | |
| 1 Year | | | 23.40 | |
| |
| Class R5 Shares | | | | |
| Inception (5/31/11) | | | -0.99 | % |
| 5 Years | | | 3.55 | |
| 1 Year | | | 23.40 | |
| |
| Class R6 Shares | | | | |
| Inception | | | -1.06 | % |
| 5 Years | | | 3.53 | |
| 1 Year | | | 23.09 | |
2.60%, 3.35%, 2.85%, 2.35%, 2.00% and 2.00%, respectively. The expense ratios presented above may vary from the expense ratios presented in other sections of this report that are based on expenses incurred during the period covered by this report.
Class A share performance reflects the maximum 5.50% sales charge, and Class C share performance reflects the applicable contingent deferred sales charge (CDSC) for the period involved. The CDSC on Class C shares is 1% for the first year after purchase. Class R, Class Y, Class R5 and Class R6 shares do not have a front-end sales charge or a CDSC; therefore, performance is at net asset value.
The performance of the Fund’s share classes will differ primarily due to different sales charge structures and class expenses.
Fund performance reflects any applicable fee waivers and/or expense reimbursements. Had the adviser not waived fees and/or reimbursed expenses currently or in the past, returns would have been lower. See current prospectus for more information.
| 1 | Total annual Fund operating expenses after any contractual fee waivers and/or expense reimbursements by the adviser in effect through at least February 28, 2019. See current prospectus for more information. |
|
| 7 �� Invesco Emerging Markets Equity Fund |
Invesco Emerging Markets Equity Fund’s investment objective is long-term growth of capital.
| ∎ | | Unless otherwise stated, information presented in this report is as of October 31, 2017, and is based on total net assets. |
| ∎ | | Unless otherwise noted, all data provided by Invesco. |
| ∎ | | To access your Fund’s reports/prospectus, visit invesco.com/fundreports. |
About share classes
| ∎ | | Class R shares are generally available only to employer sponsored retirement and benefit plans. Please see the prospectus for more information. |
| ∎ | | Class Y shares are available only to certain investors. Please see the prospectus for more information. |
| ∎ | | Class R5 shares and Class R6 shares are available for use by retirement plans that meet certain standards and for institutional investors. Class R6 shares are also available through intermediaries that have established an agreement with Invesco Distributors, Inc. to make such shares available for use in retail omnibus accounts. Please see the prospectus for more information. |
Principal risks of investing in the Fund
| ∎ | | Depositary receipts risk. Investing in depositary receipts involves the same risks as direct investments in foreign securities. In addition, the underlying issuers of certain depositary receipts are under no obligation to distribute shareholder communications or pass through any voting rights with respect to the deposited securities to the holders of such receipts. The Fund may therefore receive less timely information or have less control than if it invested directly in the foreign issuer. |
| ∎ | | Emerging markets securities risk. Emerging markets (also referred to as developing markets) are generally subject to greater market volatility, political, social and economic instability, uncertain trading markets and more governmental limitations on foreign investment than more developed markets. In addition, companies operating in emerging markets may be subject to lower trading volume and greater price fluctuations than companies in more developed markets. Securities law and the enforcement of systems of taxation in many emerging market countries may change quickly and unpredictably. In addition, investments in emerging |
| | | markets securities may also be subject to additional transaction costs, delays in settlement procedures, and lack of timely information. |
| ∎ | | Foreign securities risk. The Fund’s foreign investments may be adversely affected by political and social instability, changes in economic or taxation policies, difficulty in enforcing obligations, decreased liquidity or increased volatility. Foreign investments also involve the risk of the possible seizure, nationalization or expropriation of the issuer or foreign deposits (in which the Fund could lose its entire investments in a certain market) and the possible adoption of foreign governmental restrictions such as exchange controls. Unless the Fund has hedged its foreign securities risk, foreign securities risk also involves the risk of negative foreign currency rate fluctuations, which may cause the value of securities denominated in such foreign currency (or other instruments through which the Fund has exposure to foreign currencies) to decline in value. Currency exchange rates may fluctuate significantly over short periods of time. Currency hedging strategies, if used, are not always successful. |
| ∎ | | Geographic focus risk. The Fund may from time to time invest a substantial amount of its assets in securities of issuers located in a single country or a limited number of countries. Adverse economic, political or social conditions in those countries may therefore have a significant negative impact on the Fund’s investment performance. |
| ∎ | | Management risk. The Fund is actively managed and depends heavily on the Adviser’s judgment about markets, interest rates or the attractiveness, relative values, liquidity, or potential appreciation of particular investments made for the Fund’s portfolio. The Fund could experience losses if these judgments prove to be incorrect. Additionally, legislative, regulatory, or tax developments may adversely affect management of the Fund and, therefore, the |
| | | ability of the Fund to achieve its investment objective. |
| ∎ | | Market risk. The market values of the Fund’s investments, and therefore the value of the Fund’s shares, will go up and down, sometimes rapidly or unpredictably. Market risk may affect a single issuer, industry or section of the economy, or it may affect the market as a whole. Individual stock prices tend to go up and down more dramatically than those of certain other types of investments, such as bonds. During a general downturn in the financial markets, multiple asset classes may decline in value. When markets perform well, there can be no assurance that specific investments held by the Fund will rise in value. |
| ∎ | | Preferred securities risk. Preferred securities are subject to issuer-specific and market risks applicable generally to equity securities. Preferred securities also may be subordinated to bonds or other debt instruments, subjecting them to a greater risk of non-payment, may be less liquid than many other securities, such as common stocks, and generally offer no voting rights with respect to the issuer. |
| ∎ | | Sector focus risk. The Fund may from time to time invest a significant amount of its assets (i.e. over 25%) in one market sector or group of related industries. In this event, the Fund’s performance will depend to a greater extent on the overall condition of the sector or group of industries and there is increased risk that the Fund will lose significant value if conditions adversely affect that sector or group of industries. |
| ∎ | | Small- and mid-capitalization companies risks. Small-and mid-capitalization companies tend to be more vulnerable to changing market conditions, may have little or no operating history or track record of success, and may have more limited product lines and markets, less experienced management and fewer financial resources than larger companies. These companies’ securities may be more volatile and less liquid than those of more established companies, and their returns may vary, sometimes significantly, from the overall securities market. |
|
This report must be accompanied or preceded by a currently effective Fund prospectus, which contains more complete information, including sales charges and expenses. Investors should read it carefully before investing. |
|
|
| NOT FDIC INSURED | MAY LOSE VALUE | NO BANK GUARANTEE |
|
| 8 Invesco Emerging Markets Equity Fund |
| ∎ | | Value investing style risk. A value investing style subjects the Fund to the risk that the valuations never improve or that the returns on value equity securities are less than returns on other styles of investing or the overall stock market. |
About indexes used in this report
| ∎ | | The MSCI EAFE® Index is an unmanaged index considered representative of stocks of Europe, Australasia and the Far East. The index is computed using the net return, which withholds applicable taxes for non-resident investors. |
| ∎ | | The MSCI Emerging Markets IndexSM is an unmanaged index considered representative of stocks of developing countries. The index is computed using the net return, which withholds applicable taxes for non-resident investors. |
| ∎ | | The Lipper Emerging Market Funds Index is an unmanaged index considered representative of emerging market funds tracked by Lipper. |
| ∎ | | The Fund is not managed to track the performance of any particular index, including the index(es) described here, and consequently, the performance of the Fund may deviate significantly from the performance of the index(es). |
| ∎ | | A direct investment cannot be made in an index. Unless otherwise indicated, index results include reinvested dividends, and they do not reflect sales charges. Performance of the peer group, if applicable, reflects fund expenses; performance of a market index does not. |
Other information
| ∎ | | The returns shown in management’s discussion of Fund performance are based on net asset values (NAVs) calculated for shareholder transactions. Generally accepted accounting principles require adjustments to be made to the net assets of the Fund at period end for financial reporting purposes, and as such, the NAVs for shareholder transactions and the returns based on those NAVs may differ from the NAVs and returns reported in the Financial Highlights. |
| ∎ | | Industry classifications used in this report are generally according to the Global Industry Classification Standard, which was developed by and is the exclusive property and a service mark of MSCI Inc. and Standard & Poor’s. |
|
| 9 Invesco Emerging Markets Equity Fund |
Schedule of Investments
October 31, 2017
| | | | | | | | |
| | | Shares | | | Value | |
Common Stocks & Other Equity Interests–97.64% | |
| Argentina–4.23% | |
Banco Macro S.A.–ADR | | | 5,423 | | | $ | 682,864 | |
Grupo Financiero Galicia S.A.–ADR | | | 11,940 | | | | 655,506 | |
MercadoLibre Inc. | | | 1,893 | | | | 454,907 | |
| | | �� | | 1,793,277 | |
|
| Brazil–7.20% | |
Banco do Brasil S.A. | | | 59,900 | | | | 633,186 | |
Grendene S.A. | | | 86,400 | | | | 723,676 | |
Multiplus S.A. | | | 43,100 | | | | 501,448 | |
Petróleo Brasileiro S.A.–Preference
Shares(a) | | | 99,800 | | | | 512,530 | |
Raia Drogasil S.A. | | | 28,200 | | | | 678,600 | |
| | | | | 3,049,440 | |
|
| China–27.22% | |
Agricultural Bank of China Ltd.–Class H | | | 1,362,000 | | | | 640,723 | |
Baidu, Inc.–ADR(a) | | | 5,133 | | | | 1,252,144 | |
Bank of China Ltd.–Class H | | | 2,076,000 | | | | 1,035,153 | |
Hangzhou Robam Appliances Co. Ltd.–Class A | | | 128,830 | | | | 903,534 | |
Nexteer Automotive Group Ltd. | | | 348,000 | | | | 680,709 | |
PICC Property and Casualty Co. Ltd.–
Class H | | | 352,000 | | | | 697,557 | |
Ping An Insurance (Group) Co. of China Ltd.–Class H | | | 99,000 | | | | 869,267 | |
Shenzhou International Group Holdings Ltd. | | | 98,000 | | | | 836,619 | |
TAL Education Group–ADR | | | 22,844 | | | | 628,210 | |
Tencent Holdings Ltd. | | | 50,700 | | | | 2,283,633 | |
Wuliangye Yibin Co., Ltd.–Class A | | | 65,000 | | | | 652,645 | |
Zhengzhou Yutong Bus Co., Ltd.–Class A | | | 152,700 | | | | 585,484 | |
Zhuzhou CRRC Times Electric Co., Ltd.–Class H | | | 79,700 | | | | 466,366 | |
| | | | | 11,532,044 | |
|
| Hong Kong–4.10% | |
AIA Group Ltd. | | | 129,200 | | | | 972,138 | |
Techtronic Industries Co. Ltd. | | | 130,500 | | | | 765,295 | |
| | | | | 1,737,433 | |
|
| India–10.18% | |
Asian Paints Ltd. | | | 18,779 | | | | 342,487 | |
Britannia Industries Ltd. | | | 5,433 | | | | 389,303 | |
Eicher Motors Ltd. | | | 814 | | | | 405,236 | |
HDFC Bank Ltd. | | | 34,507 | | | | 964,988 | |
Housing Development Finance Corp. Ltd. | | | 28,938 | | | | 763,099 | |
InterGlobe Aviation Ltd.–REGS(b) | | | 20,596 | | | | 396,938 | |
Maruti Suzuki India Ltd. | | | 3,552 | | | | 450,463 | |
Tata Consultancy Services Ltd. | | | 14,763 | | | | 598,879 | |
| | | | | 4,311,393 | |
|
| Indonesia–3.00% | |
PT Bank Rakyat Indonesia (Persero) Tbk | | | 689,600 | | | | 794,674 | |
PT Link Net Tbk | | | 1,295,900 | | | | 476,778 | |
| | | | | 1,271,452 | |
|
| Malaysia–1.34% | |
My E.G. Services Bhd | | | 1,096,700 | | | | 568,261 | |
| | | | | | | | |
| | | Shares | | | Value | |
| Mexico–2.48% | |
Banregio Grupo Financiero, S.A.B. de C.V. | | | 99,500 | | | $ | 530,732 | |
Fomento Economico Mexicano, S.A.B. de C.V.–ADR | | | 5,906 | | | | 518,252 | |
| | | | | 1,048,984 | |
|
| Peru–1.77% | |
Credicorp Ltd. | | | 3,584 | | | | 750,633 | |
|
| Russia–4.09% | |
Sberbank of Russia PJSC–ADR | | | 78,777 | | | | 1,130,450 | |
Yandex N.V.–Class A(a) | | | 17,803 | | | | 602,275 | |
| | | | | 1,732,725 | |
|
| South Africa–3.90% | |
Clicks Group Ltd. | | | 31,945 | | | | 359,650 | |
Naspers Ltd.–Class N | | | 5,239 | | | | 1,294,570 | |
| | | | | 1,654,220 | |
|
| South Korea–11.67% | |
Hanssem Co., Ltd. | | | 4,517 | | | | 689,286 | |
KEPCO Plant Service & Engineering Co., Ltd. | | | 7,961 | | | | 293,473 | |
Koh Young Technology Inc. | | | 9,375 | | | | 642,662 | |
LOEN Entertainment, Inc. | | �� | 6,848 | | | | 650,974 | |
Ottogi Corp. | | | 715 | | | | 484,393 | |
Samsung Electronics Co., Ltd. | | | 886 | | | | 2,181,062 | |
| | | | | 4,941,850 | |
|
| Taiwan–8.96% | |
Eclat Textile Co., Ltd. | | | 41,800 | | | | 499,582 | |
King Slide Works Co., Ltd. | | | 55,000 | | | | 735,752 | |
President Chain Store Corp. | | | 61,000 | | | | 549,946 | |
Taiwan Semiconductor Manufacturing Co. Ltd. | | | 249,000 | | | | 2,010,984 | |
| | | | | 3,796,264 | |
|
| Thailand–5.97% | |
Beauty Community PCL–NVDR | | | 1,869,600 | | | | 1,007,158 | |
Delta Electronics (Thailand) PCL | | | 250,900 | | | | 649,374 | |
Kasikornbank PCL | | | 126,700 | | | | 871,101 | |
| | | | | 2,527,633 | |
|
| United States–1.53% | |
EPAM Systems, Inc.(a) | | | 7,116 | | | | 648,622 | |
Total Common Stocks & Other Equity Interests
(Cost $32,424,591) | | | | 41,364,231 | |
|
Money Market Funds–2.11% | |
Invesco Government & Agency Portfolio– Institutional Class, 0.95%(c) | | | 536,134 | | | | 536,134 | |
Invesco Treasury Portfolio–Institutional Class, 0.94%(c) | | | 357,423 | | | | 357,423 | |
Total Money Market Funds
(Cost $893,557) | | | | 893,557 | |
TOTAL INVESTMENTS IN SECURITIES–99.75%
(Cost $33,318,148) | | | | 42,257,788 | |
OTHER ASSETS LESS LIABILITIES–0.25% | | | | 105,021 | |
NET ASSETS–100.00% | | | $ | 42,362,809 | |
See accompanying Notes to Financial Statements which are an integral part of the financial statements.
10 Invesco Emerging Markets Equity Fund
Investment Abbreviations:
| | |
| ADR | | – American Depositary Receipt |
| NVDR | | – Non-Voting Depositary Receipt |
| REGS | | – Regulation S |
Notes to Schedule of Investments:
| (a) | Non-income producing security. |
| (b) | Security purchased or received in transaction exempt from registration under the Securities Act of 1933, as amended (the “1933 Act”). The security may be resold pursuant to an exemption from registration under the 1933 Act, typically to qualified institutional buyers. The value of this security at October 31, 2017 represented less than 1% of the Fund’s Net Assets. |
| (c) | The money market fund and the Fund are affiliated by having the same investment adviser. The rate shown is the 7-day SEC standardized yield as of October 31, 2017. |
See accompanying Notes to Financial Statements which are an integral part of the financial statements.
11 Invesco Emerging Markets Equity Fund
Statement of Assets and Liabilities
October 31, 2017
| | | | |
Assets: | | | | |
Investments in securities, at value (Cost $32,424,591) | | $ | 41,364,231 | |
Investments in affiliated money market funds, at value and cost | | | 893,557 | |
Foreign currencies, at value (Cost $52,742) | | | 52,152 | |
Receivable for: | |
Fund shares sold | | | 211,894 | |
Dividends | | | 6,247 | |
Investment for trustee deferred compensation and retirement plans | | | 20,169 | |
Other assets | | | 37,828 | |
Total assets | | | 42,586,078 | |
| |
Liabilities: | | | | |
Payable for: | |
Fund shares reacquired | | | 9,192 | |
Accrued foreign taxes | | | 99,045 | |
Accrued fees to affiliates | | | 34,017 | |
Accrued trustees’ and officers’ fees and benefits | | | 1,887 | |
Accrued other operating expenses | | | 58,146 | |
Trustee deferred compensation and retirement plans | | | 20,982 | |
Total liabilities | | | 223,269 | |
Net assets applicable to shares outstanding | | $ | 42,362,809 | |
| |
Net assets consist of: | | | | |
Shares of beneficial interest | | $ | 37,496,315 | |
Undistributed net investment income | | | 25,456 | |
Undistributed net realized gain (loss) | | | (4,097,948 | ) |
Net unrealized appreciation | | | 8,938,986 | |
| | | $ | 42,362,809 | |
| | | | |
Net Assets: | | | | |
Class A | | $ | 24,297,254 | |
Class C | | $ | 6,792,605 | |
Class R | | $ | 2,189,640 | |
Class Y | | $ | 7,111,290 | |
Class R5 | | $ | 1,960,001 | |
Class R6 | | $ | 12,019 | |
| |
Shares outstanding, no par value,
with an unlimited number of shares authorized: | | | | |
Class A | | | 2,613,077 | |
Class C | | | 751,806 | |
Class R | | | 237,815 | |
Class Y | | | 762,262 | |
Class R5 | | | 210,073 | |
Class R6 | | | 1,290 | |
Class A: | |
Net asset value per share | | $ | 9.30 | |
Maximum offering price per share | |
(Net asset value of $9.30 ¸ 94.50%) | | $ | 9.84 | |
Class C: | |
Net asset value and offering price per share | | $ | 9.04 | |
Class R: | |
Net asset value and offering price per share | | $ | 9.21 | |
Class Y: | |
Net asset value and offering price per share | | $ | 9.33 | |
Class R5: | |
Net asset value and offering price per share | | $ | 9.33 | |
Class R6: | |
Net asset value and offering price per share | | $ | 9.32 | |
See accompanying Notes to Financial Statements which are an integral part of the financial statements.
12 Invesco Emerging Markets Equity Fund
Statement of Operations
For the year ended October 31, 2017
| | | | |
Investment income: | |
Dividends (net of foreign withholding taxes of $57,520) | | $ | 517,771 | |
Dividends from affiliated money market funds | | | 5,183 | |
Total investment income | | | 522,954 | |
|
Expenses: | |
Advisory fees | | | 294,823 | |
Administrative services fees | | | 50,000 | |
Custodian fees | | | 55,853 | |
Distribution fees: | | | | |
Class A | | | 38,140 | |
Class C | | | 42,888 | |
Class R | | | 8,338 | |
Transfer agent fees — A, C, R and Y | | | 77,516 | |
Transfer agent fees — R5 | | | 30 | |
Transfer agent fees — R6 | | | 59 | |
Trustees’ and officers’ fees and benefits | | | 20,536 | |
Registration and filing fees | | | 74,991 | |
Reports to shareholders | | | 29,123 | |
Professional services fees | | | 64,633 | |
Other | | | 12,736 | |
Total expenses | | | 769,666 | |
Less: Fees waived, expenses reimbursed and expense offset arrangement(s) | | | (331,101 | ) |
Net expenses | | | 438,565 | |
Net investment income | | | 84,389 | |
| |
Realized and unrealized gain (loss) from: | | | | |
Net realized gain (loss) from: | | | | |
Investment securities (net of foreign taxes of $30,752) | | | 1,772,349 | |
Foreign currencies | | | (4,456 | ) |
| | | | 1,767,893 | |
Change in net unrealized appreciation (depreciation) of: | | | | |
Investment securities (net of foreign taxes of $47,137) | | | 6,895,874 | |
Foreign currencies | | | (447 | ) |
| | | | 6,895,427 | |
Net realized and unrealized gain | | | 8,663,320 | |
Net increase in net assets resulting from operations | | $ | 8,747,709 | |
See accompanying Notes to Financial Statements which are an integral part of the financial statements.
13 Invesco Emerging Markets Equity Fund
Statement of Changes in Net Assets
For the years ended October 31, 2017 and 2016
| | | | | | | | |
| | | 2017 | | | 2016 | |
Operations: | | | | | |
Net investment income | | $ | 84,389 | | | $ | 94,910 | |
Net realized gain (loss) | | | 1,767,893 | | | | (225,176 | ) |
Change in net unrealized appreciation | | | 6,895,427 | | | | 2,616,702 | |
Net increase in net assets resulting from operations | | | 8,747,709 | | | | 2,486,436 | |
| | |
Distributions to shareholders from net investment income: | | | | | | | | |
Class A | | | (11,076 | ) | | | — | |
Class Y | | | (17,401 | ) | | | — | |
Class R5 | | | (4,962 | ) | | | — | |
Class R6 | | | (22,501 | ) | | | — | |
Total distributions from net investment income | | | (55,940 | ) | | | — | |
| | |
Share transactions–net: | | | | | | | | |
Class A | | | 8,005,020 | | | | 308,968 | |
Class C | | | 2,423,355 | | | | 325,234 | |
Class R | | | 449,330 | | | | (42,617 | ) |
Class Y | | | 758,252 | | | | 886,210 | |
Class R5 | | | 4,962 | | | | 477,784 | |
Class R6 | | | (7,195,831 | ) | | | (1,154,945 | ) |
Net increase in net assets resulting from share transactions | | | 4,445,088 | | | | 800,634 | |
Net increase in net assets | | | 13,136,857 | | | | 3,287,070 | |
| | |
Net assets: | | | | | | | | |
Beginning of year | | | 29,225,952 | | | | 25,938,882 | |
End of year (includes undistributed net investment income of $25,456 and $32,215, respectively) | | $ | 42,362,809 | | | $ | 29,225,952 | |
Notes to Financial Statements
October 31, 2017
NOTE 1—Significant Accounting Policies
Invesco Emerging Markets Equity Fund (the “Fund”) is a series portfolio of AIM Investment Funds (Invesco Investment Funds) (the “Trust”). The Trust is organized as a Delaware statutory trust and is registered under the Investment Company Act of 1940, as amended (the “1940 Act”), as an open-end series management investment company consisting of twenty separate series portfolios, each authorized to issue an unlimited number of shares of beneficial interest. The assets, liabilities and operations of each portfolio are accounted for separately. Information presented in these financial statements pertains only to the Fund. Matters affecting each portfolio or class will be voted on exclusively by the shareholders of such portfolio or class.
The Fund’s investment objective is long-term growth of capital.
The Fund currently consists of six different classes of shares: Class A, Class C, Class R, Class Y, Class R5 and Class R6. Class Y shares are available only to certain investors. Class A shares are sold with a front-end sales charge unless certain waiver criteria are met and under certain circumstances load waived shares may be subject to contingent deferred sales charges (“CDSC”). Class C shares are sold with a CDSC. Class R, Class Y, Class R5 and Class R6 shares are sold at net asset value.
The Fund is an investment company and accordingly follows the investment company accounting and reporting guidance in accordance with Financial Accounting Standards Board Accounting Standards Codification Topic 946, Financial Services — Investment Companies.
The following is a summary of the significant accounting policies followed by the Fund in the preparation of its financial statements.
| A. | Security Valuations — Securities, including restricted securities, are valued according to the following policy. |
A security listed or traded on an exchange (except convertible securities) is valued at its last sales price or official closing price as of the close of the customary trading session on the exchange where the security is principally traded, or lacking any sales or official closing price on a particular day, the security may be valued at the closing bid price on that day. Securities traded in the over-the-counter market are valued based on prices furnished by independent pricing services or market makers. When such securities are valued by an independent pricing service they may be considered fair valued. Futures contracts are valued at the final settlement price set by an exchange on which they are principally traded. Listed options are valued at the mean between the last bid and asked prices from the exchange on which they are principally traded. Options not listed on an exchange are valued by an independent source at the mean between the last bid and asked prices. For purposes of determining net asset value (“NAV”) per share, futures and option contracts generally are valued 15 minutes after the close of the customary trading session of the New York Stock Exchange (“NYSE”).
14 Invesco Emerging Markets Equity Fund
Investments in open-end and closed-end registered investment companies that do not trade on an exchange are valued at the end-of-day net asset value per share. Investments in open-end and closed-end registered investment companies that trade on an exchange are valued at the last sales price or official closing price as of the close of the customary trading session on the exchange where the security is principally traded.
Debt obligations (including convertible securities) and unlisted equities are fair valued using an evaluated quote provided by an independent pricing service. Evaluated quotes provided by the pricing service may be determined without exclusive reliance on quoted prices, and may reflect appropriate factors such as institution-size trading in similar groups of securities, developments related to specific securities, dividend rate (for unlisted equities), yield (for debt obligations), quality, type of issue, coupon rate (for debt obligations), maturity (for debt obligations), individual trading characteristics and other market data. Pricing services generally value debt obligations assuming orderly transactions of institutional round lot size, but a fund may hold or transact in the same securities in smaller, odd lot sizes. Odd lots often trade at lower prices than institutional round lots. Debt obligations are subject to interest rate and credit risks. In addition, all debt obligations involve some risk of default with respect to interest and/or principal payments.
Foreign securities’ (including foreign exchange contracts) prices are converted into U.S. dollar amounts using the applicable exchange rates as of the close of the NYSE. If market quotations are available and reliable for foreign exchange-traded equity securities, the securities will be valued at the market quotations. Because trading hours for certain foreign securities end before the close of the NYSE, closing market quotations may become unreliable. If between the time trading ends on a particular security and the close of the customary trading session on the NYSE, events occur that the investment adviser determines are significant and make the closing price unreliable, the Fund may fair value the security. If the event is likely to have affected the closing price of the security, the security will be valued at fair value in good faith using procedures approved by the Board of Trustees. Adjustments to closing prices to reflect fair value may also be based on a screening process of an independent pricing service to indicate the degree of certainty, based on historical data, that the closing price in the principal market where a foreign security trades is not the current value as of the close of the NYSE. Foreign securities’ prices meeting the approved degree of certainty that the price is not reflective of current value will be priced at the indication of fair value from the independent pricing service. Multiple factors may be considered by the independent pricing service in determining adjustments to reflect fair value and may include information relating to sector indices, American Depositary Receipts and domestic and foreign index futures. Foreign securities may have additional risks including exchange rate changes, potential for sharply devalued currencies and high inflation, political and economic upheaval, the relative lack of issuer information, relatively low market liquidity and the potential lack of strict financial and accounting controls and standards.
Securities for which market prices are not provided by any of the above methods may be valued based upon quotes furnished by independent sources. The last bid price may be used to value equity securities. The mean between the last bid and asked prices is used to value debt obligations, including corporate loans.
Securities for which market quotations are not readily available or became unreliable are valued at fair value as determined in good faith by or under the supervision of the Trust’s officers following procedures approved by the Board of Trustees. Issuer specific events, market trends, bid/asked quotes of brokers and information providers and other market data may be reviewed in the course of making a good faith determination of a security’s fair value.
The Fund may invest in securities that are subject to interest rate risk, meaning the risk that the prices will generally fall as interest rates rise and, conversely, the prices will generally rise as interest rates fall. Specific securities differ in their sensitivity to changes in interest rates depending on their individual characteristics. Changes in interest rates may result in increased market volatility, which may affect the value and/or liquidity of certain Fund investments.
Valuations change in response to many factors including the historical and prospective earnings of the issuer, the value of the issuer’s assets, general economic conditions, interest rates, investor perceptions and market liquidity. Because of the inherent uncertainties of valuation, the values reflected in the financial statements may materially differ from the value received upon actual sale of those investments.
| B. | Securities Transactions and Investment Income — Securities transactions are accounted for on a trade date basis. Realized gains or losses on sales are computed on the basis of specific identification of the securities sold. Interest income (net of withholding tax, if any) is recorded on the accrual basis from settlement date. Dividend income (net of withholding tax, if any) is recorded on the ex-dividend date. |
The Fund may periodically participate in litigation related to Fund investments. As such, the Fund may receive proceeds from litigation settlements. Any proceeds received are included in the Statement of Operations as realized gain (loss) for investments no longer held and as unrealized gain (loss) for investments still held.
Brokerage commissions and mark ups are considered transaction costs and are recorded as an increase to the cost basis of securities purchased and/or a reduction of proceeds on a sale of securities. Such transaction costs are included in the determination of net realized and unrealized gain (loss) from investment securities reported in the Statement of Operations and the Statement of Changes in Net Assets and the net realized and unrealized gains (losses) on securities per share in the Financial Highlights. Transaction costs are included in the calculation of the Fund’s net asset value and, accordingly, they reduce the Fund’s total returns. These transaction costs are not considered operating expenses and are not reflected in net investment income reported in the Statement of Operations and the Statement of Changes in Net Assets, or the net investment income per share and the ratios of expenses and net investment income reported in the Financial Highlights, nor are they limited by any expense limitation arrangements between the Fund and the investment adviser.
The Fund allocates income and realized and unrealized capital gains and losses to a class based on the relative net assets of each class.
| C. | Country Determination — For the purposes of making investment selection decisions and presentation in the Schedule of Investments, the investment adviser may determine the country in which an issuer is located and/or credit risk exposure based on various factors. These factors include the laws of the country under which the issuer is organized, where the issuer maintains a principal office, the country in which the issuer derives 50% or more of its total revenues and the country that has the primary market for the issuer’s securities, as well as other criteria. Among the other criteria that may be evaluated for making this determination are the country in which the issuer maintains 50% or more of its assets, the type of security, financial guarantees and enhancements, the nature of the collateral and the sponsor organization. Country of issuer and/or credit risk exposure has been determined to be the United States of America, unless otherwise noted. |
| D. | Distributions — Distributions from net investment income and net realized capital gain, if any, are generally declared and paid annually and recorded on the ex-dividend date. The Fund may elect to treat a portion of the proceeds from redemptions as distributions for federal income tax purposes. |
15 Invesco Emerging Markets Equity Fund
| E. | Federal Income Taxes — The Fund intends to comply with the requirements of Subchapter M of the Internal Revenue Code of 1986, as amended (the “Internal Revenue Code”), necessary to qualify as a regulated investment company and to distribute substantially all of the Fund’s taxable earnings to shareholders. As such, the Fund will not be subject to federal income taxes on otherwise taxable income (including net realized capital gain) that is distributed to shareholders. Therefore, no provision for federal income taxes is recorded in the financial statements. |
The Fund recognizes the tax benefits of uncertain tax positions only when the position is more likely than not to be sustained. Management has analyzed the Fund’s uncertain tax positions and concluded that no liability for unrecognized tax benefits should be recorded related to uncertain tax positions. Management is not aware of any tax positions for which it is reasonably possible that the total amounts of unrecognized tax benefits will change materially in the next 12 months.
The Fund files tax returns in the U.S. Federal jurisdiction and certain other jurisdictions. Generally, the Fund is subject to examinations by such taxing authorities for up to three years after the filing of the return for the tax period.
| F. | Expenses — Fees provided for under the Rule 12b-1 plan of a particular class of the Fund are charged to the operations of such class. Transfer agency fees and expenses and other shareholder recordkeeping fees and expenses attributable to Class R5 and Class R6 are allocated to each share class based on relative net assets. Sub-accounting fees attributable to Class R5 are charged to the operations of the class. Transfer agency fees and expenses and other shareholder recordkeeping fees and expenses relating to all other classes are allocated among those classes based on relative net assets. All other expenses are allocated among the classes based on relative net assets. |
| G. | Accounting Estimates — The preparation of financial statements in conformity with accounting principles generally accepted in the United States of America (“GAAP”) requires management to make estimates and assumptions that affect the reported amounts of assets and liabilities at the date of the financial statements and the reported amounts of revenues and expenses during the reporting period including estimates and assumptions related to taxation. Actual results could differ from those estimates by a significant amount. In addition, the Fund monitors for material events or transactions that may occur or become known after the period-end date and before the date the financial statements are released to print. |
| H. | Indemnifications — Under the Trust’s organizational documents, each Trustee, officer, employee or other agent of the Trust is indemnified against certain liabilities that may arise out of the performance of their duties to the Fund. Additionally, in the normal course of business, the Fund enters into contracts, including the Fund’s servicing agreements, that contain a variety of indemnification clauses. The Fund’s maximum exposure under these arrangements is unknown as this would involve future claims that may be made against the Fund that have not yet occurred. The risk of material loss as a result of such indemnification claims is considered remote. |
| I. | Foreign Currency Translations — Foreign currency is valued at the close of the NYSE based on quotations posted by banks and major currency dealers. Portfolio securities and other assets and liabilities denominated in foreign currencies are translated into U.S. dollar amounts at date of valuation. Purchases and sales of portfolio securities (net of foreign taxes withheld on disposition) and income items denominated in foreign currencies are translated into U.S. dollar amounts on the respective dates of such transactions. The Fund does not separately account for the portion of the results of operations resulting from changes in foreign exchange rates on investments and the fluctuations arising from changes in market prices of securities held. The combined results of changes in foreign exchange rates and the fluctuation of market prices on investments (net of estimated foreign tax withholding) are included with the net realized and unrealized gain or loss from investments in the Statement of Operations. Reported net realized foreign currency gains or losses arise from (1) sales of foreign currencies, (2) currency gains or losses realized between the trade and settlement dates on securities transactions, and (3) the difference between the amounts of dividends, interest, and foreign withholding taxes recorded on the Fund’s books and the U.S. dollar equivalent of the amounts actually received or paid. Net unrealized foreign currency gains and losses arise from changes in the fair values of assets and liabilities, other than investments in securities at fiscal period end, resulting from changes in exchange rates. |
The Fund may invest in foreign securities, which may be subject to foreign taxes on income, gains on investments or currency repatriation, a portion of which may be recoverable. Foreign taxes, if any, are recorded based on the tax regulations and rates that exist in the foreign markets in which the Fund invests and are shown in the Statement of Operations.
| J. | Forward Foreign Currency Contracts — The Fund may engage in foreign currency transactions either on a spot (i.e. for prompt delivery and settlement) basis, or through forward foreign currency contracts, to manage or minimize currency or exchange rate risk. |
The Fund may also enter into forward foreign currency contracts for the purchase or sale of a security denominated in a foreign currency in order to “lock in” the U.S. dollar price of that security, or the Fund may also enter into forward foreign currency contracts that do not provide for physical settlement of the two currencies, but instead are settled by a single cash payment calculated as the difference between the agreed upon exchange rate and the spot rate at settlement based upon an agreed upon notional amount (non-deliverable forwards). The Fund will set aside liquid assets in an amount equal to the daily mark-to-market obligation for forward foreign currency contracts.
A forward foreign currency contract is an obligation between two parties (“Counterparties”) to purchase or sell a specific currency for an agreed-upon price at a future date. The use of forward foreign currency contracts does not eliminate fluctuations in the price of the underlying securities the Fund owns or intends to acquire but establishes a rate of exchange in advance. Fluctuations in the value of these contracts are measured by the difference in the contract date and reporting date exchange rates and are recorded as unrealized appreciation (depreciation) until the contracts are closed. When the contracts are closed, realized gains (losses) are recorded. Realized and unrealized gains (losses) on the contracts are included in the Statement of Operations. The primary risks associated with forward foreign currency contracts include failure of the Counterparty to meet the terms of the contract and the value of the foreign currency changing unfavorably. These risks may be in excess of the amounts reflected in the Statement of Assets and Liabilities.
16 Invesco Emerging Markets Equity Fund
NOTE 2—Advisory Fees and Other Fees Paid to Affiliates
The Trust has entered into a master investment advisory agreement with Invesco Advisers, Inc. (the “Adviser” or “Invesco”). Under the terms of the investment advisory agreement, the Fund accrues daily and pays monthly an advisory fee to the Adviser based on the annual rate of the Fund’s average daily net assets as follows:
| | | | | | | | |
| Average Daily Net Assets | | Rate | |
First $250 million | | | 0 | .935% | | | | |
Next $250 million | | | 0 | .91% | | | | |
Next $500 million | | | 0 | .885% | | | | |
Next $1.5 billion | | | 0 | .86% | | | | |
Next $2.5 billion | | | 0 | .835% | | | | |
Next $2.5 billion | | | 0 | .81% | | | | |
Next $2.5 billion | | | 0 | .785% | | | | |
Over $10 billion | | | 0 | .76% | | | | |
For the year ended October 31, 2017, the effective advisory fees incurred by the Fund was 0.935%.
Under the terms of a master sub-advisory agreement between the Adviser and each of Invesco Asset Management Deutschland GmbH, Invesco Asset Management Limited, Invesco Asset Management (Japan) Limited, Invesco Hong Kong Limited, Invesco Senior Secured Management, Inc. and Invesco Canada Ltd. and separate sub-advisory agreements with Invesco PowerShares Capital Management LLC and Invesco Asset Management (India) Private Limited (collectively, the “Affiliated Sub-Advisers”) the Adviser, not the Fund, will pay 40% of the fees paid to the Adviser to any such Affiliated Sub-Adviser(s) that provide(s) discretionary investment management services to the Fund based on the percentage of assets allocated to such Affiliated Sub-Adviser(s).
Effective January 1, 2017, the Adviser has contractually agreed, through at least February 28, 2019, to waive advisory fees and/or reimburse expenses to the extent necessary to limit total annual fund operating expenses after fee waiver and/or expense reimbursement (excluding certain items discussed below) of Class A, Class C, Class R, Class Y, Class R5 and Class R6 shares to 1.33%, 2.08%, 1.58%, 1.08%, 1.08% and 1.08%, respectively, of the Fund’s average daily net assets (the “expense limits”). Prior to January 1, 2017, the Adviser had contractually agreed to waive advisory fees and/or reimburse expenses to the extent necessary to limit total annual fund operating expenses after fee waiver and/or expense reimbursement (excluding certain items discussed below) of Class A, Class C, Class R, Class Y, Class R5 and Class R6 shares to 1.54%, 2.29%, 1.79%, 1.29%, 1.29% and 1.29%, respectively, of the Fund’s average daily net assets. In determining the Adviser’s obligation to waive advisory fees and/or reimburse expenses, the following expenses are not taken into account, and could cause the total annual fund operating expenses after fee waiver and/or expense reimbursement to exceed the numbers reflected above: (1) interest; (2) taxes; (3) dividend expense on short sales; (4) extraordinary or non-routine items, including litigation expenses; and (5) expenses that the Fund has incurred but did not actually pay because of an expense offset arrangement. Unless Invesco continues the fee waiver agreement, it will terminate on February 28, 2019. During its term, the fee waiver agreement cannot be terminated or amended to increase the expense limits without approval of the Board of Trustees.
Further, the Adviser has contractually agreed, through at least June 30, 2019, to waive the advisory fee payable by the Fund in an amount equal to 100% of the net advisory fees the Adviser receives from the affiliated money market funds on investments by the Fund of uninvested cash in such affiliated money market funds.
For the year ended October 31, 2017, the Adviser waived advisory fees of $253,496 and reimbursed class level expenses of $43,584, $12,252, $4,764, $15,622, $30 and $59 of Class A, Class C, Class R, Class Y, Class R5 and Class R6 shares, respectively.
The Trust has entered into a master administrative services agreement with Invesco pursuant to which the Fund has agreed to pay Invesco for certain administrative costs incurred in providing accounting services to the Fund. For the year ended October 31, 2017, expenses incurred under the agreement are shown in the Statement of Operations as Administrative services fees.
The Trust has entered into a transfer agency and service agreement with Invesco Investment Services, Inc. (“IIS”) pursuant to which the Fund has agreed to pay IIS a fee for providing transfer agency and shareholder services to the Fund and reimburse IIS for certain expenses incurred by IIS in the course of providing such services. IIS may make payments to intermediaries that provide omnibus account services, sub-accounting services and/or networking services. All fees payable by IIS to intermediaries that provide omnibus account services or sub-accounting services are charged back to the Fund, subject to certain limitations approved by the Trust’s Board of Trustees. For the year ended October 31, 2017, expenses incurred under the agreement are shown in the Statement of Operations as Transfer agent fees.
The Trust has entered into master distribution agreements with Invesco Distributors, Inc. (“IDI”) to serve as the distributor for the Class A, Class C, Class R, Class Y, Class R5 and Class R6 shares of the Fund. The Trust has adopted plans pursuant to Rule 12b-1 under the 1940 Act with respect to the Fund’s Class A, Class C and Class R shares (collectively the “Plans”). The Fund, pursuant to the Plans, pays IDI compensation at the annual rate of 0.25% of the Fund’s average daily net assets of Class A shares, 1.00% of the average daily net assets of Class C shares and 0.50% of the average daily net assets of Class R shares. The fees are accrued daily and paid monthly. Of the Plan payments, up to 0.25% of the average daily net assets of each class of shares may be paid to furnish continuing personal shareholder services to customers who purchase and own shares of such classes. Any amounts not paid as a service fee under the Plans would constitute an asset-based sales charge. Rules of the Financial Industry Regulatory Authority (“FINRA”) impose a cap on the total sales charges, including asset-based sales charges, that may be paid by any class of shares of the Fund. For the year ended October 31, 2017, expenses incurred under the Plans are shown in the Statement of Operations as Distribution fees.
Front-end sales commissions and CDSC (collectively, the “sales charges”) are not recorded as expenses of the Fund. Front-end sales commissions are deducted from proceeds from the sales of Fund shares prior to investment in Class A shares of the Fund. CDSC are deducted from redemption proceeds prior to remittance to the shareholder. During the year ended October 31, 2017, IDI advised the Fund that IDI retained $14,584 in front-end sales commissions from the sale of Class A shares and $2,518 and $227 from Class A and Class C shares, respectively, for CDSC imposed upon redemptions by shareholders.
Certain officers and trustees of the Trust are officers and directors of the Adviser, IIS and/or IDI.
17 Invesco Emerging Markets Equity Fund
NOTE 3—Additional Valuation Information
GAAP defines fair value as the price that would be received to sell an asset or paid to transfer a liability in an orderly transaction between market participants at the measurement date, under current market conditions. GAAP establishes a hierarchy that prioritizes the inputs to valuation methods, giving the highest priority to readily available unadjusted quoted prices in an active market for identical assets (Level 1) and the lowest priority to significant unobservable inputs (Level 3), generally when market prices are not readily available or are unreliable. Based on the valuation inputs, the securities or other investments are tiered into one of three levels. Changes in valuation methods may result in transfers in or out of an investment’s assigned level:
| | Level 1 — | Prices are determined using quoted prices in an active market for identical assets. |
| | Level 2 — | Prices are determined using other significant observable inputs. Observable inputs are inputs that other market participants may use in pricing a security. These may include quoted prices for similar securities, interest rates, prepayment speeds, credit risk, yield curves, loss severities, default rates, discount rates, volatilities and others. |
| | Level 3 — | Prices are determined using significant unobservable inputs. In situations where quoted prices or observable inputs are unavailable (for example, when there is little or no market activity for an investment at the end of the period), unobservable inputs may be used. Unobservable inputs reflect the Fund’s own assumptions about the factors market participants would use in determining fair value of the securities or instruments and would be based on the best available information. |
The following is a summary of the tiered valuation input levels, as of October 31, 2017. The level assigned to the securities valuations may not be an indication of the risk or liquidity associated with investing in those securities. Because of the inherent uncertainties of valuation, the values reflected in the financial statements may materially differ from the value received upon actual sale of those investments.
The Fund’s policy is to recognize transfers in and out of the valuation levels as of the end of the reporting period. During the year ended October 31, 2017, there were transfers from Level 1 to Level 2 of $5,779,017 and from Level 2 to Level 1 of $4,162,259, due to foreign fair value adjustments.
| | | | | | | | | | | | | | | | |
| | | Level 1 | | | Level 2 | | | Level 3 | | | Total | |
Argentina | | $ | 1,793,277 | | | $ | — | | | $ | — | | | $ | 1,793,277 | |
Brazil | | | 3,049,440 | | | | — | | | | — | | | | 3,049,440 | |
China | | | 8,344,877 | | | | 3,187,167 | | | | — | | | | 11,532,044 | |
Hong Kong | | | 1,737,433 | | | | — | | | | — | | | | 1,737,433 | |
India | | | 2,747,526 | | | | 1,563,867 | | | | — | | | | 4,311,393 | |
Indonesia | | | 476,778 | | | | 794,674 | | | | — | | | | 1,271,452 | |
Malaysia | | | — | | | | 568,261 | | | | — | | | | 568,261 | |
Mexico | | | 1,048,984 | | | | — | | | | — | | | | 1,048,984 | |
Peru | | | 750,633 | | | | — | | | | — | | | | 750,633 | |
Russia | | | 1,732,725 | | | | — | | | | — | | | | 1,732,725 | |
South Africa | | | — | | | | 1,654,220 | | | | — | | | | 1,654,220 | |
South Korea | | | 2,071,502 | | | | 2,870,348 | | | | — | | | | 4,941,850 | |
Taiwan | | | 1,235,334 | | | | 2,560,930 | | | | — | | | | 3,796,264 | |
Thailand | | | 1,656,532 | | | | 871,101 | | | | — | | | | 2,527,633 | |
United States | | | 648,622 | | | | — | | | | — | | | | 648,622 | |
Money Market Funds | | | 893,557 | | | | — | | | | — | | | | 893,557 | |
Total Investments | | $ | 28,187,220 | | | $ | 14,070,568 | | | $ | — | | | $ | 42,257,788 | |
NOTE 4—Expense Offset Arrangement(s)
The expense offset arrangement is comprised of transfer agency credits which result from balances in demand deposit accounts used by the transfer agent for clearing shareholder transactions. For the year ended October 31, 2017, the Fund received credits from this arrangement, which resulted in the reduction of the Fund’s total expenses of $1,294.
NOTE 5—Trustees’ and Officers’ Fees and Benefits
Trustees’ and Officers’ Fees and Benefits include amounts accrued by the Fund to pay remuneration to certain Trustees and Officers of the Fund. Trustees have the option to defer compensation payable by the Fund, and Trustees’ and Officers’ Fees and Benefits also include amounts accrued by the Fund to fund such deferred compensation amounts. Those Trustees who defer compensation have the option to select various Invesco Funds in which their deferral accounts shall be deemed to be invested. Finally, certain current Trustees were eligible to participate in a retirement plan that provided for benefits to be paid upon retirement to Trustees over a period of time based on the number of years of service. The Fund may have certain former Trustees who also participate in a retirement plan and receive benefits under such plan. Trustees’ and Officers’ Fees and Benefits include amounts accrued by the Fund to fund such retirement benefits. Obligations under the deferred compensation and retirement plans represent unsecured claims against the general assets of the Fund.
18 Invesco Emerging Markets Equity Fund
NOTE 6—Cash Balances
The Fund is permitted to temporarily carry a negative or overdrawn balance in its account with State Street Bank and Trust Company, the custodian bank. Such balances, if any at period-end, are shown in the Statement of Assets and Liabilities under the payable caption Amount due custodian. To compensate the custodian bank for such overdrafts, the overdrawn Fund may either (1) leave funds as a compensating balance in the account so the custodian bank can be compensated by earning the additional interest; or (2) compensate by paying the custodian bank at a rate agreed upon by the custodian bank and Invesco, not to exceed the contractually agreed upon rate.
NOTE 7—Distributions to Shareholders and Tax Components of Net Assets
Tax Character of Distributions to Shareholders Paid During the Fiscal Years Ended October 31, 2017 and 2016:
| | | | | | | | |
| | | 2017 | | | 2016 | |
Ordinary income | | $ | 55,940 | | | $ | — | |
Tax Components of Net Assets at Period-End:
| | | | |
| | | 2017 | |
Undistributed ordinary income | | $ | 44,186 | |
Net unrealized appreciation — investments | | | 8,872,074 | |
Net unrealized appreciation (depreciation) — foreign currencies | | | (654 | ) |
Temporary book/tax differences | | | (18,731 | ) |
Capital loss carryforward | | | (4,030,381 | ) |
Shares of beneficial interest | | | 37,496,315 | |
Total net assets | | $ | 42,362,809 | |
The difference between book-basis and tax-basis unrealized appreciation (depreciation) is due to differences in the timing of recognition of gains and losses on investments for tax and book purposes. The Fund’s net unrealized appreciation (depreciation) difference is attributable primarily to wash sales.
The temporary book/tax differences are a result of timing differences between book and tax recognition of income and/or expenses. The Fund’s temporary book/tax differences are the result of the trustee deferral of compensation and retirement plan benefits.
Capital loss carryforward is calculated and reported as of a specific date. Results of transactions and other activity after that date may affect the amount of capital loss carryforward actually available for the Fund to utilize. Capital losses generated in years beginning after December 22, 2010 can be carried forward for an unlimited period, whereas previous losses expire in eight tax years. Capital losses with an expiration period may not be used to offset capital gains until all net capital losses without an expiration date have been utilized. Capital loss carryforwards with no expiration date will retain their character as either short-term or long-term capital losses instead of as short-term capital losses as under prior law. The ability to utilize capital loss carryforwards in the future may be limited under the Internal Revenue Code and related regulations based on the results of future transactions.
The Fund has a capital loss carryforward as of October 31, 2017, which expires as follows:
| | | | | | | | | | | | |
| Capital Loss Carryforward* | |
| Expiration | | Short-Term | | | Long-Term | | | Total | |
Not subject to expiration | | $ | 4,030,381 | | | $ | — | | | $ | 4,030,381 | |
| * | Capital loss carryforward as of the date listed above is reduced for limitations, if any, to the extent required by the Internal Revenue Code and may be further limited depending upon a variety of factors, including the realization of net unrealized gains or losses as of the date of any reorganization. |
NOTE 8—Investment Transactions
The aggregate amount of investment securities (other than short-term securities, U.S. Treasury obligations and money market funds, if any) purchased and sold by the Fund during the year ended October 31, 2017 was $21,228,108 and $17,414,416, respectively. Cost of investments, including any derivatives, on a tax basis includes the adjustments for financial reporting purposes as of the most recently completed federal income tax reporting period-end.
| | | | |
| Unrealized Appreciation (Depreciation) of Investments on a Tax Basis | |
Aggregate unrealized appreciation of investments | | $ | 9,711,413 | |
Aggregate unrealized (depreciation) of investments | | | (839,339 | ) |
Net unrealized appreciation of investments | | $ | 8,872,074 | |
Cost of investments for tax purposes is $33,385,714.
19 Invesco Emerging Markets Equity Fund
NOTE 9—Reclassification of Permanent Differences
Primarily as a result of differing book/tax treatment of foreign capital gain taxes, on October 31, 2017, undistributed net investment income was decreased by $35,208 and undistributed net realized gain was increased by $35,208. This reclassification had no effect on the net assets of the Fund.
NOTE 10—Share Information
| | | | | | | | | | | | | | | | |
| | | Summary of Share Activity | |
| | | Years ended October 31, | |
| | | 2017(a) | | | 2016 | |
| | | Shares | | | Amount | | | Shares | | | Amount | |
Sold: | | | | | | | | | | | | | | | | |
Class A | | | 1,833,147 | | | $ | 14,913,268 | | | | 568,397 | | | $ | 3,728,060 | |
Class C | | | 439,256 | | | | 3,483,436 | | | | 213,062 | | | | 1,353,474 | |
Class R | | | 110,874 | | | | 878,616 | | | | 52,852 | | | | 338,812 | |
Class Y | | | 709,532 | | | | 5,538,744 | | | | 176,392 | | | | 1,205,752 | |
Class R5 | | | — | | | | — | | | | 76,169 | | | | 491,379 | |
Class R6 | | | 51,683 | | | | 344,289 | | | | 98,907 | | | | 603,936 | |
| | | | |
Issued as reinvestment of dividends: | | | | | | | | | | | | | | | | |
Class A | | | 1,567 | | | | 10,624 | | | | — | | | | — | |
Class Y | | | 2,442 | | | | 16,585 | | | | — | | | | — | |
Class R5 | | | 723 | | | | 4,962 | | | | — | | | | — | |
Class R6 | | | 3,309 | | | | 22,501 | | | | — | | | | — | |
| | | | |
Reacquired: | | | | | | | | | | | | | | | | |
Class A | | | (885,522 | ) | | | (6,918,872 | ) | | | (516,029 | ) | | | (3,419,092 | ) |
Class C | | | (139,344 | ) | | | (1,060,081 | ) | | | (161,069 | ) | | | (1,028,240 | ) |
Class R | | | (51,809 | ) | | | (429,286 | ) | | | (56,971 | ) | | | (381,429 | ) |
Class Y | | | (629,373 | ) | | | (4,797,077 | ) | | | (49,137 | ) | | | (319,542 | ) |
Class R5 | | | — | | | | — | | | | (2,300 | ) | | | (13,595 | ) |
Class R6(b) | | | (976,786 | ) | | | (7,562,621 | ) | | | (272,981 | ) | | | (1,758,881 | ) |
Net increase in share activity | | | 469,699 | | | $ | 4,445,088 | | | | 127,292 | | | $ | 800,634 | |
| (a) | There are entities that are record owners of more than 5% of the outstanding shares of the Fund and in the aggregate own 30% of the outstanding shares of the Fund. IDI has an agreement with these entities to sell Fund shares. The Fund, Invesco and/or Invesco affiliates may make payments to these entities, which are considered to be related to the Fund, for providing services to the Fund, Invesco and/or Invesco affiliates including but not limited to services such as securities brokerage, distribution, third party record keeping and account servicing. The Fund has no knowledge as to whether all or any portion of the shares owned of record by these entities are also owned beneficially. |
| | In addition, 7% of the outstanding shares of the Fund are owned by the Adviser or an affiliate of the Adviser. |
| (b) | On May 1, 2017, 850,367 Class R6 shares valued at $6,658,374 were redeemed by affiliated mutual funds. |
20 Invesco Emerging Markets Equity Fund
NOTE 11—Financial Highlights
The following schedule presents financial highlights for a share of the Fund outstanding throughout the periods indicated.
| | | | | | | | | | | | | | | | | | | | | | | | | | | | | | | | | | | | | | | | | | | | | | | | |
| | | Net asset
value,
beginning
of period | | | Net
investment
income
(loss)(a) | | | Net gains
(losses)
on securities
(both
realized and
unrealized) | | | Total from
investment
operations | | | Dividends
from net
investment
income | | | Net asset
value, end
of period | | | Total
return(b) | | | Net assets,
end of period
(000’s omitted) | | | Ratio of
expenses
to average
net assets
with fee waivers
and/or expenses
absorbed | | | Ratio of
expenses
to average net
assets without
fee waivers
and/or expenses
absorbed | | | Ratio of net
investment
income (loss)
to average
net assets | | | Portfolio
turnover(c) | |
Class A | |
Year ended 10/31/17 | | $ | 7.13 | | | $ | 0.03 | | | $ | 2.15 | | | $ | 2.18 | | | $ | (0.01 | ) | | $ | 9.30 | | | | 30.57 | % | | $ | 24,297 | | | | 1.36 | %(d) | | | 2.45 | %(d) | | | 0.30 | %(d) | | | 57 | % |
Year ended 10/31/16 | | | 6.53 | | | | 0.02 | | | | 0.58 | | | | 0.60 | | | | — | | | | 7.13 | | | | 9.19 | | | | 11,855 | | | | 1.66 | | | | 2.59 | | | | 0.33 | | | | 47 | |
Year ended 10/31/15 | | | 7.58 | | | | 0.02 | | | | (1.04 | ) | | | (1.02 | ) | | | (0.03 | ) | | | 6.53 | | | | (13.45 | ) | | | 10,516 | | | | 1.85 | | | | 2.58 | | | | 0.23 | | | | 97 | |
Year ended 10/31/14 | | | 7.61 | | | | 0.06 | | | | (0.03 | ) | | | 0.03 | | | | (0.06 | ) | | | 7.58 | | | | 0.44 | | | | 10,654 | | | | 1.85 | | | | 2.57 | | | | 0.74 | | | | 94 | |
Year ended 10/31/13 | | | 7.61 | | | | 0.05 | | | | 0.03 | | | | 0.08 | | | | (0.08 | ) | | | 7.61 | | | | 1.06 | | | | 15,284 | | | | 1.85 | | | | 2.75 | | | | 0.68 | | | | 41 | |
Class C | |
Year ended 10/31/17 | | | 6.97 | | | | (0.03 | ) | | | 2.10 | | | | 2.07 | | | | — | | | | 9.04 | | | | 29.70 | | | | 6,793 | | | | 2.11 | (d) | | | 3.20 | (d) | | | (0.45 | )(d) | | | 57 | |
Year ended 10/31/16 | | | 6.43 | | | | (0.03 | ) | | | 0.57 | | | | 0.54 | | | | — | | | | 6.97 | | | | 8.40 | | | | 3,149 | | | | 2.41 | | | | 3.34 | | | | (0.42 | ) | | | 47 | |
Year ended 10/31/15 | | | 7.49 | | | | (0.04 | ) | | | (1.02 | ) | | | (1.06 | ) | | | — | | | | 6.43 | | | | (14.15 | ) | | | 2,572 | | | | 2.60 | | | | 3.33 | | | | (0.52 | ) | | | 97 | |
Year ended 10/31/14 | | | 7.55 | | | | (0.00 | ) | | | (0.03 | ) | | | (0.03 | ) | | | (0.03 | ) | | | 7.49 | | | | (0.40 | ) | | | 2,825 | | | | 2.60 | | | | 3.32 | | | | (0.01 | ) | | | 94 | |
Year ended 10/31/13 | | | 7.55 | | | | (0.01 | ) | | | 0.04 | | | | 0.03 | | | | (0.03 | ) | | | 7.55 | | | | 0.40 | | | | 2,191 | | | | 2.60 | | | | 3.50 | | | | (0.07 | ) | | | 41 | |
Class R | |
Year ended 10/31/17 | | | 7.07 | | | | 0.00 | | | | 2.14 | | | | 2.14 | | | | — | | | | 9.21 | | | | 30.27 | | | | 2,190 | | | | 1.61 | (d) | | | 2.70 | (d) | | | 0.05 | (d) | | | 57 | |
Year ended 10/31/16 | | | 6.50 | | | | 0.01 | | | | 0.56 | | | | 0.57 | | | | — | | | | 7.07 | | | | 8.77 | | | | 1,263 | | | | 1.91 | | | | 2.84 | | | | 0.08 | | | | 47 | |
Year ended 10/31/15 | | | 7.55 | | | | (0.00 | ) | | | (1.03 | ) | | | (1.03 | ) | | | (0.02 | ) | | | 6.50 | | | | (13.71 | ) | | | 1,188 | | | | 2.10 | | | | 2.83 | | | | (0.02 | ) | | | 97 | |
Year ended 10/31/14 | | | 7.59 | | | | 0.04 | | | | (0.03 | ) | | | 0.01 | | | | (0.05 | ) | | | 7.55 | | | | 0.17 | | | | 1,341 | | | | 2.10 | | | | 2.82 | | | | 0.49 | | | | 94 | |
Year ended 10/31/13 | | | 7.58 | | | | 0.03 | | | | 0.04 | | | | 0.07 | | | | (0.06 | ) | | | 7.59 | | | | 0.97 | | | | 739 | | | | 2.10 | | | | 3.00 | | | | 0.43 | | | | 41 | |
Class Y | |
Year ended 10/31/17 | | | 7.15 | | | | 0.04 | | | | 2.16 | | | | 2.20 | | | | (0.02 | ) | | | 9.33 | | | | 30.94 | | | | 7,111 | | | | 1.11 | (d) | | | 2.20 | (d) | | | 0.55 | (d) | | | 57 | |
Year ended 10/31/16 | | | 6.53 | | | | 0.04 | | | | 0.58 | | | | 0.62 | | | | — | | | | 7.15 | | | | 9.49 | | | | 4,858 | | | | 1.41 | | | | 2.34 | | | | 0.58 | | | | 47 | |
Year ended 10/31/15 | | | 7.59 | | | | 0.03 | | | | (1.04 | ) | | | (1.01 | ) | | | (0.05 | ) | | | 6.53 | | | | (13.28 | ) | | | 3,607 | | | | 1.60 | | | | 2.33 | | | | 0.48 | | | | 97 | |
Year ended 10/31/14 | | | 7.62 | | | | 0.08 | | | | (0.04 | ) | | | 0.04 | | | | (0.07 | ) | | | 7.59 | | | | 0.60 | | | | 3,295 | | | | 1.60 | | | | 2.32 | | | | 0.99 | | | | 94 | |
Year ended 10/31/13 | | | 7.61 | | | | 0.07 | | | | 0.04 | | | | 0.11 | | | | (0.10 | ) | | | 7.62 | | | | 1.42 | | | | 442 | | | | 1.60 | | | | 2.50 | | | | 0.93 | | | | 41 | |
Class R5 | |
Year ended 10/31/17 | | | 7.15 | | | | 0.04 | | | | 2.16 | | | | 2.20 | | | | (0.02 | ) | | | 9.33 | | | | 30.94 | | | | 1,960 | | | | 1.10 | (d) | | | 1.91 | (d) | | | 0.56 | (d) | | | 57 | |
Year ended 10/31/16 | | | 6.53 | | | | 0.04 | | | | 0.58 | | | | 0.62 | | | | — | | | | 7.15 | | | | 9.49 | | | | 1,497 | | | | 1.41 | | | | 1.99 | | | | 0.58 | | | | 47 | |
Year ended 10/31/15 | | | 7.60 | | | | 0.03 | | | | (1.05 | ) | | | (1.02 | ) | | | (0.05 | ) | | | 6.53 | | | | (13.40 | ) | | | 885 | | | | 1.60 | | | | 1.98 | | | | 0.48 | | | | 97 | |
Year ended 10/31/14 | | | 7.62 | | | | 0.07 | | | | (0.02 | ) | | | 0.05 | | | | (0.07 | ) | | | 7.60 | | | | 0.74 | | | | 896 | | | | 1.60 | | | | 2.02 | | | | 0.99 | | | | 94 | |
Year ended 10/31/13 | | | 7.61 | | | | 0.07 | | | | 0.04 | | | | 0.11 | | | | (0.10 | ) | | | 7.62 | | | | 1.42 | | | | 366 | | | | 1.60 | | | | 2.26 | | | | 0.93 | | | | 41 | |
Class R6 | |
Year ended 10/31/17 | | | 7.15 | | | | 0.04 | | | | 2.15 | | | | 2.19 | | | | (0.02 | ) | | | 9.32 | | | | 30.80 | | | | 12 | | | | 1.10 | (d) | | | 1.91 | (d) | | | 0.56 | (d) | | | 57 | |
Year ended 10/31/16 | | | 6.54 | | | | 0.04 | | | | 0.57 | | | | 0.61 | | | | — | | | | 7.15 | | | | 9.33 | | | | 6,604 | | | | 1.41 | | | | 1.99 | | | | 0.58 | | | | 47 | |
Year ended 10/31/15 | | | 7.60 | | | | 0.03 | | | | (1.04 | ) | | | (1.01 | ) | | | (0.05 | ) | | | 6.54 | | | | (13.26 | ) | | | 7,171 | | | | 1.60 | | | | 1.98 | | | | 0.48 | | | | 97 | |
Year ended 10/31/14 | | | 7.62 | | | | 0.07 | | | | (0.02 | ) | | | 0.05 | | | | (0.07 | ) | | | 7.60 | | | | 0.73 | | | | 8,116 | | | | 1.60 | | | | 2.00 | | | | 0.99 | | | | 94 | |
Year ended 10/31/13 | | | 7.62 | | | | 0.07 | | | | 0.03 | | | | 0.10 | | | | (0.10 | ) | | | 7.62 | | | | 1.28 | | | | 8,619 | | | | 1.60 | | | | 2.21 | | | | 0.93 | | | | 41 | |
| (a) | Calculated using average shares outstanding. |
| (b) | Includes adjustments in accordance with accounting principles generally accepted in the United States of America and as such, the net asset value for financial reporting purposes and the returns based upon those net asset values may differ from the net asset value and returns for shareholder transactions. Does not include sales charges and is not annualized for periods less than one year, if applicable. |
| (c) | Portfolio turnover is calculated at the fund level and is not annualized for periods less than one year, if applicable. |
| (d) | Ratios are based on average daily net assets (000’s omitted) of $15,256, $4,289, $1,668, $5,468, $1,645 and $3,206 for Class A, Class C, Class R, Class Y, Class R5 and Class R6 shares, respectively. |
21 Invesco Emerging Markets Equity Fund
Report of Independent Registered Public Accounting Firm
To the Board of Trustees of AIM Investment Funds (Invesco Investment Funds)
and Shareholders of Invesco Emerging Markets Equity Fund:
In our opinion, the accompanying statement of assets and liabilities, including the schedule of investments, and the related statements of operations and of changes in net assets and the financial highlights present fairly, in all material respects, the financial position of Invesco Emerging Markets Equity Fund (one of the portfolios constituting the AIM Investment Funds (Invesco Investment Funds), hereafter referred to as the “Fund”) as of October 31, 2017, the results of its operations for the year then ended, the changes in its net assets for each of the two years in the period then ended and the financial highlights for each of the five years in the period then ended, in conformity with accounting principles generally accepted in the United States of America. These financial statements and financial highlights (hereafter referred to as “financial statements”) are the responsibility of the Fund’s management. Our responsibility is to express an opinion on these financial statements based on our audits. We conducted our audits of these financial statements in accordance with the standards of the Public Company Accounting Oversight Board (United States). Those standards require that we plan and perform the audit to obtain reasonable assurance about whether the financial statements are free of material misstatement. An audit includes examining, on a test basis, evidence supporting the amounts and disclosures in the financial statements, assessing the accounting principles used and significant estimates made by management, and evaluating the overall financial statement presentation. We believe that our audits, which included confirmation of securities as of October 31, 2017 by correspondence with the custodian and transfer agent, provide a reasonable basis for our opinion.
PricewaterhouseCoopers LLP
Houston, Texas
December 21, 2017
22 Invesco Emerging Markets Equity Fund
Calculating your ongoing Fund expenses
Example
As a shareholder of the Fund, you incur two types of costs: (1) transaction costs, which may include sales charges (loads) on purchase payments or contingent deferred sales charges on redemptions, if any; and (2) ongoing costs, including management fees, distribution and/or service (12b-1) fees, and other Fund expenses. This example is intended to help you understand your ongoing costs (in dollars) of investing in the Fund and to compare these costs with ongoing costs of investing in other mutual funds. The example is based on an investment of $1,000 invested at the beginning of the period and held for the entire period May 1, 2017 through October 31, 2017.
Actual expenses
The table below provides information about actual account values and actual expenses. You may use the information in this table, together with the amount you invested, to estimate the expenses that you paid over the period. Simply divide your account value by $1,000 (for example, an $8,600 account value divided by $1,000 = 8.6), then multiply the result by the number in the table under the heading entitled “Actual Expenses Paid During Period” to estimate the expenses you paid on your account during this period.
Hypothetical example for comparison purposes
The table below also provides information about hypothetical account values and hypothetical expenses based on the Fund’s actual expense ratio and an assumed rate of return of 5% per year before expenses, which is not the Fund’s actual return.
The hypothetical account values and expenses may not be used to estimate the actual ending account balance or expenses you paid for the period. You may use this information to compare the ongoing costs of investing in the Fund and other funds. To do so, compare this 5% hypothetical example with the 5% hypothetical examples that appear in the shareholder reports of the other funds.
Please note that the expenses shown in the table are meant to highlight your ongoing costs only and do not reflect any transaction costs, such as sales charges (loads) on purchase payments or contingent deferred sales charges on redemptions, if any. Therefore, the hypothetical information is useful in comparing ongoing costs only, and will not help you determine the relative total costs of owning different funds. In addition, if these transaction costs were included, your costs would have been higher.
| | | | | | | | | | | | | | | | | | | | | | | | |
| Class | | Beginning
Account Value
(05/01/17) | | | ACTUAL | | | HYPOTHETICAL (5% annual return before expenses) | | | Annualized
Expense
Ratio | |
| | | Ending
Account Value
(10/31/17)1 | | | Expenses
Paid During
Period2 | | | Ending
Account Value
(10/31/17) | | | Expenses
Paid During
Period2 | | |
| A | | $ | 1,000.00 | | | $ | 1,190.80 | | | $ | 7.34 | | | $ | 1,018.50 | | | $ | 6.77 | | | | 1.33 | % |
| C | | | 1,000.00 | | | | 1,185.00 | | | | 11.46 | | | | 1,014.72 | | | | 10.56 | | | | 2.08 | |
| R | | | 1,000.00 | | | | 1,189.90 | | | | 8.72 | | | | 1,017.24 | | | | 8.03 | | | | 1.58 | |
| Y | | | 1,000.00 | | | | 1,191.60 | | | | 5.97 | | | | 1,019.76 | | | | 5.50 | | | | 1.08 | |
| R5 | | | 1,000.00 | | | | 1,191.60 | | | | 5.97 | | | | 1,019.76 | | | | 5.50 | | | | 1.08 | |
| R6 | | | 1,000.00 | | | | 1,190.30 | | | | 5.96 | | | | 1,019.76 | | | | 5.50 | | | | 1.08 | |
| 1 | The actual ending account value is based on the actual total return of the Fund for the period May 1, 2017 through October 31, 2017, after actual expenses and will differ from the hypothetical ending account value which is based on the Fund’s expense ratio and a hypothetical annual return of 5% before expenses. |
| 2 | Expenses are equal to the Fund’s annualized expense ratio as indicated above multiplied by the average account value over the period, multiplied by 184/365 to reflect the most recent fiscal half year. |
23 Invesco Emerging Markets Equity Fund
Approval of Investment Advisory and Sub-Advisory Contracts
The Board of Trustees (the Board) of AIM Investment Funds (Invesco Investment Funds) is required under the Investment Company Act of 1940, as amended, to approve annually the renewal of Invesco Emerging Markets Equity Fund’s (the Fund) investment advisory agreements. During contract renewal meetings held on June 12-13, 2017, the Board as a whole, and the disinterested or “independent” Trustees, who comprise over 75% of the Board, voting separately, approved the continuance for the Fund of the Master Investment Advisory Agreement with Invesco Advisers, Inc. (Invesco Advisers and the investment advisory agreement) and the Master Intergroup Sub-Advisory Contract for Mutual Funds with Invesco Asset Management Deutschland GmbH, Invesco Asset Management Limited, Invesco Asset Management (Japan) Limited, Invesco Hong Kong Limited, Invesco Senior Secured Management, Inc. and Invesco Canada Ltd. and separate Sub-Advisory Contracts with Invesco PowerShares Capital Management LLC and Invesco Asset Management (India) Private Limited (collectively, the Affiliated Sub-Advisers and the sub-advisory contracts) for another year, effective July 1, 2017.
In evaluating the fairness and reasonableness of compensation under the Fund’s investment advisory agreement and sub-advisory contracts, the Board considered, among other things, the factors discussed below. The Board determined that continuation of the Fund’s investment advisory agreement and the sub-advisory contracts is in the best interest of the Fund and its shareholders and that the compensation payable to Invesco Advisers and the Affiliated Sub-Advisers under the agreements is fair and reasonable.
The Board’s Fund Evaluation Process
The Board’s Investments Committee has established three Sub-Committees, which meet throughout the year to review the performance of funds advised by Invesco Advisers (the Invesco Funds). Over the course of each year, the Sub-Committees meet with portfolio managers for their assigned Invesco Funds and other members of management to review the performance, investment objective(s), policies, strategies, limitations and investment risks of these funds. The Board had the benefit of reports from the Sub-Committees and Investments Committee throughout the year in considering approval of the continuance of each Invesco Fund’s investment advisory agreement and sub-advisory contracts for another year.
During the contract renewal process, the Board receives comparative performance and fee data regarding the Invesco Funds prepared by Invesco Advisers and Broadridge Financial Solutions, Inc. (Broadridge), an independent provider of investment company data. The Board also receives an independent written
evaluation from the Senior Officer, an officer of the Invesco Funds who reports directly to the independent Trustees. The Senior Officer’s evaluation is prepared as part of his responsibility to manage the process by which the Invesco Funds’ proposed management fees are negotiated during the annual contract renewal process to ensure they are negotiated in a manner that is at arms’ length and reasonable. In addition to meetings with Invesco Advisers and fund counsel, the independent Trustees also discuss the continuance of the investment advisory agreement and sub-advisory contracts in separate sessions with the Senior Officer and with independent legal counsel.
The Trustees recognized that the advisory fee rates for the Invesco Funds are, in most cases, the result of years of review and negotiation. The Trustees’ deliberations and conclusions in a particular year may be based in part on their deliberations and conclusions regarding these arrangements throughout the year and in prior years. The Trustees’ review and conclusions are based on the comprehensive consideration of all information presented to them and are not the result of any single determinative factor. Moreover, one Trustee may have weighed a particular piece of information or factor differently than another Trustee.
The discussion below is a summary of the Senior Officer’s independent written evaluation with respect to the Fund’s investment advisory agreement as well as a discussion of the material factors and related conclusions that formed the basis for the Board’s approval of the Fund’s investment advisory agreement and sub-advisory contracts. This information is current as of June 13, 2017, and does not reflect consideration of factors that became known to the Board after that date.
Factors and Conclusions and Summary of Independent Written Fee Evaluation
| A. | Nature, Extent and Quality of Services Provided by Invesco Advisers and the Affiliated Sub-Advisers |
The Board reviewed the advisory services provided to the Fund by Invesco Advisers under the Fund’s investment advisory agreement, the performance of Invesco Advisers in providing these services, and the credentials and experience of the officers and employees of Invesco Advisers who provide these services, including the Fund’s portfolio manager or managers. The Board’s review included consideration of Invesco Advisers’ investment process oversight, credit analysis and investment risk management. The Board also considered non-advisory services that Invesco Advisers and its affiliates provide to the Invesco Funds such as various back office support functions, trading operations, internal audit, valuation and legal and compliance.
In determining whether to continue the Fund’s investment advisory agreement, the Board considered the benefits of reapproving an existing relationship as contrasted with the greater uncertainty that may be associated with entering into a new relationship. The Board concluded that the nature, extent and quality of the services provided to the Fund by Invesco Advisers are appropriate and satisfactory.
The Board reviewed the services that may be provided by the Affiliated Sub-Advisers under the sub-advisory contracts and the credentials and experience of the officers and employees of the Affiliated Sub-Advisers who provide these services. The Board noted that the Affiliated Sub-Advisers have offices and personnel that are located in financial centers around the world. As a result, the Board noted that the Affiliated Sub-Advisers can provide research and investment analysis on the markets and economies of various countries in which the Fund may invest, make recommendations regarding securities and assist with security trades. The Board concluded that the sub-advisory contracts may benefit the Fund and its shareholders by permitting Invesco Advisers to use the resources and talents of the Affiliated Sub-Advisers in managing the Fund. The Board concluded that the nature, extent and quality of the services that may be provided by the Affiliated Sub-Advisers are appropriate and satisfactory.
| B. | Fund Investment Performance |
The Board considered Fund investment performance as a relevant factor in considering whether to approve the investment advisory agreement. The Board did not view Fund performance as a relevant factor in considering whether to approve the sub-advisory contracts for the Fund, as no Affiliated Sub-Adviser currently manages assets of the Fund.
The Board compared the Fund’s investment performance over multiple time periods ending December 31, 2016 to the performance of funds in the Broadridge performance universe and against the Lipper Emerging Markets Funds Index. The Board noted that the Fund’s performance of Class A shares of the Fund was in the fourth quintile of its performance universe for the one year period, the third quintile for the three year period and the fifth quintile for the five year period (the first quintile being the best performing funds and the fifth quintile being the worst performing funds). The Board noted that performance of Class A shares of the Fund was below the performance of the Index for the one, three and five year periods. The Trustees also reviewed more recent Fund performance and this review did not change their conclusions.
| C. | Advisory and Sub-Advisory Fees |
The Board compared the Fund’s contractual management fee rate to the contractual management fee rates of funds in the Fund’s
24 Invesco Emerging Markets Equity Fund
Broadridge expense group at a common asset level. The Board noted that the contractual management fee rate for Class A shares of the Fund was below the median contractual management fee rate of funds in its expense group. The Board noted that the term “contractual management fee” for funds in the expense group may include both advisory and certain administrative services fees, but that Broadridge does not provide information on a fund by fund basis as to what is included. The Board noted that Invesco Advisers does not separately charge the Invesco Funds for the administrative services included in the term as defined by Broadridge. The Board also reviewed the methodology used by Broadridge in providing expense group information, which includes using each fund’s contractual management fee schedule (including any applicable breakpoints) as reported in the most recent prospectus or statement of additional information for each fund in the expense group.
The Board noted that Invesco Advisers has contractually agreed to waive fees and/or limit expenses of the Fund through at least February 28, 2018 in an amount necessary to limit total annual operating expenses to a specified percentage of average daily net assets for each class of the Fund.
The Board also compared the Fund’s effective advisory fee rate (the advisory fee rate after advisory fee waivers and before other expense limitations/waivers) to the effective advisory fee rates of other mutual funds advised by Invesco Advisers and its affiliates with investment strategies comparable to those of the Fund, based on asset balances as of December 31, 2016. The Board noted that the Fund’s rate was above the rate of one mutual fund and the same as the rate of one mutual fund. The Board noted that Invesco Advisers and the Affiliated Sub-Advisers do not manage other client accounts with investment strategies comparable to those of the Fund.
The Board also considered the services that may be provided by the Affiliated Sub-Advisers pursuant to the sub-advisory contracts, as well as the fees payable by Invesco Advisers to the Affiliated Sub-Advisers pursuant to the sub-advisory contracts. The Board also noted that the sub-advisory fees are not paid directly by the Fund, but rather, are payable by Invesco Advisers to the Affiliated Sub-Advisers.
| D. | Economies of Scale and Breakpoints |
The Board considered the extent to which there are economies of scale in the provision of advisory services to the Fund. The Board also considered that the Fund may benefit from economies of scale through contractual breakpoints in the Fund’s advisory fee schedule. The Board noted that the Fund shares directly in economies of scale through lower fees charged by third party service providers based on the combined size of the Invesco Funds advised by Invesco Advisers.
| E. | Profitability and Financial Resources |
The Board reviewed information from Invesco Advisers concerning the costs of the advisory
and other services that Invesco Advisers and its affiliates provide to the Fund and the Invesco Funds and the profitability of Invesco Advisers and its affiliates in providing these services. The Board noted that Invesco Advisers continues to operate at a net profit from services Invesco Advisers and its affiliates provide to the Invesco Funds. The Board noted that Invesco Advisers and its affiliates did not make a profit from managing the Fund as a result of fee and expense waivers. The Board received and accepted information from Invesco Advisers demonstrating that Invesco Advisers and each Affiliated Sub-Adviser are financially sound and have the resources necessary to perform their obligations under the investment advisory agreement and sub-advisory contracts.
| F. | Collateral Benefits to Invesco Advisers and its Affiliates |
The Board considered various other benefits received by Invesco Advisers and its affiliates from the relationship with the Fund, including the fees received for providing transfer agency and distribution services to the Fund. The Board considered comparative information regarding fees charged for these services, including information provided by Broadridge and other independent sources. The Board considered the performance of Invesco Advisers and its affiliates in providing these services and the organizational structure employed to provide these services. The Board also considered that these services are provided to the Fund pursuant to written contracts that are reviewed and approved on an annual basis by the Board; and that the services are required for the operation of the Fund.
The Board considered the benefits realized by Invesco Advisers and the Affiliated Sub-Advisers as a result of portfolio brokerage transactions executed through “soft dollar” arrangements. The Board also noted how the Fund’s rate compared to the effective sub-adviser fee rate of one fund sub-advised by Invesco Advisers. The Board also considered that it receives periodic reports from the Chief Compliance Officer of the Invesco Funds demonstrating that these arrangements are consistent with regulatory requirements. The Board did not deem the soft dollar arrangements to be inappropriate.
The Board considered that the Fund’s uninvested cash and cash collateral from any securities lending arrangements may be invested in money market funds advised by Invesco Advisers pursuant to procedures approved by the Board. The Board noted that Invesco Advisers receives advisory fees from these affiliated money market funds attributable to such investments, although Invesco Advisers has contractually agreed to waive through varying periods the advisory fees payable by the Invesco Funds with respect to certain investments in the affiliated money market funds. The waiver is in an amount equal to 100% of the net advisory fee Invesco Advisers receives from the affiliated money market funds with respect to the Fund’s
investment in the affiliated money market funds of uninvested cash, but not cash collateral. The Board concluded that the amount of advisory fees received by Invesco Advisers from the Fund’s investment of cash collateral from any securities lending arrangements in the affiliated money market funds is fair and reasonable.
The Board also considered that the Fund may use an affiliated broker to execute certain trades for the Fund to, among other things, control information leakage, and was advised that such trades would be executed in compliance with rules under the federal securities laws and consistent with best execution obligations.
25 Invesco Emerging Markets Equity Fund
Tax Information
Form 1099-DIV, Form 1042-S and other year-end tax information provide shareholders with actual calendar year amounts that should be included in their tax returns. Shareholders should consult their tax advisors.
The following distribution information is being provided as required by the Internal Revenue Code or to meet a specific state’s requirement.
The Fund designates the following amounts or, if subsequently determined to be different, the maximum amount allowable for its fiscal year ended October 31, 2017:
| | | | |
Federal and State Income Tax | |
Qualified Dividend Income* | | | 100.00 | % |
Corporate Dividends Received Deduction* | | | 25.53 | % |
U.S. Treasury Obligations* | | | 0.00 | % |
| | * | The above percentages are based on ordinary income dividends paid to shareholders during the Fund’s fiscal year. |
26 Invesco Emerging Markets Equity Fund
Trustees and Officers
The address of each trustee and officer is AIM Investment Funds (Invesco Investment Funds) (the “Trust”), 11 Greenway Plaza, Suite 1000, Houston, Texas 77046-1173. The trustees serve for the life of the Trust, subject to their earlier death, incapacitation, resignation, retirement or removal as more specifically provided in the Trust’s organizational documents. Each officer serves for a one year term or until their successors are elected and qualified. Column two below includes length of time served with predecessor entities, if any.
| | | | | | | | |
Name, Year of Birth and Position(s) Held with the Trust | | Trustee and/
or Officer Since | | Principal Occupation(s)
During Past 5 Years | | Number of
Funds in Fund
Complex
Overseen by
Trustee | | Other Directorship(s)
Held by Trustee During Past 5 Years |
| Interested Persons | | | | | | | | |
| Martin L. Flanagan1 — 1960 Trustee | | 2007 | | Executive Director, Chief Executive Officer and President, Invesco Ltd. (ultimate parent of Invesco and a global investment management firm); Trustee, The Invesco Funds; Vice Chair, Investment Company Institute; and Member of Executive Board, SMU Cox School of Business Formerly: Advisor to the Board, Invesco Advisers, Inc. (formerly known as Invesco Institutional (N.A.), Inc.); Chairman and Chief Executive Officer, Invesco Advisers, Inc. (registered investment adviser); Director, Chairman, Chief Executive Officer and President, Invesco Holding Company (US), Inc. (formerly IVZ Inc.) (holding company), Invesco Group Services, Inc. (service provider) and Invesco North American Holdings, Inc. (holding company); Director, Chief Executive Officer and President, Invesco Holding Company Limited (parent of Invesco and a global investment management firm); Director, Invesco Ltd.; Chairman, Investment Company Institute and President, Co-Chief Executive Officer, Co-President, Chief Operating Officer and Chief Financial Officer, Franklin Resources, Inc. (global investment management organization) | | 158 | | None |
Philip A. Taylor2 — 1954 Trustee and Senior Vice President | | 2006 | | Head of the Americas and Senior Managing Director, Invesco Ltd.; Director, Invesco Advisers, Inc. (formerly known as Invesco Institutional (N.A.), Inc.) (registered investment adviser); Director, Chairman, Chief Executive Officer and President, Invesco Management Group, Inc. (formerly known as Invesco Aim Management Group, Inc.) (financial services holding company); Director and Chairman, Invesco Investment Services, Inc. (formerly known as Invesco Aim Investment Services, Inc.) (registered transfer agent); Chief Executive Officer, Invesco Corporate Class Inc. (corporate mutual fund company); Director, Chairman and Chief Executive Officer, Invesco Canada Ltd. (formerly known as Invesco Trimark Ltd./Invesco Trimark Ltèe) (registered investment adviser and registered transfer agent); Trustee and Senior Vice President, The Invesco Funds; Director, Invesco Investment Advisers LLC (formerly known as Van Kampen Asset Management). Formerly: Co-Chairman, Co-President and Co-Chief Executive Officer, Invesco Advisers, Inc. (formerly known as Invesco Institutional (N.A.), Inc.) (registered investment adviser); Director, Chief Executive Officer and President, Van Kampen Exchange Corp; President and Principal Executive Officer, The Invesco Funds (other than AIM Treasurer’s Series Trust (Invesco Treasurer’s Series Trust), Short-Term Investments Trust and Invesco Management Trust); Executive Vice President, The Invesco Funds (AIM Treasurer’s Series Trust (Invesco Treasurer’s Series Trust), Short-Term Investments Trust and Invesco Management Trust only); Director and President, INVESCO Funds Group, Inc. (registered investment adviser and registered transfer agent); Director and Chairman, IVZ Distributors, Inc. (formerly known as INVESCO Distributors, Inc.) (registered broker dealer); Director, President and Chairman, Invesco Inc. (holding company), Invesco Canada Holdings Inc. (holding company), Trimark Investments Ltd./Placements Trimark Ltèe and Invesco Financial Services Ltd/Services Financiers Invesco Ltèe; Chief Executive Officer, Invesco Canada Fund Inc. (corporate mutual fund company); Director and Chairman, Van Kampen Investor Services Inc.; Director, Chief Executive Officer and President, 1371 Preferred Inc. (holding company) and Van Kampen Investments Inc.; Director and President, AIM GP Canada Inc. (general partner for limited partnerships) and Van Kampen Advisors, Inc.; Director and Chief Executive Officer, Invesco Trimark Dealer Inc. (registered broker dealer); Director, Invesco Distributors, Inc. (formerly known as Invesco Aim Distributors, Inc.) (registered broker dealer); Manager, Invesco PowerShares Capital Management LLC; Director, Chief Executive Officer and President, Invesco Advisers, Inc.; Director, Chairman, Chief Executive Officer and President, Invesco Aim Capital Management, Inc.; President, Invesco Trimark Dealer Inc. and Invesco Trimark Ltd./Invesco Trimark Ltèe; Director and President, AIM Trimark Corporate Class Inc. and AIM Trimark Canada Fund Inc.; Senior Managing Director, Invesco Holding Company Limited; Director and Chairman, Fund Management Company (former registered broker dealer); President and Principal Executive Officer, The Invesco Funds (AIM Treasurer’s Series Trust (Invesco Treasurer’s Series Trust), and Short-Term Investments Trust only); President, AIM Trimark Global Fund Inc. and AIM Trimark Canada Fund Inc. | | 158 | | None |
| 1 | Mr. Flanagan is considered an interested person (within the meaning of Section 2(a)(19) of the 1940 Act) of the Trust because he is an officer of the Adviser to the Trust, and an officer and a director of Invesco Ltd., ultimate parent of the Adviser. |
| 2 | Mr. Taylor is considered an interested person (within the meaning of Section 2(a)(19) of the 1940 Act) of the Trust because he is an officer and a director of the Adviser. |
T-1 Invesco Emerging Markets Equity Fund
Trustees and Officers—(continued)
| | | | | | | | |
Name, Year of Birth and Position(s) Held with the Trust | | Trustee and/
or Officer Since | | Principal Occupation(s) During Past 5 Years | | Number of
Funds in Fund
Complex
Overseen by
Trustee | | Other Directorship(s)
Held by Trustee During Past 5 Years |
| Independent Trustees | | | | | | | | |
Bruce L. Crockett — 1944 Trustee and Chair | | 2001 | | Chairman, Crockett Technologies Associates (technology consulting company) Formerly: Director, Captaris (unified messaging provider); Director, President and Chief Executive Officer, COMSAT Corporation; Chairman, Board of Governors of INTELSAT (international communications company); ACE Limited (insurance company); Independent Directors Council and Investment Company Institute: Member of the Audit Committee, Investment Company Institute; Member of the Executive Committee and Chair of the Governance Committee, Independent Directors Council | | 158 | | Director and Chairman of the Audit Committee, ALPS (Attorneys Liability Protection Society) (insurance company); Director and Member of the Audit Committee, Ferroglobe PLC (metallurgical company) |
David C. Arch — 1945 Trustee | | 2010 | | Chairman of Blistex Inc. (consumer health care products manufacturer); Member, World Presidents’ Organization | | 158 | | Board member of the Illinois Manufacturers’ Association |
James T. Bunch — 1942 Trustee | | 2003 | | Managing Member, Grumman Hill Group LLC (family office/private equity investments) Formerly: Chairman of the Board, Denver Film Society; Chairman of the Board of Trustees, Evans Scholarship Foundation; Chairman, Board of Governors, Western Golf Association | | 158 | | Trustee, Evans Scholarship Foundation |
Jack M. Fields — 1952 Trustee | | 2001 | | Chief Executive Officer, Twenty First Century Group, Inc. (government affairs company); and Discovery Learning Alliance (non-profit) Formerly: Owner and Chief Executive Officer, Dos Angeles Ranch L.P. (cattle, hunting, corporate entertainment); Director, Insperity, Inc. (formerly known as Administaff) (human resources provider); Chief Executive Officer, Texana Timber LP (sustainable forestry company); Director of Cross Timbers Quail Research Ranch (non-profit); and member of the U.S. House of Representatives | | 158 | | None |
Cynthia Hostetler — 1962 Trustee | | 2017 | | Non-Executive Director and Trustee of a number of public and private business corporations Formerly: Head of Investment Funds and Private Equity, Overseas Private Investment Corporation; President, First Manhattan Bancorporation, Inc.; Attorney, Simpson Thacher & Bartlett LLP | | 158 | | Vulcan Materials Company (construction materials company); Trilinc Global Impact Fund; Aberdeen Investment Funds (4 portfolios); Artio Global Investment LLC (mutual fund complex); Edgen Group, Inc. (specialized energy and infrastructure products distributor) |
Eli Jones — 1961 Trustee | | 2016 | | Professor and Dean, Mays Business School — Texas A&M University Formerly: Professor and Dean, Walton College of Business, University of Arkansas and E.J. Ourso College of Business, Louisiana State University; Director, Arvest Bank | | 158 | | Insperity, Inc. (formerly known as Administaff) (human resources provider) |
Prema Mathai-Davis — 1950 Trustee | | 2001 | | Retired. Formerly: Chief Executive Officer, YWCA of the U.S.A. | | 158 | | None |
Teresa M. Ressel — 1962 Trustee | | 2017 | | Non-executive director and trustee of a number of public and private business corporations Formerly: Chief Financial Officer, Olayan America, The Olayan Group (international investor/commercial/industrial); Chief Executive Officer, UBS Securities LLC; Group Chief Operating Officer, Americas, UBS AG; Assistant Secretary for Management & Budget and CFO, US Department of the Treasury; Chief Compliance Officer, Kaiser Permanente (healthcare consortium); Program Manager, Hewlett-Packard; Nuclear Engineering, General Dynamics Corporation (aerospace and defense company) | | 158 | | Atlantic Power Corporation (power generation company); ON Semiconductor Corp. (semiconductor supplier) |
Larry Soll — 1942 Trustee | | 2003 | | Retired. Formerly: Chairman, Chief Executive Officer and President, Synergen Corp. (a biotechnology company) | | 158 | | None |
Ann Barnett Stern — 1957 Trustee | | 2017 | | President and Chief Executive Officer, Houston Endowment Inc. (private philanthropic institution) Formerly: Executive Vice President and General Counsel, Texas Children’s Hospital; Attorney, Beck, Redden and Secrest, LLP; Business Law Instructor, University of St. Thomas; Attorney, Andrews & Kurth LLP | | 158 | | Federal Reserve Bank of Dallas |
Raymond Stickel, Jr. — 1944 Trustee | | 2005 | | Retired. Formerly: Director, Mainstay VP Series Funds, Inc. (25 portfolios); Partner, Deloitte & Touche | | 158 | | None |
Robert C. Troccoli — 1949 Trustee | | 2016 | | Adjunct Professor, University of Denver — Daniels College of Business Formerly: Senior Partner, KPMG LLP | | 158 | | None |
T-2 Invesco Emerging Markets Equity Fund
Trustees and Officers—(continued)
| | | | | | | | |
Name, Year of Birth and Position(s) Held with the Trust | | Trustee and/
or Officer Since | | Principal Occupation(s) During Past 5 Years | | Number of
Funds in Fund
Complex
Overseen by
Trustee | | Other Directorship(s)
Held by Trustee During Past 5 Years |
| Independent Trustees—(continued) |
Christopher L. Wilson — 1957 Trustee | | 2017 | | Managing Partner, CT2, LLC (investing and consulting firm) Formerly: President/Chief Executive Officer, Columbia Funds, Bank of America Corporation; President/Chief Executive Officer, CDC IXIS Asset Management Services, Inc.; Principal & Director of Operations, Scudder Funds, Scudder, Stevens & Clark, Inc.; Assistant Vice President, Fidelity Investments | | 158 | | TD Asset Management USA Inc. (mutual fund complex) (22 portfolios); ISO New England, Inc. (non-profit organization managing regional electricity market) |
| Other Officers | | | | | | | | |
Sheri Morris — 1964 President, Principal Executive Officer and Treasurer | | 1999 | | President, Principal Executive Officer and Treasurer, The Invesco Funds; Vice President, Invesco Advisers, Inc. (formerly known as Invesco Institutional (N.A.), Inc.) (registered investment adviser); and Vice President, PowerShares Exchange-Traded Fund Trust, PowerShares Exchange-Traded Fund Trust II, PowerShares India Exchange-Traded Fund Trust, PowerShares Actively Managed Exchange-Traded Fund Trust and PowerShares Actively Managed Exchange-Traded Commodity Fund Trust Formerly: Vice President and Principal Financial Officer, The Invesco Funds; Vice President, Invesco Aim Advisers, Inc., Invesco Aim Capital Management, Inc. and Invesco Aim Private Asset Management, Inc.; Assistant Vice President and Assistant Treasurer, The Invesco Funds and Assistant Vice President, Invesco Advisers, Inc., Invesco Aim Capital Management, Inc. and Invesco Aim Private Asset Management, Inc.; and Treasurer, PowerShares Exchange-Traded Fund Trust, PowerShares Exchange-Traded Fund Trust II, PowerShares India Exchange-Traded Fund Trust and PowerShares Actively Managed Exchange-Traded Fund Trust | | N/A | | N/A |
Russell C. Burk — 1958 Senior Vice President and Senior Officer | | 2005 | | Senior Vice President and Senior Officer, The Invesco Funds | | N/A | | N/A |
John M. Zerr — 1962 Senior Vice President, Chief Legal Officer and Secretary | | 2006 | | Director, Senior Vice President, Secretary and General Counsel, Invesco Management Group, Inc. (formerly known as Invesco AIM Management Group, Inc.); Senior Vice President, Invesco Advisers, Inc. (formerly known as Invesco Institutional (N.A.), Inc.) (registered investment adviser); Senior Vice President and Secretary, Invesco Distributors, Inc. (formerly known as Invesco AIM Distributors, Inc.); Director, Vice President and Secretary, Invesco Investment Services, Inc. (formerly known as Invesco AIM Investment Services, Inc.) Senior Vice President, Chief Legal Officer and Secretary, The Invesco Funds; Managing Director, Invesco PowerShares Capital Management LLC; Director, Secretary and General Counsel, Invesco Investment Advisers LLC (formerly known as Van Kampen Asset Management); Secretary and General Counsel, Invesco Capital Markets, Inc. (formerly known as Van Kampen Funds Inc.) and Chief Legal Officer, PowerShares Exchange-Traded Fund Trust, PowerShares Exchange-Traded Fund Trust II, PowerShares India Exchange-Traded Fund Trust, PowerShares Actively Managed Exchange-Traded Fund Trust and PowerShares Actively Managed Exchange-Traded Commodity Fund Trust; Manager and Secretary, Invesco Indexing LLC Formerly: Director, Secretary, General Counsel and Senior Vice President, Van Kampen Exchange Corp.; Director, Vice President and Secretary, IVZ Distributors, Inc. (formerly known as INVESCO Distributors, Inc.); Director and Vice President, INVESCO Funds Group, Inc.; Director and Vice President, Van Kampen Advisors Inc.; Director, Vice President, Secretary and General Counsel, Van Kampen Investor Services Inc.; Director, Invesco Distributors, Inc. (formerly known as Invesco AIM Distributors, Inc.); Director, Senior Vice President, General Counsel and Secretary, Invesco AIM Advisers, Inc. and Van Kampen Investments Inc.; Director, Vice President and Secretary, Fund Management Company; Director, Senior Vice President, Secretary, General Counsel and Vice President, Invesco AIM Capital Management, Inc.; Chief Operating Officer and General Counsel, Liberty Ridge Capital, Inc. (an investment adviser); Vice President and Secretary, PBHG Funds (an investment company) and PBHG Insurance Series Fund (an investment company); Chief Operating Officer, General Counsel and Secretary, Old Mutual Investment Partners (a broker-dealer); General Counsel and Secretary, Old Mutual Fund Services (an administrator) and Old Mutual Shareholder Services (a shareholder servicing center); Executive Vice President, General Counsel and Secretary, Old Mutual Capital, Inc. (an investment adviser); and Vice President and Secretary, Old Mutual Advisors Funds (an investment company) | | N/A | | N/A |
Gregory G. McGreevey — 1962 Senior Vice President | | 2012 | | Senior Managing Director, Invesco Ltd.; Director, Chairman, President, and Chief Executive Officer, Invesco Advisers, Inc. (formerly known as Invesco Institutional (N.A.), Inc.) (registered investment adviser); Senior Vice President, Invesco Management Group, Inc.; Director, Invesco Mortgage Capital, Inc. and Invesco Senior Secured Management, Inc.; and Senior Vice President, The Invesco Funds Formerly: Assistant Vice President, The Invesco Funds | | N/A | | N/A |
T-3 Invesco Emerging Markets Equity Fund
Trustees and Officers—(continued)
| | | | | | | | |
Name, Year of Birth and Position(s) Held with the Trust | | Trustee and/
or Officer Since | | Principal Occupation(s) During Past 5 Years | | Number of
Funds in Fund
Complex
Overseen by
Trustee | | Other Directorship(s)
Held by Trustee During Past 5 Years |
| Other Officers—(continued) | | | | | | | | |
Kelli Gallegos — 1970 Vice President, Principal Financial Officer and Assistant Treasurer | | 2008 | | Vice President, Principal Financial Officer and Assistant Treasurer, The Invesco Funds; Assistant Treasurer, Invesco PowerShares Capital Management LLC, PowerShares Exchange-Traded Fund Trust, PowerShares Exchange-Traded Fund Trust II, PowerShares India Exchange-Traded Fund Trust, PowerShares Actively Managed Exchange-Traded Fund Trust and PowerShares Actively Managed Exchange-Traded Commodity Fund Trust Formerly: Assistant Vice President, The Invesco Funds | | N/A | | N/A |
Tracy Sullivan — 1962 Vice President, Chief Tax Officer and Assistant Treasurer | | 2008 | | Vice President, Chief Tax Officer and Assistant Treasurer, The Invesco Funds; Assistant Treasurer, Invesco PowerShares Capital Management LLC, PowerShares Exchange-Traded Fund Trust, PowerShares Exchange-Traded Fund Trust II, PowerShares India Exchange-Traded Fund Trust, PowerShares Actively Managed Exchange-Traded Fund Trust and PowerShares Actively Managed Exchange-Traded Commodity Fund Trust Formerly: Assistant Vice President, The Invesco Funds | | N/A | | N/A |
Crissie M. Wisdom — 1969 Anti-Money Laundering Compliance Officer | | 2013 | | Anti-Money Laundering Compliance Officer, Invesco Advisers, Inc. (formerly known as Invesco Institutional (N.A.), Inc.) (registered investment adviser), Invesco Capital Markets, Inc. (formerly known as Van Kampen Funds Inc.), Invesco Distributors, Inc., Invesco Investment Services, Inc., Invesco Management Group, Inc., The Invesco Funds, and PowerShares Exchange-Traded Fund Trust, PowerShares Exchange-Traded Fund Trust II, PowerShares India Exchange-Traded Fund Trust, PowerShares Actively Managed Exchange-Traded Fund Trust and PowerShares Actively Managed Exchange-Traded Commodity Fund Trust; Anti-Money Laundering Compliance Officer and Bank Secrecy Act Officer, INVESCO National Trust Company and Invesco Trust Company; and Fraud Prevention Manager and Controls and Risk Analysis Manager for Invesco Investment Services, Inc. Formerly: Anti-Money Laundering Compliance Officer, Van Kampen Exchange Corp. | | N/A | | N/A |
Robert R. Leveille — 1969 Chief Compliance Officer | | 2016 | | Chief Compliance Officer, Invesco Advisers, Inc. (registered investment adviser); and Chief Compliance Officer, The Invesco Funds Formerly: Chief Compliance Officer, Putnam Investments and the Putnam Funds | | N/A | | N/A |
The Statement of Additional Information of the Trust includes additional information about the Fund’s Trustees and is available upon request, without charge, by calling 1.800.959.4246. Please refer to the Fund’s Statement of Additional Information for information on the Fund’s sub-advisers.
| | | | | | |
Office of the Fund 11 Greenway Plaza, Suite 1000 Houston, TX 77046-1173 | | Investment Adviser Invesco Advisers, Inc. 1555 Peachtree Street, N.E. Atlanta, GA 30309 | | Distributor Invesco Distributors, Inc. 11 Greenway Plaza, Suite 1000 Houston, TX 77046-1173 | | Auditors PricewaterhouseCoopers LLP 1000 Louisiana Street, Suite 5800 Houston, TX 77002-5678 |
| | | |
| | | | | | |
Counsel to the Fund Stradley Ronon Stevens & Young, LLP 2005 Market Street, Suite 2600 Philadelphia, PA 19103-7018 | | Counsel to the Independent Trustees Goodwin Procter LLP 901 New York Avenue, N.W. Washington, D.C. 20001 | | Transfer Agent Invesco Investment Services, Inc. 11 Greenway Plaza, Suite 1000 Houston, TX 77046-1173 | | Custodian State Street Bank and Trust Company 225 Franklin Street Boston, MA 02110-2801 |
T-4 Invesco Emerging Markets Equity Fund
Explore High-Conviction Investing with Invesco

Go paperless with eDelivery
Visit invesco.com/edelivery to enjoy the convenience and security of anytime electronic access to your investment documents.
With eDelivery, you can elect to have any or all of the following materials delivered straight to your inbox to download, save and print from your own computer:
| ∎ | | Fund reports and prospectuses |
Invesco mailing information
Send general correspondence to Invesco Investment Services, Inc., P.O. Box 219078, Kansas City, MO 64121-9078.
Important notice regarding delivery of security holder documents
To reduce Fund expenses, only one copy of most shareholder documents may be mailed to shareholders with multiple accounts at the same address (Householding). Mailing of your shareholder documents may be householded indefinitely unless you instruct us otherwise. If you do not want the mailing of these documents to be combined with those for other members of your household, please contact Invesco Investment Services, Inc. at 800 959 4246 or contact your financial institution. We will begin sending you individual copies for each account within 30 days after receiving your request.
Fund holdings and proxy voting information
The Fund provides a complete list of its holdings four times in each fiscal year, at the quarter ends. For the second and fourth quarters, the lists appear in the Fund’s semiannual and annual reports to shareholders. For the first and third quarters, the Fund files the lists with the Securities and Exchange Commission (SEC) on Form N-Q. The most recent list of portfolio holdings is available at invesco.com/completeqtrholdings. Shareholders can also look up the Fund’s Forms N-Q on the SEC website at sec.gov. Copies of the Fund’s Forms N-Q may be reviewed and copied at the SEC Public Reference Room in Washington, D.C. You can obtain information on the operation of the Public Reference Room, including information about duplicating fee charges, by calling 202 551 8090 or 800 732 0330, or by electronic request at the following email address: publicinfo@sec.gov. The SEC file numbers for the Fund are shown below.
A description of the policies and procedures that the Fund uses to determine how to vote proxies relating to portfolio securities is available without charge, upon request, from our Client Services department at 800 959 4246 or at invesco.com/proxyguidelines. The information is also available on the SEC website, sec.gov.
| | |
Information regarding how the Fund voted proxies related to its portfolio securities during the most recent 12-month period ended June 30 is available at invesco.com/proxysearch. The information is also available on the SEC website, sec.gov. Invesco Advisers, Inc. is an investment adviser; it provides investment advisory services to individual and institutional clients and does not sell securities. Invesco Distributors, Inc. is the US distributor for Invesco Ltd.’s retail mutual funds, exchange-traded funds and institutional money market funds. Both are wholly owned, indirect subsidiaries of Invesco Ltd. | |  |
| | | | | | |
| SEC file numbers: 811-05426 and 033-19338 | | Invesco Distributors, Inc. | | | | EME-AR-1 12192017 1444 |

Letters to Shareholders
| | | | |

Philip Taylor | | | | Dear Shareholders: This annual report includes information about your Fund, including performance data and a complete list of its investments as of the close of the reporting period. Inside is a discussion of how your Fund was managed and the factors that affected its performance during the reporting period. American voters went to the polls just days after the start of the reporting period, and their decisions quickly affected markets. The US stock market rallied strongly after the election, with major market indexes rising, and setting record highs, throughout the reporting period. Generally positive economic data, strong corporate earnings and hope for tax and regulatory reform contributed to the rally. US and global bond markets, as well as emerging market equities, sold off immediately following the election – with the US bond market eventually recovering most of its losses. Overseas, economic data were mixed, prompting the |
European Central Bank and central banks in China and Japan, among other countries, to maintain extraordinarily accommodative monetary policies. Citing positive economic trends – specifically, realized and expected labor market conditions and inflation – the US Federal Reserve raised interest rates three times during the reporting period: first in December 2016, and then again in March and June 2017. Health care and tax reform proved to be more difficult than expected to enact, with little progress achieved by the end of the reporting period.
Short-term market volatility can prompt some investors to abandon their investment plans – and can cause others to settle for whatever returns the market has to offer. The investment professionals at Invesco, in contrast, invest with high conviction. This means that, no matter the asset class or the strategy, each investment team has a passion to exceed. We want to help investors achieve better outcomes, such as seeking higher returns, helping mitigate risk and generating income. Of course, investing with high conviction can’t guarantee a profit or ensure success; no investment strategy can. To learn more about how we invest with high conviction, visit invesco.com/HighConviction.
You, too, can invest with high conviction by maintaining a long-term investment perspective and by working with your financial adviser on a regular basis. During periods of short-term market volatility or uncertainty, your financial adviser can keep you focused on your long-term investment goals – a new home, a child’s college education or a secure retirement. He or she also can share research about the economy, the markets and individual investment options.
Visit our website for more information on your investments
Our website, invesco.com/us, offers a wide range of market insights and investment perspectives. On the website, you’ll find detailed information about our funds, including performance, holdings and portfolio manager commentaries. You can access information about your account by completing a simple, secure online registration. To do so, select “Log In” on the right side of the homepage, and then select “Register for Individual Account Access.”
In addition to the resources accessible on our website and through our mobile app, you can obtain timely updates to help you stay informed about the markets and the economy by connecting with Invesco on Twitter, LinkedIn or Facebook. You can access our blog at blog.invesco.us.com. Our goal is to provide you the information you want, when and where you want it.
Finally, I’m pleased to share with you Invesco’s commitment to both the Principles for Responsible Investment and to considering environmental, social and governance issues in our robust investment process. I invite you to learn more at invesco.com/esg.
Have questions?
For questions about your account, contact an Invesco client services representative at 800 959 4246. For Invesco-related questions or comments, please email me directly at phil@invesco.com.
All of us at Invesco look forward to serving your investment management needs. Thank you for investing with us.
Sincerely,

Philip Taylor
Senior Managing Director, Invesco Ltd.
| | | | |

Bruce Crockett | | | | Dear Fellow Shareholders: Among the many important lessons I’ve learned in more than 40 years in a variety of business endeavors is the value of a trusted advocate. As independent chair of the Invesco Funds Board, I can assure you that the members of the Board are strong advocates for the interests of investors in Invesco’s mutual funds. We work hard to represent your interests through oversight of the quality of the investment management services your funds receive and other matters important to your investment, including but not limited to: ∎ Ensuring that Invesco offers a diverse lineup of mutual funds that your financial adviser can use to strive to meet your financial needs as your investment goals change over time. ∎ Monitoring how the portfolio management teams of the Invesco funds are performing in light of changing economic and market conditions. |
| ∎ | Assessing each portfolio management team’s investment performance within the context of the investment strategy described in the fund’s prospectus. |
| ∎ | Monitoring for potential conflicts of interests that may impact the nature of the services that your funds receive. |
We believe one of the most important services we provide our fund shareholders is the annual review of the funds’ advisory and sub-advisory contracts with Invesco Advisers and its affiliates. This review is required by the Investment Company Act of 1940 and focuses on the nature and quality of the services Invesco provides as the adviser to the Invesco funds and the reasonableness of the fees that it charges for those services. Each year, we spend months carefully reviewing information received from Invesco and a variety of independent sources, such as performance and fee data prepared by Lipper, Inc. (a subsidiary of Broadridge Financial Solutions, Inc.), an independent, third-party firm widely recognized as a leader in its field. We also meet with our independent legal counsel and other independent advisers to review and help us assess the information that we have received. Our goal is to assure that you receive quality investment management services for a reasonable fee.
I trust the measures outlined above provide assurance that you have a worthy advocate when it comes to choosing the Invesco Funds.
As always, please contact me at bruce@brucecrockett.com with any questions or concerns you may have. On behalf of the Board, we look forward to continuing to represent your interests and serving your needs.
Sincerely,

Bruce L. Crockett
Independent Chair
Invesco Funds Board of Trustees
Management’s Discussion of Fund Performance
Performance summary
For the fiscal year ended October 31, 2017, Class A shares of Invesco Endeavor Fund (the Fund), at net asset value (NAV), outperformed the Fund’s style-specific benchmark, the Russell Midcap Index.
Your Fund’s long-term performance appears later in this report.
Fund vs. Indexes
Total returns, 10/31/16 to 10/31/17, at net asset value (NAV). Performance shown does not include applicable contingent deferred sales charges (CDSC) or front-end sales charges, which would have reduced performance.
| | | | | |
| Class A Shares | | | | 27.44 | % |
| Class B Shares | | | | 26.54 | |
| Class C Shares | | | | 26.52 | |
| Class R Shares | | | | 27.16 | |
| Class Y Shares | | | | 27.77 | |
| Class R5 Shares | | | | 27.92 | |
| Class R6 Shares | | | | 28.04 | |
| S&P 500 Index▼ (Broad Market Index) | | | | 23.63 | |
| Russell Midcap Index▼ (Style-Specific Index) | | | | 21.09 | |
| Lipper Mid-Cap Core Funds Index∎ (Peer Group Index) | | | | 20.93 | |
Source(s): ▼FactSet Research Systems Inc.; ∎Lipper Inc. | | | | | |
Market conditions and your Fund
Despite highly destructive hurricanes that threatened to derail a years-long recovery, the US economy continued to expand throughout the fiscal year ended October 31, 2017. Gross domestic product (GDP) – the value of all goods and services produced in the US – grew by 1.8% in the fourth quarter of 2016, by 1.2% in the first quarter and by 3.1% in the second quarter of 2017.1 Inflation remained subdued even as the labor market continued to strengthen. Unemployment continued its multiyear decline, hitting just 4.2% in September – a 16-year low.2
Given signs of an improving economy, the US Federal Reserve (the Fed) raised interest rates three times during the reporting period, most recently in June 2017.3 The Fed pledged that “realized and expected economic conditions relative to its objectives of maximum employment and 2 percent inflation” will guide its future actions. At the close of the
reporting period, Fed policy remained accommodative, and the fed funds target rate stood at a range of 1.00% to 1.25% – up 75 basis points for the reporting period.3 (A basis point is 0.01%.)
Despite the Fed’s actions, major US stock market indexes repeatedly hit all-time highs throughout the reporting period. The stock market rally began immediately following the outcome of the US presidential election in November 2016, based on investors’ hopes for reduced regulation, lowered corporate and personal tax rates and increased infrastructure spending. The stock market rally continued throughout the reporting period, fueled by generally positive economic data, strong corporate earnings and improved consumer confidence – even as the prospect for health care and tax reform faded somewhat.
Before we discuss the Fund’s results during the fiscal year, it is helpful to briefly explain how we manage the Fund for shareholders. We view ourselves as
business people buying businesses, and we consider the purchase of a stock as an ownership interest in a business. We strive to develop a proprietary view of a business through in-depth, fundamental research that includes careful financial statement analysis and meetings with company management. We then seek to purchase businesses whose stock prices are below what we have calculated to be the true value of the company based on an estimate of its future free cash flows.
Our investment approach focuses on individual businesses rather than market sectors. Therefore, the Fund shares little in common with sector weightings of various market indexes. However, if we were to broadly categorize businesses with which we had the most success during the fiscal year, select holdings in the financials and industrials sectors were among the largest absolute contributors to the Fund’s performance. Conversely, select holdings in the energy sector were among the largest absolute detractors from the Fund’s performance.
Relative to the Fund’s style-specific benchmark, security selection in and overweight exposure to the financials and industrials sectors contributed to the Fund’s relative performance. Additionally, security selection in and underweight exposure to the consumer discretionary sector, as well as not owning any consumer staples stocks, helped the Fund’s relative performance. Conversely, the Fund’s cash holdings detracted from its relative performance. Additionally, security selection in and underweight exposure to the information technology sector, as well as security selection in the energy sector, hurt the Fund’s relative performance.
Encore Capital Group, a financial company that buys consumer receivables from major banks and credit unions and works to collect as much of the outstanding debt as possible, was the top
| | | | | |
| Portfolio Composition | | |
By sector | % of total net assets |
| | | | | |
| Industrials | | | | 23.2 | % |
| Financials | | | | 17.3 | |
| Information Technology | | | | 10.9 | |
| Health Care | | | | 10.6 | |
| Consumer Discretionary | | | | 8.7 | |
| Real Estate | | | | 5.4 | |
| Energy | | | | 4.7 | |
Money Market Funds Plus Other Assets Less Liabilities | | | | 19.2 | |
| | | | | |
| Top 10 Equity Holdings* |
% of total net assets |
| | | | | |
1. Brookfield Property Partners L.P. | | | | 5.5 | % |
2. Echo Global Logistics, Inc. | | | | 4.3 | |
3. Encore Capital Group, Inc. | | | | 4.1 | |
4. Cognizant Technology Solutions Corp.-Class A | | | | 4.0 | |
5. UnitedHealth Group Inc. | | | | 3.8 | |
6. Oaktree Capital Group LLC | | | | 3.6 | |
7. McKesson Corp. | | | | 3.5 | |
8. Zimmer Biomet Holdings, Inc. | | | | 3.4 | |
9. Spirit Airlines Inc. | | | | 3.2 | |
10. Affiliated Managers Group, Inc. | | | | 3.1 | |
| | | | | |
Total Net Assets | | | $ | 240.5 million | |
| |
Total Number of Holdings* | | | | 30 | |
The Fund’s holdings are subject to change, and
there is no assurance that the Fund will continue to hold any particular security.
*Excluding money market fund holdings.
Data presented here are as of October 31, 2017.
contributor to the Fund’s performance, given solid earnings and improved outlook for the market environment.
Also among the Fund’s top contributors was Ryanair Holdings, a European airline. The company benefited from continued execution of its low-cost strategy and improving conditions in the European passenger airline market.
Given volatility in commodity prices and negative sentiment about the asset class, the energy sector was the largest absolute detractor from the Fund’s performance during the reporting period. Sector holdings Cenovus Energy and Newalta detracted from the Fund’s performance.
In addition, Plantronics, a designer and manufacturer of communication headsets, was among the top detractors after reporting poor revenue and earnings during the reporting period.
During the fiscal year, we made new investments in Spirit Airlines, an ultra-low-cost US airline operator, and Autozone, a leading retailer and distributor of auto replacement parts and accessories. We sold CDW, a global multi-brand technology solutions provider, primarily based on valuation.
The Fund’s cash position was a result of our disciplined approach which compels us to trim and sell holdings when their stock prices reach or exceed our estimation of intrinsic value, as well as only buy new businesses when we can purchase shares at a meaningful discount to our estimation of intrinsic value. We believe any portfolio cash provides us with the opportunity to invest in attractive investment opportunities as they present themselves.
In a market often driven by short-term factors, we continued to focus on finding quality businesses we believed were trading at attractive values relative to their long-term prospects. While we can never predict future Fund performance, we pledge to you that we will adhere to our discipline of being business people who buy businesses – and we will continually strive to upgrade the quality of the Fund’s portfolio.
As always, we thank you for your investment in Invesco Endeavor Fund and for sharing our long-term investment perspective.
1 Source: Bureau of Economic Analysis
2 Sources: Bureau of Labor Statistics,
Bloomberg
3 Source: US Federal Reserve
The views and opinions expressed in management’s discussion of Fund performance are those of Invesco Advisers, Inc. These views and opinions are subject to change at any time based on factors such as market and economic conditions. These views and opinions may not be relied upon as investment advice or recommendations, or as an offer for a particular security. The information is not a complete analysis of every aspect of any market, country, industry, security or the Fund. Statements of fact are from sources considered reliable, but Invesco Advisers, Inc. makes no representation or warranty as to their completeness or accuracy. Although historical performance is no guarantee of future results, these insights may help you understand our investment management philosophy.
See important Fund and, if applicable, index disclosures later in this report.
| | |

| | Mark Uptigrove Chartered Financial Analyst, Portfolio Manager, is lead manager of Invesco |
| Endeavor Fund. He joined Invesco in 2005. Mr. Uptigrove earned a BA from the University of Western Ontario and an MBA from the Richard Ivey School of Business. |
| | | |

| | Clayton Zacharias Chartered Financial Analyst, Portfolio Manager, is manager of Invesco Endeavor Fund. |
| He joined Invesco in 2002. Mr. Zacharias earned a BBA from Simon Fraser University. |
Your Fund’s Long-Term Performance
Results of a $10,000 Investment – Oldest Share Class(es)
Fund and index data from 10/31/07
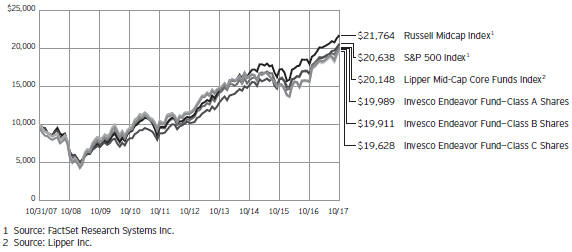
Past performance cannot guarantee comparable future results.
The data shown in the chart include reinvested distributions, applicable sales charges and Fund expenses including management fees. Results for Class B shares are calculated as if a hypothetical
shareholder had liquidated his entire investment in the Fund at the close of the reporting period and paid the contingent deferred sales charges, if applicable. Index results include reinvested dividends, but they do not reflect sales charges. Performance of the peer group,
if applicable, reflects fund expenses and management fees; performance of a market index does not. Performance shown in the chart and table(s) does not reflect deduction of taxes a shareholder would pay on Fund distributions or sale of Fund shares.
continued from page 8
About indexes used in this report
| ∎ | | The S&P 500® Index is an unmanaged index considered representative of the US stock market. |
| ∎ | | The Russell Midcap® Index is an unmanaged index considered representative of mid-cap stocks. The Russell Midcap Index is a trademark/service mark of the Frank Russell Co. Russell® is a trademark of the Frank Russell Co. |
| ∎ | | The Lipper Mid-Cap Core Funds Index is an unmanaged index considered representative of mid-cap core funds tracked by Lipper. |
| ∎ | | The Fund is not managed to track the performance of any particular index, including the index(es) described here, and consequently, the performance of the Fund may deviate significantly from the performance of the index(es). |
| ∎ | | A direct investment cannot be made in an index. Unless otherwise indicated, index results include reinvested dividends, and they do not reflect sales charges. Performance of the peer |
| | group, if applicable, reflects fund expenses; performance of a market index does not. |
Other information
| ∎ | | The returns shown in management’s discussion of Fund performance are based on net asset values (NAVs) calculated for shareholder transactions. Generally accepted accounting principles require adjustments to be made to the net assets of the Fund at period end for financial reporting purposes, and as such, the NAVs for shareholder transactions and the returns based on those NAVs may differ from the NAVs and returns reported in the Financial Highlights. |
| ∎ | | Industry classifications used in this report are generally according to the Global Industry Classification Standard, which was developed by and is the exclusive property and a service mark of MSCI Inc. and Standard & Poor’s. |
| | | | |
Average Annual Total Returns | |
| As of 10/31/17, including maximum applicable sales charges | |
| | | | | |
| |
| Class A Shares | | | | |
| Inception (11/4/03) | | | 9.43 | % |
| 10 Years | | | 7.17 | |
| 5 Years | | | 10.63 | |
| 1 Year | | | 20.43 | |
| |
| Class B Shares | | | | |
| Inception (11/4/03) | | | 9.41 | % |
| 10 Years | | | 7.13 | |
| 5 Years | | | 10.80 | |
| 1 Year | | | 21.54 | |
| |
| Class C Shares | | | | |
| Inception (11/4/03) | | | 9.07 | % |
| 10 Years | | | 6.98 | |
| 5 Years | | | 11.06 | |
| 1 Year | | | 25.52 | |
| |
| Class R Shares | | | | |
| Inception (4/30/04) | | | 9.29 | % |
| 10 Years | | | 7.52 | |
| 5 Years | | | 11.61 | |
| 1 Year | | | 27.16 | |
| |
| Class Y Shares | | | | |
| 10 Years | | | 8.03 | % |
| 5 Years | | | 12.17 | |
| 1 Year | | | 27.77 | |
| |
| Class R5 Shares | | | | |
| Inception (4/30/04) | | | 10.06 | % |
| 10 Years | | | 8.28 | |
| 5 Years | | | 12.30 | |
| 1 Year | | | 27.92 | |
| |
| Class R6 Shares | | | | |
| 10 Years | | | 8.03 | % |
| 5 Years | | | 12.41 | |
| 1 Year | | | 28.04 | |
Class Y shares incepted on October 3, 2008. Performance shown prior to that date is that of Class A shares and includes the 12b-1 fees applicable to Class A shares.
Class R6 shares incepted on September 24, 2012. Performance shown prior to that date is that of Class A shares and includes the 12b-1 fees applicable to Class A shares.
The performance data quoted represent past performance and cannot guarantee comparable future results; current performance may be lower or higher. Please visit invesco.com/performance for the most recent month-end performance. Performance figures reflect reinvested distributions, changes in net asset value and the effect of the maximum sales charge unless otherwise stated. Investment return and
| | | | |
Average Annual Total Returns | |
| As of 9/30/17, the most recent calendar quarter end, including maximum applicable sales charges | |
| |
| Class A Shares | | | | |
| Inception (11/4/03) | | | 9.26 | % |
| 10 Years | | | 6.87 | |
| 5 Years | | | 10.05 | |
| 1 Year | | | 16.08 | |
| |
| Class B Shares | | | | |
| Inception (11/4/03) | | | 9.25 | % |
| 10 Years | | | 6.83 | |
| 5 Years | | | 10.23 | |
| 1 Year | | | 16.96 | |
| |
| Class C Shares | | | | |
| Inception (11/4/03) | | | 8.91 | % |
| 10 Years | | | 6.68 | |
| 5 Years | | | 10.50 | |
| 1 Year | | | 20.95 | |
| |
| Class R Shares | | | | |
| Inception (4/30/04) | | | 9.13 | % |
| 10 Years | | | 7.22 | |
| 5 Years | | | 11.04 | |
| 1 Year | | | 22.59 | |
| |
| Class Y Shares | | | | |
| 10 Years | | | 7.72 | % |
| 5 Years | | | 11.60 | |
| 1 Year | | | 23.16 | |
| |
| Class R5 Shares | | | | |
| Inception (4/30/04) | | | 9.90 | % |
| 10 Years | | | 7.98 | |
| 5 Years | | | 11.74 | |
| 1 Year | | | 23.37 | |
| |
| Class R6 Shares | | | | |
| 10 Years | | | 7.73 | % |
| 5 Years | | | 11.84 | |
| 1 Year | | | 23.45 | |
principal value will fluctuate so that you may have a gain or loss when
you sell shares.
The net annual Fund operating expense ratio set forth in the most recent Fund prospectus as of the date of this report for Class A, Class B, Class C, Class R, Class Y, Class R5 and Class R6 shares was 1.36%, 2.11%, 2.11%, 1.61%, 1.11%, 0.96% and 0.87%, respectively.1 The total annual Fund operating expense ratio set forth in the most recent Fund prospectus as of the date of this report for Class A, Class B, Class C, Class R, Class Y, Class R5 and Class R6 shares was 1.38%, 2.13%, 2.13%, 1.63%, 1.13%, 0.98% and 0.89%, respectively. The expense ratios presented above may vary from the expense ratios presented in other sections of this report that are based
on expenses incurred during the period covered by this report.
Class A share performance reflects the maximum 5.50% sales charge, and Class B and Class C share performance reflects the applicable contingent deferred sales charge (CDSC) for the period involved. The CDSC on Class B shares declines from 5% beginning at the time of purchase to 0% at the beginning of the seventh year. The CDSC on Class C shares is 1% for the first year after purchase. Class R, Class Y, Class R5 and Class R6 shares do not have a front-end sales charge or a CDSC; therefore, performance is at net asset value.
The performance of the Fund’s share classes will differ primarily due to different sales charge structures and class expenses.
Fund performance reflects any applicable fee waivers and/or expense reimbursements. Had the adviser not waived fees and/or reimbursed expenses currently or in the past, returns would have been lower. See current prospectus for more information.
| 1 | Total annual Fund operating expenses after any contractual fee waivers and/or expense reimbursements by the adviser in effect through at least June 30, 2019. See current prospectus for more information. |
Invesco Endeavor Fund’s investment objective is long-term growth of capital.
| ∎ | | Unless otherwise stated, information presented in this report is as of October 31, 2017, and is based on total net assets. |
| ∎ | | Unless otherwise noted, all data provided by Invesco. |
| ∎ | | To access your Fund’s reports/prospectus, visit invesco.com/fundreports. |
About share classes
| ∎ | | Class B shares may not be purchased for new or additional investments. Please see the prospectus for more information. |
| ∎ | | Class R shares are generally available only to employer sponsored retirement and benefit plans. Please see the prospectus for more information. |
| ∎ | | Class Y shares are available only to certain investors. Please see the prospectus for more information. |
| ∎ | | Class R5 shares and Class R6 shares are available for use by retirement plans that meet certain standards and for institutional investors. Class R6 shares are also available through intermediaries that have established an agreement with Invesco Distributors, Inc. to make such shares available for use in retail omnibus accounts. Please see the prospectus for more information. |
Principal risks of investing in the Fund
| ∎ | | Cash/cash equivalents risk. In rising markets, holding cash or cash equivalents will negatively affect the Fund’s performance relative to its benchmark. |
| ∎ | | Debt securities risk. The prices of debt securities held by the Fund will be affected by changes in interest rates, the creditworthiness of the issuer and other factors. An increase in prevailing interest rates typically causes the value of existing debt securities to fall and often has a greater impact on longer-duration debt securities and higher quality debt securities. Falling interest rates will cause the Fund to reinvest the proceeds of debt securities that have been repaid by the issuer at lower interest rates. Falling interest rates may also reduce the Fund’s distributable income because interest payments on floating rate debt instruments held by the Fund will decline. The Fund could lose money on investments in debt securities if the issuer or borrower fails to meet its obligations to make interest payments and/or to repay principal in a timely manner. Changes in an issuer’s financial |
| | | strength, the market’s perception of such strength or in the credit rating of the issuer or the security may affect the value of debt securities. The Adviser’s credit analysis may fail to anticipate such changes, which could result in buying a debt security at an inopportune time or failing to sell a debt security in advance of a price decline or other credit event. |
| ∎ | | Foreign securities risk. The Fund’s foreign investments may be adversely affected by political and social instability, changes in economic or taxation policies, difficulty in enforcing obligations, decreased liquidity or increased volatility. Foreign investments also involve the risk of the possible seizure, nationalization or expropriation of the issuer or foreign deposits (in which the Fund could lose its entire investments in a certain market) and the possible adoption of foreign governmental restrictions such as exchange controls. Unless the Fund has hedged its foreign securities risk, foreign securities risk also involves the risk of negative foreign currency rate fluctuations, which may cause the value of securities denominated in such foreign currency (or other instruments through which the Fund has exposure to foreign currencies) to decline in value. Currency exchange rates may fluctuate significantly over short periods of time. Currency hedging strategies, if used, are not always successful. |
| ∎ | | Management risk. The Fund is actively managed and depends heavily on the Adviser’s judgment about markets, interest rates or the attractiveness, relative values, liquidity, or potential appreciation of particular investments made for the Fund’s portfolio. The Fund could experience losses if these judgments prove to be incorrect. Additionally, legislative, regulatory, or tax developments may adversely affect management of the Fund and, therefore, the ability of the Fund to achieve its investment objective. |
| ∎ | | Market risk. The market values of the Fund’s investments, and therefore the value of the Fund’s shares, will go up and down, sometimes rapidly or unpredictably. Market risk may affect a single issuer, industry or section of the economy, or it may affect the market as a whole. Individual stock prices tend to go up and down more dramatically than those of certain other types of investments, such as bonds. During a general downturn in the financial markets, multiple asset classes may decline in value. When markets perform well, there can be no assurance that specific investments held by the Fund will rise in value. |
| ∎ | | Small- and mid-capitalization companies risks. Small- and mid-capitalization companies tend to be more vulnerable to changing market conditions, may have little or no operating history or track record of success, and may have more limited product lines and markets, less experienced management and fewer financial resources than larger companies. These companies’ securities may be more volatile and less liquid than those of more established companies, and their returns may vary, sometimes significantly, from the overall securities market. |
| ∎ | | US government obligations risk. Obligations of US government agencies and authorities receive varying levels of support and may not be backed by the full faith and credit of the US government, which could affect the Fund’s ability to recover should they default. No assurance can be given that the US government will provide financial support to its agencies and authorities if it is not obligated by law to do so. |
| ∎ | | Value investing style risk. A value investing style subjects the Fund to the risk that the valuations never improve or that the returns on value equity securities are less than returns on other styles of investing or the overall stock market. |
continued on page 6
|
This report must be accompanied or preceded by a currently effective Fund prospectus, which contains more complete information, including sales charges and expenses. Investors should read it carefully before investing. |
|
|
| NOT FDIC INSURED | MAY LOSE VALUE | NO BANK GUARANTEE |
Schedule of Investments(a)
October 31, 2017
| | | | | | | | |
| | | Shares | | | Value | |
Common Stocks & Other Equity Interests–80.80% | |
| Agricultural & Farm Machinery–2.48% | |
Deere & Co. | | | 44,890 | | | $ | 5,964,983 | |
|
| Air Freight & Logistics–4.32% | |
Echo Global Logistics, Inc.(b) | | | 431,609 | | | | 10,380,196 | |
|
| Airlines–6.00% | |
Ryanair Holdings PLC–ADR (Ireland)(b) | | | 60,058 | | | | 6,733,103 | |
Spirit Airlines Inc.(b) | | | 207,235 | | | | 7,686,346 | |
| | | | | | | | 14,419,449 | |
|
| Apparel Retail–2.82% | |
Ross Stores, Inc. | | | 106,988 | | | | 6,792,668 | |
|
| Asset Management & Custody Banks–6.75% | |
Affiliated Managers Group, Inc. | | | 40,220 | | | | 7,501,030 | |
Oaktree Capital Group LLC | | | 190,733 | | | | 8,735,571 | |
| | | | | | | | 16,236,601 | |
|
| Automotive Retail–4.43% | |
AutoZone, Inc.(b) | | | 9,082 | | | | 5,353,839 | |
CarMax, Inc.(b) | | | 70,428 | | | | 5,289,143 | |
| | | | | | | | 10,642,982 | |
|
| Communications Equipment–2.10% | |
Plantronics, Inc. | | | 111,550 | | | | 5,059,908 | |
|
| Construction & Engineering–2.15% | |
Orion Group Holdings, Inc.(b) | | | 719,419 | | | | 5,179,817 | |
|
| Consumer Finance–4.13% | |
Encore Capital Group, Inc.(b) | | | 214,068 | | | | 9,943,459 | |
|
| Data Processing & Outsourced Services–2.26% | |
Alliance Data Systems Corp. | | | 24,247 | | | | 5,424,781 | |
|
| Diversified Banks–2.53% | |
Bank of America Corp. | | | 222,226 | | | | 6,086,770 | |
|
| Education Services–1.44% | |
Capella Education Co. | | | 42,377 | | | | 3,451,607 | |
|
| Environmental & Facilities Services–1.90% | |
Stericycle, Inc.(b) | | | 64,525 | | | | 4,571,596 | |
|
| Health Care Distributors–3.47% | |
McKesson Corp. | | | 60,513 | | | | 8,343,532 | |
|
| Health Care Equipment–3.38% | |
Zimmer Biomet Holdings, Inc. | | | 66,803 | | | | 8,124,581 | |
| | | | | | | | |
| | | Shares | | | Value | |
| Integrated Oil & Gas–1.75% | |
Cenovus Energy Inc. (Canada) | | | 433,667 | | | $ | 4,208,597 | |
|
| IT Consulting & Other Services–4.01% | |
Cognizant Technology Solutions Corp.– Class A | | | 127,596 | | | | 9,655,189 | |
|
| Life & Health Insurance–2.07% | |
Unum Group | | | 95,729 | | | | 4,981,737 | |
|
| Managed Health Care–3.75% | |
UnitedHealth Group Inc. | | | 42,947 | | | | 9,028,318 | |
|
| Multi-Line Insurance–1.78% | |
Vienna Insurance Group AG Wiener Versicherung Gruppe (Austria) | | | 146,205 | | | | 4,285,957 | |
|
| Oil & Gas Equipment & Services–0.32% | |
Newalta Corp. (Canada)(b) | | | 1,135,958 | | | | 766,052 | |
|
| Oil & Gas Exploration & Production–2.59% | |
Devon Energy Corp. | | | 169,120 | | | | 6,240,528 | |
|
| Real Estate Operating Companies–5.46% | |
Brookfield Property Partners L.P. | | | 563,009 | | | | 13,123,740 | |
|
| Research & Consulting Services–2.42% | |
FTI Consulting, Inc.(b) | | | 136,018 | | | | 5,814,770 | |
|
| Systems Software–2.53% | |
Check Point Software Technologies Ltd. (Israel)(b) | | | 51,600 | | | | 6,073,836 | |
|
| Trading Companies & Distributors–3.96% | |
Grafton Group PLC (United Kingdom)(c) | | | 304,859 | | | | 3,330,917 | |
Titan Machinery, Inc.(b) | | | 416,227 | | | | 6,197,620 | |
| | | | | | | | 9,528,537 | |
Total Common Stocks & Other Equity Interests
(Cost $147,715,050) | | | | 194,330,191 | |
|
Money Market Funds–19.05% | |
Invesco Government & Agency Portfolio–Institutional Class, 0.95%(d) | | | 27,496,514 | | | | 27,496,514 | |
Invesco Treasury Portfolio–Institutional Class, 0.94%(d) | | | 18,331,010 | | | | 18,331,010 | |
Total Money Market Funds
(Cost $45,827,524) | | | | 45,827,524 | |
TOTAL INVESTMENTS IN SECURITIES–99.85%
(Cost $193,542,574) | | | | 240,157,715 | |
OTHER ASSETS LESS LIABILITIES–0.15% | | | | 369,217 | |
NET ASSETS–100.00% | | | $ | 240,526,932 | |
Investment Abbreviations:
| | |
| ADR | | – American Depositary Receipt |
Notes to Schedule of Investments:
| (a) | Industry and/or sector classifications used in this report are generally according to the Global Industry Classification Standard, which was developed by and is the exclusive property and a service mark of MSCI Inc. and Standard & Poor’s. |
| (b) | Non-income producing security. |
| (c) | Each unit represents one ordinary share, seventeen Class A shares and one Class C share. |
| (d) | The money market fund and the Fund are affiliated by having the same investment adviser. The rate shown is the 7-day SEC standardized yield as of October 31, 2017. |
See accompanying Notes to Financial Statements which are an integral part of the financial statements.
9 Invesco Endeavor Fund
Statement of Assets and Liabilities
October 31, 2017
| | | | |
Assets: | |
Investments in securities, at value (Cost $147,715,050) | | $ | 194,330,191 | |
Investments in affiliated money market funds, at value and cost | | | 45,827,524 | |
Foreign currencies, at value (Cost $192) | | | 193 | |
Receivable for: | | | | |
Fund shares sold | | | 858,044 | |
Dividends | | | 122,418 | |
Investment for trustee deferred compensation and retirement plans | | | 70,848 | |
Other assets | | | 55,944 | |
Total assets | | | 241,265,162 | |
|
Liabilities: | |
Payable for: | | | | |
Fund shares reacquired | | | 440,546 | |
Accrued fees to affiliates | | | 163,502 | |
Accrued trustees’ and officers’ fees and benefits | | | 2,651 | |
Accrued other operating expenses | | | 51,760 | |
Trustee deferred compensation and retirement plans | | | 79,771 | |
Total liabilities | | | 738,230 | |
Net assets applicable to shares outstanding | | $ | 240,526,932 | |
|
Net assets consist of: | |
Shares of beneficial interest | | $ | 188,757,672 | |
Undistributed net investment income (loss) | | | (146,239 | ) |
Undistributed net realized gain | | | 5,298,852 | |
Net unrealized appreciation | | | 46,616,647 | |
| | | $ | 240,526,932 | |
| | | | |
Net Assets: | |
Class A | | $ | 132,670,358 | |
Class B | | $ | 628,752 | |
Class C | | $ | 31,548,316 | |
Class R | | $ | 14,449,164 | |
Class Y | | $ | 37,034,117 | |
Class R5 | | $ | 22,158,127 | |
Class R6 | | $ | 2,038,098 | |
|
Shares outstanding, no par value,
with an unlimited number of shares authorized: | |
Class A | | | 6,697,299 | |
Class B | | | 36,537 | |
Class C | | | 1,831,733 | |
Class R | | | 758,886 | |
Class Y | | | 1,815,560 | |
Class R5 | | | 1,054,961 | |
Class R6 | | | 96,552 | |
Class A: | | | | |
Net asset value per share | | $ | 19.81 | |
Maximum offering price per share | | | | |
(Net asset value of $19.81 ¸ 94.50%) | | $ | 20.96 | |
Class B: | | | | |
Net asset value and offering price per share | | $ | 17.21 | |
Class C: | | | | |
Net asset value and offering price per share | | $ | 17.22 | |
Class R: | | | | |
Net asset value and offering price per share | | $ | 19.04 | |
Class Y: | | | | |
Net asset value and offering price per share | | $ | 20.40 | |
Class R5: | | | | |
Net asset value and offering price per share | | $ | 21.00 | |
Class R6: | | | | |
Net asset value and offering price per share | | $ | 21.11 | |
See accompanying Notes to Financial Statements which are an integral part of the financial statements.
10 Invesco Endeavor Fund
Statement of Operations
For the year ended October 31, 2017
| | | | |
Investment income: | |
Dividends (net of foreign withholding taxes of $42,440) | | $ | 2,846,334 | |
Dividends from affiliated money market funds | | | 292,667 | |
Total investment income | | | 3,139,001 | |
| |
Expenses: | | | | |
Advisory fees | | | 1,930,259 | |
Administrative services fees | | | 89,635 | |
Custodian fees | | | 14,686 | |
Distribution fees: | | | | |
Class A | | | 318,221 | |
Class B | | | 9,372 | |
Class C | | | 342,718 | |
Class R | | | 83,926 | |
Transfer agent fees — A, B, C, R and Y | | | 469,545 | |
Transfer agent fees — R5 | | | 20,712 | |
Transfer agent fees — R6 | | | 2,846 | |
Trustees’ and officers’ fees and benefits | | | 24,771 | |
Registration and filing fees | | | 97,330 | |
Reports to shareholders | | | 82,413 | |
Professional services fees | | | 55,994 | |
Other | | | 13,844 | |
Total expenses | | | 3,556,272 | |
Less: Fees waived and expense offset arrangement(s) | | | (55,564 | ) |
Net expenses | | | 3,500,708 | |
Net investment income (loss) | | | (361,707 | ) |
| |
Realized and unrealized gain (loss) from: | | | | |
Net realized gain (loss) from: | | | | |
Investment securities | | | 26,052,972 | |
Foreign currencies | | | (12,708 | ) |
| | | | 26,040,264 | |
Change in net unrealized appreciation of: | | | | |
Investment securities | | | 37,826,744 | |
Foreign currencies | | | 18,933 | |
| | | | 37,845,677 | |
Net realized and unrealized gain | | | 63,885,941 | |
Net increase in net assets resulting from operations | | $ | 63,524,234 | |
See accompanying Notes to Financial Statements which are an integral part of the financial statements.
11 Invesco Endeavor Fund
Statement of Changes in Net Assets
For the years ended October 31, 2017 and 2016
| | | | | | | | |
| | | 2017 | | | 2016 | |
Operations: | | | | | |
Net investment income (loss) | | $ | (361,707 | ) | | $ | (222,686 | ) |
Net realized gain | | | 26,040,264 | | | | 7,951,256 | |
Change in net unrealized appreciation (depreciation) | | | 37,845,677 | | | | (9,947,929 | ) |
Net increase (decrease) in net assets resulting from operations | | | 63,524,234 | | | | (2,219,359 | ) |
| | |
Distributions to shareholders from net realized gains: | | | | | | | | |
Class A | | | (12,424,004 | ) | | | (16,953,146 | ) |
Class B | | | (112,920 | ) | | | (267,843 | ) |
Class C | | | (3,915,415 | ) | | | (5,458,567 | ) |
Class R | | | (1,786,325 | ) | | | (3,009,806 | ) |
Class Y | | | (2,904,478 | ) | | | (4,208,147 | ) |
Class R5 | | | (2,170,163 | ) | | | (3,853,359 | ) |
Class R6 | | | (4,593,195 | ) | | | (10,628,285 | ) |
Total distributions from net realized gains | | | (27,906,500 | ) | | | (44,379,153 | ) |
| | |
Share transactions–net: | | | | | | | | |
Class A | | | (1,049,715 | ) | | | (16,330,124 | ) |
Class B | | | (628,934 | ) | | | (752,329 | ) |
Class C | | | (3,264,441 | ) | | | (6,649,697 | ) |
Class R | | | (5,371,596 | ) | | | (4,522,551 | ) |
Class Y | | | 13,558,855 | | | | (15,501,361 | ) |
Class R5 | | | (2,388,568 | ) | | | (9,049,506 | ) |
Class R6 | | | (52,762,339 | ) | | | (26,818,592 | ) |
Net increase (decrease) in net assets resulting from share transactions | | | (51,906,738 | ) | | | (79,624,160 | ) |
Net increase (decrease) in net assets | | | (16,289,004 | ) | | | (126,222,672 | ) |
| | |
Net assets: | | | | | | | | |
Beginning of year | | | 256,815,936 | | | | 383,038,608 | |
End of year (includes undistributed net investment income (loss) of $(146,239) and $(173,954), respectively) | | $ | 240,526,932 | | | $ | 256,815,936 | |
Notes to Financial Statements
October 31, 2017
NOTE 1—Significant Accounting Policies
Invesco Endeavor Fund (the “Fund”) is a series portfolio of AIM Investment Funds (Invesco Investment Funds) (the “Trust”). The Trust is organized as a Delaware statutory trust and is registered under the Investment Company Act of 1940, as amended (the “1940 Act”), as an open-end series management investment company consisting of twenty separate series portfolios, each authorized to issue an unlimited number of shares of beneficial interest. The assets, liabilities and operations of each portfolio are accounted for separately. Information presented in these financial statements pertains only to the Fund. Matters affecting each portfolio or class will be voted on exclusively by the shareholders of such portfolio or class.
The Fund’s investment objective is long-term growth of capital.
The Fund currently consists of seven different classes of shares: Class A, Class B, Class C, Class R, Class Y, Class R5 and Class R6. Class Y shares are available only to certain investors. Class A shares are sold with a front-end sales charge unless certain waiver criteria are met and under certain circumstances load waived shares may be subject to contingent deferred sales charges (“CDSC”). Class C shares are sold with a CDSC. Class R, Class Y, Class R5 and Class R6 shares are sold at net asset value. Effective November 30, 2010, new or additional investments in Class B shares are no longer permitted. Existing shareholders of Class B shares may continue to reinvest dividends and capital gains distributions in Class B shares until they convert to Class A shares. Also, shareholders in Class B shares will be able to exchange those shares for Class B shares of other Invesco Funds offering such shares until they convert to Class A shares. Generally, Class B shares will automatically convert to Class A shares on or about the month-end, which is at least eight years after the date of purchase. Redemption of Class B shares prior to the conversion date will be subject to a CDSC.
The Fund is an investment company and accordingly follows the investment company accounting and reporting guidance in accordance with Financial Accounting Standards Board Accounting Standards Codification Topic 946, Financial Services — Investment Companies.
The following is a summary of the significant accounting policies followed by the Fund in the preparation of its financial statements.
| A. | Security Valuations — Securities, including restricted securities, are valued according to the following policy. |
12 Invesco Endeavor Fund
A security listed or traded on an exchange (except convertible securities) is valued at its last sales price or official closing price as of the close of the customary trading session on the exchange where the security is principally traded, or lacking any sales or official closing price on a particular day, the security may be valued at the closing bid price on that day. Securities traded in the over-the-counter market are valued based on prices furnished by independent pricing services or market makers. When such securities are valued by an independent pricing service they may be considered fair valued. Futures contracts are valued at the final settlement price set by an exchange on which they are principally traded. Listed options are valued at the mean between the last bid and asked prices from the exchange on which they are principally traded. Options not listed on an exchange are valued by an independent source at the mean between the last bid and asked prices. For purposes of determining net asset value (“NAV”) per share, futures and option contracts generally are valued 15 minutes after the close of the customary trading session of the New York Stock Exchange (“NYSE”).
Investments in open-end and closed-end registered investment companies that do not trade on an exchange are valued at the end-of-day net asset value per share. Investments in open-end and closed-end registered investment companies that trade on an exchange are valued at the last sales price or official closing price as of the close of the customary trading session on the exchange where the security is principally traded.
Debt obligations (including convertible securities) and unlisted equities are fair valued using an evaluated quote provided by an independent pricing service. Evaluated quotes provided by the pricing service may be determined without exclusive reliance on quoted prices, and may reflect appropriate factors such as institution-size trading in similar groups of securities, developments related to specific securities, dividend rate (for unlisted equities), yield (for debt obligations), quality, type of issue, coupon rate (for debt obligations), maturity (for debt obligations), individual trading characteristics and other market data. Pricing services generally value debt obligations assuming orderly transactions of institutional round lot size, but a fund may hold or transact in the same securities in smaller, odd lot sizes. Odd lots often trade at lower prices than institutional round lots. Debt obligations are subject to interest rate and credit risks. In addition, all debt obligations involve some risk of default with respect to interest and/or principal payments.
Foreign securities’ (including foreign exchange contracts) prices are converted into U.S. dollar amounts using the applicable exchange rates as of the close of the NYSE. If market quotations are available and reliable for foreign exchange-traded equity securities, the securities will be valued at the market quotations. Because trading hours for certain foreign securities end before the close of the NYSE, closing market quotations may become unreliable. If between the time trading ends on a particular security and the close of the customary trading session on the NYSE, events occur that the investment adviser determines are significant and make the closing price unreliable, the Fund may fair value the security. If the event is likely to have affected the closing price of the security, the security will be valued at fair value in good faith using procedures approved by the Board of Trustees. Adjustments to closing prices to reflect fair value may also be based on a screening process of an independent pricing service to indicate the degree of certainty, based on historical data, that the closing price in the principal market where a foreign security trades is not the current value as of the close of the NYSE. Foreign securities’ prices meeting the approved degree of certainty that the price is not reflective of current value will be priced at the indication of fair value from the independent pricing service. Multiple factors may be considered by the independent pricing service in determining adjustments to reflect fair value and may include information relating to sector indices, American Depositary Receipts and domestic and foreign index futures. Foreign securities may have additional risks including exchange rate changes, potential for sharply devalued currencies and high inflation, political and economic upheaval, the relative lack of issuer information, relatively low market liquidity and the potential lack of strict financial and accounting controls and standards.
Securities for which market prices are not provided by any of the above methods may be valued based upon quotes furnished by independent sources. The last bid price may be used to value equity securities. The mean between the last bid and asked prices is used to value debt obligations, including corporate loans.
Securities for which market quotations are not readily available or became unreliable are valued at fair value as determined in good faith by or under the supervision of the Trust’s officers following procedures approved by the Board of Trustees. Issuer specific events, market trends, bid/asked quotes of brokers and information providers and other market data may be reviewed in the course of making a good faith determination of a security’s fair value.
The Fund may invest in securities that are subject to interest rate risk, meaning the risk that the prices will generally fall as interest rates rise and, conversely, the prices will generally rise as interest rates fall. Specific securities differ in their sensitivity to changes in interest rates depending on their individual characteristics. Changes in interest rates may result in increased market volatility, which may affect the value and/or liquidity of certain Fund investments.
Valuations change in response to many factors including the historical and prospective earnings of the issuer, the value of the issuer’s assets, general economic conditions, interest rates, investor perceptions and market liquidity. Because of the inherent uncertainties of valuation, the values reflected in the financial statements may materially differ from the value received upon actual sale of those investments.
| B. | Securities Transactions and Investment Income — Securities transactions are accounted for on a trade date basis. Realized gains or losses on sales are computed on the basis of specific identification of the securities sold. Interest income (net of withholding tax, if any) is recorded on the accrual basis from settlement date. Dividend income (net of withholding tax, if any) is recorded on the ex-dividend date. |
The Fund may periodically participate in litigation related to Fund investments. As such, the Fund may receive proceeds from litigation settlements. Any proceeds received are included in the Statement of Operations as realized gain (loss) for investments no longer held and as unrealized gain (loss) for investments still held.
Brokerage commissions and mark ups are considered transaction costs and are recorded as an increase to the cost basis of securities purchased and/or a reduction of proceeds on a sale of securities. Such transaction costs are included in the determination of net realized and unrealized gain (loss) from investment securities reported in the Statement of Operations and the Statement of Changes in Net Assets and the net realized and unrealized gains (losses) on securities per share in the Financial Highlights. Transaction costs are included in the calculation of the Fund’s net asset value and, accordingly, they reduce the Fund’s total returns. These transaction costs are not considered operating expenses and are not reflected in net investment income reported in the Statement of Operations and the Statement of Changes in Net Assets, or the net investment income per share and the ratios of expenses and net investment income reported in the Financial Highlights, nor are they limited by any expense limitation arrangements between the Fund and the investment adviser.
The Fund allocates income and realized and unrealized capital gains and losses to a class based on the relative net assets of each class.
13 Invesco Endeavor Fund
| C. | Country Determination — For the purposes of making investment selection decisions and presentation in the Schedule of Investments, the investment adviser may determine the country in which an issuer is located and/or credit risk exposure based on various factors. These factors include the laws of the country under which the issuer is organized, where the issuer maintains a principal office, the country in which the issuer derives 50% or more of its total revenues and the country that has the primary market for the issuer’s securities, as well as other criteria. Among the other criteria that may be evaluated for making this determination are the country in which the issuer maintains 50% or more of its assets, the type of security, financial guarantees and enhancements, the nature of the collateral and the sponsor organization. Country of issuer and/or credit risk exposure has been determined to be the United States of America, unless otherwise noted. |
| D. | Distributions — Distributions from net investment income and net realized capital gain, if any, are generally declared and paid annually and recorded on the ex-dividend date. The Fund may elect to treat a portion of the proceeds from redemptions as distributions for federal income tax purposes. |
| E. | Federal Income Taxes — The Fund intends to comply with the requirements of Subchapter M of the Internal Revenue Code of 1986, as amended (the “Internal Revenue Code”), necessary to qualify as a regulated investment company and to distribute substantially all of the Fund’s taxable earnings to shareholders. As such, the Fund will not be subject to federal income taxes on otherwise taxable income (including net realized capital gain) that is distributed to shareholders. Therefore, no provision for federal income taxes is recorded in the financial statements. |
The Fund recognizes the tax benefits of uncertain tax positions only when the position is more likely than not to be sustained. Management has analyzed the Fund’s uncertain tax positions and concluded that no liability for unrecognized tax benefits should be recorded related to uncertain tax positions. Management is not aware of any tax positions for which it is reasonably possible that the total amounts of unrecognized tax benefits will change materially in the next 12 months.
The Fund files tax returns in the U.S. Federal jurisdiction and certain other jurisdictions. Generally, the Fund is subject to examinations by such taxing authorities for up to three years after the filing of the return for the tax period.
| F. | Expenses — Fees provided for under the Rule 12b-1 plan of a particular class of the Fund are charged to the operations of such class. Transfer agency fees and expenses and other shareholder recordkeeping fees and expenses attributable to Class R5 and Class R6 are allocated to each share class based on relative net assets. Sub-accounting fees attributable to Class R5 are charged to the operations of the class. Transfer agency fees and expenses and other shareholder recordkeeping fees and expenses relating to all other classes are allocated among those classes based on relative net assets. All other expenses are allocated among the classes based on relative net assets. |
| G. | Accounting Estimates — The preparation of financial statements in conformity with accounting principles generally accepted in the United States of America (“GAAP”) requires management to make estimates and assumptions that affect the reported amounts of assets and liabilities at the date of the financial statements and the reported amounts of revenues and expenses during the reporting period including estimates and assumptions related to taxation. Actual results could differ from those estimates by a significant amount. In addition, the Fund monitors for material events or transactions that may occur or become known after the period-end date and before the date the financial statements are released to print. |
| H. | Indemnifications — Under the Trust’s organizational documents, each Trustee, officer, employee or other agent of the Trust is indemnified against certain liabilities that may arise out of the performance of their duties to the Fund. Additionally, in the normal course of business, the Fund enters into contracts, including the Fund’s servicing agreements, that contain a variety of indemnification clauses. The Fund’s maximum exposure under these arrangements is unknown as this would involve future claims that may be made against the Fund that have not yet occurred. The risk of material loss as a result of such indemnification claims is considered remote. |
| I. | Foreign Currency Translations — Foreign currency is valued at the close of the NYSE based on quotations posted by banks and major currency dealers. Portfolio securities and other assets and liabilities denominated in foreign currencies are translated into U.S. dollar amounts at date of valuation. Purchases and sales of portfolio securities (net of foreign taxes withheld on disposition) and income items denominated in foreign currencies are translated into U.S. dollar amounts on the respective dates of such transactions. The Fund does not separately account for the portion of the results of operations resulting from changes in foreign exchange rates on investments and the fluctuations arising from changes in market prices of securities held. The combined results of changes in foreign exchange rates and the fluctuation of market prices on investments (net of estimated foreign tax withholding) are included with the net realized and unrealized gain or loss from investments in the Statement of Operations. Reported net realized foreign currency gains or losses arise from (1) sales of foreign currencies, (2) currency gains or losses realized between the trade and settlement dates on securities transactions, and (3) the difference between the amounts of dividends, interest, and foreign withholding taxes recorded on the Fund’s books and the U.S. dollar equivalent of the amounts actually received or paid. Net unrealized foreign currency gains and losses arise from changes in the fair values of assets and liabilities, other than investments in securities at fiscal period end, resulting from changes in exchange rates. |
The Fund may invest in foreign securities, which may be subject to foreign taxes on income, gains on investments or currency repatriation, a portion of which may be recoverable. Foreign taxes, if any, are recorded based on the tax regulations and rates that exist in the foreign markets in which the Fund invests and are shown in the Statement of Operations.
| J. | Forward Foreign Currency Contracts — The Fund may engage in foreign currency transactions either on a spot (i.e. for prompt delivery and settlement) basis, or through forward foreign currency contracts, to manage or minimize currency or exchange rate risk. |
The Fund may also enter into forward foreign currency contracts for the purchase or sale of a security denominated in a foreign currency in order to “lock in” the U.S. dollar price of that security, or the Fund may also enter into forward foreign currency contracts that do not provide for physical settlement of the two currencies, but instead are settled by a single cash payment calculated as the difference between the agreed upon exchange rate and the spot rate at settlement based upon an agreed upon notional amount (non-deliverable forwards). The Fund will set aside liquid assets in an amount equal to the daily mark-to-market obligation for forward foreign currency contracts.
A forward foreign currency contract is an obligation between two parties (“Counterparties”) to purchase or sell a specific currency for an agreed-upon price at a future date. The use of forward foreign currency contracts does not eliminate fluctuations in the price of the underlying securities the Fund owns or intends to acquire but establishes a rate of exchange in advance. Fluctuations in the value of these contracts are measured by the difference in the contract date and reporting date exchange rates and are recorded as unrealized appreciation (depreciation) until the contracts are closed. When the contracts are closed, realized gains (losses) are recorded. Realized and unrealized gains (losses) on the contracts are included in the Statement of Operations. The primary risks associated with forward foreign currency contracts include failure of the
14 Invesco Endeavor Fund
Counterparty to meet the terms of the contract and the value of the foreign currency changing unfavorably. These risks may be in excess of the amounts reflected in the Statement of Assets and Liabilities.
NOTE 2—Advisory Fees and Other Fees Paid to Affiliates
The Trust has entered into a master investment advisory agreement with Invesco Advisers, Inc. (the “Adviser” or “Invesco”). Under the terms of the investment advisory agreement, the Fund accrues daily and pays monthly an advisory fee to the Adviser based on the annual rate of the Fund’s average daily net assets as follows:
| | | | | | | | |
| Average Daily Net Assets | | Rate | |
First $250 million | | | 0 | .745% | | | | |
Next $250 million | | | 0 | .73% | | | | |
Next $500 million | | | 0 | .715% | | | | |
Next $1.5 billion | | | 0 | .70% | | | | |
Next $2.5 billion | | | 0 | .685% | | | | |
Next $2.5 billion | | | 0 | .67% | | | | |
Next $2.5 billion | | | 0 | .655% | | | | |
Over $10 billion | | | 0 | .64% | | | | |
For the year ended October 31, 2017, the effective advisory fees incurred by the Fund was 0.74%.
Under the terms of a master sub-advisory agreement between the Adviser and each of Invesco Asset Management Deutschland GmbH, Invesco Asset Management Limited, Invesco Asset Management (Japan) Limited, Invesco Hong Kong Limited, Invesco Senior Secured Management, Inc. and Invesco Canada Ltd. (collectively, the “Affiliated Sub-Advisers”) the Adviser, not the Fund, will pay 40% of the fees paid to the Adviser to any such Affiliated Sub-Adviser(s) that provide(s) discretionary investment management services to the Fund based on the percentage of assets allocated to such Affiliated Sub-Adviser(s).
The Adviser has contractually agreed, through at least June 30, 2018, to waive advisory fees and/or reimburse expenses to the extent necessary to limit total annual fund operating expenses after fee waiver and/or expense reimbursement (excluding certain items discussed below) of Class A, Class B, Class C, Class R, Class Y, Class R5 and Class R6 shares to 2.00%, 2.75%, 2.75%, 2.25%, 1.75%, 1.75% and 1.75%, respectively, of the Fund’s average daily net assets (the “expense limits”). In determining the Adviser’s obligation to waive advisory fees and/or reimburse expenses, the following expenses are not taken into account, and could cause the total annual fund operating expenses after fee waiver and/or expense reimbursement to exceed the numbers reflected above: (1) interest; (2) taxes; (3) dividend expense on short sales; (4) extraordinary or non-routine items, including litigation expenses; and (5) expenses that the Fund has incurred but did not actually pay because of an expense offset arrangement. Unless Invesco continues the fee waiver agreement, it will terminate on June 30, 2018. During its term, the fee waiver agreement cannot be terminated or amended to increase the expense limits without approval of the Board of Trustees. The Adviser did not waive fees and/or reimburse expenses during the period under these expense limits.
Further, the Adviser has contractually agreed, through at least June 30, 2019, to waive the advisory fee payable by the Fund in an amount equal to 100% of the net advisory fees the Adviser receives from the affiliated money market funds on investments by the Fund of uninvested cash in such affiliated money market funds.
For the year ended October 31, 2017, the Adviser waived advisory fees of $50,717.
The Trust has entered into a master administrative services agreement with Invesco pursuant to which the Fund has agreed to pay Invesco for certain administrative costs incurred in providing accounting services to the Fund. For the year ended October 31, 2017, expenses incurred under the agreement are shown in the Statement of Operations as Administrative services fees.
The Trust has entered into a transfer agency and service agreement with Invesco Investment Services, Inc. (“IIS”) pursuant to which the Fund has agreed to pay IIS a fee for providing transfer agency and shareholder services to the Fund and reimburse IIS for certain expenses incurred by IIS in the course of providing such services. IIS may make payments to intermediaries that provide omnibus account services, sub-accounting services and/or networking services. All fees payable by IIS to intermediaries that provide omnibus account services or sub-accounting services are charged back to the Fund, subject to certain limitations approved by the Trust’s Board of Trustees. For the year ended October 31, 2017, expenses incurred under the agreement are shown in the Statement of Operations as Transfer agent fees.
The Trust has entered into master distribution agreements with Invesco Distributors, Inc. (“IDI”) to serve as the distributor for the Class A, Class B, Class C, Class R, Class Y, Class R5 and Class R6 shares of the Fund. The Trust has adopted plans pursuant to Rule 12b-1 under the 1940 Act with respect to the Fund’s Class A, Class B, Class C and Class R shares (collectively, the “Plans”). The Fund, pursuant to the Plans, pays IDI compensation at the annual rate of 0.25% of the Fund’s average daily net assets of Class A shares, 1.00% of the average daily net assets of Class B and Class C shares and 0.50% of the average daily net assets of Class R shares. The fees are accrued daily and paid monthly. Of the Plan payments, up to 0.25% of the average daily net assets of each class of shares may be paid to furnish continuing personal shareholder services to customers who purchase and own shares of such classes. Any amounts not paid as a service fee under the Plans would constitute an asset-based sales charge. Rules of the Financial Industry Regulatory Authority (“FINRA”) impose a cap on the total sales charges, including asset-based sales charges, that may be paid by any class of shares of the Fund. For the year ended October 31, 2017, expenses incurred under the Plans are shown in the Statement of Operations as Distribution fees.
Front-end sales commissions and CDSC (collectively, the “sales charges”) are not recorded as expenses of the Fund. Front-end sales commissions are deducted from proceeds from the sales of Fund shares prior to investment in Class A shares of the Fund. CDSC are deducted from redemption proceeds prior to remittance to the shareholder. During the year ended October 31, 2017, IDI advised the Fund that IDI retained $30,929 in front-end sales commissions from the sale of Class A shares and $875 and $2,357 from Class A and Class C shares, respectively, for CDSC imposed on redemptions by shareholders.
15 Invesco Endeavor Fund
For the year ended October 31, 2017, the Fund incurred $104 in brokerage commissions with Invesco Capital Markets, Inc., an affiliate of the Adviser and IDI, for portfolio transactions executed on behalf of the Fund.
Certain officers and trustees of the Trust are officers and directors of the Adviser, IIS and/or IDI.
NOTE 3—Additional Valuation Information
GAAP defines fair value as the price that would be received to sell an asset or paid to transfer a liability in an orderly transaction between market participants at the measurement date, under current market conditions. GAAP establishes a hierarchy that prioritizes the inputs to valuation methods, giving the highest priority to readily available unadjusted quoted prices in an active market for identical assets (Level 1) and the lowest priority to significant unobservable inputs (Level 3), generally when market prices are not readily available or are unreliable. Based on the valuation inputs, the securities or other investments are tiered into one of three levels. Changes in valuation methods may result in transfers in or out of an investment’s assigned level:
| | Level 1 — | Prices are determined using quoted prices in an active market for identical assets. |
| | Level 2 — | Prices are determined using other significant observable inputs. Observable inputs are inputs that other market participants may use in pricing a security. These may include quoted prices for similar securities, interest rates, prepayment speeds, credit risk, yield curves, loss severities, default rates, discount rates, volatilities and others. |
| | Level 3 — | Prices are determined using significant unobservable inputs. In situations where quoted prices or observable inputs are unavailable (for example, when there is little or no market activity for an investment at the end of the period), unobservable inputs may be used. Unobservable inputs reflect the Fund’s own assumptions about the factors market participants would use in determining fair value of the securities or instruments and would be based on the best available information. |
As of October 31, 2017, all of the securities in this Fund were valued based on Level 1 inputs (see the Schedule of Investments for security categories). The level assigned to the securities valuations may not be an indication of the risk or liquidity associated with investing in those securities. Because of the inherent uncertainties of valuation, the values reflected in the financial statements may materially differ from the value received upon actual sale of those investments.
The Fund’s policy is to recognize transfers in and out of the valuation levels as of the end of the reporting period. During the year ended October 31, 2017, there were no material transfers between valuation levels.
NOTE 4—Investments in Other Affiliates
The 1940 Act defines an “affiliated person” as an issuance in which a fund holds 5% or more of the outstanding voting securities. The Fund has not owned enough of the outstanding voting securities of the issuer to have control (as defined in the 1940 Act) of that issuer. The following is a summary of the investments in other affiliates (excluding affiliated money market funds) for the year ended October 31, 2017.
| | | | | | | | | | | | | | | | | | | | | | | | | | | | |
| | | Value 10/31/16 | | | Purchases
at Cost | | | Proceeds
from Sales | | | Change in
Unrealized
Appreciation
(Depreciation) | | | Realized
Gain | | | Value 10/31/17 | | | Dividend
Income | |
Orion Group Holdings, Inc.(a) | | $ | 13,290,170 | | | $ | — | | | $ | (8,920,928 | ) | | $ | (1,056,775 | ) | | $ | 1,867,350 | | | $ | 5,179,817 | | | $ | — | |
| (a) | As of October 31, 2017, this security is no longer considered as an affiliate of the Fund. |
NOTE 5—Expense Offset Arrangement(s)
The expense offset arrangement is comprised of transfer agency credits which result from balances in demand deposit accounts used by the transfer agent for clearing shareholder transactions. For the year ended October 31, 2017, the Fund received credits from this arrangement, which resulted in the reduction of the Fund’s total expenses of $4,847.
NOTE 6—Trustees’ and Officers’ Fees and Benefits
Trustees’ and Officers’ Fees and Benefits include amounts accrued by the Fund to pay remuneration to certain Trustees and Officers of the Fund. Trustees have the option to defer compensation payable by the Fund, and Trustees’ and Officers’ Fees and Benefits also include amounts accrued by the Fund to fund such deferred compensation amounts. Those Trustees who defer compensation have the option to select various Invesco Funds in which their deferral accounts shall be deemed to be invested. Finally, certain current Trustees were eligible to participate in a retirement plan that provided for benefits to be paid upon retirement to Trustees over a period of time based on the number of years of service. The Fund may have certain former Trustees who also participate in a retirement plan and receive benefits under such plan. Trustees’ and Officers’ Fees and Benefits include amounts accrued by the Fund to fund such retirement benefits. Obligations under the deferred compensation and retirement plans represent unsecured claims against the general assets of the Fund.
NOTE 7—Cash Balances
The Fund is permitted to temporarily carry a negative or overdrawn balance in its account with State Street Bank and Trust Company, the custodian bank. Such balances, if any at period-end, are shown in the Statement of Assets and Liabilities under the payable caption Amount due custodian. To compensate the custodian bank for such overdrafts, the overdrawn Fund may either (1) leave funds as a compensating balance in the account so the custodian bank can be compensated by earning the additional interest; or (2) compensate by paying the custodian bank at a rate agreed upon by the custodian bank and Invesco, not to exceed the contractually agreed upon rate.
16 Invesco Endeavor Fund
NOTE 8—Distributions to Shareholders and Tax Components of Net Assets
Tax Character of Distributions to Shareholders Paid During the Fiscal Years Ended October 31, 2017 and 2016:
| | | | | | | | |
| | | 2017 | | | 2016 | |
Ordinary income | | $ | 2,901,936 | | | $ | 8,302,567 | |
Long-term capital gain | | | 25,004,564 | | | | 36,076,586 | |
Total distributions | | $ | 27,906,500 | | | $ | 44,379,153 | |
Tax Components of Net Assets at Period-End:
| | | | |
| | | 2017 | |
Undistributed ordinary income | | $ | 1,137,222 | |
Undistributed long-term gain | | | 5,558,435 | |
Net unrealized appreciation — investments | | | 45,145,349 | |
Net unrealized appreciation — foreign currencies | | | 1,506 | |
Temporary book/tax differences | | | (73,252 | ) |
Shares of beneficial interest | | | 188,757,672 | |
Total net assets | | $ | 240,526,932 | |
The difference between book-basis and tax-basis unrealized appreciation (depreciation) is due to differences in the timing of recognition of gains and losses on investments for tax and book purposes. The Fund’s net unrealized appreciation difference is attributable primarily to wash sales and partnership income adjustments.
The temporary book/tax differences are a result of timing differences between book and tax recognition of income and/or expenses. The Fund’s temporary book/tax differences are the result of the trustee deferral of compensation and retirement plan benefits.
Capital loss carryforward is calculated and reported as of a specific date. Results of transactions and other activity after that date may affect the amount of capital loss carryforward actually available for the Fund to utilize. Capital losses generated in years beginning after December 22, 2010 can be carried forward for an unlimited period, whereas previous losses expire in eight tax years. Capital losses with an expiration period may not be used to offset capital gains until all net capital losses without an expiration date have been utilized. Capital loss carryforwards with no expiration date will retain their character as either short-term or long-term capital losses instead of as short-term capital losses as under prior law. The ability to utilize capital loss carryforwards in the future may be limited under the Internal Revenue Code and related regulations based on the results of future transactions.
The Fund does not have a capital loss carryforward as of October 31, 2017.
NOTE 9—Investment Transactions
The aggregate amount of investment securities (other than short-term securities, U.S. Treasury obligations and money market funds, if any) purchased and sold by the Fund during the year ended October 31, 2017 was $39,682,936 and $128,528,160, respectively. Cost of investments, including any derivatives, on a tax basis includes the adjustments for financial reporting purposes as of the most recently completed federal income tax reporting period-end.
| | | | |
| Unrealized Appreciation (Depreciation) of Investments on a Tax Basis | |
Aggregate unrealized appreciation of investments | | $ | 63,206,811 | |
Aggregate unrealized (depreciation) of investments | | | (18,061,462 | ) |
Net unrealized appreciation of investments | | $ | 45,145,349 | |
Cost of investments for tax purposes is $195,012,366.
NOTE 10—Reclassification of Permanent Differences
Primarily as a result of differing book/tax treatment of net operating losses, on October 31, 2017, undistributed net investment income (loss) was increased by $389,422 and undistributed net realized gain was decreased by $389,422. This reclassification had no effect on the net assets of the Fund.
17 Invesco Endeavor Fund
NOTE 11—Share Information
| | | | | | | | | | | | | | | | |
| | | Summary of Share Activity | |
| | | Years ended October 31, | |
| | | 2017(a) | | | 2016 | |
| | | Shares | | | Amount | | | Shares | | | Amount | |
Sold: | | | | | | | | | | | | | | | | |
Class A | | | 1,807,365 | | | $ | 34,503,121 | | | | 860,186 | | | $ | 14,340,623 | |
Class B | | | 6,048 | | | | 102,352 | | | | 2,418 | | | | 36,076 | |
Class C | | | 530,870 | | | | 8,932,756 | | | | 178,482 | | | | 2,641,468 | |
Class R | | | 245,467 | | | | 4,520,273 | | | | 207,312 | | | | 3,306,725 | |
Class Y | | | 1,335,758 | | | | 26,384,134 | | | | 343,957 | | | | 5,943,184 | |
Class R5 | | | 182,739 | | | | 3,694,560 | | | | 202,044 | | | | 3,521,471 | |
Class R6 | | | 92,237 | | | | 1,821,200 | | | | 336,427 | | | | 6,002,904 | |
| | | | |
Issued as reinvestment of dividends: | | | | | | | | | | | | | | | | |
Class A | | | 646,548 | | | | 12,001,370 | | | | 1,016,193 | | | | 16,015,191 | |
Class B | | | 6,665 | | | | 108,737 | | | | 18,509 | | | | 260,602 | |
Class C | | | 230,746 | | | | 3,755,445 | | | | 365,900 | | | | 5,155,537 | |
Class R | | | 99,570 | | | | 1,782,309 | | | | 196,832 | | | | 3,007,596 | |
Class Y | | | 142,134 | | | | 2,700,939 | | | | 197,663 | | | | 3,184,354 | |
Class R5 | | | 110,165 | | | | 2,160,340 | | | | 229,868 | | | | 3,792,828 | |
Class R6 | | | 233,120 | | | | 4,593,195 | | | | 642,192 | | | | 10,628,285 | |
| | | | |
Automatic conversion of Class B shares to Class A shares: | | | | | | | | | | | | | | | | |
Class A | | | 28,063 | | | | 538,538 | | | | 41,420 | | | | 690,224 | |
Class B | | | (32,635 | ) | | | (538,538 | ) | | | (46,444 | ) | | | (690,224 | ) |
| | | | |
Reacquired: | | | | | | | | | | | | | | | | |
Class A | | | (2,510,541 | ) | | | (48,092,744 | ) | | | (2,835,913 | ) | | | (47,376,162 | ) |
Class B | | | (17,410 | ) | | | (301,485 | ) | | | (23,972 | ) | | | (358,783 | ) |
Class C | | | (951,649 | ) | | | (15,952,642 | ) | | | (973,922 | ) | | | (14,446,702 | ) |
Class R | | | (637,158 | ) | | | (11,674,178 | ) | | | (676,277 | ) | | | (10,836,872 | ) |
Class Y | | | (794,777 | ) | | | (15,526,218 | ) | | | (1,464,934 | ) | | | (24,628,899 | ) |
Class R5 | | | (411,566 | ) | | | (8,243,468 | ) | | | (944,280 | ) | | | (16,363,805 | ) |
Class R6(b) | | | (3,022,821 | ) | | | (59,176,734 | ) | | | (2,719,196 | ) | | | (43,449,781 | ) |
Net increase (decrease) in share activity | | | (2,681,062 | ) | | $ | (51,906,738 | ) | | | (4,845,535 | ) | | $ | (79,624,160 | ) |
| (a) | There are entities that are record owners of more than 5% of the outstanding shares of the Fund and in the aggregate own 35% of the outstanding shares of the Fund. IDI has an agreement with these entities to sell Fund shares. The Fund, Invesco and/or Invesco affiliates may make payments to these entities, which are considered to be related to the Fund, for providing services to the Fund, Invesco and/or Invesco affiliates including but not limited to services such as securities brokerage, distribution, third party record keeping and account servicing. The Fund has no knowledge as to whether all or any portion of the shares owned of record by these entities are also owned beneficially. |
| (b) | On May 5, 2017, 2,459,627 Class R6 shares valued at $47,864,341 and on February 18, 2016, 2,004,623 Class R6 shares valued at $30,931,333 were redeemed by affiliated mutual funds. |
18 Invesco Endeavor Fund
NOTE 12—Financial Highlights
The following schedule presents financial highlights for a share of the Fund outstanding throughout the periods indicated.
| | | | | | | | | | | | | | | | | | | | | | | | | | | | | | | | | | | | | | | | | | | | | | | | | | | | | | | | |
| | | Net asset
value,
beginning
of period | | | Net
investment
income
(loss)(a) | | | Net gains
(losses)
on securities
(both
realized and
unrealized) | | | Total from
investment
operations | | | Dividends
from net
investment
income | | | Distributions
from net
realized
gains | | | Total
distributions | | | Net asset
value, end
of period | | | Total
return(b) | | | Net assets,
end of period
(000’s omitted) | | | Ratio of
expenses
to average
net assets
with fee waivers
and/or expenses
absorbed | | | Ratio of
expenses
to average net
assets without
fee waivers
and/or expenses
absorbed | | | Ratio of net
investment
income (loss)
to average
net assets | | | Portfolio
turnover(c) | |
Class A | |
Year ended 10/31/17 | | $ | 17.19 | | | $ | (0.03 | ) | | $ | 4.57 | | | $ | 4.54 | | | $ | — | | | $ | (1.92 | ) | | $ | (1.92 | ) | | $ | 19.81 | | | | 27.44 | % | | $ | 132,670 | | | | 1.34 | %(d) | | | 1.36 | %(d) | | | (0.13 | )%(d) | | | 19 | % |
Year ended 10/31/16 | | | 19.30 | | | | (0.02 | ) | | | 0.21 | | | | 0.19 | | | | — | | | | (2.30 | ) | | | (2.30 | ) | | | 17.19 | | | | 2.08 | | | | 115,588 | | | | 1.34 | | | | 1.36 | | | | (0.12 | ) | | | 28 | |
Year ended 10/31/15 | | | 22.57 | | | | (0.01 | ) | | | (1.25 | ) | | | (1.26 | ) | | | — | | | | (2.01 | ) | | | (2.01 | ) | | | 19.30 | | | | (5.80 | ) | | | 147,504 | | | | 1.26 | | | | 1.29 | | | | (0.04 | ) | | | 27 | |
Year ended 10/31/14 | | | 21.18 | | | | (0.09 | ) | | | 2.35 | | | | 2.26 | | | | (0.01 | ) | | | (0.86 | ) | | | (0.87 | ) | | | 22.57 | | | | 11.13 | | | | 192,326 | | | | 1.26 | | | | 1.29 | | | | (0.43 | ) | | | 27 | |
Year ended 10/31/13 | | | 18.19 | | | | (0.00 | ) | | | 4.78 | | | | 4.78 | | | | (0.06 | ) | | | (1.73 | ) | | | (1.79 | ) | | | 21.18 | | | | 28.78 | | | | 180,568 | | | | 1.26 | | | | 1.30 | | | | (0.02 | ) | | | 20 | |
Class B | | | | | | | | | | | | | | | | | | | | | | | | | | | | | | | | | | | | | | | | | | | | | | | | | | | | | | | | |
Year ended 10/31/17 | | | 15.25 | | | | (0.15 | ) | | | 4.03 | | | | 3.88 | | | | — | | | | (1.92 | ) | | | (1.92 | ) | | | 17.21 | | | | 26.54 | | | | 629 | | | | 2.09 | (d) | | | 2.11 | (d) | | | (0.88 | )(d) | | | 19 | |
Year ended 10/31/16 | | | 17.52 | | | | (0.13 | ) | | | 0.16 | | | | 0.03 | | | | — | | | | (2.30 | ) | | | (2.30 | ) | | | 15.25 | | | | 1.28 | | | | 1,127 | | | | 2.09 | | | | 2.11 | | | | (0.87 | ) | | | 28 | |
Year ended 10/31/15 | | | 20.82 | | | | (0.15 | ) | | | (1.14 | ) | | | (1.29 | ) | | | — | | | | (2.01 | ) | | | (2.01 | ) | | | 17.52 | | | | (6.50 | ) | | | 2,161 | | | | 2.01 | | | | 2.04 | | | | (0.79 | ) | | | 27 | |
Year ended 10/31/14 | | | 19.74 | | | | (0.24 | ) | | | 2.18 | | | | 1.94 | | | | — | | | | (0.86 | ) | | | (0.86 | ) | | | 20.82 | | | | 10.27 | | | | 4,855 | | | | 2.01 | | | | 2.04 | | | | (1.18 | ) | | | 27 | |
Year ended 10/31/13 | | | 17.16 | | | | (0.14 | ) | | | 4.49 | | | | 4.35 | | | | (0.04 | ) | | | (1.73 | ) | | | (1.77 | ) | | | 19.74 | | | | 27.89 | | | | 5,921 | | | | 2.01 | | | | 2.05 | | | | (0.77 | ) | | | 20 | |
Class C | | | | | | | | | | | | | | | | | | | | | | | | | | | | | | | | | | | | | | | | | | | | | | | | | | | | | | | | |
Year ended 10/31/17 | | | 15.26 | | | | (0.15 | ) | | | 4.03 | | | | 3.88 | | | | — | | | | (1.92 | ) | | | (1.92 | ) | | | 17.22 | | | | 26.52 | | | | 31,548 | | | | 2.09 | (d) | | | 2.11 | (d) | | | (0.88 | )(d) | | | 19 | |
Year ended 10/31/16 | | | 17.53 | | | | (0.13 | ) | | | 0.16 | | | | 0.03 | | | | — | | | | (2.30 | ) | | | (2.30 | ) | | | 15.26 | | | | 1.27 | | | | 30,857 | | | | 2.09 | | | | 2.11 | | | | (0.87 | ) | | | 28 | |
Year ended 10/31/15 | | | 20.83 | | | | (0.15 | ) | | | (1.14 | ) | | | (1.29 | ) | | | — | | | | (2.01 | ) | | | (2.01 | ) | | | 17.53 | | | | (6.49 | ) | | | 42,965 | | | | 2.01 | | | | 2.04 | | | | (0.79 | ) | | | 27 | |
Year ended 10/31/14 | | | 19.75 | | | | (0.24 | ) | | | 2.18 | | | | 1.94 | | | | — | | | | (0.86 | ) | | | (0.86 | ) | | | 20.83 | | | | 10.27 | | | | 53,542 | | | | 2.01 | | | | 2.04 | | | | (1.18 | ) | | | 27 | |
Year ended 10/31/13 | | | 17.17 | | | | (0.14 | ) | | | 4.49 | | | | 4.35 | | | | (0.04 | ) | | | (1.73 | ) | | | (1.77 | ) | | | 19.75 | | | | 27.87 | | | | 49,344 | | | | 2.01 | | | | 2.05 | | | | (0.77 | ) | | | 20 | |
Class R | | | | | | | | | | | | | | | | | | | | | | | | | | | | | | | | | | | | | | | | | | | | | | | | | | | | | | | | |
Year ended 10/31/17 | | | 16.62 | | | | (0.07 | ) | | | 4.41 | | | | 4.34 | | | | — | | | | (1.92 | ) | | | (1.92 | ) | | | 19.04 | | | | 27.16 | | | | 14,449 | | | | 1.59 | (d) | | | 1.61 | (d) | | | (0.38 | )(d) | | | 19 | |
Year ended 10/31/16 | | | 18.78 | | | | (0.06 | ) | | | 0.20 | | | | 0.14 | | | | — | | | | (2.30 | ) | | | (2.30 | ) | | | 16.62 | | | | 1.83 | | | | 17,469 | | | | 1.59 | | | | 1.61 | | | | (0.37 | ) | | | 28 | |
Year ended 10/31/15 | | | 22.08 | | | | (0.06 | ) | | | (1.23 | ) | | | (1.29 | ) | | | — | | | | (2.01 | ) | | | (2.01 | ) | | | 18.78 | | | | (6.09 | ) | | | 24,855 | | | | 1.51 | | | | 1.54 | | | | (0.29 | ) | | | 27 | |
Year ended 10/31/14 | | | 20.77 | | | | (0.14 | ) | | | 2.31 | | | | 2.17 | | | | — | | | | (0.86 | ) | | | (0.86 | ) | | | 22.08 | | | | 10.89 | | | | 34,634 | | | | 1.51 | | | | 1.54 | | | | (0.68 | ) | | | 27 | |
Year ended 10/31/13 | | | 17.91 | | | | (0.05 | ) | | | 4.69 | | | | 4.64 | | | | (0.05 | ) | | | (1.73 | ) | | | (1.78 | ) | | | 20.77 | | | | 28.43 | | | | 34,556 | | | | 1.51 | | | | 1.55 | | | | (0.27 | ) | | | 20 | |
Class Y | | | | | | | | | | | | | | | | | | | | | | | | | | | | | | | | | | | | | | | | | | | | | | | | | | | | | | | | |
Year ended 10/31/17 | | | 17.61 | | | | 0.02 | | | | 4.69 | | | | 4.71 | | | | — | | | | (1.92 | ) | | | (1.92 | ) | | | 20.40 | | | | 27.77 | | | | 37,034 | | | | 1.09 | (d) | | | 1.11 | (d) | | | 0.12 | (d) | | | 19 | |
Year ended 10/31/16 | | | 19.66 | | | | 0.02 | | | | 0.23 | | | | 0.25 | | | | — | | | | (2.30 | ) | | | (2.30 | ) | | | 17.61 | | | | 2.37 | | | | 19,938 | | | | 1.09 | | | | 1.11 | | | | 0.13 | | | | 28 | |
Year ended 10/31/15 | | | 22.91 | | | | 0.04 | | | | (1.28 | ) | | | (1.24 | ) | | | — | | | | (2.01 | ) | | | (2.01 | ) | | | 19.66 | | | | (5.61 | ) | | | 40,425 | | | | 1.01 | | | | 1.04 | | | | 0.21 | | | | 27 | |
Year ended 10/31/14 | | | 21.48 | | | | (0.04 | ) | | | 2.38 | | | | 2.34 | | | | (0.05 | ) | | | (0.86 | ) | | | (0.91 | ) | | | 22.91 | | | | 11.39 | | | | 71,898 | | | | 1.01 | | | | 1.04 | | | | (0.18 | ) | | | 27 | |
Year ended 10/31/13 | | | 18.38 | | | | 0.05 | | | | 4.84 | | | | 4.89 | | | | (0.06 | ) | | | (1.73 | ) | | | (1.79 | ) | | | 21.48 | | | | 29.15 | | | | 92,483 | | | | 1.01 | | | | 1.05 | | | | 0.23 | | | | 20 | |
Class R5 | | | | | | | | | | | | | | | | | | | | | | | | | | | | | | | | | | | | | | | | | | | | | | | | | | | | | | | | |
Year ended 10/31/17 | | | 18.06 | | | | 0.05 | | | | 4.81 | | | | 4.86 | | | | — | | | | (1.92 | ) | | | (1.92 | ) | | | 21.00 | | | | 27.92 | | | | 22,158 | | | | 0.96 | (d) | | | 0.98 | (d) | | | 0.25 | (d) | | | 19 | |
Year ended 10/31/16 | | | 20.08 | | | | 0.05 | | | | 0.23 | | | | 0.28 | | | | — | | | | (2.30 | ) | | | (2.30 | ) | | | 18.06 | | | | 2.49 | | | | 21,192 | | | | 0.94 | | | | 0.96 | | | | 0.28 | | | | 28 | |
Year ended 10/31/15 | | | 23.32 | | | | 0.07 | | | | (1.30 | ) | | | (1.23 | ) | | | — | | | | (2.01 | ) | | | (2.01 | ) | | | 20.08 | | | | (5.46 | ) | | | 33,854 | | | | 0.89 | | | | 0.92 | | | | 0.33 | | | | 27 | |
Year ended 10/31/14 | | | 21.84 | | | | (0.02 | ) | | | 2.43 | | | | 2.41 | | | | (0.07 | ) | | | (0.86 | ) | | | (0.93 | ) | | | 23.32 | | | | 11.51 | | | | 49,356 | | | | 0.90 | | | | 0.93 | | | | (0.07 | ) | | | 27 | |
Year ended 10/31/13 | | | 18.65 | | | | 0.07 | | | | 4.92 | | | | 4.99 | | | | (0.07 | ) | | | (1.73 | ) | | | (1.80 | ) | | | 21.84 | | | | 29.24 | | | | 31,593 | | | | 0.91 | | | | 0.95 | | | | 0.33 | | | | 20 | |
Class R6 | | | | | | | | | | | | | | | | | | | | | | | | | | | | | | | | | | | | | | | | | | | | | | | | | | | | | | | | |
Year ended 10/31/17 | | | 18.13 | | | | 0.07 | | | | 4.83 | | | | 4.90 | | | | — | | | | (1.92 | ) | | | (1.92 | ) | | | 21.11 | | | | 28.04 | | | | 2,038 | | | | 0.88 | (d) | | | 0.90 | (d) | | | 0.33 | (d) | | | 19 | |
Year ended 10/31/16 | | | 20.13 | | | | 0.06 | | | | 0.24 | | | | 0.30 | | | | — | | | | (2.30 | ) | | | (2.30 | ) | | | 18.13 | | | | 2.59 | | | | 50,645 | | | | 0.85 | | | | 0.87 | | | | 0.37 | | | | 28 | |
Year ended 10/31/15 | | | 23.35 | | | | 0.09 | | | | (1.30 | ) | | | (1.21 | ) | | | — | | | | (2.01 | ) | | | (2.01 | ) | | | 20.13 | | | | (5.36 | ) | | | 91,275 | | | | 0.80 | | | | 0.83 | | | | 0.42 | | | | 27 | |
Year ended 10/31/14 | | | 21.86 | | | | 0.01 | | | | 2.42 | | | | 2.43 | | | | (0.08 | ) | | | (0.86 | ) | | | (0.94 | ) | | | 23.35 | | | | 11.62 | | | | 100,410 | | | | 0.81 | | | | 0.84 | | | | 0.02 | | | | 27 | |
Year ended 10/31/13 | | | 18.65 | | | | 0.08 | | | | 4.93 | | | | 5.01 | | | | (0.07 | ) | | | (1.73 | ) | | | (1.80 | ) | | | 21.86 | | | | 29.37 | | | | 90,291 | | | | 0.82 | | | | 0.86 | | | | 0.42 | | | | 20 | |
| (a) | Calculated using average shares outstanding. |
| (b) | Includes adjustments in accordance with accounting principles generally accepted in the United States of America and as such, the net asset value for financial reporting purposes and the returns based upon those net asset values may differ from the net asset value and returns for shareholder transactions. Does not include sales charges and is not annualized for periods less than one year, if applicable. |
| (c) | Portfolio turnover is calculated at the fund level and is not annualized for periods less than one year, if applicable. |
| (d) | Ratios are based on average daily net assets (000’s omitted) of $127,288, $937, $34,272, $16,785, $30,743, $23,160 and $26,097 for Class A, Class B, Class C, Class R, Class Y, Class R5 and Class R6 shares, respectively. |
NOTE 13—Subsequent Event
On December 1, 2017, the Fund’s Board of Trustees approved the early conversion of the remaining assets in the Fund’s Class B shares into Class A shares to occur on or about January 26, 2018. At the close of business on or about January 26, 2018, (the “Conversion Date”) all outstanding Class B shares of the Fund will be converted to Class A shares of the Fund, which is prior to the date the Class B shares would normally be converted to Class A shares. Once the conversion is completed, Class B shares will be closed and become inactive. No contingent deferred sales charges will be payable in connection with this early conversion. The conversion of the Fund’s Class B shares into Class A shares on the Conversion Date is not expected to be a taxable event for federal income tax purposes, and should not result in the recognition of gain or loss by converting shareholders, although each shareholder should consult with his or her own tax adviser.
19 Invesco Endeavor Fund
Report of Independent Registered Public Accounting Firm
To the Board of Trustees of AIM Investment Funds (Invesco Investment Funds)
and Shareholders of Invesco Endeavor Fund:
In our opinion, the accompanying statement of assets and liabilities, including the schedule of investments, and the related statements of operations and of changes in net assets and the financial highlights present fairly, in all material respects, the financial position of Invesco Endeavor Fund (one of the portfolios constituting the AIM Investment Funds (Invesco Investment Funds), hereafter referred to as the “Fund”) as of October 31, 2017, the results of its operations for the year then ended, the changes in its net assets for each of the two years in the period then ended and the financial highlights for each of the five years in the period then ended, in conformity with accounting principles generally accepted in the United States of America. These financial statements and financial highlights (hereafter referred to as “financial statements”) are the responsibility of the Fund’s management. Our responsibility is to express an opinion on these financial statements based on our audits. We conducted our audits of these financial statements in accordance with the standards of the Public Company Accounting Oversight Board (United States). Those standards require that we plan and perform the audit to obtain reasonable assurance about whether the financial statements are free of material misstatement. An audit includes examining, on a test basis, evidence supporting the amounts and disclosures in the financial statements, assessing the accounting principles used and significant estimates made by management, and evaluating the overall financial statement presentation. We believe that our audits, which included confirmation of securities as of October 31, 2017 by correspondence with the custodian and transfer agent, provide a reasonable basis for our opinion.
PricewaterhouseCoopers LLP
Houston, Texas
December 21, 2017
20 Invesco Endeavor Fund
Calculating your ongoing Fund expenses
Example
As a shareholder of the Fund, you incur two types of costs: (1) transaction costs, which may include sales charges (loads) on purchase payments or contingent deferred sales charges on redemptions, if any; and (2) ongoing costs, including management fees, distribution and/or service (12b-1) fees, and other Fund expenses. This example is intended to help you understand your ongoing costs (in dollars) of investing in the Fund and to compare these costs with ongoing costs of investing in other mutual funds. The example is based on an investment of $1,000 invested at the beginning of the period and held for the entire period May 1, 2017 through October 31, 2017.
Actual expenses
The table below provides information about actual account values and actual expenses. You may use the information in this table, together with the amount you invested, to estimate the expenses that you paid over the period. Simply divide your account value by $1,000 (for example, an $8,600 account value divided by $1,000 = 8.6), then multiply the result by the number in the table under the heading entitled “Actual Expenses Paid During Period” to estimate the expenses you paid on your account during this period.
Hypothetical example for comparison purposes
The table below also provides information about hypothetical account values and hypothetical expenses based on the Fund’s actual expense ratio and an assumed rate of return of 5% per year before expenses, which is not the Fund’s actual return.
The hypothetical account values and expenses may not be used to estimate the actual ending account balance or expenses you paid for the period. You may use this information to compare the ongoing costs of investing in the Fund and other funds. To do so, compare this 5% hypothetical example with the 5% hypothetical examples that appear in the shareholder reports of the other funds.
Please note that the expenses shown in the table are meant to highlight your ongoing costs only and do not reflect any transaction costs, such as sales charges (loads) on purchase payments or contingent deferred sales charges on redemptions, if any. Therefore, the hypothetical information is useful in comparing ongoing costs only, and will not help you determine the relative total costs of owning different funds. In addition, if these transaction costs were included, your costs would have been higher.
| | | | | | | | | | | | | | | | | | | | | | | | |
| Class | | Beginning
Account Value
(05/01/17) | | | ACTUAL | | | HYPOTHETICAL
(5% annual return before
expenses) | | | Annualized
Expense
Ratio | |
| | | Ending
Account Value
(10/31/17)1 | | | Expenses
Paid During
Period2 | | | Ending
Account Value
(10/31/17) | | | Expenses
Paid During
Period2 | | |
| A | | $ | 1,000.00 | | | $ | 1,083.00 | | | $ | 7.09 | | | $ | 1,018.40 | | | $ | 6.87 | | | | 1.35 | % |
| B | | | 1,000.00 | | | | 1,078.90 | | | | 11.00 | | | | 1,014.62 | | | | 10.66 | | | | 2.10 | |
| C | | | 1,000.00 | | | | 1,078.80 | | | | 11.00 | | | | 1,014.62 | | | | 10.66 | | | | 2.10 | |
| R | | | 1,000.00 | | | | 1,081.70 | | | | 8.40 | | | | 1,017.14 | | | | 8.13 | | | | 1.60 | |
| Y | | | 1,000.00 | | | | 1,084.40 | | | | 5.78 | | | | 1,019.66 | | | | 5.60 | | | | 1.10 | |
| R5 | | | 1,000.00 | | | | 1,085.10 | | | | 5.10 | | | | 1,020.32 | | | | 4.94 | | | | 0.97 | |
| R6 | | | 1,000.00 | | | | 1,085.80 | | | | 4.68 | | | | 1,020.72 | | | | 4.53 | | | | 0.89 | |
| 1 | The actual ending account value is based on the actual total return of the Fund for the period May 1, 2017 through October 31, 2017, after actual expenses and will differ from the hypothetical ending account value which is based on the Fund’s expense ratio and a hypothetical annual return of 5% before expenses. |
| 2 | Expenses are equal to the Fund’s annualized expense ratio as indicated above multiplied by the average account value over the period, multiplied by 184/365 to reflect the most recent fiscal half year. |
21 Invesco Endeavor Fund
Approval of Investment Advisory and Sub-Advisory Contracts
The Board of Trustees (the Board) of AIM Investment Funds (Invesco Investment Funds) is required under the Investment Company Act of 1940, as amended, to approve annually the renewal of Invesco Endeavor Fund’s (the Fund) investment advisory agreements. During contract renewal meetings held on June 12-13, 2017, the Board as a whole, and the disinterested or “independent” Trustees, who comprise over 75% of the Board, voting separately, approved the continuance for the Fund of the Master Investment Advisory Agreement with Invesco Advisers, Inc. (Invesco Advisers and the investment advisory agreement) and the Master Intergroup Sub-Advisory Contract for Mutual Funds with Invesco Asset Management Deutschland GmbH, Invesco Asset Management Limited, Invesco Asset Management (Japan) Limited, Invesco Hong Kong Limited, Invesco Senior Secured Management, Inc. and Invesco Canada Ltd. and separate Sub-Advisory Contracts with Invesco PowerShares Capital Management LLC and Invesco Asset Management (India) Private Limited (collectively, the Affiliated Sub-Advisers and the sub-advisory contracts) for another year, effective July 1, 2017.
In evaluating the fairness and reasonableness of compensation under the Fund’s investment advisory agreement and sub-advisory contracts, the Board considered, among other things, the factors discussed below. The Board determined that continuation of the Fund’s investment advisory agreement and the sub-advisory contracts is in the best interest of the Fund and its shareholders and that the compensation payable to Invesco Advisers and the Affiliated Sub-Advisers under the agreements is fair and reasonable.
The Board’s Fund Evaluation Process
The Board’s Investments Committee has established three Sub-Committees, which meet throughout the year to review the performance of funds advised by Invesco Advisers (the Invesco Funds). Over the course of each year, the Sub-Committees meet with portfolio managers for their assigned Invesco Funds and other members of management to review the performance, investment objective(s), policies, strategies, limitations and investment risks of these funds. The Board had the benefit of reports from the Sub-Committees and Investments Committee throughout the year in considering approval of the continuance of each Invesco Fund’s investment advisory agreement and sub-advisory contracts for another year.
During the contract renewal process, the Board receives comparative performance and fee data regarding the Invesco Funds prepared by Invesco Advisers and Broadridge Financial Solutions, Inc. (Broadridge), an independent provider of investment company data. The Board also receives an independent written
evaluation from the Senior Officer, an officer of the Invesco Funds who reports directly to the independent Trustees. The Senior Officer’s evaluation is prepared as part of his responsibility to manage the process by which the Invesco Funds’ proposed management fees are negotiated during the annual contract renewal process to ensure they are negotiated in a manner that is at arms’ length and reasonable. In addition to meetings with Invesco Advisers and fund counsel, the independent Trustees also discuss the continuance of the investment advisory agreement and sub-advisory contracts in separate sessions with the Senior Officer and with independent legal counsel.
The Trustees recognized that the advisory fee rates for the Invesco Funds are, in most cases, the result of years of review and negotiation. The Trustees’ deliberations and conclusions in a particular year may be based in part on their deliberations and conclusions regarding these arrangements throughout the year and in prior years. The Trustees’ review and conclusions are based on the comprehensive consideration of all information presented to them and are not the result of any single determinative factor. Moreover, one Trustee may have weighed a particular piece of information or factor differently than another Trustee.
The discussion below is a summary of the Senior Officer’s independent written evaluation with respect to the Fund’s investment advisory agreement as well as a discussion of the material factors and related conclusions that formed the basis for the Board’s approval of the Fund’s investment advisory agreement and sub-advisory contracts. This information is current as of June 13, 2017, and does not reflect consideration of factors that became known to the Board after that date.
Factors and Conclusions and Summary of Independent Written Fee Evaluation
| A. | Nature, Extent and Quality of Services Provided by Invesco Advisers and the Affiliated Sub-Advisers |
The Board reviewed the advisory services provided to the Fund by Invesco Advisers under the Fund’s investment advisory agreement, the performance of Invesco Advisers in providing these services, and the credentials and experience of the officers and employees of Invesco Advisers who provide these services, including the Fund’s portfolio manager or managers. The Board’s review included consideration of Invesco Advisers’ investment process oversight, credit analysis and investment risk management. The Board also considered non-advisory services that Invesco Advisers and its affiliates provide to the Invesco Funds such as various back office support functions, trading operations, internal audit, valuation and legal and compliance.
In determining whether to continue the Fund’s investment advisory agreement, the Board considered the benefits of reapproving an existing relationship as contrasted with the greater uncertainty that may be associated with entering into a new relationship. The Board concluded that the nature, extent and quality of the services provided to the Fund by Invesco Advisers are appropriate and satisfactory.
The Board reviewed the services that may be provided by the Affiliated Sub-Advisers under the sub-advisory contracts and the credentials and experience of the officers and employees of the Affiliated Sub-Advisers who provide these services. The Board noted that the Affiliated Sub-Advisers have offices and personnel that are located in financial centers around the world. As a result, the Board noted that the Affiliated Sub-Advisers can provide research and investment analysis on the markets and economies of various countries in which the Fund may invest, make recommendations regarding securities and assist with security trades. The Board concluded that the sub-advisory contracts may benefit the Fund and its shareholders by permitting Invesco Advisers to use the resources and talents of the Affiliated Sub-Advisers in managing the Fund. The Board concluded that the nature, extent and quality of the services that may be provided by the Affiliated Sub-Advisers are appropriate and satisfactory.
| B. | Fund Investment Performance |
The Board considered Fund investment performance as a relevant factor in considering whether to approve the investment advisory agreement as well as the sub-advisory contracts for the Fund, as Invesco Canada Ltd. currently manages assets of the Fund.
The Board compared the Fund’s investment performance over multiple time periods ending December 31, 2016 to the performance of funds in the Broadridge performance universe and against the Lipper Mid-Cap Core Funds Index. The Board noted that performance of Class A shares of the Fund was in the first quintile of its performance universe for the one year period, fourth quintile for the three year period and fifth quintile for the five year period (the first quintile being the best performing funds and the fifth quintile being the worst performing funds). The Board noted that performance of Class A shares of the Fund was above the performance of the Index for the one year period and below the performance of the Index for the three and five year periods. The Trustees also reviewed more recent Fund performance and this review did not change their conclusions.
| C. | Advisory and Sub-Advisory Fees |
The Board compared the Fund’s contractual management fee rate to the contractual management fee rates of funds in the Fund’s Broadridge expense group at a common asset
22 Invesco Endeavor Fund
level. The Board noted that the contractual management fee rate for Class A shares of the Fund was below the median contractual management fee rate of funds in its expense group. The Board noted that the term “contractual management fee” for funds in the expense group may include both advisory and certain administrative services fees, but that Broadridge does not provide information on a fund by fund basis as to what is included. The Board noted that Invesco Advisers does not separately charge the Invesco Funds for the administrative services included in the term as defined by Broadridge. The Board also reviewed the methodology used by Broadridge in providing expense group information, which includes using each fund’s contractual management fee schedule (including any applicable breakpoints) as reported in the most recent prospectus or statement of additional information for each fund in the expense group.
The Board also compared the Fund’s effective advisory fee rate (the advisory fee rate after advisory fee waivers and before other expense limitations/waivers) to the effective advisory fee rates of other funds advised by Invesco Advisers and its affiliates with investment strategies comparable to those of the Fund, based on asset balances as of December 31, 2016. The Board noted that Invesco Advisers and the Affiliated Sub-Advisers do not manage other funds or client accounts with investment strategies comparable to those of the Fund.
The Board also considered the services that may be provided by the Affiliated Sub-Advisers pursuant to the sub-advisory contracts, as well as the fees payable by Invesco Advisers to the Affiliated Sub-Advisers pursuant to the sub-advisory contracts. The Board noted that Invesco Advisers retains overall responsibility for, and provides services to, sub-advised Invesco Funds, including oversight of the Affiliated Sub-Advisers as well as the additional services described herein other than day-to-day portfolio management. The Board also noted that the sub-advisory fees are not paid directly by the Fund, but rather, are payable by Invesco Advisers to the Affiliated Sub-Advisers.
| D. | Economies of Scale and Breakpoints |
The Board considered the extent to which there are economies of scale in the provision of advisory services to the Fund. The Board also considered that the Fund may benefit from economies of scale through contractual breakpoints in the Fund’s advisory fee schedule. The Board noted that the Fund shares directly in economies of scale through lower fees charged by third party service providers based on the combined size of the Invesco Funds advised by Invesco Advisers.
| E. | Profitability and Financial Resources |
The Board reviewed information from Invesco Advisers concerning the costs of the advisory and other services that Invesco Advisers and its affiliates provide to the Fund and the Invesco Funds and the profitability of Invesco Advisers and its affiliates in providing these services. The Board noted that Invesco Advisers continues to
operate at a net profit from services Invesco Advisers and its affiliates provide to the Invesco Funds and the Fund. The Board received and accepted information from Invesco Advisers demonstrating that Invesco Advisers and each Affiliated Sub-Adviser are financially sound and have the resources necessary to perform their obligations under the investment advisory agreement and sub-advisory contracts.
| F. | Collateral Benefits to Invesco Advisers and its Affiliates |
The Board considered various other benefits received by Invesco Advisers and its affiliates from the relationship with the Fund, including the fees received for providing transfer agency and distribution services to the Fund. The Board considered comparative information regarding fees charged for these services, including information provided by Broadridge and other independent sources. The Board considered the performance of Invesco Advisers and its affiliates in providing these services and the organizational structure employed to provide these services. The Board also considered that these services are provided to the Fund pursuant to written contracts that are reviewed and approved on an annual basis by the Board; and that the services are required for the operation of the Fund.
The Board considered the benefits realized by Invesco Advisers and the Affiliated Sub-Advisers as a result of portfolio brokerage transactions executed through “soft dollar” arrangements. The Board noted that soft dollar arrangements may result in the Fund bearing costs to purchase research that may be used by Invesco Advisers or the Affiliated Sub-Advisers with other clients and may reduce Invesco Advisers’ or the Affiliated Sub-Advisers’ expenses. The Board also considered that it receives periodic reports from the Chief Compliance Officer of the Invesco Funds demonstrating that these arrangements are consistent with regulatory requirements. The Board did not deem the soft dollar arrangements to be inappropriate.
The Board considered that the Fund’s uninvested cash and cash collateral from any securities lending arrangements may be invested in money market funds advised by Invesco Advisers pursuant to procedures approved by the Board. The Board noted that Invesco Advisers receives advisory fees from these affiliated money market funds attributable to such investments, although Invesco Advisers has contractually agreed to waive through varying periods the advisory fees payable by the Invesco Funds with respect to certain investments in the affiliated money market funds. The waiver is in an amount equal to 100% of the net advisory fee Invesco Advisers receives from the affiliated money market funds with respect to the Fund’s investment in the affiliated money market funds of uninvested cash, but not cash collateral. The Board concluded that the amount of advisory fees received by Invesco Advisers from the Fund’s investment of cash collateral from any securities lending arrangements in the affiliated
money market funds is fair and reasonable.
The Board also considered that the Fund may use an affiliated broker to execute certain trades for the Fund to, among other things, control information leakage, and was advised that such trades would be executed in compliance with rules under the federal securities laws and consistent with best execution obligations.
23 Invesco Endeavor Fund
Tax Information
Form 1099-DIV, Form 1042-S and other year-end tax information provide shareholders with actual calendar year amounts that should be included in their tax returns. Shareholders should consult their tax advisors.
The following distribution information is being provided as required by the Internal Revenue Code or to meet a specific state’s requirement.
The Fund designates the following amounts or, if subsequently determined to be different, the maximum amount allowable for its fiscal year ended October 31, 2017:
| | | | |
Federal and State Income Tax | |
Long-Term Capital Gain Distributions | | $ | 25,004,564 | |
Qualified Dividend Income* | | | 64.02 | % |
Corporate Dividends Received Deduction* | | | 55.35 | % |
U.S. Treasury Obligations* | | | 0 | % |
| | * | The above percentages are based on ordinary income dividends paid to shareholders during the Fund’s fiscal year. |
| | | | |
Non-Resident Alien Shareholders | |
Qualified Short-Term Gains | | $ | 2,901,936 | |
24 Invesco Endeavor Fund
Trustees and Officers
The address of each trustee and officer is AIM Investment Funds (Invesco Investment Funds) (the “Trust”), 11 Greenway Plaza, Suite 1000, Houston, Texas 77046-1173. The trustees serve for the life of the Trust, subject to their earlier death, incapacitation, resignation, retirement or removal as more specifically provided in the Trust’s organizational documents. Each officer serves for a one year term or until their successors are elected and qualified. Column two below includes length of time served with predecessor entities, if any.
| | | | | | | | |
Name, Year of Birth and Position(s) Held with the Trust | | Trustee and/
or Officer Since | | Principal Occupation(s)
During Past 5 Years | | Number of
Funds in Fund
Complex
Overseen by
Trustee | | Other Directorship(s)
Held by Trustee During Past 5 Years |
| Interested Persons | | | | | | | | |
| Martin L. Flanagan1 — 1960 Trustee | | 2007 | | Executive Director, Chief Executive Officer and President, Invesco Ltd. (ultimate parent of Invesco and a global investment management firm); Trustee, The Invesco Funds; Vice Chair, Investment Company Institute; and Member of Executive Board, SMU Cox School of Business Formerly: Advisor to the Board, Invesco Advisers, Inc. (formerly known as Invesco Institutional (N.A.), Inc.); Chairman and Chief Executive Officer, Invesco Advisers, Inc. (registered investment adviser); Director, Chairman, Chief Executive Officer and President, Invesco Holding Company (US), Inc. (formerly IVZ Inc.) (holding company), Invesco Group Services, Inc. (service provider) and Invesco North American Holdings, Inc. (holding company); Director, Chief Executive Officer and President, Invesco Holding Company Limited (parent of Invesco and a global investment management firm); Director, Invesco Ltd.; Chairman, Investment Company Institute and President, Co-Chief Executive Officer, Co-President, Chief Operating Officer and Chief Financial Officer, Franklin Resources, Inc. (global investment management organization) | | 158 | | None |
Philip A. Taylor2 — 1954 Trustee and Senior Vice President | | 2006 | | Head of the Americas and Senior Managing Director, Invesco Ltd.; Director, Invesco Advisers, Inc. (formerly known as Invesco Institutional (N.A.), Inc.) (registered investment adviser); Director, Chairman, Chief Executive Officer and President, Invesco Management Group, Inc. (formerly known as Invesco Aim Management Group, Inc.) (financial services holding company); Director and Chairman, Invesco Investment Services, Inc. (formerly known as Invesco Aim Investment Services, Inc.) (registered transfer agent); Chief Executive Officer, Invesco Corporate Class Inc. (corporate mutual fund company); Director, Chairman and Chief Executive Officer, Invesco Canada Ltd. (formerly known as Invesco Trimark Ltd./Invesco Trimark Ltèe) (registered investment adviser and registered transfer agent); Trustee and Senior Vice President, The Invesco Funds; Director, Invesco Investment Advisers LLC (formerly known as Van Kampen Asset Management). Formerly: Co-Chairman, Co-President and Co-Chief Executive Officer, Invesco Advisers, Inc. (formerly known as Invesco Institutional (N.A.), Inc.) (registered investment adviser); Director, Chief Executive Officer and President, Van Kampen Exchange Corp; President and Principal Executive Officer, The Invesco Funds (other than AIM Treasurer’s Series Trust (Invesco Treasurer’s Series Trust), Short-Term Investments Trust and Invesco Management Trust); Executive Vice President, The Invesco Funds (AIM Treasurer’s Series Trust (Invesco Treasurer’s Series Trust), Short-Term Investments Trust and Invesco Management Trust only); Director and President, INVESCO Funds Group, Inc. (registered investment adviser and registered transfer agent); Director and Chairman, IVZ Distributors, Inc. (formerly known as INVESCO Distributors, Inc.) (registered broker dealer); Director, President and Chairman, Invesco Inc. (holding company), Invesco Canada Holdings Inc. (holding company), Trimark Investments Ltd./Placements Trimark Ltèe and Invesco Financial Services Ltd/Services Financiers Invesco Ltèe; Chief Executive Officer, Invesco Canada Fund Inc. (corporate mutual fund company); Director and Chairman, Van Kampen Investor Services Inc.; Director, Chief Executive Officer and President, 1371 Preferred Inc. (holding company) and Van Kampen Investments Inc.; Director and President, AIM GP Canada Inc. (general partner for limited partnerships) and Van Kampen Advisors, Inc.; Director and Chief Executive Officer, Invesco Trimark Dealer Inc. (registered broker dealer); Director, Invesco Distributors, Inc. (formerly known as Invesco Aim Distributors, Inc.) (registered broker dealer); Manager, Invesco PowerShares Capital Management LLC; Director, Chief Executive Officer and President, Invesco Advisers, Inc.; Director, Chairman, Chief Executive Officer and President, Invesco Aim Capital Management, Inc.; President, Invesco Trimark Dealer Inc. and Invesco Trimark Ltd./Invesco Trimark Ltèe; Director and President, AIM Trimark Corporate Class Inc. and AIM Trimark Canada Fund Inc.; Senior Managing Director, Invesco Holding Company Limited; Director and Chairman, Fund Management Company (former registered broker dealer); President and Principal Executive Officer, The Invesco Funds (AIM Treasurer’s Series Trust (Invesco Treasurer’s Series Trust), and Short-Term Investments Trust only); President, AIM Trimark Global Fund Inc. and AIM Trimark Canada Fund Inc. | | 158 | | None |
| 1 | Mr. Flanagan is considered an interested person (within the meaning of Section 2(a)(19) of the 1940 Act) of the Trust because he is an officer of the Adviser to the Trust, and an officer and a director of Invesco Ltd., ultimate parent of the Adviser. |
| 2 | Mr. Taylor is considered an interested person (within the meaning of Section 2(a)(19) of the 1940 Act) of the Trust because he is an officer and a director of the Adviser. |
T-1 Invesco Endeavor Fund
Trustees and Officers—(continued)
| | | | | | | | |
Name, Year of Birth and Position(s) Held with the Trust | | Trustee and/
or Officer Since | | Principal Occupation(s) During Past 5 Years | | Number of
Funds in Fund
Complex
Overseen by
Trustee | | Other Directorship(s)
Held by Trustee During Past 5 Years |
| Independent Trustees | | | | | | | | |
Bruce L. Crockett — 1944 Trustee and Chair | | 2001 | | Chairman, Crockett Technologies Associates (technology consulting company) Formerly: Director, Captaris (unified messaging provider); Director, President and Chief Executive Officer, COMSAT Corporation; Chairman, Board of Governors of INTELSAT (international communications company); ACE Limited (insurance company); Independent Directors Council and Investment Company Institute: Member of the Audit Committee, Investment Company Institute; Member of the Executive Committee and Chair of the Governance Committee, Independent Directors Council | | 158 | | Director and Chairman of the Audit Committee, ALPS (Attorneys Liability Protection Society) (insurance company); Director and Member of the Audit Committee, Ferroglobe PLC (metallurgical company) |
David C. Arch — 1945 Trustee | | 2010 | | Chairman of Blistex Inc. (consumer health care products manufacturer); Member, World Presidents’ Organization | | 158 | | Board member of the Illinois Manufacturers’ Association |
James T. Bunch — 1942 Trustee | | 2003 | | Managing Member, Grumman Hill Group LLC (family office/private equity investments) Formerly: Chairman of the Board, Denver Film Society; Chairman of the Board of Trustees, Evans Scholarship Foundation; Chairman, Board of Governors, Western Golf Association | | 158 | | Trustee, Evans Scholarship Foundation |
Jack M. Fields — 1952 Trustee | | 2001 | | Chief Executive Officer, Twenty First Century Group, Inc. (government affairs company); and Discovery Learning Alliance (non-profit) Formerly: Owner and Chief Executive Officer, Dos Angeles Ranch L.P. (cattle, hunting, corporate entertainment); Director, Insperity, Inc. (formerly known as Administaff) (human resources provider); Chief Executive Officer, Texana Timber LP (sustainable forestry company); Director of Cross Timbers Quail Research Ranch (non-profit); and member of the U.S. House of Representatives | | 158 | | None |
Cynthia Hostetler — 1962 Trustee | | 2017 | | Non-Executive Director and Trustee of a number of public and private business corporations Formerly: Head of Investment Funds and Private Equity, Overseas Private Investment Corporation; President, First Manhattan Bancorporation, Inc.; Attorney, Simpson Thacher & Bartlett LLP | | 158 | | Vulcan Materials Company (construction materials company); Trilinc Global Impact Fund; Aberdeen Investment Funds (4 portfolios); Artio Global Investment LLC (mutual fund complex); Edgen Group, Inc. (specialized energy and infrastructure products distributor) |
Eli Jones — 1961 Trustee | | 2016 | | Professor and Dean, Mays Business School — Texas A&M University Formerly: Professor and Dean, Walton College of Business, University of Arkansas and E.J. Ourso College of Business, Louisiana State University; Director, Arvest Bank | | 158 | | Insperity, Inc. (formerly known as Administaff) (human resources provider) |
Prema Mathai-Davis — 1950 Trustee | | 2001 | | Retired. Formerly: Chief Executive Officer, YWCA of the U.S.A. | | 158 | | None |
Teresa M. Ressel — 1962 Trustee | | 2017 | | Non-executive director and trustee of a number of public and private business corporations Formerly: Chief Financial Officer, Olayan America, The Olayan Group (international investor/commercial/industrial); Chief Executive Officer, UBS Securities LLC; Group Chief Operating Officer, Americas, UBS AG; Assistant Secretary for Management & Budget and CFO, US Department of the Treasury; Chief Compliance Officer, Kaiser Permanente (healthcare consortium); Program Manager, Hewlett-Packard; Nuclear Engineering, General Dynamics Corporation (aerospace and defense company) | | 158 | | Atlantic Power Corporation (power generation company); ON Semiconductor Corp. (semiconductor supplier) |
Larry Soll — 1942 Trustee | | 2003 | | Retired. Formerly: Chairman, Chief Executive Officer and President, Synergen Corp. (a biotechnology company) | | 158 | | None |
Ann Barnett Stern — 1957 Trustee | | 2017 | | President and Chief Executive Officer, Houston Endowment Inc. (private philanthropic institution) Formerly: Executive Vice President and General Counsel, Texas Children’s Hospital; Attorney, Beck, Redden and Secrest, LLP; Business Law Instructor, University of St. Thomas; Attorney, Andrews & Kurth LLP | | 158 | | Federal Reserve Bank of Dallas |
Raymond Stickel, Jr. — 1944 Trustee | | 2005 | | Retired. Formerly: Director, Mainstay VP Series Funds, Inc. (25 portfolios); Partner, Deloitte & Touche | | 158 | | None |
Robert C. Troccoli — 1949 Trustee | | 2016 | | Adjunct Professor, University of Denver — Daniels College of Business Formerly: Senior Partner, KPMG LLP | | 158 | | None |
T-2 Invesco Endeavor Fund
Trustees and Officers—(continued)
| | | | | | | | |
Name, Year of Birth and Position(s) Held with the Trust | | Trustee and/
or Officer Since | | Principal Occupation(s) During Past 5 Years | | Number of
Funds in Fund
Complex
Overseen by
Trustee | | Other Directorship(s)
Held by Trustee During Past 5 Years |
| Independent Trustees—(continued) |
Christopher L. Wilson — 1957 Trustee | | 2017 | | Managing Partner, CT2, LLC (investing and consulting firm) Formerly: President/Chief Executive Officer, Columbia Funds, Bank of America Corporation; President/Chief Executive Officer, CDC IXIS Asset Management Services, Inc.; Principal & Director of Operations, Scudder Funds, Scudder, Stevens & Clark, Inc.; Assistant Vice President, Fidelity Investments | | 158 | | TD Asset Management USA Inc. (mutual fund complex) (22 portfolios); ISO New England, Inc. (non-profit organization managing regional electricity market) |
| Other Officers | | | | | | | | |
Sheri Morris — 1964 President, Principal Executive Officer and Treasurer | | 1999 | | President, Principal Executive Officer and Treasurer, The Invesco Funds; Vice President, Invesco Advisers, Inc. (formerly known as Invesco Institutional (N.A.), Inc.) (registered investment adviser); and Vice President, PowerShares Exchange-Traded Fund Trust, PowerShares Exchange-Traded Fund Trust II, PowerShares India Exchange-Traded Fund Trust, PowerShares Actively Managed Exchange-Traded Fund Trust and PowerShares Actively Managed Exchange-Traded Commodity Fund Trust Formerly: Vice President and Principal Financial Officer, The Invesco Funds; Vice President, Invesco Aim Advisers, Inc., Invesco Aim Capital Management, Inc. and Invesco Aim Private Asset Management, Inc.; Assistant Vice President and Assistant Treasurer, The Invesco Funds and Assistant Vice President, Invesco Advisers, Inc., Invesco Aim Capital Management, Inc. and Invesco Aim Private Asset Management, Inc.; and Treasurer, PowerShares Exchange-Traded Fund Trust, PowerShares Exchange-Traded Fund Trust II, PowerShares India Exchange-Traded Fund Trust and PowerShares Actively Managed Exchange-Traded Fund Trust | | N/A | | N/A |
Russell C. Burk — 1958 Senior Vice President and Senior Officer | | 2005 | | Senior Vice President and Senior Officer, The Invesco Funds | | N/A | | N/A |
John M. Zerr — 1962 Senior Vice President, Chief Legal Officer and Secretary | | 2006 | | Director, Senior Vice President, Secretary and General Counsel, Invesco Management Group, Inc. (formerly known as Invesco AIM Management Group, Inc.); Senior Vice President, Invesco Advisers, Inc. (formerly known as Invesco Institutional (N.A.), Inc.) (registered investment adviser); Senior Vice President and Secretary, Invesco Distributors, Inc. (formerly known as Invesco AIM Distributors, Inc.); Director, Vice President and Secretary, Invesco Investment Services, Inc. (formerly known as Invesco AIM Investment Services, Inc.) Senior Vice President, Chief Legal Officer and Secretary, The Invesco Funds; Managing Director, Invesco PowerShares Capital Management LLC; Director, Secretary and General Counsel, Invesco Investment Advisers LLC (formerly known as Van Kampen Asset Management); Secretary and General Counsel, Invesco Capital Markets, Inc. (formerly known as Van Kampen Funds Inc.) and Chief Legal Officer, PowerShares Exchange-Traded Fund Trust, PowerShares Exchange-Traded Fund Trust II, PowerShares India Exchange-Traded Fund Trust, PowerShares Actively Managed Exchange-Traded Fund Trust and PowerShares Actively Managed Exchange-Traded Commodity Fund Trust; Manager and Secretary, Invesco Indexing LLC Formerly: Director, Secretary, General Counsel and Senior Vice President, Van Kampen Exchange Corp.; Director, Vice President and Secretary, IVZ Distributors, Inc. (formerly known as INVESCO Distributors, Inc.); Director and Vice President, INVESCO Funds Group, Inc.; Director and Vice President, Van Kampen Advisors Inc.; Director, Vice President, Secretary and General Counsel, Van Kampen Investor Services Inc.; Director, Invesco Distributors, Inc. (formerly known as Invesco AIM Distributors, Inc.); Director, Senior Vice President, General Counsel and Secretary, Invesco AIM Advisers, Inc. and Van Kampen Investments Inc.; Director, Vice President and Secretary, Fund Management Company; Director, Senior Vice President, Secretary, General Counsel and Vice President, Invesco AIM Capital Management, Inc.; Chief Operating Officer and General Counsel, Liberty Ridge Capital, Inc. (an investment adviser); Vice President and Secretary, PBHG Funds (an investment company) and PBHG Insurance Series Fund (an investment company); Chief Operating Officer, General Counsel and Secretary, Old Mutual Investment Partners (a broker-dealer); General Counsel and Secretary, Old Mutual Fund Services (an administrator) and Old Mutual Shareholder Services (a shareholder servicing center); Executive Vice President, General Counsel and Secretary, Old Mutual Capital, Inc. (an investment adviser); and Vice President and Secretary, Old Mutual Advisors Funds (an investment company) | | N/A | | N/A |
Gregory G. McGreevey — 1962 Senior Vice President | | 2012 | | Senior Managing Director, Invesco Ltd.; Director, Chairman, President, and Chief Executive Officer, Invesco Advisers, Inc. (formerly known as Invesco Institutional (N.A.), Inc.) (registered investment adviser); Senior Vice President, Invesco Management Group, Inc.; Director, Invesco Mortgage Capital, Inc. and Invesco Senior Secured Management, Inc.; and Senior Vice President, The Invesco Funds Formerly: Assistant Vice President, The Invesco Funds | | N/A | | N/A |
T-3 Invesco Endeavor Fund
Trustees and Officers—(continued)
| | | | | | | | |
Name, Year of Birth and Position(s) Held with the Trust | | Trustee and/
or Officer Since | | Principal Occupation(s) During Past 5 Years | | Number of
Funds in Fund
Complex
Overseen by
Trustee | | Other Directorship(s)
Held by Trustee During Past 5 Years |
| Other Officers—(continued) | | | | | | | | |
Kelli Gallegos — 1970 Vice President, Principal Financial Officer and Assistant Treasurer | | 2008 | | Vice President, Principal Financial Officer and Assistant Treasurer, The Invesco Funds; Assistant Treasurer, Invesco PowerShares Capital Management LLC, PowerShares Exchange-Traded Fund Trust, PowerShares Exchange-Traded Fund Trust II, PowerShares India Exchange-Traded Fund Trust, PowerShares Actively Managed Exchange-Traded Fund Trust and PowerShares Actively Managed Exchange-Traded Commodity Fund Trust Formerly: Assistant Vice President, The Invesco Funds | | N/A | | N/A |
Tracy Sullivan — 1962 Vice President, Chief Tax Officer and Assistant Treasurer | | 2008 | | Vice President, Chief Tax Officer and Assistant Treasurer, The Invesco Funds; Assistant Treasurer, Invesco PowerShares Capital Management LLC, PowerShares Exchange-Traded Fund Trust, PowerShares Exchange-Traded Fund Trust II, PowerShares India Exchange-Traded Fund Trust, PowerShares Actively Managed Exchange-Traded Fund Trust and PowerShares Actively Managed Exchange-Traded Commodity Fund Trust Formerly: Assistant Vice President, The Invesco Funds | | N/A | | N/A |
Crissie M. Wisdom — 1969 Anti-Money Laundering Compliance Officer | | 2013 | | Anti-Money Laundering Compliance Officer, Invesco Advisers, Inc. (formerly known as Invesco Institutional (N.A.), Inc.) (registered investment adviser), Invesco Capital Markets, Inc. (formerly known as Van Kampen Funds Inc.), Invesco Distributors, Inc., Invesco Investment Services, Inc., Invesco Management Group, Inc., The Invesco Funds, and PowerShares Exchange-Traded Fund Trust, PowerShares Exchange-Traded Fund Trust II, PowerShares India Exchange-Traded Fund Trust, PowerShares Actively Managed Exchange-Traded Fund Trust and PowerShares Actively Managed Exchange-Traded Commodity Fund Trust; Anti-Money Laundering Compliance Officer and Bank Secrecy Act Officer, INVESCO National Trust Company and Invesco Trust Company; and Fraud Prevention Manager and Controls and Risk Analysis Manager for Invesco Investment Services, Inc. Formerly: Anti-Money Laundering Compliance Officer, Van Kampen Exchange Corp. | | N/A | | N/A |
Robert R. Leveille — 1969 Chief Compliance Officer | | 2016 | | Chief Compliance Officer, Invesco Advisers, Inc. (registered investment adviser); and Chief Compliance Officer, The Invesco Funds Formerly: Chief Compliance Officer, Putnam Investments and the Putnam Funds | | N/A | | N/A |
The Statement of Additional Information of the Trust includes additional information about the Fund’s Trustees and is available upon request, without charge, by calling 1.800.959.4246. Please refer to the Fund’s Statement of Additional Information for information on the Fund’s sub-advisers.
| | | | | | |
Office of the Fund 11 Greenway Plaza, Suite 1000 Houston, TX 77046-1173 | | Investment Adviser Invesco Advisers, Inc. 1555 Peachtree Street, N.E. Atlanta, GA 30309 | | Distributor Invesco Distributors, Inc. 11 Greenway Plaza, Suite 1000 Houston, TX 77046-1173 | | Auditors PricewaterhouseCoopers LLP 1000 Louisiana Street, Suite 5800 Houston, TX 77002-5678 |
| | | |
| | | | | | |
Counsel to the Fund Stradley Ronon Stevens & Young, LLP 2005 Market Street, Suite 2600 Philadelphia, PA 19103-7018 | | Counsel to the Independent Trustees Goodwin Procter LLP 901 New York Avenue, N.W. Washington, D.C. 20001 | | Transfer Agent Invesco Investment Services, Inc. 11 Greenway Plaza, Suite 1000 Houston, TX 77046-1173 | | Custodian State Street Bank and Trust Company 225 Franklin Street Boston, MA 02110-2801 |
T-4 Invesco Endeavor Fund
Explore High-Conviction Investing with Invesco

Go paperless with eDelivery
Visit invesco.com/edelivery to enjoy the convenience and security of anytime electronic access to your investment documents.
With eDelivery, you can elect to have any or all of the following materials delivered straight to your inbox to download, save and print from your own computer:
| ∎ | | Fund reports and prospectuses |
Invesco mailing information
Send general correspondence to Invesco Investment Services, Inc., P.O. Box 219078, Kansas City, MO 64121-9078.
Important notice regarding delivery of security holder documents
To reduce Fund expenses, only one copy of most shareholder documents may be mailed to shareholders with multiple accounts at the same address (Householding). Mailing of your shareholder documents may be householded indefinitely unless you instruct us otherwise. If you do not want the mailing of these documents to be combined with those for other members of your household, please contact Invesco Investment Services, Inc. at 800 959 4246 or contact your financial institution. We will begin sending you individual copies for each account within 30 days after receiving your request.
Fund holdings and proxy voting information
The Fund provides a complete list of its holdings four times in each fiscal year, at the quarter ends. For the second and fourth quarters, the lists appear in the Fund’s semiannual and annual reports to shareholders. For the first and third quarters, the Fund files the lists with the Securities and Exchange Commission (SEC) on Form N-Q. The most recent list of portfolio holdings is available at invesco.com/completeqtrholdings. Shareholders can also look up the Fund’s Forms N-Q on the SEC website at sec.gov. Copies of the Fund’s Forms N-Q may be reviewed and copied at the SEC Public Reference Room in Washington, D.C. You can obtain information on the operation of the Public Reference Room, including information about duplicating fee charges, by calling 202 551 8090 or 800 732 0330, or by electronic request at the following email address: publicinfo@sec.gov. The SEC file numbers for the Fund are shown below.
A description of the policies and procedures that the Fund uses to determine how to vote proxies relating to portfolio securities is available without charge, upon request, from our Client Services department at 800 959 4246 or at invesco.com/proxyguidelines. The information is also available on the SEC website, sec.gov.
| | |
Information regarding how the Fund voted proxies related to its portfolio securities during the most recent 12-month period ended June 30 is available at invesco.com/proxysearch. The information is also available on the SEC website, sec.gov. Invesco Advisers, Inc. is an investment adviser; it provides investment advisory services to individual and institutional clients and does not sell securities. Invesco Distributors, Inc. is the US distributor for Invesco Ltd.’s retail mutual funds, exchange-traded funds and institutional money market funds. Both are wholly owned, indirect subsidiaries of Invesco Ltd. | |  |
| | | | | | | | |
| SEC file numbers: 811-05426 and 033-19338 | | Invesco Distributors, Inc. | | END-AR-1 | | 12112017 | | 1201 |

Letters to Shareholders
| | | | |

Philip Taylor | | | | Dear Shareholders: This annual report includes information about your Fund, including performance data and a complete list of its investments as of the close of the reporting period. Inside is a discussion of how your Fund was managed and the factors that affected its performance during the reporting period. American voters went to the polls just days after the start of the reporting period, and their decisions quickly affected markets. The US stock market rallied strongly after the election, with major market indexes rising, and setting record highs, throughout the reporting period. Generally positive economic data, strong corporate earnings and hope for tax and regulatory reform contributed to the rally. US and global bond markets, as well as emerging market equities, sold off immediately following the election – with the US bond market eventually recovering most of its losses. Overseas, economic data were mixed, prompting the European |
Central Bank and central banks in China and Japan, among other countries, to maintain extraordinarily accommodative monetary policies. Citing positive economic trends – specifically, realized and expected labor market conditions and inflation – the US Federal Reserve raised interest rates three times during the reporting period: first in December 2016, and then again in March and June 2017. Health care and tax reform proved to be more difficult than expected to enact, with little progress achieved by the end of the reporting period.
Short-term market volatility can prompt some investors to abandon their investment plans – and can cause others to settle for whatever returns the market has to offer. The investment professionals at Invesco, in contrast, invest with high conviction. This means that, no matter the asset class or the strategy, each investment team has a passion to exceed. We want to help investors achieve better outcomes, such as seeking higher returns, helping mitigate risk and generating income. Of course, investing with high conviction can’t guarantee a profit or ensure success; no investment strategy can. To learn more about how we invest with high conviction, visit invesco.com/HighConviction.
You, too, can invest with high conviction by maintaining a long-term investment perspective and by working with your financial adviser on a regular basis. During periods of short-term market volatility or uncertainty, your financial adviser can keep you focused on your long-term investment goals – a new home, a child’s college education or a secure retirement. He or she also can share research about the economy, the markets and individual investment options.
Visit our website for more information on your investments
Our website, invesco.com/us, offers a wide range of market insights and investment perspectives. On the website, you’ll find detailed information about our funds, including performance, holdings and portfolio manager commentaries. You can access information about your account by completing a simple, secure online registration. To do so, select “Log In” on the right side of the homepage, and then select “Register for Individual Account Access.”
In addition to the resources accessible on our website and through our mobile app, you can obtain timely updates to help you stay informed about the markets and the economy by connecting with Invesco on Twitter, LinkedIn or Facebook. You can access our blog at blog.invesco.us.com. Our goal is to provide you the information you want, when and where you want it.
Finally, I’m pleased to share with you Invesco’s commitment to both the Principles for Responsible Investment and to considering environmental, social and governance issues in our robust investment process. I invite you to learn more at invesco.com/esg.
Have questions?
For questions about your account, contact an Invesco client services representative at 800 959 4246. For Invesco-related questions or comments, please email me directly at phil@invesco.com.
All of us at Invesco look forward to serving your investment management needs. Thank you for investing with us.
Sincerely,

Philip Taylor
Senior Managing Director, Invesco Ltd.
|
| 2 Invesco Global Health Care Fund |
| | | | |

Bruce Crockett | | | | Dear Fellow Shareholders: Among the many important lessons I’ve learned in more than 40 years in a variety of business endeavors is the value of a trusted advocate. As independent chair of the Invesco Funds Board, I can assure you that the members of the Board are strong advocates for the interests of investors in Invesco’s mutual funds. We work hard to represent your interests through oversight of the quality of the investment management services your funds receive and other matters important to your investment, including but not limited to: ∎ Ensuring that Invesco offers a diverse lineup of mutual funds that your financial adviser can use to strive to meet your financial needs as your investment goals change over time. ∎ Monitoring how the portfolio management teams of the Invesco funds are performing in light of changing economic and market conditions. |
| ∎ | | Assessing each portfolio management team’s investment performance within the context of the investment strategy described in the fund’s prospectus. |
| ∎ | | Monitoring for potential conflicts of interests that may impact the nature of the services that your funds receive. |
We believe one of the most important services we provide our fund shareholders is the annual review of the funds’ advisory and sub-advisory contracts with Invesco Advisers and its affiliates. This review is required by the Investment Company Act of 1940 and focuses on the nature and quality of the services Invesco provides as the adviser to the Invesco funds and the reasonableness of the fees that it charges for those services. Each year, we spend months carefully reviewing information received from Invesco and a variety of independent sources, such as performance and fee data prepared by Lipper, Inc. (a subsidiary of Broadridge Financial Solutions, Inc.), an independent, third-party firm widely recognized as a leader in its field. We also meet with our independent legal counsel and other independent advisers to review and help us assess the information that we have received. Our goal is to assure that you receive quality investment management services for a reasonable fee.
I trust the measures outlined above provide assurance that you have a worthy advocate when it comes to choosing the Invesco Funds.
As always, please contact me at bruce@brucecrockett.com with any questions or concerns you may have. On behalf of the Board, we look forward to continuing to represent your interests and serving your needs.
Sincerely,

Bruce L. Crockett
Independent Chair
Invesco Funds Board of Trustees
|
| 3 Invesco Global Health Care Fund |
Management’s Discussion of Fund Performance
Performance summary
For the fiscal year ended October 31, 2017, Class A shares of Invesco Global Health Care Fund (the Fund), underperformed the MSCI World Health Care Index, the Fund’s style-specific benchmark.
Your Fund’s long-term performance appears later in this report.
Fund vs. Indexes
Total returns, 10/31/16 to 10/31/17, at net asset value (NAV). Performance shown does not include applicable contingent deferred sales charges (CDSC) or front-end sales charges, which would have reduced performance.
| | | | | |
| Class A Shares | | | | 17.73 | % |
| Class B Shares | | | | 16.87 | |
| Class C Shares | | | | 16.84 | |
| Class Y Shares | | | | 18.01 | |
| Investor Class Shares | | | | 17.72 | |
| Class R6 Shares* | | | | 17.94 | |
| MSCI World Index▼ (Broad Market Index) | | | | 22.77 | |
| MSCI World Health Care Index▼ (Style-Specific Index) | | | | 19.18 | |
| Lipper Global Health/Biotechnology Funds Index∎ (Peer Group Index) | | | | 17.49 | |
Source(s): ▼FactSet Research Systems Inc.; ∎Lipper Inc. *Class R6 shares incepted on April 4, 2017. See page 7 for more information. | | | | | |
Market conditions and your Fund
The reporting period began with major US stock market indexes posting gains and most hitting record highs following the US presidential election. Investors believed that the new administration’s plans to reduce tax rates, scale back regulations and increase infrastructure spending had the potential to stimulate economic growth. However, that was called into question in the first quarter of 2017, when it appeared that enacting significant regulatory and tax reform might be more difficult than previously anticipated.
Outside the US, Brexit (the UK’s plan to leave the European Union) remained a source of political and economic uncertainty, while improved economic data and confidence surveys raised the prospect of less accommodative monetary policy in continental Europe. In Asia, increased exports helped Japan’s economy, while China’s economy continued to stabilize.
Most emerging markets performed well during the reporting period. In addition to an improving global economic outlook, other positive tailwinds for international markets included continued weakness in the US dollar and reduced expectations for a major shift in US trade policy.
Interestingly, while 2017 marked the eighth year of the global bull market, we saw a shift in leadership as international stocks outperformed US stocks in the first three quarters of 2017. International stocks had trailed US stocks for four consecutive years and in six of the last seven years. As the reporting period came to a close, both developed and emerging equity markets appeared somewhat fully valued despite material discounts to the US market. In addition, recent earnings growth and earnings revision trends improved for many non-US developed markets.
In this environment, the MSCI World Index, the Fund’s broad market index,
gained 22.77% and health care stocks, as represented by the MSCI World Health Care Index, the Fund’s style-specific index, returned 19.18% for the reporting period.
Underweight exposure to and stock selection in the pharmaceuticals industry was the largest contributor to the Fund’s relative return as the industry lagged the MSCI World Health Care Index, the style-specific benchmark for the reporting period. However, the industry included a number of the Fund’s largest individual detractors, including Endo International, and Teva Pharmaceuticals. Pricing pressures and increased competition within the generic drug market negatively affected shares of both companies during the reporting period.
The Fund’s overweight exposure to the managed health care industry also contributed to relative returns. Two of the Fund’s largest individual contributors for the reporting period were managed health care companies Aetna and UnitedHealth Group. Aetna’s shares rose sharply late in the reporting period following an announcement that CVS Health (not a Fund holding) was in talks to buy the insurer for more than $66 billion. No deal had been reached by the end of the reporting period.
The Fund’s underweight exposure to the health care services and health care distributors industries, and its overweight exposure to the life science tools and services industry, aided performance. The Fund’s outperformance in the life science tools and services industry was primarily due to Thermo Fisher Scientific, a company that markets scientific instruments and lab equipment. During the reporting period, the company reported strong earnings and gave a favorable outlook for underlying business trends.
Security selection in the biotechnology industry was the primary driver of the Fund’s underperformance during the
| | | | |
| |
| Portfolio Composition | |
| By sector | | | % of total net assets | |
| | | | |
| |
| Health Care | | | 96.4 | % |
| Consumer Staples | | | 0.6 | |
Money Market Funds Plus Other Assets Less Liabilities | | | 3.0 | |
| | | | |
| |
| Top 10 Equity Holdings* | |
| | | % of total net assets | |
| | | | |
| |
| 1. Celgene Corp. | | | 4.7 | % |
| 2. Thermo Fisher Scientific, Inc. | | | 4.3 | |
| 3. Novartis AG-ADR | | | 4.0 | |
| 4. Aetna Inc. | | | 3.8 | |
| 5. Bristol-Myers Squibb Co. | | | 3.4 | |
| 6. UnitedHealth Group Inc. | | | 3.1 | |
| 7. Alexion Pharmaceuticals, Inc. | | | 3.1 | |
| 8. Eli Lilly and Co. | | | 3.0 | |
| 9. Biogen Inc. | | | 2.9 | |
| 10. BioMarin Pharmaceutical Inc. | | | 2.7 | |
| | | | |
| | |
Total Net Assets | | $ | 1.4 billion | |
| |
Total Number of Holdings* | | | 66 | |
The Fund’s holdings are subject to change, and there is no assurance that the Fund will continue to hold any particular security.
*Excluding money market fund holdings.
Data presented here are as of October 31, 2017.
|
| 4 Invesco Global Health Care Fund |
reporting period; however, the industry also held a number of the Fund’s largest individual contributors and detractors. The Fund’s top contributor for the reporting period was Vertex Pharmaceuticals, a company focused on developing and commercializing therapies for the treatment of cystic fibrosis. Shares of the company increased sharply in March due to positive results from a late-stage clinical trial for the company’s combination drug therapy for cystic fibrosis.
Shire, a UK-based biotechnology firm, was a significant detractor from Fund performance for the reporting period. Shares of Shire suffered due to investor concerns about increased competition within the company’s hematology franchise.
The Fund’s underweight exposure to the health care equipment industry and its overweight exposure to the health care facilities industry also detracted from relative returns. The Fund’s cash position, while less than 3% on average, also detracted in a strong equity market environment.
During the reporting period, we trimmed our exposure to a number of pharmaceutical holdings, and increased our exposure to managed care, health care equipment and health care supplies. The Fund’s largest industry exposure and relative overweight exposure was in biotechnology where – in our opinion – valuations are attractive, growth is robust and pipelines are strong. Many of the Fund’s biotechnology holdings have the potential - in our opinion - to be acquired, but the market seems to underappreciate this possibility. We believe that US tax reform legislation, depending on the final provisions, could set the stage for additional mergers or acquisitions within the biotechnology industry.
Similarly, we believe any clarification of the Trump administration’s policies about drug pricing would lift a major sector overhang and enable biotechnology stocks to trade more on their intrinsic value. We believe this development may also trigger a rotation out of health care devices and areas of health care services where the Fund is underweight.
As always, thank you for your continued investment in Invesco Global Health Care Fund.
The views and opinions expressed in management’s discussion of Fund performance are those of Invesco Advisers, Inc. These views and opinions are subject to change at any time based on factors such as market and economic conditions. These views and opinions may not be relied upon as investment advice or recommendations, or as an offer for a particular security. The information is not a complete analysis of every aspect of any market, country, industry, security or the Fund. Statements of fact are from sources considered reliable, but Invesco Advisers, Inc. makes no representation or warranty as to their completeness or accuracy. Although historical performance is no guarantee of future results, these insights may help you understand our investment management philosophy.
See important Fund and, if applicable, index disclosures later in this report.
| | |
 | | Derek Taner Chartered Financial Analyst, Portfolio Manager, is manager of Invesco Global Health Care Fund. He joined |
| Invesco in 2005. Mr. Taner earned a BS in business administration with an emphasis in accounting and finance and an MBA from the University of California, Berkeley Haas School of Business. |
| | |
 | | Henry Wu Portfolio Manager, is manager of Invesco Global Health Care Fund. He joined Invesco in 2014. Mr. Wu earned |
| a BS degree, with honors, in biological sciences and an MS degree in engineering-economic systems and operations research from Stanford University. He also earned an MBA from Harvard University. |
|
| 5 Invesco Global Health Care Fund |
Your Fund’s Long-Term Performance
Results of a $10,000 Investment – Oldest Share Class(es)
Fund and index data from 10/31/07
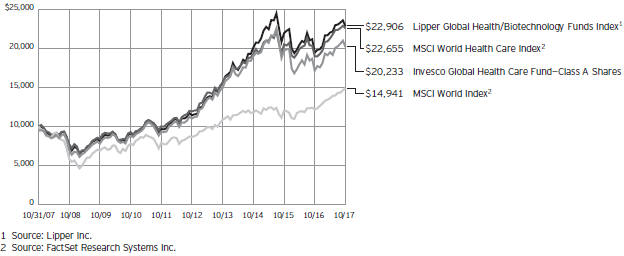
Past performance cannot guarantee comparable future results.
The data shown in the chart include reinvested distributions, applicable sales charges and Fund expenses including management fees. Index results include reinvested dividends but they do not reflect sales charges. Performance of the
peer group, if applicable, reflects fund expenses and management fees; performance of a market index does not. Performance shown in the chart and table(s) does not reflect deduction of taxes a shareholder would pay on Fund distributions or sale of Fund shares.
|
| 6 Invesco Global Health Care Fund |
| | | | |
Average Annual Total Returns | |
As of 10/31/17, including maximum applicable sales charges | |
| |
| Class A Shares | | | | |
| Inception (8/7/89) | | | 10.47 | % |
| 10 Years | | | 7.30 | |
| 5 Years | | | 11.63 | |
| 1 Year | | | 11.24 | |
| |
| Class B Shares | | | | |
| Inception (4/1/93) | | | 10.63 | % |
| 10 Years | | | 7.26 | |
| 5 Years | | | 11.81 | |
| 1 Year | | | 11.87 | |
| |
| Class C Shares | | | | |
| Inception (3/1/99) | | | 7.93 | % |
| 10 Years | | | 7.10 | |
| 5 Years | | | 12.06 | |
| 1 Year | | | 15.84 | |
| |
| Class Y Shares | | | | |
| 10 Years | | | 8.15 | % |
| 5 Years | | | 13.18 | |
| 1 Year | | | 18.01 | |
| |
| Investor Class Shares | | | | |
| Inception (7/15/05) | | | 8.34 | % |
| 10 Years | | | 7.91 | |
| 5 Years | | | 12.90 | |
| 1 Year | | | 17.72 | |
| |
| Class R6 Shares | | | | |
| 10 Years | | | 7.93 | % |
| 5 Years | | | 12.95 | |
| 1 Year | | | 17.94 | |
Class Y shares incepted on October 3, 2008. Performance shown prior to that date is that of Class A shares and includes the 12b-1 fees applicable to Class A shares.
Class R6 shares incepted on April 4, 2017. Performance shown prior to that date is that of Class A shares and includes the 12b-1 fees applicable to Class A shares.
The performance data quoted represent past performance and cannot guarantee comparable future results; current performance may be lower or higher. Please visit invesco.com/performance for the most recent month-end performance. Performance figures reflect reinvested distributions, changes in net asset value and the effect of the maximum sales charge unless otherwise stated. Investment return and principal value will fluctuate so that you may have a gain or loss when you sell shares.
| | | | |
Average Annual Total Returns | |
| As of 9/30/17, the most recent calendar quarter end, including maximum applicable sales charges | |
| |
| Class A Shares | | | | |
| Inception (8/7/89) | | | 10.66 | % |
| 10 Years | | | 8.04 | |
| 5 Years | | | 12.08 | |
| 1 Year | | | 6.26 | |
| |
| Class B Shares | | | | |
| Inception (4/1/93) | | | 10.84 | % |
| 10 Years | | | 8.00 | |
| 5 Years | | | 12.26 | |
| 1 Year | | | 6.62 | |
| |
| Class C Shares | | | | |
| Inception (3/1/99) | | | 8.20 | % |
| 10 Years | | | 7.84 | |
| 5 Years | | | 12.51 | |
| 1 Year | | | 10.64 | |
| |
| Class Y Shares | | | | |
| 10 Years | | | 8.90 | % |
| 5 Years | | | 13.63 | |
| 1 Year | | | 12.74 | |
| |
| Investor Class Shares | | | | |
| Inception (7/15/05) | | | 8.75 | % |
| 10 Years | | | 8.65 | |
| 5 Years | | | 13.36 | |
| 1 Year | | | 12.45 | |
| |
| Class R6 Shares | | | | |
| 10 Years | | | 8.67 | % |
| 5 Years | | | 13.39 | |
| 1 Year | | | 12.64 | |
The total annual Fund operating expense ratio set forth in the most recent Fund prospectus as of the date of this report for Class A, Class B, Class C, Class Y, Investor Class and Class R6 shares was 1.09%, 1.84%, 1.84%, 0.84%, 1.09% and 0.72%, respectively. The expense ratios presented above may vary from the expense ratios presented in other sections of this report that are based on expenses incurred during the period covered by this report.
Class A share performance reflects the maximum 5.50% sales charge, and Class B and Class C share performance reflects the applicable contingent deferred sales charge (CDSC) for the period involved. The CDSC on Class B shares declines from 5% beginning at the time of purchase to 0% at the beginning of the seventh year. The CDSC on Class C shares is 1% for the first year after purchase. Class Y shares, Investor Class shares and Class R6
shares do not have a front-end sales charge or a CDSC; therefore, performance is at net asset value.
The performance of the Fund’s share classes will differ primarily due to different sales charge structures and class expenses.
Fund performance reflects any applicable fee waivers and/or expense reimbursements. Had the adviser not waived fees and/or reimbursed expenses currently or in the past, returns would have been lower. See current prospectus for more information.
|
| 7 Invesco Global Health Care Fund |
Invesco Global Health Care Fund’s investment objective is long-term growth of capital.
| ∎ | | Unless otherwise stated, information presented in this report is as of October 31, 2017, and is based on total net assets. |
| ∎ | | Unless otherwise noted, all data provided by Invesco. |
| ∎ | | To access your Fund’s reports/prospectus, visit invesco.com/fundreports. |
About share classes
| ∎ | | Class B shares may not be purchased for new or additional investments. Please see the prospectus for more information. |
| ∎ | | Class Y shares and Investor Class shares are available only to certain investors. Please see the prospectus for more information. |
| ∎ | | Class R6 shares are available for use by retirement plans that meet certain standards and for institutional investors. Class R6 shares are also available through intermediaries that have established an agreement with Invesco Distributors, Inc. to make such shares available for use in retail omnibus accounts. Please see the prospectus for more information. |
Principal risks of investing in the Fund
| ∎ | | Convertible securities risk. The market values of convertible securities are affected by market interest rates, the risk of actual issuer default on interest or principal payments and the value of the underlying common stock into which the convertible security may be converted. Additionally, a convertible security is subject to the same types of market and issuer risks as apply to the underlying common stock. In addition, certain convertible securities are subject to involuntary conversions and may undergo principal write-downs upon the occurrence of certain triggering events, and, as a result, are subject to an increased risk of loss. Convertible securities may be rated below investment grade. |
| ∎ | | Depositary receipts risk. Investing in depositary receipts involves the same risks as direct investments in foreign securities. In addition, the underlying issuers of certain depositary receipts are under no obligation to distribute shareholder communications or pass through any voting rights with respect to the deposited securities to the holders of such receipts. The Fund may therefore receive less timely |
| | | information or have less control than if it invested directly in the foreign issuer. |
| ∎ | | Derivatives risk. The value of a derivative instrument depends largely on (and is derived from) the value of an underlying security, currency, commodity, interest rate, index or other asset (each referred to as an underlying asset). In addition to risks relating to the underlying assets, the use of derivatives may include other, possibly greater, risks, including counterparty, leverage and liquidity risks. Counterparty risk is the risk that the counterparty to the derivative contract will default on its obligation to pay the Fund the amount owed or otherwise perform under the derivative contract. Derivatives create leverage risk because they do not require payment up front equal to the economic exposure created by owning the derivative. As a result, an adverse change in the value of the underlying asset could result in the Fund sustaining a loss that is substantially greater than the amount invested in the derivative, which may make the Fund’s returns more volatile and increase the risk of loss. Derivative instruments may also be less liquid than more traditional investments and the Fund may be unable to sell or close out its derivative positions at a desirable time or price. This risk may be more acute under adverse market conditions, during which the Fund may be most in need of liquidating its derivative positions. Derivatives may also be harder to value, less tax efficient and subject to changing government regulation that could impact the Fund’s ability to use certain derivatives or their cost. Also, derivatives used for hedging or to gain or limit exposure to a particular market segment may not provide the expected benefits, particularly during adverse market conditions. |
| ∎ | | Emerging markets securities risk. Emerging markets (also referred to as developing markets) are generally subject to greater market volatility, |
| | | political, social and economic instability, uncertain trading markets and more governmental limitations on foreign investment than more developed markets. In addition, companies operating in emerging markets may be subject to lower trading volume and greater price fluctuations than companies in more developed markets. Securities law and the enforcement of systems of taxation in many emerging market countries may change quickly and unpredictably. In addition, investments in emerging markets securities may also be subject to additional transaction costs, delays in settlement procedures, and lack of timely information. |
| ∎ | | Foreign securities risk. The Fund’s foreign investments may be adversely affected by political and social instability, changes in economic or taxation policies, difficulty in enforcing obligations, decreased liquidity or increased volatility. Foreign investments also involve the risk of the possible seizure, nationalization or expropriation of the issuer or foreign deposits (in which the Fund could lose its entire investments in a certain market) and the possible adoption of foreign governmental restrictions such as exchange controls. Unless the Fund has hedged its foreign securities risk, foreign securities risk also involves the risk of negative foreign currency rate fluctuations, which may cause the value of securities denominated in such foreign currency (or other instruments through which the Fund has exposure to foreign currencies) to decline in value. Currency exchange rates may fluctuate significantly over short periods of time. Currency hedging strategies, if used, are not always successful. |
| ∎ | | Geographic focus risk. The Fund may from time to time invest a substantial amount of its assets in securities of issuers located in a single country or a limited number of countries. Adverse economic, political or social conditions in those countries may therefore have a significant negative impact on the Fund’s investment performance. |
��
|
This report must be accompanied or preceded by a currently effective Fund prospectus, which contains more complete information, including sales charges and expenses. Investors should read it carefully before investing. |
|
|
| NOT FDIC INSURED | MAY LOSE VALUE | NO BANK GUARANTEE |
|
| 8 Invesco Global Health Care Fund |
| ∎ | | Health care sector risk. The Fund will concentrate its investments in the securities of domestic and foreign issuers in the health care sector. The health care sector is subject to significant government regulations, increases or decreases in the cost of medical products and services, and competitive forces that could negatively impact a health care company’s profitability. The health care sector may also be affected by government health care programs. |
| ∎ | | Management risk. The Fund is actively managed and depends heavily on the Adviser’s judgment about markets, interest rates or the attractiveness, relative values, liquidity, or potential appreciation of particular investments made for the Fund’s portfolio. The Fund could experience losses if these judgments prove to be incorrect. Additionally, legislative, regulatory, or tax developments may adversely affect management of the Fund and, therefore, the ability of the Fund to achieve its investment objective. |
| ∎ | | Market risk. The market values of the Fund’s investments, and therefore the value of the Fund’s shares, will go up and down, sometimes rapidly or unpredictably. Market risk may affect a single issuer, industry or section of the economy, or it may affect the market as a whole. Individual stock prices tend to go up and down more dramatically than those of certain other types of investments, such as bonds. During a general downturn in the financial markets, multiple asset classes may decline in value. When markets perform well, there can be no assurance that specific investments held by the Fund will rise in value. |
| ∎ | | Preferred securities risk. Preferred securities are subject to issuer-specific and market risks applicable generally to equity securities. Preferred securities also may be subordinated to bonds or other debt instruments, subjecting them to a greater risk of non-payment, may be less liquid than many other securities, such as common stocks, and generally offer no voting rights with respect to the issuer. |
| ∎ | | Small- and mid-capitalization companies risks. Small- and mid-capitalization companies tend to be more vulnerable to changing market conditions, may have little or no operating history or track record of success, and may have more limited product lines and markets, less experienced management and fewer financial resources than larger companies. These companies’ securities may be more volatile and less liquid than those of more established companies, and their returns may vary, sometimes significantly, from the overall securities market. |
About indexes used in this report
| ∎ | | The MSCI World IndexSM is an unmanaged index considered representative of stocks of developed countries. The index is computed using the net return, which withholds applicable taxes for non-resident investors. |
| ∎ | | The MSCI World Health Care Index is an unmanaged index considered representative of health care stocks of developed countries. The index is computed using the net return, which withholds applicable taxes for non-resident investors. |
| ∎ | | The Lipper Global Health/Biotechnology Funds Index is an unmanaged index considered representative of global health/biotechnology funds tracked by Lipper. |
| ∎ | | The Fund is not managed to track the performance of any particular index, including the index(es) described here, and consequently, the performance of the Fund may deviate significantly from the performance of the index(es). |
| ∎ | | A direct investment cannot be made in an index. Unless otherwise indicated, index results include reinvested dividends, and they do not reflect sales charges. Performance of the peer group, if applicable, reflects fund expenses; performance of a market index does not. |
Other information
| ∎ | | The returns shown in management’s discussion of Fund performance are based on net asset values (NAVs) calculated for shareholder transactions. Generally accepted accounting principles require adjustments to be made to the net assets of the Fund at period end for financial reporting purposes, and as such, the NAVs for shareholder transactions and the returns based on those NAVs may differ from the NAVs and returns reported in the Financial Highlights. |
| ∎ | | Industry classifications used in this report are generally according to the Global Industry Classification Standard, which was developed by and is the exclusive property and a service mark of MSCI Inc. and Standard & Poor’s. |
|
| 9 Invesco Global Health Care Fund |
Schedule of Investments(a)
October 31, 2017
| | | | | | | | |
| | | Shares | | | Value | |
Common Stocks & Other Equity Interests–97.01% | |
| Biotechnology–34.56% | |
ACADIA Pharmaceuticals Inc.(b) | | | 181,196 | | | $ | 6,311,057 | |
Alexion Pharmaceuticals, Inc.(b) | | | 368,186 | | | | 44,057,137 | |
Array BioPharma Inc.(b) | | | 1,273,524 | | | | 13,308,326 | |
BioCryst Pharmaceuticals, Inc.(b) | | | 639,339 | | | | 2,877,025 | |
Biogen Inc.(b) | | | 131,962 | | | | 41,127,277 | |
BioMarin Pharmaceutical Inc.(b) | | | 466,514 | | | | 38,296,134 | |
bluebird bio, Inc.(b) | | | 89,453 | | | | 12,442,912 | |
Celgene Corp.(b) | | | 659,778 | | | | 66,617,785 | |
Clovis Oncology Inc.(b) | | | 234,518 | | | | 17,675,622 | |
DBV Technologies S.A.–ADR (France)(b) | | | 353,836 | | | | 8,286,839 | |
Exact Sciences Corp.(b) | | | 464,547 | | | | 25,545,439 | |
Gilead Sciences, Inc. | | | 454,043 | | | | 34,035,063 | |
Heron Therapeutics, Inc.(b) | | | 387,434 | | | | 5,947,112 | |
Incyte Corp.(b) | | | 197,263 | | | | 22,340,035 | |
Loxo Oncology, Inc.(b) | | | 80,588 | | | | 6,943,462 | |
Neurocrine Biosciences, Inc.(b) | | | 177,885 | | | | 11,048,437 | |
Prothena Corp. PLC (Ireland)(b) | | | 168,684 | | | | 9,792,106 | |
REGENXBIO Inc.(b) | | | 199,588 | | | | 5,977,661 | |
Sarepta Therapeutics, Inc.(b) | | | 219,373 | | | | 10,817,283 | |
Seattle Genetics, Inc.(b) | | | 213,206 | | | | 13,071,660 | |
Shire PLC–ADR | | | 242,526 | | | | 35,804,113 | |
Spark Therapeutics, Inc.(b) | | | 82,758 | | | | 6,695,122 | |
TESARO, Inc.(b) | | | 113,910 | | | | 13,187,361 | |
Ultragenyx Pharmaceutical Inc.(b) | | | 171,354 | | | | 7,897,706 | |
Vertex Pharmaceuticals Inc.(b) | | | 193,468 | | | | 28,290,826 | |
| | | | | | | | 488,393,500 | |
|
| Drug Retail–0.56% | |
Raia Drogasil S.A. (Brazil) | | | 331,578 | | | | 7,979,036 | |
|
| Health Care Equipment–9.44% | |
Boston Scientific Corp.(b) | | | 726,564 | | | | 20,445,511 | |
Edwards Lifesciences Corp.(b) | | | 150,439 | | | | 15,379,379 | |
Koninklijke Philips N.V. (Netherlands) | | | 406,717 | | | | 16,561,142 | |
Olympus Corp. (Japan) | | | 421,700 | | | | 15,712,249 | |
ResMed Inc. | | | 95,192 | | | | 8,013,263 | |
Wright Medical Group N.V.(b) | | | 799,968 | | | | 20,967,161 | |
Zimmer Biomet Holdings, Inc. | | | 299,150 | | | | 36,382,623 | |
| | | | | | | | 133,461,328 | |
|
| Health Care Facilities–1.44% | |
HCA Healthcare, Inc.(b) | | | 164,633 | | | | 12,454,486 | |
Tenet Healthcare Corp.(b) | | | 553,317 | | | | 7,901,367 | |
| | | | | | | | 20,355,853 | |
|
| Health Care Services–0.79% | |
Envision Healthcare Corp.(b) | | | 262,819 | | | | 11,196,089 | |
|
| Health Care Supplies–3.98% | |
Align Technology, Inc.(b) | | | 101,047 | | | | 24,148,212 | |
DENTSPLY SIRONA Inc. | | | 525,126 | | | | 32,069,445 | |
| | | | | | | | 56,217,657 | |
| | | | | | | | |
| | | Shares | | | Value | |
| Life Sciences Tools & Services–6.07% | |
Agilent Technologies, Inc. | | | 110,427 | | | $ | 7,512,349 | |
Illumina, Inc.(b) | | | 86,681 | | | | 17,786,074 | |
Thermo Fisher Scientific, Inc. | | | 311,763 | | | | 60,429,022 | |
| | | | | | | | 85,727,445 | |
|
| Managed Health Care–14.80% | |
Aetna Inc. | | | 315,657 | | | | 53,671,160 | |
Anthem, Inc. | | | 110,623 | | | | 23,143,438 | |
Centene Corp.(b) | | | 203,348 | | | | 19,047,607 | |
Cigna Corp. | | | 75,306 | | | | 14,851,849 | |
HealthEquity, Inc.(b) | | | 164,469 | | | | 8,259,633 | |
Humana Inc. | | | 124,402 | | | | 31,766,051 | |
Molina Healthcare, Inc.(b) | | | 103,908 | | | | 7,048,080 | |
Qualicorp S.A. (Brazil) | | | 667,900 | | | | 7,141,852 | |
UnitedHealth Group Inc. | | | 210,381 | | | | 44,226,294 | |
| | | | | | | | 209,155,964 | |
|
| Pharmaceuticals–25.37% | |
Aclaris Therapeutics, Inc.(b) | | | 391,396 | | | | 9,867,093 | |
Aerie Pharmaceuticals, Inc.(b) | | | 215,058 | | | | 13,279,832 | |
Allergan PLC | | | 138,376 | | | | 24,524,378 | |
AstraZeneca PLC–ADR (United Kingdom) | | | 492,172 | | | | 16,979,934 | |
Bayer AG (Germany) | | | 284,484 | | | | 37,158,346 | |
Bristol-Myers Squibb Co. | | | 772,686 | | | | 47,643,819 | |
Dermira, Inc.(b) | | | 355,028 | | | | 9,504,100 | |
Eli Lilly and Co. | | | 512,367 | | | | 41,983,352 | |
Jazz Pharmaceuticals PLC(b) | | | 95,110 | | | | 13,460,918 | |
Merck & Co., Inc. | | | 561,618 | | | | 30,939,536 | |
Nippon Shinyaku Co., Ltd. (Japan) | | | 223,500 | | | | 15,858,795 | |
Novartis AG–ADR (Switzerland) | | | 688,804 | | | | 56,881,434 | |
Roche Holding AG (Switzerland) | | | 86,253 | | | | 19,929,146 | |
Supernus Pharmaceuticals Inc.(b) | | | 237,033 | | | | 9,860,573 | |
Zogenix, Inc.(b) | | | 283,235 | | | | 10,621,313 | |
| | | | | | | | 358,492,569 | |
Total Common Stocks & Other Equity Interests
(Cost $964,090,205) | | | | 1,370,979,441 | |
|
Preferred Stock–0.00% | |
| Health Care Equipment–0.00% | |
Intact Medical Corp., Series C, Pfd. (Acquired 03/26/2001;
Cost $2,000,000)(c)(d)(e) | | | 2,439,026 | | | | 0 | |
|
Money Market Funds–3.56% | |
Invesco Government & Agency Portfolio–Institutional Class, 0.95%(f) | | | 30,183,530 | | | | 30,183,530 | |
Invesco Treasury Portfolio–Institutional Class, 0.94%(f) | | | 20,122,353 | | | | 20,122,353 | |
Total Money Market Funds
(Cost $50,305,883) | | | | 50,305,883 | |
TOTAL INVESTMENTS IN SECURITIES–100.57%
(Cost $1,016,396,088) | | | | 1,421,285,324 | |
OTHER ASSETS LESS LIABILITIES–(0.57)% | | | | (8,084,835 | ) |
NET ASSETS–100.00% | | | $ | 1,413,200,489 | |
See accompanying Notes to Financial Statements which are an integral part of the financial statements.
10 Invesco Global Health Care Fund
Investment Abbreviations:
| | |
| ADR | | – American Depositary Receipt |
| Pfd. | | – Preferred |
Notes to Schedule of Investments:
| (a) | Industry and/or sector classifications used in this report are generally according to the Global Industry Classification Standard, which was developed by and is the exclusive property and a service mark of MSCI Inc. and Standard & Poor’s. |
| (b) | Non-income producing security. |
| (c) | Security is considered venture capital. See Note 1K. |
| (d) | Security purchased or received in transaction exempt from registration under the Securities Act of 1933, as amended (the “1933 Act”). The security may be resold pursuant to an exemption from registration under the 1933 Act, typically to qualified institutional buyers. The value of this security at October 31, 2017 represented less than 1% of the Fund’s Net Assets. |
| (e) | Security valued using significant unobservable inputs (Level 3). See Note 3. |
| (f) | The money market fund and the Fund are affiliated by having the same investment adviser. The rate shown is the 7-day SEC standardized yield as of October 31, 2017. |
See accompanying Notes to Financial Statements which are an integral part of the financial statements.
11 Invesco Global Health Care Fund
Statement of Assets and Liabilities
October 31, 2017
| | | | |
Assets: | | | | |
Investments in securities, at value (Cost $966,090,205) | | $ | 1,370,979,441 | |
Investments in affiliated money market funds, at value and cost | | | 50,305,883 | |
Foreign currencies, at value (Cost $1,202,016) | | | 1,154,626 | |
Receivable for: | | | | |
Fund shares sold | | | 184,953 | |
Dividends | | | 1,223,098 | |
Investment for trustee deferred compensation and retirement plans | | | 289,954 | |
Other assets | | | 142,449 | |
Total assets | | | 1,424,280,404 | |
| |
Liabilities: | | | | |
Payable for: | | | | |
Investments purchased | | | 8,616,560 | |
Fund shares reacquired | | | 1,230,533 | |
Accrued fees to affiliates | | | 822,372 | |
Accrued trustees’ and officers’ fees and benefits | | | 3,408 | |
Accrued other operating expenses | | | 31,790 | |
Trustee deferred compensation and retirement plans | | | 375,252 | |
Total liabilities | | | 11,079,915 | |
Net assets applicable to shares outstanding | | $ | 1,413,200,489 | |
| |
Net assets consist of: | | | | |
Shares of beneficial interest | | $ | 919,747,733 | |
Undistributed net investment income (loss) | | | (2,346,168 | ) |
Undistributed net realized gain | | | 90,954,159 | |
Net unrealized appreciation | | | 404,844,765 | |
| | | $ | 1,413,200,489 | |
| | | | |
Net Assets: | | | | |
Class A | | $ | 722,642,919 | |
Class B | | $ | 2,077,184 | |
Class C | | $ | 56,741,449 | |
Class Y | | $ | 35,924,279 | |
Investor Class | | $ | 595,800,918 | |
Class R6 | | $ | 13,740 | |
|
Shares outstanding, no par value,
with an unlimited number of shares authorized: | |
Class A | | | 19,099,235 | |
Class B | | | 76,772 | |
Class C | | | 2,093,829 | |
Class Y | | | 933,755 | |
Investor Class | | | 15,741,896 | |
Class R6 | | | 357 | |
Class A: | | | | |
Net asset value per share | | $ | 37.84 | |
Maximum offering price per share | | | | |
(Net asset value of $37.84 ¸ 94.50%) | | $ | 40.04 | |
Class B: | | | | |
Net asset value and offering price per share | | $ | 27.06 | |
Class C: | | | | |
Net asset value and offering price per share | | $ | 27.10 | |
Class Y: | | | | |
Net asset value and offering price per share | | $ | 38.47 | |
Investor Class: | | | | |
Net asset value and offering price per share | | $ | 37.85 | |
Class R6: | | | | |
Net asset value and offering price per share | | $ | 38.49 | |
See accompanying Notes to Financial Statements which are an integral part of the financial statements.
12 Invesco Global Health Care Fund
Statement of Operations
For the year ended October 31, 2017
| | | | |
Investment income: | | | | |
Dividends (net of foreign withholding taxes of $942,823) | | $ | 13,950,344 | |
Dividends from affiliated money market funds | | | 260,474 | |
Total investment income | | | 14,210,818 | |
| |
Expenses: | | | | |
Advisory fees | | | 8,912,415 | |
Administrative services fees | | | 351,682 | |
Custodian fees | | | 61,110 | |
Distribution fees: | | | | |
Class A | | | 1,848,775 | |
Class B | | | 34,133 | |
Class C | | | 616,255 | |
Investor Class | | | 1,487,405 | |
Transfer agent fees — A, B,C, Y and Investor | | | 2,458,551 | |
Transfer agent fees — R6 | | | 6 | |
Trustees’ and officers’ fees and benefits | | | 42,829 | |
Registration and filing fees | | | 105,005 | |
Reports to shareholders | | | 355,697 | |
Professional services fees | | | 83,378 | |
Other | | | 27,254 | |
Total expenses | | | 16,384,495 | |
Less: Fees waived and expense offset arrangement(s) | | | (71,134 | ) |
Net expenses | | | 16,313,361 | |
Net investment income (loss) | | | (2,102,543 | ) |
| |
Realized and unrealized gain (loss) from: | | | | |
Net realized gain from: | | | | |
Investment securities (includes net gains from securities sold to affiliates of $3,617,275) | | | 91,341,001 | |
Foreign currencies | | | 14,822 | |
| | | | 91,355,823 | |
Change in net unrealized appreciation (depreciation) of: | | | | |
Investment securities | | | 141,459,846 | |
Foreign currencies | | | (22,365 | ) |
| | | | 141,437,481 | |
Net realized and unrealized gain | | | 232,793,304 | |
Net increase in net assets resulting from operations | | $ | 230,690,761 | |
See accompanying Notes to Financial Statements which are an integral part of the financial statements.
13 Invesco Global Health Care Fund
Statement of Changes in Net Assets
For the years ended October 31, 2017 and 2016
| | | | | | | | |
| | | 2017 | | | 2016 | |
Operations: | | | | | | | | |
Net investment income (loss) | | $ | (2,102,543 | ) | | $ | 3,016,869 | |
Net realized gain | | | 91,355,823 | | | | 31,491,611 | |
Change in net unrealized appreciation (depreciation) | | | 141,437,481 | | | | (258,791,207 | ) |
Net increase (decrease) in net assets resulting from operations | | | 230,690,761 | | | | (224,282,727 | ) |
| | |
Distributions to shareholders from net investment income: | | | | | | | | |
Class A | | | (1,607,275 | ) | | | — | |
Class Y | | | (118,323 | ) | | | — | |
Investor Class | | | (1,255,558 | ) | | | — | |
Total distributions from net investment income | | | (2,981,156 | ) | | | — | |
| | |
Distributions to shareholders from net realized gains: | | | | | | | | |
Class A | | | (15,823,825 | ) | | | (127,967,635 | ) |
Class B | | | (135,902 | ) | | | (1,855,636 | ) |
Class C | | | (1,930,498 | ) | | | (18,225,035 | ) |
Class Y | | | (507,868 | ) | | | (5,234,942 | ) |
Investor Class | | | (12,361,129 | ) | | | (93,924,558 | ) |
Total distributions from net realized gains | | | (30,759,222 | ) | | | (247,207,806 | ) |
| | |
Share transactions–net: | | | | | | | | |
Class A | | | (105,311,767 | ) | | | (11,048,725 | ) |
Class B | | | (3,051,588 | ) | | | (3,591,164 | ) |
Class C | | | (17,796,792 | ) | | | (9,986,290 | ) |
Class Y | | | 9,660,440 | | | | (7,490,433 | ) |
Investor Class | | | (49,623,544 | ) | | | 30,971,871 | |
Class R6 | | | 13,272 | | | | — | |
Net increase (decrease) in net assets resulting from share transactions | | | (166,109,979 | ) | | | (1,144,741 | ) |
Net increase (decrease) in net assets | | | 30,840,404 | | | | (472,635,274 | ) |
| | |
Net assets: | | | | | | | | |
Beginning of year | | | 1,382,360,085 | | | | 1,854,995,359 | |
End of year (includes undistributed net investment income (loss) of $(2,346,168) and $2,597,623, respectively) | | $ | 1,413,200,489 | | | $ | 1,382,360,085 | |
Notes to Financial Statements
October 31, 2017
NOTE 1—Significant Accounting Policies
Invesco Global Health Care Fund (the “Fund”) is a series portfolio of AIM Investment Funds (Invesco Investment Funds) (the “Trust”). The Trust is organized as a Delaware statutory trust and is registered under the Investment Company Act of 1940, as amended (the “1940 Act”), as an open-end series management investment company consisting of twenty separate series portfolios, each authorized to issue an unlimited number of shares of beneficial interest. The assets, liabilities and operations of each portfolio are accounted for separately. Information presented in these financial statements pertains only to the Fund. Matters affecting each portfolio or class will be voted on exclusively by the shareholders of such portfolio or class.
The Fund’s investment objective is long-term growth of capital.
The Fund currently consists of six different classes of shares: Class A, Class B, Class C, Class Y, Investor Class and Class R6. On April 4, 2017, the Fund began offering Class R6 shares. Class Y and Investor Class shares are available only to certain investors. Class A shares are sold with a front-end sales charge unless certain waiver criteria are met and under certain circumstances load waived shares may be subject to contingent deferred sales charges (“CDSC”). Class C shares are sold with a CDSC. Class Y, Investor Class and Class R6 shares are sold at net asset value. Effective November 30, 2010, new or additional investments in Class B shares are no longer permitted. Existing shareholders of Class B shares may continue to reinvest dividends and capital gains distributions in Class B shares until they convert to Class A shares. Also, shareholders in Class B shares will be able to exchange those shares for Class B shares of other Invesco Funds offering such shares until they convert to Class A shares. Generally, Class B shares will automatically convert to Class A shares on or about the month-end, which is at least eight years after the date of purchase. Redemption of Class B shares prior to the conversion date will be subject to a CDSC.
14 Invesco Global Health Care Fund
The Fund is an investment company and accordingly follows the investment company accounting and reporting guidance in accordance with Financial Accounting Standards Board Accounting Standards Codification Topic 946, Financial Services — Investment Companies.
The following is a summary of the significant accounting policies followed by the Fund in the preparation of its financial statements.
| A. | Security Valuations — Securities, including restricted securities, are valued according to the following policy. |
A security listed or traded on an exchange (except convertible securities) is valued at its last sales price or official closing price as of the close of the customary trading session on the exchange where the security is principally traded, or lacking any sales or official closing price on a particular day, the security may be valued at the closing bid price on that day. Securities traded in the over-the-counter market are valued based on prices furnished by independent pricing services or market makers. When such securities are valued by an independent pricing service they may be considered fair valued. Futures contracts are valued at the final settlement price set by an exchange on which they are principally traded. Listed options are valued at the mean between the last bid and asked prices from the exchange on which they are principally traded. Options not listed on an exchange are valued by an independent source at the mean between the last bid and asked prices. For purposes of determining net asset value (“NAV”) per share, futures and option contracts generally are valued 15 minutes after the close of the customary trading session of the New York Stock Exchange (“NYSE”).
Investments in open-end and closed-end registered investment companies that do not trade on an exchange are valued at the end-of-day net asset value per share. Investments in open-end and closed-end registered investment companies that trade on an exchange are valued at the last sales price or official closing price as of the close of the customary trading session on the exchange where the security is principally traded.
Debt obligations (including convertible securities) and unlisted equities are fair valued using an evaluated quote provided by an independent pricing service. Evaluated quotes provided by the pricing service may be determined without exclusive reliance on quoted prices, and may reflect appropriate factors such as institution-size trading in similar groups of securities, developments related to specific securities, dividend rate (for unlisted equities), yield (for debt obligations), quality, type of issue, coupon rate (for debt obligations), maturity (for debt obligations), individual trading characteristics and other market data. Pricing services generally value debt obligations assuming orderly transactions of institutional round lot size, but a fund may hold or transact in the same securities in smaller, odd lot sizes. Odd lots often trade at lower prices than institutional round lots. Debt obligations are subject to interest rate and credit risks. In addition, all debt obligations involve some risk of default with respect to interest and/or principal payments.
Foreign securities’ (including foreign exchange contracts) prices are converted into U.S. dollar amounts using the applicable exchange rates as of the close of the NYSE. If market quotations are available and reliable for foreign exchange-traded equity securities, the securities will be valued at the market quotations. Because trading hours for certain foreign securities end before the close of the NYSE, closing market quotations may become unreliable. If between the time trading ends on a particular security and the close of the customary trading session on the NYSE, events occur that the investment adviser determines are significant and make the closing price unreliable, the Fund may fair value the security. If the event is likely to have affected the closing price of the security, the security will be valued at fair value in good faith using procedures approved by the Board of Trustees. Adjustments to closing prices to reflect fair value may also be based on a screening process of an independent pricing service to indicate the degree of certainty, based on historical data, that the closing price in the principal market where a foreign security trades is not the current value as of the close of the NYSE. Foreign securities’ prices meeting the approved degree of certainty that the price is not reflective of current value will be priced at the indication of fair value from the independent pricing service. Multiple factors may be considered by the independent pricing service in determining adjustments to reflect fair value and may include information relating to sector indices, American Depositary Receipts and domestic and foreign index futures. Foreign securities may have additional risks including exchange rate changes, potential for sharply devalued currencies and high inflation, political and economic upheaval, the relative lack of issuer information, relatively low market liquidity and the potential lack of strict financial and accounting controls and standards.
Securities for which market prices are not provided by any of the above methods may be valued based upon quotes furnished by independent sources. The last bid price may be used to value equity securities. The mean between the last bid and asked prices is used to value debt obligations, including corporate loans.
Securities for which market quotations are not readily available or became unreliable are valued at fair value as determined in good faith by or under the supervision of the Trust’s officers following procedures approved by the Board of Trustees. Issuer specific events, market trends, bid/asked quotes of brokers and information providers and other market data may be reviewed in the course of making a good faith determination of a security’s fair value.
The Fund may invest in securities that are subject to interest rate risk, meaning the risk that the prices will generally fall as interest rates rise and, conversely, the prices will generally rise as interest rates fall. Specific securities differ in their sensitivity to changes in interest rates depending on their individual characteristics. Changes in interest rates may result in increased market volatility, which may affect the value and/or liquidity of certain Fund investments.
Valuations change in response to many factors including the historical and prospective earnings of the issuer, the value of the issuer’s assets, general economic conditions, interest rates, investor perceptions and market liquidity. Because of the inherent uncertainties of valuation, the values reflected in the financial statements may materially differ from the value received upon actual sale of those investments.
| B. | Securities Transactions and Investment Income — Securities transactions are accounted for on a trade date basis. Realized gains or losses on sales are computed on the basis of specific identification of the securities sold. Interest income (net of withholding tax, if any) is recorded on the accrual basis from settlement date. Dividend income (net of withholding tax, if any) is recorded on the ex-dividend date. |
The Fund may periodically participate in litigation related to Fund investments. As such, the Fund may receive proceeds from litigation settlements. Any proceeds received are included in the Statement of Operations as realized gain (loss) for investments no longer held and as unrealized gain (loss) for investments still held.
Brokerage commissions and mark ups are considered transaction costs and are recorded as an increase to the cost basis of securities purchased and/or a reduction of proceeds on a sale of securities. Such transaction costs are included in the determination of net realized and unrealized gain (loss) from investment securities reported in the Statement of Operations and the Statement of Changes in Net Assets and the net realized and unrealized gains (losses) on securities per share in the Financial Highlights. Transaction costs are included in the calculation of the Fund’s net asset value and, accordingly, they reduce the Fund’s total returns. These transaction costs are not considered operating expenses and are not reflected in net investment income reported in the Statement of Operations and the Statement of Changes in Net Assets, or the net
15 Invesco Global Health Care Fund
investment income per share and the ratios of expenses and net investment income reported in the Financial Highlights, nor are they limited by any expense limitation arrangements between the Fund and the investment adviser.
The Fund allocates income and realized and unrealized capital gains and losses to a class based on the relative net assets of each class.
| C. | Country Determination — For the purposes of making investment selection decisions and presentation in the Schedule of Investments, the investment adviser may determine the country in which an issuer is located and/or credit risk exposure based on various factors. These factors include the laws of the country under which the issuer is organized, where the issuer maintains a principal office, the country in which the issuer derives 50% or more of its total revenues and the country that has the primary market for the issuer’s securities, as well as other criteria. Among the other criteria that may be evaluated for making this determination are the country in which the issuer maintains 50% or more of its assets, the type of security, financial guarantees and enhancements, the nature of the collateral and the sponsor organization. Country of issuer and/or credit risk exposure has been determined to be the United States of America, unless otherwise noted. |
| D. | Distributions — Distributions from net investment income and net realized capital gain, if any, are generally declared and paid annually and recorded on the ex-dividend date. The Fund may elect to treat a portion of the proceeds from redemptions as distributions for federal income tax purposes. |
| E. | Federal Income Taxes — The Fund intends to comply with the requirements of Subchapter M of the Internal Revenue Code of 1986, as amended (the “Internal Revenue Code”), necessary to qualify as a regulated investment company and to distribute substantially all of the Fund’s taxable earnings to shareholders. As such, the Fund will not be subject to federal income taxes on otherwise taxable income (including net realized capital gain) that is distributed to shareholders. Therefore, no provision for federal income taxes is recorded in the financial statements. |
The Fund recognizes the tax benefits of uncertain tax positions only when the position is more likely than not to be sustained. Management has analyzed the Fund’s uncertain tax positions and concluded that no liability for unrecognized tax benefits should be recorded related to uncertain tax positions. Management is not aware of any tax positions for which it is reasonably possible that the total amounts of unrecognized tax benefits will change materially in the next 12 months.
The Fund files tax returns in the U.S. Federal jurisdiction and certain other jurisdictions. Generally, the Fund is subject to examinations by such taxing authorities for up to three years after the filing of the return for the tax period.
| F. | Expenses — Fees provided for under the Rule 12b-1 plan of a particular class of the Fund are charged to the operations of such class. Transfer agency fees and expenses and other shareholder recordkeeping fees and expenses attributable to Class R6 are charged to such class. Transfer agency fees and expenses and other shareholder recordkeeping fees and expenses relating to all other classes are allocated among those classes based on relative net assets. All other expenses are allocated among the classes based on relative net assets. |
| G. | Accounting Estimates — The preparation of financial statements in conformity with accounting principles generally accepted in the United States of America (“GAAP”) requires management to make estimates and assumptions that affect the reported amounts of assets and liabilities at the date of the financial statements and the reported amounts of revenues and expenses during the reporting period including estimates and assumptions related to taxation. Actual results could differ from those estimates by a significant amount. In addition, the Fund monitors for material events or transactions that may occur or become known after the period-end date and before the date the financial statements are released to print. |
| H. | Indemnifications — Under the Trust’s organizational documents, each Trustee, officer, employee or other agent of the Trust is indemnified against certain liabilities that may arise out of the performance of their duties to the Fund. Additionally, in the normal course of business, the Fund enters into contracts, including the Fund’s servicing agreements, that contain a variety of indemnification clauses. The Fund’s maximum exposure under these arrangements is unknown as this would involve future claims that may be made against the Fund that have not yet occurred. The risk of material loss as a result of such indemnification claims is considered remote. |
| I. | Foreign Currency Translations — Foreign currency is valued at the close of the NYSE based on quotations posted by banks and major currency dealers. Portfolio securities and other assets and liabilities denominated in foreign currencies are translated into U.S. dollar amounts at date of valuation. Purchases and sales of portfolio securities (net of foreign taxes withheld on disposition) and income items denominated in foreign currencies are translated into U.S. dollar amounts on the respective dates of such transactions. The Fund does not separately account for the portion of the results of operations resulting from changes in foreign exchange rates on investments and the fluctuations arising from changes in market prices of securities held. The combined results of changes in foreign exchange rates and the fluctuation of market prices on investments (net of estimated foreign tax withholding) are included with the net realized and unrealized gain or loss from investments in the Statement of Operations. Reported net realized foreign currency gains or losses arise from (1) sales of foreign currencies, (2) currency gains or losses realized between the trade and settlement dates on securities transactions, and (3) the difference between the amounts of dividends, interest, and foreign withholding taxes recorded on the Fund’s books and the U.S. dollar equivalent of the amounts actually received or paid. Net unrealized foreign currency gains and losses arise from changes in the fair values of assets and liabilities, other than investments in securities at fiscal period end, resulting from changes in exchange rates. |
The Fund may invest in foreign securities, which may be subject to foreign taxes on income, gains on investments or currency repatriation, a portion of which may be recoverable. Foreign taxes, if any, are recorded based on the tax regulations and rates that exist in the foreign markets in which the Fund invests and are shown in the Statement of Operations.
| J. | Forward Foreign Currency Contracts — The Fund may engage in foreign currency transactions either on a spot (i.e. for prompt delivery and settlement) basis, or through forward foreign currency contracts, to manage or minimize currency or exchange rate risk. |
The Fund may also enter into forward foreign currency contracts for the purchase or sale of a security denominated in a foreign currency in order to “lock in” the U.S. dollar price of that security, or the Fund may also enter into forward foreign currency contracts that do not provide for physical settlement of the two currencies, but instead are settled by a single cash payment calculated as the difference between the agreed upon exchange rate and the spot rate at settlement based upon an agreed upon notional amount (non-deliverable forwards). The Fund will set aside liquid assets in an amount equal to the daily mark-to-market obligation for forward foreign currency contracts.
A forward foreign currency contract is an obligation between two parties (“Counterparties”) to purchase or sell a specific currency for an agreed-upon price at a future date. The use of forward foreign currency contracts does not eliminate fluctuations in the price of the underlying securities the Fund owns or intends to acquire but establishes a rate of exchange in advance. Fluctuations in the value of these contracts are measured by the difference in the contract date and reporting date exchange rates and are recorded as unrealized appreciation (depreciation)
16 Invesco Global Health Care Fund
until the contracts are closed. When the contracts are closed, realized gains (losses) are recorded. Realized and unrealized gains (losses) on the contracts are included in the Statement of Operations. The primary risks associated with forward foreign currency contracts include failure of the Counterparty to meet the terms of the contract and the value of the foreign currency changing unfavorably. These risks may be in excess of the amounts reflected in the Statement of Assets and Liabilities.
| K. | Other Risks — The Fund’s performance is vulnerable to factors affecting the health care industry, including government regulation, obsolescence caused by scientific advances and technological innovations. |
The Fund has invested in non-publicly traded companies, some of which are in the startup or development stages. These investments are inherently risky, as the market for the technologies or products these companies are developing are typically in the early stages and may never materialize. The Fund could lose its entire investment in these companies. These investments are valued at fair value as determined in good faith in accordance with procedures approved by the Board of Trustees. Investments in privately held venture capital securities are illiquid.
NOTE 2—Advisory Fees and Other Fees Paid to Affiliates
The Trust has entered into a master investment advisory agreement with Invesco Advisers, Inc. (the “Adviser” or “Invesco”). Under the terms of the investment advisory agreement, the Fund accrues daily and pays monthly an advisory fee to the Adviser based on the annual rate of the Fund’s average daily net assets as follows:
| | | | | | | | |
| Average Daily Net Assets | | Rate | |
First $350 million | | | 0 | .75% | | | | |
Next $350 million | | | 0 | .65% | | | | |
Next $1.3 billion | | | 0 | .55% | | | | |
Next $2 billion | | | 0 | .45% | | | | |
Next $2 billion | | | 0 | .40% | | | | |
Next $2 billion | | | 0 | .375% | | | | |
Over $8 billion | | | 0 | .35% | | | | |
For the year ended October 31, 2017, the effective advisory fees incurred by the Fund was 0.62%.
Under the terms of a master sub-advisory agreement between the Adviser and each of Invesco Asset Management Deutschland GmbH, Invesco Asset Management Limited, Invesco Asset Management (Japan) Limited, Invesco Hong Kong Limited, Invesco Senior Secured Management, Inc. and Invesco Canada Ltd. (collectively, the “Affiliated Sub-Advisers”) the Adviser, not the Fund, will pay 40% of the fees paid to the Adviser to any such Affiliated Sub-Adviser(s) that provide(s) discretionary investment management services to the Fund based on the percentage of assets allocated to such Affiliated Sub-Adviser(s).
The Adviser has contractually agreed, through at least June 30, 2018, to waive advisory fees and/or reimburse expenses to the extent necessary to limit total annual fund operating expenses after fee waiver and/or expense reimbursement (excluding certain items discussed below) of Class A, Class B, Class C, Class Y, Investor Class and Class R6 shares to 2.00%, 2.75%, 2.75%, 1.75%, 2.00% and 1.75% of average daily net assets (the “expense limits”), respectively. In determining the Adviser’s obligation to waive advisory fees and/or reimburse expenses, the following expenses are not taken into account, and could cause total annual fund operating expenses after fee waiver and/or expense reimbursement to exceed the numbers reflected above: (1) interest; (2) taxes; (3) dividend expense on short sales; (4) extraordinary or non-routine items, including litigation expenses; and (5) expenses that the Fund has incurred but did not actually pay because of an expense offset arrangement. Unless Invesco continues the fee waiver agreement, it will terminate on June 30, 2018. During its term, the fee waiver agreement cannot be terminated or amended to increase the expense limits without approval of the Board of Trustees. The Adviser did not waive fees and/or reimburse expenses during the period under these expense limits.
Further, the Adviser has contractually agreed, through at least June 30, 2019, to waive the advisory fee payable by the Fund in an amount equal to 100% of the net advisory fees the Adviser receives from the affiliated money market funds on investments by the Fund of uninvested cash in such affiliated money market funds.
For the year ended October 31, 2017, the Adviser waived advisory fees of $40,059.
The Trust has entered into a master administrative services agreement with Invesco pursuant to which the Fund has agreed to pay Invesco for certain administrative costs incurred in providing accounting services to the Fund. For the year ended October 31, 2017, expenses incurred under the agreement are shown in the Statement of Operations as Administrative services fees.
The Trust has entered into a transfer agency and service agreement with Invesco Investment Services, Inc. (“IIS”) pursuant to which the Fund has agreed to pay IIS a fee for providing transfer agency and shareholder services to the Fund and reimburse IIS for certain expenses incurred by IIS in the course of providing such services. IIS may make payments to intermediaries that provide omnibus account services, sub-accounting services and/or networking services. All fees payable by IIS to intermediaries that provide omnibus account services or sub-accounting services are charged back to the Fund, subject to certain limitations approved by the Trust’s Board of Trustees. For the year ended October 31, 2017, the expenses incurred under the agreement are shown in the Statement of Operations as Transfer agent fees.
The Trust has entered into master distribution agreements with Invesco Distributors, Inc. (“IDI”) to serve as the distributor for the Class A, Class B, Class C, Class Y, Investor Class and Class R6 shares of the Fund. The Trust has adopted plans pursuant to Rule 12b-1 under the 1940 Act with respect to the Fund’s Class A, Class B, Class C and Investor Class shares (collectively, the “Plans”). The Fund, pursuant to the Plans, pays IDI compensation at the annual rate of 0.25% of the Fund’s average daily net assets of Class A shares, 1.00% of the average daily net assets of Class B and Class C shares and 0.25% of the average daily net assets of Investor Class shares. The fees are accrued daily and paid monthly. Of the Plan payments, up to 0.25% of the average daily net assets of each class of shares may be paid to furnish continuing personal shareholder services to customers who purchase and own shares of such classes. Any amounts not paid as a service fee under the Plans would constitute an asset-based sales charge. Rules of the Financial Industry Regulatory Authority (“FINRA”) impose a cap on the total sales charges, including asset-based sales charges, that may be paid by any class of shares of the Fund. For the year ended October 31, 2017, expenses incurred under the Plan are shown in the Statement of Operations as Distribution fees.
17 Invesco Global Health Care Fund
Front-end sales commissions and CDSC (collectively, the “sales charges”) are not recorded as expenses of the Fund. Front-end sales commissions are deducted from proceeds from the sales of Fund shares prior to investment in Class A shares of the Fund. CDSC are deducted from redemption proceeds prior to remittance to the shareholder. During the year ended October 31, 2017, IDI advised the Fund that IDI retained $66,772 in front-end sales commissions from the sale of Class A shares and $4,667, $389 and $5,212 from Class A, Class B and Class C shares, respectively, for CDSC imposed on redemptions by shareholders.
For the year ended October 31, 2017, the Fund incurred $10,184 in brokerage commissions with Invesco Capital Markets, Inc., an affiliate of the Adviser and IDI, for portfolio transactions executed on behalf of the Fund.
Certain officers and trustees of the Trust are officers and directors of the Adviser, IIS and/or IDI.
NOTE 3—Additional Valuation Information
GAAP defines fair value as the price that would be received to sell an asset or paid to transfer a liability in an orderly transaction between market participants at the measurement date, under current market conditions. GAAP establishes a hierarchy that prioritizes the inputs to valuation methods, giving the highest priority to readily available unadjusted quoted prices in an active market for identical assets (Level 1) and the lowest priority to significant unobservable inputs (Level 3), generally when market prices are not readily available or are unreliable. Based on the valuation inputs, the securities or other investments are tiered into one of three levels. Changes in valuation methods may result in transfers in or out of an investment’s assigned level:
| | Level 1 — | Prices are determined using quoted prices in an active market for identical assets. |
| | Level 2 — | Prices are determined using other significant observable inputs. Observable inputs are inputs that other market participants may use in pricing a security. These may include quoted prices for similar securities, interest rates, prepayment speeds, credit risk, yield curves, loss severities, default rates, discount rates, volatilities and others. |
| | Level 3 — | Prices are determined using significant unobservable inputs. In situations where quoted prices or observable inputs are unavailable (for example, when there is little or no market activity for an investment at the end of the period), unobservable inputs may be used. Unobservable inputs reflect the Fund’s own assumptions about the factors market participants would use in determining fair value of the securities or instruments and would be based on the best available information. |
The following is a summary of the tiered valuation input levels, as of October 31, 2017. The level assigned to the securities valuations may not be an indication of the risk or liquidity associated with investing in those securities. Because of the inherent uncertainties of valuation, the values reflected in the financial statements may materially differ from the value received upon actual sale of those investments.
The Fund’s policy is to recognize transfers in and out of the valuation levels as of the end of the reporting period. During the year ended October 31, 2017, there were transfers from Level 1 to Level 2 of $68,729,390 and from Level 2 to Level 1 of $19,929,146 due to foreign fair value adjustments.
| | | | | | | | | | | | | | | | |
| | | Level 1 | | | Level 2 | | | Level 3 | | | Total | |
Common Stocks & Equity Interests | | $ | 1,302,250,051 | | | $ | 68,729,390 | | | $ | — | | | $ | 1,370,979,441 | |
Preferred Stocks | | | — | | | | — | | | | 0 | | | | 0 | |
Money Market Funds | | | 50,305,883 | | | | — | | | | — | | | | 50,305,883 | |
Total Investments | | $ | 1,352,555,934 | | | $ | 68,729,390 | | | $ | 0 | | | $ | 1,421,285,324 | |
NOTE 4—Security Transactions with Affiliated Funds
The Fund is permitted to purchase or sell securities from or to certain other Invesco Funds under specified conditions outlined in procedures adopted by the Board of Trustees of the Trust. The procedures have been designed to ensure that any purchase or sale of securities by the Trust from or to another fund or portfolio that is or could be considered an affiliate by virtue of having a common investment adviser (or affiliated investment advisers), common Trustees and/or common officers complies with Rule 17a-7 of the 1940 Act. Further, as defined under the procedures, each transaction is effected at the current market price. Pursuant to these procedures, for the year ended October 31, 2017, the Fund engaged in securities sales of $12,976,407, which resulted in net realized gains of $3,617,275.
NOTE 5—Expense Offset Arrangement(s)
The expense offset arrangement is comprised of transfer agency credits which result from balances in demand deposit accounts used by the transfer agent for clearing shareholder transactions. For the year ended October 31, 2017, the Fund received credits from this arrangement, which resulted in the reduction of the Fund’s total expenses of $31,075.
NOTE 6—Trustees’ and Officers’ Fees and Benefits
Trustees’ and Officers’ Fees and Benefits include amounts accrued by the Fund to pay remuneration to certain Trustees and Officers of the Fund. Trustees have the option to defer compensation payable by the Fund, and Trustees’ and Officers’ Fees and Benefits also include amounts accrued by the Fund to fund such deferred compensation amounts. Those Trustees who defer compensation have the option to select various Invesco Funds in which their deferral accounts shall be deemed to be invested. Finally, certain current Trustees were eligible to participate in a retirement plan that provided for benefits to be paid upon retirement to Trustees over a period of time based on the number of years of service. The Fund may have certain former Trustees who also participate in a retirement plan and receive benefits under such plan. Trustees’ and Officers’ Fees and Benefits include amounts accrued by the Fund to fund such retirement benefits. Obligations under the deferred compensation and retirement plans represent unsecured claims against the general assets of -the Fund.
18 Invesco Global Health Care Fund
NOTE 7—Cash Balances
The Fund is permitted to temporarily carry a negative or overdrawn balance in its account with State Street Bank and Trust Company, the custodian bank. Such balances, if any at period-end, are shown in the Statement of Assets and Liabilities under the payable caption Amount due custodian. To compensate the custodian bank for such overdrafts, the overdrawn Fund may either (1) leave funds as a compensating balance in the account so the custodian bank can be compensated by earning the additional interest; or (2) compensate by paying the custodian bank at a rate agreed upon by the custodian bank and Invesco, not to exceed the contractually agreed upon rate.
NOTE 8—Distributions to Shareholders and Tax Components of Net Assets
Tax Character of Distributions to Shareholders Paid During the Fiscal Years Ended October 31, 2017 and 2016:
| | | | | | | | |
| | | 2017 | | | 2016 | |
Ordinary income | | $ | 2,952,595 | | | $ | 15,102,427 | |
Long-term capital gain | | | 30,787,783 | | | | 232,105,379 | |
Total distributions | | $ | 33,740,378 | | | $ | 247,207,806 | |
Tax Components of Net Assets at Period-End:
| | | | |
| | | 2017 | |
Undistributed long-term gain | | $ | 91,419,812 | |
Net unrealized appreciation — investments | | | 404,423,583 | |
Net unrealized appreciation (depreciation) — foreign currencies | | | (44,471 | ) |
Temporary book/tax differences | | | (350,025 | ) |
Late-Year ordinary loss deferral | | | (1,996,143 | ) |
Shares of beneficial interest | | | 919,747,733 | |
Total net assets | | $ | 1,413,200,489 | |
The difference between book-basis and tax-basis unrealized appreciation (depreciation) is due to differences in the timing of recognition of gains and losses on investments for tax and book purposes. The Fund’s net unrealized appreciation difference is attributable primarily to wash sales.
The temporary book/tax differences are a result of timing differences between book and tax recognition of income and/or expenses. The Fund’s temporary book/tax differences are the result of the trustee deferral of compensation and retirement plan benefits.
Capital loss carryforward is calculated and reported as of a specific date. Results of transactions and other activity after that date may affect the amount of capital loss carryforward actually available for the Fund to utilize. Capital losses generated in years beginning after December 22, 2010 can be carried forward for an unlimited period, whereas previous losses expire in eight tax years. Capital losses with an expiration period may not be used to offset capital gains until all net capital losses without an expiration date have been utilized. Capital loss carryforwards with no expiration date will retain their character as either short-term or long-term capital losses instead of as short-term capital losses as under prior law. The ability to utilize capital loss carryforwards in the future may be limited under the Internal Revenue Code and related regulations based on the results of future transactions.
The Fund does not have a capital loss carryforward as of October 31, 2017.
NOTE 9—Investment Transactions
The aggregate amount of investment securities (other than short-term securities, U.S. Treasury obligations and money market funds, if any) purchased and sold by the Fund during the year ended October 31, 2017 was $499,295,386 and $718,466,069, respectively. Cost of investments, including any derivatives, on a tax basis includes the adjustments for financial reporting purposes as of the most recently completed federal income tax reporting period-end.
| | | | |
| Unrealized Appreciation (Depreciation) of Investments on a Tax Basis | |
Aggregate unrealized appreciation of investments | | $ | 445,896,869 | |
Aggregate unrealized (depreciation) of investments | | | (41,473,286 | ) |
Net unrealized appreciation of investments | | $ | 404,423,583 | |
Cost of investments for tax purposes is $1,016,861,741.
NOTE 10—Reclassification of Permanent Differences
Primarily as a result of differing book/tax treatment of net operating loss and foreign currency transactions, on October 31, 2017, undistributed net investment income (loss) was increased by $139,908, undistributed net realized gain was decreased by $43,382 and shares of beneficial interest was decreased by $96,526. This reclassification had no effect on the net assets of the Fund.
19 Invesco Global Health Care Fund
NOTE 11—Share Information
| | | | | | | | | | | | | | | | |
| | | Summary of Share Activity | |
| | | Years ended October 31, | |
| | | 2017(a) | | | 2016 | |
| | | Shares | | | Amount | | | Shares | | | Amount | |
Sold: | | | | | | | | | | | | | | | | |
Class A | | | 1,046,320 | | | $ | 37,489,570 | | | | 1,843,602 | | | $ | 67,167,477 | |
Class B | | | 6,634 | | | | 167,650 | | | | 11,075 | | | | 289,683 | |
Class C | | | 310,753 | | | | 8,133,539 | | | | 404,498 | | | | 10,787,866 | |
Class Y | | | 640,928 | | | | 23,573,301 | | | | 341,967 | | | | 12,813,669 | |
Investor Class | | | 183,690 | | | | 6,634,297 | | | | 389,082 | | | | 14,740,822 | |
Class R6(b) | | | 357 | | | | 13,272 | | | | — | | | | — | |
| | | | |
Issued as reinvestment of dividends: | | | | | | | | | | | | | | | | |
Class A | | | 512,170 | | | | 16,973,305 | | | | 3,396,181 | | | | 125,115,293 | |
Class B | | | 5,664 | | | | 135,083 | | | | 68,337 | | | | 1,836,894 | |
Class C | | | 79,740 | | | | 1,904,968 | | | | 668,972 | | | | 18,015,422 | |
Class Y | | | 16,752 | | | | 563,212 | | | | 131,892 | | | | 4,930,137 | |
Investor Class | | | 396,403 | | | | 13,140,754 | | | | 2,469,246 | | | | 90,991,726 | |
| | | | |
Automatic conversion of Class B shares to Class A shares: | | | | | | | | | | | | | | | | |
Class A | | | 66,739 | | | | 2,401,525 | | | | 94,832 | | | | 3,351,350 | |
Class B | | | (92,917 | ) | | | (2,401,525 | ) | | | (129,996 | ) | | | (3,351,350 | ) |
| | | | |
Reacquired: | | | | | | | | | | | | | | | | |
Class A | | | (4,546,739 | ) | | | (162,176,167 | ) | | | (5,783,954 | ) | | | (206,682,845 | ) |
Class B | | | (37,363 | ) | | | (952,796 | ) | | | (90,684 | ) | | | (2,366,391 | ) |
Class C | | | (1,086,586 | ) | | | (27,835,299 | ) | | | (1,500,972 | ) | | | (38,789,578 | ) |
Class Y | | | (397,427 | ) | | | (14,476,073 | ) | | | (691,953 | ) | | | (25,234,239 | ) |
Investor Class | | | (1,944,467 | ) | | | (69,398,595 | ) | | | (2,094,161 | ) | | | (74,760,677 | ) |
Net increase (decrease) in share activity | | | (4,839,349 | ) | | $ | (166,109,979 | ) | | | (472,036 | ) | | $ | (1,144,741 | ) |
| (a) | There are entities that are record owners of more than 5% of the outstanding shares of the Fund and in the aggregate own 14% of the outstanding shares of the Fund. IDI has an agreement with these entities to sell Fund shares. The Fund, Invesco and/or Invesco affiliates may make payments to these entities, which are considered to be related to the Fund, for providing services to the Fund, Invesco and/or Invesco affiliates including but not limited to services such as securities brokerage, distribution, third party record keeping and account servicing. The Fund has no knowledge as to whether all or any portion of the shares owned of record by these entities are also owned beneficially. |
| (b) | Commencement date of April 4, 2017. |
20 Invesco Global Health Care Fund
NOTE 12—Financial Highlights
The following schedule presents financial highlights for a share of the Fund outstanding throughout the periods indicated.
| | | | | | | | | | | | | | | | | | | | | | | | | | | | | | | | | | | | | | | | | | | | | | | | | | | | | | | | |
| | | Net asset
value,
beginning
of period | | | Net
investment
income
(loss)(a) | | | Net gains
(losses)
on securities
(both
realized and
unrealized) | | | Total from
investment
operations | | | Dividends
from net
investment
income | | | Distributions
from net
realized
gains | | | Total
distributions | | | Net asset
value, end
of period | | | Total
return(b) | | | Net assets,
end of period
(000’s omitted) | | | Ratio of
expenses
to average
net assets
with fee waivers
and/or expenses
absorbed | | | Ratio of
expenses
to average net
assets without
fee waivers
and/or expenses
absorbed | | | Ratio of net
investment
income (loss)
to average
net assets | | | Portfolio
turnover(c) | |
Class A | | | | | | | | | | | | | | | | | | | | | | | | | | | | | | | | | | | | | | | | | | | | | | | | | | | | | | | | |
Year ended 10/31/17 | | $ | 32.93 | | | $ | (0.05 | ) | | $ | 5.77 | | | $ | 5.72 | | | $ | (0.07 | ) | | $ | (0.74 | ) | | $ | (0.81 | ) | | $ | 37.84 | | | | 17.73 | % | | $ | 722,643 | | | | 1.12 | %(d) | | | 1.12 | %(d) | | | (0.12 | )%(d) | | | 36 | % |
Year ended 10/31/16 | | | 43.70 | | | | 0.08 | | | | (5.09 | ) | | | (5.01 | ) | | | — | | | | (5.76 | ) | | | (5.76 | ) | | | 32.93 | | | | (12.87 | ) | | | 725,053 | | | | 1.09 | | | | 1.09 | | | | 0.23 | | | | 21 | |
Year ended 10/31/15 | | | 47.08 | | | | 0.02 | | | | 1.53 | | | | 1.55 | | | | — | | | | (4.93 | ) | | | (4.93 | ) | | | 43.70 | | | | 3.56 | | | | 981,963 | | | | 1.04 | | | | 1.05 | | | | 0.04 | | | | 47 | |
Year ended 10/31/14 | | | 40.38 | | | | 0.01 | | | | 10.15 | | | | 10.16 | | | | (0.01 | ) | | | (3.45 | ) | | | (3.46 | ) | | | 47.08 | | | | 27.20 | | | | 906,858 | | | | 1.07 | | | | 1.08 | | | | 0.04 | | | | 24 | |
Year ended 10/31/13 | | | 32.09 | | | | 0.07 | | | | 10.63 | | | | 10.70 | | | | (0.17 | ) | | | (2.24 | ) | | | (2.41 | ) | | | 40.38 | | | | 35.79 | | | | 737,071 | | | | 1.10 | | | | 1.11 | | | | 0.21 | | | | 37 | |
Class B | | | | | | | | | | | | | | | | | | | | | | | | | | | | | | | | | | | | | | | | | | | | | | | | | | | | | | | | |
Year ended 10/31/17 | | | 23.87 | | | | (0.22 | ) | | | 4.15 | | | | 3.93 | | | | — | | | | (0.74 | ) | | | (0.74 | ) | | | 27.06 | | | | 16.87 | | | | 2,077 | | | | 1.87 | (d) | | | 1.87 | (d) | | | (0.87 | )(d) | | | 36 | |
Year ended 10/31/16 | | | 33.51 | | | | (0.14 | ) | | | (3.74 | ) | | | (3.88 | ) | | | — | | | | (5.76 | ) | | | (5.76 | ) | | | 23.87 | | | | (13.52 | ) | | | 4,649 | | | | 1.84 | | | | 1.84 | | | | (0.52 | ) | | | 21 | |
Year ended 10/31/15 | | | 37.50 | | | | (0.25 | ) | | | 1.19 | | | | 0.94 | | | | — | | | | (4.93 | ) | | | (4.93 | ) | | | 33.51 | | | | 2.76 | | | | 11,262 | | | | 1.79 | | | | 1.80 | | | | (0.71 | ) | | | 47 | |
Year ended 10/31/14 | | | 33.06 | | | | (0.24 | ) | | | 8.13 | | | | 7.89 | | | | — | | | | (3.45 | ) | | | (3.45 | ) | | | 37.50 | | | | 26.26 | | | | 14,239 | | | | 1.82 | | | | 1.83 | | | | (0.71 | ) | | | 24 | |
Year ended 10/31/13 | | | 26.72 | | | | (0.16 | ) | | | 8.74 | | | | 8.58 | | | | — | | | | (2.24 | ) | | | (2.24 | ) | | | 33.06 | | | | 34.81 | | | | 17,101 | | | | 1.85 | | | | 1.86 | | | | (0.54 | ) | | | 37 | |
Class C | | | | | | | | | | | | | | | | | | | | | | | | | | | | | | | | | | | | | | | | | | | | | | | | | | | | | | | | |
Year ended 10/31/17 | | | 23.91 | | | | (0.22 | ) | | | 4.15 | | | | 3.93 | | | | — | | | | (0.74 | ) | | | (0.74 | ) | | | 27.10 | | | | 16.84 | | | | 56,741 | | | | 1.87 | (d) | | | 1.87 | (d) | | | (0.87 | )(d) | | | 36 | |
Year ended 10/31/16 | | | 33.56 | | | | (0.14 | ) | | | (3.75 | ) | | | (3.89 | ) | | | — | | | | (5.76 | ) | | | (5.76 | ) | | | 23.91 | | | | (13.53 | ) | | | 66,699 | | | | 1.84 | | | | 1.84 | | | | (0.52 | ) | | | 21 | |
Year ended 10/31/15 | | | 37.54 | | | | (0.25 | ) | | | 1.20 | | | | 0.95 | | | | — | | | | (4.93 | ) | | | (4.93 | ) | | | 33.56 | | | | 2.78 | | | | 107,976 | | | | 1.79 | | | | 1.80 | | | | (0.71 | ) | | | 47 | |
Year ended 10/31/14 | | | 33.09 | | | | (0.24 | ) | | | 8.14 | | | | 7.90 | | | | — | | | | (3.45 | ) | | | (3.45 | ) | | | 37.54 | | | | 26.26 | | | | 81,439 | | | | 1.82 | | | | 1.83 | | | | (0.71 | ) | | | 24 | |
Year ended 10/31/13 | | | 26.75 | | | | (0.16 | ) | | | 8.74 | | | | 8.58 | | | | — | | | | (2.24 | ) | | | (2.24 | ) | | | 33.09 | | | | 34.76 | | | | 57,536 | | | | 1.85 | | | | 1.86 | | | | (0.54 | ) | | | 37 | |
Class Y | | | | | | | | | | | | | | | | | | | | | | | | | | | | | | | | | | | | | | | | | | | | | | | | | | | | | | | | |
Year ended 10/31/17 | | | 33.48 | | | | 0.05 | | | | 5.85 | | | | 5.90 | | | | (0.17 | ) | | | (0.74 | ) | | | (0.91 | ) | | | 38.47 | | | | 18.01 | | | | 35,924 | | | | 0.87 | (d) | | | 0.87 | (d) | | | 0.13 | (d) | | | 36 | |
Year ended 10/31/16 | | | 44.24 | | | | 0.17 | | | | (5.17 | ) | | | (5.00 | ) | | | — | | | | (5.76 | ) | | | (5.76 | ) | | | 33.48 | | | | (12.67 | ) | | | 22,548 | | | | 0.84 | | | | 0.84 | | | | 0.48 | | | | 21 | |
Year ended 10/31/15 | | | 47.51 | | | | 0.14 | | | | 1.53 | | | | 1.67 | | | | (0.01 | ) | | | (4.93 | ) | | | (4.94 | ) | | | 44.24 | | | | 3.82 | | | | 39,443 | | | | 0.79 | | | | 0.80 | | | | 0.29 | | | | 47 | |
Year ended 10/31/14 | | | 40.71 | | | | 0.13 | | | | 10.22 | | | | 10.35 | | | | (0.10 | ) | | | (3.45 | ) | | | (3.55 | ) | | | 47.51 | | | | 27.52 | | | | 31,016 | | | | 0.82 | | | | 0.83 | | | | 0.29 | | | | 24 | |
Year ended 10/31/13 | | | 32.34 | | | | 0.16 | | | | 10.70 | | | | 10.86 | | | | (0.25 | ) | | | (2.24 | ) | | | (2.49 | ) | | | 40.71 | | | | 36.10 | | | | 15,502 | | | | 0.85 | | | | 0.86 | | | | 0.46 | | | | 37 | |
Investor Class | | | | | | | | | | | | | | | | | | | | | | | | | | | | | | | | | | | | | | | | | | | | | | | | | | | | | | | | |
Year ended 10/31/17 | | | 32.94 | | | | (0.04 | ) | | | 5.76 | | | | 5.72 | | | | (0.07 | ) | | | (0.74 | ) | | | (0.81 | ) | | | 37.85 | | | | 17.72 | | | | 595,801 | | | | 1.12 | (d) | | | 1.12 | (d) | | | (0.12 | )(d) | | | 36 | |
Year ended 10/31/16 | | | 43.71 | | | | 0.08 | | | | (5.09 | ) | | | (5.01 | ) | | | — | | | | (5.76 | ) | | | (5.76 | ) | | | 32.94 | | | | (12.87 | ) | | | 563,411 | | | | 1.09 | | | | 1.09 | | | | 0.23 | | | | 21 | |
Year ended 10/31/15 | | | 47.09 | | | | 0.02 | | | | 1.53 | | | | 1.55 | | | | — | | | | (4.93 | ) | | | (4.93 | ) | | | 43.71 | | | | 3.57 | | | | 714,351 | | | | 1.04 | | | | 1.05 | | | | 0.04 | | | | 47 | |
Year ended 10/31/14 | | | 40.39 | | | | 0.01 | | | | 10.15 | | | | 10.16 | | | | (0.01 | ) | | | (3.45 | ) | | | (3.46 | ) | | | 47.09 | | | | 27.19 | | | | 730,280 | | | | 1.07 | | | | 1.08 | | | | 0.04 | | | | 24 | |
Year ended 10/31/13 | | | 32.10 | | | | 0.07 | | | | 10.63 | | | | 10.70 | | | | (0.17 | ) | | | (2.24 | ) | | | (2.41 | ) | | | 40.39 | | | | 35.78 | | | | 607,408 | | | | 1.10 | | | | 1.11 | | | | 0.21 | | | | 37 | |
Class R6 | | | | | | | | | | | | | | | | | | | | | | | | | | | | | | | | | | | | | | | | | | | | | | | | | | | | | | | | |
Year ended 10/31/17(e) | | | 36.35 | | | | 0.05 | | | | 2.09 | | | | 2.14 | | | | — | | | | — | | | | — | | | | 38.49 | | | | 5.89 | | | | 14 | | | | 0.78 | (d)(f) | | | 0.78 | (d)(f) | | | 0.22 | (d)(f) | | | 36 | |
| (a) | Calculated using average shares outstanding. |
| (b) | Includes adjustments in accordance with accounting principles generally accepted in the United States of America and as such, the net asset value for financial reporting purposes and the returns based upon those net asset values may differ from the net asset value and returns for shareholder transactions. Does not include sales charges and is not annualized for periods less than one year, if applicable. |
| (c) | Portfolio turnover is calculated at the fund level and is not annualized for periods less than one year, if applicable. |
| (d) | Ratios are based on average daily net assets (000’s omitted) of $739,510, $3,413, $61,626, $30,013, $594,962 and $10 for Class A, Class B, Class C, Class Y, Investor Class and Class R6 shares, respectively. |
| (e) | Commencement date of April 4, 2017 for Class R6 shares. |
NOTE 13—Subsequent Event
On December 1, 2017, the Fund’s Board of Trustees approved the early conversion of the remaining assets in the Fund’s Class B shares into Class A shares to occur on or about January 26, 2018. At the close of business on or about January 26, 2018, (the “Conversion Date”) all outstanding Class B shares of the Fund will be converted to Class A shares of the Fund, which is prior to the date the Class B shares would normally be converted to Class A shares. Once the conversion is completed, Class B shares will be closed and become inactive. No contingent deferred sales charges will be payable in connection with this early conversion. The conversion of the Fund’s Class B shares into Class A shares on the Conversion Date is not expected to be a taxable event for federal income tax purposes, and should not result in the recognition of gain or loss by converting shareholders, although each shareholder should consult with his or her own tax adviser.
21 Invesco Global Health Care Fund
Report of Independent Registered Public Accounting Firm
To the Board of Trustees of AIM Investment Funds (Invesco Investment Funds) and
Shareholders of Invesco Global Health Care Fund:
In our opinion, the accompanying statement of assets and liabilities, including the schedule of investments, and the related statements of operations and of changes in net assets and the financial highlights present fairly, in all material respects, the financial position of Invesco Global Health Care Fund (one of the portfolios constituting the AIM Investment Funds (Invesco Investment Funds), hereafter referred to as the “Fund”) as of October 31, 2017, the results of its operations for the year then ended, the changes in its net assets for each of the two years in the period then ended and the financial highlights for each of the periods indicated therein, in conformity with accounting principles generally accepted in the United States of America. These financial statements and financial highlights (hereafter referred to as “financial statements”) are the responsibility of the Fund’s management. Our responsibility is to express an opinion on these financial statements based on our audits. We conducted our audits of these financial statements in accordance with the standards of the Public Company Accounting Oversight Board (United States). Those standards require that we plan and perform the audit to obtain reasonable assurance about whether the financial statements are free of material misstatement. An audit includes examining, on a test basis, evidence supporting the amounts and disclosures in the financial statements, assessing the accounting principles used and significant estimates made by management, and evaluating the overall financial statement presentation. We believe that our audits, which included confirmation of securities as of October 31, 2017 by correspondence with the custodian, transfer agent and brokers, and when replies were not received from brokers, we performed other auditing procedures, provide a reasonable basis for our opinion.
PricewaterhouseCoopers LLP
Houston, Texas
December 21, 2017
22 Invesco Global Health Care Fund
Calculating your ongoing Fund expenses
Example
As a shareholder of the Fund, you incur two types of costs: (1) transaction costs, which may include sales charges (loads) on purchase payments or contingent deferred sales charges on redemptions, if any; and (2) ongoing costs, including management fees, distribution and/or service (12b-1) fees, and other Fund expenses. This example is intended to help you understand your ongoing costs (in dollars) of investing in the Fund and to compare these costs with ongoing costs of investing in other mutual funds. The example is based on an investment of $1,000 invested at the beginning of the period and held for the entire period May 1, 2017 through October 31, 2017.
Actual expenses
The table below provides information about actual account values and actual expenses. You may use the information in this table, together with the amount you invested, to estimate the expenses that you paid over the period. Simply divide your account value by $1,000 (for example, an $8,600 account value divided by $1,000 = 8.6), then multiply the result by the number in the table under the heading entitled “Actual Expenses Paid During Period” to estimate the expenses you paid on your account during this period
Hypothetical example for comparison purposes
The table below also provides information about hypothetical account values and hypothetical expenses based on the Fund’s actual expense ratio and an assumed rate of return of 5% per year before expenses, which is not the Fund’s actual return.
The hypothetical account values and expenses may not be used to estimate the actual ending account balance or expenses you paid for the period. You may use this information to compare the ongoing costs of investing in the Fund and other funds. To do so, compare this 5% hypothetical example with the 5% hypothetical examples that appear in the shareholder reports of the other funds.
Please note that the expenses shown in the table are meant to highlight your ongoing costs only and do not reflect any transaction costs, such as sales charges (loads) on purchase payments or contingent deferred sales charges on redemptions, if any. Therefore, the hypothetical information is useful in comparing ongoing costs only, and will not help you determine the relative total costs of owning different funds. In addition, if these transaction costs were included, your costs would have been higher.
| | | | | | | | | | | | | | | | | | | | | | | | |
| Class | | Beginning
Account Value
(05/01/17) | | | ACTUAL | | | HYPOTHETICAL (5% annual return before expenses) | | | Annualized
Expense
Ratio | |
| | | Ending
Account Value
(10/31/17)1 | | | Expenses
Paid During
Period2 | | | Ending
Account Value
(10/31/17) | | | Expenses
Paid During
Period2 | | |
| A | | $ | 1,000.00 | | | $ | 1,036.10 | | | $ | 5.65 | | | $ | 1,019.66 | | | $ | 5.60 | | | | 1.10 | % |
| B | | | 1,000.00 | | | | 1,032.00 | | | | 9.48 | | | | 1,015.88 | | | | 9.40 | | | | 1.85 | |
| C | | | 1,000.00 | | | | 1,032.00 | | | | 9.48 | | | | 1,015.88 | | | | 9.40 | | | | 1.85 | |
| Y | | | 1,000.00 | | | | 1,037.20 | | | | 4.36 | | | | 1,020.92 | | | | 4.33 | | | | 0.85 | |
| Investor | | | 1,000.00 | | | | 1,035.80 | | | | 5.64 | | | | 1,019.66 | | | | 5.60 | | | | 1.10 | |
| R6 | | | 1,000.00 | | | | 1,037.50 | | | | 4.06 | | | | 1,021.22 | | | | 4.02 | | | | 0.79 | |
| 1 | The actual ending account value is based on the actual total return of the Fund for the period May 1, 2017 through October 31, 2017, after actual expenses and will differ from the hypothetical ending account value which is based on the Fund’s expense ratio and a hypothetical annual return of 5% before expenses. |
| 2 | Expenses are equal to the Fund’s annualized expense ratio as indicated above multiplied by the average account value over the period, multiplied by 184/365 to reflect the most recent fiscal half year. |
23 Invesco Global Health Care Fund
Approval of Investment Advisory and Sub-Advisory Contracts
The Board of Trustees (the Board) of AIM Investment Funds (Invesco Investment Funds) is required under the Investment Company Act of 1940, as amended, to approve annually the renewal of Invesco Global Health Care Fund’s (the Fund) investment advisory agreements. During contract renewal meetings held on June 12-13, 2017, the Board as a whole, and the disinterested or “independent” Trustees, who comprise over 75% of the Board, voting separately, approved the continuance for the Fund of the Master Investment Advisory Agreement with Invesco Advisers, Inc. (Invesco Advisers and the investment advisory agreement) and the Master Intergroup Sub-Advisory Contract for Mutual Funds with Invesco Asset Management Deutschland GmbH, Invesco Asset Management Limited, Invesco Asset Management (Japan) Limited, Invesco Hong Kong Limited, Invesco Senior Secured Management, Inc. and Invesco Canada Ltd. (collectively, the Affiliated Sub-Advisers and the sub-advisory contracts) for another year, effective July 1, 2017.
In evaluating the fairness and reasonableness of compensation under the Fund’s investment advisory agreement and sub-advisory contracts, the Board considered, among other things, the factors discussed below. The Board determined that continuation of the Fund’s investment advisory agreement and the sub-advisory contracts is in the best interest of the Fund and its shareholders and that the compensation payable to Invesco Advisers and the Affiliated Sub-Advisers under the agreements is fair and reasonable.
The Board’s Fund Evaluation Process
The Board’s Investments Committee has established three Sub-Committees, which meet throughout the year to review the performance of funds advised by Invesco Advisers (the Invesco Funds). Over the course of each year, the Sub-Committees meet with portfolio managers for their assigned Invesco Funds and other members of management to review the performance, investment objective(s), policies, strategies, limitations and investment risks of these funds. The Board had the benefit of reports from the Sub-Committees and Investments Committee throughout the year in considering approval of the continuance of each Invesco Fund’s investment advisory agreement and sub-advisory contracts for another year.
During the contract renewal process, the Board receives comparative performance and fee data regarding the Invesco Funds prepared by Invesco Advisers and Broadridge Financial Solutions, Inc. (Broadridge), an independent provider of investment company data. The Board also receives an independent written evaluation from the Senior Officer, an officer of the Invesco Funds who reports directly to the independent Trustees. The Senior Officer’s
evaluation is prepared as part of his responsibility to manage the process by which the Invesco Funds’ proposed management fees are negotiated during the annual contract renewal process to ensure they are negotiated in a manner that is at arms’ length and reasonable. In addition to meetings with Invesco Advisers and fund counsel, the independent Trustees also discuss the continuance of the investment advisory agreement and sub-advisory contracts in separate sessions with the Senior Officer and with independent legal counsel.
The Trustees recognized that the advisory fee rates for the Invesco Funds are, in most cases, the result of years of review and negotiation. The Trustees’ deliberations and conclusions in a particular year may be based in part on their deliberations and conclusions regarding these arrangements throughout the year and in prior years. The Trustees’ review and conclusions are based on the comprehensive consideration of all information presented to them and are not the result of any single determinative factor. Moreover, one Trustee may have weighed a particular piece of information or factor differently than another Trustee.
The discussion below is a summary of the Senior Officer’s independent written evaluation with respect to the Fund’s investment advisory agreement as well as a discussion of the material factors and related conclusions that formed the basis for the Board’s approval of the Fund’s investment advisory agreement and sub-advisory contracts. This information is current as of June 13, 2017, and does not reflect consideration of factors that became known to the Board after that date.
Factors and Conclusions and Summary of Independent Written Fee Evaluation
| A. | Nature, Extent and Quality of Services Provided by Invesco Advisers and the Affiliated Sub-Advisers |
The Board reviewed the advisory services provided to the Fund by Invesco Advisers under the Fund’s investment advisory agreement, the performance of Invesco Advisers in providing these services, and the credentials and experience of the officers and employees of Invesco Advisers who provide these services, including the Fund’s portfolio manager or managers. The Board’s review included consideration of Invesco Advisers’ investment process oversight, credit analysis and investment risk management. The Board also considered non-advisory services that Invesco Advisers and its affiliates provide to the Invesco Funds such as various back office support functions, trading operations, internal audit, valuation and legal and compliance.
In determining whether to continue the Fund’s investment advisory agreement, the Board considered the benefits of reapproving an
existing relationship as contrasted with the greater uncertainty that may be associated with entering into a new relationship. The Board concluded that the nature, extent and quality of the services provided to the Fund by Invesco Advisers are appropriate and satisfactory.
The Board reviewed the services that may be provided by the Affiliated Sub-Advisers under the sub-advisory contracts and the credentials and experience of the officers and employees of the Affiliated Sub-Advisers who provide these services. The Board noted that the Affiliated Sub-Advisers have offices and personnel that are located in financial centers around the world. As a result, the Board noted that the Affiliated Sub-Advisers can provide research and investment analysis on the markets and economies of various countries in which the Fund may invest, make recommendations regarding securities and assist with security trades. The Board concluded that the sub-advisory contracts may benefit the Fund and its shareholders by permitting Invesco Advisers to use the resources and talents of the Affiliated Sub-Advisers in managing the Fund. The Board concluded that the nature, extent and quality of the services that may be provided by the Affiliated Sub-Advisers are appropriate and satisfactory.
| B. | Fund Investment Performance |
The Board considered Fund investment performance as a relevant factor in considering whether to approve the investment advisory agreement. The Board did not view Fund performance as a relevant factor in considering whether to approve the sub-advisory contracts for the Fund, as no Affiliated Sub-Adviser currently manages assets of the Fund.
The Board compared the Fund’s investment performance over multiple time periods ending December 31, 2016 to the performance of funds in the Broadridge performance universe and against the Lipper Global Health/Biotechnology Funds Index. The Board noted that performance of Class A shares of the Fund was in the third quintile of its performance universe for the one year period, fifth quintile for the three year period and fourth quintile for the five year period (the first quintile being the best performing funds and the fifth quintile being the worst performing funds). The Board noted that performance of Class A shares of the Fund was below the performance of the Index for the one, three and five year periods. The Trustees also reviewed more recent Fund performance and this review did not change their conclusions.
| C. | Advisory and Sub-Advisory Fees |
The Board compared the Fund’s contractual management fee rate to the contractual management fee rates of funds in the Fund’s Broadridge expense group at a common asset level. The Board noted that the contractual management fee rate for Class A shares of the
24 Invesco Global Health Care Fund
Fund was below the median contractual management fee rate of funds in its expense group. The Board noted that the term “contractual management fee” for funds in the expense group may include both advisory and certain administrative services fees, but that Broadridge does not provide information on a fund by fund basis as to what is included. The Board noted that Invesco Advisers does not separately charge the Invesco Funds for the administrative services included in the term as defined by Broadridge. The Board also reviewed the methodology used by Broadridge in providing expense group information, which includes using each fund’s contractual management fee schedule (including any applicable breakpoints) as reported in the most recent prospectus or statement of additional information for each fund in the expense group.
The Board also compared the Fund’s effective advisory fee rate (the advisory fee rate after advisory fee waivers and before other expense limitations/waivers) to the effective advisory fee rates of other mutual funds advised by Invesco Advisers and its affiliates with investment strategies comparable to those of the Fund, based on asset balances as of December 31, 2016. The Board noted that the Fund’s rate was below the effective advisory fee rate of one off-shore fund advised by Invesco Advisers. The Board noted that Invesco Advisers and the Affiliated Sub-Advisers do not manage other client accounts with investment strategies comparable to those of the Fund.
The Board also considered the services that may be provided by the Affiliated Sub-Advisers pursuant to the sub-advisory contracts, as well as the fees payable by Invesco Advisers to the Affiliated Sub-Advisers pursuant to the sub-advisory contracts. The Board also noted that the sub-advisory fees are not paid directly by the Fund, but rather, are payable by Invesco Advisers to the Affiliated Sub-Advisers.
| D. | Economies of Scale and Breakpoints |
The Board considered the extent to which there are economies of scale in the provision of advisory services to the Fund. The Board also considered that the Fund benefits from economies of scale through contractual breakpoints in the Fund’s advisory fee schedule. The Board noted that the Fund shares directly in economies of scale through lower fees charged by third party service providers based on the combined size of the Invesco Funds advised by Invesco Advisers.
| E. | Profitability and Financial Resources |
The Board reviewed information from Invesco Advisers concerning the costs of the advisory and other services that Invesco Advisers and its affiliates provide to the Fund and the Invesco Funds and the profitability of Invesco Advisers and its affiliates in providing these services. The Board noted that Invesco Advisers continues to operate at a net profit from services Invesco Advisers and its affiliates provide to the Invesco Funds and the Fund. The Board did not deem the level of profits realized by Invesco Advisers and its affiliates from providing services to the Fund
to be excessive given the nature, quality and extent of the services provided. The Board received and accepted information from Invesco Advisers demonstrating that Invesco Advisers and each Affiliated Sub-Adviser are financially sound and have the resources necessary to perform their obligations under the investment advisory agreement and sub-advisory contracts.
| F. | Collateral Benefits to Invesco Advisers and its Affiliates |
The Board considered various other benefits received by Invesco Advisers and its affiliates from the relationship with the Fund, including the fees received for providing transfer agency and distribution services to the Fund. The Board considered comparative information regarding fees charged for these services, including information provided by Broadridge and other independent sources. The Board considered the performance of Invesco Advisers and its affiliates in providing these services and the organizational structure employed to provide these services. The Board also considered that these services are provided to the Fund pursuant to written contracts that are reviewed and approved on an annual basis by the Board; and that the services are required for the operation of the Fund.
The Board considered the benefits realized by Invesco Advisers and the Affiliated Sub-Advisers as a result of portfolio brokerage transactions executed through “soft dollar” arrangements. The Board noted that soft dollar arrangements may result in the Fund bearing costs to purchase research that may be used by Invesco Advisers or the Affiliated Sub-Advisers with other clients and may reduce Invesco Advisers’ or the Affiliated Sub-Advisers’ expenses. The Board also considered that it receives periodic reports from the Chief Compliance Officer of the Invesco Funds demonstrating that these arrangements are consistent with regulatory requirements. The Board did not deem the soft dollar arrangements to be inappropriate.
The Board considered that the Fund’s uninvested cash and cash collateral from any securities lending arrangements may be invested in money market funds advised by Invesco Advisers pursuant to procedures approved by the Board. The Board noted that Invesco Advisers receives advisory fees from these affiliated money market funds attributable to such investments, although Invesco Advisers has contractually agreed to waive through varying periods the advisory fees payable by the Invesco Funds with respect to certain investments in the affiliated money market funds. The waiver is in an amount equal to 100% of the net advisory fee Invesco Advisers receives from the affiliated money market funds with respect to the Fund’s investment in the affiliated money market funds of uninvested cash, but not cash collateral. The Board concluded that the amount of advisory fees received by Invesco Advisers from the Fund’s investment of cash collateral from any securities lending arrangements in the affiliated money market funds is fair and reasonable.
The Board also considered that the Fund may use an affiliated broker to execute certain trades for the Fund to, among other things, control information leakage, and was advised that such trades would be executed in compliance with rules under the federal securities laws and consistent with best execution obligations.
25 Invesco Global Health Care Fund
Tax Information
Form 1099-DIV, Form 1042-S and other year-end tax information provide shareholders with actual calendar year amounts that should be included in their tax returns. Shareholders should consult their tax advisors.
The following distribution information is being provided as required by the Internal Revenue Code or to meet a specific state’s requirement.
The Fund designates the following amounts or, if subsequently determined to be different, the maximum amount allowable for its fiscal year ended October 31, 2017:
| | | | |
Federal and State Income Tax | |
Long-Term Capital Gain Distributions | | $ | 30,787,783 | |
Qualified Dividend Income* | | | 100 | % |
Corporate Dividends Received Deduction* | | | 100 | % |
U.S. Treasury Obligations* | | | 0 | % |
| | * | The above percentages are based on ordinary income dividends paid to shareholders during the Fund’s fiscal year. |
26 Invesco Global Health Care Fund
Trustees and Officers
The address of each trustee and officer is AIM Investment Funds (Invesco Investment Funds) (the “Trust”), 11 Greenway Plaza, Suite 1000, Houston, Texas 77046-1173. The trustees serve for the life of the Trust, subject to their earlier death, incapacitation, resignation, retirement or removal as more specifically provided in the Trust’s organizational documents. Each officer serves for a one year term or until their successors are elected and qualified. Column two below includes length of time served with predecessor entities, if any.
| | | | | | | | |
Name, Year of Birth and Position(s) Held with the Trust | | Trustee and/
or Officer Since | | Principal Occupation(s)
During Past 5 Years | | Number of
Funds in Fund
Complex
Overseen by
Trustee | | Other Directorship(s)
Held by Trustee During Past 5 Years |
| Interested Persons | | | | | | | | |
| Martin L. Flanagan1 — 1960 Trustee | | 2007 | | Executive Director, Chief Executive Officer and President, Invesco Ltd. (ultimate parent of Invesco and a global investment management firm); Trustee, The Invesco Funds; Vice Chair, Investment Company Institute; and Member of Executive Board, SMU Cox School of Business Formerly: Advisor to the Board, Invesco Advisers, Inc. (formerly known as Invesco Institutional (N.A.), Inc.); Chairman and Chief Executive Officer, Invesco Advisers, Inc. (registered investment adviser); Director, Chairman, Chief Executive Officer and President, Invesco Holding Company (US), Inc. (formerly IVZ Inc.) (holding company), Invesco Group Services, Inc. (service provider) and Invesco North American Holdings, Inc. (holding company); Director, Chief Executive Officer and President, Invesco Holding Company Limited (parent of Invesco and a global investment management firm); Director, Invesco Ltd.; Chairman, Investment Company Institute and President, Co-Chief Executive Officer, Co-President, Chief Operating Officer and Chief Financial Officer, Franklin Resources, Inc. (global investment management organization) | | 158 | | None |
Philip A. Taylor2 — 1954 Trustee and Senior Vice President | | 2006 | | Head of the Americas and Senior Managing Director, Invesco Ltd.; Director, Invesco Advisers, Inc. (formerly known as Invesco Institutional (N.A.), Inc.) (registered investment adviser); Director, Chairman, Chief Executive Officer and President, Invesco Management Group, Inc. (formerly known as Invesco Aim Management Group, Inc.) (financial services holding company); Director and Chairman, Invesco Investment Services, Inc. (formerly known as Invesco Aim Investment Services, Inc.) (registered transfer agent); Chief Executive Officer, Invesco Corporate Class Inc. (corporate mutual fund company); Director, Chairman and Chief Executive Officer, Invesco Canada Ltd. (formerly known as Invesco Trimark Ltd./Invesco Trimark Ltèe) (registered investment adviser and registered transfer agent); Trustee and Senior Vice President, The Invesco Funds; Director, Invesco Investment Advisers LLC (formerly known as Van Kampen Asset Management). Formerly: Co-Chairman, Co-President and Co-Chief Executive Officer, Invesco Advisers, Inc. (formerly known as Invesco Institutional (N.A.), Inc.) (registered investment adviser); Director, Chief Executive Officer and President, Van Kampen Exchange Corp; President and Principal Executive Officer, The Invesco Funds (other than AIM Treasurer’s Series Trust (Invesco Treasurer’s Series Trust), Short-Term Investments Trust and Invesco Management Trust); Executive Vice President, The Invesco Funds (AIM Treasurer’s Series Trust (Invesco Treasurer’s Series Trust), Short-Term Investments Trust and Invesco Management Trust only); Director and President, INVESCO Funds Group, Inc. (registered investment adviser and registered transfer agent); Director and Chairman, IVZ Distributors, Inc. (formerly known as INVESCO Distributors, Inc.) (registered broker dealer); Director, President and Chairman, Invesco Inc. (holding company), Invesco Canada Holdings Inc. (holding company), Trimark Investments Ltd./Placements Trimark Ltèe and Invesco Financial Services Ltd/Services Financiers Invesco Ltèe; Chief Executive Officer, Invesco Canada Fund Inc. (corporate mutual fund company); Director and Chairman, Van Kampen Investor Services Inc.; Director, Chief Executive Officer and President, 1371 Preferred Inc. (holding company) and Van Kampen Investments Inc.; Director and President, AIM GP Canada Inc. (general partner for limited partnerships) and Van Kampen Advisors, Inc.; Director and Chief Executive Officer, Invesco Trimark Dealer Inc. (registered broker dealer); Director, Invesco Distributors, Inc. (formerly known as Invesco Aim Distributors, Inc.) (registered broker dealer); Manager, Invesco PowerShares Capital Management LLC; Director, Chief Executive Officer and President, Invesco Advisers, Inc.; Director, Chairman, Chief Executive Officer and President, Invesco Aim Capital Management, Inc.; President, Invesco Trimark Dealer Inc. and Invesco Trimark Ltd./Invesco Trimark Ltèe; Director and President, AIM Trimark Corporate Class Inc. and AIM Trimark Canada Fund Inc.; Senior Managing Director, Invesco Holding Company Limited; Director and Chairman, Fund Management Company (former registered broker dealer); President and Principal Executive Officer, The Invesco Funds (AIM Treasurer’s Series Trust (Invesco Treasurer’s Series Trust), and Short-Term Investments Trust only); President, AIM Trimark Global Fund Inc. and AIM Trimark Canada Fund Inc. | | 158 | | None |
| 1 | Mr. Flanagan is considered an interested person (within the meaning of Section 2(a)(19) of the 1940 Act) of the Trust because he is an officer of the Adviser to the Trust, and an officer and a director of Invesco Ltd., ultimate parent of the Adviser. |
| 2 | Mr. Taylor is considered an interested person (within the meaning of Section 2(a)(19) of the 1940 Act) of the Trust because he is an officer and a director of the Adviser. |
T-1 Invesco Global Health Care Fund
Trustees and Officers—(continued)
| | | | | | | | |
Name, Year of Birth and Position(s) Held with the Trust | | Trustee and/
or Officer Since | | Principal Occupation(s) During Past 5 Years | | Number of
Funds in Fund
Complex
Overseen by
Trustee | | Other Directorship(s)
Held by Trustee During Past 5 Years |
| Independent Trustees | | | | | | | | |
Bruce L. Crockett — 1944 Trustee and Chair | | 2001 | | Chairman, Crockett Technologies Associates (technology consulting company) Formerly: Director, Captaris (unified messaging provider); Director, President and Chief Executive Officer, COMSAT Corporation; Chairman, Board of Governors of INTELSAT (international communications company); ACE Limited (insurance company); Independent Directors Council and Investment Company Institute: Member of the Audit Committee, Investment Company Institute; Member of the Executive Committee and Chair of the Governance Committee, Independent Directors Council | | 158 | | Director and Chairman of the Audit Committee, ALPS (Attorneys Liability Protection Society) (insurance company); Director and Member of the Audit Committee, Ferroglobe PLC (metallurgical company) |
David C. Arch — 1945 Trustee | | 2010 | | Chairman of Blistex Inc. (consumer health care products manufacturer); Member, World Presidents’ Organization | | 158 | | Board member of the Illinois Manufacturers’ Association |
James T. Bunch — 1942 Trustee | | 2003 | | Managing Member, Grumman Hill Group LLC (family office/private equity investments) Formerly: Chairman of the Board, Denver Film Society; Chairman of the Board of Trustees, Evans Scholarship Foundation; Chairman, Board of Governors, Western Golf Association | | 158 | | Trustee, Evans Scholarship Foundation |
Jack M. Fields —��1952 Trustee | | 2001 | | Chief Executive Officer, Twenty First Century Group, Inc. (government affairs company); and Discovery Learning Alliance (non-profit) Formerly: Owner and Chief Executive Officer, Dos Angeles Ranch L.P. (cattle, hunting, corporate entertainment); Director, Insperity, Inc. (formerly known as Administaff) (human resources provider); Chief Executive Officer, Texana Timber LP (sustainable forestry company); Director of Cross Timbers Quail Research Ranch (non-profit); and member of the U.S. House of Representatives | | 158 | | None |
Cynthia Hostetler — 1962 Trustee | | 2017 | | Non-Executive Director and Trustee of a number of public and private business corporations Formerly: Head of Investment Funds and Private Equity, Overseas Private Investment Corporation; President, First Manhattan Bancorporation, Inc.; Attorney, Simpson Thacher & Bartlett LLP | | 158 | | Vulcan Materials Company (construction materials company); Trilinc Global Impact Fund; Aberdeen Investment Funds (4 portfolios); Artio Global Investment LLC (mutual fund complex); Edgen Group, Inc. (specialized energy and infrastructure products distributor) |
Eli Jones — 1961 Trustee | | 2016 | | Professor and Dean, Mays Business School — Texas A&M University Formerly: Professor and Dean, Walton College of Business, University of Arkansas and E.J. Ourso College of Business, Louisiana State University; Director, Arvest Bank | | 158 | | Insperity, Inc. (formerly known as Administaff) (human resources provider) |
Prema Mathai-Davis — 1950 Trustee | | 2001 | | Retired. Formerly: Chief Executive Officer, YWCA of the U.S.A. | | 158 | | None |
Teresa M. Ressel — 1962 Trustee | | 2017 | | Non-executive director and trustee of a number of public and private business corporations Formerly: Chief Financial Officer, Olayan America, The Olayan Group (international investor/commercial/industrial); Chief Executive Officer, UBS Securities LLC; Group Chief Operating Officer, Americas, UBS AG; Assistant Secretary for Management & Budget and CFO, US Department of the Treasury; Chief Compliance Officer, Kaiser Permanente (healthcare consortium); Program Manager, Hewlett-Packard; Nuclear Engineering, General Dynamics Corporation (aerospace and defense company) | | 158 | | Atlantic Power Corporation (power generation company); ON Semiconductor Corp. (semiconductor supplier) |
Larry Soll — 1942 Trustee | | 2003 | | Retired. Formerly: Chairman, Chief Executive Officer and President, Synergen Corp. (a biotechnology company) | | 158 | | None |
Ann Barnett Stern — 1957 Trustee | | 2017 | | President and Chief Executive Officer, Houston Endowment Inc. (private philanthropic institution) Formerly: Executive Vice President and General Counsel, Texas Children’s Hospital; Attorney, Beck, Redden and Secrest, LLP; Business Law Instructor, University of St. Thomas; Attorney, Andrews & Kurth LLP | | 158 | | Federal Reserve Bank of Dallas |
Raymond Stickel, Jr. — 1944 Trustee | | 2005 | | Retired. Formerly: Director, Mainstay VP Series Funds, Inc. (25 portfolios); Partner, Deloitte & Touche | | 158 | | None |
Robert C. Troccoli — 1949 Trustee | | 2016 | | Adjunct Professor, University of Denver — Daniels College of Business Formerly: Senior Partner, KPMG LLP | | 158 | | None |
T-2 Invesco Global Health Care Fund
Trustees and Officers—(continued)
| | | | | | | | |
Name, Year of Birth and Position(s) Held with the Trust | | Trustee and/
or Officer Since | | Principal Occupation(s) During Past 5 Years | | Number of
Funds in Fund
Complex
Overseen by
Trustee | | Other Directorship(s)
Held by Trustee During Past 5 Years |
| Independent Trustees—(continued) |
Christopher L. Wilson — 1957 Trustee | | 2017 | | Managing Partner, CT2, LLC (investing and consulting firm) Formerly: President/Chief Executive Officer, Columbia Funds, Bank of America Corporation; President/Chief Executive Officer, CDC IXIS Asset Management Services, Inc.; Principal & Director of Operations, Scudder Funds, Scudder, Stevens & Clark, Inc.; Assistant Vice President, Fidelity Investments | | 158 | | TD Asset Management USA Inc. (mutual fund complex) (22 portfolios); ISO New England, Inc. (non-profit organization managing regional electricity market) |
| Other Officers | | | | | | | | |
Sheri Morris — 1964 President, Principal Executive Officer and Treasurer | | 1999 | | President, Principal Executive Officer and Treasurer, The Invesco Funds; Vice President, Invesco Advisers, Inc. (formerly known as Invesco Institutional (N.A.), Inc.) (registered investment adviser); and Vice President, PowerShares Exchange-Traded Fund Trust, PowerShares Exchange-Traded Fund Trust II, PowerShares India Exchange-Traded Fund Trust, PowerShares Actively Managed Exchange-Traded Fund Trust and PowerShares Actively Managed Exchange-Traded Commodity Fund Trust Formerly: Vice President and Principal Financial Officer, The Invesco Funds; Vice President, Invesco Aim Advisers, Inc., Invesco Aim Capital Management, Inc. and Invesco Aim Private Asset Management, Inc.; Assistant Vice President and Assistant Treasurer, The Invesco Funds and Assistant Vice President, Invesco Advisers, Inc., Invesco Aim Capital Management, Inc. and Invesco Aim Private Asset Management, Inc.; and Treasurer, PowerShares Exchange-Traded Fund Trust, PowerShares Exchange-Traded Fund Trust II, PowerShares India Exchange-Traded Fund Trust and PowerShares Actively Managed Exchange-Traded Fund Trust | | N/A | | N/A |
Russell C. Burk — 1958 Senior Vice President and Senior Officer | | 2005 | | Senior Vice President and Senior Officer, The Invesco Funds | | N/A | | N/A |
John M. Zerr — 1962 Senior Vice President, Chief Legal Officer and Secretary | | 2006 | | Director, Senior Vice President, Secretary and General Counsel, Invesco Management Group, Inc. (formerly known as Invesco AIM Management Group, Inc.); Senior Vice President, Invesco Advisers, Inc. (formerly known as Invesco Institutional (N.A.), Inc.) (registered investment adviser); Senior Vice President and Secretary, Invesco Distributors, Inc. (formerly known as Invesco AIM Distributors, Inc.); Director, Vice President and Secretary, Invesco Investment Services, Inc. (formerly known as Invesco AIM Investment Services, Inc.) Senior Vice President, Chief Legal Officer and Secretary, The Invesco Funds; Managing Director, Invesco PowerShares Capital Management LLC; Director, Secretary and General Counsel, Invesco Investment Advisers LLC (formerly known as Van Kampen Asset Management); Secretary and General Counsel, Invesco Capital Markets, Inc. (formerly known as Van Kampen Funds Inc.) and Chief Legal Officer, PowerShares Exchange-Traded Fund Trust, PowerShares Exchange-Traded Fund Trust II, PowerShares India Exchange-Traded Fund Trust, PowerShares Actively Managed Exchange-Traded Fund Trust and PowerShares Actively Managed Exchange-Traded Commodity Fund Trust; Manager and Secretary, Invesco Indexing LLC Formerly: Director, Secretary, General Counsel and Senior Vice President, Van Kampen Exchange Corp.; Director, Vice President and Secretary, IVZ Distributors, Inc. (formerly known as INVESCO Distributors, Inc.); Director and Vice President, INVESCO Funds Group, Inc.; Director and Vice President, Van Kampen Advisors Inc.; Director, Vice President, Secretary and General Counsel, Van Kampen Investor Services Inc.; Director, Invesco Distributors, Inc. (formerly known as Invesco AIM Distributors, Inc.); Director, Senior Vice President, General Counsel and Secretary, Invesco AIM Advisers, Inc. and Van Kampen Investments Inc.; Director, Vice President and Secretary, Fund Management Company; Director, Senior Vice President, Secretary, General Counsel and Vice President, Invesco AIM Capital Management, Inc.; Chief Operating Officer and General Counsel, Liberty Ridge Capital, Inc. (an investment adviser); Vice President and Secretary, PBHG Funds (an investment company) and PBHG Insurance Series Fund (an investment company); Chief Operating Officer, General Counsel and Secretary, Old Mutual Investment Partners (a broker-dealer); General Counsel and Secretary, Old Mutual Fund Services (an administrator) and Old Mutual Shareholder Services (a shareholder servicing center); Executive Vice President, General Counsel and Secretary, Old Mutual Capital, Inc. (an investment adviser); and Vice President and Secretary, Old Mutual Advisors Funds (an investment company) | | N/A | | N/A |
Gregory G. McGreevey — 1962 Senior Vice President | | 2012 | | Senior Managing Director, Invesco Ltd.; Director, Chairman, President, and Chief Executive Officer, Invesco Advisers, Inc. (formerly known as Invesco Institutional (N.A.), Inc.) (registered investment adviser); Senior Vice President, Invesco Management Group, Inc.; Director, Invesco Mortgage Capital, Inc. and Invesco Senior Secured Management, Inc.; and Senior Vice President, The Invesco Funds Formerly: Assistant Vice President, The Invesco Funds | | N/A | | N/A |
T-3 Invesco Global Health Care Fund
Trustees and Officers—(continued)
| | | | | | | | |
Name, Year of Birth and Position(s) Held with the Trust | | Trustee and/
or Officer Since | | Principal Occupation(s) During Past 5 Years | | Number of
Funds in Fund
Complex
Overseen by
Trustee | | Other Directorship(s)
Held by Trustee During Past 5 Years |
| Other Officers—(continued) | | | | | | | | |
Kelli Gallegos — 1970 Vice President, Principal Financial Officer and Assistant Treasurer | | 2008 | | Vice President, Principal Financial Officer and Assistant Treasurer, The Invesco Funds; Assistant Treasurer, Invesco PowerShares Capital Management LLC, PowerShares Exchange-Traded Fund Trust, PowerShares Exchange-Traded Fund Trust II, PowerShares India Exchange-Traded Fund Trust, PowerShares Actively Managed Exchange-Traded Fund Trust and PowerShares Actively Managed Exchange-Traded Commodity Fund Trust Formerly: Assistant Vice President, The Invesco Funds | | N/A | | N/A |
Tracy Sullivan — 1962 Vice President, Chief Tax Officer and Assistant Treasurer | | 2008 | | Vice President, Chief Tax Officer and Assistant Treasurer, The Invesco Funds; Assistant Treasurer, Invesco PowerShares Capital Management LLC, PowerShares Exchange-Traded Fund Trust, PowerShares Exchange-Traded Fund Trust II, PowerShares India Exchange-Traded Fund Trust, PowerShares Actively Managed Exchange-Traded Fund Trust and PowerShares Actively Managed Exchange-Traded Commodity Fund Trust Formerly: Assistant Vice President, The Invesco Funds | | N/A | | N/A |
Crissie M. Wisdom — 1969 Anti-Money Laundering Compliance Officer | | 2013 | | Anti-Money Laundering Compliance Officer, Invesco Advisers, Inc. (formerly known as Invesco Institutional (N.A.), Inc.) (registered investment adviser), Invesco Capital Markets, Inc. (formerly known as Van Kampen Funds Inc.), Invesco Distributors, Inc., Invesco Investment Services, Inc., Invesco Management Group, Inc., The Invesco Funds, and PowerShares Exchange-Traded Fund Trust, PowerShares Exchange-Traded Fund Trust II, PowerShares India Exchange-Traded Fund Trust, PowerShares Actively Managed Exchange-Traded Fund Trust and PowerShares Actively Managed Exchange-Traded Commodity Fund Trust; Anti-Money Laundering Compliance Officer and Bank Secrecy Act Officer, INVESCO National Trust Company and Invesco Trust Company; and Fraud Prevention Manager and Controls and Risk Analysis Manager for Invesco Investment Services, Inc. Formerly: Anti-Money Laundering Compliance Officer, Van Kampen Exchange Corp. | | N/A | | N/A |
Robert R. Leveille — 1969 Chief Compliance Officer | | 2016 | | Chief Compliance Officer, Invesco Advisers, Inc. (registered investment adviser); and Chief Compliance Officer, The Invesco Funds Formerly: Chief Compliance Officer, Putnam Investments and the Putnam Funds | | N/A | | N/A |
The Statement of Additional Information of the Trust includes additional information about the Fund’s Trustees and is available upon request, without charge, by calling 1.800.959.4246. Please refer to the Fund’s Statement of Additional Information for information on the Fund’s sub-advisers.
| | | | | | |
Office of the Fund 11 Greenway Plaza, Suite 1000 Houston, TX 77046-1173 | | Investment Adviser Invesco Advisers, Inc. 1555 Peachtree Street, N.E. Atlanta, GA 30309 | | Distributor Invesco Distributors, Inc. 11 Greenway Plaza, Suite 1000 Houston, TX 77046-1173 | | Auditors PricewaterhouseCoopers LLP 1000 Louisiana Street, Suite 5800 Houston, TX 77002-5678 |
| | | |
| | | | | | |
Counsel to the Fund Stradley Ronon Stevens & Young, LLP 2005 Market Street, Suite 2600 Philadelphia, PA 19103-7018 | | Counsel to the Independent Trustees Goodwin Procter LLP 901 New York Avenue, N.W. Washington, D.C. 20001 | | Transfer Agent Invesco Investment Services, Inc. 11 Greenway Plaza, Suite 1000 Houston, TX 77046-1173 | | Custodian State Street Bank and Trust Company 225 Franklin Street Boston, MA 02110-2801 |
T-4 Invesco Global Health Care Fund
Explore High-Conviction Investing with Invesco

Go paperless with eDelivery
Visit invesco.com/edelivery to enjoy the convenience and security of anytime electronic access to your investment documents.
With eDelivery, you can elect to have any or all of the following materials delivered straight to your inbox to download, save and print from your own computer:
| ∎ | | Fund reports and prospectuses |
Invesco mailing information
Send general correspondence to Invesco Investment Services, Inc., P.O. Box 219078, Kansas City, MO 64121-9078.
Important notice regarding delivery of security holder documents
To reduce Fund expenses, only one copy of most shareholder documents may be mailed to shareholders with multiple accounts at the same address (Householding). Mailing of your shareholder documents may be householded indefinitely unless you instruct us otherwise. If you do not want the mailing of these documents to be combined with those for other members of your household, please contact Invesco Investment Services, Inc. at 800 959 4246 or contact your financial institution. We will begin sending you individual copies for each account within 30 days after receiving your request.
Fund holdings and proxy voting information
The Fund provides a complete list of its holdings four times in each fiscal year, at the quarter ends. For the second and fourth quarters, the lists appear in the Fund’s semiannual and annual reports to shareholders. For the first and third quarters, the Fund files the lists with the Securities and Exchange Commission (SEC) on Form N-Q. The most recent list of portfolio holdings is available at invesco.com/completeqtrholdings. Shareholders can also look up the Fund’s Forms N-Q on the SEC website at sec.gov. Copies of the Fund’s Forms N-Q may be reviewed and copied at the SEC Public Reference Room in Washington, D.C. You can obtain information on the operation of the Public Reference Room, including information about duplicating fee charges, by calling 202 551 8090 or 800 732 0330, or by electronic request at the following email address: publicinfo@sec.gov. The SEC file numbers for the Fund are shown below.
A description of the policies and procedures that the Fund uses to determine how to vote proxies relating to portfolio securities is available without charge, upon request, from our Client Services department at 800 959 4246 or at invesco.com/proxyguidelines. The information is also available on the SEC website, sec.gov.
| | |
Information regarding how the Fund voted proxies related to its portfolio securities during the most recent 12-month period ended June 30 is available at invesco.com/proxysearch. The information is also available on the SEC website, sec.gov. Invesco Advisers, Inc. is an investment adviser; it provides investment advisory services to individual and institutional clients and does not sell securities. Invesco Distributors, Inc. is the US distributor for Invesco Ltd.’s retail mutual funds, exchange-traded funds and institutional money market funds. Both are wholly owned, indirect subsidiaries of Invesco Ltd. | |  |
| | | | |
| SEC file numbers: 811-05426 and 033-19338 | | Invesco Distributors, Inc. | | GHC-AR-1 12112017 1423 |

Letters to Shareholders
| | | | |

Philip Taylor | | | | Dear Shareholders: This annual report includes information about your Fund, including performance data and a complete list of its investments as of the close of the reporting period. Inside is a discussion of how your Fund was managed and the factors that affected its performance during the reporting period. American voters went to the polls just days after the start of the reporting period, and their decisions quickly affected markets. The US stock market rallied strongly after the election, with major market indexes rising, and setting record highs, throughout the reporting period. Generally positive economic data, strong corporate earnings and hope for tax and regulatory reform contributed to the rally. US and global bond markets, as well as emerging market equities, sold off immediately following the election – with the US bond market eventually recovering most of its losses. Overseas, economic data were mixed, prompting the European |
Central Bank and central banks in China and Japan, among other countries, to maintain extraordinarily accommodative monetary policies. Citing positive economic trends – specifically, realized and expected labor market conditions and inflation – the US Federal Reserve raised interest rates three times during the reporting period: first in December 2016, and then again in March and June 2017. Health care and tax reform proved to be more difficult than expected to enact, with little progress achieved by the end of the reporting period.
Short-term market volatility can prompt some investors to abandon their investment plans – and can cause others to settle for whatever returns the market has to offer. The investment professionals at Invesco, in contrast, invest with high conviction. This means that, no matter the asset class or the strategy, each investment team has a passion to exceed. We want to help investors achieve better outcomes, such as seeking higher returns, helping mitigate risk and generating income. Of course, investing with high conviction can’t guarantee a profit or ensure success; no investment strategy can. To learn more about how we invest with high conviction, visit invesco.com/HighConviction.
You, too, can invest with high conviction by maintaining a long-term investment perspective and by working with your financial adviser on a regular basis. During periods of short-term market volatility or uncertainty, your financial adviser can keep you focused on your long-term investment goals – a new home, a child’s college education or a secure retirement. He or she also can share research about the economy, the markets and individual investment options.
Visit our website for more information on your investments
Our website, invesco.com/us, offers a wide range of market insights and investment perspectives. On the website, you’ll find detailed information about our funds, including performance, holdings and portfolio manager commentaries. You can access information about your account by completing a simple, secure online registration. To do so, select “Log In” on the right side of the homepage, and then select “Register for Individual Account Access.”
In addition to the resources accessible on our website and through our mobile app, you can obtain timely updates to help you stay informed about the markets and the economy by connecting with Invesco on Twitter, LinkedIn or Facebook. You can access our blog at blog.invesco.us.com. Our goal is to provide you the information you want, when and where you want it.
Finally, I’m pleased to share with you Invesco’s commitment to both the Principles for Responsible Investment and to considering environmental, social and governance issues in our robust investment process. I invite you to learn more at invesco.com/esg.
Have questions?
For questions about your account, contact an Invesco client services representative at 800 959 4246. For Invesco-related questions or comments, please email me directly at phil@invesco.com.
All of us at Invesco look forward to serving your investment management needs. Thank you for investing with us.
Sincerely,

Philip Taylor
Senior Managing Director, Invesco Ltd.
|
| 2 Invesco Global Infrastructure Fund |
| | | | |

Bruce Crockett | | | | Dear Fellow Shareholders: Among the many important lessons I’ve learned in more than 40 years in a variety of business endeavors is the value of a trusted advocate. As independent chair of the Invesco Funds Board, I can assure you that the members of the Board are strong advocates for the interests of investors in Invesco’s mutual funds. We work hard to represent your interests through oversight of the quality of the investment management services your funds receive and other matters important to your investment, including but not limited to: ∎ Ensuring that Invesco offers a diverse lineup of mutual funds that your financial adviser can use to strive to meet your financial needs as your investment goals change over time. ∎ Monitoring how the portfolio management teams of the Invesco funds are performing in light of changing economic and market conditions. |
| ∎ | | Assessing each portfolio management team’s investment performance within the context of the investment strategy described in the fund’s prospectus. |
| ∎ | | Monitoring for potential conflicts of interests that may impact the nature of the services that your funds receive. |
We believe one of the most important services we provide our fund shareholders is the annual review of the funds’ advisory and sub-advisory contracts with Invesco Advisers and its affiliates. This review is required by the Investment Company Act of 1940 and focuses on the nature and quality of the services Invesco provides as the adviser to the Invesco funds and the reasonableness of the fees that it charges for those services. Each year, we spend months carefully reviewing information received from Invesco and a variety of independent sources, such as performance and fee data prepared by Lipper, Inc. (a subsidiary of Broadridge Financial Solutions, Inc.), an independent, third-party firm widely recognized as a leader in its field. We also meet with our independent legal counsel and other independent advisers to review and help us assess the information that we have received. Our goal is to assure that you receive quality investment management services for a reasonable fee.
I trust the measures outlined above provide assurance that you have a worthy advocate when it comes to choosing the Invesco Funds.
As always, please contact me at bruce@brucecrockett.com with any questions or concerns you may have. On behalf of the Board, we look forward to continuing to represent your interests and serving your needs.
Sincerely,

Bruce L. Crockett
Independent Chair
Invesco Funds Board of Trustees
|
| 3 Invesco Global Infrastructure Fund |
Management’s Discussion of Fund Performance
Performance summary
For the fiscal year ended October 31, 2017, Class A shares of Invesco Global Infrastructure Fund (the Fund), at net asset value (NAV), outperformed the Fund’s style-specific benchmark, the Dow Jones Brookfield Global Infrastructure Index.
Your Fund’s long-term performance appears later in this report.
Fund vs. Indexes
Total returns, 10/31/16 to 10/31/17, at net asset value (NAV). Performance shown does not include applicable contingent deferred sales charges (CDSC) or front-end sales charges, which would have reduced performance.
| | | | | |
| Class A Shares | | | | 13.74 | % |
| Class C Shares | | | | 12.92 | |
| Class R Shares | | | | 13.47 | |
| Class Y Shares | | | | 14.02 | |
| Class R5 Shares | | | | 14.02 | |
| Class R6 Shares | | | | 14.02 | |
| MSCI World Index▼ (Broad Market Index) | | | | 22.77 | |
| Dow Jones Brookfield Global Infrastructure Index▼ (Style-Specific Index) | | | | 12.66 | |
| Lipper Global Infrastructure Funds Classification Average∎ (Peer Group) | | | | 14.07 | |
Source(s): ▼FactSet Research Systems Inc.; ∎Lipper, Inc. | | | | | |
Market conditions and your Fund
The reporting period began with major US stock market indexes posting gains and most hitting record highs following the US presidential election. Investors believed that the new administration’s plans to reduce tax rates, scale back regulations and increase infrastructure spending had the potential to stimulate economic growth. However, that was called into question in the first quarter of 2017, when it appeared that enacting significant regulatory and tax reform might be more difficult than previously anticipated.
Outside the US, Brexit (the UK’s plan to leave the European Union) remained a source of political and economic uncertainty, while improved economic data and confidence surveys raised the prospect of less accommodative monetary policy in continental Europe. In Asia, increased exports helped Japan’s economy, while China’s economy continued to stabilize. Most emerging markets performed well
during the reporting period. In addition to an improving global economic outlook, other positive tailwinds for international markets included continued weakness in the US dollar and reduced expectations for a major shift in US trade policy.
Interestingly, while 2017 marked the eighth year of the global bull market, we saw a shift in leadership as international stocks outperformed US stocks in the first three quarters of 2017. International stocks had trailed US stocks for four consecutive years and in six of the last seven years. As the reporting period came to a close, we believed both developed and emerging equity markets appeared somewhat fully valued despite material discounts to the US market. In addition, recent earnings growth and earnings revision trends improved for many non-US developed markets.
In general, global infrastructure stocks – which are heavily concentrated in the energy and utilities sectors – produced positive returns but underperformed broad market equities during the
reporting period. The Fund also produced positive returns and, at NAV, outperformed its style-specific benchmark, due to a combination of security selection and market allocation.
Relative to the Fund’s style-specific benchmark, security selection contributed to the Fund’s performance in the following infrastructure sectors: electric utilities, midstream services, telecom, airports, ports, gas distribution and diversified. Additionally, underweight allocations in the electric utilities, airports and ports infrastructure sectors, as well as overweight allocations in the telecom and diversified infrastructure sectors, added to the Fund’s relative performance. Conversely, security selection in the satellites, tolls, water and rail infrastructure sectors detracted from the Fund’s relative performance. Additionally, overweight allocation in the satellites infrastructure sector and exposure to ancillary cash were also detractors from the Fund’s relative performance.
Top individual contributors to the Fund’s absolute performance included American Tower, SBA Communications and Vinci. Both American Tower and SBA Communications are owners/operators of wireless infrastructure, and both are structured as real estate investment trusts. Both companies reported favorable earnings during the reporting period and raised their guidance for the full 2017 calendar year. We believed telecom companies were favorably positioned from a fundamental standpoint, with positive cash flow growth and strong demand due to the continued adoption of smartphones. Vinci is a global company involved in every step of infrastructure from finance and design to buildout and daily operations. During the fiscal year, Vinci completed a number of acquisitions and was awarded a number of new projects, including concession agreements at
| | | | | |
| Portfolio Composition | | |
By infrastructure sector | % of total net assets |
| | | | | |
| Midstream Services | | | | 24.2 | % |
| Gas Utilities | | | | 18.3 | |
| Telecom | | | | 18.3 | |
| Diversified | | | | 7.7 | |
| Water | | | | 7.1 | |
| Tolls | | | | 6.5 | |
| Electric Utilities | | | | 6.4 | |
| Airports | | | | 4.9 | |
| Rail | | | | 3.2 | |
| Ports & Satellites | | | | 2.7 | |
Money Market Funds Plus Other Assets Less Liabilities | | | | 0.8 | |
| | | | | |
| Top 10 Equity Holdings* |
% of total net assets |
| | | | | |
1. American Tower Corp.-Class A | | | | 7.6 | % |
2. Enbridge Inc. | | | | 7.3 | |
3. Sempra Energy | | | | 5.6 | |
4. Crown Castle International Corp. | | | | 5.2 | |
5. Vinci S.A. | | | | 4.8 | |
6. Pembina Pipeline Corp. | | | | 4.1 | |
7. Williams Cos., Inc. (The) | | | | 3.8 | |
8. PG&E Corp. | | | | 3.0 | |
9. Severn Trent PLC | | | | 3.0 | |
10. Cheniere Energy, Inc. | | | | 2.9 | |
| | | | | |
Total Net Assets | | | $ | 22.1 million | |
| |
Total Number of Holdings* | | | | 62 | |
The Fund’s holdings are subject to change, and
there is no assurance that the Fund will continue to hold any particular security.
*Excluding money market fund holdings.
Data presented here are as of October 31, 2017.
|
| 4 Invesco Global Infrastructure Fund |
airports in France and Japan, pipeline construction in Australia, plumbing installations in a Belgium hospital and an office skyline building in Warsaw.
Although our position in the midstream services infrastructure sector added to the Fund’s relative performance, select holdings, including Enbridge and Kinder Morgan, were the largest detractors from the Fund’s absolute performance. The companies detracted due to volatility in the energy sector. In general, we believed the lifting of the US crude oil export ban would be beneficial in the long term for continued US midstream infrastructure buildout. During the reporting period, we also found the growth characteristics for the midstream services infrastructure sector to be relatively attractive and anticipated an increase in US energy production in 2017 and 2018. This increase in volume would be beneficial for midstream services companies, which tend to be influenced more by the volume of energy, rather than by the price.
SES, a Luxembourg-domiciled provider of satellite communications and broadcasting services, was also among the top detractors from the Fund’s absolute performance. During the third quarter of 2017, SES reported a decrease in its revenue and profit margin. We continued to hold the stock as we believed in its long term value and cash flow generating capabilities. The SES Video division, which represents a significant portion of the company, renewed a multi-year contract with Sky Deutschland (not a Fund holding) in Germany during the reporting period. Additionally, SES has had a history of progressive dividend increases over each of the last 10 years.
At the close of the reporting period, the Fund held underweight allocations relative to its style-specific benchmark in the more regulated infrastructure sectors, mainly gas distribution and electric utilities. The Fund held overweight allocations in the more competitive and user-pay infrastructure sectors, such as telecom, rail, tolls and ports – where we believed the growth characteristics to be relatively attractive. The Fund remained focused on companies that we believed had above-average earnings growth characteristics, sound balance sheets and strategic infrastructure assets, providing a relatively stable underlying earnings stream.
As always, we thank you for your investment in Invesco Global Infrastructure Fund.
The views and opinions expressed in management’s discussion of Fund performance are those of Invesco Advisers, Inc. These views and opinions are subject to change at any time based on factors such as market and economic conditions. These views and opinions may not be relied upon as investment advice or recommendations, or as an offer for a particular security. The information is not a complete analysis of every aspect of any market, country, industry, security or the Fund. Statements of fact are from sources considered reliable, but Invesco Advisers, Inc. makes no representation or warranty as to their completeness or accuracy. Although historical performance is no guarantee of future results, these insights may help you understand our investment management philosophy.
See important Fund and, if applicable, index disclosures later in this report.
| | |
 | | Joe Rodriguez, Jr. |
| | Portfolio Manager, is lead manager of Invesco Global Infrastructure Fund. He is Head of Global Securities with |
| Invesco Real Estate, where he oversees all phases of the unit, including securities research and administration. Mr. Rodriguez joined Invesco in 1990. He earned a BBA in economics and finance and an MBA in finance from Baylor University. |
| | |

| | Mark Blackburn Chartered Financial Analyst, Portfolio Manager, is manager of Invesco Global Infrastructure Fund. He |
| joined Invesco in 1998. Mr. Blackburn earned a BS in accounting from Louisiana State University and an MBA from Southern Methodist University. He is also a Certified Public Accountant. |
| | |
 | | James Cowen Portfolio Manager, is manager of Invesco Global Infrastructure Fund. He joined Invesco in 2000. Mr. Cowen |
| earned a Master of Town and Country Planning degree from the University of Manchester and a Master of Philosophy degree in land economy from Cambridge University. |
| | |

| | Paul Curbo Chartered Financial Analyst, Portfolio Manager, is manager of Invesco Global Infrastructure Fund. He |
| joined Invesco in 1998. Mr. Curbo earned a BBA in finance from The University of Texas at Austin. |
| | |
 | | Darin Turner Portfolio Manager, is manager of Invesco Global Infrastructure Fund. He joined Invesco in 2005. |
| Mr. Turner earned a BBA in finance from Baylor University, an MS in real estate from The University of Texas at Arlington and an MBA specializing in investments from Southern Methodist University. |
| | |

| | Ping-Ying Wang Chartered Financial Analyst, Portfolio Manager, is manager of Invesco Global Infrastructure Fund. |
| She joined Invesco in 1998. Ms. Wang earned a BS in international finance from the People’s University of China and a PhD in finance from The University of Texas at Dallas. |
|
| 5 Invesco Global Infrastructure Fund |
Your Fund’s Long-Term Performance
Results of a $10,000 Investment – Oldest Share Class(es) since Inception
Fund and index data from 5/2/14
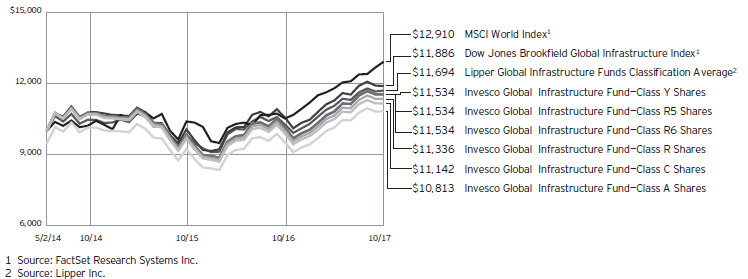
Past performance cannot guarantee comparable future results.
The data shown in the chart include reinvested distributions, applicable sales charges and Fund expenses including
management fees. Index results include reinvested dividends, but they do not reflect sales charges. Performance of the peer group, if applicable, reflects fund expenses and management fees; performance
of a market index does not. Performance shown in the chart and table(s) does not reflect deduction of taxes a shareholder would pay on Fund distributions or sale of Fund shares.
continued from page 9
About indexes used in this report
| ∎ | | The MSCI World IndexSM is an unmanaged index considered representative of stocks of developed countries. The index is computed using the net return, which withholds applicable taxes for non-resident investors. |
| ∎ | | The Dow Jones Brookfield Global Infrastructure Index is designed to measure the stock performance of infrastructure companies domiciled globally and covers all sectors of the infrastructure market. |
| ∎ | | The Lipper Global Infrastructure Funds Classification Average represents an average of all of the funds in the Lipper Global Infrastructure Funds classification. |
| ∎ | | The Fund is not managed to track the performance of any particular index, including the index(es) described here, and consequently, the performance of the Fund may deviate significantly from the performance of the index(es). |
| ∎ | | A direct investment cannot be made in an index. Unless otherwise indicated, index results include reinvested dividends, and they do not reflect sales |
| | | charges. Performance of the peer group, if applicable, reflects fund expenses; performance of a market index does not. |
Other information
| ∎ | | CPA® and Certified Public Accountant® are trademarks owned by the American Institute of Certified Public Accountants. |
| ∎ | | The returns shown in management’s discussion of Fund performance are based on net asset values (NAVs) calculated for shareholder transactions. Generally accepted accounting principles require adjustments to be made to the net assets of the Fund at period end for financial reporting purposes, and as such, the NAVs for shareholder transactions and the returns based on those NAVs may differ from the NAVs and returns reported in the Financial Highlights. |
|
| 6 Invesco Global Infrastructure Fund |
| | | | |
Average Annual Total Returns | |
| As of 10/31/17, including maximum applicable sales charges | |
| |
| Class A Shares | | | | |
| Inception (5/2/2014) | | | 2.26 | % |
| 1 Year | | | 7.48 | |
| |
| Class C Shares | | | | |
| Inception (5/2/2014) | | | 3.14 | % |
| 1 Year | | | 11.92 | |
| |
| Class R Shares | | | | |
| Inception (5/2/2014) | | | 3.65 | % |
| 1 Year | | | 13.47 | |
| |
| Class Y Shares | | | | |
| Inception (5/2/2014) | | | 4.16 | % |
| 1 Year | | | 14.02 | |
| |
| Class R5 Shares | | | | |
| Inception (5/2/2014) | | | 4.16 | % |
| 1 Year | | | 14.02 | |
| |
| Class R6 Shares | | | | |
| Inception (5/2/2014) | | | 4.16 | % |
| 1 Year | | | 14.02 | |
The performance data quoted represent past performance and cannot guarantee comparable future results; current performance may be lower or higher. Please visit invesco.com/performance for the most recent month-end performance. Performance figures reflect reinvested distributions, changes in net asset value and the effect of the maximum sales charge unless otherwise stated. Investment return and principal value will fluctuate so that you may have a gain or loss when you sell shares.
The net annual Fund operating expense ratio set forth in the most recent Fund prospectus as of the date of this report for Class A, Class C, Class R, Class Y, Class R5 and Class R6 shares was 1.28%, 2.03%, 1.53%, 1.03%, 1.03% and 1.03%, respectively.1 The total annual Fund operating expense ratio set forth in the most recent Fund prospectus as of the date of this report for Class A, Class C, Class R, Class Y, Class R5 and Class R6 shares was 4.29%, 5.04%, 4.54%, 4.04%, 4.02% and 4.02%, respectively. The expense ratios presented above may vary from the expense ratios presented in other sections of this report that are based on expenses incurred during the period covered by this report.
Class A share performance reflects the maximum 5.50% sales charge, and Class C share performance reflects the applicable contingent deferred sales
| | | | |
Average Annual Total Returns | |
| As of 9/30/17, the most recent calendar quarter end, including maximum applicable sales charges | |
| |
| Class A Shares | | | | |
| Inception (5/2/2014) | | | 2.32 | % |
| 1 Year | | | 3.61 | |
| |
| Class C Shares | | | | |
| Inception (5/2/2014) | | | 3.25 | % |
| 1 Year | | | 7.83 | |
| |
| Class R Shares | | | | |
| Inception (5/2/2014) | | | 3.77 | % |
| 1 Year | | | 9.37 | |
| |
| Class Y Shares | | | | |
| Inception (5/2/2014) | | | 4.27 | % |
| 1 Year | | | 9.91 | |
| |
| Class R5 Shares | | | | |
| Inception (5/2/2014) | | | 4.27 | % |
| 1 Year | | | 9.91 | |
| |
| Class R6 Shares | | | | |
| Inception (5/2/2014) | | | 4.27 | % |
| 1 Year | | | 9.91 | |
charge (CDSC) for the period involved. The CDSC on Class C shares is 1% for the first year after purchase. Class R, Class Y, Class R5 and Class R6 class shares do not have a front-end sales charge or a CDSC; therefore, performance is at net asset value.
The performance of the Fund’s share classes will differ primarily due to different sales charge structures and class expenses.
Fund performance reflects any applicable fee waivers and/or expense reimbursements. Had the adviser not waived fees and/or reimbursed expenses currently or in the past, returns would have been lower. See current prospectus for more information.
| 1 | Total annual Fund operating expenses after any contractual fee waivers and/or expense reimbursements by the adviser in effect through at least February 28, 2018. See current prospectus for more information. |
|
| 7 Invesco Global Infrastructure Fund |
Invesco Global Infrastructure Fund’s investment objective is total return through growth of capital and current income.
| ∎ | | Unless otherwise stated, information presented in this report is as of October 31, 2017, and is based on total net assets. |
| ∎ | | Unless otherwise noted, all data provided by Invesco. |
| ∎ | | To access your Fund’s reports/prospectus, visit invesco.com/fundreports. |
About share classes
| ∎ | | Class R shares are generally available only to employer sponsored retirement and benefit plans. Please see the prospectus for more information. |
| ∎ | | Class Y shares are available only to certain investors. Please see the prospectus for more information. |
| ∎ | | Class R5 shares and Class R6 shares are available for use by retirement plans that meet certain standards and for institutional investors. Class R6 shares are also available through intermediaries that have established an agreement with Invesco Distributors, Inc. to make such shares available for use in retail omnibus accounts. Please see the prospectus for more information. |
Principal risks of investing in the Fund
| ∎ | | Active trading risk. Active trading of portfolio securities may result in added expenses, a lower return and increased tax liability. |
| ∎ | | Debt securities risk. The prices of debt securities held by the Fund will be affected by changes in interest rates, the creditworthiness of the issuer and other factors. An increase in prevailing interest rates typically causes the value of existing debt securities to fall and often has a greater impact on longer-duration debt securities and higher quality debt securities. Falling interest rates will cause the Fund to reinvest the proceeds of debt securities that have been repaid by the issuer at lower interest rates. Falling interest rates may also reduce the Fund’s distributable income because interest payments on floating rate debt instruments held by the Fund will decline. The Fund could lose money on investments in debt securities if the issuer or borrower fails to meet its obligations to make interest payments and/or to repay principal in a timely manner. Changes in an issuer’s financial strength, the market’s perception of such strength or in the credit rating |
| | | of the issuer or the security may affect the value of debt securities. The Adviser’s credit analysis may fail to anticipate such changes, which could result in buying a debt security at an inopportune time or failing to sell a debt security in advance of a price decline or other credit event. |
| ∎ | | Depositary receipts risk. Investing in depositary receipts involves the same risks as direct investments in foreign securities. In addition, the underlying issuers of certain depositary receipts are under no obligation to distribute shareholder communications or pass through any voting rights with respect to the deposited securities to the holders of such receipts. The Fund may therefore receive less timely information or have less control than if it invested directly in the foreign issuer. |
| ∎ | | Derivatives risk. The value of a derivative instrument depends largely on (and is derived from) the value of an underlying security, currency, commodity, interest rate, index or other asset (each referred to as an underlying asset). In addition to risks relating to the underlying assets, the use of derivatives may include other, possibly greater, risks, including counterparty, leverage and liquidity risks. Counterparty risk is the risk that the counterparty to the derivative contract will default on its obligation to pay the Fund the amount owed or otherwise perform under the derivative contract. Derivatives create leverage risk because they do not require payment up front equal to the economic exposure created by owning the derivative. As a result, an adverse change in the value of the underlying asset could result in the Fund sustaining a loss that is substantially greater than the amount invested in the derivative, which may make the Fund’s returns more volatile and increase the risk of loss. Derivative instruments may also be less liquid than more traditional investments and the Fund may be unable to sell or close out |
| | | its derivative positions at a desirable time or price. This risk may be more acute under adverse market conditions, during which the Fund may be most in need of liquidating its derivative positions. Derivatives may also be harder to value, less tax efficient and subject to changing government regulation that could impact the Fund’s ability to use certain derivatives or their cost. Also, derivatives used for hedging or to gain or limit exposure to a particular market segment may not provide the expected benefits, particularly during adverse market conditions. |
| ∎ | | Emerging markets securities risk. |
Emerging markets (also referred to as developing markets) are generally subject to greater market volatility, political, social and economic instability, uncertain trading markets and more governmental limitations on foreign investment than more developed markets. In addition, companies operating in emerging markets may be subject to lower trading volume and greater price fluctuations than companies in more developed markets. Securities law and the enforcement of systems of taxation in many emerging market countries may change quickly and unpredictably. In addition, investments in emerging markets securities may also be subject to additional transaction costs, delays in settlement procedures, and lack of timely information.
| ∎ | | Foreign securities risk. The Fund’s foreign investments may be adversely affected by political and social instability, changes in economic or taxation policies, difficulty in enforcing obligations, decreased liquidity or increased volatility. Foreign investments also involve the risk of the possible seizure, nationalization or expropriation of the issuer or foreign deposits (in which the Fund could lose its entire investments in a certain market) and the possible adoption of foreign governmental restrictions such as exchange controls. Unless the Fund has hedged its foreign securities risk, foreign securities risk also involves the risk of negative foreign currency rate fluctuations, which may cause the value of securities denominated in such foreign currency (or other instruments through which the Fund has exposure to foreign currencies) to decline in value. Currency |
|
This report must be accompanied or preceded by a currently effective Fund prospectus, which contains more complete information, including sales charges and expenses. Investors should read it carefully before investing. |
|
|
| NOT FDIC INSURED | MAY LOSE VALUE | NO BANK GUARANTEE |
|
| 8 Invesco Global Infrastructure Fund |
| | exchange rates may fluctuate significantly over short periods of time. Currency hedging strategies, if used, are not always successful. |
| ∎ | | Geographic focus risk. The Fund may from time to time invest a substantial amount of its assets in securities of issuers located in a single country or a limited number of countries. Adverse economic, political or social conditions in those countries may therefore have a significant negative impact on the Fund’s investment performance. |
| ∎ | | High yield debt securities (junk bond) risk. Investments in high yield debt securities (“junk bonds”) and other lower-rated securities will subject the Fund to substantial risk of loss. These securities are considered to be speculative with respect to the issuer’s ability to pay interest and principal when due, are more susceptible to default or decline in market value and are less liquid than investment grade debt securities. Prices of high yield debt securities tend to be very volatile. |
| ∎ | | Infrastructure-related companies risk. The Fund will concentrate its investments in the infrastructure industry. Infrastructure-related companies are subject to a variety of risk factors, including costs associated with environmental, governmental and other regulations, high interest costs for capital construction programs, high leverage, the effects of economic slowdowns, surplus capacity, increased competition, fluctuations of fuel prices, the effects of energy conservation policies, unfavorable tax laws or accounting policies, environmental damage, difficulty in raising capital, increased susceptibility to terrorist acts or political actions, and general changes in market sentiment towards infrastructure assets. |
| ∎ | | Management risk. The Fund is actively managed and depends heavily on the Adviser’s judgment about markets, interest rates or the attractiveness, relative values, liquidity, or potential appreciation of particular investments made for the Fund’s portfolio. The Fund could experience losses if these judgments prove to be incorrect. Additionally, legislative, regulatory, or tax developments may adversely affect management of the Fund and, therefore, the ability of the Fund to achieve its investment objective. |
| ∎ | | Market risk. The market values of the Fund’s investments, and therefore the value of the Fund’s shares, will go up and down, sometimes rapidly or unpredictably. Market risk may affect a single |
| | issuer, industry or section of the economy, or it may affect the market as a whole. Individual stock prices tend to go up and down more dramatically than those of certain other types of investments, such as bonds. During a general downturn in the financial markets, multiple asset classes may decline in value. When markets perform well, there can be no assurance that specific investments held by the Fund will rise in value. |
| ∎ | | MLP risk. The Fund invests in securities of MLPs, which are subject to the following risks: |
| | – | Limited partner risk. An MLP is a public limited partnership or limited liability company taxed as a partnership under the Internal Revenue Code of 1986, as amended (the Code). Although the characteristics of MLPs closely resemble a traditional limited partnership, a major difference is that MLPs may trade on a public exchange or in the over-the-counter market. The risks of investing in an MLP are similar to those of investing in a partnership, including more flexible governance structures, which could result in less protection for investors than investments in a corporation. Investors in an MLP normally would not be liable for the debts of the MLP beyond the amount that the investor has contributed but investors may not be shielded to the same extent that a shareholder of a corporation would be. In certain circumstances, creditors of an MLP would have the right to seek return of capital distributed to a limited partner, which right would continue after an investor sold its investment in the MLP. |
| | – | Liquidity risk. The ability to trade on a public exchange or in the over-the-counter market provides a certain amount of liquidity not found in many limited partnership investments. However, MLP interests may be less liquid than conventional publicly traded securities and, therefore, more difficult to trade at desirable times and/or prices. |
| | – | Interest rate risk. In addition, MLP distributions may be reduced by fees and other expenses incurred by the MLP. MLPs generally are considered interest-rate sensitive investments. During periods of interest rate volatility, these investments may not provide attractive returns. |
| | – | General partner risk. The holder of the general partner or managing member interest can be liable in certain circumstances for amounts |
greater than the amount of the holder’s investment in the general partner or managing member.
Additionally, if the Fund were to invest more than 25% of its total assets in MLPs that are taxed as partnerships this could cause the Fund to lose its status as regulated investment company under Subchapter M of the Code.
| ∎ | | MLP tax risk. MLPs taxed as partnerships do not pay U.S. federal income tax at the partnership level. A change in current tax law, or a change in the underlying business mix of a given MLP, however, could result in an MLP being classified as a corporation for U.S. federal income tax purposes, which would have the effect of reducing the amount of cash available for distribution by the MLP and, as a result, could result in a reduction of the value of the Fund’s investment, and consequently your investment in the Fund and lower income. Each year, the Fund will send you an annual tax statement (Form 1099) to assist you in completing your federal, state and local tax returns. If an MLP in which the Fund invests amends its partnership tax return, the Fund will, when necessary, send you a corrected Form 1099, which could, in turn, require you to amend your federal, state or local tax returns. |
| ∎ | | Non-diversification risk. The Fund is non-diversified and can invest a greater portion of its assets in the obligations or securities of a small number of issuers or any single issuer than a diversified fund can. A change in the value of one or a few issuers’ securities will therefore affect the value of the Fund more than if it was a diversified fund. |
| ∎ | | Small- and mid-capitalization companies risks. Small- and mid-capitalization companies tend to be more vulnerable to changing market conditions, may have little or no operating history or track record of success, and may have more limited product lines and markets, less experienced management and fewer financial resources than larger companies. These companies’ securities may be more volatile and less liquid than those of more established companies, and their returns may vary, sometimes significantly, from the overall securities market. |
continued on page 6
|
| 9 Invesco Global Infrastructure Fund |
Schedule of Investments
October 31, 2017
| | | | | | | | |
| | | Shares | | | Value | |
Common Stocks & Other Equity Interests–99.25% | |
| Australia–5.55% | |
APA Group | | | 17,809 | | | $ | 116,760 | |
Macquarie Atlas Roads Group | | | 49,886 | | | | 227,569 | |
Spark Infrastructure Group | | | 162,972 | | | | 318,210 | |
Sydney Airport | | | 11,076 | | | | 60,276 | |
Transurban Group | | | 54,044 | | | | 503,422 | |
| | | | | | | | 1,226,237 | |
|
| Canada–15.51% | |
Canadian Pacific Railway Ltd. | | | 629 | | | | 109,057 | |
Enbridge Inc. | | | 42,230 | | | | 1,622,947 | |
Keyera Corp. | | | 2,340 | | | | 68,889 | |
Pembina Pipeline Corp. | | | 27,466 | | | | 908,011 | |
TransCanada Corp. | | | 11,612 | | | | 551,302 | |
Westshore Terminals Investment Corp. | | | 8,811 | | | | 168,079 | |
| | | | | | | | 3,428,285 | |
|
| China–3.20% | |
Beijing Enterprises Water Group Ltd. | | | 260,000 | | | | 218,294 | |
China Merchants Port Holdings Co. Ltd. | | | 80,000 | | | | 250,212 | |
China Resources Gas Group Ltd. | | | 31,335 | | | | 114,674 | |
ENN Energy Holdings Ltd. | | | 17,000 | | | | 124,644 | |
| | | | | | | | 707,824 | |
|
| France–9.87% | |
Aéroports de Paris | | | 546 | | | | 91,971 | |
Eiffage S.A. | | | 4,267 | | | | 445,816 | |
Eutelsat Communications S.A. | | | 4,010 | | | | 100,479 | |
Groupe Eurotunnel S.E. | | | 38,904 | | | | 488,995 | |
Vinci S.A. | | | 10,759 | | | | 1,053,412 | |
| | | | | | | | 2,180,673 | |
|
| Germany–0.33% | |
Fraport AG Frankfurt Airport Services Worldwide | | | 763 | | | | 72,591 | |
|
| Hong Kong–0.69% | |
China Gas Holdings Ltd. | | | 50,000 | | | | 151,896 | |
|
| Italy–4.19% | |
Atlantia S.p.A. | | | 10,540 | | | | 343,513 | |
Infrastrutture Wireless Italiane S.p.A.-REGS(a) | | | 11,509 | | | | 78,631 | |
Terna — Rete Elettrica Nazionale S.p.A. | | | 83,400 | | | | 503,251 | |
| | | | | | | | 925,395 | |
|
| Japan–1.62% | |
Japan Airport Terminal Co., Ltd. | | | 4,300 | | | | 151,914 | |
Kyushu Railway Co. | | | 2,100 | | | | 67,370 | |
Toho Gas Co., Ltd. | | | 1,100 | | | | 30,823 | |
Tokyo Gas Co., Ltd. | | | 2,600 | | | | 64,802 | |
West Japan Railway Co. | | | 600 | | | | 42,315 | |
| | | | | | | | 357,224 | |
| | | | | | | | |
| | | Shares | | | Value | |
| Luxembourg–0.31% | |
SES S.A. | | | 4,228 | | | $ | 68,756 | |
|
| Mexico–0.53% | |
Grupo Aeroportuario del Pacifico S.A.B. de C.V.–ADR | | | 1,247 | | | | 118,365 | |
|
| New Zealand–1.24% | |
Auckland International Airport Ltd. | | | 63,849 | | | | 273,157 | |
|
| Spain–4.77% | |
Abertis Infraestructuras S.A. | | | 16,843 | | | | 364,351 | |
Aena SME, S.A.–REGS(a) | | | 1,018 | | | | 186,774 | |
Cellnex Telecom S.A.–REGS(a) | | | 4,549 | | | | 112,951 | |
Ferrovial, S.A. | | | 4,122 | | | | 89,552 | |
Red Eléctrica Corp. S.A. | | | 13,565 | | | | 300,394 | |
| | | | | | | | 1,054,022 | |
|
| Switzerland–0.57% | |
Flughafen Zürich AG | | | 581 | | | | 126,380 | |
|
| United Kingdom–6.92% | |
John Laing Group PLC(a) | | | 28,997 | | | | 110,012 | |
National Grid PLC | | | 43,542 | | | | 524,041 | |
Pennon Group PLC | | | 14,260 | | | | 150,407 | |
Severn Trent PLC | | | 23,441 | | | | 657,345 | |
United Utilities Group PLC | | | 7,892 | | | | 87,329 | |
| | | | | | | | 1,529,134 | |
|
| United States–43.95% | |
American Tower Corp.–Class A | | | 11,673 | | | | 1,677,060 | |
American Water Works Co., Inc. | | | 5,110 | | | | 448,454 | |
Atmos Energy Corp. | | | 2,836 | | | | 247,413 | |
Cheniere Energy, Inc.(b) | | | 13,503 | | | | 631,130 | |
CMS Energy Corp. | | | 4,798 | | | | 232,079 | |
Crown Castle International Corp. | | | 10,775 | | | | 1,153,787 | |
Dominion Energy, Inc. | | | 2,524 | | | | 204,797 | |
Edison International | | | 5,014 | | | | 400,869 | |
Kinder Morgan, Inc. | | | 11,568 | | | | 209,496 | |
NiSource Inc. | | | 12,178 | | | | 321,134 | |
ONEOK, Inc. | | | 4,890 | | | | 265,380 | |
PG&E Corp. | | | 11,474 | | | | 662,853 | |
Public Service Enterprise Group Inc. | | | 4,551 | | | | 223,909 | |
SBA Communications Corp.–Class A(b) | | | 3,213 | | | | 505,019 | |
Sempra Energy | | | 10,614 | | | | 1,247,145 | |
Targa Resources Corp. | | | 6,202 | | | | 257,383 | |
WEC Energy Group, Inc. | | | 2,689 | | | | 181,212 | |
Williams Cos., Inc. (The) | | | 29,638 | | | | 844,683 | |
| | | | | | | | 9,713,803 | |
Total Common Stocks & Other Equity Interests
(Cost $20,087,967) | | | | 21,933,742 | |
See accompanying Notes to Financial Statements which are an integral part of the financial statements.
10 Invesco Global Infrastructure Fund
| | | | | | | | |
| | | Shares | | | Value | |
Money Market Funds–0.77% | | | | | | | | |
Invesco Government & Agency Portfolio–Institutional Class, 0.95%(c) | | | 102,283 | | | $ | 102,283 | |
Invesco Treasury Portfolio–Institutional Class, 0.94%(c) | | | 68,189 | | | | 68,189 | |
Total Money Market Funds
(Cost $170,472) | | | | 170,472 | |
TOTAL INVESTMENTS IN SECURITIES–100.02%
(Cost $20,258,439) | | | | 22,104,214 | |
OTHER ASSETS LESS LIABILITIES–(0.02)% | | | | (3,606 | ) |
NET ASSETS–100.00% | | | $ | 22,100,608 | |
Investment Abbreviations:
| | |
| ADR | | – American Depositary Receipt |
| REGS | | – Regulation S |
Notes to Schedule of Investments:
| (a) | Security purchased or received in a transaction exempt from registration under the Securities Act of 1933, as amended (the “1933 Act”). The security may be resold pursuant to an exemption from registration under the 1933 Act, typically to qualified institutional buyers. The aggregate value of these securities at October 31, 2017 was $488,368, which represented 2.21% of the Fund’s Net Assets. |
| (b) | Non-income producing security. |
| (c) | The money market fund and the Fund are affiliated by having the same investment adviser. The rate shown is the 7-day SEC standardized yield as of October 31, 2017. |
See accompanying Notes to Financial Statements which are an integral part of the financial statements.
11 Invesco Global Infrastructure Fund
Statement of Assets and Liabilities
October 31, 2017
| | | | |
Assets: | |
Investments in securities, at value (Cost $20,087,967) | | $ | 21,933,742 | |
Investments in affiliated money market funds, at value and cost | | | 170,472 | |
Foreign currencies, at value (Cost $56,425) | | | 55,714 | |
Receivable for: | | | | |
Investments sold | | | 94,537 | |
Fund shares sold | | | 15,115 | |
Dividends | | | 35,981 | |
Investment for trustee deferred compensation and retirement plans | | | 6,194 | |
Other assets | | | 32,759 | |
Total assets | | | 22,344,514 | |
|
Liabilities: | |
Payable for: | | | | |
Investments purchased | | | 144,540 | |
Fund shares reacquired | | | 135 | |
Accrued fees to affiliates | | | 31,835 | |
Accrued trustees’ and officers’ fees and benefits | | | 2,157 | |
Accrued other operating expenses | | | 59,045 | |
Trustee deferred compensation and retirement plans | | | 6,194 | |
Total liabilities | | | 243,906 | |
Net assets applicable to shares outstanding | | $ | 22,100,608 | |
|
Net assets consist of: | |
Shares of beneficial interest | | $ | 20,426,941 | |
Undistributed net investment income | | | 108,797 | |
Undistributed net realized gain (loss) | | | (280,136 | ) |
Net unrealized appreciation | | | 1,845,006 | |
| | | $ | 22,100,608 | |
| | | | |
Net Assets: | |
Class A | | $ | 8,898,986 | |
Class C | | $ | 2,015,646 | |
Class R | | $ | 295,750 | |
Class Y | | $ | 10,685,371 | |
Class R5 | | $ | 10,753 | |
Class R6 | | $ | 194,102 | |
|
Shares outstanding, no par value,
with an unlimited number of shares authorized: | |
Class A | | | 828,802 | |
Class C | | | 188,104 | |
Class R | | | 27,562 | |
Class Y | | | 994,848 | |
Class R5 | | | 1,001 | |
Class R6 | | | 18,071 | |
Class A: | | | | |
Net asset value per share | | $ | 10.74 | |
Maximum offering price per share | | | | |
(Net asset value of $10.74 ¸ 94.50%) | | $ | 11.37 | |
Class C: | | | | |
Net asset value and offering price per share | | $ | 10.72 | |
Class R: | | | | |
Net asset value and offering price per share | | $ | 10.73 | |
Class Y: | | | | |
Net asset value and offering price per share | | $ | 10.74 | |
Class R5: | | | | |
Net asset value and offering price per share | | $ | 10.74 | |
Class R6: | | | | |
Net asset value and offering price per share | | $ | 10.74 | |
See accompanying Notes to Financial Statements which are an integral part of the financial statements.
12 Invesco Global Infrastructure Fund
Statement of Operations
For the year ended October 31, 2017
| | | | |
Investment income: | |
Dividends (net of foreign withholding taxes of $34,408) | | $ | 642,518 | |
Dividends from affiliated money market funds | | | 1,789 | |
Total investment income | | | 644,307 | |
| |
Expenses: | | | | |
Advisory fees | | | 146,513 | |
Administrative services fees | | | 50,000 | |
Custodian fees | | | 44,540 | |
Distribution fees: | | | | |
Class A | | | 17,625 | |
Class C | | | 14,544 | |
Class R | | | 1,040 | |
Transfer agent fees — A, C, R and Y | | | 30,195 | |
Transfer agent fees — R5 | | | 10 | |
Transfer agent fees — R6 | | | 157 | |
Trustees’ and officers’ fees and benefits | | | 20,406 | |
Registration and filing fees | | | 71,830 | |
Reports to shareholders | | | 18,000 | |
Professional services fees | | | 63,032 | |
Other | | | 12,129 | |
Total expenses | | | 490,021 | |
Less: Fees waived and expenses reimbursed | | | (275,285 | ) |
Net expenses | | | 214,736 | |
Net investment income | | | 429,571 | |
| |
Realized and unrealized gain (loss) from: | | | | |
Net realized gain (loss) from: | | | | |
Investment securities | | | 713,062 | |
Foreign currencies | | | (1,407 | ) |
| | | | 711,655 | |
Change in net unrealized appreciation (depreciation) of: | | | | |
Investment securities | | | 1,300,654 | |
Foreign currencies | | | (458 | ) |
| | | | 1,300,196 | |
Net realized and unrealized gain | | | 2,011,851 | |
Net increase in net assets resulting from operations | | $ | 2,441,422 | |
See accompanying Notes to Financial Statements which are an integral part of the financial statements.
13 Invesco Global Infrastructure Fund
Statement of Changes in Net Assets
For the years ended October 31, 2017 and 2016
| | | | | | | | |
| | | 2017 | | | 2016 | |
Operations: | | | | | | | | |
Net investment income | | $ | 429,571 | | | $ | 154,889 | |
Net realized gain (loss) | | | 711,655 | | | | (444,964 | ) |
Change in net unrealized appreciation | | | 1,300,196 | | | | 550,489 | |
Net increase in net assets resulting from operations | | | 2,441,422 | | | | 260,414 | |
| | |
Distributions to shareholders from net investment income: | | | | | | | | |
Class A | | | (133,550 | ) | | | (58,780 | ) |
Class C | | | (16,079 | ) | | | (3,050 | ) |
Class R | | | (3,225 | ) | | | (583 | ) |
Class Y | | | (179,756 | ) | | | (83,322 | ) |
Class R5 | | | (215 | ) | | | (179 | ) |
Class R6 | | | (3,330 | ) | | | (1,566 | ) |
Total distributions from net investment income | | | (336,155 | ) | | | (147,480 | ) |
| | |
Share transactions-net: | | | | | | | | |
Class A | | | 3,866,129 | | | | 896,696 | |
Class C | | | 1,400,904 | | | | 142,834 | |
Class R | | | 202,316 | | | | 40,880 | |
Class Y | | | 4,473,703 | | | | 885,878 | |
Class R6 | | | 60,864 | | | | 43,676 | |
Net increase in net assets resulting from share transactions | | | 10,003,916 | | | | 2,009,964 | |
Net increase in net assets | | | 12,109,183 | | | | 2,122,898 | |
| | |
Net assets: | | | | | | | | |
Beginning of year | | | 9,991,425 | | | | 7,868,527 | |
End of year (includes undistributed net investment income of $108,797 and $13,008, respectively) | | $ | 22,100,608 | | | $ | 9,991,425 | |
Notes to Financial Statements
October 31, 2017
NOTE 1—Significant Accounting Policies
Invesco Global Infrastructure Fund (the “Fund”) is a series portfolio of AIM Investment Funds (Invesco Investment Funds) (the “Trust”). The Trust is organized as a Delaware statutory trust and is registered under the Investment Company Act of 1940, as amended (the “1940 Act”), as an open-end series management investment company consisting of twenty separate series portfolios, each authorized to issue an unlimited number of shares of beneficial interest. The assets, liabilities and operations of each portfolio are accounted for separately. Information presented in these financial statements pertains only to the Fund. Matters affecting each portfolio or class will be voted on exclusively by the shareholders of such portfolio or class.
The Fund’s investment objective is total return through growth of capital and current income.
The Fund currently consists of six different classes of shares: Class A, Class C, Class R, Class Y, Class R5 and Class R6. Class Y shares are available only to certain investors. Class A shares are sold with a front-end sales charge unless certain waiver criteria are met and under certain circumstances load waived shares may be subject to contingent deferred sales charges (“CDSC”). Class C shares are sold with a CDSC. Class R, Class Y, Class R5 and Class R6 shares are sold at net asset value.
The Fund is an investment company and accordingly follows the investment company accounting and reporting guidance in accordance with Financial Accounting Standards Board Accounting Standards Codification Topic 946, Financial Services — Investment Companies.
The following is a summary of the significant accounting policies followed by the Fund in the preparation of its financial statements.
| A. | Security Valuations — Securities, including restricted securities, are valued according to the following policy. |
A security listed or traded on an exchange (except convertible securities) is valued at its last sales price or official closing price as of the close of the customary trading session on the exchange where the security is principally traded, or lacking any sales or official closing price on a particular day, the security may be valued at the closing bid price on that day. Securities traded in the over-the-counter market are valued based on prices furnished by independent pricing services or market makers. When such securities are valued by an independent pricing service they may be considered fair valued. Futures contracts are valued at the final settlement price set by an exchange on which they are principally traded. Listed options are valued at the mean between the last bid and asked prices from the exchange on which they are principally traded. Options not listed on an exchange are valued by an independent source at the mean between the last bid and asked prices. For purposes of determining net asset value (“NAV”) per share, futures and option contracts generally are valued 15 minutes after the close of the customary trading session of the New York Stock Exchange (“NYSE”).
14 Invesco Global Infrastructure Fund
Investments in open-end and closed-end registered investment companies that do not trade on an exchange are valued at the end-of-day net asset value per share. Investments in open-end and closed-end registered investment companies that trade on an exchange are valued at the last sales price or official closing price as of the close of the customary trading session on the exchange where the security is principally traded.
Debt obligations (including convertible securities) and unlisted equities are fair valued using an evaluated quote provided by an independent pricing service. Evaluated quotes provided by the pricing service may be determined without exclusive reliance on quoted prices, and may reflect appropriate factors such as institution-size trading in similar groups of securities, developments related to specific securities, dividend rate (for unlisted equities), yield (for debt obligations), quality, type of issue, coupon rate (for debt obligations), maturity (for debt obligations), individual trading characteristics and other market data. Pricing services generally value debt obligations assuming orderly transactions of institutional round lot size, but a fund may hold or transact in the same securities in smaller, odd lot sizes. Odd lots often trade at lower prices than institutional round lots. Debt obligations are subject to interest rate and credit risks. In addition, all debt obligations involve some risk of default with respect to interest and/or principal payments.
Foreign securities’ (including foreign exchange contracts) prices are converted into U.S. dollar amounts using the applicable exchange rates as of the close of the NYSE. If market quotations are available and reliable for foreign exchange-traded equity securities, the securities will be valued at the market quotations. Because trading hours for certain foreign securities end before the close of the NYSE, closing market quotations may become unreliable. If between the time trading ends on a particular security and the close of the customary trading session on the NYSE, events occur that the investment adviser determines are significant and make the closing price unreliable, the Fund may fair value the security. If the event is likely to have affected the closing price of the security, the security will be valued at fair value in good faith using procedures approved by the Board of Trustees. Adjustments to closing prices to reflect fair value may also be based on a screening process of an independent pricing service to indicate the degree of certainty, based on historical data, that the closing price in the principal market where a foreign security trades is not the current value as of the close of the NYSE. Foreign securities’ prices meeting the approved degree of certainty that the price is not reflective of current value will be priced at the indication of fair value from the independent pricing service. Multiple factors may be considered by the independent pricing service in determining adjustments to reflect fair value and may include information relating to sector indices, American Depositary Receipts and domestic and foreign index futures. Foreign securities may have additional risks including exchange rate changes, potential for sharply devalued currencies and high inflation, political and economic upheaval, the relative lack of issuer information, relatively low market liquidity and the potential lack of strict financial and accounting controls and standards.
Securities for which market prices are not provided by any of the above methods may be valued based upon quotes furnished by independent sources. The last bid price may be used to value equity securities. The mean between the last bid and asked prices is used to value debt obligations, including corporate loans.
Securities for which market quotations are not readily available or became unreliable are valued at fair value as determined in good faith by or under the supervision of the Trust’s officers following procedures approved by the Board of Trustees. Issuer specific events, market trends, bid/asked quotes of brokers and information providers and other market data may be reviewed in the course of making a good faith determination of a security’s fair value.
The Fund may invest in securities that are subject to interest rate risk, meaning the risk that the prices will generally fall as interest rates rise and, conversely, the prices will generally rise as interest rates fall. Specific securities differ in their sensitivity to changes in interest rates depending on their individual characteristics. Changes in interest rates may result in increased market volatility, which may affect the value and/or liquidity of certain Fund investments.
Valuations change in response to many factors including the historical and prospective earnings of the issuer, the value of the issuer’s assets, general economic conditions, interest rates, investor perceptions and market liquidity. Because of the inherent uncertainties of valuation, the values reflected in the financial statements may materially differ from the value received upon actual sale of those investments.
| B. | Securities Transactions and Investment Income — Securities transactions are accounted for on a trade date basis. Realized gains or losses on sales are computed on the basis of specific identification of the securities sold. Interest income (net of withholding tax, if any) is recorded on the accrual basis from settlement date. Dividend income (net of withholding tax, if any) is recorded on the ex-dividend date. |
The Fund may periodically participate in litigation related to Fund investments. As such, the Fund may receive proceeds from litigation settlements. Any proceeds received are included in the Statement of Operations as realized gain (loss) for investments no longer held and as unrealized gain (loss) for investments still held.
Brokerage commissions and mark ups are considered transaction costs and are recorded as an increase to the cost basis of securities purchased and/or a reduction of proceeds on a sale of securities. Such transaction costs are included in the determination of net realized and unrealized gain (loss) from investment securities reported in the Statement of Operations and the Statement of Changes in Net Assets and the net realized and unrealized gains (losses) on securities per share in the Financial Highlights. Transaction costs are included in the calculation of the Fund’s net asset value and, accordingly, they reduce the Fund’s total returns. These transaction costs are not considered operating expenses and are not reflected in net investment income reported in the Statement of Operations and the Statement of Changes in Net Assets, or the net investment income per share and the ratios of expenses and net investment income reported in the Financial Highlights, nor are they limited by any expense limitation arrangements between the Fund and the investment adviser.
The Fund allocates income and realized and unrealized capital gains and losses to a class based on the relative net assets of each class.
| C. | Country Determination — For the purposes of making investment selection decisions and presentation in the Schedule of Investments, the investment adviser may determine the country in which an issuer is located and/or credit risk exposure based on various factors. These factors include the laws of the country under which the issuer is organized, where the issuer maintains a principal office, the country in which the issuer derives 50% or more of its total revenues and the country that has the primary market for the issuer’s securities, as well as other criteria. Among the other criteria that may be evaluated for making this determination are the country in which the issuer maintains 50% or more of its assets, the type of security, financial guarantees and enhancements, the nature of the collateral and the sponsor organization. Country of issuer and/or credit risk exposure has been determined to be the United States of America, unless otherwise noted. |
| D. | Distributions — Distributions from net investment income, if any, are declared and paid quarterly and are recorded on the ex-dividend date. Distributions from net realized capital gain, if any, are generally declared and paid annually and recorded on the ex-dividend date. The Fund may elect to treat a portion of the proceeds from redemptions as distributions for federal income tax purposes. |
15 Invesco Global Infrastructure Fund
| E. | Return of Capital — Distributions received from the Fund’s investments in MLPs generally are comprised of income and return of capital. The Fund records investment income and return of capital based on estimates made at the time such distributions are received. The return of capital portion of the distribution is a reduction to investment income that results in an equivalent reduction in the cost basis of the associated investments and increases net realized gains (losses) and change in unrealized appreciation (depreciation). Such estimates are based on historical information available from each MLP and other industry sources. These estimates will subsequently be revised and may materially differ primarily based on information received from the MLPs after their tax reporting periods are concluded. |
| F. | Federal Income Taxes — The Fund intends to comply with the requirements of Subchapter M of the Internal Revenue Code of 1986, as amended (the “Internal Revenue Code”), necessary to qualify as a regulated investment company and to distribute substantially all of the Fund’s taxable earnings to shareholders. As such, the Fund will not be subject to federal income taxes on otherwise taxable income (including net realized capital gain) that is distributed to shareholders. Therefore, no provision for federal income taxes is recorded in the financial statements. |
The Fund recognizes the tax benefits of uncertain tax positions only when the position is more likely than not to be sustained. Management has analyzed the Fund’s uncertain tax positions and concluded that no liability for unrecognized tax benefits should be recorded related to uncertain tax positions. Management is not aware of any tax positions for which it is reasonably possible that the total amounts of unrecognized tax benefits will change materially in the next 12 months.
The Fund files tax returns in the U.S. Federal jurisdiction and certain other jurisdictions. Generally, the Fund is subject to examinations by such taxing authorities for up to three years after the filing of the return for the tax period.
| G. | Expenses — Fees provided for under the Rule 12b-1 plan of a particular class of the Fund are charged to the operations of such class. Transfer agency fees and expenses and other shareholder recordkeeping fees and expenses attributable to Class R5 and Class R6 are allocated to each share class based on relative net assets. Sub-accounting fees attributable to Class R5 are charged to the operations of the class. Transfer agency fees and expenses and other shareholder recordkeeping fees and expenses relating to all other classes are allocated among those classes based on relative net assets. All other expenses are allocated among the classes based on relative net assets. |
| H. | Accounting Estimates — The preparation of financial statements in conformity with accounting principles generally accepted in the United States of America (“GAAP”) requires management to make estimates and assumptions that affect the reported amounts of assets and liabilities at the date of the financial statements and the reported amounts of revenues and expenses during the reporting period including estimates and assumptions related to taxation. Actual results could differ from those estimates by a significant amount. In addition, the Fund monitors for material events or transactions that may occur or become known after the period-end date and before the date the financial statements are released to print. |
| I. | Indemnifications — Under the Trust’s organizational documents, each Trustee, officer, employee or other agent of the Trust is indemnified against certain liabilities that may arise out of the performance of their duties to the Fund. Additionally, in the normal course of business, the Fund enters into contracts, including the Fund’s servicing agreements, that contain a variety of indemnification clauses. The Fund’s maximum exposure under these arrangements is unknown as this would involve future claims that may be made against the Fund that have not yet occurred. The risk of material loss as a result of such indemnification claims is considered remote. |
| J. | Foreign Currency Translations — Foreign currency is valued at the close of the NYSE based on quotations posted by banks and major currency dealers. Portfolio securities and other assets and liabilities denominated in foreign currencies are translated into U.S. dollar amounts at date of valuation. Purchases and sales of portfolio securities (net of foreign taxes withheld on disposition) and income items denominated in foreign currencies are translated into U.S. dollar amounts on the respective dates of such transactions. The Fund does not separately account for the portion of the results of operations resulting from changes in foreign exchange rates on investments and the fluctuations arising from changes in market prices of securities held. The combined results of changes in foreign exchange rates and the fluctuation of market prices on investments (net of estimated foreign tax withholding) are included with the net realized and unrealized gain or loss from investments in the Statement of Operations. Reported net realized foreign currency gains or losses arise from (1) sales of foreign currencies, (2) currency gains or losses realized between the trade and settlement dates on securities transactions, and (3) the difference between the amounts of dividends, interest, and foreign withholding taxes recorded on the Fund’s books and the U.S. dollar equivalent of the amounts actually received or paid. Net unrealized foreign currency gains and losses arise from changes in the fair values of assets and liabilities, other than investments in securities at fiscal period end, resulting from changes in exchange rates. |
The Fund may invest in foreign securities, which may be subject to foreign taxes on income, gains on investments or currency repatriation, a portion of which may be recoverable. Foreign taxes, if any, are recorded based on the tax regulations and rates that exist in the foreign markets in which the Fund invests and are shown in the Statement of Operations.
| K. | Forward Foreign Currency Contracts — The Fund may engage in foreign currency transactions either on a spot (i.e. for prompt delivery and settlement) basis, or through forward foreign currency contracts, to manage or minimize currency or exchange rate risk. |
The Fund may also enter into forward foreign currency contracts for the purchase or sale of a security denominated in a foreign currency in order to “lock in” the U.S. dollar price of that security, or the Fund may also enter into forward foreign currency contracts that do not provide for physical settlement of the two currencies, but instead are settled by a single cash payment calculated as the difference between the agreed upon exchange rate and the spot rate at settlement based upon an agreed upon notional amount (non-deliverable forwards). The Fund will set aside liquid assets in an amount equal to the daily mark-to-market obligation for forward foreign currency contracts.
A forward foreign currency contract is an obligation between two parties (“Counterparties”) to purchase or sell a specific currency for an agreed-upon price at a future date. The use of forward foreign currency contracts does not eliminate fluctuations in the price of the underlying securities the Fund owns or intends to acquire but establishes a rate of exchange in advance. Fluctuations in the value of these contracts are measured by the difference in the contract date and reporting date exchange rates and are recorded as unrealized appreciation (depreciation) until the contracts are closed. When the contracts are closed, realized gains (losses) are recorded. Realized and unrealized gains (losses) on the contracts are included in the Statement of Operations. The primary risks associated with forward foreign currency contracts include failure of the Counterparty to meet the terms of the contract and the value of the foreign currency changing unfavorably. These risks may be in excess of the amounts reflected in the Statement of Assets and Liabilities.
16 Invesco Global Infrastructure Fund
NOTE 2—Advisory Fees and Other Fees Paid to Affiliates
The Trust has entered into a master investment advisory agreement with Invesco Advisers, Inc. (the “Adviser” or “Invesco”). Under the terms of the investment advisory agreement, the Fund accrues daily and pays monthly an advisory fee to the Adviser based on the annual rate of the Fund’s average daily net assets as follows:
| | | | | | | | |
| Average Daily Net Assets | | Rate | |
First $2.5 billion | | | 0 | .84% | | | | |
Next $2 billion | | | 0 | .80% | | | | |
Next $3.5 billion | | | 0 | .785% | | | | |
Over $8 billion | | | 0 | .77% | | | | |
For the year ended October 31, 2017, the effective advisory fees incurred by the Fund was 0.84%.
Under the terms of a master sub-advisory agreement between the Adviser and each of Invesco Asset Management Deutschland GmbH, Invesco Asset Management Limited, Invesco Asset Management (Japan) Limited, Invesco Hong Kong Limited, Invesco Senior Secured Management, Inc. and Invesco Canada Ltd. and separate sub-advisory agreements with Invesco PowerShares Capital Management LLC and Invesco Asset Management (India) Private Limited (collectively, the “Affiliated Sub-Advisers”) the Adviser, not the Fund, will pay 40% of the fees paid to the Adviser to any such Affiliated Sub-Adviser(s) that provide(s) discretionary investment management services to the Fund based on the percentage of assets allocated to such Affiliated Sub-Adviser(s).
Effective January 1, 2017, the Adviser has contractually agreed, through at least February 28, 2019, to waive advisory fees and/or reimburse expenses of all shares to the extent necessary to limit total annual fund operating expenses after fee waiver and/or expense reimbursement (excluding certain items discussed below) of Class A, Class C, Class R, Class Y, Class R5 and Class R6 shares to 1.28%, 2.03%, 1.53%, 1.03%, 1.03% and 1.03%, respectively, of average daily net assets (the “expense limits”). Prior to January 1, 2017, the Adviser had contractually agreed to waive advisory fees and/or reimburse expenses of all shares to the extent necessary to limit total annual fund operating expenses after fee waiver and/or expense reimbursement (excluding certain items discussed below) of Class A, Class C, Class R, Class Y, Class R5 and Class R6 shares to 1.40%, 2.15%, 1.65%, 1.15%, 1.15% and 1.15%, respectively, of average daily net assets. In determining the Adviser’s obligation to waive advisory fees and/or reimburse expenses, the following expenses are not taken into account, and could cause the total annual fund operating expenses after fee waiver and/or expense reimbursement to exceed the numbers reflected above: (1) interest; (2) taxes; (3) dividend expense on short sales; (4) extraordinary or non-routine items, including litigation expenses; and (5) expenses that the Fund has incurred but did not actually pay because of an expense offset arrangement. Unless Invesco continues the fee waiver agreement, it will terminate on February 28, 2019. During its term, the fee waiver agreement cannot be terminated or amended to increase the expense limits or reduce the advisory fee waiver without approval of the Board of Trustees.
Further, the Adviser has contractually agreed, through at least June 30, 2019, to waive the advisory fee payable by the Fund in an amount equal to 100% of the net advisory fees the Adviser receives from the affiliated money market funds on investments by the Fund of uninvested cash in such affiliated money market funds.
For the year ended October 31, 2017, the Adviser waived advisory fees and reimbursed fund level expenses of $244,923 and reimbursed class level expenses of $12,325, $2,542, $364, $14,964, $10 and $157 of Class A, Class C, Class R, Class Y, Class R5 and Class R6 shares, respectively.
The Trust has entered into a transfer agency and service agreement with Invesco Investment Services, Inc. (“IIS”) pursuant to which the Fund has agreed to pay IIS a fee for providing transfer agency and shareholder services to the Fund and reimburse IIS for certain expenses incurred by IIS in the course of providing such services. IIS may make payments to intermediaries that provide omnibus account services, sub-accounting services and/or networking services. All fees payable by IIS to intermediaries that provide omnibus account services or sub-accounting services are charged back to the Fund, subject to certain limitations approved by the Trust’s Board of Trustees. For the year ended October 31, 2017, expenses incurred under the agreement are shown in the Statement of Operations as Transfer agent fees.
The Trust has entered into a master administrative services agreement with Invesco pursuant to which the Fund has agreed to pay Invesco for certain administrative costs incurred in providing accounting services to the Fund. For the year ended October 31, 2017, expenses incurred under the agreement are shown in the Statement of Operations as Administrative services fees.
The Trust has entered into master distribution agreements with Invesco Distributors, Inc. (“IDI”) to serve as the distributor for the Class A, Class C, Class R, Class Y, Class R5 and Class R6 shares of the Fund. The Trust has adopted plans pursuant to Rule 12b-1 under the 1940 Act with respect to the Fund’s Class A, Class C and Class R shares (collectively, the “Plans”). The Fund, pursuant to the Plans, pays IDI compensation at the annual rate of 0.25% of the Fund’s average daily net assets of Class A shares, 1.00% of the average daily net assets of Class C shares and 0.50% of the average daily net assets of Class R shares. The fees are accrued daily and paid monthly. Of the Plan payments, up to 0.25% of the average daily net assets of each class of shares may be paid to furnish continuing personal shareholder services to customers who purchase and own shares of such classes. Any amounts not paid as a service fee under the Plans would constitute an asset-based sales charge. Rules of the Financial Industry Regulatory Authority (“FINRA”) impose a cap on the total sales charges, including asset-based sales charges, that may be paid by any class of shares of the Fund. For the year ended October 31, 2017, expenses incurred under the Plans are shown in the Statement of Operations as Distribution fees.
Front-end sales commissions and CDSC (collectively, the “sales charges”) are not recorded as expenses of the Fund. Front-end sales commissions are deducted from proceeds from the sales of Fund shares prior to investment in Class A shares of the Fund. CDSC are deducted from redemption proceeds prior to remittance to the shareholder. During the year ended October 31, 2017, IDI advised the Fund that IDI retained $7,101 in front-end sales commissions from the sale of Class A shares and $4 from Class C shares for CDSC imposed upon redemptions by shareholders.
Certain officers and trustees of the Trust are officers and directors of the Adviser, IIS and/or IDI.
17 Invesco Global Infrastructure Fund
NOTE 3—Additional Valuation Information
GAAP defines fair value as the price that would be received to sell an asset or paid to transfer a liability in an orderly transaction between market participants at the measurement date, under current market conditions. GAAP establishes a hierarchy that prioritizes the inputs to valuation methods, giving the highest priority to readily available unadjusted quoted prices in an active market for identical assets (Level 1) and the lowest priority to significant unobservable inputs (Level 3), generally when market prices are not readily available or are unreliable. Based on the valuation inputs, the securities or other investments are tiered into one of three levels. Changes in valuation methods may result in transfers in or out of an investment’s assigned level:
| | Level 1 — | Prices are determined using quoted prices in an active market for identical assets. |
| | Level 2 — | Prices are determined using other significant observable inputs. Observable inputs are inputs that other market participants may use in pricing a security. These may include quoted prices for similar securities, interest rates, prepayment speeds, credit risk, yield curves, loss severities, default rates, discount rates, volatilities and others. |
| | Level 3 — | Prices are determined using significant unobservable inputs. In situations where quoted prices or observable inputs are unavailable (for example, when there is little or no market activity for an investment at the end of the period), unobservable inputs may be used. Unobservable inputs reflect the Fund’s own assumptions about the factors market participants would use in determining fair value of the securities or instruments and would be based on the best available information. |
The following is a summary of the tiered valuation input levels, as of October 31, 2017. The level assigned to the securities valuations may not be an indication of the risk or liquidity associated with investing in those securities. Because of the inherent uncertainties of valuation, the values reflected in the financial statements may materially differ from the value received upon actual sale of those investments.
The Fund’s policy is to recognize transfers in and out of the valuation levels as of the end of the reporting period.
During the year ended October 31, 2017, there were transfers from Level 1 to Level 2 of $425,071 and from Level 2 to Level 1 of $3,787,279, due to foreign fair value adjustments.
| | | | | | | | | | | | | | | | |
| | | Level 1 | | | Level 2 | | | Level 3 | | | Total | |
Australia | | $ | 287,845 | | | $ | 938,392 | | | $ | — | | | $ | 1,226,237 | |
Canada | | | 3,428,285 | | | | — | | | | — | | | | 3,428,285 | |
China | | | 707,824 | | | | — | | | | — | | | | 707,824 | |
France | | | 2,180,673 | | | | — | | | | — | | | | 2,180,673 | |
Germany | | | — | | | | 72,591 | | | | — | | | | 72,591 | |
Hong Kong | | | 151,896 | | | | — | | | | — | | | | 151,896 | |
Italy | | | 581,882 | | | | 343,513 | | | | — | | | | 925,395 | |
Japan | | | — | | | | 357,224 | | | | — | | | | 357,224 | |
Luxembourg | | | 68,756 | | | | — | | | | — | | | | 68,756 | |
Mexico | | | 118,365 | | | | — | | | | — | | | | 118,365 | |
New Zealand | | | — | | | | 273,157 | | | | — | | | | 273,157 | |
Spain | | | 1,054,022 | | | | — | | | | — | | | | 1,054,022 | |
Switzerland | | | 126,380 | | | | — | | | | — | | | | 126,380 | |
United Kingdom | | | 1,529,134 | | | | — | | | | — | | | | 1,529,134 | |
United States | | | 9,713,803 | | | | — | | | | — | | | | 9,713,803 | |
Money Market Funds | | | 170,472 | | | | — | | | | — | | | | 170,472 | |
Total Investments | | $ | 20,119,337 | | | $ | 1,984,877 | | | $ | — | | | $ | 22,104,214 | |
NOTE 4—Trustees’ and Officers’ Fees and Benefits
Trustees’ and Officers’ Fees and Benefits include amounts accrued by the Fund to pay remuneration to certain Trustees and Officers of the Fund. Trustees have the option to defer compensation payable by the Fund, and Trustees’ and Officers’ Fees and Benefits also include amounts accrued by the Fund to fund such deferred compensation amounts. Those Trustees who defer compensation have the option to select various Invesco Funds in which their deferral accounts shall be deemed to be invested. Obligations under the deferred compensation plan represent unsecured claims against the general assets of the Fund.
NOTE 5—Cash Balances
The Fund is permitted to temporarily carry a negative or overdrawn balance in its account with State Street Bank and Trust Company, the custodian bank. Such balances, if any at period-end, are shown in the Statement of Assets and Liabilities under the payable caption Amount due custodian. To compensate the custodian bank for such overdrafts, the overdrawn Fund may either (1) leave funds as a compensating balance in the account so the custodian bank can be compensated by earning the additional interest; or (2) compensate by paying the custodian bank at a rate agreed upon by the custodian bank and Invesco, not to exceed the contractually agreed upon rate.
18 Invesco Global Infrastructure Fund
NOTE 6—Distributions to Shareholders and Tax Components of Net Assets
Tax Character of Distributions to Shareholders Paid During the Fiscal Years Ended October 31, 2017 and 2016:
| | | | | | | | |
| | | 2017 | | | 2016 | |
Ordinary income | | $ | 336,155 | | | $ | 147,480 | |
Tax Components of Net Assets at Period-End:
| | | | |
| | | 2017 | |
Undistributed ordinary income | | $ | 259,630 | |
Undistributed long-term gain | | | 334,781 | |
Net unrealized appreciation — investments | | | 1,321,964 | |
Net unrealized appreciation (depreciation) — foreign currencies | | | (769 | ) |
Temporary book/tax differences | | | (5,503 | ) |
Capital loss carryforward | | | (236,436 | ) |
Shares of beneficial interest | | | 20,426,941 | |
Total net assets | | $ | 22,100,608 | |
The difference between book-basis and tax-basis unrealized appreciation (depreciation) is due to differences in the timing of recognition of gains and losses on investments for tax and book purposes. The Fund’s net unrealized appreciation (depreciation) difference is attributable primarily to wash sales.
The temporary book/tax differences are a result of timing differences between book and tax recognition of income and/or expenses. The Fund’s temporary book/tax differences are the result of the trustee deferral of compensation.
Capital loss carryforward is calculated and reported as of a specific date. Results of transactions and other activity after that date may affect the amount of capital loss carryforward actually available for the Fund to utilize. Capital losses generated in years beginning after December 22, 2010 can be carried forward for an unlimited period, whereas previous losses expire in eight tax years. Capital losses with an expiration period may not be used to offset capital gains until all net capital losses without an expiration date have been utilized. Capital loss carryforwards with no expiration date will retain their character as either short-term or long-term capital losses instead of as short-term capital losses as under prior law. The ability to utilize capital loss carryforwards in the future may be limited under the Internal Revenue Code and related regulations based on the results of future transactions.
The Fund has a capital loss carryforward as of October 31, 2017, which expires as follows:
| | | | | | | | | | | | |
| Capital Loss Carryforward* | |
| Expiration | | Short-Term | | | Long-Term | | | Total | |
Not subject to expiration | | $ | 236,436 | | | $ | — | | | $ | 236,436 | |
| * | Capital loss carryforward as of the date listed above is reduced for limitations, if any, to the extent required by the Internal Revenue Code and may be further limited depending upon a variety of factors, including the realization of net unrealized gains or losses as of the date of any reorganization. |
NOTE 7—Investment Transactions
The aggregate amount of investment securities (other than short-term securities, U.S. Treasury obligations and money market funds, if any) purchased and sold by the Fund during the year ended October 31, 2017 was $27,038,805 and $16,987,951, respectively. Cost of investments, including any derivatives, on a tax basis includes the adjustments for financial reporting purposes as of the most recently completed federal income tax reporting period-end.
| | | | |
| Unrealized Appreciation (Depreciation) of Investments on a Tax Basis | |
Aggregate unrealized appreciation of investments | | $ | 1,640,411 | |
Aggregate unrealized (depreciation) of investments | | | (318,447 | ) |
Net unrealized appreciation of investments | | $ | 1,321,964 | |
Cost of investments for tax purposes is $20,782,250.
NOTE 8—Reclassification of Permanent Differences
Primarily as a result of differing book/tax treatment of partnerships and prior year real estate investment trust reclassification, on October 31, 2017, undistributed net investment income was increased by $2,373, undistributed net realized gain (loss) was decreased by $2,003 and shares of beneficial interest was decreased by $370. This reclassification had no effect on the net assets of the Fund.
19 Invesco Global Infrastructure Fund
NOTE 9—Share Information
| | | | | | | | | | | | | | | | |
| | | Summary of Share Activity | |
| | | Years ended October 31, | |
| | | 2017(a) | | | 2016 | |
| | | Shares | | | Amount | | | Shares | | | Amount | |
Sold: | | | | | | | | | | | | | | | | |
Class A | | | 540,397 | | | $ | 5,370,212 | | | | 150,770 | | | $ | 1,439,352 | |
Class C | | | 167,142 | | | | 1,644,192 | | | | 27,743 | | | | 259,588 | |
Class R | | | 27,781 | | | | 281,761 | | | | 5,110 | | | | 47,978 | |
Class Y | | | 604,953 | | | | 5,980,042 | | | | 199,905 | | | | 1,858,567 | |
Class R6 | | | 9,889 | | | | 97,616 | | | | 9,451 | | | | 87,462 | |
| | | | |
Issued as reinvestment of dividends: | | | | | | | | | | | | | | | | |
Class A | | | 10,009 | | | | 103,226 | | | | 3,637 | | | | 33,164 | |
Class C | | | 1,522 | | | | 15,805 | | | | 309 | | | | 2,803 | |
Class R | | | 292 | | | | 3,060 | | | | 48 | | | | 450 | |
Class Y | | | 13,517 | | | | 139,417 | | | | 5,820 | | | | 53,018 | |
Class R6 | | | 304 | | | | 3,114 | | | | 151 | | | | 1,386 | |
| | | | |
Reacquired: | | | | | | | | | | | | | | | | |
Class A | | | (157,736 | ) | | | (1,607,309 | ) | | | (61,640 | ) | | | (575,820 | ) |
Class C | | | (25,138 | ) | | | (259,093 | ) | | | (12,940 | ) | | | (119,557 | ) |
Class R | | | (7,704 | ) | | | (82,505 | ) | | | (812 | ) | | | (7,548 | ) |
Class Y | | | (161,852 | ) | | | (1,645,756 | ) | | | (111,869 | ) | | | (1,025,707 | ) |
Class R6 | | | (4,001 | ) | | | (39,866 | ) | | | (4,938 | ) | | | (45,172 | ) |
Net increase in share activity | | | 1,019,375 | | | $ | 10,003,916 | | | | 210,745 | | | $ | 2,009,964 | |
| (a) | There are entities that are record owners of more than 5% of the outstanding shares of the Fund and in the aggregate own 44% of the outstanding shares of the Fund. IDI has an agreement with these entities to sell Fund shares. The Fund, Invesco and/or Invesco affiliates may make payments to these entities, which are considered to be related to the Fund, for providing services to the Fund, Invesco and/or Invesco affiliates including but not limited to services such as securities brokerage, distribution, third party record keeping and account servicing. The Fund has no knowledge as to whether all or any portion of the shares owned of record by these entities are also owned beneficially. |
| | In addition, 16% of the outstanding shares of the Fund are owned by the Adviser or an affiliate of the Adviser. |
20 Invesco Global Infrastructure Fund
NOTE 10—Financial Highlights
The following schedule presents financial highlights for a share of the Fund outstanding throughout the periods indicated.
| | | | | | | | | | | | | | | | | | | | | | | | | | | | | | | | | | | | | | | | | | | | | | | | | | | | | | | | |
| | | Net asset
value,
beginning
of period | | | Net
investment
income(a) | | | Net gains
(losses)
on securities
(both
realized and
unrealized) | | | Total from
investment
operations | | | Dividends
from net
investment
income | | | Distributions
from net
realized
gains | | | Total
distributions | | | Net asset
value, end
of period | | | Total
return(b) | | | Net assets,
end of period
(000’s omitted) | | | Ratio of
expenses
to average
net assets
with fee waivers
and/or expenses
absorbed | | | Ratio of
expenses
to average net
assets without
fee waivers
and/or expenses
absorbed | | | Ratio of net
investment
income
to average
net assets | | | Portfolio
turnover(c) | |
Class A | | | | | | | | | | | | | | | | | | | | | | | | | | | | | | | | | | | | | | | | | | | | | | | | | | | | | | | | |
Year ended 10/31/17 | | $ | 9.62 | | | $ | 0.25 | (d) | | $ | 1.06 | | | $ | 1.31 | | | $ | (0.19 | ) | | $ | — | | | $ | (0.19 | ) | | $ | 10.74 | | | | 13.74 | % | | $ | 8,899 | | | | 1.29 | %(e) | | | 2.87 | %(e) | | | 2.40 | %(d)(e) | | | 99 | % |
Year ended 10/31/16 | | | 9.50 | | | | 0.17 | | | | 0.11 | | | | 0.28 | | | | (0.16 | ) | | | — | | | | (0.16 | ) | | | 9.62 | | | | 3.01 | | | | 4,194 | | | | 1.40 | | | | 4.29 | | | | 1.76 | | | | 85 | |
Year ended 10/31/15 | | | 10.66 | | | | 0.17 | | | | (1.11 | ) | | | (0.94 | ) | | | (0.21 | ) | | | (0.01 | ) | | | (0.22 | ) | | | 9.50 | | | | (8.85 | ) | | | 3,262 | | | | 1.40 | | | | 6.36 | | | | 1.68 | | | | 84 | |
Year ended 10/31/14(f) | | | 10.00 | | | | 0.08 | | | | 0.63 | | | | 0.71 | | | | (0.05 | ) | | | — | | | | (0.05 | ) | | | 10.66 | | | | 7.12 | | | | 2,497 | | | | 1.39 | (g) | | | 8.60 | (g) | | | 1.51 | (g) | | | 19 | |
Class C | | | | | | | | | | | | | | | | | | | | | | | | | | | | | | | | | | | | | | | | | | | | | | | | | | | | | | | | |
Year ended 10/31/17 | | | 9.60 | | | | 0.17 | (d) | | | 1.06 | | | | 1.23 | | | | (0.11 | ) | | | — | | | | (0.11 | ) | | | 10.72 | | | | 12.92 | | | | 2,016 | | | | 2.04 | (e) | | | 3.62 | (e) | | | 1.65 | (d)(e) | | | 99 | |
Year ended 10/31/16 | | | 9.48 | | | | 0.10 | | | | 0.11 | | | | 0.21 | | | | (0.09 | ) | | | — | | | | (0.09 | ) | | | 9.60 | | | | 2.24 | | | | 428 | | | | 2.15 | | | | 5.04 | | | | 1.01 | | | | 85 | |
Year ended 10/31/15 | | | 10.64 | | | | 0.09 | | | | (1.10 | ) | | | (1.01 | ) | | | (0.14 | ) | | | (0.01 | ) | | | (0.15 | ) | | | 9.48 | | | | (9.56 | ) | | | 279 | | | | 2.15 | | | | 7.11 | | | | 0.93 | | | | 84 | |
Year ended 10/31/14(f) | | | 10.00 | | | | 0.04 | | | | 0.63 | | | | 0.67 | | | | (0.03 | ) | | | — | | | | (0.03 | ) | | | 10.64 | | | | 6.71 | | | | 181 | | | | 2.14 | (g) | | | 9.35 | (g) | | | 0.76 | (g) | | | 19 | |
Class R | | | | | | | | | | | | | | | | | | | | | | | | | | | | | | | | | | | | | | | | | | | | | | | | | | | | | | | | |
Year ended 10/31/17 | | | 9.61 | | | | 0.22 | (d) | | | 1.06 | | | | 1.28 | | | | (0.16 | ) | | | — | | | | (0.16 | ) | | | 10.73 | | | | 13.47 | | | | 296 | | | | 1.54 | (e) | | | 3.12 | (e) | | | 2.15 | (d)(e) | | | 99 | |
Year ended 10/31/16 | | | 9.49 | | | | 0.14 | | | | 0.11 | | | | 0.25 | | | | (0.13 | ) | | | — | | | | (0.13 | ) | | | 9.61 | | | | 2.76 | | | | 69 | | | | 1.65 | | | | 4.54 | | | | 1.51 | | | | 85 | |
Year ended 10/31/15 | | | 10.66 | | | | 0.14 | | | | (1.11 | ) | | | (0.97 | ) | | | (0.19 | ) | | | (0.01 | ) | | | (0.20 | ) | | | 9.49 | | | | (9.18 | ) | | | 27 | | | | 1.65 | | | | 6.61 | | | | 1.43 | | | | 84 | |
Year ended 10/31/14(f) | | | 10.00 | | | | 0.07 | | | | 0.64 | | | | 0.71 | | | | (0.05 | ) | | | — | | | | (0.05 | ) | | | 10.66 | | | | 7.05 | | | | 13 | | | | 1.64 | (g) | | | 8.85 | (g) | | | 1.26 | (g) | | | 19 | |
Class Y | | | | | | | | | | | | | | | | | | | | | | | | | | | | | | | | | | | | | | | | | | | | | | | | | | | | | | | | |
Year ended 10/31/17 | | | 9.62 | | | | 0.27 | (d) | | | 1.06 | | | | 1.33 | | | | (0.21 | ) | | | — | | | | (0.21 | ) | | | 10.74 | | | | 14.02 | | | | 10,685 | | | | 1.04 | (e) | | | 2.62 | (e) | | | 2.65 | (d)(e) | | | 99 | |
Year ended 10/31/16 | | | 9.50 | | | | 0.19 | | | | 0.11 | | | | 0.30 | | | | (0.18 | ) | | | — | | | | (0.18 | ) | | | 9.62 | | | | 3.27 | | | | 5,177 | | | | 1.15 | | | | 4.04 | | | | 2.01 | | | | 85 | |
Year ended 10/31/15 | | | 10.67 | | | | 0.20 | | | | (1.12 | ) | | | (0.92 | ) | | | (0.24 | ) | | | (0.01 | ) | | | (0.25 | ) | | | 9.50 | | | | (8.70 | ) | | | 4,223 | | | | 1.15 | | | | 6.11 | | | | 1.93 | | | | 84 | |
Year ended 10/31/14(f) | | | 10.00 | | | | 0.09 | | | | 0.64 | | | | 0.73 | | | | (0.06 | ) | | | — | | | | (0.06 | ) | | | 10.67 | | | | 7.29 | | | | 2,287 | | | | 1.14 | (g) | | | 8.35 | (g) | | | 1.76 | (g) | | | 19 | |
Class R5 | | | | | | | | | | | | | | | | | | | | | | | | | | | | | | | | | | | | | | | | | | | | | | | | | | | | | | | | |
Year ended 10/31/17 | | | 9.62 | | | | 0.27 | (d) | | | 1.06 | | | | 1.33 | | | | (0.21 | ) | | | — | | | | (0.21 | ) | | | 10.74 | | | | 14.02 | | | | 11 | | | | 1.04 | (e) | | | 2.54 | (e) | | | 2.65 | (d)(e) | | | 99 | |
Year ended 10/31/16 | | | 9.50 | | | | 0.19 | | | | 0.11 | | | | 0.30 | | | | (0.18 | ) | | | — | | | | (0.18 | ) | | | 9.62 | | | | 3.27 | | | | 10 | | | | 1.15 | | | | 4.02 | | | | 2.01 | | | | 85 | |
Year ended 10/31/15 | | | 10.67 | | | | 0.20 | | | | (1.12 | ) | | | (0.92 | ) | | | (0.24 | ) | | | (0.01 | ) | | | (0.25 | ) | | | 9.50 | | | | (8.70 | ) | | | 10 | | | | 1.15 | | | | 6.00 | | | | 1.93 | | | | 84 | |
Year ended 10/31/14(f) | | | 10.00 | | | | 0.09 | | | | 0.64 | | | | 0.73 | | | | (0.06 | ) | | | — | | | | (0.06 | ) | | | 10.67 | | | | 7.29 | | | | 11 | | | | 1.14 | (g) | | | 8.34 | (g) | | | 1.76 | (g) | | | 19 | |
Class R6 | | | | | | | | | | | | | | | | | | | | | | | | | | | | | | | | | | | | | | | | | | | | | | | | | | | | | | | | |
Year ended 10/31/17 | | | 9.62 | | | | 0.27 | (d) | | | 1.06 | | | | 1.33 | | | | (0.21 | ) | | | — | | | | (0.21 | ) | | | 10.74 | | | | 14.02 | | | | 194 | | | | 1.04 | (e) | | | 2.54 | (e) | | | 2.65 | (d)(e) | | | 99 | |
Year ended 10/31/16 | | | 9.50 | | | | 0.19 | | | | 0.11 | | | | 0.30 | | | | (0.18 | ) | | | — | | | | (0.18 | ) | | | 9.62 | | | | 3.27 | | | | 114 | | | | 1.15 | | | | 4.02 | | | | 2.01 | | | | 85 | |
Year ended 10/31/15 | | | 10.67 | | | | 0.20 | | | | (1.12 | ) | | | (0.92 | ) | | | (0.24 | ) | | | (0.01 | ) | | | (0.25 | ) | | | 9.50 | | | | (8.70 | ) | | | 69 | | | | 1.15 | | | | 6.00 | | | | 1.93 | | | | 84 | |
Year ended 10/31/14(f) | | | 10.00 | | | | 0.09 | | | | 0.64 | | | | 0.73 | | | | (0.06 | ) | | | — | | | | (0.06 | ) | | | 10.67 | | | | 7.29 | | | | 38 | | | | 1.14 | (g) | | | 8.34 | (g) | | | 1.76 | (g) | | | 19 | |
| (a) | Calculated using average shares outstanding. |
| (b) | Includes adjustments in accordance with accounting principles generally accepted in the United States of America and as such, the net asset value for financial reporting purposes and the returns based upon those net asset values may differ from the net asset value and returns for shareholder transactions. Does not include sales charges and is not annualized for periods less than one year, if applicable. |
| (c) | Portfolio turnover is calculated at the fund level and is not annualized for periods less than one year, if applicable. |
| (d) | Net investment income per share and the ratio of net investment income to average net assets include significant dividends received during the period. Net investment income per share and the ratio of net investment income to average net assets excluding the significant dividends are $0.20 and 1.88%, $0.12 and 1.13%, $0.17 and 1.63%, $0.22 and 2.13%, $0.22 and 2.13% and $0.22 and 2.13% for Class A, Class C, Class R, Class Y, Class R5 and Class R6 shares, respectively. |
| (e) | Ratios are based on average daily net assets (000’s omitted) of $7,050, $1,454, $208, $8,560, $10 and $160 for Class A, Class C, Class R, Class Y, Class R5 and Class R6 shares, respectively. |
| (f) | Commencement date of May 2, 2014. |
21 Invesco Global Infrastructure Fund
Report of Independent Registered Public Accounting Firm
To the Board of Trustees of AIM Investment Funds (Invesco Investment Funds) and Shareholders of Invesco Global Infrastructure Fund:
In our opinion, the accompanying statement of assets and liabilities, including the schedule of investments, and the related statements of operations and of changes in net assets and the financial highlights present fairly, in all material respects, the financial position of Invesco Global Infrastructure Fund (one of the portfolios constituting the AIM Investment Funds (Invesco Investment Funds), hereafter referred to as the “Fund”) as of October 31, 2017, the results of its operations for the year then ended, the changes in its net assets for each of the two years in the period then ended and the financial highlights for each of the three years in the period then ended and for the period May 2, 2014 (commencement of investment operations) through October 31, 2014, in conformity with accounting principles generally accepted in the United States of America. These financial statements and financial highlights (hereafter referred to as “financial statements”) are the responsibility of the Fund’s management. Our responsibility is to express an opinion on these financial statements based on our audits. We conducted our audits of these financial statements in accordance with the standards of the Public Company Accounting Oversight Board (United States). Those standards require that we plan and perform the audit to obtain reasonable assurance about whether the financial statements are free of material misstatement. An audit includes examining, on a test basis, evidence supporting the amounts and disclosures in the financial statements, assessing the accounting principles used and significant estimates made by management, and evaluating the overall financial statement presentation. We believe that our audits, which included confirmation of securities as of October 31, 2017 by correspondence with the custodian, transfer agent and brokers, and when replies were not received from brokers, we performed other auditing procedures, provide a reasonable basis for our opinion.
PricewaterhouseCoopers LLP
Houston, Texas
December 21, 2017
22 Invesco Global Infrastructure Fund
Calculating your ongoing Fund expenses
Example
As a shareholder of the Fund, you incur two types of costs: (1) transaction costs, which may include sales charges (loads) on purchase payments or contingent deferred sales charges on redemptions, if any; and (2) ongoing costs, including management fees, distribution and/or service (12b-1) fees, and other Fund expenses. This example is intended to help you understand your ongoing costs (in dollars) of investing in the Fund and to compare these costs with ongoing costs of investing in other mutual funds. The example is based on an investment of $1,000 invested at the beginning of the period and held for the entire period May 1, 2017 through October 31, 2017.
Actual expenses
The table below provides information about actual account values and actual expenses. You may use the information in this table, together with the amount you invested, to estimate the expenses that you paid over the period. Simply divide your account value by $1,000 (for example, an $8,600 account value divided by $1,000 = 8.6), then multiply the result by the number in the table under the heading entitled “Actual Expenses Paid During Period” to estimate the expenses you paid on your account during this period.
Hypothetical example for comparison purposes
The table below also provides information about hypothetical account values and hypothetical expenses based on the Fund’s actual expense ratio and an assumed rate of return of 5% per year before expenses, which is not the Fund’s actual return.
The hypothetical account values and expenses may not be used to estimate the actual ending account balance or expenses you paid for the period. You may use this information to compare the ongoing costs of investing in the Fund and other funds. To do so, compare this 5% hypothetical example with the 5% hypothetical examples that appear in the shareholder reports of the other funds.
Please note that the expenses shown in the table are meant to highlight your ongoing costs only and do not reflect any transaction costs, such as sales charges (loads) on purchase payments or contingent deferred sales charges on redemptions, if any. Therefore, the hypothetical information is useful in comparing ongoing costs only, and will not help you determine the relative total costs of owning different funds. In addition, if these transaction costs were included, your costs would have been higher.
| | | | | | | | | | | | | | | | | | | | | | | | |
| Class | | Beginning
Account Value
(05/01/17) | | | ACTUAL | | | HYPOTHETICAL (5% annual return before
expenses) | | | Annualized
Expense
Ratio | |
| | | Ending
Account Value
(10/31/17)1 | | | Expenses
Paid During
Period2 | | | Ending
Account Value
(10/31/17) | | | Expenses
Paid During
Period2 | | |
| A | | $ | 1,000.00 | | | $ | 1,066.80 | | | $ | 6.67 | | | $ | 1,018.75 | | | $ | 6.51 | | | | 1.28 | % |
| C | | | 1,000.00 | | | | 1,062.90 | | | | 10.56 | | | | 1,014.97 | | | | 10.31 | | | | 2.03 | |
| R | | | 1,000.00 | | | | 1,065.50 | | | | 7.97 | | | | 1,017.49 | | | | 7.78 | | | | 1.53 | |
| Y | | | 1,000.00 | | | | 1,067.10 | | | | 5.37 | | | | 1,020.01 | | | | 5.24 | | | | 1.03 | |
| R5 | | | 1,000.00 | | | | 1,067.10 | | | | 5.37 | | | | 1,020.01 | | | | 5.24 | | | | 1.03 | |
| R6 | | | 1,000.00 | | | | 1,067.10 | | | | 5.37 | | | | 1,020.01 | | | | 5.24 | | | | 1.03 | |
| 1 | The actual ending account value is based on the actual total return of the Fund for the period May 1, 2017 through October 31, 2017, after actual expenses and will differ from the hypothetical ending account value which is based on the Fund’s expense ratio and a hypothetical annual return of 5% before expenses. |
| 2 | Expenses are equal to the Fund’s annualized expense ratio as indicated above multiplied by the average account value over the period, multiplied by 184/365 to reflect the most recent fiscal half year. |
23 Invesco Global Infrastructure Fund
Approval of Investment Advisory and Sub-Advisory Contracts
The Board of Trustees (the Board) of AIM Investment Funds (Invesco Investment Funds) is required under the Investment Company Act of 1940, as amended, to approve annually the renewal of Invesco Global Infrastructure Fund’s (the Fund) investment advisory agreements. During contract renewal meetings held on June 12-13, 2017, the Board as a whole, and the disinterested or “independent” Trustees, who comprise over 75% of the Board, voting separately, approved the continuance for the Fund of the Master Investment Advisory Agreement with Invesco Advisers, Inc. (Invesco Advisers and the investment advisory agreement) and the Master Intergroup Sub-Advisory Contract for Mutual Funds with Invesco Asset Management Deutschland GmbH, Invesco Asset Management Limited, Invesco Asset Management (Japan) Limited, Invesco Hong Kong Limited, Invesco Senior Secured Management, Inc. and Invesco Canada Ltd. and separate Sub-Advisory Contracts with Invesco PowerShares Capital Management LLC and Invesco Asset Management (India) Private Limited (collectively, the Affiliated Sub-Advisers and the sub-advisory contracts) for another year, effective July 1, 2017.
In evaluating the fairness and reasonableness of compensation under the Fund’s investment advisory agreement and sub-advisory contracts, the Board considered, among other things, the factors discussed below. The Board determined that continuation of the Fund’s investment advisory agreement and the sub-advisory contracts is in the best interest of the Fund and its shareholders and that the compensation payable to Invesco Advisers and the Affiliated Sub-Advisers under the agreements is fair and reasonable.
The Board’s Fund Evaluation Process
The Board’s Investments Committee has established three Sub-Committees, which meet throughout the year to review the performance of funds advised by Invesco Advisers (the Invesco Funds). Over the course of each year, the Sub-Committees meet with portfolio managers for their assigned Invesco Funds and other members of management to review the performance, investment objective(s), policies, strategies, limitations and investment risks of these funds. The Board had the benefit of reports from the Sub-Committees and Investments Committee throughout the year in considering approval of the continuance of each Invesco Fund’s investment advisory agreement and sub-advisory contracts for another year.
During the contract renewal process, the Board receives comparative performance and fee data regarding the Invesco Funds prepared by Invesco Advisers and Broadridge Financial Solutions, Inc. (Broadridge), an independent provider of investment company data. The Board also receives an independent written
evaluation from the Senior Officer, an officer of the Invesco Funds who reports directly to the independent Trustees. The Senior Officer’s evaluation is prepared as part of his responsibility to manage the process by which the Invesco Funds’ proposed management fees are negotiated during the annual contract renewal process to ensure they are negotiated in a manner that is at arms’ length and reasonable. In addition to meetings with Invesco Advisers and fund counsel, the independent Trustees also discuss the continuance of the investment advisory agreement and sub-advisory contracts in separate sessions with the Senior Officer and with independent legal counsel.
The Trustees recognized that the advisory fee rates for the Invesco Funds are, in most cases, the result of years of review and negotiation. The Trustees’ deliberations and conclusions in a particular year may be based in part on their deliberations and conclusions regarding these arrangements throughout the year and in prior years. The Trustees’ review and conclusions are based on the comprehensive consideration of all information presented to them and are not the result of any single determinative factor. Moreover, one Trustee may have weighed a particular piece of information or factor differently than another Trustee.
The discussion below is a summary of the Senior Officer’s independent written evaluation with respect to the Fund’s investment advisory agreement as well as a discussion of the material factors and related conclusions that formed the basis for the Board’s approval of the Fund’s investment advisory agreement and sub-advisory contracts. This information is current as of June 13, 2017, and does not reflect consideration of factors that became known to the Board after that date.
Factors and Conclusions and Summary of Independent Written Fee Evaluation
| A. | Nature, Extent and Quality of Services Provided by Invesco Advisers and the Affiliated Sub-Advisers |
The Board reviewed the advisory services provided to the Fund by Invesco Advisers under the Fund’s investment advisory agreement, the performance of Invesco Advisers in providing these services, and the credentials and experience of the officers and employees of Invesco Advisers who provide these services, including the Fund’s portfolio manager or managers. The Board’s review included consideration of Invesco Advisers’ investment process oversight, credit analysis and investment risk management. The Board also considered non-advisory services that Invesco Advisers and its affiliates provide to the Invesco Funds such as various back office support functions, trading operations, internal audit, valuation and legal and compliance.
In determining whether to continue the Fund’s investment advisory agreement, the Board considered the benefits of reapproving an existing relationship as contrasted with the greater uncertainty that may be associated with entering into a new relationship. The Board concluded that the nature, extent and quality of the services provided to the Fund by Invesco Advisers are appropriate and satisfactory.
The Board reviewed the services that may be provided by the Affiliated Sub-Advisers under the sub-advisory contracts and the credentials and experience of the officers and employees of the Affiliated Sub-Advisers who provide these services. The Board noted that the Affiliated Sub-Advisers have offices and personnel that are located in financial centers around the world. As a result, the Board noted that the Affiliated Sub-Advisers can provide research and investment analysis on the markets and economies of various countries in which the Fund may invest, make recommendations regarding securities and assist with security trades. The Board concluded that the sub-advisory contracts may benefit the Fund and its shareholders by permitting Invesco Advisers to use the resources and talents of the Affiliated Sub-Advisers in managing the Fund. The Board concluded that the nature, extent and quality of the services that may be provided by the Affiliated Sub-Advisers are appropriate and satisfactory.
| B. | Fund Investment Performance |
The Board considered Fund investment performance as a relevant factor in considering whether to approve the investment advisory agreement as well as the sub-advisory contracts for the Fund, as Invesco Asset Management Limited currently manages assets of the Fund.
The Board noted that the Fund had only two years of performance history and compared the Fund’s investment performance during the past one and two calendar years to the performance of funds in the Broadridge performance universe and against the Lipper Global Infrastructure Funds Index. The Board noted that performance of Class A shares of the Fund was in the second quintile of its performance universe for the one year period and the fifth quintile for the two year period (the first quintile being the best performing funds and the fifth quintile being the worst performing funds). The Board noted that performance of Class A shares of the Fund was below the performance of the Index for the one and two year periods. The Trustees also reviewed more recent Fund performance and this review did not change their conclusions.
| C. | Advisory and Sub-Advisory Fees |
The Board compared the Fund’s contractual management fee rate to the contractual management fee rates of funds in the Fund’s Broadridge expense group at a common asset level. The Board noted that the contractual
24 Invesco Global Infrastructure Fund
management fee rate for Class A shares of the Fund was below the median contractual management fee rate of funds in its expense group. The Board noted that the term “contractual management fee” for funds in the expense group may include both advisory and certain administrative services fees, but that Broadridge does not provide information on a fund by fund basis as to what is included. The Board noted that Invesco does not separately charge the Invesco Funds for the administrative services included in the term as defined by Broadridge. The Board also reviewed the methodology used by Broadridge in providing expense group information, which includes using each fund’s contractual management fee schedule (including any applicable breakpoints) as reported in the most recent prospectus or statement of additional information for each fund in the expense group.
The Board noted that Invesco Advisers has contractually agreed to waive fees and/or limit expenses of the Fund through February 28, 2018 in an amount necessary to limit total annual operating expenses to a specified percentage of average daily net assets for each class of the Fund.
The Board noted that Invesco Advisers and the Affiliated Sub-Advisers do not manage other mutual funds or client accounts with investment strategies comparable to those of the Fund.
The Board also considered the services that may be provided by the Affiliated Sub-Advisers pursuant to the sub-advisory contracts, as well as the fees payable by Invesco Advisers to the Affiliated Sub-Advisers pursuant to the sub-advisory contracts. The Board noted that Invesco Advisers retains overall responsibility for, and provides services to, sub-advised Invesco Funds, including oversight of the Affiliated Sub-Advisers as well as the additional services described herein other than day-to-day portfolio management. The Board also noted that the sub-advisory fees are not paid directly by the Fund, but rather, are payable by Invesco Advisers to the Affiliated Sub-Advisers.
| D. | Economies of Scale and Breakpoints |
The Board considered the extent to which there are economies of scale in the provision of advisory services to the Fund. The Board also considered that the Fund may benefit from economies of scale through contractual breakpoints in the Fund’s advisory fee schedule. The Board noted that the Fund shares directly in economies of scale through lower fees charged by third party service providers based on the combined size of the Invesco Funds advised by Invesco Advisers.
| E. | Profitability and Financial Resources |
The Board reviewed information from Invesco Advisers concerning the costs of the advisory and other services that Invesco Advisers and its affiliates provide to the Fund and the Invesco Funds and the profitability of Invesco Advisers and its affiliates in providing these services. The Board noted that Invesco Advisers continues to operate at a net profit from services Invesco Advisers and its affiliates provide to the Invesco
Funds. The Board noted that although Invesco Advisers received a minimal amount of revenues from advising the Fund, Invesco Advisers and its subsidiaries did not make a profit from managing the Fund. The Board received and accepted information from Invesco Advisers demonstrating that Invesco Advisers and each Affiliated Sub-Adviser are financially sound and have the resources necessary to perform their obligations under the investment advisory agreement and sub-advisory contracts.
| F. | Collateral Benefits to Invesco Advisers and its Affiliates |
The Board considered various other benefits received by Invesco Advisers and its affiliates from the relationship with the Fund, including the fees received for providing transfer agency and distribution services to the Fund. The Board considered comparative information regarding fees charged for these services, including information provided by Broadridge and other independent sources. The Board considered the performance of Invesco Advisers and its affiliates in providing these services and the organizational structure employed to provide these services. The Board also considered that these services are provided to the Fund pursuant to written contracts that are reviewed and approved on an annual basis by the Board; and that the services are required for the operation of the Fund.
The Board considered the benefits realized by Invesco Advisers and the Affiliated Sub-Advisers as a result of portfolio brokerage transactions executed through “soft dollar” arrangements. The Board noted that soft dollar arrangements may result in the Fund bearing costs to purchase research that may be used by Invesco Advisers or the Affiliated Sub-Advisers with other clients and may reduce Invesco Adviser’s or the Affiliated Sub-Adviser’s expenses. The Board also considered that it receives periodic reports from the Chief Compliance Officer of the Invesco Funds demonstrating that these arrangements are consistent with regulatory requirements. The Board did not deem the soft dollar arrangements to be inappropriate.
The Board considered that the Fund’s uninvested cash and cash collateral from any securities lending arrangements may be invested in money market funds advised by Invesco Advisers pursuant to procedures approved by the Board. The Board noted that Invesco Advisers receives advisory fees from these affiliated money market funds attributable to such investments, although Invesco Advisers has contractually agreed to waive through varying periods the advisory fees payable by the Invesco Funds with respect to certain investments in the affiliated money market funds. The waiver is in an amount equal to 100% of the net advisory fee Invesco Advisers receives from the affiliated money market funds with respect to the Fund’s investment in the affiliated money market funds of uninvested cash, but not cash collateral. The Board concluded that the amount of advisory fees received by Invesco Advisers from the
Fund’s investment of cash collateral from any securities lending arrangements in the affiliated money market funds is fair and reasonable.
The Board also considered that the Fund may use an affiliated broker to execute certain trades for the Fund to, among other things, control information leakage, and was advised that such trades would be executed in compliance with rules under the federal securities laws and consistent with best execution obligations.
25 Invesco Global Infrastructure Fund
Tax Information
Form 1099-DIV, Form 1042-S and other year-end tax information provide shareholders with actual calendar year amounts that should be included in their tax returns. Shareholders should consult their tax advisors.
The following distribution information is being provided as required by the Internal Revenue Code or to meet a specific state’s requirement.
The Fund designates the following amounts or, if subsequently determined to be different, the maximum amount allowable for its fiscal year ended October 31, 2017:
| | | | |
Federal and State Income Tax | |
Qualified Dividend Income* | | | 86.25 | % |
Corporate Dividends Received Deduction* | | | 32.22 | % |
U.S. Treasury Obligations* | | | 0 | % |
| | * | The above percentages are based on ordinary income dividends paid to shareholders during the Fund’s fiscal year. |
26 Invesco Global Infrastructure Fund
Trustees and Officers
The address of each trustee and officer is AIM Investment Funds (Invesco Investment Funds) (the “Trust”), 11 Greenway Plaza, Suite 1000, Houston, Texas 77046-1173. The trustees serve for the life of the Trust, subject to their earlier death, incapacitation, resignation, retirement or removal as more specifically provided in the Trust’s organizational documents. Each officer serves for a one year term or until their successors are elected and qualified. Column two below includes length of time served with predecessor entities, if any.
| | | | | | | | |
Name, Year of Birth and Position(s) Held with the Trust | | Trustee and/
or Officer Since | | Principal Occupation(s)
During Past 5 Years | | Number of
Funds in Fund
Complex
Overseen by
Trustee | | Other Directorship(s)
Held by Trustee During Past 5 Years |
| Interested Persons | | | | | | | | |
| Martin L. Flanagan1 — 1960 Trustee | | 2007 | | Executive Director, Chief Executive Officer and President, Invesco Ltd. (ultimate parent of Invesco and a global investment management firm); Trustee, The Invesco Funds; Vice Chair, Investment Company Institute; and Member of Executive Board, SMU Cox School of Business Formerly: Advisor to the Board, Invesco Advisers, Inc. (formerly known as Invesco Institutional (N.A.), Inc.); Chairman and Chief Executive Officer, Invesco Advisers, Inc. (registered investment adviser); Director, Chairman, Chief Executive Officer and President, Invesco Holding Company (US), Inc. (formerly IVZ Inc.) (holding company), Invesco Group Services, Inc. (service provider) and Invesco North American Holdings, Inc. (holding company); Director, Chief Executive Officer and President, Invesco Holding Company Limited (parent of Invesco and a global investment management firm); Director, Invesco Ltd.; Chairman, Investment Company Institute and President, Co-Chief Executive Officer, Co-President, Chief Operating Officer and Chief Financial Officer, Franklin Resources, Inc. (global investment management organization) | | 158 | | None |
Philip A. Taylor2 — 1954 Trustee and Senior Vice President | | 2006 | | Head of the Americas and Senior Managing Director, Invesco Ltd.; Director, Invesco Advisers, Inc. (formerly known as Invesco Institutional (N.A.), Inc.) (registered investment adviser); Director, Chairman, Chief Executive Officer and President, Invesco Management Group, Inc. (formerly known as Invesco Aim Management Group, Inc.) (financial services holding company); Director and Chairman, Invesco Investment Services, Inc. (formerly known as Invesco Aim Investment Services, Inc.) (registered transfer agent); Chief Executive Officer, Invesco Corporate Class Inc. (corporate mutual fund company); Director, Chairman and Chief Executive Officer, Invesco Canada Ltd. (formerly known as Invesco Trimark Ltd./Invesco Trimark Ltèe) (registered investment adviser and registered transfer agent); Trustee and Senior Vice President, The Invesco Funds; Director, Invesco Investment Advisers LLC (formerly known as Van Kampen Asset Management). Formerly: Co-Chairman, Co-President and Co-Chief Executive Officer, Invesco Advisers, Inc. (formerly known as Invesco Institutional (N.A.), Inc.) (registered investment adviser); Director, Chief Executive Officer and President, Van Kampen Exchange Corp; President and Principal Executive Officer, The Invesco Funds (other than AIM Treasurer’s Series Trust (Invesco Treasurer’s Series Trust), Short-Term Investments Trust and Invesco Management Trust); Executive Vice President, The Invesco Funds (AIM Treasurer’s Series Trust (Invesco Treasurer’s Series Trust), Short-Term Investments Trust and Invesco Management Trust only); Director and President, INVESCO Funds Group, Inc. (registered investment adviser and registered transfer agent); Director and Chairman, IVZ Distributors, Inc. (formerly known as INVESCO Distributors, Inc.) (registered broker dealer); Director, President and Chairman, Invesco Inc. (holding company), Invesco Canada Holdings Inc. (holding company), Trimark Investments Ltd./Placements Trimark Ltèe and Invesco Financial Services Ltd/Services Financiers Invesco Ltèe; Chief Executive Officer, Invesco Canada Fund Inc. (corporate mutual fund company); Director and Chairman, Van Kampen Investor Services Inc.; Director, Chief Executive Officer and President, 1371 Preferred Inc. (holding company) and Van Kampen Investments Inc.; Director and President, AIM GP Canada Inc. (general partner for limited partnerships) and Van Kampen Advisors, Inc.; Director and Chief Executive Officer, Invesco Trimark Dealer Inc. (registered broker dealer); Director, Invesco Distributors, Inc. (formerly known as Invesco Aim Distributors, Inc.) (registered broker dealer); Manager, Invesco PowerShares Capital Management LLC; Director, Chief Executive Officer and President, Invesco Advisers, Inc.; Director, Chairman, Chief Executive Officer and President, Invesco Aim Capital Management, Inc.; President, Invesco Trimark Dealer Inc. and Invesco Trimark Ltd./Invesco Trimark Ltèe; Director and President, AIM Trimark Corporate Class Inc. and AIM Trimark Canada Fund Inc.; Senior Managing Director, Invesco Holding Company Limited; Director and Chairman, Fund Management Company (former registered broker dealer); President and Principal Executive Officer, The Invesco Funds (AIM Treasurer’s Series Trust (Invesco Treasurer’s Series Trust), and Short-Term Investments Trust only); President, AIM Trimark Global Fund Inc. and AIM Trimark Canada Fund Inc. | | 158 | | None |
| 1 | Mr. Flanagan is considered an interested person (within the meaning of Section 2(a)(19) of the 1940 Act) of the Trust because he is an officer of the Adviser to the Trust, and an officer and a director of Invesco Ltd., ultimate parent of the Adviser. |
| 2 | Mr. Taylor is considered an interested person (within the meaning of Section 2(a)(19) of the 1940 Act) of the Trust because he is an officer and a director of the Adviser. |
T-1 Invesco Global Infrastructure Fund
Trustees and Officers—(continued)
| | | | | | | | |
Name, Year of Birth and Position(s) Held with the Trust | | Trustee and/
or Officer Since | | Principal Occupation(s) During Past 5 Years | | Number of
Funds in Fund
Complex
Overseen by
Trustee | | Other Directorship(s)
Held by Trustee During Past 5 Years |
| Independent Trustees | | | | | | | | |
Bruce L. Crockett — 1944 Trustee and Chair | | 2001 | | Chairman, Crockett Technologies Associates (technology consulting company) Formerly: Director, Captaris (unified messaging provider); Director, President and Chief Executive Officer, COMSAT Corporation; Chairman, Board of Governors of INTELSAT (international communications company); ACE Limited (insurance company); Independent Directors Council and Investment Company Institute: Member of the Audit Committee, Investment Company Institute; Member of the Executive Committee and Chair of the Governance Committee, Independent Directors Council | | 158 | | Director and Chairman of the Audit Committee, ALPS (Attorneys Liability Protection Society) (insurance company); Director and Member of the Audit Committee, Ferroglobe PLC (metallurgical company) |
David C. Arch — 1945 Trustee | | 2010 | | Chairman of Blistex Inc. (consumer health care products manufacturer); Member, World Presidents’ Organization | | 158 | | Board member of the Illinois Manufacturers’ Association |
James T. Bunch — 1942 Trustee | | 2003 | | Managing Member, Grumman Hill Group LLC (family office/private equity investments) Formerly: Chairman of the Board, Denver Film Society; Chairman of the Board of Trustees, Evans Scholarship Foundation; Chairman, Board of Governors, Western Golf Association | | 158 | | Trustee, Evans Scholarship Foundation |
Jack M. Fields — 1952 Trustee | | 2001 | | Chief Executive Officer, Twenty First Century Group, Inc. (government affairs company); and Discovery Learning Alliance (non-profit) Formerly: Owner and Chief Executive Officer, Dos Angeles Ranch L.P. (cattle, hunting, corporate entertainment); Director, Insperity, Inc. (formerly known as Administaff) (human resources provider); Chief Executive Officer, Texana Timber LP (sustainable forestry company); Director of Cross Timbers Quail Research Ranch (non-profit); and member of the U.S. House of Representatives | | 158 | | None |
Cynthia Hostetler — 1962 Trustee | | 2017 | | Non-Executive Director and Trustee of a number of public and private business corporations Formerly: Head of Investment Funds and Private Equity, Overseas Private Investment Corporation; President, First Manhattan Bancorporation, Inc.; Attorney, Simpson Thacher & Bartlett LLP | | 158 | | Vulcan Materials Company (construction materials company); Trilinc Global Impact Fund; Aberdeen Investment Funds (4 portfolios); Artio Global Investment LLC (mutual fund complex); Edgen Group, Inc. (specialized energy and infrastructure products distributor) |
Eli Jones — 1961 Trustee | | 2016 | | Professor and Dean, Mays Business School — Texas A&M University Formerly: Professor and Dean, Walton College of Business, University of Arkansas and E.J. Ourso College of Business, Louisiana State University; Director, Arvest Bank | | 158 | | Insperity, Inc. (formerly known as Administaff) (human resources provider) |
Prema Mathai-Davis — 1950 Trustee | | 2001 | | Retired. Formerly: Chief Executive Officer, YWCA of the U.S.A. | | 158 | | None |
Teresa M. Ressel — 1962 Trustee | | 2017 | | Non-executive director and trustee of a number of public and private business corporations Formerly: Chief Financial Officer, Olayan America, The Olayan Group (international investor/commercial/industrial); Chief Executive Officer, UBS Securities LLC; Group Chief Operating Officer, Americas, UBS AG; Assistant Secretary for Management & Budget and CFO, US Department of the Treasury; Chief Compliance Officer, Kaiser Permanente (healthcare consortium); Program Manager, Hewlett-Packard; Nuclear Engineering, General Dynamics Corporation (aerospace and defense company) | | 158 | | Atlantic Power Corporation (power generation company); ON Semiconductor Corp. (semiconductor supplier) |
Larry Soll — 1942 Trustee | | 2003 | | Retired. Formerly: Chairman, Chief Executive Officer and President, Synergen Corp. (a biotechnology company) | | 158 | | None |
Ann Barnett Stern — 1957 Trustee | | 2017 | | President and Chief Executive Officer, Houston Endowment Inc. (private philanthropic institution) Formerly: Executive Vice President and General Counsel, Texas Children’s Hospital; Attorney, Beck, Redden and Secrest, LLP; Business Law Instructor, University of St. Thomas; Attorney, Andrews & Kurth LLP | | 158 | | Federal Reserve Bank of Dallas |
Raymond Stickel, Jr. — 1944 Trustee | | 2005 | | Retired. Formerly: Director, Mainstay VP Series Funds, Inc. (25 portfolios); Partner, Deloitte & Touche | | 158 | | None |
Robert C. Troccoli — 1949 Trustee | | 2016 | | Adjunct Professor, University of Denver — Daniels College of Business Formerly: Senior Partner, KPMG LLP | | 158 | | None |
T-2 Invesco Global Infrastructure Fund
Trustees and Officers—(continued)
| | | | | | | | |
Name, Year of Birth and Position(s) Held with the Trust | | Trustee and/
or Officer Since | | Principal Occupation(s) During Past 5 Years | | Number of
Funds in Fund
Complex
Overseen by
Trustee | | Other Directorship(s)
Held by Trustee During Past 5 Years |
| Independent Trustees—(continued) |
Christopher L. Wilson — 1957 Trustee | | 2017 | | Managing Partner, CT2, LLC (investing and consulting firm) Formerly: President/Chief Executive Officer, Columbia Funds, Bank of America Corporation; President/Chief Executive Officer, CDC IXIS Asset Management Services, Inc.; Principal & Director of Operations, Scudder Funds, Scudder, Stevens & Clark, Inc.; Assistant Vice President, Fidelity Investments | | 158 | | TD Asset Management USA Inc. (mutual fund complex) (22 portfolios); ISO New England, Inc. (non-profit organization managing regional electricity market) |
| Other Officers | | | | | | | | |
Sheri Morris — 1964 President, Principal Executive Officer and Treasurer | | 1999 | | President, Principal Executive Officer and Treasurer, The Invesco Funds; Vice President, Invesco Advisers, Inc. (formerly known as Invesco Institutional (N.A.), Inc.) (registered investment adviser); and Vice President, PowerShares Exchange-Traded Fund Trust, PowerShares Exchange-Traded Fund Trust II, PowerShares India Exchange-Traded Fund Trust, PowerShares Actively Managed Exchange-Traded Fund Trust and PowerShares Actively Managed Exchange-Traded Commodity Fund Trust Formerly: Vice President and Principal Financial Officer, The Invesco Funds; Vice President, Invesco Aim Advisers, Inc., Invesco Aim Capital Management, Inc. and Invesco Aim Private Asset Management, Inc.; Assistant Vice President and Assistant Treasurer, The Invesco Funds and Assistant Vice President, Invesco Advisers, Inc., Invesco Aim Capital Management, Inc. and Invesco Aim Private Asset Management, Inc.; and Treasurer, PowerShares Exchange-Traded Fund Trust, PowerShares Exchange-Traded Fund Trust II, PowerShares India Exchange-Traded Fund Trust and PowerShares Actively Managed Exchange-Traded Fund Trust | | N/A | | N/A |
Russell C. Burk — 1958 Senior Vice President and Senior Officer | | 2005 | | Senior Vice President and Senior Officer, The Invesco Funds | | N/A | | N/A |
John M. Zerr — 1962 Senior Vice President, Chief Legal Officer and Secretary | | 2006 | | Director, Senior Vice President, Secretary and General Counsel, Invesco Management Group, Inc. (formerly known as Invesco AIM Management Group, Inc.); Senior Vice President, Invesco Advisers, Inc. (formerly known as Invesco Institutional (N.A.), Inc.) (registered investment adviser); Senior Vice President and Secretary, Invesco Distributors, Inc. (formerly known as Invesco AIM Distributors, Inc.); Director, Vice President and Secretary, Invesco Investment Services, Inc. (formerly known as Invesco AIM Investment Services, Inc.) Senior Vice President, Chief Legal Officer and Secretary, The Invesco Funds; Managing Director, Invesco PowerShares Capital Management LLC; Director, Secretary and General Counsel, Invesco Investment Advisers LLC (formerly known as Van Kampen Asset Management); Secretary and General Counsel, Invesco Capital Markets, Inc. (formerly known as Van Kampen Funds Inc.) and Chief Legal Officer, PowerShares Exchange-Traded Fund Trust, PowerShares Exchange-Traded Fund Trust II, PowerShares India Exchange-Traded Fund Trust, PowerShares Actively Managed Exchange-Traded Fund Trust and PowerShares Actively Managed Exchange-Traded Commodity Fund Trust; Manager and Secretary, Invesco Indexing LLC Formerly: Director, Secretary, General Counsel and Senior Vice President, Van Kampen Exchange Corp.; Director, Vice President and Secretary, IVZ Distributors, Inc. (formerly known as INVESCO Distributors, Inc.); Director and Vice President, INVESCO Funds Group, Inc.; Director and Vice President, Van Kampen Advisors Inc.; Director, Vice President, Secretary and General Counsel, Van Kampen Investor Services Inc.; Director, Invesco Distributors, Inc. (formerly known as Invesco AIM Distributors, Inc.); Director, Senior Vice President, General Counsel and Secretary, Invesco AIM Advisers, Inc. and Van Kampen Investments Inc.; Director, Vice President and Secretary, Fund Management Company; Director, Senior Vice President, Secretary, General Counsel and Vice President, Invesco AIM Capital Management, Inc.; Chief Operating Officer and General Counsel, Liberty Ridge Capital, Inc. (an investment adviser); Vice President and Secretary, PBHG Funds (an investment company) and PBHG Insurance Series Fund (an investment company); Chief Operating Officer, General Counsel and Secretary, Old Mutual Investment Partners (a broker-dealer); General Counsel and Secretary, Old Mutual Fund Services (an administrator) and Old Mutual Shareholder Services (a shareholder servicing center); Executive Vice President, General Counsel and Secretary, Old Mutual Capital, Inc. (an investment adviser); and Vice President and Secretary, Old Mutual Advisors Funds (an investment company) | | N/A | | N/A |
Gregory G. McGreevey — 1962 Senior Vice President | | 2012 | | Senior Managing Director, Invesco Ltd.; Director, Chairman, President, and Chief Executive Officer, Invesco Advisers, Inc. (formerly known as Invesco Institutional (N.A.), Inc.) (registered investment adviser); Senior Vice President, Invesco Management Group, Inc.; Director, Invesco Mortgage Capital, Inc. and Invesco Senior Secured Management, Inc.; and Senior Vice President, The Invesco Funds Formerly: Assistant Vice President, The Invesco Funds | | N/A | | N/A |
T-3 Invesco Global Infrastructure Fund
Trustees and Officers—(continued)
| | | | | | | | |
Name, Year of Birth and Position(s) Held with the Trust | | Trustee and/
or Officer Since | | Principal Occupation(s) During Past 5 Years | | Number of
Funds in Fund
Complex
Overseen by
Trustee | | Other Directorship(s)
Held by Trustee During Past 5 Years |
| Other Officers—(continued) | | | | | | | | |
Kelli Gallegos — 1970 Vice President, Principal Financial Officer and Assistant Treasurer | | 2008 | | Vice President, Principal Financial Officer and Assistant Treasurer, The Invesco Funds; Assistant Treasurer, Invesco PowerShares Capital Management LLC, PowerShares Exchange-Traded Fund Trust, PowerShares Exchange-Traded Fund Trust II, PowerShares India Exchange-Traded Fund Trust, PowerShares Actively Managed Exchange-Traded Fund Trust and PowerShares Actively Managed Exchange-Traded Commodity Fund Trust Formerly: Assistant Vice President, The Invesco Funds | | N/A | | N/A |
Tracy Sullivan — 1962 Vice President, Chief Tax Officer and Assistant Treasurer | | 2008 | | Vice President, Chief Tax Officer and Assistant Treasurer, The Invesco Funds; Assistant Treasurer, Invesco PowerShares Capital Management LLC, PowerShares Exchange-Traded Fund Trust, PowerShares Exchange-Traded Fund Trust II, PowerShares India Exchange-Traded Fund Trust, PowerShares Actively Managed Exchange-Traded Fund Trust and PowerShares Actively Managed Exchange-Traded Commodity Fund Trust Formerly: Assistant Vice President, The Invesco Funds | | N/A | | N/A |
Crissie M. Wisdom — 1969 Anti-Money Laundering Compliance Officer | | 2013 | | Anti-Money Laundering Compliance Officer, Invesco Advisers, Inc. (formerly known as Invesco Institutional (N.A.), Inc.) (registered investment adviser), Invesco Capital Markets, Inc. (formerly known as Van Kampen Funds Inc.), Invesco Distributors, Inc., Invesco Investment Services, Inc., Invesco Management Group, Inc., The Invesco Funds, and PowerShares Exchange-Traded Fund Trust, PowerShares Exchange-Traded Fund Trust II, PowerShares India Exchange-Traded Fund Trust, PowerShares Actively Managed Exchange-Traded Fund Trust and PowerShares Actively Managed Exchange-Traded Commodity Fund Trust; Anti-Money Laundering Compliance Officer and Bank Secrecy Act Officer, INVESCO National Trust Company and Invesco Trust Company; and Fraud Prevention Manager and Controls and Risk Analysis Manager for Invesco Investment Services, Inc. Formerly: Anti-Money Laundering Compliance Officer, Van Kampen Exchange Corp. | | N/A | | N/A |
Robert R. Leveille — 1969 Chief Compliance Officer | | 2016 | | Chief Compliance Officer, Invesco Advisers, Inc. (registered investment adviser); and Chief Compliance Officer, The Invesco Funds Formerly: Chief Compliance Officer, Putnam Investments and the Putnam Funds | | N/A | | N/A |
The Statement of Additional Information of the Trust includes additional information about the Fund’s Trustees and is available upon request, without charge, by calling 1.800.959.4246. Please refer to the Fund’s Statement of Additional Information for information on the Fund’s sub-advisers.
| | | | | | |
Office of the Fund 11 Greenway Plaza, Suite 1000 Houston, TX 77046-1173 | | Investment Adviser Invesco Advisers, Inc. 1555 Peachtree Street, N.E. Atlanta, GA 30309 | | Distributor Invesco Distributors, Inc. 11 Greenway Plaza, Suite 1000 Houston, TX 77046-1173 | | Auditors PricewaterhouseCoopers LLP 1000 Louisiana Street, Suite 5800 Houston, TX 77002-5678 |
| | | |
| | | | | | |
Counsel to the Fund Stradley Ronon Stevens & Young, LLP 2005 Market Street, Suite 2600 Philadelphia, PA 19103-7018 | | Counsel to the Independent Trustees Goodwin Procter LLP 901 New York Avenue, N.W. Washington, D.C. 20001 | | Transfer Agent Invesco Investment Services, Inc. 11 Greenway Plaza, Suite 1000 Houston, TX 77046-1173 | | Custodian State Street Bank and Trust Company 225 Franklin Street Boston, MA 02110-2801 |
T-4 Invesco Global Infrastructure Fund
Explore High-Conviction Investing with Invesco

Go paperless with eDelivery
Visit invesco.com/edelivery to enjoy the convenience and security of anytime electronic access to your investment documents.
With eDelivery, you can elect to have any or all of the following materials delivered straight to your inbox to download, save and print from your own computer:
| ∎ | | Fund reports and prospectuses |
Invesco mailing information
Send general correspondence to Invesco Investment Services, Inc., P.O. Box 219078, Kansas City, MO 64121-9078.
Important notice regarding delivery of security holder documents
To reduce Fund expenses, only one copy of most shareholder documents may be mailed to shareholders with multiple accounts at the same address (Householding). Mailing of your shareholder documents may be householded indefinitely unless you instruct us otherwise. If you do not want the mailing of these documents to be combined with those for other members of your household, please contact Invesco Investment Services, Inc. at 800 959 4246 or contact your financial institution. We will begin sending you individual copies for each account within 30 days after receiving your request.
Fund holdings and proxy voting information
The Fund provides a complete list of its holdings four times in each fiscal year, at the quarter ends. For the second and fourth quarters, the lists appear in the Fund’s semiannual and annual reports to shareholders. For the first and third quarters, the Fund files the lists with the Securities and Exchange Commission (SEC) on Form N-Q. The most recent list of portfolio holdings is available at invesco.com/completeqtrholdings. Shareholders can also look up the Fund’s Forms N-Q on the SEC website at sec.gov. Copies of the Fund’s Forms N-Q may be reviewed and copied at the SEC Public Reference Room in Washington, D.C. You can obtain information on the operation of the Public Reference Room, including information about duplicating fee charges, by calling 202 551 8090 or 800 732 0330, or by electronic request at the following email address: publicinfo@sec.gov. The SEC file numbers for the Fund are shown below.
A description of the policies and procedures that the Fund uses to determine how to vote proxies relating to portfolio securities is available without charge, upon request, from our Client Services department at 800 959 4246 or at invesco.com/proxyguidelines. The information is also available on the SEC website, sec.gov.
| | |
Information regarding how the Fund voted proxies related to its portfolio securities during the most recent 12-month period ended June 30 is available at invesco.com/proxysearch. The information is also available on the SEC website, sec.gov. Invesco Advisers, Inc. is an investment adviser; it provides investment advisory services to individual and institutional clients and does not sell securities. Invesco Distributors, Inc. is the US distributor for Invesco Ltd.’s retail mutual funds, exchange-traded funds and institutional money market funds. Both are wholly owned, indirect subsidiaries of Invesco Ltd. | |  |
| | | | | | |
| SEC file numbers: 811-05426 and 033-19338 | | Invesco Distributors, Inc. | | GBLI-AR-1 | | 12132017 1112 |

Letters to Shareholders
| | |

Philip Taylor | | Dear Shareholders: This annual report includes information about your Fund, including performance data and a complete list of its investments as of the close of the reporting period. Inside is a discussion of how your Fund was managed and the factors that affected its performance during the reporting period. American voters went to the polls just days after the start of the reporting period, and their decisions quickly affected markets. The US stock market rallied strongly after the election, with major market indexes rising, and setting record highs, throughout the reporting period. Generally positive economic data, strong corporate earnings and hope for tax and regulatory reform contributed to the rally. US and global bond markets, as well as emerging market equities, sold off immediately following the election – with the US bond market eventually |
recovering most of its losses. Overseas, economic data were mixed, prompting the European Central Bank and central banks in China and Japan, among other countries, to maintain extraordinarily accommodative monetary policies. Citing positive economic trends – specifically, realized and expected labor market conditions and inflation – the US Federal Reserve raised interest rates three times during the reporting period: first in December 2016, and then again in March and June 2017. Health care and tax reform proved to be more difficult than expected to enact, with little progress achieved by the end of the reporting period.
Short-term market volatility can prompt some investors to abandon their investment plans – and can cause others to settle for whatever returns the market has to offer. The investment professionals at Invesco, in contrast, invest with high conviction. This means that, no matter the asset class or the strategy, each investment team has a passion to exceed. We want to help investors achieve better outcomes, such as seeking higher returns, helping mitigate risk and generating income. Of course, investing with high conviction can’t guarantee a profit or ensure success; no investment strategy can. To learn more about how we invest with high conviction, visit invesco.com/HighConviction.
You, too, can invest with high conviction by maintaining a long-term investment perspective and by working with your financial adviser on a regular basis. During periods of short-term market volatility or uncertainty, your financial adviser can keep you focused on your long-term investment goals – a new home, a child’s college education or a secure retirement. He or she also can share research about the economy, the markets and individual investment options.
Visit our website for more information on your investments
Our website, invesco.com/us, offers a wide range of market insights and investment perspectives. On the website, you’ll find detailed information about our funds, including performance, holdings and portfolio manager commentaries. You can access information about your account by completing a simple, secure online registration. To do so, select “Log In” on the right side of the homepage, and then select “Register for Individual Account Access.”
In addition to the resources accessible on our website and through our mobile app, you can obtain timely updates to help you stay informed about the markets and the economy by connecting with Invesco on Twitter, LinkedIn or Facebook. You can access our blog at blog.invesco.us.com. Our goal is to provide you the information you want, when and where you want it.
Finally, I’m pleased to share with you Invesco’s commitment to both the Principles for Responsible Investment and to considering environmental, social and governance issues in our robust investment process. I invite you to learn more at invesco.com/esg.
Have questions?
For questions about your account, contact an Invesco client services representative at 800 959 4246. For Invesco-related questions or comments, please email me directly at phil@invesco.com.
All of us at Invesco look forward to serving your investment management needs. Thank you for investing with us.
Sincerely,

Philip Taylor
Senior Managing Director, Invesco Ltd.
2 Invesco Global Market Neutral Fund
| | | | |

Bruce Crockett | | Dear Fellow Shareholders: Among the many important lessons I’ve learned in more than 40 years in a variety of business endeavors is the value of a trusted advocate. As independent chair of the Invesco Funds Board, I can assure you that the members of the Board are strong advocates for the interests of investors in Invesco’s mutual funds. We work hard to represent your interests through oversight of the quality of the investment management services your funds receive and other matters important to your investment, including but not limited to: |
| | ∎ | | Ensuring that Invesco offers a diverse lineup of mutual funds that your financial adviser can use to strive to meet your financial needs as your investment goals change over time. |
| | ∎ | | Monitoring how the portfolio management teams of the Invesco funds are performing in light of changing economic and market conditions. |
| ∎ | Assessing each portfolio management team’s investment performance within the context of the investment strategy described in the fund’s prospectus. |
∎ Monitoring for potential conflicts of interests that may impact the nature of the services that your funds receive.
We believe one of the most important services we provide our fund shareholders is the annual review of the funds’ advisory and sub-advisory contracts with Invesco Advisers and its affiliates. This review is required by the Investment Company Act of 1940 and focuses on the nature and quality of the services Invesco provides as the adviser to the Invesco funds and the reasonableness of the fees that it charges for those services. Each year, we spend months carefully reviewing information received from Invesco and a variety of independent sources, such as performance and fee data prepared by Lipper, Inc. (a subsidiary of Broadridge Financial Solutions, Inc.), an independent, third-party firm widely recognized as a leader in its field. We also meet with our independent legal counsel and other independent advisers to review and help us assess the information that we have received. Our goal is to assure that you receive quality investment management services for a reasonable fee.
I trust the measures outlined above provide assurance that you have a worthy advocate when it comes to choosing the Invesco Funds. As always, please contact me at bruce@brucecrockett.com with any questions or concerns you may have. On behalf of the Board, we look forward to continuing to represent your interests and serving your needs.
Sincerely,

Bruce L. Crockett
Independent Chair
Invesco Funds Board of Trustees
3 Invesco Global Market Neutral Fund
Management’s Discussion of Fund Performance
| | |
Performance summary For the fiscal year ended October 31, 2017, Class A shares of Invesco Global Market Neutral Fund (the Fund), at net asset value (NAV), outperformed the Citi US Three-Month Treasury Bill Index, the Fund’s broad market/style-specific benchmark. Your Fund’s long-term performance appears later in this report. |
| | |
Fund vs. Indexes Total returns, 10/31/16 to 10/31/17, at net asset value (NAV). Performance shown does not include applicable contingent deferred sales charges (CDSC) or front-end sales charges, which would have reduced performance. |
| | | | |
| |
| Class A Shares | | | 1.51 | % |
| Class C Shares | | | 0.72 | |
| Class R Shares | | | 1.22 | |
| Class Y Shares | | | 1.81 | |
| Class R5 Shares | | | 1.81 | |
| Class R6 Shares | | | 1.71 | |
| Citi US Three-Month Treasury Bill Indexq (Broad Market/Style-Specific Index) | | | 0.71 | |
| Lipper Alternative Equity Market Neutral Funds Index∎ (Peer Group Index) | | | 4.34 | |
| | |
Source(s): qFactSet Research Systems Inc., ∎Lipper Inc. |
Market conditions and your Fund
The reporting period began with major US stock market indexes posting gains and most hitting record highs following the US presidential election. Investors believed that the new administration’s plans to reduce tax rates, scale back regulations and increase infrastructure spending had the potential to stimulate economic growth. However, that was called into question in the first quarter of 2017, when it appeared that enacting significant regulatory and tax reform might be more difficult than previously anticipated.
Outside the US, Brexit (the UK’s plan to leave the European Union) remained a source of political and economic uncertainty, while improved economic data and confidence surveys raised the prospect of less accommodative monetary policy in continental Europe. In Asia, increased exports helped Japan’s economy, while China’s economy continued to stabilize. Most international markets, including emerging markets, performed well during the reporting period. In addition to an improving global economic outlook, other positive tailwinds for international markets included continued weakness in the US dollar and reduced expectations for a major shift in US trade policy.
Interestingly, while 2017 marked the eighth year of the global bull market, we saw a shift in leadership as international stocks outperformed US stocks in the first three quarters of 2017, primarily due to a weaker US dollar. Previously, international stocks had trailed US stocks for four consecutive years and in six of the last seven years. As the reporting period came to a close, both developed and emerging equity markets appeared somewhat fully valued despite material discounts to the US market. In addition, recent earnings growth and earnings revision trends improved for many non-US developed markets.
The Fund follows a market neutral strategy, which is intended to produce a portfolio that experiences minimal influence from the return patterns of the general global stock market. The Fund seeks neutral positioning in terms of beta (market exposure) by seeking to maintain neutral country, sector and industry exposures. The Fund uses a systematic model that evaluates fundamental and behavioral factors to forecast individual security returns and risks and ranks these securities based on their attractiveness relative to industry peers. Implementation occurs by establishing a portfolio with long positions in highly ranked stocks and shorting those that are poorly ranked. As such, the goal is to provide absolute risk adjusted returns over a full market cycle, regardless of the direction of the equity markets.
| | | | | | | | | | |
Portfolio Composition | | | | | | | | | | |
By sector, based on total net assets | | | | | | | | | | |
| | | Equity Securities | | Gross | | Net | | |
| | | Long1 | | Short2 | | Exposure3 | | Exposure4 | | |
Industrials | | 19.9% | | 17.8% | | 37.7% | | 2.1% | | |
Information Technology | | 17.2 | | 15.9 | | 33.1 | | 1.3 | | |
Consumer Discretionary | | 14.7 | | 14.5 | | 29.2 | | 0.2 | | |
Health Care | | 10.5 | | 10.3 | | 20.8 | | 0.2 | | |
Materials | | 10.2 | | 8.9 | | 19.1 | | 1.3 | | |
Energy | | 7.5 | | 6.6 | | 14.1 | | 0.9 | | |
Financials | | 4.9 | | 4.9 | | 9.8 | | 0.0 | | |
Consumer Staples | | 3.9 | | 3.8 | | 7.7 | | 0.1 | | |
Utilities | | 2.6 | | 2.7 | | 5.3 | | -0.1 | | |
Real Estate | | 1.9 | | 5.4 | | 7.3 | | -3.5 | | |
Telecommunication Services | | 0.8 | | 2.0 | | 2.8 | | -1.2 | | |
Money Market Funds
Plus Other Assets Less Liabilities | | 5.9 | | 0.0 | | 5.9 | | 5.9 | | |
Total | | 100.0 | | 92.8 | | 192.8 | | 7.2 | | |
| 1 | Represents the value of the equity securities in the portfolio. |
| 2 | Represents the value of the equity securities underlying the Fund’s equity short portfolio swaps. |
| 3 | Represents the cumulative exposure of the Fund’s long and short positions. |
| 4 | Represents the net exposure of the Fund’s long and short positions. |
| | |
| Total Net Assets | | $17.0 million |
| Data presented here are as of October 31, 2017. |
4 Invesco Global Market Neutral Fund
In a market neutral construct, a positive spread between the top- and bottom-ranked stocks (long and short candidates for the portfolio) is intended to result in the Fund’s outperformance relative to the Citi US Three-Month Treasury Bill Index. The largest contributors to Fund performance for the fiscal year were holdings in the health care, consumer discretionary and information technology (IT) sectors. Holdings in the industrials and telecommunication services sectors were key detractors from Fund performance during the reporting period.
In the health care sector, both the long and short positions in the health care equipment/services industry performed as expected and aided absolute Fund performance. In the consumer discretionary sector, stock selection on both the long and short side of the Fund contributed to Fund performance – primarily due to long holdings in the automobile industry. Finally, long holdings in the IT sector, specifically in the internet software/services and IT services industries, also contributed to Fund performance during the reporting period.
Holdings in the industrials sector were key detractors from Fund performance for the reporting period. These included holdings in the commercial and professional services and transportation (non-airline) industries. Within telecommunication services, both long and short holdings failed to perform as expected.
Please note that the Fund may utilize derivative instruments that include equity-related total return swaps and futures contracts. During the reporting period, the Fund utilized equity-related total return swaps to efficiently implement its strategy and gain long and/or short exposure to the various sectors/ industries described above, but did not use futures contracts. The implementation impact of using equity-related total return swaps is a component of transaction costs. Derivatives may amplify traditional investment risks through the creation of leverage and may be less liquid than traditional securities.
Thank you for your investment in Invesco Global Market Neutral Fund.
The views and opinions expressed in management’s discussion of Fund performance are those of Invesco Advisers, Inc. These views and opinions are subject to change at any time based on factors such as market and economic conditions. These views and opinions may not be relied upon as investment advice or recommendations, or as an offer for a particular security. The information is not a complete analysis of every aspect of any market, country, industry, security or the Fund. Statements of fact are from sources considered reliable, but Invesco Advisers, Inc. makes no representation or warranty as to their completeness or accuracy. Although historical performance is no guarantee of future results, these insights may help you understand our investment management philosophy.
See important Fund and, if applicable, index disclosures later in this report.
| | |
 | | Michael Abata Chartered Financial Analyst, Portfolio Manager, is manager of Invesco Global Market Neutral Fund. |
| He joined Invesco in 2011. Mr. Abata earned a BA in economics from Binghamton University. |
| | |
 | | Uwe Draeger Portfolio Manager, is manager of Invesco Global Market Neutral Fund. He joined Invesco in 2005. |
| Mr. Draeger earned a Diplom-Ökonom degree from Hochschule für Ökonomie Berlin, an MA from City of London Polytechnic and an MBA from Anglia Business School (Cambridge). |
| | |
 | | Nils Huter Chartered Financial Analyst, Portfolio Manager, is manager of Invesco Global Market Neutral Fund. |
| He joined Invesco in 2007. Mr. Huter earned a business administration degree, Diplom Kaufmann (FH), the University of Applied Sciences and Arts in Hildesheim. |
| | |
 | | Donna Chapman Wilson Portfolio Manager and Director of Portfolio Management, is manager of Invesco Global Market Neutral Fund. She joined |
| Invesco in 1997. Ms. Chapman Wilson earned a BA in economics from Hampton University and an MBA in finance from the Wharton School of the University of Pennsylvania. |
5 Invesco Global Market Neutral Fund
Your Fund’s Long-Term Performance
Results of a $10,000 Investment – Oldest Share Class(es) since Inception
Fund and index data from 12/19/13
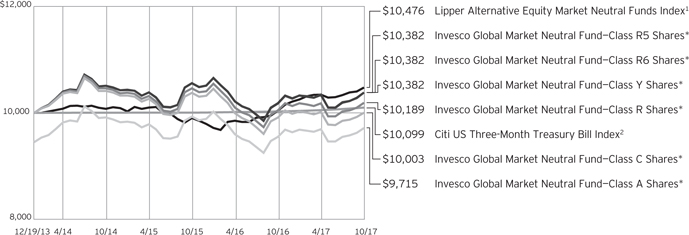
1 Source: Lipper Inc.
2 Source: FactSet Research Systems Inc.
*Includes the effect of the Adviser pay-in for an economic loss of $0.52 per share
Past performance cannot guarantee comparable future results.
The data shown in the chart include reinvested distributions, applicable sales charges and Fund expenses including
management fees. Index results include reinvested dividends, but they do not reflect sales charges. Performance of the peer group, if applicable, reflects fund expenses and management fees;
performance of a market index does not. Performance shown in the chart and table(s) does not reflect deduction of taxes a shareholder would pay on Fund distributions or sale of Fund shares.
6 Invesco Global Market Neutral Fund
| | | | |
Average Annual Total Returns | | |
| As of 10/31/17, including maximum applicable sales charges | | |
| | | |
| | |
Class A Shares | | | | |
Inception (12/19/13) | | –0.75%* | | |
1 Year | | –4.10 | | |
| | |
Class C Shares | | | | |
Inception (12/19/13) | | 0.01%* | | |
1 Year | | –0.28 | | |
| | |
Class R Shares | | | | |
Inception (12/19/13) | | 0.49%* | | |
1 Year | | 1.22 | | |
| | |
Class Y Shares | | | | |
Inception (12/19/13) | | 0.97%* | | |
1 Year | | 1.81 | | |
| | |
Class R5 Shares | | | | |
Inception (12/19/13) | | 0.97%* | | |
1 Year | | 1.81 | | |
| | |
Class R6 Shares | | | | |
Inception (12/19/13) | | 0.97%* | | |
1 Year | | 1.71 | | |
* Amount includes the effect of the Adviser pay-in for an economic loss of $0.41 per share for the fiscal period-end 2014 and $0.11 for fiscal period-end 2015. Had the pay-in not been made, average annual total returns were estimated at -0.66%, -1.39%, -0.90%, -0.39%, -0.39% and -0.39% for Class A, Class C, Class R, Class Y, Class R5 and Class R6 shares, respectively. |
The performance data quoted represent past performance and cannot guarantee comparable future results; current performance may be lower or higher. Please visit invesco.com/performance for the most recent month-end performance. Performance figures reflect reinvested distributions, changes in net asset value and the effect of the maximum sales charge unless otherwise stated. Investment return and principal value will fluctuate so that you may have a gain or loss when you sell shares.
The net annual Fund operating expense ratio set forth in the most recent Fund prospectus as of the date of this report for Class A, Class C, Class R, Class Y, Class R5 and Class R6 shares was 1.50%, 2.25%, 1.75%, 1.25%, 1.25% and 1.25%, respectively.1,2 The total annual Fund operating expense ratio set forth in the most recent Fund prospectus as of the date of this report for Class A, Class C, Class R, Class Y, Class R5 and Class R6 shares was 2.60%, 3.35%, 2.85%, 2.35%, 2.27% and 2.27%, respectively. The expense ratios presented above may vary from the expense ratios presented in other
| | | | |
Average Annual Total Returns | | |
| As of 9/30/17, the most recent calendar quarter end, including maximum applicable sales charges | | |
| | |
Class A Shares | | | | |
Inception (12/19/13) | | –1.00%** | | |
1 Year | | –3.95 | | |
| | |
Class C Shares | | | | |
Inception (12/19/13) | | –0.21%** | | |
1 Year | | –0.17 | | |
| | |
Class R Shares | | | | |
Inception (12/19/13) | | 0.26%** | | |
1 Year | | 1.33 | | |
| | |
Class Y Shares | | | | |
Inception (12/19/13) | | 0.73%** | | |
1 Year | | 1.83 | | |
| | |
Class R5 Shares | | | | |
Inception (12/19/13) | | 0.76%** | | |
1 Year | | 1.93 | | |
| | |
Class R6 Shares | | | | |
Inception (12/19/13) | | 0.76%** | | |
1 Year | | 1.82 | | |
** Amount includes the effect of the Adviser pay-in for an economic loss of $0.41 per share for the fiscal period-end 2014 and $0.11 for fiscal period-end 2015. Had the pay-in not been made, average annual total returns were estimated at -0.92%, -1.65%, -1.17%, -0.68%, -0.65% and -0.65% for Class A, Class C, Class R, Class Y, Class R5 and Class R6 shares, respectively. |
sections of this report that are based on expenses incurred during the period covered by this report.
Class A share performance reflects the maximum 5.50% sales charge, and Class C share performance reflects the applicable contingent deferred sales charge (CDSC) for the period involved. The CDSC on Class C shares is 1% for the first year after purchase. Class R, Class Y, Class R5 and Class R6 class shares do not have a front-end sales charge or a CDSC; therefore, performance is at net asset value.
The performance of the Fund’s share classes will differ primarily due to different sales charge structures and class expenses.
Fund performance reflects any applicable fee waivers and/or expense reimbursements. Had the adviser not waived fees and/or reimbursed expenses currently or in the past, returns would have been lower. See current prospectus for more information.
| 1 | Total annual Fund operating expenses after any contractual fee waivers and/or expense reimbursements by the adviser in effect through at least February 28, 2019. See current prospectus for more information. |
| 2 | Total annual Fund operating expenses after any contractual fee waivers and/or expense reimbursements by the adviser in effect through at least June 30, 2019. See current prospectus for more information. |
7 Invesco Global Market Neutral Fund
Invesco Global Market Neutral Fund’s investment objective is to seek to provide a positive return over a full market cycle from a broadly diversified portfolio of stocks while seeking to limit exposure to the general risks associated with the stock market investing.
| ∎ | Unless otherwise stated, information presented in this report is as of October 31, 2017, and is based on total net assets. |
| ∎ | Unless otherwise noted, all data provided by Invesco. |
| ∎ | To access your Fund’s reports/prospectus, visit invesco.com/fundreports. |
About share classes
| ∎ | Class R shares are generally available only to employer sponsored retirement and benefit plans. Please see the prospectus for more information. |
| ∎ | Class Y shares are available only to certain investors. Please see the prospectus for more information. |
| ∎ | Class R5 shares and Class R6 shares are available for use by retirement plans that meet certain standards and for institutional investors. Class R6 shares are also available through intermediaries that have established an agreement with Invesco Distributors, Inc. to make such shares available for use in retail omnibus accounts. Please see the prospectus for more information. |
Principal risks of investing in the Fund
| ∎ | Derivatives risk. The value of a derivative instrument depends largely on (and is derived from) the value of an underlying security, currency, commodity, interest rate, index or other asset (each referred to as an underlying asset). In addition to risks relating to the underlying assets, the use of derivatives may include other, possibly greater, risks, including counterparty, leverage and liquidity risks. Counterparty risk is the risk that the counterparty to the derivative contract will default on its obligation to pay the Fund the amount owed or otherwise perform under the derivative contract. Derivatives create leverage risk because they do not require payment up front equal to the economic exposure created by owning the derivative. As a result, an adverse change in the value of the underlying asset could result in the Fund sustaining a loss that is substantially greater than the amount invested in the derivative, which may make the Fund’s returns more volatile and increase the risk of loss. Derivative instruments may also be less liquid than |
| | more traditional investments and the Fund may be unable to sell or close out its derivative positions at a desirable time or price. This risk may be more acute under adverse market conditions, during which the Fund may be most in need of liquidating its derivative positions. Derivatives may also be harder to value, less tax efficient and subject to changing government regulation that could impact the Fund’s ability to use certain derivatives or their cost. The SEC has proposed new regulations related to the use of derivatives and related instruments by registered investment companies. If adopted as proposed, these regulations would limit the Fund’s ability to engage in derivatives transactions and may result in increased costs or require the Fund to modify its investment strategies or to liquidate. Also, derivatives used for hedging or to gain or limit exposure to a particular market segment may not provide the expected benefits, particularly during adverse market conditions. These risks are greater for the Fund than most other mutual funds because the Fund will implement its investment strategy primarily through derivative instruments rather than direct investments in stocks/bonds. |
| ∎ | Foreign securities risk. The Fund’s foreign investments may be adversely affected by political and social instability, changes in economic or taxation policies, difficulty in enforcing obligations, decreased liquidity or increased volatility. Foreign investments also involve the risk of the possible seizure, nationalization or expropriation of the issuer or foreign deposits (in which the Fund could lose its entire investments in a certain market) and the possible adoption of foreign governmental restrictions such as exchange controls. Unless the Fund has hedged its foreign securities risk, foreign securities risk also involves the risk of negative foreign currency rate fluctuations, which |
| | may cause the value of securities denominated in such foreign currency (or other instruments through which the Fund has exposure to foreign currencies) to decline in value. Currency exchange rates may fluctuate significantly over short periods of time. Currency hedging strategies, if used, are not always successful. |
| ∎ | Investing in the European Union risk. Investments in certain countries in the European Union are susceptible to high economic risks associated with high levels of debt, such as investments in sovereign debt of Greece, Italy and Spain. Efforts of the member states to further unify their economic and monetary policies may increase the potential for the downward movement of one member state’s market to cause a similar effect on other member states’ markets. Separately, the European Union faces issues involving its membership, structure, procedures and policies. The exit of one or more member states from the European Union, such as the United Kingdom (UK) which has announced its intention to exit, would place its currency and banking system in jeopardy. The exit by the UK or other member states will likely result in increased volatility, illiquidity and potentially lower economic growth in the affected markets, which will adversely affect the Fund’s investments. |
| ∎ | Management risk. The Fund is actively managed and depends heavily on the Adviser’s judgment about markets, interest rates or the attractiveness, relative values, liquidity, or potential appreciation of particular investments made for the Fund’s portfolio. The Fund could experience losses if these judgments prove to be incorrect. Additionally, legislative, regulatory, or tax developments may adversely affect management of the Fund and, therefore, the ability of the Fund to achieve its investment objective. In particular, there is no guarantee that the portfolio manager’s stock selection process will produce a market neutral portfolio that reduces or eliminates the Fund’s exposure to general US stock market risk, sector or industry-specific risk or market capitalization risk. In addition, the Fund’s market neutral investment strategy will likely |
|
|
This report must be accompanied or preceded by a currently effective Fund prospectus, which contains more complete information, including sales charges and expenses. Investors should read it carefully before investing. |
NOT FDIC INSURED | MAY LOSE VALUE | NO BANK GUARANTEE
8 Invesco Global Market Neutral Fund
| | cause the Fund to underperform the broader US equity market during market rallies. Such underperformance could be significant during sudden or significant market rallies. |
| ∎ | Market risk. The market values of the Fund’s investments, and therefore the value of the Fund’s shares, will go up and down, sometimes rapidly or unpredictably. Market risk may affect a single issuer, industry or section of the economy, or it may affect the market as a whole. Individual stock prices tend to go up and down more dramatically than those of certain other types of investments, such as bonds. During a general downturn in the financial markets, multiple asset classes may decline in value. When markets perform well, there can be no assurance that specific investments held by the Fund will rise in value. |
| ∎ | Preferred securities risk. Preferred securities are subject to issuer-specific and market risks applicable generally to equity securities. Preferred securities also may be subordinated to bonds or other debt instruments, subjecting them to a greater risk of non-payment, may be less liquid than many other securities, such as common stocks, and generally offer no voting rights with respect to the issuer. |
| ∎ | Short position risk. Because the Fund’s potential loss on a short position arises from increases in the value of the asset sold short, the Fund will incur a loss on a short position, which is theoretically unlimited, if the price of the asset sold short increases from the short sale price. The counterparty to a short position or other market factors may prevent the Fund from closing out a short position at a desirable time or price and may reduce or eliminate any gain or result in a loss. In a rising market, the Fund’s short positions will cause the Fund to underperform the overall market and its peers that do not engage in shorting. If the Fund holds both long and short positions, and both positions decline simultaneously, the short positions will not provide any buffer (hedge) from declines in value of the Fund’s long positions. Certain types of short positions involve leverage, which may exaggerate any losses, potentially |
| | more than the actual cost of the investment, and will increase the volatility of the Fund’s returns. |
| ∎ | Small- and mid-capitalization companies risks. Small- and mid-capitalization companies tend to be more vulnerable to changing market conditions, may have little or no operating history or track record of success, and may have more limited product lines and markets, less experienced management and fewer financial resources than larger companies. These companies’ securities may be more volatile and less liquid than those of more established companies, and their returns may vary, sometimes significantly, from the overall securities market. |
About indexes used in this report
| ∎ | The Citi US Three-Month Treasury Bill Index is an unmanaged index representative of three-month US Treasury bills. |
| ∎ | The Lipper Alternative Equity Market Neutral Funds Index is an unmanaged index considered representative of alternative equity market neutral funds tracked by Lipper. |
| ∎ | The Fund is not managed to track the performance of any particular index, including the index(es) described here, and consequently, the performance of the Fund may deviate significantly from the performance of the index(es). |
| ∎ | A direct investment cannot be made in an index. Unless otherwise indicated, index results include reinvested dividends, and they do not reflect sales charges. Performance of the peer group, if applicable, reflects fund expenses; performance of a market index does not. |
Other information
| ∎ | The returns shown in management’s discussion of Fund performance are based on net asset values (NAVs) calculated for shareholder transactions. Generally accepted accounting principles require adjustments to be made to the net assets of the Fund at period end for financial reporting purposes, and as such, the NAVs for shareholder transactions and the returns based on those NAVs may differ from the NAVs and returns reported in the Financial Highlights. |
| ∎ | Industry classifications used in this report are generally according to the Global Industry Classification Standard, which was developed by and is the exclusive property and a service mark of MSCI Inc. and Standard & Poor’s. |
9 Invesco Global Market Neutral Fund
Schedule of Investments
October 31, 2017
| | | | | | | | |
| | | Shares | | | Value | |
Common Stocks & Other Equity Interests–94.06% | |
| Australia–1.78% | |
BlueScope Steel Ltd. | | | 10,533 | | | $ | 103,891 | |
Cochlear Ltd. | | | 862 | | | | 116,384 | |
Metcash Ltd. | | | 40,564 | | | | 83,518 | |
| | | | | | | | 303,793 | |
|
| Austria–1.25% | |
OMV AG | | | 3,552 | | | | 213,424 | |
|
| Canada–5.11% | |
ARC Resources Ltd. | | | 7,526 | | | | 91,763 | |
Barrick Gold Corp. | | | 7,933 | | | | 114,620 | |
Canadian National Railway Co. | | | 933 | | | | 75,075 | |
Capital Power Corp. | | | 5,332 | | | | 100,970 | |
Enerplus Corp. | | | 16,411 | | | | 150,486 | |
Kinross Gold Corp.(a) | | | 20,800 | | | | 82,226 | |
Russel Metals Inc. | | | 4,133 | | | | 92,393 | |
West Fraser Timber Co., Ltd. | | | 2,674 | | | | 162,645 | |
| | | | | | | | 870,178 | |
|
| China–1.29% | |
Yangzijiang Shipbuilding Holdings Ltd. | | | 190,600 | | | | 220,230 | |
|
| Denmark–1.77% | |
Dfds A/S | | | 709 | | | | 41,124 | |
Vestas Wind Systems A/S | | | 2,957 | | | | 260,860 | |
| | | | | | | | 301,984 | |
|
| Finland–1.23% | |
Outokumpu Oyj | | | 5,419 | | | | 51,258 | |
UPM-Kymmene Oyj | | | 5,261 | | | | 158,117 | |
| | | | | | | | 209,375 | |
|
| France–3.08% | |
Faurecia | | | 1,325 | | | | 96,329 | |
Nexity S.A. | | | 2,200 | | | | 135,187 | |
Peugeot S.A. | | | 12,324 | | | | 292,365 | |
| | | | | | | | 523,881 | |
|
| Germany–4.83% | |
Covestro AG–REGS(b) | | | 2,625 | | | | 252,559 | |
Hochtief AG | | | 1,070 | | | | 189,283 | |
RWE AG(a) | | | 4,530 | | | | 113,244 | |
Siltronic AG(a) | | | 316 | | | | 46,823 | |
Software AG | | | 3,775 | | | | 192,215 | |
Suedzucker AG | | | 1,367 | | | | 27,156 | |
| | | | | | | | 821,280 | |
|
| Ireland–0.40% | |
Smurfit Kappa Group PLC | | | 2,282 | | | | 68,025 | |
|
| Japan–22.24% | |
AEON Mall Co., Ltd. | | | 1,900 | | | | 33,921 | |
Asahi Glass Co., Ltd. | | | 1,000 | | | | 39,299 | |
| | | | | | | | |
| | | Shares | | | Value | |
| Japan–(continued) | |
Benesse Holdings, Inc. | | | 1,000 | | | $ | 33,985 | |
Brother Industries, Ltd. | | | 13,000 | | | | 313,723 | |
Dai Nippon Printing Co., Ltd. | | | 10,000 | | | | 240,372 | |
Daiichikosho Co., Ltd. | | | 2,400 | | | | 113,221 | |
Daiwa House Industry Co., Ltd. | | | 2,500 | | | | 91,702 | |
Denka Co., Ltd. | | | 2,200 | | | | 73,590 | |
Fujitsu Ltd. | | | 37,000 | | | | 285,872 | |
Haseko Corp. | | | 6,300 | | | | 91,499 | |
Ibiden Co., Ltd. | | | 17,300 | | | | 290,230 | |
JTEKT Corp. | | | 4,800 | | | | 79,310 | |
K’s Holdings Corp. | | | 6,200 | | | | 142,230 | |
Konica Minolta Inc. | | | 4,000 | | | | 35,078 | |
Marubeni Corp. | | | 17,400 | | | | 116,571 | |
Mazda Motor Corp. | | | 6,100 | | | | 88,042 | |
Miraca Holdings Inc. | | | 2,000 | | | | 92,708 | |
Mitsubishi Corp. | | | 3,200 | | | | 74,989 | |
Mitsui & Co., Ltd. | | | 11,700 | | | | 174,995 | |
mixi, Inc. | | | 4,800 | | | | 234,913 | |
Nichirei Corp. | | | 1,300 | | | | 33,298 | |
Nippon Express Co., Ltd. | | | 500 | | | | 31,793 | |
Nippon Telegraph & Telephone Corp. | | | 900 | | | | 43,613 | |
Nishimatsu Construction Co., Ltd. | | | 3,600 | | | | 109,180 | |
Penta-Ocean Construction Co., Ltd. | | | 43,000 | | | | 285,042 | |
TDK Corp. | | | 600 | | | | 46,318 | |
Tokyo Gas Co., Ltd. | | | 8,000 | | | | 199,391 | |
Toppan Printing Co., Ltd. | | | 19,000 | | | | 192,224 | |
West Japan Railway Co. | | | 2,800 | | | | 197,471 | |
| | | | | | | | 3,784,580 | |
|
| Netherlands–0.87% | |
BE Semiconductor Industries N.V. | | | 626 | | | | 49,187 | |
PostNL N.V. | | | 10,140 | | | | 43,244 | |
Randstad Holding N.V. | | | 895 | | | | 55,069 | |
| | | | | | | | 147,500 | |
|
| Norway–0.50% | |
SalMar ASA | | | 2,873 | | | | 85,715 | |
|
| Panama–0.30% | |
Copa Holdings, S.A.–Class A | | | 408 | | | | 50,261 | |
|
| Singapore–0.50% | |
Genting Singapore PLC | | | 58,400 | | | | 52,269 | |
SATS Ltd. | | | 9,300 | | | | 32,067 | |
| | | | | | | | 84,336 | |
|
| Spain–1.97% | |
Distribuidora Internacional de Alimentacion S.A.(a) | | | 39,314 | | | | 192,347 | |
Endesa, S.A. | | | 1,144 | | | | 26,186 | |
Mediaset Espana Comunicacion S.A. | | | 10,715 | | | | 116,481 | |
| | | | | | | | 335,014 | |
See accompanying Notes to Financial Statements which are an integral part of the financial statements.
10 Invesco Global Market Neutral Fund
| | | | | | | | |
| | | Shares | | | Value | |
| Sweden–1.39% | |
Intrum Justitia AB | | | 4,910 | | | $ | 171,734 | |
JM AB | | | 2,433 | | | | 64,201 | |
| | | | | | | | 235,935 | |
|
| Switzerland–2.36% | |
Adecco Group AG | | | 413 | | | | 32,807 | |
Georg Fischer AG | | | 31 | | | | 38,238 | |
Lonza Group AG | | | 899 | | | | 238,808 | |
Oriflame Holding AG | | | 1,337 | | | | 48,090 | |
STMicroelectronics N.V. | | | 1,848 | | | | 43,485 | |
| | | | | | | | 401,428 | |
|
| United Kingdom–9.32% | |
Electrocomponents PLC | | | 15,299 | | | | 141,040 | |
Fiat Chrysler Automobiles N.V.(a) | | | 16,858 | | | | 291,426 | |
GlaxoSmithKline PLC | | | 7,162 | | | | 128,695 | |
Indivior PLC(a) | | | 11,018 | | | | 54,389 | |
Moneysupermarket.com Group PLC | | | 35,999 | | | | 155,371 | |
PageGroup PLC | | | 10,980 | | | | 68,130 | |
Persimmon PLC | | | 5,061 | | | | 188,379 | |
QinetiQ Group PLC | | | 33,661 | | | | 109,150 | |
Rio Tinto PLC | | | 1,171 | | | | 55,199 | |
Royal Dutch Shell PLC–Class B | | | 1,828 | | | | 58,846 | |
Subsea 7 S.A. | | | 9,666 | | | | 162,475 | |
Synthomer PLC | | | 8,800 | | | | 57,257 | |
WH Smith PLC | | | 4,232 | | | | 115,078 | |
| | | | | | | | 1,585,435 | |
|
| United States–33.87% | |
Aaron’s, Inc. | | | 3,713 | | | | 136,638 | |
AGNC Investment Corp. | | | 1,494 | | | | 30,074 | |
Amgen Inc. | | | 506 | | | | 88,661 | |
Assured Guaranty Ltd. | | | 1,540 | | | | 57,134 | |
AT&T Inc. | | | 2,603 | | | | 87,591 | |
Baxter International Inc. | | | 1,018 | | | | 65,630 | |
Best Buy Co., Inc. | | | 3,195 | | | | 178,856 | |
Biogen Inc.(a) | | | 717 | | | | 223,460 | |
Boeing Co. (The) | | | 1,223 | | | | 315,510 | |
Cabot Corp. | | | 1,843 | | | | 112,349 | |
Chemours Co. (The) | | | 3,058 | | | | 173,113 | |
Cisco Systems, Inc. | | | 6,385 | | | | 218,048 | |
Citigroup Inc. | | | 4,090 | | | | 300,615 | |
Darden Restaurants, Inc. | | | 1,562 | | | | 128,506 | |
Devon Energy Corp. | | | 3,743 | | | | 138,117 | |
E*TRADE Financial Corp.(a) | | | 942 | | | | 41,062 | |
Gilead Sciences, Inc. | | | 3,045 | | | | 228,253 | |
| | | | | | | | |
| | | Shares | | | Value | |
| United States–(continued) | |
Greif, Inc.–Class A | | | 726 | | | $ | 40,315 | |
HP Inc. | | | 15,013 | | | | 323,530 | |
HRG Group, Inc.(a) | | | 5,688 | | | | 92,259 | |
Humana Inc. | | | 263 | | | | 67,157 | |
InterDigital, Inc. | | | 1,220 | | | | 89,487 | |
Juniper Networks, Inc. | | | 1,671 | | | | 41,491 | |
Lear Corp. | | | 806 | | | | 141,526 | |
Lincoln National Corp. | | | 678 | | | | 51,379 | |
LyondellBasell Industries N.V.–Class A | | | 800 | | | | 82,824 | |
Navient Corp. | | | 8,176 | | | | 101,873 | |
NCR Corp.(a) | | | 784 | | | | 25,159 | |
Newmont Mining Corp. | | | 3,910 | | | | 141,386 | |
Office Depot, Inc. | | | 38,457 | | | | 119,217 | |
Pitney Bowes Inc. | | | 3,700 | | | | 50,838 | |
Potlatch Corp. | | | 1,165 | | | | 60,347 | |
Royal Caribbean Cruises Ltd. | | | 264 | | | | 32,675 | |
Sanderson Farms, Inc. | | | 323 | | | | 48,311 | |
Teradyne, Inc. | | | 3,812 | | | | 163,497 | |
Transocean Ltd.(a) | | | 13,091 | | | | 137,455 | |
Tupperware Brands Corp. | | | 1,471 | | | | 86,421 | |
United Therapeutics Corp.(a) | | | 404 | | | | 47,910 | |
Valero Energy Corp. | | | 2,887 | | | | 227,755 | |
VeriSign, Inc.(a) | | | 1,349 | | | | 145,044 | |
Vertex Pharmaceuticals Inc.(a) | | | 642 | | | | 93,880 | |
VMware, Inc.–Class A(a) | | | 769 | | | | 92,042 | |
Voya Financial, Inc. | | | 6,177 | | | | 248,068 | |
Wal-Mart Stores, Inc. | | | 634 | | | | 55,355 | |
WellCare Health Plans Inc.(a) | | | 1,689 | | | | 333,983 | |
Whiting Petroleum Corp.(a) | | | 5,717 | | | | 34,359 | |
Williams Cos., Inc. (The) | | | 2,247 | | | | 64,040 | |
| | | | | | | | 5,763,200 | |
Total Common Stocks & Other Equity Interests
(Cost $12,585,369) | | | | 16,005,574 | |
|
Money Market Funds–5.81% | |
Invesco Government & Agency
Portfolio–Institutional Class, 0.95%(c) | | | 593,079 | | | | 593,079 | |
Invesco Treasury
Portfolio–Institutional Class, 0.94%(c) | | | 395,386 | | | | 395,386 | |
Total Money Market Funds
(Cost $988,465) | | | | 988,465 | |
TOTAL INVESTMENTS IN SECURITIES–99.87%
(Cost $13,573,834) | | | | 16,994,039 | |
OTHER ASSETS LESS LIABILITIES–0.13% | | | | | | | 22,949 | |
NET ASSETS–100.00% | | | | | | $ | 17,016,988 | |
Investment Abbreviations:
Notes to Schedule of Investments:
| (a) | Non-income producing security. |
| (b) | Security purchased or received in transaction exempt from registration under the Securities Act of 1933, as amended (the “1933 Act”). The security may be resold pursuant to an exemption from registration under the 1933 Act, typically to qualified institutional buyers. The value of this security at October 31, 2017 was $252,559, which represented 1.48% of the Fund’s Net Assets. |
| (c) | The money market fund and the Fund are affiliated by having the same investment adviser. The rate shown is the 7-day SEC standardized yield as of October 31, 2017. |
See accompanying Notes to Financial Statements which are an integral part of the financial statements.
11 Invesco Global Market Neutral Fund
| | | | | | | | | | | | | | | | | | | | | | | | | | | | | | | | | | | | |
| Open Over–The–Counter Total Return Swap Agreements | |
| Reference Entity | | Counterparty | | | Maturity Date | | | Floating Rate Index(1) | | | Payment
Frequency | | | Notional
Value | | | Upfront
Payments
(Received) | | | Value(2)(3) | | | Unrealized Appreciation
(Depreciation)(2)(3) | | | Net Value of
Reference
Entities | |
Euro Area Equity Securities-Short | | | Morgan Stanley & Co. LLC | | | | 01/23/2019 | | | | Federal Funds floating rate | | | | Monthly | | | $ | (2,126,515 | ) | | $ | — | | | $ | 73,892 | | | $ | 73,892 | | | $ | (2,052,890 | ) |
Canada Equity Securities-Short | | | Morgan Stanley & Co. LLC | | | | 01/23/2019 | | | | Federal Funds floating rate | | | | Monthly | | | | (798,927 | ) | | | — | | | | 14,647 | | | | 14,647 | | | | (784,424 | ) |
Denmark Equity Securities-Short | | | Morgan Stanley & Co. LLC | | | | 01/23/2019 | | | | Federal Funds floating rate | | | | Monthly | | | | (179,294 | ) | | | — | | | | 5,842 | | | | 5,842 | | | | (173,478 | ) |
Sweden Equity Securities-Short | | | Morgan Stanley & Co. LLC | | | | 01/23/2019 | | | | Federal Funds floating rate | | | | Monthly | | | | (271,622 | ) | | | — | | | | 4,871 | | | | 4,871 | | | | (266,791 | ) |
Australia Equity Securities-Short | | | Morgan Stanley & Co. LLC | | | | 01/23/2019 | | | | Federal Funds floating rate | | | | Monthly | | | | (190,705 | ) | | | — | | | | 3,013 | | | | 3,013 | | | | (187,720 | ) |
Hong Kong Equity Securities-Short | | | Morgan Stanley & Co. LLC | | | | 10/17/2019 | | | | Federal Funds floating rate | | | | Monthly | | | | (30,010 | ) | | | — | | | | 259 | | | | 259 | | | | (29,745 | ) |
Norway Equity Securities-Short | | | Morgan Stanley & Co. LLC | | | | 01/23/2019 | | | | Federal Funds floating rate | | | | Monthly | | | | (160,312 | ) | | | — | | | | 145 | | | | 145 | | | | (160,191 | ) |
Subtotal — Appreciation | | | | | | | | — | | | | 102,669 | | | | 102,669 | | | | (3,655,239 | ) |
Japan Equity Securities-Short | | | Morgan Stanley & Co. LLC | | | | 01/23/2019 | | | | Federal Funds floating rate | | | | Monthly | | | | (3,857,840 | ) | | | — | | | | (63,805 | ) | | | (63,805 | ) | | | (3,922,082 | ) |
Switzerland Equity Securities-Short | | | Morgan Stanley & Co. LLC | | | | 01/23/2019 | | | | Federal Funds floating rate | | | | Monthly | | | | (411,319 | ) | | | — | | | | (60,018 | ) | | | (60,018 | ) | | | (471,390 | ) |
United States Equity Securities-Short | | | Morgan Stanley & Co. LLC | | | | 12/22/2017 | | | | Federal Funds floating rate | | | | Monthly | | | | (5,919,261 | ) | | | — | | | | (36,368 | ) | | | (36,368 | ) | | | (5,939,809 | ) |
United Kingdom Equity Securities-Short | | | Morgan Stanley & Co. LLC | | | | 01/23/2019 | | | | Federal Funds floating rate | | | | Monthly | | | | (1,192,079 | ) | | | — | | | | (20,623 | ) | | | (20,623 | ) | | | (1,212,846 | ) |
Spain Equity Securities-Short | | | Morgan Stanley & Co. LLC | | | | 02/25/2019 | | | | Federal Funds floating rate | | | | Monthly | | | | (318,812 | ) | | | — | | | | (9,597 | ) | | | (9,597 | ) | | | (328,456 | ) |
Singapore Equity Securities-Short | | | Morgan Stanley & Co. LLC | | | | 01/23/2019 | | | | Federal Funds floating rate | | | | Monthly | | | | (254,425 | ) | | | — | | | | (4,580 | ) | | | (4,580 | ) | | | (259,042 | ) |
Subtotal — Depreciation | | | | | | | | — | | | | (194,991 | ) | | | (194,991 | ) | | | (12,133,625 | ) |
Total Return Swap Agreements — Equity Risk | | | | | | | | | | | $ | — | | | $ | (92,322 | ) | | $ | (92,322 | ) | | $ | (15,788,864 | ) |
| (1) | The Fund receives or pays the total return on the short positions underlying the total return swap, and receives a specific Federal Funds floating rate. The total return swaps are settled in U.S. Dollars. |
| (2) | Amount includes $(14,579) of dividends payable and financing fees related to the reference entities. |
| (3) | Swaps are collateralized by $83,397 cash held with Morgan Stanley & Co. LLC, the Counterparty. |
The following table represents the individual short positions and related values of equity securities underlying the total return swaps with Morgan Stanley & Co. LLC, as of October 31, 2017.
| | | | | | | | | | | | |
| | | Shares | | | Value | | | Percentage of
Reference Entities | |
Equity Securities — Short–100.00% | | | | | |
| Australia–1.21% | | | | | | | | | | | | |
Bank of Queensland Ltd. | | | (12,361 | ) | | $ | (126,400 | ) | | | 0.83 | |
Brambles Ltd. | | | (4,096 | ) | | | (29,658 | ) | | | 0.19 | |
Crown Resorts Ltd. | | | (3,563 | ) | | | (31,662 | ) | | | 0.19 | |
| | | | | (187,720 | ) | | | 1.21 | |
| |
| Canada–5.09% | | | | | |
Enbridge Inc. | | | (927 | ) | | | (35,626 | ) | | | 0.23 | |
Gildan Activewear Inc. | | | (4,462 | ) | | | (136,547 | ) | | | 0.89 | |
Hydro One Ltd. | | | (5,009 | ) | | | (88,563 | ) | | | 0.57 | |
Osisko Gold Royalties Ltd. | | | (2,380 | ) | | | (29,960 | ) | | | 0.19 | |
Ritchie Bros. Auctioneers Inc. | | | (6,252 | ) | | | (175,333 | ) | | | 1.14 | |
Stella–Jones Inc. | | | (4,910 | ) | | | (191,818 | ) | | | 1.25 | |
Wheaton Precious Metals Corp. | | | (6,100 | ) | | | (126,577 | ) | | | 0.82 | |
| | | | | (784,424 | ) | | | 5.09 | |
| |
| Denmark–1.14% | | | | | |
Genmab A/S | | | (859 | ) | | | (173,478 | ) | | | 1.14 | |
| |
| Euro Area–13.53% | | | | | |
Amer Sports Oyj | | | (1,359 | ) | | | (33,831 | ) | | | 0.22 | |
Anheuser–Busch InBev S.A./N.V. | | | (1,322 | ) | | | (161,777 | ) | | | 1.06 | |
Banco BPM S.p.A. | | | (25,730 | ) | | | (89,739 | ) | | | 0.60 | |
Banco Comercial Portugues, S.A. | | | (233,456 | ) | | | (69,756 | ) | | | 0.44 | |
Bayerische Motoren Werke AG | | | (1,367 | ) | | | (139,337 | ) | | | 0.88 | |
Bollore S.A. | | | (25,568 | ) | | | (123,604 | ) | | | 0.77 | |
| | | | | | | | | | | | |
| | | Shares | | | Value | | | Percentage of
Reference Entities | |
| Euro Area–(continued) | | | | | |
Daimler AG | | | (3,584 | ) | | $ | (297,636 | ) | | | 1.84 | |
DBV Technologies S.A. | | | (3,079 | ) | | | (139,039 | ) | | | 1.03 | |
GEA Group AG | | | (1,792 | ) | | | (86,412 | ) | | | 0.54 | |
Groupe Eurotunnel SE | | | (5,916 | ) | | | (74,360 | ) | | | 0.47 | |
IMMOFINANZ AG | | | (16,814 | ) | | | (42,523 | ) | | | 0.28 | |
MorphoSys AG | | | (3,893 | ) | | | (338,126 | ) | | | 2.15 | |
Nokia Oyj | | | (50,911 | ) | | | (250,035 | ) | | | 1.97 | |
SBM Offshore N.V. | | | (9,393 | ) | | | (167,630 | ) | | | 1.03 | |
Unipol Gruppo S.p.A. | | | (8,661 | ) | | | (39,085 | ) | | | 0.25 | |
| | | | | (2,052,890 | ) | | | 13.53 | |
| |
| Hong Kong–0.19% | | | | | |
MGM China Holdings Ltd. | | | (13,200 | ) | | | (29,745 | ) | | | 0.19 | |
| |
| Japan–24.55% | | | | | |
Asahi Intecc Co., Ltd. | | | (1,400 | ) | | | (80,781 | ) | | | 0.49 | |
Daifuku Co., Ltd. | | | (3,500 | ) | | | (169,628 | ) | | | 1.05 | |
Fast Retailing Co., Ltd. | | | (100 | ) | | | (33,081 | ) | | | 0.21 | |
Hamamatsu Photonics K.K. | | | (8,400 | ) | | | (270,050 | ) | | | 1.69 | |
JGC Corp. | | | (15,200 | ) | | | (252,553 | ) | | | 1.61 | |
Kansai Paint Co., Ltd. | | | (8,500 | ) | | | (217,341 | ) | | | 1.33 | |
Keihan Holdings Co., Ltd. | | | (4,400 | ) | | | (133,908 | ) | | | 0.85 | |
Keyence Corp. | | | (500 | ) | | | (276,322 | ) | | | 1.70 | |
Kintetsu Group Holdings Co., Ltd. | | | (800 | ) | | | (30,610 | ) | | | 0.20 | |
Koito Manufacturing Co., Ltd. | | | (2,000 | ) | | | (132,641 | ) | | | 0.85 | |
Kyushu Electric Power Co., Inc. | | | (6,100 | ) | | | (69,215 | ) | | | 0.43 | |
See accompanying Notes to Financial Statements which are an integral part of the financial statements.
12 Invesco Global Market Neutral Fund
| | | | | | | | | | | | |
| | | Shares | | | Value | | | Percentage of
Reference Entities | |
| Japan–(continued) | | | | | |
Maruichi Steel Tube Ltd. | | | (1,400 | ) | | $ | (42,484 | ) | | | 0.26 | |
MISUMI Group Inc. | | | (11,800 | ) | | | (321,752 | ) | | | 1.96 | |
Nidec Corp. | | | (1,600 | ) | | | (211,030 | ) | | | 1.33 | |
Nihon M&A Center Inc. | | | (3,500 | ) | | | (166,549 | ) | | | 1.04 | |
Nintendo Co., Ltd. | | | (300 | ) | | | (115,578 | ) | | | 0.73 | |
Nippon Paint Holdings Co., Ltd. | | | (7,600 | ) | | | (266,057 | ) | | | 1.68 | |
Nitori Holdings Co., Ltd. | | | (500 | ) | | | (72,368 | ) | | | 0.47 | |
Ryohin Keikaku Co., Ltd. | | | (300 | ) | | | (88,134 | ) | | | 0.55 | |
Shimadzu Corp. | | | (5,000 | ) | | | (103,263 | ) | | | 0.65 | |
Shimano Inc. | | | (600 | ) | | | (81,643 | ) | | | 0.52 | |
SoftBank Group Corp. | | | (1,300 | ) | | | (113,740 | ) | | | 0.73 | |
Start Today Co., Ltd. | | | (1,000 | ) | | | (27,179 | ) | | | 0.20 | |
Topcon Corp. | | | (9,200 | ) | | | (192,837 | ) | | | 1.17 | |
Tsuruha Holdings Inc. | | | (1,100 | ) | | | (135,746 | ) | | | 0.86 | |
Welcia Holdings Co., Ltd. | | | (4,400 | ) | | | (166,418 | ) | | | 1.05 | |
Yamaha Motor Co., Ltd. | | | (5,100 | ) | | | (151,174 | ) | | | 0.94 | |
| | | | | (3,922,082 | ) | | | 24.55 | |
| |
| Norway–1.02% | | | | | |
Schibsted ASA–Class A | | | (3,999 | ) | | | (103,104 | ) | | | 0.66 | |
Schibsted ASA–Class B | | | (2,435 | ) | | | (57,087 | ) | | | 0.36 | |
| | | | | (160,191 | ) | | | 1.02 | |
| |
| Singapore–1.62% | | | | | |
Sembcorp Industries Ltd. | | | (107,000 | ) | | | (259,042 | ) | | | 1.62 | |
| |
| Spain–2.03% | | | | | |
Acerinox S.A. | | | (3,936 | ) | | | (56,557 | ) | | | 0.37 | |
Cellnex Telecom S.A. | | | (4,843 | ) | | | (120,251 | ) | | | 0.75 | |
Inmobiliaria Colonial Socimi S.A. | | | (15,936 | ) | | | (151,648 | ) | | | 0.91 | |
| | | | | (328,456 | ) | | | 2.03 | |
| |
| Sweden–1.73% | | | | | |
Fastighets AB Balder–Class B | | | (8,015 | ) | | | (208,719 | ) | | | 1.38 | |
Lundin Petroleum AB | | | (2,469 | ) | | | (58,072 | ) | | | 0.35 | |
| | | | | (266,791 | ) | | | 1.73 | |
| |
| Switzerland–2.62% | | | | | |
ams AG | | | (2,115 | ) | | | (192,822 | ) | | | 0.89 | |
Panalpina Welttransport Holding AG | | | (770 | ) | | | (105,975 | ) | | | 0.65 | |
Vifor Pharma AG | | | (1,342 | ) | | | (172,593 | ) | | | 1.08 | |
| | | | | (471,390 | ) | | | 2.62 | |
| |
| United Kingdom–7.59% | | | | | |
BBA Aviation PLC | | | (58,194 | ) | | | (245,984 | ) | | | 1.50 | |
Cobham PLC | | | (20,730 | ) | | | (38,277 | ) | | | 0.24 | |
Dixons Carphone PLC | | | (11,903 | ) | | | (27,418 | ) | | | 0.18 | |
Essentra PLC | | | (21,356 | ) | | | (150,925 | ) | | | 0.92 | |
Fresnillo PLC | | | (6,116 | ) | | | (105,781 | ) | | | 0.71 | |
GVC Holdings PLC | | | (3,157 | ) | | | (39,317 | ) | | | 0.24 | |
Hikma Pharmaceuticals PLC | | | (4,038 | ) | | | (62,438 | ) | | | 0.40 | |
Just Eat PLC | | | (15,709 | ) | | | (162,769 | ) | | | 0.95 | |
Mediclinic International PLC | | | (13,055 | ) | | | (100,932 | ) | | | 0.68 | |
| | | | | | | | | | | | |
| | | Shares | | | Value | | | Percentage of
Reference Entities | |
| United Kingdom–(continued) | | | | | |
Paddy Power Betfair PLC | | | (2,265 | ) | | $ | (231,830 | ) | | | 1.47 | |
Serco Group PLC | | | (30,457 | ) | | | (47,175 | ) | | | 0.30 | |
| | | | | (1,212,846 | ) | | | 7.59 | |
| |
| United States–37.68% | | | | | |
Acadia Healthcare Co., Inc. | | | (1,159 | ) | | | (36,346 | ) | | | 0.33 | |
ACADIA Pharmaceuticals Inc. | | | (2,185 | ) | | | (76,103 | ) | | | 0.50 | |
Advance Auto Parts, Inc. | | | (427 | ) | | | (34,903 | ) | | | 0.23 | |
Alnylam Pharmaceuticals, Inc. | | | (408 | ) | | | (49,711 | ) | | | 0.30 | |
Alphabet Inc.–Class A | | | (32 | ) | | | (33,057 | ) | | | 0.20 | |
Alphabet Inc.–Class C | | | (189 | ) | | | (192,145 | ) | | | 1.16 | |
Avnet, Inc. | | | (1,462 | ) | | | (58,187 | ) | | | 0.37 | |
Ball Corp. | | | (4,734 | ) | | | (203,230 | ) | | | 1.29 | |
Bank of the Ozarks | | | (864 | ) | | | (40,280 | ) | | | 0.25 | |
Callon Petroleum Co. | | | (6,190 | ) | | | (68,647 | ) | | | 0.41 | |
Cavium Inc. | | | (3,003 | ) | | | (207,177 | ) | | | 1.31 | |
Charter Communications, Inc.–Class A | | | (146 | ) | | | (48,789 | ) | | | 0.32 | |
Cheniere Energy, Inc. | | | (3,164 | ) | | | (147,885 | ) | | | 0.92 | |
Chipotle Mexican Grill, Inc. | | | (256 | ) | | | (69,606 | ) | | | 0.52 | |
Compass Minerals International, Inc. | | | (1,348 | ) | | | (88,429 | ) | | | 0.57 | |
Coty Inc.–Class A | | | (10,215 | ) | | | (157,311 | ) | | | 1.00 | |
Cousins Properties, Inc. | | | (3,835 | ) | | | (34,592 | ) | | | 0.23 | |
Dentsply Sirona Inc. | | | (1,433 | ) | | | (87,513 | ) | | | 0.56 | |
DexCom Inc. | | | (2,411 | ) | | | (108,423 | ) | | | 0.69 | |
Diamondback Energy Inc. | | | (1,567 | ) | | | (167,920 | ) | | | 1.00 | |
Diebold Nixdorf, Inc. | | | (3,500 | ) | | | (67,550 | ) | | | 0.47 | |
Dominion Energy, Inc. | | | (2,127 | ) | | | (172,585 | ) | | | 1.09 | |
Education Realty Trust, Inc. | | | (1,480 | ) | | | (51,652 | ) | | | 0.34 | |
Ellie Mae, Inc. | | | (582 | ) | | | (52,351 | ) | | | 0.33 | |
Envision Healthcare Corp. | | | (4,911 | ) | | | (209,209 | ) | | | 1.38 | |
Equinix, Inc. | | | (115 | ) | | | (53,303 | ) | | | 0.34 | |
Fastenal Co. | | | (2,401 | ) | | | (112,775 | ) | | | 0.75 | |
FireEye, Inc. | | | (3,073 | ) | | | (51,995 | ) | | | 0.33 | |
Gulfport Energy Corp. | | | (12,210 | ) | | | (167,277 | ) | | | 1.05 | |
Hexcel Corp. | | | (2,100 | ) | | | (127,449 | ) | | | 0.84 | |
Howard Hughes Corp. (The) | | | (1,625 | ) | | | (207,399 | ) | | | 1.30 | |
Johnson Controls International PLC | | | (5,548 | ) | | | (229,632 | ) | | | 1.47 | |
Kennedy–Wilson Holdings Inc. | | | (8,592 | ) | | | (167,114 | ) | | | 1.06 | |
Kroger Co. (The) | | | (1,301 | ) | | | (26,931 | ) | | | 0.18 | |
LCI Industries | | | (283 | ) | | | (35,035 | ) | | | 0.22 | |
MACOM Technology Solutions Holdings, Inc. | | | (1,035 | ) | | | (42,311 | ) | | | 0.26 | |
Markel Corp. | | | (210 | ) | | | (227,703 | ) | | | 1.44 | |
Mattel, Inc. | | | (8,358 | ) | | | (118,015 | ) | | | 0.82 | |
Monro, Inc. | | | (2,191 | ) | | | (108,126 | ) | | | 0.70 | |
Murphy USA Inc. | | | (980 | ) | | | (72,873 | ) | | | 0.46 | |
National Instruments Corp. | | | (751 | ) | | | (33,795 | ) | | | 0.21 | |
Neurocrine Biosciences, Inc. | | | (1,780 | ) | | | (110,556 | ) | | | 0.66 | |
O’Reilly Automotive, Inc. | | | (222 | ) | | | (46,831 | ) | | | 0.29 | |
See accompanying Notes to Financial Statements which are an integral part of the financial statements.
13 Invesco Global Market Neutral Fund
| | | | | | | | | | | | |
| | | Shares | | | Value | | | Percentage of
Reference Entities | |
| United States–(continued) | | | | | |
Parsley Energy, Inc.–Class A | | | (7,579 | ) | | $ | (201,601 | ) | | | 1.17 | |
Schlumberger Ltd. | | | (800 | ) | | | (51,200 | ) | | | 0.32 | |
SM Energy Co. | | | (2,991 | ) | | | (63,798 | ) | | | 0.34 | |
Tesla Inc. | | | (136 | ) | | | (45,088 | ) | | | 0.29 | |
Tractor Supply Co. | | | (3,034 | ) | | | (182,829 | ) | | | 1.13 | |
Ultimate Software Group, Inc. (The) | | | (400 | ) | | | (81,036 | ) | | | 0.49 | |
United Bankshares, Inc. | | | (4,117 | ) | | | (148,006 | ) | | | 0.96 | |
ViaSat, Inc. | | | (3,193 | ) | | | (207,864 | ) | | | 1.31 | |
Visa Inc.–Class A | | | (961 | ) | | | (105,691 | ) | | | 0.66 | |
Vulcan Materials Co. | | | (260 | ) | | | (31,655 | ) | | | 0.20 | |
Wabtec Corp. | | | (1,185 | ) | | | (90,653 | ) | | | 0.58 | |
WEC Energy Group, Inc. | | | (1,989 | ) | | | (134,039 | ) | | | 0.85 | |
Western Alliance Bancorp | | | (1,700 | ) | | | (94,860 | ) | | | 0.60 | |
Zayo Group Holdings, Inc. | | | (2,739 | ) | | | (98,768 | ) | | | 0.63 | |
| | | | | | | | (5,939,809 | ) | | | 37.68 | |
Total Equity Securities — Short | | | | | | $ | (15,788,864 | ) | | | 100.00 | |
See accompanying Notes to Financial Statements which are an integral part of the financial statements.
14 Invesco Global Market Neutral Fund
Statement of Assets and Liabilities
October 31, 2017
| | | | |
Assets: | | | | |
Investments in securities, at value (Cost $12,585,369) | | $ | 16,005,574 | |
Investments in affiliated money market funds, at value and cost | | | 988,465 | |
Other investments: | | | | |
Unrealized appreciation on swap agreements — OTC | | | 102,669 | |
Deposits with brokers: | | | | |
Cash Collateral — OTC derivatives | | | 83,397 | |
Foreign currencies, at value (Cost $18,186) | | | 18,189 | |
Receivable for: | | | | |
Fund shares sold | | | 11,485 | |
Dividends | | | 43,061 | |
Investment for trustee deferred compensation and retirement plans | | | 7,291 | |
Other assets | | | 56,752 | |
Total assets | | | 17,316,883 | |
|
Liabilities: | |
Other investments: | | | | |
Unrealized depreciation on swap agreements — OTC | | | 194,991 | |
Payable for: | | | | |
Accrued fees to affiliates | | | 9,217 | |
Accrued trustees’ and officers’ fees and benefits | | | 1,871 | |
Accrued other operating expenses | | | 86,525 | |
Trustee deferred compensation and retirement plans | | | 7,291 | |
Total liabilities | | | 299,895 | |
Net assets applicable to shares outstanding | | $ | 17,016,988 | |
|
Net assets consist of: | |
Shares of beneficial interest | | $ | 12,653,838 | |
Undistributed net investment income | | | (57,750 | ) |
Undistributed net realized gain | | | 1,093,127 | |
Net unrealized appreciation | | | 3,327,773 | |
| | | $ | 17,016,988 | |
| | | | |
Net Assets: | |
Class A | | $ | 7,654,356 | |
Class C | | $ | 381,347 | |
Class R | | $ | 32,240 | |
Class Y | | $ | 7,476,400 | |
Class R5 | | $ | 507,016 | |
Class R6 | | $ | 965,629 | |
|
Shares outstanding, no par value, with an
unlimited number of shares authorized: | |
Class A | | | 760,732 | |
Class C | | | 38,875 | |
Class R | | | 3,231 | |
Class Y | | | 737,486 | |
Class R5 | | | 50,001 | |
Class R6 | | | 95,209 | |
Class A: | | | | |
Net asset value per share | | $ | 10.06 | |
Maximum offering price per share | | | | |
(Net asset value of $10.06 ¸ 94.50%) | | $ | 10.65 | |
Class C: | | | | |
Net asset value and offering price per share | | $ | 9.81 | |
Class R: | | | | |
Net asset value and offering price per share | | $ | 9.98 | |
Class Y: | | | | |
Net asset value and offering price per share | | $ | 10.14 | |
Class R5: | | | | |
Net asset value and offering price per share | | $ | 10.14 | |
Class R6: | | | | |
Net asset value and offering price per share | | $ | 10.14 | |
See accompanying Notes to Financial Statements which are an integral part of the financial statements.
15 Invesco Global Market Neutral Fund
Statement of Operations
For the year ended October 31, 2017
| | | | |
Investment income: | |
Dividends (net of foreign withholding taxes of $20,898) | | $ | 366,538 | |
Dividends from affiliated money market funds | | | 7,994 | |
Total investment income | | | 374,532 | |
| |
Expenses: | | | | |
Advisory fees | | | 186,554 | |
Administrative services fees | | | 50,000 | |
Custodian fees | | | 10,000 | |
Distribution fees: | | | | |
Class A | | | 18,913 | |
Class C | | | 4,221 | |
Class R | | | 139 | |
Transfer agent fees — A, C, R and Y | | | 14,795 | |
Transfer agent fees — R5 | | | 55 | |
Transfer agent fees — R6 | | | 97 | |
Trustees’ and officers’ fees and benefits | | | 20,361 | |
Registration and filing fees | | | 80,222 | |
Reports to shareholders | | | 25,687 | |
Professional services fees | | | 92,457 | |
Other | | | 13,555 | |
Total expenses | | | 517,056 | |
Less: Fees waived and expenses reimbursed | | | (259,916 | ) |
Net expenses | | | 257,140 | |
Net investment income | | | 117,392 | |
| |
Realized and unrealized gain (loss) from: | | | | |
Net realized gain (loss) from: | | | | |
Investment securities | | | 1,512,587 | |
Foreign currencies | | | 5,291 | |
Swap agreements | | | (2,933,067 | ) |
| | | | (1,415,189 | ) |
Change in net unrealized appreciation (depreciation) of: | | | | |
Investment securities | | | 1,894,379 | |
Foreign currencies | | | 2,483 | |
Swap agreements | | | (270,324 | ) |
| | | | 1,626,538 | |
Net realized and unrealized gain | | | 211,349 | |
Net increase in net assets resulting from operations | | $ | 328,741 | |
See accompanying Notes to Financial Statements which are an integral part of the financial statements.
16 Invesco Global Market Neutral Fund
Statement of Changes in Net Assets
For the years ended October 31, 2017 and 2016
| | | | | | | | |
| | | 2017 | | | 2016 | |
Operations: | | | | | |
Net investment income | | $ | 117,392 | | | $ | 245,562 | |
Net realized gain (loss) | | | (1,415,189 | ) | | | (2,575,111 | ) |
Change in net unrealized appreciation | | | 1,626,538 | | | | 1,445,322 | |
Net increase (decrease) in net assets resulting from operations | | | 328,741 | | | | (884,227 | ) |
| | |
Distributions to shareholders from net realized gains: | | | | | | | | |
Class A | | | — | | | | (14,354 | ) |
Class C | | | — | | | | (1,226 | ) |
Class R | | | — | | | | (43 | ) |
Class Y | | | — | | | | (31,654 | ) |
Class R5 | | | — | | | | (1,295 | ) |
Class R6 | | | — | | | | (1,692 | ) |
Total distributions from net realized gains | | | — | | | | (50,264 | ) |
| | |
Share transactions–net: | | | | | | | | |
Class A | | | (190,910 | ) | | | 2,295,064 | |
Class C | | | (256,799 | ) | | | 115,558 | |
Class R | | | 8,513 | | | | 8,382 | |
Class Y | | | (4,966,606 | ) | | | 480,103 | |
Class R6 | | | 162,755 | | | | 144,850 | |
Net increase (decrease) in net assets resulting from share transactions | | | (5,243,047 | ) | | | 3,043,957 | |
Net increase (decrease) in net assets | | | (4,914,306 | ) | | | 2,109,466 | |
| | |
Net assets: | | | | | | | | |
Beginning of year | | | 21,931,294 | | | | 19,821,828 | |
End of year (includes undistributed net investment income of $(57,750) and $(183,040), respectively) | | $ | 17,016,988 | | | $ | 21,931,294 | |
See accompanying Notes to Financial Statements which are an integral part of the financial statements.
17 Invesco Global Market Neutral Fund
Notes to Financial Statements
October 31, 2017
NOTE 1—Significant Accounting Policies
Invesco Global Market Neutral Fund (the “Fund”) is a series portfolio of AIM Investment Funds (Invesco Investment Funds) (the “Trust”). The Trust is organized as a Delaware statutory trust and is registered under the Investment Company Act of 1940, as amended (the “1940 Act”), as an open-end series management investment company consisting of twenty separate series portfolios, each authorized to issue an unlimited number of shares of beneficial interest. The assets, liabilities and operations of each portfolio are accounted for separately. Information presented in these financial statements pertains only to the Fund. Matters affecting each portfolio or class will be voted on exclusively by the shareholders of such portfolio or class.
The Fund’s investment objective is to seek to provide a positive return over a full market cycle from a broadly diversified portfolio of stocks while seeking to limit exposure to the general risks associated with stock market investing.
The Fund currently consists of six different classes of shares: Class A, Class C, Class R, Class Y, Class R5 and Class R6. Class Y shares are available only to certain investors. Class A shares are sold with a front-end sales charge unless certain waiver criteria are met and under certain circumstances load waived shares may be subject to contingent deferred sales charges (“CDSC”). Class C shares are sold with a CDSC. Class R, Class Y, Class R5 and Class R6 shares are sold at net asset value.
The Fund is an investment company and accordingly follows the investment company accounting and reporting guidance in accordance with Financial Accounting Standards Board Accounting Standards Codification Topic 946, Financial Services — Investment Companies.
The following is a summary of the significant accounting policies followed by the Fund in the preparation of its financial statements.
| A. | Security Valuations — Securities, including restricted securities, are valued according to the following policy. |
A security listed or traded on an exchange (except convertible securities) is valued at its last sales price or official closing price as of the close of the customary trading session on the exchange where the security is principally traded, or lacking any sales or official closing price on a particular day, the security may be valued at the closing bid price on that day. Securities traded in the over-the-counter market are valued based on prices furnished by independent pricing services or market makers. When such securities are valued by an independent pricing service they may be considered fair valued. Futures contracts are valued at the final settlement price set by an exchange on which they are principally traded. Listed options are valued at the mean between the last bid and asked prices from the exchange on which they are principally traded. Options not listed on an exchange are valued by an independent source at the mean between the last bid and asked prices. For purposes of determining net asset value (“NAV”) per share, futures and option contracts generally are valued 15 minutes after the close of the customary trading session of the New York Stock Exchange (“NYSE”).
Investments in open-end and closed-end registered investment companies that do not trade on an exchange are valued at the end-of-day net asset value per share. Investments in open-end and closed-end registered investment companies that trade on an exchange are valued at the last sales price or official closing price as of the close of the customary trading session on the exchange where the security is principally traded.
Swap agreements are fair valued using an evaluated quote, if available, provided by an independent pricing service. Evaluated quotes provided by the pricing service are valued based on a model which may include end-of-day net present values, spreads, ratings, industry, company performance and returns of referenced assets. Centrally cleared swap agreements are valued at the daily settlement price determined by the relevant exchange or clearinghouse.
Debt obligations (including convertible securities) and unlisted equities are fair valued using an evaluated quote provided by an independent pricing service. Evaluated quotes provided by the pricing service may be determined without exclusive reliance on quoted prices, and may reflect appropriate factors such as institution-size trading in similar groups of securities, developments related to specific securities, dividend rate (for unlisted equities), yield (for debt obligations), quality, type of issue, coupon rate (for debt obligations), maturity (for debt obligations), individual trading characteristics and other market data. Pricing services generally value debt obligations assuming orderly transactions of institutional round lot size, but a fund may hold or transact in the same securities in smaller, odd lot sizes. Odd lots often trade at lower prices than institutional round lots. Debt obligations are subject to interest rate and credit risks. In addition, all debt obligations involve some risk of default with respect to interest and/or principal payments.
Foreign securities’ (including foreign exchange contracts) prices are converted into U.S. dollar amounts using the applicable exchange rates as of the close of the NYSE. If market quotations are available and reliable for foreign exchange-traded equity securities, the securities will be valued at the market quotations. Because trading hours for certain foreign securities end before the close of the NYSE, closing market quotations may become unreliable. If between the time trading ends on a particular security and the close of the customary trading session on the NYSE, events occur that the investment adviser determines are significant and make the closing price unreliable, the Fund may fair value the security. If the event is likely to have affected the closing price of the security, the security will be valued at fair value in good faith using procedures approved by the Board of Trustees. Adjustments to closing prices to reflect fair value may also be based on a screening process of an independent pricing service to indicate the degree of certainty, based on historical data, that the closing price in the principal market where a foreign security trades is not the current value as of the close of the NYSE. Foreign securities’ prices meeting the approved degree of certainty that the price is not reflective of current value will be priced at the indication of fair value from the independent pricing service. Multiple factors may be considered by the independent pricing service in determining adjustments to reflect fair value and may include information relating to sector indices, American Depositary Receipts and domestic and foreign index futures. Foreign securities may have additional risks including exchange rate changes, potential for sharply devalued currencies and high inflation, political and economic upheaval, the relative lack of issuer information, relatively low market liquidity and the potential lack of strict financial and accounting controls and standards.
Securities for which market prices are not provided by any of the above methods may be valued based upon quotes furnished by independent sources. The last bid price may be used to value equity securities. The mean between the last bid and asked prices is used to value debt obligations, including corporate loans.
Securities for which market quotations are not readily available or became unreliable are valued at fair value as determined in good faith by or under the supervision of the Trust’s officers following procedures approved by the Board of Trustees. Issuer specific events, market trends, bid/asked quotes of brokers and information providers and other market data may be reviewed in the course of making a good faith determination of a security’s fair value.
18 Invesco Global Market Neutral Fund
The Fund may invest in securities that are subject to interest rate risk, meaning the risk that the prices will generally fall as interest rates rise and, conversely, the prices will generally rise as interest rates fall. Specific securities differ in their sensitivity to changes in interest rates depending on their individual characteristics. Changes in interest rates may result in increased market volatility, which may affect the value and/or liquidity of certain Fund investments.
Valuations change in response to many factors including the historical and prospective earnings of the issuer, the value of the issuer’s assets, general economic conditions, interest rates, investor perceptions and market liquidity. Because of the inherent uncertainties of valuation, the values reflected in the financial statements may materially differ from the value received upon actual sale of those investments.
| B. | Securities Transactions and Investment Income — Securities transactions are accounted for on a trade date basis. Realized gains or losses on sales are computed on the basis of specific identification of the securities sold. Interest income (net of withholding tax, if any) is recorded on the accrual basis from settlement date. Dividend income (net of withholding tax, if any) is recorded on the ex-dividend date. |
The Fund may periodically participate in litigation related to Fund investments. As such, the Fund may receive proceeds from litigation settlements. Any proceeds received are included in the Statement of Operations as realized gain (loss) for investments no longer held and as unrealized gain (loss) for investments still held.
Brokerage commissions and mark ups are considered transaction costs and are recorded as an increase to the cost basis of securities purchased and/or a reduction of proceeds on a sale of securities. Such transaction costs are included in the determination of net realized and unrealized gain (loss) from investment securities reported in the Statement of Operations and the Statement of Changes in Net Assets and the net realized and unrealized gains (losses) on securities per share in the Financial Highlights. Transaction costs are included in the calculation of the Fund’s net asset value and, accordingly, they reduce the Fund’s total returns. These transaction costs are not considered operating expenses and are not reflected in net investment income reported in the Statement of Operations and the Statement of Changes in Net Assets, or the net investment income per share and the ratios of expenses and net investment income reported in the Financial Highlights, nor are they limited by any expense limitation arrangements between the Fund and the investment adviser.
The Fund allocates income and realized and unrealized capital gains and losses to a class based on the relative net assets of each class.
| C. | Country Determination — For the purposes of making investment selection decisions and presentation in the Schedule of Investments, the investment adviser may determine the country in which an issuer is located and/or credit risk exposure based on various factors. These factors include the laws of the country under which the issuer is organized, where the issuer maintains a principal office, the country in which the issuer derives 50% or more of its total revenues and the country that has the primary market for the issuer’s securities, as well as other criteria. Among the other criteria that may be evaluated for making this determination are the country in which the issuer maintains 50% or more of its assets, the type of security, financial guarantees and enhancements, the nature of the collateral and the sponsor organization. Country of issuer and/or credit risk exposure has been determined to be the United States of America, unless otherwise noted. |
| D. | Distributions — Distributions from net investment income and net realized capital gain, if any, are generally declared and paid annually and recorded on the ex-dividend date. The Fund may elect to treat a portion of the proceeds from redemptions as distributions for federal income tax purposes. |
| E. | Federal Income Taxes — The Fund intends to comply with the requirements of Subchapter M of the Internal Revenue Code of 1986, as amended (the “Internal Revenue Code”), necessary to qualify as a regulated investment company and to distribute substantially all of the Fund’s taxable earnings to shareholders. As such, the Fund will not be subject to federal income taxes on otherwise taxable income (including net realized capital gain) that is distributed to shareholders. Therefore, no provision for federal income taxes is recorded in the financial statements. |
The Fund recognizes the tax benefits of uncertain tax positions only when the position is more likely than not to be sustained. Management has analyzed the Fund’s uncertain tax positions and concluded that no liability for unrecognized tax benefits should be recorded related to uncertain tax positions. Management is not aware of any tax positions for which it is reasonably possible that the total amounts of unrecognized tax benefits will change materially in the next 12 months.
The Fund files tax returns in the U.S. Federal jurisdiction and certain other jurisdictions. Generally, the Fund is subject to examinations by such taxing authorities for up to three years after the filing of the return for the tax period.
| F. | Expenses — Fees provided for under the Rule 12b-1 plan of a particular class of the Fund are charged to the operations of such class. Transfer agency fees and expenses and other shareholder recordkeeping fees and expenses attributable to Class R5 and Class R6 are allocated to each share class based on relative net assets. Sub-accounting fees attributable to Class R5 are charged to the operations of the class. Transfer agency fees and expenses and other shareholder recordkeeping fees and expenses relating to all other classes are allocated among those classes based on relative net assets. All other expenses are allocated among the classes based on relative net assets. |
| G. | Accounting Estimates — The preparation of financial statements in conformity with accounting principles generally accepted in the United States of America (“GAAP”) requires management to make estimates and assumptions that affect the reported amounts of assets and liabilities at the date of the financial statements and the reported amounts of revenues and expenses during the reporting period including estimates and assumptions related to taxation. Actual results could differ from those estimates by a significant amount. In addition, the Fund monitors for material events or transactions that may occur or become known after the period-end date and before the date the financial statements are released to print. |
| H. | Indemnifications — Under the Trust’s organizational documents, each Trustee, officer, employee or other agent of the Trust is indemnified against certain liabilities that may arise out of the performance of their duties to the Fund. Additionally, in the normal course of business, the Fund enters into contracts, including the Fund’s servicing agreements, that contain a variety of indemnification clauses. The Fund’s maximum exposure under these arrangements is unknown as this would involve future claims that may be made against the Fund that have not yet occurred. The risk of material loss as a result of such indemnification claims is considered remote. |
| I. | Foreign Currency Translations — Foreign currency is valued at the close of the NYSE based on quotations posted by banks and major currency dealers. Portfolio securities and other assets and liabilities denominated in foreign currencies are translated into U.S. dollar amounts at date of valuation. Purchases and sales of portfolio securities (net of foreign taxes withheld on disposition) and income items denominated in foreign currencies are translated into U.S. dollar amounts on the respective dates of such transactions. The Fund does not separately account for the portion of the results of operations resulting from changes in foreign exchange rates on investments and the fluctuations arising from changes in market prices of securities held. The combined results of changes in foreign exchange rates and the fluctuation of market prices on investments (net of estimated foreign tax withholding) are included with the net realized and unrealized gain or loss from investments in the |
19 Invesco Global Market Neutral Fund
| | Statement of Operations. Reported net realized foreign currency gains or losses arise from (1) sales of foreign currencies, (2) currency gains or losses realized between the trade and settlement dates on securities transactions, and (3) the difference between the amounts of dividends, interest, and foreign withholding taxes recorded on the Fund’s books and the U.S. dollar equivalent of the amounts actually received or paid. Net unrealized foreign currency gains and losses arise from changes in the fair values of assets and liabilities, other than investments in securities at fiscal period end, resulting from changes in exchange rates. |
The Fund may invest in foreign securities, which may be subject to foreign taxes on income, gains on investments or currency repatriation, a portion of which may be recoverable. Foreign taxes, if any, are recorded based on the tax regulations and rates that exist in the foreign markets in which the Fund invests and are shown in the Statement of Operations.
| J. | Forward Foreign Currency Contracts — The Fund may engage in foreign currency transactions either on a spot (i.e. for prompt delivery and settlement) basis, or through forward foreign currency contracts, to manage or minimize currency or exchange rate risk. |
The Fund may also enter into forward foreign currency contracts for the purchase or sale of a security denominated in a foreign currency in order to “lock in” the U.S. dollar price of that security, or the Fund may also enter into forward foreign currency contracts that do not provide for physical settlement of the two currencies, but instead are settled by a single cash payment calculated as the difference between the agreed upon exchange rate and the spot rate at settlement based upon an agreed upon notional amount (non-deliverable forwards). The Fund will set aside liquid assets in an amount equal to the daily mark-to-market obligation for forward foreign currency contracts.
A forward foreign currency contract is an obligation between two parties (“Counterparties”) to purchase or sell a specific currency for an agreed-upon price at a future date. The use of forward foreign currency contracts does not eliminate fluctuations in the price of the underlying securities the Fund owns or intends to acquire but establishes a rate of exchange in advance. Fluctuations in the value of these contracts are measured by the difference in the contract date and reporting date exchange rates and are recorded as unrealized appreciation (depreciation) until the contracts are closed. When the contracts are closed, realized gains (losses) are recorded. Realized and unrealized gains (losses) on the contracts are included in the Statement of Operations. The primary risks associated with forward foreign currency contracts include failure of the Counterparty to meet the terms of the contract and the value of the foreign currency changing unfavorably. These risks may be in excess of the amounts reflected in the Statement of Assets and Liabilities.
| K. | Swap Agreements — The Fund may enter into various swap transactions, including interest rate, total return, volatility, variance, index, currency and credit default swap contracts (“CDS”) for investment purposes or to manage interest rate, equity, currency or credit risk. Such transactions are agreements between Counterparties. These agreements may contain among other conditions, events of default and termination events, and various covenants and representations such as provisions that require the Fund to maintain a pre-determined level of net assets, and/or provide limits regarding the decline of the Fund’s NAV over specific periods of time. If the Fund were to trigger such provisions and have open derivative positions at that time, the Counterparty may be able to terminate such agreement and request immediate payment in an amount equal to the net liability positions, if any. |
Interest rate, total return, volatility, variance, index, and currency swap agreements are two-party contracts entered into primarily to exchange the returns (or differentials in rates of returns) earned or realized on particular predetermined investments or instruments. The gross returns to be exchanged or “swapped” between the parties are calculated with respect to a notional amount, i.e., the return on or increase in value of a particular dollar amount invested at a particular interest rate or return of an underlying asset, in a particular foreign currency, or in a “basket” of securities representing a particular index.
A total return swap is an agreement in which one party makes payments based on a set rate, either fixed or variable, while the other party makes payments based on the return of an underlying asset, which includes both the income generated and capital gains, if any. The unrealized appreciation (depreciation) on total return swaps includes dividends on the underlying equity securities and financing rate payable from the Counterparty. At the maturity date, a net cash flow is exchanged where the total return is equivalent to the return of the underlying reference less a financing rate, if any. As a receiver, the Fund would receive payments based on any positive total return and would owe payments in the event of a negative total return. As the payer, the Fund would owe payments on any net positive total return, and would receive payment in the event of a negative total return.
Changes in the value of swap agreements are recognized as unrealized gains (losses) in the Statement of Operations by “marking to market” on a daily basis to reflect the value of the swap agreement at the end of each trading day. Payments received or paid at the beginning of the agreement are reflected as such on the Statement of Assets and Liabilities and may be referred to as upfront payments. The Fund accrues for the fixed payment stream and amortizes upfront payments, if any, on swap agreements on a daily basis with the net amount, recorded as a component of realized gain (loss) on the Statement of Operations. A liquidation payment received or made at the termination of a swap agreement is recorded as realized gain (loss) on the Statement of Operations. The Fund segregates cash or liquid securities having a value at least equal to the amount of the potential obligation of a Fund under any swap transaction. Cash held as collateral is recorded as deposits with brokers on the Statement of Assets and Liabilities. Entering into these agreements involves, to varying degrees, lack of liquidity and elements of credit, market, and Counterparty risk in excess of amounts recognized on the Statement of Assets and Liabilities. Such risks involve the possibility that a swap is difficult to sell or liquidate; the Counterparty does not honor its obligations under the agreement and unfavorable interest rates and market fluctuations. It is possible that developments in the swaps market, including potential government regulation, could adversely affect the Fund’s ability to terminate existing swap agreements or to realize amounts to be received under such agreements. A short position in a security poses more risk than holding the same security long. As there is no limit on how much the price of the security can increase, the Fund’s exposure is unlimited.
| L. | Leverage Risk — Leverage exists when the Fund can lose more than it originally invests because it purchases or sells an instrument or enters into a transaction without investing an amount equal to the full economic exposure of the instrument or transaction. |
| M. | Collateral — To the extent the Fund has designated or segregated a security as collateral and that security is subsequently sold, it is the Fund’s practice to replace such collateral no later than the next business day. |
20 Invesco Global Market Neutral Fund
NOTE 2—Advisory Fees and Other Fees Paid to Affiliates
The Trust has entered into a master investment advisory agreement with Invesco Advisers, Inc. (the “Adviser” or “Invesco”). Effective January 1, 2017, under the terms of the investment advisory agreement, the Fund accrues daily and pays monthly an advisory fee to the Adviser based on the annual rate of the Fund’s average daily net assets as follows:
| | | | | | | | |
| Average Daily Net Assets | | Rate | |
First $250 million | | | 0 | .95% | | | | |
Next $250 million | | | 0 | .93% | | | | |
Next $500 million | | | 0 | .91% | | | | |
Next $1.5 billion | | | 0 | .89% | | | | |
Next $2.5 billion | | | 0 | .87% | | | | |
Next $2.5 billion | | | 0 | .85% | | | | |
Next $2.5 billion | | | 0 | .83% | | | | |
Over $10 billion | | | 0 | .81% | | | | |
Prior to January 1, 2017, the Fund paid an advisory fee to the Adviser based on the annual rate of the Fund’s average daily net assets as follows:
| | | | |
| Average Daily Net Assets | | Rate | |
First $10 billion | | | 1.25% | |
Over $10 billion | | | 1.15% | |
For the year ended October 31, 2017, the effective advisory fees incurred by the Fund was 1.01%.
Under the terms of a master sub-advisory agreement between the Adviser and each of Invesco Asset Management Deutschland GmbH, Invesco Asset Management Limited, Invesco Asset Management (Japan) Limited, Invesco Hong Kong Limited, Invesco Senior Secured Management, Inc. and Invesco Canada Ltd. and separate sub-advisory agreements with Invesco PowerShares Capital Management LLC and Invesco Asset Management (India) Private Limited (collectively, the “Affiliated Sub-Advisers”) the Adviser, not the Fund, will pay 40% of the fees paid to the Adviser to any such Affiliated Sub-Adviser(s) that provide(s) discretionary investment management services to the Fund based on the percentage of assets allocated to such Affiliated Sub-Adviser(s).
Effective January 1, 2017, the Adviser has contractually agreed, through at least February 28, 2019, to waive advisory fees and/or reimburse expenses to the extent necessary to limit total annual fund operating expenses after fee waiver and/or expense reimbursement (excluding certain items discussed below) of Class A, Class C, Class R, Class Y, Class R5 and Class R6 shares to 1.50%, 2.25%, 1.75%, 1.25%, 1.25% and 1.25% of average daily net assets (the “expense limits”), respectively. Prior to January 1, 2017, the Adviser had contractually agreed to waive advisory fees and/or reimburse expenses to the extent necessary to limit total annual fund operating expenses after fee waiver and/or expense reimbursement (excluding certain items discussed below) of Class A, Class C, Class R, Class Y, Class R5 and Class R6 shares to 1.62%, 2.37%, 1.87%, 1.37%, 1.37% and 1.37% of average daily net assets, respectively. In determining the Adviser’s obligation to waive advisory fees and/or reimburse expenses, the following expenses are not taken into account, and could cause total annual fund operating expenses after fee waiver and/or expense reimbursement to exceed the numbers reflected above: (1) interest; (2) taxes; (3) dividend expense on short sales; (4) extraordinary or non-routine items, including litigation expenses; and (5) expenses that the Fund has incurred but did not actually pay because of an expense offset arrangement. Unless Invesco continues the fee waiver agreement, it will terminate on February 28, 2019. During its term, the fee waiver agreement cannot be terminated or amended to increase the expense limits or reduce the advisory fee waiver without approval of the Board of Trustees.
Further, the Adviser has contractually agreed, through at least June 30, 2019, to waive the advisory fee payable by the Fund in an amount equal to 100% of the net advisory fees the Adviser receives from the affiliated money market funds on investments by the Fund of uninvested cash in such affiliated money market funds.
For the year ended October 31, 2017, the Adviser waived advisory fees of $244,969 and reimbursed class level expenses of $6,545, $365, $24, $7,861, $55 and $97 of Class A, Class C, Class R, Class Y, Class R5 and Class R6 shares, respectively.
The Trust has entered into a master administrative services agreement with Invesco pursuant to which the Fund has agreed to pay Invesco for certain administrative costs incurred in providing accounting services to the Fund. For the year ended October 31, 2017, expenses incurred under the agreement are shown in the Statement of Operations as Administrative services fees.
The Trust has entered into a transfer agency and service agreement with Invesco Investment Services, Inc. (“IIS”) pursuant to which the Fund has agreed to pay IIS a fee for providing transfer agency and shareholder services to the Fund and reimburse IIS for certain expenses incurred by IIS in the course of providing such services. IIS may make payments to intermediaries that provide omnibus account services, sub-accounting services and/or networking services. All fees payable by IIS to intermediaries that provide omnibus account services or sub-accounting services are charged back to the Fund, subject to certain limitations approved by the Trust’s Board of Trustees. For the year ended October 31, 2017, expenses incurred under the agreement are shown in the Statement of Operations as Transfer agent fees.
The Trust has entered into master distribution agreements with Invesco Distributors, Inc. (“IDI”) to serve as the distributor for the Class A, Class C, Class R, Class Y, Class R5 and Class R6 shares of the Fund. The Trust has adopted plans pursuant to Rule 12b-1 under the 1940 Act with respect to the Fund’s Class A, Class C and Class R shares (collectively the “Plans”). The Fund, pursuant to the Plans, pays IDI compensation at the annual rate of 0.25% of the Fund’s average daily net assets of Class A shares, 1.00% of the average daily net assets of Class C shares and 0.50% of the average daily net assets of Class R shares. The fees are accrued daily and paid monthly. Of the Plan payments, up to 0.25% of the average daily net assets of each class of shares may be paid to furnish continuing personal shareholder services to customers who purchase and own shares of such classes. Any amounts not paid as a service fee under the Plans would constitute an asset-based sales charge. Rules of the Financial Industry Regulatory Authority (“FINRA”) impose a cap on the total sales charges, including asset-based sales charges, that may be paid by any class of shares of the Fund. For the year ended October 31, 2017, expenses incurred under the Plans are shown in the Statement of Operations as Distribution fees.
21 Invesco Global Market Neutral Fund
Front-end sales commissions and CDSC (collectively, the “sales charges”) are not recorded as expenses of the Fund. Front-end sales commissions are deducted from proceeds from the sales of Fund shares prior to investment in Class A shares of the Fund. CDSC are deducted from redemption proceeds prior to remittance to the shareholder. During the year ended October 31, 2017, IDI advised the Fund that IDI retained $116 in front-end sales commissions from the sale of Class A shares and $5 from Class C shares for CDSC imposed upon redemptions by shareholders.
Certain officers and trustees of the Trust are officers and directors of the Adviser, IIS and/or IDI.
NOTE 3—Additional Valuation Information
GAAP defines fair value as the price that would be received to sell an asset or paid to transfer a liability in an orderly transaction between market participants at the measurement date, under current market conditions. GAAP establishes a hierarchy that prioritizes the inputs to valuation methods, giving the highest priority to readily available unadjusted quoted prices in an active market for identical assets (Level 1) and the lowest priority to significant unobservable inputs (Level 3), generally when market prices are not readily available or are unreliable. Based on the valuation inputs, the securities or other investments are tiered into one of three levels. Changes in valuation methods may result in transfers in or out of an investment’s assigned level:
| | Level 1 — | Prices are determined using quoted prices in an active market for identical assets. |
| | Level 2 — | Prices are determined using other significant observable inputs. Observable inputs are inputs that other market participants may use in pricing a security. These may include quoted prices for similar securities, interest rates, prepayment speeds, credit risk, yield curves, loss severities, default rates, discount rates, volatilities and others. |
| | Level 3 — | Prices are determined using significant unobservable inputs. In situations where quoted prices or observable inputs are unavailable (for example, when there is little or no market activity for an investment at the end of the period), unobservable inputs may be used. Unobservable inputs reflect the Fund’s own assumptions about the factors market participants would use in determining fair value of the securities or instruments and would be based on the best available information. |
The following is a summary of the tiered valuation input levels, as of October 31, 2017. The level assigned to the securities valuations may not be an indication of the risk or liquidity associated with investing in those securities. Because of the inherent uncertainties of valuation, the values reflected in the financial statements may materially differ from the value received upon actual sale of those investments.
The Fund’s policy is to recognize transfers in and out of the valuation levels as of the end of the reporting period. During the year ended October 31, 2017, there were transfers from Level 1 to Level 2 of $1,727,914 and from Level 2 to Level 1 of $1,331,139, due to foreign fair value adjustments.
| | | | | | | | | | | | | | | | |
| | | Level 1 | | | Level 2 | | | Level 3 | | | Total | |
Australia | | $ | 83,518 | | | $ | 220,275 | | | $ | — | | | $ | 303,793 | |
Austria | | | 213,424 | | | | — | | | | — | | | | 213,424 | |
Canada | | | 870,178 | | | | — | | | | — | | | | 870,178 | |
China | | | 220,230 | | | | — | | | | — | | | | 220,230 | |
Denmark | | | 301,984 | | | | — | | | | — | | | | 301,984 | |
Finland | | | 209,375 | | | | — | | | | — | | | | 209,375 | |
France | | | 523,881 | | | | — | | | | — | | | | 523,881 | |
Germany | | | 352,282 | | | | 468,998 | | | | — | | | | 821,280 | |
Ireland | | | 68,025 | | | | — | | | | — | | | | 68,025 | |
Japan | | | 411,878 | | | | 3,372,702 | | | | — | | | | 3,784,580 | |
Netherlands | | | 147,500 | | | | — | | | | — | | | | 147,500 | |
Norway | | | 85,715 | | | | — | | | | — | | | | 85,715 | |
Panama | | | 50,261 | | | | — | | | | — | | | | 50,261 | |
Singapore | | | 84,336 | | | | — | | | | — | | | | 84,336 | |
Spain | | | 335,014 | | | | — | | | | — | | | | 335,014 | |
Sweden | | | 64,201 | | | | 171,734 | | | | — | | | | 235,935 | |
Switzerland | | | 282,294 | | | | 119,134 | | | | — | | | | 401,428 | |
United Kingdom | | | 1,188,724 | | | | 396,711 | | | | — | | | | 1,585,435 | |
United States | | | 5,763,200 | | | | — | | | | — | | | | 5,763,200 | |
Money Market Funds | | | 988,465 | | | | — | | | | — | | | | 988,465 | |
| | | | 12,244,485 | | | | 4,749,554 | | | | — | | | | 16,994,039 | |
Swap Agreements* | | | — | | | | (92,322 | ) | | | — | | | | (92,322 | ) |
Total Investments | | $ | 12,244,485 | | | $ | 4,657,232 | | | $ | — | | | $ | 16,901,717 | |
| * | Unrealized appreciation (depreciation). |
NOTE 4—Derivative Investments
The Fund may enter into an International Swaps and Derivatives Association Master Agreement (“ISDA Master Agreement”) under which a Fund may trade OTC derivatives. An OTC transaction entered into under an ISDA Master Agreement typically involves a collateral posting arrangement, payment netting provisions and close-out netting provisions. These netting provisions allow for reduction of credit risk through netting of contractual obligations. The enforceability of the netting provisions of the ISDA Master Agreement depends on the governing law of the ISDA Master Agreement, among other factors.
22 Invesco Global Market Neutral Fund
For financial reporting purposes, the Fund does not offset OTC derivative assets or liabilities that are subject to ISDA Master Agreements in the Statement of Assets and Liabilities.
Value of Derivative Investments at Period-End
The table below summarizes the value of the Fund’s derivative investments, detailed by primary risk exposure, held as of October 31, 2017:
| | | | |
| | | Value | |
| Derivative Assets | | Equity Risk | |
Unrealized appreciation on swap agreements — OTC | | $ | 102,669 | |
Derivatives not subject to master netting agreements | | | — | |
Total Derivative Assets subject to master netting agreements | | $ | 102,669 | |
| | | | |
| | | Value | |
| Derivative Liabilities | | Equity Risk | |
Unrealized depreciation on swap agreements — OTC | | $ | (194,991 | ) |
Derivatives not subject to master netting agreements | | | — | |
Total Derivative Liabilities subject to master netting agreements | | $ | (194,991 | ) |
Offsetting Assets and Liabilities
The table below reflects the Fund’s exposure to Counterparties subject to either an ISDA Master Agreement or other agreement for OTC derivative transactions as of October 31, 2017.
| | | | | | | | | | | | | | | | | | | | | | | | |
| | | Financial
Derivative
Assets | | | Financial
Derivative
Liabilities | | | Net Value of
Derivatives | | | Collateral
(Received)/Pledged | | | Net
Amount | |
| Counterparty | | Swap
Agreements | | | Swap
Agreements | | | | Non-Cash | | | Cash | | |
Morgan Stanley & Co. LLC | | $ | 102,669 | | | $ | (194,991 | ) | | $ | (92,322 | ) | | $ | — | | | $ | 83,397 | | | $ | (8,925 | ) |
Effect of Derivative Investments for the year ended October 31, 2017
The table below summarizes the gains (losses) on derivative investments, detailed by primary risk exposure, recognized in earnings during the period:
| | | | |
| | | Location of
Gain (Loss)
on Statement
of Operations | |
| | Equity
Risk | |
Realized Gain (Loss): | | | | |
Swap agreements | | $ | (2,933,067 | ) |
Change in Net Unrealized Appreciation (Depreciation): | | | | |
Swap agreements | | $ | (270,324 | ) |
Total | | $ | (3,203,391 | ) |
The table below summarizes the average notional value of swap agreements outstanding during the period.
| | | | |
| | | Swap
Agreements | |
Average notional value | | $ | 17,218,041 | |
NOTE 5—Trustees’ and Officers’ Fees and Benefits
Trustees’ and Officers’ Fees and Benefits include amounts accrued by the Fund to pay remuneration to certain Trustees and Officers of the Fund. Trustees have the option to defer compensation payable by the Fund, and Trustees’ and Officers’ Fees and Benefits also include amounts accrued by the Fund to fund such deferred compensation amounts. Those Trustees who defer compensation have the option to select various Invesco Funds in which their deferral accounts shall be deemed to be invested. Obligations under the deferred compensation plan represent unsecured claims against the general assets of the Fund.
NOTE 6—Cash Balances
The Fund is permitted to temporarily carry a negative or overdrawn balance in its account with State Street Bank and Trust Company, the custodian bank. Such balances, if any at period-end, are shown in the Statement of Assets and Liabilities under the payable caption Amount due custodian. To compensate the custodian bank for such overdrafts, the overdrawn Fund may either (1) leave funds as a compensating balance in the account so the custodian bank can be compensated by earning the additional interest; or (2) compensate by paying the custodian bank at a rate agreed upon by the custodian bank and Invesco, not to exceed the contractually agreed upon rate.
23 Invesco Global Market Neutral Fund
NOTE 7—Distributions to Shareholders and Tax Components of Net Assets
Tax Character of Distributions to Shareholders Paid During the Fiscal Years Ended October 31, 2017 and 2016:
| | | | | | | | |
| | | 2017 | | | 2016 | |
Long-term capital gain | | $ | — | | | $ | 50,264 | |
Tax Components of Net Assets at Period-End:
| | | | |
| | | 2017 | |
Undistributed long-term gain | | $ | 1,153,027 | |
Net unrealized appreciation — investments | | | 3,215,807 | |
Net unrealized appreciation — other investments | | | 793 | |
Temporary book/tax differences | | | (6,477 | ) |
Shares of beneficial interest | | | 12,653,838 | |
Total net assets | | $ | 17,016,988 | |
The difference between book-basis and tax-basis unrealized appreciation (depreciation) is due to differences in the timing of recognition of gains and losses on investments for tax and book purposes. The Fund’s net unrealized appreciation difference is attributable primarily to passive foreign investment companies and wash sales.
The temporary book/tax differences are a result of timing differences between book and tax recognition of income and/or expenses. The Fund’s temporary book/tax differences are the result of the trustee deferral of compensation and retirement plan benefits.
Capital loss carryforward is calculated and reported as of a specific date. Results of transactions and other activity after that date may affect the amount of capital loss carryforward actually available for the Fund to utilize. The ability to utilize capital loss carryforward in the future may be limited under the Internal Revenue Code and related regulations based on the results of future transactions.
The Fund does not have a capital loss carryforward as of October 31, 2017.
NOTE 8—Investment Transactions
The aggregate amount of investment securities (other than short-term securities, U.S. Treasury obligations and money market funds, if any) purchased and sold by the Fund during the year ended October 31, 2017 was $6,097,949 and $13,707,144, respectively. Cost of investments, including any derivatives, on a tax basis includes the adjustments for financial reporting purposes as of the most recently completed federal income tax reporting period-end.
| | | | |
| Unrealized Appreciation (Depreciation) of Investments on a Tax Basis | |
Aggregate unrealized appreciation of investments | | $ | 3,890,967 | |
Aggregate unrealized (depreciation) of investments | | | (675,160 | ) |
Net unrealized appreciation of investments | | $ | 3,215,807 | |
Cost of investments for tax purposes is $13,685,910.
NOTE 9—Reclassification of Permanent Differences
Primarily as a result of differing book/tax treatment of swap agreements and net operating loss, on October 31, 2017, undistributed net investment income was increased by $7,898, undistributed net realized gain was increased by $2,900,770 and shares of beneficial interest was decreased by $2,908,668. This reclassification had no effect on the net assets of the Fund.
24 Invesco Global Market Neutral Fund
NOTE 10—Share Information
| | | | | | | | | | | | | | | | |
| | | Summary of Share Activity | |
| | | Years ended October 31, | |
| | | 2017(a) | | | 2016 | |
| | | Shares | | | Amount | | | Shares | | | Amount | |
Sold: | | | | | | | | | | | | | | | | |
Class A | | | 50,956 | | | $ | 506,412 | | | | 323,878 | | | $ | 3,282,254 | |
Class C | | | 8,688 | | | | 84,771 | | | | 197,014 | | | | 1,998,263 | |
Class R | | | 863 | | | | 8,513 | | | | 2,586 | | | | 26,252 | |
Class Y | | | 87,656 | | | | 880,836 | | | | 442,472 | | | | 4,518,995 | |
Class R6 | | | 32,982 | | | | 330,711 | | | | 22,473 | | | | 224,372 | |
| | | | |
Issued as reinvestment of dividends: | | | | | | | | | | | | | | | | |
Class A | | | — | | | | — | | | | 264 | | | | 2,697 | |
Class C | | | — | | | | — | | | | 119 | | | | 1,200 | |
Class R | | | — | | | | — | | | | 2 | | | | 16 | |
Class Y | | | — | | | | — | | | | 1,953 | | | | 20,025 | |
Class R6 | | | — | | | | — | | | | 39 | | | | 397 | |
| | | | |
Reacquired: | | | | | | | | | | | | | | | | |
Class A | | | (69,912 | ) | | | (697,322 | ) | | | (98,828 | ) | | | (989,887 | ) |
Class C | | | (34,891 | ) | | | (341,570 | ) | | | (191,138 | ) | | | (1,883,905 | ) |
Class R | | | — | | | | — | | | | (1,854 | ) | | | (17,886 | ) |
Class Y | | | (581,028 | ) | | | (5,847,442 | ) | | | (404,130 | ) | | | (4,058,917 | ) |
Class R6 | | | (16,681 | ) | | | (167,956 | ) | | | (7,869 | ) | | | (79,919 | ) |
Net increase (decrease) in share activity | | | (521,367 | ) | | $ | (5,243,047 | ) | | | 286,981 | | | $ | 3,043,957 | |
| (a) | There are entities that are record owners of more than 5% of the outstanding shares of the Fund and in the aggregate own 31% of the outstanding shares of the Fund. IDI has an agreement with these entities to sell Fund shares. The Fund, Invesco and/or Invesco affiliates may make payments to these entities, which are considered to be related to the Fund, for providing services to the Fund, Invesco and/or Invesco affiliates including but not limited to services such as securities brokerage, distribution, third party record keeping and account servicing. The Fund has no knowledge as to whether all or any portion of the shares owned of record by these entities are also owned beneficially. |
| | In addition, 62% of the outstanding shares of the Fund are owned by the Adviser or an affiliate of the Adviser. |
25 Invesco Global Market Neutral Fund
NOTE 11—Financial Highlights
The following schedule presents financial highlights for a share of the Fund outstanding throughout the periods indicated.
| | | | | | | | | | | | | | | | | | | | | | | | | | | | | | | | | | | | | | | | | | | | | | | | | | | | | | | | |
| | | Net asset
value,
beginning
of period | | | Net
investment
income
(loss)(a) | | | Net gains
(losses)
on securities
(both
realized and
unrealized) | | | Total from
investment
operations | | | Dividends
from net
investment
income | | | Distributions
from net
realized
gains | | | Total
distributions | | | Net asset
value, end
of period | | | Total
return(b) | | | Net assets,
end of period
(000’s omitted) | | | Ratio of
expenses
to average
net assets
with fee waivers
and/or expenses
absorbed | | | Ratio of
expenses
to average net
assets without
fee waivers
and/or expenses
absorbed | | | Ratio of net
investment
income (loss)
to average
net assets | | | Portfolio
turnover(c) | |
Class A | |
Year ended 10/31/17 | | $ | 9.91 | | | $ | 0.05 | | | $ | 0.10 | | | $ | 0.15 | | | $ | — | | | $ | — | | | $ | — | | | $ | 10.06 | | | | 1.51 | % | | $ | 7,654 | | | | 1.52 | %(d) | | | 2.93 | %(d) | | | 0.51 | %(d) | | | 35 | % |
Year ended 10/31/16 | | | 10.31 | | | | 0.10 | | | | (0.47 | ) | | | (0.37 | ) | | | — | | | | (0.03 | ) | | | (0.03 | ) | | | 9.91 | | | | (3.64 | ) | | | 7,729 | | | | 1.61 | | | | 2.89 | | | | 1.00 | | | | 79 | |
Year ended 10/31/15 | | | 10.49 | | | | 0.07 | | | | (0.06 | ) | | | 0.01 | | | | (0.18 | ) | | | (0.01 | ) | | | (0.19 | ) | | | 10.31 | | | | 0.16 | (e) | | | 5,716 | | | | 1.61 | | | | 3.28 | | | | 0.69 | | | | 77 | |
Year ended 10/31/14(f) | | | 10.00 | | | | 0.04 | | | | 0.45 | | | | 0.49 | | | | — | | | | — | | | | — | | | | 10.49 | | | | 4.90 | (g) | | | 5,197 | | | | 1.61 | (h) | | | 4.61 | (h) | | | 0.43 | (h) | | | 46 | |
Class C | | | | | | | | | | | | | | | | | | | | | | | | | | | | | | | | | | | | | | | | | | | | | | | | | | | | | | | | |
Year ended 10/31/17 | | | 9.74 | | | | (0.02 | ) | | | 0.09 | | | | 0.07 | | | | — | | | | — | | | | — | | | | 9.81 | | | | 0.72 | | | | 381 | | | | 2.27 | (d) | | | 3.68 | (d) | | | (0.24 | )(d) | | | 35 | |
Year ended 10/31/16 | | | 10.20 | | | | 0.03 | | | | (0.46 | ) | | | (0.43 | ) | | | — | | | | (0.03 | ) | | | (0.03 | ) | | | 9.74 | | | | (4.27 | ) | | | 634 | | | | 2.36 | | | | 3.64 | | | | 0.25 | | | | 79 | |
Year ended 10/31/15 | | | 10.41 | | | | (0.01 | ) | | | (0.03 | ) | | | (0.04 | ) | | | (0.16 | ) | | | (0.01 | ) | | | (0.17 | ) | | | 10.20 | | | | (0.35 | )(e) | | | 603 | | | | 2.36 | | | | 4.03 | | | | (0.06 | ) | | | 77 | |
Year ended 10/31/14(f) | | | 10.00 | | | | (0.03 | ) | | | 0.44 | | | | 0.41 | | | | — | | | | — | | | | — | | | | 10.41 | | | | 4.10 | (g) | | | 123 | | | | 2.36 | (h) | | | 5.36 | (h) | | | (0.32 | )(h) | | | 46 | |
Class R | | | | | | | | | | | | | | | | | | | | | | | | | | | | | | | | | | | | | | | | | | | | | | | | | | | | | | | | |
Year ended 10/31/17 | | | 9.86 | | | | 0.03 | | | | 0.09 | | | | 0.12 | | | | — | | | | — | | | | — | | | | 9.98 | | | | 1.22 | | | | 32 | | | | 1.77 | (d) | | | 3.18 | (d) | | | 0.26 | (d) | | | 35 | |
Year ended 10/31/16 | | | 10.27 | | | | 0.08 | | | | (0.46 | ) | | | (0.38 | ) | | | — | | | | (0.03 | ) | | | (0.03 | ) | | | 9.86 | | | | (3.75 | ) | | | 23 | | | | 1.86 | | | | 3.14 | | | | 0.75 | | | | 79 | |
Year ended 10/31/15 | | | 10.46 | | | | 0.05 | | | | (0.05 | ) | | | (0.00 | ) | | | (0.18 | ) | | | (0.01 | ) | | | (0.19 | ) | | | 10.27 | | | | (0.01 | )(e) | | | 17 | | | | 1.86 | | | | 3.53 | | | | 0.44 | | | | 77 | |
Year ended 10/31/14(f) | | | 10.00 | | | | 0.02 | | | | 0.44 | | | | 0.46 | | | | — | | | | — | | | | — | | | | 10.46 | | | | 4.60 | (g) | | | 14 | | | | 1.86 | (h) | | | 4.86 | (h) | | | 0.18 | (h) | | | 46 | |
Class Y | | | | | | | | | | | | | | | | | | | | | | | | | | | | | | | | | | | | | | | | | | | | | | | | | | | | | | | | |
Year ended 10/31/17 | | | 9.96 | | | | 0.08 | | | | 0.10 | | | | 0.18 | | | | — | | | | — | | | | — | | | | 10.14 | | | | 1.81 | | | | 7,476 | | | | 1.27 | (d) | | | 2.68 | (d) | | | 0.76 | (d) | | | 35 | |
Year ended 10/31/16 | | | 10.34 | | | | 0.13 | | | | (0.48 | ) | | | (0.35 | ) | | | — | | | | (0.03 | ) | | | (0.03 | ) | | | 9.96 | | | | (3.43 | ) | | | 12,261 | | | | 1.36 | | | | 2.64 | | | | 1.25 | | | | 79 | |
Year ended 10/31/15 | | | 10.52 | | | | 0.10 | | | | (0.06 | ) | | | 0.04 | | | | (0.21 | ) | | | (0.01 | ) | | | (0.22 | ) | | | 10.34 | | | | 0.38 | (e) | | | 12,305 | | | | 1.36 | | | | 3.03 | | | | 0.94 | | | | 77 | |
Year ended 10/31/14(f) | | | 10.00 | | | | 0.06 | | | | 0.46 | | | | 0.52 | | | | — | | | | — | | | | — | | | | 10.52 | | | | 5.20 | (g) | | | 7,311 | | | | 1.36 | (h) | | | 4.36 | (h) | | | 0.68 | (h) | | | 46 | |
Class R5 | | | | | | | | | | | | | | | | | | | | | | | | | | | | | | | | | | | | | | | | | | | | | | | | | | | | | | | | |
Year ended 10/31/17 | | | 9.96 | | | | 0.08 | | | | 0.10 | | | | 0.18 | | | | — | | | | — | | | | — | | | | 10.14 | | | | 1.81 | | | | 507 | | | | 1.26 | (d) | | | 2.60 | (d) | | | 0.77 | (d) | | | 35 | |
Year ended 10/31/16 | | | 10.34 | | | | 0.13 | | | | (0.48 | ) | | | (0.35 | ) | | | — | | | | (0.03 | ) | | | (0.03 | ) | | | 9.96 | | | | (3.43 | ) | | | 498 | | | | 1.36 | | | | 2.56 | | | | 1.25 | | | | 79 | |
Year ended 10/31/15 | | | 10.51 | | | | 0.10 | | | | (0.05 | ) | | | 0.05 | | | | (0.21 | ) | | | (0.01 | ) | | | (0.22 | ) | | | 10.34 | | | | 0.47 | (e) | | | 517 | | | | 1.36 | | | | 2.97 | | | | 0.94 | | | | 77 | |
Year ended 10/31/14(f) | | | 10.00 | | | | 0.06 | | | | 0.45 | | | | 0.51 | | | | — | | | | — | | | | — | | | | 10.51 | | | | 5.10 | (g) | | | 671 | | | | 1.36 | (h) | | | 4.33 | (h) | | | 0.68 | (h) | | | 46 | |
Class R6 | | | | | | | | | | | | | | | | | | | | | | | | | | | | | | | | | | | | | | | | | | | | | | | | | | | | | | | | |
Year ended 10/31/17 | | | 9.97 | | | | 0.08 | | | | 0.09 | | | | 0.17 | | | | — | | | | — | | | | — | | | | 10.14 | | | | 1.71 | | | | 966 | | | | 1.26 | (d) | | | 2.60 | (d) | | | 0.77 | (d) | | | 35 | |
Year ended 10/31/16 | | | 10.34 | | | | 0.13 | | | | (0.47 | ) | | | (0.34 | ) | | | — | | | | (0.03 | ) | | | (0.03 | ) | | | 9.97 | | | | (3.33 | ) | | | 786 | | | | 1.36 | | | | 2.56 | | | | 1.25 | | | | 79 | |
Year ended 10/31/15 | | | 10.51 | | | | 0.10 | | | | (0.05 | ) | | | 0.05 | | | | (0.21 | ) | | | (0.01 | ) | | | (0.22 | ) | | | 10.34 | | | | 0.47 | (e) | | | 664 | | | | 1.36 | | | | 2.97 | | | | 0.94 | | | | 77 | |
Year ended 10/31/14(f) | | | 10.00 | | | | 0.06 | | | | 0.45 | | | | 0.51 | | | | — | | | | — | | | | — | | | | 10.51 | | | | 5.10 | (g) | | | 573 | | | | 1.36 | (h) | | | 4.33 | (h) | | | 0.68 | (h) | | | 46 | |
| (a) | Calculated using average shares outstanding. |
| (b) | Includes adjustments in accordance with accounting principles generally accepted in the United States of America and as such, the net asset value for financial reporting purposes and the returns based upon those net asset values may differ from the net asset value and returns for shareholder transactions. Does not include sales charges and is not annualized for periods less than one year, if applicable. |
| (c) | Portfolio turnover is calculated at the fund level and is not annualized for periods less than one year, if applicable. |
| (d) | Ratios are based on average daily net assets (000’s omitted) of $7,565, $422, $28, $9,086, $500 and $878 for Class A, Class C, Class R, Class Y, Class R5 and Class R6 shares, respectively. |
| (e) | Amount includes the effect of the Adviser pay-in for an economic loss of $0.11 per share. Had the pay-in not been made, the total return would have been (0.91)%, (1.42)%, (1.09)%, (0.69)%, (0.60)% and (0.60)% for Class A, Class C, Class R, Class Y, Class R5 and Class R6 shares, respectively. |
| (f) | Commencement December 19, 2013. |
| (g) | Amount includes the effect of the Adviser pay-in for the economic loss of $0.41 per share. Had the pay-in not been made, the total return would have been 0.80%, 0.10%, 0.60%, 1.00%, 1.00% and 1.00% for Class A, Class C, Class R, Class Y, Class R5 and Class R6 shares, respectively. |
26 Invesco Global Market Neutral Fund
Report of Independent Registered Public Accounting Firm
To the Board of Trustees of AIM Investment Funds (Invesco Investment Funds)
and Shareholders of Invesco Global Market Neutral Fund:
In our opinion, the accompanying statement of assets and liabilities, including the schedule of investments, and the related statements of operations and of changes in net assets and the financial highlights present fairly, in all material respects, the financial position of Invesco Global Market Neutral Fund (one of the portfolios constituting the AIM Investment Funds (Invesco Investment Funds), hereafter referred to as the “Fund”) as of October 31, 2017, the results of its operations for the year then ended, the changes in its net assets for each of the two years in the period then ended and the financial highlights for each of the three years in the period then ended and for the period December 19, 2013 (commencement of investment operations) through October 31, 2014, in conformity with accounting principles generally accepted in the United States of America. These financial statements and financial highlights (hereafter referred to as “financial statements”) are the responsibility of the Fund’s management. Our responsibility is to express an opinion on these financial statements based on our audits. We conducted our audits of these financial statements in accordance with the standards of the Public Company Accounting Oversight Board (United States). Those standards require that we plan and perform the audit to obtain reasonable assurance about whether the financial statements are free of material misstatement. An audit includes examining, on a test basis, evidence supporting the amounts and disclosures in the financial statements, assessing the accounting principles used and significant estimates made by management, and evaluating the overall financial statement presentation. We believe that our audits, which included confirmation of securities as of October 31, 2017 by correspondence with the custodian, transfer agent and brokers, and when replies were not received from brokers, we performed other auditing procedures, provide a reasonable basis for our opinion.
PricewaterhouseCoopers LLP
Houston, Texas
December 21, 2017
27 Invesco Global Market Neutral Fund
Calculating your ongoing Fund expenses
Example
As a shareholder of the Fund, you incur two types of costs: (1) transaction costs, which may include sales charges (loads) on purchase payments or contingent deferred sales charges on redemptions, if any; and (2) ongoing costs, including management fees, distribution and/or service (12b-1) fees, and other Fund expenses. This example is intended to help you understand your ongoing costs (in dollars) of investing in the Fund and to compare these costs with ongoing costs of investing in other mutual funds. The example is based on an investment of $1,000 invested at the beginning of the period and held for the entire period May 1, 2017 through October 31, 2017.
Actual expenses
The table below provides information about actual account values and actual expenses. You may use the information in this table, together with the amount you invested, to estimate the expenses that you paid over the period. Simply divide your account value by $1,000 (for example, an $8,600 account value divided by $1,000 = 8.6), then multiply the result by the number in the table under the heading entitled “Actual Expenses Paid During Period” to estimate the expenses you paid on your account during this period.
Hypothetical example for comparison purposes
The table below also provides information about hypothetical account values and hypothetical expenses based on the Fund’s actual expense ratio and an assumed rate of return of 5% per year before expenses, which is not the Fund’s actual return.
The hypothetical account values and expenses may not be used to estimate the actual ending account balance or expenses you paid for the period. You may use this information to compare the ongoing costs of investing in the Fund and other funds. To do so, compare this 5% hypothetical example with the 5% hypothetical examples that appear in the shareholder reports of the other funds.
Please note that the expenses shown in the table are meant to highlight your ongoing costs only and do not reflect any transaction costs, such as sales charges (loads) on purchase payments or contingent deferred sales charges on redemptions, if any. Therefore, the hypothetical information is useful in comparing ongoing costs only, and will not help you determine the relative total costs of owning different funds. In addition, if these transaction costs were included, your costs would have been higher.
| | | | | | | | | | | | | | | | | | | | | | | | |
| Class | | Beginning
Account Value
(05/01/17) | | | ACTUAL | | | HYPOTHETICAL
(5% annual return before
expenses) | | | Annualized
Expense
Ratio | |
| | | Ending
Account Value
(10/31/17)1 | | | Expenses
Paid During
Period2 | | | Ending
Account Value
(10/31/17) | | | Expenses
Paid During
Period2 | | |
| A | | $ | 1,000.00 | | | $ | 1,003.00 | | | $ | 7.52 | | | $ | 1,017.69 | | | $ | 7.58 | | | | 1.49 | % |
| C | | | 1,000.00 | | | | 999.00 | | | | 11.29 | | | | 1,013.91 | | | | 11.37 | | | | 2.24 | |
| R | | | 1,000.00 | | | | 1,002.00 | | | | 8.78 | | | | 1,016.43 | | | | 8.84 | | | | 1.74 | |
| Y | | | 1,000.00 | | | | 1,004.00 | | | | 6.26 | | | | 1,018.95 | | | | 6.31 | | | | 1.24 | |
| R5 | | | 1,000.00 | | | | 1,004.00 | | | | 6.26 | | | | 1,018.95 | | | | 6.31 | | | | 1.24 | |
| R6 | | | 1,000.00 | | | | 1,004.00 | | | | 6.26 | | | | 1,108.95 | | | | 6.31 | | | | 1.24 | |
| 1 | The actual ending account value is based on the actual total return of the Fund for the period May 1, 2017 through October 31, 2017, after actual expenses and will differ from the hypothetical ending account value which is based on the Fund’s expense ratio and a hypothetical annual return of 5% before expenses. |
| 2 | Expenses are equal to the Fund’s annualized expense ratio as indicated above multiplied by the average account value over the period, multiplied by 184/365 to reflect the most recent fiscal half year. |
28 Invesco Global Market Neutral Fund
Approval of Investment Advisory and Sub-Advisory Contracts
The Board of Trustees (the Board) of AIM Investment Funds (Invesco Investment Funds) is required under the Investment Company Act of 1940, as amended, to approve annually the renewal of Invesco Global Market Neutral Fund’s (the Fund) investment advisory agreements. During contract renewal meetings held on June 12-13, 2017, the Board as a whole, and the disinterested or “independent” Trustees, who comprise over 75% of the Board, voting separately, approved the continuance for the Fund of the Master Investment Advisory Agreement with Invesco Advisers, Inc. (Invesco Advisers and the investment advisory agreement) and the Master Intergroup Sub-Advisory Contract for Mutual Funds with Invesco Asset Management Deutschland GmbH, Invesco Asset Management Limited, Invesco Asset Management (Japan) Limited, Invesco Hong Kong Limited, Invesco Senior Secured Management, Inc. and Invesco Canada Ltd. and separate Sub-Advisory Contracts with Invesco PowerShares Capital Management LLC and Invesco Asset Management (India) Private Limited (collectively, the Affiliated Sub-Advisers and the sub-advisory contracts) for another year, effective July 1, 2017.
In evaluating the fairness and reasonableness of compensation under the Fund’s investment advisory agreement and sub-advisory contracts, the Board considered, among other things, the factors discussed below. The Board determined that continuation of the Fund’s investment advisory agreement and the sub-advisory contracts is in the best interest of the Fund and its shareholders and that the compensation payable to Invesco Advisers and the Affiliated Sub-Advisers under the agreements is fair and reasonable.
The Board’s Fund Evaluation Process
The Board’s Investments Committee has established three Sub-Committees, which meet throughout the year to review the performance of funds advised by Invesco Advisers (the Invesco Funds). Over the course of each year, the Sub-Committees meet with portfolio managers for their assigned Invesco Funds and other members of management to review the performance, investment objective(s), policies, strategies, limitations and investment risks of these funds. The Board had the benefit of reports from the Sub-Committees and Investments Committee throughout the year in considering approval of the continuance of each Invesco Fund’s investment advisory agreement and sub-advisory contracts for another year.
During the contract renewal process, the Board receives comparative performance and fee data regarding the Invesco Funds prepared by Invesco Advisers and Broadridge Financial Solutions, Inc. (Broadridge), an independent provider of investment company data. The Board also receives an independent written
evaluation from the Senior Officer, an officer of the Invesco Funds who reports directly to the independent Trustees. The Senior Officer’s evaluation is prepared as part of his responsibility to manage the process by which the Invesco Funds’ proposed management fees are negotiated during the annual contract renewal process to ensure they are negotiated in a manner that is at arms’ length and reasonable. In addition to meetings with Invesco Advisers and fund counsel, the independent Trustees also discuss the continuance of the investment advisory agreement and sub-advisory contracts in separate sessions with the Senior Officer and with independent legal counsel.
The Trustees recognized that the advisory fee rates for the Invesco Funds are, in most cases, the result of years of review and negotiation. The Trustees’ deliberations and conclusions in a particular year may be based in part on their deliberations and conclusions regarding these arrangements throughout the year and in prior years. The Trustees’ review and conclusions are based on the comprehensive consideration of all information presented to them and are not the result of any single determinative factor. Moreover, one Trustee may have weighed a particular piece of information or factor differently than another Trustee.
The discussion below is a summary of the Senior Officer’s independent written evaluation with respect to the Fund’s investment advisory agreement as well as a discussion of the material factors and related conclusions that formed the basis for the Board’s approval of the Fund’s investment advisory agreement and sub-advisory contracts. This information is current as of June 13, 2017, and does not reflect consideration of factors that became known to the Board after that date.
Factors and Conclusions and Summary of Independent Written Fee Evaluation
| A. | Nature, Extent and Quality of Services Provided by Invesco Advisers and the Affiliated Sub-Advisers |
The Board reviewed the advisory services provided to the Fund by Invesco Advisers under the Fund’s investment advisory agreement, the performance of Invesco Advisers in providing these services, and the credentials and experience of the officers and employees of Invesco Advisers who provide these services, including the Fund’s portfolio manager or managers. The Board’s review included consideration of Invesco Advisers’ investment process oversight, credit analysis and investment risk management. The Board also considered non-advisory services that Invesco Advisers and its affiliates provide to the Invesco Funds such as various back office support functions, trading operations, internal audit, valuation and legal and compliance.
In determining whether to continue the Fund’s investment advisory agreement, the Board considered the benefits of reapproving an existing relationship as contrasted with the greater uncertainty that may be associated with entering into a new relationship. The Board concluded that the nature, extent and quality of the services provided to the Fund by Invesco Advisers are appropriate and satisfactory.
The Board reviewed the services that may be provided by the Affiliated Sub-Advisers under the sub-advisory contracts and the credentials and experience of the officers and employees of the Affiliated Sub-Advisers who provide these services. The Board noted that the Affiliated Sub-Advisers have offices and personnel that are located in financial centers around the world. As a result, the Board noted that the Affiliated Sub-Advisers can provide research and investment analysis on the markets and economies of various countries in which the Fund may invest, make recommendations regarding securities and assist with security trades. The Board concluded that the sub-advisory contracts may benefit the Fund and its shareholders by permitting Invesco Advisers to use the resources and talents of the Affiliated Sub-Advisers in managing the Fund. The Board concluded that the nature, extent and quality of the services that may be provided by the Affiliated Sub-Advisers are appropriate and satisfactory.
| B. | Fund Investment Performance |
The Board considered Fund investment performance as a relevant factor in considering whether to approve the investment advisory agreement as well as the sub-advisory contracts for the Fund, as Invesco Asset Management Deutschland GmbH currently manages assets of the Fund.
The Board noted that the Fund had only three years of performance history and compared the Fund’s investment performance during the past one and three calendar years to the performance of funds in the Broadridge performance universe and against the Lipper Alternative Equity Market Neutral Funds Index. The Board noted that performance of Class A shares of the Fund was in the fifth quintile of its performance universe for the one year period and the third quintile for the three year period (the first quintile being the best performing funds and the fifth quintile being the worst performing funds). The Board noted that performance of Class A shares of the Fund was below the performance of the Index for the one year period and above the performance of the Index for the three year period. The Trustees also reviewed more recent Fund performance and this review did not change their conclusions.
| C. | Advisory and Sub-Advisory Fees |
The Board compared the Fund’s contractual management fee rate to the contractual
29 Invesco Global Market Neutral Fund
management fee rates of funds in the Fund’s Broadridge expense group at a common asset level. The Board noted that the contractual management fee rate for Class A shares of the Fund was below the median contractual management fee rate of funds in its expense group. The Board noted that the term “contractual management fee” for funds in the expense group may include both advisory and certain administrative services fees, but that Broadridge does not provide information on a fund by fund basis as to what is included. The Board noted that Invesco Advisers does not separately charge the Invesco Funds for the administrative services included in the term as defined by Broadridge. The Board also reviewed the methodology used by Broadridge in providing expense group information, which includes using each fund’s contractual management fee schedule (including any applicable breakpoints) as reported in the most recent prospectus or statement of additional information for each fund in the expense group.
The Board noted that Invesco Advisers has contractually agreed to waive fees and/or limit expenses of the Fund through at least February 28, 2018 in an amount necessary to limit total annual operating expenses to a specified percentage of average daily net assets for each class of the Fund.
The Board noted that Invesco Advisers and the Affiliated Sub-Advisers do not manage other mutual funds or client accounts with investment strategies comparable to those of the Fund.
The Board also considered the services that may be provided by the Affiliated Sub-Advisers pursuant to the sub-advisory contracts, as well as the fees payable by Invesco Advisers to the Affiliated Sub-Advisers pursuant to the sub-advisory contracts. The Board noted that Invesco Advisers retains overall responsibility for, and provides services to, sub-advised Invesco Funds, including oversight of the Affiliated Sub-Advisers as well as the additional services described herein other than day-to-day portfolio management. The Board also noted that the sub-advisory fees are not paid directly by the Fund, but rather, are payable by Invesco Advisers to the Affiliated Sub-Advisers.
| D. | Economies of Scale and Breakpoints |
The Board considered the extent to which there are economies of scale in the provision of advisory services to the Fund. The Board also considered that the Fund may benefit from economies of scale through contractual breakpoints in the Fund’s advisory fee schedule. The Board noted that the Fund shares directly in economies of scale through lower fees charged by third party service providers based on the combined size of the Invesco Funds advised by Invesco Advisers.
| E. | Profitability and Financial Resources |
The Board reviewed information from Invesco Advisers concerning the costs of the advisory and other services that Invesco Advisers and its affiliates provide to the Fund and the Invesco Funds and the profitability of Invesco Advisers and its affiliates in providing these services. The
Board noted that Invesco Advisers continues to operate at a net profit from services Invesco Advisers and its affiliates provide to the Invesco Funds. The Board noted that although Invesco Advisers received a minimal amount of revenues from advising the Fund, Invesco Advisers and its subsidiaries did not make a profit from managing the Fund. The Board received and accepted information from Invesco Advisers demonstrating that Invesco Advisers and each Affiliated Sub-Adviser are financially sound and have the resources necessary to perform their obligations under the investment advisory agreement and sub-advisory contracts.
| F. | Collateral Benefits to Invesco Advisers and its Affiliates |
The Board considered various other benefits received by Invesco Advisers and its affiliates from the relationship with the Fund, including the fees received for providing transfer agency and distribution services to the Fund. The Board considered comparative information regarding fees charged for these services, including information provided by Broadridge and other independent sources. The Board considered the performance of Invesco Advisers and its affiliates in providing these services and the organizational structure employed to provide these services. The Board also considered that these services are provided to the Fund pursuant to written contracts that are reviewed and approved on an annual basis by the Board; and that the services are required for the operation of the Fund.
The Board considered the benefits realized by Invesco Advisers and the Affiliated Sub-Advisers as a result of portfolio brokerage transactions executed through “soft dollar” arrangements. The Board noted that soft dollar arrangements may result in the Fund bearing costs to purchase research that may be used by Invesco Advisers or the Affiliated Sub-Advisers with other clients and may reduce Invesco Adviser’s or the Affiliated Sub-Adviser’s expenses. The Board also considered that it receives periodic reports from the Chief Compliance Officer of the Invesco Funds demonstrating that these arrangements are consistent with regulatory requirements. The Board did not deem the soft dollar arrangements to be inappropriate.
The Board considered that the Fund’s uninvested cash and cash collateral from any securities lending arrangements may be invested in money market funds advised by Invesco Advisers pursuant to procedures approved by the Board. The Board noted that Invesco Advisers receives advisory fees from these affiliated money market funds attributable to such investments, although Invesco Advisers has contractually agreed to waive through varying periods the advisory fees payable by the Invesco Funds with respect to certain investments in the affiliated money market funds. The waiver is in an amount equal to 100% of the net advisory fee Invesco Advisers receives from the affiliated money market funds with respect to the Fund’s investment in the affiliated money market funds
of uninvested cash, but not cash collateral. The Board concluded that the amount of advisory fees received by Invesco Advisers from the Fund’s investment of cash collateral from any securities lending arrangements in the affiliated money market funds is fair and reasonable.
The Board also considered that the Fund may use an affiliated broker to execute certain trades for the Fund to, among other things, control information leakage, and was advised that such trades would be executed in compliance with rules under the federal securities laws and consistent with best execution obligations.
30 Invesco Global Market Neutral Fund
Trustees and Officers
The address of each trustee and officer is AIM Investment Funds (Invesco Investment Funds) (the “Trust”), 11 Greenway Plaza, Suite 1000, Houston, Texas 77046-1173. The trustees serve for the life of the Trust, subject to their earlier death, incapacitation, resignation, retirement or removal as more specifically provided in the Trust’s organizational documents. Each officer serves for a one year term or until their successors are elected and qualified. Column two below includes length of time served with predecessor entities, if any.
| | | | | | | | |
Name, Year of Birth and Position(s) Held with the Trust | | Trustee and/
or Officer Since | | Principal Occupation(s)
During Past 5 Years | | Number of
Funds in Fund
Complex
Overseen by
Trustee | | Other Directorship(s)
Held by Trustee During Past 5 Years |
| Interested Persons | | | | | | | | |
| Martin L. Flanagan1 — 1960 Trustee | | 2007 | | Executive Director, Chief Executive Officer and President, Invesco Ltd. (ultimate parent of Invesco and a global investment management firm); Trustee, The Invesco Funds; Vice Chair, Investment Company Institute; and Member of Executive Board, SMU Cox School of Business Formerly: Advisor to the Board, Invesco Advisers, Inc. (formerly known as Invesco Institutional (N.A.), Inc.); Chairman and Chief Executive Officer, Invesco Advisers, Inc. (registered investment adviser); Director, Chairman, Chief Executive Officer and President, Invesco Holding Company (US), Inc. (formerly IVZ Inc.) (holding company), Invesco Group Services, Inc. (service provider) and Invesco North American Holdings, Inc. (holding company); Director, Chief Executive Officer and President, Invesco Holding Company Limited (parent of Invesco and a global investment management firm); Director, Invesco Ltd.; Chairman, Investment Company Institute and President, Co-Chief Executive Officer, Co-President, Chief Operating Officer and Chief Financial Officer, Franklin Resources, Inc. (global investment management organization) | | 158 | | None |
Philip A. Taylor2 — 1954 Trustee and Senior Vice President | | 2006 | | Head of the Americas and Senior Managing Director, Invesco Ltd.; Director, Invesco Advisers, Inc. (formerly known as Invesco Institutional (N.A.), Inc.) (registered investment adviser); Director, Chairman, Chief Executive Officer and President, Invesco Management Group, Inc. (formerly known as Invesco Aim Management Group, Inc.) (financial services holding company); Director and Chairman, Invesco Investment Services, Inc. (formerly known as Invesco Aim Investment Services, Inc.) (registered transfer agent); Chief Executive Officer, Invesco Corporate Class Inc. (corporate mutual fund company); Director, Chairman and Chief Executive Officer, Invesco Canada Ltd. (formerly known as Invesco Trimark Ltd./Invesco Trimark Ltèe) (registered investment adviser and registered transfer agent); Trustee and Senior Vice President, The Invesco Funds; Director, Invesco Investment Advisers LLC (formerly known as Van Kampen Asset Management). Formerly: Co-Chairman, Co-President and Co-Chief Executive Officer, Invesco Advisers, Inc. (formerly known as Invesco Institutional (N.A.), Inc.) (registered investment adviser); Director, Chief Executive Officer and President, Van Kampen Exchange Corp; President and Principal Executive Officer, The Invesco Funds (other than AIM Treasurer’s Series Trust (Invesco Treasurer’s Series Trust), Short-Term Investments Trust and Invesco Management Trust); Executive Vice President, The Invesco Funds (AIM Treasurer’s Series Trust (Invesco Treasurer’s Series Trust), Short-Term Investments Trust and Invesco Management Trust only); Director and President, INVESCO Funds Group, Inc. (registered investment adviser and registered transfer agent); Director and Chairman, IVZ Distributors, Inc. (formerly known as INVESCO Distributors, Inc.) (registered broker dealer); Director, President and Chairman, Invesco Inc. (holding company), Invesco Canada Holdings Inc. (holding company), Trimark Investments Ltd./Placements Trimark Ltèe and Invesco Financial Services Ltd/Services Financiers Invesco Ltèe; Chief Executive Officer, Invesco Canada Fund Inc. (corporate mutual fund company); Director and Chairman, Van Kampen Investor Services Inc.; Director, Chief Executive Officer and President, 1371 Preferred Inc. (holding company) and Van Kampen Investments Inc.; Director and President, AIM GP Canada Inc. (general partner for limited partnerships) and Van Kampen Advisors, Inc.; Director and Chief Executive Officer, Invesco Trimark Dealer Inc. (registered broker dealer); Director, Invesco Distributors, Inc. (formerly known as Invesco Aim Distributors, Inc.) (registered broker dealer); Manager, Invesco PowerShares Capital Management LLC; Director, Chief Executive Officer and President, Invesco Advisers, Inc.; Director, Chairman, Chief Executive Officer and President, Invesco Aim Capital Management, Inc.; President, Invesco Trimark Dealer Inc. and Invesco Trimark Ltd./Invesco Trimark Ltèe; Director and President, AIM Trimark Corporate Class Inc. and AIM Trimark Canada Fund Inc.; Senior Managing Director, Invesco Holding Company Limited; Director and Chairman, Fund Management Company (former registered broker dealer); President and Principal Executive Officer, The Invesco Funds (AIM Treasurer’s Series Trust (Invesco Treasurer’s Series Trust), and Short-Term Investments Trust only); President, AIM Trimark Global Fund Inc. and AIM Trimark Canada Fund Inc. | | 158 | | None |
| 1 | Mr. Flanagan is considered an interested person (within the meaning of Section 2(a)(19) of the 1940 Act) of the Trust because he is an officer of the Adviser to the Trust, and an officer and a director of Invesco Ltd., ultimate parent of the Adviser. |
| 2 | Mr. Taylor is considered an interested person (within the meaning of Section 2(a)(19) of the 1940 Act) of the Trust because he is an officer and a director of the Adviser. |
T-1 Invesco Global Market Neutral Fund
Trustees and Officers—(continued)
| | | | | | | | |
Name, Year of Birth and Position(s) Held with the Trust | | Trustee and/
or Officer Since | | Principal Occupation(s) During Past 5 Years | | Number of
Funds in Fund
Complex
Overseen by
Trustee | | Other Directorship(s)
Held by Trustee During Past 5 Years |
| Independent Trustees | | | | | | | | |
Bruce L. Crockett — 1944 Trustee and Chair | | 2001 | | Chairman, Crockett Technologies Associates (technology consulting company) Formerly: Director, Captaris (unified messaging provider); Director, President and Chief Executive Officer, COMSAT Corporation; Chairman, Board of Governors of INTELSAT (international communications company); ACE Limited (insurance company); Independent Directors Council and Investment Company Institute: Member of the Audit Committee, Investment Company Institute; Member of the Executive Committee and Chair of the Governance Committee, Independent Directors Council | | 158 | | Director and Chairman of the Audit Committee, ALPS (Attorneys Liability Protection Society) (insurance company); Director and Member of the Audit Committee, Ferroglobe PLC (metallurgical company) |
David C. Arch — 1945 Trustee | | 2010 | | Chairman of Blistex Inc. (consumer health care products manufacturer); Member, World Presidents’ Organization | | 158 | | Board member of the Illinois Manufacturers’ Association |
James T. Bunch — 1942 Trustee | | 2003 | | Managing Member, Grumman Hill Group LLC (family office/private equity investments) Formerly: Chairman of the Board, Denver Film Society; Chairman of the Board of Trustees, Evans Scholarship Foundation; Chairman, Board of Governors, Western Golf Association | | 158 | | Trustee, Evans Scholarship Foundation |
Jack M. Fields — 1952 Trustee | | 2001 | | Chief Executive Officer, Twenty First Century Group, Inc. (government affairs company); and Discovery Learning Alliance (non-profit) Formerly: Owner and Chief Executive Officer, Dos Angeles Ranch L.P. (cattle, hunting, corporate entertainment); Director, Insperity, Inc. (formerly known as Administaff) (human resources provider); Chief Executive Officer, Texana Timber LP (sustainable forestry company); Director of Cross Timbers Quail Research Ranch (non-profit); and member of the U.S. House of Representatives | | 158 | | None |
Cynthia Hostetler — 1962 Trustee | | 2017 | | Non-Executive Director and Trustee of a number of public and private business corporations Formerly: Head of Investment Funds and Private Equity, Overseas Private Investment Corporation; President, First Manhattan Bancorporation, Inc.; Attorney, Simpson Thacher & Bartlett LLP | | 158 | | Vulcan Materials Company (construction materials company); Trilinc Global Impact Fund; Aberdeen Investment Funds (4 portfolios); Artio Global Investment LLC (mutual fund complex); Edgen Group, Inc. (specialized energy and infrastructure products distributor) |
Eli Jones — 1961 Trustee | | 2016 | | Professor and Dean, Mays Business School — Texas A&M University Formerly: Professor and Dean, Walton College of Business, University of Arkansas and E.J. Ourso College of Business, Louisiana State University; Director, Arvest Bank | | 158 | | Insperity, Inc. (formerly known as Administaff) (human resources provider) |
Prema Mathai-Davis — 1950 Trustee | | 2001 | | Retired. Formerly: Chief Executive Officer, YWCA of the U.S.A. | | 158 | | None |
Teresa M. Ressel — 1962 Trustee | | 2017 | | Non-executive director and trustee of a number of public and private business corporations Formerly: Chief Financial Officer, Olayan America, The Olayan Group (international investor/commercial/industrial); Chief Executive Officer, UBS Securities LLC; Group Chief Operating Officer, Americas, UBS AG; Assistant Secretary for Management & Budget and CFO, US Department of the Treasury; Chief Compliance Officer, Kaiser Permanente (healthcare consortium); Program Manager, Hewlett-Packard; Nuclear Engineering, General Dynamics Corporation (aerospace and defense company) | | 158 | | Atlantic Power Corporation (power generation company); ON Semiconductor Corp. (semiconductor supplier) |
Larry Soll — 1942 Trustee | | 2003 | | Retired. Formerly: Chairman, Chief Executive Officer and President, Synergen Corp. (a biotechnology company) | | 158 | | None |
Ann Barnett Stern — 1957 Trustee | | 2017 | | President and Chief Executive Officer, Houston Endowment Inc. (private philanthropic institution) Formerly: Executive Vice President and General Counsel, Texas Children’s Hospital; Attorney, Beck, Redden and Secrest, LLP; Business Law Instructor, University of St. Thomas; Attorney, Andrews & Kurth LLP | | 158 | | Federal Reserve Bank of Dallas |
Raymond Stickel, Jr. — 1944 Trustee | | 2005 | | Retired. Formerly: Director, Mainstay VP Series Funds, Inc. (25 portfolios); Partner, Deloitte & Touche | | 158 | | None |
Robert C. Troccoli — 1949 Trustee | | 2016 | | Adjunct Professor, University of Denver — Daniels College of Business Formerly: Senior Partner, KPMG LLP | | 158 | | None |
T-2 Invesco Global Market Neutral Fund
Trustees and Officers—(continued)
| | | | | | | | |
Name, Year of Birth and Position(s) Held with the Trust | | Trustee and/
or Officer Since | | Principal Occupation(s) During Past 5 Years | | Number of
Funds in Fund
Complex
Overseen by
Trustee | | Other Directorship(s)
Held by Trustee During Past 5 Years |
| Independent Trustees—(continued) |
Christopher L. Wilson — 1957 Trustee | | 2017 | | Managing Partner, CT2, LLC (investing and consulting firm) Formerly: President/Chief Executive Officer, Columbia Funds, Bank of America Corporation; President/Chief Executive Officer, CDC IXIS Asset Management Services, Inc.; Principal & Director of Operations, Scudder Funds, Scudder, Stevens & Clark, Inc.; Assistant Vice President, Fidelity Investments | | 158 | | TD Asset Management USA Inc. (mutual fund complex) (22 portfolios); ISO New England, Inc. (non-profit organization managing regional electricity market) |
| Other Officers | | | | | | | | |
Sheri Morris — 1964 President, Principal Executive Officer and Treasurer | | 1999 | | President, Principal Executive Officer and Treasurer, The Invesco Funds; Vice President, Invesco Advisers, Inc. (formerly known as Invesco Institutional (N.A.), Inc.) (registered investment adviser); and Vice President, PowerShares Exchange-Traded Fund Trust, PowerShares Exchange-Traded Fund Trust II, PowerShares India Exchange-Traded Fund Trust, PowerShares Actively Managed Exchange-Traded Fund Trust and PowerShares Actively Managed Exchange-Traded Commodity Fund Trust Formerly: Vice President and Principal Financial Officer, The Invesco Funds; Vice President, Invesco Aim Advisers, Inc., Invesco Aim Capital Management, Inc. and Invesco Aim Private Asset Management, Inc.; Assistant Vice President and Assistant Treasurer, The Invesco Funds and Assistant Vice President, Invesco Advisers, Inc., Invesco Aim Capital Management, Inc. and Invesco Aim Private Asset Management, Inc.; and Treasurer, PowerShares Exchange-Traded Fund Trust, PowerShares Exchange-Traded Fund Trust II, PowerShares India Exchange-Traded Fund Trust and PowerShares Actively Managed Exchange-Traded Fund Trust | | N/A | | N/A |
Russell C. Burk — 1958 Senior Vice President and Senior Officer | | 2005 | | Senior Vice President and Senior Officer, The Invesco Funds | | N/A | | N/A |
John M. Zerr — 1962 Senior Vice President, Chief Legal Officer and Secretary | | 2006 | | Director, Senior Vice President, Secretary and General Counsel, Invesco Management Group, Inc. (formerly known as Invesco AIM Management Group, Inc.); Senior Vice President, Invesco Advisers, Inc. (formerly known as Invesco Institutional (N.A.), Inc.) (registered investment adviser); Senior Vice President and Secretary, Invesco Distributors, Inc. (formerly known as Invesco AIM Distributors, Inc.); Director, Vice President and Secretary, Invesco Investment Services, Inc. (formerly known as Invesco AIM Investment Services, Inc.) Senior Vice President, Chief Legal Officer and Secretary, The Invesco Funds; Managing Director, Invesco PowerShares Capital Management LLC; Director, Secretary and General Counsel, Invesco Investment Advisers LLC (formerly known as Van Kampen Asset Management); Secretary and General Counsel, Invesco Capital Markets, Inc. (formerly known as Van Kampen Funds Inc.) and Chief Legal Officer, PowerShares Exchange-Traded Fund Trust, PowerShares Exchange-Traded Fund Trust II, PowerShares India Exchange-Traded Fund Trust, PowerShares Actively Managed Exchange-Traded Fund Trust and PowerShares Actively Managed Exchange-Traded Commodity Fund Trust; Manager and Secretary, Invesco Indexing LLC Formerly: Director, Secretary, General Counsel and Senior Vice President, Van Kampen Exchange Corp.; Director, Vice President and Secretary, IVZ Distributors, Inc. (formerly known as INVESCO Distributors, Inc.); Director and Vice President, INVESCO Funds Group, Inc.; Director and Vice President, Van Kampen Advisors Inc.; Director, Vice President, Secretary and General Counsel, Van Kampen Investor Services Inc.; Director, Invesco Distributors, Inc. (formerly known as Invesco AIM Distributors, Inc.); Director, Senior Vice President, General Counsel and Secretary, Invesco AIM Advisers, Inc. and Van Kampen Investments Inc.; Director, Vice President and Secretary, Fund Management Company; Director, Senior Vice President, Secretary, General Counsel and Vice President, Invesco AIM Capital Management, Inc.; Chief Operating Officer and General Counsel, Liberty Ridge Capital, Inc. (an investment adviser); Vice President and Secretary, PBHG Funds (an investment company) and PBHG Insurance Series Fund (an investment company); Chief Operating Officer, General Counsel and Secretary, Old Mutual Investment Partners (a broker-dealer); General Counsel and Secretary, Old Mutual Fund Services (an administrator) and Old Mutual Shareholder Services (a shareholder servicing center); Executive Vice President, General Counsel and Secretary, Old Mutual Capital, Inc. (an investment adviser); and Vice President and Secretary, Old Mutual Advisors Funds (an investment company) | | N/A | | N/A |
Gregory G. McGreevey — 1962 Senior Vice President | | 2012 | | Senior Managing Director, Invesco Ltd.; Director, Chairman, President, and Chief Executive Officer, Invesco Advisers, Inc. (formerly known as Invesco Institutional (N.A.), Inc.) (registered investment adviser); Senior Vice President, Invesco Management Group, Inc.; Director, Invesco Mortgage Capital, Inc. and Invesco Senior Secured Management, Inc.; and Senior Vice President, The Invesco Funds Formerly: Assistant Vice President, The Invesco Funds | | N/A | | N/A |
T-3 Invesco Global Market Neutral Fund
Trustees and Officers—(continued)
| | | | | | | | |
Name, Year of Birth and Position(s) Held with the Trust | | Trustee and/
or Officer Since | | Principal Occupation(s) During Past 5 Years | | Number of
Funds in Fund
Complex
Overseen by
Trustee | | Other Directorship(s)
Held by Trustee During Past 5 Years |
| Other Officers—(continued) | | | | | | | | |
Kelli Gallegos — 1970 Vice President, Principal Financial Officer and Assistant Treasurer | | 2008 | | Vice President, Principal Financial Officer and Assistant Treasurer, The Invesco Funds; Assistant Treasurer, Invesco PowerShares Capital Management LLC, PowerShares Exchange-Traded Fund Trust, PowerShares Exchange-Traded Fund Trust II, PowerShares India Exchange-Traded Fund Trust, PowerShares Actively Managed Exchange-Traded Fund Trust and PowerShares Actively Managed Exchange-Traded Commodity Fund Trust Formerly: Assistant Vice President, The Invesco Funds | | N/A | | N/A |
Tracy Sullivan — 1962 Vice President, Chief Tax Officer and Assistant Treasurer | | 2008 | | Vice President, Chief Tax Officer and Assistant Treasurer, The Invesco Funds; Assistant Treasurer, Invesco PowerShares Capital Management LLC, PowerShares Exchange-Traded Fund Trust, PowerShares Exchange-Traded Fund Trust II, PowerShares India Exchange-Traded Fund Trust, PowerShares Actively Managed Exchange-Traded Fund Trust and PowerShares Actively Managed Exchange-Traded Commodity Fund Trust Formerly: Assistant Vice President, The Invesco Funds | | N/A | | N/A |
Crissie M. Wisdom — 1969 Anti-Money Laundering Compliance Officer | | 2013 | | Anti-Money Laundering Compliance Officer, Invesco Advisers, Inc. (formerly known as Invesco Institutional (N.A.), Inc.) (registered investment adviser), Invesco Capital Markets, Inc. (formerly known as Van Kampen Funds Inc.), Invesco Distributors, Inc., Invesco Investment Services, Inc., Invesco Management Group, Inc., The Invesco Funds, and PowerShares Exchange-Traded Fund Trust, PowerShares Exchange-Traded Fund Trust II, PowerShares India Exchange-Traded Fund Trust, PowerShares Actively Managed Exchange-Traded Fund Trust and PowerShares Actively Managed Exchange-Traded Commodity Fund Trust; Anti-Money Laundering Compliance Officer and Bank Secrecy Act Officer, INVESCO National Trust Company and Invesco Trust Company; and Fraud Prevention Manager and Controls and Risk Analysis Manager for Invesco Investment Services, Inc. Formerly: Anti-Money Laundering Compliance Officer, Van Kampen Exchange Corp. | | N/A | | N/A |
Robert R. Leveille — 1969 Chief Compliance Officer | | 2016 | | Chief Compliance Officer, Invesco Advisers, Inc. (registered investment adviser); and Chief Compliance Officer, The Invesco Funds Formerly: Chief Compliance Officer, Putnam Investments and the Putnam Funds | | N/A | | N/A |
The Statement of Additional Information of the Trust includes additional information about the Fund’s Trustees and is available upon request, without charge, by calling 1.800.959.4246. Please refer to the Fund’s Statement of Additional Information for information on the Fund’s sub-advisers.
| | | | | | |
Office of the Fund 11 Greenway Plaza, Suite 1000 Houston, TX 77046-1173 | | Investment Adviser Invesco Advisers, Inc. 1555 Peachtree Street, N.E. Atlanta, GA 30309 | | Distributor Invesco Distributors, Inc. 11 Greenway Plaza, Suite 1000 Houston, TX 77046-1173 | | Auditors PricewaterhouseCoopers LLP 1000 Louisiana Street, Suite 5800 Houston, TX 77002-5678 |
| | | |
| | | | | | |
Counsel to the Fund Stradley Ronon Stevens & Young, LLP 2005 Market Street, Suite 2600 Philadelphia, PA 19103-7018 | | Counsel to the Independent Trustees Goodwin Procter LLP 901 New York Avenue, N.W. Washington, D.C. 20001 | | Transfer Agent Invesco Investment Services, Inc. 11 Greenway Plaza, Suite 1000 Houston, TX 77046-1173 | | Custodian State Street Bank and Trust Company 225 Franklin Street Boston, MA 02110-2801 |
T-4 Invesco Global Market Neutral Fund
Explore High-Conviction Investing with Invesco

Go paperless with eDelivery
Visit invesco.com/edelivery to enjoy the convenience and security of anytime electronic access to your investment documents.
With eDelivery, you can elect to have any or all of the following materials delivered straight to your inbox to download, save and print from your own computer:
| ∎ | Fund reports and prospectuses |
Invesco mailing information
Send general correspondence to Invesco Investment Services, Inc., P.O. Box 219078, Kansas City, MO 64121-9078.
Important notice regarding delivery of security holder documents
To reduce Fund expenses, only one copy of most shareholder documents may be mailed to shareholders with multiple accounts at the same address (Householding). Mailing of your shareholder documents may be householded indefinitely unless you instruct us otherwise. If you do not want the mailing of these documents to be combined with those for other members of your household, please contact Invesco Investment Services, Inc. at 800 959 4246 or contact your financial institution. We will begin sending you individual copies for each account within 30 days after receiving your request.
Fund holdings and proxy voting information
The Fund provides a complete list of its holdings four times in each fiscal year, at the quarter ends. For the second and fourth quarters, the lists appear in the Fund’s semiannual and annual reports to shareholders. For the first and third quarters, the Fund files the lists with the Securities and Exchange Commission (SEC) on Form N-Q. The most recent list of portfolio holdings is available at invesco.com/completeqtrholdings. Shareholders can also look up the Fund’s Forms N-Q on the SEC website at sec.gov. Copies of the Fund’s Forms N-Q may be reviewed and copied at the SEC Public Reference Room in Washington, D.C. You can obtain information on the operation of the Public Reference Room, including information about duplicating fee charges, by calling 202 551 8090 or 800 732 0330, or by electronic request at the following email address: publicinfo@sec.gov.
The SEC file numbers for the Fund are shown below.
A description of the policies and procedures that the Fund uses to determine how to vote proxies relating to portfolio securities is available without charge, upon request, from our Client Services department at 800 959 4246 or at invesco.com/proxyguidelines. The information is also available on the SEC website, sec.gov.
| | |
Information regarding how the Fund voted proxies related to its portfolio securities during the
most recent 12-month period ended June 30 is available at invesco.com/proxysearch. The
information is also available on the SEC website, sec.gov. Invesco Advisers, Inc. is an investment adviser; it provides investment advisory services to
individual and institutional clients and does not sell securities. Invesco Distributors, Inc. is the US
distributor for Invesco Ltd.’s retail mutual funds, exchange-traded funds and institutional money
market funds. Both are wholly owned, indirect subsidiaries of Invesco Ltd. | |  |
| | | | |
| SEC file numbers: 811-05426 and 033-19338 | | Invesco Distributors, Inc. | | GMN-AR-1 12202017 1347 |
Letters to Shareholders
| | | | |

Philip Taylor | | | | Dear Shareholders: This annual report includes information about your Fund, including performance data and a complete list of its investments as of the close of the reporting period. Inside is a discussion of how your Fund was managed and the factors that affected its performance during the reporting period. American voters went to the polls just days after the start of the reporting period, and their decisions quickly affected markets. The US stock market rallied strongly after the election, with major market indexes rising, and setting record highs, throughout the reporting period. Generally positive economic data, strong corporate earnings and hope for tax and regulatory reform contributed to the rally. US and global bond markets, as well as emerging market equities, sold off immediately following the election – with the US bond market eventually recovering most of its losses. Overseas, economic data were mixed, prompting the European |
Central Bank and central banks in China and Japan, among other countries, to maintain extraordinarily accommodative monetary policies. Citing positive economic trends – specifically, realized and expected labor market conditions and inflation – the US Federal Reserve raised interest rates three times during the reporting period: first in December 2016, and then again in March and June 2017. Health care and tax reform proved to be more difficult than expected to enact, with little progress achieved by the end of the reporting period.
Short-term market volatility can prompt some investors to abandon their investment plans – and can cause others to settle for whatever returns the market has to offer. The investment professionals at Invesco, in contrast, invest with high conviction. This means that, no matter the asset class or the strategy, each investment team has a passion to exceed. We want to help investors achieve better outcomes, such as seeking higher returns, helping mitigate risk and generating income. Of course, investing with high conviction can’t guarantee a profit or ensure success; no investment strategy can. To learn more about how we invest with high conviction, visit invesco.com/HighConviction.
You, too, can invest with high conviction by maintaining a long-term investment perspective and by working with your financial adviser on a regular basis. During periods of short-term market volatility or uncertainty, your financial adviser can keep you focused on your long-term investment goals – a new home, a child’s college education or a secure retirement. He or she also can share research about the economy, the markets and individual investment options.
Visit our website for more information on your investments
Our website, invesco.com/us, offers a wide range of market insights and investment perspectives. On the website, you’ll find detailed information about our funds, including performance, holdings and portfolio manager commentaries. You can access information about your account by completing a simple, secure online registration. To do so, select “Log In” on the right side of the homepage, and then select “Register for Individual Account Access.”
In addition to the resources accessible on our website and through our mobile app, you can obtain timely updates to help you stay informed about the markets and the economy by connecting with Invesco on Twitter, LinkedIn or Facebook. You can access our blog at blog.invesco.us.com. Our goal is to provide you the information you want, when and where you want it.
Finally, I’m pleased to share with you Invesco’s commitment to both the Principles for Responsible Investment and to considering environmental, social and governance issues in our robust investment process. I invite you to learn more at invesco.com/esg.
Have questions?
For questions about your account, contact an Invesco client services representative at 800 959 4246. For Invesco-related questions or comments, please email me directly at phil@invesco.com.
All of us at Invesco look forward to serving your investment management needs. Thank you for investing with us.
Sincerely,

Philip Taylor
Senior Managing Director, Invesco Ltd.
|
| 2 Invesco Global Targeted Returns Fund |
| | | | |

Bruce Crockett | | | | Dear Fellow Shareholders: Among the many important lessons I’ve learned in more than 40 years in a variety of business endeavors is the value of a trusted advocate. As independent chair of the Invesco Funds Board, I can assure you that the members of the Board are strong advocates for the interests of investors in Invesco’s mutual funds. We work hard to represent your interests through oversight of the quality of the investment management services your funds receive and other matters important to your investment, including but not limited to: ∎ Ensuring that Invesco offers a diverse lineup of mutual funds that your financial adviser can use to strive to meet your financial needs as your investment goals change over time. ∎ Monitoring how the portfolio management teams of the Invesco funds are performing in light of changing economic and market conditions. |
| ∎ | Assessing each portfolio management team’s investment performance within the context of the investment strategy described in the fund’s prospectus. |
| ∎ | Monitoring for potential conflicts of interests that may impact the nature of the services that your funds receive. |
We believe one of the most important services we provide our fund shareholders is the annual review of the funds’ advisory and sub-advisory contracts with Invesco Advisers and its affiliates. This review is required by the Investment Company Act of 1940 and focuses on the nature and quality of the services Invesco provides as the adviser to the Invesco funds and the reasonableness of the fees that it charges for those services. Each year, we spend months carefully reviewing information received from Invesco and a variety of independent sources, such as performance and fee data prepared by Lipper, Inc. (a subsidiary of Broadridge Financial Solutions, Inc.), an independent, third-party firm widely recognized as a leader in its field. We also meet with our independent legal counsel and other independent advisers to review and help us assess the information that we have received. Our goal is to assure that you receive quality investment management services for a reasonable fee.
I trust the measures outlined above provide assurance that you have a worthy advocate when it comes to choosing the Invesco Funds.
As always, please contact me at bruce@brucecrockett.com with any questions or concerns you may have. On behalf of the Board, we look forward to continuing to represent your interests and serving your needs.
Sincerely,

Bruce L. Crockett
Independent Chair
Invesco Funds Board of Trustees
|
| 3 Invesco Global Targeted Returns Fund |
Management’s Discussion of Fund Performance
Performance summary
For the fiscal year ended October 31, 2017, Class A shares of Invesco Global Targeted Returns Fund (the Fund), at net asset value (NAV), outperformed the Citi US Three-Month Treasury Bill Index, the Fund’s broad market/style-specific benchmark.
Your Fund’s long-term performance appears later in this report.
Fund vs. Indexes
Total returns, 10/31/16 to 10/31/17, at net asset value (NAV). Performance shown does not include applicable contingent deferred sales charges (CDSC) or front-end sales charges, which would have reduced performance.
| | | | | |
| Class A Shares | | | | 1.32 | % |
| Class C Shares | | | | 0.52 | |
| Class R Shares | | | | 0.99 | |
| Class Y Shares | | | | 1.48 | |
| Class R5 Shares | | | | 1.58 | |
| Class R6 Shares | | | | 1.59 | |
| Citi US Three-Month Treasury Bill Index▼ (Broad Market/Style Specific Index)* | | | | 0.71 | |
| U.S. 3-Month Treasury Bill Index∎ (Former Broad Market/Style-Specific Index)* | | | | 0.80 | |
Source(s): ▼FactSet Research Systems Inc.; ∎Lipper Inc. *The Fund has elected to use the Citi US Three-Month Treasury Bill Index rather than the U.S. 3-Month Treasury Bill Index as its broad market/style-specific index because the Citi US Three-Month Treasury Bill Index more closely reflects the performance of the types of securities in which the Fund invests. | | | | | |
Market conditions and your Fund
The Fund targets an annual gross return of 5% above three-month US Treasury bills and aims to achieve this with less than half the volatility of global equities (as represented by the MSCI World Index), over a rolling three-year period. The Fund seeks to achieve these targets by investing in good long-term investment ideas
(typically 20-30) that are combined through a robust risk-managed process into a single portfolio. There is no guarantee that the Fund will achieve either a positive return or its target return, and an investor may lose money by investing in the Fund. Each idea reflects a fundamental macroeconomic view with regard to asset classes, geographies, currencies or sectors globally that have the potential to
| | | | | | |
| Portfolio Composition | | | | | | |
| By asset type | | | | | | |
| | | Risk Allocation1 | | Notional Value as % of Total Net Assets2 | | Value as % of Total Net Assets3 |
| Commodity | | 5.10% | | 23.65% | | -0.01% |
| Credit | | 7.03 | | 27.33 | | 16.12 |
| Currency | | 25.73 | | 295.87 | | 2.00 |
| Equity | | 30.90 | | 285.21 | | 44.02 |
| Inflation | | 9.31 | | 196.87 | | 0.03 |
| Interest Rate | | 17.94 | | 198.23 | | 11.41 |
| Volatility4 | | 3.99 | | 1.22 | | -0.63 |
| Money Market Funds Plus Other Assets Less Liabilities | | – | | – | | 27.06 |
deliver a positive return over a two- to three-year time horizon. We then identify what we believe is the best way to implement these ideas. This can include investments in a wide range of asset types including derivative instruments and physical securities, including underlying investment companies.
The reporting period began with major US stock market indexes posting gains and most hitting record highs following the US presidential election. Investors believed that the new administration’s plans to reduce tax rates, scale back regulations and increase infrastructure spending had the potential to stimulate economic growth. However, that was called into question in the first quarter of 2017, when it appeared that enacting significant regulatory and tax reform might be more difficult than previously anticipated.
Outside the US, Brexit (the UK’s plan to leave the European Union) remained a source of political and economic uncertainty, while improved economic data and confidence surveys raised the prospect of less accommodative monetary policy in continental Europe. In Asia, increased exports helped Japan’s economy, while China’s economy continued to stabilize. Most emerging markets performed well during the reporting period. In addition to an improving global economic outlook, other positive tailwinds for international markets included continued weakness in the US dollar and reduced expectations for a major shift in US trade policy.
One of the significant contributors to Fund performance during the reporting period was the Equity – Selective Asia
| | |
| Total Net Assets | | $148.4 million |
The Fund’s holdings are subject to change, and there is no assurance that the Fund will continue to hold any particular security.
Data presented here are as of October 31, 2017.
| 1 | The values in this column represent the Adviser’s proprietary measure of risk that each asset type contributes to the Fund. The risk associated with each asset type is calculated by aggregating the independent risk, as of the end of the fiscal period, of each of the Fund’s investment ideas that are included in that asset type. Independent risk is determined by measuring the historical price volatility of the assets or asset classes that comprise the investment idea using a statistical measurement called standard deviation. Standard deviation measures how much historical prices vary from their average over a certain period of time. The risk of each investment idea takes into account the Adviser’s evaluation of the risk dynamics and expected correlation of the components of the investment idea based on historical price movements. Historical price movements may not be representative of future price movements and, therefore, the actual risk of each asset type may be much greater or lower than the values shown. In addition, there are ways to measure risk other than standard deviation which, if used, may have resulted in a different risk allocation. |
| 2 | The values in this column represent the gross notional amount of the derivative instruments and other investments held by the Fund, including purchased and written options, futures, forwards, swaps and investment companies. The notional amount of a derivative is the nominal or face amount used to calculate payments made on the instrument. The gross notional amount does not reflect any offsetting or netting of long and short positions. The notional amounts of derivatives and other investments denominated in foreign currencies have been adjusted to the US dollar equivalent using spot exchange rates. See the Consolidated Schedule of Investments for a complete list of derivative instruments held by the Fund as of October 31, 2017. |
| 3 | The percentages in this column were calculated by adding the market value of purchased options and sovereign debt securities, the net unrealized appreciation/depreciation of written options, futures, swaps and forwards, and the net asset value of investments in affiliated issuers held by the Fund. See the Consolidated Schedule of Investments for the complete list of derivative instruments held by the Fund as of October 31, 2017. |
| 4 | Includes the volatility and variance swaps held by the Fund, the gains and losses on which are driven by the volatility (i.e., the positive and negative changes in value over time) of a particular asset, such as stocks or currencies, and not by the asset itself. |
|
| 4 Invesco Global Targeted Returns Fund |
Exposure idea. We implemented the idea by reflecting two Asian equity strategies managed by our Invesco colleagues and tailored this idea by using index futures. The idea benefited from the strong performance of the underlying strategies as well as its overweight exposure to the Taiwanese equity market, which performed well on an improved outlook for global growth. In the Interest Rates – Swap Spreads idea, we sought to capitalize on long-dated UK gilts and US Treasuries, which appeared to be trading at historically cheap levels versus other similar interest rate swaps. Midway through the reporting period, this idea benefited as spreads between long-dated government bonds and interest rate swaps narrowed in both the US and the UK. Our Equity – Japan idea was a solid performer during the reporting period, particularly during the latter half. This idea was rewarded by strong gains in Japanese equity markets during the run-up to Prime Minister Abe’s landslide re-election win.
Among the most significant detractors from Fund performance for the reporting period was the Currency – Japanese Yen vs Korean Won idea, which favored the Japanese yen against the relatively more expensive Korean won. The yen depreciated early in the reporting period as Japanese authorities maintained their quantitative easing efforts despite increasing pressure on bond yields globally. Later in the reporting period, the yen and won remained relatively range bound as tensions between the US and North Korea put some pressure on the South Korean won. The Currency – US Dollar vs Euro idea, which seeks to benefit from the US dollar strengthening versus the euro due to relatively favorable long-term economic growth dynamics in the US, was a detractor in the latter half of the reporting period. Several European events proved accretive for the euro, including broadly positive European economic data, markets speculating the European Central Bank would begin unwinding its accommodative monetary policy and the election of a pro-European French president. The US dollar was also under pressure because of concerns over a slowdown in tax reform and other pro-growth policies of the Trump administration. Our Equity – US Staples vs Discretionary idea detracted from the Fund’s performance early in the reporting period. While the idea provided diversification with negative correlation to equity markets and low correlation with other ideas in the strategy, it was already under review and ultimately removed from the Fund in November 2016 following the
Trump presidential election victory and his administration’s pro-growth agenda.
While the Fund is focused on the return and risk attributes of each idea individually and its impact on the other ideas in the Fund, there were some shifts in positioning during the reporting period that could be identified more broadly. We lowered the number of total investment ideas in the portfolio over the reporting period and increased risk-on positioning while maintaining diversification across seven asset classes and continuing to have broad geographic representation. After adding our first commodity idea to the portfolio last year, it was supplemented with another commodity idea which seeks to take advantage of the shape of the commodity curve and potentially benefit from rising energy prices.
On March 28, 2017, the Fund transitioned the manner in which it obtains equity and fixed income market exposure from a fund-of-funds structure to a sleeved structure. Pursuant to a sleeve structure, the Fund invests directly in individual securities rather than investing in underlying funds.
We believe economic growth is being boosted by cyclical factors such as consumption and trade, but structural issues such as high debt and declining global liquidity could hinder it. We believe low inflation may persist due to a lack of pricing power and debt overhang. Policy conflicts are influencing decision making, which could drive uncertainty both for the US dollar and for core bond markets. A weakened US dollar is a boon to emerging markets, but its popularity as a borrowed currency typically indicates that it still has support. Credit markets look expensive and vulnerable to policy changes, and equity returns are dominated by income. For these reasons, diversified alpha through actively-managed equity and credit strategies is a useful source of potential value. Volatility remains stubbornly low, but macroeconomic uncertainties suggest this may be unsustainable and may rise.
As indicated throughout this report, the investment ideas make significant use of derivative instruments. Therefore, the performance of the Fund, both positive and negative, can be attributed largely to these instruments. Derivatives can be a cost-effective way to gain exposure to asset classes. However, derivatives may amplify traditional investment risks through the creation of leverage and may be less liquid than traditional securities.
We thank you for your investment in Invesco Global Targeted Returns Fund.
| 2 | Source: US Federal Reserve |
The views and opinions expressed in management’s discussion of Fund performance are those of Invesco Advisers, Inc. These views and opinions are subject to change at any time based on factors such as market and economic conditions. These views and opinions may not be relied upon as investment advice or recommendations, or as an offer for a particular security. The information is not a complete analysis of every aspect of any market, country, industry, security or the Fund. Statements of fact are from sources considered reliable, but Invesco Advisers, Inc. makes no representation or warranty as to their completeness or accuracy. Although historical performance is no guarantee of future results, these insights may help you understand our investment management philosophy.
See important Fund and, if applicable, index disclosures later in this report.
| | |
 | | David Millar Portfolio Manager, is lead manager of Invesco Global Targeted Returns Fund. He joined |
| Invesco in 2013. Mr. Millar earned a BSc (Hons) degree in mathematical statistics from the University of Cape Town. He is a Fellow of the Institute and Faculty of Actuaries. |
| | |
 | | Richard Batty Portfolio Manager, is manager of Invesco Global Targeted Returns Fund. He joined Invesco in 2013. |
| Mr. Batty earned a PhD in financial economics from Brunel University. |
| | |
 | | Dave Jubb Portfolio Manager, is manager of Invesco Global Targeted Returns Fund. He joined Invesco in 2013. |
| Mr. Jubb earned a Bsc (Hons) in mathematics from St. Andrews University. He is a Fellow of the Institute and Faculty of Actuaries. |
|
| 5 Invesco Global Targeted Returns Fund |
Your Fund’s Long-Term Performance
Results of a $10,000 Investment – Oldest Share Class(es) since Inception
Fund and index data from 12/19/13
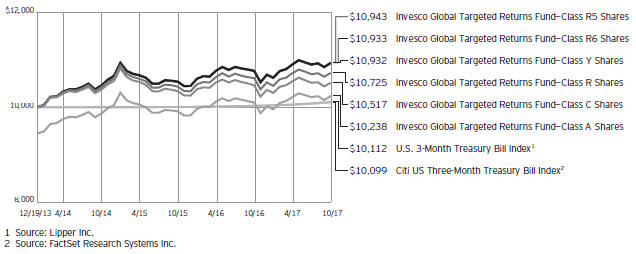
Past performance cannot guarantee comparable future results.
During the reporting period, the Fund elected to use the Citi US Three-Month Treasury Bill Index rather than the U.S. 3-Month Treasury Bill Index as its broad market/style-specific index because the Citi US Three-Month Treasury Bill Index more closely reflects the performance of the types of securities in which the Fund
invests. Because this is the first reporting period since we have adopted the new index, SEC guidelines require that we compare performance to both the old and new indexes.
The data shown in the chart include reinvested distributions, applicable sales charges and Fund expenses including management fees. Index results include reinvested dividends, but they do not
reflect sales charges. Performance of the peer group, if applicable, reflects fund expenses and management fees; performance of a market index does not. Performance shown in the chart and table(s) does not reflect deduction of taxes a shareholder would pay on Fund distributions or sale of Fund shares.
continued from page 10
| ∎ | | A direct investment cannot be made in an index. Unless otherwise indicated, index results include reinvested dividends, and they do not reflect sales charges. Performance of the peer group, if applicable, reflects fund expenses; performance of a market index does not. |
Other information
| ∎ | | The returns shown in management’s discussion of Fund performance are based on net asset values (NAVs) calculated for shareholder transactions. Generally accepted accounting principles require adjustments to be made to the net assets of the Fund at period end for financial reporting purposes, and as such, the NAVs for shareholder transactions and the returns based on those NAVs may differ from the NAVs and returns reported in the Financial Highlights. |
|
| 6 Invesco Global Targeted Returns Fund |
| | | | |
Average Annual Total Returns | |
As of 10/31/17, including maximum applicable sales charges | |
| |
| Class A Shares | | | | |
| Inception (12/19/13) | | | 0.61 | % |
| 1 Year | | | -4.25 | |
| |
| Class C Shares | | | | |
| Inception (12/19/13) | | | 1.31 | % |
| 1 Year | | | -0.45 | |
| |
| Class R Shares | | | | |
| Inception (12/19/13) | | | 1.83 | % |
| 1 Year | | | 0.99 | |
| |
| Class Y Shares | | | | |
| Inception (12/19/13) | | | 2.33 | % |
| 1 Year | | | 1.48 | |
| |
| Class R5 Shares | | | | |
| Inception (12/19/13) | | | 2.36 | % |
| 1 Year | | | 1.58 | |
| |
| Class R6 Shares | | | | |
| Inception (12/19/13) | | | 2.33 | % |
| 1 Year | | | 1.59 | |
The performance data quoted represent past performance and cannot guarantee comparable future results; current performance may be lower or higher. Please visit invesco.com/performance for the most recent month-end performance. Performance figures reflect reinvested distributions, changes in net asset value and the effect of the maximum sales charge unless otherwise stated. Investment return and principal value will fluctuate so that you may have a gain or loss when you sell shares.
The net annual Fund operating expense ratio set forth in the most recent Fund prospectus as of the date of this report for Class A, Class C, Class R, Class Y, Class R5 and Class R6 shares was 1.44%, 2.19%, 1.69%, 1.19%, 1.19% and 1.19%, respectively.1,2,3 The total annual Fund operating expense ratio set forth in the most recent Fund prospectus as of the date of this report for Class A, Class C, Class R, Class Y, Class R5 and Class R6 shares was 2.37%, 3.12%, 2.62%, 2.12%, 2.11% and 2.02%, respectively.1 The expense ratios presented above may vary from the expense ratios presented in other sections of this report that are based on expenses incurred during the period covered by this report.
Class A share performance reflects the maximum 5.50% sales charge, and Class C share performance reflects the applicable contingent deferred sales
| | | | |
Average Annual Total Returns | |
| As of 9/30/17, the most recent calendar quarter end, including maximum applicable sales charges | |
| |
| Class A Shares | | | | |
| Inception (12/19/13) | | | 0.41 | % |
| 1 Year | | | -5.28 | |
| |
| Class C Shares | | | | |
| Inception (12/19/13) | | | 1.15 | % |
| 1 Year | | | -1.55 | |
| |
| Class R Shares | | | | |
| Inception (12/19/13) | | | 1.68 | % |
| 1 Year | | | 0.08 | |
| |
| Class Y Shares | | | | |
| Inception (12/19/13) | | | 2.17 | % |
| 1 Year | | | 0.48 | |
| |
| Class R5 Shares | | | | |
| Inception (12/19/13) | | | 2.20 | % |
| 1 Year | | | 0.48 | |
| |
| Class R6 Shares | | | | |
| Inception (12/19/13) | | | 2.17 | % |
| 1 Year | | | 0.48 | |
charge (CDSC) for the period involved. The CDSC on Class C shares is 1% for the first year after purchase. Class R, Class Y, Class R5 and Class R6 class shares do not have a front-end sales charge or a CDSC; therefore, performance is at net asset value.
The performance of the Fund’s share classes will differ primarily due to different sales charge structures and class expenses.
Fund performance reflects any applicable fee waivers and/or expense reimbursements. Had the adviser not waived fees and/or reimbursed expenses currently or in the past, returns would have been lower. See current prospectus for more information.
| 1 | The expense ratio includes acquired fund fees and expenses of the underlying funds in which the Fund invests of 0.42% for Invesco Global Targeted Returns Fund. |
| 2 | Total annual Fund operating expenses after any contractual fee waivers and/or expense reimbursements by the adviser in effect through at least February 28, 2019. See current prospectus for more information. |
| 3 | Total annual Fund operating expenses after any contractual fee waivers and/or expense reimbursements by the adviser in effect through at least June 30, 2019. See current prospectus for more information. |
|
| 7 Invesco Global Targeted Returns Fund |
Invesco Global Targeted Returns Fund’s investment objective is to seek a positive total return over the long term in all market environments.
| ∎ | | Unless otherwise stated, information presented in this report is as of October 31, 2017, and is based on total net assets. |
| ∎ | | Unless otherwise noted, all data provided by Invesco. |
| ∎ | | To access your Fund’s reports/prospectus, visit invesco.com/fundreports. |
About share classes
| ∎ | | Class R shares are generally available only to employer sponsored retirement and benefit plans. Please see the prospectus for more information. |
| ∎ | | Class Y shares are available only to certain investors. Please see the prospectus for more information. |
| ∎ | | Class R5 shares and Class R6 shares are available for use by retirement plans that meet certain standards and for institutional investors. Class R6 shares are also available through intermediaries that have established an agreement with Invesco Distributors, Inc. to make such shares available for use in retail omnibus accounts. Please see the prospectus for more information. |
Principal risks of investing in the Fund
| ∎ | | Allocation risk. The Fund’s investment performance depends, in part, on how its assets are allocated among the underlying funds or asset classes. The Adviser’s evaluations and assumptions regarding the asset classes or the underlying funds in which the Fund invests may be incorrect, causing the Fund to be invested (or not invested) in one or more asset classes or underlying funds at an inopportune time, which could negatively affect the Fund’s performance. |
| ∎ | | Changing fixed income market conditions risk. The current low interest rate environment was created in part by the Federal Reserve Board (FRB) and certain foreign central banks keeping the federal funds and equivalent foreign rates near, at or below zero. Increases in the federal funds and equivalent foreign rates may expose fixed income markets to heightened volatility and reduced liquidity for certain fixed income investments, particularly those with longer maturities. In addition, decreases in fixed income dealer market-making capacity may also potentially lead to heightened volatility and reduced |
| | | liquidity in the fixed income markets. As a result, the value of the Fund’s investments and share price may decline. Changes in central bank policies could also result in higher than normal shareholder redemptions, which could potentially increase portfolio turnover and the Fund’s transaction costs. |
| ∎ | | Commodities tax risk. The tax treatment of commodity-linked derivative instruments may be adversely affected by changes in legislation, regulations or other legally binding authority. If, as a result of any such adverse action, the income of the Fund from certain commodity-linked derivatives was treated as non-qualifying income, the Fund might fail to qualify as a regulated investment company and be subject to federal income tax at the Fund level. As a result of a recent announcement by the Internal Revenue Service, the Fund intends to invest in commodity-linked notes: (a) directly, generally only to the extent that it obtains an opinion of counsel confirming that income from such investments should be qualifying income because such commodity-linked notes constitute securities under section 2(a)(36) of the 1940 Act or (b) indirectly through the Subsidiary. Should the Internal Revenue Service issue further guidance, or Congress enact legislation, that adversely affects the tax treatment of the Fund’s use of commodity-linked notes or the Subsidiary (which guidance might be applied to the Fund retroactively), it could, among other consequences, limit the Fund’s ability to pursue its investment strategy. |
| ∎ | | Commodity-linked notes risk. In addition to risks associated with the underlying commodities, investments in commodity-linked notes may be subject to additional risks, such as non-payment of interest and loss of principal, counterparty risk, lack of a secondary market and risk of greater volatility than traditional equity and debt securities. The value of the |
| | | commodity-linked notes the Fund buys may fluctuate significantly because the values of the underlying investments to which they are linked are themselves volatile. Additionally, certain commodity-linked notes employ “economic” leverage by requiring payment by the issuer of an amount that is a multiple of the price increase or decrease of the underlying commodity, commodity index, or other economic variable. Such economic leverage will increase the volatility of the value of these commodity-linked notes and the Fund to the extent it invests in such notes. |
| ∎ | | Commodity risk. The Fund may have investment exposure to the commodities markets and/or a particular sector of the commodities markets, which may subject the Fund to greater volatility than investments in traditional securities, such as stocks and bonds. Volatility in the commodities markets may be caused by changes in overall market movements, domestic and foreign political and economic events and policies, war, acts of terrorism, changes in domestic or foreign interest rates and/ or investor expectations concerning interest rates, domestic and foreign inflation rates, investment and trading activities of mutual funds, hedge funds and commodities funds, and factors such as drought, floods, weather, livestock disease, embargoes, tariffs and other regulatory developments or supply and demand disruptions. Because the Fund’s performance may be linked to the performance of volatile commodities, investors should be willing to assume the risks of potentially significant fluctuations in the value of the Fund’s shares. |
| ∎ | | Debt securities risk. The prices of debt securities held by the Fund will be affected by changes in interest rates, the creditworthiness of the issuer and other factors. An increase in prevailing interest rates typically causes the value of existing debt securities to fall and often has a greater impact on longer-duration debt securities and higher quality debt securities. Falling interest rates will cause the Fund to reinvest the proceeds of debt securities that have been repaid by the issuer at lower interest rates. Falling interest rates may also reduce the Fund’s distributable income because interest payments on floating |
|
This report must be accompanied or preceded by a currently effective Fund prospectus, which contains more complete information, including sales charges and expenses. Investors should read it carefully before investing. |
|
|
| NOT FDIC INSURED | MAY LOSE VALUE | NO BANK GUARANTEE |
|
| 8 Invesco Global Targeted Returns Fund |
| | rate debt instruments held by the Fund will decline. The Fund could lose money on investments in debt securities if the issuer or borrower fails to meet its obligations to make interest payments and/or to repay principal in a timely manner. Changes in an issuer’s financial strength, the market’s perception of such strength or in the credit rating of the issuer or the security may affect the value of debt securities. The Adviser’s credit analysis may fail to anticipate such changes, which could result in buying a debt security at an inopportune time or failing to sell a debt security in advance of a price decline or other credit event. |
| ∎ | | Derivatives risk. The value of a derivative instrument depends largely on (and is derived from) the value of an underlying security, currency, commodity, interest rate, index or other asset (each referred to as an underlying asset). In addition to risks relating to the underlying assets, the use of derivatives may include other, possibly greater, risks, including counterparty, leverage and liquidity risks. Counterparty risk is the risk that the counterparty to the derivative contract will default on its obligation to pay the Fund the amount owed or otherwise perform under the derivative contract. Derivatives create leverage risk because they do not require payment up front equal to the economic exposure created by owning the derivative. As a result, an adverse change in the value of the underlying asset could result in the Fund sustaining a loss that is substantially greater than the amount invested in the derivative, which may make the Fund’s returns more volatile and increase the risk of loss. Derivative instruments may also be less liquid than more traditional investments and the Fund may be unable to sell or close out its derivative positions at a desirable time or price. This risk may be more acute under adverse market conditions, during which the Fund may be most in need of liquidating its derivative positions. Derivatives may also be harder to value, less tax efficient and subject to changing government regulation that could impact the Fund’s ability to use certain derivatives or their cost. The SEC has proposed new regulations related to the use of derivatives and related instruments by registered investment companies. If adopted as proposed, these regulations would limit the Fund’s ability to engage in derivatives transactions and may result in increased costs or require the Fund to |
| | | modify its investment strategies or to liquidate. Also, derivatives used for hedging or to gain or limit exposure to a particular market segment may not provide the expected benefits, particularly during adverse market conditions. These risks are greater for the Fund than most other mutual funds because the Fund will implement its investment strategy primarily through derivative instruments rather than direct investments in stocks/bonds. |
| ∎ | | Emerging markets securities risk. Emerging markets (also referred to as developing markets) are generally subject to greater market volatility, political, social and economic instability, uncertain trading markets and more governmental limitations on foreign investment than more developed markets. In addition, companies operating in emerging markets may be subject to lower trading volume and greater price fluctuations than companies in more developed markets. Securities law and the enforcement of systems of taxation in many emerging market countries may change quickly and unpredictably. In addition, investments in emerging markets securities may also be subject to additional transaction costs, delays in settlement procedures, and lack of timely information. |
| ∎ | | Exchange-traded funds risk. In addition to the risks associated with the underlying assets held by the exchange-traded fund, investments in exchange-traded funds are subject to the following additional risks: (1) an exchange-traded fund’s shares may trade above or below its net asset value; (2) an active trading market for the exchange-traded fund’s shares may not develop or be maintained; (3) trading an exchange-traded fund’s shares may be halted by the listing exchange; (4) a passively managed exchange-traded fund may not track the performance of the reference asset; and (5) a passively managed exchange-traded fund may hold troubled securities. Investment in exchange-traded funds may involve duplication of management fees and certain other expenses, as the Fund indirectly bears its proportionate share of any expenses paid by the exchange-traded funds in which it invests. Further, certain exchange-traded funds in which the Fund may invest are leveraged, which may result in economic leverage, permitting the Fund to gain exposure that is greater than would be the case in an unlevered instrument and potentially resulting in greater volatility. |
| ∎ | | Exchange-traded notes risk. Exchange-traded notes are subject to credit risk, counterparty risk, and the risk that the value of the exchange-traded note may drop due to a downgrade in the issuer’s credit rating. The value of an exchange-traded note may also be influenced by time to maturity, level of supply and demand for the exchange-traded note, volatility and lack of liquidity in the underlying market, changes in the applicable interest rates, and economic, legal, political, or geographic events that affect the referenced underlying market or assets. The Fund will bear its proportionate share of any fees and expenses borne by an exchange-traded note in which it invests. For certain exchange-traded notes, there may be restrictions on the Fund’s right to redeem its investment, which is meant to be held until maturity. |
| ∎ | | Foreign currency tax risk. If the US Treasury Department were to exercise its authority to issue regulations that exclude from the definition of “qualifying income” foreign currency gains not directly related to the Fund’s business of investing in securities, the Fund may be unable to qualify as a regulated investment company for one or more years. In this event, the Fund’s Board of Trustees may authorize a significant change in investment strategy or other action. |
| ∎ | | Foreign government debt risk. Investments in foreign government debt securities (sometimes referred to as sovereign debt securities) involve certain risks in addition to those relating to foreign securities or debt securities generally. The issuer of the debt or the governmental authorities that control the repayment of the debt may be unable or unwilling to repay principal or interest when due in accordance with the terms of such debt, and the Fund may have limited recourse in the event of a default against the defaulting government. Without the approval of debt holders, some governmental debtors have in the past been able to reschedule or restructure their debt payments or declare moratoria on payments. |
| ∎ | | Foreign securities risk. The Fund’s foreign investments may be adversely affected by political and social instability, changes in economic or taxation policies, difficulty in enforcing obligations, decreased liquidity or increased volatility. Foreign investments also involve the risk of the possible seizure, nationalization or expropriation of the issuer or foreign deposits (in which the Fund could lose its entire investments in a certain market) and the possible adoption |
|
| 9 Invesco Global Targeted Returns Fund |
| | of foreign governmental restrictions such as exchange controls. Unless the Fund has hedged its foreign securities risk, foreign securities risk also involves the risk of negative foreign currency rate fluctuations, which may cause the value of securities denominated in such foreign currency (or other instruments through which the Fund has exposure to foreign currencies) to decline in value. Currency exchange rates may fluctuate significantly over short periods of time. Currency hedging strategies, if used, are not always successful. |
| ∎ | | High yield debt securities (junk bond) risk. Investments in high yield debt securities (“junk bonds”) and other lower-rated securities will subject the Fund to substantial risk of loss. These securities are considered to be speculative with respect to the issuer’s ability to pay interest and principal when due, are more susceptible to default or decline in market value and are less liquid than investment grade debt securities. Prices of high yield debt securities tend to be very volatile. |
| ∎ | | Investing in the European Union risk. Investments in certain countries in the European Union are susceptible to high economic risks associated with high levels of debt, such as investments in sovereign debt of Greece, Italy and Spain. Efforts of the member states to further unify their economic and monetary policies may increase the potential for the downward movement of one member state’s market to cause a similar effect on other member states’ markets. Separately, the European Union faces issues involving its membership, structure, procedures and policies. The exit of one or more member states from the European Union, such as the United Kingdom (UK) which has announced its intention to exit, would place its currency and banking system in jeopardy. The exit by the UK or other member states will likely result in increased volatility, illiquidity and potentially lower economic growth in the affected markets, which will adversely affect the Fund’s investments. |
| ∎ | | Management risk. The Fund is actively managed and depends heavily on the Adviser’s judgment about markets, interest rates or the attractiveness, relative values, liquidity, or potential appreciation of particular investments made for the Fund’s portfolio. The Fund could experience losses if these judgments prove to be incorrect. Because the Fund’s investment process relies heavily on its asset allocation process, |
| | | market movements that are counter to the portfolio managers’ expectations may have a significant adverse effect on the Fund’s net asset value. Additionally, legislative, regulatory, or tax developments may adversely affect management of the Fund and, therefore, the ability of the Fund to achieve its investment objective. |
| ∎ | | Market risk. The market values of the Fund’s investments, and therefore the value of the Fund’s shares, will go up and down, sometimes rapidly or unpredictably. Market risk may affect a single issuer, industry or section of the economy, or it may affect the market as a whole. Individual stock prices tend to go up and down more dramatically than those of certain other types of investments, such as bonds. During a general downturn in the financial markets, multiple asset classes may decline in value. When markets perform well, there can be no assurance that specific investments held by the Fund will rise in value. |
| ∎ | | Short position risk. Because the Fund’s potential loss on a short position arises from increases in the value of the asset sold short, the Fund will incur a loss on a short position, which is theoretically unlimited, if the price of the asset sold short increases from the short sale price. The counterparty to a short position or other market factors may prevent the Fund from closing out a short position at a desirable time or price and may reduce or eliminate any gain or result in a loss. In a rising market, the Fund’s short positions will cause the Fund to underperform the overall market and its peers that do not engage in shorting. If the Fund holds both long and short positions, and both positions decline simultaneously, the short positions will not provide any buffer (hedge) from declines in value of the Fund’s long positions. Certain types of short positions involve leverage, which may exaggerate any losses, potentially more than the actual cost of the investment, and will increase the volatility of the Fund’s returns. |
| ∎ | | Small- and mid-capitalization companies risks. Small- and mid-capitalization companies tend to be more vulnerable to changing market conditions, may have little or no operating history or track record of success, and may have more limited product lines and markets, less experienced management and fewer financial resources than larger companies. These companies’ securities may be more volatile and less liquid than those of more established companies, and their returns may vary, |
| | | sometimes significantly, from the overall securities market. |
| ∎ | | Subsidiary risk. By investing in the Subsidiary, the Fund is indirectly exposed to risks associated with the Subsidiary’s investments. The Subsidiary is not registered under the Investment Company Act of 1940, as amended (1940 Act), and, except as otherwise noted in the prospectus, is not subject to the investor protections of the 1940 Act. Changes in the laws of the United States and/or the Cayman Islands, under which the Fund and the Subsidiary, respectively, are organized, could result in the inability of the Fund and/or the Subsidiary to operate as described in the prospectus and the SAI, and could negatively affect the Fund and its shareholders. |
| ∎ | | US government obligations risk. Obligations of US government agencies and authorities receive varying levels of support and may not be backed by the full faith and credit of the US government, which could affect the Fund’s ability to recover should they default. No assurance can be given that the US government will provide financial support to its agencies and authorities if it is not obligated by law to do so. |
| ∎ | | Volatility risk. Although the Fund’s investment strategy targets a specific volatility level, certain of the Fund’s investments may appreciate or decrease significantly in value over short periods of time. This may cause the Fund’s net asset value per share to experience significant increases or declines in value over short periods of time. |
About indexes used in this report
| ∎ | | The Citi US Three-Month Treasury Bill Index is an unmanaged index representative of three-month US Treasury bills. |
| ∎ | | The U.S. 3-Month Treasury Bill Index is tracked by Lipper to provide performance for the three-month US Treasury bill. |
| ∎ | | The MSCI World IndexSM is an unmanaged index considered representative of stocks of developed countries. The index is computed using the net return, which withholds applicable taxes for non-resident investors. |
| ∎ | | The Fund is not managed to track the performance of any particular index, including the index(es) described here, and consequently, the performance of the Fund may deviate significantly from the performance of the index(es). |
continued on page 6
|
| 10 Invesco Global Targeted Returns Fund |
Consolidated Schedule of Investments
October 31, 2017
| | | | | | | | |
| | | Shares | | | Value | |
Common Stocks & Other Equity Interests–40.60% | |
| Australia–0.22% | |
Alumina Ltd. | | | 14,874 | | | $ | 26,707 | |
Amcor Ltd. | | | 7,370 | | | | 89,353 | |
Fairfax Media Ltd. | | | 26,574 | | | | 22,404 | |
Metcash Ltd. | | | 20,095 | | | | 41,374 | |
Mineral Resources Ltd. | | | 1,240 | | | | 16,604 | |
Newcrest Mining Ltd. | | | 2,180 | | | | 37,193 | |
Origin Energy Ltd.(a) | | | 6,118 | | | | 37,289 | |
Woodside Petroleum Ltd. | | | 2,516 | | | | 59,358 | |
| | | | | | | | 330,282 | |
|
| Austria–0.07% | |
OMV AG | | | 1,815 | | | | 109,055 | |
| | |
| Belgium–0.06% | | | | | | | | |
Proximus S.A. | | | 2,812 | | | | 93,390 | |
| | |
| Brazil–0.15% | | | | | | | | |
BRF S.A.(a) | | | 4,300 | | | | 58,257 | |
EZ Tec Empreendimentos e Participacoes S.A. | | | 10,500 | | | | 69,266 | |
Kroton Educacional S.A. | | | 6,800 | | | | 37,707 | |
Telefonica Brasil S.A.–Preference Shares | | | 3,300 | | | | 50,923 | |
| | | | | | | | 216,153 | |
|
| Canada–0.30% | |
Canadian Natural Resources Ltd. | | | 6,572 | | | | 229,340 | |
Goldcorp, Inc. | | | 5,683 | | | | 74,220 | |
Methanex Corp. | | | 1,453 | | | | 70,834 | |
PrairieSky Royalty Ltd. | | | 2,657 | | | | 70,724 | |
| | | | | | | | 445,118 | |
|
| China–2.18% | |
51job, Inc.–ADR (a) | | | 2,402 | | | | 148,684 | |
Alibaba Group Holding Ltd.–ADR(a) | | | 1,044 | | | | 193,025 | |
Autohome Inc.–ADR(a) | | | 1,059 | | | | 60,903 | |
Baidu, Inc.–ADR(a) | | | 1,600 | | | | 390,304 | |
Changyou.com Ltd.–ADR(a) | | | 465 | | | | 18,014 | |
China Biologic Products Holdings, Inc.(a) | | | 510 | | | | 39,632 | |
China Communications Services Corp. Ltd.–Class H | | | 8,000 | | | | 4,851 | |
China Conch Venture Holdings Ltd. | | | 44,000 | | | | 89,676 | |
China Literature Ltd.(a)(b) | | | 8 | | | | 57 | |
China Mobile Ltd. | | | 34,000 | | | | 341,464 | |
China Resources Power Holdings Co. Ltd. | | | 46,000 | | | | 88,446 | |
CNOOC Ltd. | | | 144,000 | | | | 196,972 | |
ENN Energy Holdings Ltd. | | | 16,000 | | | | 117,312 | |
FIH Mobile Ltd. | | | 38,000 | | | | 11,963 | |
Fuyao Glass Industry Group Co., Ltd.–REGS–Class H(b) | | | 9,600 | | | | 36,658 | |
| | | | | | | | |
| | | Shares | | | Value | |
| China–(continued) | |
Industrial & Commercial Bank of China Ltd.–Class H | | | 234,000 | | | $ | 185,667 | |
JD.com, Inc.–ADR(a) | | | 4,031 | | | | 151,243 | |
Minth Group Ltd. | | | 32,000 | | | | 172,687 | |
NetEase, Inc.–ADR | | | 1,537 | | | | 433,311 | |
Qingdao Port International Co., Ltd.–REGS–Class H (b) | | | 83,000 | | | | 58,904 | |
Sohu.com Inc.(a) | | | 471 | | | | 26,955 | |
Tencent Holdings Ltd. | | | 9,400 | | | | 423,396 | |
Zhejiang Expressway Co., Ltd.–Class H | | | 34,000 | | | | 42,183 | |
| | | | | | | | 3,232,307 | |
|
| Denmark–0.45% | |
Carlsberg A/S–Class B | | | 604 | | | | 68,980 | |
Danske Bank A/S | | | 4,300 | | | | 164,054 | |
GN Store Nord A/S | | | 1,331 | | | | 44,029 | |
H. Lundbeck A/S | | | 1,698 | | | | 100,908 | |
ISS A/S | | | 1,990 | | | | 84,241 | |
Novo Nordisk A/S–Class B | | | 3,548 | | | | 176,523 | |
Rockwool International A/S–Class B | | | 76 | | | | 20,643 | |
Sydbank A/S | | | 391 | | | | 15,254 | |
| | | | | | | | 674,632 | |
|
| Finland–0.74% | |
Nokia Oyj | | | 47,793 | | | | 234,722 | |
Orion Oyj–Class B | | | 462 | | | | 18,944 | |
Stora Enso Oyj–Class R | | | 27,029 | | | | 422,858 | |
UPM-Kymmene Oyj | | | 14,230 | | | | 427,674 | |
| | | | | | | | 1,104,198 | |
|
| France–2.98% | |
Airbus SE | | | 5,331 | | | | 544,935 | |
Atos SE | | | 1,121 | | | | 174,201 | |
AXA S.A. | | | 3,752 | | | | 113,332 | |
BNP Paribas S.A. | | | 2,454 | | | | 191,843 | |
Capgemini SE | | | 2,644 | | | | 321,398 | |
Cie Generale des Etablissements Michelin | | | 2,735 | | | | 395,701 | |
Faurecia | | | 2,526 | | | | 183,644 | |
Ipsen S.A. | | | 455 | | | | 55,017 | |
Legrand S.A. | | | 706 | | | | 52,446 | |
Neopost S.A. | | | 516 | | | | 19,018 | |
Nexity S.A. | | | 260 | | | | 15,977 | |
Orange S.A. | | | 26,293 | | | | 431,405 | |
Peugeot S.A. | | | 7,352 | | | | 174,413 | |
Safran S.A. | | | 1,305 | | | | 137,471 | |
Sanofi | | | 1,897 | | | | 179,636 | |
Société Générale S.A. | | | 2,939 | | | | 163,650 | |
SPIE S.A. | | | 926 | | | | 24,357 | |
Teleperformance | | | 125 | | | | 18,224 | |
TOTAL S.A. | | | 21,871 | | | | 1,219,609 | |
| | | | | | | | 4,416,277 | |
See accompanying Notes to Consolidated Financial Statements which are an integral part of the financial statements.
11 Invesco Global Targeted Returns Fund
| | | | | | | | |
| | | Shares | | | Value | |
| Germany–2.07% | |
Allianz S.E. | | | 524 | | | $ | 121,685 | |
BASF S.E. | | | 3,217 | | | | 350,839 | |
Bayer AG | | | 3,135 | | | | 409,483 | |
Beiersdorf AG | | | 354 | | | | 39,712 | |
Covestro AG–REGS(b) | | | 2,013 | | | | 193,677 | |
Deutsche Boerse AG | | | 1,927 | | | | 199,066 | |
Deutsche Post AG | | | 15,466 | | | | 708,403 | |
Deutsche Telekom AG | | | 8,543 | | | | 155,645 | |
E.ON S.E. | | | 13,451 | | | | 158,728 | |
Fraport AG Frankfurt Airport Services Worldwide | | | 1,071 | | | | 101,894 | |
HOCHTIEF AG | | | 458 | | | | 81,020 | |
Rheinmetall AG | | | 349 | | | | 41,163 | |
RWE AG(a) | | | 6,884 | | | | 172,091 | |
SAP S.E. | | | 886 | | | | 100,795 | |
Siltronic AG(a) | | | 407 | | | | 60,307 | |
Software AG | | | 775 | | | | 39,461 | |
TUI AG | | | 2,639 | | | | 47,677 | |
Volkswagen AG–Preference Shares | | | 502 | | | | 91,167 | |
| | | | | | | | 3,072,813 | |
|
| Hong Kong–0.71% | |
AIA Group Ltd. | | | 48,000 | | | | 361,166 | |
CK Asset Holdings Ltd. | | | 19,000 | | | | 156,235 | |
CK Hutchison Holdings Ltd. | | | 23,000 | | | | 292,018 | |
Jardine Strategic Holdings Ltd. | | | 1,400 | | | | 58,716 | |
Pacific Basin Shipping Ltd.(a) | | | 65,000 | | | | 14,831 | |
Standard Chartered PLC(a) | | | 11,250 | | | | 112,235 | |
Yue Yuen Industrial (Holdings) Ltd. | | | 14,500 | | | | 55,741 | |
| | | | | | | | 1,050,942 | |
|
| India–0.73% | |
Adani Ports & Special Economic Zone Ltd. | | | 11,324 | | | | 75,266 | |
Godrej Consumer Products Ltd. | | | 5,850 | | | | 84,379 | |
HDFC Bank Ltd.–ADR | | | 3,540 | | | | 326,742 | |
Housing Development Finance Corp. Ltd. | | | 1,894 | | | | 49,945 | |
ICICI Bank Ltd.–ADR | | | 12,773 | | | | 116,875 | |
Infosys Ltd.–ADR | | | 9,263 | | | | 137,555 | |
Tata Consultancy Services Ltd. | | | 605 | | | | 24,542 | |
UPL Ltd. | | | 14,646 | | | | 180,803 | |
Zee Entertainment Enterprises Ltd. | | | 9,890 | | | | 82,774 | |
| | | | | | | | 1,078,881 | |
|
| Indonesia–0.12% | |
PT Bank Negara Indonesia (Persero) Tbk | | | 201,400 | | | | 112,854 | |
PT Bank Rakyat Indonesia (Persero) Tbk | | | 27,200 | | | | 31,344 | |
PT Telekomunikasi Indonesia Persero Tbk | | | 92,700 | | | | 27,685 | |
| | | | | | | | 171,883 | |
| | | | | | | | |
| | | Shares | | | Value | |
| Ireland–0.15% | |
Kingspan Group PLC | | | 4,481 | | | $ | 187,395 | |
UDG Healthcare PLC | | | 2,467 | | | | 30,297 | |
| | | | | | | | 217,692 | |
|
| Italy–0.77% | |
A2A S.p.A. | | | 10,600 | | | | 18,213 | |
Banco BPM S.p.A.(a) | | | 52,111 | | | | 181,402 | |
Eni S.p.A. | | | 12,608 | | | | 206,065 | |
Intesa Sanpaolo S.p.A. | | | 133,710 | | | | 449,520 | |
Mediaset S.p.A.(a) | | | 6,765 | | | | 24,855 | |
Recordati S.p.A. | | | 2,246 | | | | 104,349 | |
Telecom Italia S.p.A.(a) | | | 183,420 | | | | 159,022 | |
| | | | | | | | 1,143,426 | |
|
| Japan–0.37% | |
INPEX Corp. | | | 3,400 | | | | 36,182 | |
Mitsubishi Estate Co., Ltd. | | | 3,100 | | | | 56,228 | |
NEXON Co., Ltd.(a) | | | 7,400 | | | | 197,871 | |
Sumitomo Mitsui Financial Group, Inc. | | | 2,100 | | | | 84,512 | |
Toyota Motor Corp. | | | 2,700 | | | | 167,678 | |
| | | | | | | | 542,471 | |
|
| Malaysia–0.01% | |
British American Tobacco Malaysia Bhd. | | | 1,900 | | | | 17,620 | |
|
| Mali–0.08% | |
Randgold Resources Ltd. | | | 1,208 | | | | 118,668 | |
|
| Mexico–0.08% | |
Fibra Uno Administracion S.A. de C.V. | | | 73,100 | | | | 114,694 | |
|
| Netherlands–0.93% | |
ASM International N.V. | | | 801 | | | | 53,671 | |
ASR Nederland N.V. | | | 1,000 | | | | 41,005 | |
BE Semiconductor Industries N.V. | | | 384 | | | | 30,172 | |
Heineken Holding N.V. | | | 188 | | | | 17,454 | |
ING Groep N.V. | | | 25,775 | | | | 476,201 | |
Koninklijke Ahold Delhaize N.V. | | | 21,680 | | | | 407,995 | |
Philips Lighting N.V.–REGS(b) | | | 705 | | | | 26,671 | |
SBM Offshore N.V. | | | 8,716 | | | | 155,548 | |
Wolters Kluwer N.V. | | | 3,348 | | | | 164,116 | |
| | | | | | | | 1,372,833 | |
|
| Norway–0.62% | |
Norsk Hydro ASA | | | 15,068 | | | | 116,492 | |
Orkla ASA | | | 7,543 | | | | 73,830 | |
Statoil ASA | | | 24,833 | | | | 503,813 | |
Telenor ASA | | | 3,427 | | | | 72,792 | |
TGS NOPEC Geophysical Co. ASA | | | 2,212 | | | | 50,776 | |
Yara International ASA | | | 2,014 | | | | 95,617 | |
| | | | | | | | 913,320 | |
|
| Philippines–0.03% | |
Robinsons Retail Holdings, Inc. | | | 27,160 | | | | 51,106 | |
See accompanying Notes to Consolidated Financial Statements which are an integral part of the financial statements.
12 Invesco Global Targeted Returns Fund
| | | | | | | | |
| | | Shares | | | Value | |
| Russia–0.04% | | | | | | | | |
MMC Norilsk Nickel PJSC–ADR | | | 3,214 | | | $ | 59,138 | |
|
| Singapore–0.21% | |
DBS Group Holdings Ltd. | | | 5,200 | | | | 86,902 | |
Parkway Life REIT | | | 5,900 | | | | 12,336 | |
Singapore Telecommunications Ltd. | | | 20,200 | | | | 55,667 | |
United Overseas Bank Ltd. | | | 9,000 | | | | 162,556 | |
| | | | | | | | 317,461 | |
|
| South Africa–0.10% | |
Mondi PLC | | | 6,391 | | | | 154,599 | |
|
| South Korea–1.57% | |
E-MART Inc. | | | 174 | | | | 34,789 | |
Hyundai Motor Co. | | | 1,310 | | | | 188,255 | |
Hyundai Motor Co.–Preference Shares | | | 1,690 | | | | 170,457 | |
Kangwon Land, Inc. | | | 1,442 | | | | 44,148 | |
KB Financial Group Inc. | | | 3,216 | | | | 167,920 | |
Korea Electric Power Corp. | | | 5,860 | | | | 205,038 | |
Korea Investment Holdings Co., Ltd. | | | 1,254 | | | | 70,852 | |
LG Corp. | | | 1,718 | | | | 131,878 | |
LG Uplus Corp. | | | 1,543 | | | | 17,698 | |
POSCO | | | 472 | | | | 137,448 | |
Samsung Electronics Co., Ltd. | | | 292 | | | | 718,815 | |
Samsung Electronics Co., Ltd.–Preference Shares | | | 159 | | | | 317,903 | |
Shinhan Financial Group Co., Ltd. | | | 2,776 | | | | 124,964 | |
| | | | | | | | 2,330,165 | |
|
| Spain–0.74% | |
Amadeus IT Group S.A. | | | 2,855 | | | | 193,727 | |
Atresmedia Corp. de Medios de Comunicación, S.A. | | | 7,830 | | | | 80,449 | |
Banco Bilbao Vizcaya Argentaria, S.A. | | | 17,630 | | | | 154,296 | |
Bankia S.A. | | | 27,481 | | | | 131,217 | |
CaixaBank S.A. | | | 65,154 | | | | 304,958 | |
Ebro Foods, S.A. | | | 580 | | | | 13,955 | |
Endesa, S.A. | | | 2,937 | | | | 67,229 | |
Mediaset Espana Comunicacion S.A. | | | 4,781 | | | | 51,973 | |
Merlin Properties Socimi, S.A. | | | 4,788 | �� | | | 63,194 | |
Obrascon Huarte Lain, S.A.(a) | | | 7,770 | | | | 43,645 | |
| | | | | | | | 1,104,643 | |
|
| Sweden–0.45% | |
Electrolux AB–Series B | | | 4,511 | | | | 159,502 | |
Intrum Justitia AB | | | 1,033 | | | | 36,131 | |
Loomis AB–Class B | | | 482 | | | | 19,340 | |
Lundin Petroleum AB(a) | | | 2,731 | | | | 64,235 | |
Nordea Bank AB | | | 7,413 | | | | 89,614 | |
Saab AB–Class B | | | 739 | | | | 37,765 | |
Sandvik AB | | | 1,128 | | | | 20,550 | |
SSAB AB–Class A(a) | | | 8,911 | | | | 43,670 | |
SSAB AB–Class B(a) | | | 16,134 | | | | 64,931 | |
Swedish Match AB | | | 3,414 | | | | 128,541 | |
| | | | | | | | 664,279 | |
| | | | | | | | |
| | | Shares | | | Value | |
| Switzerland–2.68% | |
Adecco Group AG | | | 3,661 | | | $ | 290,815 | |
Barry Callebaut AG | | | 27 | | | | 42,140 | |
Bucher Industries AG | | | 59 | | | | 23,135 | |
Coca-Cola HBC AG | | | 2,856 | | | | 96,555 | |
Flughafen Zürich AG | | | 229 | | | | 49,813 | |
Georg Fischer AG | | | 46 | | | | 56,740 | |
Glencore PLC | | | 92,545 | | | | 445,666 | |
LafargeHolcim Ltd. | | | 804 | | | | 45,414 | |
Logitech International S.A. | | | 4,062 | | | | 145,118 | |
Lonza Group AG | | | 705 | | | | 187,274 | |
Nestle S.A. | | | 869 | | | | 73,085 | |
Novartis AG | | | 7,470 | | | | 616,181 | |
Roche Holding AG | | | 2,995 | | | | 692,008 | |
SGS S.A. | | | 75 | | | | 185,245 | |
Sika AG | | | 22 | | | | 163,023 | |
STMicroelectronics N.V. | | | 5,315 | | | | 125,067 | |
Straumann Holding AG | | | 102 | | | | 71,214 | |
Temenos Group AG | | | 1,076 | | | | 124,253 | |
UBS Group AG | | | 14,611 | | | | 248,908 | |
VAT Group AG–REGS(b) | | | 166 | | | | 21,615 | |
Zurich Insurance Group AG | | | 877 | | | | 267,937 | |
| | | | | | | | 3,971,206 | |
|
| Taiwan–1.00% | |
Asustek Computer Inc. | | | 6,000 | | | | 51,988 | |
China Life Insurance Co., Ltd. | | | 15,170 | | | | 14,369 | |
Delta Electronics Inc. | | | 3,000 | | | | 14,466 | |
Gigabyte Technology Co., Ltd. | | | 15,000 | | | | 23,348 | |
Hon Hai Precision Industry Co., Ltd. | | | 67,000 | | | | 249,911 | |
MediaTek Inc. | | | 14,000 | | | | 158,970 | |
Quanta Computer Inc. | | | 13,000 | | | | 30,679 | |
Taiwan Semiconductor Manufacturing Co. Ltd.–ADR | | | 15,851 | | | | 670,973 | |
Taiwan Semiconductor Manufacturing Co. Ltd. | | | 30,000 | | | | 242,287 | |
Yageo Corp. | | | 3,193 | | | | 25,560 | |
| | | | | | | | 1,482,551 | |
|
| Thailand–0.12% | |
Bangkok Bank PCL–NVDR | | | 4,500 | | | | 26,169 | |
Bangkok Bank PCL | | | 22,300 | | | | 135,306 | |
CPN Retail Growth Leasehold Property Fund | | | 27,600 | | | | 18,108 | |
| | | | | | | | 179,583 | |
|
| United Kingdom–16.00% | |
Ashtead Group PLC | | | 2,631 | | | | 67,803 | |
AstraZeneca PLC | | | 6,844 | | | | 463,866 | |
Aviva PLC | | | 130,505 | | | | 876,024 | |
Babcock International Group PLC | | | 24,404 | | | | 263,236 | |
BAE Systems PLC | | | 148,403 | | | | 1,170,017 | |
Balfour Beatty PLC | | | 43,314 | | | | 157,655 | |
Barclays PLC | | | 326,088 | | | | 805,489 | |
See accompanying Notes to Consolidated Financial Statements which are an integral part of the financial statements.
13 Invesco Global Targeted Returns Fund
| | | | | | | | |
| | | Shares | | | Value | |
| United Kingdom–(continued) | |
Barratt Developments PLC | | | 20,332 | | | $ | 176,774 | |
Beazley PLC | | | 36,242 | | | | 243,367 | |
Bellway PLC | | | 2,073 | | | | 100,513 | |
Booker Group PLC | | | 49,407 | | | | 132,052 | |
BP PLC | | | 305,390 | | | | 2,069,780 | |
British American Tobacco PLC | | | 14,904 | | | | 962,581 | |
BT Group PLC | | | 203,746 | | | | 704,518 | |
BTG PLC (a) | | | 36,361 | | | | 364,197 | |
Bunzl PLC | | | 7,592 | | | | 236,628 | |
Capita PLC | | | 22,255 | | | | 154,913 | |
Centrica PLC | | | 75,360 | | | | 169,984 | |
Compass Group PLC | | | 8,910 | | | | 195,657 | |
Dairy Crest Group PLC | | | 19,009 | | | | 153,403 | |
Derwent London PLC | | | 6,001 | | | | 213,323 | |
easyJet PLC | | | 34,521 | | | | 614,035 | |
Electrocomponents PLC | | | 5,943 | | | | 54,788 | |
Essentra PLC | | | 7,849 | | | | 55,470 | |
esure Group PLC | | | 41,222 | | | | 147,029 | |
Experian PLC | | | 1,618 | | | | 34,089 | |
Fevertree Drinks PLC | | | 1,038 | | | | 29,246 | |
Fiat Chrysler Automobiles N.V.(a) | | | 1,174 | | | | 20,295 | |
G4S PLC | | | 127,839 | | | | 477,198 | |
GlaxoSmithKline PLC | | | 8,722 | | | | 156,727 | |
Hays PLC | | | 18,810 | | | | 46,576 | |
Hiscox Ltd. | | | 22,843 | | | | 433,321 | |
HSBC Holdings PLC | | | 12,000 | | | | 117,303 | |
Imperial Brands PLC | | | 9,199 | | | | 375,214 | |
Inchcape PLC | | | 3,164 | | | | 32,847 | |
Indivior PLC (a) | | | 10,821 | | | | 53,416 | |
InterContinental Hotels Group PLC | | | 1,729 | | | | 95,966 | |
International Consolidated Airlines Group, S.A. | | | 21,294 | | | | 179,839 | |
International Consolidated Airlines Group, S.A. | | | 39,663 | | | | 335,098 | |
Intertek Group PLC | | | 1,861 | | | | 133,996 | |
J D Wetherspoon PLC | | | 16,348 | | | | 270,373 | |
J Sainsbury PLC | | | 121,852 | | | | 392,530 | |
Lancashire Holdings Ltd. | | | 16,386 | | | | 163,580 | |
Legal & General Group PLC | | | 319,259 | | | | 1,132,357 | |
Lloyds Banking Group PLC | | | 307,593 | | | | 279,037 | |
London Stock Exchange Group PLC | | | 4,114 | | | | 205,540 | |
Marks & Spencer Group PLC | | | 97,192 | | | | 444,267 | |
Moneysupermarket.com Group PLC | | | 8,014 | | | | 34,588 | |
N Brown Group PLC | | | 31,737 | | | | 126,984 | |
NEX Group PLC | | | 2,392 | | | | 20,161 | |
Next PLC | | | 3,861 | | | | 252,396 | |
PageGroup PLC | | | 5,499 | | | | 34,121 | |
Persimmon PLC | | | 4,745 | | | | 176,617 | |
Provident Financial PLC | | | 10,852 | | | | 134,283 | |
RELX N.V. | | | 5,694 | | | | 128,613 | |
RELX PLC | | | 23,345 | | | | 537,076 | |
Rentokil Initial PLC | | | 83,901 | | | | 374,263 | |
| | | | | | | | |
| | | Shares | | | Value | |
| United Kingdom–(continued) | |
Rightmove PLC | | | 1,201 | | | $ | 66,273 | |
Rolls-Royce Holdings PLC–Preference Shares(a) | | | 1,448,402 | | | | 1,924 | |
Rolls-Royce Holdings PLC | | | 31,487 | | | | 406,980 | |
Royal Bank of Scotland Group PLC (The)(a) | | | 70,548 | | | | 264,748 | |
Royal Dutch Shell PLC–Class A | | | 40,856 | | | | 1,283,081 | |
Royal Dutch Shell PLC–Class A | | | 13,100 | | | | 412,251 | |
Royal Dutch Shell PLC–Class B | | | 10,509 | | | | 338,298 | |
RSA Insurance Group PLC | | | 37,172 | | | | 310,596 | |
Saga PLC | | | 20,417 | | | | 51,830 | |
Shaftesbury PLC | | | 12,600 | | | | 165,705 | |
Spirax-Sarco Engineering PLC | | | 352 | | | | 26,419 | |
SSP Group PLC | | | 4,072 | | | | 31,644 | |
Stagecoach Group PLC | | | 43,880 | | | | 97,228 | |
Standard Chartered PLC(a) | | | 6,777 | | | | 67,555 | |
Subsea 7 S.A. | | | 8,287 | | | | 139,295 | |
TalkTalk Telecom Group PLC | | | 121,090 | | | | 343,427 | |
TechnipFMC PLC(a) | | | 1,094 | | | | 29,745 | |
Tesco PLC | | | 40,623 | | | | 97,890 | |
Thomas Cook Group PLC | | | 312,268 | | | | 496,951 | |
TP ICAP PLC | | | 28,102 | | | | 203,266 | |
Unilever N.V. | | | 2,931 | | | | 170,392 | |
Vectura Group PLC(a) | | | 58,706 | | | | 77,985 | |
Vodafone Group PLC | | | 240,851 | | | | 689,222 | |
WH Smith PLC | | | 1,900 | | | | 51,665 | |
Wm Morrison Supermarkets PLC | | | 43,683 | | | | 130,100 | |
| | | | | | | | 23,735,489 | |
|
| United States–3.76% | |
Allergan PLC | | | 371 | | | | 65,752 | |
Altria Group, Inc. | | | 5,544 | | | | 356,036 | |
American Express Co. | | | 1,416 | | | | 135,256 | |
Amgen Inc. | | | 935 | | | | 163,831 | |
Aon PLC | | | 772 | | | | 110,728 | |
Apache Corp. | | | 2,083 | | | | 86,174 | |
Berkshire Hathaway Inc.–Class B(a) | | | 584 | | | | 109,173 | |
Carnival PLC | | | 2,445 | | | | 161,130 | |
Chevron Corp. | | | 2,688 | | | | 311,512 | |
Citigroup Inc. | | | 6,032 | | | | 443,352 | |
eBay Inc.(a) | | | 4,018 | | | | 151,237 | |
First Republic Bank | | | 1,751 | | | | 170,547 | |
Gilead Sciences, Inc. | | | 2,790 | | | | 209,138 | |
JPMorgan Chase & Co. | | | 4,721 | | | | 474,980 | |
Las Vegas Sands Corp. | | | 3,451 | | | | 218,724 | |
Markel Corp.(a) | | | 38 | | | | 41,203 | |
Mastercard Inc.–Class A | | | 1,078 | | | | 160,374 | |
Microsoft Corp. | | | 3,376 | | | | 280,816 | |
Monsanto Co. | | | 111 | | | | 13,442 | |
Nasdaq, Inc. | | | 2,452 | | | | 178,138 | |
National Oilwell Varco Inc. | | | 2,218 | | | | 75,833 | |
Newmont Mining Corp. | | | 980 | | | | 35,437 | |
See accompanying Notes to Consolidated Financial Statements which are an integral part of the financial statements.
14 Invesco Global Targeted Returns Fund
| | | | | | | | |
| | |
Shares | | | Value | |
| United States–(continued) | |
Nielsen Holdings PLC | | | 4,859 | | | $ | 180,123 | |
PayPal Holdings, Inc.(a) | | | 1,421 | | | | 103,108 | |
Pfizer Inc. | | | 7,060 | | | | 247,524 | |
Priceline Group Inc. (The)(a) | | | 59 | | | | 112,806 | |
Samsonite International S.A. | | | 19,200 | | | | 80,675 | |
TE Connectivity Ltd. | | | 1,478 | | | | 134,454 | |
Union Pacific Corp. | | | 1,102 | | | | 127,601 | |
United Rentals, Inc.(a) | | | 421 | | | | 59,563 | |
United Technologies Corp. | | | 2,076 | | | | 248,622 | |
Wells Fargo & Co. | | | 4,397 | | | | 246,848 | |
Williams-Sonoma, Inc. | | | 1,574 | | | | 81,218 | |
| | | | | | | | 5,575,355 | |
| | |
| Zambia–0.11% | | | | | | | | |
First Quantum Minerals Ltd. | | | 14,547 | | | | 162,711 | |
Total Common Stocks & Other Equity Interests
(Cost $53,940,535) | | | | 60,224,941 | |
| | |
| | | Principal
Amount | | | | |
Non-U.S. Dollar Denominated Bonds & Notes–16.97%(c) | |
| Australia–0.08% | |
Origin Energy Finance Ltd., REGS, Unsec. Sub. Gtd. Euro Bonds, 4.00%, 09/16/2074(b) | | EUR | 100,000 | | | | 122,282 | |
|
| Belgium–0.10% | |
Solvay Finance S.A., REGS, Jr. Unsec. Sub. Gtd. Euro Bonds, 5.87%(b)(d) | | EUR | 100,000 | | | | 140,953 | |
|
| Bermuda–0.05% | |
Fidelity International Ltd., REGS, Sr. Unsec. Medium-Term Euro Notes, 6.75%, 10/19/2020(b) | | GBP | 50,000 | | | | 75,688 | |
|
| Brazil–0.02% | |
Notas do Tesouro Nacional, Series F, Unsec. Notes, 10.00%, 01/01/2018 | | BRL | 75,000 | | | | 23,831 | |
|
| Canada–0.02% | |
Parkland Fuel Corp., Sr. Unsec. Gtd. Notes, 5.63%, 05/09/2025 | | CAD | 40,000 | | | | 31,160 | |
|
| France–0.44% | |
Burger King France S.A.S.,
Sr. Sec. Gtd. Floating Rate Bonds, 5.25% (3 mo. EURIBOR + 5.25%), 05/01/2023(b)(e) | | EUR | 100,000 | | | | 120,128 | |
Électricité de France S.A., REGS, Jr. Unsec. Sub. Medium-Term Euro Notes, 5.88%(b)(d) | | GBP | 100,000 | | | | 140,060 | |
La Financière ATALIAN S.A.S., Sr. Unsec. Gtd. Bonds, 4.00%, 05/15/2024(b) | | EUR | 100,000 | | | | 122,664 | |
Orange S.A., REGS, Jr. Unsec. Sub. Euro Notes, 5.88%(b)(d) | | GBP | 100,000 | | | | 148,588 | |
| | | | | | | | |
| | | Principal
Amount | | | Value | |
| France–(continued) | |
TOTAL S.A., REGS, Jr. Unsec. Sub. Medium-Term Euro Notes, 2.25%(b)(d) | | EUR | 100,000 | | | $ | 122,320 | |
| | | | | | | | 653,760 | |
|
| Germany–0.33% | |
CBR Fashion Finance B.V., Sr. Sec. Gtd. Bonds, 5.13%, 10/01/2022(b) | | EUR | 100,000 | | | | 117,284 | |
PrestigeBidCo GmbH, Sr. Sec. Gtd. Bonds, 6.25%, 12/15/2023(b) | | EUR | 100,000 | | | | 126,951 | |
Unitymedia Hessen GmbH & Co. KG/Unitymedia NRW GmbH, REGS, Sr. Sec. Gtd. First Lien Euro Bonds, 4.63%, 02/15/2026(b) | | EUR | 100,000 | | | | 127,993 | |
WEPA Hygieneprodukte GmbH, REGS, Sr. Sec. Gtd. First Lien Euro Notes, 3.75%, 05/15/2024(b) | | EUR | 100,000 | | | | 122,047 | |
| | | | | | | | 494,275 | |
|
| Hungary–0.75% | |
Hungary Government Bond,
Series 2027A, Unsec. Bonds, 3.00%, 10/27/2027 | | HUF | 283,870,000 | | | | 1,115,689 | |
|
| Italy–0.31% | |
Enel S.p.A., REGS, Jr. Unsec. Sub. Euro Bonds, 6.63%, 09/15/2076(b) | | GBP | 100,000 | | | | 150,970 | |
Italy Buoni Poliennali del Tesoro, Sr. Unsec. Euro Bonds, 1.25%, 12/01/2026 | | EUR | 55,000 | | | | 61,906 | |
Mercury Bondco PLC, Sr. Sec. Gtd. PIK Bonds, 7.88% PIK Rate, 7.13% Cash Rate, 05/30/2021(b)(f) | | EUR | 100,000 | | | | 121,813 | |
Wind Tre S.p.A., Sr. Sec. Gtd. Floating Rate Notes, 2.47% (3 mo. EURIBOR + 2.75%),
01/20/2024(b)(e) | | EUR | 100,000 | | | | 117,189 | |
| | | | | | | | 451,878 | |
|
| Mexico–1.70% | |
Mexican Bonos,
Series M, Sr. Unsec. Bonds, 5.75%, 03/05/2026 | | MXN | 2,113,000 | | | | 100,198 | |
10.00%, 12/05/2024 | | MXN | 38,706,700 | | | | 2,343,583 | |
Petróleos Mexicanos, REGS, Sr. Unsec. Gtd. Medium-Term Euro Notes, 8.25%, 06/02/2022(b) | | GBP | 50,000 | | | | 83,086 | |
| | | | | | | | 2,526,867 | |
|
| Netherlands–0.16% | |
HEMA Bondco I B.V., Sr. Sec. Gtd. Floating Rate Bonds, 6.25% (3 mo. EURIBOR + 6.25%),
07/15/2022(b)(e) | | EUR | 100,000 | | | | 121,150 | |
See accompanying Notes to Consolidated Financial Statements which are an integral part of the financial statements.
15 Invesco Global Targeted Returns Fund
| | | | | | | | |
| | | Principal
Amount | | | Value | |
| Netherlands–(continued) | |
UPC Holding B.V., REGS, Sr. Sec. First Lien Euro Bonds, 3.88%, 06/15/2029(b) | | EUR | 100,000 | | | $ | 112,896 | |
| | | | | | | | 234,046 | |
|
| Poland–3.08% | |
Republic of Poland Government Bond,
Series 0726, Unsec. Bonds, 2.50%, 07/25/2026 | | PLN | 17,343,000 | | | | 4,460,956 | |
Series 0727, Unsec. Bonds, 2.50%, 07/25/2027 | | PLN | 440,000 | | | | 111,684 | |
| | | | | | | | 4,572,640 | |
|
| Portugal–0.05% | |
Portugal Obrigações do Tesouro, REGS, Sr. Unsec. Euro Bonds, 2.88%, 10/15/2025(b) | | EUR | 60,000 | | | | 75,999 | |
|
| Spain–0.40% | |
Iberdrola International B.V., REGS, Sr. Unsec. Gtd. Medium-Term Euro Notes, 1.13%, 04/21/2026(b) | | EUR | 100,000 | | | | 118,189 | |
Naviera Armas, S.A., Sr. Sec. Gtd. Floating Rate Bonds, 6.50% (3 mo. EURIBOR + 6.50%),
07/31/2023(b)(e) | | EUR | 100,000 | | | | 125,567 | |
Spain Government Bond, REGS, Sr. Unsec. Euro Bonds, 1.95%, 04/30/2026(b) | | EUR | 55,000 | | | | 68,088 | |
2.75%, 10/31/2024(b) | | EUR | 55,000 | | | | 72,486 | |
Spain Government Inflation Linked Bond, REGS, Sr. Unsec. Euro Bonds, 0.55%, 11/30/2019(b) | | EUR | 50,000 | | | | 60,773 | |
Telefónica Europe B.V., REGS, Jr. Unsec. Sub. Gtd. Euro Bonds, 6.75%(b)(d) | | GBP | 100,000 | | | | 147,476 | |
| | | | | | | | 592,579 | |
|
| Supranational–0.07% | |
European Investment Bank (The), REGS, Sr. Unsec. Medium-Term Euro Notes, 1.50%, 02/01/2019(b) | | GBP | 80,000 | | | | 107,499 | |
|
| Switzerland–0.19% | |
ELM B.V. for Swiss Reinsurance Co. Ltd., REGS, Jr. Unsec. Sub. Medium-Term Euro Notes,
6.30%(b)(d) | | GBP | 100,000 | | | | 142,099 | |
LafargeHolcim Sterling Finance (Netherlands) B.V., REGS, Sr. Unsec. Gtd. Medium-Term Euro Notes, 3.00%, 05/12/2032(b) | | GBP | 100,000 | | | | 130,281 | |
| | | | | | | | 272,380 | |
|
| United Kingdom–8.67% | |
AA Bond Co. Ltd., REGS, Sr. Sec. First Lien Medium-Term Euro Notes, 4.25%, 07/31/2043(b) | | GBP | 100,000 | | | | 140,502 | |
| | | | | | | | |
| | | Principal
Amount | | | Value | |
| United Kingdom–(continued) | |
Anglian Water (Osprey) Financing PLC, REGS, Sr. Sec. Gtd. Medium-Term Euro Notes, 7.00%, 01/31/2018(b) | | GBP | 100,000 | | | $ | 134,834 | |
B.A.T. International Finance PLC, REGS, Sr. Unsec. Gtd. Medium-Term Euro Notes, 2.25%, 09/09/2052(b) | | GBP | 100,000 | | | | 107,302 | |
Barclays Bank PLC, Series RCI, REGS, Jr. Unsec. Sub. Euro Bonds, 14.00%(b)(d) | | GBP | 150,000 | | | | 234,870 | |
Boparan Finance PLC, REGS, Sr. Sec. Gtd. First Lien Euro Notes, 5.50%, 07/15/2021(b) | | GBP | 100,000 | | | | 126,367 | |
BP Capital Markets PLC, REGS, Sr. Unsec. Gtd. Medium-Term Euro Notes, 1.18%, 08/12/2023(b) | | GBP | 100,000 | | | | 128,997 | |
Centrica PLC, REGS, Jr. Unsec. Sub. Euro Bonds, 5.25%, 04/10/2075(b) | | GBP | 100,000 | | | | 141,961 | |
CYBG PLC, REGS, Unsec. Sub. Euro Bonds, 5.00%, 02/09/2026(b) | | GBP | 100,000 | | | | 139,795 | |
Ei Group PLC, Sr. Sec. First Mortgage Euro Bonds, 6.50%, 12/06/2018 | | GBP | 50,000 | | | | 69,904 | |
HBOS Capital Funding L.P., REGS, Jr. Unsec. Sub. Gtd. Euro Notes,
6.46%(b)(d) | | GBP | 100,000 | | | | 139,434 | |
Heathrow Finance PLC, REGS, Sr. Sec. First Lien Euro Notes, 5.75%, 03/03/2025(b) | | GBP | 100,000 | | | | 150,763 | |
InterContinental Hotels Group PLC, REGS, Sr. Unsec. Gtd. Medium-Term Euro Notes, 2.13%, 08/24/2026(b) | | GBP | 100,000 | | | | 127,064 | |
Jaguar Land Rover Automotive PLC, REGS, Sr. Unsec. Gtd. Euro Notes, 3.88%, 03/01/2023(b) | | GBP | 100,000 | | | | 139,581 | |
John Lewis PLC, REGS, Sr. Unsec. Euro Bonds, 4.25%, 12/18/2034(b) | | GBP | 100,000 | | | | 140,009 | |
Lloyds Banking Group PLC, REGS, Jr. Unsec. Sub. Euro Bonds, 7.88%(b)(d) | | GBP | 200,000 | | | | 321,694 | |
Marks & Spencers PLC, REGS, Sr. Unsec. Medium-Term Euro Notes, 4.75%, 06/12/2025(b) | | GBP | 100,000 | | | | 149,142 | |
Nationwide Building Society, REGS, Jr. Unsec. Sub. Bonds, 10.25%(b)(d) | | GBP | 68,000 | | | | 142,046 | |
Jr. Unsec. Sub. Medium-Term Euro Notes, 6.88%(b)(d) | | GBP | 100,000 | | | | 140,648 | |
New Look Secured Issuer PLC, REGS, Sr. Sec. Gtd. First Lien Euro Bonds, 6.50%, 07/01/2022(b) | | GBP | 100,000 | | | | 80,838 | |
Next PLC, REGS, Sr. Unsec. Euro Bonds, 3.63%, 05/18/2028(b) | | GBP | 100,000 | | | | 137,219 | |
Ocado Group PLC, Sr. Sec. Gtd. Notes, 4.00%, 06/15/2024(b) | | GBP | 100,000 | | | | 130,515 | |
See accompanying Notes to Consolidated Financial Statements which are an integral part of the financial statements.
16 Invesco Global Targeted Returns Fund
| | | | | | | | |
| | | Principal
Amount | | | Value | |
| United Kingdom–(continued) | |
Phoenix Group Holdings, REGS, Sr. Unsec. Euro Bonds, 5.75%, 07/07/2021(b) | | GBP | 100,000 | | | $ | 149,104 | |
RAC Bond Co. PLC, REGS, Sr. Sec. Gtd. First Lien Medium-Term Euro Notes, 4.87%, 05/06/2026(b) | | GBP | 100,000 | | | | 146,112 | |
RL Finance Bonds No. 3 PLC, REGS, Unsec. Gtd. Sub. Euro Bonds, 6.13%, 11/13/2028(b) | | GBP | 100,000 | | | | 155,354 | |
Rothesay Life PLC, REGS, Unsec. Sub. Euro Bonds, 8.00%, 10/30/2025(b) | | GBP | 100,000 | | | | 155,820 | |
Royal Bank of Scotland Group PLC (The), REGS, Jr. Unsec. Sub. Variable Rate Euro Notes, 2.00% (3 mo. EURIBOR + 2.33%)(b)(d)(e) | | EUR | 100,000 | | | | 113,545 | |
Royal Bank of Scotland PLC (The), Series 352, Jr. Unsec. Sub. Medium-Term Euro Notes, 6.20%(d) | | GBP | 13,000 | | | | 18,919 | |
Sky PLC, REGS, Sr. Unsec. Gtd. Medium-Term Euro Notes, 2.88%, 11/24/2020(b) | | GBP | 100,000 | | | | 139,094 | |
SSE PLC, REGS, Jr. Unsec. Sub. Euro Bonds, 3.88%(b)(d) | | GBP | 100,000 | | | | 138,055 | |
Tesco Property Finance 2 PLC, REGS, Sr. Sec. First Lien Mortgage-Backed Euro Bonds, 6.05%, 10/13/2039(b) | | GBP | 44,037 | | | | 70,717 | |
Thames Water Utilities Cayman Finance Ltd., REGS, Sr. Sec. Gtd. First Lien Medium-Term Euro Notes, 1.88%, 01/24/2024(b) | | GBP | 100,000 | | | | 130,607 | |
Travis Perkins PLC, REGS, Sr. Unsec. Gtd. Euro Bonds, 4.50%, 09/07/2023(b) | | GBP | 100,000 | | | | 139,733 | |
United Kingdom Gilt, REGS,
Unsec. Bonds,
1.50%, 07/22/2047(b) | | GBP | 2,667,080 | | | | 3,223,382 | |
3.50%, 01/22/2045(b) | | GBP | 2,454,934 | | | | 4,334,954 | |
United Kingdom Gilt Inflation-Linked, REGS, Unsec. Bonds, 0.13%, 03/22/2026(b) | | GBP | 60,000 | | | | 93,302 | |
Virgin Media Finance PLC, REGS, Sr. Unsec. Gtd. Euro Notes, 7.00%, 04/15/2023(b) | | GBP | 100,000 | | | | 141,300 | |
Virgin Media Secured Finance PLC, REGS, Sr. Sec. Gtd. First Lien Euro Notes, 6.25%, 03/28/2029(b) | | GBP | 100,000 | | | | 145,299 | |
Vodafone Group PLC, REGS, Sr. Unsec. Medium-Term Euro Notes, 3.38%, 08/08/2049(b) | | GBP | 100,000 | | | | 122,490 | |
Whitbread Group PLC, REGS, Sr. Unsec. Gtd. Euro Bonds, 3.38%, 10/16/2025(b) | | GBP | 100,000 | | | | 139,546 | |
William Hill PLC, REGS, Sr. Unsec. Gtd. Euro Bonds, 4.88%, 09/07/2023(b) | | GBP | 100,000 | | | | 139,017 | |
Yorkshire Building Society (The), REGS, Sr. Unsec. Medium-Term Euro Notes, 3.50%, 04/21/2026(b) | | GBP | 100,000 | | | | 143,262 | |
| | | | | | | | 12,863,097 | |
| | | | | | | | |
| | | Principal
Amount | | | Value | |
| United States–0.55% | | | | | | | | |
Adient Global Holdings Ltd., Sr. Unsec. Gtd. Notes, 3.50%, 08/15/2024(b) | | EUR | 100,000 | | | $ | 123,348 | |
Belden Inc., Sr. Unsec. Sub. Gtd. Notes, 4.13%, 10/15/2026(b) | | EUR | 100,000 | | | | 125,897 | |
International Business Machines Corp., Sr. Unsec. Euro Notes, 2.63%, 08/05/2022 | | GBP | 100,000 | | | | 140,882 | |
Johnson & Johnson, Sr. Unsec. Global Notes, 5.50%, 11/06/2024 | | GBP | 50,000 | | | | 84,165 | |
Netflix, Inc., Sr. Unsec. Notes, 3.63%, 05/15/2027(b) | | EUR | 100,000 | | | | 119,827 | |
Spectrum Brands, Inc., Sr. Unsec. Gtd. Bonds, 4.00%, 10/01/2026(b) | | EUR | 100,000 | | | | 123,912 | |
Valeant Pharmaceuticals International, Inc., REGS, Sr. Unsec. Gtd. Euro Notes, 4.50%, 05/15/2023(b) | | EUR | 100,000 | | | | 99,287 | |
| | | | | | | | 817,318 | |
Total Non-U.S. Dollar Denominated Bonds & Notes
(Cost $24,374,720) | | | | 25,171,941 | |
|
U.S. Dollar Denominated Bonds & Notes–10.28% | |
| Belgium–0.07% | |
Anheuser-Busch InBev Finance, Inc., Sr. Unsec. Gtd. Global Notes, 3.70%, 02/01/2024 | | $ | 100,000 | | | | 104,839 | |
|
| Brazil–0.20% | |
CBC Ammo LLC/CBC FinCo Inc., Sr. Unsec. Notes, 7.25%, 11/15/2021(b) | | | 14,000 | | | | 14,245 | |
JBS USA Lux S.A./JBS USA Finance, Inc., REGS, Sr. Unsec. Gtd. Euro Notes, 5.75%, 06/15/2025(b) | | | 45,000 | | | | 43,875 | |
MARB BondCo PLC, Sr. Unsec. Gtd. Notes, 7.00%, 03/15/2024(b) | | | 200,000 | | | | 202,000 | |
Petrobras Global Finance B.V., Sr. Unsec. Gtd. Global Notes, 8.75%, 05/23/2026 | | | 25,000 | | | | 30,344 | |
| | | | | | | | 290,464 | |
|
| Canada–0.27% | |
1011778 BC ULC/ New Red Finance, Inc., Sec. Gtd. Second Lien Notes, 5.00%, 10/15/2025(b) | | | 59,000 | | | | 60,180 | |
5.00%, 10/15/2025(b) | | | 24,000 | | | | 24,480 | |
Air Canada, Sr. Unsec. Gtd. Notes, 7.75%, 04/15/2021(b) | | | 25,000 | | | | 28,688 | |
Bombardier Inc., Sr. Unsec. Notes, 6.00%, 10/15/2022(b) | | | 65,000 | | | | 64,350 | |
Cott Holdings Inc., Sr. Unsec. Gtd. Notes, 5.50%, 04/01/2025(b) | | | 50,000 | | | | 51,687 | |
HudBay Minerals, Inc., Sr. Unsec. Gtd. Notes, 7.63%, 01/15/2025(b) | | | 31,000 | | | | 34,333 | |
See accompanying Notes to Consolidated Financial Statements which are an integral part of the financial statements.
17 Invesco Global Targeted Returns Fund
| | | | | | | | |
| | | Principal
Amount | | | Value | |
| Canada–(continued) | |
Precision Drilling Corp.,
Sr. Unsec. Gtd. Global Notes, 5.25%, 11/15/2024 | | $ | 65,000 | | | $ | 61,100 | |
6.50%, 12/15/2021 | | | 15,000 | | | | 15,225 | |
Teck Resources Ltd.,
Sr. Unsec. Gtd. Global Notes, 4.75%, 01/15/2022 | | | 25,000 | | | | 26,500 | |
Sr. Unsec. Notes, 6.13%, 10/01/2035 | | | 33,000 | | | | 37,537 | |
| | | | | | | | 404,080 | |
|
| France–0.36% | |
AXA S.A., Series A, Jr. Unsec. Sub. Notes, 6.46%(b)(d) | | | 100,000 | | | | 102,938 | |
BNP Paribas S.A., REGS, Jr. Unsec. Sub. Euro Notes, 7.38%(b)(d) | | | 200,000 | | | | 231,250 | |
Societe Generale S.A., Unsec. Sub. Notes, 4.25%, 04/14/2025(b) | | | 200,000 | | | | 205,690 | |
| | | | | | | | 539,878 | |
|
| Germany–0.13% | |
Allianz S.E., REGS, Series DIP, Jr. Unsec. Sub. Medium-Term Euro Notes, 3.88%(b)(d) | | | 200,000 | | | | 187,722 | |
|
| Italy–0.32% | |
Intesa Sanpaolo S.p.A., Jr. Unsec. Gtd. Sub. Notes, 7.70%(b)(d) | | | 200,000 | | | | 219,500 | |
Telecom Italia Capital S.A., Sr. Unsec. Gtd. Global Notes, 6.38%, 11/15/2033 | | | 16,000 | | | | 18,640 | |
7.20%, 07/18/2036 | | | 16,000 | | | | 19,904 | |
Telecom Italia S.p.A., Sr. Unsec. Notes, 5.30%, 05/30/2024(b) | | | 200,000 | | | | 216,250 | |
| | | | | | | | 474,294 | |
|
| Luxembourg–0.24% | |
Altice Financing S.A., Sr. Sec. Gtd. First Lien Bonds, 7.50%, 05/15/2026(b) | | | 200,000 | | | | 220,250 | |
ArcelorMittal, Sr. Unsec. Global Notes, 7.50%, 10/15/2039 | | | 16,000 | | | | 20,060 | |
Intelsat Jackson Holdings S.A., Sr. Unsec. Gtd. Global Bonds, 5.50%, 08/01/2023 | | | 22,000 | | | | 18,838 | |
Sr. Unsec. Gtd. Global Notes, 7.25%, 10/15/2020 | | | 76,000 | | | | 73,507 | |
7.50%, 04/01/2021 | | | 29,000 | | | | 27,622 | |
| | | | | | | | 360,277 | |
|
| Mexico–0.10% | |
Fomento Economico Mexicano S.A.B. de C.V., Sr. Unsec. Global Notes, 2.88%, 05/10/2023 | | | 150,000 | | | | 149,125 | |
|
| New Zealand–0.06% | |
Reynolds Group Issuer Inc./LLC, Sr. Unsec. Gtd. Notes, 7.00%, 07/15/2024(b) | | | 80,000 | | | | 85,550 | |
| | | | | | | | |
| | | Principal
Amount | | | Value | |
| Spain–0.24% | |
Codere Finance 2 (Luxembourg) S.A., Sr. Sec. Gtd. First Lien Notes, 7.63%, 11/01/2021(b) | | $ | 200,000 | | | $ | 202,890 | |
Telefónica Emisiones, S.A.U., Sr. Unsec. Gtd. Global Notes, 4.10%, 03/08/2027 | | | 150,000 | | | | 154,825 | |
| | | | | | | | 357,715 | |
|
| Switzerland–0.15% | |
Cloverie PLC for Zurich Insurance Co. Ltd., REGS, Unsec. Sub. Medium-Term Euro Notes, 5.63%, 06/24/2046(b) | | | 200,000 | | | | 222,529 | |
|
| United Kingdom–0.58% | |
Barclays Bank PLC, Unsec. Sub. Global Notes, 7.75%, 04/10/2023 | | | 200,000 | | | | 204,750 | |
HSBC Holdings PLC, Jr. Unsec. Sub. Global Bonds, 6.00%(d) | | | 200,000 | | | | 213,000 | |
Noble Holding International Ltd., Sr. Unsec. Gtd. Global Notes, 7.75%, 01/15/2024 | | | 28,000 | | | | 25,200 | |
Royal Bank of Scotland Group PLC (The),
Jr. Unsec. Sub. Bonds, 7.50%(d) | | | 200,000 | | | | 214,800 | |
Unsec. Sub. Global Bonds, 5.13%, 05/28/2024 | | | 100,000 | | | | 107,146 | |
Series U, Jr. Unsec. Sub. Variable Rate Global Notes, 3.66% (3 mo. USD LIBOR + 2.32%)(d)(e) | | | 100,000 | | | | 97,510 | |
| | | | | | | | 862,406 | |
|
| United States–7.52% | |
AES Corp. (The),
Sr. Unsec. Global Notes, 8.00%, 06/01/2020 | | | 3,000 | | | | 3,435 | |
Sr. Unsec. Notes, 5.50%, 04/15/2025 | | | 85,000 | | | | 90,312 | |
Aircastle Ltd.,
Sr. Unsec. Global Notes, 7.63%, 04/15/2020 | | | 10,000 | | | �� | 11,113 | |
Sr. Unsec. Notes, 5.00%, 04/01/2023 | | | 78,000 | | | | 82,680 | |
Albertsons Cos. LLC/ Safeway Inc./New Albertson’s, Inc./Albertson’s LLC, Sr. Unsec. Gtd. Global Notes, 6.63%, 06/15/2024 | | | 47,000 | | | | 44,415 | |
Ally Financial Inc.,
Sr. Unsec. Global Notes, 4.63%, 05/19/2022 | | | 125,000 | | | | 132,500 | |
Sr. Unsec. Gtd. Global Notes, 8.00%, 03/15/2020 | | | 30,000 | | | | 33,788 | |
AMC Entertainment Holdings, Inc., Sr. Unsec. Gtd. Sub. Global Notes, 5.75%, 06/15/2025 | | | 70,000 | | | | 68,425 | |
5.88%, 11/15/2026 | | | 30,000 | | | | 29,363 | |
AMC Networks Inc., Sr. Unsec. Gtd. Global Notes, 5.00%, 04/01/2024 | | | 60,000 | | | | 61,237 | |
See accompanying Notes to Consolidated Financial Statements which are an integral part of the financial statements.
18 Invesco Global Targeted Returns Fund
| | | | | | | | |
| | | Principal
Amount | | | Value | |
| United States–(continued) | |
AmeriGas Partners, L.P./AmeriGas Finance Corp., Sr. Unsec. Global Notes, 5.88%, 08/20/2026 | | $ | 75,000 | | | $ | 78,375 | |
Andeavor Logistics L.P./Tesoro Logistics Finance Corp., Sr. Unsec. Gtd. Global Notes, 6.38%, 05/01/2024 | | | 60,000 | | | | 66,000 | |
Antero Midstream Partners LP/Antero Midstream Finance Corp., Sr. Unsec. Gtd. Global Notes, 5.38%, 09/15/2024 | | | 65,000 | | | | 68,087 | |
Antero Resources Corp., Sr. Unsec. Gtd. Global Notes, 5.63%, 06/01/2023 | | | 48,000 | | | | 50,520 | |
Apple Inc., Sr. Unsec. Global Notes, 3.45%, 02/09/2045 | | | 50,000 | | | | 47,641 | |
Aramark Services, Inc., Sr. Unsec. Gtd. Notes, 5.00%, 04/01/2025(b) | | | 30,000 | | | | 32,138 | |
Archrock Partners, L.P./Archrock Partners Finance Corp., Sr. Unsec. Gtd. Global Notes, 6.00%, 10/01/2022 | | | 15,000 | | | | 14,981 | |
Ashland LLC, Sr. Unsec. Gtd. Global Notes, 4.75%, 08/15/2022 | | | 60,000 | | | | 63,462 | |
Ashton Woods USA LLC/Ashton Woods Finance Co.,
Sr. Unsec. Notes, 6.75%, 08/01/2025(b) | | | 24,000 | | | | 23,880 | |
6.88%, 02/15/2021(b) | | | 36,000 | | | | 37,125 | |
AT&T Inc., Sr. Unsec. Global Notes, 4.50%, 05/15/2035 | | | 50,000 | | | | 48,855 | |
Avis Budget Car Rental LLC/Avis Budget Finance Inc., Sr. Unsec. Gtd. Notes, 5.25%, 03/15/2025(b) | | | 18,000 | | | | 17,663 | |
B&G Foods, Inc., Sr. Unsec. Gtd. Notes, 5.25%, 04/01/2025 | | | 16,000 | | | | 16,380 | |
Ball Corp.
Sr. Unsec. Gtd. Global Bonds, 4.00%, 11/15/2023 | | | 50,000 | | | | 51,562 | |
Sr. Unsec. Gtd. Global Notes, 5.25%, 07/01/2025 | | | 60,000 | | | | 66,150 | |
Bank of America Corp., Series M, Jr. Unsec. Sub. Bonds, 8.13%(d) | | | 100,000 | | | | 103,285 | |
Beazer Homes USA, Inc.,
Sr. Unsec. Gtd. Global Notes, 6.75%, 03/15/2025 | | | 40,000 | | | | 42,512 | |
8.75%, 03/15/2022 | | | 25,000 | | | | 27,843 | |
Sr. Unsec. Notes, 5.88%, 10/15/2027(b) | | | 6,000 | | | | 6,015 | |
BMC East, LLC, Sr. Sec. Gtd. First Lien Notes, 5.50%, 10/01/2024(b) | | | 45,000 | | | | 47,250 | |
Boyd Gaming Corp., Sr. Unsec. Gtd. Global Notes, 6.38%, 04/01/2026 | | | 80,000 | | | | 88,000 | |
Brink’s Co. (The), Sr. Unsec. Gtd. Notes, 4.63%, 10/15/2027(b) | | | 40,000 | | | | 39,900 | |
Builders FirstSource, Inc., Sr. Unsec. Gtd. Notes, 10.75%, 08/15/2023(b) | | | 47,000 | | | | 53,580 | |
| | | | | | | | |
| | | Principal
Amount | | | Value | |
| United States–(continued) | |
CalAtlantic Group, Inc., Sr. Unsec. Gtd. Notes, 5.25%, 06/01/2026 | | $ | 23,000 | | | $ | 24,581 | |
Callon Petroleum Co., Sr. Unsec. Gtd. Global Notes, 6.13%, 10/01/2024 | | | 60,000 | | | | 62,700 | |
Calpine Corp., Sr. Unsec. Global Notes, 5.38%, 01/15/2023 | | | 25,000 | | | | 24,406 | |
Carrols Restaurant Group, Inc., Sec. Gtd. Second Lien Notes,
8.00%, 05/01/2022(b) | | | 13,000 | | | | 13,796 | |
Catalent Pharma Solutions, Inc., Sr. Unsec. Gtd. Notes, 4.88%, 01/15/2026(b) | | | 7,000 | | | | 7,123 | |
CB Escrow Corp., Sr. Unsec. Notes, 8.00%, 10/15/2025(b) | | | 6,000 | | | | 6,225 | |
CCO Holdings LLC/CCO Holdings Capital Corp.,
Sr. Unsec. Global Notes, 5.75%, 09/01/2023 | | | 20,000 | | | | 20,775 | |
5.75%, 01/15/2024 | | | 25,000 | | | | 26,031 | |
Sr. Unsec. Notes, 5.13%, 05/01/2027(b) | | | 100,000 | | | | 101,125 | |
5.75%, 02/15/2026(b) | | | 95,000 | | | | 99,546 | |
CDW LLC/CDW Finance Corp., Sr. Unsec. Gtd. Notes, 5.00%, 09/01/2025 | | | 65,000 | | | | 68,331 | |
Cedar Fair L.P./Canada’s Wonderland Co./Magnum Management Corp., Sr. Unsec. Gtd. Global Notes, 5.38%, 06/01/2024 | | | 60,000 | | | | 63,450 | |
CenturyLink, Inc.,
Series S, Sr. Unsec. Notes, 6.45%, 06/15/2021 | | | 38,000 | | | | 40,284 | |
Series Y, Sr. Unsec. Global Notes, 7.50%, 04/01/2024 | | | 30,000 | | | | 31,950 | |
Chemours Co. (The), Sr. Unsec. Gtd. Global Notes, 7.00%, 05/15/2025 | | | 90,000 | | | | 100,800 | |
Cincinnati Bell Inc., Sr. Unsec. Gtd. Notes, 7.00%, 07/15/2024(b) | | | 40,000 | | | | 40,000 | |
CIT Group Inc., Sr. Unsec. Global Notes, 5.00%, 08/01/2023 | | | 76,000 | | | | 82,399 | |
Clear Channel Worldwide Holdings, Inc., Series B,
Sr. Unsec. Gtd. Global Notes, 6.50%, 11/15/2022 | | | 50,000 | | | | 52,000 | |
Sr. Unsec. Gtd. Sub. Global Notes, 7.63%, 03/15/2020 | | | 60,000 | | | | 60,150 | |
Clearwater Paper Corp., Sr. Unsec. Gtd. Global Notes, 4.50%, 02/01/2023 | | | 65,000 | | | | 65,162 | |
CommScope Technologies LLC, Sr. Unsec. Gtd. Notes, 6.00%, 06/15/2025(b) | | | 85,000 | | | | 90,100 | |
Community Health Systems, Inc., Sr. Sec. Gtd. First Lien Global Notes, 5.13%, 08/01/2021 | | | 40,000 | | | | 38,900 | |
Sr. Sec. Gtd. First Lien Notes, 6.25%, 03/31/2023 | | | 63,000 | | | | 60,716 | |
Sr. Unsec. Gtd. Global Notes, 8.00%, 11/15/2019 | | | 30,000 | | | | 28,688 | |
See accompanying Notes to Consolidated Financial Statements which are an integral part of the financial statements.
19 Invesco Global Targeted Returns Fund
| | | | | | | | |
| | | Principal
Amount | | | Value | |
| United States–(continued) | |
Continental Resources Inc., Sr. Unsec. Gtd. Global Notes, 3.80%, 06/01/2024 | | $ | 70,000 | | | $ | 68,337 | |
Core & Main LP, Sr. Unsec. Notes, 6.13%, 08/15/2025(b) | | | 40,000 | | | | 40,600 | |
Crown Americas LLC/Crown Americas Capital Corp. V, Sr. Unsec. Gtd. Global Notes, 4.25%, 09/30/2026 | | | 20,000 | | | | 20,150 | |
CyrusOne L.P./CyrusOne Finance Corp., Sr. Unsec. Gtd. Notes, 5.38%, 03/15/2027(b) | | | 50,000 | | | | 53,562 | |
Dana Inc., Sr. Unsec. Notes, 5.50%, 12/15/2024 | | | 60,000 | | | | 63,600 | |
DaVita Inc., Sr. Unsec. Gtd. Global Notes, 5.00%, 05/01/2025 | | | 31,000 | | | | 30,613 | |
Dell International LLC/ EMC Corp., Sr. Unsec. Gtd. Notes, 7.13%, 06/15/2024(b) | | | 85,000 | | | | 93,853 | |
Delphi Jersey Holdings PLC, Sr. Unsec. Notes, 5.00%, 10/01/2025(b) | | | 12,000 | | | | 12,120 | |
Diebold Nixdorf, Inc., Sr. Unsec. Gtd. Global Notes, 8.50%, 04/15/2024 | | | 35,000 | | | | 36,969 | |
Discover Financial Services, Inc., Series C, Jr. Unsec. Sub. Global Notes, 5.50%(d) | | | 21,000 | | | | 21,446 | |
DISH DBS Corp., Sr. Unsec. Gtd. Global Notes, 5.88%, 11/15/2024 | | | 120,000 | | | | 120,600 | |
Dynegy Inc., Sr. Unsec. Gtd. Global Notes, 7.38%, 11/01/2022 | | | 20,000 | | | | 21,475 | |
Eagle Holding Co. II, LLC, Sr. Unsec. PIK Notes, 8.38% PIK Rate, 7.63% Cash Rate, 05/15/2022(b)(f) | | | 33,000 | | | | 34,155 | |
Energy Transfer Equity, L.P., Sr. Sec. First Lien Notes, 5.88%, 01/15/2024 | | | 104,000 | | | | 113,360 | |
EnerSys, Sr. Unsec. Gtd. Notes, 5.00%, 04/30/2023(b) | | | 60,000 | | | | 63,150 | |
Ensco PLC, Sr. Unsec. Global Notes, 4.50%, 10/01/2024 | | | 60,000 | | | | 49,500 | |
EP Energy LLC/Everest Acquisition Finance Inc., Sr. Sec. Gtd. First Lien Notes, 8.00%, 11/29/2024(b) | | | 60,000 | | | | 61,500 | |
Equinix Inc., Sr. Unsec. Notes, 5.88%, 01/15/2026 | | | 85,000 | | | | 92,331 | |
Ferrellgas L.P./Ferrellgas Finance Corp., Sr. Unsec. Global Notes, 6.50%, 05/01/2021 | | | 25,000 | | | | 23,813 | |
First Data Corp., Sr. Unsec. Gtd. Notes, 7.00%, 12/01/2023(b) | | | 150,000 | | | | 160,878 | |
Freeport-McMoRan Inc., Sr. Unsec. Gtd. Global Notes, 5.40%, 11/14/2034 | | | 40,000 | | | | 39,200 | |
| | | | | | | | |
| | | Principal
Amount | | | Value | |
| United States–(continued) | |
Frontier Communications Corp., Sr. Unsec. Global Notes, 10.50%, 09/15/2022 | | $ | 60,000 | | | $ | 52,782 | |
11.00%, 09/15/2025 | | | 60,000 | | | | 51,075 | |
Genesis Energy L.P./Genesis Energy Finance Corp., Sr. Unsec. Gtd. Notes, 6.50%, 10/01/2025 | | | 16,000 | | | | 16,280 | |
Graphic Packaging International Inc.,
Sr. Unsec. Gtd. Notes, 4.13%, 08/15/2024 | | | 50,000 | | | | 52,000 | |
4.88%, 11/15/2022 | | | 60,000 | | | | 64,200 | |
Gulfport Energy Corp., Sr. Unsec. Gtd. Global Notes, 6.00%, 10/15/2024 | | | 65,000 | | | | 65,325 | |
H&E Equipment Services, Inc., Sr. Unsec. Gtd. Notes, 5.63%, 09/01/2025(b) | | | 51,000 | | | | 53,996 | |
HCA, Inc.,
Sr. Sec. Gtd. First Lien Notes, 5.25%, 04/15/2025 | | | 141,000 | | | | 150,517 | |
Sr. Unsec. Gtd. Notes, 5.88%, 02/15/2026 | | | 75,000 | | | | 79,031 | |
HealthSouth Corp., Sr. Unsec. Gtd. Global Notes, 5.75%, 09/15/2025 | | | 65,000 | | | | 67,356 | |
Herc Rentals Inc., Sec. Gtd. Second Lien Notes, 7.75%, 06/01/2024(b) | | | 41,000 | | | | 45,202 | |
Hertz Corp. (The),
Sec. Gtd. Second Lien Notes, 7.63%, 06/01/2022(b) | | | 112,000 | | | | 117,062 | |
Sr. Unsec. Gtd. Global Notes, 6.75%, 04/15/2019 | | | 30,000 | | | | 30,094 | |
7.38%, 01/15/2021 | | | 3,000 | | | | 3,023 | |
Hewlett Packard Enterprise Co., Sr. Unsec. Global Notes, 4.90%, 10/15/2025 | | | 50,000 | | | | 53,245 | |
Hill-Rom Holdings, Inc., Sr. Unsec. Gtd. Notes, 5.00%, 02/15/2025(b) | | | 39,000 | | | | 40,072 | |
Hillman Group Inc. (The), Sr. Unsec. Gtd. Notes, 6.38%, 07/15/2022(b) | | | 53,000 | | | | 52,867 | |
Holly Energy Partners L.P./Holly Energy Finance Corp., Sr. Unsec. Gtd. Notes, 6.00%, 08/01/2024(b) | | | 30,000 | | | | 31,575 | |
Hot Topic, Inc., Sr. Sec. Gtd. First Lien Notes, 9.25%, 06/15/2021(b) | | | 60,000 | | | | 50,025 | |
Hughes Satellite Systems Corp., Sr. Sec. Gtd. First Lien Global Notes, 5.25%, 08/01/2026 | | | 35,000 | | | | 35,922 | |
Sr. Unsec. Gtd. Global Notes, 7.63%, 06/15/2021 | | | 50,000 | | | | 56,306 | |
Ingles Markets, Inc., Sr. Unsec. Global Notes, 5.75%, 06/15/2023 | | | 64,000 | | | | 63,200 | |
See accompanying Notes to Consolidated Financial Statements which are an integral part of the financial statements.
20 Invesco Global Targeted Returns Fund
| | | | | | | | |
| | | Principal
Amount | | | Value | |
| United States–(continued) | |
Iron Mountain Inc., Sr. Unsec. Gtd. Notes, 6.00%, 08/15/2023 | | $ | 127,000 | | | $ | 134,302 | |
Iron Mountain US Holdings, Inc., Sr. Unsec. Gtd. Notes, 5.38%, 06/01/2026(b) | | | 35,000 | | | | 36,750 | |
J.C. Penney Corp., Inc.,
Sr. Unsec. Gtd. Deb., 7.40%, 04/01/2037 | | | 50,000 | | | | 30,750 | |
Sr. Unsec. Gtd. Notes, 6.38%, 10/15/2036 | | | 50,000 | | | | 29,625 | |
Jaguar Holding Co., II/Pharmaceutical Product Development, LLC, Sr. Unsec. Gtd. Notes, 6.38%, 08/01/2023(b) | | | 15,000 | | | | 15,694 | |
KB Home, Sr. Unsec. Gtd. Notes, 7.50%, 09/15/2022 | | | 23,000 | | | | 26,738 | |
Kenan Advantage Group Inc., (The), Sr. Unsec. Notes, 7.88%, 07/31/2023(b) | | | 60,000 | | | | 62,550 | |
KFC Holding Co./Pizza Hut Holdings LLC/Taco Bell of America LLC, Sr. Unsec. Gtd. Notes, 4.75%, 06/01/2027(b) | | | 16,000 | | | | 16,460 | |
Koppers Inc., Sr. Unsec. Gtd. Notes, 6.00%, 02/15/2025(b) | | | 35,000 | | | | 37,625 | |
Kraton Polymers LLC/Kraton Polymers Capital Corp., Sr. Unsec. Gtd. Notes, 10.50%, 04/15/2023(b) | | | 40,000 | | | | 45,600 | |
L Brands, Inc., Sr. Unsec. Gtd. Global Notes, 5.63%, 02/15/2022 | | | 70,000 | | | | 75,215 | |
6.88%, 11/01/2035 | | | 30,000 | | | | 29,925 | |
Lamar Media Corp., Sr. Unsec. Gtd. Global Notes, 5.75%, 02/01/2026 | | | 90,000 | | | | 97,425 | |
Lamb Weston Holdings, Inc., Sr. Unsec. Gtd. Notes, 4.63%, 11/01/2024(b) | | | 60,000 | | | | 63,000 | |
Lennar Corp., Sr. Unsec. Gtd. Global Notes, 4.75%, 11/15/2022 | | | 50,000 | | | | 53,000 | |
Level 3 Financing, Inc., Sr. Unsec. Gtd. Global Notes, 5.25%, 03/15/2026 | | | 100,000 | | | | 103,595 | |
Levi Strauss & Co., Sr. Unsec. Global Notes, 5.00%, 05/01/2025 | | | 50,000 | | | | 52,810 | |
LifePoint Health, Inc., Sr. Unsec. Gtd. Global Notes, 5.38%, 05/01/2024 | | | 60,000 | | | | 60,450 | |
Lithia Motors, Inc., Sr. Unsec. Gtd. Notes, 5.25%, 08/01/2025(b) | | | 17,000 | | | | 17,871 | |
LPL Holdings Inc., Sr. Unsec. Gtd. Notes, 5.75%, 09/15/2025(b) | | | 32,000 | | | | 33,360 | |
McDonald’s Corp., Sr. Unsec. Medium-Term Notes, 3.25%, 06/10/2024 | | | 75,000 | | | | 77,289 | |
MEDNAX, Inc., Sr. Unsec. Gtd. Notes, 5.25%, 12/01/2023(b) | | | 55,000 | | | | 57,337 | |
| | | | | | | | |
| | | Principal
Amount | | | Value | |
| United States–(continued) | |
Meritage Homes Corp., Sr. Unsec. Gtd. Global Notes, 6.00%, 06/01/2025 | | $ | 51,000 | | | $ | 55,080 | |
Meritor Inc., Sr. Unsec. Gtd. Notes, 6.25%, 02/15/2024 | | | 60,000 | | | | 64,425 | |
MGM Resorts International, Sr. Unsec. Gtd. Notes, 4.63%, 09/01/2026 | | | 110,000 | | | | 110,550 | |
Microsoft Corp., Sr. Unsec. Global Bonds, 2.40%, 08/08/2026 | | | 80,000 | | | | 77,365 | |
Molina Healthcare, Inc., Sr. Unsec. Gtd. Notes, 4.88%, 06/15/2025(b) | | | 24,000 | | | | 23,880 | |
MPH Acquisition Holdings LLC, Sr. Unsec. Gtd. Notes, 7.13%, 06/01/2024(b) | | | 60,000 | | | | 64,725 | |
MSCI Inc., Sr. Unsec. Gtd. Notes, 5.75%, 08/15/2025(b) | | | 50,000 | | | | 54,250 | |
Mueller Industries, Inc., Unsec. Sub. Deb., 6.00%, 03/01/2027 | | | 25,000 | | | | 25,813 | |
Murphy Oil USA, Inc., Sr. Unsec. Gtd. Global Notes, 5.63%, 05/01/2027 | | | 42,000 | | | | 44,677 | |
Navient Corp., Sr. Unsec. Medium-Term Notes, 7.25%, 01/25/2022 | | | 25,000 | | | | 27,219 | |
8.00%, 03/25/2020 | | | 45,000 | | | | 49,725 | |
Netflix, Inc., Sr. Unsec. Global Notes, 5.75%, 03/01/2024 | | | 45,000 | | | | 48,319 | |
Newfield Exploration Co., Sr. Unsec. Global Notes, 5.63%, 07/01/2024 | | | 48,000 | | | | 52,140 | |
NGL Energy Partners L.P./NGL Energy Finance Corp., Sr. Unsec. Gtd. Global Notes, 6.13%, 03/01/2025 | | | 10,000 | | | | 9,525 | |
NGPL PipeCo. LLC, Sr. Unsec. Bonds, 4.88%, 08/15/2027(b) | | | 7,000 | | | | 7,263 | |
Novelis Corp., Sr. Unsec. Gtd. Notes, 6.25%, 08/15/2024(b) | | | 50,000 | | | | 52,875 | |
NRG Energy, Inc., Sr. Unsec. Gtd. Global Notes, 6.63%, 03/15/2023 | | | 23,000 | | | | 23,863 | |
6.63%, 01/15/2027 | | | 32,000 | | | | 34,240 | |
Oasis Petroleum Inc., Sr. Unsec. Gtd. Global Notes, 6.88%, 01/15/2023 | | | 60,000 | | | | 61,650 | |
Oshkosh Corp., Sr. Unsec. Gtd. Global Notes, 5.38%, 03/01/2025 | | | 30,000 | | | | 31,950 | |
Parsley Energy LLC/Parsley Finance Corp., Sr. Unsec. Gtd. Notes, 6.25%, 06/01/2024(b) | | | 65,000 | | | | 69,225 | |
Penske Automotive Group Inc., Sr. Unsec. Sub. Gtd. Notes, 5.50%, 05/15/2026 | | | 27,000 | | | | 27,844 | |
Pinnacle Entertainment, Inc., Sr. Unsec. Global Notes, 5.63%, 05/01/2024 | | | 60,000 | | | | 62,250 | |
See accompanying Notes to Consolidated Financial Statements which are an integral part of the financial statements.
21 Invesco Global Targeted Returns Fund
| | | | | | | | |
| | | Principal
Amount | | | Value | |
| United States–(continued) | |
Plastipak Holdings Inc., Sr. Unsec. Notes, 6.25%, 10/15/2025(b) | | $ | 34,000 | | | $ | 34,808 | |
PolyOne Corp., Sr. Unsec. Global Notes, 5.25%, 03/15/2023 | | | 65,000 | | | | 70,200 | |
Priceline Group Inc. (The), Sr. Unsec. Global Notes, 3.60%, 06/01/2026 | | | 100,000 | | | | 102,387 | |
Prime Security Services Borrower, LLC/Prime Finance, Inc., Sec. Gtd. Second Lien Notes,
9.25%, 05/15/2023(b) | | | 80,000 | | | | 88,856 | |
QEP Resources, Inc., Sr. Unsec. Notes, 6.88%, 03/01/2021 | | | 60,000 | | | | 64,050 | |
Range Resources Corp.,
Sr. Unsec. Gtd. Global Notes, 4.88%, 05/15/2025 | | | 34,000 | | | | 32,980 | |
5.88%, 07/01/2022 | | | 29,000 | | | | 29,870 | |
RSP Permian, Inc., Sr. Unsec. Gtd. Notes, 5.25%, 01/15/2025(b) | | | 65,000 | | | | 66,462 | |
SBA Communications Corp., Sr. Unsec. Global Notes, 4.88%, 09/01/2024 | | | 65,000 | | | | 66,950 | |
Scientific Games International Inc., Sr. Unsec. Gtd. Global Notes, 10.00%, 12/01/2022 | | | 50,000 | | | | 55,437 | |
SemGroup Corp./ Rose Rock Finance Corp., Sr. Unsec. Gtd. Global Notes, 5.63%, 11/15/2023 | | | 30,000 | | | | 29,475 | |
Sensata Technologies B.V., Sr. Unsec. Gtd. Notes, 5.00%, 10/01/2025(b) | | | 65,000 | | | | 69,550 | |
ServiceMaster Co., LLC (The), Sr. Unsec. Gtd. Notes, 5.13%, 11/15/2024(b) | | | 90,000 | | | | 92,925 | |
SESI, L.L.C., Sr. Unsec. Gtd. Global Notes, 7.13%, 12/15/2021 | | | 61,000 | | | | 62,677 | |
Sirius XM Radio Inc., Sr. Unsec. Gtd. Notes,
5.38%, 07/15/2026(b) | | | 55,000 | | | | 58,094 | |
6.00%, 07/15/2024(b) | | | 34,000 | | | | 36,380 | |
Six Flags Entertainment Corp., Sr. Unsec. Gtd. Notes, 4.88%, 07/31/2024(b) | | | 35,000 | | | | 36,094 | |
SM Energy Co., Sr. Unsec. Global Notes, 6.13%, 11/15/2022 | | | 36,000 | | | | 36,360 | |
Southwestern Energy Co., Sr. Unsec. Global Notes, 4.10%, 03/15/2022 | | | 80,000 | | | | 79,000 | |
Spectrum Brands, Inc., Sr. Unsec. Gtd. Global Notes, 5.75%, 07/15/2025 | | | 60,000 | | | | 64,031 | |
Sprint Communications Inc., Sr. Unsec. Global Notes, 11.50%, 11/15/2021 | | | 40,000 | | | | 50,300 | |
Sprint Corp., Sr. Unsec. Gtd. Global Notes, 7.25%, 09/15/2021 | | | 35,000 | | | | 38,238 | |
7.88%, 09/15/2023 | | | 150,000 | | | | 168,000 | |
| | | | | | | | |
| | | Principal
Amount | | | Value | |
| United States–(continued) | |
Standard Industries Inc., Sr. Unsec. Notes, 6.00%, 10/15/2025(b) | | $ | 30,000 | | | $ | 32,588 | |
Steel Dynamics, Inc., Sr. Unsec. Gtd. Global Notes, 5.00%, 12/15/2026 | | | 35,000 | | | | 37,100 | |
Suburban Propane Partners, L.P./Suburban Energy Finance Corp., Sr. Unsec. Global Notes, 5.50%, 06/01/2024 | | | 79,000 | | | | 79,000 | |
SunCoke Energy Partners, L.P./SunCoke Energy Partners Finance Corp., Sr. Unsec. Gtd. Notes, 7.50%, 06/15/2025(b) | | | 30,000 | | | | 31,650 | |
Surgery Center Holdings, Inc., Sr. Unsec. Gtd. Notes, 6.75%, 07/01/2025(b) | | | 6,000 | | | | 5,490 | |
8.88%, 04/15/2021(b) | | | 7,000 | | | | 7,175 | |
T-Mobile USA, Inc.,
Sr. Unsec. Gtd. Global Bonds, 6.50%, 01/15/2026 | | | 150,000 | | | | 166,330 | |
Sr. Unsec. Gtd. Notes, 6.00%, 04/15/2024 | | | 50,000 | | | | 53,625 | |
Targa Resources Partners L.P./Targa Resources Partners Finance Corp., Sr. Unsec. Gtd. Global Bonds, 5.13%, 02/01/2025 | | | 74,000 | | | | 76,497 | |
Taylor Morrison Communities Inc./ Taylor Morrison Holdings II, Inc., Sr. Unsec. Gtd. Notes, 5.88%, 04/15/2023(b) | | | 30,000 | | | | 32,269 | |
Teleflex Inc.,
Sr. Unsec. Gtd. Global Notes, 4.88%, 06/01/2026 | | | 8,000 | | | | 8,440 | |
5.25%, 06/15/2024 | | | 3,000 | | | | 3,188 | |
Tenet Healthcare Corp.,
Sr. Unsec. Global Notes, 6.75%, 06/15/2023 | | | 100,000 | | | | 94,250 | |
8.13%, 04/01/2022 | | | 30,000 | | | | 30,150 | |
Terex Corp., Sr. Unsec. Gtd. Notes, 5.63%, 02/01/2025(b) | | | 65,000 | | | | 69,306 | |
Time Warner Cable LLC, Sr. Sec. Gtd. First Lien Global Bonds, 5.88%, 11/15/2040 | | | 50,000 | | | | 54,371 | |
Titan International Inc., Sr. Sec. Gtd. First Lien Global Notes, 6.88%, 10/01/2020 | | | 80,000 | | | | 82,550 | |
TransDigm Inc., Sr. Unsec. Gtd. Sub. Global Notes, 6.50%, 05/15/2025 | | | 87,000 | | | | 89,936 | |
Transocean Inc., Sr. Unsec. Gtd. Global Notes, 7.50%, 04/15/2031 | | | 40,000 | | | | 35,900 | |
TreeHouse Foods, Inc., Sr. Unsec. Gtd. Notes, 6.00%, 02/15/2024(b) | | | 60,000 | | | | 64,500 | |
Tribune Media Co., Sr. Unsec. Gtd. Global Notes, 5.88%, 07/15/2022 | | | 60,000 | | | | 62,550 | |
See accompanying Notes to Consolidated Financial Statements which are an integral part of the financial statements.
22 Invesco Global Targeted Returns Fund
| | | | | | | | |
| | | Principal
Amount | | | Value | |
| United States–(continued) | |
TriMas Corp., Sr. Unsec. Gtd. Notes, 4.88%, 10/15/2025(b) | | $ | 14,000 | | | $ | 14,184 | |
Trinseo Materials Operating S.C.A./Trinseo Materials Finance, Inc., Sr. Unsec. Gtd. Notes, 5.38%, 09/01/2025(b) | | | 18,000 | | | | 18,990 | |
United Rentals North America, Inc., Sr. Unsec. Gtd. Global Notes, 5.50%, 07/15/2025 | | | 75,000 | | | | 80,437 | |
Sr. Unsec. Gtd. Notes, 5.88%, 09/15/2026 | | | 12,000 | | | | 13,133 | |
United States Steel Corp., Sr. Unsec. Global Notes, 6.88%, 08/15/2025 | | | 58,000 | | | | 59,124 | |
US Foods, Inc., Sr. Unsec. Gtd. Notes, 5.88%, 06/15/2024(b) | | | 60,000 | | | | 63,675 | |
Valeant Pharmaceuticals International, Inc.,
Sr. Sec. Gtd. First Lien Notes, 5.50%, 11/01/2025(b) | | | 8,000 | | | | 8,190 | |
Sr. Unsec. Gtd. Notes, 5.63%, 12/01/2021(b) | | | 60,000 | | | | 54,975 | |
6.13%, 04/15/2025(b) | | | 65,000 | | | | 54,844 | |
Valvoline Inc., Sr. Unsec. Gtd. Notes, 5.50%, 07/15/2024(b) | | | 60,000 | | | | 63,750 | |
Venator Finance S.a.r.l./Venator Materials Corp., Sr. Unsec. Gtd. Notes, 5.75%, 07/15/2025(b) | | | 14,000 | | | | 14,840 | |
Verizon Communications Inc., Sr. Unsec. Global Notes, 4.40%, 11/01/2034 | | | 50,000 | | | | 50,449 | |
VFH Parent LLC/Orchestra Co-Issuer Inc., Sec. Gtd. Second Lien Notes, 6.75%, 06/15/2022(b) | | | 12,000 | | | | 12,510 | |
Wal-Mart Stores, Inc., Sr. Unsec. Notes, 2.65%, 12/15/2024 | | | 100,000 | | | | 99,917 | |
Walt Disney Co. (The), Sr. Unsec. Global Notes, 3.00%, 02/13/2026 | | | 50,000 | | | | 50,550 | |
Weatherford International Ltd., Sr. Unsec. Gtd. Notes, 6.50%, 08/01/2036 | | | 45,000 | | | | 37,688 | |
WellCare Health Plans Inc., Sr. Unsec. Notes, 5.25%, 04/01/2025 | | | 60,000 | | | | 63,300 | |
Western Digital Corp., Sr. Unsec. Gtd. Global Notes, 10.50%, 04/01/2024 | | | 55,000 | | | | 64,680 | |
Whiting Petroleum Corp., Sr. Unsec. Gtd. Global Notes, 6.25%, 04/01/2023 | | | 75,000 | | | | 75,187 | |
Williams Cos., Inc. (The),
Sr. Unsec. Global Notes, 4.55%, 06/24/2024 | | | 40,000 | | | | 42,000 | |
Sr. Unsec. Notes, 7.88%, 09/01/2021 | | | 22,000 | | | | 25,960 | |
WPX Energy Inc., Sr. Unsec. Notes, 5.25%, 09/15/2024 | | | 65,000 | | | | 65,569 | |
| | | | | | | | |
| | | Principal
Amount | | | Value | |
| United States–(continued) | |
Wrangler Buyer Corp., Sr. Unsec. Notes, 6.00%, 10/01/2025(b) | | $ | 4,000 | | | $ | 4,110 | |
Wynn Las Vegas LLC/Wynn Las Vegas Capital Corp., Sr. Unsec. Gtd. Notes, 5.25%, 05/15/2027(b) | | | 17,000 | | | | 17,383 | |
| | | | | | | | 11,151,735 | |
| | |
| Zambia–0.04% | | | | | | | | |
First Quantum Minerals Ltd., Sr. Unsec. Gtd. Notes,
7.00%, 02/15/2021(b) | | | 60,000 | | | | 62,475 | |
Total U.S. Dollar Denominated Bonds & Notes
(Cost $14,920,760) | | | | 15,253,089 | |
|
U.S. Treasury Securities–0.77% | |
| U.S. Treasury Notes–0.71% | | | | | |
1.25%, 12/31/2018 | | | 957,900 | | | | 955,169 | |
1.63%, 05/15/2026 | | | 100,000 | | | | 94,529 | |
| | | | | | | | 1,049,698 | |
|
| U.S. Treasury Inflation–Indexed Notes–0.06% | |
0.13%, 04/15/2021 | | | 97,159 | (g) | | | 97,344 | |
Total U.S. Treasury Securities
(Cost $1,148,772) | | | | 1,147,042 | |
| | |
| | | Shares | | | | |
Preferred Stocks–0.01% | |
| United States–0.01% | |
CIT Group Inc., Series A, 5.80% Pfd.
(Cost $10,000) | | | 10,000 | | | | 10,384 | |
|
Money Market Funds–19.27% | |
Invesco Government & Agency Portfolio–Institutional Class, 0.95%(h) | | | 15,019,647 | | | | 15,019,647 | |
Invesco Treasury Portfolio– Institutional Class, 0.94%(h) | | | 10,013,098 | | | | 10,013,098 | |
STIC (Global Series) PLC–U.S. Dollar Liquidity Portfolio (Ireland)–Institutional Class, 1.25%(h) | | | 3,552,118 | | | | 3,552,118 | |
Total Money Market Funds
(Cost $28,584,863) | | | | 28,584,863 | |
|
Options Purchased–5.63% | |
(Cost $15,721,188) | | | | | | | 8,355,949 | |
TOTAL INVESTMENTS IN SECURITIES–93.53%
(Cost $138,700,838) | | | | 138,748,209 | |
OTHER ASSETS LESS LIABILITIES–6.47% | | | | 9,604,646 | |
NET ASSETS–100.00% | | | | | | $ | 148,352,855 | |
See accompanying Notes to Consolidated Financial Statements which are an integral part of the financial statements.
23 Invesco Global Targeted Returns Fund
Investment Abbreviations:
| | |
| ADR | | – American Depositary Receipt |
| BRL | | – Brazilian Real |
| CAD | | – Canadian Dollar |
| Deb. | | – Debentures |
| DIP | | – Debtor-in-Possession |
| EUR | | – Euro |
| EURIBOR | | – Euro Interbank Offered Rate |
| GBP | | – British Pound Sterling |
| Gtd. | | – Guaranteed |
| HUF | | – Hungarian Forint |
| Jr. | | – Junior |
| LIBOR | | – London Interbank Offered Rate |
| MXN | | – Mexican Peso |
| NVDR | | – Non-Voting Depositary Receipt |
| Pfd. | | – Preferred |
| PIK | | – Pay-in-Kind |
| PLN | | – Polish Zloty |
| REGS | | – Regulation S |
| REIT | | – Real Estate Investment Trust |
| Sec. | | – Secured |
| Sr. | | – Senior |
| Sub. | | – Subordinated |
| Unsec. | | – Unsecured |
| USD | | – U.S. Dollar |
Notes to Consolidated Schedule of Investments:
| (a) | Non-income producing security. |
| (b) | Security purchased or received in a transaction exempt from registration under the Securities Act of 1933, as amended (the “1933 Act”). The security may be resold pursuant to an exemption from registration under the 1933 Act, typically to qualified institutional buyers. The aggregate value of these securities at October 31, 2017 was $22,665,674, which represented 15.28% of the Fund’s Net Assets. |
| (c) | Foreign denominated security. Principal amount is denominated in the currency indicated. |
| (d) | Perpetual bond with no specified maturity date. |
| (e) | Interest or dividend rate is redetermined periodically. Rate shown is the rate in effect on October 31, 2017. |
| (f) | All or a portion of this security is Pay-in-Kind. Pay-in-Kind securities pay interest income in the form of securities. |
| (g) | Principal amount of security and interest payments are adjusted for inflation. See Note 1I. |
| (h) | The money market fund and the Fund are affiliated by having the same investment adviser. The rate shown is the 7-day SEC standardized yield as of October 31, 2017. |
Investments in Affiliated Issuers–0.00%(i)(j)
| | | | | | | | | | | | | | | | | | | | | | | | | | | | | | | | | | | | |
| | | % of
Net
Assets
10/31/17 | | | Value 10/31/16 | | | Purchases
at Cost | | | Proceeds
from Sales | | | Change in
Unrealized
Appreciation (Depreciation) | | | Realized
Gain (Loss) | | | Dividend
Income | | | Shares
10/31/17 | | | Value
10/31/17 | |
Domestic Equity Funds–0.00% | |
Invesco Diversified Dividend Fund-Class R6 | | | 0.00 | % | | $ | 13,366,203 | | | $ | 476,778 | | | $ | (14,403,531 | ) | | $ | (588,272 | ) | | $ | 1,484,858 | | | $ | 140,742 | | | | — | | | $ | — | |
|
Fixed-Income Funds–0.00% | |
Invesco High Yield Fund-Class R6 | | | 0.00 | % | | | 26,657,031 | | | | 440,042 | | | | (27,218,858 | ) | | | 420,945 | | | | (299,160 | ) | | | 531,905 | | | | — | | | | — | |
|
Foreign Equity Funds–0.00% | |
Invesco Asia Pacific Growth Fund-Class Y | | | 0.00 | % | | | 17,011,618 | | | | 372,011 | | | | (17,573,784 | ) | | | (811,960 | ) | | | 1,175,184 | | | | 198,943 | | | | — | | | | — | |
Invesco European Growth Fund-Class Y | | | 0.00 | % | | | 21,099,716 | | | | 1,265,954 | | | | (23,699,220 | ) | | | 1,739,215 | | | | (405,665 | ) | | | 388,692 | | | | — | | | | — | |
Invesco International Growth Fund-Class R6 | | | 0.00 | % | | | 21,348,075 | | | | 998,806 | | | | (23,374,700 | ) | | | 790,723 | | | | 237,096 | | | | 340,861 | | | | — | | | | — | |
Total Foreign Equity Funds | | | | | | | 59,459,409 | | | | 2,636,771 | | | | (64,647,704 | ) | | | 1,717,978 | | | | 1,006,615 | | | | 928,496 | | | | — | | | | — | |
TOTAL INVESTMENTS IN AFFILIATED ISSUERS (Cost $—) | | | 0.00 | % | | $ | 99,482,643 | | | $ | 3,553,591 | | | $ | (106,270,093 | ) | | $ | 1,550,651 | | | $ | 2,192,313 | (k) | | $ | 1,601,143 | | | | — | | | $ | — | |
Notes to Consolidated Schedule of Investments:
| (i) | The Fund has transitioned its investments in certain affiliated underlying funds to direct investments in the underlying securities of those funds or other investment securities that align with the Fund’s investment objective. The investment objective of the Fund did not change. |
| (j) | Each underlying fund and the Fund are affiliated by either having the same investment adviser or an investment adviser under common control with the Fund’s investment adviser. |
| (k) | Includes $336,036 and $173,069 of capital gains distributions from Invesco Diversified Dividend Fund and Invesco Asia Pacific Growth Fund, respectively. |
See accompanying Notes to Consolidated Financial Statements which are an integral part of the financial statements.
24 Invesco Global Targeted Returns Fund
| | | | | | | | | | | | | | | | | | | | | | | | | | | | | | | | | | |
| Open Over-The-Counter Index Options Purchased | |
| Description | | Type of
Contract | | | Broker/Counterparty | | Expiration
Date | | | Number of
Contracts | | | Exercise
Price | | | Notional
Value(l) | | | Value | |
HSCEI Index | | | Call | | | J.P. Morgan Chase Bank, N.A. | | | 12/28/2018 | | | | 21 | | | | HKD | | | | 11,200 | | | | HKD | | | | 11,760,000 | | | $ | 137,765 | |
HSCEI Index | | | Call | | | Societe Generale S.A. | | | 12/28/2018 | | | | 73 | | | | HKD | | | | 11,200 | | | | HKD | | | | 40,880,000 | | | | 478,899 | |
HSCEI Index | | | Call | | | UBS | | | 12/28/2018 | | | | 56 | | | | HKD | | | | 11,200 | | | | HKD | | | | 31,360,000 | | | | 367,374 | |
RTY Index | | | Call | | | Goldman Sachs International | | | 12/15/2017 | | | | 1 | | | | USD | | | | 1,580 | | | | USD | | | | 158,000 | | | | 317 | |
SPX Index | | | Call | | | Citigroup Global Markets Inc. | | | 12/15/2017 | | | | 18 | | | | USD | | | | 2,645 | | | | USD | | | | 4,761,000 | | | | 6,549 | |
SPX Index | | | Call | | | Goldman Sachs International | | | 12/15/2017 | | | | 36 | | | | USD | | | | 2,660 | | | | USD | | | | 9,576,000 | | | | 8,423 | |
SPX Index | | | Call | | | Goldman Sachs International | | | 09/21/2018 | | | | 26 | | | | USD | | | | 2,625 | | | | USD | | | | 6,825,000 | | | | 235,035 | |
SPX Index | | | Call | | | J.P. Morgan Chase Bank, N.A. | | | 09/21/2018 | | | | 51 | | | | USD | | | | 2,625 | | | | USD | | | | 13,387,500 | | | | 461,031 | |
VIX Index | | | Call | | | Bank of America Merrill Lynch | | | 03/21/2018 | | | | 337 | | | | USD | | | | 16 | | | | USD | | | | 539,200 | | | | 70,724 | |
VIX Index | | | Call | | | Morgan Stanley Capital Services LLC | | | 12/20/2017 | | | | 396 | | | | USD | | | | 16 | | | | USD | | | | 633,600 | | | | 31,719 | |
VIX Index | | | Call | | | Morgan Stanley Capital Services LLC | | | 02/14/2018 | | | | 399 | | | | USD | | | | 16 | | | | USD | | | | 638,400 | | | | 64,977 | |
VIX Index | | | Call | | | Morgan Stanley Capital Services LLC | | | 04/18/2018 | | | | 365 | | | | USD | | | | 15 | | | | USD | | | | 547,500 | | | | 99,805 | |
Subtotal — Over-The-Counter Index Call Options Purchased | | | | 1,779 | | | | | | | | | | | | | | | | | | | | 1,962,618 | |
HSCEI Index | | | Put | | | BNP Paribas S.A. | | | 12/28/2017 | | | | 11 | | | | HKD | | | | 9,800 | | | | HKD | | | | 5,390,000 | | | | 1,778 | |
HSCEI Index | | | Put | | | BNP Paribas S.A. | | | 12/28/2017 | | | | 18 | | | | HKD | | | | 10,200 | | | | HKD | | | | 9,180,000 | | | | 4,909 | |
HSCEI Index | | | Put | | | BNP Paribas S.A. | | | 12/28/2017 | | | | 7 | | | | HKD | | | | 10,600 | | | | HKD | | | | 3,710,000 | | | | 3,403 | |
HSCEI Index | | | Put | | | Citigroup Global Markets Inc. | | | 12/28/2017 | | | | 35 | | | | HKD | | | | 9,800 | | | | HKD | | | | 17,150,000 | | | | 5,658 | |
HSCEI Index | | | Put | | | Citigroup Global Markets Inc. | | | 12/28/2017 | | | | 29 | | | | HKD | | | | 10,200 | | | | HKD | | | | 14,790,000 | | | | 7,908 | |
HSCEI Index | | | Put | | | Citigroup Global Markets Inc. | | | 12/28/2017 | | | | 90 | | | | HKD | | | | 10,600 | | | | HKD | | | | 47,700,000 | | | | 43,748 | |
HSCEI Index | | | Put | | | Deutsche Bank Securities Inc. | | | 12/28/2017 | | | | 43 | | | | HKD | | | | 9,800 | | | | HKD | | | | 21,070,000 | | | | 6,952 | |
HSCEI Index | | | Put | | | Deutsche Bank Securities Inc. | | | 12/28/2018 | | | | 16 | | | | HKD | | | | 10,000 | | | | HKD | | | | 8,000,000 | | | | 49,174 | |
HSCEI Index | | | Put | | | Deutsche Bank Securities Inc. | | | 12/28/2018 | | | | 14 | | | | HKD | | | | 10,400 | | | | HKD | | | | 7,280,000 | | | | 54,086 | |
HSCEI Index | | | Put | | | Goldman Sachs International | | | 12/28/2017 | | | | 11 | | | | HKD | | | | 9,800 | | | | HKD | | | | 5,390,000 | | | | 1,778 | |
HSCEI Index | | | Put | | | Goldman Sachs International | | | 12/28/2017 | | | | 10 | | | | HKD | | | | 10,200 | | | | HKD | | | | 5,100,000 | | | | 2,727 | |
HSCEI Index | | | Put | | | Goldman Sachs International | | | 12/28/2017 | | | | 10 | | | | HKD | | | | 10,600 | | | | HKD | | | | 5,300,000 | | | | 4,861 | |
HSCEI Index | | | Put | | | J.P. Morgan Chase Bank, N.A. | | | 12/28/2017 | | | | 94 | | | | HKD | | | | 9,400 | | | | HKD | | | | 44,180,000 | | | | 9,346 | |
HSCEI Index | | | Put | | | J.P. Morgan Chase Bank, N.A. | | | 12/28/2017 | | | | 96 | | | | HKD | | | | 9,800 | | | | HKD | | | | 47,040,000 | | | | 15,520 | |
HSCEI Index | | | Put | | | J.P. Morgan Chase Bank, N.A. | | | 12/28/2017 | | | | 23 | | | | HKD | | | | 10,200 | | | | HKD | | | | 11,730,000 | | | | 6,271 | |
HSCEI Index | | | Put | | | J.P. Morgan Chase Bank, N.A. | | | 12/28/2017 | | | | 19 | | | | HKD | | | | 10,600 | | | | HKD | | | | 10,070,000 | | | | 9,235 | |
HSCEI Index | | | Put | | | J.P. Morgan Chase Bank, N.A. | | | 12/28/2018 | | | | 21 | | | | HKD | | | | 10,800 | | | | HKD | | | | 11,340,000 | | | | 101,321 | |
HSCEI Index | | | Put | | | Societe Generale S.A. | | | 12/28/2017 | | | | 6 | | | | HKD | | | | 9,400 | | | | HKD | | | | 2,820,000 | | | | 597 | |
HSCEI Index | | | Put | | | Societe Generale S.A. | | | 12/28/2018 | | | | 73 | | | | HKD | | | | 10,800 | | | | HKD | | | | 39,420,000 | | | | 352,211 | |
HSCEI Index | | | Put | | | UBS | | | 12/28/2017 | | | | 21 | | | | HKD | | | | 9,800 | | | | HKD | | | | 10,290,000 | | | | 3,395 | |
HSCEI Index | | | Put | | | UBS | | | 12/28/2017 | | | | 20 | | | | HKD | | | | 10,200 | | | | HKD | | | | 10,200,000 | | | | 5,454 | |
HSCEI Index | | | Put | | | UBS | | | 12/28/2017 | | | | 9 | | | | HKD | | | | 10,600 | | | | HKD | | | | 4,770,000 | | | | 4,375 | |
HSCEI Index | | | Put | | | UBS | | | 12/28/2018 | | | | 56 | | | | HKD | | | | 10,800 | | | | HKD | | | | 30,240,000 | | | | 270,190 | |
NKY Index | | | Put | | | Bank of America Merrill Lynch | | | 12/08/2017 | | | | 124 | | | | JPY | | | | 20,000 | | | | JPY | | | | 2,480,000,000 | | | | 44,494 | |
NKY Index | | | Put | | | J.P. Morgan Chase Bank, N.A. | | | 06/08/2018 | | | | 3 | | | | JPY | | | | 21,000 | | | | JPY | | | | 63,000,000 | | | | 19,019 | |
NKY Index | | | Put | | | UBS | | | 12/08/2017 | | | | 5 | | | | JPY | | | | 20,250 | | | | JPY | | | | 101,250,000 | | | | 2,239 | |
NKY Index | | | Put | | | UBS | | | 12/08/2017 | | | | 15 | | | | JPY | | | | 20,875 | | | | JPY | | | | 313,125,000 | | | | 12,442 | |
RTY Index | | | Put | | | Citigroup Global Markets Inc. | | | 11/17/2017 | | | | 1 | | | | USD | | | | 1,435 | | | | USD | | | | 143,500 | | | | 350 | |
SMI Index | | | Put | | | Citigroup Global Markets Inc. | | | 12/15/2017 | | | | 45 | | | | CHF | | | | 8,400 | | | | CHF | | | | 3,780,000 | | | | 5,305 | |
SMI Index | | | Put | | | Citigroup Global Markets Inc. | | | 06/15/2018 | | | | 9 | | | | CHF | | | | 8,000 | | | | CHF | | | | 720,000 | | | | 10,995 | |
SMI Index | | | Put | | | Citigroup Global Markets Inc. | | | 06/15/2018 | | | | 9 | | | | CHF | | | | 8,200 | | | | CHF | | | | 738,000 | | | | 13,810 | |
SMI Index | | | Put | | | Citigroup Global Markets Inc. | | | 06/15/2018 | | | | 7 | | | | CHF | | | | 8,600 | | | | CHF | | | | 602,000 | | | | 16,921 | |
SMI Index | | | Put | | | Goldman Sachs International | | | 12/15/2017 | | | | 54 | | | | CHF | | | | 8,400 | | | | CHF | | | | 4,536,000 | | | | 6,366 | |
SMI Index | | | Put | | | Goldman Sachs International | | | 12/15/2017 | | | | 10 | | | | CHF | | | | 8,600 | | | | CHF | | | | 860,000 | | | | 1,831 | |
SMI Index | | | Put | | | Goldman Sachs International | | | 06/15/2018 | | | | 31 | | | | CHF | | | | 8,000 | | | | CHF | | | | 2,480,000 | | | | 37,872 | |
SMI Index | | | Put | | | Goldman Sachs International | | | 06/15/2018 | | | | 30 | | | | CHF | | | | 8,200 | | | | CHF | | | | 2,460,000 | | | | 46,033 | |
SMI Index | | | Put | | | Goldman Sachs International | | | 06/15/2018 | | | | 54 | | | | CHF | | | | 8,600 | | | | CHF | | | | 4,644,000 | | | | 130,536 | |
See accompanying Notes to Consolidated Financial Statements which are an integral part of the financial statements.
25 Invesco Global Targeted Returns Fund
| | | | | | | | | | | | | | | | | | | | | | | | | | | | | | | | | | |
| Open Over-The-Counter Index Options Purchased—(continued) | |
| Description | | Type of
Contract | | | Broker/Counterparty | | Expiration
Date | | | Number of
Contracts | | | Exercise
Price | | | Notional
Value(l) | | | Value | |
SMI Index | | | Put | | | J.P. Morgan Chase Bank, N.A. | | | 12/15/2017 | | | | 10 | | | | CHF | | | | 8,200 | | | | CHF | | | | 820,000 | | | $ | 801 | |
SMI Index | | | Put | | | J.P. Morgan Chase Bank, N.A. | | | 12/15/2017 | | | | 11 | | | | CHF | | | | 8,400 | | | | CHF | | | | 924,000 | | | | 1,297 | |
SMI Index | | | Put | | | J.P. Morgan Chase Bank, N.A. | | | 06/15/2018 | | | | 8 | | | | CHF | | | | 7,700 | | | | CHF | | | | 616,000 | | | | 7,004 | |
SMI Index | | | Put | | | J.P. Morgan Chase Bank, N.A. | | | 06/15/2018 | | | | 7 | | | | CHF | | | | 8,000 | | | | CHF | | | | 560,000 | | | | 8,552 | |
SMI Index | | | Put | | | J.P. Morgan Chase Bank, N.A. | | | 06/15/2018 | | | | 6 | | | | CHF | | | | 8,200 | | | | CHF | | | | 492,000 | | | | 9,207 | |
SMI Index | | | Put | | | J.P. Morgan Chase Bank, N.A. | | | 06/15/2018 | | | | 61 | | | | CHF | | | | 8,600 | | | | CHF | | | | 5,246,000 | | | | 147,458 | |
SMI Index | | | Put | | | UBS | | | 12/15/2017 | | | | 49 | | | | CHF | | | | 8,600 | | | | CHF | | | | 4,214,000 | | | | 8,971 | |
SMI Index | | | Put | | | UBS | | | 06/15/2018 | | | | 12 | | | | CHF | | | | 7,700 | | | | CHF | | | | 924,000 | | | | 10,505 | |
SMI Index | | | Put | | | UBS | | | 06/15/2018 | | | | 24 | | | | CHF | | | | 8,000 | | | | CHF | | | | 1,920,000 | | | | 29,320 | |
SMI Index | | | Put | | | UBS | | | 06/15/2018 | | | | 21 | | | | CHF | | | | 8,200 | | | | CHF | | | | 1,722,000 | | | | 32,223 | |
SMI Index | | | Put | | | UBS | | | 06/15/2018 | | | | 11 | | | | CHF | | | | 8,600 | | | | CHF | | | | 946,000 | | | | 26,590 | |
SPX Index | | | Put | | | Goldman Sachs International | | | 09/21/2018 | | | | 27 | | | | USD | | | | 2,375 | | | | USD | | | | 6,412,500 | | | | 182,039 | |
SPX Index | | | Put | | | J.P. Morgan Chase Bank, N.A. | | | 09/21/2018 | | | | 57 | | | | USD | | | | 2,375 | | | | USD | | | | 13,537,500 | | | | 384,304 | |
SX7E Index | | | Put | | | Citigroup Global Markets Inc. | | | 12/15/2017 | | | | 45 | | | | EUR | | | | 110 | | | | EUR | | | | 247,500 | | | | 136 | |
SX7E Index | | | Put | | | Citigroup Global Markets Inc. | | | 12/15/2017 | | | | 258 | | | | EUR | | | | 115 | | | | EUR | | | | 1,483,500 | | | | 1,789 | |
SX7E Index | | | Put | | | Citigroup Global Markets Inc. | | | 12/15/2017 | | | | 253 | | | | EUR | | | | 120 | | | | EUR | | | | 1,518,000 | | | | 4,055 | |
SX7E Index | | | Put | | | Goldman Sachs International | | | 12/15/2017 | | | | 206 | | | | EUR | | | | 115 | | | | EUR | | | | 1,184,500 | | | | 1,428 | |
SX7E Index | | | Put | | | Goldman Sachs International | | | 12/15/2017 | | | | 397 | | | | EUR | | | | 120 | | | | EUR | | | | 2,382,000 | | | | 6,363 | |
SX7E Index | | | Put | | | Goldman Sachs International | | | 12/15/2017 | | | | 97 | | | | EUR | | | | 130 | | | | EUR | | | | 630,500 | | | | 8,131 | |
SX7E Index | | | Put | | | Goldman Sachs International | | | 12/21/2018 | | | | 88 | | | | EUR | | | | 110 | | | | EUR | | | | 484,000 | | | | 26,772 | |
SX7E Index | | | Put | | | Goldman Sachs International | | | 12/21/2018 | | | | 72 | | | | EUR | | | | 120 | | | | EUR | | | | 432,000 | | | | 34,727 | |
SX7E Index | | | Put | | | Goldman Sachs International | | | 12/21/2018 | | | | 152 | | | | EUR | | | | 130 | | | | EUR | | | | 988,000 | | | | 110,804 | |
SX7E Index | | | Put | | | J.P. Morgan Chase Bank, N.A. | | | 12/15/2017 | | | | 7 | | | | EUR | | | | 110 | | | | EUR | | | | 38,500 | | | | 21 | |
SX7E Index | | | Put | | | J.P. Morgan Chase Bank, N.A. | | | 12/15/2017 | | | | 255 | | | | EUR | | | | 115 | | | | EUR | | | | 1,466,250 | | | | 1,769 | |
SX7E Index | | | Put | | | J.P. Morgan Chase Bank, N.A. | | | 12/15/2017 | | | | 7 | | | | EUR | | | | 120 | | | | EUR | | | | 42,000 | | | | 112 | |
SX7E Index | | | Put | | | J.P. Morgan Chase Bank, N.A. | | | 12/21/2018 | | | | 155 | | | | EUR | | | | 110 | | | | EUR | | | | 852,500 | | | | 47,154 | |
SX7E Index | | | Put | | | J.P. Morgan Chase Bank, N.A. | | | 12/21/2018 | | | | 170 | | | | EUR | | | | 120 | | | | EUR | | | | 1,020,000 | | | | 81,995 | |
SX7E Index | | | Put | | | J.P. Morgan Chase Bank, N.A. | | | 12/21/2018 | | | | 161 | | | | EUR | | | | 130 | | | | EUR | | | | 1,046,500 | | | | 117,364 | |
SX7E Index | | | Put | | | Bank of America Merrill Lynch | | | 12/21/2018 | | | | 34 | | | | EUR | | | | 110 | | | | EUR | | | | 187,000 | | | | 10,344 | |
SX7E Index | | | Put | | | Bank of America Merrill Lynch | | | 12/21/2018 | | | | 28 | | | | EUR | | | | 120 | | | | EUR | | | | 168,000 | | | | 13,505 | |
SX7E Index | | | Put | | | Bank of America Merrill Lynch | | | 12/21/2018 | | | | 27 | | | | EUR | | | | 130 | | | | EUR | | | | 175,500 | | | | 19,682 | |
UKX Index | | | Put | | | Barclays Bank PLC | | | 06/15/2018 | | | | 8 | | | | GBP | | | | 7,150 | | | | GBP | | | | 572,000 | | | | 22,630 | |
UKX Index | | | Put | | | Citigroup Global Markets Inc. | | | 06/15/2018 | | | | 9 | | | | GBP | | | | 7,150 | | | | GBP | | | | 643,500 | | | | 25,459 | |
UKX Index | | | Put | | | Deutsche Bank Securities Inc. | | | 12/15/2017 | | | | 188 | | | | GBP | | | | 7,125 | | | | GBP | | | | 13,395,000 | | | | 45,926 | |
UKX Index | | | Put | | | Deutsche Bank Securities Inc. | | | 06/15/2018 | | | | 22 | | | | GBP | | | | 7,150 | | | | GBP | | | | 1,573,000 | | | | 62,232 | |
UKX Index | | | Put | | | Goldman Sachs International | | | 12/15/2017 | | | | 12 | | | | GBP | | | | 7,125 | | | | GBP | | | | 855,000 | | | | 2,931 | |
UKX Index | | | Put | | | HSBC New York | | | 06/15/2018 | | | | 11 | | | | GBP | | | | 7,150 | | | | GBP | | | | 786,500 | | | | 31,116 | |
UKX Index | | | Put | | | J.P. Morgan Chase Bank, N.A. | | | 06/15/2018 | | | | 25 | | | | GBP | | | | 7,150 | | | | GBP | | | | 1,787,500 | | | | 70,719 | |
VIX Index | | | Put | | | Bank of America Merrill Lynch | | | 12/20/2017 | | | | 337 | | | | USD | | | | 14 | | | | USD | | | | 471,800 | | | | 96,134 | |
VIX Index | | | Put | | | Morgan Stanley Capital Services LLC | | | 11/15/2017 | | | | 399 | | | | USD | | | | 14 | | | | USD | | | | 558,600 | | | | 124,120 | |
VIX Index | | | Put | | | Morgan Stanley Capital Services LLC | | | 01/17/2018 | | | | 365 | | | | USD | | | | 13 | | | | USD | | | | 474,500 | | | | 61,137 | |
Subtotal – Over-The-Counter Index Put Options Purchased | | | | 5,221 | | | | | | | | | | | | | | | | | | | $ | 3,189,936 | |
Total Over-The-Counter Index Options Purchased | | | | 7,000 | | | | | | | | | | | | | | | | | | | $ | 5,152,554 | |
| | | | | | | | | | | | | | | | | | | | | | | | | | | | | | | | |
| Open Exchange-Traded Index Options Purchased | |
| Description | | Type of
Contract | | | Expiration
Date | | | Number of
Contracts | | | Exercise
Price | | | Notional
Value(l) | | | Value | |
SMI Index | | | Put | | | | 12/15/2017 | | | | 25 | | | | CHF | | | | 7,200 | | | | CHF | | | | 1,800,000 | | | $ | 476 | |
SMI Index | | | Put | | | | 12/15/2017 | | | | 24 | | | | CHF | | | | 7,400 | | | | CHF | | | | 1,776,000 | | | | 649 | |
SMI Index | | | Put | | | | 12/15/2017 | | | | 123 | | | | CHF | | | | 7,700 | | | | CHF | | | | 9,471,000 | | | | 5,302 | |
SMI Index | | | Put | | | | 12/15/2017 | | | | 79 | | | | CHF | | | | 8,200 | | | | CHF | | | | 6,478,000 | | | | 7,602 | |
See accompanying Notes to Consolidated Financial Statements which are an integral part of the financial statements.
26 Invesco Global Targeted Returns Fund
| | | | | | | | | | | | | | | | | | | | | | | | | | | | | | | | |
| Open Exchange-Traded Index Options Purchased—(continued) | |
| Description | | Type of
Contract | | | Expiration
Date | | | Number of
Contracts | | | Exercise
Price | | | Notional
Value(l) | | | Value | |
SMI Index | | | Put | | | | 12/15/2017 | | | | 73 | | | | CHF | | | | 8,400 | | | | CHF | | | | 6,132,000 | | | $ | 10,025 | |
SX7E Index | | | Put | | | | 12/15/2017 | | | | 92 | | | | EUR | | | | 110 | | | | EUR | | | | 506,000 | | | | 268 | |
SX7E Index | | | Put | | | | 12/15/2017 | | | | 88 | | | | EUR | | | | 115 | | | | EUR | | | | 506,000 | | | | 769 | |
SX7E Index | | | Put | | | | 12/15/2017 | | | | 87 | | | | EUR | | | | 120 | | | | EUR | | | | 522,000 | | | | 1,774 | |
Total Exchange-Traded Index Options Purchased | | | | 591 | | | | | | | | 26,865 | |
Total Index Options Purchased — Equity Risk | | | | 7,591 | | | | | | | $ | 5,179,419 | |
| (l) | Notional Value is calculated by multiplying the Number of Contracts by the Exercise Price by the multiplier. |
| | | | | | | | | | | | | | | | | | | | | | | | | | | | | | |
| Open Over-The-Counter Foreign Currency Options Purchased | |
| Description | | Type of
Contract | | | Counterparty | | Expiration
Date | | | Exercise
Price | | | Notional
Value | | | Value | |
EUR versus USD | | | Call | | | Barclays Bank PLC | | | 06/17/2021 | | | | USD | | | | 1.175 | | | | EUR | | | | 562,501 | | | $ | 72,907 | |
EUR versus USD | | | Call | | | Citigroup Global Markets Inc. | | | 06/17/2021 | | | | USD | | | | 1.175 | | | | EUR | | | | 567,334 | | | | 73,533 | |
EUR versus USD | | | Call | | | Citigroup Global Markets Inc. | | | 06/17/2021 | | | | USD | | | | 1.189 | | | | EUR | | | | 632,455 | | | | 76,181 | |
EUR versus USD | | | Call | | | Citigroup Global Markets Inc. | | | 06/17/2021 | | | | USD | | | | 1.284 | | | | EUR | | | | 112,906 | | | | 7,979 | |
EUR versus USD | | | Call | | | Goldman Sachs International | | | 11/15/2019 | | | | USD | | | | 1.227 | | | | EUR | | | | 2,792,791 | | | | 141,563 | |
EUR versus USD | | | Call | | | Goldman Sachs International | | | 02/14/2020 | | | | USD | | | | 1.234 | | | | EUR | | | | 1,659,309 | | | | 91,672 | |
EUR versus USD | | | Call | | | Goldman Sachs International | | | 05/15/2020 | | | | USD | | | | 1.240 | | | | EUR | | | | 2,609,579 | | | | 155,115 | |
EUR versus USD | | | Call | | | Goldman Sachs International | | | 08/25/2020 | | | | USD | | | | 1.200 | | | | EUR | | | | 1,348,907 | | | | 120,412 | |
EUR versus USD | | | Call | | | Goldman Sachs International | | | 06/17/2021 | | | | USD | | | | 1.177 | | | | EUR | | | | 530,238 | | | | 68,210 | |
EUR versus USD | | | Call | | | Goldman Sachs International | | | 06/17/2021 | | | | USD | | | | 1.228 | | | | EUR | | | | 1,684,483 | | | | 164,900 | |
EUR versus USD | | | Call | | | J.P. Morgan Securities LLC | | | 05/28/2020 | | | | USD | | | | 1.259 | | | | EUR | | | | 795,507 | | | | 41,591 | |
EUR versus USD | | | Call | | | J.P. Morgan Securities LLC | | | 06/17/2021 | | | | USD | | | | 1.281 | | | | EUR | | | | 379,616 | | | | 27,317 | |
EUR versus USD | | | Call | | | Morgan Stanley Capital Services LLC | | | 05/28/2020 | | | | USD | | | | 1.251 | | | | EUR | | | | 1,759,196 | | | | 98,034 | |
EUR versus USD | | | Call | | | Morgan Stanley Capital Services LLC | | | 05/28/2020 | | | | USD | | | | 1.257 | | | | EUR | | | | 879,599 | | | | 46,905 | |
EUR versus USD | | | Call | | | Morgan Stanley Capital Services LLC | | | 05/28/2020 | | | | USD | | | | 1.259 | | | | EUR | | | | 879,599 | | | | 45,987 | |
USD versus BRL | | | Call | | | Goldman Sachs International | | | 03/20/2018 | | | | BRL | | | | 3.750 | | | | USD | | | | 586,600 | | | | 3,596 | |
USD versus BRL | | | Call | | | Morgan Stanley Capital Services LLC | | | 03/20/2018 | | | | BRL | | | | 3.750 | | | | USD | | | | 2,712,400 | | | | 16,626 | |
USD versus CAD | | | Call | | | Goldman Sachs International | | | 11/13/2017 | | | | CAD | | | | 1.335 | | | | USD | | | | 13,011,300 | | | | 1,061 | |
Subtotal — Over-The-Counter Foreign Currency Call Options Purchased | | | | | | | | | | | | | | | | | | | | | | | 1,253,589 | |
EUR versus USD | | | Put | | | Bank of America Merrill Lynch | | | 08/25/2020 | | | | USD | | | | 1.217 | | | | EUR | | | | 798,120 | | | | 39,741 | |
EUR versus USD | | | Put | | | Barclays Bank PLC | | | 01/13/2020 | | | | USD | | | | 1.270 | | | | EUR | | | | 338,440 | | | | 26,066 | |
EUR versus USD | | | Put | | | Barclays Bank PLC | | | 01/27/2020 | | | | USD | | | | 1.222 | | | | EUR | | | | 640,440 | | | | 32,555 | |
EUR versus USD | | | Put | | | Barclays Bank PLC | | | 03/12/2020 | | | | USD | | | | 1.170 | | | | EUR | | | | 132,118 | | | | 4,125 | |
EUR versus USD | | | Put | | | Barclays Bank PLC | | | 04/22/2020 | | | | USD | | | | 1.172 | | | | EUR | | | | 783,356 | | | | 25,245 | |
EUR versus USD | | | Put | | | Barclays Bank PLC | | | 05/12/2020 | | | | USD | | | | 1.225 | | | | EUR | | | | 119,640 | | | | 6,298 | |
EUR versus USD | | | Put | | | Barclays Bank PLC | | | 06/03/2020 | | | | USD | | | | 1.218 | | | | EUR | | | | 509,824 | | | | 25,323 | |
EUR versus USD | | | Put | | | Barclays Bank PLC | | | 06/26/2020 | | | | USD | | | | 1.220 | | | | EUR | | | | 578,405 | | | | 29,261 | |
EUR versus USD | | | Put | | | Barclays Bank PLC | | | 07/10/2020 | | | | USD | | | | 1.213 | | | | EUR | | | | 477,259 | | | | 22,791 | |
EUR versus USD | | | Put | | | Barclays Bank PLC | | | 07/16/2020 | | | | USD | | | | 1.188 | | | | EUR | | | | 437,856 | | | | 16,839 | |
EUR versus USD | | | Put | | | Barclays Bank PLC | | | 08/25/2020 | | | | USD | | | | 1.177 | | | | EUR | | | | 754,643 | | | | 26,692 | |
EUR versus USD | | | Put | | | Citigroup Global Markets Inc. | | | 08/25/2020 | | | | USD | | | | 1.194 | | | | EUR | | | | 363,370 | | | | 14,841 | |
EUR versus USD | | | Put | | | Citigroup Global Markets Inc. | | | 08/25/2020 | | | | USD | | | | 1.228 | | | | EUR | | | | 353,889 | | | | 19,276 | |
EUR versus USD | | | Put | | | Citigroup Global Markets Inc. | | | 06/17/2021 | | | | USD | | | | 1.184 | | | | EUR | | | | 1,126,229 | | | | 46,442 | |
EUR versus USD | | | Put | | | Deutsche Bank Securities Inc. | | | 07/01/2020 | | | | USD | | | | 1.210 | | | | EUR | | | | 358,640 | | | | 16,691 | |
EUR versus USD | | | Put | | | Deutsche Bank Securities Inc. | | | 08/25/2020 | | | | USD | | | | 1.205 | | | | EUR | | | | 320,544 | | | | 14,440 | |
EUR versus USD | | | Put | | | Goldman Sachs International | | | 12/12/2019 | | | | USD | | | | 1.350 | | | | EUR | | | | 2,792,791 | | | | 378,815 | |
EUR versus USD | | | Put | | | Goldman Sachs International | | | 01/21/2020 | | | | USD | | | | 1.253 | | | | EUR | | | | 310,284 | | | | 20,748 | |
EUR versus USD | | | Put | | | Goldman Sachs International | | | 02/06/2020 | | | | USD | | | | 1.234 | | | | EUR | | | | 238,027 | | | | 13,473 | |
EUR versus USD | | | Put | | | Goldman Sachs International | | | 04/15/2020 | | | | USD | | | | 1.159 | | | | EUR | | | | 618,354 | | | | 17,612 | |
EUR versus USD | | | Put | | | Goldman Sachs International | | | 07/29/2020 | | | | USD | | | | 1.204 | | | | EUR | | | | 200,000 | | | | 8,884 | |
See accompanying Notes to Consolidated Financial Statements which are an integral part of the financial statements.
27 Invesco Global Targeted Returns Fund
| | | | | | | | | | | | | | | | | | | | | | | | | | | | | | |
| Open Over-The-Counter Foreign Currency Options Purchased—(continued) | |
| Description | | Type of
Contract | | | Counterparty | | Expiration
Date | | | Exercise
Price | | | Notional
Value | | | Value | |
EUR versus USD | | | Put | | | Goldman Sachs International | | | 08/25/2020 | | | | USD | | | | 1.171 | | | | EUR | | | | 565,767 | | | $ | 18,974 | |
EUR versus USD | | | Put | | | Goldman Sachs International | | | 08/25/2020 | | | | USD | | | | 1.181 | | | | EUR | | | | 840,208 | | | | 30,648 | |
EUR versus USD | | | Put | | | Goldman Sachs International | | | 08/25/2020 | | | | USD | | | | 1.182 | | | | EUR | | | | 940,625 | | | | 34,613 | |
EUR versus USD | | | Put | | | Goldman Sachs International | | | 08/25/2020 | | | | USD | | | | 1.192 | | | | EUR | | | | 1,446,909 | | | | 58,086 | |
EUR versus USD | | | Put | | | Goldman Sachs International | | | 08/25/2020 | | | | USD | | | | 1.199 | | | | EUR | | | | 949,393 | | | | 40,474 | |
EUR versus USD | | | Put | | | Goldman Sachs International | | | 08/25/2020 | | | | USD | | | | 1.203 | | | | EUR | | | | 1,678,227 | | | | 74,335 | |
EUR versus USD | | | Put | | | Goldman Sachs International | | | 08/25/2020 | | | | USD | | | | 1.210 | | | | EUR | | | | 422,926 | | | | 19,787 | |
EUR versus USD | | | Put | | | Goldman Sachs International | | | 06/17/2021 | | | | USD | | | | 1.176 | | | | EUR | | | | 953,186 | | | | 37,038 | |
EUR versus USD | | | Put | | | Goldman Sachs International | | | 06/17/2021 | | | | USD | | | | 1.195 | | | | EUR | | | | 798,801 | | | | 35,711 | |
EUR versus USD | | | Put | | | Goldman Sachs International | | | 06/17/2021 | | | | USD | | | | 1.202 | | | | EUR | | | | 948,543 | | | | 44,614 | |
EUR versus USD | | | Put | | | Goldman Sachs International | | | 06/17/2021 | | | | USD | | | | 1.205 | | | | EUR | | | | 599,775 | | | | 28,827 | |
EUR versus USD | | | Put | | | Goldman Sachs International | | | 06/17/2021 | | | | USD | | | | 1.208 | | | | EUR | | | | 842,323 | | | | 41,365 | |
EUR versus USD | | | Put | | | J.P. Morgan Securities LLC | | | 06/17/2021 | | | | USD | | | | 1.208 | | | | EUR | | | | 385,953 | | | | 18,953 | |
USD versus JPY | | | Put | | | Barclays Bank PLC | | | 01/17/2018 | | | | JPY | | | | 113.500 | | | | USD | | | | 1,833,000 | | | | 29,768 | |
USD versus JPY | | | Put | | | Goldman Sachs International | | | 01/17/2018 | | | | JPY | | | | 107.700 | | | | USD | | | | 11,251,000 | | | | 31,779 | |
USD versus JPY | | | Put | | | Goldman Sachs International | | | 01/17/2018 | | | | JPY | | | | 113.500 | | | | USD | | | | 7,403,000 | | | | 120,224 | |
USD versus JPY | | | Put | | | Goldman Sachs International | | | 01/17/2018 | | | | JPY | | | | 119.000 | | | | USD | | | | 5,576,000 | | | | 293,194 | |
USD versus JPY | | | Put | | | Goldman Sachs International | | | 06/20/2018 | | | | JPY | | | | 111.000 | | | | USD | | | | 2,751,000 | | | | 65,257 | |
USD versus KRW | | | Put | | | Citigroup Global Markets Inc. | | | 01/17/2018 | | | | KRW | | | | 1,190.000 | | | | USD | | | | 1,366,372 | | | | 93,136 | |
Subtotal — Over-The-Counter Foreign Currency Put Options Purchased | | | | | | | | 1,922,941 | |
Total — Foreign Currency Options Purchased — Currency Risk | | | | | | | | 3,176,530 | |
Total — Options Purchased (Cost $15,721,188) | | | | | | | $ | 8,355,949 | |
| | | | | | | | | | | | | | | | | | | | | | | | | | | | | | | | | | | | | | | | | | |
| Open Over-The-Counter Index Options Written | |
| Description | | Type of
Contract | | | Counterparty | | Expiration
Date | | | Number of
Contracts | | | Exercise Price | | | Premiums
Received | | | Notional
Value(m) | | | Value | | | Unrealized
Appreciation
(Depreciation) | |
CBOE SPX Volatility Index | | | Call | | | Bank of America Merrill Lynch | | | December-2017 | | | | 396 | | | | USD | | | | 16 | | | $ | (59,004 | ) | | | USD | | | | 633,600 | | | $ | (31,719 | ) | | $ | 27,285 | |
CBOE SPX Volatility Index | | | Call | | | Morgan Stanley Capital Services LLC | | | February-2018 | | | | 17 | | | | USD | | | | 16 | | | | (2,873 | ) | | | USD | | | | 27,200 | | | | (2,768 | ) | | | 105 | |
CBOE SPX Volatility Index | | | Call | | | Morgan Stanley Capital Services LLC | | | March-2018 | | | | 17 | | | | USD | | | | 16 | | | | (3,587 | ) | | | USD | | | | 27,200 | | | | (3,568 | ) | | | 19 | |
CBOE SPX Volatility Index | | | Call | | | Morgan Stanley Capital Services LLC | | | April-2018 | | | | 17 | | | | USD | | | | 15 | | | | (4,692 | ) | | | USD | | | | 25,500 | | | | (4,648 | ) | | | 44 | |
Hang Seng China Enterprises Index | | | Call | | | J.P. Morgan Chase Bank, N.A. | | | December-2018 | | | | 23 | | | | HKD | | | | 11,200 | | | | (151,684 | ) | | | HKD | | | | 12,880,000 | | | | (150,886 | ) | | | 798 | |
Russell 2000 Index Mini | | | Call | | | Goldman Sachs International | | | December-2017 | | | | 20 | | | | USD | | | | 1,580 | | | | (9,788 | ) | | | USD | | | | 3,160,000 | | | | (6,349 | ) | | | 3,439 | |
S&P 500 Index | | | Call | | | Citigroup Global Markets Inc. | | | December-2017 | | | | 1 | | | | USD | | | | 2,645 | | | | (455 | ) | | | USD | | | | 264,500 | | | | (364 | ) | | | 91 | |
S&P 500 Index | | | Call | | | Goldman Sachs International | | | December-2017 | | | | 2 | | | | USD | | | | 2,660 | | | | (620 | ) | | | USD | | | | 532,000 | | | | (468 | ) | | | 152 | |
S&P 500 Index | | | Call | | | J.P. Morgan Chase Bank, N.A. | | | September-2018 | | | | 3 | | | | USD | | | | 2,625 | | | | (28,335 | ) | | | USD | | | | 787,500 | | | | (27,119 | ) | | | 1,216 | |
Subtotal — Over-The-Counter Index Call Options Written | | | | | | | | | | | | | | | | (261,038 | ) | | | | | | | | | | | (227,889 | ) | | | 33,149 | |
CBOE SPX Volatility Index | | | Put | | | Morgan Stanley Capital Services LLC | | | November-2017 | | | | 17 | | | | USD | | | | 14 | | | | (5,372 | ) | | | USD | | | | 23,800 | | | | (5,288 | ) | | | 84 | |
CBOE SPX Volatility Index | | | Put | | | Morgan Stanley Capital Services LLC | | | December-2017 | | | | 17 | | | | USD | | | | 14 | | | | (5,168 | ) | | | USD | | | | 23,800 | | | | (4,850 | ) | | | 318 | |
CBOE SPX Volatility Index | | | Put | | | Morgan Stanley Capital Services LLC | | | January-2018 | | | | 17 | | | | USD | | | | 13 | | | | (3,009 | ) | | | USD | | | | 22,100 | | | | (2,847 | ) | | | 162 | |
FTSE 100 Index | | | Put | | | UBS | | | December-2017 | | | | 39 | | | | GBP | | | | 7,125 | | | | (88,856 | ) | | | GBP | | | | 2,778,750 | | | | (9,528 | ) | | | 79,328 | |
FTSE 100 Index | | | Put | | | UBS | | | June-2018 | | | | 7 | | | | GBP | | | | 7,150 | | | | (29,352 | ) | | | GBP | | | | 500,500 | | | | (19,801 | ) | | | 9,551 | |
See accompanying Notes to Consolidated Financial Statements which are an integral part of the financial statements.
28 Invesco Global Targeted Returns Fund
| | | | | | | | | | | | | | | | | | | | | | | | | | | | | | | | | | | | | | | | | | |
| Open Over-The-Counter Index Options Written—(continued) | |
| Description | | Type of
Contract | | | Counterparty | | Expiration
Date | | | Number of
Contracts | | | Exercise Price | | | Premiums
Received | | | Notional
Value(m) | | | Value | | | Unrealized
Appreciation
(Depreciation) | |
FTSE 100 Index | | | Put | | | Deutsche Bank Securities Inc. | | | June-2018 | | | | 5 | | | | GBP | | | | 7,150 | | | $ | (13,733 | ) | | | GBP | | | | 357,500 | | | $ | (14,144 | ) | | $ | (411 | ) |
Hang Seng China Enterprises Index | | | Put | | | J.P. Morgan Chase Bank, N.A. | | | December-2018 | | | | 24 | | | | HKD | | | | 10,800 | | | | (118,665 | ) | | | HKD | | | | 12,960,000 | | | | (115,795 | ) | | | 2,870 | |
Nikkei 225 Index | | | Put | | | Goldman Sachs International | | | December-2017 | | | | 34 | | | | JPY | | | | 20,000 | | | | (246,679 | ) | | | JPY | | | | 680,000,000 | | | | (12,200 | ) | | | 234,479 | |
Nikkei 225 Index | | | Put | | | UBS | | | December-2017 | | | | 19 | | | | JPY | | | | 20,000 | | | | (129,801 | ) | | | JPY | | | | 380,000,000 | | | | (6,817 | ) | | | 122,984 | |
Nikkei 225 Index | | | Put | | | Bank of America Merrill Lynch | | | December-2017 | | | | 16 | | | | JPY | | | | 20,250 | | | | (118,206 | ) | | | JPY | | | | 324,000,000 | | | | (7,166 | ) | | | 111,040 | |
Nikkei 225 Index | | | Put | | | J.P. Morgan Chase Bank, N.A. | | | December-2017 | | | | 3 | | | | JPY | | | | 20,000 | | | | (1,668 | ) | | | JPY | | | | 60,000,000 | | | | (1,076 | ) | | | 592 | |
Nikkei 225 Index | | | Put | | | Bank of America Merrill Lynch | | | June-2018 | | | | 60 | | | | JPY | | | | 42,000 | | | | (618,823 | ) | | | JPY | | | | 1,260,000,000 | | | | (380,384 | ) | | | 238,439 | |
Nikkei 225 Index | | | Put | | | UBS | | | June-2018 | | | | 15 | | | | JPY | | | | 22,000 | | | | (138,007 | ) | | | JPY | | | | 330,000,000 | | | | (149,824 | ) | | | (11,817 | ) |
Russell 2000 Index Mini | | | Put | | | Citigroup Global Markets Inc. | | | November-2017 | | | | 11 | | | | USD | | | | 1,435 | | | | (6,215 | ) | | | USD | | | | 1,578,500 | | | | (3,855 | ) | | | 2,360 | |
S&P 500 Index | | | Put | | | J.P. Morgan Chase Bank, N.A. | | | September-2018 | | | | 3 | | | | USD | | | | 2,375 | | | | (20,490 | ) | | | USD | | | | 712,500 | | | | (20,226 | ) | | | 264 | |
SMI Index | | | Put | | | Goldman Sachs International | | | December-2017 | | | | 112 | | | | CHF | | | | 7,700 | | | | (87,694 | ) | | | CHF | | | | 8,624,000 | | | | (4,012 | ) | | | 83,682 | |
SMI Index | | | Put | | | UBS | | | December-2017 | | | | 23 | | | | CHF | | | | 8,400 | | | | (38,232 | ) | | | CHF | | | | 1,932,000 | | | | (2,711 | ) | | | 35,521 | |
SMI Index | | | Put | | | UBS | | | December-2017 | | | | 21 | | | | CHF | | | | 8,600 | | | | (45,816 | ) | | | CHF | | | | 1,806,000 | | | | (3,845 | ) | | | 41,971 | |
SMI Index | | | Put | | | Goldman Sachs International | | | June-2018 | | | | 2 | | | | CHF | | | | 8,000 | | | | (5,147 | ) | | | CHF | | | | 160,000 | | | | (2,443 | ) | | | 2,704 | |
SMI Index | | | Put | | | Goldman Sachs International | | | June-2018 | | | | 2 | | | | CHF | | | | 8,200 | | | | (5,462 | ) | | | CHF | | | | 164,000 | | | | (3,069 | ) | | | 2,393 | |
SMI Index | | | Put | | | Goldman Sachs International | | | June-2018 | | | | 2 | | | | CHF | | | | 8,600 | | | | (8,403 | ) | | | CHF | | | | 172,000 | | | | (4,835 | ) | | | 3,568 | |
SMI Index | | | Put | | | Deutsche Bank Securities Inc. | | | June-2018 | | | | 10 | | | | CHF | | | | 8,000 | | | | (13,033 | ) | | | CHF | | | | 800,000 | | | | (12,217 | ) | | | 816 | |
SMI Index | | | Put | | | Deutsche Bank Securities Inc. | | | June-2018 | | | | 8 | | | | CHF | | | | 8,200 | | | | (12,992 | ) | | | CHF | | | | 656,000 | | | | (12,275 | ) | | | 717 | |
SMI Index | | | Put | | | Deutsche Bank Securities Inc. | | | June-2018 | | | | 6 | | | | CHF | | | | 8,600 | | | | (15,347 | ) | | | CHF | | | | 516,000 | | | | (14,504 | ) | | | 843 | |
SX7E Index | | | Put | | | UBS | | | December-2017 | | | | 30 | | | | EUR | | | | 115 | | | | (7,850 | ) | | | EUR | | | | 172,500 | | | | (208 | ) | | | 7,642 | |
SX7E Index | | | Put | | | UBS | | | December-2017 | | | | 26 | | | | EUR | | | | 120 | | | | (9,072 | ) | | | EUR | | | | 156,000 | | | | (417 | ) | | | 8,655 | |
SX7E Index | | | Put | | | UBS | | | December-2017 | | | | 23 | | | | EUR | | | | 130 | | | | (13,461 | ) | | | EUR | | | | 149,500 | | | | (1,928 | ) | | | 11,533 | |
SX7E Index | | | Put | | | UBS | | | December-2018 | | | | 20 | | | | EUR | | | | 110 | | | | (8,703 | ) | | | EUR | | | | 110,000 | | | | (6,084 | ) | | | 2,619 | |
SX7E Index | | | Put | | | UBS | | | December-2018 | | | | 17 | | | | EUR | | | | 120 | | | | (10,947 | ) | | | EUR | | | | 102,000 | | | | (8,200 | ) | | | 2,747 | |
SX7E Index | | | Put | | | UBS | | | December-2018 | | | | 16 | | | | EUR | | | | 130 | | | | (14,631 | ) | | | EUR | | | | 104,000 | | | | (11,664 | ) | | | 2,967 | |
Subtotal — Over-The-Counter Index Put Options Written | | | | | | | | (1,840,834 | ) | | | | | | | (842,213 | ) | | | 998,621 | |
Total — Index Options Written—Equity Risk | | | | | | | $ | (2,101,872 | ) | | | | | | $ | (1,070,102 | ) | | $ | 1,031,770 | |
| (m) | Notional Value is calculated by multiplying the Number of Contracts by the Exercise Price by the multiplier. |
| | | | | | | | | | | | | | | | | | | | | | | | | | | | | | | | | | | | | | |
| Open Over-The-Counter Foreign Currency Options Written | |
| Description | | Type of
Contract | | | Counterparty | | Expiration
Date | | | Exercise
Price | | | Premiums
Received | | | Notional
Value | | | Value | | | Unrealized
Appreciation
(Depreciation) | |
EUR versus USD | | | Call | | | Barclays Bank PLC | | | January-2020 | | | | USD | | | | 1.270 | | | $ | (33,953 | ) | | | EUR | | | | 338,440 | | | $ | (12,883 | ) | | $ | 21,070 | |
EUR versus USD | | | Call | | | Barclays Bank PLC | | | January-2020 | | | | USD | | | | 1.222 | | | | (66,630 | ) | | | EUR | | | | 640,440 | | | | (37,968 | ) | | | 28,662 | |
EUR versus USD | | | Call | | | Barclays Bank PLC | | | March-2020 | | | | USD | | | | 1.170 | | | | (13,404 | ) | | | EUR | | | | 132,118 | | | | (12,339 | ) | | | 1,065 | |
EUR versus USD | | | Call | | | Barclays Bank PLC | | | April-2020 | | | | USD | | | | 1.172 | | | | (44,779 | ) | | | EUR | | | | 431,984 | | | | (40,926 | ) | | | 3,853 | |
EUR versus USD | | | Call | | | Barclays Bank PLC | | | April-2020 | | | | USD | | | | 1.172 | | | | (36,888 | ) | | | EUR | | | | 351,372 | | | | (33,289 | ) | | | 3,599 | |
EUR versus USD | | | Call | | | Barclays Bank PLC | | | May-2020 | | | | USD | | | | 1.225 | | | | (12,182 | ) | | | EUR | | | | 119,640 | | | | (7,966 | ) | | | 4,216 | |
See accompanying Notes to Consolidated Financial Statements which are an integral part of the financial statements.
29 Invesco Global Targeted Returns Fund
| | | | | | | | | | | | | | | | | | | | | | | | | | | | | | | | | | | | | | |
| Open Over-The-Counter Foreign Currency Options Written—(continued) | |
| Description | | Type of
Contract | | | Counterparty | | Expiration
Date | | | Exercise
Price | | | Premiums
Received | | | Notional
Value | | | Value | | | Unrealized
Appreciation
(Depreciation) | |
EUR versus USD | | | Call | | | Barclays Bank PLC | | | June-2020 | | | | USD | | | | 1.218 | | | $ | (52,930 | ) | | | EUR | | | | 509,824 | | | $ | (36,716 | ) | | $ | 16,214 | |
EUR versus USD | | | Call | | | Barclays Bank PLC | | | June-2020 | | | | USD | | | | 1.220 | | | | (57,422 | ) | | | EUR | | | | 578,405 | | | | (42,186 | ) | | | 15,236 | |
EUR versus USD | | | Call | | | Barclays Bank PLC | | | July-2020 | | | | USD | | | | 1.213 | | | | (48,840 | ) | | | EUR | | | | 477,259 | | | | (37,156 | ) | | | 11,684 | |
EUR versus USD | | | Call | | | Barclays Bank PLC | | | July-2020 | | | | USD | | | | 1.188 | | | | (42,457 | ) | | | EUR | | | | 437,856 | | | | (40,668 | ) | | | 1,789 | |
EUR versus USD | | | Call | | | Barclays Bank PLC | | | August-2020 | | | | USD | | | | 1.177 | | | | (79,273 | ) | | | EUR | | | | 754,643 | | | | (77,790 | ) | | | 1,483 | |
EUR versus USD | | | Call | | | Citigroup Global Markets Inc. | | | August-2020 | | | | USD | | | | 1.194 | | | | (36,552 | ) | | | EUR | | | | 363,370 | | | | (33,732 | ) | | | 2,820 | |
EUR versus USD | | | Call | | | Citigroup Global Markets Inc. | | | August-2020 | | | | USD | | | | 1.228 | | | | (36,638 | ) | | | EUR | | | | 353,889 | | | | (26,039 | ) | | | 10,599 | |
EUR versus USD | | | Call | | | Citigroup Global Markets Inc. | | | June-2021 | | | | USD | | | | 1.184 | | | | (113,043 | ) | | | EUR | | | | 1,126,229 | | | | (139,475 | ) | | | (26,432 | ) |
EUR versus USD | | | Call | | | Deutsche Bank Securities Inc. | | | July-2020 | | | | USD | | | | 1.210 | | | | (36,515 | ) | | | EUR | | | | 358,640 | | | | (28,215 | ) | | | 8,300 | |
EUR versus USD | | | Call | | | Deutsche Bank Securities Inc. | | | August-2020 | | | | USD | | | | 1.205 | | | | (32,515 | ) | | | EUR | | | | 320,544 | | | | (27,592 | ) | | | 4,923 | |
EUR versus USD | | | Call | | | Goldman Sachs International | | | December-2019 | | | | USD | | | | 1.350 | | | | (283,731 | ) | | | EUR | | | | 2,792,791 | | | | (47,326 | ) | | | 236,405 | |
EUR versus USD | | | Call | | | Goldman Sachs International | | | January-2020 | | | | USD | | | | 1.253 | | | | (30,213 | ) | | | EUR | | | | 310,284 | | | | (13,952 | ) | | | 16,261 | |
EUR versus USD | | | Call | | | Goldman Sachs International | | | February-2020 | | | | USD | | | | 1.234 | | | | (22,003 | ) | | | EUR | | | | 238,027 | | | | (12,963 | ) | | | 9,040 | |
EUR versus USD | | | Call | | | Goldman Sachs International | | | April-2020 | | | | USD | | | | 1.159 | | | | (63,718 | ) | | | EUR | | | | 618,354 | | | | (64,092 | ) | | | (374 | ) |
EUR versus USD | | | Call | | | Goldman Sachs International | | | July-2020 | | | | USD | | | | 1.204 | | | | (19,856 | ) | | | EUR | | | | 200,000 | | | | (16,878 | ) | | | 2,978 | |
EUR versus USD | | | Call | | | Goldman Sachs International | | | August-2020 | | | | USD | | | | 1.171 | | | | (58,508 | ) | | | EUR | | | | 565,767 | | | | (60,519 | ) | | | (2,011 | ) |
EUR versus USD | | | Call | | | Goldman Sachs International | | | August-2020 | | | | USD | | | | 1.181 | | | | (88,316 | ) | | | EUR | | | | 840,208 | | | | (84,738 | ) | | | 3,578 | |
EUR versus USD | | | Call | | | Goldman Sachs International | | | August-2020 | | | | USD | | | | 1.182 | | | | (99,575 | ) | | | EUR | | | | 940,625 | | | | (94,271 | ) | | | 5,304 | |
EUR versus USD | | | Call | | | Goldman Sachs International | | | August-2020 | | | | USD | | | | 1.192 | | | | (150,346 | ) | | | EUR | | | | 1,446,909 | | | | (136,065 | ) | | | 14,281 | |
EUR versus USD | | | Call | | | Goldman Sachs International | | | August-2020 | | | | USD | | | | 1.199 | | | | (107,205 | ) | | | EUR | | | | 949,393 | | | | (85,307 | ) | | | 21,898 | |
EUR versus USD | | | Call | | | Goldman Sachs International | | | August-2020 | | | | USD | | | | 1.203 | | | | (172,877 | ) | | | EUR | | | | 1,678,227 | | | | (146,390 | ) | | | 26,487 | |
EUR versus USD | | | Call | | | Goldman Sachs International | | | August-2020 | | | | USD | | | | 1.210 | | | | (42,969 | ) | | | EUR | | | | 422,926 | | | | (35,325 | ) | | | 7,644 | |
EUR versus USD | | | Call | | | Goldman Sachs International | | | June-2021 | | | | USD | | | | 1.176 | | | | (78,167 | ) | | | EUR | | | | 953,186 | | | | (122,926 | ) | | | (44,759 | ) |
EUR versus USD | | | Call | | | Goldman Sachs International | | | June-2021 | | | | USD | | | | 1.195 | | | | (59,194 | ) | | | EUR | | | | 798,801 | | | | (93,457 | ) | | | (34,263 | ) |
EUR versus USD | | | Call | | | Goldman Sachs International | | | June-2021 | | | | USD | | | | 1.202 | | | | (111,513 | ) | | | EUR | | | | 948,543 | | | | (106,960 | ) | | | 4,553 | |
EUR versus USD | | | Call | | | Goldman Sachs International | | | June-2021 | | | | USD | | | | 1.205 | | | | (72,564 | ) | | | EUR | | | | 599,775 | | | | (66,561 | ) | | | 6,003 | |
EUR versus USD | | | Call | | | Goldman Sachs International | | | June-2021 | | | | USD | | | | 1.208 | | | | (97,442 | ) | | | EUR | | | | 842,323 | | | | (91,990 | ) | | | 5,452 | |
EUR versus USD | | | Call | | | J.P. Morgan Chase Bank, N.A. | | | June-2021 | | | | USD | | | | 1.208 | | | | (39,433 | ) | | | EUR | | | | 385,953 | | | | (42,150 | ) | | | (2,717 | ) |
EUR versus USD | | | Call | | | Bank of America
Merrill Lynch | | | August-2020 | | | | USD | | | | 1.217 | | | | (85,895 | ) | | | EUR | | | | 798,120 | | | | (63,360 | ) | | | 22,535 | |
USD versus BRL | | | Call | | | Barclays Bank PLC | | | March-2018 | | | | BRL | | | | 3.750 | | | | (1,459 | ) | | | USD | | | | 300,000 | | | | (1,839 | ) | | | (380 | ) |
USD versus BRL | | | Call | | | Morgan Stanley Capital
Services LLC | | | March-2018 | | | | BRL | | | | 3.750 | | | | (6,085 | ) | | | USD | | | | 263,000 | | | | (1,612 | ) | | | 4,473 | |
Subtotal — Over-The-Counter Foreign Currency Call Options Written | | | | | | | | (2,435,090 | ) | | | | | | | | | | | (2,023,621 | ) | | | 411,469 | |
EUR versus USD | | | Put | | | Barclays Bank PLC | | | June-2021 | | | | USD | | | | 1.175 | | | | (51,880 | ) | | | EUR | | | | 562,501 | | | | (21,694 | ) | | | 30,186 | |
EUR versus USD | | | Put | | | Citigroup Global Markets Inc. | | | June-2021 | | | | USD | | | | 1.175 | | | | (59,017 | ) | | | EUR | | | | 567,334 | | | | (21,881 | ) | | | 37,136 | |
EUR versus USD | | | Put | | | Citigroup Global Markets Inc. | | | June-2021 | | | | USD | | | | 1.189 | | | | (67,932 | ) | | | EUR | | | | 632,455 | | | | (27,139 | ) | | | 40,793 | |
EUR versus USD | | | Put | | | Citigroup Global Markets Inc. | | | June-2021 | | | | USD | | | | 1.284 | | | | (9,707 | ) | | | EUR | | | | 112,906 | | | | (9,239 | ) | | | 468 | |
EUR versus USD | | | Put | | | Goldman Sachs International | | | November-2019 | | | | USD | | | | 1.227 | | | | (161,037 | ) | | | EUR | | | | 2,792,791 | | | | (147,771 | ) | | | 13,266 | |
EUR versus USD | | | Put | | | Goldman Sachs International | | | February-2020 | | | | USD | | | | 1.234 | | | | (102,489 | ) | | | EUR | | | | 1,659,309 | | | | (93,708 | ) | | | 8,781 | |
EUR versus USD | | | Put | | | Goldman Sachs International | | | May-2020 | | | | USD | | | | 1.240 | | | | (171,527 | ) | | | EUR | | | | 2,609,579 | | | | (156,210 | ) | | | 15,317 | |
EUR versus USD | | | Put | | | Goldman Sachs International | | | August-2020 | | | | USD | | | | 1.200 | | | | (151,201 | ) | | | EUR | | | | 1,348,907 | | | | (57,998 | ) | | | 93,203 | |
EUR versus USD | | | Put | | | Goldman Sachs International | | | June-2021 | | | | USD | | | | 1.177 | | | | (58,344 | ) | | | EUR | | | | 530,238 | | | | (20,680 | ) | | | 37,664 | |
EUR versus USD | | | Put | | | Goldman Sachs International | | | June-2021 | | | | USD | | | | 1.228 | | | | (134,703 | ) | | | EUR | | | | 1,684,483 | | | | (95,249 | ) | | | 39,454 | |
EUR versus USD | | | Put | | | J.P. Morgan Chase Bank, N.A. | | | May-2020 | | | | USD | | | | 1.259 | | | | (49,987 | ) | | | EUR | | | | 795,507 | | | | (55,281 | ) | | | (5,294 | ) |
EUR versus USD | | | Put | | | J.P. Morgan Chase Bank, N.A. | | | June-2021 | | | | USD | | | | 1.281 | | | | (29,802 | ) | | | EUR | | | | 379,616 | | | | (30,486 | ) | | | (684 | ) |
EUR versus USD | | | Put | | | Morgan Stanley Capital
Services LLC | | | May-2020 | | | | USD | | | | 1.251 | | | | (112,376 | ) | | | EUR | | | | 1,759,196 | | | | (114,668 | ) | | | (2,292 | ) |
EUR versus USD | | | Put | | | Morgan Stanley Capital
Services LLC | | | May-2020 | | | | USD | | | | 1.257 | | | | (54,393 | ) | | | EUR | | | | 879,599 | | | | (59,938 | ) | | | (5,545 | ) |
See accompanying Notes to Consolidated Financial Statements which are an integral part of the financial statements.
30 Invesco Global Targeted Returns Fund
| | | | | | | | | | | | | | | | | | | | | | | | | | | | | | | | | | | | | | |
| Open Over-The-Counter Foreign Currency Options Written—(continued) | |
| Description | | Type of
Contract | | | Counterparty | | Expiration
Date | | | Exercise
Price | | | Premiums
Received | | | Notional
Value | | | Value | | | Unrealized
Appreciation
(Depreciation) | |
EUR versus USD | | | Put | | | Morgan Stanley Capital
Services LLC | | | May-2020 | | | | USD | | | | 1.259 | | | $ | (54,773 | ) | | | EUR | | | | 879,599 | | | $ | (61,125 | ) | | $ | (6,352 | ) |
USD versus JPY | | | Put | | | Barclays Bank PLC | | | January-2018 | | | | JPY | | | | 113.500 | | | | (27,424 | ) | | | USD | | | | 709,000 | | | | (11,514 | ) | | | 15,910 | |
USD versus JPY | | | Put | | | Goldman Sachs International | | | January-2018 | | | | JPY | | | | 113.500 | | | | (152,738 | ) | | | USD | | | | 3,638,499 | | | | (59,089 | ) | | | 93,649 | |
USD versus JPY | | | Put | | | UBS | | | January-2018 | | | | JPY | | | | 113.500 | | | | (67,234 | ) | | | USD | | | | 1,838,000 | | | | (29,849 | ) | | | 37,385 | |
USD versus KRW | | | Put | | | Goldman Sachs International | | | January-2018 | | | | KRW | | | | 1,190.000 | | | | (53,603 | ) | | | USD | | | | 1,366,372 | | | | (93,136 | ) | | | (39,533 | ) |
USD versus KRW | | | Put | | | Goldman Sachs International | | | January-2018 | | | | KRW | | | | 1,250.000 | | | | (409,404 | ) | | | USD | | | | 5,702,000 | | | | (682,540 | ) | | | (273,136 | ) |
Subtotal — Over-The-Counter Foreign Currency Put Options Written | | | | | | | | | | | | (1,979,571 | ) | | | | | | | | | | | (1,849,195 | ) | | | 130,376 | |
Total — Foreign Currency Options Written — Currency Risk | | | | | | | $ | (4,414,661 | ) | | | | | | | | | | $ | (3,872,816 | ) | | $ | 541,845 | |
Total — Options Written | | | | | | | $ | (6,516,533 | ) | | | | | | | | | | $ | (4,942,918 | ) | | $ | 1,573,615 | |
| | | | | | | | | | | | | | | | | | | | |
| Open Futures Contracts(n) | |
| Long Futures Contracts | | Number of
Contracts | | | Expiration
Month | | | Notional
Value | | | Value | | | Unrealized
Appreciation
(Depreciation) | |
CAA Index | | | 388 | | | | December-2017 | | | $ | 3,062,173 | | | $ | 178,896 | | | $ | 178,896 | |
CAC 40 Index | | | 184 | | | | November-2017 | | | | 11,792,003 | | | | 301,061 | | | | 301,061 | |
E-Mini S&P 500 Index | | | 6 | | | | December-2017 | | | | 771,810 | | | | 91,509 | | | | 91,509 | |
Mini MSCI Emerging Markets Index | | | 34 | | | | December-2017 | | | | 1,911,140 | | | | 48,522 | | | | 48,522 | |
MSCI Taiwan Index | | | 101 | | | | November-2017 | | | | 4,110,700 | | | | 33,901 | | | | 33,901 | |
Swiss Market Index | | | 108 | | | | December-2017 | | | | 10,006,455 | | | | 268,325 | | | | 268,325 | |
Subtotal — Equity Risk | | | | | | | | | | | | | | | 922,214 | | | | 922,214 | |
Euro-Buxl 30 Year Bonds | | | 2 | | | | December-2017 | | | | 387,026 | | | | 5,325 | | | | 5,325 | |
U.S. Treasury Long Bonds | | | 2 | | | | December-2017 | | | | 304,938 | | | | 438 | | | | 438 | |
U.S. Treasury Ultra Bonds | | | 82 | | | | December-2017 | | | | 13,512,063 | | | | (275,006 | ) | | | (275,006 | ) |
Subtotal — Interest Rate Risk | | | | | | | | | | | | | | | (269,243 | ) | | | (269,243 | ) |
Subtotal — Long Futures Contracts | | | | | | | | | | | | | | | 652,971 | | | | 652,971 | |
| | | | | |
| | | | | | | | | | | | | | | | | | | | |
Short Futures Contracts | | | | | | | | | | | | | | | | | | | | |
Bovespa Index | | | 115 | | | | December-2017 | | | | (2,631,786 | ) | | | 94,981 | | | | 94,981 | |
DAX Index | | | 30 | | | | December-2017 | | | | (11,551,731 | ) | | | (838,756 | ) | | | (838,756 | ) |
EURO STOXX 50 Index | | | 236 | | | | December-2017 | | | | (10,111,425 | ) | | | (647,533 | ) | | | (647,533 | ) |
E-Mini Russell 2000 Index | | | 133 | | | | December-2017 | | | | (9,992,955 | ) | | | (784,336 | ) | | | (784,336 | ) |
FTSE 100 Index | | | 123 | | | | December-2017 | | | | (12,201,387 | ) | | | (148,655 | ) | | | (148,655 | ) |
Hang Seng China Enterprises Index | | | 42 | | | | November-2017 | | | | (3,098,828 | ) | | | 33,186 | | | | 33,186 | |
Mexican Bolsa IPC Index | | | 87 | | | | December-2017 | | | | (2,210,691 | ) | | | 88,402 | | | | 88,402 | |
MSCI AC Asia ex Japan Index | | | 37 | | | | December-2017 | | | | (1,804,294 | ) | | | (88,046 | ) | | | (88,046 | ) |
Nikkei 225 Index | | | 9 | | | | December-2017 | | | | (869,008 | ) | | | (115,082 | ) | | | (115,082 | ) |
Russell UK Mid 150 Futures Index | | | 57 | | | | December-2017 | | | | (2,910,865 | ) | | | (101,230 | ) | | | (101,230 | ) |
Subtotal — Equity Risk | | | | | | | | | | | | | | | (2,507,069 | ) | | | (2,507,069 | ) |
Long Gilt | | | 8 | | | | December-2017 | | | | (1,321,280 | ) | | | 14,913 | | | | 14,913 | |
U.S. Treasury 2 Year Notes | | | 8 | | | | December-2017 | | | | (1,722,875 | ) | | | 0 | | | | 0 | |
U.S. Treasury 10 Year Bonds | | | 9 | | | | December-2017 | | | | (1,124,438 | ) | | | 109 | | | | 109 | |
Subtotal — Interest Rate Risk | | | | | | | | | | | | | | | 15,022 | | | | 15,022 | |
Subtotal — Short Futures Contracts | | | | | | | | | | | | | | | (2,492,047 | ) | | | (2,492,047 | ) |
Total — Futures Contracts | | | | | | | | | | | | | | $ | (1,839,076 | ) | | $ | (1,839,076 | ) |
| (n) | Futures contracts collateralized by $4,456,843 cash held with Bank of America Merrill Lynch, the futures commission merchant. |
See accompanying Notes to Consolidated Financial Statements which are an integral part of the financial statements.
31 Invesco Global Targeted Returns Fund
| | | | | | | | | | | | | | | | | | | | | | | | | | | | | | | | | | | | | | | | |
| Open Centrally Cleared Credit Default Swap Agreements(o) | |
| Reference Entity | | Buy/Sell
Protection | | | (Pay)/ Receive
Fixed
Rate | | | Payment
Frequency | | | Maturity
Date | | | Implied
Credit
Spread(p) | | | Notional Value | | | Upfront
Payments
Paid
(Received) | | | Value | | | Unrealized
Appreciation
(Depreciation)(q) | |
Markit CDX North America Investment Grade Index, Series 29, Version 1 | | | Sell | | | | 1.00 | % | | | Quarterly | | | | 12/20/2022 | | | | 0.52 | % | | | USD | | | | 735,000 | | | $ | 16,915 | | | $ | 17,000 | | | $ | 85 | |
Markit iTraxx Europe Index, Series 28, Version 1 | | | Sell | | | | 1.00 | | | | Quarterly | | | | 12/20/2022 | | | | 0.50 | | | | EUR | | | | 2,040,000 | | | | 43,672 | | | | 60,560 | | | | 16,888 | |
Markit iTraxx Europe Index, Series 27, Version 1 | | | Sell | | | | 1.00 | | | | Quarterly | | | | 06/20/2022 | | | | 0.42 | | | | EUR | | | | 35,000 | | | | 807 | | | | 1,102 | | | | 295 | |
Subtotal — Appreciation | | | | | | | | | | | | | | | | | | | | | | | | | | | | | | | 61,394 | | | | 78,662 | | | | 17,268 | |
Markit CDX North America Investment Grade Index, Series 29, Version 1 | | | Buy | | | | (1.00 | ) | | | Quarterly | | | | 12/20/2022 | | | | 0.52 | | | | USD | | | | 11,375,000 | | | | (221,428 | ) | | | (263,093 | ) | | | (41,665 | ) |
Markit iTraxx Europe Crossover Index, Series 28, Version 1 | | | Buy | | | | (5.00 | ) | | | Quarterly | | | | 12/20/2022 | | | | 2.25 | | | | EUR | | | | 675,000 | | | | (93,326 | ) | | | (102,246 | ) | | | (8,920 | ) |
Markit iTraxx Europe Index, Series 28, Version 1 | | | Buy | | | | (1.00 | ) | | | Quarterly | | | | 12/20/2022 | | | | 0.50 | | | | EUR | | | | 300,000 | | | | (7,928 | ) | | | (8,906 | ) | | | (978 | ) |
Markit iTraxx Europe Index, Series 27, Version 1 | | | Buy | | | | (1.00 | ) | | | Quarterly | | | | 06/20/2022 | | | | 0.42 | | | | EUR | | | | 21,358,000 | | | | (343,977 | ) | | | (672,529 | ) | | | (328,552 | ) |
Subtotal — Depreciation | | | | | | | | | | | | | | | | | | | | | | | | | | | | | | | (666,659 | ) | | | (1,046,774 | ) | | | (380,115 | ) |
Total Credit Default Swap Agreements — Credit Risk | | | | | | | | | | | | | | | $ | (605,265 | ) | | $ | (968,112 | ) | | $ | (362,847 | ) |
| (p) | Implied credit spreads represent the current level as of October 31, 2017 at which protection could be bought or sold given the terms of the existing credit default swap contract and serve as an indicator of the current status of the payment/performance risk of the credit default swap contract. An implied credit spread that has widened or increased since entry into the initial contract may indicate a deteriorating credit profile and increased risk of default for the reference entity. A declining or narrowing spread may indicate an improving credit profile or decreased risk of default for the reference entity. Alternatively, credit spreads may increase or decrease reflecting the general tolerance for risk in the credit spread markets generally. |
| (q) | The daily variation margin receivable (payable) at period end is recorded in the Consolidated Statement of Assets and Liabilities. |
| | | | | | | | | | | | | | | | | | | | | | | | | | | | | | | | | | |
| Open Centrally Cleared Interest Rate Swap Agreements(o) | |
Pay/Receive
Floating Rate | | Floating Rate Index | | Payment
Frequency | | (Pay)/Receive
Fixed Rate | | | Payment
Frequency | | Maturity
Date | | | Notional
Value | | | Upfront
Payments
Paid
(Received) | | | Value | | | Unrealized
Appreciation
(Depreciation)(r) | |
Pay | | 3 Month CDOR | | Semi-Annually | | | 2.140 | % | | Semi-Annually | | | 09/18/2022 | | | | CAD | | | | 509,225 | | | $ | — | | | $ | 2,421 | | | $ | 2,421 | |
Pay | | 3 Month CDOR | | Semi-Annually | | | 2.145 | | | Semi-Annually | | | 09/15/2022 | | | | CAD | | | | 1,261,963 | | | | — | | | | 6,255 | | | | 6,255 | |
Pay | | 3 Month CDOR | | Semi-Annually | | | 2.150 | | | Semi-Annually | | | 09/15/2022 | | | | CAD | | | | 1,261,963 | | | | — | | | | 6,496 | | | | 6,496 | |
Pay | | 3 Month CDOR | | Semi-Annually | | | 2.153 | | | Semi-Annually | | | 09/15/2022 | | | | CAD | | | | 1,261,962 | | | | — | | | | 6,616 | | | | 6,616 | |
Pay | | 3 Month CDOR | | Semi-Annually | | | 2.155 | | | Semi-Annually | | | 09/18/2022 | | | | CAD | | | | 1,261,963 | | | | — | | | | 6,725 | | | | 6,725 | |
Pay | | 3 Month CDOR | | Semi-Annually | | | 2.160 | | | Semi-Annually | | | 09/18/2022 | | | | CAD | | | | 1,261,962 | | | | — | | | | 6,966 | | | | 6,966 | |
Pay | | 3 Month CDOR | | Semi-Annually | | | 2.163 | | | Semi-Annually | | | 09/18/2022 | | | | CAD | | | | 1,261,962 | | | | — | | | | 7,087 | | | | 7,087 | |
Pay | | 3 Month CDOR | | Semi-Annually | | | 2.169 | | | Semi-Annually | | | 12/20/2022 | | | | CAD | | | | 1,245,463 | | | | — | | | | 5,901 | | | | 5,901 | |
Pay | | 3 Month CDOR | | Semi-Annually | | | 2.170 | | | Semi-Annually | | | 12/20/2022 | | | | CAD | | | | 1,245,462 | | | | — | | | | 5,949 | | | | 5,949 | |
Pay | | 3 Month CDOR | | Semi-Annually | | | 2.174 | | | Semi-Annually | | | 12/20/2022 | | | | CAD | | | | 1,245,463 | | | | — | | | | 6,118 | | | | 6,118 | |
Pay | | 3 Month CDOR | | Semi-Annually | | | 2.175 | | | Semi-Annually | | | 12/20/2022 | | | | CAD | | | | 2,878,150 | | | | — | | | | 14,322 | | | | 14,322 | |
Pay | | 3 Month CDOR | | Semi-Annually | | | 2.190 | | | Semi-Annually | | | 12/20/2022 | | | | CAD | | | | 1,245,462 | | | | — | | | | 6,916 | | | | 6,916 | |
Pay | | 3 Month STIBOR | | Quarterly | | | 0.478 | | | Annually | | | 12/20/2022 | | | | SEK | | | | 12,413,000 | | | | — | | | | 4,235 | | | | 4,235 | |
Pay | | 3 Month STIBOR | | Quarterly | | | 2.305 | | | Annually | | | 07/21/2025 | | | | SEK | | | | 18,514,281 | | | | — | | | | 99,517 | | | | 99,517 | |
Pay | | 3 Month STIBOR | | Quarterly | | | 2.275 | | | Annually | | | 10/02/2025 | | | | SEK | | | | 10,606,000 | | | | — | | | | 51,429 | | | | 51,429 | |
Pay | | 3 Month STIBOR | | Quarterly | | | 2.373 | | | Annually | | | 11/24/2025 | | | | SEK | | | | 13,133,000 | | | | — | | | | 67,505 | | | | 67,505 | |
Pay | | 3 Month STIBOR | | Quarterly | | | 2.470 | | | Annually | | | 11/17/2025 | | | | SEK | | | | 14,717,000 | | | | — | | | | 84,127 | | | | 84,127 | |
Pay | | 3 Month STIBOR | | Quarterly | | | 2.534 | | | Annually | | | 12/17/2025 | | | | SEK | | | | 36,231,000 | | | | — | | | | 215,301 | | | | 215,301 | |
Pay | | 3 Month STIBOR | | Quarterly | | | 2.313 | | | Annually | | | 01/19/2026 | | | | SEK | | | | 21,817,000 | | | | — | | | | 98,842 | | | | 98,842 | |
Pay | | 3 Month STIBOR | | Quarterly | | | 2.655 | | | Annually | | | 01/04/2026 | | | | SEK | | | | 34,380,000 | | | | — | | | | 224,894 | | | | 224,894 | |
Pay | | 3 Month STIBOR | | Quarterly | | | 2.060 | | | Annually | | | 03/10/2026 | | | | SEK | | | | 11,083,000 | | | | — | | | | 31,640 | | | | 31,640 | |
Pay | | 3 Month STIBOR | | Quarterly | | | 2.033 | | | Annually | | | 06/16/2026 | | | | SEK | | | | 15,348,000 | | | | — | | | | 33,948 | | | | 33,948 | |
Pay | | 3 Month STIBOR | | Quarterly | | | 2.053 | | | Annually | | | 06/16/2026 | | | | SEK | | | | 15,954,000 | | | | — | | | | 37,124 | | | | 37,124 | |
Pay | | 3 Month STIBOR | | Quarterly | | | 1.927 | | | Annually | | | 06/15/2027 | | | | SEK | | | | 5,530,800 | | | | — | | | | 144 | | | | 144 | |
See accompanying Notes to Consolidated Financial Statements which are an integral part of the financial statements.
32 Invesco Global Targeted Returns Fund
| | | | | | | | | | | | | | | | | | | | | | | | | | | | | | | | | | | | |
| Open Centrally Cleared Interest Rate Swap Agreements(o)—(continued) | |
Pay/Receive
Floating Rate | | Floating Rate Index | | | Payment
Frequency | | (Pay)/Receive
Fixed Rate | | | Payment
Frequency | | Maturity
Date | | | Notional
Value | | | Upfront
Payments
Paid
(Received) | | | Value | | | Unrealized
Appreciation
(Depreciation)(r) | |
Pay | | | 3 Month STIBOR | | | Quarterly | | | 1.948 | % | | Annually | | | 06/15/2027 | | | | SEK | | | | 3,687,200 | | | $ | — | | | $ | 506 | | | $ | 506 | |
Pay | | | 3 Month STIBOR | | | Quarterly | | | 1.968 | | | Annually | | | 06/15/2027 | | | | SEK | | | | 16,029,000 | | | | — | | | | 3,993 | | | | 3,993 | |
Pay | | | 3 Month USD LIBOR | | | Quarterly | | | 2.584 | | | Semi-Annually | | | 03/15/2027 | | | | USD | | | | 4,739,000 | | | | — | | | | 95,553 | | | | 95,553 | |
Pay | | | 3 Month USD LIBOR | | | Quarterly | | | 2.417 | | | Semi-Annually | | | 12/20/2027 | | | | USD | | | | 823,000 | | | | — | | | | 1,467 | | | | 1,467 | |
Pay | | | 3 Month USD LIBOR | | | Quarterly | | | 2.644 | | | Semi-Annually | | | 11/15/2043 | | | | USD | | | | 1,118,000 | | | | — | | | | 2,409 | | | | 2,409 | |
Pay | | | 3 Month USD LIBOR | | | Quarterly | | | 2.649 | | | Semi-Annually | | | 11/15/2043 | | | | USD | | | | 393,000 | | | | — | | | | 2,025 | | | | 2,025 | |
Pay | | | 3 Month USD LIBOR | | | Quarterly | | | 2.677 | | | Semi-Annually | | | 11/15/2043 | | | | USD | | | | 762,000 | | | | — | | | | 8,126 | | | | 8,126 | |
Pay | | | 3 Month USD LIBOR | | | Quarterly | | | 2.788 | | | Semi-Annually | | | 12/15/2047 | | | | USD | | | | 400,000 | | | | — | | | | 426 | | | | 426 | |
Pay | | | 6 Month AUD BBSW | | | Semi-Annually | | | 2.942 | | | Semi-Annually | | | 12/21/2026 | | | | AUD | | | | 3,891,534 | | | | — | | | | 36,244 | | | | 36,244 | |
Pay | | | 6 Month AUD BBSW | | | Semi-Annually | | | 2.943 | | | Semi-Annually | | | 12/21/2026 | | | | AUD | | | | 3,113,633 | | | | — | | | | 29,141 | | | | 29,141 | |
Pay | | | 6 Month AUD BBSW | | | Semi-Annually | | | 2.965 | | | Semi-Annually | | | 12/21/2026 | | | | AUD | | | | 3,113,633 | | | | — | | | | 33,381 | | | | 33,381 | |
Pay | | | 6 Month AUD BBSW | | | Semi-Annually | | | 2.970 | | | Semi-Annually | | | 12/21/2026 | | | | AUD | | | | 1,659,717 | | | | — | | | | 18,296 | | | | 18,296 | |
Pay | | | 6 Month AUD BBSW | | | Semi-Annually | | | 3.052 | | | Semi-Annually | | | 12/21/2026 | | | | AUD | | | | 3,080,074 | | | | — | | | | 49,185 | | | | 49,185 | |
Pay | | | 6 Month AUD BBSW | | | Semi-Annually | | | 3.091 | | | Semi-Annually | | | 12/21/2026 | | | | AUD | | | | 1,270,417 | | | | — | | | | 23,240 | | | | 23,240 | |
Pay | | | 6 Month AUD BBSW | | | Semi-Annually | | | 3.135 | | | Semi-Annually | | | 12/21/2026 | | | | AUD | | | | 3,266,992 | | | | — | | | | 68,423 | | | | 68,423 | |
Pay | | | 6 Month AUD BBSW | | | Semi-Annually | | | 2.889 | | | Semi-Annually | | | 03/15/2027 | | | | AUD | | | | 1,205,040 | | | | — | | | | 6,372 | | | | 6,372 | |
Pay | | | 6 Month AUD BBSW | | | Semi-Annually | | | 2.905 | | | Semi-Annually | | | 03/15/2027 | | | | AUD | | | | 2,190,995 | | | | — | | | | 13,854 | | | | 13,854 | |
Pay | | | 6 Month AUD BBSW | | | Semi-Annually | | | 2.913 | | | Semi-Annually | | | 03/15/2027 | | | | AUD | | | | 1,755,322 | | | | — | | | | 11,939 | | | | 11,939 | |
Pay | | | 6 Month AUD BBSW | | | Semi-Annually | | | 2.914 | | | Semi-Annually | | | 03/15/2027 | | | | AUD | | | | 1,755,322 | | | | — | | | | 12,078 | | | | 12,078 | |
Pay | | | 6 Month AUD BBSW | | | Semi-Annually | | | 2.918 | | | Semi-Annually | | | 03/15/2027 | | | | AUD | | | | 1,755,321 | | | | — | | | | 12,498 | | | | 12,498 | |
Pay | | | 6 Month AUD BBSW | | | Semi-Annually | | | 2.884 | | | Semi-Annually | | | 06/21/2027 | | | | AUD | | | | 664,000 | | | | — | | | | 2,644 | | | | 2,644 | |
Pay | | | 6 Month AUD BBSW | | | Semi-Annually | | | 2.926 | | | Semi-Annually | | | 12/20/2027 | | | | AUD | | | | 1,369,340 | | | | — | | | | 5,951 | | | | 5,951 | |
Pay | | | 6 Month AUD BBSW | | | Semi-Annually | | | 2.930 | | | Semi-Annually | | | 12/20/2027 | | | | AUD | | | | 2,738,320 | | | | — | | | | 12,588 | | | | 12,588 | |
Pay | | | 6 Month AUD BBSW | | | Semi-Annually | | | 2.932 | | | Semi-Annually | | | 12/20/2027 | | | | AUD | | | | 1,369,340 | | | | — | | | | 6,525 | | | | 6,525 | |
Pay | | | 6 Month EUR LIBOR | | | Semi-Annually | | | 1.442 | | | Annually | | | 06/15/2027 | | | | EUR | | | | 1,443,000 | | | | — | | | | 2,188 | | | | 2,188 | |
Pay | | | 6 Month EUR LIBOR | | | Semi-Annually | | | 1.498 | | | Annually | | | 09/21/2027 | | | | EUR | | | | 2,041,000 | | | | — | | | | 2,134 | | | | 2,134 | |
Pay | | | 6 Month EUR LIBOR | | | Semi-Annually | | | 1.585 | | | Annually | | | 12/21/2027 | | | | EUR | | | | 1,596,000 | | | | — | | | | 4,679 | | | | 4,679 | |
Pay | | | 6 Month EUR LIBOR | | | Semi-Annually | | | 1.642 | | | Annually | | | 12/21/2027 | | | | EUR | | | | 1,095,000 | | | | — | | | | 6,723 | | | | 6,723 | |
Pay | | | 6 Month EUR LIBOR | | | Semi-Annually | | | 1.937 | | | Annually | | | 12/15/2047 | | | | EUR | | | | 179,000 | | | | — | | | | 127 | | | | 127 | |
Pay | | | 6 Month GBP LIBOR | | | Semi-Annually | | | 1.634 | | | Semi-Annually | | | 09/20/2047 | | | | GBP | | | | 626,383 | | | | — | | | | 7,845 | | | | 7,845 | |
Pay | | | 6 Month GBP LIBOR | | | Semi-Annually | | | 1.635 | | | Semi-Annually | | | 09/20/2047 | | | | GBP | | | | 917,042 | | | | — | | | | 11,816 | | | | 11,816 | |
Pay | | | 6 Month GBP LIBOR | | | Semi-Annually | | | 1.669 | | | Semi-Annually | | | 09/20/2047 | | | | GBP | | | | 862,575 | | | | — | | | | 20,502 | | | | 20,502 | |
Pay | | | 6 Month GBP LIBOR | | | Semi-Annually | | | 1.670 | | | Semi-Annually | | | 09/15/2047 | | | | GBP | | | | 538,000 | | | | — | | | | 647 | | | | 647 | |
Pay | | | 6 Month GBP LIBOR | | | Semi-Annually | | | 1.622 | | | Semi-Annually | | | 12/20/2047 | | | | GBP | | | | 291,000 | | | | — | | | | 2,535 | | | | 2,535 | |
Pay | | | 6 Month GBP LIBOR | | | Semi-Annually | | | 1.661 | | | Semi-Annually | | | 12/15/2047 | | | | GBP | | | | 643,000 | | | | — | | | | 763 | | | | 763 | |
Pay | | | 6 Month GBP LIBOR | | | Semi-Annually | | | 1.676 | | | Semi-Annually | | | 12/20/2047 | | | | GBP | | | | 230,000 | | | | — | | | | 6,110 | | | | 6,110 | |
Receive | | | 3 Month STIBOR | | | Quarterly | | | 0.036 | | | Annually | | | 09/21/2021 | | | | SEK | | | | 10,167,000 | | | | — | | | | 7,709 | | | | 7,709 | |
Receive | | | 3 Month STIBOR | | | Quarterly | | | 0.020 | | | Annually | | | 09/21/2021 | | | | SEK | | | | 11,493,000 | | | | — | | | | 5,688 | | | | 5,688 | |
Receive | | | 3 Month STIBOR | | | Quarterly | | | 0.020 | | | Annually | | | 12/21/2021 | | | | SEK | | | | 16,053,000 | | | | — | | | | 12,406 | | | | 12,406 | |
Receive | | | 3 Month USD LIBOR | | | Quarterly | | | 2.333 | | | Semi-Annually | | | 12/21/2026 | | | | USD | | | | 4,390,500 | | | | — | | | | 1,687 | | | | 1,687 | |
Receive | | | 3 Month USD LIBOR | | | Quarterly | | | 2.271 | | | Semi-Annually | | | 03/15/2027 | | | | USD | | | | 776,000 | | | | — | | | | 5,103 | | | | 5,103 | |
Receive | | | 3 Month USD LIBOR | | | Quarterly | | | 2.299 | | | Semi-Annually | | | 03/15/2027 | | | | USD | | | | 1,130,000 | | | | — | | | | 4,759 | | | | 4,759 | |
Receive | | | 3 Month USD LIBOR | | | Quarterly | | | 2.311 | | | Semi-Annually | | | 03/15/2027 | | | | USD | | | | 1,408,000 | | | | — | | | | 4,488 | | | | 4,488 | |
Receive | | | 3 Month USD LIBOR | | | Quarterly | | | 2.315 | | | Semi-Annually | | | 03/15/2027 | | | | USD | | | | 1,130,000 | | | | — | | | | 3,216 | | | | 3,216 | |
Receive | | | 3 Month USD LIBOR | | | Quarterly | | | 2.317 | | | Semi-Annually | | | 03/15/2027 | | | | USD | | | | 1,130,000 | | | | — | | | | 3,023 | | | | 3,023 | |
Receive | | | 3 Month USD LIBOR | | | Quarterly | | | 2.310 | | | Semi-Annually | | | 06/21/2027 | | | | USD | | | | 204,000 | | | | — | | | | 901 | | | | 901 | |
Receive | | | 3 Month USD LIBOR | | | Quarterly | | | 2.309 | | | Semi-Annually | | | 10/19/2027 | | | | USD | | | | 700,456 | | | | — | | | | 4,155 | | | | 4,155 | |
Receive | | | 3 Month USD LIBOR | | | Quarterly | | | 2.332 | | | Semi-Annually | | | 12/20/2027 | | | | USD | | | | 700,456 | | | | — | | | | 4,085 | | | | 4,085 | |
Receive | | | 3 Month USD LIBOR | | | Quarterly | | | 2.334 | | | Semi-Annually | | | 12/20/2027 | | | | USD | | | | 350,316 | | | | — | | | | 2,002 | | | | 2,002 | |
See accompanying Notes to Consolidated Financial Statements which are an integral part of the financial statements.
33 Invesco Global Targeted Returns Fund
| | | | | | | | | | | | | | | | | | | | | | | | | | | | | | | | | | | | | | | | |
| Open Centrally Cleared Interest Rate Swap Agreements(o)—(continued) | |
Pay/Receive
Floating Rate | | Floating Rate Index | | | Payment
Frequency | | | (Pay)/Receive
Fixed Rate | | | Payment
Frequency | | | Maturity
Date | | | Notional
Value | | | Upfront
Payments
Paid
(Received) | | | Value | | | Unrealized
Appreciation
(Depreciation)(r) | |
Receive | | | 3 Month USD LIBOR | | | | Quarterly | | | | 2.337 | % | | | Semi-Annually | | | | 12/20/2027 | | | | USD | | | | 350,140 | | | $ | — | | | $ | 1,906 | | | $ | 1,906 | |
Receive | | | 3 Month USD LIBOR | | | | Quarterly | | | | 2.338 | | | | Semi-Annually | | | | 12/20/2027 | | | | USD | | | | 350,316 | | | | — | | | | 1,860 | | | | 1,860 | |
Receive | | | 3 Month USD LIBOR | | | | Quarterly | | | | 2.341 | | | | Semi-Annually | | | | 12/20/2027 | | | | USD | | | | 350,316 | | | | — | | | | 1,765 | | | | 1,765 | |
Receive | | | 3 Month USD LIBOR | | | | Quarterly | | | | 2.453 | | | | Semi-Annually | | | | 11/15/2043 | | | | USD | | | | 1,670,208 | | | | — | | | | 56,193 | | | | 56,193 | |
Receive | | | 3 Month USD LIBOR | | | | Quarterly | | | | 2.458 | | | | Semi-Annually | | | | 11/15/2043 | | | | USD | | | | 4,124,697 | | | | — | | | | 134,793 | | | | 134,793 | |
Receive | | | 3 Month USD LIBOR | | | | Quarterly | | | | 2.460 | | | | Semi-Annually | | | | 11/15/2043 | | | | USD | | | | 4,979,453 | | | | — | | | | 160,012 | | | | 160,012 | |
Receive | | | 3 Month USD LIBOR | | | | Quarterly | | | | 2.475 | | | | Semi-Annually | | | | 11/15/2043 | | | | USD | | | | 2,856,567 | | | | — | | | | 83,282 | | | | 83,282 | |
Receive | | | 3 Month USD LIBOR | | | | Quarterly | | | | 2.494 | | | | Semi-Annually | | | | 11/15/2043 | | | | USD | | | | 910,000 | | | | — | | | | 23,063 | | | | 23,063 | |
Receive | | | 3 Month USD LIBOR | | | | Quarterly | | | | 2.555 | | | | Semi-Annually | | | | 11/15/2043 | | | | USD | | | | 1,769,000 | | | | — | | | | 23,940 | | | | 23,940 | |
Receive | | | 3 Month USD LIBOR | | | | Quarterly | | | | 2.558 | | | | Semi-Annually | | | | 11/15/2043 | | | | USD | | | | 817,000 | | | | — | | | | 10,513 | | | | 10,513 | |
Receive | | | 3 Month USD LIBOR | | | | Quarterly | | | | 2.671 | | | | Semi-Annually | | | | 09/15/2047 | | | | USD | | | | 1,083,000 | | | | — | | | | 10,538 | | | | 10,538 | |
Receive | | | 3 Month USD LIBOR | | | | Quarterly | | | | 2.678 | | | | Semi-Annually | | | | 09/15/2047 | | | | USD | | | | 428,000 | | | | — | | | | 3,903 | | | | 3,903 | |
Receive | | | 6 Month AUD BBSW | | | | Semi-Annually | | | | 2.653 | | | | Semi-Annually | | | | 06/21/2027 | | | | AUD | | | | 1,353,000 | | | | — | | | | 14,732 | | | | 14,732 | |
Receive | | | 6 Month AUD BBSW | | | | Semi-Annually | | | | 2.818 | | | | Semi-Annually | | | | 09/20/2027 | | | | AUD | | | | 670,000 | | | | — | | | | 942 | | | | 942 | |
Receive | | | 6 Month EUR LIBOR | | | | Semi-Annually | | | | 1.370 | | | | Annually | | | | 06/15/2027 | | | | EUR | | | | 878,000 | | | | — | | | | 2,032 | | | | 2,032 | |
Receive | | | 6 Month EUR LIBOR | | | | Semi-Annually | | | | 1.414 | | | | Annually | | | | 06/15/2027 | | | | EUR | | | | 4,151,500 | | | | — | | | | 418 | | | | 418 | |
Receive | | | 6 Month EUR LIBOR | | | | Semi-Annually | | | | 1.407 | | | | Annually | | | | 09/21/2027 | | | | EUR | | | | 169,000 | | | | — | | | | 625 | | | | 625 | |
Receive | | | 6 Month GBP LIBOR | | | | Semi-Annually | | | | 1.144 | | | | Semi-Annually | | | | 09/21/2046 | | | | GBP | | | | 234,000 | | | | — | | | | 31,596 | | | | 31,596 | |
Receive | | | 6 Month GBP LIBOR | | | | Semi-Annually | | | | 1.615 | | | | Semi-Annually | | | | 09/17/2046 | | | | GBP | | | | 4,229,880 | | | | — | | | | 55,172 | | | | 55,172 | |
Receive | | | 6 Month GBP LIBOR | | | | Semi-Annually | | | | 1.693 | | | | Semi-Annually | | | | 09/17/2046 | | | | GBP | | | | 1,178,120 | | | | — | | | | 2,230 | | | | 2,230 | |
Receive | | | 6 Month GBP LIBOR | | | | Semi-Annually | | | | 1.004 | | | | Semi-Annually | | | | 12/21/2046 | | | | GBP | | | | 493,000 | | | | — | | | | 88,884 | | | | 88,884 | |
Receive | | | 6 Month GBP LIBOR | | | | Semi-Annually | | | | 1.210 | | | | Semi-Annually | | | | 12/21/2046 | | | | GBP | | | | 758,000 | | | | — | | | | 89,272 | | | | 89,272 | |
Receive | | | 6 Month GBP LIBOR | | | | Semi-Annually | | | | 1.294 | | | | Semi-Annually | | | | 12/21/2046 | | | | GBP | | | | 517,000 | | | | — | | | | 48,261 | | | | 48,261 | |
Receive | | | 6 Month GBP LIBOR | | | | Semi-Annually | | | | 1.395 | | | | Semi-Annually | | | | 12/21/2046 | | | | GBP | | | | 220,000 | | | | — | | | | 14,043 | | | | 14,043 | |
Receive | | | 6 Month GBP LIBOR | | | | Semi-Annually | | | | 1.533 | | | | Semi-Annually | | | | 03/15/2047 | | | | GBP | | | | 1,237,709 | | | | — | | | | 27,451 | | | | 27,451 | |
Receive | | | 6 Month GBP LIBOR | | | | Semi-Annually | | | | 1.569 | | | | Semi-Annually | | | | 03/15/2047 | | | | GBP | | | | 1,028,291 | | | | — | | | | 11,889 | | | | 11,889 | |
Receive | | | 6 Month GBP LIBOR | | | | Semi-Annually | | | | 1.440 | | | | Semi-Annually | | | | 06/21/2047 | | | | GBP | | | | 643,000 | | | | — | | | | 31,852 | | | | 31,852 | |
Receive | | | 6 Month GBP LIBOR | | | | Semi-Annually | | | | 1.415 | | | | Semi-Annually | | | | 09/20/2047 | | | | GBP | | | | 240,000 | | | | — | | | | 13,706 | | | | 13,706 | |
Receive | | | 6 Month GBP LIBOR | | | | Semi-Annually | | | | 1.494 | | | | Semi-Annually | | | | 09/15/2047 | | | | GBP | | | | 86,000 | | | | — | | | | 2,078 | | | | 2,078 | |
Receive | | | 6 Month GBP LIBOR | | | | Semi-Annually | | | | 1.523 | | | | Semi-Annually | | | | 09/15/2047 | | | | GBP | | | | 589,211 | | | | — | | | | 11,821 | | | | 11,821 | |
Receive | | | 6 Month GBP LIBOR | | | | Semi-Annually | | | | 1.544 | | | | Semi-Annually | | | | 09/15/2047 | | | | GBP | | | | 1,206,492 | | | | — | | | | 20,606 | | | | 20,606 | |
Receive | | | 6 Month GBP LIBOR | | | | Semi-Annually | | | | 1.545 | | | | Semi-Annually | | | | 09/15/2047 | | | | GBP | | | | 566,313 | | | | — | | | | 9,566 | | | | 9,566 | |
Receive | | | 6 Month GBP LIBOR | | | | Semi-Annually | | | | 1.549 | | | | Semi-Annually | | | | 09/15/2047 | | | | GBP | | | | 1,206,492 | | | | — | | | | 19,786 | | | | 19,786 | |
Receive | | | 6 Month GBP LIBOR | | | | Semi-Annually | | | | 1.558 | | | | Semi-Annually | | | | 09/15/2047 | | | | GBP | | | | 1,206,492 | | | | — | | | | 18,203 | | | | 18,203 | |
Receive | | | 6 Month GBP LIBOR | | | | Semi-Annually | | | | 1.598 | | | | Semi-Annually | | | | 12/15/2047 | | | | GBP | | | | 570,000 | | | | — | | | | 4,544 | | | | 4,544 | |
Receive | | | 6 Month GBP LIBOR | | | | Semi-Annually | | | | 1.608 | | | | Semi-Annually | | | | 12/15/2047 | | | | GBP | | | | 571,000 | | | | — | | | | 3,685 | | | | 3,685 | |
Receive | | | 6 Month GBP LIBOR | | | | Semi-Annually | | | | 1.648 | | | | Semi-Annually | | | | 12/15/2047 | | | | GBP | | | | 586,000 | | | | — | | | | 421 | | | | 421 | |
Subtotal — Appreciation | | | | | | | | | | | | | | | | | | | | — | | | | 2,648,216 | | | | 2,648,216 | |
Pay | | | 28 Day MXN TIIE | | | | Monthly | | | | 6.925 | | | | Monthly | | | | 06/16/2021 | | | | MXN | | | | 1,500,000 | | | | — | | | | (174 | ) | | | (174 | ) |
Pay | | | 3 Month CDOR | | | | Semi-Annually | | | | 2.030 | | | | Semi-Annually | | | | 12/20/2022 | | | | CAD | | | | 351,536 | | | | — | | | | (91 | ) | | | (91 | ) |
Pay | | | 3 Month CDOR | | | | Semi-Annually | | | | 2.038 | | | | Semi-Annually | | | | 12/20/2022 | | | | CAD | | | | 1,282,813 | | | | — | | | | (240 | ) | | | (240 | ) |
Pay | | | 3 Month CDOR | | | | Semi-Annually | | | | 2.040 | | | | Semi-Annually | | | | 12/20/2022 | | | | CAD | | | | 1,282,814 | | | | — | | | | (139 | ) | | | (139 | ) |
Pay | | | 3 Month STIBOR | | | | Quarterly | | | | 1.327 | | | | Annually | | | | 06/16/2026 | | | | SEK | | | | 10,167,000 | | | | — | | | | (18,174 | ) | | | (18,174 | ) |
Pay | | | 3 Month STIBOR | | | | Quarterly | | | | 1.360 | | | | Annually | | | | 09/15/2026 | | | | SEK | | | | 15,350,000 | | | | — | | | | (30,181 | ) | | | (30,181 | ) |
Pay | | | 3 Month STIBOR | | | | Quarterly | | | | 1.560 | | | | Annually | | | | 09/15/2026 | | | | SEK | | | | 8,210,000 | | | | — | | | | (7,015 | ) | | | (7,015 | ) |
Pay | | | 3 Month STIBOR | | | | Quarterly | | | | 1.613 | | | | Annually | | | | 09/15/2026 | | | | SEK | | | | 16,053,000 | | | | — | | | | (9,589 | ) | | | (9,589 | ) |
Pay | | | 3 Month USD LIBOR | | | | Quarterly | | | | 2.347 | | | | Semi-Annually | | | | 03/15/2027 | | | | USD | | | | 616,000 | | | | — | | | | (28 | ) | | | (28 | ) |
Pay | | | 3 Month USD LIBOR | | | | Quarterly | | | | 2.147 | | | | Semi-Annually | | | | 06/21/2027 | | | | USD | | | | 770,000 | | | | — | | | | (14,401 | ) | | | (14,401 | ) |
Pay | | | 3 Month USD LIBOR | | | | Quarterly | | | | 2.248 | | | | Semi-Annually | | | | 06/21/2027 | | | | USD | | | | 1,102,000 | | | | — | | | | (10,828 | ) | | | (10,828 | ) |
See accompanying Notes to Consolidated Financial Statements which are an integral part of the financial statements.
34 Invesco Global Targeted Returns Fund
| | | | | | | | | | | | | | | | | | | | | | | | | | | | | | | | | | |
| Open Centrally Cleared Interest Rate Swap Agreements(o)—(continued) | |
Pay/Receive
Floating Rate | | Floating Rate Index | | Payment
Frequency | | (Pay)/Receive
Fixed Rate | | | Payment
Frequency | | Maturity
Date | | | Notional
Value | | | Upfront
Payments
Paid
(Received) | | | Value | | | Unrealized
Appreciation
(Depreciation)(r) | |
Pay | | 3 Month USD LIBOR | | Quarterly | | | 2.179 | % | | Semi-Annually | | | 09/20/2027 | | | | USD | | | | 363,000 | | | $ | — | | | $ | (6,245 | ) | | $ | (6,245 | ) |
Pay | | 3 Month USD LIBOR | | Quarterly | | | 2.449 | | | Semi-Annually | | | 11/15/2043 | | | | USD | | | | 796,000 | | | | — | | | | (27,408 | ) | | | (27,408 | ) |
Pay | | 3 Month USD LIBOR | | Quarterly | | | 2.469 | | | Semi-Annually | | | 11/15/2043 | | | | USD | | | | 313,000 | | | | — | | | | (9,518 | ) | | | (9,518 | ) |
Pay | | 3 Month USD LIBOR | | Quarterly | | | 2.475 | | | Semi-Annually | | | 11/15/2043 | | | | USD | | | | 2,341,000 | | | | — | | | | (68,361 | ) | | | (68,361 | ) |
Pay | | 3 Month USD LIBOR | | Quarterly | | | 2.453 | | | Semi-Annually | | | 03/24/2046 | | | | USD | | | | 4,233,688 | | | | — | | | | (137,571 | ) | | | (137,571 | ) |
Pay | | 3 Month USD LIBOR | | Quarterly | | | 2.625 | | | Semi-Annually | | | 04/28/2046 | | | | USD | | | | 574,000 | | | | — | | | | (9,357 | ) | | | (9,357 | ) |
Pay | | 3 Month USD LIBOR | | Quarterly | | | 2.510 | | | Semi-Annually | | | 06/18/2046 | | | | USD | | | | 491,000 | | | | — | | | | (13,121 | ) | | | (13,121 | ) |
Pay | | 3 Month USD LIBOR | | Quarterly | | | 2.155 | | | Semi-Annually | | | 09/17/2046 | | | | USD | | | | 751,000 | | | | — | | | | (44,255 | ) | | | (44,255 | ) |
Pay | | 3 Month USD LIBOR | | Quarterly | | | 2.163 | | | Semi-Annually | | | 09/17/2046 | | | | USD | | | | 1,123,000 | | | | — | | | | (65,349 | ) | | | (65,349 | ) |
Pay | | 3 Month USD LIBOR | | Quarterly | | | 2.623 | | | Semi-Annually | | | 06/16/2047 | | | | USD | | | | 376,000 | | | | — | | | | (5,472 | ) | | | (5,472 | ) |
Pay | | 3 Month USD LIBOR | | Quarterly | | | 2.713 | | | Semi-Annually | | | 06/16/2047 | | | | USD | | | | 959,000 | | | | — | | | | (6,144 | ) | | | (6,144 | ) |
Pay | | 3 Month USD LIBOR | | Quarterly | | | 2.591 | | | Semi-Annually | | | 09/15/2047 | | | | USD | | | | 131,000 | | | | — | | | | (2,226 | ) | | | (2,226 | ) |
Pay | | 3 Month USD LIBOR | | Quarterly | | | 2.691 | | | Semi-Annually | | | 12/15/2047 | | | | USD | | | | 515,531 | | | | — | | | | (3,890 | ) | | | (3,890 | ) |
Pay | | 3 Month USD LIBOR | | Quarterly | | | 2.697 | | | Semi-Annually | | | 12/15/2047 | | | | USD | | | | 515,735 | | | | — | | | | (3,640 | ) | | | (3,640 | ) |
Pay | | 3 Month USD LIBOR | | Quarterly | | | 2.703 | | | Semi-Annually | | | 12/15/2047 | | | | USD | | | | 515,734 | | | | — | | | | (3,372 | ) | | | (3,372 | ) |
Pay | | 6 Month EUR LIBOR | | Semi-Annually | | | 1.816 | | | Annually | | | 09/15/2047 | | | | EUR | | | | 652,000 | | | | — | | | | (10,569 | ) | | | (10,569 | ) |
Pay | | 6 Month EUR LIBOR | | Semi-Annually | | | 1.821 | | | Annually | | | 09/15/2047 | | | | EUR | | | | 1,304,000 | | | | — | | | | (20,269 | ) | | | (20,269 | ) |
Pay | | 6 Month EUR LIBOR | | Semi-Annually | | | 1.822 | | | Annually | | | 09/15/2047 | | | | EUR | | | | 654,000 | | | | — | | | | (10,062 | ) | | | (10,062 | ) |
Pay | | 6 Month EUR LIBOR | | Semi-Annually | | | 1.824 | | | Annually | | | 09/15/2047 | | | | EUR | | | | 653,000 | | | | — | | | | (9,897 | ) | | | (9,897 | ) |
Pay | | 6 Month EUR LIBOR | | Semi-Annually | | | 1.830 | | | Annually | | | 09/15/2047 | | | | EUR | | | | 652,000 | | | | — | | | | (9,408 | ) | | | (9,408 | ) |
Pay | | 6 Month EUR LIBOR | | Semi-Annually | | | 1.841 | | | Annually | | | 09/15/2047 | | | | EUR | | | | 1,305,000 | | | | — | | | | (16,849 | ) | | | (16,849 | ) |
Pay | | 6 Month EUR LIBOR | | Semi-Annually | | | 1.893 | | | Annually | | | 12/15/2047 | | | | EUR | | | | 353,048 | | | | — | | | | (1,785 | ) | | | (1,785 | ) |
Pay | | 6 Month EUR LIBOR | | Semi-Annually | | | 1.899 | | | Annually | | | 12/15/2047 | | | | EUR | | | | 685,952 | | | | — | | | | (2,866 | ) | | | (2,866 | ) |
Pay | | 6 Month GBP LIBOR | | Semi-Annually | | | 1.470 | | | Semi-Annually | | | 03/17/2047 | | | | GBP | | | | 229,000 | | | | — | | | | (6,950 | ) | | | (6,950 | ) |
Pay | | 6 Month GBP LIBOR | | Semi-Annually | | | 1.566 | | | Semi-Annually | | | 03/17/2047 | | | | GBP | | | | 187,000 | | | | — | | | | (3,223 | ) | | | (3,223 | ) |
Pay | | 6 Month GBP LIBOR | | Semi-Annually | | | 1.468 | | | Semi-Annually | | | 06/16/2047 | | | | GBP | | | | 260,000 | | | | — | | | | (7,527 | ) | | | (7,527 | ) |
Pay | | 6 Month GBP LIBOR | | Semi-Annually | | | 1.474 | | | Semi-Annually | | | 09/20/2047 | | | | GBP | | | | 285,000 | | | | — | | | | (11,037 | ) | | | (11,037 | ) |
Receive | | 3 Month CDOR | | Semi-Annually | | | 2.113 | | | Semi-Annually | | | 12/20/2022 | | | | CAD | | | | 792,000 | | | | — | | | | (2,053 | ) | | | (2,053 | ) |
Receive | | 3 Month STIBOR | | Quarterly | | | 0.390 | | | Annually | | | 04/29/2021 | | | | SEK | | | | 111,635,138 | | | | — | | | | (167,791 | ) | | | (167,791 | ) |
Receive | | 3 Month STIBOR | | Quarterly | | | 0.385 | | | Annually | | | 05/02/2021 | | | | SEK | | | | 170,366,862 | | | | — | | | | (250,717 | ) | | | (250,717 | ) |
Receive | | 3 Month STIBOR | | Quarterly | | | 0.348 | | | Annually | | | 06/21/2022 | | | | SEK | | | | 14,426,000 | | | | — | | | | (3,720 | ) | | | (3,720 | ) |
Receive | | 3 Month STIBOR | | Quarterly | | | 0.354 | | | Annually | | | 06/21/2022 | | | | SEK | | | | 5,530,800 | | | | — | | | | (1,581 | ) | | | (1,581 | ) |
Receive | | 3 Month STIBOR | | Quarterly | | | 0.365 | | | Annually | | | 06/21/2022 | | | | SEK | | | | 3,687,200 | | | | — | | | | (1,278 | ) | | | (1,278 | ) |
Receive | | 3 Month STIBOR | | Quarterly | | | 2.071 | | | Annually | | | 12/21/2027 | | | | SEK | | | | 12,413,000 | | | | — | | | | (2,208 | ) | | | (2,208 | ) |
Receive | | 3 Month USD LIBOR | | Quarterly | | | 2.371 | | | Semi-Annually | | | 12/21/2026 | | | | USD | | | | 4,390,500 | | | | — | | | | (12,274 | ) | | | (12,274 | ) |
Receive | | 3 Month USD LIBOR | | Quarterly | | | 2.381 | | | Semi-Annually | | | 12/21/2026 | | | | USD | | | | 2,958,000 | | | | — | | | | (10,655 | ) | | | (10,655 | ) |
Receive | | 3 Month USD LIBOR | | Quarterly | | | 2.384 | | | Semi-Annually | | | 12/21/2026 | | | | USD | | | | 482,000 | | | | — | | | | (1,854 | ) | | | (1,854 | ) |
Receive | | 3 Month USD LIBOR | | Quarterly | | | 2.389 | | | Semi-Annually | | | 12/21/2026 | | | | USD | | | | 963,000 | | | | — | | | | (4,107 | ) | | | (4,107 | ) |
Receive | | 3 Month USD LIBOR | | Quarterly | | | 2.391 | | | Semi-Annually | | | 12/21/2026 | | | | USD | | | | 1,101,000 | | | | — | | | | (4,861 | ) | | | (4,861 | ) |
Receive | | 3 Month USD LIBOR | | Quarterly | | | 2.791 | | | Semi-Annually | | | 12/15/2047 | | | | USD | | | | 439,000 | | | | — | | | | (585 | ) | | | (585 | ) |
Receive | | 6 Month AUD BBSW | | Semi-Annually | | | 2.960 | | | Semi-Annually | | | 03/15/2027 | | | | AUD | | | | 1,151,000 | | | | — | | | | (11,289 | ) | | | (11,289 | ) |
Receive | | 6 Month AUD BBSW | | Semi-Annually | | | 3.040 | | | Semi-Annually | | | 03/15/2027 | | | | AUD | | | | 762,000 | | | | — | | | | (11,426 | ) | | | (11,426 | ) |
Receive | | 6 Month AUD BBSW | | Semi-Annually | | | 2.903 | | | Semi-Annually | | | 09/20/2027 | | | | AUD | | | | 1,593,000 | | | | — | | | | (7,284 | ) | | | (7,284 | ) |
Receive | | 6 Month AUD BBSW | | Semi-Annually | | | 2.947 | | | Semi-Annually | | | 12/20/2027 | | | | AUD | | | | 1,629,000 | | | | — | | | | (9,488 | ) | | | (9,488 | ) |
Receive | | 6 Month EUR LIBOR | | Semi-Annually | | | 1.423 | | | Annually | | | 06/15/2027 | | | | EUR | | | | 830,300 | | | | — | | | | (305 | ) | | | (305 | ) |
Receive | | 6 Month EUR LIBOR | | Semi-Annually | | | 1.425 | | | Annually | | | 06/15/2027 | | | | EUR | | | | 3,321,200 | | | | — | | | | (1,529 | ) | | | (1,529 | ) |
Receive | | 6 Month EUR LIBOR | | Semi-Annually | | | 1.429 | | | Annually | | | 06/15/2027 | | | | EUR | | | | 732,000 | | | | — | | | | (10,256 | ) | | | (10,256 | ) |
Receive | | 6 Month EUR LIBOR | | Semi-Annually | | | 1.433 | | | Annually | | | 06/15/2027 | | | | EUR | | | | 2,490,900 | | | | — | | | | (2,232 | ) | | | (2,232 | ) |
Receive | | 6 Month EUR LIBOR | | Semi-Annually | | | 1.438 | | | Annually | | | 06/15/2027 | | | | EUR | | | | 5,812,100 | | | | — | | | | (6,784 | ) | | | (6,784 | ) |
See accompanying Notes to Consolidated Financial Statements which are an integral part of the financial statements.
35 Invesco Global Targeted Returns Fund
| | | | | | | | | | | | | | | | | | | | | | | | | | | | | | | | | | | | |
| Open Centrally Cleared Interest Rate Swap Agreements(o)—(continued) | |
Pay/Receive
Floating Rate | | Floating Rate Index | | Payment
Frequency | | (Pay)/Receive
Fixed Rate | | | Payment
Frequency | | | Maturity
Date | | | Notional
Value | | | Upfront
Payments
Paid
(Received) | | | Value | | | Unrealized
Appreciation
(Depreciation)(r) | |
Receive | | 6 Month EUR LIBOR | | Semi-Annually | | | 1.611 | % | | | Annually | | | | 09/21/2027 | | | | EUR | | | | 2,138,758 | | | $ | — | | | $ | (16,108 | ) | | $ | (16,108 | ) |
Receive | | 6 Month EUR LIBOR | | Semi-Annually | | | 1.613 | | | | Annually | | | | 09/21/2027 | | | | EUR | | | | 703,153 | | | | — | | | | (5,375 | ) | | | (5,375 | ) |
Receive | | 6 Month EUR LIBOR | | Semi-Annually | | | 1.622 | | | | Annually | | | | 09/21/2027 | | | | EUR | | | | 1,406,307 | | | | — | | | | (11,475 | ) | | | (11,475 | ) |
Receive | | 6 Month EUR LIBOR | | Semi-Annually | | | 1.624 | | | | Annually | | | | 09/21/2027 | | | | EUR | | | | 703,153 | | | | — | | | | (5,816 | ) | | | (5,816 | ) |
Receive | | 6 Month EUR LIBOR | | Semi-Annually | | | 1.626 | | | | Annually | | | | 09/21/2027 | | | | EUR | | | | 1,406,307 | | | | — | | | | (11,789 | ) | | | (11,789 | ) |
Receive | | 6 Month EUR LIBOR | | Semi-Annually | | | 1.639 | | | | Annually | | | | 09/21/2027 | | | | EUR | | | | 916,736 | | | | — | | | | (8,351 | ) | | | (8,351 | ) |
Receive | | 6 Month EUR LIBOR | | Semi-Annually | | | 1.653 | | | | Annually | | | | 09/21/2027 | | | | EUR | | | | 3,490,569 | | | | — | | | | (34,572 | ) | | | (34,572 | ) |
Receive | | 6 Month EUR LIBOR | | Semi-Annually | | | 1.654 | | | | Annually | | | | 09/21/2027 | | | | EUR | | | | 1,347,710 | | | | — | | | | (13,357 | ) | | | (13,357 | ) |
Receive | | 6 Month EUR LIBOR | | Semi-Annually | | | 1.658 | | | | Annually | | | | 09/21/2027 | | | | EUR | | | | 1,406,307 | | | | — | | | | (14,288 | ) | | | (14,288 | ) |
Receive | | 6 Month EUR LIBOR | | Semi-Annually | | | 1.940 | | | | Annually | | | | 09/15/2047 | | | | EUR | | | | 199,000 | | | | — | | | | (18 | ) | | | (18 | ) |
Receive | | 6 Month EUR LIBOR | | Semi-Annually | | | 1.952 | | | | Annually | | | | 12/15/2047 | | | | EUR | | | | 391,000 | | | | — | | | | (1,003 | ) | | | (1,003 | ) |
Receive | | 6 Month GBP LIBOR | | Semi-Annually | | | 1.972 | | | | Semi-Annually | | | | 12/02/2045 | | | | GBP | | | | 737,000 | | | | — | | | | (100,855 | ) | | | (100,855 | ) |
Receive | | 6 Month GBP LIBOR | | Semi-Annually | | | 2.045 | | | | Semi-Annually | | | | 12/03/2045 | | | | GBP | | | | 1,090,000 | | | | — | | | | (175,202 | ) | | | (175,202 | ) |
Receive | | 6 Month GBP LIBOR | | Semi-Annually | | | 2.050 | | | | Semi-Annually | | | | 01/06/2046 | | | | GBP | | | | 301,000 | | | | — | | | | (47,801 | ) | | | (47,801 | ) |
Receive | | 6 Month GBP LIBOR | | Semi-Annually | | | 1.636 | | | | Semi-Annually | | | | 03/08/2046 | | | | GBP | | | | 402,000 | | | | — | | | | (7,966 | ) | | | (7,966 | ) |
Receive | | 6 Month GBP LIBOR | | Semi-Annually | | | 1.643 | | | | Semi-Annually | | | | 03/18/2046 | | | | GBP | | | | 243,000 | | | | — | | | | (5,302 | ) | | | (5,302 | ) |
Receive | | 6 Month GBP LIBOR | | Semi-Annually | | | 1.850 | | | | Semi-Annually | | | | 04/26/2046 | | | | GBP | | | | 172,000 | | | | — | | | | (15,969 | ) | | | (15,969 | ) |
Receive | | 6 Month GBP LIBOR | | Semi-Annually | | | 1.443 | | | | Semi-Annually | | | | 06/16/2047 | | | | GBP | | | | 264,000 | | | | — | | | | (2,830 | ) | | | (2,830 | ) |
Subtotal — Depreciation | | | | | | | | | | | | | | | | | | | | | | | — | | | | (1,609,585 | ) | | | (1,609,585 | ) |
Total — Interest Rate Swap Agreements — Interest Rate Risk | | | | | | | | | | | $ | — | | | $ | 1,038,631 | | | $ | 1,038,631 | |
| (o) | Centrally cleared swap agreements collateralized by $2,014,886 cash held with Credit Suisse Securities (USA) LLC. |
| (r) | The daily variation margin receivable (payable) at period end is recorded in the Consolidated Statement of Assets and Liabilities. |
| | | | | | | | | | | | | | | | | | | | | | | | | | | | | | | | | | | | | | | | | | |
| Open Over-The-Counter Inflation Swap Agreements(s) | |
| Counterparty | | Pay/Receive
Floating Rate | | | Floating Rate Index | | Payment
Frequency | | | Fixed
Rate | | | Payment
Frequency | | | Maturity
Date | | | Notional
Value | | | Upfront
Payments
Paid
(Received) | | | Value | | | Unrealized
Appreciation
(Depreciation) | |
Barclays Bank PLC | | | Receive | | | United States CPI Urban
Consumers NSA | | | At Maturity | | | | 1.955 | % | | | At Maturity | | | | 10/18/2026 | | | | USD | | | | 1,314,000 | | | $ | — | | | $ | 20,667 | | | $ | 20,667 | |
Barclays Bank PLC | | | Receive | | | United States CPI Urban
Consumers NSA | | | At Maturity | | | | 1.960 | | | | At Maturity | | | | 10/18/2026 | | | | USD | | | | 1,314,000 | | | | — | | | | 20,016 | | | | 20,016 | |
Barclays Bank PLC | | | Receive | | | United States CPI Urban
Consumers NSA | | | At Maturity | | | | 1.995 | | | | At Maturity | | | | 10/19/2026 | | | | USD | | | | 1,314,000 | | | | — | | | | 15,480 | | | | 15,480 | |
Barclays Bank PLC | | | Receive | | | United States CPI Urban
Consumers NSA | | | At Maturity | | | | 2.000 | | | | At Maturity | | | | 10/19/2026 | | | | USD | | | | 1,288,000 | | | | — | | | | 14,533 | | | | 14,533 | |
Barclays Bank PLC | | | Receive | | | United States CPI Urban
Consumers NSA | | | At Maturity | | | | 2.010 | | | | At Maturity | | | | 10/20/2026 | | | | USD | | | | 1,314,000 | | | | — | | | | 13,556 | | | | 13,556 | |
Barclays Bank PLC | | | Receive | | | United States CPI Urban
Consumers NSA | | | At Maturity | | | | 1.993 | | | | At Maturity | | | | 10/21/2026 | | | | USD | | | | 1,288,000 | | | | — | | | | 15,568 | | | | 15,568 | |
Barclays Bank PLC | | | Receive | | | United States CPI Urban
Consumers NSA | | | At Maturity | | | | 2.010 | | | | At Maturity | | | | 10/21/2026 | | | | USD | | | | 1,314,000 | | | | — | | | | 13,594 | | | | 13,594 | |
Barclays Bank PLC | | | Receive | | | United States CPI Urban
Consumers NSA | | | At Maturity | | | | 1.995 | | | | At Maturity | | | | 10/24/2026 | | | | USD | | | | 1,314,000 | | | | — | | | | 15,676 | | | | 15,676 | |
Barclays Bank PLC | | | Receive | | | United States CPI Urban
Consumers NSA | | | At Maturity | | | | 2.233 | | | | At Maturity | | | | 12/19/2026 | | | | USD | | | | 2,578,000 | | | | — | | | | 33,308 | | | | 33,308 | |
Goldman Sachs International | | | Receive | | | United States CPI Urban
Consumers NSA | | | At Maturity | | | | 2.040 | | | | At Maturity | | | | 11/01/2026 | | | | USD | | | | 1,320,000 | | | | — | | | | 10,136 | | | | 10,136 | |
Morgan Stanley Capital Services LLC | | | Receive | | | United States CPI Urban
Consumers NSA | | | At Maturity | | | | 2.048 | | | | At Maturity | | | | 11/01/2026 | | | | USD | | | | 1,299,000 | | | | — | | | | 9,002 | | | | 9,002 | |
Subtotal — Appreciation | | | | | | | | | | | | | | | | | | | — | | | | 181,536 | | | | 181,536 | |
Barclays Bank PLC | | | Pay | | | United Kingdom RPI | | | At Maturity | | | | 3.106 | | | | At Maturity | | | | 06/15/2026 | | | | GBP | | | | 1,294,000 | | | | — | | | | (70,719 | ) | | | (70,719 | ) |
Barclays Bank PLC | | | Receive | | | United Kingdom RPI | | | At Maturity | | | | 3.574 | | | | At Maturity | | | | 12/15/2026 | | | | GBP | | | | 3,132,000 | | | | — | | | | (55,889 | ) | | | (55,889 | ) |
See accompanying Notes to Consolidated Financial Statements which are an integral part of the financial statements.
36 Invesco Global Targeted Returns Fund
| | | | | | | | | | | | | | | | | | | | | | | | | | | | | | | | | | | | | | | | | | |
| Open Over-The-Counter Inflation Swap Agreements(s)—(continued) | |
| Counterparty | | Pay/Receive
Floating Rate | | | Floating Rate Index | | Payment
Frequency | | | Fixed
Rate | | | Payment
Frequency | | | Maturity
Date | | | Notional
Value | | | Upfront
Payments
Paid
(Received) | | | Value | | | Unrealized
Appreciation
(Depreciation) | |
Barclays Bank PLC | | | Receive | | | United States CPI Urban
Consumers NSA | | | At Maturity | | | | 2.225 | % | | | At Maturity | | | | 11/16/2026 | | | | USD | | | | 1,825,000 | | | $ | — | | | $ | (20,507 | ) | | $ | (20,507 | ) |
Barclays Bank PLC | | | Receive | | | United States CPI Urban
Consumers NSA | | | At Maturity | | | | 2.255 | | | | At Maturity | | | | 11/17/2026 | | | | USD | | | | 1,867,000 | | | | — | | | | (26,699 | ) | | | (26,699 | ) |
Citigroup Global Markets Inc. | | | Pay | | | United Kingdom RPI | | | At Maturity | | | | 2.949 | | | | At Maturity | | | | 09/15/2025 | | | | GBP | | | | 840,423 | | | | — | | | | (41,525 | ) | | | (41,525 | ) |
Citigroup Global Markets Inc. | | | Pay | | | United Kingdom RPI | | | At Maturity | | | | 2.801 | | | | At Maturity | | | | 05/15/2026 | | | | GBP | | | | 1,018,000 | | | | — | | | | (94,646 | ) | | | (94,646 | ) |
Goldman Sachs International | | | Pay | | | United Kingdom RPI | | | At Maturity | | | | 3.060 | | | | At Maturity | | | | 12/29/2025 | | | | GBP | | | | 3,450,000 | | | | — | | | | (146,814 | ) | | | (146,814 | ) |
Goldman Sachs International | | | Pay | | | United Kingdom RPI | | | At Maturity | | | | 2.964 | | | | At Maturity | | | | 03/15/2026 | | | | GBP | | | | 2,298,000 | | | | — | | | | (150,447 | ) | | | (150,447 | ) |
Goldman Sachs International | | | Receive | | | United States CPI Urban
Consumers NSA | | | At Maturity | | | | 2.218 | | | | At Maturity | | | | 11/16/2026 | | | | USD | | | | 1,762,000 | | | | — | | | | (18,460 | ) | | | (18,460 | ) |
Morgan Stanley Capital Services LLC | | | Pay | | | United Kingdom RPI | | | At Maturity | | | | 2.923 | | | | At Maturity | | | | 02/27/2025 | | | | GBP | | | | 11,857,170 | | | | — | | | | (369,182 | ) | | | (369,182 | ) |
Morgan Stanley Capital Services LLC | | | Pay | | | United Kingdom RPI | | | At Maturity | | | | 3.250 | | | | At Maturity | | | | 07/10/2025 | | | | GBP | | | | 830,852 | | | | — | | | | (322 | ) | | | (322 | ) |
Morgan Stanley Capital Services LLC | | | Receive | | | United States CPI Urban
Consumers NSA | | | At Maturity | | | | 2.249 | | | | At Maturity | | | | 11/16/2026 | | | | USD | | | | 1,493,000 | | | | — | | | | (20,411 | ) | | | (20,411 | ) |
Morgan Stanley Capital Services LLC | | | Receive | | | United States CPI Urban
Consumers NSA | | | At Maturity | | | | 2.259 | | | | At Maturity | | | | 11/16/2026 | | | | USD | | | | 1,276,000 | | | | — | | | | (18,741 | ) | | | (18,741 | ) |
Morgan Stanley Capital Services LLC | | | Receive | | | United States CPI Urban
Consumers NSA | | | At Maturity | | | | 2.284 | | | | At Maturity | | | | 11/16/2026 | | | | USD | | | | 2,776,000 | | | | — | | | | (47,835 | ) | | | (47,835 | ) |
Morgan Stanley Capital Services LLC | | | Receive | | | United States CPI Urban
Consumers NSA | | | At Maturity | | | | 2.255 | | | | At Maturity | | | | 11/17/2026 | | | | USD | | | | 1,867,000 | | | | — | | | | (26,604 | ) | | | (26,604 | ) |
Subtotal — Depreciation | | | | | | | | | | | | | | | | | | | | — | | | | (1,108,801 | ) | | | (1,108,801 | ) |
Subtotal — Over-The-Counter Inflation Swap Agreements | | | | | | | | | | | | | | | | | | | $ | — | | | $ | (927,265 | ) | | $ | (927,265 | ) |
| | | | | | | | | | | | | | | | | | | | | | | | | | | | | | | | | | | | |
| Centrally Cleared Inflation Swap Agreements(s) | |
Pay/Receive
Floating Rate | | Floating Rate Index | | Payment
Frequency | | Fixed
Rate | | | Payment
Frequency | | | Maturity
Date | | | Notional
Value | | | Upfront
Payments
Paid
(Received) | | | Value | | | Unrealized
Appreciation
(Depreciation)(t) | |
Receive | | Eurostat Eurozone HICP Ex Tobacco Unrevised Series NSA | | At Maturity | | | 1.105 | % | | | At Maturity | | | | 04/15/2022 | | | | EUR | | | | 8,303,000 | | | $ | — | | | $ | 60,962 | | | $ | 60,962 | |
Receive | | Eurostat Eurozone HICP Ex Tobacco Unrevised Series NSA | | At Maturity | | | 1.114 | | | | At Maturity | | | | 03/15/2022 | | | | EUR | | | | 6,642,400 | | | | — | | | | 50,524 | | | | 50,524 | |
Receive | | Eurostat Eurozone HICP Ex Tobacco Unrevised Series NSA | | At Maturity | | | 1.127 | | | | At Maturity | | | | 03/15/2022 | | | | EUR | | | | 1,660,600 | | | | — | | | | 11,469 | | | | 11,469 | |
Receive | | Eurostat Eurozone HICP Ex Tobacco Unrevised Series NSA | | At Maturity | | | 1.128 | | | | At Maturity | | | | 06/15/2022 | | | | EUR | | | | 338,000 | | | | — | | | | 2,995 | | | | 2,995 | |
Receive | | Eurostat Eurozone HICP Ex Tobacco Unrevised Series NSA | | At Maturity | | | 1.134 | | | | At Maturity | | | | 04/15/2022 | | | | EUR | | | | 1,755,000 | | | | — | | | | 10,065 | | | | 10,065 | |
Receive | | Eurostat Eurozone HICP Ex Tobacco Unrevised Series NSA | | At Maturity | | | 1.140 | | | | At Maturity | | | | 03/15/2022 | | | | EUR | | | | 4,981,800 | | | | — | | | | 30,644 | | | | 30,644 | |
Receive | | Eurostat Eurozone HICP Ex Tobacco Unrevised Series NSA | | At Maturity | | | 1.141 | | | | At Maturity | | | | 03/15/2022 | | | | EUR | | | | 11,624,200 | | | | — | | | | 74,519 | | | | 74,519 | |
Receive | | Eurostat Eurozone HICP Ex Tobacco Unrevised Series NSA | | At Maturity | | | 1.176 | | | | At Maturity | | | | 07/15/2022 | | | | EUR | | | | 2,754,047 | | | | — | | | | 13,785 | | | | 13,785 | |
See accompanying Notes to Consolidated Financial Statements which are an integral part of the financial statements.
37 Invesco Global Targeted Returns Fund
| | | | | | | | | | | | | | | | | | | | | | | | | | | | | | | | | | | | |
| Centrally Cleared Inflation Swap Agreements(s)—(continued) | |
Pay/Receive
Floating Rate | | Floating Rate Index | | Payment
Frequency | | Fixed
Rate | | | Payment
Frequency | | | Maturity
Date | | | Notional
Value | | | Upfront
Payments
Paid
(Received) | | | Value | | | Unrealized
Appreciation
(Depreciation)(t) | |
Receive | | Eurostat Eurozone HICP Ex Tobacco Unrevised Series NSA | | At Maturity | | | 1.180 | % | | | At Maturity | | | | 07/15/2022 | | | | EUR | | | | 2,666,152 | | | $ | — | | | $ | 12,707 | | | $ | 12,707 | |
Receive | | Eurostat Eurozone HICP Ex Tobacco Unrevised Series NSA | | At Maturity | | | 1.202 | | | | At Maturity | | | | 07/15/2022 | | | | EUR | | | | 3,984,578 | | | | — | | | | 13,822 | | | | 13,822 | |
Receive | | Eurostat Eurozone HICP Ex Tobacco Unrevised Series NSA | | At Maturity | | | 1.208 | | | | At Maturity | | | | 07/15/2022 | | | | EUR | | | | 1,321,356 | | | | — | | | | 4,085 | | | | 4,085 | |
Receive | | Eurostat Eurozone HICP Ex Tobacco Unrevised Series NSA | | At Maturity | | | 1.217 | | | | At Maturity | | | | 07/15/2022 | | | | EUR | | | | 2,666,151 | | | | — | | | | 6,721 | | | | 6,721 | |
Receive | | Eurostat Eurozone HICP Ex Tobacco Unrevised Series NSA | | At Maturity | | | 1.222 | | | | At Maturity | | | | 07/15/2022 | | | | EUR | | | | 3,999,227 | | | | — | | | | 8,781 | | | | 8,781 | |
Receive | | Eurostat Eurozone HICP Ex Tobacco Unrevised Series NSA | | At Maturity | | | 1.385 | | | | At Maturity | | | | 06/15/2027 | | | | EUR | | | | 2,887,000 | | | | — | | | | 24,738 | | | | 24,738 | |
Receive | | Eurostat Eurozone HICP Ex Tobacco Unrevised Series NSA | | At Maturity | | | 1.421 | | | | At Maturity | | | | 08/15/2027 | | | | EUR | | | | 4,082,000 | | | | — | | | | 24,959 | | | | 24,959 | |
Receive | | Eurostat Eurozone HICP Ex Tobacco Unrevised Series NSA | | At Maturity | | | 1.455 | | | | At Maturity | | | | 09/15/2027 | | | | EUR | | | | 2,191,000 | | | | — | | | | 5,759 | | | | 5,759 | |
Receive | | Eurostat Eurozone HICP Ex Tobacco Unrevised Series NSA | | At Maturity | | | 1.475 | | | | At Maturity | | | | 10/15/2027 | | | | EUR | | | | 3,191,000 | | | | — | | | | 2,182 | | | | 2,182 | |
Receive | | United States CPI Urban Consumers NSA | | At Maturity | | | 2.069 | | | | At Maturity | | | | 08/25/2027 | | | | USD | | | | 220,120 | | | | — | | | | 1,927 | | | | 1,927 | |
Receive | | United States CPI Urban Consumers NSA | | At Maturity | | | 2.074 | | | | At Maturity | | | | 08/23/2027 | | | | USD | | | | 436,000 | | | | — | | | | 3,597 | | | | 3,597 | |
Receive | | United States CPI Urban Consumers NSA | | At Maturity | | | 2.079 | | | | At Maturity | | | | 08/22/2027 | | | | USD | | | | 237,000 | | | | — | | | | 1,833 | | | | 1,833 | |
Receive | | United States CPI Urban Consumers NSA | | At Maturity | | | 2.082 | | | | At Maturity | | | | 08/24/2027 | | | | USD | | | | 436,000 | | | | — | | | | 3,247 | | | | 3,247 | |
Receive | | United States CPI Urban Consumers NSA | | At Maturity | | | 2.093 | | | | At Maturity | | | | 08/21/2027 | | | | USD | | | | 474,000 | | | | — | | | | 3,000 | | | | 3,000 | |
Receive | | United States CPI Urban Consumers NSA | | At Maturity | | | 2.093 | | | | At Maturity | | | | 08/21/2027 | | | | USD | | | | 474,000 | | | | — | | | | 3,000 | | | | 3,000 | |
Receive | | United States CPI Urban Consumers NSA | | At Maturity | | | 2.123 | | | | At Maturity | | | | 10/19/2027 | | | | USD | | | | 617,000 | | | | — | | | | 2,990 | | | | 2,990 | |
Receive | | United States CPI Urban Consumers NSA | | At Maturity | | | 2.131 | | | | At Maturity | | | | 10/19/2027 | | | | USD | | | | 617,000 | | | | — | | | | 2,475 | | | | 2,475 | |
Receive | | United States CPI Urban Consumers NSA | | At Maturity | | | 2.131 | | | | At Maturity | | | | 10/23/2027 | | | | USD | | | | 308,000 | | | | — | | | | 1,174 | | | | 1,174 | |
Receive | | United States CPI Urban Consumers NSA | | At Maturity | | | 2.148 | | | | At Maturity | | | | 10/20/2027 | | | | USD | | | | 617,000 | | | | — | | | | 1,448 | | | | 1,448 | |
Receive | | United States CPI Urban Consumers NSA | | At Maturity | | | 2.150 | | | | At Maturity | | | | 10/20/2027 | | | | USD | | | | 308,000 | | | | — | | | | 647 | | | | 647 | |
Receive | | United Kingdom RPI | | At Maturity | | | 3.353 | | | | At Maturity | | | | 10/15/2027 | | | | GBP | | | | 1,269,000 | | | | — | | | | 4,263 | | | | 4,263 | |
Receive | | United Kingdom RPI | | At Maturity | | | 3.390 | | | | At Maturity | | | | 09/15/2027 | | | | GBP | | | | 1,479,000 | | | | — | | | | 2,392 | | | | 2,392 | |
Receive | | United Kingdom RPI | | At Maturity | | | 3.420 | | | | At Maturity | | | | 06/15/2047 | | | | GBP | | | | 23,000 | | | | — | | | | 1,335 | | | | 1,335 | |
Receive | | United Kingdom RPI | | At Maturity | | | 3.423 | | | | At Maturity | | | | 06/15/2027 | | | | GBP | | | | 1,100,000 | | | | — | | | | 2,568 | | | | 2,568 | |
Receive | | United Kingdom RPI | | At Maturity | | | 3.443 | | | | At Maturity | | | | 08/15/2047 | | | | GBP | | | | 34,066 | | | | — | | | | 1,388 | | | | 1,388 | |
Receive | | United Kingdom RPI | | At Maturity | | | 3.453 | | | | At Maturity | | | | 08/15/2047 | | | | GBP | | | | 34,463 | | | | — | | | | 1,173 | | | | 1,173 | |
Receive | | United Kingdom RPI | | At Maturity | | | 3.453 | | | | At Maturity | | | | 08/15/2047 | | | | GBP | | | | 34,463 | | | | — | | | | 1,173 | | | | 1,173 | |
See accompanying Notes to Consolidated Financial Statements which are an integral part of the financial statements.
38 Invesco Global Targeted Returns Fund
| | | | | | | | | | | | | | | | | | | | | | | | | | | | | | | | | | | | | | |
| Centrally Cleared Inflation Swap Agreements(s)—(continued) | |
Pay/Receive
Floating Rate | | Floating Rate Index | | Payment
Frequency | | | Fixed
Rate | | | Payment
Frequency | | | Maturity
Date | | | Notional
Value | | | Upfront
Payments
Paid
(Received) | | | Value | | | Unrealized
Appreciation
(Depreciation)(t) | |
Receive | | United Kingdom RPI | | | At Maturity | | | | 3.454 | % | | | At Maturity | | | | 08/15/2047 | | | | GBP | | | | 67,943 | | | $ | — | | | $ | 2,255 | | | $ | 2,255 | |
Receive | | United Kingdom RPI | | | At Maturity | | | | 3.458 | | | | At Maturity | | | | 08/15/2047 | | | | GBP | | | | 34,463 | | | | — | | | | 1,055 | | | | 1,055 | |
Receive | | United Kingdom RPI | | | At Maturity | | | | 3.478 | | | | At Maturity | | | | 08/15/2047 | | | | GBP | | | | 80,661 | | | | — | | | | 1,338 | | | | 1,338 | |
Receive | | United Kingdom RPI | | | At Maturity | | | | 3.480 | | | | At Maturity | | | | 08/15/2047 | | | | GBP | | | | 80,661 | | | | — | | | | 1,235 | | | | 1,235 | |
Pay | | Eurostat Eurozone HICP Ex Tobacco Unrevised Series NSA | | | At Maturity | | | | 1.302 | | | | At Maturity | | | | 10/15/2022 | | | | EUR | | | | 3,191,000 | | | | — | | | | 928 | | | | 928 | |
Pay | | United States CPI Urban Consumers NSA | | | At Maturity | | | | 2.120 | | | | At Maturity | | | | 05/12/2027 | | | | USD | | | | 950,000 | | | | — | | | | 1,963 | | | | 1,963 | |
Pay | | United States CPI Urban Consumers NSA | | | At Maturity | | | | 2.120 | | | | At Maturity | | | | 05/12/2027 | | | | USD | | | | 2,281,000 | | | | — | | | | 4,712 | | | | 4,712 | |
Pay | | United States CPI Urban Consumers NSA | | | At Maturity | | | | 2.133 | | | | At Maturity | | | | 05/15/2027 | | | | USD | | | | 1,117,000 | | | | — | | | | 3,049 | | | | 3,049 | |
Pay | | United States CPI Urban Consumers NSA | | | At Maturity | | | | 2.135 | | | | At Maturity | | | | 05/11/2027 | | | | USD | | | | 236,000 | | | | — | | | | 869 | | | | 869 | |
Pay | | United States CPI Urban Consumers NSA | | | At Maturity | | | | 2.135 | | | | At Maturity | | | | 05/11/2027 | | | | USD | | | | 654,000 | | | | — | | | | 2,409 | | | | 2,409 | |
Pay | | United States CPI Urban Consumers NSA | | | At Maturity | | | | 2.138 | | | | At Maturity | | | | 05/11/2027 | | | | USD | | | | 1,574,000 | | | | — | | | | 6,189 | | | | 6,189 | |
Pay | | United States CPI Urban Consumers NSA | | | At Maturity | | | | 2.144 | | | | At Maturity | | | | 05/11/2027 | | | | USD | | | | 1,574,000 | | | | — | | | | 7,207 | | | | 7,207 | |
Pay | | United States CPI Urban Consumers NSA | | | At Maturity | | | | 2.281 | | | | At Maturity | | | | 03/01/2027 | | | | USD | | | | 919,000 | | | | — | | | | 16,693 | | | | 16,693 | |
Pay | | United Kingdom RPI | | | At Maturity | | | | 3.381 | | | | At Maturity | | | | 10/15/2027 | | | | GBP | | | | 1,700,380 | | | | — | | | | 1,929 | | | | 1,929 | |
Pay | | United Kingdom RPI | | | At Maturity | | | | 3.388 | | | | At Maturity | | | | 10/15/2027 | | | | GBP | | | | 2,280,760 | | | | — | | | | 5,214 | | | | 5,214 | |
Pay | | United Kingdom RPI | | | At Maturity | | | | 3.483 | | | | At Maturity | | | | 10/15/2047 | | | | GBP | | | | 111,000 | | | | — | | | | 137 | | | | 137 | |
Pay | | United Kingdom RPI | | | At Maturity | | | | 3.505 | | | | At Maturity | | | | 09/15/2047 | | | | GBP | | | | 131,000 | | | | — | | | | 1,380 | | | | 1,380 | |
Pay | | United Kingdom RPI | | | At Maturity | | | | 3.630 | | | | At Maturity | | | | 01/15/2027 | | | | GBP | | | | 644,421 | | | | — | | | | 17,435 | | | | 17,435 | |
Pay | | United Kingdom RPI | | | At Maturity | | | | 3.633 | | | | At Maturity | | | | 01/15/2027 | | | | GBP | | | | 885,159 | | | | — | | | | 24,349 | | | | 24,349 | |
Pay | | United Kingdom RPI | | | At Maturity | | | | 3.635 | | | | At Maturity | | | | 01/15/2027 | | | | GBP | | | | 644,420 | | | | — | | | | 17,922 | | | | 17,922 | |
Subtotal — Appreciation | | | | | | | | | | | | | | | | | | | | | | | | | | | — | | | | 516,615 | | | | 516,615 | |
Pay | | Eurostat Eurozone HICP Ex Tobacco Unrevised Series NSA | | | At Maturity | | | | 1.190 | | | | At Maturity | | | | 05/15/2022 | | | | EUR | | | | 1,465,000 | | | | — | | | | (3,412 | ) | | | (3,412 | ) |
Pay | | Eurostat Eurozone HICP Ex Tobacco Unrevised Series NSA | | | At Maturity | | | | 1.310 | % | | | At Maturity | | | | 08/15/2022 | | | | EUR | | | | 6,650,145 | | | | — | | | | (7,059 | ) | | | (7,059 | ) |
Pay | | Eurostat Eurozone HICP Ex Tobacco Unrevised Series NSA | | | At Maturity | | | | 1.315 | | | | At Maturity | | | | 08/15/2022 | | | | EUR | | | | 2,996,344 | | | | — | | | | (4,158 | ) | | | (4,158 | ) |
Pay | | United States CPI Urban Consumers NSA | | | At Maturity | | | | 2.147 | | | | At Maturity | | | | 04/25/2027 | | | | USD | | | | 198,000 | | | | — | | | | (1,234 | ) | | | (1,234 | ) |
Pay | | United States CPI Urban Consumers NSA | | | At Maturity | | | | 2.199 | | | | At Maturity | | | | 04/26/2027 | | | | USD | | | | 397,000 | | | | — | | | | (4,543 | ) | | | (4,543 | ) |
Pay | | United States CPI Urban Consumers NSA | | | At Maturity | | | | 2.294 | | | | At Maturity | | | | 01/12/2027 | | | | USD | | | | 866,000 | | | | — | | | | (16,559 | ) | | | (16,559 | ) |
Pay | | United States CPI Urban Consumers NSA | | | At Maturity | | | | 2.300 | | | | At Maturity | | | | 01/12/2027 | | | | USD | | | | 866,000 | | | | — | | | | (17,087 | ) | | | (17,087 | ) |
Pay | | United Kingdom RPI | | | At Maturity | | | | 3.495 | | | | At Maturity | | | | 10/15/2047 | | | | GBP | | | | 85,540 | | | | — | | | | (826 | ) | | | (826 | ) |
Pay | | United Kingdom RPI | | | At Maturity | | | | 3.505 | | | | At Maturity | | | | 02/15/2027 | | | | GBP | | | | 1,235,000 | | | | — | | | | (14,717 | ) | | | (14,717 | ) |
Pay | | United Kingdom RPI | | | At Maturity | | | | 3.518 | | | | At Maturity | | | | 10/15/2047 | | | | GBP | | | | 143,957 | | | | — | | | | (3,715 | ) | | | (3,715 | ) |
Pay | | United Kingdom RPI | | | At Maturity | | | | 3.524 | | | | At Maturity | | | | 05/15/2047 | | | | GBP | | | | 458,250 | | | | — | | | | (7,895 | ) | | | (7,895 | ) |
Pay | | United Kingdom RPI | | | At Maturity | | | | 3.531 | | | | At Maturity | | | | 10/15/2047 | | | | GBP | | | | 200,503 | | | | — | | | | (7,149 | ) | | | (7,149 | ) |
Pay | | United Kingdom RPI | | | At Maturity | | | | 3.549 | | | | At Maturity | | | | 05/15/2047 | | | | GBP | | | | 458,250 | | | | — | | | | (15,982 | ) | | | (15,982 | ) |
See accompanying Notes to Consolidated Financial Statements which are an integral part of the financial statements.
39 Invesco Global Targeted Returns Fund
| | | | | | | | | | | | | | | | | | | | | | | | | | | | | | | | | | | | |
| Centrally Cleared Inflation Swap Agreements(s)—(continued) | |
Pay/Receive
Floating Rate | | Floating Rate Index | | Payment
Frequency | | Fixed
Rate | | | Payment
Frequency | | | Maturity
Date | | | Notional
Value | | | Upfront
Payments
Paid
(Received) | | | Value | | | Unrealized
Appreciation
(Depreciation)(t) | |
Pay | | United Kingdom RPI | | At Maturity | | | 3.552 | % | | | At Maturity | | | | 05/15/2047 | | | | GBP | | | | 458,250 | | | $ | — | | | $ | (16,900 | ) | | $ | (16,900 | ) |
Pay | | United Kingdom RPI | | At Maturity | | | 3.564 | | | | At Maturity | | | | 05/15/2047 | | | | GBP | | | | 458,250 | | | | — | | | | (20,906 | ) | | | (20,906 | ) |
Receive | | Eurostat Eurozone HICP Ex Tobacco Unrevised Series NSA | | At Maturity | | | 1.198 | | | | At Maturity | | | | 06/15/2022 | | | | EUR | | | | 2,887,000 | | | | — | | | | (13,679 | ) | | | (13,679 | ) |
Receive | | Eurostat Eurozone HICP Ex Tobacco Unrevised Series NSA | | At Maturity | | | 1.253 | | | | At Maturity | | | | 08/15/2022 | | | | EUR | | | | 4,082,000 | | | | — | | | | (10,216 | ) | | | (10,216 | ) |
Receive | | Eurostat Eurozone HICP Ex Tobacco Unrevised Series NSA | | At Maturity | | | 1.282 | | | | At Maturity | | | | 09/15/2022 | | | | EUR | | | | 2,191,000 | | | | — | | | | (2,145 | ) | | | (2,145 | ) |
Receive | | Eurostat Eurozone HICP Ex Tobacco Unrevised Series NSA | | At Maturity | | | 1.333 | | | | At Maturity | | | | 04/15/2027 | | | | EUR | | | | 8,303,000 | | | | — | | | | (90,111 | ) | | | (90,111 | ) |
Receive | | Eurostat Eurozone HICP Ex Tobacco Unrevised Series NSA | | At Maturity | | | 1.334 | | | | At Maturity | | | | 06/15/2027 | | | | EUR | | | | 338,000 | | | | — | | | | (4,956 | ) | | | (4,956 | ) |
Receive | | Eurostat Eurozone HICP Ex Tobacco Unrevised Series NSA | | At Maturity | | | 1.339 | | | | At Maturity | | | | 03/15/2027 | | | | EUR | | | | 6,642,400 | | | | — | | | | (69,638 | ) | | | (69,638 | ) |
Receive | | Eurostat Eurozone HICP Ex Tobacco Unrevised Series NSA | | At Maturity | | | 1.360 | | | | At Maturity | | | | 03/15/2027 | | | | EUR | | | | 1,660,600 | | | | — | | | | (13,506 | ) | | | (13,506 | ) |
Receive | | Eurostat Eurozone HICP Ex Tobacco Unrevised Series NSA | | At Maturity | | | 1.364 | | | | At Maturity | | | | 04/15/2027 | | | | EUR | | | | 1,755,000 | | | | — | | | | (12,701 | ) | | | (12,701 | ) |
Receive | | Eurostat Eurozone HICP Ex Tobacco Unrevised Series NSA | | At Maturity | | | 1.375 | | | | At Maturity | | | | 07/15/2027 | | | | EUR | | | | 2,754,047 | | | | — | | | | (25,173 | ) | | | (25,173 | ) |
Receive | | Eurostat Eurozone HICP Ex Tobacco Unrevised Series NSA | | At Maturity | | | 1.377 | | | | At Maturity | | | | 03/15/2027 | | | | EUR | | | | 11,624,200 | | | | — | | | | (69,334 | ) | | | (69,334 | ) |
Receive | | Eurostat Eurozone HICP Ex Tobacco Unrevised Series NSA | | At Maturity | | | 1.380 | | | | At Maturity | | | | 07/15/2027 | | | | EUR | | | | 2,666,152 | | | | — | | | | (22,748 | ) | | | (22,748 | ) |
Receive | | Eurostat Eurozone HICP Ex Tobacco Unrevised Series NSA | | At Maturity | | | 1.381 | | | | At Maturity | | | | 03/15/2027 | | | | EUR | | | | 4,981,800 | | | | — | | | | (28,710 | ) | | | (28,710 | ) |
Receive | | Eurostat Eurozone HICP Ex Tobacco Unrevised Series NSA | | At Maturity | | | 1.388 | | | | At Maturity | | | | 07/15/2027 | | | | EUR | | | | 3,984,578 | | | | — | | | | (29,963 | ) | | | (29,963 | ) |
Receive | | Eurostat Eurozone HICP Ex Tobacco Unrevised Series NSA | | At Maturity | | | 1.391 | | | | At Maturity | | | | 07/15/2027 | | | | EUR | | | | 1,321,356 | | | | — | | | | (9,470 | ) | | | (9,470 | ) |
Receive | | Eurostat Eurozone HICP Ex Tobacco Unrevised Series NSA | | At Maturity | | | 1.405 | | | | At Maturity | | | | 07/15/2027 | | | | EUR | | | | 2,666,151 | | | | — | | | | (14,615 | ) | | | (14,615 | ) |
Receive | | Eurostat Eurozone HICP Ex Tobacco Unrevised Series NSA | | At Maturity | | | 1.406 | | | | At Maturity | | | | 07/15/2027 | | | | EUR | | | | 3,999,227 | | | | — | | | | (21,497 | ) | | | (21,497 | ) |
Receive | | Eurostat Eurozone HICP Ex Tobacco Unrevised Series NSA | | At Maturity | | | 1.420 | | | | At Maturity | | | | 05/15/2027 | | | | EUR | | | | 1,465,000 | | | | — | | | | (1,340 | ) | | | (1,340 | ) |
Receive | | Eurostat Eurozone HICP Ex Tobacco Unrevised Series NSA | | At Maturity | | | 1.462 | | | | At Maturity | | | | 08/15/2027 | | | | EUR | | | | 6,650,145 | | | | — | | | | (5,579 | ) | | | (5,579 | ) |
See accompanying Notes to Consolidated Financial Statements which are an integral part of the financial statements.
40 Invesco Global Targeted Returns Fund
| | | | | | | | | | | | | | | | | | | | | | | | | | | | | | | | | | | | | | |
| Centrally Cleared Inflation Swap Agreements(s)—(continued) | |
Pay/Receive
Floating Rate | | Floating Rate Index | | Payment
Frequency | | | Fixed
Rate | | | Payment
Frequency | | | Maturity
Date | | | Notional
Value | | | Upfront
Payments
Paid
(Received) | | | Value | | | Unrealized
Appreciation
(Depreciation)(t) | |
Receive | | Eurostat Eurozone HICP Ex Tobacco Unrevised Series NSA | | | At Maturity | | | | 1.465 | % | | | At Maturity | | | | 08/15/2027 | | | | EUR | | | | 2,996,344 | | | $ | — | | | $ | (1,524 | ) | | $ | (1,524 | ) |
Receive | | United States CPI Urban Consumers NSA | | | At Maturity | | | | 2.055 | | | | At Maturity | | | | 06/08/2027 | | | | USD | | | | 3,860,000 | | | | — | | | | (27,485 | ) | | | (27,485 | ) |
Receive | | United States CPI Urban Consumers NSA | | | At Maturity | | | | 2.081 | | | | At Maturity | | | | 05/18/2027 | | | | USD | | | | 3,154,000 | | | | — | | | | (7,484 | ) | | | (7,484 | ) |
Receive | | United States CPI Urban Consumers NSA | | | At Maturity | | | | 2.093 | | | | At Maturity | | | | 06/07/2027 | | | | USD | | | | 819,000 | | | | — | | | | (2,750 | ) | | | (2,750 | ) |
Receive | | United States CPI Urban Consumers NSA | | | At Maturity | | | | 2.165 | | | | At Maturity | | | | 10/25/2027 | | | | USD | | | | 693,000 | | | | — | | | | (286 | ) | | | (286 | ) |
Receive | | United States CPI Urban Consumers NSA | | | At Maturity | | | | 2.170 | | | | At Maturity | | | | 09/18/2027 | | | | USD | | | | 437,000 | | | | — | | | | (32 | ) | | | (32 | ) |
Receive | | United Kingdom RPI | | | At Maturity | | | | 3.321 | | | | At Maturity | | | | 08/15/2027 | | | | GBP | | | | 334,383 | | | | — | | | | (5,782 | ) | | | (5,782 | ) |
Receive | | United Kingdom RPI | | | At Maturity | | | | 3.335 | | | | At Maturity | | | | 08/15/2027 | | | | GBP | | | | 839,930 | | | | — | | | | (12,721 | ) | | | (12,721 | ) |
Receive | | United Kingdom RPI | | | At Maturity | | | | 3.343 | | | | At Maturity | | | | 08/15/2027 | | | | GBP | | | | 426,036 | | | | — | | | | (5,962 | ) | | | (5,962 | ) |
Receive | | United Kingdom RPI | | | At Maturity | | | | 3.343 | | | | At Maturity | | | | 08/15/2027 | | | | GBP | | | | 426,035 | | | | — | | | | (5,961 | ) | | | (5,961 | ) |
Receive | | United Kingdom RPI | | | At Maturity | | | | 3.352 | | | | At Maturity | | | | 10/15/2027 | | | | GBP | | | | 1,109,860 | | | | — | | | | (3,752 | ) | | | (3,752 | ) |
Receive | | United Kingdom RPI | | | At Maturity | | | | 3.353 | | | | At Maturity | | | | 08/15/2027 | | | | GBP | | | | 426,036 | | | | — | | | | (5,305 | ) | | | (5,305 | ) |
Receive | | United Kingdom RPI | | | At Maturity | | | | 3.370 | | | | At Maturity | | | | 06/15/2027 | | | | GBP | | | | 255,000 | | | | — | | | | (2,703 | ) | | | (2,703 | ) |
Receive | | United Kingdom RPI | | | At Maturity | | | | 3.374 | | | | At Maturity | | | | 08/15/2027 | | | | GBP | | | | 972,670 | | | | — | | | | (8,915 | ) | | | (8,915 | ) |
Receive | | United Kingdom RPI | | | At Maturity | | | | 3.378 | | | | At Maturity | | | | 08/15/2027 | | | | GBP | | | | 972,670 | | | | — | | | | (8,350 | ) | | | (8,350 | ) |
Receive | | United Kingdom RPI | | | At Maturity | | | | 3.411 | | | | At Maturity | | | | 05/15/2027 | | | | GBP | | | | 1,022,000 | | | | — | | | | (447 | ) | | | (447 | ) |
Receive | | United Kingdom RPI | | | At Maturity | | | | 3.485 | | | | At Maturity | | | | 06/15/2047 | | | | GBP | | | | 102,000 | | | | — | | | | (1,533 | ) | | | (1,533 | ) |
Subtotal — Depreciation | | | | — | | | | (688,515 | ) | | | (688,515 | ) |
Subtotal — Centrally Cleared Inflation Swap Agreements | | | | — | | | | (171,900 | ) | | | (171,900 | ) |
Total — Interest Rate and Inflation Swap Agreements — Interest Rate Risk | | | $ | — | | | $ | (60,534 | ) | | $ | (60,534 | ) |
| (s) | Inflation swap agreements collateralized by $1,673,548 cash held with Deutsche Bank Securities Inc., Goldman Sachs International and Morgan Stanley Capital Services, LLC. |
| (t) | The daily variation margin receivable (payable) at period end is recorded in the Consolidated Statement of Assets and Liabilities. |
| | | | | | | | | | | | | | | | | | | | | | | | | | |
| Open Over-The-Counter Variance Swap Agreements | |
| Counterparty | | Reference Entity | | Pay/Receive
Variance | | | Volatility
Strike Rate | | | Maturity
Date | | | | | | Notional
Value | | | Unrealized
Appreciation
(Depreciation) | |
BNP Paribas S.A. | | S&P 500 Index | | | Pay | | | | 17.25 | % | | | December-2017 | | | | USD | | | | 7,143 | | | $ | 49,023 | |
BNP Paribas S.A. | | S&P 500 Index | | | Pay | | | | 17.65 | | | | December-2018 | | | | USD | | | | 6,188 | | | | 15,596 | |
BNP Paribas S.A. | | S&P 500 Index | | | Pay | | | | 17.75 | | | | December-2018 | | | | USD | | | | 2,071 | | | | 5,232 | |
BNP Paribas S.A. | | S&P 500 Index | | | Pay | | | | 19.80 | | | | December-2017 | | | | USD | | | | 7,175 | | | | 60,578 | |
Citigroup Global Markets Inc. | | KOSPI 200 Index | | | Pay | | | | 17.60 | | | | December-2017 | | | | KRW | | | | 4,414,436 | | | | 21,789 | |
Citigroup Global Markets Inc. | | S&P 500 Index | | | Pay | | | | 13.50 | | | | December-2017 | | | | USD | | | | 3,601 | | | | 15,420 | |
Citigroup Global Markets Inc. | | S&P 500 Index | | | Pay | | | | 14.05 | | | | December-2017 | | | | USD | | | | 3,112 | | | | 14,626 | |
Citigroup Global Markets Inc. | | S&P 500 Index | | | Pay | | | | 15.40 | | | | June-2018 | | | | USD | | | | 2,788 | | | | 6,002 | |
Citigroup Global Markets Inc. | | S&P 500 Index | | | Pay | | | | 16.26 | | | | June-2018 | | | | USD | | | | 2,334 | | | | 7,065 | |
Citigroup Global Markets Inc. | | S&P 500 Index | | | Pay | | | | 16.65 | | | | December-2018 | | | | USD | | | | 3,485 | | | | 4,870 | |
Citigroup Global Markets Inc. | | S&P 500 Index | | | Pay | | | | 17.41 | | | | December-2018 | | | | USD | | | | 3,890 | | | | 8,549 | |
Citigroup Global Markets Inc. | | S&P 500 Index | | | Pay | | | | 17.55 | | | | December-2018 | | | | USD | | | | 3,886 | | | | 10,887 | |
Goldman Sachs International | | S&P 500 Index | | | Pay | | | | 14.80 | | | | December-2017 | | | | USD | | | | 6,535 | | | | 34,357 | |
See accompanying Notes to Consolidated Financial Statements which are an integral part of the financial statements.
41 Invesco Global Targeted Returns Fund
| | | | | | | | | | | | | | | | | | | | | | | | | | | | |
| Open Over-The-Counter Variance Swap Agreements—(continued) | |
| Counterparty | | Reference Entity | | | Pay/Receive
Variance | | | Volatility
Strike Rate | | | Maturity
Date | | | | | | Notional
Value | | | Unrealized
Appreciation
(Depreciation) | |
Goldman Sachs International | | | S&P 500 Index | | | | Pay | | | | 18.75 | % | | | December-2017 | | | | USD | | | | 2,659 | | | $ | 20,841 | |
Goldman Sachs International | | | S&P 500 Index | | | | Pay | | | | 20.50 | | | | December-2017 | | | | USD | | | | 9,024 | | | | 78,760 | |
Goldman Sachs International | | | S&P 500 Index | | | | Pay | | | | 20.60 | | | | December-2017 | | | | USD | | | | 8,661 | | | | 74,634 | |
Goldman Sachs International | | | S&P 500 Index | | | | Pay | | | | 21.15 | | | | December-2017 | | | | USD | | | | 5,408 | | | | 48,530 | |
J.P. Morgan Chase Bank, N.A. | | | Hang Seng China Enterprise Index | | | | Pay | | | | 22.30 | | | | December-2017 | | | | HKD | | | | 109,308 | | | | 48,552 | |
J.P. Morgan Chase Bank, N.A. | | | Hang Seng China Enterprise Index | | | | Pay | | | | 26.65 | | | | December-2017 | | | | HKD | | | | 316,698 | | | | 361,228 | |
J.P. Morgan Chase Bank, N.A. | | | Hang Seng China Enterprise Index | | | | Pay | | | | 26.75 | | | | December-2017 | | | | HKD | | | | 105,566 | | | | 121,443 | |
J.P. Morgan Chase Bank, N.A. | | | KOSPI 200 Index | | | | Pay | | | | 16.90 | | | | December-2017 | | | | KRW | | | | 26,414,363 | | | | 110,965 | |
J.P. Morgan Chase Bank, N.A. | | | S&P 500 Index | | | | Pay | | | | 13.93 | | | | December-2017 | | | | USD | | | | 3,713 | | | | 16,975 | |
J.P. Morgan Chase Bank, N.A. | | | S&P 500 Index | | | | Pay | | | | 13.98 | | | | December-2017 | | | | USD | | | | 4,951 | | | | 22,800 | |
J.P. Morgan Chase Bank, N.A. | | | S&P 500 Index | | | | Pay | | | | 14.80 | | | | December-2017 | | | | USD | | | | 3,297 | | | | 17,530 | |
J.P. Morgan Chase Bank, N.A. | | | S&P 500 Index | | | | Pay | | | | 14.90 | | | | December-2017 | | | | USD | | | | 3,732 | | | | 19,517 | |
J.P. Morgan Chase Bank, N.A. | | | S&P 500 Index | | | | Pay | | | | 14.96 | | | | December-2017 | | | | USD | | | | 2,994 | | | | 15,873 | |
J.P. Morgan Chase Bank, N.A. | | | S&P 500 Index | | | | Pay | | | | 15.11 | | | | December-2017 | | | | USD | | | | 9,149 | | | | 49,796 | |
J.P. Morgan Chase Bank, N.A. | | | S&P 500 Index | | | | Pay | | | | 16.00 | | | | December-2017 | | | | USD | | | | 1,536 | | | | 9,268 | |
J.P. Morgan Chase Bank, N.A. | | | S&P 500 Index | | | | Pay | | | | 16.32 | | | | December-2017 | | | | USD | | | | 3,242 | | | | 20,150 | |
J.P. Morgan Chase Bank, N.A. | | | S&P 500 Index | | | | Pay | | | | 16.45 | | | | December-2017 | | | | USD | | | | 7,659 | | | | 49,099 | |
J.P. Morgan Chase Bank, N.A. | | | S&P 500 Index | | | | Pay | | | | 16.56 | | | | December-2017 | | | | USD | | | | 17,560 | | | | 113,539 | |
J.P. Morgan Chase Bank, N.A. | | | S&P 500 Index | | | | Pay | | | | 16.70 | | | | December-2018 | | | | USD | | | | 5,204 | | | | 1,311 | |
J.P. Morgan Chase Bank, N.A. | | | S&P 500 Index | | | | Pay | | | | 16.90 | | | | December-2018 | | | | USD | | | | 6,548 | | | | 5,106 | |
J.P. Morgan Chase Bank, N.A. | | | S&P 500 Index | | | | Pay | | | | 17.10 | | | | December-2017 | | | | USD | | | | 3,333 | | | | 22,574 | |
J.P. Morgan Chase Bank, N.A. | | | S&P 500 Index | | | | Pay | | | | 17.31 | | | | December-2018 | | | | USD | | | | 2,784 | | | | 3,533 | |
J.P. Morgan Chase Bank, N.A. | | | S&P 500 Index | | | | Pay | | | | 17.45 | | | | December-2018 | | | | USD | | | | 4,851 | | | | 7,605 | |
J.P. Morgan Chase Bank, N.A. | | | S&P 500 Index | | | | Pay | | | | 17.70 | | | | December-2017 | | | | USD | | | | 10,317 | | | | 74,178 | |
J.P. Morgan Chase Bank, N.A. | | | S&P 500 Index | | | | Pay | | | | 17.95 | | | | December-2018 | | | | USD | | | | 23,318 | | | | 74,150 | |
J.P. Morgan Chase Bank, N.A. | | | S&P 500 Index | | | | Pay | | | | 18.80 | | | | December-2017 | | | | USD | | | | 6,094 | | | | 47,751 | |
J.P. Morgan Chase Bank, N.A. | | | S&P 500 Index | | | | Pay | | | | 19.55 | | | | December-2017 | | | | USD | | | | 7,945 | | | | 66,153 | |
J.P. Morgan Chase Bank, N.A. | | | S&P 500 Index | | | | Pay | | | | 19.90 | | | | December-2017 | | | | USD | | | | 8,054 | | | | 68,384 | |
J.P. Morgan Chase Bank, N.A. | | | S&P 500 Index | | | | Pay | | | | 20.09 | | | | December-2017 | | | | USD | | | | 4,958 | | | | 41,407 | |
J.P. Morgan Chase Bank, N.A. | | | S&P 500 Index | | | | Pay | | | | 20.20 | | | | December-2017 | | | | USD | | | | 15,837 | | | | 136,325 | |
J.P. Morgan Chase Bank, N.A. | | | S&P 500 Index | | | | Pay | | | | 20.36 | | | | December-2017 | | | | USD | | | | 19,225 | | | | 166,538 | |
J.P. Morgan Chase Bank, N.A. | | | S&P 500 Index | | | | Pay | | | | 20.60 | | | | December-2017 | | | | USD | | | | 11,548 | | | | 99,512 | |
J.P. Morgan Chase Bank, N.A. | | | S&P 500 Index | | | | Pay | | | | 20.65 | | | | December-2017 | | | | USD | | | | 9,155 | | | | 80,825 | |
J.P. Morgan Chase Bank, N.A. | | | S&P 500 Index | | | | Pay | | | | 20.73 | | | | December-2017 | | | | USD | | | | 8,762 | | | | 75,916 | |
J.P. Morgan Chase Bank, N.A. | | | S&P 500 Index | | | | Pay | | | | 20.79 | | | | December-2017 | | | | USD | | | | 11,417 | | | | 100,382 | |
J.P. Morgan Chase Bank, N.A. | | | S&P 500 Index | | | | Pay | | | | 21.25 | | | | December-2017 | | | | USD | | | | 14,422 | | | | 130,247 | |
Morgan Stanley Capital Services LLC | | | S&P 500 Index | | | | Pay | | | | 24.58 | | | | December-2017 | | | | USD | | | | 17,827 | | | | 182,447 | |
Societe Generale | | | Hang Seng China Enterprise Index | | | | Pay | | | | 20.40 | | | | December-2017 | | | | HKD | | | | 54,619 | | | | 11,385 | |
Societe Generale | | | Hang Seng China Enterprise Index | | | | Pay | | | | 21.65 | | | | December-2017 | | | | HKD | | | | 81,877 | | | | 29,607 | |
Societe Generale | | | Hang Seng China Enterprise Index | | | | Pay | | | | 22.56 | | | | December-2017 | | | | HKD | | | | 54,690 | | | | 25,823 | |
Societe Generale | | | Hang Seng Index | | | | Pay | | | | 22.01 | | | | December-2017 | | | | HKD | | | | 136,738 | | | | 135,285 | |
Societe Generale | | | KOSPI 200 Index | | | | Pay | | | | 17.25 | | | | December-2017 | | | | KRW | | | | 17,608,798 | | | | 77,909 | |
Societe Generale | | | KOSPI 200 Index | | | | Pay | | | | 17.50 | | | | December-2017 | | | | KRW | | | | 8,794,672 | | | | 42,469 | |
Societe Generale | | | KOSPI 200 Index | | | | Pay | | | | 17.60 | | | | December-2017 | | | | KRW | | | | 8,824,892 | | | | 43,558 | |
Societe Generale | | | KOSPI 200 Index | | | | Pay | | | | 20.00 | | | | December-2018 | | | | KRW | | | | 7,789,108 | | | | 14,220 | |
Societe Generale | | | S&P 500 Index | | | | Pay | | | | 14.90 | | | | December-2017 | | | | USD | | | | 15,056 | | | | 80,834 | |
Societe Generale | | | S&P 500 Index | | | | Pay | | | | 14.95 | | | | June-2018 | | | | USD | | | | 3,269 | | | | 5,275 | |
Societe Generale | | | S&P 500 Index | | | | Pay | | | | 15.85 | | | | December-2017 | | | | USD | | | | 15,469 | | | | 92,692 | |
Societe Generale | | | S&P 500 Index | | | | Pay | | | | 15.90 | | | | December-2017 | | | | USD | | | | 2,048 | | | | 12,230 | |
Societe Generale | | | S&P 500 Index | | | | Pay | | | | 15.90 | | | | June-2018 | | | | USD | | | | 2,617 | | | | 6,181 | |
See accompanying Notes to Consolidated Financial Statements which are an integral part of the financial statements.
42 Invesco Global Targeted Returns Fund
| | | | | | | | | | | | | | | | | | | | | | | | | | | | |
| Open Over-The-Counter Variance Swap Agreements—(continued) | |
| Counterparty | | Reference Entity | | | Pay/Receive
Variance | | | Volatility
Strike Rate | | | Maturity
Date | | | | | | Notional
Value | | | Unrealized
Appreciation
(Depreciation) | |
Societe Generale | | | S&P 500 Index | | | | Pay | | | | 15.95 | % | | | December-2018 | | | | USD | | | | 5,448 | | | $ | 3,468 | |
Societe Generale | | | S&P 500 Index | | | | Pay | | | | 16.85 | | | | December-2018 | | | | USD | | | | 4,362 | | | | 6,081 | |
Societe Generale | | | S&P 500 Index | | | | Pay | | | | 17.36 | | | | December-2018 | | | | USD | | | | 9,742 | | | | 12,993 | |
Societe Generale | | | S&P 500 Index | | | | Pay | | | | 17.70 | | | | December-2018 | | | | USD | | | | 23,318 | | | | 69,233 | |
Societe Generale | | | S&P 500 Index | | | | Pay | | | | 17.80 | | | | December-2018 | | | | USD | | | | 7,772 | | | | 23,365 | |
Societe Generale | | | S&P 500 Index | | | | Pay | | | | 18.15 | | | | December-2018 | | | | USD | | | | 2,666 | | | | 8,072 | |
Societe Generale | | | S&P 500 Index | | | | Pay | | | | 18.40 | | | | December-2017 | | | | USD | | | | 5,224 | | | | 39,670 | |
Societe Generale | | | S&P 500 Index | | | | Pay | | | | 18.50 | | | | December-2017 | | | | USD | | | | 4,654 | | | | 35,800 | |
Societe Generale | | | S&P 500 Index | | | | Pay | | | | 19.00 | | | | December-2017 | | | | USD | | | | 2,285 | | | | 18,170 | |
Societe Generale | | | S&P 500 Index | | | | Pay | | | | 19.25 | | | | December-2017 | | | | USD | | | | 14,636 | | | | 119,079 | |
Societe Generale | | | S&P 500 Index | | | | Pay | | | | 19.30 | | | | December-2017 | | | | USD | | | | 18,815 | | | | 153,567 | |
Societe Generale | | | S&P 500 Index | | | | Pay | | | | 19.85 | | | | December-2017 | | | | USD | | | | 4,602 | | | | 38,942 | |
Societe Generale | | | S&P 500 Index | | | | Pay | | | | 20.00 | | | | December-2017 | | | | USD | | | | 4,100 | | | | 35,084 | |
Societe Generale | | | S&P 500 Index | | | | Pay | | | | 20.15 | | | | December-2017 | | | | USD | | | | 10,986 | | | | 93,843 | |
Societe Generale | | | S&P 500 Index | | | | Pay | | | | 20.20 | | | | December-2017 | | | | USD | | | | 11,548 | | | | 96,825 | |
Societe Generale | | | S&P 500 Index | | | | Pay | | | | 20.30 | | | | December-2017 | | | | USD | | | | 16,022 | | | | 138,241 | |
Societe Generale | | | S&P 500 Index | | | | Pay | | | | 20.45 | | | | December-2017 | | | | USD | | | | 15,792 | | | | 137,377 | |
Societe Generale | | | S&P 500 Index | | | | Pay | | | | 20.65 | | | | December-2017 | | | | USD | | | | 6,524 | | | | 56,835 | |
Societe Generale | | | S&P 500 Index | | | | Pay | | | | 20.75 | | | | December-2017 | | | | USD | | | | 3,410 | | | | 30,351 | |
Societe Generale | | | S&P 500 Index | | | | Pay | | | | 20.90 | | | | December-2017 | | | | USD | | | | 5,007 | | | | 43,850 | |
Societe Generale | | | S&P 500 Index | | | | Pay | | | | 21.20 | | | | December-2017 | | | | USD | | | | 12,125 | | | | 111,090 | |
UBS | | | Hang Seng China Enterprise Index | | | | Pay | | | | 20.15 | | | | December-2017 | | | | HKD | | | | 40,283 | | | | 7,204 | |
UBS | | | Hang Seng China Enterprise Index | | | | Pay | | | | 21.77 | | | | December-2017 | | | | HKD | | | | 81,877 | | | | 30,698 | |
UBS | | | KOSPI 200 Index | | | | Pay | | | | 16.40 | | | | December-2017 | | | | KRW | | | | 10,458,789 | | | | 43,793 | |
UBS | | | KOSPI 200 Index | | | | Pay | | | | 16.70 | | | | December-2017 | | | | KRW | | | | 17,588,568 | | | | 76,164 | |
UBS | | | KOSPI 200 Index | | | | Pay | | | | 17.50 | | | | December-2017 | | | | KRW | | | | 4,414,527 | | | | 21,519 | |
UBS | | | KOSPI 200 Index | | | | Pay | | | | 19.00 | | | | December-2018 | | | | KRW | | | | 7,721,467 | | | | 7,188 | |
UBS | | | KOSPI 200 Index | | | | Pay | | | | 19.60 | | | | December-2018 | | | | KRW | | | | 7,712,584 | | | | 13,089 | |
UBS | | | KOSPI 200 Index | | | | Pay | | | | 19.70 | | | | December-2018 | | | | KRW | | | | 4,834,372 | | | | 8,585 | |
UBS | | | KOSPI 200 Index | | | | Pay | | | | 20.30 | | | | December-2018 | | | | KRW | | | | 13,155,600 | | | | 40,414 | |
UBS | | | S&P 500 Index | | | | Pay | | | | 14.60 | | | | December-2017 | | | | USD | | | | 2,898 | | | | 14,714 | |
UBS | | | S&P 500 Index | | | | Pay | | | | 14.71 | | | | December-2017 | | | | USD | | | | 1,873 | | | | 9,851 | |
UBS | | | S&P 500 Index | | | | Pay | | | | 14.80 | | | | June-2018 | | | | USD | | | | 4,359 | | | | 6,454 | |
UBS | | | S&P 500 Index | | | | Pay | | | | 14.85 | | | | December-2017 | | | | USD | | | | 2,245 | | | | 11,743 | |
UBS | | | S&P 500 Index | | | | Pay | | | | 14.90 | | | | December-2017 | | | | USD | | | | 7,528 | | | | 40,417 | |
UBS | | | S&P 500 Index | | | | Pay | | | | 15.25 | | | | June-2018 | | | | USD | | | | 2,091 | | | | 4,233 | |
UBS | | | S&P 500 Index | | | | Pay | | | | 15.61 | | | | June-2018 | | | | USD | | | | 2,701 | | | | 6,576 | |
UBS | | | S&P 500 Index | | | | Pay | | | | 15.90 | | | | June-2018 | | | | USD | | | | 3,490 | | | | 8,243 | |
UBS | | | S&P 500 Index | | | | Pay | | | | 16.10 | | | | December-2017 | | | | USD | | | | 8,644 | | | | 52,547 | |
UBS | | | S&P 500 Index | | | | Pay | | | | 16.20 | | | | December-2017 | | | | USD | | | | 2,560 | | | | 15,765 | |
UBS | | | S&P 500 Index | | | | Pay | | | | 16.96 | | | | December-2018 | | | | USD | | | | 4,501 | | | | 7,913 | |
UBS | | | S&P 500 Index | | | | Pay | | | | 17.20 | | | | December-2018 | | | | USD | | | | 9,701 | | | | 13,027 | |
UBS | | | S&P 500 Index | | | | Pay | | | | 17.40 | | | | December-2018 | | | | USD | | | | 3,742 | | | | 10,020 | |
UBS | | | S&P 500 Index | | | | Pay | | | | 17.60 | | | | December-2018 | | | | USD | | | | 3,887 | | | | 11,050 | |
UBS | | | S&P 500 Index | | | | Pay | | | | 18.00 | | | | December-2018 | | | | USD | | | | 24,915 | | | | 78,886 | |
UBS | | | Hang Seng China Enterprise Index | | | | Receive | | | | 25.00 | | | | December-2018 | | | | HKD | | | | 51,858 | | | | 1,227 | |
Subtotal — Appreciation | | | | | | | | | | | | | | | | | | | | | | | | | | | 5,228,562 | |
BNP Paribas S.A. | | | Hang Seng China Enterprise Index | | | | Receive | | | | 29.09 | | | | December-2017 | | | | HKD | | | | 38,937 | | | | (52,837 | ) |
BNP Paribas S.A. | | | Hang Seng China Enterprise Index | | | | Receive | | | | 34.67 | | | | December-2017 | | | | HKD | | | | 27,121 | | | | (48,612 | ) |
BNP Paribas S.A. | | | Hang Seng Index | | | | Receive | | | | 20.29 | | | | December-2017 | | | | HKD | | | | 22,171 | | | | (18,306 | ) |
See accompanying Notes to Consolidated Financial Statements which are an integral part of the financial statements.
43 Invesco Global Targeted Returns Fund
| | | | | | | | | | | | | | | | | | | | | | | | | | |
| Open Over-The-Counter Variance Swap Agreements—(continued) | |
| Counterparty | | Reference Entity | | Pay/Receive
Variance | | | Volatility
Strike Rate | | | Maturity
Date | | | | | | Notional
Value | | | Unrealized
Appreciation
(Depreciation) | |
BNP Paribas S.A. | | KOSPI 200 Index | | | Receive | | | | 17.19 | % | | | December-2017 | | | | KRW | | | | 7,833,404 | | | $ | (35,979 | ) |
BNP Paribas S.A. | | KOSPI 200 Index | | | Receive | | | | 19.89 | | | | December-2018 | | | | KRW | | | | 3,322,882 | | | | (8,615 | ) |
BNP Paribas S.A. | | KOSPI 200 Index | | | Receive | | | | 20.05 | | | | December-2017 | | | | KRW | | | | 7,086,103 | | | | (46,150 | ) |
BNP Paribas S.A. | | KOSPI 200 Index | | | Receive | | | | 20.19 | | | | December-2018 | | | | KRW | | | | 3,470,917 | | | | (9,304 | ) |
Citigroup Global Markets Inc. | | Hang Seng China Enterprise Index | | | Receive | | | | 20.54 | | | | December-2017 | | | | HKD | | | | 21,612 | | | | (8,281 | ) |
Citigroup Global Markets Inc. | | Hang Seng China Enterprise Index | | | Receive | | | | 20.83 | | | | December-2017 | | | | HKD | | | | 20,528 | | | | (8,929 | ) |
Citigroup Global Markets Inc. | | Hang Seng China Enterprise Index | | | Receive | | | | 22.72 | | | | June-2018 | | | | HKD | | | | 20,501 | | | | (2,911 | ) |
Citigroup Global Markets Inc. | | Hang Seng Index | | | Receive | | | | 19.87 | | | | June-2018 | | | | HKD | | | | 19,853 | | | | (5,969 | ) |
Citigroup Global Markets Inc. | | KOSPI 200 Index | | | Receive | | | | 18.72 | | | | December-2018 | | | | KRW | | | | 1,008,074 | | | | (1,389 | ) |
Citigroup Global Markets Inc. | | KOSPI 200 Index | | | Receive | | | | 19.59 | | | | December-2018 | | | | KRW | | | | 2,276,485 | | | | (4,997 | ) |
Citigroup Global Markets Inc. | | KOSPI 200 Index | | | Receive | | | | 19.85 | | | | December-2018 | | | | KRW | | | | 4,414,436 | | | | (12,917 | ) |
Citigroup Global Markets Inc. | | S&P 500 Index | | | Receive | | | | 15.00 | | | | December-2017 | | | | USD | | | | 3,886 | | | | (20,703 | ) |
Citigroup Global Markets Inc. | | S&P 500 Index | | | Receive | | | | 17.62 | | | | December-2018 | | | | USD | | | | 14,398 | | | | (25,353 | ) |
Goldman Sachs International | | Hang Seng China Enterprise Index | | | Receive | | | | 29.65 | | | | December-2017 | | | | HKD | | | | 33,595 | | | | (45,387 | ) |
Goldman Sachs International | | Hang Seng China Enterprise Index | | | Receive | | | | 30.20 | | | | December-2017 | | | | HKD | | | | 38,165 | | | | (53,135 | ) |
Goldman Sachs International | | Hang Seng China Enterprise Index | | | Receive | | | | 30.85 | | | | December-2017 | | | | HKD | | | | 24,602 | | | | (35,667 | ) |
Goldman Sachs International | | Hang Seng China Enterprise Index | | | Receive | | | | 34.93 | | | | December-2017 | | | | HKD | | | | 15,094 | | | | (27,354 | ) |
Goldman Sachs International | | Hang Seng China Enterprise Index | | | Receive | | | | 35.59 | | | | December-2017 | | | | HKD | | | | 100,975 | | | | (188,052 | ) |
Goldman Sachs International | | Hang Seng China Enterprise Index | | | Receive | | | | 35.90 | | | | December-2017 | | | | HKD | | | | 27,237 | | | | (51,364 | ) |
Goldman Sachs International | | KOSPI 200 Index | | | Receive | | | | 17.25 | | | | December-2017 | | | | KRW | | | | 7,697,003 | | | | (33,909 | ) |
Goldman Sachs International | | KOSPI 200 Index | | | Receive | | | | 20.30 | | | | December-2017 | | | | KRW | | | | 8,164,924 | | | | (52,971 | ) |
Goldman Sachs International | | KOSPI 200 Index | | | Receive | | | | 21.10 | | | | December-2017 | | | | KRW | | | | 6,109,726 | | | | (42,177 | ) |
HSBC New York | | Hang Seng China Enterprise Index | | | Receive | | | | 42.60 | | | | December-2017 | | | | HKD | | | | 54,382 | | | | (129,415 | ) |
J.P. Morgan Chase Bank, N.A. | | Hang Seng China Enterprise Index | | | Receive | | | | 20.92 | | | | December-2017 | | | | HKD | | | | 34,859 | | | | (16,093 | ) |
J.P. Morgan Chase Bank, N.A. | | Hang Seng China Enterprise Index | | | Receive | | | | 21.13 | | | | December-2017 | | | | HKD | | | | 24,681 | | | | (12,698 | ) |
J.P. Morgan Chase Bank, N.A. | | Hang Seng China Enterprise Index | | | Receive | | | | 21.14 | | | | December-2017 | | | | HKD | | | | 42,525 | | | | (24,173 | ) |
J.P. Morgan Chase Bank, N.A. | | Hang Seng China Enterprise Index | | | Receive | | | | 21.15 | | | | December-2017 | | | | HKD | | | | 7,957 | | | | (4,646 | ) |
J.P. Morgan Chase Bank, N.A. | | Hang Seng China Enterprise Index | | | Receive | | | | 21.26 | | | | December-2017 | | | | HKD | | | | 39,552 | | | | (23,173 | ) |
J.P. Morgan Chase Bank, N.A. | | Hang Seng China Enterprise Index | | | Receive | | | | 23.99 | | | | June-2018 | | | | HKD | | | | 15,696 | | | | (3,811 | ) |
J.P. Morgan Chase Bank, N.A. | | Hang Seng China Enterprise Index | | | Receive | | | | 24.04 | | | | December-2017 | | | | HKD | | | | 20,690 | | | | (18,493 | ) |
J.P. Morgan Chase Bank, N.A. | | Hang Seng China Enterprise Index | | | Receive | | | | 24.39 | | | | December-2017 | | | | HKD | | | | 20,265 | | | | (18,487 | ) |
J.P. Morgan Chase Bank, N.A. | | Hang Seng China Enterprise Index | | | Receive | | | | 25.04 | | | | December-2017 | | | | HKD | | | | 25,867 | | | | (25,417 | ) |
J.P. Morgan Chase Bank, N.A. | | Hang Seng China Enterprise Index | | | Receive | | | | 25.45 | | | | December-2017 | | | | HKD | | | | 12,935 | | | | (13,242 | ) |
J.P. Morgan Chase Bank, N.A. | | Hang Seng China Enterprise Index | | | Receive | | | | 25.59 | | | | December-2018 | | | | HKD | | | | 13,305 | | | | (653 | ) |
J.P. Morgan Chase Bank, N.A. | | Hang Seng China Enterprise Index | | | Receive | | | | 25.64 | | | | December-2017 | | | | HKD | | | | 13,930 | | | | (14,513 | ) |
J.P. Morgan Chase Bank, N.A. | | Hang Seng China Enterprise Index | | | Receive | | | | 26.94 | | | | December-2017 | | | | HKD | | | | 51,698 | | | | (60,070 | ) |
J.P. Morgan Chase Bank, N.A. | | Hang Seng China Enterprise Index | | | Receive | | | | 29.06 | | | | December-2017 | | | | HKD | | | | 19,469 | | | | (26,275 | ) |
J.P. Morgan Chase Bank, N.A. | | Hang Seng China Enterprise Index | | | Receive | | | | 29.74 | | | | December-2017 | | | | HKD | | | | 26,799 | | | | (37,754 | ) |
J.P. Morgan Chase Bank, N.A. | | Hang Seng China Enterprise Index | | | Receive | | | | 30.09 | | | | December-2017 | | | | HKD | | | | 111,934 | | | | (156,383 | ) |
J.P. Morgan Chase Bank, N.A. | | Hang Seng China Enterprise Index | | | Receive | | | | 30.50 | | | | December-2017 | | | | HKD | | | | 42,751 | | | | (60,775 | ) |
J.P. Morgan Chase Bank, N.A. | | Hang Seng China Enterprise Index | | | Receive | | | | 30.63 | | | | December-2017 | | | | HKD | | | | 27,067 | | | | (38,624 | ) |
J.P. Morgan Chase Bank, N.A. | | Hang Seng China Enterprise Index | | | Receive | | | | 31.29 | | | | December-2017 | | | | HKD | | | | 25,465 | | | | (38,957 | ) |
J.P. Morgan Chase Bank, N.A. | | Hang Seng China Enterprise Index | | | Receive | | | | 31.45 | | | | December-2017 | | | | HKD | | | | 62,123 | | | | (95,823 | ) |
J.P. Morgan Chase Bank, N.A. | | Hang Seng China Enterprise Index | | | Receive | | | | 31.64 | | | | December-2017 | | | | HKD | | | | 39,789 | | | | (61,970 | ) |
J.P. Morgan Chase Bank, N.A. | | Hang Seng China Enterprise Index | | | Receive | | | | 34.19 | | | | December-2017 | | | | HKD | | | | 11,861 | | | | (20,824 | ) |
J.P. Morgan Chase Bank, N.A. | | Hang Seng China Enterprise Index | | | Receive | | | | 34.29 | | | | December-2017 | | | | HKD | | | | 33,920 | | | | (59,813 | ) |
J.P. Morgan Chase Bank, N.A. | | Hang Seng China Enterprise Index | | | Receive | | | | 35.24 | | | | December-2017 | | | | HKD | | | | 15,305 | | | | (28,097 | ) |
J.P. Morgan Chase Bank, N.A. | | Hang Seng Index | | | Receive | | | | 17.05 | | | | December-2017 | | | | HKD | | | | 26,949 | | | | (11,062 | ) |
J.P. Morgan Chase Bank, N.A. | | Hang Seng Index | | | Receive | | | | 17.19 | | | | December-2017 | | | | HKD | | | | 33,901 | | | | (17,178 | ) |
J.P. Morgan Chase Bank, N.A. | | Hang Seng Index | | | Receive | | | | 17.53 | | | | December-2017 | | | | HKD | | | | 14,889 | | | | (7,182 | ) |
See accompanying Notes to Consolidated Financial Statements which are an integral part of the financial statements.
44 Invesco Global Targeted Returns Fund
| | | | | | | | | | | | | | | | | | | | | | | | | | |
| Open Over-The-Counter Variance Swap Agreements—(continued) | |
| Counterparty | | Reference Entity | | Pay/Receive
Variance | | | Volatility
Strike Rate | | | Maturity
Date | | | | | | Notional
Value | | | Unrealized
Appreciation
(Depreciation) | |
J.P. Morgan Chase Bank, N.A. | | Hang Seng Index | | | Receive | | | | 19.26 | % | | | December-2017 | | | | HKD | | | | 29,385 | | | $ | (20,893 | ) |
J.P. Morgan Chase Bank, N.A. | | Hang Seng Index | | | Receive | | | | 19.39 | | | | December-2017 | | | | HKD | | | | 31,669 | | | | (23,488 | ) |
J.P. Morgan Chase Bank, N.A. | | Hang Seng Index | | | Receive | | | | 20.29 | | | | December-2017 | | | | HKD | | | | 19,271 | | | | (15,982 | ) |
J.P. Morgan Chase Bank, N.A. | | Hang Seng Index | | | Receive | | | | 20.64 | | | | December-2017 | | | | HKD | | | | 15,035 | | | | (13,093 | ) |
J.P. Morgan Chase Bank, N.A. | | Hang Seng Index | | | Receive | | | | 21.50 | | | | December-2018 | | | | HKD | | | | 35,751 | | | | (2,666 | ) |
J.P. Morgan Chase Bank, N.A. | | Hang Seng Index | | | Receive | | | | 21.85 | | | | December-2018 | | | | HKD | | | | 25,293 | | | | (1,994 | ) |
J.P. Morgan Chase Bank, N.A. | | Hang Seng Index | | | Receive | | | | 22.39 | | | | December-2018 | | | | HKD | | | | 40,215 | | | | (8,222 | ) |
J.P. Morgan Chase Bank, N.A. | | Hang Seng Index | | | Receive | | | | 22.44 | | | | December-2018 | | | | HKD | | | | 11,809 | | | | (2,237 | ) |
J.P. Morgan Chase Bank, N.A. | | Hang Seng Index | | | Receive | | | | 24.95 | | | | December-2017 | | | | HKD | | | | 36,337 | | | | (44,775 | ) |
J.P. Morgan Chase Bank, N.A. | | Hang Seng Index | | | Receive | | | | 25.08 | | | | December-2017 | | | | HKD | | | | 64,715 | | | | (77,185 | ) |
J.P. Morgan Chase Bank, N.A. | | Hang Seng Index | | | Receive | | | | 25.25 | | | | December-2017 | | | | HKD | | | | 27,496 | | | | (33,848 | ) |
J.P. Morgan Chase Bank, N.A. | | Hang Seng Index | | | Receive | | | | 25.60 | | | | December-2017 | | | | HKD | | | | 51,286 | | | | (63,679 | ) |
J.P. Morgan Chase Bank, N.A. | | Hang Seng Index | | | Receive | | | | 26.40 | | | | December-2017 | | | | HKD | | | | 23,155 | | | | (30,153 | ) |
J.P. Morgan Chase Bank, N.A. | | KOSPI 200 Index | | | Receive | | | | 18.79 | | | | December-2018 | | | | KRW | | | | 26,414,363 | | | | (54,229 | ) |
J.P. Morgan Chase Bank, N.A. | | KOSPI 200 Index | | | Receive | | | | 18.94 | | | | December-2017 | | | | KRW | | | | 2,999,226 | | | | (17,493 | ) |
J.P. Morgan Chase Bank, N.A. | | KOSPI 200 Index | | | Receive | | | | 19.75 | | | | December-2017 | | | | KRW | | | | 3,826,805 | | | | (24,401 | ) |
J.P. Morgan Chase Bank, N.A. | | KOSPI 200 Index | | | Receive | | | | 19.98 | | | | December-2017 | | | | KRW | | | | 4,400,800 | | | | (28,353 | ) |
J.P. Morgan Chase Bank, N.A. | | KOSPI 200 Index | | | Receive | | | | 20.28 | | | | December-2017 | | | | KRW | | | | 9,543,941 | | | | (61,826 | ) |
J.P. Morgan Chase Bank, N.A. | | KOSPI 200 Index | | | Receive | | | | 20.64 | | | | December-2017 | | | | KRW | | | | 3,928,560 | | | | (26,342 | ) |
J.P. Morgan Chase Bank, N.A. | | KOSPI 200 Index | | | Receive | | | | 20.74 | | | | December-2017 | | | | KRW | | | | 5,313,225 | | | | (35,741 | ) |
J.P. Morgan Chase Bank, N.A. | | KOSPI 200 Index | | | Receive | | | | 21.19 | | | | December-2017 | | | | KRW | | | | 9,170,873 | | | | (63,401 | ) |
J.P. Morgan Chase Bank, N.A. | | KOSPI 200 Index | | | Receive | | | | 21.28 | | | | December-2017 | | | | KRW | | | | 8,385,612 | | | | (58,734 | ) |
J.P. Morgan Chase Bank, N.A. | | KOSPI 200 Index | | | Receive | | | | 21.30 | | | | December-2017 | | | | KRW | | | | 5,469,899 | | | | (38,279 | ) |
J.P. Morgan Chase Bank, N.A. | | KOSPI 200 Index | | | Receive | | | | 21.45 | | | | December-2017 | | | | KRW | | | | 4,600,846 | | | | (32,649 | ) |
J.P. Morgan Chase Bank, N.A. | | S&P 500 Index | | | Receive | | | | 14.94 | | | | December-2017 | | | | USD | | | | 12,700 | | | | (65,323 | ) |
J.P. Morgan Chase Bank, N.A. | | S&P 500 Index | | | Receive | | | | 15.42 | | | | December-2017 | | | | USD | | | | 23,318 | | | | (131,509 | ) |
J.P. Morgan Chase Bank, N.A. | | S&P 500 Index | | | Receive | | | | 17.34 | | | | December-2017 | | | | USD | | | | 4,031 | | | | (27,819 | ) |
Morgan Stanley Capital Services LLC | | Hang Seng China Enterprise Index | | | Receive | | | | 32.25 | | | | December-2017 | | | | HKD | | | | 10,902 | | | | (17,502 | ) |
Morgan Stanley Capital Services LLC | | Hang Seng China Enterprise Index | | | Receive | | | | 34.80 | | | | December-2017 | | | | HKD | | | | 52,850 | | | | (95,253 | ) |
Societe Generale | | Hang Seng China Enterprise Index | | | Receive | | | | 22.69 | | | | December-2017 | | | | HKD | | | | 63,701 | | | | (46,966 | ) |
Societe Generale | | Hang Seng China Enterprise Index | | | Receive | | | | 23.33 | | | | December-2017 | | | | HKD | | | | 15,692 | | | | (12,911 | ) |
Societe Generale | | Hang Seng China Enterprise Index | | | Receive | | | | 25.95 | | | | December-2018 | | | | HKD | | | | 25,936 | | | | (3,245 | ) |
Societe Generale | | Hang Seng China Enterprise Index | | | Receive | | | | 26.00 | | | | December-2018 | | | | HKD | | | | 25,936 | | | | (3,388 | ) |
Societe Generale | | Hang Seng China Enterprise Index | | | Receive | | | | 26.09 | | | | December-2017 | | | | HKD | | | | 30,953 | | | | (33,270 | ) |
Societe Generale | | Hang Seng China Enterprise Index | | | Receive | | | | 27.78 | | | | December-2017 | | | | HKD | | | | 8,840 | | | | (10,966 | ) |
Societe Generale | | Hang Seng China Enterprise Index | | | Receive | | | | 28.54 | | | | December-2017 | | | | HKD | | | | 44,220 | | | | (57,787 | ) |
Societe Generale | | Hang Seng China Enterprise Index | | | Receive | | | | 29.10 | | | | December-2017 | | | | HKD | | | | 27,362 | | | | (37,076 | ) |
Societe Generale | | Hang Seng China Enterprise Index | | | Receive | | | | 29.55 | | | | December-2017 | | | | HKD | | | | 5,905 | | | | (8,211 | ) |
Societe Generale | | Hang Seng China Enterprise Index | | | Receive | | | | 29.89 | | | | December-2017 | | | | HKD | | | | 40,573 | | | | (56,188 | ) |
Societe Generale | | Hang Seng China Enterprise Index | | | Receive | | | | 29.93 | | | | December-2017 | | | | HKD | | | | 27,320 | | | | (38,241 | ) |
Societe Generale | | Hang Seng China Enterprise Index | | | Receive | | | | 30.42 | | | | December-2017 | | | | HKD | | | | 40,377 | | | | (57,491 | ) |
Societe Generale | | Hang Seng China Enterprise Index | | | Receive | | | | 30.73 | | | | December-2017 | | | | HKD | | | | 38,467 | | | | (56,062 | ) |
Societe Generale | | Hang Seng China Enterprise Index | | | Receive | | | | 32.10 | | | | December-2017 | | | | HKD | | | | 10,130 | | | | (16,144 | ) |
Societe Generale | | Hang Seng China Enterprise Index | | | Receive | | | | 33.25 | | | | December-2017 | | | | HKD | | | | 31,530 | | | | (53,072 | ) |
Societe Generale | | Hang Seng China Enterprise Index | | | Receive | | | | 35.10 | | | | December-2017 | | | | HKD | | | | 12,873 | | | | (23,496 | ) |
Societe Generale | | Hang Seng China Enterprise Index | | | Receive | | | | 35.35 | | | | December-2017 | | | | HKD | | | | 33,179 | | | | (61,188 | ) |
Societe Generale | | Hang Seng China Enterprise Index | | | Receive | | | | 36.75 | | | | December-2017 | | | | HKD | | | | 49,130 | | | | (95,793 | ) |
Societe Generale | | Hang Seng China Enterprise Index | | | Receive | | | | 39.80 | | | | December-2017 | | | | HKD | | | | 45,162 | | | | (98,272 | ) |
Societe Generale | | Hang Seng Index | | | Receive | | | | 17.68 | | | | December-2017 | | | | HKD | | | | 27,957 | | | | (15,759 | ) |
Societe Generale | | Hang Seng Index | | | Receive | | | | 18.69 | | | | December-2017 | | | | HKD | | | | 15,973 | | | | (10,688 | ) |
See accompanying Notes to Consolidated Financial Statements which are an integral part of the financial statements.
45 Invesco Global Targeted Returns Fund
| | | | | | | | | | | | | | | | | | | | | | | | | | |
| Open Over-The-Counter Variance Swap Agreements—(continued) | |
| Counterparty | | Reference Entity | | Pay/Receive
Variance | | | Volatility
Strike Rate | | | Maturity
Date | | | | | | Notional
Value | | | Unrealized
Appreciation
(Depreciation) | |
Societe Generale | | Hang Seng Index | | | Receive | | | | 19.00 | % | | | June-2018 | | | | HKD | | | | 29,185 | | | $ | (4,452 | ) |
Societe Generale | | Hang Seng Index | | | Receive | | | | 20.63 | | | | June-2018 | | | | HKD | | | | 12,274 | | | | (3,934 | ) |
Societe Generale | | Hang Seng Index | | | Receive | | | | 21.52 | | | | December-2017 | | | | HKD | | | | 26,531 | | | | (24,971 | ) |
Societe Generale | | Hang Seng Index | | | Receive | | | | 22.23 | | | | December-2017 | | | | HKD | | | | 33,234 | | | | (33,467 | ) |
Societe Generale | | Hang Seng Index | | | Receive | | | | 22.78 | | | | December-2017 | | | | HKD | | | | 20,626 | | | | (21,731 | ) |
Societe Generale | | Hang Seng Index | | | Receive | | | | 23.48 | | | | December-2017 | | | | HKD | | | | 53,065 | | | | (58,988 | ) |
Societe Generale | | Hang Seng Index | | | Receive | | | | 24.09 | | | | December-2017 | | | | HKD | | | | 26,533 | | | | (30,910 | ) |
Societe Generale | | Hang Seng Index | | | Receive | | | | 24.28 | | | | December-2017 | | | | HKD | | | | 90,205 | | | | (106,121 | ) |
Societe Generale | | Hang Seng Index | | | Receive | | | | 24.80 | | | | December-2017 | | | | HKD | | | | 64,593 | | | | (77,570 | ) |
Societe Generale | | Hang Seng Index | | | Receive | | | | 24.99 | | | | December-2017 | | | | HKD | | | | 50,717 | | | | (61,115 | ) |
Societe Generale | | Hang Seng Index | | | Receive | | | | 25.08 | | | | December-2017 | | | | HKD | | | | 38,488 | | | | (47,098 | ) |
Societe Generale | | Hang Seng Index | | | Receive | | | | 25.15 | | | | December-2017 | | | | HKD | | | | 58,617 | | | | (70,348 | ) |
Societe Generale | | Hang Seng Index | | | Receive | | | | 25.35 | | | | December-2017 | | | | HKD | | | | 50,597 | | | | (61,593 | ) |
Societe Generale | | Hang Seng Index | | | Receive | | | | 25.52 | | | | December-2017 | | | | HKD | | | | 63,930 | | | | (79,487 | ) |
Societe Generale | | Hang Seng Index | | | Receive | | | | 25.85 | | | | December-2017 | | | | HKD | | | | 41,245 | | | | (51,710 | ) |
Societe Generale | | Hang Seng Index | | | Receive | | | | 25.98 | | | | December-2017 | | | | HKD | | | | 47,871 | | | | (61,634 | ) |
Societe Generale | | KOSPI 200 Index | | | Receive | | | | 16.73 | | | | December-2017 | | | | KRW | | | | 2,447,572 | | | | (10,299 | ) |
Societe Generale | | KOSPI 200 Index | | | Receive | | | | 16.90 | | | | December-2017 | | | | KRW | | | | 8,664,244 | | | | (36,340 | ) |
Societe Generale | | KOSPI 200 Index | | | Receive | | | | 17.05 | | | | December-2017 | | | | KRW | | | | 5,320,074 | | | | (24,211 | ) |
Societe Generale | | KOSPI 200 Index | | | Receive | | | | 18.35 | | | | December-2018 | | | | KRW | | | | 3,878,625 | | | | (4,037 | ) |
Societe Generale | | KOSPI 200 Index | | | Receive | | | | 18.59 | | | | December-2017 | | | | KRW | | | | 4,902,073 | | | | (27,398 | ) |
Societe Generale | | KOSPI 200 Index | | | Receive | | | | 18.95 | | | | December-2017 | | | | KRW | | | | 13,267,226 | | | | (77,865 | ) |
Societe Generale | | KOSPI 200 Index | | | Receive | | | | 19.00 | | | | December-2018 | | | | KRW | | | | 17,608,798 | | | | (38,968 | ) |
Societe Generale | | KOSPI 200 Index | | | Receive | | | | 19.40 | | | | December-2018 | | | | KRW | | | | 8,794,672 | | | | (22,767 | ) |
Societe Generale | | KOSPI 200 Index | | | Receive | | | | 19.53 | | | | December-2017 | | | | KRW | | | | 8,117,144 | | | | (50,049 | ) |
Societe Generale | | KOSPI 200 Index | | | Receive | | | | 19.90 | | | | December-2018 | | | | KRW | | | | 8,824,892 | | | | (26,143 | ) |
Societe Generale | | KOSPI 200 Index | | | Receive | | | | 19.97 | | | | December-2018 | | | | KRW | | | | 4,560,014 | | | | (12,597 | ) |
Societe Generale | | KOSPI 200 Index | | | Receive | | | | 20.28 | | | | December-2018 | | | | KRW | | | | 4,951,830 | | | | (12,449 | ) |
Societe Generale | | KOSPI 200 Index | | | Receive | | | | 20.38 | | | | December-2017 | | | | KRW | | | | 7,005,983 | | | | (47,008 | ) |
Societe Generale | | KOSPI 200 Index | | | Receive | | | | 20.83 | | | | December-2017 | | | | KRW | | | | 7,959,537 | | | | (53,996 | ) |
Societe Generale | | KOSPI 200 Index | | | Receive | | | | 21.10 | | | | December-2017 | | | | KRW | | | | 9,222,065 | | | | (62,919 | ) |
Societe Generale | | KOSPI 200 Index | | | Receive | | | | 21.35 | | | | December-2017 | | | | KRW | | | | 7,267,477 | | | | (51,485 | ) |
Societe Generale | | KOSPI 200 Index | | | Receive | | | | 26.85 | | | | December-2017 | | | | KRW | | | | 21,545,172 | | | | (211,592 | ) |
Societe Generale | | S&P 500 Index | | | Receive | | | | 14.30 | | | | December-2017 | | | | USD | | | | 6,350 | | | | (30,496 | ) |
Societe Generale | | S&P 500 Index | | | Receive | | | | 14.60 | | | | December-2017 | | | | USD | | | | 9,525 | | | | (46,561 | ) |
Societe Generale | | S&P 500 Index | | | Receive | | | | 15.20 | | | | December-2017 | | | | USD | | | | 21,895 | | | | (118,752 | ) |
Societe Generale | | S&P 500 Index | | | Receive | | | | 15.30 | | | | December-2017 | | | | USD | | | | 15,545 | | | | (86,488 | ) |
UBS | | Hang Seng China Enterprise Index | | | Receive | | | | 21.09 | | | | December-2017 | | | | HKD | | | | 37,745 | | | | (16,594 | ) |
UBS | | Hang Seng China Enterprise Index | | | Receive | | | | 21.40 | | | | December-2017 | | | | HKD | | | | 53,251 | | | | (32,423 | ) |
UBS | | Hang Seng China Enterprise Index | | | Receive | | | | 22.28 | | | | June-2018 | | | | HKD | | | | 51,884 | | | | (3,530 | ) |
UBS | | Hang Seng China Enterprise Index | | | Receive | | | | 23.80 | | | | December-2017 | | | | HKD | | | | 34,282 | | | | (29,179 | ) |
UBS | | Hang Seng China Enterprise Index | | | Receive | | | | 24.35 | | | | June-2018 | | | | HKD | | | | 16,365 | | | | (4,813 | ) |
UBS | | Hang Seng China Enterprise Index | | | Receive | | | | 25.30 | | | | December-2018 | | | | HKD | | | | 51,871 | | | | (4,362 | ) |
UBS | | Hang Seng China Enterprise Index | | | Receive | | | | 26.04 | | | | December-2018 | | | | HKD | | | | 103,115 | | | | (16,698 | ) |
UBS | | Hang Seng Index | | | Receive | | | | 17.25 | | | | December-2017 | | | | HKD | | | | 27,471 | | | | (13,391 | ) |
UBS | | Hang Seng Index | | | Receive | | | | 17.29 | | | | December-2017 | | | | HKD | | | | 9,378 | | | | (4,855 | ) |
UBS | | Hang Seng Index | | | Receive | | | | 17.49 | | | | December-2017 | | | | HKD | | | | 17,390 | | | | (7,795 | ) |
UBS | | Hang Seng Index | | | Receive | | | | 19.29 | | | | June-2018 | | | | HKD | | | | 21,916 | | | | (4,442 | ) |
UBS | | Hang Seng Index | | | Receive | | | | 19.49 | | | | June-2018 | | | | HKD | | | | 18,235 | | | | (4,476 | ) |
UBS | | Hang Seng Index | | | Receive | | | | 21.68 | | | | December-2018 | | | | HKD | | | | 28,721 | | | | (2,220 | ) |
See accompanying Notes to Consolidated Financial Statements which are an integral part of the financial statements.
46 Invesco Global Targeted Returns Fund
| | | | | | | | | | | | | | | | | | | | | | | | | | | | |
| Open Over-The-Counter Variance Swap Agreements—(continued) | |
| Counterparty | | Reference Entity | | | Pay/Receive
Variance | | | Volatility
Strike Rate | | | Maturity
Date | | | | | | Notional
Value | | | Unrealized
Appreciation
(Depreciation) | |
UBS | | | Hang Seng Index | | | | Receive | | | | 21.79 | % | | | December-2018 | | | | HKD | | | | 18,601 | | | $ | (2,680 | ) |
UBS | | | KOSPI 200 Index | | | | Receive | | | | 17.30 | | | | December-2017 | | | | KRW | | | | 5,836,060 | | | | (25,920 | ) |
UBS | | | KOSPI 200 Index | | | | Receive | | | | 18.60 | | | | December-2018 | | | | KRW | | | | 17,588,568 | | | | (34,916 | ) |
UBS | | | KOSPI 200 Index | | | | Receive | | | | 19.00 | | | | December-2017 | | | | KRW | | | | 7,406,340 | | | | (40,954 | ) |
UBS | | | KOSPI 200 Index | | | | Receive | | | | 19.30 | | | | December-2018 | | | | KRW | | | | 10,458,789 | | | | (26,008 | ) |
UBS | | | KOSPI 200 Index | | | | Receive | | | | 19.44 | | | | December-2018 | | | | KRW | | | | 1,758,023 | | | | (3,565 | ) |
UBS | | | KOSPI 200 Index | | | | Receive | | | | 19.80 | | | | December-2018 | | | | KRW | | | | 4,414,527 | | | | (12,756 | ) |
UBS | | | KOSPI 200 Index | | | | Receive | | | | 19.95 | | | | December-2018 | | | | KRW | | | | 5,617,288 | | | | (16,243 | ) |
UBS | | | S&P 500 Index | | | | Receive | | | | 14.30 | | | | December-2017 | | | | USD | | | | 5,346 | | | | (25,674 | ) |
UBS | | | S&P 500 Index | | | | Receive | | | | 14.60 | | | | December-2017 | | | | USD | | | | 9,525 | | | | (46,561 | ) |
UBS | | | S&P 500 Index | | | | Receive | | | | 15.05 | | | | December-2017 | | | | USD | | | | 3,887 | | | | (20,833 | ) |
UBS | | | S&P 500 Index | | | | Receive | | | | 15.10 | | | | December-2017 | | | | USD | | | | 9,370 | | | | (50,138 | ) |
UBS | | | S&P 500 Index | | | | Receive | | | | 15.60 | | | | December-2017 | | | | USD | | | | 15,545 | | | | (89,163 | ) |
Subtotal — Depreciation | | | | | | | | | | | | | | | | | | | | | | | | | | | (6,167,890 | ) |
Total — Variance Swap Agreements—Equity Risk | | | | | | | | | | | | | | | | | | | $ | (939,328 | ) |
| | | | | | | | | | | | | | | | | | | | | | | | | | | | | | | | | | | | | | |
| Open Over-The-Counter Total Return Swap Agreements(u) | |
| Counterparty | | Pay/Receive | | | Reference Entity(v) | | Fixed
Rate | | | Payment
Frequency | | | Number of
Contracts | | | Maturity Date | | | Notional Value(w) | | | Upfront
Payments
Paid
(Received) | | | Value | | | Unrealized
Appreciation (Depreciation) | |
BNP Paribas S.A. | | | Receive | | | BNP Paribas DR Alpha ex-Agriculture and Livestock Index | | | 0.15 | % | | | Monthly | | | | 14,389 | | | | June-2018 | | | $ | 4,276,493 | | | $ | — | | | $ | 5,438 | | | $ | 5,438 | |
Macquarie Bank Ltd. | | | Pay | | | Macquarie MQCP575 Index | | | 0.25 | | | | Monthly | | | | 8,756 | | | | February-2018 | | | | 1,572,852 | | | | — | | | | 669 | | | | 669 | |
Macquarie Bank Ltd. | | | Receive | | | Macquarie MQCP252 Index | | | 0.12 | | | | Monthly | | | | 2,710 | | | | February-2018 | | | | 283,491 | | | | — | | | | 1,286 | | | | 1,286 | |
Subtotal — Commodity Risk | | | | | | | | | | | | — | | | | 7,393 | | | | 7,393 | |
Morgan Stanley Capital Services LLC | | | Pay | | | Morgan Stanley Systematic 6-Month European Dispersion Index | | | 0.10 | | | | Monthly | | | | 281 | | | | September-2018 | | | | EUR 46,343 | | | | — | | | | 124 | | | | 124 | |
Morgan Stanley Capital Services LLC | | | Pay | | | Morgan Stanley Systematic 6-Month European Dispersion (Wednesday) Index | | | 0.10 | | | | Monthly | | | | 276 | | | | September-2018 | | | | EUR 45,822 | | | | — | | | | 93 | | | | 93 | |
Morgan Stanley Capital Services LLC | | | Receive | | | Morgan Stanley Systematic 5-Month Dispersion Index | | | 0.10 | | | | Monthly | | | | 48,357 | | | | April-2018 | | | | 10,174,312 | | | | — | | | | 193,428 | | | | 193,428 | |
Subtotal — Equity Risk | | | | | | | | | | | | — | | | | 193,645 | | | | 193,645 | |
Subtotal — Appreciation | | | | | | | | | | | | — | | | | 201,038 | | | | 201,038 | |
BNP Paribas S.A. | | | Pay | | | BNP Paribas DR Alpha ex-Agriculture and Livestock Index | | | 0.15 | | | | Monthly | | | | 1,580 | | | | June-2018 | | | | 468,946 | | | | — | | | | (597 | ) | | | (597 | ) |
Macquarie Bank Ltd. | | | Pay | | | Macquarie MQCP252 Index | | | 0.12 | | | | Monthly | | | | 39,342 | | | | February-2018 | | | | 4,115,539 | | | | — | | | | (18,672 | ) | | | (18,672 | ) |
Macquarie Bank Ltd. | | | Receive | | | Macquarie MQCP575 Index | | | 0.25 | | | | Monthly | | | | 135,639 | | | | February-2018 | | | | 24,365,010 | | | | — | | | | (10,363 | ) | | | (10,363 | ) |
Subtotal — Commodity Risk | | | | | | | | | | | | — | | | | (29,632 | ) | | | (29,632 | ) |
Morgan Stanley Capital Services LLC | | | Pay | | | Morgan Stanley Systematic 5-Month Dispersion Index | | | 0.10 | | | | Monthly | | | | 12,499 | | | | April-2018 | | | | 2,632,901 | | | | — | | | | (46,886 | ) | | | (46,886 | ) |
See accompanying Notes to Consolidated Financial Statements which are an integral part of the financial statements.
47 Invesco Global Targeted Returns Fund
| | | | | | | | | | | | | | | | | | | | | | | | | | | | | | | | | | | | | | |
| Open Over-The-Counter Total Return Swap Agreements(u)—(continued) | |
| Counterparty | | Pay/Receive | | | Reference Entity(v) | | Fixed
Rate | | | Payment
Frequency | | | Number of
Contracts | | | Maturity Date | | | Notional Value(w) | | | Upfront
Payments
Paid
(Received) | | | Value | | | Unrealized
Appreciation (Depreciation) | |
Morgan Stanley Capital Services LLC | | | Receive | | | Morgan Stanley Systematic 6-Month European Dispersion Index | | | 0.10 | % | | | Monthly | | | | 4,181 | | | | September-2018 | | | | EUR 692,206 | | | $ | — | | | | $ (5,065 | ) | | $ | (5,065 | ) |
Morgan Stanley Capital Services LLC | | | Receive | | | Morgan Stanley Systematic 6-Month European Dispersion (Wednesday) Index | | | 0.10 | | | | Monthly | | | | 4,148 | | | | September-2018 | | | | EUR 691,347 | | | | — | | | | (4,542 | ) | | | (4,542 | ) |
Subtotal — Equity Risk | | | | | | | | | | | | — | | | | (56,493 | ) | | | (56,493 | ) |
Subtotal — Depreciation | | | | | | | | | | | | — | | | | (86,125 | ) | | | (86,125 | ) |
Total — Total Return Swap Agreements | | | | | | | | | | | $ | — | | | | $114,913 | | | $ | 114,913 | |
Index Information:
| | |
Morgan Stanley Systematic
5-Month Dispersion Index | | – An index comprising cash, equity securities, options on equity securities and stock market index futures. |
Morgan Stanley Systematic
6-Month European
Dispersion Index | | – An index comprising cash, equity securities, options on equity securities and stock market index futures. |
Morgan Stanley Systematic
6-Month European
Dispersion (Wednesday)
Index | | – An index comprising cash, equity securities, options on equity securities and stock market index futures. |
| (u) | The Fund receives or pays payments based on any positive or negative return on the Reference Entity, respectively. |
| (v) | The tables below include additional information regarding the underlying components of certain reference entities that are not publicly available. |
| | | | | | |
| Reference Entity Components | |
| Reference Entity | | Underlying Components | | Percentage | |
Macquarie MQCP575 Index | | | | | | |
| | | Long Futures Contracts | | | |
| | Aluminum | | | 13.76 | % |
| | Heating Oil | | | 8.57 | |
| | High Grade Copper | | | 19.16 | |
| | Natural Gas | | | 19.02 | |
| | Nickel | | | 6.75 | |
| | Unleaded Gasoline | | | 8.73 | |
| | WTI Crude | | | 16.18 | |
| | Zinc | | | 7.83 | |
| | |
| | | | | | |
| | | Short Futures Contracts | | | |
| | Aluminum | | | (13.76 | )% |
| | Heating Oil | | | (8.57 | ) |
| | High Grade Copper | | | (19.16 | ) |
| | Natural Gas | | | (19.02 | ) |
| | Nickel | | | (6.75 | ) |
| | Unleaded Gasoline | | | (8.73 | ) |
| | WTI Crude | | | (16.18 | ) |
| | Zinc | | | (7.83 | ) |
Macquarie MQCP252 Index | | | | | | |
| | | Short Futures Contracts | | | |
| | Aluminum | | | (13.76 | )% |
| | Heating Oil | | | (8.57 | ) |
| | High Grade Copper | | | (19.16 | ) |
| | Natural Gas | | | (19.02 | ) |
| | Nickel | | | (6.75 | ) |
| | Unleaded Gasoline | | | (8.73 | ) |
| | WTI Crude | | | (16.18 | ) |
| | Zinc | | | (7.83 | ) |
See accompanying Notes to Consolidated Financial Statements which are an integral part of the financial statements.
48 Invesco Global Targeted Returns Fund
| | | | | | | | | | | | | | | | |
| Reference Entity | |
Morgan Stanley Systematic 5-Month Dispersion Index | | | | | | | | | | | | | | | | |
| | | | | | | | | | | | | | | | |
| Top 50 Underlying Reference Entity Components | |
| Description | | | | | | | | | | | Percentage | |
| | | | |
| | | | | | | | | | | | | | | | |
Currencies | | | | | | | | | | | | | | | | |
U.S. Dollars | | | | | | | | | | | | | | | (203.09 | )% |
| | | | |
| | | | | | | | | | | | | | | | |
| Long Futures Contracts | | | | | Expiration
Month | | | | | | | |
SPX Index | | | | | | | December–2017 | | | | | | | | 412.20 | % |
| | | | |
| | | | | | | | | | | | | | | | |
Short Equity Securities | | | | | | | | | | | | | | | | |
AbbVie Inc. | | | | | | | | | | | | | | | (3.33 | )% |
Alphabet Inc. — Class A | | | | | | | | | | | | | | | (3.87 | ) |
Alphabet Inc. — Class C | | | | | | | | | | | | | | | (4.02 | ) |
Amazon.com, Inc. | | | | | | | | | | | | | | | (6.69 | ) |
Apple Inc. | | | | | | | | | | | | | | | (12.36 | ) |
Bank of America Corp. | | | | | | | | | | | | | | | (5.08 | ) |
Berkshire Hathaway Inc. | | | | | | | | | | | | | | | (4.67 | ) |
Boeing Co. (The) | | | | | | | | | | | | | | | (2.84 | ) |
Chevron Corp. | | | | | | | | | | | | | | | (2.81 | ) |
Cisco Systems, Inc. | | | | | | | | | | | | | | | (2.24 | ) |
Citigroup Inc. | | | | | | | | | | | | | | | (2.54 | ) |
Exxon Mobil Corp. | | | | | | | | | | | | | | | (2.86 | ) |
Facebook, Inc. | | | | | | | | | | | | | | | (6.00 | ) |
Home Depot, Inc. (The) | | | | | | | | | | | | | | | (3.16 | ) |
Intel Corp. | | | | | | | | | | | | | | | (4.50 | ) |
Johnson & Johnson | | | | | | | | | | | | | | | (3.29 | ) |
JPMorgan Chase & Co. | | | | | | | | | | | | | | | (5.62 | ) |
McDonald’s Corp. | | | | | | | | | | | | | | | (2.05 | ) |
Microsoft Corp. | | | | | | | | | | | | | | | (11.01 | ) |
UnitedHealth Group Inc. | | | | | | | | | | | | | | | (3.36 | ) |
Visa Inc. | | | | | | | | | | | | | | | (3.15 | ) |
Wells Fargo & Co. | | | | | | | | | | | | | | | (2.05 | ) |
| | | | |
| | | | | | | | | | | | | | | | |
Options Purchased | |
| | | Type of
Contract | | | Expiration
Date | | | Exercise
Price | | | | |
Apple Inc. | | | Call | | | | 11/17/2017 | | | $ | 160 | | | | (12.36 | )% |
Apple Inc. | | | Call | | | | 02/16/2018 | | | | 175 | | | | (3.33 | ) |
Apple Inc. | | | Call | | | | 01/19/2018 | | | | 180 | | | | (6.69 | ) |
Johnson & Johnson | | | Call | | | | 01/19/2018 | | | | 140 | | | | (2.84 | ) |
Microsoft Corp. | | | Call | | | | 12/15/2017 | | | | 78 | | | | (5.08 | ) |
Microsoft Corp. | | | Call | | | | 01/19/2018 | | | | 80 | | | | (4.67 | ) |
| | | | |
| | | | | | | | | | | | | | | | |
Options Written | |
SPX Index | | | Call | | | | 12/17/2017 | | | $ | 2,475 | | | | (0.33 | )% |
SPX Index | | | Call | | | | 12/15/2017 | | | | 2,500 | | | | (1.88 | ) |
SPX Index | | | Call | | | | 12/15/2017 | | | | 2,525 | | | | (1.69 | ) |
SPX Index | | | Call | | | | 12/15/2017 | | | | 2,600 | | | | (0.24 | ) |
SPX Index | | | Call | | | | 12/15/2017 | | | | 2,625 | | | | (0.54 | ) |
SPX Index | | | Call | | | | 12/15/2017 | | | | 2,650 | | | | (0.04 | ) |
SPX Index | | | Call | | | | 01/19/2018 | | | | 2,500 | | | | (1.59 | ) |
SPX Index | | | Call | | | | 01/19/2018 | | | | 2,525 | | | | (1.23 | ) |
See accompanying Notes to Consolidated Financial Statements which are an integral part of the financial statements.
49 Invesco Global Targeted Returns Fund
| | | | | | | | | | | | | | | | |
| Top 50 Underlying Reference Entity Components—(continued) | |
| Options Written—(continued) | |
| Description | | Type of
Contract | | | Expiration
Date | | | Exercise
Price | | | Percentage | |
SPX Index | | | Call | | | | 01/19/2018 | | | $ | 2,550 | | | | (1.15 | )% |
SPX Index | | | Call | | | | 01/19/2018 | | | | 2,575 | | | | (0.16 | ) |
SPX Index | | | Call | | | | 01/19/2018 | | | | 2,600 | | | | (0.86 | ) |
SPX Index | | | Call | | | | 01/19/2018 | | | | 2,625 | | | | (0.63 | ) |
SPX Index | | | Call | | | | 01/19/2018 | | | | 2,650 | | | | (0.30 | ) |
SPX Index | | | Call | | | | 01/19/2018 | | | | 2,675 | | | | (0.04 | ) |
SPX Index | | | Call | | | | 03/16/2018 | | | | 2,575 | | | | (0.62 | ) |
SPX Index | | | Call | | | | 03/16/2018 | | | | 2,600 | | | | (0.14 | ) |
SPX Index | | | Call | | | | 03/16/2018 | | | | 2,610 | | | | (0.30 | ) |
SPX Index | | | Call | | | | 03/16/2018 | | | | 2,625 | | | | (0.77 | ) |
SPX Index | | | Call | | | | 03/16/2018 | | | | 2,700 | | | | (0.22 | ) |
SPX Index | | | Call | | | | 03/16/2018 | | | | 2,725 | | | | (0.42 | ) |
| (w) | Notional value is denominated in U.S. Dollars unless otherwise noted. |
| | | | | | | | | | | | | | | | | | | | | | | | | | | | | | | | | | | | | | |
| Open Over-The-Counter Total Return Swap Agreements(x) | |
| Counterparty | | Pay/Receive | | | Reference
Entity | | Floating Rate Index | | | Payment
Frequency | | | Number of
Contracts | | | Maturity Date | | | Notional Value(y) | | | Upfront
Payments
Paid
(Received) | | | Value | | | Unrealized
Appreciation (Depreciation) | |
J.P. Morgan Chase Bank, N.A. | | | Receive | | | Hang Seng China Enterprises Total Return Index | | | 3 mo. HIBOR + 0.32 | % | | | Monthly | | | | 1,674 | | | | January-2018 | | | | HKD 32,859,850 | | | $ | — | | | $ | 246,437 | | | $ | 246,437 | |
UBS | | | Receive | | | MSCI World Energy Sector Total Return Index | | | 3 mo. USD LIBOR –0.385 | % | | | Monthly | | | | 12,621 | | | | September-2018 | | | $ | 3,991,099 | | | | — | | | | 54,972 | | | | 54,972 | |
Subtotal — Appreciation | | | | | | | | | | | | | | | | | | | | | | | | | | — | | | | 301,409 | | | | 301,409 | |
UBS | | | Pay | | | MSCI World Energy Sector Total Return Index | | | 3 mo. USD LIBOR –0.385 | % | | | Monthly | | | | 597 | | | | September-2018 | | | | 188,569 | | | | — | | | | (2,966 | ) | | | (2,966 | ) |
Subtotal — Depreciation | | | | | | | | | | | | | | | | | | | | | | | | | | — | | | | (2,966 | ) | | | (2,966 | ) |
Total — Total Return Swap Agreements — Equity Risk | | | $ | — | | | $ | 298,443 | | | $ | 298,443 | |
| (x) | The Fund receives or pays payments based on any positive or negative return on the Reference Entity, respectively. |
| (y) | Notional value is denominated in U.S. Dollars unless otherwise noted. |
| | | | | | | | | | | | | | | | | | | | | | |
| Open Forward Foreign Currency Contracts | |
Settlement
Date | | Counterparty | | Contract to | | | Unrealized
Appreciation
(Depreciation) | |
| | | | | | Deliver | | | | | | Receive | | |
11/07/2017 | | RBC Capital Markets LLC | | | USD | | | | 41,857 | | | | ARS | | | | 771,000 | | | $ | 1,627 | |
11/10/2017 | | Barclays Bank PLC | | | AUD | | | | 1,708,667 | | | | USD | | | | 1,352,839 | | | | 45,201 | |
11/10/2017 | | Barclays Bank PLC | | | CAD | | | | 5,701,041 | | | | USD | | | | 4,508,516 | | | | 89,024 | |
11/10/2017 | | Barclays Bank PLC | | | EUR | | | | 1,900,860 | | | | USD | | | | 2,261,833 | | | | 46,330 | |
11/10/2017 | | Barclays Bank PLC | | | JPY | | | | 81,178,000 | | | | USD | | | | 725,536 | | | | 11,205 | |
11/10/2017 | | Barclays Bank PLC | | | MXN | | | | 4,412,000 | | | | USD | | | | 246,264 | | | | 16,551 | |
11/10/2017 | | Barclays Bank PLC | | | USD | | | | 930,300 | | | | CNY | | | | 6,293,853 | | | | 17,717 | |
11/10/2017 | | Barclays Bank PLC | | | USD | | | | 600,916 | | | | KRW | | | | 679,366,000 | | | | 5,956 | |
11/10/2017 | | Barclays Bank PLC | | | USD | | | | 985,058 | | | | RUB | | | | 61,075,081 | | | | 57,635 | |
11/10/2017 | | Deutsche Bank Securities Inc. | | | USD | | | | 420,183 | | | | KRW | | | | 474,092,000 | | | | 3,320 | |
11/10/2017 | | Goldman Sachs International | | | BRL | | | | 500,000 | | | | USD | | | | 157,893 | | | | 5,252 | |
11/10/2017 | | Goldman Sachs International | | | CAD | | | | 3,014,650 | | | | USD | | | | 2,413,554 | | | | 76,574 | |
11/10/2017 | | Goldman Sachs International | | | JPY | | | | 656,001,000 | | | | USD | | | | 5,825,199 | | | | 52,677 | |
11/10/2017 | | Goldman Sachs International | | | MXN | | | | 2,610,000 | | | | USD | | | | 145,961 | | | | 10,070 | |
11/10/2017 | | Goldman Sachs International | | | NZD | | | | 1,693,000 | | | | USD | | | | 1,252,067 | | | | 93,809 | |
11/10/2017 | | Goldman Sachs International | | | USD | | | | 3,278,573 | | | | CLP | | | | 2,141,400,000 | | | | 91,561 | |
See accompanying Notes to Consolidated Financial Statements which are an integral part of the financial statements.
50 Invesco Global Targeted Returns Fund
| | | | | | | | | | | | | | | | | | | | | | |
| Open Forward Foreign Currency Contracts—(continued) | |
Settlement
Date | | Counterparty | | Contract to | | | Unrealized
Appreciation
(Depreciation) | |
| | | | | | Deliver | | | | | | Receive | | |
11/10/2017 | | Goldman Sachs International | | | USD | | | | 250,413 | | | | GBP | | | | 194,254 | | | $ | 7,706 | |
11/10/2017 | | Goldman Sachs International | | | USD | | | | 693,305 | | | | KRW | | | | 780,446,546 | | | | 3,861 | |
11/10/2017 | | Morgan Stanley Capital Services LLC | | | EUR | | | | 4,837,937 | | | | USD | | | | 5,708,094 | | | | 69,348 | |
11/10/2017 | | Morgan Stanley Capital Services LLC | | | MXN | | | | 10,221,000 | | | | USD | | | | 565,978 | | | | 33,816 | |
11/10/2017 | | State Street Bank & Trust Co. | | | INR | | | | 27,415,800 | | | | USD | | | | 424,249 | | | | 1,138 | |
11/10/2017 | | State Street Bank & Trust Co. | | | SEK | | | | 4,208,000 | | | | EUR | | | | 441,724 | | | | 11,874 | |
11/10/2017 | | UBS | | | JPY | | | | 59,782,000 | | | | USD | | | | 532,434 | | | | 6,378 | |
11/27/2017 | | Goldman Sachs International | | | EUR | | | | 235,000 | | | | USD | | | | 276,538 | | | | 2,389 | |
11/29/2017 | | Barclays Bank PLC | | | IDR | | | | 2,372,868,000 | | | | USD | | | | 174,990 | | | | 674 | |
11/29/2017 | | Barclays Bank PLC | | | USD | | | | 79,020 | | | | TWD | | | | 2,380,000 | | | | 56 | |
11/29/2017 | | Goldman Sachs International | | | USD | | | | 34,253 | | | | INR | | | | 2,229,000 | | | | 99 | |
11/29/2017 | | Goldman Sachs International | | | USD | | | | 991,667 | | | | KRW | | | | 1,121,209,000 | | | | 11,406 | |
11/29/2017 | | State Street Bank & Trust Co. | | | AUD | | | | 684,646 | | | | USD | | | | 534,824 | | | | 10,999 | |
11/29/2017 | | State Street Bank & Trust Co. | | | BRL | | | | 410,000 | | | | USD | | | | 128,394 | | | | 3,543 | |
11/29/2017 | | State Street Bank & Trust Co. | | | CAD | | | | 216,000 | | | | USD | | | | 172,428 | | | | 4,952 | |
11/29/2017 | | State Street Bank & Trust Co. | | | CHF | | | | 4,419,913 | | | | USD | | | | 4,508,611 | | | | 69,401 | |
11/29/2017 | | State Street Bank & Trust Co. | | | CNY | | | | 18,274,976 | | | | USD | | | | 2,753,999 | | | | 4,436 | |
11/29/2017 | | State Street Bank & Trust Co. | | | DKK | | | | 4,769,671 | | | | USD | | | | 756,249 | | | | 8,242 | |
11/29/2017 | | State Street Bank & Trust Co. | | | EUR | | | | 14,847,656 | | | | USD | | | | 17,603,273 | | | | 280,242 | |
11/29/2017 | | State Street Bank & Trust Co. | | | HKD | | | | 26,828,732 | | | | USD | | | | 3,440,612 | | | | 294 | |
11/29/2017 | | State Street Bank & Trust Co. | | | JPY | | | | 68,612,161 | | | | USD | | | | 605,823 | | | | 1,581 | |
11/29/2017 | | State Street Bank & Trust Co. | | | MXN | | | | 1,249,000 | | | | USD | | | | 65,722 | | | | 918 | |
11/29/2017 | | State Street Bank & Trust Co. | | | NOK | | | | 9,464,071 | | | | USD | | | | 1,186,273 | | | | 26,836 | |
11/29/2017 | | State Street Bank & Trust Co. | | | SEK | | | | 7,956,934 | | | | USD | | | | 974,814 | | | | 22,655 | |
11/29/2017 | | State Street Bank & Trust Co. | | | SGD | | | | 482,518 | | | | USD | | | | 354,657 | | | | 595 | |
11/29/2017 | | State Street Bank & Trust Co. | | | USD | | | | 2,093,360 | | | | GBP | | | | 1,587,000 | | | | 16,511 | |
11/29/2017 | | State Street Bank & Trust Co. | | | USD | | | | 55,602 | | | | JPY | | | | 6,314,000 | | | | 3 | |
11/29/2017 | | State Street Bank & Trust Co. | | | USD | | | | 251,602 | | | | KRW | | | | 284,276,000 | | | | 2,722 | |
11/29/2017 | | State Street Bank & Trust Co. | | | USD | | | | 50,997 | | | | TWD | | | | 1,542,000 | | | | 236 | |
11/30/2017 | | Goldman Sachs International | | | CAD | | | | 40,000 | | | | USD | | | | 31,970 | | | | 955 | |
11/30/2017 | | Morgan Stanley Capital Services LLC | | | CAD | | | | 40,000 | | | | USD | | | | 31,857 | | | | 843 | |
12/04/2017 | | Barclays Bank PLC | | | USD | | | | 1,053,675 | | | | CNY | | | | 7,010,100 | | | | 626 | |
12/04/2017 | | State Street Bank & Trust Co. | | | USD | | | | 586,205 | | | | CNY | | | | 3,923,200 | | | | 3,834 | |
12/11/2017 | | Barclays Bank PLC | | | NZD | | | | 3,969,000 | | | | USD | | | | 2,835,295 | | | | 121,649 | |
12/11/2017 | | Deutsche Bank Securities Inc. | | | EUR | | | | 1,900,860 | | | | USD | | | | 2,275,892 | | | | 56,402 | |
12/11/2017 | | Goldman Sachs International | | | AUD | | | | 3,863,667 | | | | USD | | | | 3,059,568 | | | | 103,773 | |
12/11/2017 | | Goldman Sachs International | | | BRL | | | | 371,000 | | | | USD | | | | 116,906 | | | | 4,093 | |
12/11/2017 | | Goldman Sachs International | | | CAD | | | | 4,658,386 | | | | USD | | | | 3,733,877 | | | | 121,429 | |
12/11/2017 | | Goldman Sachs International | | | RUB | | | | 9,544,662 | | | | USD | | | | 163,202 | | | | 1,177 | |
12/11/2017 | | Goldman Sachs International | | | USD | | | | 21,743 | | | | KRW | | | | 24,596,178 | | | | 264 | |
12/11/2017 | | Morgan Stanley Capital Services LLC | | | CLP | | | | 169,400,000 | | | | USD | | | | 269,616 | | | | 3,117 | |
12/11/2017 | | State Street Bank & Trust Co. | | | SEK | | | | 4,207,000 | | | | EUR | | | | 438,969 | | | | 8,699 | |
01/12/2018 | | Barclays Bank PLC | | | BRL | | | | 729,000 | | | | USD | | | | 225,480 | | | | 4,706 | |
01/12/2018 | | Barclays Bank PLC | | | EUR | | | | 1,900,860 | | | | USD | | | | 2,244,530 | | | | 20,521 | |
01/12/2018 | | Barclays Bank PLC | | | MXN | | | | 2,327,000 | | | | USD | | | | 120,900 | | | | 1,086 | |
01/12/2018 | | Barclays Bank PLC | | | RUB | | | | 19,495,182 | | | | USD | | | | 334,784 | | | | 5,617 | |
01/12/2018 | | Citigroup Global Markets Inc. | | | CLP | | | | 671,500,000 | | | | USD | | | | 1,063,678 | | | | 7,830 | |
01/12/2018 | | Citigroup Global Markets Inc. | | | MXN | | | | 2,781,000 | | | | USD | | | | 144,470 | | | | 1,280 | |
01/12/2018 | | Deutsche Bank Securities Inc. | | | AUD | | | | 4,218,667 | | | | USD | | | | 3,269,551 | | | | 42,964 | |
01/12/2018 | | Deutsche Bank Securities Inc. | | | NZD | | | | 4,982,000 | | | | USD | | | | 3,517,965 | | | | 113,435 | |
See accompanying Notes to Consolidated Financial Statements which are an integral part of the financial statements.
51 Invesco Global Targeted Returns Fund
| | | | | | | | | | | | | | | | | | | | | | |
| Open Forward Foreign Currency Contracts—(continued) | |
Settlement
Date | | Counterparty | | Contract to | | | Unrealized
Appreciation
(Depreciation) | |
| | | | | | Deliver | | | | | | Receive | | |
01/12/2018 | | Deutsche Bank Securities Inc. | | | USD | | | | 3,722,657 | | | | INR | | | | 246,130,907 | | | $ | 52,521 | |
01/12/2018 | | Goldman Sachs International | | | USD | | | | 283,524 | | | | GBP | | | | 214,573 | | | | 2,190 | |
01/12/2018 | | State Street Bank & Trust Co. | | | SEK | | | | 6,455,000 | | | | EUR | | | | 669,105 | | | | 8,081 | |
01/26/2018 | | Goldman Sachs International | | | USD | | | | 383,189 | | | | GBP | | | | 290,000 | | | | 3,132 | |
Subtotal — Appreciation | | | | 1,917,644 | |
11/10/2017 | | Barclays Bank PLC | | | CLP | | | | 474,700,000 | | | | USD | | | | 737,799 | | | | (9,283 | ) |
11/10/2017 | | Barclays Bank PLC | | | CNY | | | | 40,651,331 | | | | USD | | | | 6,008,711 | | | | (114,431 | ) |
11/10/2017 | | Barclays Bank PLC | | | EUR | | | | 2,643,628 | | | | SEK | | | | 25,367,000 | | | | (49,190 | ) |
11/10/2017 | | Barclays Bank PLC | | | KRW | | | | 5,630,895,862 | | | | USD | | | | 4,924,953 | | | | (105,080 | ) |
11/10/2017 | | Barclays Bank PLC | | | USD | | | | 409,562 | | | | AUD | | | | 518,000 | | | | (13,138 | ) |
11/10/2017 | | Barclays Bank PLC | | | USD | | | | 783,381 | | | | CAD | | | | 950,736 | | | | (46,363 | ) |
11/10/2017 | | Barclays Bank PLC | | | USD | | | | 485,756 | | | | EUR | | | | 402,731 | | | | (16,363 | ) |
11/10/2017 | | Barclays Bank PLC | | | USD | | | | 8,897,483 | | | | GBP | | | | 6,695,223 | | | | (1,076 | ) |
11/10/2017 | | Barclays Bank PLC | | | USD | | | | 4,093,142 | | | | JPY | | | | 450,867,000 | | | | (125,710 | ) |
11/10/2017 | | Barclays Bank PLC | | | USD | | | | 445,346 | | | | NZD | | | | 612,000 | | | | (26,649 | ) |
11/10/2017 | | Deutsche Bank Securities Inc. | | | USD | | | | 824,704 | | | | CAD | | | | 1,040,703 | | | | (17,942 | ) |
11/10/2017 | | Goldman Sachs International | | | USD | | | | 2,765,512 | | | | CAD | | | | 3,489,302 | | | | (60,578 | ) |
11/10/2017 | | Goldman Sachs International | | | USD | | | | 5,228,753 | | | | EUR | | | | 4,435,206 | | | | (59,401 | ) |
11/10/2017 | | Goldman Sachs International | | | USD | | | | 6,353,146 | | | | INR | | | | 408,094,307 | | | | (54,989 | ) |
11/10/2017 | | Goldman Sachs International | | | USD | | | | 1,964,337 | | | | JPY | | | | 222,093,000 | | | | (10,016 | ) |
11/10/2017 | | Morgan Stanley Capital Services LLC | | | USD | | | | 432,987 | | | | JPY | | | | 49,194,000 | | | | (101 | ) |
11/10/2017 | | State Street Bank & Trust Co. | | | KRW | | | | 29,818,850 | | | | USD | | | | 26,291 | | | | (346 | ) |
11/10/2017 | | State Street Bank & Trust Co. | | | RUB | | | | 12,307,742 | | | | USD | | | | 205,180 | | | | (4,941 | ) |
11/10/2017 | | State Street Bank & Trust Co. | | | USD | | | | 175,421 | | | | CAD | | | | 220,300 | | | | (4,643 | ) |
11/10/2017 | | State Street Bank & Trust Co. | | | USD | | | | 270,978 | | | | EUR | | | | 229,196 | | | | (3,844 | ) |
11/10/2017 | | UBS | | | USD | | | | 319,322 | | | | JPY | | | | 35,774,000 | | | | (4,527 | ) |
11/27/2017 | | Goldman Sachs International | | | USD | | | | 86,206 | | | | EUR | | | | 72,098 | | | | (2,097 | ) |
11/29/2017 | | Goldman Sachs International | | | INR | | | | 34,545,000 | | | | USD | | | | 529,101 | | | | (3,281 | ) |
11/29/2017 | | Goldman Sachs International | | | KRW | | | | 2,629,532,643 | | | | USD | | | | 2,325,723 | | | | (26,750 | ) |
11/29/2017 | | Goldman Sachs International | | | TWD | | | | 25,602,602 | | | | USD | | | | 847,347 | | | | (3,301 | ) |
11/29/2017 | | Goldman Sachs International | | | USD | | | | 13,099 | | | | IDR | | | | 178,256,000 | | | | (4 | ) |
11/29/2017 | | State Street Bank & Trust Co. | | | GBP | | | | 20,344,046 | | | | USD | | | | 26,816,197 | | | | (230,624 | ) |
11/29/2017 | | State Street Bank & Trust Co. | | | INR | | | | 273,000 | | | | USD | | | | 4,182 | | | | (25 | ) |
11/29/2017 | | State Street Bank & Trust Co. | | | USD | | | | 57,591 | | | | AUD | | | | 74,000 | | | | (973 | ) |
11/29/2017 | | State Street Bank & Trust Co. | | | USD | | | | 15,797 | | | | CAD | | | | 20,000 | | | | (290 | ) |
11/29/2017 | | State Street Bank & Trust Co. | | | USD | | | | 431,302 | | | | CHF | | | | 425,000 | | | | (4,446 | ) |
11/29/2017 | | State Street Bank & Trust Co. | | | USD | | | | 74,389 | | | | DKK | | | | 470,000 | | | | (681 | ) |
11/29/2017 | | State Street Bank & Trust Co. | | | USD | | | | 1,662,188 | | | | EUR | | | | 1,415,000 | | | | (11,281 | ) |
11/29/2017 | | State Street Bank & Trust Co. | | | USD | | | | 1,234,633 | | | | HKD | | | | 9,628,000 | | | | (9 | ) |
11/29/2017 | | State Street Bank & Trust Co. | | | USD | | | | 16,843 | | | | IDR | | | | 229,186,000 | | | | (6 | ) |
11/29/2017 | | State Street Bank & Trust Co. | | | USD | | | | 121,548 | | | | NOK | | | | 971,000 | | | | (2,591 | ) |
11/29/2017 | | State Street Bank & Trust Co. | | | USD | | | | 156,618 | | | | SEK | | | | 1,286,000 | | | | (2,730 | ) |
11/29/2017 | | State Street Bank & Trust Co. | | | USD | | | | 35,244 | | | | SGD | | | | 48,000 | | | | (23 | ) |
12/04/2017 | | Barclays Bank PLC | | | CNY | | | | 587,401 | | | | USD | | | | 88,291 | | | | (52 | ) |
12/04/2017 | | Goldman Sachs International | | | CNY | | | | 52,534,362 | | | | USD | | | | 7,641,811 | | | | (259,222 | ) |
12/04/2017 | | Goldman Sachs International | | | USD | | | | 262,246 | | | | CNY | | | | 1,724,500 | | | | (2,886 | ) |
12/04/2017 | | State Street Bank & Trust Co. | | | CNY | | | | 270,835 | | | | USD | | | | 40,468 | | | | (265 | ) |
12/08/2017 | | Goldman Sachs International | | | GBP | | | | 313,495 | | | | USD | | | | 413,171 | | | | (3,748 | ) |
12/08/2017 | | Goldman Sachs International | | | USD | | | | 326,405 | | | | GBP | | | | 240,000 | | | | (7,228 | ) |
12/11/2017 | | Barclays Bank PLC | | | USD | | | | 3,131,448 | | | | BRL | | | | 9,940,000 | | | | (108,912 | ) |
See accompanying Notes to Consolidated Financial Statements which are an integral part of the financial statements.
52 Invesco Global Targeted Returns Fund
| | | | | | | | | | | | | | | | | | | | | | |
| Open Forward Foreign Currency Contracts—(continued) | |
Settlement
Date | | Counterparty | | Contract to | | | Unrealized
Appreciation
(Depreciation) | |
| | | | | | Deliver | | | | | | Receive | | |
12/11/2017 | | Barclays Bank PLC | | | USD | | | | 3,552,454 | | | | INR | | | | 229,669,707 | | | $ | (17,430 | ) |
12/11/2017 | | Barclays Bank PLC | | | USD | | | | 6,872,868 | | | | MXN | | | | 124,367,999 | | | | (433,091 | ) |
12/11/2017 | | Goldman Sachs International | | | EUR | | | | 3,239,422 | | | | SEK | | | | 30,723,000 | | | | (102,890 | ) |
12/11/2017 | | Goldman Sachs International | | | USD | | | | 1,553,734 | | | | CLP | | | | 974,300,000 | | | | (20,969 | ) |
12/11/2017 | | Goldman Sachs International | | | USD | | | | 656,855 | | | | GBP | | | | 487,613 | | | | (8,303 | ) |
12/11/2017 | | Goldman Sachs International | | | USD | | | | 1,799,045 | | | | RUB | | | | 105,810,848 | | | | (2,855 | ) |
12/11/2017 | | Morgan Stanley Capital Services LLC | | | USD | | | | 1,355,631 | | | | CAD | | | | 1,643,736 | | | | (80,960 | ) |
01/10/2018 | | RBC Capital Markets LLC | | | USD | | | | 81,133 | | | | ARS | | | | 1,475,000 | | | | (1,122 | ) |
01/12/2018 | | Barclays Bank PLC | | | USD | | | | 275,804 | | | | CAD | | | | 348,300 | | | | (5,602 | ) |
01/12/2018 | | Barclays Bank PLC | | | GBP | | | | 13,363,265 | | | | USD | | | | 17,641,488 | | | | (152,338 | ) |
01/12/2018 | | Barclays Bank PLC | | | INR | | | | 64,090,900 | | | | USD | | | | 976,847 | | | | (6,185 | ) |
01/12/2018 | | Barclays Bank PLC | | | KRW | | | | 59,459,905 | | | | USD | | | | 52,605 | | | | (607 | ) |
01/12/2018 | | Barclays Bank PLC | | | USD | | | | 74,828 | | | | BRL | | | | 247,000 | | | | (25 | ) |
01/12/2018 | | Barclays Bank PLC | | | USD | | | | 7,121,881 | | | | CLP | | | | 4,486,500,000 | | | | (67,430 | ) |
01/12/2018 | | Barclays Bank PLC | | | USD | | | | 1,576,447 | | | | RUB | | | | 93,362,681 | | | | (62 | ) |
01/12/2018 | | Citigroup Global Markets Inc. | | | EUR | | | | 2,008,698 | | | | SEK | | | | 19,231,414 | | | | (41,894 | ) |
01/12/2018 | | Citigroup Global Markets Inc. | | | USD | | | | 606,184 | | | | AUD | | | | 777,000 | | | | (11,906 | ) |
01/12/2018 | | Citigroup Global Markets Inc. | | | USD | | | | 360,435 | | | | NZD | | | | 518,000 | | | | (6,451 | ) |
01/12/2018 | | Deutsche Bank Securities Inc. | | | EUR | | | | 5,936,081 | | | | SEK | | | | 56,548,000 | | | | (157,948 | ) |
01/12/2018 | | Deutsche Bank Securities Inc. | | | USD | | | | 98,018 | | | | BRL | | | | 314,000 | | | | (2,925 | ) |
01/12/2018 | | Deutsche Bank Securities Inc. | | | USD | | | | 229,345 | | | | MXN | | | | 4,343,000 | | | | (5,731 | ) |
01/12/2018 | | Goldman Sachs International | | | AUD | | | | 164,000 | | | | USD | | | | 125,391 | | | | (42 | ) |
01/12/2018 | | Goldman Sachs International | | | EUR | | | | 275,417 | | | | SEK | | | | 2,631,392 | | | | (6,401 | ) |
01/12/2018 | | Goldman Sachs International | | | USD | | | | 24,497 | | | | MXN | | | | 475,000 | | | | (40 | ) |
01/12/2018 | | Morgan Stanley Capital Services LLC | | | EUR | | | | 452,148 | | | | SEK | | | | 4,320,195 | | | | (10,475 | ) |
01/12/2018 | | Morgan Stanley Capital Services LLC | | | NZD | | | | 155,000 | | | | USD | | | | 105,875 | | | | (47 | ) |
01/12/2018 | | State Street Bank & Trust Co. | | | USD | | | | 619,856 | | | | EUR | | | | 525,157 | | | | (5,421 | ) |
01/26/2018 | | Goldman Sachs International | | | EUR | | | | 2,277,000 | | | | USD | | | | 2,656,303 | | | | (10,048 | ) |
01/26/2018 | | Goldman Sachs International | | | GBP | | | | 5,700,000 | | | | USD | | | | 7,485,069 | | | | (108,134 | ) |
01/26/2018 | | Goldman Sachs International | | | USD | | | | 330,924 | | | | EUR | | | | 280,000 | | | | (3,046 | ) |
Subtotal — Depreciation | | | | (2,670,414 | ) |
Total — Forward Foreign Currency Contracts — Currency Risk | | | $ | (752,770 | ) |
Abbreviations:
| | |
| ARS | | – Argentine Peso |
| AUD | | – Australian Dollar |
| BBSW | | – Australian Bank Bill Swap Rate |
| BRL | | – Brazilian Real |
| CAD | | – Canadian Dollar |
| CDOR | | – Canadian Dealer Offered Rate |
| CHF | | – Swiss Franc |
| CLP | | – Chilean Peso |
| CNY | | – Chinese Yuan |
| CPI | | – Consumer Price Index |
| DKK | | – Danish Krone |
| EUR | | – Euro |
| GBP | | – British Pound Sterling |
| HIBOR | | – Hong Kong Interbank Offered Rate |
| HICP | | – Harmonised Index of Consumer Prices |
| HKD | | – Hong Kong Dollar |
| IDR | | – Indonesian Rupiah |
| | |
| INR | | – Indian Rupee |
| JPY | | – Japanese Yen |
| KRW | | – South Korean Won |
| LIBOR | | – London Interbank Offered Rate |
| MXN | | – Mexican New Peso |
| NOK | | – Norwegian Krone |
| NSA | | – Non-Seasonally Adjusted |
| NZD | | – New Zealand Dollar |
| RPI | | – Retail Price Index |
| RUB | | – Russian Ruble |
| SEK | | – Swedish Krona |
| SGD | | – Singapore Dollar |
| STIBOR | | – Stockholm Interbank Offered Rate |
| TIIE | | – Interbank Equilibrium Interest Rate |
| TWD | | – New Taiwan Dollar |
| USD | | – U.S. Dollar |
See accompanying Notes to Consolidated Financial Statements which are an integral part of the financial statements.
53 Invesco Global Targeted Returns Fund
Consolidated Statement of Assets and Liabilities
October 31, 2017
| | | | |
Assets: | | | | |
Investments in securities, at value (Cost $110,115,975) | | $ | 110,163,346 | |
Investments in affiliated money market funds, at value and cost | | | 28,584,863 | |
Other investments: | | | | |
Variation margin receivable — futures contracts | | | 309,774 | |
Variation margin receivable — centrally cleared swap agreements | | | 86,843 | |
Swaps receivable — OTC | | | 268,393 | |
Unrealized appreciation on forward foreign currency contracts outstanding | | | 1,917,644 | |
Unrealized appreciation on swap agreements — OTC | | | 5,912,545 | |
Foreign currencies, at value (Cost $5,576,350) | | | 5,571,923 | |
Deposits with brokers: | | | | |
Cash collateral — exchange-traded futures contracts | | | 4,456,843 | |
Cash collateral — exchange-traded option contracts | | | 505,000 | |
Cash collateral — exchange-traded swap agreements | | | 3,688,434 | |
Cash collateral OTC Derivatives | | | 2,475,000 | |
Receivable for: | | | | |
Investments sold | | | 382,046 | |
Fund shares sold | | | 85,138 | |
Dividends and interest | | | 665,751 | |
Investment for trustee deferred compensation and retirement plans | | | 7,623 | |
Other assets | | | 244,867 | |
Total assets | | | 165,326,033 | |
| |
Liabilities: | | | | |
Other investments: | | | | |
Options written, at value (premiums received $6,516,533) | | | 4,942,918 | |
Swaps payable — centrally cleared | | | 20 | |
Swaps payable — OTC | | | 19,779 | |
Unrealized depreciation on forward foreign currency contracts outstanding | | | 2,670,414 | |
Unrealized depreciation on swap agreements — OTC | | | 7,365,782 | |
Payable for: | | | | |
Investments purchased | | | 1,003,098 | |
Fund shares reacquired | | | 198,124 | |
Amount due to custodian | | | 201,748 | |
Accrued fees to affiliates | | | 147,876 | |
Accrued trustees’ and officers’ fees and benefits | | | 2,499 | |
Accrued other operating expenses | | | 413,297 | |
Trustee deferred compensation and retirement plans | | | 7,623 | |
Total liabilities | | | 16,973,178 | |
Net assets applicable to shares outstanding | | $ | 148,352,855 | |
| |
Net assets consist of: | | | | |
Shares of beneficial interest | | $ | 153,697,702 | |
Undistributed net investment income | | | 31,662 | |
Undistributed net realized gain (loss) | | | (3,438,236 | ) |
Net unrealized appreciation (depreciation) | | | (1,938,273 | ) |
| | | $ | 148,352,855 | |
| | | | |
Net Assets: | |
Class A | | $ | 19,360,140 | |
Class C | | $ | 12,262,705 | |
Class R | | $ | 26,026 | |
Class Y | | $ | 108,067,800 | |
Class R5 | | $ | 10,045 | |
Class R6 | | $ | 8,626,139 | |
|
Shares outstanding, no par value,
with an unlimited number of shares authorized: | |
Class A | | | 1,936,605 | |
Class C | | | 1,251,050 | |
Class R | | | 2,619 | |
Class Y | | | 10,763,111 | |
Class R5 | | | 1,000 | |
Class R6 | | | 859,426 | |
Class A: | | | | |
Net asset value per share | | $ | 10.00 | |
Maximum offering price per share | | | | |
(Net asset value of $10.00 ÷ 94.50%) | | $ | 10.58 | |
Class C: | | | | |
Net asset value and offering price per share | | $ | 9.80 | |
Class R: | | | | |
Net asset value and offering price per share | | $ | 9.94 | |
Class Y: | | | | |
Net asset value and offering price per share | | $ | 10.04 | |
Class R5: | | | | |
Net asset value and offering price per share | | $ | 10.05 | |
Class R6: | | | | |
Net asset value and offering price per share | | $ | 10.04 | |
See accompanying Notes to Consolidated Financial Statements which are an integral part of the financial statements.
54 Invesco Global Targeted Returns Fund
Consolidated Statement of Operations
For the year ended October 31, 2017
| | | | |
Investment income: | |
Dividends (net of foreign withholding taxes of $98,062) | | $ | 1,492,828 | |
Dividends from affiliated underlying funds | | | 1,706,329 | |
Interest Income | | | 1,342,023 | |
Total investment income | | | 4,541,180 | |
| |
Expenses: | | | | |
Advisory fees | | | 2,115,216 | |
Administrative services fees | | | 50,000 | |
Custodian fees | | | 202,578 | |
Distribution fees: | | | | |
Class A | | | 56,060 | |
Class C | | | 139,526 | |
Class R | | | 108 | |
Transfer agent fees — A, C, R and Y | | | 169,778 | |
Transfer agent fees — R5 | | | 33 | |
Transfer agent fees — R6 | | | 119 | |
Trustees’ and officers’ fees and benefits | | | 22,644 | |
Registration and filing fees | | | 103,865 | |
Reports to shareholders | | | 51,850 | |
Professional services fees | | | 118,082 | |
Pricing fees | | | 577,821 | |
Other | | | 15,125 | |
Total expenses | | | 3,622,805 | |
Less: Fees waived, expenses reimbursed and expense offset arrangement(s) | | | (1,567,481 | ) |
Net expenses | | | 2,055,324 | |
Net investment income | | | 2,485,856 | |
| |
Realized and unrealized gain (loss) from: | | | | |
Net realized gain (loss) from: | | | | |
Investment securities | | | (11,376,345 | ) |
Investment securities — affiliated funds (includes distributions from affiliated funds of $509,105) | | | 2,192,313 | |
Foreign currencies | | | 716,232 | |
Forward foreign currency contracts | | | (1,422,634 | ) |
Futures contracts | | | (1,319,371 | ) |
Option contracts written | | | 6,708,405 | |
Swap agreements | | | 17,787 | |
| | | | (4,483,613 | ) |
Change in net unrealized appreciation (depreciation) of: | | | | |
Investment securities | | | 5,813,086 | |
Investment securities — affiliated funds | | | 1,550,651 | |
Foreign currencies | | | (668 | ) |
Forward foreign currency contracts | | | (2,440,788 | ) |
Futures contracts | | | (1,843,132 | ) |
Option contracts written | | | (445,312 | ) |
Swap agreements | | | 1,384,519 | |
| | | | 4,018,356 | |
Net realized and unrealized gain (loss) | | | (465,257 | ) |
Net increase in net assets resulting from operations | | $ | 2,020,599 | |
See accompanying Notes to Consolidated Financial Statements which are an integral part of the financial statements.
55 Invesco Global Targeted Returns Fund
Consolidated Statement of Changes in Net Assets
For the years ended October 31, 2017 and 2016
| | | | | | | | |
| | | 2017 | | | 2016 | |
Operations: | | | | | |
Net investment income | | $ | 2,485,856 | | | $ | 1,242,462 | |
Net realized gain (loss) | | | (4,483,613 | ) | | | 6,872,259 | |
Change in net unrealized appreciation (depreciation) | | | 4,018,356 | | | | (4,359,787 | ) |
Net increase in net assets resulting from operations | | | 2,020,599 | | | | 3,754,934 | |
| | |
Distributions to shareholders from net investment income: | | | | | | | | |
Class A | | | (302,695 | ) | | | (146,529 | ) |
Class C | | | (93,125 | ) | | | (38,269 | ) |
Class R | | | (177 | ) | | | (47 | ) |
Class Y | | | (2,306,952 | ) | | | (947,623 | ) |
Class R5 | | | (921 | ) | | | (528 | ) |
Class R6 | | | (151 | ) | | | (68,481 | ) |
Total distributions from net investment income | | | (2,704,021 | ) | | | (1,201,477 | ) |
| | |
Return of capital: | | | | | | | | |
Class A | | | (11,454 | ) | | | — | |
Class C | | | (3,524 | ) | | | — | |
Class R | | | (7 | ) | | | — | |
Class Y | | | (87,296 | ) | | | — | |
Class R5 | | | (35 | ) | | | — | |
Class R6 | | | (6 | ) | | | — | |
Total return of capital | | | (102,322 | ) | | | — | |
| | |
Distributions to shareholders from net realized gains: | | | | | | | | |
Class A | | | (757,865 | ) | | | (319,531 | ) |
Class C | | | (493,617 | ) | | | (139,306 | ) |
Class R | | | (538 | ) | | | (138 | ) |
Class Y | | | (4,799,192 | ) | | | (1,480,056 | ) |
Class R5 | | | (1,917 | ) | | | (825 | ) |
Class R6 | | | (314 | ) | | | (106,958 | ) |
Total distributions from net realized gains | | | (6,053,443 | ) | | | (2,046,814 | ) |
| | |
Share transactions–net: | | | | | | | | |
Class A | | | (9,083,175 | ) | | | 5,549,639 | |
Class C | | | (3,618,751 | ) | | | 4,942,790 | |
Class R | | | 10,007 | | | | 6,231 | |
Class Y | | | (61,768,547 | ) | | | 77,180,742 | |
Class R5 | | | (51,152 | ) | | | 1,126 | |
Class R6 | | | 8,592,340 | | | | (8,126,492 | ) |
Net increase (decrease) in net assets resulting from share transactions | | | (65,919,278 | ) | | | 79,554,036 | |
Net increase (decrease) in net assets | | | (72,758,465 | ) | | | 80,060,679 | |
| | |
Net assets: | | | | | | | | |
Beginning of year | | | 221,111,320 | | | | 141,050,641 | |
End of year (includes undistributed net investment income of $31,662 and $1,324,142, respectively) | | $ | 148,352,855 | | | $ | 221,111,320 | |
See accompanying Notes to Consolidated Financial Statements which are an integral part of the financial statements.
56 Invesco Global Targeted Returns Fund
Notes to Consolidated Financial Statements
October 31, 2017
NOTE 1—Significant Accounting Policies
Invesco Global Targeted Returns Fund (the “Fund”) is a series portfolio of AIM Investment Funds (Invesco Investment Funds) (the “Trust”). The Trust is organized as a Delaware statutory trust and is registered under the Investment Company Act of 1940, as amended (the “1940 Act”), as an open-end series management investment company consisting of twenty separate series portfolios, each authorized to issue an unlimited number of shares of beneficial interest. The assets, liabilities and operations of each portfolio are accounted for separately. Information presented in these consolidated financial statements pertains only to the Fund. Matters affecting each portfolio or class will be voted on exclusively by the shareholders of such portfolio or class.
The Fund will seek to gain exposure to the commodity markets primarily through investments in the Invesco Cayman Commodity Fund VII Ltd. (the “Subsidiary”), a wholly-owned subsidiary of the Fund organized under the laws of the Cayman Islands. The Subsidiary was organized by the Fund to invest in commodity-linked derivatives and other securities that may provide leveraged and non-leveraged exposure to commodities. The Fund may invest up to 25% of its total assets in the Subsidiary.
The Fund’s investment objective is to seek a positive total return over the long term in all market environments.
The Fund currently consists of six different classes of shares: Class A, Class C, Class R, Class Y, Class R5 and Class R6. Class Y shares are available only to certain investors. Class A shares are sold with a front-end sales charge unless certain waiver criteria are met and under certain circumstances load waived shares may be subject to contingent deferred sales charges (“CDSC”). Class C shares are sold with a CDSC. Class R, Class Y, Class R5 and Class R6 shares are sold at net asset value.
The Fund is an investment company and accordingly follows the investment company accounting and reporting guidance in accordance with Financial Accounting Standards Board Accounting Standards Codification Topic 946, Financial Services — Investment Companies.
The following is a summary of the significant accounting policies followed by the Fund in the preparation of its consolidated financial statements.
| A. | Security Valuations — Securities, including restricted securities, are valued according to the following policy. |
A security listed or traded on an exchange (except convertible securities) is valued at its last sales price or official closing price as of the close of the customary trading session on the exchange where the security is principally traded, or lacking any sales or official closing price on a particular day, the security may be valued at the closing bid price on that day. Securities traded in the over-the-counter market are valued based on prices furnished by independent pricing services or market makers. When such securities are valued by an independent pricing service they may be considered fair valued. Futures contracts are valued at the final settlement price set by an exchange on which they are principally traded. Listed options are valued at the mean between the last bid and asked prices from the exchange on which they are principally traded. Options not listed on an exchange are valued by an independent source at the mean between the last bid and asked prices. For purposes of determining net asset value (“NAV”) per share, futures and option contracts generally are valued 15 minutes after the close of the customary trading session of the New York Stock Exchange (“NYSE”).
Investments in open-end and closed-end registered investment companies that do not trade on an exchange are valued at the end-of-day net asset value per share. Investments in open-end and closed-end registered investment companies that trade on an exchange are valued at the last sales price or official closing price as of the close of the customary trading session on the exchange where the security is principally traded.
Swap agreements are fair valued using an evaluated quote, if available, provided by an independent pricing service. Evaluated quotes provided by the pricing service are valued based on a model which may include end-of-day net present values, spreads, ratings, industry, company performance and returns of referenced assets. Centrally cleared swap agreements are valued at the daily settlement price determined by the relevant exchange or clearinghouse.
Debt obligations (including convertible securities) and unlisted equities are fair valued using an evaluated quote provided by an independent pricing service. Evaluated quotes provided by the pricing service may be determined without exclusive reliance on quoted prices, and may reflect appropriate factors such as institution-size trading in similar groups of securities, developments related to specific securities, dividend rate (for unlisted equities), yield (for debt obligations), quality, type of issue, coupon rate (for debt obligations), maturity (for debt obligations), individual trading characteristics and other market data. Pricing services generally value debt obligations assuming orderly transactions of institutional round lot size, but a fund may hold or transact in the same securities in smaller, odd lot sizes. Odd lots often trade at lower prices than institutional round lots. Debt obligations are subject to interest rate and credit risks. In addition, all debt obligations involve some risk of default with respect to interest and/or principal payments.
Foreign securities’ (including foreign exchange contracts) prices are converted into U.S. dollar amounts using the applicable exchange rates as of the close of the NYSE. If market quotations are available and reliable for foreign exchange-traded equity securities, the securities will be valued at the market quotations. Because trading hours for certain foreign securities end before the close of the NYSE, closing market quotations may become unreliable. If between the time trading ends on a particular security and the close of the customary trading session on the NYSE, events occur that the investment adviser determines are significant and make the closing price unreliable, the Fund may fair value the security. If the event is likely to have affected the closing price of the security, the security will be valued at fair value in good faith using procedures approved by the Board of Trustees. Adjustments to closing prices to reflect fair value may also be based on a screening process of an independent pricing service to indicate the degree of certainty, based on historical data, that the closing price in the principal market where a foreign security trades is not the current value as of the close of the NYSE. Foreign securities’ prices meeting the approved degree of certainty that the price is not reflective of current value will be priced at the indication of fair value from the independent pricing service. Multiple factors may be considered by the independent pricing service in determining adjustments to reflect fair value and may include information relating to sector indices, American Depositary Receipts and domestic and foreign index futures. Foreign securities may have additional risks including exchange rate changes, potential for sharply devalued currencies and high inflation, political and economic upheaval, the relative lack of issuer information, relatively low market liquidity and the potential lack of strict financial and accounting controls and standards.
Securities for which market prices are not provided by any of the above methods may be valued based upon quotes furnished by independent sources. The last bid price may be used to value equity securities. The mean between the last bid and asked prices is used to value debt obligations, including corporate loans.
57 Invesco Global Targeted Returns Fund
Securities for which market quotations are not readily available or became unreliable are valued at fair value as determined in good faith by or under the supervision of the Trust’s officers following procedures approved by the Board of Trustees. Issuer specific events, market trends, bid/asked quotes of brokers and information providers and other market data may be reviewed in the course of making a good faith determination of a security’s fair value.
The Fund may invest in securities that are subject to interest rate risk, meaning the risk that the prices will generally fall as interest rates rise and, conversely, the prices will generally rise as interest rates fall. Specific securities differ in their sensitivity to changes in interest rates depending on their individual characteristics. Changes in interest rates may result in increased market volatility, which may affect the value and/or liquidity of certain Fund investments.
Valuations change in response to many factors including the historical and prospective earnings of the issuer, the value of the issuer’s assets, general economic conditions, interest rates, investor perceptions and market liquidity. Because of the inherent uncertainties of valuation, the values reflected in the consolidated financial statements may materially differ from the value received upon actual sale of those investments.
| B. | Securities Transactions and Investment Income — Securities transactions are accounted for on a trade date basis. Realized gains or losses on sales are computed on the basis of specific identification of the securities sold. Interest income (net of withholding tax, if any) is recorded on the accrual basis from settlement date. Bond premiums and discounts are amortized and/or accreted over the lives of the respective securities. Pay-in-kind income received in the form of securities in-lieu of cash is recorded as interest income. Dividend income (net of withholding tax, if any) is recorded on the ex-dividend date. |
The Fund may periodically participate in litigation related to Fund investments. As such, the Fund may receive proceeds from litigation settlements. Any proceeds received are included in the Consolidated Statement of Operations as realized gain (loss) for investments no longer held and as unrealized gain (loss) for investments still held.
Brokerage commissions and mark ups are considered transaction costs and are recorded as an increase to the cost basis of securities purchased and/or a reduction of proceeds on a sale of securities. Such transaction costs are included in the determination of net realized and unrealized gain (loss) from investment securities reported in the Consolidated Statement of Operations and the Consolidated Statement of Changes in Net Assets and the net realized and unrealized gains (losses) on securities per share in the Financial Highlights. Transaction costs are included in the calculation of the Fund’s net asset value and, accordingly, they reduce the Fund’s total returns. These transaction costs are not considered operating expenses and are not reflected in net investment income reported in the Consolidated Statement of Operations and the Consolidated Statement of Changes in Net Assets, or the net investment income per share and the ratios of expenses and net investment income reported in the Financial Highlights, nor are they limited by any expense limitation arrangements between the Fund and the investment adviser.
The Fund allocates income and realized and unrealized capital gains and losses to a class based on the relative net assets of each class.
| C. | Country Determination — For the purposes of making investment selection decisions and presentation in the Consolidated Schedule of Investments, the investment adviser may determine the country in which an issuer is located and/or credit risk exposure based on various factors. These factors include the laws of the country under which the issuer is organized, where the issuer maintains a principal office, the country in which the issuer derives 50% or more of its total revenues and the country that has the primary market for the issuer’s securities, as well as other criteria. Among the other criteria that may be evaluated for making this determination are the country in which the issuer maintains 50% or more of its assets, the type of security, financial guarantees and enhancements, the nature of the collateral and the sponsor organization. Country of issuer and/or credit risk exposure has been determined to be the United States of America, unless otherwise noted. |
| D. | Distributions — Distributions from net investment income and net realized capital gain, if any, are generally declared and paid annually and recorded on the ex-dividend date. The Fund may elect to treat a portion of the proceeds from redemptions as distributions for federal income tax purposes. |
| E. | Federal Income Taxes — The Fund intends to comply with the requirements of Subchapter M of the Internal Revenue Code of 1986, as amended (the “Internal Revenue Code”), necessary to qualify as a regulated investment company and to distribute substantially all of the Fund’s taxable earnings to shareholders. As such, the Fund will not be subject to federal income taxes on otherwise taxable income (including net realized capital gain) that is distributed to shareholders. Therefore, no provision for federal income taxes is recorded in the consolidated financial statements. |
The Fund recognizes the tax benefits of uncertain tax positions only when the position is more likely than not to be sustained. Management has analyzed the Fund’s uncertain tax positions and concluded that no liability for unrecognized tax benefits should be recorded related to uncertain tax positions. Management is not aware of any tax positions for which it is reasonably possible that the total amounts of unrecognized tax benefits will change materially in the next 12 months.
The Subsidiary is classified as a controlled foreign corporation under Subchapter N of the Internal Revenue Code. Therefore, the Fund is required to increase its taxable income by its share of the Subsidiary’s income. Net investment losses of the Subsidiary cannot be deducted by the Fund in the current period nor carried forward to offset taxable income in future periods.
The Fund files tax returns in the U.S. Federal jurisdiction and certain other jurisdictions. Generally the Fund is subject to examinations by such taxing authorities for up to three years after the filing of the return for the tax period.
| F. | Expenses — Fees provided for under the Rule 12b-1 plan of a particular class of the Fund are charged to the operations of such class. Transfer agency fees and expenses and other shareholder recordkeeping fees and expenses attributable to Class R5 and Class R6 are allocated to each share class based on relative net assets. Sub-accounting fees attributable to Class R5 are charged to the operations of the class. Transfer agency fees and expenses and other shareholder recordkeeping fees and expenses relating to all other classes are allocated among those classes based on relative net assets. All other expenses are allocated among the classes based on relative net assets. |
| G. | Accounting Estimates — The financial statements are prepared on a consolidated basis in conformity with accounting principles generally accepted in the United States of America (“GAAP”), which requires management to make estimates and assumptions that affect the reported amounts of assets and liabilities at the date of the financial statements and the reported amounts of revenues and expenses during the reporting period including estimates and assumptions related to taxation. Actual results could differ from those estimates by a significant amount. The accompanying financial statements reflect the financial position of the Fund and its Subsidiary and the results of operations on a consolidated basis. All inter-company accounts and transactions have been eliminated in consolidation. |
58 Invesco Global Targeted Returns Fund
In addition, the Fund monitors for material events or transactions that may occur or become known after the period-end date and before the date the consolidated financial statements are released to print.
| H. | Indemnifications — Under the Trust’s organizational documents, each Trustee, officer, employee or other agent of the Trust, and under the Subsidiary’s organizational documents, the directors and officers of the Subsidiary, are indemnified against certain liabilities that may arise out of the performance of their duties to the Fund and/or the Subsidiary, respectively. Additionally, in the normal course of business, the Fund enters into contracts, including the Fund’s servicing agreements, that contain a variety of indemnification clauses. The Fund’s maximum exposure under these arrangements is unknown as this would involve future claims that may be made against the Fund that have not yet occurred. The risk of material loss as a result of such indemnification claims is considered remote. |
| I. | Treasury Inflation-Protected Securities — The Fund may invest in Treasury Inflation-Protected Securities (“TIPS”). TIPS are fixed income securities whose principal value is periodically adjusted to the rate of inflation. The principal value of TIPS will be adjusted upward or downward, and any increase or decrease in the principal amount of TIPS will be included as interest income in the Statement of Operations, even though investors do not receive their principal until maturity. |
| J. | Structured Securities — The Fund may invest in structured securities. Structured securities are a type of derivative security whose value is determined by reference to changes in the value of underlying securities, currencies, interest rates, commodities, indices or other financial indicators (“reference instruments”). Most structured securities are fixed-income securities that have maturities of three years or less. Structured securities may be positively or negatively indexed (i.e., their principal value or interest rates may increase or decrease if the underlying reference instrument appreciates) and may have return characteristics similar to direct investments in the underlying reference instrument. |
Structured securities may entail a greater degree of market risk than other types of debt securities because the investor bears the risk of the reference instruments. In addition to the credit risk of structured securities and the normal risks of price changes in response to changes in interest rates, the principal amount of structured notes or indexed securities may decrease as a result of changes in the value of the underlying reference instruments. Changes in the daily value of structured securities are recorded as unrealized gains (losses) in the Consolidated Statement of Operations. When the structured securities mature or are sold, the Fund recognizes a realized gain (loss) on the Consolidated Statement of Operations.
| K. | Foreign Currency Translations — Foreign currency is valued at the close of the NYSE based on quotations posted by banks and major currency dealers. Portfolio securities and other assets and liabilities denominated in foreign currencies are translated into U.S. dollar amounts at date of valuation. Purchases and sales of portfolio securities (net of foreign taxes withheld on disposition) and income items denominated in foreign currencies are translated into U.S. dollar amounts on the respective dates of such transactions. The Fund does not separately account for the portion of the results of operations resulting from changes in foreign exchange rates on investments and the fluctuations arising from changes in market prices of securities held. The combined results of changes in foreign exchange rates and the fluctuation of market prices on investments (net of estimated foreign tax withholding) are included with the net realized and unrealized gain or loss from investments in the Consolidated Statement of Operations. Reported net realized foreign currency gains or losses arise from (1) sales of foreign currencies, (2) currency gains or losses realized between the trade and settlement dates on securities transactions, and (3) the difference between the amounts of dividends, interest, and foreign withholding taxes recorded on the Fund’s books and the U.S. dollar equivalent of the amounts actually received or paid. Net unrealized foreign currency gains and losses arise from changes in the fair values of assets and liabilities, other than investments in securities at fiscal period end, resulting from changes in exchange rates. |
The Fund may invest in foreign securities, which may be subject to foreign taxes on income, gains on investments or currency repatriation, a portion of which may be recoverable. Foreign taxes, if any, are recorded based on the tax regulations and rates that exist in the foreign markets in which the Fund invests and are shown in the Consolidated Statement of Operations.
| L. | Forward Foreign Currency Contracts — The Fund may engage in foreign currency transactions either on a spot (i.e. for prompt delivery and settlement) basis, or through forward foreign currency contracts, to manage or minimize currency or exchange rate risk. |
The Fund may also enter into forward foreign currency contracts for the purchase or sale of a security denominated in a foreign currency in order to “lock in” the U.S. dollar price of that security, or the Fund may also enter into forward foreign currency contracts that do not provide for physical settlement of the two currencies, but instead are settled by a single cash payment calculated as the difference between the agreed upon exchange rate and the spot rate at settlement based upon an agreed upon notional amount (non-deliverable forwards). The Fund will set aside liquid assets in an amount equal to the daily mark-to-market obligation for forward foreign currency contracts.
A forward foreign currency contract is an obligation between two parties (“Counterparties”) to purchase or sell a specific currency for an agreed-upon price at a future date. The use of forward foreign currency contracts does not eliminate fluctuations in the price of the underlying securities the Fund owns or intends to acquire but establishes a rate of exchange in advance. Fluctuations in the value of these contracts are measured by the difference in the contract date and reporting date exchange rates and are recorded as unrealized appreciation (depreciation) until the contracts are closed. When the contracts are closed, realized gains (losses) are recorded. Realized and unrealized gains (losses) on the contracts are included in the Consolidated Statement of Operations. The primary risks associated with forward foreign currency contracts include failure of the Counterparty to meet the terms of the contract and the value of the foreign currency changing unfavorably. These risks may be in excess of the amounts reflected in the Consolidated Statement of Assets and Liabilities.
| M. | Futures Contracts — The Fund may enter into futures contracts to equitize the Fund’s cash holdings or to manage exposure to interest rate, equity and market price movements and/or currency risks. A futures contract is an agreement between Counterparties to purchase or sell a specified underlying security, currency or commodity (or delivery of a cash settlement price, in the case of an index future) for a fixed price at a future date. The Fund currently invests only in exchange-traded futures and they are standardized as to maturity date and underlying financial instrument. Initial margin deposits required upon entering into futures contracts are satisfied by the segregation of specific securities or cash as collateral at the futures commission merchant (broker). During the period the futures contracts are open, changes in the value of the contracts are recognized as unrealized gains or losses by recalculating the value of the contracts on a daily basis. Subsequent or variation margin payments are received or made depending upon whether unrealized gains or losses are incurred. These amounts are reflected as receivables or payables on the Consolidated Statement of Assets and Liabilities. When the contracts are closed or expire, the Fund recognizes a realized gain or loss equal to the difference between the proceeds from, or cost of, the closing transaction and the Fund’s basis in the contract. The net realized gain (loss) and the change in unrealized gain (loss) on futures contracts held during the period is included on the Consolidated Statement of Operations. The |
59 Invesco Global Targeted Returns Fund
| | primary risks associated with futures contracts are market risk and the absence of a liquid secondary market. If the Fund were unable to liquidate a futures contract and/or enter into an offsetting closing transaction, the Fund would continue to be subject to market risk with respect to the value of the contracts and continue to be required to maintain the margin deposits on the futures contracts. Futures contracts have minimal Counterparty risk since the exchange’s clearinghouse, as Counterparty to all exchange-traded futures, guarantees the futures against default. Risks may exceed amounts recognized in the Consolidated Statement of Assets and Liabilities. |
| N. | Call Options Purchased and Written — The Fund may write covered call options and/or buy call options. A covered call option gives the purchaser of such option the right to buy, and the writer the obligation to sell, the underlying security or foreign currency at the stated exercise price during the option period. Options written by the Fund normally will have expiration dates between three and nine months from the date written. The exercise price of a call option may be below, equal to, or above the current market value of the underlying security at the time the option is written. |
Additionally, the Fund may enter into an option on a swap agreement, also called a “swaption”. A swaption is an option that gives the buyer the right, but not the obligation, to enter into a swap on a future date in exchange for paying a market-based premium. A receiver swaption gives the owner the right to receive the total return of a specified asset, reference rate or index. Swaptions also include options that allow an existing swap to be terminated or extended by one of the Counterparties.
When the Fund writes a covered call option, an amount equal to the premium received by the Fund is recorded as an asset and an equivalent liability in the Consolidated Statement of Assets and Liabilities. The amount of the liability is subsequently “marked-to-market” to reflect the current market value of the option written. If a written covered call option expires on the stipulated expiration date, or if the Fund enters into a closing purchase transaction, the Fund realizes a gain (or a loss if the closing purchase transaction exceeds the premium received when the option was written) without regard to any unrealized gain or loss on the underlying security, and the liability related to such option is extinguished. If a written covered call option is exercised, the Fund realizes a gain or a loss from the sale of the underlying security and the proceeds of the sale are increased by the premium originally received. Realized and unrealized gains and losses on call options written are included in the Consolidated Statement of Operations as Net realized gain (loss) from and Change in net unrealized appreciation (depreciation) of Option contracts written. A risk in writing a covered call option is that the Fund gives up the opportunity for profit if the market price of the security increases and the option is exercised.
When the Fund buys a call option, an amount equal to the premium paid by the Fund is recorded as an investment on the Consolidated Statement of Assets and Liabilities. The amount of the investment is subsequently “marked-to-market” to reflect the current value of the option purchased. Realized and unrealized gains and losses on call options purchased are included in the Consolidated Statement of Operations as Net realized gain (loss) from and Change in net unrealized appreciation (depreciation) of Investment securities. A risk in buying an option is that the Fund pays a premium whether or not the option is exercised. In addition, there can be no assurance that a liquid secondary market will exist for any option purchased.
| O. | Put Options Purchased and Written — The Fund may purchase and write put options including options on securities indexes, or foreign currency and/or futures contracts. By purchasing a put option, the Fund obtains the right (but not the obligation) to sell the option’s underlying instrument at a fixed exercise price. In return for this right, the Fund pays an option premium. The option’s underlying instrument may be a security, securities index, or a futures contract. Put options may be used by the Fund to hedge securities it owns by locking in a minimum price at which the Fund can sell. If security prices fall, the put option could be exercised to offset all or a portion of the Fund’s resulting losses. At the same time, because the maximum the Fund has at risk is the cost of the option, purchasing put options does not eliminate the potential for the Fund to profit from an increase in the value of the underlying portfolio securities. The Fund may write put options to earn additional income in the form of option premiums if it expects the price of the underlying instrument to remain stable or rise during the option period so that the option will not be exercised. The risk in this strategy is that the price of the underlying securities may decline by an amount greater than the premium received. Put options written are reported as a liability in the Consolidated Statement of Assets and Liabilities. Realized and unrealized gains and losses on put options purchased and put options written are included in the Consolidated Statement of Operations as Net realized gain (loss) from and Change in net unrealized appreciation (depreciation) of Investment securities and Option contracts written, respectively. A risk in buying an option is that the Fund pays a premium whether or not the option is exercised. In addition, there can be no assurance that a liquid secondary market will exist for any option purchased. |
| P. | Swap Agreements — The Fund may enter into various swap transactions, including interest rate, total return, volatility, variance, index, currency and credit default swap contracts (“CDS”) for investment purposes or to manage interest rate, equity, currency or credit risk. Such transactions are agreements between Counterparties. A swap agreement may be negotiated bilaterally and traded over-the-counter (“OTC”) between two parties (“uncleared/OTC”) or, in some instances, must be transacted through a future commission merchant (“FCM”) and cleared through a clearinghouse that serves as a central Counterparty (“centrally cleared swap”). These agreements may contain among other conditions, events of default and termination events, and various covenants and representations such as provisions that require the Fund to maintain a pre-determined level of net assets, and/or provide limits regarding the decline of the Fund’s NAV over specific periods of time. If the Fund were to trigger such provisions and have open derivative positions at that time, the Counterparty may be able to terminate such agreement and request immediate payment in an amount equal to the net liability positions, if any. |
Interest rate, total return, volatility, variance, index and currency swap agreements are two-party contracts entered into primarily to exchange the returns (or differentials in rates of returns) earned or realized on particular predetermined investments or instruments. The gross returns to be exchanged or “swapped” between the parties are calculated with respect to a notional amount, i.e., the return on or increase in value of a particular dollar amount invested at a particular interest rate or return of an underlying asset, in a particular foreign currency, or in a “basket” of securities representing a particular index.
Inflation swap agreements are contracts in which one party agrees to pay the cumulative percentage increase in a price index, such as the Consumer Price Index, over the term of the swap, and the other party pays a compounded fixed rate.
In a centrally cleared swap, the Fund’s ultimate Counterparty is a central clearinghouse. The Fund will initially enter into centrally cleared swaps through an executing broker. When a fund enters into a centrally cleared swap, it must deliver to the central Counterparty (via the FCM) an amount referred to as “initial margin.” Initial margin requirements are determined by the central Counterparty, but an FCM may require additional initial margin above the amount required by the central Counterparty. Initial margin deposits required upon entering into centrally cleared swaps
60 Invesco Global Targeted Returns Fund
are satisfied by cash or securities as collateral at the FCM. Securities deposited as initial margin are designated on the Consolidated Schedule of Investments and cash deposited is recorded on the Consolidated Statement of Assets and Liabilities. During the term of a cleared swap agreement, a “variation margin” amount may be required to be paid by the Fund or may be received by the Fund, based on the daily change in price of the underlying reference instrument subject to the swap agreement and is recorded as a receivable or payable for variation margin in the Consolidated Statement of Assets and Liabilities until the centrally cleared swap is terminated, at which time a realized gain or loss is recorded.
A CDS is an agreement between Counterparties to exchange the credit risk of an issuer. A buyer of a CDS is said to buy protection by paying a fixed payment over the life of the agreement and in some situations an upfront payment to the seller of the CDS. If a defined credit event occurs (such as payment default or bankruptcy), the Fund as a protection buyer would cease paying its fixed payment, the Fund would deliver eligible bonds issued by the reference entity to the seller, and the seller would pay the full notional value, or the “par value”, of the referenced obligation to the Fund. A seller of a CDS is said to sell protection and thus would receive a fixed payment over the life of the agreement and an upfront payment, if applicable. If a credit event occurs, the Fund as a protection seller would cease to receive the fixed payment stream, the Fund would pay the buyer “par value” or the full notional value of the referenced obligation, and the Fund would receive the eligible bonds issued by the reference entity. In turn, these bonds may be sold in order to realize a recovery value. Alternatively, the seller of the CDS and its Counterparty may agree to net the notional amount and the market value of the bonds and make a cash payment equal to the difference to the buyer of protection. If no credit event occurs, the Fund receives the fixed payment over the life of the agreement. As the seller, the Fund would effectively add leverage to its portfolio because, in addition to its total net assets, the Fund would be subject to investment exposure on the notional amount of the CDS. In connection with these agreements, cash and securities may be identified as collateral in accordance with the terms of the respective swap agreements to provide assets of value and recourse in the event of default under the swap agreement or bankruptcy/insolvency of a party to the swap agreement. If a Counterparty becomes bankrupt or otherwise fails to perform its obligations due to financial difficulties, the Fund may experience significant delays in obtaining any recovery in a bankruptcy or other reorganization proceeding. The Fund may obtain only limited recovery or may obtain no recovery in such circumstances. The Fund’s maximum risk of loss from Counterparty risk, either as the protection seller or as the protection buyer, is the value of the contract. The risk may be mitigated by having a master netting arrangement between the Fund and the Counterparty and by the designation of collateral by the Counterparty to cover the Fund’s exposure to the Counterparty.
Implied credit spreads represent the current level at which protection could be bought or sold given the terms of the existing CDS contract and serve as an indicator of the current status of the payment/performance risk of the CDS. An implied spread that has widened or increased since entry into the initial contract may indicate a deteriorating credit profile and increased risk of default for the reference entity. A declining or narrowing spread may indicate an improving credit profile or decreased risk of default for the reference entity. Alternatively, credit spreads may increase or decrease reflecting the general tolerance for risk in the credit markets.
A volatility swap involves an exchange between the Fund and a Counterparty of periodic payments based on the measured volatility of an underlying security, currency, commodity, interest rate, index or other reference asset over a specified time frame. Depending on the structure of the swap, either the Fund’s or the Counterparty’s payment obligation will typically be based on the realized volatility of the reference asset as measured by changes in its price or level over a specified time period, while the other party’s payment obligation will be based on a specified rate representing expected volatility for the reference asset at the time the swap is executed, or the measured volatility of a different reference asset over a specified time period. The Fund will typically make or lose money on a volatility swap depending on the magnitude of the reference asset’s volatility, or size of the movements in its price, over a specified time period, rather than general increases or decreases in the price of the reference asset. Volatility swaps are often used to speculate on future volatility levels, to trade the spread between realized and expected volatility, or to decrease the volatility exposure of other investments held by the Fund. Variance swaps are similar to volatility swaps, except payments are based on the difference between the implied and measured volatility mathematically squared.
An interest rate swap is an agreement between Counterparties pursuant to which the parties exchange a floating rate payment for a fixed rate payment based on a specified notional amount.
Changes in the value of centrally cleared and OTC swap agreements are recognized as unrealized gains (losses) in the Consolidated Statement of Operations by “marking to market” on a daily basis to reflect the value of the swap agreement at the end of each trading day. Payments received or paid at the beginning of the agreement are reflected as such on the Consolidated Statement of Assets and Liabilities and may be referred to as upfront payments. The Fund accrues for the fixed payment stream and amortizes upfront payments, if any, on swap agreements on a daily basis with the net amount, recorded as a component of realized gain (loss) on the Consolidated Statement of Operations. A liquidation payment received or made at the termination of a swap agreement is recorded as realized gain (loss) on the Consolidated Statement of Operations. The Fund segregates cash or liquid securities having a value at least equal to the amount of the potential obligation of the Fund under any swap transaction. Cash held as collateral is recorded as deposits with brokers on the Consolidated Statement of Assets and Liabilities. Entering into these agreements involves, to varying degrees, lack of liquidity and elements of credit, market, and Counterparty risk in excess of amounts recognized on the Consolidated Statement of Assets and Liabilities. Such risks involve the possibility that a swap is difficult to sell or liquidate, the Counterparty does not honor its obligations under the agreement and unfavorable interest rates and market fluctuations. It is possible that developments in the swaps market, including potential government regulation, could adversely affect the Fund’s ability to terminate existing swap agreements or to realize amounts to be received under such agreements. A short position in a security poses more risk than holding the same security long. As there is no limit on how much the price of the security can increase, the Fund’s exposure is unlimited.
Notional amounts of each individual credit default swap agreement outstanding as of October 31, 2017 for which the Fund is the seller of protection are disclosed in the open swap agreements table. These potential amounts would be partially offset by any recovery values of the respective referenced obligations, upfront payments received upon entering into the agreement, or net amounts received from the settlement of buy protection credit default swap agreements entered into by the Fund for the same referenced entity or entities.
| Q. | Other Risks — The Fund will seek to gain exposure to commodity markets primarily through an investment in the Subsidiary and through investments in exchange-traded funds and commodity-linked derivatives. The Subsidiary, unlike the Fund, may invest without limitation in commodities, commodity-linked derivatives and other securities, such as exchange-traded and commodity-linked notes, that may provide leveraged and non-leveraged exposure to commodity markets. The Fund is indirectly exposed to the risks associated with the Subsidiary’s investments. |
61 Invesco Global Targeted Returns Fund
| R. | Leverage Risk — Leverage exists when the Fund can lose more than it originally invests because it purchases or sells an instrument or enters into a transaction without investing an amount equal to the full economic exposure of the instrument or transaction. |
| S. | Collateral — To the extent the Fund has designated or segregated a security as collateral and that security is subsequently sold, it is the Fund’s practice to replace such collateral no later than the next business day. |
NOTE 2—Advisory Fees and Other Fees Paid to Affiliates
The Trust has entered into a master investment advisory agreement with Invesco Advisers, Inc. (the “Adviser” or “Invesco”). Effective January 1, 2017, under the terms of the investment advisory agreement, the Fund accrues daily and pays monthly an advisory fee to the Adviser based on the annual rate of the Fund’s average daily net assets as follows:
| | | | |
| Average Daily Net Assets | | Rate | |
First $250 million | | | 1.10% | |
Next $250 million | | | 1.08% | |
Next $500 million | | | 1.05% | |
Next $1.5 billion | | | 1.03% | |
Next $2.5 billion | | | 1.00% | |
Next $2.5 billion | | | 0.98% | |
Next $2.5 billion | | | 0.95% | |
Over $10 billion | | | 0.93% | |
Prior to January 1, 2017, the Fund paid an advisory fee to the Adviser based on the annual rate of the Fund’s average daily net assets as follows:
| | | | |
| Average Daily Net Assets | | Rate | |
First $10 billion | | | 1.50% | |
Over $10 billion | | | 1.25% | |
For the year ended October 31, 2017, the effective advisory fees incurred by the Fund was 1.18%.
The Subsidiary has entered into a separate contract with the Adviser whereby the Adviser provides investment advisory and other services to the Subsidiary. In consideration of these services, the Subsidiary pays an advisory fee to the Adviser based on the annual rate of the Subsidiary’s average daily net assets as set forth in the table above.
Under the terms of a master sub-advisory agreement between the Adviser and each of Invesco Asset Management Deutschland GmbH, Invesco Asset Management Limited, Invesco Asset Management (Japan) Limited, Invesco Hong Kong Limited, Invesco Senior Secured Management, Inc. and Invesco Canada Ltd. and separate sub-advisory agreements with Invesco PowerShares Capital Management LLC and Invesco Asset Management (India) Private Limited (collectively, the “Affiliated Sub-Advisers”) the Adviser, not the Fund, will pay 40% of the fees paid to the Adviser to any such Affiliated Sub-Adviser(s) that provide(s) discretionary investment management services to the Fund based on the percentage of assets allocated to such Affiliated Sub-Adviser(s).
Effective January 1, 2017, the Adviser has contractually agreed, through at least February 28, 2019, to waive advisory fees and/or reimburse expenses to the extent necessary to limit total annual fund operating expenses after fee waiver and/or expense reimbursement (including prior fiscal year-end Acquired Fund Fees and Expenses of 0.42% and excluding certain items discussed below) of Class A, Class C, Class R, Class Y, Class R5 and Class R6 shares to 1.44%, 2.19%, 1.69%, 1.19%, 1.19% and 1.19%, respectively, of average daily net assets (the “expense limits”). Prior to January 1, 2017, the Adviser had contractually agreed to waive advisory fees and/or reimburse expenses to the extent necessary to limit total annual fund operating expenses after fee waiver and/or expense reimbursement (excluding certain items discussed below) of Class A, Class C, Class R, Class Y, Class R5 and Class R6 shares to 1.65%, 2.40%, 1.90%, 1.40%, 1.40% and 1.40%, respectively, of average daily net assets. In determining the Adviser’s obligation to waive advisory fees and/or reimburse expenses, the following expenses are not taken into account, and could cause total annual fund operating expenses after fee waiver and/or expense reimbursement to exceed the numbers reflected above: (1) interest; (2) taxes; (3) dividend expense on short sales; (4) extraordinary or non-routine items, including litigation expenses; and (5) expenses that the Fund has incurred but did not actually pay because of an expense offset arrangement. Acquired Fund Fees and Expenses are not operating expenses of the Fund directly, but are fees and expenses, including management fees of the investment companies in which the Fund invests. As a result, the total annual fund operating expenses after expense reimbursement may exceed the expense limits above. Unless Invesco continues the fee waiver agreement, it will terminate on February 28, 2019. During its term, the fee waiver agreement cannot be terminated or amended to increase the expense limits or reduce the advisory fee waiver without approval of the Board of Trustees.
Further, the Adviser has contractually agreed, through at least June 30, 2019, to waive the advisory fee payable by the Fund in an amount equal to 100% of the net advisory fees the Adviser receives on the Fund’s investments in certain affiliated funds.
For the year ended October 31, 2017, the Adviser waived advisory fees of $1,397,551 and reimbursed class level expenses of $21,674, $13,486, $21, $134,390, $33 and $119 of Class A, Class C, Class R, Class Y, Class R5 and Class R6 shares, respectively.
The Trust has entered into a master administrative services agreement with Invesco pursuant to which the Fund has agreed to pay Invesco for certain administrative costs incurred in providing accounting services to the Fund. For the year ended October 31, 2017, expenses incurred under the agreement are shown in the Consolidated Statement of Operations as Administrative services fees.
The Trust has entered into a transfer agency and service agreement with Invesco Investment Services, Inc. (“IIS”) pursuant to which the Fund has agreed to pay IIS a fee for providing transfer agency and shareholder services to the Fund and reimburse IIS for certain expenses incurred by IIS in the course of providing such services. IIS may make payments to intermediaries that provide omnibus account services, sub-accounting services and/or networking services. All fees payable by IIS to intermediaries that provide omnibus account services or sub-accounting services are charged back to the Fund, subject to certain limitations approved by the Trust’s Board of Trustees. For the year ended October 31, 2017, expenses incurred under the agreement are shown in the Consolidated Statement of Operations as Transfer agent fees.
62 Invesco Global Targeted Returns Fund
The Trust has entered into master distribution agreements with Invesco Distributors, Inc. (“IDI”) to serve as the distributor for the Class A, Class C, Class R, Class Y, Class R5 and Class R6 shares of the Fund. The Trust has adopted plans pursuant to Rule 12b-1 under the 1940 Act with respect to the Fund’s Class A, Class C and Class R shares (collectively, the “Plans”). The Fund, pursuant to the Plans, pays IDI compensation at the annual rate of 0.25% of the Fund’s average daily net assets of Class A shares, 1.00% of the average daily net assets of Class C shares and 0.50% of the average daily net assets of Class R shares. The fees are accrued daily and paid monthly. Of the Plan payments, up to 0.25% of the average daily net assets of each class of shares may be paid to furnish continuing personal shareholder services to customers who purchase and own shares of such classes. Any amounts not paid as a service fee under the Plans would constitute an asset-based sales charge. Rules of the Financial Industry Regulatory Authority (“FINRA”) impose a cap on the total sales charges, including asset-based sales charges, that may be paid by any class of shares of the Fund. For the year ended October 31, 2017, expenses incurred under the Plans are shown in the Consolidated Statement of Operations as Distribution fees.
Front-end sales commissions and CDSC (collectively, the “sales charges”) are not recorded as expenses of the Fund. Front-end sales commissions are deducted from proceeds from the sales of Fund shares prior to investment in Class A shares of the Fund. CDSC are deducted from redemption proceeds prior to remittance to the shareholder. During the year ended October 31, 2017, IDI advised the Fund that IDI retained $596 in front-end sales commissions from the sale of Class A shares and $678 and $2,256 from Class A and Class C shares, respectively, for CDSC imposed upon redemptions by shareholders.
Certain officers and trustees of the Trust are officers and directors of the Adviser, IIS and/or IDI.
NOTE 3—Additional Valuation Information
GAAP defines fair value as the price that would be received to sell an asset or paid to transfer a liability in an orderly transaction between market participants at the measurement date, under current market conditions. GAAP establishes a hierarchy that prioritizes the inputs to valuation methods, giving the highest priority to readily available unadjusted quoted prices in an active market for identical assets (Level 1) and the lowest priority to significant unobservable inputs (Level 3), generally when market prices are not readily available or are unreliable. Based on the valuation inputs, the securities or other investments are tiered into one of three levels. Changes in valuation methods may result in transfers in or out of an investment’s assigned level:
| | Level 1 — | Prices are determined using quoted prices in an active market for identical assets. |
| | Level 2 — | Prices are determined using other significant observable inputs. Observable inputs are inputs that other market participants may use in pricing a security. These may include quoted prices for similar securities, interest rates, prepayment speeds, credit risk, yield curves, loss severities, default rates, discount rates, volatilities and others. |
| | Level 3 — | Prices are determined using significant unobservable inputs. In situations where quoted prices or observable inputs are unavailable (for example, when there is little or no market activity for an investment at the end of the period), unobservable inputs may be used. Unobservable inputs reflect the Fund’s own assumptions about the factors market participants would use in determining fair value of the securities or instruments and would be based on the best available information. |
The following is a summary of the tiered valuation input levels, as of October 31, 2017. The level assigned to the securities valuations may not be an indication of the risk or liquidity associated with investing in those securities. Because of the inherent uncertainties of valuation, the values reflected in the consolidated financial statements may materially differ from the value received upon actual sale of those investments.
The Fund’s policy is to recognize transfers in and out of the valuation levels as of the end of the reporting period. During the year ended October 31, 2017, there were no material transfers between valuation levels.
| | | | | | | | | | | | | | | | |
| | | Level 1 | | | Level 2 | | | Level 3 | | | Total | |
Common Stocks & Other Equity Interests | | $ | 45,564,446 | | | $ | 14,660,495 | | | $ | — | | | $ | 60,224,941 | |
Non-U.S. Dollar Denominated Bonds | | | — | | | | 25,171,941 | | | | — | | | | 25,171,941 | |
U.S. Government Sponsored Agency Securities | | | — | | | | 15,253,089 | | | | — | | | | 15,253,089 | |
U.S. Treasury Securities | | | — | | | | 1,147,042 | | | | — | | | | 1,147,042 | |
Preferred Stocks | | | — | | | | 10,384 | | | | — | | | | 10,384 | |
Money Market Funds | | | 28,584,863 | | | | — | | | | — | | | | 28,584,863 | |
Options Purchased | | | 26,865 | | | | 8,329,084 | | | | — | | | | 8,355,949 | |
| | | | 74,176,174 | | | | 64,572,035 | | | | — | | | | 138,748,209 | |
Forward Foreign Currency Contracts* | | | — | | | | (752,770 | ) | | | — | | | | (752,770 | ) |
Futures Contracts* | | | (1,839,076 | ) | | | — | | | | — | | | | (1,839,076 | ) |
Options Written* | | | — | | | | (4,942,918 | ) | | | — | | | | (4,942,918 | ) |
Swap Agreements* | | | — | | | | (949,353 | ) | | | — | | | | (949,353 | ) |
Total Investments | | $ | 72,337,098 | | | $ | 57,926,994 | | | $ | — | | | $ | 130,264,092 | |
| * | Forward foreign currency contracts, futures contracts and swap agreements are valued at unrealized appreciation (depreciation). Options written are shown at value. |
NOTE 4—Derivative Investments
The Fund may enter into an International Swaps and Derivatives Association Master Agreement (“ISDA Master Agreement”) under which a fund may trade OTC derivatives. An OTC transaction entered into under an ISDA Master Agreement typically involves a collateral posting arrangement, payment netting provisions and close-out netting provisions. These netting provisions allow for reduction of credit risk through netting of contractual obligations. The enforceability of the netting provisions of the ISDA Master Agreement depends on the governing law of the ISDA Master Agreement, among other factors.
63 Invesco Global Targeted Returns Fund
For financial reporting purposes, the Fund does not offset OTC derivative assets or liabilities that are subject to ISDA Master Agreements in the Consolidated Statement of Assets and Liabilities.
Value of Derivative Investments at Period-End
The table below summarizes the value of the Fund’s derivative investments, detailed by primary risk exposure, held as of October 31, 2017:
| | | | | | | | | | | | | | | | | | | | | | | | |
| | | Value | |
| Derivative Assets | | Commodity
Risk | | | Credit
Risk | | | Currency
Risk | | | Equity
Risk | | | Interest Rate
Risk | | | Total | |
Unrealized appreciation on futures contracts —
Exchange-Traded(a) | | $ | — | | | $ | — | | | $ | — | | | $ | 1,138,783 | | | $ | 20,785 | | | $ | 1,159,568 | |
Unrealized appreciation on swap agreements —
Centrally Cleared(a) | | | — | | | | 17,268 | | | | — | | | | — | | | | 3,164,831 | | | | 3,182,099 | |
Unrealized appreciation on swap agreements — OTC | | | 7,393 | | | | — | | | | — | | | | 5,723,616 | | | | 181,536 | | | | 5,912,545 | |
Options purchased, at value — Exchange-Traded(b) | | | — | | | | — | | | | — | | | | 26,865 | | | | — | | | | 26,865 | |
Options purchased, at value — OTC(b) | | | — | | | | — | | | | 3,176,530 | | | | 5,152,554 | | | | — | | | | 8,329,084 | |
Unrealized appreciation on forward foreign currency contracts outstanding | | | — | | | | — | | | | 1,917,644 | | | | — | | | | — | | | | 1,917,644 | |
Total Derivative Assets | | | 7,393 | | | | 17,268 | | | | 5,094,174 | | | | 12,041,818 | | | | 3,367,152 | | | | 20,527,805 | |
Derivatives not subject to master netting agreements | | | — | | | | (17,268 | ) | | | — | | | | (1,165,648 | ) | | | (3,185,616 | ) | | | (4,368,532 | ) |
Total Derivative Assets subject to master netting agreements | | $ | 7,393 | | | $ | — | | | $ | 5,094,174 | | | $ | 10,876,170 | | | $ | 181,536 | | | $ | 16,159,273 | |
| |
| | | Value | |
| Derivative Liabilities | | Commodity
Risk | | | Credit
Risk | | | Currency
Risk | | | Equity
Risk | | | Interest Rate
Risk | | | Total | |
Unrealized depreciation on futures contracts —
Exchange-Traded(a) | | $ | — | | | $ | — | | | $ | — | | | $ | (2,723,638 | ) | | $ | (275,006 | ) | | $ | (2,998,644 | ) |
Unrealized depreciation on swap agreements —
Centrally Cleared(a) | | | — | | | | (380,115 | ) | | | — | | | | — | | | | (2,298,100 | ) | | | (2,678,215 | ) |
Unrealized depreciation on swap agreements — OTC | | | (29,632 | ) | | | — | | | | — | | | | (6,227,349 | ) | | | (1,108,801 | ) | | | (7,365,782 | ) |
Options written, at value — OTC | | | — | | | | — | | | | (3,872,816 | ) | | | (1,070,102 | ) | | | — | | | | (4,942,918 | ) |
Unrealized depreciation on forward foreign currency contracts outstanding | | | — | | | | — | | | | (2,670,414 | ) | | | — | | | | — | | | | (2,670,414 | ) |
Total Derivative Liabilities | | | (29,632 | ) | | | (380,115 | ) | | | (6,543,230 | ) | | | (10,021,089 | ) | | | (3,681,907 | ) | | | (20,655,973 | ) |
Derivatives not subject to master netting agreements | | | — | | | | 380,115 | | | | — | | | | 2,723,638 | | | | 2,573,106 | | | | 5,676,859 | |
Total Derivative Liabilities subject to master netting agreements | | $ | (29,632 | ) | | $ | — | | | $ | (6,543,230 | ) | | $ | (7,297,451 | ) | | $ | (1,108,801 | ) | | $ | (14,979,114 | ) |
| (a) | The variation margin receivable (payable) at period-end is recorded in the Consolidated Statement of Assets and Liabilities. |
| (b) | Options purchased, at value as reported in the Consolidated Schedule of Investments. |
64 Invesco Global Targeted Returns Fund
Offsetting Assets and Liabilities
The table below reflects the Fund’s exposure to Counterparties subject to either an ISDA Master Agreement or other agreement for OTC derivative transactions as of October 31, 2017.
| | | | | | | | | | | | | | | | | | | | | | | | | | | | | | | | | | | | | | | | | | | | | | | | |
| | | Financial Derivative Assets | | | Financial Derivative Liabilities | | | Net Value of
Derivatives | | | Collateral
(Received)/Pledged | | | Net
Amount(a) | |
| | | Forward
Foreign
Currency
Contracts | | | Options
Purchased | | | Swap
Agreements | | | Total
Assets | | | Forward
Foreign
Currency
Contracts | | | Options
Written | | | Swap
Agreements | | | Total
Liabilities | | | | | | |
| Counterparty | | | | | | | | | | | Non-Cash | | | Cash | | |
Fund | | | | | | | | | | | | | | | | | | | | | | | | | | | | | | | | | | | | | | | | | | | | | | | | |
Bank of America Merrill Lynch | | $ | — | | | $ | 294,624 | | | $ | — | | | $ | 294,624 | | | $ | — | | | $ | (482,629 | ) | | $ | — | | | $ | (482,629 | ) | | $ | (188,005 | ) | | $ | — | | | $ | 188,005 | | | $ | — | |
Barclays Bank PLC | | | 444,554 | | | | 340,500 | | | | — | | | | 785,054 | | | | (1,299,017 | ) | | | (414,934 | ) | | | — | | | | (1,713,951 | ) | | | (928,897 | ) | | | — | | | | 810,000 | | | | (118,897 | ) |
BNP Paribas S.A. | | | — | | | | 10,090 | | | | 130,429 | | | | 140,519 | | | | — | | | | — | | | | (219,803 | ) | | | (219,803 | ) | | | (79,284 | ) | | | — | | | | 79,284 | | | | — | |
Citigroup Global Markets Inc. | | | 9,110 | | | | 474,071 | | | | 89,208 | | | | 572,389 | | | | (60,251 | ) | | | (261,724 | ) | | | (91,449 | ) | | | (413,424 | ) | | | 158,965 | | | | — | | | | (158,965 | ) | | | — | |
Deutsche Bank Securities Inc. | | | 268,642 | | | | 249,501 | | | | — | | | | 518,143 | | | | (184,546 | ) | | | (108,947 | ) | | | — | | | | (293,493 | ) | | | 224,650 | | | | — | | | | (150,000 | ) | | | 74,650 | |
Goldman Sachs International | | | 592,417 | | | | 3,009,961 | | | | 257,122 | | | | 3,859,500 | | | | (756,229 | ) | | | (2,719,477 | ) | | | (530,016 | ) | | | (4,005,722 | ) | | | (146,222 | ) | | | — | | | | — | | | | (146,222 | ) |
HSBC New York | | | — | | | | 31,116 | | | | — | | | | 31,116 | | | | — | | | | — | | | | (129,415 | ) | | | (129,415 | ) | | | (98,299 | ) | | | — | | | | 80,000 | | | | (18,299 | ) |
J.P. Morgan Chase Bank, N.A. | | | — | | | | 1,725,126 | | | | 2,678,538 | | | | 4,403,664 | | | | — | | | | (443,019 | ) | | | (1,915,290 | ) | | | (2,358,309 | ) | | | 2,045,355 | | | | — | | | | (1,810,000 | ) | | | 235,355 | |
Morgan Stanley & Co. LLC | | | 107,124 | | | | 589,310 | | | | 182,447 | | | | 878,881 | | | | (91,583 | ) | | | (261,312 | ) | | | (112,755 | ) | | | (465,650 | ) | | | 413,231 | | | | — | | | | (413,231 | ) | | | — | |
RBC Capital Markets LLC | | | 1,627 | | | | — | | | | — | | | | 1,627 | | | | (1,122 | ) | | | — | | | | — | | | | (1,122 | ) | | | 505 | | | | — | | | | — | | | | 505 | |
State Street Bank & Trust Co. | | | 487,792 | | | | — | | | | — | | | | 487,792 | | | | (273,139 | ) | | | — | | | | — | | | | (273,139 | ) | | | 214,653 | | | | — | | | | — | | | | 214,653 | |
Societe Generale | | | — | | | | 831,707 | | | | 1,849,404 | | | | 2,681,111 | | | | — | | | | — | | | | (2,643,763 | ) | | | (2,643,763 | ) | | | 37,348 | | | | — | | | | — | | | | 37,348 | |
UBS | | | 6,378 | | | | 773,078 | | | | 596,375 | | | | 1,375,831 | | | | (4,527 | ) | | | (250,876 | ) | | | (543,594 | ) | | | (798,997 | ) | | | 576,834 | | | | — | | | | (270,000 | ) | | | 306,834 | |
Subtotal — Fund | | | 1,917,644 | | | | 8,329,084 | | | | 5,783,523 | | | | 16,030,251 | | | | (2,670,414 | ) | | | (4,942,918 | ) | | | (6,186,085 | ) | | | (13,799,417 | ) | | | 2,230,834 | | | | — | | | | (1,644,907 | ) | | | 585,927 | |
| | | | | | | | | | | | |
Subsidiary | | | | | | | | | | | | | | | | | | | | | | | | | | | | | | | | | | | | | | | | | | | | | | | | |
Barclays Bank PLC | | | — | | | | — | | | | 162,398 | | | | 162,398 | | | | — | | | | — | | | | (173,814 | ) | | | (173,814 | ) | | | (11,416 | ) | | | — | | | | — | | | | (11,416 | ) |
BNP Paribas S.A. | | | — | | | | — | | | | 5,438 | | | | 5,438 | | | | — | | | | — | | | | (597 | ) | | | (597 | ) | | | 4,841 | | | | — | | | | — | | | | 4,841 | |
Citigroup Global Markets Inc. | | | — | | | | — | | | | — | | | | — | | | | — | | | | — | | | | (136,171 | ) | | | (136,171 | ) | | | (136,171 | ) | | | — | | | | 136,171 | | | | — | |
Goldman Sachs International | | | — | | | | — | | | | 10,136 | | | | 10,136 | | | | — | | | | — | | | | (315,721 | ) | | | (315,721 | ) | | | (305,585 | ) | | | — | | | | 280,000 | | | | (25,585 | ) |
Macquarie Bank Ltd. | | | — | | | | — | | | | 1,955 | | | | 1,955 | | | | — | | | | — | | | | (29,035 | ) | | | (29,035 | ) | | | (27,080 | ) | | | — | | | | 27,080 | | | | — | |
Morgan Stanley Capital Services LLC | | | — | | | | — | | | | 217,488 | | | | 217,488 | | | | — | | | | — | | | | (544,138 | ) | | | (544,138 | ) | | | (326,650 | ) | | | — | | | | 320,000 | | | | (6,650 | ) |
Subtotal — Subsidiary | | $ | — | | | $ | — | | | $ | 397,415 | | | $ | 397,415 | | | $ | — | | | $ | — | | | $ | (1,199,476 | ) | | $ | (1,199,476 | ) | | $ | (802,061 | ) | | $ | — | | | $ | 763,251 | | | $ | (38,810 | ) |
Total | | $ | 1,917,644 | | | $ | 8,329,084 | | | $ | 6,180,938 | | | $ | 16,427,666 | | | $ | (2,670,414 | ) | | $ | (4,942,918 | ) | | $ | (7,385,561 | ) | | $ | (14,998,893 | ) | | $ | 1,428,773 | | | $ | — | | | $ | (881,656 | ) | | $ | 547,117 | |
| (a) | The Fund and the Subsidiary are recognized as separate legal entities and as such are subject to separate netting arrangements with the Counterparty. |
Effect of Derivative Investments for the year ended October 31, 2017
The table below summarizes the gains (losses) on derivative investments, detailed by primary risk exposure, recognized in earnings during the period:
| | | | | | | | | | | | | | | | | | | | | | | | |
| | | Location of Gain (Loss) on Consolidated Statement of Operations | |
| | | Commodity
Risk | | | Credit
Risk | | | Currency
Risk | | | Equity
Risk | | | Interest Rate
Risk | | | Total | |
Realized Gain (Loss): | | | | | | | | | | | | | | | | | | | | | | | | |
Forward foreign currency contracts | | $ | — | | | $ | — | | | $ | (1,422,634 | ) | | $ | — | | | $ | — | | | $ | (1,422,634 | ) |
Futures contracts | | | — | | | | — | | | | — | | | | 359,323 | | | | (1,678,694 | ) | | | (1,319,371 | ) |
Options purchased(a) | | | — | | | | — | | | | (5,745,238 | ) | | | (8,049,388 | ) | | | (1,022 | ) | | | (13,795,648 | ) |
Options written | | | — | | | | — | | | | 4,690,159 | | | | 1,944,922 | | | | 73,324 | | | | 6,708,405 | |
Swap agreements | | | 242,242 | | | | (844,292 | ) | | | — | | | | 413,842 | | | | 205,995 | | | | 17,787 | |
Change in Net Unrealized Appreciation (Depreciation): | | | | | | | | | | | | | | | | | | | | | | | | |
Forward foreign currency contracts | | | — | | | | — | | | | (2,440,788 | ) | | | — | | | | — | | | | (2,440,788 | ) |
Futures contracts | | | — | | | | — | | | | — | | | | (2,626,139 | ) | | | 783,007 | | | | (1,843,132 | ) |
Options purchased(a) | | | — | | | | — | | | | (1,341,203 | ) | | | (2,148,528 | ) | | | — | | | | (3,489,731 | ) |
Options written | | | — | | | | — | | | | 20,246 | | | | (465,558 | ) | | | — | | | | (445,312 | ) |
Swap agreements | | | (125,532 | ) | | | (239,520 | ) | | | 289,012 | | | | (328,401 | ) | | | 1,788,960 | | | | 1,384,519 | |
Total | | $ | 116,710 | | | $ | (1,083,812 | ) | | $ | (5,950,446 | ) | | $ | (10,899,927 | ) | | $ | 1,171,570 | | | $ | (16,645,905 | ) |
| (a) | Options purchased are included in the net realized gain (loss) from investment securities and the change in net unrealized appreciation (depreciation) of investment securities. |
65 Invesco Global Targeted Returns Fund
The table below summarizes the average notional value of forward foreign currency contracts, futures contracts, options purchased, options written and swap agreements outstanding during the period.
| | | | | | | | | | | | | | | | | | | | | | | | | | | | |
| | | Forward
Foreign Currency
Contracts | | | Futures
Contracts | | | Index
Options
Purchased | | | Index
Options
Written | | | Foreign
Currency
Options | | | Swaptions(a) | | | Swap
Agreements | |
Average notional value | | $ | 302,246,870 | | | $ | 116,314,191 | | | $ | 224,654,420 | | | $ | 46,000,905 | | | $ | 165,986,057 | | | $ | 4,077,667 | | | $ | 633,255,204 | |
Average contracts | | | — | | | | — | | | | 7,834 | | | | 977 | | | | — | | | | — | | | | — | |
| (a) | Summarizes the three month average notional value of swaptions contracts outstanding during the period. |
NOTE 5—Expense Offset Arrangement(s)
The expense offset arrangement is comprised of transfer agency credits which result from balances in demand deposit accounts used by the transfer agent for clearing shareholder transactions. For the year ended October 31, 2017, the Fund received credits from this arrangement, which resulted in the reduction of the Fund’s total expenses of $207.
NOTE 6—Trustees’ and Officers’ Fees and Benefits
Trustees’ and Officers’ Fees and Benefits include amounts accrued by the Fund to pay remuneration to certain Trustees and Officers of the Fund. Trustees have the option to defer compensation payable by the Fund, and Trustees’ and Officers’ Fees and Benefits also include amounts accrued by the Fund to fund such deferred compensation amounts. Those Trustees who defer compensation have the option to select various Invesco Funds in which their deferral accounts shall be deemed to be invested. Obligations under the deferred compensation plan represent unsecured claims against the general assets of the Fund.
NOTE 7—Cash Balances
The Fund is permitted to temporarily carry a negative or overdrawn balance in its account with State Street Bank and Trust Company, the custodian bank. Such balances, if any at period-end, are shown in the Consolidated Statement of Assets and Liabilities under the payable caption Amount due custodian. To compensate the custodian bank for such overdrafts, the overdrawn Fund may either (1) leave funds as a compensating balance in the account so the custodian bank can be compensated by earning the additional interest; or (2) compensate by paying the custodian bank at a rate agreed upon by the custodian bank and Invesco, not to exceed the contractually agreed upon rate.
NOTE 8—Distributions to Shareholders and Tax Components of Net Assets
Tax Character of Distributions to Shareholders Paid During the Fiscal Years Ended October 31, 2017 and 2016:
| | | | | | | | |
| | | 2017 | | | 2016 | |
Ordinary income | | $ | 4,586,711 | | | $ | 2,702,286 | |
Return of capital | | | 102,322 | | | | — | |
Long-term capital gain | | | 4,170,753 | | | | 546,005 | |
Total distributions | | $ | 8,859,786 | | | $ | 3,248,291 | |
Tax Components of Net Assets at Period-End:
| | | | |
| | | 2017 | |
Net unrealized appreciation — investments | | $ | 1,013,115 | |
Net unrealized appreciation (depreciation) — other investments | | | (18,060 | ) |
Temporary book/tax differences | | | (6,772 | ) |
Capital loss carryforward | | | (6,333,130 | ) |
Shares of beneficial interest | | | 153,697,702 | |
Total net assets | | $ | 148,352,855 | |
The difference between book-basis and tax-basis unrealized appreciation (depreciation) is due to differences in the timing of recognition of gains and losses on investments for tax and book purposes. The Fund’s net unrealized appreciation difference is attributable primarily to derivative investments, straddles and wash sales.
The temporary book/tax differences are a result of timing differences between book and tax recognition of income and/or expenses. The Fund’s temporary book/tax differences are the result of the trustee deferral of compensation and retirement plan benefits.
Capital loss carryforward is calculated and reported as of a specific date. Results of transactions and other activity after that date may affect the amount of capital loss carryforward actually available for the Fund to utilize. The ability to utilize capital loss carryforward in the future may be limited under the Internal Revenue Code and related regulations based on the results of future transactions.
The Fund has a capital loss carryforward as of October 31, 2017, as follows:
| | | | | | | | | | | | |
| Capital Loss Carryforward* | |
| Expiration | | Short-Term | | | Long-Term | | | Total | |
Not subject to expiration | | $ | — | | | $ | 6,333,130 | | | $ | 6,333,130 | |
| * | Capital loss carryforward as of the date listed above is reduced for limitations, if any, to the extent required by the Internal Revenue Code and may be further limited depending upon a variety of factors, including the realization of net unrealized gains or losses as of the date of any reorganization. |
66 Invesco Global Targeted Returns Fund
NOTE 9—Investment Transactions
The aggregate amount of investment securities (other than short-term securities, U.S. Treasury obligations and money market funds, if any) purchased and sold by the Fund during the year ended October 31, 2017 was $139,504,774 and $178,210,920, respectively. During the same period, purchases and sales of U.S. Treasury obligations were $4,154,735 and $3,021,067, respectively. Cost of investments, including any derivatives, on a tax basis includes the adjustments for financial reporting purposes as of the most recently completed federal income tax reporting period-end.
| | | | |
| Unrealized Appreciation (Depreciation) of Investments on a Tax Basis | |
Aggregate unrealized appreciation of investments | | $ | 25,860,934 | |
Aggregate unrealized (depreciation) of investments | | | (24,847,819 | ) |
Net unrealized appreciation (depreciation) of investments | | $ | 1,013,115 | |
Cost of investments for tax purposes is $129,250,977.
NOTE 10—Reclassification of Permanent Differences
Primarily as a result of differing book/tax treatment of foreign currency transactions, net operating losses, straddles and income from derivative investments, on October 31, 2017, undistributed net investment income was decreased by $971,993, undistributed net realized gain (loss) was increased by $1,635,541 and shares of beneficial interest was decreased by $663,548. This reclassification had no effect on the net assets of the Fund.
NOTE 11—Share Information
| | | | | | | | | | | | | | | | |
| | | Summary of Share Activity | |
| | | Years ended October 31, | |
| | | 2017(a) | | | 2016 | |
| | | Shares | | | Amount | | | Shares | | | Amount | |
Sold: | | | | | | | | | | | | | | | | |
Class A | | | 432,607 | | | $ | 4,320,006 | | | | 1,819,533 | | | $ | 18,661,287 | |
Class C | | | 170,628 | | | | 1,667,723 | | | | 1,066,269 | | | | 10,770,226 | |
Class R | | | 981 | | | | 9,707 | | | | 606 | | | | 6,231 | |
Class Y | | | 5,299,391 | | | | 52,987,480 | | | | 12,374,104 | | | | 127,479,975 | |
Class R6 | | | 869,493 | | | | 8,703,963 | | | | — | | | | — | |
| | | | |
Issued as reinvestment of dividends: | | | | | | | | | | | | | | | | |
Class A | | | 109,618 | | | | 1,068,780 | | | | 46,420 | | | | 466,060 | |
Class C | | | 60,540 | | | | 582,399 | | | | 17,883 | | | | 177,399 | |
Class R | | | 31 | | | | 300 | | | | — | | | | — | |
Class Y | | | 736,278 | | | | 7,193,440 | | | | 221,333 | | | | 2,226,608 | |
Class R5 | | | 246 | | | | 2,402 | | | | 112 | | | | 1,126 | |
Class R6 | | | — | | | | — | | | | 17,417 | | | | 175,272 | |
| | | | |
Reacquired: | | | | | | | | | | | | | | | | |
Class A | | | (1,444,640 | ) | | | (14,471,961 | ) | | | (1,319,854 | ) | | | (13,577,708 | ) |
Class C | | | (601,188 | ) | | | (5,868,873 | ) | | | (593,471 | ) | | | (6,004,835 | ) |
Class Y | | | (12,178,368 | ) | | | (121,949,467 | ) | | | (5,106,862 | ) | | | (52,525,841 | ) |
Class R5 | | | (5,347 | ) | | | (53,554 | ) | | | — | | | | — | |
Class R6 | | | (11,067 | ) | | | (111,623 | ) | | | (793,730 | ) | | | (8,301,764 | ) |
Net increase (decrease) in share activity | | | (6,560,797 | ) | | $ | (65,919,278 | ) | | | 7,749,760 | | | $ | 79,554,036 | |
| (a) | There are entities that are record owners of more than 5% of the outstanding shares of the Fund and in the aggregate own 59% of the outstanding shares of the Fund. IDI has an agreement with these entities to sell Fund shares. The Fund, Invesco and/or Invesco affiliates may make payments to these entities, which are considered to be related to the Fund, for providing services to the Fund, Invesco and/or Invesco affiliates including but not limited to services such as securities brokerage, distribution, third party record keeping and account servicing. The Fund has no knowledge as to whether all or any portion of the shares owned of record by these entities are also owned beneficially. |
| | In addition, 6% of the outstanding shares of the Fund are owned by the Adviser or an affiliate of the Adviser. |
67 Invesco Global Targeted Returns Fund
NOTE 12—Financial Highlights
The following schedule presents financial highlights for a share of the Fund outstanding throughout the periods indicated.
| | | | | | | | | | | | | | | | | | | | | | | | | | | | | | | | | | | | | | | | | | | | | | | | | | | | | | | | | | | | |
| | | Net asset
value,
beginning
of period | | | Net
investment
income
(loss)(a) | | | Net gains
on securities
(both
realized and
unrealized) | | | Total from
investment
operations | | | Dividends
from net
investment
income | | | Return of capital | | | Distributions
from net
realized
gains | | | Total
distributions | | | Net asset
value, end
of period | | | Total
return(b) | | | Net assets,
end of period
(000’s omitted) | | | Ratio of
expenses
to average
net assets
with fee waivers
and/or expenses
absorbed | | | Ratio of
expenses
to average net
assets without
fee waivers
and/or expenses
absorbed | | | Ratio of net
investment
income (loss)
to average
net assets | | | Portfolio
turnover(d) | |
Class A | | | | | | | | | | | | | | | | | | | | | | | | | | | | | | | | | | | | | | | | | | | | | | | | | | | | | | | | | | | | |
Year ended 10/31/17 | | $ | 10.32 | | | $ | 0.12 | | | $ | 0.00 | | | $ | 0.12 | | | $ | (0.12 | ) | | $ | (0.01 | ) | | $ | (0.31 | ) | | $ | (0.44 | ) | | $ | 10.00 | | | | 1.32 | % | | $ | 19,360 | | | | 1.29 | %(f) | | | 2.16 | %(f) | | | 1.24 | %(f) | | | 121 | % |
Year ended 10/31/16 | | | 10.33 | | | | 0.05 | | | | 0.14 | | | | 0.19 | | | | (0.06 | ) | | | — | | | | (0.14 | ) | | | (0.20 | ) | | | 10.32 | | | | 1.90 | | | | 29,309 | | | | 1.31 | (c) | | | 2.35 | | | | 0.51 | | | | 23 | |
Year ended 10/31/15 | | | 10.44 | | | | 0.01 | | | | 0.04 | | | | 0.05 | | | | (0.06 | ) | | | — | | | | (0.10 | ) | | | (0.16 | ) | | | 10.33 | | | | 0.49 | | | | 23,688 | | | | 1.33 | (c) | | | 2.38 | | | | 0.05 | | | | 79 | |
Year ended 10/31/14(e) | | | 10.00 | | | | (0.02 | ) | | | 0.46 | | | | 0.44 | | | | — | | | | — | | | | — | | | | — | | | | 10.44 | | | | 4.40 | | | | 13,504 | | | | 1.29 | (c)(g) | | | 3.16 | (g) | | | (0.18 | )(g) | | | 20 | |
Class C | | | | | | | | | | | | | | | | | | | | | | | | | | | | | | | | | | | | | | | | | | | | | | | | | | | | | | | | | | | | |
Year ended 10/31/17 | | | 10.13 | | | | 0.05 | | | | (0.01 | ) | | | 0.04 | | | | (0.06 | ) | | | (0.00 | ) | | | (0.31 | ) | | | (0.37 | ) | | | 9.80 | | | | 0.52 | | | | 12,263 | | | | 2.04 | (f) | | | 2.91 | (f) | | | 0.49 | (f) | | | 121 | |
Year ended 10/31/16 | | | 10.19 | | | | (0.02 | ) | | | 0.14 | | | | 0.12 | | | | (0.04 | ) | | | — | | | | (0.14 | ) | | | (0.18 | ) | | | 10.13 | | | | 1.17 | | | | 16,428 | | | | 2.06 | (c) | | | 3.10 | | | | (0.24 | ) | | | 23 | |
Year ended 10/31/15 | | | 10.37 | | | | (0.07 | ) | | | 0.04 | | | | (0.03 | ) | | | (0.05 | ) | | | — | | | | (0.10 | ) | | | (0.15 | ) | | | 10.19 | | | | (0.27 | ) | | | 11,524 | | | | 2.08 | (c) | | | 3.13 | | | | (0.70 | ) | | | 79 | |
Year ended 10/31/14(e) | | | 10.00 | | | | (0.08 | ) | | | 0.45 | | | | 0.37 | | | | — | | | | — | | | | — | | | | — | | | | 10.37 | | | | 3.70 | | | | 444 | | | | 2.04 | (c)(g) | | | 3.91 | (g) | | | (0.93 | )(g) | | | 20 | |
Class R | | | | | | | | | | | | | | | | | | | | | | | | | | | | | | | | | | | | | | | | | | | | | | | | | | | | | | | | | | | | |
Year ended 10/31/17 | | | 10.27 | | | | 0.10 | | | | (0.01 | ) | | | 0.09 | | | | (0.10 | ) | | | (0.01 | ) | | | (0.31 | ) | | | (0.42 | ) | | | 9.94 | | | | 0.99 | | | | 26 | | | | 1.54 | (f) | | | 2.41 | (f) | | | 0.99 | (f) | | | 121 | |
Year ended 10/31/16 | | | 10.29 | | | | 0.03 | | | | 0.14 | | | | 0.17 | | | | (0.05 | ) | | | — | | | | (0.14 | ) | | | (0.19 | ) | | | 10.27 | | | | 1.65 | | | | 17 | | | | 1.56 | (c) | | | 2.60 | | | | 0.26 | | | | 23 | |
Year ended 10/31/15 | | | 10.42 | | | | (0.02 | ) | | | 0.04 | | | | 0.02 | | | | (0.05 | ) | | | — | | | | (0.10 | ) | | | (0.15 | ) | | | 10.29 | | | | 0.27 | | | | 10 | | | | 1.58 | (c) | | | 2.63 | | | | (0.20 | ) | | | 79 | |
Year ended 10/31/14(e) | | | 10.00 | | | | (0.04 | ) | | | 0.46 | | | | 0.42 | | | | — | | | | — | | | | — | | | | — | | | | 10.42 | | | | 4.20 | | | | 10 | | | | 1.54 | (c)(g) | | | 3.41 | (g) | | | (0.43 | )(g) | | | 20 | |
Class Y | | | | | | | | | | | | | | | | | | | | | | | | | | | | | | | | | | | | | | | | | | | | | | | | | | | | | | | | | | | | |
Year ended 10/31/17 | | | 10.37 | | | | 0.15 | | | | (0.01 | ) | | | 0.14 | | | | (0.15 | ) | | | (0.01 | ) | | | (0.31 | ) | | | (0.47 | ) | | | 10.04 | | | | 1.48 | | | | 108,068 | | | | 1.04 | (f) | | | 1.91 | (f) | | | 1.49 | (f) | | | 121 | |
Year ended 10/31/16 | | | 10.37 | | | | 0.08 | | | | 0.15 | | | | 0.23 | | | | (0.09 | ) | | | — | | | | (0.14 | ) | | | (0.23 | ) | | | 10.37 | | | | 2.24 | | | | 175,284 | | | | 1.06 | (c) | | | 2.10 | | | | 0.76 | | | | 23 | |
Year ended 10/31/15 | | | 10.46 | | | | 0.03 | | | | 0.04 | | | | 0.07 | | | | (0.06 | ) | | | — | | | | (0.10 | ) | | | (0.16 | ) | | | 10.37 | | | | 0.72 | | | | 97,703 | | | | 1.08 | (c) | | | 2.13 | | | | 0.30 | | | | 79 | |
Year ended 10/31/14(e) | | | 10.00 | | | | 0.01 | | | | 0.45 | | | | 0.46 | | | | — | | | | — | | | | — | | | | — | | | | 10.46 | | | | 4.60 | | | | 16,352 | | | | 1.04 | (c)(g) | | | 2.91 | (g) | | | 0.07 | (g) | | | 20 | |
Class R5 | | | | | | | | | | | | | | | | | | | | | | | | | | | | | | | | | | | | | | | | | | | | | | | | | | | | | | | | | | | | |
Year ended 10/31/17 | | | 10.37 | | | | 0.15 | | | | 0.00 | | | | 0.15 | | | | (0.15 | ) | | | (0.01 | ) | | | (0.31 | ) | | | (0.47 | ) | | | 10.05 | | | | 1.58 | | | | 10 | | | | 1.04 | (f) | | | 1.87 | (f) | | | 1.49 | (f) | | | 121 | |
Year ended 10/31/16 | | | 10.38 | | | | 0.08 | | | | 0.14 | | | | 0.22 | | | | (0.09 | ) | | | — | | | | (0.14 | ) | | | (0.23 | ) | | | 10.37 | | | | 2.15 | | | | 63 | | | | 1.06 | (c) | | | 2.09 | | | | 0.76 | | | | 23 | |
Year ended 10/31/15 | | | 10.46 | | | | 0.03 | | | | 0.05 | | | | 0.08 | | | | (0.06 | ) | | | — | | | | (0.10 | ) | | | (0.16 | ) | | | 10.38 | | | | 0.82 | | | | 62 | | | | 1.08 | (c) | | | 2.07 | | | | 0.30 | | | | 79 | |
Year ended 10/31/14(e) | | | 10.00 | | | | 0.01 | | | | 0.45 | | | | 0.46 | | | | — | | | | — | | | | — | | | | — | | | | 10.46 | | | | 4.60 | | | | 2,724 | | | | 1.04 | (c)(g) | | | 2.87 | (g) | | | 0.07 | (g) | | | 20 | |
Class R6 | | | | | | | | | | | | | | | | | | | | | | | | | | | | | | | | | | | | | | | | | | | | | | | | | | | | | | | | | | | | |
Year ended 10/31/17 | | | 10.36 | | | | 0.15 | | | | 0.00 | | | | 0.15 | | | | (0.15 | ) | | | (0.01 | ) | | | (0.31 | ) | | | (0.47 | ) | | | 10.04 | | | | 1.59 | | | | 8,626 | | | | 1.04 | (f) | | | 1.81 | (f) | | | 1.49 | (f) | | | 121 | |
Year ended 10/31/16 | | | 10.37 | | | | 0.08 | | | | 0.14 | | | | 0.22 | | | | (0.09 | ) | | | — | | | | (0.14 | ) | | | (0.23 | ) | | | 10.36 | | | | 2.14 | | | | 10 | | | | 1.06 | (c) | | | 2.00 | | | | 0.76 | | | | 23 | |
Year ended 10/31/15 | | | 10.46 | | | | 0.03 | | | | 0.04 | | | | 0.07 | | | | (0.06 | ) | | | — | | | | (0.10 | ) | | | (0.16 | ) | | | 10.37 | | | | 0.73 | | | | 8,063 | | | | 1.08 | (c) | | | 2.07 | | | | 0.30 | | | | 79 | |
Year ended 10/31/14(e) | | | 10.00 | | | | 0.01 | | | | 0.45 | | | | 0.46 | | | | — | | | | — | | | | — | | | | — | | | | 10.46 | | | | 4.60 | | | | 9,298 | | | | 1.04 | (c)(g) | | | 2.87 | (g) | | | 0.07 | (g) | | | 20 | |
| (a) | Calculated using average shares outstanding. |
| (b) | Includes adjustments in accordance with accounting principles generally accepted in the United States of America and as such, the net asset value for financial reporting purposes and the returns based upon those net asset values may differ from the net asset value and returns for shareholder transactions. Does not include sales charges and is not annualized for periods less than one year, if applicable. |
| (c) | In addition to the fees and expenses which the Fund bears directly; the Fund indirectly bears a pro rata share of the fees and expenses of the underlying funds in which the Fund invests. Because the underlying funds have varied expenses and fee levels and the Fund may own different proportions at different times, the amount of fees and expenses incurred indirectly by the Fund will vary. Estimated underlying fund expenses are not expenses that are incurred directly by your Fund. They are expenses that are incurred directly by the underlying funds and are deducted from the value of the funds your Fund invests in. The effect of the estimated underlying fund expenses that you bear indirectly is included in your Fund’s total return. Estimated acquired fund fees from underlying funds were 0.44%, 0.44% and 0.50% for the years ended October 31, 2016 and 2015 and the period ended October 31, 2014. |
| (d) | Portfolio turnover is calculated at the fund level and is not annualized for periods less than one year, if applicable. |
| (e) | Commencement date of December 19, 2013. |
| (f) | Ratios are based on average daily net assets (000’s omitted) of 22,424, $13,953, $22, $139,042, $58 and $4,328 for Class A, Class C, Class R, Class Y, Class R5 and Class R6 shares, respectively. |
68 Invesco Global Targeted Returns Fund
Report of Independent Registered Public Accounting Firm
To the Board of Trustees of AIM Investment Funds (Invesco Investment Funds) and Shareholders of Invesco Global Targeted Returns Fund:
In our opinion, the accompanying consolidated statement of assets and liabilities, including the consolidated schedule of investments, and the related consolidated statements of operations and of changes in net assets and the financial highlights present fairly, in all material respects, the consolidated financial position of Invesco Global Targeted Returns Fund and its subsidiary (one of the portfolios constituting the AIM Investment Funds (Invesco Investment Fund), hereafter referred to as the “Fund”) as of October 31, 2017, the results of their operations for the year then ended, the changes in their net assets for each of the two years in the period then ended and the financial highlights for each of the three years in the period then ended and for the period December 19, 2013 (commencement of investment operations) through October 31, 2014, in conformity with accounting principles generally accepted in the United States of America. These consolidated financial statements and financial highlights (hereafter referred to as “financial statements”) are the responsibility of the Fund’s management. Our responsibility is to express an opinion on these financial statements based on our audits. We conducted our audits of these financial statements in accordance with the standards of the Public Company Accounting Oversight Board (United States). Those standards require that we plan and perform the audit to obtain reasonable assurance about whether the financial statements are free of material misstatement. An audit includes examining, on a test basis, evidence supporting the amounts and disclosures in the financial statements, assessing the accounting principles used and significant estimates made by management, and evaluating the overall financial statement presentation. We believe that our audits, which included confirmation of securities as of October 31, 2017 by correspondence with the custodian, transfer agent and brokers, and when replies were not received from brokers, we performed other auditing procedures, provide a reasonable basis for our opinion.
PricewaterhouseCoopers LLP
Houston, Texas
December 21, 2017
69 Invesco Global Targeted Returns Fund
Calculating your ongoing Fund expenses
Example
As a shareholder of the Fund, you incur two types of costs: (1) transaction costs, which may include sales charges (loads) on purchase payments or contingent deferred sales charges on redemptions, if any; and (2) ongoing costs, including management fees, distribution and/or service (12b-1) fees, and other Fund expenses. This example is intended to help you understand your ongoing costs (in dollars) of investing in the Fund and to compare these costs with ongoing costs of investing in other mutual funds. The example is based on an investment of $1,000 invested at the beginning of the period and held for the entire period May 1, 2017 through October 31, 2017.
Actual expenses
The table below provides information about actual account values and actual expenses. You may use the information in this table, together with the amount you invested, to estimate the expenses that you paid over the period. Simply divide your account value by $1,000 (for example, an $8,600 account value divided by $1,000 = 8.6), then multiply the result by the number in the table under the heading entitled “Actual Expenses Paid During Period” to estimate the expenses you paid on your account during this period.
Hypothetical example for comparison purposes
The table below also provides information about hypothetical account values and hypothetical expenses based on the Fund’s actual expense ratio and an assumed rate of return of 5% per year before expenses, which is not the Fund’s actual return.
The hypothetical account values and expenses may not be used to estimate the actual ending account balance or expenses you paid for the period. You may use this information to compare the ongoing costs of investing in the Fund and other funds. To do so, compare this 5% hypothetical example with the 5% hypothetical examples that appear in the shareholder reports of the other funds.
Please note that the expenses shown in the table are meant to highlight your ongoing costs only and do not reflect any transaction costs, such as sales charges (loads) on purchase payments or contingent deferred sales charges on redemptions, if any. Therefore, the hypothetical information is useful in comparing ongoing costs only, and will not help you determine the relative total costs of owning different funds. In addition, if these transaction costs were included, your costs would have been higher.
| | | | | | | | | | | | | | | | | | | | | | | | |
| Class | | Beginning
Account Value
(05/01/17) | | | ACTUAL | | | HYPOTHETICAL (5% annual return before expenses) | | | Annualized
Expense
Ratio | |
| | | Ending
Account Value
(10/31/17)1 | | | Expenses
Paid During
Period2 | | | Ending
Account Value
(10/31/17) | | | Expenses
Paid During
Period 2 | | |
A | | $ | 1,000.00 | | | $ | 1,002.00 | | | $ | 7.06 | | | $ | 1,018.15 | | | $ | 7.12 | | | | 1.40 | % |
C | | | 1,000.00 | | | | 996.90 | | | | 10.82 | | | | 1,014.37 | | | | 10.92 | | | | 2.15 | |
R | | | 1,000.00 | | | | 1,000.00 | | | | 8.32 | | | | 1,016.89 | | | | 8.39 | | | | 1.65 | |
Y | | | 1,000.00 | | | | 1,003.00 | | | | 5.81 | | | | 1,019.41 | | | | 5.85 | | | | 1.15 | |
R5 | | | 1,000.00 | | | | 1,003.00 | | | | 5.81 | | | | 1,019.41 | | | | 5.85 | | | | 1.15 | |
R6 | | | 1,000.00 | | | | 1,003.00 | | | | 5.81 | | | | 1,019.41 | | | | 5.85 | | | | 1.15 | |
| 1 | The actual ending account value is based on the actual total return of the Fund for the period May 1, 2017 through October 31, 2017, after actual expenses and will differ from the hypothetical ending account value which is based on the Fund’s expense ratio and a hypothetical annual return of 5% before expenses. |
| 2 | Expenses are equal to the Fund’s annualized expense ratio as indicated above multiplied by the average account value over the period, multiplied by 184/365 to reflect the most recent fiscal half year. |
70 Invesco Global Targeted Returns Fund
Approval of Investment Advisory and Sub-Advisory Contracts
The Board of Trustees (the Board) of AIM Investment Funds (Invesco Investment Funds) is required under the Investment Company Act of 1940, as amended, to approve annually the renewal of Invesco Global Targeted Returns Fund’s (the Fund) investment advisory agreements. During contract renewal meetings held on June 12-13, 2017, the Board as a whole, and the disinterested or “independent” Trustees, who comprise over 75% of the Board, voting separately, approved the continuance for the Fund of the Master Investment Advisory Agreement with Invesco Advisers, Inc. (Invesco Advisers and the investment advisory agreement) and the Master Intergroup Sub-Advisory Contract for Mutual Funds with Invesco Asset Management Deutschland GmbH, Invesco Asset Management Limited, Invesco Asset Management (Japan) Limited, Invesco Hong Kong Limited, Invesco Senior Secured Management, Inc. and Invesco Canada Ltd. and separate Sub-Advisory Contracts with Invesco PowerShares Capital Management LLC and Invesco Asset Management (India) Private Limited (collectively, the Affiliated Sub-Advisers and the sub-advisory contracts) for another year, effective July 1, 2017.
In evaluating the fairness and reasonableness of compensation under the Fund’s investment advisory agreement and sub-advisory contracts, the Board considered, among other things, the factors discussed below. The Board determined that continuation of the Fund’s investment advisory agreement and the sub-advisory contracts is in the best interest of the Fund and its shareholders and that the compensation payable to Invesco Advisers and the Affiliated Sub-Advisers under the agreements is fair and reasonable.
The Board’s Fund Evaluation Process
The Board’s Investments Committee has established three Sub-Committees, which meet throughout the year to review the performance of funds advised by Invesco Advisers (the Invesco Funds). Over the course of each year, the Sub-Committees meet with portfolio managers for their assigned Invesco Funds and other members of management to review the performance, investment objective(s), policies, strategies, limitations and investment risks of these funds. The Board had the benefit of reports from the Sub-Committees and Investments Committee throughout the year in considering approval of the continuance of each Invesco Fund’s investment advisory agreement and sub-advisory contracts for another year.
During the contract renewal process, the Board receives comparative performance and fee data regarding the Invesco Funds prepared by Invesco Advisers and Broadridge Financial Solutions, Inc. (Broadridge), an independent provider of investment company data. The Board also receives an independent written
evaluation from the Senior Officer, an officer of the Invesco Funds who reports directly to the independent Trustees. The Senior Officer’s evaluation is prepared as part of his responsibility to manage the process by which the Invesco Funds’ proposed management fees are negotiated during the annual contract renewal process to ensure they are negotiated in a manner that is at arms’ length and reasonable. In addition to meetings with Invesco Advisers and fund counsel, the independent Trustees also discuss the continuance of the investment advisory agreement and sub-advisory contracts in separate sessions with the Senior Officer and with independent legal counsel.
The Trustees recognized that the advisory fee rates for the Invesco Funds are, in most cases, the result of years of review and negotiation. The Trustees’ deliberations and conclusions in a particular year may be based in part on their deliberations and conclusions regarding these arrangements throughout the year and in prior years. The Trustees’ review and conclusions are based on the comprehensive consideration of all information presented to them and are not the result of any single determinative factor. Moreover, one Trustee may have weighed a particular piece of information or factor differently than another Trustee.
The discussion below is a summary of the Senior Officer’s independent written evaluation with respect to the Fund’s investment advisory agreement as well as a discussion of the material factors and related conclusions that formed the basis for the Board’s approval of the Fund’s investment advisory agreement and sub-advisory contracts. This information is current as of June 13, 2017, and does not reflect consideration of factors that became known to the Board after that date.
Factors and Conclusions and Summary of Independent Written Fee Evaluation
| A. | Nature, Extent and Quality of Services Provided by Invesco Advisers and the Affiliated Sub-Advisers |
The Board reviewed the advisory services provided to the Fund by Invesco Advisers under the Fund’s investment advisory agreement, the performance of Invesco Advisers in providing these services, and the credentials and experience of the officers and employees of Invesco Advisers who provide these services, including the Fund’s portfolio manager or managers. The Board’s review included consideration of Invesco Advisers’ investment process oversight, credit analysis and investment risk management. The Board also considered non-advisory services that Invesco Advisers and its affiliates provide to the Invesco Funds such as various back office support functions, trading operations, internal audit, valuation and legal and compliance.
In determining whether to continue the Fund’s investment advisory agreement, the Board considered the benefits of reapproving an existing relationship as contrasted with the greater uncertainty that may be associated with entering into a new relationship. The Board concluded that the nature, extent and quality of the services provided to the Fund by Invesco Advisers are appropriate and satisfactory.
The Board reviewed the services that may be provided by the Affiliated Sub-Advisers under the sub-advisory contracts and the credentials and experience of the officers and employees of the Affiliated Sub-Advisers who provide these services. The Board noted that the Affiliated Sub-Advisers have offices and personnel that are located in financial centers around the world. As a result, the Board noted that the Affiliated Sub-Advisers can provide research and investment analysis on the markets and economies of various countries in which the Fund may invest, make recommendations regarding securities and assist with security trades. The Board concluded that the sub-advisory contracts may benefit the Fund and its shareholders by permitting Invesco Advisers to use the resources and talents of the Affiliated Sub-Advisers in managing the Fund. The Board concluded that the nature, extent and quality of the services that may be provided by the Affiliated Sub-Advisers are appropriate and satisfactory.
| B. | Fund Investment Performance |
The Board considered Fund investment performance as a relevant factor in considering whether to approve the investment advisory agreement as well as the sub-advisory contracts for the Fund, as Invesco Asset Management Limited currently manages assets of the Fund.
The Board noted that the Fund was new and compared the Fund’s performance during the past one and three calendar years to the performance of funds in the Broadridge performance universe and against the Lipper Absolute Return Funds Index. The Board noted that performance of Class A shares of the Fund was in the fourth quintile of its performance universe for the one year period and the second quintile for the three year period (the first quintile being the best performing funds and the fifth quintile being the worst performing funds). The Board noted that performance of Class A shares of the Fund was below the performance of the Index for the one year period and above the performance of the Index for the three year period. The Trustees also reviewed more recent Fund performance and this review did not change their conclusions.
| C. | Advisory and Sub-Advisory Fees |
The Board compared the Fund’s contractual management fee rate to the contractual management fee rates of funds in the Fund’s Broadridge expense group at a common asset level. The Board noted that the contractual
71 Invesco Global Targeted Returns Fund
management fee rate for Class A shares of the Fund was above the median contractual management fee rate of funds in its expense group. The Board noted that the term “contractual management fee” for funds in the expense group may include both advisory and certain administrative services fees, but that Broadridge does not provide information on a fund by fund basis as to what is included. The Board noted that Invesco Advisers does not separately charge the Invesco Funds for the administrative services included in the term as defined by Broadridge. The Board also reviewed the methodology used by Broadridge in providing expense group information, which includes using each fund’s contractual management fee schedule (including any applicable breakpoints) as reported in the most recent prospectus or statement of additional information for each fund in the expense group.
The Board noted that Invesco Advisers has contractually agreed to waive fees and/or limit expenses of the Fund through at least February 28, 2018 in an amount necessary to limit total annual operating expenses to a specified percentage of average daily net assets for each class of the Fund.
The Board also compared the Fund’s effective advisory fee rate (the advisory fee rate after advisory fee waivers and before other expense limitations/waivers) to the effective advisory fee rates of other funds advised by Invesco Advisers and its affiliates with investment strategies comparable to those of the Fund, based on asset balances as of December 31, 2016. The Board noted how the Fund’s rate compared to the rates of off-shore funds with investment strategies comparable to those of the Fund.
The Board also considered the fees charged by Invesco Advisers and the Affiliated Sub-Advisers to other client accounts with investment strategies comparable to those of the Fund. The Board noted that Invesco Advisers or the Affiliated Sub-Advisers may charge lower fees to large institutional clients. Invesco Advisers reviewed with the Board the significantly greater scope of services it provides to the Invesco Funds relative to certain other types of client accounts. These additional services include provision of administrative services, officers and office space, oversight of service providers, preparation of annual registration statement updates and financial information and regulatory compliance under the Investment Company Act of 1940, as amended.
Invesco Advisers also reviewed generally the higher frequency of shareholder purchases and redemptions in the Invesco Funds relative to the flow of assets for other client accounts. Invesco Advisers advised the Board that advance notice of redemptions is often provided to Invesco Advisers by institutional clients. The Board did note that sub-advisory fee rates charged by the Affiliated Sub-Advisers to manage the Invesco Funds and to manage other client accounts tended to be more comparable, reflecting a similar scope of services.
The Board also considered the services that may be provided by the Affiliated Sub-Advisers pursuant to the sub-advisory contracts, as well as the fees payable by Invesco Advisers to the Affiliated Sub-Advisers pursuant to the sub-advisory contracts. The Board noted that Invesco Advisers retains overall responsibility for, and provides services to, sub-advised Invesco Funds, including oversight of the Affiliated Sub-Advisers as well as the additional services described herein other than day-to-day portfolio management. The Board also noted that the sub-advisory fees are not paid directly by the Fund, but rather, are payable by Invesco Advisers to the Affiliated Sub-Advisers.
| D. | Economies of Scale and Breakpoints |
The Board considered the extent to which there are economies of scale in the provision of advisory services to the Fund. The Board also considered that the Fund may benefit from economies of scale through contractual breakpoints in the Fund’s advisory fee schedule. The Board noted that the Fund shares directly in economies of scale through lower fees charged by third party service providers based on the combined size of the Invesco Funds advised by Invesco Advisers.
| E. | Profitability and Financial Resources |
The Board reviewed information from Invesco Advisers concerning the costs of the advisory and other services that Invesco Advisers and its affiliates provide to the Fund and the Invesco Funds and the profitability of Invesco Advisers and its affiliates in providing these services. The Board noted that Invesco Advisers continues to operate at a net profit from services Invesco Advisers and its affiliates provide to the Invesco Funds and the Fund. The Board did not deem the level of profits realized by Invesco Advisers and its affiliates from providing services to the Fund to be excessive given the nature, quality and extent of the services provided. The Board received and accepted information from Invesco Advisers demonstrating that Invesco Advisers and each Affiliated Sub-Adviser are financially sound and have the resources necessary to perform their obligations under the investment advisory agreement and sub-advisory contracts.
| F. | Collateral Benefits to Invesco Advisers and its Affiliates |
The Board considered various other benefits received by Invesco Advisers and its affiliates from the relationship with the Fund, including the fees received for providing transfer agency and distribution services to the Fund. The Board considered comparative information regarding fees charged for these services, including information provided by Broadridge and other independent sources. The Board considered the performance of Invesco Advisers and its affiliates in providing these services and the organizational structure employed to provide these services. The Board also considered that these services are provided to the Fund pursuant to written contracts that are reviewed and approved on an annual basis by the Board; and that the services are required for the operation of the Fund.
The Board considered the benefits realized by Invesco Advisers and the Affiliated Sub-Advisers as a result of portfolio brokerage transactions executed through “soft dollar” arrangements. Invesco Advisers noted that the Fund does not execute brokerage transactions through “soft dollar” arrangements to any significant degree.
The Board considered that the Fund’s uninvested cash and cash collateral from any securities lending arrangements may be invested in money market funds advised by Invesco Advisers pursuant to procedures approved by the Board. The Board noted that Invesco Advisers receives advisory fees from these affiliated money market funds attributable to such investments, although Invesco Advisers has contractually agreed to waive through varying periods the advisory fees payable by the Invesco Funds with respect to certain investments in the affiliated money market funds. The waiver is in an amount equal to 100% of the net advisory fee Invesco Advisers receives from the affiliated money market funds with respect to the Fund’s investment in the affiliated money market funds of uninvested cash, but not cash collateral. The Board concluded that the amount of advisory fees received by Invesco Advisers from the Fund’s investment of cash collateral from any securities lending arrangements in the affiliated money market funds is fair and reasonable.
72 Invesco Global Targeted Returns Fund
Tax Information
Form 1099-DIV, Form 1042-S and other year–end tax information provide shareholders with actual calendar year amounts that should be included in their tax returns. Shareholders should consult their tax advisors.
The following distribution information is being provided as required by the Internal Revenue Code or to meet a specific state’s requirement.
The Fund designates the following amounts or, if subsequently determined to be different, the maximum amount allowable for its fiscal year ended October 31, 2017:
| | | | |
Federal and State Income Tax | |
Long-Term Capital Gain Distributions | | $ | 4,170,753 | |
Qualified Dividend Income* | | | 19.66 | % |
Corporate Dividends Received Deduction* | | | 1.57 | % |
U.S. Treasury Obligations* | | | 0.21 | % |
| | * | The above percentages are based on ordinary income dividends paid to shareholders during the Fund’s fiscal year. |
| | | | |
Non-Resident Alien Shareholders | |
Qualified Short-Term Gains | | $ | 1,747,491 | |
73 Invesco Global Targeted Returns Fund
Trustees and Officers
The address of each trustee and officer is AIM Investment Funds (Invesco Investment Funds) (the “Trust”), 11 Greenway Plaza, Suite 1000, Houston, Texas 77046-1173. The trustees serve for the life of the Trust, subject to their earlier death, incapacitation, resignation, retirement or removal as more specifically provided in the Trust’s organizational documents. Each officer serves for a one year term or until their successors are elected and qualified. Column two below includes length of time served with predecessor entities, if any.
| | | | | | | | |
Name, Year of Birth and Position(s) Held with the Trust | | Trustee and/
or Officer Since | | Principal Occupation(s)
During Past 5 Years | | Number of
Funds in Fund
Complex
Overseen by
Trustee | | Other Directorship(s)
Held by Trustee During Past 5 Years |
| Interested Persons | | | | | | | | |
| Martin L. Flanagan1 — 1960 Trustee | | 2007 | | Executive Director, Chief Executive Officer and President, Invesco Ltd. (ultimate parent of Invesco and a global investment management firm); Trustee, The Invesco Funds; Vice Chair, Investment Company Institute; and Member of Executive Board, SMU Cox School of Business Formerly: Advisor to the Board, Invesco Advisers, Inc. (formerly known as Invesco Institutional (N.A.), Inc.); Chairman and Chief Executive Officer, Invesco Advisers, Inc. (registered investment adviser); Director, Chairman, Chief Executive Officer and President, Invesco Holding Company (US), Inc. (formerly IVZ Inc.) (holding company), Invesco Group Services, Inc. (service provider) and Invesco North American Holdings, Inc. (holding company); Director, Chief Executive Officer and President, Invesco Holding Company Limited (parent of Invesco and a global investment management firm); Director, Invesco Ltd.; Chairman, Investment Company Institute and President, Co-Chief Executive Officer, Co-President, Chief Operating Officer and Chief Financial Officer, Franklin Resources, Inc. (global investment management organization) | | 158 | | None |
Philip A. Taylor2 — 1954 Trustee and Senior Vice President | | 2006 | | Head of the Americas and Senior Managing Director, Invesco Ltd.; Director, Invesco Advisers, Inc. (formerly known as Invesco Institutional (N.A.), Inc.) (registered investment adviser); Director, Chairman, Chief Executive Officer and President, Invesco Management Group, Inc. (formerly known as Invesco Aim Management Group, Inc.) (financial services holding company); Director and Chairman, Invesco Investment Services, Inc. (formerly known as Invesco Aim Investment Services, Inc.) (registered transfer agent); Chief Executive Officer, Invesco Corporate Class Inc. (corporate mutual fund company); Director, Chairman and Chief Executive Officer, Invesco Canada Ltd. (formerly known as Invesco Trimark Ltd./Invesco Trimark Ltèe) (registered investment adviser and registered transfer agent); Trustee and Senior Vice President, The Invesco Funds; Director, Invesco Investment Advisers LLC (formerly known as Van Kampen Asset Management). Formerly: Co-Chairman, Co-President and Co-Chief Executive Officer, Invesco Advisers, Inc. (formerly known as Invesco Institutional (N.A.), Inc.) (registered investment adviser); Director, Chief Executive Officer and President, Van Kampen Exchange Corp; President and Principal Executive Officer, The Invesco Funds (other than AIM Treasurer’s Series Trust (Invesco Treasurer’s Series Trust), Short-Term Investments Trust and Invesco Management Trust); Executive Vice President, The Invesco Funds (AIM Treasurer’s Series Trust (Invesco Treasurer’s Series Trust), Short-Term Investments Trust and Invesco Management Trust only); Director and President, INVESCO Funds Group, Inc. (registered investment adviser and registered transfer agent); Director and Chairman, IVZ Distributors, Inc. (formerly known as INVESCO Distributors, Inc.) (registered broker dealer); Director, President and Chairman, Invesco Inc. (holding company), Invesco Canada Holdings Inc. (holding company), Trimark Investments Ltd./Placements Trimark Ltèe and Invesco Financial Services Ltd/Services Financiers Invesco Ltèe; Chief Executive Officer, Invesco Canada Fund Inc. (corporate mutual fund company); Director and Chairman, Van Kampen Investor Services Inc.; Director, Chief Executive Officer and President, 1371 Preferred Inc. (holding company) and Van Kampen Investments Inc.; Director and President, AIM GP Canada Inc. (general partner for limited partnerships) and Van Kampen Advisors, Inc.; Director and Chief Executive Officer, Invesco Trimark Dealer Inc. (registered broker dealer); Director, Invesco Distributors, Inc. (formerly known as Invesco Aim Distributors, Inc.) (registered broker dealer); Manager, Invesco PowerShares Capital Management LLC; Director, Chief Executive Officer and President, Invesco Advisers, Inc.; Director, Chairman, Chief Executive Officer and President, Invesco Aim Capital Management, Inc.; President, Invesco Trimark Dealer Inc. and Invesco Trimark Ltd./Invesco Trimark Ltèe; Director and President, AIM Trimark Corporate Class Inc. and AIM Trimark Canada Fund Inc.; Senior Managing Director, Invesco Holding Company Limited; Director and Chairman, Fund Management Company (former registered broker dealer); President and Principal Executive Officer, The Invesco Funds (AIM Treasurer’s Series Trust (Invesco Treasurer’s Series Trust), and Short-Term Investments Trust only); President, AIM Trimark Global Fund Inc. and AIM Trimark Canada Fund Inc. | | 158 | | None |
| 1 | Mr. Flanagan is considered an interested person (within the meaning of Section 2(a)(19) of the 1940 Act) of the Trust because he is an officer of the Adviser to the Trust, and an officer and a director of Invesco Ltd., ultimate parent of the Adviser. |
| 2 | Mr. Taylor is considered an interested person (within the meaning of Section 2(a)(19) of the 1940 Act) of the Trust because he is an officer and a director of the Adviser. |
T-1 Invesco Global Targeted Returns Fund
Trustees and Officers—(continued)
| | | | | | | | |
Name, Year of Birth and Position(s) Held with the Trust | | Trustee and/
or Officer Since | | Principal Occupation(s) During Past 5 Years | | Number of
Funds in Fund
Complex
Overseen by
Trustee | | Other Directorship(s)
Held by Trustee During Past 5 Years |
| Independent Trustees | | | | | | | | |
Bruce L. Crockett — 1944 Trustee and Chair | | 2001 | | Chairman, Crockett Technologies Associates (technology consulting company) Formerly: Director, Captaris (unified messaging provider); Director, President and Chief Executive Officer, COMSAT Corporation; Chairman, Board of Governors of INTELSAT (international communications company); ACE Limited (insurance company); Independent Directors Council and Investment Company Institute: Member of the Audit Committee, Investment Company Institute; Member of the Executive Committee and Chair of the Governance Committee, Independent Directors Council | | 158 | | Director and Chairman of the Audit Committee, ALPS (Attorneys Liability Protection Society) (insurance company); Director and Member of the Audit Committee, Ferroglobe PLC (metallurgical company) |
David C. Arch — 1945 Trustee | | 2010 | | Chairman of Blistex Inc. (consumer health care products manufacturer); Member, World Presidents’ Organization | | 158 | | Board member of the Illinois Manufacturers’ Association |
James T. Bunch — 1942 Trustee | | 2003 | | Managing Member, Grumman Hill Group LLC (family office/private equity investments) Formerly: Chairman of the Board, Denver Film Society; Chairman of the Board of Trustees, Evans Scholarship Foundation; Chairman, Board of Governors, Western Golf Association | | 158 | | Trustee, Evans Scholarship Foundation |
Jack M. Fields — 1952 Trustee | | 2001 | | Chief Executive Officer, Twenty First Century Group, Inc. (government affairs company); and Discovery Learning Alliance (non-profit) Formerly: Owner and Chief Executive Officer, Dos Angeles Ranch L.P. (cattle, hunting, corporate entertainment); Director, Insperity, Inc. (formerly known as Administaff) (human resources provider); Chief Executive Officer, Texana Timber LP (sustainable forestry company); Director of Cross Timbers Quail Research Ranch (non-profit); and member of the U.S. House of Representatives | | 158 | | None |
Cynthia Hostetler — 1962 Trustee | | 2017 | | Non-Executive Director and Trustee of a number of public and private business corporations Formerly: Head of Investment Funds and Private Equity, Overseas Private Investment Corporation; President, First Manhattan Bancorporation, Inc.; Attorney, Simpson Thacher & Bartlett LLP | | 158 | | Vulcan Materials Company (construction materials company); Trilinc Global Impact Fund; Aberdeen Investment Funds (4 portfolios); Artio Global Investment LLC (mutual fund complex); Edgen Group, Inc. (specialized energy and infrastructure products distributor) |
Eli Jones — 1961 Trustee | | 2016 | | Professor and Dean, Mays Business School — Texas A&M University Formerly: Professor and Dean, Walton College of Business, University of Arkansas and E.J. Ourso College of Business, Louisiana State University; Director, Arvest Bank | | 158 | | Insperity, Inc. (formerly known as Administaff) (human resources provider) |
Prema Mathai-Davis — 1950 Trustee | | 2001 | | Retired. Formerly: Chief Executive Officer, YWCA of the U.S.A. | | 158 | | None |
Teresa M. Ressel — 1962 Trustee | | 2017 | | Non-executive director and trustee of a number of public and private business corporations Formerly: Chief Financial Officer, Olayan America, The Olayan Group (international investor/commercial/industrial); Chief Executive Officer, UBS Securities LLC; Group Chief Operating Officer, Americas, UBS AG; Assistant Secretary for Management & Budget and CFO, US Department of the Treasury; Chief Compliance Officer, Kaiser Permanente (healthcare consortium); Program Manager, Hewlett-Packard; Nuclear Engineering, General Dynamics Corporation (aerospace and defense company) | | 158 | | Atlantic Power Corporation (power generation company); ON Semiconductor Corp. (semiconductor supplier) |
Larry Soll — 1942 Trustee | | 2003 | | Retired. Formerly: Chairman, Chief Executive Officer and President, Synergen Corp. (a biotechnology company) | | 158 | | None |
Ann Barnett Stern — 1957 Trustee | | 2017 | | President and Chief Executive Officer, Houston Endowment Inc. (private philanthropic institution) Formerly: Executive Vice President and General Counsel, Texas Children’s Hospital; Attorney, Beck, Redden and Secrest, LLP; Business Law Instructor, University of St. Thomas; Attorney, Andrews & Kurth LLP | | 158 | | Federal Reserve Bank of Dallas |
Raymond Stickel, Jr. — 1944 Trustee | | 2005 | | Retired. Formerly: Director, Mainstay VP Series Funds, Inc. (25 portfolios); Partner, Deloitte & Touche | | 158 | | None |
Robert C. Troccoli — 1949 Trustee | | 2016 | | Adjunct Professor, University of Denver — Daniels College of Business Formerly: Senior Partner, KPMG LLP | | 158 | | None |
T-2 Invesco Global Targeted Returns Fund
Trustees and Officers—(continued)
| | | | | | | | |
Name, Year of Birth and Position(s) Held with the Trust | | Trustee and/
or Officer Since | | Principal Occupation(s) During Past 5 Years | | Number of
Funds in Fund
Complex
Overseen by
Trustee | | Other Directorship(s)
Held by Trustee During Past 5 Years |
| Independent Trustees—(continued) |
Christopher L. Wilson — 1957 Trustee | | 2017 | | Managing Partner, CT2, LLC (investing and consulting firm) Formerly: President/Chief Executive Officer, Columbia Funds, Bank of America Corporation; President/Chief Executive Officer, CDC IXIS Asset Management Services, Inc.; Principal & Director of Operations, Scudder Funds, Scudder, Stevens & Clark, Inc.; Assistant Vice President, Fidelity Investments | | 158 | | TD Asset Management USA Inc. (mutual fund complex) (22 portfolios); ISO New England, Inc. (non-profit organization managing regional electricity market) |
| Other Officers | | | | | | | | |
Sheri Morris — 1964 President, Principal Executive Officer and Treasurer | | 1999 | | President, Principal Executive Officer and Treasurer, The Invesco Funds; Vice President, Invesco Advisers, Inc. (formerly known as Invesco Institutional (N.A.), Inc.) (registered investment adviser); and Vice President, PowerShares Exchange-Traded Fund Trust, PowerShares Exchange-Traded Fund Trust II, PowerShares India Exchange-Traded Fund Trust, PowerShares Actively Managed Exchange-Traded Fund Trust and PowerShares Actively Managed Exchange-Traded Commodity Fund Trust Formerly: Vice President and Principal Financial Officer, The Invesco Funds; Vice President, Invesco Aim Advisers, Inc., Invesco Aim Capital Management, Inc. and Invesco Aim Private Asset Management, Inc.; Assistant Vice President and Assistant Treasurer, The Invesco Funds and Assistant Vice President, Invesco Advisers, Inc., Invesco Aim Capital Management, Inc. and Invesco Aim Private Asset Management, Inc.; and Treasurer, PowerShares Exchange-Traded Fund Trust, PowerShares Exchange-Traded Fund Trust II, PowerShares India Exchange-Traded Fund Trust and PowerShares Actively Managed Exchange-Traded Fund Trust | | N/A | | N/A |
Russell C. Burk — 1958 Senior Vice President and Senior Officer | | 2005 | | Senior Vice President and Senior Officer, The Invesco Funds | | N/A | | N/A |
John M. Zerr — 1962 Senior Vice President, Chief Legal Officer and Secretary | | 2006 | | Director, Senior Vice President, Secretary and General Counsel, Invesco Management Group, Inc. (formerly known as Invesco AIM Management Group, Inc.); Senior Vice President, Invesco Advisers, Inc. (formerly known as Invesco Institutional (N.A.), Inc.) (registered investment adviser); Senior Vice President and Secretary, Invesco Distributors, Inc. (formerly known as Invesco AIM Distributors, Inc.); Director, Vice President and Secretary, Invesco Investment Services, Inc. (formerly known as Invesco AIM Investment Services, Inc.) Senior Vice President, Chief Legal Officer and Secretary, The Invesco Funds; Managing Director, Invesco PowerShares Capital Management LLC; Director, Secretary and General Counsel, Invesco Investment Advisers LLC (formerly known as Van Kampen Asset Management); Secretary and General Counsel, Invesco Capital Markets, Inc. (formerly known as Van Kampen Funds Inc.) and Chief Legal Officer, PowerShares Exchange-Traded Fund Trust, PowerShares Exchange-Traded Fund Trust II, PowerShares India Exchange-Traded Fund Trust, PowerShares Actively Managed Exchange-Traded Fund Trust and PowerShares Actively Managed Exchange-Traded Commodity Fund Trust; Manager and Secretary, Invesco Indexing LLC Formerly: Director, Secretary, General Counsel and Senior Vice President, Van Kampen Exchange Corp.; Director, Vice President and Secretary, IVZ Distributors, Inc. (formerly known as INVESCO Distributors, Inc.); Director and Vice President, INVESCO Funds Group, Inc.; Director and Vice President, Van Kampen Advisors Inc.; Director, Vice President, Secretary and General Counsel, Van Kampen Investor Services Inc.; Director, Invesco Distributors, Inc. (formerly known as Invesco AIM Distributors, Inc.); Director, Senior Vice President, General Counsel and Secretary, Invesco AIM Advisers, Inc. and Van Kampen Investments Inc.; Director, Vice President and Secretary, Fund Management Company; Director, Senior Vice President, Secretary, General Counsel and Vice President, Invesco AIM Capital Management, Inc.; Chief Operating Officer and General Counsel, Liberty Ridge Capital, Inc. (an investment adviser); Vice President and Secretary, PBHG Funds (an investment company) and PBHG Insurance Series Fund (an investment company); Chief Operating Officer, General Counsel and Secretary, Old Mutual Investment Partners (a broker-dealer); General Counsel and Secretary, Old Mutual Fund Services (an administrator) and Old Mutual Shareholder Services (a shareholder servicing center); Executive Vice President, General Counsel and Secretary, Old Mutual Capital, Inc. (an investment adviser); and Vice President and Secretary, Old Mutual Advisors Funds (an investment company) | | N/A | | N/A |
Gregory G. McGreevey — 1962 Senior Vice President | | 2012 | | Senior Managing Director, Invesco Ltd.; Director, Chairman, President, and Chief Executive Officer, Invesco Advisers, Inc. (formerly known as Invesco Institutional (N.A.), Inc.) (registered investment adviser); Senior Vice President, Invesco Management Group, Inc.; Director, Invesco Mortgage Capital, Inc. and Invesco Senior Secured Management, Inc.; and Senior Vice President, The Invesco Funds Formerly: Assistant Vice President, The Invesco Funds | | N/A | | N/A |
T-3 Invesco Global Targeted Returns Fund
Trustees and Officers—(continued)
| | | | | | | | |
Name, Year of Birth and Position(s) Held with the Trust | | Trustee and/
or Officer Since | | Principal Occupation(s) During Past 5 Years | | Number of
Funds in Fund
Complex
Overseen by
Trustee | | Other Directorship(s)
Held by Trustee During Past 5 Years |
| Other Officers—(continued) | | | | | | | | |
Kelli Gallegos — 1970 Vice President, Principal Financial Officer and Assistant Treasurer | | 2008 | | Vice President, Principal Financial Officer and Assistant Treasurer, The Invesco Funds; Assistant Treasurer, Invesco PowerShares Capital Management LLC, PowerShares Exchange-Traded Fund Trust, PowerShares Exchange-Traded Fund Trust II, PowerShares India Exchange-Traded Fund Trust, PowerShares Actively Managed Exchange-Traded Fund Trust and PowerShares Actively Managed Exchange-Traded Commodity Fund Trust Formerly: Assistant Vice President, The Invesco Funds | | N/A | | N/A |
Tracy Sullivan — 1962 Vice President, Chief Tax Officer and Assistant Treasurer | | 2008 | | Vice President, Chief Tax Officer and Assistant Treasurer, The Invesco Funds; Assistant Treasurer, Invesco PowerShares Capital Management LLC, PowerShares Exchange-Traded Fund Trust, PowerShares Exchange-Traded Fund Trust II, PowerShares India Exchange-Traded Fund Trust, PowerShares Actively Managed Exchange-Traded Fund Trust and PowerShares Actively Managed Exchange-Traded Commodity Fund Trust Formerly: Assistant Vice President, The Invesco Funds | | N/A | | N/A |
Crissie M. Wisdom — 1969 Anti-Money Laundering Compliance Officer | | 2013 | | Anti-Money Laundering Compliance Officer, Invesco Advisers, Inc. (formerly known as Invesco Institutional (N.A.), Inc.) (registered investment adviser), Invesco Capital Markets, Inc. (formerly known as Van Kampen Funds Inc.), Invesco Distributors, Inc., Invesco Investment Services, Inc., Invesco Management Group, Inc., The Invesco Funds, and PowerShares Exchange-Traded Fund Trust, PowerShares Exchange-Traded Fund Trust II, PowerShares India Exchange-Traded Fund Trust, PowerShares Actively Managed Exchange-Traded Fund Trust and PowerShares Actively Managed Exchange-Traded Commodity Fund Trust; Anti-Money Laundering Compliance Officer and Bank Secrecy Act Officer, INVESCO National Trust Company and Invesco Trust Company; and Fraud Prevention Manager and Controls and Risk Analysis Manager for Invesco Investment Services, Inc. Formerly: Anti-Money Laundering Compliance Officer, Van Kampen Exchange Corp. | | N/A | | N/A |
Robert R. Leveille — 1969 Chief Compliance Officer | | 2016 | | Chief Compliance Officer, Invesco Advisers, Inc. (registered investment adviser); and Chief Compliance Officer, The Invesco Funds Formerly: Chief Compliance Officer, Putnam Investments and the Putnam Funds | | N/A | | N/A |
The Statement of Additional Information of the Trust includes additional information about the Fund’s Trustees and is available upon request, without charge, by calling 1.800.959.4246. Please refer to the Fund’s Statement of Additional Information for information on the Fund’s sub-advisers.
| | | | | | |
Office of the Fund 11 Greenway Plaza, Suite 1000 Houston, TX 77046-1173 | | Investment Adviser Invesco Advisers, Inc. 1555 Peachtree Street, N.E. Atlanta, GA 30309 | | Distributor Invesco Distributors, Inc. 11 Greenway Plaza, Suite 1000 Houston, TX 77046-1173 | | Auditors PricewaterhouseCoopers LLP 1000 Louisiana Street, Suite 5800 Houston, TX 77002-5678 |
| | | |
| | | | | | |
Counsel to the Fund Stradley Ronon Stevens & Young, LLP 2005 Market Street, Suite 2600 Philadelphia, PA 19103-7018 | | Counsel to the Independent Trustees Goodwin Procter LLP 901 New York Avenue, N.W. Washington, D.C. 20001 | | Transfer Agent Invesco Investment Services, Inc. 11 Greenway Plaza, Suite 1000 Houston, TX 77046-1173 | | Custodian State Street Bank and Trust Company 225 Franklin Street Boston, MA 02110-2801 |
T-4 Invesco Global Targeted Returns Fund
Explore High-Conviction Investing with Invesco

Go paperless with eDelivery
Visit invesco.com/edelivery to enjoy the convenience and security of anytime electronic access to your investment documents.
With eDelivery, you can elect to have any or all of the following materials delivered straight to your inbox to download, save and print from your own computer:
| ∎ | | Fund reports and prospectuses |
Invesco mailing information
Send general correspondence to Invesco Investment Services, Inc., P.O. Box 219078, Kansas City, MO 64121-9078.
Important notice regarding delivery of security holder documents
To reduce Fund expenses, only one copy of most shareholder documents may be mailed to shareholders with multiple accounts at the same address (Householding). Mailing of your shareholder documents may be householded indefinitely unless you instruct us otherwise. If you do not want the mailing of these documents to be combined with those for other members of your household, please contact Invesco Investment Services, Inc. at 800 959 4246 or contact your financial institution. We will begin sending you individual copies for each account within 30 days after receiving your request.
Fund holdings and proxy voting information
The Fund provides a complete list of its holdings four times in each fiscal year, at the quarter ends. For the second and fourth quarters, the lists appear in the Fund’s semiannual and annual reports to shareholders. For the first and third quarters, the Fund files the lists with the Securities and Exchange Commission (SEC) on Form N-Q. The most recent list of portfolio holdings is available at invesco.com/completeqtrholdings. Shareholders can also look up the Fund’s Forms N-Q on the SEC website at sec.gov. Copies of the Fund’s Forms N-Q may be reviewed and copied at the SEC Public Reference Room in Washington, D.C. You can obtain information on the operation of the Public Reference Room, including information about duplicating fee charges, by calling 202 551 8090 or 800 732 0330, or by electronic request at the following email address: publicinfo@sec.gov. The SEC file numbers for the Fund are shown below.
A description of the policies and procedures that the Fund uses to determine how to vote proxies relating to portfolio securities is available without charge, upon request, from our Client Services department at 800 959 4246 or at invesco.com/proxyguidelines. The information is also available on the SEC website, sec.gov.
| | |
Information regarding how the Fund voted proxies related to its portfolio securities during the most recent 12-month period ended June 30 is available at invesco.com/proxysearch. The information is also available on the SEC website, sec.gov. Invesco Advisers, Inc. is an investment adviser; it provides investment advisory services to individual and institutional clients and does not sell securities. Invesco Distributors, Inc. is the US distributor for Invesco Ltd.’s retail mutual funds, exchange-traded funds and institutional money market funds. Both are wholly owned, indirect subsidiaries of Invesco Ltd. | |  |
| | | | | | | | |
| SEC file numbers: 811-05426 and 033-19338 | | Invesco Distributors, Inc. | | GTR-AR-1 | | 12212017 | | 0848 |
Letters to Shareholders
| | | | |

Phillip Taylor | | | | Dear Shareholders: This annual report includes information about your Fund, including performance data and a complete list of its investments as of the close of the reporting period. Inside is a discussion of how your Fund was managed and the factors that affected its performance during the reporting period. American voters went to the polls just days after the start of the reporting period, and their decisions quickly affected markets. The US stock market rallied strongly after the election, with major market indexes rising, and setting record highs, throughout the reporting period. Generally positive economic data, strong corporate earnings and hope for tax and regulatory reform contributed to the rally. US and global bond markets, as well as emerging market equities, sold off immediately following the election – with the US bond market eventually recovering most of its losses. Overseas, economic data were mixed, prompting the European |
Central Bank and central banks in China and Japan, among other countries, to maintain extraordinarily accommodative monetary policies. Citing positive economic trends – specifically, realized and expected labor market conditions and inflation – the US Federal Reserve raised interest rates three times during the reporting period: first in December 2016, and then again in March and June 2017. Health care and tax reform proved to be more difficult than expected to enact, with little progress achieved by the end of the reporting period.
Short-term market volatility can prompt some investors to abandon their investment plans – and can cause others to settle for whatever returns the market has to offer. The investment professionals at Invesco, in contrast, invest with high conviction. This means that, no matter the asset class or the strategy, each investment team has a passion to exceed. We want to help investors achieve better outcomes, such as seeking higher returns, helping mitigate risk and generating income. Of course, investing with high conviction can’t guarantee a profit or ensure success; no investment strategy can. To learn more about how we invest with high conviction, visit invesco.com/HighConviction.
You, too, can invest with high conviction by maintaining a long-term investment perspective and by working with your financial adviser on a regular basis. During periods of short-term market volatility or uncertainty, your financial adviser can keep you focused on your long-term investment goals – a new home, a child’s college education or a secure retirement. He or she also can share research about the economy, the markets and individual investment options.
Visit our website for more information on your investments
Our website, invesco.com/us, offers a wide range of market insights and investment perspectives. On the website, you’ll find detailed information about our funds, including performance, holdings and portfolio manager commentaries. You can access information about your account by completing a simple, secure online registration. To do so, select “Log In” on the right side of the homepage, and then select “Register for Individual Account Access.”
In addition to the resources accessible on our website and through our mobile app, you can obtain timely updates to help you stay informed about the markets and the economy by connecting with Invesco on Twitter, LinkedIn or Facebook. You can access our blog at blog.invesco.us.com. Our goal is to provide you the information you want, when and where you want it.
Finally, I’m pleased to share with you Invesco’s commitment to both the Principles for Responsible Investment and to considering environmental, social and governance issues in our robust investment process. I invite you to learn more at invesco.com/esg.
Have questions?
For questions about your account, contact an Invesco client services representative at 800 959 4246. For Invesco-related questions or comments, please email me directly at phil@invesco.com.
All of us at Invesco look forward to serving your investment management needs. Thank you for investing with us.
Sincerely,

Philip Taylor
Senior Managing Director, Invesco Ltd.
|
| 2 Invesco Greater China Fund |
| | | | |

Bruce Crockett | | | | Dear Fellow Shareholders: Among the many important lessons I’ve learned in more than 40 years in a variety of business endeavors is the value of a trusted advocate. As independent chair of the Invesco Funds Board, I can assure you that the members of the Board are strong advocates for the interests of investors in Invesco’s mutual funds. We work hard to represent your interests through oversight of the quality of the investment management services your funds receive and other matters important to your investment, including but not limited to: ∎ Ensuring that Invesco offers a diverse lineup of mutual funds that your financial adviser can use to strive to meet your financial needs as your investment goals change over time. ∎ Monitoring how the portfolio management teams of the Invesco funds are performing in light of changing economic and market conditions. |
| ∎ | Assessing each portfolio management team’s investment performance within the context of the investment strategy described in the fund’s prospectus. |
| ∎ | Monitoring for potential conflicts of interests that may impact the nature of the services that your funds receive. |
We believe one of the most important services we provide our fund shareholders is the annual review of the funds’ advisory and sub-advisory contracts with Invesco Advisers and its affiliates. This review is required by the Investment Company Act of 1940 and focuses on the nature and quality of the services Invesco provides as the adviser to the Invesco funds and the reasonableness of the fees that it charges for those services. Each year, we spend months carefully reviewing information received from Invesco and a variety of independent sources, such as performance and fee data prepared by Lipper, Inc. (a subsidiary of Broadridge Financial Solutions, Inc.), an independent, third-party firm widely recognized as a leader in its field. We also meet with our independent legal counsel and other independent advisers to review and help us assess the information that we have received. Our goal is to assure that you receive quality investment management services for a reasonable fee.
I trust the measures outlined above provide assurance that you have a worthy advocate when it comes to choosing the Invesco Funds.
As always, please contact me at bruce@brucecrockett.com with any questions or concerns you may have. On behalf of the Board, we look forward to continuing to represent your interests and serving your needs.
Sincerely,

Bruce L. Crockett
Independent Chair
Invesco Funds Board of Trustees
|
| 3 Invesco Greater China Fund |
Management’s Discussion of Fund Performance
Performance summary
For the fiscal year ended October 31, 2017, Class A shares of Invesco Greater China Fund (the Fund), at net asset value (NAV), outperformed the MSCI Golden Dragon Index, the Fund’s broad market/style-specific benchmark.
Your Fund’s long-term performance appears later in this report.
Fund vs. Indexes
Total returns, 10/31/16 to 10/31/17, at net asset value (NAV). Performance shown does not include applicable contingent deferred sales charges (CDSC) or front-end sales charges, which would have reduced performance.
| | | | | |
| Class A Shares | | | | 33.25 | % |
| Class B Shares | | | | 32.25 | |
| Class C Shares | | | | 32.20 | |
| Class Y Shares | | | | 33.59 | |
| Class R5 Shares | | | | 33.80 | |
| Class R6 Shares* | | | | 33.53 | |
| MSCI Golden Dragon Index▼ (Broad Market/ Style-Specific Index) | | | | 32.46 | |
| Lipper China Region Funds Index∎ (Peer Group Index) | | | | 36.27 | |
Source(s): ▼FactSet Research Systems Inc.; ∎Lipper Inc.
*Class R6 shares incepted on April 4, 2017. See page 7 for more details.
Market conditions and your Fund
For the fiscal year ended October 31, 2017, Chinese equity markets rebounded on the back of rising investor confidence, resulting from a number of robust economic indicators and positive developments. China’s economy accelerated in the first quarter of 2017, with growth beating expectations as both the industrials and telecommunication services sectors improved. The Chinese government’s efforts to rebalance China’s economy from being manufacturing-led to more consumer-driven remained on track. Macroeconomic data remained strong, as official manufacturing Purchasing Managers’ Index and industrial profits data provided indications of a robust Chinese economy. During the fiscal year, the Hong Kong equity market benefited from the positive spill-over from Chinese equities. Taiwanese
equities also moved higher, led by
growth in the information technology (IT) and industrials sectors.
From a sector perspective, the IT and consumer discretionary sectors led market gains, posting double-digit returns for the fiscal year.
For the reporting period ended October 31, 2017, Class A shares of the Fund at NAV outperformed the MSCI Golden Dragon Index, its broad market/style-specific index. Sector allocation and stock selection had a positive impact on Fund performance. The Fund’s relative outperformance was driven by stock selection in the utilities sector. In particular, natural gas companies Towngas China Company and ENN Energy Holdings were notable contributors to Fund performance. Fund holdings in the utilities sector rose on better-than-expected tariff regulation.
Underweight exposure to the financials sector supported relative results during the reporting period.
Stock selection in the industrials and consumer staples sectors also contributed to the Fund’s performance versus the broad market/style-specific index. The top contributor in the industrials sector was Zhuzhou CRRC Times Electric, a manufacturer of railway power and control systems for various users in China and overseas. The stock rose on strengthening order book visibility. In the consumer staples sector, Hong Kong-based Sun Art Retail Group, an operator of supermarkets and hypermarkets, was a key contributor to relative performance during the reporting period. The company stepped up its online and new business formats to improve margins and increase sales.
In contrast, select holdings in the consumer discretionary sector detracted from the Fund’s performance versus the broad market/style-specific benchmark during the reporting period. In particular, Vipshop Holdings, an online discount retailer in China, was the leading detractor due to lower-than-expected earnings and a decline in active customers. We sold Vipshop Holdings before the close of the reporting period. Sportswear retailer Pou Sheng International Holdings was another key detractor from Fund performance within the sector.
Stock selection in and overweight exposure to the telecommunication services sector detracted from the Fund’s absolute and relative performance versus the broad market/style-specific index during the reporting period. This was mainly due to the Fund’s holding in China Mobile, the largest telecommunication services
| | | | | |
| Portfolio Composition |
By sector | | | | % of total net assets | |
| | | | | |
| Information Technology | | | | 36.4 | % |
| Consumer Discretionary | | | | 20.6 | |
| Consumer Staples | | | | 12.8 | |
| Industrials | | | | 9.7 | |
| Telecommunication Services | | | | 6.6 | |
| Health Care | | | | 5.3 | |
| Materials | | | | 4.4 | |
| Utilities | | | | 3.8 | |
| Financials | | | | 0.4 | |
Money Market Funds Plus Other Assets Less Liabilities | | | | 0.0 | |
| | | | | |
| Top 10 Equity Holdings* |
| | | | % of total net assets | |
| | | | | |
1. TencentHoldings Ltd. | | | | 9.4 | % |
2. AlibabaGroup Holding Ltd.-ADR | | | | 8.8 | |
3. ChinaMobile Ltd. | | | | 5.9 | |
4. TaiwanSemiconductor ManufacturingCo. Ltd. | | | | 4.5 | |
5. HUAYUAutomotive Systems Co.,Ltd.-Class A | | | | 3.9 | |
6. HenganInternational Group Co., Ltd. | | | | 3.8 | |
7. HonHai Precision Industry Co., Ltd. | | | | 3.6 | |
8. LarganPrecision Co., Ltd. | | | | 3.2 | |
9. ZhuzhouCRRC Times Electric Co.,Ltd.-Class H | | | | 2.9 | |
10. JD.com, Inc.-ADR | | | | 2.8 | |
| | | | | |
| Total Net Assets | | | | $95.7 million | |
| |
| Total Number of Holdings* | | | | 51 | |
The Fund’s holdings are subject to change, and there is no assurance that the Fund will continue to hold any particular security.
* Excluding money market fund holdings.
Data presented here are as of October 31, 2017.
|
| 4 Invesco Greater China Fund |
company in China. The company’s annual performance retreated from strong gains the previous quarter.
Despite lagging stock selection in the consumer discretionary and telecommunication services sectors, strong stock selection in other sectors benefited Fund performance relative to the broad market/style-specific benchmark.
We continue to seek companies with sustainable industry leadership and competitive advantages using an active bottom-up investment process. This approach has led to significant exposure to consumer-related sectors, including the consumer discretionary, consumer staples and telecommunication services sectors in China. In our view, the growth drivers for these sectors are diverse and not strongly correlated. We continue to favor private enterprises over state-owned enterprises, as private enterprises tend to have interests that we believe better align with investors. At the same time, we believe that per-capita health care spending in China must increase significantly to catch up with health care spending in other developed market economies.
We remain cautious towards Chinese banks due to various industry headwinds. However, during the fiscal year, we witnessed steady progress in the Chinese government’s attempts to limit previously fast-growing and less-transparent shadow banking activities.
The Chinese government has also managed to curb excess capacity in the coal and steel industries. We believe that conditions will remain broadly stable moving forward. The latest macroeconomic data continue to reflect economic resilience as these changes take place. While headline growth is expected to moderate, the Chinese economy is on track to deliver the Chinese government’s target of 6.5% growth.1 Regarding future reforms, we believe that deleveraging will remain a high priority of the Chinese government. From a bottom-up perspective, at the close of the reporting period, Chinese companies continued to see earnings upgrades across all sectors. Valuations were still attractive relative to long-term historical levels and Chinese equities were trading at a discount to those in developed markets. Finally, liquidity was robust as investor fund flows into Hong Kong via the Shenzhen-Hong Kong Stock Connect program remained strong during the reporting period.
Thank you for your continued investment in Invesco Greater China Fund.
The views and opinions expressed in management’s discussion of Fund performance are those of Invesco Advisers, Inc. These views and opinions are subject to change at any time based on factors such as market and economic conditions. These views and opinions may not be relied upon as investment advice or recommendations, or as an offer for a particular security. The information is not a complete analysis of every aspect of any market, country, industry, security or the Fund. Statements of fact are from sources considered reliable, but Invesco Advisers, Inc. makes no representation or warranty as to their completeness or accuracy. Although historical performance is no guarantee of future results, these insights may help you understand our investment management philosophy.
See important Fund and, if applicable, index disclosures later in this report.
| | |
 | | Mike Shiao Portfolio Manager and Chief Investment Officer of Invesco’s Greater China Equities Team, |
| is manager of Invesco Greater China Fund. He joined Invesco in 2002. Mr. Shiao earned a bachelor’s degree from National Chung Hsing University, Taiwan and an MS in finance from Drexel University. |
|
| 5 Invesco Greater China Fund |
Your Fund’s Long-Term Performance
Results of a $10,000 Investment – Oldest Share Class(es)
Fund and index data from 10/31/07
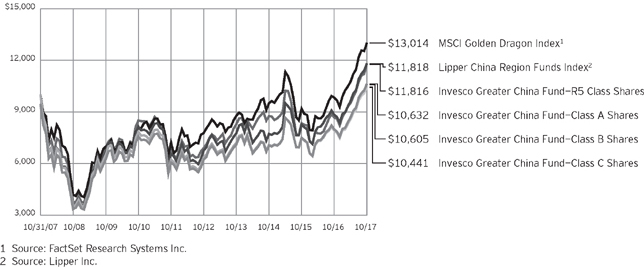
Past performance cannot guarantee comparable future results.
The data shown in the chart include reinvested distributions, applicable sales charges and Fund expenses including management fees. Results for Class B shares are calculated as if a hypothetical shareholder had liquidated his entire investment in the Fund at the close of the reporting period and paid the contingent deferred sales charges, if applicable.
Index results include reinvested dividends, but they do not reflect sales charges. Performance of the peer group, if applicable, reflects fund expenses and management fees; performance of a market index does not. Performance shown in the chart and table(s) does not reflect deduction of taxes a shareholder would pay on Fund distributions or sale of Fund shares.
|
| 6 Invesco Greater China Fund |
| | | | | |
| Average Annual Total Returns |
| As of 10/31/17, including maximum applicable sales charges | |
| | | | | |
| |
| Class A Shares | | | | | |
| Inception (3/31/06) | | | | 10.14 | % |
| 10 Years | | | | 0.61 | |
| 5 Years | | | | 10.05 | |
| 1 Year | | | | 25.94 | |
| |
| Class B Shares | | | | | |
| Inception (3/31/06) | | | | 10.12 | % |
| 10 Years | | | | 0.59 | |
| 5 Years | | | | 10.20 | |
| 1 Year | | | | 27.25 | |
| |
| Class C Shares | | | | | |
| Inception (3/31/06) | | | | 9.85 | % |
| 10 Years | | | | 0.43 | |
| 5 Years | | | | 10.47 | |
| 1 Year | | | | 31.20 | |
| |
| Class Y Shares | | | | | |
| 10 Years | | | | 1.41 | % |
| 5 Years | | | | 11.57 | |
| 1 Year | | | | 33.59 | |
| |
| Class R5 Shares | | | | | |
| Inception (3/31/06) | | | | 11.20 | % |
| 10 Years | | | | 1.68 | |
| 5 Years | | | | 11.81 | |
| 1 Year | | | | 33.80 | |
| |
| Class R6 Shares | | | | | |
| 10 Years | | | | 1.21 | % |
| 5 Years | | | | 11.35 | |
| 1 Year | | | | 33.53 | |
Class Y shares incepted on October 3, 2008. Performance shown prior to that date is that of Class A shares and includes the 12b-1 fees applicable to Class A shares.
Class R6 shares incepted on April 4, 2017. Performance shown prior to that date is that of Class A shares and includes the 12b-1 fees applicable to Class A shares.
The performance data quoted represent past performance and cannot guarantee comparable future results; current performance may be lower or higher. Please visit invesco.com/performance for the most recent month-end performance. Performance figures reflect reinvested distributions, changes in net asset value and the effect of the maximum sales charge unless otherwise stated. Investment return and principal value will fluctuate so that you may have a gain or loss when you sell shares.
| | | | | |
| Average Annual Total Returns |
| As of 9/30/17, the most recent calendar quarter end, including maximum applicable sales charges | |
| |
| Class A Shares | | | | | |
| Inception (3/31/06) | | | | 9.89 | % |
| 10 Years | | | | 1.68 | |
| 5 Years | | | | 10.88 | |
| 1 Year | | | | 18.19 | |
| |
| Class B Shares | | | | | |
| Inception (3/31/06) | | | | 9.87 | % |
| 10 Years | | | | 1.66 | |
| 5 Years | | | | 11.05 | |
| 1 Year | | | | 19.17 | |
| |
| Class C Shares | | | | | |
| Inception (3/31/06) | | | | 9.60 | % |
| 10 Years | | | | 1.50 | |
| 5 Years | | | | 11.32 | |
| 1 Year | | | | 23.15 | |
| |
| Class Y Shares | | | | | |
| 10 Years | | | | 2.49 | % |
| 5 Years | | | | 12.43 | |
| 1 Year | | | | 25.40 | |
| |
| Class R5 Shares | | | | | |
| Inception (3/31/06) | | | | 10.95 | % |
| 10 Years | | | | 2.77 | |
| 5 Years | | | | 12.66 | |
| 1 Year | | | | 25.62 | |
| |
| Class R6 Shares | | | | | |
| 10 Years | | | | 2.28 | % |
| 5 Years | | | | 12.20 | |
| 1 Year | | | | 25.34 | |
The total annual Fund operating expense ratio set forth in the most recent Fund prospectus as of the date of this report for Class A, Class B, Class C, Class Y, Class R5 and Class R6 shares was 1.93%, 2.68%, 2.68%, 1.68%, 1.45% and 1.40%, respectively. The expense ratios presented above may vary from the expense ratios presented in other sections of this report that are based on expenses incurred during the period covered by this report.
Class A share performance reflects the maximum 5.50% sales charge, and Class B and Class C share performance reflects the applicable contingent deferred sales charge (CDSC) for the period involved. The CDSC on Class B shares declines from 5% beginning at the time of purchase to 0% at the beginning of the seventh year. The CDSC on Class C shares is 1% for the first year after purchase. Class Y, Class R5 and Class R6 shares do not have a front-end sales charge or a CDSC; therefore, performance is at net asset value.
The performance of the Fund’s share classes will differ primarily due to different sales charge structures and class expenses.
Fund performance reflects any applicable fee waivers and/or expense reimbursements. Had the adviser not waived fees and/or reimbursed expenses currently or in the past, returns would have been lower. See current prospectus for more information.
7 Invesco Greater China Fund
Invesco Greater China Fund’s investment objective is long-term growth of capital.
| ∎ | | Unless otherwise stated, information presented in this report is as of October 31, 2017, and is based on total net assets. |
| ∎ | | Unless otherwise noted, all data provided by Invesco. |
| ∎ | | To access your Fund’s reports/prospectus, visit invesco.com/fundreports. |
About share classes
| ∎ | | Class B shares may not be purchased for new or additional investments. Please see the prospectus for more information. |
| ∎ | | Class Y shares are available to only certain investors. Please see the prospectus for more information. |
| ∎ | | Class R5 shares and Class R6 shares are available for use by retirement plans that meet certain standards and for institutional investors. Class R6 shares are also available through intermediaries that have established an agreement with Invesco Distributors, Inc. to make such shares available for use in retail omnibus accounts. Please see the prospectus for more information. |
Principal risks of investing in the Fund
| ∎ | | Convertible securities risk. The market values of convertible securities are affected by market interest rates, the risk of actual issuer default on interest or principal payments and the value of the underlying common stock into which the convertible security may be converted. Additionally, a convertible security is subject to the same types of market and issuer risks as apply to the underlying common stock. In addition, certain convertible securities are subject to involuntary conversions and may undergo principal write-downs upon the occurrence of certain triggering events, and, as a result, are subject to an increased risk of loss. Convertible securities may be rated below investment grade. |
| ∎ | | Debt securities risk. The prices of debt securities held by the Fund will be affected by changes in interest rates, the creditworthiness of the issuer and other factors. An increase in prevailing interest rates typically causes the value of existing debt securities to fall and often has a greater impact on longer-duration debt securities and higher quality debt securities. Falling interest rates will cause the Fund to reinvest the proceeds of debt securities that have been repaid by the issuer at lower interest rates. Falling interest rates |
| | | may also reduce the Fund’s distributable income because interest payments on floating rate debt instruments held by the Fund will decline. The Fund could lose money on investments in debt securities if the issuer or borrower fails to meet its obligations to make interest payments and/or to repay principal in a timely manner. Changes in an issuer’s financial strength, the market’s perception of such strength or in the credit rating of the issuer or the security may affect the value of debt securities. The Adviser’s credit analysis may fail to anticipate such changes, which could result in buying a debt security at an inopportune time or failing to sell a debt security in advance of a price decline or other credit event. |
| ∎ | | Depositary receipts risk. Investing in depositary receipts involves the same risks as direct investments in foreign securities. In addition, the underlying issuers of certain depositary receipts are under no obligation to distribute shareholder communications or pass through any voting rights with respect to the deposited securities to the holders of such receipts. The Fund may therefore receive less timely information or have less control than if it invested directly in the foreign issuer. |
| ∎ | | Emerging markets securities risk. Emerging markets (also referred to as developing markets) are generally subject to greater market volatility, political, social and economic instability, uncertain trading markets and more governmental limitations on foreign investment than more developed markets. In addition, companies operating in emerging markets may be subject to lower trading volume and greater price fluctuations than companies in more developed markets. Securities law and the enforcement of systems of taxation in many emerging market countries |
| | | may change quickly and unpredictably. In addition, investments in emerging markets securities may also be subject to additional transaction costs, delays in settlement procedures, and lack of timely information. |
| ∎ | | Foreign government debt risk. Investments in foreign government debt securities (sometimes referred to as sovereign debt securities) involve certain risks in addition to those relating to foreign securities or debt securities generally. The issuer of the debt or the governmental authorities that control the repayment of the debt may be unable or unwilling to repay principal or interest when due in accordance with the terms of such debt, and the Fund may have limited recourse in the event of a default against the defaulting government. Without the approval of debt holders, some governmental debtors have in the past been able to reschedule or restructure their debt payments or declare moratoria on payments. |
| ∎ | | Foreign securities risk. The Fund’s foreign investments may be adversely affected by political and social instability, changes in economic o taxation policies, difficulty in enforcing obligations, decreased liquidity or increased volatility. Foreign investments also involve the risk of the possible seizure, nationalization or expropriation of the issuer or foreign deposits (in which the Fund could lose its entire investments in a certain market) and the possible adoption of foreign governmental restrictions such as exchange controls. Unless the Fund has hedged its foreign securities risk, foreign securities risk also involves the risk of negative foreign currency rate fluctuations, which may cause the value of securities denominated in such foreign currency (or other instruments through which the Fund has exposure to foreign currencies) to decline in value. Currency exchange rates may fluctuate significantly over short periods of time. Currency hedging strategies, if used, are not always successful. |
| ∎ | | Geographic focus risk. The Fund may from time to time invest a substantial amount of its assets in securities of issuers located in a single country or a limited number of countries. Adverse economic, political or social conditions |
|
This report must be accompanied or preceded by a currently effective Fund prospectus, which contains more complete information, including sales charges and expenses. Investors should read it carefully before investing. |
|
|
| NOT FDIC INSURED | MAY LOSE VALUE | NO BANK GUARANTEE |
8 Invesco Greater China Fund
in those countries may therefore have a significant negative impact on the Fund’s investment performance.
| ∎ | | Management risk. The Fund is actively managed and depends heavily on the Adviser’s judgment about markets, interest rates or the attractiveness, relative values, liquidity, or potential appreciation of particular investments made for the Fund’s portfolio. The Fund could experience losses if these judgments prove to be incorrect. Additionally, legislative, regulatory, or tax developments may adversely affect management of the Fund and, therefore, the ability of the Fund to achieve its investment objective. |
| ∎ | | Market risk. The market values of the Fund’s investments, and therefore the value of the Fund’s shares, will go up and down, sometimes rapidly or unpredictably. Market risk may affect a single issuer, industry or section of the economy, or it may affect the market as a whole. Individual stock prices tend to go up and down more dramatically than those of certain other types of investments, such as bonds. During a general downturn in the financial markets, multiple asset classes may decline in value. When markets perform well, there can be no assurance that specific investments held by the Fund will rise in value. |
| ∎ | | Participation notes risk. Investments in participation notes involve the same risks associated with a direct investment in the underlying security, currency or market they seek to replicate, and, in addition, subject the Fund to the credit-worthiness of the bank or broker-dealer that issued the participation notes. |
| ∎ | | Preferred securities risk. Preferred securities are subject to issuer-specific and market risks applicable generally to equity securities. Preferred securities also may be subordinated to bonds or other debt instruments, subjecting them to a greater risk of non-payment, may be less liquid than many other securities, such as common stocks, and generally offer no voting rights with respect to the issuer. |
| ∎ | | Sector focus risk. The Fund may from time to time invest a significant amount of its assets (i.e. over 25%) in one market sector or group of related industries. In this event, the Fund’s performance |
| | | will depend to a greater extent on the overall condition of the sector or group of industries and there is increased risk that the Fund will lose significant value if conditions adversely affect that sector or group of industries. |
| ∎ | | Small- and mid-capitalization companies risks. Small- and mid-capitalization companies tend to be more vulnerable to changing market conditions, may have little or no operating history or track record of success, and may have more limited product lines and markets, less experienced management and fewer financial resources than larger companies. These companies’ securities may be more volatile and less liquid than those of more established companies, and their returns may vary, sometimes significantly, from the overall securities market. |
| ∎ | | Unique economic and political risks of investing in Greater China. Investments in companies located or operating in Greater China involve risks not associated with investments in Western nations, such as nationalization, expropriation, or confiscation of property; difficulty in obtaining and/or enforcing judgments; alteration or discontinuation of economic reforms; military conflicts, either internal or with other countries; inflation, currency fluctuations and fluctuations in inflation and interest rates that may have negative effects on the economy and securities markets of Greater China; and Greater China’s dependency on the economies of other Asian countries, many of which are developing countries. Events in any one country within Greater China may impact the other countries in the region or Greater China as a whole. Certain securities issued by companies located or operating in Greater China, such as China A- shares, are subject to trading restrictions, quota limitations and less market liquidity. Additionally, developing countries, such as those in Greater China, may subject the Fund’s investments to a number of tax rules, and the application of many of those rules may be uncertain. Moreover, China has implemented a number of tax reforms in recent years, and may amend or revise its existing tax laws and/or procedures in the future, possibly with retroactive |
| | | effect. Changes inapplicable Chinese tax law could reduce the after-tax profits of the Fund, directly or indirectly, including by reducing the after-tax profits of companies in China in which the Fund invests. Uncertainties in Chinese tax rules could result in unexpected tax liabilities for the Fund. |
About indexes used in this report
| ∎ | | The MSCI Golden Dragon Index captures the equity market performance of large- and mid-cap China securities and non-domestic China securities listed in Hong Kong and Taiwan. The index is computed using the net return, which withholds applicable taxes for non-residents. |
| ∎ | | The Lipper China Region Funds Index is an unmanaged index considered representative of China region funds tracked by Lipper. |
| ∎ | | The Fund is not managed to track the performance of any particular index, including the index(es) described here, and consequently, the performance of the Fund may deviate significantly from the performance of the index(es). |
| ∎ | | A direct investment cannot be made in an index. Unless otherwise indicated, index results include reinvested dividends, and they do not reflect sales charges. Performance of the peer group, if applicable, reflects fund expenses; performance of a market index does not. |
Other information
| ∎ | | The returns shown in management’s discussion of Fund performance are based on net asset values (NAVs) calculated for shareholder transactions. Generally accepted accounting principles require adjustments to be made to the net assets of the Fund at period end for financial reporting purposes, and as such, the NAVs for shareholder transactions and the returns based on those NAVs may differ from the NAVs and returns reported in the Financial Highlights. |
| ∎ | | Industry classifications used in this report are generally according to the Global Industry Classification Standard, which was developed by and is the exclusive property and a service mark of MSCI Inc. and Standard & Poor’s. |
9 Invesco Greater China Fund
Schedule of Investments(a)
October 31, 2017
| | | | | | | | |
| | | Shares | | | Value | |
Common Stocks & Other Equity Interests–99.97%(b) | |
| Apparel Retail–1.37% | |
Pou Sheng International (Holdings) Ltd. (Hong Kong) | | | 7,171,000 | | | $ | 1,314,447 | |
|
| Auto Parts & Equipment–6.52% | |
HUAYU Automotive Systems Co., Ltd.–Class A | | | 966,004 | | | | 3,702,409 | |
Minth Group Ltd. | | | 470,000 | | | | 2,536,339 | |
| | | | | | | | 6,238,748 | |
|
| Automobile Manufacturers–0.62% | |
Jiangling Motors Corp., Ltd.–Class B | | | 311,100 | | | | 596,567 | |
|
| Commodity Chemicals–3.39% | |
Formosa Chemicals & Fibre Corp. (Taiwan) | | | 532,000 | | | | 1,618,923 | |
Formosa Plastics Corp. (Taiwan) | | | 534,000 | | | | 1,626,980 | |
| | | | | | | | 3,245,903 | |
|
| Diversified Banks–0.43% | |
BOC Hong Kong (Holdings) Ltd. | | | 86,500 | | | | 411,910 | |
|
| Education Services–1.42% | |
New Oriental Education & Technology Group, Inc.–ADR | | | 16,281 | | | | 1,355,230 | |
|
| Electrical Components & Equipment–4.03% | |
Voltronic Power Technology Corp. (Taiwan) | | | 59,150 | | | | 1,113,855 | |
Zhuzhou CRRC Times Electric Co., Ltd.–Class H | | | 468,300 | | | | 2,740,264 | |
| | | | | | | | 3,854,119 | |
|
| Electronic Components–4.61% | |
Chin-Poon Industrial Co., Ltd. (Taiwan) | | | 647,000 | | | | 1,354,079 | |
Largan Precision Co., Ltd. (Taiwan) | | | 16,000 | | | | 3,052,656 | |
| | | | | | | | 4,406,735 | |
|
| Electronic Equipment & Instruments–0.65% | |
Flytech Technology Co., Ltd. (Taiwan) | | | 220,000 | | | | 620,101 | |
|
| Electronic Manufacturing Services–3.84% | |
FIH Mobile Ltd. | | | 877,000 | | | | 276,083 | |
Hon Hai Precision Industry Co., Ltd. (Taiwan) | | | 911,000 | | | | 3,398,051 | |
| | | | | | | | 3,674,134 | |
|
| Food Retail–2.60% | |
President Chain Store Corp. (Taiwan) | | | 276,000 | | | | 2,488,279 | |
|
| Footwear–1.18% | |
Stella International Holdings Ltd. | | | 698,000 | | | | 1,133,722 | |
|
| Gas Utilities–3.75% | |
ENN Energy Holdings Ltd. | | | 257,000 | | | | 1,884,329 | |
Towngas China Co. Ltd. | | | 2,082,000 | | | | 1,708,001 | |
| | | | | | | | 3,592,330 | |
|
| Health Care Equipment–1.90% | |
MicroPort Scientific Corp. | | | 1,832,000 | | | | 1,815,081 | |
| | | | | | | | |
| | | Shares | | | Value | |
| Health Care Supplies–1.16% | |
Shandong Weigao Group Medical Polymer Co. Ltd.–Class H | | | 1,540,000 | | | $ | 1,105,443 | |
|
| Home Entertainment Software–2.29% | |
Changyou.com Ltd.–ADR(c) | | | 56,500 | | | | 2,188,810 | |
|
| Hotels, Resorts & Cruise Lines–0.64% | |
China International Travel Service Corp Ltd.–Class A | | | 90,100 | | | | 561,784 | |
Shanghai Jinjiang International Hotels Development Co., Ltd.–Class B | | | 22,948 | | | | 54,754 | |
| | | | | | | | 616,538 | |
|
| Hypermarkets & Super Centers–2.66% | |
Sun Art Retail Group Ltd. (Hong Kong) | | | 2,515,000 | | | | 2,540,339 | |
|
| Industrial Conglomerates–2.31% | |
Beijing Enterprises Holdings Ltd. | | | 247,000 | | | | 1,467,486 | |
CK Hutchison Holdings Ltd. (Hong Kong) | | | 58,500 | | | | 742,742 | |
| | | | | | | | 2,210,228 | |
|
| Industrial Machinery–1.03% | |
CIMC Enric Holdings Ltd.(c) | | | 1,454,000 | | | | 984,070 | |
|
| Internet & Direct Marketing Retail–5.23% | |
Ctrip.com International, Ltd.–ADR(c) | | | 48,360 | | | | 2,315,960 | |
JD.com, Inc.–ADR(c) | | | 71,500 | | | | 2,682,680 | |
| | | | | | | | 4,998,640 | |
|
| Internet Software & Services–20.45% | |
Alibaba Group Holding Ltd.–ADR(c) | | | 45,589 | | | | 8,428,950 | |
Autohome Inc.–ADR(c) | | | 21,800 | | | | 1,253,718 | |
PChome Online Inc. (Taiwan) | | | 159,305 | | | | 921,617 | |
Tencent Holdings Ltd. | | | 198,900 | | | | 8,958,869 | |
| | | | | | | | 19,563,154 | |
|
| Leisure Products–0.82% | |
Goodbaby International Holdings Ltd. | | | 1,430,000 | | | | 783,648 | |
|
| Marine Ports & Services–2.37% | |
China Merchants Port Holdings Co. Ltd. | | | 692,000 | | | | 2,164,330 | |
Qingdao Port International Co., Ltd.–Class H–REGS(d) | | | 144,000 | | | | 102,195 | |
| | | | | | | | 2,266,525 | |
|
| Packaged Foods & Meats–3.75% | |
Qinqin Foodstuffs Group (Cayman) Co. Ltd.(c) | | | 55,600 | | | | 14,824 | |
Tingyi (Cayman Islands) Holding Corp. | | | 1,440,000 | | | | 2,274,855 | |
Uni-President China Holdings Ltd. | | | 1,548,000 | | | | 1,293,737 | |
| | | | | | | | 3,583,416 | |
|
| Personal Products–3.78% | |
Hengan International Group Co. Ltd. | | | 366,500 | | | | 3,612,666 | |
See accompanying Notes to Financial Statements which are an integral part of the financial statements.
10 Invesco Greater China Fund
| | | | | | | | |
| | | Shares | | | Value | |
| Pharmaceuticals–2.20% | |
Shanghai Fudan-Zhangjiang Bio-Pharmaceutical Co., Ltd.–Class H | | | 128,000 | | | $ | 70,044 | |
Sino Biopharmaceutical Ltd. | | | 1,744,000 | | | | 2,036,537 | |
| | | | | | | | 2,106,581 | |
|
| Restaurants–1.90% | |
Ajisen (China) Holdings Ltd. (Hong Kong) | | | 2,540,000 | | | | 1,191,632 | |
Café de Coral Holdings Ltd. (Hong Kong) | | | 100,000 | | | | 308,141 | |
Xiabuxiabu Catering Management China Holdings Co. Ltd.–REGS(d) | | | 217,000 | | | | 316,541 | |
| | | | | | | | 1,816,314 | |
|
| Semiconductors–4.53% | |
Taiwan Semiconductor Manufacturing Co. Ltd. (Taiwan) | | | 536,000 | | | | 4,328,864 | |
| | | | | | | | |
| | | Shares | | | Value | |
| Steel–1.02% | |
Baoshan Iron & Steel Co., Ltd.–Class A(c) | | | 840,698 | | | $ | 973,516 | |
|
| Tires & Rubber–0.92% | |
Cheng Shin Rubber Industry Co., Ltd. (Taiwan) | | | 447,000 | | | | 882,345 | |
|
| Wireless Telecommunication Services–6.60% | |
China Mobile Ltd. | | | 564,000 | | | | 5,664,291 | |
SmarTone Telecommunications Holdings Ltd. (Hong Kong) | | | 521,500 | | | | 649,084 | |
| | | | | | | | 6,313,375 | |
TOTAL INVESTMENTS IN SECURITIES–99.97% (Cost $76,360,489) | | | | 95,621,778 | |
OTHER ASSETS LESS LIABILITIES–0.03% | | | | 29,610 | |
NET ASSETS–100.00% | | | $ | 95,651,388 | |
Investment Abbreviations:
| | |
| ADR | | – American Depositary Receipt |
| REGS | | – Regulation S |
Notes to Schedule of Investments:
| (a) | Industry and/or sector classifications used in this report are generally according to the Global Industry Classification Standard, which was developed by and is the exclusive property and a service mark of MSCI Inc. and Standard & Poor’s. |
| (b) | Country of issuer and/or credit risk exposure listed in Common Stocks & Other Equity Interests has been determined to be China unless otherwise noted. |
| (c) | Non-income producing security. |
| (d) | Security purchased or received in a transaction exempt from registration under the Securities Act of 1933, as amended (the “1933 Act”). The security may be resold pursuant to an exemption from registration under the 1933 Act, typically to qualified institutional buyers. The aggregate value of these securities at October 31, 2017 was $418,736, which represented less than 1% of the Fund’s Net Assets. |
See accompanying Notes to Financial Statements which are an integral part of the financial statements.
11 Invesco Greater China Fund
Statement of Assets and Liabilities
October 31, 2017
| | | | |
Assets: | | | | |
Investments in securities, at value (Cost $76,360,489) | | $ | 95,621,778 | |
Receivable for: | | | | |
Fund shares sold | | | 107,855 | |
Dividends | | | 118,063 | |
Investment for trustee deferred compensation and retirement plans | | | 54,776 | |
Other assets | | | 30,653 | |
Total assets | | | 95,933,125 | |
| |
Liabilities: | | | | |
Payable for: | | | | |
Fund shares reacquired | | | 16,942 | |
Amount due custodian | | | 69,193 | |
Accrued fees to affiliates | | | 66,444 | |
Accrued trustees’ and officers’ fees and benefits | | | 2,192 | |
Accrued other operating expenses | | | 66,569 | |
Trustee deferred compensation and retirement plans | | | 60,397 | |
Total liabilities | | | 281,737 | |
Net assets applicable to shares outstanding | | $ | 95,651,388 | |
| |
Net assets consist of: | | | | |
Shares of beneficial interest | | $ | 76,555,511 | |
Undistributed net investment income | | | (21,973 | ) |
Undistributed net realized gain (loss) | | | (143,414 | ) |
Net unrealized appreciation | | | 19,261,264 | |
| | | $ | 95,651,388 | |
| | | | |
Net Assets: | | | | |
Class A | | $ | 69,843,091 | |
Class B | | $ | 763,947 | |
Class C | | $ | 13,421,987 | |
Class Y | | $ | 11,443,635 | |
Class R5 | | $ | 71,733 | |
Class R6 | | $ | 106,995 | |
|
Shares outstanding, no par value,
with an unlimited number of shares authorized: | |
Class A | | | 2,375,699 | |
Class B | | | 26,804 | |
Class C | | | 471,768 | |
Class Y | | | 388,731 | |
Class R5 | | | 2,435 | |
Class R6 | | | 3,633 | |
Class A: | | | | |
Net asset value per share | | $ | 29.40 | |
Maximum offering price per share | | | | |
(Net asset value of $29.40 ¸ 94.50%) | | $ | 31.11 | |
Class B: | | | | |
Net asset value and offering price per share | | $ | 28.50 | |
Class C: | | | | |
Net asset value and offering price per share | | $ | 28.45 | |
Class Y: | | | | |
Net asset value and offering price per share | | $ | 29.44 | |
Class R5: | | | | |
Net asset value and offering price per share | | $ | 29.46 | |
Class R6: | | | | |
Net asset value and offering price per share | | $ | 29.45 | |
See accompanying Notes to Financial Statements which are an integral part of the financial statements.
12 Invesco Greater China Fund
Statement of Operations
For the year ended October 31, 2017
| | | | |
Investment income: | | | | |
Dividends (net of foreign withholding taxes of $146,156) | | $ | 1,628,575 | |
Dividends from affiliated money market funds | | | 10,310 | |
Total investment income | | | 1,638,885 | |
| |
Expenses: | | | | |
Advisory fees | | | 713,091 | |
Administrative services fees | | | 50,000 | |
Custodian fees | | | 71,604 | |
Distribution fees: | | | | |
Class A | | | 141,309 | |
Class B | | | 10,122 | |
Class C | | | 118,406 | |
Transfer agent fees — A, B, C and Y | | | 220,950 | |
Transfer agent fees — R5 | | | 60 | |
Transfer agent fees — R6 | | | 12 | |
Trustees’ and officers’ fees and benefits | | | 21,764 | |
Registration and filing fees | | | 79,384 | |
Reports to shareholders | | | 54,907 | |
Professional services fees | | | 60,940 | |
Other | | | 14,988 | |
Total expenses | | | 1,557,537 | |
Less: Fees waived and expense offset arrangement(s) | | | (4,708 | ) |
Net expenses | | | 1,552,829 | |
Net investment income | | | 86,056 | |
| |
Realized and unrealized gain (loss) from: | | | | |
Net realized gain (loss) from: | | | | |
Investment securities | | | 3,545,342 | |
Foreign currencies | | | (37,170 | ) |
| | | | 3,508,172 | |
Change in net unrealized appreciation (depreciation) of: | | | | |
Investment securities | | | 18,738,836 | |
Foreign currencies | | | (162 | ) |
| | | | 18,738,674 | |
Net realized and unrealized gain | | | 22,246,846 | |
Net increase in net assets resulting from operations | | $ | 22,332,902 | |
See accompanying Notes to Financial Statements which are an integral part of the financial statements.
13 Invesco Greater China Fund
Statement of Changes in Net Assets
For the years ended October 31, 2017 and 2016
| | | | | | | | |
| | | 2017 | | | 2016 | |
Operations: | | | | | | | | |
Net investment income | | $ | 86,056 | | | $ | 419,905 | |
Net realized gain (loss) | | | 3,508,172 | | | | (228,375 | ) |
Change in net unrealized appreciation | | | 18,738,674 | | | | 3,807,846 | |
Net increase in net assets resulting from operations | | | 22,332,902 | | | | 3,999,376 | |
| | |
Distributions to shareholders from net investment income: | | | | | | | | |
Class A | | | (354,279 | ) | | | (545,985 | ) |
Class B | | | — | | | | (3,961 | ) |
Class C | | | — | | | | (23,094 | ) |
Class Y | | | (45,730 | ) | | | (47,018 | ) |
Class R5 | | | (619 | ) | | | (1,312 | ) |
Total distributions from net investment income | | | (400,628 | ) | | | (621,370 | ) |
| | |
Share transactions–net: | | | | | | | | |
Class A | | | 1,136,916 | | | | (3,173,106 | ) |
Class B | | | (720,092 | ) | | | (1,402,208 | ) |
Class C | | | (1,792,194 | ) | | | (2,541,266 | ) |
Class Y | | | 4,144,381 | | | | 1,472,686 | |
Class R5 | | | 243 | | | | (21,707 | ) |
Class R6 | | | 104,144 | | | | — | |
Net increase (decrease) in net assets resulting from share transactions | | | 2,873,398 | | | | (5,665,601 | ) |
Net increase (decrease) in net assets | | | 24,805,672 | | | | (2,287,595 | ) |
| | |
Net assets: | | | | | | | | |
Beginning of year | | | 70,845,716 | | | | 73,133,311 | |
End of year (includes undistributed net investment income of $(21,973) and $327,427, respectively) | | $ | 95,651,388 | | | $ | 70,845,716 | |
Notes to Financial Statements
October 31, 2017
NOTE 1—Significant Accounting Policies
Invesco Greater China Fund (the “Fund”) is a series portfolio of AIM Investment Funds (Invesco Investment Funds) (the “Trust”). The Trust is organized as a Delaware statutory trust and is registered under the Investment Company Act of 1940, as amended (the “1940 Act”), as an open-end series management investment company consisting of twenty separate series portfolios, each authorized to issue an unlimited number of shares of beneficial interest. The assets, liabilities and operations of each portfolio are accounted for separately. Information presented in these financial statements pertains only to the Fund. Matters affecting each portfolio or class will be voted on exclusively by the shareholders of such portfolio or class.
The Fund’s investment objective is long-term growth of capital.
The Fund currently consists of six different classes of shares: Class A, Class B, Class C, Class Y, Class R5 and Class R6. Effective April 4, 2017, the Fund began offering Class R6 shares. Class Y shares are available only to certain investors. Class A shares are sold with a front-end sales charge unless certain waiver criteria are met and under certain circumstances load waived shares may be subject to contingent deferred sales charges (“CDSC”). Class C shares are sold with a CDSC. Class Y, Class R5 and Class R6 shares are sold at net asset value. Effective November 30, 2010, new or additional investments in Class B shares are no longer permitted. Existing shareholders of Class B shares may continue to reinvest dividends and capital gains distributions in Class B shares until they convert to Class A shares. Also, shareholders in Class B shares will be able to exchange those shares for Class B shares of other Invesco Funds offering such shares until they convert to Class A shares. Generally, Class B shares will automatically convert to Class A shares on or about the month-end, which is at least eight years after the date of purchase. Redemption of Class B shares prior to the conversion date will be subject to a CDSC.
The Fund is an investment company and accordingly follows the investment company accounting and reporting guidance in accordance with Financial Accounting Standards Board Accounting Standards Codification Topic 946, Financial Services — Investment Companies.
The following is a summary of the significant accounting policies followed by the Fund in the preparation of its financial statements.
| A. | Security Valuations — Securities, including restricted securities, are valued according to the following policy. |
A security listed or traded on an exchange (except convertible securities) is valued at its last sales price or official closing price as of the close of the customary trading session on the exchange where the security is principally traded, or lacking any sales or official closing price on a particular day, the security may be valued at the closing bid price on that day. Securities traded in the over-the-counter market are valued based
14 Invesco Greater China Fund
on prices furnished by independent pricing services or market makers. When such securities are valued by an independent pricing service they may be considered fair valued. Futures contracts are valued at the final settlement price set by an exchange on which they are principally traded. Listed options are valued at the mean between the last bid and asked prices from the exchange on which they are principally traded. Options not listed on an exchange are valued by an independent source at the mean between the last bid and asked prices. For purposes of determining net asset value (“NAV”) per share, futures and option contracts generally are valued 15 minutes after the close of the customary trading session of the New York Stock Exchange (“NYSE”).
Investments in open-end and closed-end registered investment companies that do not trade on an exchange are valued at the end-of-day net asset value per share. Investments in open-end and closed-end registered investment companies that trade on an exchange are valued at the last sales price or official closing price as of the close of the customary trading session on the exchange where the security is principally traded.
Debt obligations (including convertible securities) and unlisted equities are fair valued using an evaluated quote provided by an independent pricing service. Evaluated quotes provided by the pricing service may be determined without exclusive reliance on quoted prices, and may reflect appropriate factors such as institution-size trading in similar groups of securities, developments related to specific securities, dividend rate (for unlisted equities), yield (for debt obligations), quality, type of issue, coupon rate (for debt obligations), maturity (for debt obligations), individual trading characteristics and other market data. Pricing services generally value debt obligations assuming orderly transactions of institutional round lot size, but a fund may hold or transact in the same securities in smaller, odd lot sizes. Odd lots often trade at lower prices than institutional round lots. Debt obligations are subject to interest rate and credit risks. In addition, all debt obligations involve some risk of default with respect to interest and/or principal payments.
Foreign securities’ (including foreign exchange contracts) prices are converted into U.S. dollar amounts using the applicable exchange rates as of the close of the NYSE. If market quotations are available and reliable for foreign exchange-traded equity securities, the securities will be valued at the market quotations. Because trading hours for certain foreign securities end before the close of the NYSE, closing market quotations may become unreliable. If between the time trading ends on a particular security and the close of the customary trading session on the NYSE, events occur that the investment adviser determines are significant and make the closing price unreliable, the Fund may fair value the security. If the event is likely to have affected the closing price of the security, the security will be valued at fair value in good faith using procedures approved by the Board of Trustees. Adjustments to closing prices to reflect fair value may also be based on a screening process of an independent pricing service to indicate the degree of certainty, based on historical data, that the closing price in the principal market where a foreign security trades is not the current value as of the close of the NYSE. Foreign securities’ prices meeting the approved degree of certainty that the price is not reflective of current value will be priced at the indication of fair value from the independent pricing service. Multiple factors may be considered by the independent pricing service in determining adjustments to reflect fair value and may include information relating to sector indices, American Depositary Receipts and domestic and foreign index futures. Foreign securities may have additional risks including exchange rate changes, potential for sharply devalued currencies and high inflation, political and economic upheaval, the relative lack of issuer information, relatively low market liquidity and the potential lack of strict financial and accounting controls and standards.
Securities for which market prices are not provided by any of the above methods may be valued based upon quotes furnished by independent sources. The last bid price may be used to value equity securities. The mean between the last bid and asked prices is used to value debt obligations, including corporate loans.
Securities for which market quotations are not readily available or became unreliable are valued at fair value as determined in good faith by or under the supervision of the Trust’s officers following procedures approved by the Board of Trustees. Issuer specific events, market trends, bid/asked quotes of brokers and information providers and other market data may be reviewed in the course of making a good faith determination of a security’s fair value.
The Fund may invest in securities that are subject to interest rate risk, meaning the risk that the prices will generally fall as interest rates rise and, conversely, the prices will generally rise as interest rates fall. Specific securities differ in their sensitivity to changes in interest rates depending on their individual characteristics. Changes in interest rates may result in increased market volatility, which may affect the value and/or liquidity of certain Fund investments.
Valuations change in response to many factors including the historical and prospective earnings of the issuer, the value of the issuer’s assets, general economic conditions, interest rates, investor perceptions and market liquidity. Because of the inherent uncertainties of valuation, the values reflected in the financial statements may materially differ from the value received upon actual sale of those investments.
| B. | Securities Transactions and Investment Income — Securities transactions are accounted for on a trade date basis. Realized gains or losses on sales are computed on the basis of specific identification of the securities sold. Interest income (net of withholding tax, if any) is recorded on the accrual basis from settlement date. Dividend income (net of withholding tax, if any) is recorded on the ex-dividend date. |
The Fund may periodically participate in litigation related to Fund investments. As such, the Fund may receive proceeds from litigation settlements. Any proceeds received are included in the Statement of Operations as realized gain (loss) for investments no longer held and as unrealized gain (loss) for investments still held.
Brokerage commissions and mark ups are considered transaction costs and are recorded as an increase to the cost basis of securities purchased and/or a reduction of proceeds on a sale of securities. Such transaction costs are included in the determination of net realized and unrealized gain (loss) from investment securities reported in the Statement of Operations and the Statement of Changes in Net Assets and the net realized and unrealized gains (losses) on securities per share in the Financial Highlights. Transaction costs are included in the calculation of the Fund’s net asset value and, accordingly, they reduce the Fund’s total returns. These transaction costs are not considered operating expenses and are not reflected in net investment income reported in the Statement of Operations and the Statement of Changes in Net Assets, or the net investment income per share and the ratios of expenses and net investment income reported in the Financial Highlights, nor are they limited by any expense limitation arrangements between the Fund and the investment adviser.
The Fund allocates income and realized and unrealized capital gains and losses to a class based on the relative net assets of each class.
| C. | Country Determination — For the purposes of making investment selection decisions and presentation in the Schedule of Investments, the investment adviser may determine the country in which an issuer is located and/or credit risk exposure based on various factors. These factors include the laws of the country under which the issuer is organized, where the issuer maintains a principal office, the country in which the issuer derives 50% or more of its total revenues and the country that has the primary market for the issuer’s securities, as well as other criteria. Among |
15 Invesco Greater China Fund
| | the other criteria that may be evaluated for making this determination are the country in which the issuer maintains 50% or more of its assets, the type of security, financial guarantees and enhancements, the nature of the collateral and the sponsor organization. Country of issuer and/or credit risk exposure has been determined to be the United States of America, unless otherwise noted. |
| D. | Distributions — Distributions from net investment income and net realized capital gain, if any, are generally declared and paid annually and recorded on the ex-dividend date. The Fund may elect to treat a portion of the proceeds from redemptions as distributions for federal income tax purposes. |
| E. | Federal Income Taxes — The Fund intends to comply with the requirements of Subchapter M of the Internal Revenue Code of 1986, as amended (the “Internal Revenue Code”), necessary to qualify as a regulated investment company and to distribute substantially all of the Fund’s taxable earnings to shareholders. As such, the Fund will not be subject to federal income taxes on otherwise taxable income (including net realized capital gain) that is distributed to shareholders. Therefore, no provision for federal income taxes is recorded in the financial statements. |
The Fund recognizes the tax benefits of uncertain tax positions only when the position is more likely than not to be sustained. Management has analyzed the Fund’s uncertain tax positions and concluded that no liability for unrecognized tax benefits should be recorded related to uncertain tax positions. Management is not aware of any tax positions for which it is reasonably possible that the total amounts of unrecognized tax benefits will change materially in the next 12 months.
The Fund files tax returns in the U.S. Federal jurisdiction and certain other jurisdictions. Generally, the Fund is subject to examinations by such taxing authorities for up to three years after the filing of the return for the tax period.
| F. | Expenses — Fees provided for under the Rule 12b-1 plan of a particular class of the Fund are charged to the operations of such class. Transfer agency fees and expenses and other shareholder recordkeeping fees and expenses attributable to Class R5 and Class R6 are allocated to each share class based on relative net assets. Sub-accounting fees attributable to Class R5 are charged to the operations of the class. Transfer agency fees and expenses and other shareholder recordkeeping fees and expenses relating to all other classes are allocated among those classes based on relative net assets. All other expenses are allocated among the classes based on relative net assets. |
| G. | Accounting Estimates — The preparation of financial statements in conformity with accounting principles generally accepted in the United States of America (“GAAP”) requires management to make estimates and assumptions that affect the reported amounts of assets and liabilities at the date of the financial statements and the reported amounts of revenues and expenses during the reporting period including estimates and assumptions related to taxation. Actual results could differ from those estimates by a significant amount. In addition, the Fund monitors for material events or transactions that may occur or become known after the period-end date and before the date the financial statements are released to print. |
| H. | Indemnifications — Under the Trust’s organizational documents, each Trustee, officer, employee or other agent of the Trust is indemnified against certain liabilities that may arise out of the performance of their duties to the Fund. Additionally, in the normal course of business, the Fund enters into contracts, including the Fund’s servicing agreements, that contain a variety of indemnification clauses. The Fund’s maximum exposure under these arrangements is unknown as this would involve future claims that may be made against the Fund that have not yet occurred. The risk of material loss as a result of such indemnification claims is considered remote. |
| I. | Foreign Currency Translations — Foreign currency is valued at the close of the NYSE based on quotations posted by banks and major currency dealers. Portfolio securities and other assets and liabilities denominated in foreign currencies are translated into U.S. dollar amounts at date of valuation. Purchases and sales of portfolio securities (net of foreign taxes withheld on disposition) and income items denominated in foreign currencies are translated into U.S. dollar amounts on the respective dates of such transactions. The Fund does not separately account for the portion of the results of operations resulting from changes in foreign exchange rates on investments and the fluctuations arising from changes in market prices of securities held. The combined results of changes in foreign exchange rates and the fluctuation of market prices on investments (net of estimated foreign tax withholding) are included with the net realized and unrealized gain or loss from investments in the Statement of Operations. Reported net realized foreign currency gains or losses arise from (1) sales of foreign currencies, (2) currency gains or losses realized between the trade and settlement dates on securities transactions, and (3) the difference between the amounts of dividends, interest, and foreign withholding taxes recorded on the Fund’s books and the U.S. dollar equivalent of the amounts actually received or paid. Net unrealized foreign currency gains and losses arise from changes in the fair values of assets and liabilities, other than investments in securities at fiscal period end, resulting from changes in exchange rates. |
The Fund may invest in foreign securities, which may be subject to foreign taxes on income, gains on investments or currency repatriation, a portion of which may be recoverable. Foreign taxes, if any, are recorded based on the tax regulations and rates that exist in the foreign markets in which the Fund invests and are shown in the Statement of Operations.
| J. | Forward Foreign Currency Contracts — The Fund may engage in foreign currency transactions either on a spot (i.e. for prompt delivery and settlement) basis, or through forward foreign currency contracts, to manage or minimize currency or exchange rate risk. |
The Fund may also enter into forward foreign currency contracts for the purchase or sale of a security denominated in a foreign currency in order to “lock in” the U.S. dollar price of that security, or the Fund may also enter into forward foreign currency contracts that do not provide for physical settlement of the two currencies, but instead are settled by a single cash payment calculated as the difference between the agreed upon exchange rate and the spot rate at settlement based upon an agreed upon notional amount (non-deliverable forwards). The Fund will set aside liquid assets in an amount equal to the daily mark-to-market obligation for forward foreign currency contracts.
A forward foreign currency contract is an obligation between two parties (“Counterparties”) to purchase or sell a specific currency for an agreed-upon price at a future date. The use of forward foreign currency contracts does not eliminate fluctuations in the price of the underlying securities the Fund owns or intends to acquire but establishes a rate of exchange in advance. Fluctuations in the value of these contracts are measured by the difference in the contract date and reporting date exchange rates and are recorded as unrealized appreciation (depreciation) until the contracts are closed. When the contracts are closed, realized gains (losses) are recorded. Realized and unrealized gains (losses) on the contracts are included in the Statement of Operations. The primary risks associated with forward foreign currency contracts include failure of the Counterparty to meet the terms of the contract and the value of the foreign currency changing unfavorably. These risks may be in excess of the amounts reflected in the Statement of Assets and Liabilities.
16 Invesco Greater China Fund
| K. | Other Risks — Investing in a single-country mutual fund involves greater risk than investing in a more diversified fund due to lack of exposure to other countries. The political and economic conditions and changes in regulatory, tax or economic policy in a single country could significantly affect the market in that country and in surrounding or related countries. |
Investing in developing countries can add additional risk, such as high rates of inflation or sharply devalued currencies against the U.S. dollar.
Transaction costs are often higher and there may be delays in settlement procedures.
Certain securities issued by companies in China may be less liquid, harder to sell or more volatile than U.S. securities.
NOTE 2—Advisory Fees and Other Fees Paid to Affiliates
The Trust has entered into a master investment advisory agreement with Invesco Advisers, Inc. (the “Adviser” or “Invesco”). Under the terms of the investment advisory agreement, the Fund accrues daily and pays monthly an advisory fee to the Adviser based on the annual rate of the Fund’s average daily net assets as follows:
| | | | | | | | |
| Average Daily Net Assets | | Rate | |
First $250 million | | | 0 | .935% | | | | |
Next $250 million | | | 0 | .91% | | | | |
Next $500 million | | | 0 | .885% | | | | |
Next $1.5 billion | | | 0 | .86% | | | | |
Next $2.5 billion | | | 0 | .835% | | | | |
Next $2.5 billion | | | 0 | .81% | | | | |
Next $2.5 billion | | | 0 | .785% | | | | |
Over $10 billion | | | 0 | .76% | | | | |
For the year ended October 31, 2017, the effective advisory fees incurred by the Fund was 0.935%.
Under the terms of a master sub-advisory agreement between the Adviser and each of Invesco Asset Management Deutschland GmbH, Invesco Asset Management Limited, Invesco Asset Management (Japan) Limited, Invesco Hong Kong Limited, Invesco Senior Secured Management, Inc. and Invesco Canada Ltd. (collectively, the “Affiliated Sub-Advisers”) the Adviser, not the Fund, will pay 40% of the fees paid to the Adviser to any such Affiliated Sub-Adviser(s) that provide(s) discretionary investment management services to the Fund based on the percentage of assets allocated to such Affiliated Sub-Adviser(s).
The Adviser has contractually agreed, through at least June 30, 2018, to waive advisory fees and/or reimburse expenses to the extent necessary to limit total annual fund operating expenses after fee waiver and/or expense reimbursement (excluding certain items discussed below) of Class A, Class B, Class C, Class Y, Class R5 and Class R6 shares to 2.25%, 3.00%, 3.00%, 2.00%, 2.00% and 2.00%, respectively, of the Fund’s average daily net assets (the “expense limits”). In determining the Adviser’s obligation to waive advisory fees and/or reimburse expenses, the following expenses are not taken into account, and could cause the total annual fund operating expenses after fee waiver and/or reimbursement to exceed the numbers reflected above: (1) interest; (2) taxes; (3) dividend expense on short sales; (4) extraordinary or non-routine items, including litigation expenses; and (5) expenses that the Fund has incurred but did not actually pay because of an expense offset arrangement. Unless Invesco continues the fee waiver agreement, it will terminate on June 30, 2018. During its term, the fee waiver agreement cannot be terminated or amended to increase the expense limits or reduce the advisory fee waiver without approval of the Board of Trustees. The Adviser did not waive fees and/or reimburse expenses during the period under these expense limits.
Further, the Adviser has contractually agreed, through at least June 30, 2019, to waive the advisory fee payable by the Fund in an amount equal to 100% of the net advisory fees the Adviser receives from the affiliated money market funds on investments by the Fund of uninvested cash in such affiliated money market funds.
For the year ended October 31, 2017, the Adviser waived advisory fees of $1,381.
The Trust has entered into a master administrative services agreement with Invesco pursuant to which the Fund has agreed to pay Invesco for certain administrative costs incurred in providing accounting services to the Fund. For the year ended October 31, 2017, expenses incurred under the agreement are shown in the Statement of Operations as Administrative services fees.
The Trust has entered into a transfer agency and service agreement with Invesco Investment Services, Inc. (“IIS”) pursuant to which the Fund has agreed to pay IIS a fee for providing transfer agency and shareholder services to the Fund and reimburse IIS for certain expenses incurred by IIS in the course of providing such services. IIS may make payments to intermediaries that provide omnibus account services, sub-accounting services and/or networking services. All fees payable by IIS to intermediaries that provide omnibus account services or sub-accounting services are charged back to the Fund, subject to certain limitations approved by the Trust’s Board of Trustees. For the year ended October 31, 2017, expenses incurred under the agreement are shown in the Statement of Operations as Transfer agent fees.
The Trust has entered into master distribution agreements with Invesco Distributors, Inc. (“IDI”) to serve as the distributor for the Class A, Class B, Class C, Class Y, Class R5 and Class R6 shares of the Fund. The Trust has adopted plans pursuant to Rule 12b-1 under the 1940 Act with respect to the Fund’s Class A, Class B and Class C shares (collectively, the “Plans”). The Fund, pursuant to the Plans, pays IDI compensation at the annual rate of 0.25% of the Fund’s average daily net assets of Class A shares and 1.00% of the average daily net assets of Class B and Class C shares. The fees are accrued daily and paid monthly. Of the Plan payments, up to 0.25% of the average daily net assets of each class of shares may be paid to furnish continuing personal shareholder services to customers who purchase and own shares of such classes. Any amounts not paid as a service fee under the Plans would constitute an asset-based sales charge. Rules of the Financial Industry Regulatory Authority (“FINRA”) impose a cap on the total sales charges, including asset-based sales charges, that may be paid by any class of shares of the Fund. For the year ended October 31, 2017, expenses incurred under the Plans are shown in the Statement of Operations as Distribution fees.
Front-end sales commissions and CDSC (collectively, the “sales charges”) are not recorded as expenses of the Fund. Front-end sales commissions are deducted from proceeds from the sales of Fund shares prior to investment in Class A shares of the Fund. CDSC are deducted from redemption proceeds prior to remittance to the shareholder. During the year ended October 31, 2017, IDI advised the Fund that IDI retained $18,874 in
17 Invesco Greater China Fund
front-end sales commissions from the sale of Class A shares and $9 and $458 from Class A and Class C shares, respectively, for CDSC imposed on redemptions by shareholders.
Certain officers and trustees of the Trust are officers and directors of the Adviser, IIS and/or IDI.
NOTE 3—Additional Valuation Information
GAAP defines fair value as the price that would be received to sell an asset or paid to transfer a liability in an orderly transaction between market participants at the measurement date, under current market conditions. GAAP establishes a hierarchy that prioritizes the inputs to valuation methods, giving the highest priority to readily available unadjusted quoted prices in an active market for identical assets (Level 1) and the lowest priority to significant unobservable inputs (Level 3), generally when market prices are not readily available or are unreliable. Based on the valuation inputs, the securities or other investments are tiered into one of three levels. Changes in valuation methods may result in transfers in or out of an investment’s assigned level:
| | Level 1 — | Prices are determined using quoted prices in an active market for identical assets. |
| | Level 2 — | Prices are determined using other significant observable inputs. Observable inputs are inputs that other market participants may use in pricing a security. These may include quoted prices for similar securities, interest rates, prepayment speeds, credit risk, yield curves, loss severities, default rates, discount rates, volatilities and others. |
| | Level 3 — | Prices are determined using significant unobservable inputs. In situations where quoted prices or observable inputs are unavailable (for example, when there is little or no market activity for an investment at the end of the period), unobservable inputs may be used. Unobservable inputs reflect the Fund’s own assumptions about the factors market participants would use in determining fair value of the securities or instruments and would be based on the best available information. |
The following is a summary of the tiered valuation input levels, as of October 31, 2017. The level assigned to the securities valuations may not be an indication of the risk or liquidity associated with investing in those securities. Because of the inherent uncertainties of valuation, the values reflected in the financial statements may materially differ from the value received upon actual sale of those investments.
The Fund’s policy is to recognize transfers in and out of the valuation levels as of the end of the reporting period. During the year ended October 31, 2017, there were transfers from Level 1 to Level 2 of $14,454,611 and from Level 2 to Level 1 of $8,452,091, due to foreign fair value adjustments.
| | | | | | | | | | | | | | | | |
| | | Level 1 | | | Level 2 | | | Level 3 | | | Total | |
Common Stocks & Other Equity Interests | | $ | 61,182,326 | | | $ | 34,439,452 | | | $ | — | | | $ | 95,621,778 | |
NOTE 4—Expense Offset Arrangement(s)
The expense offset arrangement is comprised of transfer agency credits which result from balances in demand deposit accounts used by the transfer agent for clearing shareholder transactions. For the year ended October 31, 2017, the Fund received credits from this arrangement, which resulted in the reduction of the Fund’s total expenses of $3,327.
NOTE 5—Trustees’ and Officers’ Fees and Benefits
Trustees’ and Officers’ Fees and Benefits include amounts accrued by the Fund to pay remuneration to certain Trustees and Officers of the Fund. Trustees have the option to defer compensation payable by the Fund, and Trustees’ and Officers’ Fees and Benefits also include amounts accrued by the Fund to fund such deferred compensation amounts. Those Trustees who defer compensation have the option to select various Invesco Funds in which their deferral accounts shall be deemed to be invested. Finally, certain current Trustees were eligible to participate in a retirement plan that provided for benefits to be paid upon retirement to Trustees over a period of time based on the number of years of service. The Fund may have certain former Trustees who also participate in a retirement plan and receive benefits under such plan. Trustees’ and Officers’ Fees and Benefits include amounts accrued by the Fund to fund such retirement benefits. Obligations under the deferred compensation and retirement plans represent unsecured claims against the general assets of the Fund.
NOTE 6—Cash Balances
The Fund is permitted to temporarily carry a negative or overdrawn balance in its account with State Street Bank and Trust Company, the custodian bank. Such balances, if any at period-end, are shown in the Statement of Assets and Liabilities under the payable caption Amount due custodian. To compensate the custodian bank for such overdrafts, the overdrawn Fund may either (1) leave funds as a compensating balance in the account so the custodian bank can be compensated by earning the additional interest; or (2) compensate by paying the custodian bank at a rate agreed upon by the custodian bank and Invesco, not to exceed the contractually agreed upon rate.
18 Invesco Greater China Fund
NOTE 7—Distributions to Shareholders and Tax Components of Net Assets
Tax Character of Distributions to Shareholders Paid During the Fiscal Years Ended October 31, 2017 and 2016:
| | | | | | | | |
| | | 2017 | | | 2016 | |
Ordinary income | | $ | 400,628 | | | $ | 621,370 | |
Tax Components of Net Assets at Period-End:
| | | | |
| | | 2017 | |
Undistributed ordinary income | | $ | 456,196 | |
Net unrealized appreciation — investments | | | 18,694,927 | |
Net unrealized appreciation (depreciation) — foreign currencies | | | (25 | ) |
Temporary book/tax differences | | | (55,221 | ) |
Shares of beneficial interest | | | 76,555,511 | |
Total net assets | | $ | 95,651,388 | |
The difference between book-basis and tax-basis unrealized appreciation (depreciation) is due to differences in the timing of recognition of gains and losses on investments for tax and book purposes. The Fund’s net unrealized appreciation difference is attributable primarily to wash sales and the treatment of passive foreign investments companies.
The temporary book/tax differences are a result of timing differences between book and tax recognition of income and/or expenses. The Fund’s temporary book/tax differences are the result of the trustee deferral of compensation and retirement plan benefits.
Capital loss carryforward is calculated and reported as of a specific date. Results of transactions and other activity after that date may affect the amount of capital loss carryforward actually available for the Fund to utilize. Capital losses generated in years beginning after December 22, 2010 can be carried forward for an unlimited period, whereas previous losses expire in eight tax years. Capital losses with an expiration period may not be used to offset capital gains until all net capital losses without an expiration date have been utilized. Capital loss carryforwards with no expiration date will retain their character as either short-term or long-term capital losses instead of as short-term capital losses as under prior law. The ability to utilize capital loss carryforwards in the future may be limited under the Internal Revenue Code and related regulations based on the results of future transactions.
The Fund does not have a capital loss carryforward as of October 31, 2017.
NOTE 8—Investment Transactions
The aggregate amount of investment securities (other than short-term securities, U.S. Treasury obligations and money market funds, if any) purchased and sold by the Fund during the year ended October 31, 2017 was $44,540,951 and $41,713,820, respectively. Cost of investments, including any derivatives, on a tax basis includes the adjustments for financial reporting purposes as of the most recently completed federal income tax reporting period-end.
| | | | |
| Unrealized Appreciation (Depreciation) of Investments on a Tax Basis | |
Aggregate unrealized appreciation of investments | | $ | 22,883,194 | |
Aggregate unrealized (depreciation) of investments | | | (4,188,267 | ) |
Net unrealized appreciation of investments | | $ | 18,694,927 | |
Cost of investments for tax purposes is $76,926,851.
NOTE 9—Reclassification of Permanent Differences
Primarily as a result of differing book/tax treatment of expired capital loss carryforward, on October 31, 2017, undistributed net investment income was decreased by $34,828, undistributed net realized gain (loss) was increased by $7,935,395 and shares of beneficial interest was decreased by $7,900,567. This reclassification had no effect on the net assets of the Fund.
19 Invesco Greater China Fund
NOTE 10—Share Information
| | | | | | | | | | | | | | | | |
| | | Summary of Share Activity | |
| | | Years ended October 31, | |
| | | 2017(a) | | | 2016 | |
| | | Shares | | | Amount | | | Shares | | | Amount | |
Sold: | | | | | | | | | | | | | | | | |
Class A | | | 569,913 | | | $ | 14,502,235 | | | | 249,846 | | | $ | 5,170,461 | |
Class B | | | 1,033 | | | | 23,318 | | | | 838 | | | | 16,774 | |
Class C | | | 45,152 | | | | 1,130,270 | | | | 41,490 | | | | 846,424 | |
Class Y | | | 346,947 | | | | 8,827,823 | | | | 337,898 | | | | 6,881,781 | |
Class R5 | | | — | | | | — | | | | 2,145 | | | | 43,338 | |
Class R6(b) | | | 3,633 | | | | 104,144 | | | | — | | | | — | |
| | | | |
Issued as reinvestment of dividends: | | | | | | | | | | | | | | | | |
Class A | | | 15,781 | | | | 339,129 | | | | 26,127 | | | | 514,692 | |
Class B | | | — | | | | — | | | | 196 | | | | 3,776 | |
Class C | | | — | | | | — | | | | 1,066 | | | | 20,460 | |
Class Y | | | 1,898 | | | | 40,746 | | | | 2,144 | | | | 42,201 | |
Class R5 | | | 20 | | | | 432 | | | | 55 | | | | 1,072 | |
| | | | |
Automatic conversion of Class B shares to Class A shares: | | | | | | | | | | | | | | | | |
Class A | | | 21,353 | | | | 537,044 | | | | 50,077 | | | | 1,019,667 | |
Class B | | | (21,965 | ) | | | (537,044 | ) | | | (51,484 | ) | | | (1,019,667 | ) |
| | | | |
Reacquired: | | | | | | | | | | | | | | | | |
Class A | | | (592,344 | ) | | | (14,241,492 | ) | | | (481,297 | ) | | | (9,877,926 | ) |
Class B | | | (8,760 | ) | | | (206,366 | ) | | | (20,343 | ) | | | (403,091 | ) |
Class C | | | (125,409 | ) | | | (2,922,464 | ) | | | (173,247 | ) | | | (3,408,150 | ) |
Class Y | | | (194,454 | ) | | | (4,724,188 | ) | | | (268,901 | ) | | | (5,451,296 | ) |
Class R5 | | | (8 | ) | | | (189 | ) | | | (3,336 | ) | | | (66,117 | ) |
Net increase (decrease) in share activity | | | 62,790 | | | $ | 2,873,398 | | | | (286,726 | ) | | $ | (5,665,601 | ) |
| (a) | There are entities that are record owners of more than 5% of the outstanding shares of the Fund and in the aggregate own 24% of the outstanding shares of the Fund. IDI has an agreement with these entities to sell Fund shares. The Fund, Invesco and/or Invesco affiliates may make payments to these entities, which are considered to be related to the Fund, for providing services to the Fund, Invesco and/or Invesco affiliates including but not limited to services such as securities brokerage, distribution, third party record keeping and account servicing. The Fund has no knowledge as to whether all or any portion of the shares owned of record by these entities are also owned beneficially. |
| (b) | Commencement date of April 4, 2017. |
20 Invesco Greater China Fund
NOTE 11—Financial Highlights
The following schedule presents financial highlights for a share of the Fund outstanding throughout the periods indicated.
| | | | | | | | | | | | | | | | | | | | | | | | | | | | | | | | | | | | | | | | | | | | | | | | |
| | | Net asset
value,
beginning
of period | | | Net
investment
income
(loss)(a) | | | Net gains
(losses)
on securities
(both
realized and
unrealized) | | | Total from
investment
operations | | | Dividends
from net
investment
income | | | Net asset
value, end
of period | | | Total
return(b) | | | Net assets,
end of period
(000’s omitted) | | | Ratio of
expenses
to average
net assets
with fee waivers
and/or expenses
absorbed | | | Ratio of
expenses
to average net
assets without
fee waivers
and/or expenses
absorbed | | | Ratio of net
investment
income (loss)
to average
net assets | | | Portfolio
turnover(c) | |
Class A | | | | | | | | | | | | | | | | | | | | | | | | | | | | | | | | | | | | | | | | | | | | | | | | |
Year ended 10/31/17 | | $ | 22.23 | | | $ | 0.05 | | | $ | 7.27 | | | $ | 7.32 | | | $ | (0.15 | ) | | $ | 29.40 | | | | 33.19 | % | | $ | 69,843 | | | | 1.93 | %(d) | | | 1.93 | %(d) | | | 0.22 | %(d) | | | 56 | % |
Year ended 10/31/16 | | | 21.10 | | | | 0.15 | | | | 1.20 | | | | 1.35 | | | | (0.22 | ) | | | 22.23 | | | | 6.51 | | | | 52,479 | | | | 1.93 | | | | 1.93 | | | | 0.74 | | | | 52 | |
Year ended 10/31/15 | | | 19.93 | | | | 0.18 | | | | 1.08 | | | | 1.26 | | | | (0.09 | ) | | | 21.10 | | | | 6.36 | | | | 53,087 | | | | 1.88 | | | | 1.88 | | | | 0.85 | | | | 130 | |
Year ended 10/31/14 | | | 20.31 | | | | (0.03 | ) | | | (0.13 | ) | | | (0.16 | ) | | | (0.22 | ) | | | 19.93 | | | | (0.87 | ) | | | 62,957 | | | | 1.85 | | | | 1.85 | | | | (0.15 | ) | | | 124 | |
Year ended 10/31/13 | | | 17.90 | | | | 0.09 | | | | 2.44 | | | | 2.53 | | | | (0.12 | ) | | | 20.31 | | | | 14.18 | | | | 76,691 | | | | 1.78 | | | | 1.78 | | | | 0.50 | | | | 148 | |
Class B | | | | | | | | | | | | | | | | | | | | | | | | | | | | | | | | | | | | | | | | | | | | | | | | |
Year ended 10/31/17 | | | 21.56 | | | | (0.13 | ) | | | 7.07 | | | | 6.94 | | | | — | | | | 28.50 | | | | 32.19 | | | | 764 | | | | 2.68 | (d) | | | 2.68 | (d) | | | (0.53 | )(d) | | | 56 | |
Year ended 10/31/16 | | | 20.43 | | | | (0.00 | ) | | | 1.16 | | | | 1.16 | | | | (0.03 | ) | | | 21.56 | | | | 5.72 | | | | 1,218 | | | | 2.68 | | | | 2.68 | | | | (0.01 | ) | | | 52 | |
Year ended 10/31/15 | | | 19.35 | | | | 0.02 | | | | 1.06 | | | | 1.08 | | | | — | | | | 20.43 | | | | 5.58 | | | | 2,600 | | | | 2.63 | | | | 2.63 | | | | 0.10 | | | | 130 | |
Year ended 10/31/14 | | | 19.71 | | | | (0.18 | ) | | | (0.14 | ) | | | (0.32 | ) | | | (0.04 | ) | | | 19.35 | | | | (1.61 | ) | | | 5,303 | | | | 2.60 | | | | 2.60 | | | | (0.90 | ) | | | 124 | |
Year ended 10/31/13 | | | 17.39 | | | | (0.05 | ) | | | 2.37 | | | | 2.32 | | | | — | | | | 19.71 | | | | 13.34 | | | | 7,411 | | | | 2.53 | | | | 2.53 | | | | (0.25 | ) | | | 148 | |
Class C | | | | | | | | | | | | | | | | | | | | | | | | | | | | | | | | | | | | | | | | | | | | | | | | |
Year ended 10/31/17 | | | 21.52 | | | | (0.13 | ) | | | 7.06 | | | | 6.93 | | | | — | | | | 28.45 | | | | 32.20 | | | | 13,422 | | | | 2.68 | (d) | | | 2.68 | (d) | | | (0.53 | )(d) | | | 56 | |
Year ended 10/31/16 | | | 20.39 | | | | (0.00 | ) | | | 1.16 | | | | 1.16 | | | | (0.03 | ) | | | 21.52 | | | | 5.73 | | | | 11,879 | | | | 2.68 | | | | 2.68 | | | | (0.01 | ) | | | 52 | |
Year ended 10/31/15 | | | 19.32 | | | | 0.02 | | | | 1.05 | | | | 1.07 | | | | — | | | | 20.39 | | | | 5.54 | | | | 13,922 | | | | 2.63 | | | | 2.63 | | | | 0.10 | | | | 130 | |
Year ended 10/31/14 | | | 19.68 | | | | (0.18 | ) | | | (0.14 | ) | | | (0.32 | ) | | | (0.04 | ) | | | 19.32 | | | | (1.62 | ) | | | 15,978 | | | | 2.60 | | | | 2.60 | | | | (0.90 | ) | | | 124 | |
Year ended 10/31/13 | | | 17.36 | | | | (0.05 | ) | | | 2.37 | | | | 2.32 | | | | — | | | | 19.68 | | | | 13.36 | | | | 21,366 | | | | 2.53 | | | | 2.53 | | | | (0.25 | ) | | | 148 | |
Class Y | | | | | | | | | | | | | | | | | | | | | | | | | | | | | | | | | | | | | | | | | | | | | | | | |
Year ended 10/31/17 | | | 22.26 | | | | 0.12 | | | | 7.27 | | | | 7.39 | | | | (0.21 | ) | | | 29.44 | | | | 33.53 | | | | 11,444 | | | | 1.68 | (d) | | | 1.68 | (d) | | | 0.47 | (d) | | | 56 | |
Year ended 10/31/16 | | | 21.14 | | | | 0.21 | | | | 1.19 | | | | 1.40 | | | | (0.28 | ) | | | 22.26 | | | | 6.77 | | | | 5,216 | | | | 1.68 | | | | 1.68 | | | | 0.99 | | | | 52 | |
Year ended 10/31/15 | | | 19.98 | | | | 0.23 | | | | 1.08 | | | | 1.31 | | | | (0.15 | ) | | | 21.14 | | | | 6.62 | | | | 3,449 | | | | 1.63 | | | | 1.63 | | | | 1.10 | | | | 130 | |
Year ended 10/31/14 | | | 20.36 | | | | 0.02 | | | | (0.13 | ) | | | (0.11 | ) | | | (0.27 | ) | | | 19.98 | | | | (0.62 | ) | | | 4,494 | | | | 1.60 | | | | 1.60 | | | | 0.10 | | | | 124 | |
Year ended 10/31/13 | | | 17.95 | | | | 0.14 | | | | 2.44 | | | | 2.58 | | | | (0.17 | ) | | | 20.36 | | | | 14.43 | | | | 4,531 | | | | 1.53 | | | | 1.53 | | | | 0.75 | | | | 148 | |
Class R5 | | | | | | | | | | | | | | | | | | | | | | | | | | | | | | | | | | | | | | | | | | | | | | | | |
Year ended 10/31/17 | | | 22.28 | | | | 0.16 | | | | 7.28 | | | | 7.44 | | | | (0.26 | ) | | | 29.46 | | | | 33.80 | | | | 72 | | | | 1.50 | (d) | | | 1.50 | (d) | | | 0.65 | (d) | | | 56 | |
Year ended 10/31/16 | | | 21.17 | | | | 0.25 | | | | 1.19 | | | | 1.44 | | | | (0.33 | ) | | | 22.28 | | | | 7.00 | | | | 54 | | | | 1.45 | | | | 1.45 | | | | 1.22 | | | | 52 | |
Year ended 10/31/15 | | | 20.01 | | | | 0.28 | | | | 1.08 | | | | 1.36 | | | | (0.20 | ) | | | 21.17 | | | | 6.88 | | | | 75 | | | | 1.41 | | | | 1.41 | | | | 1.32 | | | | 130 | |
Year ended 10/31/14 | | | 20.38 | | | | 0.06 | | | | (0.14 | ) | | | (0.08 | ) | | | (0.29 | ) | | | 20.01 | | | | (0.46 | ) | | | 104 | | | | 1.39 | | | | 1.39 | | | | 0.31 | | | | 124 | |
Year ended 10/31/13 | | | 17.97 | | | | 0.18 | | | | 2.45 | | | | 2.63 | | | | (0.22 | ) | | | 20.38 | | | | 14.71 | | | | 411 | | | | 1.33 | | | | 1.33 | | | | 0.95 | | | | 148 | |
Class R6 | | | | | | | | | | | | | | | | | | | | | | | | | | | | | | | | | | | | | | | | | | | | | | | | |
Year ended 10/31/17(e) | | | 23.28 | | | | 0.25 | | | | 5.92 | | | | 6.17 | | | | — | | | | 29.45 | | | | 26.50 | | | | 107 | | | | 1.47 | (d)(f) | | | 1.47 | (d)(f) | | | 0.68 | (d)(f) | | | 56 | |
| (a) | Calculated using average shares outstanding. |
| (b) | Includes adjustments in accordance with accounting principles generally accepted in the United States of America and as such, the net asset value for financial reporting purposes and the returns based upon those net asset values may differ from the net asset value and returns for shareholder transactions. Does not include sales charges and is not annualized for periods less than one year, if applicable. |
| (c) | Portfolio turnover is calculated at the fund level and is not annualized for periods less than one year, if applicable. |
| (d) | Ratios are based on average daily net assets (000’s omitted) of $56,524, $1,012, $11,841, $6,818, $60, and $20 for Class A, Class B, Class C, Class Y, Class R5 and Class R6 shares, respectively. |
| (e) | Commencement date of April 4, 2017 for Class R6 shares. |
Note 12—Subsequent Event
On December 1, 2017, the Fund’s Board of Trustees approved the early conversion of the remaining assets in the Fund’s Class B shares into Class A shares to occur on or about January 26, 2018. At the close of business on or about January 26, 2018, (the “Conversion Date”) all outstanding Class B shares of the Fund will be converted to Class A shares of the Fund, which is prior to the date the Class B shares would normally be converted to Class A shares. Once the conversion is completed, Class B shares will be closed and become inactive. No contingent deferred sales charges will be payable in connection with this early conversion. The conversion of the Fund’s Class B shares into Class A shares on the Conversion Date is not expected to be a taxable event for federal income tax purposes, and should not result in the recognition of gain or loss by converting shareholders, although each shareholder should consult with his or her own tax adviser.
21 Invesco Greater China Fund
Report of Independent Registered Public Accounting Firm
To the Board of Trustees of AIM Investment Funds (Invesco Investment Funds)
and Shareholders of Invesco Greater China Fund:
In our opinion, the accompanying statement of assets and liabilities, including the schedule of investments, and the related statements of operations and of changes in net assets and the financial highlights present fairly, in all material respects, the financial position of Invesco Greater China Fund (one of the portfolios constituting the AIM Investment Funds (Invesco Investment Funds), hereafter referred to as the “Fund”) as of October 31, 2017, the results of its operations for the year then ended, the changes in its net assets for each of the two years in the period then ended and the financial highlights for each of the periods indicated therein, in conformity with accounting principles generally accepted in the United States of America. These financial statements and financial highlights (hereafter referred to as “financial statements”) are the responsibility of the Fund’s management. Our responsibility is to express an opinion on these financial statements based on our audits. We conducted our audits of these financial statements in accordance with the standards of the Public Company Accounting Oversight Board (United States). Those standards require that we plan and perform the audit to obtain reasonable assurance about whether the financial statements are free of material misstatement. An audit includes examining, on a test basis, evidence supporting the amounts and disclosures in the financial statements, assessing the accounting principles used and significant estimates made by management, and evaluating the overall financial statement presentation. We believe that our audits, which included confirmation of securities as of October 31, 2017 by correspondence with the custodian and brokers, and when replies were not received from brokers, we performed other auditing procedures, provide a reasonable basis for our opinion.
PricewaterhouseCoopers LLP
Houston, Texas
December 21, 2017
22 Invesco Greater China Fund
Calculating your ongoing Fund expenses
Example
As a shareholder of the Fund, you incur two types of costs: (1) transaction costs, which may include sales charges (loads) on purchase payments or contingent deferred sales charges on redemptions, if any; and (2) ongoing costs, including management fees, distribution and/or service (12b-1) fees, and other Fund expenses. This example is intended to help you understand your ongoing costs (in dollars) of investing in the Fund and to compare these costs with ongoing costs of investing in other mutual funds. The example is based on an investment of $1,000 invested at the beginning of the period and held for the entire period May 1, 2017 through October 31, 2017.
Actual expenses
The table below provides information about actual account values and actual expenses. You may use the information in this table, together with the amount you invested, to estimate the expenses that you paid over the period. Simply divide your account value by $1,000 (for example, an $8,600 account value divided by $1,000 = 8.6), then multiply the result by the number in the table under the heading entitled “Actual Expenses Paid During Period” to estimate the expenses you paid on your account during this period.
Hypothetical example for comparison purposes
The table below also provides information about hypothetical account values and hypothetical expenses based on the Fund’s actual expense ratio and an assumed rate of return of 5% per year before expenses, which is not the Fund’s actual return.
The hypothetical account values and expenses may not be used to estimate the actual ending account balance or expenses you paid for the period. You may use this information to compare the ongoing costs of investing in the Fund and other funds. To do so, compare this 5% hypothetical example with the 5% hypothetical examples that appear in the shareholder reports of the other funds.
Please note that the expenses shown in the table are meant to highlight your ongoing costs only and do not reflect any transaction costs, such as sales charges (loads) on purchase payments or contingent deferred sales charges on redemptions, if any. Therefore, the hypothetical information is useful in comparing ongoing costs only, and will not help you determine the relative total costs of owning different funds. In addition, if these transaction costs were included, your costs would have been higher.
| | | | | | | | | | | | | | | | | | | | | | | | |
| Class | | Beginning
Account Value
(05/01/17) | | | ACTUAL | | | HYPOTHETICAL (5% annual return before expenses) | | | Annualized
Expense
Ratio | |
| | | Ending
Account Value
(10/31/17)1 | | | Expenses
Paid During
Period2 | | | Ending
Account Value
(10/31/17) | | | Expenses
Paid During
Period2 | | |
| A | | $ | 1,000.00 | | | $ | 1,224.00 | | | $ | 10.48 | | | $ | 1,015.78 | | | $ | 9.50 | | | | 1.87 | % |
| B | | | 1,000.00 | | | | 1,219.50 | | | | 14.66 | | | | 1,012.00 | | | | 13.29 | | | | 2.62 | |
| C | | | 1,000.00 | | | | 1,219.50 | | | | 14.66 | | | | 1,012.00 | | | | 13.29 | | | | 2.62 | |
| Y | | | 1,000.00 | | | | 1,225.60 | | | | 9.09 | | | | 1,017.04 | | | | 8.24 | | | | 1.62 | |
| R5 | | | 1,000.00 | | | | 1,227.00 | | | | 8.20 | | | | 1,017.85 | | | | 7.43 | | | | 1.46 | |
| R6 | | | 1,000.00 | | | | 1,226.60 | | | | 8.19 | | | | 1,017.85 | | | | 7.43 | | | | 1.46 | |
| 1 | The actual ending account value is based on the actual total return of the Fund for the period May 1, 2017 through October 31, 2017, after actual expenses and will differ from the hypothetical ending account value which is based on the Fund’s expense ratio and a hypothetical annual return of 5% before expenses. |
| 2 | Expenses are equal to the Fund’s annualized expense ratio as indicated above multiplied by the average account value over the period, multiplied by 184/365 to reflect the most recent fiscal half year. |
23 Invesco Greater China Fund
Approval of Investment Advisory and Sub-Advisory Contracts
The Board of Trustees (the Board) of AIM Investment Funds (Invesco Investment Funds) is required under the Investment Company Act of 1940, as amended, to approve annually the renewal of Invesco Greater China Fund’s (the Fund) investment advisory agreements. During contract renewal meetings held on June 12-13, 2017, the Board as a whole, and the disinterested or “independent” Trustees, who comprise over 75% of the Board, voting separately, approved the continuance for the Fund of the Master Investment Advisory Agreement with Invesco Advisers, Inc. (Invesco Advisers and the investment advisory agreement) and the Master Intergroup Sub-Advisory Contract for Mutual Funds with Invesco Asset Management Deutschland GmbH, Invesco Asset Management Limited, Invesco Asset Management (Japan) Limited, Invesco Hong Kong Limited, Invesco Senior Secured Management, Inc. and Invesco Canada Ltd. (collectively, the Affiliated Sub-Advisers and the sub-advisory contracts) for another year, effective July 1, 2017.
In evaluating the fairness and reasonableness of compensation under the Fund’s investment advisory agreement and sub-advisory contracts, the Board considered, among other things, the factors discussed below. The Board determined that continuation of the Fund’s investment advisory agreement and the sub-advisory contracts is in the best interest of the Fund and its shareholders and that the compensation payable to Invesco Advisers and the Affiliated Sub-Advisers under the agreements is fair and reasonable.
The Board’s Fund Evaluation Process
The Board’s Investments Committee has established three Sub-Committees, which meet throughout the year to review the performance of funds advised by Invesco Advisers (the Invesco Funds). Over the course of each year, the Sub-Committees meet with portfolio managers for their assigned Invesco Funds and other members of management to review the performance, investment objective(s), policies, strategies, limitations and investment risks of these funds. The Board had the benefit of reports from the Sub-Committees and Investments Committee throughout the year in considering approval of the continuance of each Invesco Fund’s investment advisory agreement and sub-advisory contracts for another year.
During the contract renewal process, the Board receives comparative performance and fee data regarding the Invesco Funds prepared by Invesco Advisers and Broadridge Financial Solutions, Inc. (Broadridge), an independent provider of investment company data. The Board also receives an independent written evaluation from the Senior Officer, an officer of the Invesco Funds who reports directly to the independent Trustees. The Senior Officer’s
evaluation is prepared as part of his responsibility to manage the process by which the Invesco Funds’ proposed management fees are negotiated during the annual contract renewal process to ensure they are negotiated in a manner that is at arms’ length and reasonable. In addition to meetings with Invesco Advisers and fund counsel, the independent Trustees also discuss the continuance of the investment advisory agreement and sub-advisory contracts in separate sessions with the Senior Officer and with independent legal counsel.
The Trustees recognized that the advisory fee rates for the Invesco Funds are, in most cases, the result of years of review and negotiation. The Trustees’ deliberations and conclusions in a particular year may be based in part on their deliberations and conclusions regarding these arrangements throughout the year and in prior years. The Trustees’ review and conclusions are based on the comprehensive consideration of all information presented to them and are not the result of any single determinative factor. Moreover, one Trustee may have weighed a particular piece of information or factor differently than another Trustee.
The discussion below is a summary of the Senior Officer’s independent written evaluation with respect to the Fund’s investment advisory agreement as well as a discussion of the material factors and related conclusions that formed the basis for the Board’s approval of the Fund’s investment advisory agreement and sub-advisory contracts. This information is current as of June 13, 2017, and does not reflect consideration of factors that became known to the Board after that date.
Factors and Conclusions and Summary of Independent Written Fee Evaluation
| A. | Nature, Extent and Quality of Services Provided by Invesco Advisers and the Affiliated Sub-Advisers |
The Board reviewed the advisory services provided to the Fund by Invesco Advisers under the Fund’s investment advisory agreement, the performance of Invesco Advisers in providing these services, and the credentials and experience of the officers and employees of Invesco Advisers who provide these services, including the Fund’s portfolio manager or managers. The Board’s review included consideration of Invesco Advisers’ investment process oversight, credit analysis and investment risk management. The Board also considered non-advisory services that Invesco Advisers and its affiliates provide to the Invesco Funds such as various back office support functions, trading operations, internal audit, valuation and legal and compliance.
In determining whether to continue the Fund’s investment advisory agreement, the Board considered the benefits of reapproving an
existing relationship as contrasted with the greater uncertainty that may be associated with entering into a new relationship. The Board concluded that the nature, extent and quality of the services provided to the Fund by Invesco Advisers are appropriate and satisfactory.
The Board reviewed the services that may be provided by the Affiliated Sub-Advisers under the sub-advisory contracts and the credentials and experience of the officers and employees of the Affiliated Sub-Advisers who provide these services. The Board noted that the Affiliated Sub-Advisers have offices and personnel that are located in financial centers around the world. As a result, the Board noted that the Affiliated Sub-Advisers can provide research and investment analysis on the markets and economies of various countries in which the Fund may invest, make recommendations regarding securities and assist with security trades. The Board concluded that the sub-advisory contracts may benefit the Fund and its shareholders by permitting Invesco Advisers to use the resources and talents of the Affiliated Sub-Advisers in managing the Fund. The Board concluded that the nature, extent and quality of the services that may be provided by the Affiliated Sub-Advisers are appropriate and satisfactory.
| B. | Fund Investment Performance |
The Board considered Fund investment performance as a relevant factor in considering whether to approve the investment advisory agreement as well as the sub-advisory contracts for the Fund, as Invesco Hong Kong Limited currently manages assets of the Fund.
The Board compared the Fund’s investment performance over multiple time periods ending December 31, 2016 to the performance of funds in the Broadridge performance universe and against the Lipper China Region Funds Index. The Board noted that performance of Class A shares of the Fund was in the first quintile of its performance universe for the one year period, the second quintile for the three year period and the third quintile for the five year period (the first quintile being the best performing funds and the fifth quintile being the worst performing funds). The Board noted that performance of Class A shares of the Fund was above the performance of the Index for the one, three and five year periods. The Trustees also reviewed more recent Fund performance and this review did not change their conclusions.
| C. | Advisory and Sub-Advisory Fees |
The Board compared the Fund’s contractual management fee rate to the contractual management fee rates of funds in the Fund’s Broadridge expense group at a common asset level. The Board noted that the contractual management fee rate for Class A shares of the Fund was below the median contractual management fee rate of funds in its expense group. The Board noted that the term
24 Invesco Greater China Fund
“contractual management fee” for funds in the expense group may include both advisory and certain administrative services fees, but that Broadridge does not provide information on a fund by fund basis as to what is included. The Board noted that Invesco Advisers does not separately charge the Invesco Funds for the administrative services included in the term as defined by Broadridge. The Board also reviewed the methodology used by Broadridge in providing expense group information, which includes using each fund’s contractual management fee schedule (including any applicable breakpoints) as reported in the most recent prospectus or statement of additional information for each fund in the expense group.
The Board also compared the Fund’s effective advisory fee rate (the advisory fee rate after advisory fee waivers and before other expense limitations/waivers) to the effective advisory fee rates of other funds advised by Invesco Advisers and its affiliates with investment strategies comparable to those of the Fund, based on asset balances as of December 31, 2016. The Board also noted that the Fund’s rate was below rate of two off-shore funds advised by Invesco Advisers.
The Board noted that Invesco Advisers and the Affiliated Sub-Advisers do not manage other client accounts with investment strategies comparable to those of the Fund.
The Board also considered the services that may be provided by the Affiliated Sub-Advisers pursuant to the sub-advisory contracts, as well as the fees payable by Invesco Advisers to the Affiliated Sub-Advisers pursuant to the sub-advisory contracts. The Board noted that Invesco Advisers retains overall responsibility for, and provides services to, sub-advised Invesco Funds, including oversight of the Affiliated Sub-Advisers as well as the additional services described herein other than day-to-day portfolio management. The Board also noted that the sub-advisory fees are not paid directly by the Fund, but rather, are payable by Invesco Advisers to the Affiliated Sub-Advisers.
| D. | Economies of Scale and Breakpoints |
The Board considered the extent to which there are economies of scale in the provision of advisory services to the Fund. The Board also considered that the Fund may benefit from economies of scale through contractual breakpoints in the Fund’s advisory fee schedule. The Board noted that the Fund shares directly in economies of scale through lower fees charged by third party service providers based on the combined size of the Invesco Funds advised by Invesco Advisers.
| E. | Profitability and Financial Resources |
The Board reviewed information from Invesco Advisers concerning the costs of the advisory and other services that Invesco Advisers and its affiliates provide to the Fund and the Invesco Funds and the profitability of Invesco Advisers and its affiliates in providing these services. The Board noted that Invesco Advisers continues to operate at a net profit from services Invesco Advisers and its affiliates provide to the Invesco
Funds and the Fund. The Board did not deem the level of profits realized by Invesco Advisers and its affiliates from providing services to the Fund to be excessive given the nature, quality and extent of the services provided. The Board received and accepted information from Invesco Advisers demonstrating that Invesco Advisers and each Affiliated Sub-Adviser are financially sound and have the resources necessary to perform their obligations under the investment advisory agreement and sub-advisory contracts.
| F. | Collateral Benefits to Invesco Advisers and its Affiliates |
The Board considered various other benefits received by Invesco Advisers and its affiliates from the relationship with the Fund, including the fees received for providing transfer agency and distribution services to the Fund. The Board considered comparative information regarding fees charged for these services, including information provided by Broadridge and other independent sources. The Board considered the performance of Invesco Advisers and its affiliates in providing these services and the organizational structure employed to provide these services. The Board also considered that these services are provided to the Fund pursuant to written contracts that are reviewed and approved on an annual basis by the Board; and that the services are required for the operation of the Fund.
The Board considered the benefits realized by Invesco Advisers and the Affiliated Sub-Advisers as a result of portfolio brokerage transactions executed through “soft dollar” arrangements. The Board noted that soft dollar arrangements may result in the Fund bearing costs to purchase research that may be used by Invesco Advisers or the Affiliated Sub-Advisers with other clients and may reduce Invesco Adviser’s or the Affiliated Sub-Adviser’s expenses. The Board also considered that it receives periodic reports from the Chief Compliance Officer of the Invesco Funds demonstrating that these arrangements are consistent with regulatory requirements. The Board did not deem the soft dollar arrangements to be inappropriate.
The Board considered that the Fund’s uninvested cash and cash collateral from any securities lending arrangements may be invested in money market funds advised by Invesco Advisers pursuant to procedures approved by the Board. The Board noted that Invesco Advisers receives advisory fees from these affiliated money market funds attributable to such investments, although Invesco Advisers has contractually agreed to waive through varying periods the advisory fees payable by the Invesco Funds with respect to certain investments in the affiliated money market funds. The waiver is in an amount equal to 100% of the net advisory fee Invesco Advisers receives from the affiliated money market funds with respect to the Fund’s investment in the affiliated money market funds of uninvested cash, but not cash collateral. The Board concluded that the amount of advisory fees received by Invesco Advisers from the
Fund’s investment of cash collateral from any securities lending arrangements in the affiliated money market funds is fair and reasonable.
The Board also considered that the Fund may use an affiliated broker to execute certain trades for the Fund to, among other things, control information leakage, and was advised that such trades would be executed in compliance with rules under the federal securities laws and consistent with best execution obligations.
25 Invesco Greater China Fund
Tax Information
Form 1099-DIV, Form 1042-S and other year-end tax information provide shareholders with actual calendar year amounts that should be included in their tax returns. Shareholders should consult their tax advisors.
The following distribution information is being provided as required by the Internal Revenue Code or to meet a specific state’s requirement.
The Fund designates the following amounts or, if subsequently determined to be different, the maximum amount allowable for its fiscal year ended October 31, 2017:
| | | | |
Federal and State Income Tax | |
Qualified Dividend Income* | | | 95.46 | % |
Corporate Dividends Received Deduction* | | | 0.06 | % |
U.S. Treasury Obligations* | | | 0.00 | % |
| | * | The above percentages are based on ordinary income dividends paid to shareholders during the Fund’s fiscal year. |
26 Invesco Greater China Fund
Trustees and Officers
The address of each trustee and officer is AIM Investment Funds (Invesco Investment Funds) (the “Trust”), 11 Greenway Plaza, Suite 1000, Houston, Texas 77046-1173. The trustees serve for the life of the Trust, subject to their earlier death, incapacitation, resignation, retirement or removal as more specifically provided in the Trust’s organizational documents. Each officer serves for a one year term or until their successors are elected and qualified. Column two below includes length of time served with predecessor entities, if any.
| | | | | | | | |
Name, Year of Birth and Position(s) Held with the Trust | | Trustee and/
or Officer Since | | Principal Occupation(s)
During Past 5 Years | | Number of
Funds in Fund
Complex
Overseen by
Trustee | | Other Directorship(s)
Held by Trustee During Past 5 Years |
| Interested Persons | | | | | | | | |
| Martin L. Flanagan1 — 1960 Trustee | | 2007 | | Executive Director, Chief Executive Officer and President, Invesco Ltd. (ultimate parent of Invesco and a global investment management firm); Trustee, The Invesco Funds; Vice Chair, Investment Company Institute; and Member of Executive Board, SMU Cox School of Business Formerly: Advisor to the Board, Invesco Advisers, Inc. (formerly known as Invesco Institutional (N.A.), Inc.); Chairman and Chief Executive Officer, Invesco Advisers, Inc. (registered investment adviser); Director, Chairman, Chief Executive Officer and President, Invesco Holding Company (US), Inc. (formerly IVZ Inc.) (holding company), Invesco Group Services, Inc. (service provider) and Invesco North American Holdings, Inc. (holding company); Director, Chief Executive Officer and President, Invesco Holding Company Limited (parent of Invesco and a global investment management firm); Director, Invesco Ltd.; Chairman, Investment Company Institute and President, Co-Chief Executive Officer, Co-President, Chief Operating Officer and Chief Financial Officer, Franklin Resources, Inc. (global investment management organization) | | 158 | | None |
Philip A. Taylor2 — 1954 Trustee and Senior Vice President | | 2006 | | Head of the Americas and Senior Managing Director, Invesco Ltd.; Director, Invesco Advisers, Inc. (formerly known as Invesco Institutional (N.A.), Inc.) (registered investment adviser); Director, Chairman, Chief Executive Officer and President, Invesco Management Group, Inc. (formerly known as Invesco Aim Management Group, Inc.) (financial services holding company); Director and Chairman, Invesco Investment Services, Inc. (formerly known as Invesco Aim Investment Services, Inc.) (registered transfer agent); Chief Executive Officer, Invesco Corporate Class Inc. (corporate mutual fund company); Director, Chairman and Chief Executive Officer, Invesco Canada Ltd. (formerly known as Invesco Trimark Ltd./Invesco Trimark Ltèe) (registered investment adviser and registered transfer agent); Trustee and Senior Vice President, The Invesco Funds; Director, Invesco Investment Advisers LLC (formerly known as Van Kampen Asset Management). Formerly: Co-Chairman, Co-President and Co-Chief Executive Officer, Invesco Advisers, Inc. (formerly known as Invesco Institutional (N.A.), Inc.) (registered investment adviser); Director, Chief Executive Officer and President, Van Kampen Exchange Corp; President and Principal Executive Officer, The Invesco Funds (other than AIM Treasurer’s Series Trust (Invesco Treasurer’s Series Trust), Short-Term Investments Trust and Invesco Management Trust); Executive Vice President, The Invesco Funds (AIM Treasurer’s Series Trust (Invesco Treasurer’s Series Trust), Short-Term Investments Trust and Invesco Management Trust only); Director and President, INVESCO Funds Group, Inc. (registered investment adviser and registered transfer agent); Director and Chairman, IVZ Distributors, Inc. (formerly known as INVESCO Distributors, Inc.) (registered broker dealer); Director, President and Chairman, Invesco Inc. (holding company), Invesco Canada Holdings Inc. (holding company), Trimark Investments Ltd./Placements Trimark Ltèe and Invesco Financial Services Ltd/Services Financiers Invesco Ltèe; Chief Executive Officer, Invesco Canada Fund Inc. (corporate mutual fund company); Director and Chairman, Van Kampen Investor Services Inc.; Director, Chief Executive Officer and President, 1371 Preferred Inc. (holding company) and Van Kampen Investments Inc.; Director and President, AIM GP Canada Inc. (general partner for limited partnerships) and Van Kampen Advisors, Inc.; Director and Chief Executive Officer, Invesco Trimark Dealer Inc. (registered broker dealer); Director, Invesco Distributors, Inc. (formerly known as Invesco Aim Distributors, Inc.) (registered broker dealer); Manager, Invesco PowerShares Capital Management LLC; Director, Chief Executive Officer and President, Invesco Advisers, Inc.; Director, Chairman, Chief Executive Officer and President, Invesco Aim Capital Management, Inc.; President, Invesco Trimark Dealer Inc. and Invesco Trimark Ltd./Invesco Trimark Ltèe; Director and President, AIM Trimark Corporate Class Inc. and AIM Trimark Canada Fund Inc.; Senior Managing Director, Invesco Holding Company Limited; Director and Chairman, Fund Management Company (former registered broker dealer); President and Principal Executive Officer, The Invesco Funds (AIM Treasurer’s Series Trust (Invesco Treasurer’s Series Trust), and Short-Term Investments Trust only); President, AIM Trimark Global Fund Inc. and AIM Trimark Canada Fund Inc. | | 158 | | None |
| 1 | Mr. Flanagan is considered an interested person (within the meaning of Section 2(a)(19) of the 1940 Act) of the Trust because he is an officer of the Adviser to the Trust, and an officer and a director of Invesco Ltd., ultimate parent of the Adviser. |
| 2 | Mr. Taylor is considered an interested person (within the meaning of Section 2(a)(19) of the 1940 Act) of the Trust because he is an officer and a director of the Adviser. |
T-1 Invesco Greater China Fund
Trustees and Officers—(continued)
| | | | | | | | |
Name, Year of Birth and Position(s) Held with the Trust | | Trustee and/
or Officer Since | | Principal Occupation(s) During Past 5 Years | | Number of
Funds in Fund
Complex
Overseen by
Trustee | | Other Directorship(s)
Held by Trustee During Past 5 Years |
| Independent Trustees | | | | | | | | |
Bruce L. Crockett — 1944 Trustee and Chair | | 2001 | | Chairman, Crockett Technologies Associates (technology consulting company) Formerly: Director, Captaris (unified messaging provider); Director, President and Chief Executive Officer, COMSAT Corporation; Chairman, Board of Governors of INTELSAT (international communications company); ACE Limited (insurance company); Independent Directors Council and Investment Company Institute: Member of the Audit Committee, Investment Company Institute; Member of the Executive Committee and Chair of the Governance Committee, Independent Directors Council | | 158 | | Director and Chairman of the Audit Committee, ALPS (Attorneys Liability Protection Society) (insurance company); Director and Member of the Audit Committee, Ferroglobe PLC (metallurgical company) |
David C. Arch — 1945 Trustee | | 2010 | | Chairman of Blistex Inc. (consumer health care products manufacturer); Member, World Presidents’ Organization | | 158 | | Board member of the Illinois Manufacturers’ Association |
James T. Bunch — 1942 Trustee | | 2003 | | Managing Member, Grumman Hill Group LLC (family office/private equity investments) Formerly: Chairman of the Board, Denver Film Society; Chairman of the Board of Trustees, Evans Scholarship Foundation; Chairman, Board of Governors, Western Golf Association | | 158 | | Trustee, Evans Scholarship Foundation |
Jack M. Fields — 1952 Trustee | | 2001 | | Chief Executive Officer, Twenty First Century Group, Inc. (government affairs company); and Discovery Learning Alliance (non-profit) Formerly: Owner and Chief Executive Officer, Dos Angeles Ranch L.P. (cattle, hunting, corporate entertainment); Director, Insperity, Inc. (formerly known as Administaff) (human resources provider); Chief Executive Officer, Texana Timber LP (sustainable forestry company); Director of Cross Timbers Quail Research Ranch (non-profit); and member of the U.S. House of Representatives | | 158 | | None |
Cynthia Hostetler — 1962 Trustee | | 2017 | | Non-Executive Director and Trustee of a number of public and private business corporations Formerly: Head of Investment Funds and Private Equity, Overseas Private Investment Corporation; President, First Manhattan Bancorporation, Inc.; Attorney, Simpson Thacher & Bartlett LLP | | 158 | | Vulcan Materials Company (construction materials company); Trilinc Global Impact Fund; Aberdeen Investment Funds (4 portfolios); Artio Global Investment LLC (mutual fund complex); Edgen Group, Inc. (specialized energy and infrastructure products distributor) |
Eli Jones — 1961 Trustee | | 2016 | | Professor and Dean, Mays Business School — Texas A&M University Formerly: Professor and Dean, Walton College of Business, University of Arkansas and E.J. Ourso College of Business, Louisiana State University; Director, Arvest Bank | | 158 | | Insperity, Inc. (formerly known as Administaff) (human resources provider) |
Prema Mathai-Davis — 1950 Trustee | | 2001 | | Retired. Formerly: Chief Executive Officer, YWCA of the U.S.A. | | 158 | | None |
Teresa M. Ressel — 1962 Trustee | | 2017 | | Non-executive director and trustee of a number of public and private business corporations Formerly: Chief Financial Officer, Olayan America, The Olayan Group (international investor/commercial/industrial); Chief Executive Officer, UBS Securities LLC; Group Chief Operating Officer, Americas, UBS AG; Assistant Secretary for Management & Budget and CFO, US Department of the Treasury; Chief Compliance Officer, Kaiser Permanente (healthcare consortium); Program Manager, Hewlett-Packard; Nuclear Engineering, General Dynamics Corporation (aerospace and defense company) | | 158 | | Atlantic Power Corporation (power generation company); ON Semiconductor Corp. (semiconductor supplier) |
Larry Soll — 1942 Trustee | | 2003 | | Retired. Formerly: Chairman, Chief Executive Officer and President, Synergen Corp. (a biotechnology company) | | 158 | | None |
Ann Barnett Stern — 1957 Trustee | | 2017 | | President and Chief Executive Officer, Houston Endowment Inc. (private philanthropic institution) Formerly: Executive Vice President and General Counsel, Texas Children’s Hospital; Attorney, Beck, Redden and Secrest, LLP; Business Law Instructor, University of St. Thomas; Attorney, Andrews & Kurth LLP | | 158 | | Federal Reserve Bank of Dallas |
Raymond Stickel, Jr. — 1944 Trustee | | 2005 | | Retired. Formerly: Director, Mainstay VP Series Funds, Inc. (25 portfolios); Partner, Deloitte & Touche | | 158 | | None |
Robert C. Troccoli — 1949 Trustee | | 2016 | | Adjunct Professor, University of Denver — Daniels College of Business Formerly: Senior Partner, KPMG LLP | | 158 | | None |
T-2 Invesco Greater China Fund
Trustees and Officers—(continued)
| | | | | | | | |
Name, Year of Birth and Position(s) Held with the Trust | | Trustee and/
or Officer Since | | Principal Occupation(s) During Past 5 Years | | Number of
Funds in Fund
Complex
Overseen by
Trustee | | Other Directorship(s)
Held by Trustee During Past 5 Years |
| Independent Trustees—(continued) |
Christopher L. Wilson — 1957 Trustee | | 2017 | | Managing Partner, CT2, LLC (investing and consulting firm) Formerly: President/Chief Executive Officer, Columbia Funds, Bank of America Corporation; President/Chief Executive Officer, CDC IXIS Asset Management Services, Inc.; Principal & Director of Operations, Scudder Funds, Scudder, Stevens & Clark, Inc.; Assistant Vice President, Fidelity Investments | | 158 | | TD Asset Management USA Inc. (mutual fund complex) (22 portfolios); ISO New England, Inc. (non-profit organization managing regional electricity market) |
| Other Officers | | | | | | | | |
Sheri Morris — 1964 President, Principal Executive Officer and Treasurer | | 1999 | | President, Principal Executive Officer and Treasurer, The Invesco Funds; Vice President, Invesco Advisers, Inc. (formerly known as Invesco Institutional (N.A.), Inc.) (registered investment adviser); and Vice President, PowerShares Exchange-Traded Fund Trust, PowerShares Exchange-Traded Fund Trust II, PowerShares India Exchange-Traded Fund Trust, PowerShares Actively Managed Exchange-Traded Fund Trust and PowerShares Actively Managed Exchange-Traded Commodity Fund Trust Formerly: Vice President and Principal Financial Officer, The Invesco Funds; Vice President, Invesco Aim Advisers, Inc., Invesco Aim Capital Management, Inc. and Invesco Aim Private Asset Management, Inc.; Assistant Vice President and Assistant Treasurer, The Invesco Funds and Assistant Vice President, Invesco Advisers, Inc., Invesco Aim Capital Management, Inc. and Invesco Aim Private Asset Management, Inc.; and Treasurer, PowerShares Exchange-Traded Fund Trust, PowerShares Exchange-Traded Fund Trust II, PowerShares India Exchange-Traded Fund Trust and PowerShares Actively Managed Exchange-Traded Fund Trust | | N/A | | N/A |
Russell C. Burk — 1958 Senior Vice President and Senior Officer | | 2005 | | Senior Vice President and Senior Officer, The Invesco Funds | | N/A | | N/A |
John M. Zerr — 1962 Senior Vice President, Chief Legal Officer and Secretary | | 2006 | | Director, Senior Vice President, Secretary and General Counsel, Invesco Management Group, Inc. (formerly known as Invesco AIM Management Group, Inc.); Senior Vice President, Invesco Advisers, Inc. (formerly known as Invesco Institutional (N.A.), Inc.) (registered investment adviser); Senior Vice President and Secretary, Invesco Distributors, Inc. (formerly known as Invesco AIM Distributors, Inc.); Director, Vice President and Secretary, Invesco Investment Services, Inc. (formerly known as Invesco AIM Investment Services, Inc.) Senior Vice President, Chief Legal Officer and Secretary, The Invesco Funds; Managing Director, Invesco PowerShares Capital Management LLC; Director, Secretary and General Counsel, Invesco Investment Advisers LLC (formerly known as Van Kampen Asset Management); Secretary and General Counsel, Invesco Capital Markets, Inc. (formerly known as Van Kampen Funds Inc.) and Chief Legal Officer, PowerShares Exchange-Traded Fund Trust, PowerShares Exchange-Traded Fund Trust II, PowerShares India Exchange-Traded Fund Trust, PowerShares Actively Managed Exchange-Traded Fund Trust and PowerShares Actively Managed Exchange-Traded Commodity Fund Trust; Manager and Secretary, Invesco Indexing LLC Formerly: Director, Secretary, General Counsel and Senior Vice President, Van Kampen Exchange Corp.; Director, Vice President and Secretary, IVZ Distributors, Inc. (formerly known as INVESCO Distributors, Inc.); Director and Vice President, INVESCO Funds Group, Inc.; Director and Vice President, Van Kampen Advisors Inc.; Director, Vice President, Secretary and General Counsel, Van Kampen Investor Services Inc.; Director, Invesco Distributors, Inc. (formerly known as Invesco AIM Distributors, Inc.); Director, Senior Vice President, General Counsel and Secretary, Invesco AIM Advisers, Inc. and Van Kampen Investments Inc.; Director, Vice President and Secretary, Fund Management Company; Director, Senior Vice President, Secretary, General Counsel and Vice President, Invesco AIM Capital Management, Inc.; Chief Operating Officer and General Counsel, Liberty Ridge Capital, Inc. (an investment adviser); Vice President and Secretary, PBHG Funds (an investment company) and PBHG Insurance Series Fund (an investment company); Chief Operating Officer, General Counsel and Secretary, Old Mutual Investment Partners (a broker-dealer); General Counsel and Secretary, Old Mutual Fund Services (an administrator) and Old Mutual Shareholder Services (a shareholder servicing center); Executive Vice President, General Counsel and Secretary, Old Mutual Capital, Inc. (an investment adviser); and Vice President and Secretary, Old Mutual Advisors Funds (an investment company) | | N/A | | N/A |
Gregory G. McGreevey — 1962 Senior Vice President | | 2012 | | Senior Managing Director, Invesco Ltd.; Director, Chairman, President, and Chief Executive Officer, Invesco Advisers, Inc. (formerly known as Invesco Institutional (N.A.), Inc.) (registered investment adviser); Senior Vice President, Invesco Management Group, Inc.; Director, Invesco Mortgage Capital, Inc. and Invesco Senior Secured Management, Inc.; and Senior Vice President, The Invesco Funds Formerly: Assistant Vice President, The Invesco Funds | | N/A | | N/A |
T-3 Invesco Greater China Fund
Trustees and Officers—(continued)
| | | | | | | | |
Name, Year of Birth and Position(s) Held with the Trust | | Trustee and/
or Officer Since | | Principal Occupation(s) During Past 5 Years | | Number of
Funds in Fund
Complex
Overseen by
Trustee | | Other Directorship(s)
Held by Trustee During Past 5 Years |
| Other Officers—(continued) | | | | | | | | |
Kelli Gallegos — 1970 Vice President, Principal Financial Officer and Assistant Treasurer | | 2008 | | Vice President, Principal Financial Officer and Assistant Treasurer, The Invesco Funds; Assistant Treasurer, Invesco PowerShares Capital Management LLC, PowerShares Exchange-Traded Fund Trust, PowerShares Exchange-Traded Fund Trust II, PowerShares India Exchange-Traded Fund Trust, PowerShares Actively Managed Exchange-Traded Fund Trust and PowerShares Actively Managed Exchange-Traded Commodity Fund Trust Formerly: Assistant Vice President, The Invesco Funds | | N/A | | N/A |
Tracy Sullivan — 1962 Vice President, Chief Tax Officer and Assistant Treasurer | | 2008 | | Vice President, Chief Tax Officer and Assistant Treasurer, The Invesco Funds; Assistant Treasurer, Invesco PowerShares Capital Management LLC, PowerShares Exchange-Traded Fund Trust, PowerShares Exchange-Traded Fund Trust II, PowerShares India Exchange-Traded Fund Trust, PowerShares Actively Managed Exchange-Traded Fund Trust and PowerShares Actively Managed Exchange-Traded Commodity Fund Trust Formerly: Assistant Vice President, The Invesco Funds | | N/A | | N/A |
Crissie M. Wisdom — 1969 Anti-Money Laundering Compliance Officer | | 2013 | | Anti-Money Laundering Compliance Officer, Invesco Advisers, Inc. (formerly known as Invesco Institutional (N.A.), Inc.) (registered investment adviser), Invesco Capital Markets, Inc. (formerly known as Van Kampen Funds Inc.), Invesco Distributors, Inc., Invesco Investment Services, Inc., Invesco Management Group, Inc., The Invesco Funds, and PowerShares Exchange-Traded Fund Trust, PowerShares Exchange-Traded Fund Trust II, PowerShares India Exchange-Traded Fund Trust, PowerShares Actively Managed Exchange-Traded Fund Trust and PowerShares Actively Managed Exchange-Traded Commodity Fund Trust; Anti-Money Laundering Compliance Officer and Bank Secrecy Act Officer, INVESCO National Trust Company and Invesco Trust Company; and Fraud Prevention Manager and Controls and Risk Analysis Manager for Invesco Investment Services, Inc. Formerly: Anti-Money Laundering Compliance Officer, Van Kampen Exchange Corp. | | N/A | | N/A |
Robert R. Leveille — 1969 Chief Compliance Officer | | 2016 | | Chief Compliance Officer, Invesco Advisers, Inc. (registered investment adviser); and Chief Compliance Officer, The Invesco Funds Formerly: Chief Compliance Officer, Putnam Investments and the Putnam Funds | | N/A | | N/A |
The Statement of Additional Information of the Trust includes additional information about the Fund’s Trustees and is available upon request, without charge, by calling 1.800.959.4246. Please refer to the Fund’s Statement of Additional Information for information on the Fund’s sub-advisers.
| | | | | | |
Office of the Fund 11 Greenway Plaza, Suite 1000 Houston, TX 77046-1173 | | Investment Adviser Invesco Advisers, Inc. 1555 Peachtree Street, N.E. Atlanta, GA 30309 | | Distributor Invesco Distributors, Inc. 11 Greenway Plaza, Suite 1000 Houston, TX 77046-1173 | | Auditors PricewaterhouseCoopers LLP 1000 Louisiana Street, Suite 5800 Houston, TX 77002-5678 |
| | | |
| | | | | | |
Counsel to the Fund Stradley Ronon Stevens & Young, LLP 2005 Market Street, Suite 2600 Philadelphia, PA 19103-7018 | | Counsel to the Independent Trustees Goodwin Procter LLP 901 New York Avenue, N.W. Washington, D.C. 20001 | | Transfer Agent Invesco Investment Services, Inc. 11 Greenway Plaza, Suite 1000 Houston, TX 77046-1173 | | Custodian State Street Bank and Trust Company 225 Franklin Street Boston, MA 02110-2801 |
T-4 Invesco Greater China Fund
Explore High-Conviction Investing with Invesco

Go paperless with eDelivery
Visit invesco.com/edelivery to enjoy the convenience and security of anytime electronic access to your investment documents.
With eDelivery, you can elect to have any or all of the following materials delivered straight to your inbox to download, save and print from your own computer:
| ∎ | | Fund reports and prospectuses |
Invesco mailing information
Send general correspondence to Invesco Investment Services, Inc., P.O. Box 219078, Kansas City, MO 64121-9078.
Important notice regarding delivery of security holder documents
To reduce Fund expenses, only one copy of most shareholder documents may be mailed to shareholders with multiple accounts at the same address (Householding). Mailing of your shareholder documents may be householded indefinitely unless you instruct us otherwise. If you do not want the mailing of these documents to be combined with those for other members of your household, please contact Invesco Investment Services, Inc. at 800 959 4246 or contact your financial institution. We will begin sending you individual copies for each account within 30 days after receiving your request.
Fund holdings and proxy voting information
The Fund provides a complete list of its holdings four times in each fiscal year, at the quarter ends. For the second and fourth quarters, the lists appear in the Fund’s semiannual and annual reports to shareholders. For the first and third quarters, the Fund files the lists with the Securities and Exchange Commission (SEC) on Form N-Q. The most recent list of portfolio holdings is available at invesco.com/completeqtrholdings. Shareholders can also look up the Fund’s Forms N-Q on the SEC website at sec.gov. Copies of the Fund’s Forms N-Q may be reviewed and copied at the SEC Public Reference Room in Washington, D.C. You can obtain information on the operation of the Public Reference Room, including information about duplicating fee charges, by calling 202 551 8090 or 800 732 0330, or by electronic request at the following email address: publicinfo@sec.gov. The SEC file numbers for the Fund are shown below.
A description of the policies and procedures that the Fund uses to determine how to vote proxies relating to portfolio securities is available without charge, upon request, from our Client Services department at 800 959 4246 or at invesco.com/proxyguidelines. The information is also available on the SEC website, sec.gov.
| | |
Information regarding how the Fund voted proxies related to its portfolio securities during the most recent 12-month period ended June 30 is available at invesco.com/proxysearch. The information is also available on the SEC website, sec.gov. Invesco Advisers, Inc. is an investment adviser; it provides investment advisory services to individual and institutional clients and does not sell securities. Invesco Distributors, Inc. is the US distributor for Invesco Ltd.’s retail mutual funds, exchange-traded funds and institutional money market funds. Both are wholly owned, indirect subsidiaries of Invesco Ltd. | |  |
| | | | | | | | |
| SEC file numbers: 811-05426 and 033-19338 | | Invesco Distributors, Inc. | | CHI-AR-1 | | 12122017 | | 0940 |
Letters to Shareholders
| | | | |

Philip Taylor | | | | Dear Shareholders: This annual report includes information about your Fund, including performance data and a complete list of its investments as of the close of the reporting period. Inside is a discussion of how your Fund was managed and the factors that affected its performance during the reporting period. American voters went to the polls just days after the start of the reporting period, and their decisions quickly affected markets. The US stock market rallied strongly after the election, with major market indexes rising, and setting record highs, throughout the reporting period. Generally positive economic data, strong corporate earnings and hope for tax and regulatory reform contributed to the rally. US and global bond markets, as well as emerging market equities, sold off immediately following the election – with the US bond market eventually recovering most of its losses. Overseas, economic data were mixed, prompting the European |
Central Bank and central banks in China and Japan, among other countries, to maintain extraordinarily accommodative monetary policies. Citing positive economic trends – specifically, realized and expected labor market conditions and inflation – the US Federal Reserve raised interest rates three times during the reporting period: first in December 2016, and then again in March and June 2017. Health care and tax reform proved to be more difficult than expected to enact, with little progress achieved by the end of the reporting period.
Short-term market volatility can prompt some investors to abandon their investment plans – and can cause others to settle for whatever returns the market has to offer. The investment professionals at Invesco, in contrast, invest with high conviction. This means that, no matter the asset class or the strategy, each investment team has a passion to exceed. We want to help investors achieve better outcomes, such as seeking higher returns, helping mitigate risk and generating income. Of course, investing with high conviction can’t guarantee a profit or ensure success; no investment strategy can. To learn more about how we invest with high conviction, visit invesco.com/HighConviction.
You, too, can invest with high conviction by maintaining a long-term investment perspective and by working with your financial adviser on a regular basis. During periods of short-term market volatility or uncertainty, your financial adviser can keep you focused on your long-term investment goals – a new home, a child’s college education or a secure retirement. He or she also can share research about the economy, the markets and individual investment options.
Visit our website for more information on your investments
Our website, invesco.com/us, offers a wide range of market insights and investment perspectives. On the website, you’ll find detailed information about our funds, including performance, holdings and portfolio manager commentaries. You can access information about your account by completing a simple, secure online registration. To do so, select “Log In” on the right side of the homepage, and then select “Register for Individual Account Access.”
In addition to the resources accessible on our website and through our mobile app, you can obtain timely updates to help you stay informed about the markets and the economy by connecting with Invesco on Twitter, LinkedIn or Facebook. You can access our blog at blog.invesco.us.com. Our goal is to provide you the information you want, when and where you want it.
Finally, I’m pleased to share with you Invesco’s commitment to both the Principles for Responsible Investment and to considering environmental, social and governance issues in our robust investment process. I invite you to learn more at invesco.com/esg.
Have questions?
For questions about your account, contact an Invesco client services representative at 800 959 4246. For Invesco-related questions or comments, please email me directly at phil@invesco.com.
All of us at Invesco look forward to serving your investment management needs. Thank you for investing with us.
Sincerely,

Philip Taylor
Senior Managing Director, Invesco Ltd.
2 Invesco Long/Short Equity Fund
| | | | |

Bruce Crockett | | | | Dear Fellow Shareholders: Among the many important lessons I’ve learned in more than 40 years in a variety of business endeavors is the value of a trusted advocate. As independent chair of the Invesco Funds Board, I can assure you that the members of the Board are strong advocates for the interests of investors in Invesco’s mutual funds. We work hard to represent your interests through oversight of the quality of the investment management services your funds receive and other matters important to your investment, including but not limited to: ∎ Ensuring that Invesco offers a diverse lineup of mutual funds that your financial adviser can use to strive to meet your financial needs as your investment goals change over time. ∎ Monitoring how the portfolio management teams of the Invesco funds are performing in light of changing economic and market conditions. |
| ∎ | Assessing each portfolio management team’s investment performance within the context of the investment strategy described in the fund’s prospectus. |
| ∎ | Monitoring for potential conflicts of interests that may impact the nature of the services that your funds receive. |
We believe one of the most important services we provide our fund shareholders is the annual review of the funds’ advisory and sub-advisory contracts with Invesco Advisers and its affiliates. This review is required by the Investment Company Act of 1940 and focuses on the nature and quality of the services Invesco provides as the adviser to the Invesco funds and the reasonableness of the fees that it charges for those services. Each year, we spend months carefully reviewing information received from Invesco and a variety of independent sources, such as performance and fee data prepared by Lipper, Inc. (a subsidiary of Broadridge Financial Solutions, Inc.), an independent, third-party firm widely recognized as a leader in its field. We also meet with our independent legal counsel and other independent advisers to review and help us assess the information that we have received. Our goal is to assure that you receive quality investment management services for a reasonable fee.
I trust the measures outlined above provide assurance that you have a worthy advocate when it comes to choosing the Invesco Funds.
As always, please contact me at bruce@brucecrockett.com with any questions or concerns you may have. On behalf of the Board, we look forward to continuing to represent your interests and serving your needs.
Sincerely,

Bruce L. Crockett
Independent Chair
Invesco Funds Board of Trustees
3 Invesco Long/Short Equity Fund
Management’s Discussion of Fund Performance
Performance summary
For the fiscal year ended October 31, 2017, Class A shares of Invesco Long/Short Equity Fund (the Fund), at net asset value (NAV), outperformed the S&P 500 Index and the Citi US Three-Month Treasury Bill Index, the Fund’s broad market and style-specific benchmarks, respectively.
Your Fund’s long-term performance appears later in this report.
Fund vs. Indexes
Total returns, 10/31/16 to 10/31/17, at net asset value (NAV). Performance shown does not include applicable contingent deferred sales charges (CDSC) or front-end sales charges, which would have reduced performance.
| | | | | |
| Class A Shares | | | | 26.62 | % |
| Class C Shares | | | | 25.65 | |
| Class R Shares | | | | 26.37 | |
| Class Y Shares | | | | 26.85 | |
| Class R5 Shares | | | | 27.07 | |
| Class R6 Shares | | | | 27.17 | |
| S&P 500 Index▼ (Broad Market Index) | | | | 23.63 | |
| Citi US Three-Month Treasury Bill Index▼ (Style-Specific Index) | | | | 0.71 | |
| Lipper Alternative Long/Short Equity Funds Index∎ (Peer Group Index) | | | | 9.01 | |
Source(s):▼Factset Research Systems Inc., ∎Lipper Inc. | | | | | |
Market conditions and your Fund
Despite highly destructive hurricanes that threatened to derail a years-long recovery, the US economy continued to expand throughout the fiscal year ended October 31, 2017. Gross domestic product (GDP) – the value of all goods and services produced in the US – grew by 1.8% in the fourth quarter of 2016, and by 1.2% in the first quarter and 3.1% in the second quarter of 2017.1 Inflation remained subdued even as the labor market continued to strengthen.
Unemployment continued its multi-year decline, hitting just 4.2% in September – a 16-year low.2
Given signs of an improving economy, the US Federal Reserve (the Fed) raised interest rates three times during the reporting period, most recently in June 2017.3 The Fed pledged that “realized and expected economic conditions relative to its objectives of maximum employment and 2 percent inflation” will guide its future actions. At the close of the reporting period, Fed policy remained accommodative, and the fed funds target
rate stood at a range of 1.00% to 1.25% – up 75 basis points for the reporting period.3 (A basis point is 0.01%.)
Despite the Fed’s actions, major US stock market indexes repeatedly hit all-time highs throughout the reporting period. The stock market rally began immediately following the outcome of the US presidential election in November 2016, based on investors’ hopes for reduced regulation, lowered corporate and personal tax rates and increased infrastructures pending. The stock market rally continued throughout the reporting period, fueled by generally positive economic data, strong corporate earnings and improved consumer confidence – even as the prospect for health care and tax reform faded somewhat.
As part of our investment process, we evaluate fundamental and behavioral factors to forecast individual securities’ returns and risks and rank these securities based on their attractiveness relative to industry peers. The Fund generally maintains a net long bias and implements its strategy by purchasing what we consider to be highly-ranked stocks as long positions, and selling short what we consider to be poorly-ranked stocks within their respective industries. The Fund seeks to add value primarily from stock selection and secondarily by dynamically changing the level of its beta, or market exposure based upon predicted levels of risk in the equity markets. Additionally, the Fund’s net long market position may result in net
| | | | | |
| Total Net Assets | | | | $73.8 million | |
Data presented here are as of October 31, 2017.
| | | | | | | | | | | | | | | | | | | | |
| Portfolio Composition | | | | | | | | |
| By sector, based on total net assets | | | | |
| | | Equity Securities | | | | |
| | | Long1 | | Short2 | | Gross Exposure3 | | Net Exposure4 |
Financials | | | | 33.0 | % | | | | 15.7 | % | | | | 48.7 | % | | | | 17.3 | % |
Health Care | | | | 32.7 | | | | | 7.0 | | | | | 39.7 | | | | | 25.7 | |
Consumer Discretionary | | | | 30.7 | | | | | 27.5 | | | | | 58.2 | | | | | 3.2 | |
Information Technology | | | | 28.2 | | | | | 7.1 | | | | | 35.3 | | | | | 21.1 | |
Energy | | | | 17.3 | | | | | 9.5 | | | | | 26.8 | | | | | 7.8 | |
Industrials | | | | 16.3 | | | | | 19.5 | | | | | 35.8 | | | | | -3.2 | |
Materials | | | | 11.3 | | | | | 6.4 | | | | | 17.7 | | | | | 4.9 | |
Real Estate | | | | 9.9 | | | | | 3.8 | | | | | 13.7 | | | | | 6.1 | |
Utilities | | | | 7.5 | | | | | – | | | | | 7.5 | | | | | 7.5 | |
Consumer Staples | | | | 6.3 | | | | | 2.9 | | | | | 9.2 | | | | | 3.4 | |
Telecommunication Services | | | | 0.5 | | | | | – | | | | | 0.5 | | | | | 0.5 | |
Money Market Funds Plus Other Assets Less Liabilities | | | | 5.7 | | | | | – | | | | | 5.7 | | | | | 5.7 | |
Total | | | | 199.4 | | | | | 99.4 | | | | | 298.8 | | | | | 100.0 | |
| 1 | Represents the value of equity securities in the portfolio and the equity securities underlying the Fund’s equity long portfolio swap. | |
| 2 | Represents the value of the equity securities underlying the Fund’s equity short portfolio swap. | |
| 3 | Represents the cumulative exposure of the Fund’s long and short positions. | |
| 4 | Represents the net exposure of the Fund’s long and short positions. | |
4 Invesco Long/Short Equity Fund
long/net short exposure in sectors where there is an imbalance between highly-ranked and poorly-ranked stocks. In a long/short construct, a positive spread between the top-and bottom-ranked stocks (long and short candidates for the portfolio), plus a return from market/sector exposure, is intended to result in the Fund achieving attractive risk-adjusted performance relative to its broad market benchmark over a full market cycle.
During the fiscal year, Fund performance relative to the broad market benchmark benefited most from a positive long/short spread in eight of 11 sectors with both long and short holdings adding value. Relative Fund performance was led by stock selection in the information technology (IT), financials and industrials sectors. Stock selection in the energy and materials sectors detracted from the Fund’s absolute and relative performance for the reporting period.
The top-contributing sector to Fund performance was the financials sector. Within this sector, the Fund benefited from a meaningful net long allocation and positive results from long holdings in the banking and diversified financials industries. The Fund also benefited from a net long allocation in the IT sector and stock selection in the semiconductor industry. Long holdings within the industrials sector, specifically the capital goods industry, also contributed to Fund performance for the reporting period.
Holdings within the energy sector, particularly the long positions in the oil and gas exploration and production industry, performed poorly during the reporting period. Within the materials sector, both long and short holdings underperformed our expectations and detracted from Fund returns.
At the end of the reporting period, the Fund’s largest net long sector allocations were in the health care, financials and IT sectors. The Fund did not have any sectors with net short positions.
Please note that the Fund may utilize derivative instruments that include equity total return swaps and futures contracts. During the reporting period, the Fund utilized equity total return swaps to efficiently implement its strategy, but did not use futures contracts. The implementation impact of using equity total return swaps is a component of transaction costs. Derivatives may amplify traditional investment risks through the creation of leverage and may be less liquid than traditional securities.
Thank you for your investment in Invesco Long/Short Equity Fund.
| 1 | Source: Bureau of Economic Analysis |
| 2 | Sources: Bureau of Labor Statistics, Bloomberg |
| 3 | Source: US Federal Reserve |
The views and opinions expressed in management’s discussion of Fund performance are those of Invesco Advisers, Inc. These views and opinions are subject to change at any time based on factors such as market and economic conditions. These views and opinions may not be relied upon as investment advice or recommendations, or as an offer for a particular security. The information is not a complete analysis of every aspect of any market, country, industry, security or the Fund. Statements of fact are from sources considered reliable, but Invesco Advisers, Inc. makes no representation or warranty as to their completeness or accuracy. Although historical performance is no guarantee of future results, these insights may help you understand our investment management philosophy.
See important Fund and, if applicable, index disclosures later in this report.
| | |
 | | Michael Abata Chartered Financial Analyst, Portfolio Manager, is manager of Invesco Long/Short Equity Fund. He joined |
| Invesco in 2011. Mr. Abata earned a BA in economics from Binghamton University. |
| | |
 | | Anthony Munchak Chartered Financial Analyst, Portfolio Manager, is manager of Invesco Long/Short Equity Fund. He joined |
| Invesco in 2000. Mr. Munchak earned a BS and an MS in finance from Boston College and an MBA from Bentley College. |
| | |
 | | Glen Murphy Chartered Financial Analyst, Portfolio Manager, is manager of Invesco Long/Short Equity Fund. He joined |
| Invesco in 1995. Mr. Murphy earned a BA from the University of Massachusetts at Amherst and an MS in finance from Boston College. |
| | |
 | | Francis Orlando Chartered Financial Analyst, Portfolio Manager, is manager of Invesco Long/Short Equity Fund. He joined |
| Invesco in 1987. Mr. Orlando earned a BA in business administration from Merrimack College and an MBA from Boston University. |
| | |
 | | Donna Chapman Wilson Portfolio Manager and Director of Portfolio Management, is manager of Invesco Long/Short Equity Fund. She joined |
| Invesco in 1997. Ms. Chapman Wilson earned a BA in economics from Hampton University and an MBA in finance from the Wharton School of the University of Pennsylvania. |
5 Invesco Long/Short Equity Fund
Your Fund’s Long-Term Performance
Results of a $10,000 Investment – Oldest Share Class(es) since Inception
Fund and index data from 12/19/13
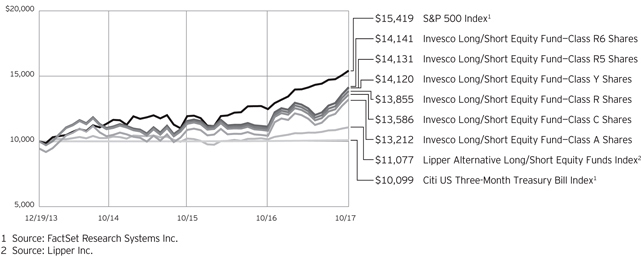
Past performance cannot guarantee comparable future results.
The data shown in the chart include reinvested distributions, applicable sales charges and Fund expenses including
management fees. Index results include reinvested dividends, but they do not reflect sales charges. Performance of the peer group, if applicable, reflects fund expenses and management fees;
performance of a market index does not. Performance shown in the chart and table(s) does not reflect deduction of taxes a shareholder would pay on Fund distributions or sale of Fund shares.
continued from page 8
| ∎ | | Small- and mid-capitalization companies risks. Small- and mid-capitalization companies tend to be more vulnerable to changing market conditions, may have little or no operating history or track record of success, and may have more limited product lines and markets, less experienced management and fewer financial resources than larger companies. These companies’ securities may be more volatile and less liquid than those of more established companies, and their returns may vary, sometimes significantly, from the overall securities market. |
About indexes used in this report
| ∎ | | The S&P 500® Index is an unmanaged index considered representative of the US stock market. |
| ∎ | | The Citi US Three-Month Treasury Bill Index is an unmanaged index representative of three-month US Treasury bills. |
| ∎ | | The Lipper Alternative Long/Short Equity Funds Index is an unmanaged index considered representative of alternative long/short equity funds tracked by Lipper. |
| ∎ | | The Fund is not managed to track the performance of any particular index, including the index(es) described here, and consequently, the performance of the Fund may deviate significantly from the performance of the index(es). |
| ∎ | | A direct investment cannot be made in an index. Unless otherwise indicated, index results include reinvested dividends, and they do not reflect sales charges. Performance of the peer group, if applicable, reflects fund expenses; performance of a market index does not. |
Other information
| ∎ | | The returns shown in management’s discussion of Fund performance are based on net asset values (NAVs) calculated for shareholder transactions. Generally accepted accounting principles require adjustments to be made to the net assets of the Fund at period end for financial reporting purposes, and as such, the NAVs for share holder transactions and the returns based on those NAVs may differ from the NAVs and returns reported in the Financial Highlights. |
| ∎ | | Industry classifications used in this report are generally according to the Global Industry Classification Standard, which was developed by and is the exclusive property and a service mark of MSCI Inc. and Standard & Poor’s. |
6 Invesco Long/Short Equity Fund
| | | | | |
Average Annual Total Returns | |
| As of 10/31/17, including maximum applicable sales charges | |
| | | | | |
| |
| Class A Shares | | | | | |
| Inception (12/19/13) | | | | 7.47 | % |
| 1 Year | | | | 19.64 | |
| |
| Class C Shares | | | | | |
| Inception (12/19/13) | | | | 8.25 | % |
| 1 Year | | | | 24.65 | |
| |
| Class R Shares | | | | | |
| Inception (12/19/13) | | | | 8.80 | % |
| 1 Year | | | | 26.37 | |
| |
| Class Y Shares | | | | | |
| Inception (12/19/13) | | | | 9.34 | % |
| 1 Year | | | | 26.85 | |
| |
| Class R5 Shares | | | | | |
| Inception (12/19/13) | | | | 9.36 | % |
| 1 Year | | | | 27.07 | |
| |
| Class R6 Shares | | | | | |
| Inception (12/19/13) | | | | 9.38 | % |
| 1 Year | | | | 27.17 | |
The performance data quoted represent past performance and cannot guarantee comparable future results; current performance may be lower or higher. Please visit invesco.com/performance for the most recent month-end performance. Performance figures reflect reinvested distributions, changes in net asset value and the effect of the maximum sales charge unless otherwise stated. Investment return and principal value will fluctuate so that you may have a gain or loss when you sell shares.
The net annual Fund operating expense ratio set forth in the most recent Fund prospectus as of the date of this report for Class A, Class C, Class R, Class Y, Class R5 and Class R6 shares was 1.59%, 2.34%, 1.84%, 1.34%, 1.26% and 1.26%, respectively.1,2 The total annual Fund operating expense ratio set forth in the most recent Fund prospectus as of the date of this report for Class A, Class C, Class R, Class Y, Class R5 and Class R6 shares was 1.65%, 2.40%, 1.90%, 1.40%, 1.28% and 1.28%, respectively. The expense ratios presented above may vary from the expense ratios presented in other sections of this report that are based on expenses incurred during the period covered by this report.
| | | | | |
Average Annual Total Returns | |
| As of 9/30/17, the most recent calendar quarter end, including maximum applicable sales charges | |
| | | | | |
| |
| Class A Shares | | | | | |
| Inception (12/19/13) | | | | 6.57 | % |
| 1 Year | | | | 14.56 | |
| |
| Class C Shares | | | | | |
| Inception (12/19/13) | | | | 7.36 | % |
| 1 Year | | | | 19.26 | |
| |
| Class R Shares | | | | | |
| Inception (12/19/13) | | | | 7.91 | % |
| 1 Year | | | | 20.93 | |
| |
| Class Y Shares | | | | | |
| Inception (12/19/13) | | | | 8.45 | % |
| 1 Year | | | | 21.49 | |
| |
| Class R5 Shares | | | | | |
| Inception (12/19/13) | | | | 8.47 | % |
| 1 Year | | | | 21.58 | |
| |
| Class R6 Shares | | | | | |
| Inception (12/19/13) | | | | 8.47 | % |
| 1 Year | | | | 21.58 | |
Class A share performance reflects the maximum 5.50% sales charge, and Class C share performance reflects the applicable contingent deferred sales charge (CDSC) for the period involved. The CDSC on Class C shares is 1% for the first year after purchase. Class R, Class Y, Class R5 and Class R6 class shares do not have a front-end sales charge or a CDSC; therefore, performance is at net asset value.
The performance of the Fund’s share classes will differ primarily due to different sales charge structures and class expenses.
Fund performance reflects any applicable fee waivers and/or expense reimbursements. Had the adviser not waived fees and/or reimbursed expenses currently or in the past, returns would have been lower. See current prospectus for more information.
| 1 | Total annual Fund operating expenses after any contractual fee waivers and/or expense reimbursements by the adviser in effect through at least February 28, 2019. See current prospectus for more information. |
| 2 | Total annual Fund operating expenses after any contractual fee waivers and/or expense reimbursements by the adviser in effect through at least June 30, 2019. See current prospectus for more information. |
7 Invesco Long/Short Equity Fund
Invesco Long/Short Equity Fund’s investment objective is to seek long-term capital appreciation.
| ∎ | | Unless otherwise stated, information presented in this report is as of October 31, 2017, and is based on total net assets. |
| ∎ | | Unless otherwise noted, all data provided by Invesco. |
| ∎ | | To access your Fund’s reports/prospectus, visit invesco.com/fundreports. |
About share classes
| ∎ | | Class R shares are generally available only to employer sponsored retirement and benefit plans. Please see the prospectus for more information. |
| ∎ | | Class Y shares are available only to certain investors. Please see the prospectus for more information. |
| ∎ | | Class R5 shares and Class R6 shares are available for use by retirement plans that meet certain standards and for institutional investors. Class R6 shares are also available through inter-mediaries that have established an agreement with Invesco Distributors, Inc. to make such shares available for use in retail omnibus accounts. Please see the prospectus for more information. |
Principal risks of investing in the Fund
| ∎ | | Active trading risk. Active trading of portfolio securities may result in added expenses, a lower return and increased tax liability. |
| ∎ | | Derivatives risk. The value of a derivative instrument depends largely on (and is derived from) the value of an underlying security, currency, commodity, interest rate, index or other asset (each referred to as an underlying asset). In addition to risks relating to the underlying assets, the use of derivatives may include other, possibly greater, risks, including counterparty, leverage and liquidity risks. Counterparty risk is the risk that the counterparty to the derivative contract will default on its obligation to pay the Fund the amount owed or otherwise perform under the derivative contract. Derivatives create leverage risk because they do not require payment up front equal to the economic exposure created by owning the derivative. As a result, an adverse change in the value of the underlying asset could result in the Fund sustaining a loss that is substantially greater than the amount invested in the derivative, which may make the |
| ∎ | | Fund’s returns more volatile and increase the risk of loss. Derivative instruments may also be less liquid than more traditional investments and the Fund may be unable to sell or close out its derivative positions at a desirable time or price. This risk may be more acute under adverse market conditions, during which the Fund may be most in need of liquidating its derivative positions. Derivatives may also be harder to value, less tax efficient and subject to changing government regulation that could impact the Fund’s ability to use certain derivatives or their cost. Also, derivatives used for hedging or to gain or limit exposure to a particular market segment may not provide the expected benefits, particularly during adverse market conditions. These risks are greater for the Fund than mutual funds that do not use derivative instruments or that use derivative instruments to a lesser extent than the Fund to implement their investment strategies. |
| ∎ | | Management risk. The Fund is actively managed and depends heavily on the Adviser’s judgment about markets, interest rates or the attractiveness, relative values, liquidity, or potential appreciation of particular investments made for the Fund’s portfolio. The Fund could experience losses if these judgments prove to be incorrect. There is no guarantee that the Fund’s mixture of long and short positions or the portfolio manager’s stock selection process will produce a portfolio with reduced exposure to stock market risk. In addition, the Fund’s long/short investment strategy may cause the Fund to underperform the broader equity markets in which the Fund invests during market rallies. Such underperformance could be significant during sudden or significant market rallies. Additionally, legislative, regulatory, or tax developments may adversely affect management of the Fund and, therefore, the ability of the Fund to achieve its investment objective. |
| ∎ | | Market risk. The market values of the Fund’s investments, and therefore the value of the Fund’s shares, will go up and down, sometimes rapidly or unpredictably. Market risk may affect a single issuer, industry or section of the economy, or it may affect the market as a whole. Individual stock prices tend to go up and down more dramatically than those of certain other types of investments, such as bonds. During a general downturn in the financial markets, multiple asset classes may decline in value. When markets perform well, there can be no assurance that specific investments held by the Fund will rise in value. |
| ∎ | | Sector focus risk. The Fund may from time to time invest a significant amount of its assets (i.e. over 25%) in one market sector or group of related industries. In this event, the Fund’s performance will depend to a greater extent on the overall condition of the sector or group of industries and there is increased risk that the Fund will lose significant value if conditions adversely affect that sector or group of industries. |
| ∎ | | Short position risk. Because the Fund’s potential loss on a short position arises from increases in the value of the asset sold short, the Fund will incur a loss on a short position, which is theoretically unlimited, if the price of the asset sold short increases from the short sale price. The counterparty to a short position or other market factors may prevent the Fund from closing out a short position at a desirable time or price and may reduce or eliminate any gain or result in a loss. In a rising market, the Fund’s short positions will cause the Fund to underperform the overall market and its peers that do not engage in shorting. If the Fund holds both long and short positions, and both positions decline simultaneously, the short positions will not provide any buffer (hedge) from declines in value of the Fund’s long positions. Certain types of short positions involve leverage, which may exaggerate any losses, potentially more than the actual cost of the investment, and will increase the volatility of the Fund’s returns. |
continued on page 6
|
This report must be accompanied or preceded by a currently effective Fund prospectus, which contains more complete information, including sales charges and expenses. Investors should read it carefully before investing. |
|
|
| NOT FDIC INSURED | MAY LOSE VALUE | NO BANK GUARANTEE |
8 Invesco Long/Short Equity Fund
Schedule of Investments(a)
October 31, 2017
| | | | | | | | |
| | | Shares | | | Value | |
Common Stocks & Other Equity Interests–94.32% | |
| Aerospace & Defense–1.59% | | | | | | | | |
Spirit AeroSystems Holdings, Inc.–Class A | | | 14,650 | | | $ | 1,173,465 | |
|
| Agricultural Products–0.26% | |
Bunge Ltd. | | | 2,750 | | | | 189,145 | |
|
| Apparel Retail–1.71% | |
Gap, Inc. (The) | | | 48,600 | | | | 1,263,114 | |
|
| Apparel, Accessories & Luxury Goods–3.39% | |
PVH Corp. | | | 11,150 | | | | 1,413,931 | |
Ralph Lauren Corp. | | | 12,150 | | | | 1,086,575 | |
| | | | | 2,500,506 | |
|
| Application Software–3.16% | |
ANSYS, Inc.(b) | | | 6,650 | | | | 909,121 | |
Cadence Design Systems, Inc.(b) | | | 33,000 | | | | 1,424,280 | |
| | | | | 2,333,401 | |
|
| Auto Parts & Equipment–3.16% | |
BorgWarner, Inc. | | | 25,300 | | | | 1,333,816 | |
Lear Corp. | | | 5,700 | | | | 1,000,863 | |
| | | | | 2,334,679 | |
|
| Biotechnology–3.28% | |
United Therapeutics Corp.(b) | | | 8,650 | | | | 1,025,804 | |
Vertex Pharmaceuticals, Inc.(b) | | | 9,550 | | | | 1,396,496 | |
| | | | | 2,422,300 | |
|
| Building Products–1.78% | |
Owens Corning | | | 15,900 | | | | 1,314,771 | |
|
| Cable & Satellite–0.26% | |
Liberty Global PLC–Series C (United Kingdom)(b) | | | 6,300 | | | | 188,307 | |
|
| Communications Equipment–1.33% | |
Juniper Networks, Inc. | | | 39,500 | | | | 980,785 | |
|
| Computer & Electronics Retail–0.16% | |
Best Buy Co., Inc. | | | 2,050 | | | | 114,759 | |
|
| Construction Machinery & Heavy Trucks–2.98% | |
Allison Transmission Holdings, Inc. | | | 34,200 | | | | 1,453,158 | |
Cummins Inc. | | | 4,200 | | | | 742,896 | |
| | | | | 2,196,054 | |
|
| Consumer Electronics–1.50% | |
Garmin Ltd. | | | 19,600 | | | | 1,109,556 | |
|
| Consumer Finance–1.86% | |
Ally Financial Inc. | | | 52,600 | | | | 1,374,438 | |
|
| Copper–0.22% | |
Freeport-McMoRan Inc.(b) | | | 11,550 | | | | 161,469 | |
|
| Department Stores–3.03% | |
Kohl’s Corp. | | | 30,550 | | | | 1,275,768 | |
Macy’s, Inc. | | | 51,400 | | | | 964,264 | |
| | | | | 2,240,032 | |
| | | | | | | | |
| | | Shares | | | Value | |
| Diversified Chemicals–1.63% | |
Eastman Chemical Co. | | | 13,250 | | | $ | 1,203,233 | |
|
| Diversified Metals & Mining–1.61% | |
Teck Resources Ltd.–Class B (Canada) | | | 58,250 | | | | 1,190,630 | |
|
| Electric Utilities–0.45% | |
Entergy Corp. | | | 3,820 | | | | 329,513 | |
|
| Electrical Components & Equipment–0.50% | |
Rockwell Automation, Inc. | | | 1,850 | | | | 371,517 | |
|
| Gold–0.32% | |
Barrick Gold Corp. (Canada) | | | 3,350 | | | | 48,408 | |
Newmont Mining Corp. | | | 5,150 | | | | 186,224 | |
| | | | | 234,632 | |
|
| Health Care Distributors–0.14% | |
McKesson Corp. | | | 750 | | | | 103,410 | |
|
| Health Care Equipment–1.19% | |
IDEXX Laboratories, Inc.(b) | | | 5,300 | | | | 880,701 | |
|
| Health Care Services–1.38% | |
DaVita Inc.(b) | | | 16,800 | | | | 1,020,432 | |
|
| Health Care Supplies–1.50% | |
Cooper Cos., Inc. (The) | | | 4,600 | | | | 1,105,196 | |
|
| Homebuilding–3.90% | |
NVR, Inc.(b) | | | 450 | | | | 1,476,616 | |
Toll Brothers, Inc. | | | 30,450 | | | | 1,401,918 | |
| | | | | 2,878,534 | |
|
| Hotel and Resort REIT’s–0.13% | |
Host Hotels & Resorts Inc. | | | 5,050 | | | | 98,778 | |
|
| Human Resource & Employment Services–1.95% | |
ManpowerGroup Inc. | | | 11,700 | | | | 1,442,376 | |
|
| Independent Power Producers & Energy Traders–1.96% | |
NRG Energy, Inc. | | | 58,000 | | | | 1,450,000 | |
|
| Internet & Direct Marketing Retail–3.05% | |
Liberty Interactive Corp. QVC Group–Class A(b) | | | 48,250 | | | | 1,096,240 | |
Liberty Ventures–Series A(b) | | | 20,250 | | | | 1,153,440 | |
| | | | | 2,249,680 | |
|
| Internet Software & Services–3.10% | |
IAC/InterActiveCorp.(b) | | | 6,800 | | | | 877,540 | |
VeriSign, Inc.(b) | | | 13,150 | | | | 1,413,888 | |
| | | | | 2,291,428 | |
|
| Investment Banking & Brokerage–0.14% | |
E*TRADE Financial Corp.(b) | | | 2,350 | | | | 102,437 | |
|
| IT Consulting & Other Services–0.05% | |
Teradata Corp.(b) | | | 1,200 | | | | 40,140 | |
|
| Life & Health Insurance–3.16% | |
Lincoln National Corp. | | | 16,350 | | | | 1,239,003 | |
Unum Group | | | 21,050 | | | | 1,095,442 | |
| | | | | 2,334,445 | |
See accompanying Notes to Financial Statements which are an integral part of the financial statements.
9 Invesco Long/Short Equity Fund
| | | | | | | | |
| | | Shares | | | Value | |
| Managed Health Care–1.78% | |
WellCare Health Plans Inc.(b) | | | 6,650 | | | $ | 1,314,971 | |
|
| Multi-Utilities–0.42% | |
CenterPoint Energy, Inc. | | | 10,600 | | | | 313,548 | |
|
| Oil & Gas Exploration & Production–5.30% | |
ConocoPhillips | | | 14,500 | | | | 741,675 | |
Devon Energy Corp. | | | 10,650 | | | | 392,985 | |
Marathon Oil Corp. | | | 102,550 | | | | 1,458,261 | |
Murphy Oil Corp. | | | 49,250 | | | | 1,317,437 | |
| | | | | 3,910,358 | |
|
| Oil & Gas Refining & Marketing–1.52% | |
HollyFrontier Corp. | | | 30,450 | | | | 1,125,128 | |
|
| Oil & Gas Storage & Transportation–1.25% | |
Williams Cos., Inc. (The) | | | 32,300 | | | | 920,550 | |
|
| Packaged Foods & Meats–1.45% | |
Conagra Brands, Inc. | | | 10,600 | | | | 362,096 | |
Pilgrim’s Pride Corp.(b) | | | 22,350 | | | | 710,283 | |
| | | | | 1,072,379 | |
|
| Property & Casualty Insurance–0.23% | |
CNA Financial Corp. | | | 3,150 | | | | 170,510 | |
|
| Regional Banks–8.46% | |
Citizens Financial Group, Inc. | | | 34,950 | | | | 1,328,449 | |
Comerica Inc. | | | 14,950 | | | | 1,174,622 | |
East West BanCorp., Inc. | | | 19,250 | | | | 1,151,920 | |
Regions Financial Corp. | | | 87,200 | | | | 1,349,856 | |
SunTrust Banks, Inc. | | | 20,600 | | | | 1,240,326 | |
| | | | | 6,245,173 | |
|
| Residential REIT’s–3.18% | |
Equity Lifestyle Properties, Inc. | | | 13,300 | | | | 1,176,784 | |
Essex Property Trust, Inc. | | | 4,450 | | | | 1,167,813 | |
| | | | | 2,344,597 | |
|
| Semiconductor Equipment–1.84% | |
KLA-Tencor Corp. | | | 12,500 | | | | 1,361,125 | |
| | | | | | | | |
| | | Shares | | | Value | |
| Semiconductors–1.76% | |
Marvell Technology Group Ltd. (Bermuda) | | | 70,200 | | | $ | 1,296,594 | |
|
| Specialized Consumer Services–1.56% | |
H&R Block, Inc. | | | 46,550 | | | | 1,151,647 | |
|
| Specialized REIT’s–1.65% | |
American Tower Corp. | | | 7,200 | | | | 1,034,424 | |
Four Corners Property Trust, Inc. | | | 7,400 | | | | 182,632 | |
| | | | | 1,217,056 | |
|
| Specialty Stores–0.46% | |
Tiffany & Co. | | | 3,600 | | | | 337,032 | |
|
| Systems Software–2.10% | |
Dell Technologies Inc.–Class V(b) | | | 13,150 | | | | 1,088,426 | |
Red Hat, Inc.(b) | | | 3,800 | | | | 459,154 | |
| | | | | 1,547,580 | |
|
| Technology Hardware, Storage & Peripherals–3.56% | |
HP Inc. | | | 66,900 | | | | 1,441,695 | |
Xerox Corp. | | | 39,150 | | | | 1,186,636 | |
| | | | | 2,628,331 | |
|
| Trading Companies & Distributors–1.45% | |
United Rentals, Inc.(b) | | | 7,550 | | | | 1,068,174 | |
|
| Wireless Telecommunication Services–0.52% | |
Rogers Communications, Inc.–Class B (Canada) | | | 7,400 | | | | 384,060 | |
Total Common Stocks & Other Equity Interests
(Cost $60,313,933) | | | | 69,632,676 | |
| | |
Money Market Funds–4.32% | | | | | | | | |
Invesco Government & Agency Portfolio–Institutional Class, 0.95%(c) | | | 1,914,340 | | | | 1,914,340 | |
Invesco Treasury Portfolio–Institutional Class, 0.94%(c) | | | 1,276,227 | | | | 1,276,227 | |
Total Money Market Funds
(Cost $3,190,567) | | | | 3,190,567 | |
TOTAL INVESTMENTS IN SECURITIES–98.64%
(Cost $63,504,500) | | | | 72,823,243 | |
OTHER ASSETS LESS LIABILITIES–1.36% | | | | 1,001,779 | |
NET ASSETS–100.00% | | | $ | 73,825,022 | |
Investment Abbreviations:
| | |
| REIT | | – Real Estate Investment Trust |
Notes to Schedule of Investments:
| (a) | Industry and/or sector classifications used in this report are generally according to the Global Industry Classification Standard, which was developed by and is the exclusive property and a service mark of MSCI Inc. and Standard & Poor’s. |
| (b) | Non-income producing security. |
| (c) | The money market fund and the Fund are affiliated by having the same investment adviser. The rate shown is the 7-day SEC standardized yield as of October 31, 2017. |
| | | | | | | | | | | | | | | | | | | | | | | | | | | | | | | | |
| Open Over-The-Counter Total Return Swap Agreements | |
| Reference Entity | | Counterparty | | Maturity
Dates | | | Floating Rate Index(1) | | Payment
Frequency | | | Notional
Amount | | | Upfront
Payments
Paid
(Received) | | | Value | | | Unrealized
Appreciation
(Depreciation) | | | Net Value of
Reference
Entities | |
Equity Securities — Long | | Morgan Stanley & Co. LLC | | | 12/21/2017 | | | Federal Funds floating rate | | | Monthly | | | $ | 74,007,762 | | | $ | — | | | $ | (300,992 | )(2) | | $ | (300,992 | )(2) | | $ | 73,673,336 | |
Equity Securities — Short | | Morgan Stanley & Co. LLC | | | 12/21/2017 | | | Federal Funds floating rate | | | Monthly | | | | (73,782,640 | ) | | | — | | | | 610,240 | (3) | | | 610,240 | (3) | | | (73,161,244 | ) |
Total Return Swap Agreements — Equity Risk | | | | | | | | | | | | $ | 225,122 | | | $ | — | | | $ | 309,248 | | | $ | 309,248 | | | $ | 512,092 | |
| (1) | The Fund receives or pays the total return on the long and short positions underlying the total return swap and pays or receives a specific Federal Funds floating rate. |
| (2) | Amount includes $33,434 of dividends receivable and financing fees related to the reference entities. |
| (3) | Amount includes $(11,156) of dividends payable and financing fees related to the reference entities. |
See accompanying Notes to Financial Statements which are an integral part of the financial statements.
10 Invesco Long/Short Equity Fund
The following table represents the individual long and short positions and related values of equity securities underlying the total return swap with Morgan Stanley & Co. LLC as of October 31, 2017.
| | | | | | | | | | | | |
| | | Shares | | | Value | | | Percentage of
Reference Entities | |
Equity Securities — Long–100.00% | |
| Aerospace & Defense–2.36% | |
Boeing Co. (The) | | | 5,650 | | | $ | 1,457,587 | | | | 2.00 | |
Spirit AeroSystems Holdings, Inc.–Class A | | | 3,350 | | | | 268,335 | | | | 0.36 | |
| | | | | 1,725,922 | | | | 2.36 | |
|
| Agricultural Products–1.17% | |
Bunge Ltd. | | | 12,150 | | | | 835,677 | | | | 1.17 | |
|
| Apparel, Accessories & Luxury Goods–0.04% | |
PVH Corp. | | | 250 | | | | 31,703 | | | | 0.04 | |
|
| Asset Management & Custody Banks–5.06% | |
Ameriprise Financial Inc. | | | 8,600 | | | | 1,346,244 | | | | 1.79 | |
Franklin Resources Inc. | | | 24,850 | | | | 1,046,930 | | | | 1.50 | |
State Street Corp. | | | 13,600 | | | | 1,251,200 | | | | 1.77 | |
| | | | | 3,644,374 | | | | 5.06 | |
|
| Auto Parts & Equipment–0.62% | |
Lear Corp. | | | 2,650 | | | | 465,314 | | | | 0.62 | |
|
| Biotechnology–12.32% | |
AbbVie Inc. | | | 15,650 | | | | 1,412,412 | | | | 2.00 | |
Alexion Pharmaceuticals Inc. | | | 8,550 | | | | 1,023,093 | | | | 1.56 | |
Amgen Inc. | | | 7,150 | | | | 1,252,823 | | | | 1.75 | |
Biogen Inc. | | | 4,140 | | | | 1,290,272 | | | | 1.84 | |
Bioverativ Inc. | | | 2,030 | | | | 114,695 | | | | 0.16 | |
Celgene Corp. | | | 11,250 | | | | 1,135,912 | | | | 1.78 | |
Gilead Sciences, Inc. | | | 16,900 | | | | 1,266,824 | | | | 1.83 | |
Regeneron Pharmaceuticals, Inc. | | | 2,400 | | | | 966,288 | | | | 1.40 | |
| | | | | 8,462,319 | | | | 12.32 | |
|
| Cable & Satellite–1.27% | |
Liberty Global PLC (United Kingdom)–Class C | | | 30,950 | | | | 925,096 | | | | 1.27 | |
|
| Commodity Chemicals–1.49% | |
LyondellBasell Industries N.V.–Class A | | | 11,150 | | | | 1,154,360 | | | | 1.49 | |
|
| Communications Equipment–0.02% | |
Juniper Networks, Inc. | | | 700 | | | | 17,381 | | | | 0.02 | |
|
| Computer & Electronics Retail–1.65% | |
Best Buy Co., Inc. | | | 21,800 | | | | 1,220,364 | | | | 1.65 | |
|
| Construction Machinery & Heavy Trucks–0.76% | |
Cummins Inc. | | | 3,150 | | | | 557,172 | | | | 0.76 | |
|
| Consumer Electronics–0.03% | |
Garmin Ltd. | | | 350 | | | | 19,814 | | | | 0.03 | |
|
| Copper–1.64% | |
Freeport-McMoRan Inc. | | | 81,800 | | | | 1,143,564 | | | | 1.64 | |
| | | | | | | | | | | | |
| | | Shares | | | Value | | | Percentage of
Reference Entities | |
| Department Stores–0.05% | |
Macy’s Inc. | | | 1,850 | | | $ | 34,706 | | | | 0.05 | |
|
| Diversified Banks–8.49% | |
Bank of America Corp. | | | 52,850 | | | | 1,447,561 | | | | 1.94 | |
Bank of Montreal (Canada) | | | 4,950 | | | | 379,219 | | | | 0.52 | |
Bank of Nova Scotia (The) (Canada) | | | 19,250 | | | | 1,242,010 | | | | 1.67 | |
Canadian Imperial Bank of Commerce (Canada) | | | 7,900 | | | | 695,595 | | | | 0.95 | |
Citigroup Inc. | | | 19,500 | | | | 1,433,250 | | | | 1.94 | |
Toronto-Dominion Bank (The) (Canada) | | | 19,250 | | | | 1,094,363 | | | | 1.47 | |
| | | | | 6,291,998 | | | | 8.49 | |
|
| Electric Utilities–3.39% | |
Entergy Corp. | | | 180 | | | | 15,527 | | | | 0.02 | |
Exelon Corp. | | | 31,550 | | | | 1,268,625 | | | | 1.69 | |
FirstEnergy Corp. | | | 35,650 | | | | 1,174,667 | | | | 1.55 | |
Fortis Inc. (Canada) | | | 2,550 | | | | 93,916 | | | | 0.13 | |
| | | | | 2,552,735 | | | | 3.39 | |
|
| Electrical Components & Equipment–1.27% | |
Rockwell Automation Inc. | | | 5,000 | | | | 1,004,100 | | | | 1.27 | |
|
| Fertilizers & Agricultural Chemicals–1.69% | |
FMC Corp. | | | 13,250 | | | | 1,230,395 | | | | 1.69 | |
|
| General Merchandise Stores–1.69% | |
Target Corp. | | | 20,000 | | | | 1,180,800 | | | | 1.69 | |
|
| Gold–2.97% | |
Barrick Gold Corp. (Canada) | | | 69,900 | | | | 1,010,055 | | | | 1.53 | |
Newmont Mining Corp. | | | 28,600 | | | | 1,034,176 | | | | 1.44 | |
| | | | | 2,044,231 | | | | 2.97 | |
|
| Health Care Distributors–1.48% | |
McKesson Corp. | | | 7,400 | | | | 1,020,312 | | | | 1.48 | |
|
| Health Care Equipment–2.05% | |
Baxter International Inc. | | | 22,350 | | | | 1,440,904 | | | | 1.94 | |
IDEXX Laboratories Inc. | | | 500 | | | | 83,085 | | | | 0.11 | |
| | | | | 1,523,989 | | | | 2.05 | |
|
| Hotel and Resort REIT’s–1.50% | |
Host Hotels & Resorts Inc. | | | 57,500 | | | | 1,124,700 | | | | 1.50 | |
|
| Hotels, Resorts & Cruise Lines–3.20% | |
Hilton Worldwide Holdings Inc. | | | 17,700 | | | | 1,279,356 | | | | 1.68 | |
Royal Caribbean Cruises Ltd. | | | 9,250 | | | | 1,144,873 | | | | 1.52 | |
| | | | | 2,424,229 | | | | 3.20 | |
|
| Hypermarkets & Super Centers–1.89% | |
Wal-Mart Stores Inc. | | | 15,800 | | | | 1,379,498 | | | | 1.89 | |
See accompanying Notes to Financial Statements which are an integral part of the financial statements.
11 Invesco Long/Short Equity Fund
| | | | | | | | | | | | |
| | | Shares | | | Value | | | Percentage of
Reference Entities | |
| Industrial REIT’s–1.56% | |
Prologis Inc. | | | 17,900 | | | $ | 1,155,982 | | | | 1.56 | |
|
| Integrated Oil & Gas–1.50% | |
Suncor Energy, Inc. (Canada) | | | 32,700 | | | | 1,110,492 | | | | 1.50 | |
|
| Internet Software & Services–2.20% | |
eBay Inc. | | | 30,000 | | | | 1,129,200 | | | | 1.50 | |
IAC/InterActiveCorp. | | | 4,200 | | | | 542,010 | | | | 0.70 | |
| | | | | 1,671,210 | | | | 2.20 | |
|
| Investment Banking & Brokerage–1.44% | |
E*TRADE Financial Corp. | | | 24,900 | | | | 1,085,391 | | | | 1.44 | |
|
| IT Consulting & Other Services–0.42% | |
Teradata Corp. | | | 9,700 | | | | 324,465 | | | | 0.42 | |
|
| Life & Health Insurance–1.79% | |
Aflac Inc. | | | 15,450 | | | | 1,296,100 | | | | 1.76 | |
Lincoln National Corp. | | | 300 | | | | 22,734 | | | | 0.03 | |
| | | | | 1,318,834 | | | | 1.79 | |
|
| Managed Health Care–8.36% | |
Anthem Inc. | | | 6,200 | | | | 1,297,102 | | | | 1.64 | |
Centene Corp. | | | 11,550 | | | | 1,081,888 | | | | 1.53 | |
Cigna Corp. | | | 6,750 | | | | 1,331,235 | | | | 1.76 | |
Humana Inc. | | | 4,700 | | | | 1,200,145 | | | | 1.56 | |
UnitedHealth Group Inc. | | | 6,700 | | | | 1,408,474 | | | | 1.87 | |
| | | | | 6,318,844 | | | | 8.36 | |
|
| Multi-Utilities–1.24% | |
CenterPoint Energy Inc. | | | 30,900 | | | | 914,022 | | | | 1.24 | |
|
| Oil & Gas Equipment & Services–1.65% | |
Halliburton Co. | | | 28,850 | | | | 1,233,049 | | | | 1.65 | |
|
| Oil & Gas Exploration & Production–3.61% | |
Canadian Natural Resources Ltd. (Canada) | | | 36,650 | | | | 1,279,085 | | | | 1.61 | |
ConocoPhillips | | | 11,500 | | | | 588,225 | | | | 0.78 | |
Devon Energy Corp. | | | 26,150 | | | | 964,935 | | | | 1.22 | |
| | | | | 2,832,245 | | | | 3.61 | |
|
| Oil & Gas Refining & Marketing–1.95% | |
Valero Energy Corp. | | | 18,600 | | | | 1,467,354 | | | | 1.95 | |
| | | | | | | | | | | | |
| | | Shares | | | Value | | | Percentage of
Reference Entities | |
| Oil & Gas Storage & Transportation–0.26% | |
Williams Cos, Inc. (The) | | | 6,600 | | | $ | 188,100 | | | | 0.26 | |
|
| Packaged Foods & Meats–1.63% | |
Conagra Brands, Inc. | | | 23,500 | | | | 802,760 | | | | 1.09 | |
Pilgrim’s Pride Corp. | | | 13,000 | | | | 413,140 | | | | 0.54 | |
| | | | | 1,215,900 | | | | 1.63 | |
|
| Property & Casualty Insurance–2.24% | |
CNA Financial Corp. | | | 10,050 | | | | 544,006 | | | | 0.68 | |
Progressive Corp. (The) | | | 23,650 | | | | 1,150,573 | | | | 1.56 | |
| | | | | 1,694,579 | | | | 2.24 | |
|
| Railroads–1.64% | |
Norfolk Southern Corp. | | | 9,200 | | | | 1,209,064 | | | | 1.64 | |
|
| Regional Banks–0.22% | |
Citizens Financial Group Inc. | | | 650 | | | | 24,706 | | | | 0.03 | |
Comerica Inc. | | | 1,200 | | | | 94,284 | | | | 0.13 | |
Regions Financial Corp. | | | 1,550 | | | | 23,994 | | | | 0.03 | |
SunTrust Banks, Inc. | | | 350 | | | | 21,074 | | | | 0.03 | |
| | | | | 164,058 | | | | 0.22 | |
|
| Semiconductor Equipment–3.97% | |
Applied Materials, Inc. | | | 25,900 | | | | 1,461,537 | | | | 1.97 | |
KLA-Tencor Corp. | | | 250 | | | | 27,223 | | | | 0.04 | |
Lam Research Corp. | | | 7,050 | | | | 1,470,419 | | | | 1.96 | |
| | | | | 2,959,179 | | | | 3.97 | |
|
| Semiconductors–2.02% | |
Micron Technology, Inc. | | | 35,950 | | | | 1,592,945 | | | | 2.02 | |
|
| Specialized REIT’s–1.83% | |
American Tower Corp. | | | 1,650 | | | | 237,055 | | | | 0.31 | |
SBA Communications Corp. | | | 7,600 | | | | 1,194,568 | | | | 1.52 | |
| | | | | 1,431,623 | | | | 1.83 | |
|
| Systems Software–0.87% | |
Red Hat Inc. | | | 5,350 | | | | 646,441 | | | | 0.87 | |
|
| Technology Hardware, Storage & Peripherals–1.50% | |
HP Inc. | | | 1,450 | | | | 31,248 | | | | 0.04 | |
Western Digital Corp. | | | 12,250 | | | | 1,093,558 | | | | 1.46 | |
| | | | | 1,124,806 | | | | 1.50 | |
Total Equity Securities — Long | | | $ | 73,673,336 | | | | 100.00 | |
See accompanying Notes to Financial Statements which are an integral part of the financial statements.
12 Invesco Long/Short Equity Fund
| | | | | | | | | | | | |
| | | Shares | | | Value | | | Percentage of
Reference Entities | |
Equity Securities — Short–(100.00)% | |
| Advertising–(1.47)% | |
Interpublic Group of Cos Inc. (The) | | | (56,000 | ) | | $ | (1,078,000 | ) | | | (1.47 | ) |
|
| Aerospace & Defense–(1.41)% | |
TransDigm Group Inc. | | | (3,900 | ) | | | (1,082,250 | ) | | | (1.41 | ) |
|
| Air Freight & Logistics–(2.92)% | |
CH Robinson Worldwide Inc. | | | (13,800 | ) | | | (1,083,714 | ) | | | (1.47 | ) |
FedEx Corp. | | | (4,750 | ) | | | (1,072,597 | ) | | | (1.45 | ) |
| | | | | (2,156,311 | ) | | | (2.92 | ) |
|
| Apparel Retail–(1.43)% | |
L Brands Inc. | | | (24,650 | ) | | | (1,060,936 | ) | | | (1.43 | ) |
|
| Apparel, Accessories & Luxury Goods–(3.09)% | |
Lululemon Athletica Inc. | | | (17,450 | ) | | | (1,073,349 | ) | | | (1.51 | ) |
Under Armour, Inc.–Class A | | | (10,650 | ) | | | (133,338 | ) | | | (0.24 | ) |
Under Armour, Inc.–Class C | | | (64,950 | ) | | | (748,874 | ) | | | (1.34 | ) |
| | | | | (1,955,561 | ) | | | (3.09 | ) |
|
| Application Software–(4.31)% | |
Splunk Inc. | | | (16,100 | ) | | | (1,083,530 | ) | | | (1.40 | ) |
Tyler Technologies, Inc. | | | (6,050 | ) | | | (1,072,605 | ) | | | (1.46 | ) |
Ultimate Software Group Inc. (The) | | | (5,550 | ) | | | (1,124,375 | ) | | | (1.45 | ) |
| | | | | (3,280,510 | ) | | | (4.31 | ) |
|
| Asset Management & Custody Banks–(1.49)% | |
Brookfield Asset Management Inc. (Canada)–Class A | | | (25,800 | ) | | | (1,082,052 | ) | | | (1.49 | ) |
|
| Automobile Manufacturers–(1.56)% | |
Tesla, Inc. | | | (3,420 | ) | | | (1,133,833 | ) | | | (1.56 | ) |
|
| Automotive Retail–(5.80)% | |
Advance Auto Parts, Inc. | | | (13,450 | ) | | | (1,099,403 | ) | | | (1.55 | ) |
AutoNation Inc. | | | (22,400 | ) | | | (1,061,760 | ) | | | (1.39 | ) |
AutoZone Inc. | | | (1,840 | ) | | | (1,084,680 | ) | | | (1.47 | ) |
OReilly Automotive Inc. | | | (5,000 | ) | | | (1,054,750 | ) | | | (1.39 | ) |
| | | | | (4,300,593 | ) | | | (5.80 | ) |
|
| Biotechnology–(2.94)% | |
Seattle Genetics Inc. | | | (17,550 | ) | | | (1,075,991 | ) | | | (1.48 | ) |
TESARO, Inc. | | | (9,500 | ) | | | (1,099,815 | ) | | | (1.46 | ) |
| | | | | (2,175,806 | ) | | | (2.94 | ) |
|
| Brewers–(1.42)% | |
Molson Coors Brewing Co.–Class B | | | (12,500 | ) | | | (1,010,875 | ) | | | (1.42 | ) |
|
| Building Products–(1.46)% | |
Johnson Controls International plc | | | (25,950 | ) | | | (1,074,070 | ) | | | (1.46 | ) |
|
| Communications Equipment–(1.29)% | |
Palo Alto Networks, Inc. | | | (6,400 | ) | | | (942,080 | ) | | | (1.29 | ) |
|
| Construction Machinery & Heavy Trucks–(1.48)% | |
Wabtec Corp./DE | | | (14,350 | ) | | | (1,097,775 | ) | | | (1.48 | ) |
| | | | | | | | | | | | |
| | | Shares | | | Value | | | Percentage of
Reference Entities | |
| Construction Materials–(2.91)% | |
Martin Marietta Materials, Inc. | | | (5,050 | ) | | $ | (1,095,093 | ) | | | (1.46 | ) |
Vulcan Materials Co. | | | (8,850 | ) | | | (1,077,488 | ) | | | (1.45 | ) |
| | | | | (2,172,581 | ) | | | (2.91 | ) |
|
| Data Processing & Outsourced Services–(0.09)% | |
Sabre Corp. | | | (3,650 | ) | | | (71,394 | ) | | | (0.09 | ) |
|
| Distributors–(1.38)% | |
Genuine Parts Co. | | | (11,450 | ) | | | (1,010,233 | ) | | | (1.38 | ) |
|
| Electrical Components & Equipment–(1.50)% | |
Acuity Brands Inc. | | | (6,900 | ) | | | (1,153,680 | ) | | | (1.50 | ) |
|
| Financial Exchanges & Data–(2.89)% | |
FactSet Research Systems Inc. | | | (5,100 | ) | | | (968,337 | ) | | | (1.29 | ) |
MarketAxess Holdings Inc. | | | (6,250 | ) | | | (1,087,500 | ) | | | (1.60 | ) |
| | | | | (2,055,837 | ) | | | (2.89 | ) |
|
| Footwear–(1.43)% | |
NIKE Inc.–Class B | | | (19,650 | ) | | | (1,080,554 | ) | | | (1.43 | ) |
|
| Health Care Distributors–(0.95)% | |
Cardinal Health, Inc. | | | (10,550 | ) | | | (653,045 | ) | | | (0.95 | ) |
|
| Health Care Equipment–(1.50)% | |
DexCom, Inc. | | | (24,700 | ) | | | (1,110,759 | ) | | | (1.50 | ) |
|
| Health Care Services–(0.13)% | |
MEDNAX Inc. | | | (2,200 | ) | | | (96,338 | ) | | | (0.13 | ) |
|
| Health Care Supplies–(1.47)% | |
DENTSPLY SIRONA Inc. | | | (17,550 | ) | | | (1,071,779 | ) | | | (1.47 | ) |
|
| Home Furnishings–(1.48)% | |
Leggett & Platt, Inc. | | | (22,250 | ) | | | (1,051,535 | ) | | | (1.48 | ) |
|
| Housewares & Specialties–(1.50)% | |
Newell Brands Inc. | | | (27,550 | ) | | | (1,123,489 | ) | | | (1.50 | ) |
|
| Industrial Conglomerates–(2.98)% | |
Carlisle Cos Inc. | | | (9,900 | ) | | | (1,087,317 | ) | | | (1.40 | ) |
General Electric Co. | | | (53,000 | ) | | | (1,068,480 | ) | | | (1.58 | ) |
| | | | | (2,155,797 | ) | | | (2.98 | ) |
|
| Industrial Machinery–(4.44)% | |
Flowserve Corp. | | | (24,250 | ) | | | (1,068,697 | ) | | | (1.47 | ) |
Middleby Corp. (The) | | | (9,400 | ) | | | (1,089,460 | ) | | | (1.49 | ) |
Snap-on Inc. | | | (6,950 | ) | | | (1,096,571 | ) | | | (1.48 | ) |
| | | | | (3,254,728 | ) | | | (4.44 | ) |
|
| Internet & Direct Marketing Retail–(2.70)% | |
Amazon.com, Inc. | | | (1,000 | ) | | | (1,105,280 | ) | | | (1.31 | ) |
TripAdvisor, Inc. | | | (25,800 | ) | | | (967,500 | ) | | | (1.39 | ) |
| | | | | (2,072,780 | ) | | | (2.70 | ) |
|
| Leisure Products–(1.65)% | |
Mattel Inc. | | | (78,700 | ) | | | (1,111,244 | ) | | | (1.65 | ) |
See accompanying Notes to Financial Statements which are an integral part of the financial statements.
13 Invesco Long/Short Equity Fund
| | | | | | | | | | | | |
| | | Shares | | | Value | | | Percentage of
Reference Entities | |
| Metal & Glass Containers–(1.49)% | |
Ball Corp. | | | (25,650 | ) | | $ | (1,101,154 | ) | | | (1.49 | ) |
|
| Movies & Entertainment–(0.13)% | |
Liberty Media Corp. Liberty Braves | | | (3,800 | ) | | | (89,224 | ) | | | (0.13 | ) |
|
| Multi-Sector Holdings–(0.77)% | |
FNFV Group | | | (32,150 | ) | | | (554,587 | ) | | | (0.77 | ) |
|
| Oil & Gas Drilling–(1.43)% | |
Helmerich & Payne Inc. | | | (20,250 | ) | | | (1,099,777 | ) | | | (1.43 | ) |
|
| Oil & Gas Equipment & Services–(1.26)% | |
Core Laboratories NV | | | (10,600 | ) | | | (1,058,940 | ) | | | (1.26 | ) |
|
| Oil & Gas Exploration & Production–(4.18)% | |
Antero Resources Corp. | | | (50,600 | ) | | | (981,640 | ) | | | (1.31 | ) |
Diamondback Energy Inc. | | | (10,500 | ) | | | (1,125,180 | ) | | | (1.43 | ) |
Parsley Energy Inc.–Class A | | | (43,550 | ) | | | (1,158,430 | ) | | | (1.44 | ) |
| | | | | (3,265,250 | ) | | | (4.18 | ) |
|
| Oil & Gas Storage & Transportation–(2.05)% | |
Cheniere Energy, Inc. | | | (21,600 | ) | | | (1,009,584 | ) | | | (1.33 | ) |
Pembina Pipeline Corp. (Canada) | | | (16,300 | ) | | | (539,041 | ) | | | (0.72 | ) |
| | | | | (1,548,625 | ) | | | (2.05 | ) |
|
| Personal Products–(1.54)% | |
Coty, Inc.–Class A | | | (73,900 | ) | | | (1,138,060 | ) | | | (1.54 | ) |
|
| Property & Casualty Insurance–(5.64)% | |
Axis Capital Holdings Ltd. | | | (16,800 | ) | | | (913,752 | ) | | | (1.24 | ) |
Cincinnati Financial Corp. | | | (14,050 | ) | | | (985,888 | ) | | | (1.45 | ) |
Markel Corp. | | | (985 | ) | | | (1,068,035 | ) | | | (1.44 | ) |
XL Group Ltd. (Bermuda) | | | (27,000 | ) | | | (1,092,690 | ) | | | (1.51 | ) |
| | | | | (4,060,365 | ) | | | (5.64 | ) |
|
| Real Estate Development–(1.45)% | |
Howard Hughes Corp. (The) | | | (8,500 | ) | | | (1,084,855 | ) | | | (1.45 | ) |
|
| Regional Banks–(2.83)% | |
PacWest Bancorp | | | (20,650 | ) | | | (997,808 | ) | | | (1.35 | ) |
Signature Bank/New York NY | | | (8,150 | ) | | | (1,059,582 | ) | | | (1.48 | ) |
| | | | | (2,057,390 | ) | | | (2.83 | ) |
| | | | | | | | | | | | |
| | | Shares | | | Value | | | Percentage of
Reference Entities | |
| Reinsurance–(0.96)% | | | | | | | | | |
Alleghany Corp. | | | (1,260 | ) | | $ | (713,437 | ) | | | (0.96 | ) |
|
| Research & Consulting Services–(2.86)% | |
IHS Markit Ltd. | | | (23,500 | ) | | | (1,001,335 | ) | | | (1.40 | ) |
Verisk Analytics Inc. | | | (12,700 | ) | | | (1,080,135 | ) | | | (1.46 | ) |
| | | | | (2,081,470 | ) | | | (2.86 | ) |
|
| Residential REIT’s–(0.92)% | |
American Campus Communities Inc. | | | (16,250 | ) | | | (675,675 | ) | | | (0.92 | ) |
|
| Restaurants–(3.14)% | |
Chipotle Mexican Grill, Inc. | | | (3,980 | ) | | | (1,082,162 | ) | | | (1.69 | ) |
Starbucks Corp. | | | (19,650 | ) | | | (1,077,606 | ) | | | (1.45 | ) |
| | | | | (2,159,768 | ) | | | (3.14 | ) |
|
| Retail REIT’s–(1.48)% | |
Macerich Co. (The) | | | (18,950 | ) | | | (1,034,670 | ) | | | (1.48 | ) |
|
| Semiconductors–(1.62)% | |
Advanced Micro Devices Inc. | | | (85,000 | ) | | | (933,725 | ) | | | (1.62 | ) |
|
| Silver–(0.52)% | |
Wheaton Precious Metals Corp. (Canada) | | | (18,200 | ) | | | (377,468 | ) | | | (0.52 | ) |
|
| Specialty Chemicals–(1.48)% | |
International Flavors & Fragrances Inc. | | | (7,300 | ) | | | (1,076,166 | ) | | | (1.48 | ) |
|
| Specialty Stores–(1.36)% | |
Tractor Supply Co. | | | (17,200 | ) | | | (1,036,472 | ) | | | (1.36 | ) |
|
| Thrifts & Mortgage Finance–(1.45)% | |
New York Community Bancorp Inc. | | | (84,000 | ) | | | (1,055,040 | ) | | | (1.45 | ) |
|
| Trucking–(0.37)% | |
AMERCO | | | (720 | ) | | | (282,701 | ) | | | (0.37 | ) |
Total Equity Securities — Short | | | $ | (73,161,244 | ) | | | (100.00 | ) |
See accompanying Notes to Financial Statements which are an integral part of the financial statements.
14 Invesco Long/Short Equity Fund
Statement of Assets and Liabilities
October 31, 2017
| | | | |
Assets: | |
Investments in securities, at value (Cost $60,313,933) | | $ | 69,632,676 | |
Investments in affiliated money market funds, at value and cost | | | 3,190,567 | |
Other investments: | | | | |
Swaps receivable — OTC | | | 38,395 | |
Unrealized appreciation on swap agreements — OTC | | | 610,240 | |
Deposits with brokers: | | | | |
Cash Collateral — OTC derivatives | | | 50,175 | |
Receivable for: | | | | |
Investments sold | | | 5,555,857 | |
Fund shares sold | | | 224,562 | |
Dividends and interest | | | 37,998 | |
Investment for trustee deferred compensation and retirement plans | | | 7,371 | |
Other assets | | | 56,205 | |
Total assets | | | 79,404,046 | |
|
Liabilities: | |
Other investments: | | | | |
Swaps payable — OTC | | | 101,938 | |
Unrealized depreciation on swap agreements — OTC | | | 300,992 | |
Payable for: | | | | |
Investments purchased | | | 5,063,596 | |
Fund shares reacquired | | | 15,966 | |
Accrued fees to affiliates | | | 8,923 | |
Accrued trustees’ and officers’ fees and benefits | | | 1,933 | |
Accrued other operating expenses | | | 78,305 | |
Trustee deferred compensation and retirement plans | | | 7,371 | |
Total liabilities | | | 5,579,024 | |
Net assets applicable to shares outstanding | | $ | 73,825,022 | |
|
Net assets consist of: | |
Shares of beneficial interest | | $ | 53,980,448 | |
Undistributed net investment income | | | 4,976,325 | |
Undistributed net realized gain | | | 5,240,258 | |
Net unrealized appreciation | | | 9,627,991 | |
| | | $ | 73,825,022 | |
| | | | |
Net Assets: | |
Class A | | $ | 11,457,304 | |
Class C | | $ | 2,812,372 | |
Class R | | $ | 131,549 | |
Class Y | | $ | 12,144,985 | |
Class R5 | | $ | 46,762 | |
Class R6 | | $ | 47,232,050 | |
|
Shares outstanding, no par value, with an unlimited
number of shares authorized: | |
Class A | | | 870,975 | |
Class C | | | 218,741 | |
Class R | | | 10,075 | |
Class Y | | | 916,414 | |
Class R5 | | | 3,526 | |
Class R6 | | | 3,560,657 | |
Class A: | | | | |
Net asset value per share | | $ | 13.15 | |
Maximum offering price per share | | | | |
(Net asset value of $13.15 ¸ 94.50%) | | $ | 13.92 | |
Class C: | | | | |
Net asset value and offering price per share | | $ | 12.86 | |
Class R: | | | | |
Net asset value and offering price per share | | $ | 13.06 | |
Class Y: | | | | |
Net asset value and offering price per share | | $ | 13.25 | |
Class R5: | | | | |
Net asset value and offering price per share | | $ | 13.26 | |
Class R6: | | | | |
Net asset value and offering price per share | | $ | 13.26 | |
See accompanying Notes to Financial Statements which are an integral part of the financial statements.
15 Invesco Long/Short Equity Fund
Statement of Operations
For the year ended October 31, 2017
| | | | |
Investment income: | |
Dividends (net of foreign withholding taxes of $3,457) | | $ | 1,311,269 | |
Dividends from affiliated money market funds | | | 35,872 | |
Total investment income | | | 1,347,141 | |
| |
Expenses: | | | | |
Advisory fees | | | 639,607 | |
Administrative services fees | | | 50,000 | |
Custodian fees | | | 5,582 | |
Distribution fees: | | | | |
Class A | | | 32,324 | |
Class C | | | 24,972 | |
Class R | | | 518 | |
Transfer agent fees — A, C, R and Y | | | 30,753 | |
Transfer agent fees — R5 | | | 5 | |
Transfer agent fees — R6 | | | 393 | |
Trustees’ and officers’ fees and benefits | | | 21,020 | |
Registration and filing fees | | | 80,113 | |
Reports to shareholders | | | 25,325 | |
Professional services fees | | | 85,238 | |
Other | | | 10,117 | |
Total expenses | | | 1,005,967 | |
Less: Fees waived, expenses reimbursed and expense offset arrangement(s) | | | (25,680 | ) |
Net expenses | | | 980,287 | |
Net investment income | | | 366,854 | |
| |
Realized and unrealized gain (loss) from: | | | | |
Net realized gain from: | | | | |
Investment securities | | | 5,399,609 | |
Swap agreements | | | 6,044,089 | |
| | | | 11,443,698 | |
Change in net unrealized appreciation (depreciation) of: | | | | |
Investment securities | | | 6,775,199 | |
Swap agreements | | | (1,126,421 | ) |
| | | | 5,648,778 | |
Net realized and unrealized gain | | | 17,092,476 | |
Net increase in net assets resulting from operations | | $ | 17,459,330 | |
See accompanying Notes to Financial Statements which are an integral part of the financial statements.
16 Invesco Long/Short Equity Fund
Statement of Changes in Net Assets
For the years ended October 31, 2017 and 2016
| | | | | | | | |
| | | 2017 | | | 2016 | |
Operations: | | | | | |
Net investment income | | $ | 366,854 | | | $ | 413,490 | |
Net realized gain (loss) | | | 11,443,698 | | | | (5,154,166 | ) |
Change in net unrealized appreciation | | | 5,648,778 | | | | 3,611,483 | |
Net increase (decrease) in net assets resulting from operations | | | 17,459,330 | | | | (1,129,193 | ) |
| | |
Distributions to shareholders from net investment income: | | | | | | | | |
Class A | | | — | | | | (600,522 | ) |
Class C | | | — | | | | (125,377 | ) |
Class R | | | — | | | | (2,120 | ) |
Class Y | | | — | | | | (392,484 | ) |
Class R5 | | | — | | | | (29,196 | ) |
Class R6 | | | — | | | | (30,735 | ) |
Total distributions from net investment income | | | — | | | | (1,180,434 | ) |
| | |
Distributions to shareholders from net realized gains: | | | | | | | | |
Class A | | | (81,636 | ) | | | (61,333 | ) |
Class C | | | (16,680 | ) | | | (14,863 | ) |
Class R | | | (593 | ) | | | (227 | ) |
Class Y | | | (52,325 | ) | | | (37,978 | ) |
Class R5 | | | (3,814 | ) | | | (2,825 | ) |
Class R6 | | | (296,699 | ) | | | (2,974 | ) |
Total distributions from net realized gains | | | (451,747 | ) | | | (120,200 | ) |
| | |
Share transactions-net: | | | | | | | | |
Class A | | | (2,845,486 | ) | | | (131,605 | ) |
Class C | | | (155,873 | ) | | | 319,228 | |
Class R | | | 25,428 | | | | 47,832 | |
Class Y | | | 2,198,569 | | | | 641,681 | |
Class R5 | | | (614,953 | ) | | | 18,068 | |
Class R6 | | | (10,273,941 | ) | | | 45,877,671 | |
Net increase (decrease) in net assets resulting from share transactions | | | (11,666,256 | ) | | | 46,772,875 | |
Net increase in net assets | | | 5,341,327 | | | | 44,343,048 | |
| | |
Net assets: | | | | | | | | |
Beginning of year | | | 68,483,695 | | | | 24,140,647 | |
End of year (includes undistributed net investment income of $4,976,325 and $(1,441,667), respectively) | | $ | 73,825,022 | | | $ | 68,483,695 | |
See accompanying Notes to Financial Statements which are an integral part of the financial statements.
17 Invesco Long/Short Equity Fund
Notes to Financial Statements
October 31, 2017
NOTE 1—Significant Accounting Policies
Invesco Long/Short Equity Fund (the “Fund”) is a series portfolio of AIM Investment Funds (Invesco Investment Funds) (the “Trust”). The Trust is organized as a Delaware statutory trust and is registered under the Investment Company Act of 1940, as amended (the “1940 Act”), as an open-end series management investment company consisting of twenty separate series portfolios, each authorized to issue an unlimited number of shares of beneficial interest. The assets, liabilities and operations of each portfolio are accounted for separately. Information presented in these financial statements pertains only to the Fund. Matters affecting each portfolio or class will be voted on exclusively by the shareholders of such portfolio or class.
The Fund’s investment objective is to seek long-term capital appreciation.
The Fund currently consists of six different classes of shares: Class A, Class C, Class R, Class Y, Class R5 and Class R6. Class Y shares are available only to certain investors. Class A shares are sold with a front-end sales charge unless certain waiver criteria are met and under certain circumstances load waived shares may be subject to contingent deferred sales charges (“CDSC”). Class C shares are sold with a CDSC. Class R, Class Y, Class R5 and Class R6 shares are sold at net asset value.
The Fund is an investment company and accordingly follows the investment company accounting and reporting guidance in accordance with Financial Accounting Standards Board Accounting Standards Codification Topic 946, Financial Services – Investment Companies.
The following is a summary of the significant accounting policies followed by the Fund in the preparation of its financial statements.
| A. | Security Valuations — Securities, including restricted securities, are valued according to the following policy. |
A security listed or traded on an exchange (except convertible securities) is valued at its last sales price or official closing price as of the close of the customary trading session on the exchange where the security is principally traded, or lacking any sales or official closing price on a particular day, the security may be valued at the closing bid price on that day. Securities traded in the over-the-counter market are valued based on prices furnished by independent pricing services or market makers. When such securities are valued by an independent pricing service they may be considered fair valued. Futures contracts are valued at the final settlement price set by an exchange on which they are principally traded. Listed options are valued at the mean between the last bid and asked prices from the exchange on which they are principally traded. Options not listed on an exchange are valued by an independent source at the mean between the last bid and asked prices. For purposes of determining net asset value (“NAV”) per share, futures and option contracts generally are valued 15 minutes after the close of the customary trading session of the New York Stock Exchange (“NYSE”).
Investments in open-end and closed-end registered investment companies that do not trade on an exchange are valued at the end-of-day net asset value per share. Investments in open-end and closed-end registered investment companies that trade on an exchange are valued at the last sales price or official closing price as of the close of the customary trading session on the exchange where the security is principally traded.
Swap agreements are fair valued using an evaluated quote, if available, provided by an independent pricing service. Evaluated quotes provided by the pricing service are valued based on a model which may include end-of-day net present values, spreads, ratings, industry, company performance and returns of referenced assets. Centrally cleared swap agreements are valued at the daily settlement price determined by the relevant exchange or clearinghouse.
Debt obligations (including convertible securities) and unlisted equities are fair valued using an evaluated quote provided by an independent pricing service. Evaluated quotes provided by the pricing service may be determined without exclusive reliance on quoted prices, and may reflect appropriate factors such as institution-size trading in similar groups of securities, developments related to specific securities, dividend rate (for unlisted equities), yield (for debt obligations), quality, type of issue, coupon rate (for debt obligations), maturity (for debt obligations), individual trading characteristics and other market data. Pricing services generally value debt obligations assuming orderly transactions of institutional round lot size, but a fund may hold or transact in the same securities in smaller, odd lot sizes. Odd lots often trade at lower prices than institutional round lots. Debt obligations are subject to interest rate and credit risks. In addition, all debt obligations involve some risk of default with respect to interest and/or principal payments.
Foreign securities’ (including foreign exchange contracts) prices are converted into U.S. dollar amounts using the applicable exchange rates as of the close of the NYSE. If market quotations are available and reliable for foreign exchange-traded equity securities, the securities will be valued at the market quotations. Because trading hours for certain foreign securities end before the close of the NYSE, closing market quotations may become unreliable. If between the time trading ends on a particular security and the close of the customary trading session on the NYSE, events occur that the investment adviser determines are significant and make the closing price unreliable, the Fund may fair value the security. If the event is likely to have affected the closing price of the security, the security will be valued at fair value in good faith using procedures approved by the Board of Trustees. Adjustments to closing prices to reflect fair value may also be based on a screening process of an independent pricing service to indicate the degree of certainty, based on historical data, that the closing price in the principal market where a foreign security trades is not the current value as of the close of the NYSE. Foreign securities’ prices meeting the approved degree of certainty that the price is not reflective of current value will be priced at the indication of fair value from the independent pricing service. Multiple factors may be considered by the independent pricing service in determining adjustments to reflect fair value and may include information relating to sector indices, American Depositary Receipts and domestic and foreign index futures. Foreign securities may have additional risks including exchange rate changes, potential for sharply devalued currencies and high inflation, political and economic upheaval, the relative lack of issuer information, relatively low market liquidity and the potential lack of strict financial and accounting controls and standards.
Securities for which market prices are not provided by any of the above methods may be valued based upon quotes furnished by independent sources. The last bid price may be used to value equity securities. The mean between the last bid and asked prices is used to value debt obligations, including corporate loans.
Securities for which market quotations are not readily available or became unreliable are valued at fair value as determined in good faith by or under the supervision of the Trust’s officers following procedures approved by the Board of Trustees. Issuer specific events, market trends, bid/asked quotes of brokers and information providers and other market data may be reviewed in the course of making a good faith determination of a security’s fair value.
18 Invesco Long/Short Equity Fund
The Fund may invest in securities that are subject to interest rate risk, meaning the risk that the prices will generally fall as interest rates rise and, conversely, the prices will generally rise as interest rates fall. Specific securities differ in their sensitivity to changes in interest rates depending on their individual characteristics. Changes in interest rates may result in increased market volatility, which may affect the value and/or liquidity of certain Fund investments.
Valuations change in response to many factors including the historical and prospective earnings of the issuer, the value of the issuer’s assets, general economic conditions, interest rates, investor perceptions and market liquidity. Because of the inherent uncertainties of valuation, the values reflected in the financial statements may materially differ from the value received upon actual sale of those investments.
| B. | Securities Transactions and Investment Income — Securities transactions are accounted for on a trade date basis. Realized gains or losses on sales are computed on the basis of specific identification of the securities sold. Interest income (net of withholding tax, if any) is recorded on the accrual basis from settlement date. Dividend income (net of withholding tax, if any) is recorded on the ex-dividend date. |
The Fund may periodically participate in litigation related to Fund investments. As such, the Fund may receive proceeds from litigation settlements. Any proceeds received are included in the Statement of Operations as realized gain (loss) for investments no longer held and as unrealized gain (loss) for investments still held.
Brokerage commissions and mark ups are considered transaction costs and are recorded as an increase to the cost basis of securities purchased and/or a reduction of proceeds on a sale of securities. Such transaction costs are included in the determination of net realized and unrealized gain (loss) from investment securities reported in the Statement of Operations and the Statement of Changes in Net Assets and the net realized and unrealized gains (losses) on securities per share in the Financial Highlights. Transaction costs are included in the calculation of the Fund’s net asset value and, accordingly, they reduce the Fund’s total returns. These transaction costs are not considered operating expenses and are not reflected in net investment income reported in the Statement of Operations and the Statement of Changes in Net Assets, or the net investment income per share and the ratios of expenses and net investment income reported in the Financial Highlights, nor are they limited by any expense limitation arrangements between the Fund and the investment adviser.
The Fund allocates income and realized and unrealized capital gains and losses to a class based on the relative net assets of each class.
| C. | Country Determination — For the purposes of making investment selection decisions and presentation in the Schedule of Investments, the investment adviser may determine the country in which an issuer is located and/or credit risk exposure based on various factors. These factors include the laws of the country under which the issuer is organized, where the issuer maintains a principal office, the country in which the issuer derives 50% or more of its total revenues and the country that has the primary market for the issuer’s securities, as well as other criteria. Among the other criteria that may be evaluated for making this determination are the country in which the issuer maintains 50% or more of its assets, the type of security, financial guarantees and enhancements, the nature of the collateral and the sponsor organization. Country of issuer and/or credit risk exposure has been determined to be the United States of America, unless otherwise noted. |
| D. | Distributions — Distributions from net investment income and net realized capital gain, if any, are generally declared and paid annually and recorded on the ex-dividend date. The Fund may elect to treat a portion of the proceeds from redemptions as distributions for federal income tax purposes. |
| E. | Federal Income Taxes — The Fund intends to comply with the requirements of Subchapter M of the Internal Revenue Code of 1986, as amended (the “Internal Revenue Code”), necessary to qualify as a regulated investment company and to distribute substantially all of the Fund’s taxable earnings to shareholders. As such, the Fund will not be subject to federal income taxes on otherwise taxable income (including net realized capital gain) that is distributed to shareholders. Therefore, no provision for federal income taxes is recorded in the financial statements. |
The Fund recognizes the tax benefits of uncertain tax positions only when the position is more likely than not to be sustained. Management has analyzed the Fund’s uncertain tax positions and concluded that no liability for unrecognized tax benefits should be recorded related to uncertain tax positions. Management is not aware of any tax positions for which it is reasonably possible that the total amounts of unrecognized tax benefits will change materially in the next 12 months.
The Fund files tax returns in the U.S. Federal jurisdiction and certain other jurisdictions. Generally, the Fund is subject to examinations by such taxing authorities for up to three years after the filing of the return for the tax period.
| F. | Expenses — Fees provided for under the Rule 12b-1 plan of a particular class of the Fund are charged to the operations of such class. Transfer agency fees and expenses and other shareholder recordkeeping fees and expenses attributable to Class R5 and Class R6 are allocated to each share class based on relative net assets. Sub-accounting fees attributable to Class R5 are charged to the operations of the class. Transfer agency fees and expenses and other shareholder recordkeeping fees and expenses relating to all other classes are allocated among those classes based on relative net assets. All other expenses are allocated among the classes based on relative net assets. |
| G. | Accounting Estimates — The preparation of financial statements in conformity with accounting principles generally accepted in the United States of America (“GAAP”) requires management to make estimates and assumptions that affect the reported amounts of assets and liabilities at the date of the financial statements and the reported amounts of revenues and expenses during the reporting period including estimates and assumptions related to taxation. Actual results could differ from those estimates by a significant amount. In addition, the Fund monitors for material events or transactions that may occur or become known after the period-end date and before the date the financial statements are released to print. |
| H. | Indemnifications — Under the Trust’s organizational documents, each Trustee, officer, employee or other agent of the Trust is indemnified against certain liabilities that may arise out of the performance of their duties to the Fund. Additionally, in the normal course of business, the Fund enters into contracts, including the Fund’s servicing agreements, that contain a variety of indemnification clauses. The Fund’s maximum exposure under these arrangements is unknown as this would involve future claims that may be made against the Fund that have not yet occurred. The risk of material loss as a result of such indemnification claims is considered remote. |
| I. | Swap Agreements — The Fund may enter into various swap transactions, including interest rate, total return, volatility, variance, index, currency and credit default swap contracts (“CDS”) for investment purposes or to manage interest rate, equity, currency or credit risk. Such transactions are agreements between two parties (“Counterparties”). These agreements may contain among other conditions, events of default and termination events, and various covenants and representations such as provisions that require the Fund to maintain a pre-determined level of net assets, and/or provide limits regarding the decline of the Fund’s NAV over specific periods of time. If the Fund were to trigger such provisions and have open derivative positions at that time, the Counterparty may be able to terminate such agreement and request immediate payment in an amount equal to the net liability positions, if any. |
19 Invesco Long/Short Equity Fund
Interest rate, total return, volatility, variance, index, and currency swap agreements are two-party contracts entered into primarily to exchange the returns (or differentials in rates of returns) earned or realized on particular predetermined investments or instruments. The gross returns to be exchanged or “swapped” between the parties are calculated with respect to a notional amount, i.e., the return on or increase in value of a particular dollar amount invested at a particular interest rate or return of an underlying asset, in a particular foreign currency, or in a “basket” of securities representing a particular index.
A total return swap is an agreement in which one party makes payments based on a set rate, either fixed or variable, while the other party makes payments based on the return of an underlying asset, which includes both the income generated and capital gains, if any. The unrealized appreciation (depreciation) on total return swaps includes dividends on the underlying equity securities and financing rate payable from the Counterparty. At the maturity date, a net cash flow is exchanged where the total return is equivalent to the return of the underlying reference less a financing rate, if any. As a receiver, the Fund would receive payments based on any positive total return and would owe payments in the event of a negative total return. As the payer, the Fund would owe payments on any net positive total return, and would receive payment in the event of a negative total return.
Changes in the value of swap agreements are recognized as unrealized gains (losses) in the Statement of Operations by “marking to market” on a daily basis to reflect the value of the swap agreement at the end of each trading day. Payments received or paid at the beginning of the agreement are reflected as such on the Statement of Assets and Liabilities and may be referred to as upfront payments. The Fund accrues for the fixed payment stream and amortizes upfront payments, if any, on swap agreements on a daily basis with the net amount, recorded as a component of realized gain (loss) on the Statement of Operations. A liquidation payment received or made at the termination of a swap agreement is recorded as realized gain (loss) on the Statement of Operations. The Fund segregates cash or liquid securities having a value at least equal to the amount of the potential obligation of a Fund under any swap transaction. Cash held as collateral is recorded as deposits with brokers on the Statement of Assets and Liabilities. Entering into these agreements involves, to varying degrees, lack of liquidity and elements of credit, market, and Counterparty risk in excess of amounts recognized on the Statement of Assets and Liabilities. Such risks involve the possibility that a swap is difficult to sell or liquidate; the Counterparty does not honor its obligations under the agreement and unfavorable interest rates and market fluctuations. It is possible that developments in the swaps market, including potential government regulation, could adversely affect the Fund’s ability to terminate existing swap agreements or to realize amounts to be received under such agreements. A short position in a security poses more risk than holding the same security long. As there is no limit on how much the price of the security can increase, the Fund’s exposure is unlimited.
| J. | Leverage Risk — Leverage exists when the Fund can lose more than it originally invests because it purchases or sells an instrument or enters into a transaction without investing an amount equal to the full economic exposure of the instrument or transaction. |
| K. | Collateral — To the extent the Fund has designated or segregated a security as collateral and that security is subsequently sold, it is the Fund’s practice to replace such collateral no later than the next business day. |
NOTE 2—Advisory Fees and Other Fees Paid to Affiliates
The Trust has entered into a master investment advisory agreement with Invesco Advisers, Inc. (the “Adviser” or “Invesco”). Effective January 1, 2017, under the terms of the investment advisory agreement, the Fund accrues daily and pays monthly an advisory fee to the Adviser based on the annual rate of the Fund’s average daily net assets as follows:
| | | | |
| Average Daily Net Assets | | Rate | |
First $250 million | | | 0.80% | |
Next $250 million | | | 0.77% | |
Next $500 million | | | 0.75% | |
Next $1.5 billion | | | 0.72% | |
Next $2.5 billion | | | 0.70% | |
Next $2.5 billion | | | 0.67% | |
Next $2.5 billion | | | 0.65% | |
Over $10 billion | | | 0.62% | |
Prior to January 1, 2017, the Fund paid an advisory fee to the Adviser based on the annual rate of the Fund’s average daily net assets as follows:
| | | | |
| Average Daily Net Assets | | Rate | |
First $10 billion | | | 1.25% | |
Over $10 billion | | | 1.15% | |
For the year ended October 31, 2017, the effective advisory fees incurred by the Fund was 0.87%.
Under the terms of a master sub-advisory agreement between the Adviser and each of Invesco Asset Management Deutschland GmbH, Invesco Asset Management Limited, Invesco Asset Management (Japan) Limited, Invesco Hong Kong Limited, Invesco Senior Secured Management, Inc. and Invesco Canada Ltd. and separate sub-advisory agreements with Invesco PowerShares Capital Management LLC and Invesco Asset Management (India) Private Limited (collectively, the “Affiliated Sub-Advisers”) the Adviser, not the Fund, will pay 40% of the fees paid to the Adviser to any such Affiliated Sub-Adviser(s) that provide(s) discretionary investment management services to the Fund based on the percentage of assets allocated to such Affiliated Sub-Adviser(s).
Effective January 1, 2017, the Adviser has contractually agreed, through at least February 28, 2019, to waive advisory fees and/or reimburse expenses to the extent necessary to limit total annual fund operating expenses after fee waiver and/or expense reimbursement (excluding certain items discussed below) of Class A, Class C, Class R, Class Y, Class R5 and Class R6 shares to 1.59%, 2.34%, 1.84%, 1.34%, 1.34% and 1.34%, respectively, of the Fund’s average daily net assets (the “expense limits”). Prior to January 1, 2017, the Adviser had contractually agreed to waive advisory fees and/or reimburse expenses to the extent necessary to limit total annual fund operating expenses after fee waiver and/or expense reimbursement (excluding certain items discussed below) of Class A, Class C, Class R, Class Y, Class R5 and Class R6 shares to 1.87%, 2.62%, 2.12%,
20 Invesco Long/Short Equity Fund
1.62%, 1.62% and 1.62%, respectively, of the Fund’s average daily net assets. In determining the Adviser’s obligation to waive advisory fees and/or reimburse expenses, the following expenses are not taken into account, and could cause total annual fund operating expenses after fee waiver and/or expense reimbursement to exceed the numbers reflected above: (1) interest; (2) taxes; (3) dividend expense on short sales; (4) extraordinary or non-routine items, including litigation expenses; and (5) expenses that the Fund has incurred but did not actually pay because of an expense offset arrangement. Unless Invesco continues the fee waiver agreement, it will terminate on February 28, 2019. During its term, the fee waiver agreement cannot be terminated or amended to increase the expense limits or reduce the advisory fee waiver without approval of the Board of Trustees.
Further, the Adviser has contractually agreed, through at least June 30, 2019, to waive the advisory fee payable by the Fund in an amount equal to 100% of the net advisory fees the Adviser receives from the affiliated money market funds on investments by the Fund of uninvested cash in such affiliated money market funds.
For the year ended October 31, 2017, the Adviser waived advisory fees of $20,252 and reimbursed class level expenses of $2,556, $494, $20, $2,019, $1 and $98 of Class A, Class C, Class R, Class Y, Class R5 and Class R6 shares, respectively.
The Trust has entered into a master administrative services agreement with Invesco pursuant to which the Fund has agreed to pay Invesco for certain administrative costs incurred in providing accounting services to the Fund. For the year ended October 31, 2017, expenses incurred under the agreement are shown in the Statement of Operations as Administrative services fees.
The Trust has entered into a transfer agency and service agreement with Invesco Investment Services, Inc. (“IIS”) pursuant to which the Fund has agreed to pay IIS a fee for providing transfer agency and shareholder services to the Fund and reimburse IIS for certain expenses incurred by IIS in the course of providing such services. IIS may make payments to intermediaries that provide omnibus account services, sub-accounting services and/or networking services. All fees payable by IIS to intermediaries that provide omnibus account services or sub-accounting services are charged back to the Fund, subject to certain limitations approved by the Trust’s Board of Trustees. For the year ended October 31, 2017, expenses incurred under the agreement are shown in the Statement of Operations as Transfer agent fees.
The Trust has entered into master distribution agreements with Invesco Distributors, Inc. (“IDI”) to serve as the distributor for the Class A, Class C, Class R, Class Y, Class R5 and Class R6 shares of the Fund. The Trust has adopted plans pursuant to Rule 12b-1 under the 1940 Act with respect to the Fund’s Class A, Class C and Class R shares (collectively the “Plans”). The Fund, pursuant to the Plans, pays IDI compensation at the annual rate of 0.25% of the Fund’s average daily net assets of Class A shares, 1.00% of the average daily net assets of Class C shares and 0.50% of the average daily net assets of Class R shares. The fees are accrued daily and paid monthly. Of the Plan payments, up to 0.25% of the average daily net assets of each class of shares may be paid to furnish continuing personal shareholder services to customers who purchase and own shares of such classes. Any amounts not paid as a service fee under the Plans would constitute an asset-based sales charge. Rules of the Financial Industry Regulatory Authority (“FINRA”) impose a cap on the total sales charges, including asset-based sales charges, that may be paid by any class of shares of the Fund. For the year ended October 31, 2017, expenses incurred under the Plans are shown in the Statement of Operations as Distribution fees.
Front-end sales commissions and CDSC (collectively, the “sales charges”) are not recorded as expenses of the Fund. Front-end sales commissions are deducted from proceeds from the sales of Fund shares prior to investment in Class A shares of the Fund. CDSC are deducted from redemption proceeds prior to remittance to the shareholder. During the year ended October 31, 2017, IDI advised the Fund that IDI retained $2,343 in front-end sales commissions from the sale of Class A shares and $412 from Class C shares for CDSC imposed upon redemptions by shareholders.
Certain officers and trustees of the Trust are officers and directors of the Adviser, IIS and/or IDI.
NOTE 3—Additional Valuation Information
GAAP defines fair value as the price that would be received to sell an asset or paid to transfer a liability in an orderly transaction between market participants at the measurement date, under current market conditions. GAAP establishes a hierarchy that prioritizes the inputs to valuation methods, giving the highest priority to readily available unadjusted quoted prices in an active market for identical assets (Level 1) and the lowest priority to significant unobservable inputs (Level 3), generally when market prices are not readily available or are unreliable. Based on the valuation inputs, the securities or other investments are tiered into one of three levels. Changes in valuation methods may result in transfers in or out of an investment’s assigned level:
| | Level 1 — | Prices are determined using quoted prices in an active market for identical assets. |
| | Level 2 — | Prices are determined using other significant observable inputs. Observable inputs are inputs that other market participants may use in pricing a security. These may include quoted prices for similar securities, interest rates, prepayment speeds, credit risk, yield curves, loss severities, default rates, discount rates, volatilities and others. |
| | Level 3 — | Prices are determined using significant unobservable inputs. In situations where quoted prices or observable inputs are unavailable (for example, when there is little or no market activity for an investment at the end of the period), unobservable inputs may be used. Unobservable inputs reflect the Fund’s own assumptions about the factors market participants would use in determining fair value of the securities or instruments and would be based on the best available information. |
The following is a summary of the tiered valuation input levels, as of October 31, 2017. The level assigned to the securities valuations may not be an indication of the risk or liquidity associated with investing in those securities. Because of the inherent uncertainties of valuation, the values reflected in the financial statements may materially differ from the value received upon actual sale of those investments.
The Fund’s policy is to recognize transfers in and out of the valuation levels as of the end of the reporting period. During the year ended October 31, 2017, there were no material transfers between valuation levels.
| | | | | | | | | | | | | | | | |
| | | Level 1 | | | Level 2 | | | Level 3 | | | Total | |
Common Stocks & Other Equity Interests | | $ | 69,632,676 | | | $ | — | | | $ | — | | | $ | 69,632,676 | |
Money Market Funds | | | 3,190,567 | | | | — | | | | — | | | | 3,190,567 | |
| | | | 72,823,243 | | | | — | | | | — | | | | 72,823,243 | |
Swap Agreements* | | | — | | | | 309,248 | | | | — | | | | 309,248 | |
Total Investments | | $ | 72,823,243 | | | $ | 309,248 | | | $ | — | | | $ | 73,132,491 | |
| * | Unrealized appreciation. |
21 Invesco Long/Short Equity Fund
NOTE 4—Derivative Investments
The Fund may enter into an International Swaps and Derivatives Association Master Agreement (“ISDA Master Agreement”) under which a Fund may trade OTC derivatives. An OTC transaction entered into under an ISDA Master Agreement typically involves a collateral posting arrangement, payment netting provisions and close-out netting provisions. These netting provisions allow for reduction of credit risk through netting of contractual obligations. The enforceability of the netting provisions of the ISDA Master Agreement depends on the governing law of the ISDA Master Agreement, among other factors.
For financial reporting purposes, the Fund does not offset OTC derivative assets or liabilities that are subject to ISDA Master Agreements in the Statement of Assets and Liabilities.
Value of Derivative Investments at Period-End
The table below summarizes the value of the Fund’s derivative investments, detailed by primary risk exposure, held as of October 31, 2017:
| | | | |
| | | Value | |
| Derivative Assets | | Equity
Risk | |
Unrealized depreciation on swap agreements — OTC | | $ | 610,240 | |
Derivatives not subject to master netting agreements | | | — | |
Total Derivative Liabilities subject to master netting agreements | | $ | 610,240 | |
| |
| | | Value | |
| Derivative Liabilities | | Equity
Risk | |
Unrealized depreciation on swap agreements — OTC | | $ | (300,992 | ) |
Derivatives not subject to master netting agreements | | | — | |
Total Derivative Liabilities subject to master netting agreements | | $ | (300,992 | ) |
Offsetting Assets and Liabilities
The table below reflects the Fund’s exposure to Counterparties subject to either an ISDA Master Agreement or other agreement for OTC derivative transactions as of October 31, 2017.
| | | | | | | | | | | | | | | | | | | | | | | | |
| | | Financial
Derivative Assets | | | Financial
Derivative Liabilities | | | | | | Collateral
(Received)/Pledged | | | | |
| Counterparty | | Swap Agreements | | | Swap Agreements | | | Net Value of
Derivatives | | | Non-Cash | | | Cash | | | Net
Amount | |
Morgan Stanley & Co. LLC | | $ | 648,635 | | | $ | (402,930 | ) | | $ | 245,705 | | | $ | — | | | $ | — | | | $ | 245,705 | |
Effect of Derivative Investments for the year ended October 31, 2017
The table below summarizes the gains (losses) on derivative investments, detailed by primary risk exposure, recognized in earnings during the period:
| | | | |
| | | Location of Gain (Loss) on
Statement of Operations | |
| | | Equity
Risk | |
Realized Gain: | | | | |
Swap agreements | | $ | 6,044,089 | |
Change in Net Unrealized Appreciation (Depreciation): | | | | |
Swap agreements | | | (1,126,421 | ) |
Total | | $ | 4,917,668 | |
The table below summarizes the average notional value of swap agreements outstanding during the period.
| | | | |
| | | Swap
Agreements | |
Average notional value | | $ | 145,950,985 | |
NOTE 5—Expense Offset Arrangement(s)
The expense offset arrangement is comprised of transfer agency credits which result from balances in demand deposit accounts used by the transfer agent for clearing shareholder transactions. For the year ended October 31, 2017, the Fund received credits from this arrangement, which resulted in the reduction of the Fund’s total expenses of $240.
NOTE 6—Trustees’ and Officers’ Fees and Benefits
Trustees’ and Officers’ Fees and Benefits include amounts accrued by the Fund to pay remuneration to certain Trustees and Officers of the Fund. Trustees have the option to defer compensation payable by the Fund, and Trustees’ and Officers’ Fees and Benefits also include amounts accrued by the Fund to fund such deferred compensation amounts. Those Trustees who defer compensation have the option to select various Invesco Funds in which their deferral accounts shall be deemed to be invested. Obligations under the deferred compensation plan represent unsecured claims against the general assets of the Fund.
22 Invesco Long/Short Equity Fund
NOTE 7—Cash Balances
The Fund is permitted to temporarily carry a negative or overdrawn balance in its account with State Street Bank and Trust Company, the custodian bank. Such balances, if any at period-end, are shown in the Statement of Assets and Liabilities under the payable caption Amount due custodian. To compensate the custodian bank for such overdrafts, the overdrawn Fund may either (1) leave funds as a compensating balance in the account so the custodian bank can be compensated by earning the additional interest; or (2) compensate by paying the custodian bank at a rate agreed upon by the custodian bank and Invesco, not to exceed the contractually agreed upon rate.
NOTE 8—Distributions to Shareholders and Tax Components of Net Assets
Tax Character of Distributions to Shareholders Paid During the Fiscal Years Ended October 31, 2017 and 2016:
| | | | | | | | |
| | | 2017 | | | 2016 | |
Ordinary income | | $ | — | | | $ | 1,132,066 | |
Long-term capital gain | | | 451,747 | | | | 168,568 | |
Total distributions | | $ | 451,747 | | | $ | 1,300,634 | |
Tax Components of Net Assets at Period-End:
| | | | |
| | | 2017 | |
Undistributed ordinary income | | $ | 6,913,626 | |
Undistributed long-term gain | | | 3,627,444 | |
Net unrealized appreciation — investments | | | 9,310,053 | |
Temporary book/tax differences | | | (6,549 | ) |
Shares of beneficial interest | | | 53,980,448 | |
Total net assets | | $ | 73,825,022 | |
The difference between book-basis and tax-basis unrealized appreciation (depreciation) is due to differences in the timing of recognition of gains and losses on investments for tax and book purposes. The Fund’s net unrealized appreciation difference is attributable primarily to swap agreements and wash sales.
The temporary book/tax differences are a result of timing differences between book and tax recognition of income and/or expenses. The Fund’s temporary book/tax differences are the result of the trustee deferral of compensation and retirement plan benefits.
Capital loss carryforward is calculated and reported as of a specific date. Results of transactions and other activity after that date may affect the amount of capital loss carryforward actually available for the Fund to utilize. The ability to utilize capital loss carryforward in the future may be limited under the Internal Revenue Code and related regulations based on the results of future transactions.
The Fund does not have a capital loss carryforward as of October 31, 2017.
NOTE 9—Investment Transactions
The aggregate amount of investment securities (other than short-term securities, U.S. Treasury obligations and money market funds, if any) purchased and sold by the Fund during the year ended October 31, 2017 was $62,935,954 and $70,940,542, respectively. Cost of investments, including any derivatives, on a tax basis includes the adjustments for financial reporting purposes as of the most recently completed federal income tax reporting period-end.
| | | | |
| Unrealized Appreciation (Depreciation) of Investments on a Tax Basis | |
Aggregate unrealized appreciation of investments | | $ | 10,821,412 | |
Aggregate unrealized (depreciation) of investments | | | (1,511,359 | ) |
Net unrealized appreciation of investments | | $ | 9,310,053 | |
Cost of investments for tax purposes is $63,822,438.
NOTE 10—Reclassification of Permanent Differences
Primarily as a result of differing book/tax treatment of swap agreements, on October 31, 2017, undistributed net investment income was increased by $6,051,138, undistributed net realized gain was decreased by $6,037,991 and shares of beneficial interest was decreased by $13,147. This reclassification had no effect on the net assets of the Fund.
23 Invesco Long/Short Equity Fund
NOTE 11—Share Information
| | | | | | | | | | | | | | | | |
| | | Summary of Share Activity | |
| | | Years ended October 31, | |
| | | 2017(a) | | | 2016 | |
| | | Shares | | | Amount | | | Shares | | | Amount | |
Sold: | | | | | | | | | | | | | | | | |
Class A | | | 304,596 | | | $ | 3,646,029 | | | | 485,055 | | | $ | 5,239,306 | |
Class C | | | 46,302 | | | | 524,043 | | | | 122,278 | | | | 1,335,132 | |
Class R | | | 3,850 | | | | 46,256 | | | | 4,388 | | | | 46,734 | |
Class Y | | | 431,307 | | | | 5,111,591 | | | | 237,370 | | | | 2,565,330 | |
Class R5 | | | 1,004 | | | | 11,943 | | | | 1,739 | | | | 18,068 | |
Class R6(b) | | | 278,872 | | | | 3,188,531 | | | | 4,517,701 | | | | 47,595,766 | |
| | | | |
Issued as reinvestment of dividends: | | | | | | | | | | | | | | | | |
Class A | | | 5,622 | | | | 66,343 | | | | 33,564 | | | | 364,508 | |
Class C | | | 1,371 | | | | 15,922 | | | | 11,487 | | | | 123,718 | |
Class R | | | 44 | | | | 519 | | | | 162 | | | | 1,762 | |
Class Y | | | 1,371 | | | | 16,268 | | | | 12,205 | | | | 132,915 | |
Class R5 | | | 11 | | | | 129 | | | | — | | | | — | |
Class R6 | | | 24,685 | | | | 293,014 | | | | 155 | | | | 1,688 | |
| | | | |
Reacquired: | | | | | | | | | | | | | | | | |
Class A | | | (545,259 | ) | | | (6,557,858 | ) | | | (529,912 | ) | | | (5,735,419 | ) |
Class C | | | (60,626 | ) | | | (695,838 | ) | | | (109,262 | ) | | | (1,139,622 | ) |
Class R | | | (1,834 | ) | | | (21,347 | ) | | | (63 | ) | | | (664 | ) |
Class Y | | | (240,137 | ) | | | (2,929,290 | ) | | | (192,505 | ) | | | (2,056,564 | ) |
Class R5 | | | (49,229 | ) | | | (627,025 | ) | | | — | | | | — | |
Class R6 | | | (1,150,985 | ) | | | (13,755,486 | ) | | | (162,427 | ) | | | (1,719,783 | ) |
Net increase (decrease) in share activity | | | (949,035 | ) | | $ | (11,666,256 | ) | | | 4,431,935 | | | $ | 46,772,875 | |
| (a) | There is an entity that is a record owner of more than 5% of the outstanding shares of the Fund and owns 11% of the outstanding shares of the Fund. IDI has an agreement with this entity to sell Fund shares. The Fund, Invesco and/or Invesco affiliates may make payments to this entity, which is considered to be related to the Fund, for providing services to the Fund, Invesco and/or Invesco affiliates including but not limited to services such as, securities brokerage, distribution, third party record keeping and account servicing. The Fund has no knowledge as to whether all or any portion of the shares owned of record by this entity are also owned beneficially. |
| | In addition, 70% of the outstanding shares of the Fund are owned by the Adviser or an affiliate of the Adviser. |
| (b) | On February 18, 2016, 4,184,012 Class R6 shares valued at $44,099,486 were sold to affiliated mutual funds. |
24 Invesco Long/Short Equity Fund
NOTE 12—Financial Highlights
The following schedule presents financial highlights for a share of the Fund outstanding throughout the periods indicated.
| | | | | | | | | | | | | | | | | | | | | | | | | | | | | | | | | | | | | | | | | | | | | | | | | | | | | | | | |
| | | Net asset
value,
beginning
of period | | | Net
investment
income
(loss)(a) | | | Net gains
(losses)
on securities
(both
realized and
unrealized) | | | Total from
investment
operations | | | Dividends
from net
investment
income | | | Distributions
from net
realized
gains | | | Total
distributions | | | Net asset
value, end
of period | | | Total
return(b) | | | Net assets,
end of period
(000’s omitted) | | | Ratio of
expenses
to average
net assets
with fee waivers
and/or expenses
absorbed | | | Ratio of
expenses
to average net
assets without
fee waivers
and/or expenses
absorbed | | | Ratio of net
investment
income (loss)
to average
net assets | | | Portfolio
turnover(c) | |
Class A | | | | | | | | | | | | | | | | | | | | | | | | | | | | | | | | | | | | | | | | | | | | | | | | | | | | | | | | |
Year ended 10/31/17 | | $ | 10.45 | | | $ | 0.03 | | | $ | 2.74 | | | $ | 2.77 | | | $ | — | | | $ | (0.07 | ) | | $ | (0.07 | ) | | $ | 13.15 | | | | 26.62 | % | | $ | 11,457 | | | | 1.57 | %(d) | | | 1.62 | %(d) | | | 0.27 | %(d) | | | 95 | % |
Year ended 10/31/16 | | | 11.50 | | | | 0.06 | (e) | | | (0.50 | ) | | | (0.44 | ) | | | (0.55 | ) | | | (0.06 | ) | | | (0.61 | ) | | | 10.45 | | | | (4.03 | ) | | | 11,562 | | | | 1.85 | | | | 2.08 | | | | 0.58 | (e) | | | 102 | |
Year ended 10/31/15 | | | 11.00 | | | | 0.01 | | | | 0.49 | | | | 0.50 | | | | — | | | | (0.00 | ) | | | — | | | | 11.50 | | | | 4.57 | | | | 12,854 | | | | 1.85 | | | | 2.76 | | | | 0.11 | | | | 89 | |
Year ended 10/31/14(f) | | | 10.00 | | | | (0.02 | ) | | | 1.02 | | | | 1.00 | | | | — | | | | — | | | | — | | | | 11.00 | | | | 10.00 | | | | 16,796 | | | | 1.85 | (g) | | | 3.04 | (g) | | | (0.25 | )(g) | | | 102 | |
Class C | | | | | | | | | | | | | | | | | | | | | | | | | | | | | | | | | | | | | | | | | | | | | | | | | | | | | | | | |
Year ended 10/31/17 | | | 10.30 | | | | (0.06 | ) | | | 2.69 | | | | 2.63 | | | | — | | | | (0.07 | ) | | | (0.07 | ) | | | 12.86 | | | | 25.65 | | | | 2,812 | | | | 2.32 | (d) | | | 2.37 | (d) | | | (0.48 | )(d) | | | 95 | |
Year ended 10/31/16 | | | 11.34 | | | | (0.02 | )(e) | | | (0.48 | ) | | | (0.50 | ) | | | (0.48 | ) | | | (0.06 | ) | | | (0.54 | ) | | | 10.30 | | | | (4.68 | ) | | | 2,385 | | | | 2.60 | | | | 2.83 | | | | (0.17 | )(e) | | | 102 | |
Year ended 10/31/15 | | | 10.92 | | | | (0.07 | ) | | | 0.49 | | | | 0.42 | | | | — | | | | (0.00 | ) | | | — | | | | 11.34 | | | | 3.87 | | | | 2,350 | | | | 2.60 | | | | 3.51 | | | | (0.64 | ) | | | 89 | |
Year ended 10/31/14(f) | | | 10.00 | | | | (0.10 | ) | | | 1.02 | | | | 0.92 | | | | — | | | | — | | | | — | | | | 10.92 | | | | 9.20 | | | | 2,618 | | | | 2.60 | (g) | | | 3.79 | (g) | | | (1.00 | )(g) | | | 102 | |
Class R | | | | | | | | | | | | | | | | | | | | | | | | | | | | | | | | | | | | | | | | | | | | | | | | | | | | | | | | |
Year ended 10/31/17 | | | 10.40 | | | | 0.00 | | | | 2.73 | | | | 2.73 | | | | — | | | | (0.07 | ) | | | (0.07 | ) | | | 13.06 | | | | 26.37 | | | | 132 | | | | 1.82 | (d) | | | 1.87 | (d) | | | 0.02 | (d) | | | 95 | |
Year ended 10/31/16 | | | 11.45 | | | | 0.04 | (e) | | | (0.50 | ) | | | (0.46 | ) | | | (0.53 | ) | | | (0.06 | ) | | | (0.59 | ) | | | 10.40 | | | | (4.27 | ) | | | 83 | | | | 2.10 | | | | 2.33 | | | | 0.33 | (e) | | | 102 | |
Year ended 10/31/15 | | | 10.98 | | | | (0.02 | ) | | | 0.49 | | | | 0.47 | | | | — | | | | (0.00 | ) | | | — | | | | 11.45 | | | | 4.31 | | | | 40 | | | | 2.10 | | | | 3.01 | | | | (0.14 | ) | | | 89 | |
Year ended 10/31/14(f) | | | 10.00 | | | | (0.04 | ) | | | 1.02 | | | | 0.98 | | | | — | | | | — | | | | — | | | | 10.98 | | | | 9.80 | | | | 27 | | | | 2.10 | (g) | | | 3.29 | (g) | | | (0.50 | )(g) | | | 102 | |
Class Y | | | | | | | | | | | | | | | | | | | | | | | | | | | | | | | | | | | | | | | | | | | | | | | | | | | | | | | | |
Year ended 10/31/17 | | | 10.51 | | | | 0.06 | | | | 2.75 | | | | 2.81 | | | | — | | | | (0.07 | ) | | | (0.07 | ) | | | 13.25 | | | | 26.85 | | | | 12,145 | | | | 1.32 | (d) | | | 1.37 | (d) | | | 0.52 | (d) | | | 95 | |
Year ended 10/31/16 | | | 11.56 | | | | 0.09 | (e) | | | (0.50 | ) | | | (0.41 | ) | | | (0.58 | ) | | | (0.06 | ) | | | (0.64 | ) | | | 10.51 | | | | (3.74 | ) | | | 7,604 | | | | 1.60 | | | | 1.83 | | | | 0.83 | (e) | | | 102 | |
Year ended 10/31/15 | | | 11.02 | | | | 0.04 | | | | 0.50 | | | | 0.54 | | | | — | | | | (0.00 | ) | | | — | | | | 11.56 | | | | 4.93 | | | | 7,709 | | | | 1.60 | | | | 2.51 | | | | 0.36 | | | | 89 | |
Year ended 10/31/14(f) | | | 10.00 | | | | 0.00 | | | | 1.02 | | | | 1.02 | | | | — | | | | — | | | | — | | | | 11.02 | | | | 10.20 | | | | 12,389 | | | | 1.60 | (g) | | | 2.79 | (g) | | | 0.00 | (g) | | | 102 | |
Class R5 | | | | | | | | | | | | | | | | | | | | | | | | | | | | | | | | | | | | | | | | | | | | | | | | | | | | | | | | |
Year ended 10/31/17 | | | 10.50 | | | | 0.07 | | | | 2.76 | | | | 2.83 | | | | — | | | | (0.07 | ) | | | (0.07 | ) | | | 13.26 | | | | 27.07 | | | | 47 | | | | 1.22 | (d) | | | 1.25 | (d) | | | 0.62 | (d) | | | 95 | |
Year ended 10/31/16 | | | 11.56 | | | | 0.09 | (e) | | | (0.51 | ) | | | (0.42 | ) | | | (0.58 | ) | | | (0.06 | ) | | | (0.64 | ) | | | 10.50 | | | | (3.83 | ) | | | 543 | | | | 1.60 | | | | 1.71 | | | | 0.83 | (e) | | | 102 | |
Year ended 10/31/15 | | | 11.02 | | | | 0.04 | | | | 0.50 | | | | 0.54 | | | | — | | | | (0.00 | ) | | | — | | | | 11.56 | | | | 4.93 | | | | 578 | | | | 1.60 | | | | 2.38 | | | | 0.36 | | | | 89 | |
Year ended 10/31/14(f) | | | 10.00 | | | | 0.00 | | | | 1.02 | | | | 1.02 | | | | — | | | | — | | | | — | | | | 11.02 | | | | 10.20 | | | | 718 | | | | 1.60 | (g) | | | 2.69 | (g) | | | 0.00 | (g) | | | 102 | |
Class R6 | | | | | | | | | | | | | | | | | | | | | | | | | | | | | | | | | | | | | | | | | | | | | | | | | | | | | | | | |
Year ended 10/31/17 | | | 10.50 | | | | 0.07 | | | | 2.76 | | | | 2.83 | | | | — | | | | (0.07 | ) | | | (0.07 | ) | | | 13.26 | | | | 27.07 | | | | 47,232 | | | | 1.22 | (d) | | | 1.25 | (d) | | | 0.62 | (d) | | | 95 | |
Year ended 10/31/16 | | | 11.56 | | | | 0.09 | (e) | | | (0.51 | ) | | | (0.42 | ) | | | (0.58 | ) | | | (0.06 | ) | | | (0.64 | ) | | | 10.50 | | | | (3.83 | ) | | | 46,305 | | | | 1.60 | | | | 1.71 | | | | 0.83 | (e) | | | 102 | |
Year ended 10/31/15 | | | 11.02 | | | | 0.04 | | | | 0.50 | | | | 0.54 | | | | — | | | | (0.00 | ) | | | — | | | | 11.56 | | | | 4.93 | | | | 609 | | | | 1.60 | | | | 2.38 | | | | 0.36 | | | | 89 | |
Year ended 10/31/14(f) | | | 10.00 | | | | 0.00 | | | | 1.02 | | | | 1.02 | | | | — | | | | — | | | | — | | | | 11.02 | | | | 10.20 | | | | 562 | | | | 1.60 | (g) | | | 2.69 | (g) | | | 0.00 | (g) | | | 102 | |
| (a) | Calculated using average shares outstanding. |
| (b) | Includes adjustments in accordance with accounting principles generally accepted in the United States of America and as such, the net asset value for financial reporting purposes and the returns based upon those net asset values may differ from the net asset value and returns for shareholder transactions. Does not include sales charges and is not annualized for periods less than one year, if applicable. |
| (c) | Portfolio turnover is calculated at the fund level and is not annualized for periods less than one year, if applicable. |
| (d) | Ratios are based on average daily net assets (000’s omitted) of $12,930, $2,497, $104, $10,214, $563 and $46,933 for Class A, Class C, Class R, Class Y, Class R5 and Class R6 shares, respectively. |
| (e) | Net investment income per share and the ratio of net investment income to average net assets include significant dividends received during the period. Net investment income per share and the ratio of net investment income to average net assets excluding the significant dividends are $(0.00) and (0.00)%, $(0.08) and (0.75)%, $(0.02) and (0.25)%, $0.03 and 0.25%, $0.03 and 0.25% and $0.03 and 0.25% for Class A, Class C, Class R, Class Y, Class R5 and Class R6 shares, respectively. |
| (f) | Commencement date of December 19, 2013. |
25 Invesco Long/Short Equity Fund
Report of Independent Registered Public Accounting Firm
To the Board of Trustees of AIM Investment Funds (Invesco Investment Funds)
and Shareholders of Invesco Long/Short Equity Fund:
In our opinion, the accompanying statement of assets and liabilities, including the schedule of investments, and the related statements of operations and of changes in net assets and the financial highlights present fairly, in all material respects, the financial position of Invesco Long/Short Equity Fund (one of the portfolios constituting the AIM Investment Funds (Invesco Investment Funds), hereafter referred to as the “Fund”) as of October 31, 2017, the results of its operations for the year then ended, the changes in its net assets for each of the two years in the period then ended and the financial highlights for each of the three years in the period then ended and for the period December 19, 2013 (commencement of investment operations) through October 31, 2014, in conformity with accounting principles generally accepted in the United States of America. These financial statements and financial highlights (hereafter referred to as “financial statements”) are the responsibility of the Fund’s management. Our responsibility is to express an opinion on these financial statements based on our audits. We conducted our audits of these financial statements in accordance with the standards of the Public Company Accounting Oversight Board (United States). Those standards require that we plan and perform the audit to obtain reasonable assurance about whether the financial statements are free of material misstatement. An audit includes examining, on a test basis, evidence supporting the amounts and disclosures in the financial statements, assessing the accounting principles used and significant estimates made by management, and evaluating the overall financial statement presentation. We believe that our audits, which included confirmation of securities as of October 31, 2017 by correspondence with the custodian, transfer agent and brokers, and when replies were not received from brokers, we performed other auditing procedures, provide a reasonable basis for our opinion.
PricewaterhouseCoopers LLP
Houston, Texas
December 21, 2017
26 Invesco Long/Short Equity Fund
Calculating your ongoing Fund expenses
Example
As a shareholder of the Fund, you incur two types of costs: (1) transaction costs, which may include sales charges (loads) on purchase payments or contingent deferred sales charges on redemptions, if any; and (2) ongoing costs, including management fees, distribution and/or service (12b-1) fees, and other Fund expenses. This example is intended to help you understand your ongoing costs (in dollars) of investing in the Fund and to compare these costs with ongoing costs of investing in other mutual funds. The example is based on an investment of $1,000 invested at the beginning of the period and held for the entire period May 1, 2017 through October 31, 2017.
Actual expenses
The table below provides information about actual account values and actual expenses. You may use the information in this table, together with the amount you invested, to estimate the expenses that you paid over the period. Simply divide your account value by $1,000 (for example, an $8,600 account value divided by $1,000 = 8.6), then multiply the result by the number in the table under the heading entitled “Actual Expenses Paid During Period” to estimate the expenses you paid on your account during this period.
Hypothetical example for comparison purposes
The table below also provides information about hypothetical account values and hypothetical expenses based on the Fund’s actual expense ratio and an assumed rate of return of 5% per year before expenses, which is not the Fund’s actual return.
The hypothetical account values and expenses may not be used to estimate the actual ending account balance or expenses you paid for the period. You may use this information to compare the ongoing costs of investing in the Fund and other funds. To do so, compare this 5% hypothetical example with the 5% hypothetical examples that appear in the shareholder reports of the other funds.
Please note that the expenses shown in the table are meant to highlight your ongoing costs only and do not reflect any transaction costs, such as sales charges (loads) on purchase payments or contingent deferred sales charges on redemptions, if any. Therefore, the hypothetical information is useful in comparing ongoing costs only, and will not help you determine the relative total costs of owning different funds. In addition, if these transaction costs were included, your costs would have been higher.
| | | | | | | | | | | | | | | | | | | | | | | | |
| Class | | Beginning
Account Value
(05/01/17) | | | ACTUAL | | | HYPOTHETICAL (5% annual return before expenses) | | | Annualized
Expense
Ratio | |
| | | Ending
Account Value
(10/31/17)1 | | | Expenses
Paid During
Period2 | | | Ending
Account Value
(10/31/17) | | | Expenses
Paid During
Period2 | | |
| A | | $ | 1,000.00 | | | $ | 1,125.90 | | | $ | 8.20 | | | $ | 1,017.49 | | | $ | 7.78 | | | | 1.53 | % |
| C | | | 1,000.00 | | | | 1,122.20 | | | | 12.20 | | | | 1,013.71 | | | | 11.57 | | | | 2.28 | |
| R | | | 1,000.00 | | | | 1,124.90 | | | | 9.53 | | | | 1,016.23 | | | | 9.05 | | | | 1.78 | |
| Y | | | 1,000.00 | | | | 1,127.70 | | | | 6.86 | | | | 1,018.75 | | | | 6.51 | | | | 1.28 | |
| R5 | | | 1,000.00 | | | | 1,127.60 | | | | 6.22 | | | | 1,019.36 | | | | 5.90 | | | | 1.16 | |
| R6 | | | 1,000.00 | | | | 1,128.40 | | | | 6.22 | | | | 1,019.36 | | | | 5.90 | | | | 1.16 | |
| 1 | The actual ending account value is based on the actual total return of the Fund for the period May 1, 2017 through October 31, 2017, after actual expenses and will differ from the hypothetical ending account value which is based on the Fund’s expense ratio and a hypothetical annual return of 5% before expenses. |
| 2 | Expenses are equal to the Fund’s annualized expense ratio as indicated above multiplied by the average account value over the period, multiplied by 184/365 to reflect the most recent fiscal half year. |
27 Invesco Long/Short Equity Fund
Approval of Investment Advisory and Sub-Advisory Contracts
The Board of Trustees (the Board) of AIM Investment Funds (Invesco Investment Funds) is required under the Investment Company Act of 1940, as amended, to approve annually the renewal of Invesco Long/Short Equity Fund’s (the Fund) investment advisory agreements. During contract renewal meetings held on June 12-13, 2017, the Board as a whole, and the disinterested or “independent” Trustees, who comprise over 75% of the Board, voting separately, approved the continuance for the Fund of the Master Investment Advisory Agreement with Invesco Advisers, Inc. (Invesco Advisers and the investment advisory agreement) and the Master Intergroup Sub-Advisory Contract for Mutual Funds with Invesco Asset Management Deutschland GmbH, Invesco Asset Management Limited, Invesco Asset Management (Japan) Limited, Invesco Hong Kong Limited, Invesco Senior Secured Management, Inc. and Invesco Canada Ltd. and separate Sub-Advisory Contracts with Invesco PowerShares Capital Management LLC and Invesco Asset Management (India) Private Limited (collectively, the Affiliated Sub-Advisers and the sub-advisory contracts) for another year, effective July 1, 2017.
In evaluating the fairness and reasonableness of compensation under the Fund’s investment advisory agreement and sub-advisory contracts, the Board considered, among other things, the factors discussed below. The Board determined that continuation of the Fund’s investment advisory agreement and the sub-advisory contracts is in the best interest of the Fund and its shareholders and that the compensation payable to Invesco Advisers and the Affiliated Sub-Advisers under the agreements is fair and reasonable.
The Board’s Fund Evaluation Process
The Board’s Investments Committee has established three Sub-Committees, which meet throughout the year to review the performance of funds advised by Invesco Advisers (the Invesco Funds). Over the course of each year, the Sub-Committees meet with portfolio managers for their assigned Invesco Funds and other members of management to review the performance, investment objective(s), policies, strategies, limitations and investment risks of these funds. The Board had the benefit of reports from the Sub-Committees and Investments Committee throughout the year in considering approval of the continuance of each Invesco Fund’s investment advisory agreement and sub-advisory contracts for another year.
During the contract renewal process, the Board receives comparative performance and fee data regarding the Invesco Funds prepared by Invesco Advisers and Broadridge Financial Solutions, Inc. (Broadridge), an independent provider of investment company data. The Board also receives an independent written
evaluation from the Senior Officer, an officer of the Invesco Funds who reports directly to the independent Trustees. The Senior Officer’s evaluation is prepared as part of his responsibility to manage the process by which the Invesco Funds’ proposed management fees are negotiated during the annual contract renewal process to ensure they are negotiated in a manner that is at arms’ length and reasonable. In addition to meetings with Invesco Advisers and fund counsel, the independent Trustees also discuss the continuance of the investment advisory agreement and sub-advisory contracts in separate sessions with the Senior Officer and with independent legal counsel.
The Trustees recognized that the advisory fee rates for the Invesco Funds are, in most cases, the result of years of review and negotiation. The Trustees’ deliberations and conclusions in a particular year may be based in part on their deliberations and conclusions regarding these arrangements throughout the year and in prior years. The Trustees’ review and conclusions are based on the comprehensive consideration of all information presented to them and are not the result of any single determinative factor. Moreover, one Trustee may have weighed a particular piece of information or factor differently than another Trustee.
The discussion below is a summary of the Senior Officer’s independent written evaluation with respect to the Fund’s investment advisory agreement as well as a discussion of the material factors and related conclusions that formed the basis for the Board’s approval of the Fund’s investment advisory agreement and sub-advisory contracts. This information is current as of June 13, 2017, and does not reflect consideration of factors that became known to the Board after that date.
Factors and Conclusions and Summary of Independent Written Fee Evaluation
| A. | Nature, Extent and Quality of Services Provided by Invesco Advisers and the Affiliated Sub-Advisers |
The Board reviewed the advisory services provided to the Fund by Invesco Advisers under the Fund’s investment advisory agreement, the performance of Invesco Advisers in providing these services, and the credentials and experience of the officers and employees of Invesco Advisers who provide these services, including the Fund’s portfolio manager or managers. The Board’s review included consideration of Invesco Advisers’ investment process oversight, credit analysis and investment risk management. The Board also considered non-advisory services that Invesco Advisers and its affiliates provide to the Invesco Funds such as various back office support functions, trading operations, internal audit, valuation and legal and compliance.
In determining whether to continue the Fund’s investment advisory agreement, the Board considered the benefits of reapproving an existing relationship as contrasted with the greater uncertainty that may be associated with entering into a new relationship. The Board concluded that the nature, extent and quality of the services provided to the Fund by Invesco Advisers are appropriate and satisfactory.
The Board reviewed the services that may be provided by the Affiliated Sub-Advisers under the sub-advisory contracts and the credentials and experience of the officers and employees of the Affiliated Sub-Advisers who provide these services. The Board noted that the Affiliated Sub-Advisers have offices and personnel that are located in financial centers around the world. As a result, the Board noted that the Affiliated Sub-Advisers can provide research and investment analysis on the markets and economies of various countries in which the Fund may invest, make recommendations regarding securities and assist with security trades. The Board concluded that the sub-advisory contracts may benefit the Fund and its shareholders by permitting Invesco Advisers to use the resources and talents of the Affiliated Sub-Advisers in managing the Fund. The Board concluded that the nature, extent and quality of the services that may be provided by the Affiliated Sub-Advisers are appropriate and satisfactory.
| B. | Fund Investment Performance |
The Board considered Fund investment performance as a relevant factor in considering whether to approve the investment advisory agreement. The Board did not view Fund performance as a relevant factor in considering whether to approve the sub-advisory contracts for the Fund, as no Affiliated Sub-Adviser currently manages assets of the Fund.
The Board noted the Fund had only three years of performance history and compared the Fund’s investment performance during the past one and three calendar years to the performance of funds in the Broadridge performance universe and against the Lipper Alternative Long/Short Equity Funds Index. The Board noted that performance of Class A shares of the Fund was in the second quintile of its performance universe for the one year period and the first quintile for the three year period (the first quintile being the best performing funds and the fifth quintile being the worst performing funds). The Board noted that performance of Class A shares of the Fund was above the performance of the Index for the one and three year periods. The Trustees also reviewed more recent Fund performance and this review did not change their conclusions.
| C. | Advisory and Sub-Advisory Fees |
The Board compared the Fund’s contractual management fee rate to the contractual management fee rates of funds in the Fund’s
28 Invesco Long/Short Equity Fund
Broadridge expense group at a common asset level. The Board noted that the contractual management fee rate for Class A shares of the Fund was below the median contractual management fee rate of funds in its expense group. The Board noted that the term “contractual management fee” for funds in the expense group may include both advisory and certain administrative services fees, but that Broadridge does not provide information on a fund by fund basis as to what is included. The Board noted that Invesco Advisers does not separately charge the Invesco Funds for the administrative services included in the term as defined by Broadridge. The Board also reviewed the methodology used by Broadridge in providing expense group information, which includes using each fund’s contractual management fee schedule (including any applicable breakpoints) as reported in the most recent prospectus or statement of additional information for each fund in the expense group.
The Board noted that Invesco Advisers has contractually agreed to waive fees and/or limit expenses of the Fund through at least February 28, 2018 in an amount necessary to limit total annual operating expenses to a specified percentage of average daily net assets for each class of the Fund.
The Board noted that Invesco Advisers and the Affiliated Sub-Advisers do not manage other mutual funds or client accounts with investment strategies comparable to those of the Fund.
The Board also considered the services that may be provided by the Affiliated Sub-Advisers pursuant to the sub-advisory contracts, as well as the fees payable by Invesco Advisers to the Affiliated Sub-Advisers pursuant to the sub-advisory contracts. The Board also noted that the sub-advisory fees are not paid directly by the Fund, but rather, are payable by Invesco Advisers to the Affiliated Sub-Advisers.
| D. | Economies of Scale and Breakpoints |
The Board considered the extent to which there are economies of scale in the provision of advisory services to the Fund. The Board also considered that the Fund may benefit from economies of scale through contractual breakpoints in the Fund’s advisory fee schedule. The Board noted that the Fund shares directly in economies of scale through lower fees charged by third party service providers based on the combined size of the Invesco Funds advised by Invesco Advisers.
| E. | Profitability and Financial Resources |
The Board reviewed information from Invesco Advisers concerning the costs of the advisory and other services that Invesco Advisers and its affiliates provide to the Fund and the Invesco Funds and the profitability of Invesco Advisers and its affiliates in providing these services. The Board noted that Invesco Advisers continues to operate at a net profit from services Invesco Advisers and its affiliates provide to the Invesco Funds and the Fund. The Board did not deem the level of profits realized by Invesco Advisers and its affiliates from providing services to the Fund to be excessive given the nature, quality and
extent of the services provided. The Board received and accepted information from Invesco Advisers demonstrating that Invesco Advisers and each Affiliated Sub-Adviser are financially sound and have the resources necessary to perform their obligations under the investment advisory agreement and sub-advisory contracts.
| F. | Collateral Benefits to Invesco Advisers and its Affiliates |
The Board considered various other benefits received by Invesco Advisers and its affiliates from the relationship with the Fund, including the fees received for providing transfer agency and distribution services to the Fund. The Board considered comparative information regarding fees charged for these services, including information provided by Broadridge and other independent sources. The Board considered the performance of Invesco Advisers and its affiliates in providing these services and the organizational structure employed to provide these services. The Board also considered that these services are provided to the Fund pursuant to written contracts that are reviewed and approved on an annual basis by the Board; and that the services are required for the operation of the Fund.
The Board considered the benefits realized by Invesco Advisers and the Affiliated Sub-Advisers as a result of portfolio brokerage transactions executed through “soft dollar” arrangements. The Board noted that soft dollar arrangements may result in the Fund bearing costs to purchase research that may be used by Invesco Advisers or the Affiliated Sub-Advisers with other clients and may reduce Invesco Adviser’s or the Affiliated Sub-Adviser’s expenses. The Board also considered that it receives periodic reports from the Chief Compliance Officer of the Invesco Funds demonstrating that these arrangements are consistent with regulatory requirements. The Board did not deem the soft dollar arrangements to be inappropriate.
The Board considered that the Fund’s uninvested cash and cash collateral from any securities lending arrangements may be invested in money market funds advised by Invesco Advisers pursuant to procedures approved by the Board. The Board noted that Invesco Advisers receives advisory fees from these affiliated money market funds attributable to such investments, although Invesco Advisers has contractually agreed to waive through varying periods the advisory fees payable by the Invesco Funds with respect to certain investments in the affiliated money market funds. The waiver is in an amount equal to 100% of the net advisory fee Invesco Advisers receives from the affiliated money market funds with respect to the Fund’s investment in the affiliated money market funds of uninvested cash, but not cash collateral. The Board concluded that the amount of advisory fees received by Invesco Advisers from the Fund’s investment of cash collateral from any securities lending arrangements in the affiliated money market funds is fair and reasonable.
The Board also considered that the Fund may use an affiliated broker to execute certain trades for the Fund to, among other things, control information leakage, and was advised that such trades would be executed in compliance with rules under the federal securities laws and consistent with best execution obligations.
29 Invesco Long/Short Equity Fund
Tax Information
Form 1099-DIV, Form 1042-S and other year-end tax information provide shareholders with actual calendar year amounts that should be included in their tax returns. Shareholders should consult their tax advisors.
The following distribution information is being provided as required by the Internal Revenue Code or to meet a specific state’s requirement.
The Fund designates the following amounts or, if subsequently determined to be different, the maximum amount allowable for its fiscal year ended October 31, 2017:
| | | | |
Federal and State Income Tax | |
Long-Term Capital Gain Distributions | | $ | 451,747 | |
Qualified Dividend Income* | | | 0 | % |
Corporate Dividends Received Deduction* | | | 0 | % |
U.S. Treasury Obligations* | | | 0 | % |
| | * | The above percentages are based on ordinary income dividends paid to shareholders during the Fund’s fiscal year. |
30 Invesco Long/Short Equity Fund
Trustees and Officers
The address of each trustee and officer is AIM Investment Funds (Invesco Investment Funds) (the “Trust”), 11 Greenway Plaza, Suite 1000, Houston, Texas 77046-1173. The trustees serve for the life of the Trust, subject to their earlier death, incapacitation, resignation, retirement or removal as more specifically provided in the Trust’s organizational documents. Each officer serves for a one year term or until their successors are elected and qualified. Column two below includes length of time served with predecessor entities, if any.
| | | | | | | | |
Name, Year of Birth and Position(s) Held with the Trust | | Trustee and/
or Officer Since | | Principal Occupation(s)
During Past 5 Years | | Number of
Funds in Fund
Complex
Overseen by
Trustee | | Other Directorship(s)
Held by Trustee During Past 5 Years |
| Interested Persons | | | | | | | | |
| Martin L. Flanagan1 — 1960 Trustee | | 2007 | | Executive Director, Chief Executive Officer and President, Invesco Ltd. (ultimate parent of Invesco and a global investment management firm); Trustee, The Invesco Funds; Vice Chair, Investment Company Institute; and Member of Executive Board, SMU Cox School of Business Formerly: Advisor to the Board, Invesco Advisers, Inc. (formerly known as Invesco Institutional (N.A.), Inc.); Chairman and Chief Executive Officer, Invesco Advisers, Inc. (registered investment adviser); Director, Chairman, Chief Executive Officer and President, Invesco Holding Company (US), Inc. (formerly IVZ Inc.) (holding company), Invesco Group Services, Inc. (service provider) and Invesco North American Holdings, Inc. (holding company); Director, Chief Executive Officer and President, Invesco Holding Company Limited (parent of Invesco and a global investment management firm); Director, Invesco Ltd.; Chairman, Investment Company Institute and President, Co-Chief Executive Officer, Co-President, Chief Operating Officer and Chief Financial Officer, Franklin Resources, Inc. (global investment management organization) | | 158 | | None |
Philip A. Taylor2 — 1954 Trustee and Senior Vice President | | 2006 | | Head of the Americas and Senior Managing Director, Invesco Ltd.; Director, Invesco Advisers, Inc. (formerly known as Invesco Institutional (N.A.), Inc.) (registered investment adviser); Director, Chairman, Chief Executive Officer and President, Invesco Management Group, Inc. (formerly known as Invesco Aim Management Group, Inc.) (financial services holding company); Director and Chairman, Invesco Investment Services, Inc. (formerly known as Invesco Aim Investment Services, Inc.) (registered transfer agent); Chief Executive Officer, Invesco Corporate Class Inc. (corporate mutual fund company); Director, Chairman and Chief Executive Officer, Invesco Canada Ltd. (formerly known as Invesco Trimark Ltd./Invesco Trimark Ltèe) (registered investment adviser and registered transfer agent); Trustee and Senior Vice President, The Invesco Funds; Director, Invesco Investment Advisers LLC (formerly known as Van Kampen Asset Management). Formerly: Co-Chairman, Co-President and Co-Chief Executive Officer, Invesco Advisers, Inc. (formerly known as Invesco Institutional (N.A.), Inc.) (registered investment adviser); Director, Chief Executive Officer and President, Van Kampen Exchange Corp; President and Principal Executive Officer, The Invesco Funds (other than AIM Treasurer’s Series Trust (Invesco Treasurer’s Series Trust), Short-Term Investments Trust and Invesco Management Trust); Executive Vice President, The Invesco Funds (AIM Treasurer’s Series Trust (Invesco Treasurer’s Series Trust), Short-Term Investments Trust and Invesco Management Trust only); Director and President, INVESCO Funds Group, Inc. (registered investment adviser and registered transfer agent); Director and Chairman, IVZ Distributors, Inc. (formerly known as INVESCO Distributors, Inc.) (registered broker dealer); Director, President and Chairman, Invesco Inc. (holding company), Invesco Canada Holdings Inc. (holding company), Trimark Investments Ltd./Placements Trimark Ltèe and Invesco Financial Services Ltd/Services Financiers Invesco Ltèe; Chief Executive Officer, Invesco Canada Fund Inc. (corporate mutual fund company); Director and Chairman, Van Kampen Investor Services Inc.; Director, Chief Executive Officer and President, 1371 Preferred Inc. (holding company) and Van Kampen Investments Inc.; Director and President, AIM GP Canada Inc. (general partner for limited partnerships) and Van Kampen Advisors, Inc.; Director and Chief Executive Officer, Invesco Trimark Dealer Inc. (registered broker dealer); Director, Invesco Distributors, Inc. (formerly known as Invesco Aim Distributors, Inc.) (registered broker dealer); Manager, Invesco PowerShares Capital Management LLC; Director, Chief Executive Officer and President, Invesco Advisers, Inc.; Director, Chairman, Chief Executive Officer and President, Invesco Aim Capital Management, Inc.; President, Invesco Trimark Dealer Inc. and Invesco Trimark Ltd./Invesco Trimark Ltèe; Director and President, AIM Trimark Corporate Class Inc. and AIM Trimark Canada Fund Inc.; Senior Managing Director, Invesco Holding Company Limited; Director and Chairman, Fund Management Company (former registered broker dealer); President and Principal Executive Officer, The Invesco Funds (AIM Treasurer’s Series Trust (Invesco Treasurer’s Series Trust), and Short-Term Investments Trust only); President, AIM Trimark Global Fund Inc. and AIM Trimark Canada Fund Inc. | | 158 | | None |
| 1 | Mr. Flanagan is considered an interested person (within the meaning of Section 2(a)(19) of the 1940 Act) of the Trust because he is an officer of the Adviser to the Trust, and an officer and a director of Invesco Ltd., ultimate parent of the Adviser. |
| 2 | Mr. Taylor is considered an interested person (within the meaning of Section 2(a)(19) of the 1940 Act) of the Trust because he is an officer and a director of the Adviser. |
T-1 Invesco Long/Short Equity Fund
Trustees and Officers—(continued)
| | | | | | | | |
Name, Year of Birth and Position(s) Held with the Trust | | Trustee and/
or Officer Since | | Principal Occupation(s) During Past 5 Years | | Number of
Funds in Fund
Complex
Overseen by
Trustee | | Other Directorship(s)
Held by Trustee During Past 5 Years |
| Independent Trustees | | | | | | | | |
Bruce L. Crockett — 1944 Trustee and Chair | | 2001 | | Chairman, Crockett Technologies Associates (technology consulting company) Formerly: Director, Captaris (unified messaging provider); Director, President and Chief Executive Officer, COMSAT Corporation; Chairman, Board of Governors of INTELSAT (international communications company); ACE Limited (insurance company); Independent Directors Council and Investment Company Institute: Member of the Audit Committee, Investment Company Institute; Member of the Executive Committee and Chair of the Governance Committee, Independent Directors Council | | 158 | | Director and Chairman of the Audit Committee, ALPS (Attorneys Liability Protection Society) (insurance company); Director and Member of the Audit Committee, Ferroglobe PLC (metallurgical company) |
David C. Arch — 1945 Trustee | | 2010 | | Chairman of Blistex Inc. (consumer health care products manufacturer); Member, World Presidents’ Organization | | 158 | | Board member of the Illinois Manufacturers’ Association |
James T. Bunch — 1942 Trustee | | 2003 | | Managing Member, Grumman Hill Group LLC (family office/private equity investments) Formerly: Chairman of the Board, Denver Film Society; Chairman of the Board of Trustees, Evans Scholarship Foundation; Chairman, Board of Governors, Western Golf Association | | 158 | | Trustee, Evans Scholarship Foundation |
Jack M. Fields — 1952 Trustee | | 2001 | | Chief Executive Officer, Twenty First Century Group, Inc. (government affairs company); and Discovery Learning Alliance (non-profit) Formerly: Owner and Chief Executive Officer, Dos Angeles Ranch L.P. (cattle, hunting, corporate entertainment); Director, Insperity, Inc. (formerly known as Administaff) (human resources provider); Chief Executive Officer, Texana Timber LP (sustainable forestry company); Director of Cross Timbers Quail Research Ranch (non-profit); and member of the U.S. House of Representatives | | 158 | | None |
Cynthia Hostetler — 1962 Trustee | | 2017 | | Non-Executive Director and Trustee of a number of public and private business corporations Formerly: Head of Investment Funds and Private Equity, Overseas Private Investment Corporation; President, First Manhattan Bancorporation, Inc.; Attorney, Simpson Thacher & Bartlett LLP | | 158 | | Vulcan Materials Company (construction materials company); Trilinc Global Impact Fund; Aberdeen Investment Funds (4 portfolios); Artio Global Investment LLC (mutual fund complex); Edgen Group, Inc. (specialized energy and infrastructure products distributor) |
Eli Jones — 1961 Trustee | | 2016 | | Professor and Dean, Mays Business School — Texas A&M University Formerly: Professor and Dean, Walton College of Business, University of Arkansas and E.J. Ourso College of Business, Louisiana State University; Director, Arvest Bank | | 158 | | Insperity, Inc. (formerly known as Administaff) (human resources provider) |
Prema Mathai-Davis — 1950 Trustee | | 2001 | | Retired. Formerly: Chief Executive Officer, YWCA of the U.S.A. | | 158 | | None |
Teresa M. Ressel — 1962 Trustee | | 2017 | | Non-executive director and trustee of a number of public and private business corporations Formerly: Chief Financial Officer, Olayan America, The Olayan Group (international investor/commercial/industrial); Chief Executive Officer, UBS Securities LLC; Group Chief Operating Officer, Americas, UBS AG; Assistant Secretary for Management & Budget and CFO, US Department of the Treasury; Chief Compliance Officer, Kaiser Permanente (healthcare consortium); Program Manager, Hewlett-Packard; Nuclear Engineering, General Dynamics Corporation (aerospace and defense company) | | 158 | | Atlantic Power Corporation (power generation company); ON Semiconductor Corp. (semiconductor supplier) |
Larry Soll — 1942 Trustee | | 2003 | | Retired. Formerly: Chairman, Chief Executive Officer and President, Synergen Corp. (a biotechnology company) | | 158 | | None |
Ann Barnett Stern — 1957 Trustee | | 2017 | | President and Chief Executive Officer, Houston Endowment Inc. (private philanthropic institution) Formerly: Executive Vice President and General Counsel, Texas Children’s Hospital; Attorney, Beck, Redden and Secrest, LLP; Business Law Instructor, University of St. Thomas; Attorney, Andrews & Kurth LLP | | 158 | | Federal Reserve Bank of Dallas |
Raymond Stickel, Jr. — 1944 Trustee | | 2005 | | Retired. Formerly: Director, Mainstay VP Series Funds, Inc. (25 portfolios); Partner, Deloitte & Touche | | 158 | | None |
Robert C. Troccoli — 1949 Trustee | | 2016 | | Adjunct Professor, University of Denver — Daniels College of Business Formerly: Senior Partner, KPMG LLP | | 158 | | None |
T-2 Invesco Long/Short Equity Fund
Trustees and Officers—(continued)
| | | | | | | | |
Name, Year of Birth and Position(s) Held with the Trust | | Trustee and/
or Officer Since | | Principal Occupation(s) During Past 5 Years | | Number of
Funds in Fund
Complex
Overseen by
Trustee | | Other Directorship(s)
Held by Trustee During Past 5 Years |
| Independent Trustees—(continued) |
Christopher L. Wilson — 1957 Trustee | | 2017 | | Managing Partner, CT2, LLC (investing and consulting firm) Formerly: President/Chief Executive Officer, Columbia Funds, Bank of America Corporation; President/Chief Executive Officer, CDC IXIS Asset Management Services, Inc.; Principal & Director of Operations, Scudder Funds, Scudder, Stevens & Clark, Inc.; Assistant Vice President, Fidelity Investments | | 158 | | TD Asset Management USA Inc. (mutual fund complex) (22 portfolios); ISO New England, Inc. (non-profit organization managing regional electricity market) |
| Other Officers | | | | | | | | |
Sheri Morris — 1964 President, Principal Executive Officer and Treasurer | | 1999 | | President, Principal Executive Officer and Treasurer, The Invesco Funds; Vice President, Invesco Advisers, Inc. (formerly known as Invesco Institutional (N.A.), Inc.) (registered investment adviser); and Vice President, PowerShares Exchange-Traded Fund Trust, PowerShares Exchange-Traded Fund Trust II, PowerShares India Exchange-Traded Fund Trust, PowerShares Actively Managed Exchange-Traded Fund Trust and PowerShares Actively Managed Exchange-Traded Commodity Fund Trust Formerly: Vice President and Principal Financial Officer, The Invesco Funds; Vice President, Invesco Aim Advisers, Inc., Invesco Aim Capital Management, Inc. and Invesco Aim Private Asset Management, Inc.; Assistant Vice President and Assistant Treasurer, The Invesco Funds and Assistant Vice President, Invesco Advisers, Inc., Invesco Aim Capital Management, Inc. and Invesco Aim Private Asset Management, Inc.; and Treasurer, PowerShares Exchange-Traded Fund Trust, PowerShares Exchange-Traded Fund Trust II, PowerShares India Exchange-Traded Fund Trust and PowerShares Actively Managed Exchange-Traded Fund Trust | | N/A | | N/A |
Russell C. Burk — 1958 Senior Vice President and Senior Officer | | 2005 | | Senior Vice President and Senior Officer, The Invesco Funds | | N/A | | N/A |
John M. Zerr — 1962 Senior Vice President, Chief Legal Officer and Secretary | | 2006 | | Director, Senior Vice President, Secretary and General Counsel, Invesco Management Group, Inc. (formerly known as Invesco AIM Management Group, Inc.); Senior Vice President, Invesco Advisers, Inc. (formerly known as Invesco Institutional (N.A.), Inc.) (registered investment adviser); Senior Vice President and Secretary, Invesco Distributors, Inc. (formerly known as Invesco AIM Distributors, Inc.); Director, Vice President and Secretary, Invesco Investment Services, Inc. (formerly known as Invesco AIM Investment Services, Inc.) Senior Vice President, Chief Legal Officer and Secretary, The Invesco Funds; Managing Director, Invesco PowerShares Capital Management LLC; Director, Secretary and General Counsel, Invesco Investment Advisers LLC (formerly known as Van Kampen Asset Management); Secretary and General Counsel, Invesco Capital Markets, Inc. (formerly known as Van Kampen Funds Inc.) and Chief Legal Officer, PowerShares Exchange-Traded Fund Trust, PowerShares Exchange-Traded Fund Trust II, PowerShares India Exchange-Traded Fund Trust, PowerShares Actively Managed Exchange-Traded Fund Trust and PowerShares Actively Managed Exchange-Traded Commodity Fund Trust; Manager and Secretary, Invesco Indexing LLC Formerly: Director, Secretary, General Counsel and Senior Vice President, Van Kampen Exchange Corp.; Director, Vice President and Secretary, IVZ Distributors, Inc. (formerly known as INVESCO Distributors, Inc.); Director and Vice President, INVESCO Funds Group, Inc.; Director and Vice President, Van Kampen Advisors Inc.; Director, Vice President, Secretary and General Counsel, Van Kampen Investor Services Inc.; Director, Invesco Distributors, Inc. (formerly known as Invesco AIM Distributors, Inc.); Director, Senior Vice President, General Counsel and Secretary, Invesco AIM Advisers, Inc. and Van Kampen Investments Inc.; Director, Vice President and Secretary, Fund Management Company; Director, Senior Vice President, Secretary, General Counsel and Vice President, Invesco AIM Capital Management, Inc.; Chief Operating Officer and General Counsel, Liberty Ridge Capital, Inc. (an investment adviser); Vice President and Secretary, PBHG Funds (an investment company) and PBHG Insurance Series Fund (an investment company); Chief Operating Officer, General Counsel and Secretary, Old Mutual Investment Partners (a broker-dealer); General Counsel and Secretary, Old Mutual Fund Services (an administrator) and Old Mutual Shareholder Services (a shareholder servicing center); Executive Vice President, General Counsel and Secretary, Old Mutual Capital, Inc. (an investment adviser); and Vice President and Secretary, Old Mutual Advisors Funds (an investment company) | | N/A | | N/A |
Gregory G. McGreevey — 1962 Senior Vice President | | 2012 | | Senior Managing Director, Invesco Ltd.; Director, Chairman, President, and Chief Executive Officer, Invesco Advisers, Inc. (formerly known as Invesco Institutional (N.A.), Inc.) (registered investment adviser); Senior Vice President, Invesco Management Group, Inc.; Director, Invesco Mortgage Capital, Inc. and Invesco Senior Secured Management, Inc.; and Senior Vice President, The Invesco Funds Formerly: Assistant Vice President, The Invesco Funds | | N/A | | N/A |
T-3 Invesco Long/Short Equity Fund
Trustees and Officers—(continued)
| | | | | | | | |
Name, Year of Birth and Position(s) Held with the Trust | | Trustee and/
or Officer Since | | Principal Occupation(s) During Past 5 Years | | Number of
Funds in Fund
Complex
Overseen by
Trustee | | Other Directorship(s)
Held by Trustee During Past 5 Years |
| Other Officers—(continued) | | | | | | | | |
Kelli Gallegos — 1970 Vice President, Principal Financial Officer and Assistant Treasurer | | 2008 | | Vice President, Principal Financial Officer and Assistant Treasurer, The Invesco Funds; Assistant Treasurer, Invesco PowerShares Capital Management LLC, PowerShares Exchange-Traded Fund Trust, PowerShares Exchange-Traded Fund Trust II, PowerShares India Exchange-Traded Fund Trust, PowerShares Actively Managed Exchange-Traded Fund Trust and PowerShares Actively Managed Exchange-Traded Commodity Fund Trust Formerly: Assistant Vice President, The Invesco Funds | | N/A | | N/A |
Tracy Sullivan — 1962 Vice President, Chief Tax Officer and Assistant Treasurer | | 2008 | | Vice President, Chief Tax Officer and Assistant Treasurer, The Invesco Funds; Assistant Treasurer, Invesco PowerShares Capital Management LLC, PowerShares Exchange-Traded Fund Trust, PowerShares Exchange-Traded Fund Trust II, PowerShares India Exchange-Traded Fund Trust, PowerShares Actively Managed Exchange-Traded Fund Trust and PowerShares Actively Managed Exchange-Traded Commodity Fund Trust Formerly: Assistant Vice President, The Invesco Funds | | N/A | | N/A |
Crissie M. Wisdom — 1969 Anti-Money Laundering Compliance Officer | | 2013 | | Anti-Money Laundering Compliance Officer, Invesco Advisers, Inc. (formerly known as Invesco Institutional (N.A.), Inc.) (registered investment adviser), Invesco Capital Markets, Inc. (formerly known as Van Kampen Funds Inc.), Invesco Distributors, Inc., Invesco Investment Services, Inc., Invesco Management Group, Inc., The Invesco Funds, and PowerShares Exchange-Traded Fund Trust, PowerShares Exchange-Traded Fund Trust II, PowerShares India Exchange-Traded Fund Trust, PowerShares Actively Managed Exchange-Traded Fund Trust and PowerShares Actively Managed Exchange-Traded Commodity Fund Trust; Anti-Money Laundering Compliance Officer and Bank Secrecy Act Officer, INVESCO National Trust Company and Invesco Trust Company; and Fraud Prevention Manager and Controls and Risk Analysis Manager for Invesco Investment Services, Inc. Formerly: Anti-Money Laundering Compliance Officer, Van Kampen Exchange Corp. | | N/A | | N/A |
Robert R. Leveille — 1969 Chief Compliance Officer | | 2016 | | Chief Compliance Officer, Invesco Advisers, Inc. (registered investment adviser); and Chief Compliance Officer, The Invesco Funds Formerly: Chief Compliance Officer, Putnam Investments and the Putnam Funds | | N/A | | N/A |
The Statement of Additional Information of the Trust includes additional information about the Fund’s Trustees and is available upon request, without charge, by calling 1.800.959.4246. Please refer to the Fund’s Statement of Additional Information for information on the Fund’s sub-advisers.
| | | | | | |
Office of the Fund 11 Greenway Plaza, Suite 1000 Houston, TX 77046-1173 | | Investment Adviser Invesco Advisers, Inc. 1555 Peachtree Street, N.E. Atlanta, GA 30309 | | Distributor Invesco Distributors, Inc. 11 Greenway Plaza, Suite 1000 Houston, TX 77046-1173 | | Auditors PricewaterhouseCoopers LLP 1000 Louisiana Street, Suite 5800 Houston, TX 77002-5678 |
| | | |
| | | | | | |
Counsel to the Fund Stradley Ronon Stevens & Young, LLP 2005 Market Street, Suite 2600 Philadelphia, PA 19103-7018 | | Counsel to the Independent Trustees Goodwin Procter LLP 901 New York Avenue, N.W. Washington, D.C. 20001 | | Transfer Agent Invesco Investment Services, Inc. 11 Greenway Plaza, Suite 1000 Houston, TX 77046-1173 | | Custodian State Street Bank and Trust Company 225 Franklin Street Boston, MA 02110-2801 |
T-4 Invesco Long/Short Equity Fund
Explore High-Conviction Investing with Invesco

Go paperless with eDelivery
Visit invesco.com/edelivery to enjoy the convenience and security of anytime electronic access to your investment documents.
With eDelivery, you can elect to have any or all of the following materials delivered straight to your inbox to download, save and print from your own computer:
| ∎ | | Fund reports and prospectuses |
Invesco mailing information
Send general correspondence to Invesco Investment Services, Inc., P.O. Box 219078, Kansas City, MO 64121-9078.
Important notice regarding delivery of security holder documents
To reduce Fund expenses, only one copy of most shareholder documents may be mailed to shareholders with multiple accounts at the same address (Householding). Mailing of your shareholder documents may be householded indefinitely unless you instruct us otherwise. If you do not want the mailing of these documents to be combined with those for other members of your household, please contact Invesco Investment Services, Inc. at 800 959 4246 or contact your financial institution. We will begin sending you individual copies for each account within 30 days after receiving your request.
Fund holdings and proxy voting information
The Fund provides a complete list of its holdings four times in each fiscal year, at the quarter ends. For the second and fourth quarters, the lists appear in the Fund’s semiannual and annual reports to shareholders. For the first and third quarters, the Fund files the lists with the Securities and Exchange Commission (SEC) on Form N-Q. The most recent list of portfolio holdings is available at invesco.com/completeqtrholdings. Shareholders can also look up the Fund’s Forms N-Q on the SEC website at sec. gov. Copies of the Fund’s Forms N-Q may be reviewed and copied at the SEC Public Reference Room in Washington, D.C. You can obtain information on the operation of the Public Reference Room, including information about duplicating fee charges, by calling 202 551 8090 or 800 732 0330, or by electronic request at the following email address: publicinfo@sec.gov. The SEC file numbers for the Fund are shown below.
A description of the policies and procedures that the Fund uses to determine how to vote proxies relating to portfolio securities is available without charge, upon request, from our Client Services department at 800 959 4246 or at invesco.com/proxyguidelines. The information is also available on the SEC website, sec.gov.
| | |
Information regarding how the Fund voted proxies related to its portfolio securities during the most recent 12-month period ended June 30 is available at invesco.com/proxysearch. The information is also available on the SEC website, sec.gov. Invesco Advisers, Inc. is an investment adviser; it provides investment advisory services to individual and institutional clients and does not sell securities. Invesco Distributors, Inc. is the US distributor for Invesco Ltd.’s retail mutual funds, exchange-traded funds and institutional money market funds. Both are wholly owned, indirect subsidiaries of Invesco Ltd. | |  |
| | | | | | | | |
| SEC file numbers: 811-05426 and 033-19338 | | Invesco Distributors, Inc. | | LSE-AR-1 | | 12212017 | | 0957 |

Letters to Shareholders
| | | | |

Philip Taylor | | | | Dear Shareholders: This annual report includes information about your Fund, including performance data and a complete list of its investments as of the close of the reporting period. Inside is a discussion of how your Fund was managed and the factors that affected its performance during the reporting period. American voters went to the polls just days after the start of the reporting period, and their decisions quickly affected markets. The US stock market rallied strongly after the election, with major market indexes rising, and setting record highs, throughout the reporting period. Generally positive economic data, strong corporate earnings and hope for tax and regulatory reform contributed to the rally. US and global bond markets, as well as emerging market equities, sold off immediately following the election – with the US bond market eventually recovering most of its losses. Overseas, economic data were mixed, prompting the European Central Bank and central |
banks in China and Japan, among other countries, to maintain extraordinarily accommodative monetary policies. Citing positive economic trends – specifically, realized and expected labor market conditions and inflation – the US Federal Reserve raised interest rates three times during the reporting period: first in December 2016, and then again in March and June 2017. Health care and tax reform proved to be more difficult than expected to enact, with little progress achieved by the end of the reporting period.
Short-term market volatility can prompt some investors to abandon their investment plans – and can cause others to settle for whatever returns the market has to offer. The investment professionals at Invesco, in contrast, invest with high conviction. This means that, no matter the asset class or the strategy, each investment team has a passion to exceed. We want to help investors achieve better outcomes, such as seeking higher returns, helping mitigate risk and generating income. Of course, investing with high conviction can’t guarantee a profit or ensure success; no investment strategy can. To learn more about how we invest with high conviction, visit invesco.com/HighConviction.
You, too, can invest with high conviction by maintaining a long-term investment perspective and by working with your financial adviser on a regular basis. During periods of short-term market volatility or uncertainty, your financial adviser can keep you focused on your long-term investment goals – a new home, a child’s college education or a secure retirement. He or she also can share research about the economy, the markets and individual investment options.
Visit our website for more information on your investments
Our website, invesco.com/us, offers a wide range of market insights and investment perspectives. On the website, you’ll find detailed information about our funds, including performance, holdings and portfolio manager commentaries. You can access information about your account by completing a simple, secure online registration. To do so, select “Log In” on the right side of the homepage, and then select “Register for Individual Account Access.”
In addition to the resources accessible on our website and through our mobile app, you can obtain timely updates to help you stay informed about the markets and the economy by connecting with Invesco on Twitter, LinkedIn or Facebook. You can access our blog at blog.invesco.us.com. Our goal is to provide you the information you want, when and where you want it.
Finally, I’m pleased to share with you Invesco’s commitment to both the Principles for Responsible Investment and to considering environmental, social and governance issues in our robust investment process. I invite you to learn more at invesco.com/esg.
Have questions?
For questions about your account, contact an Invesco client services representative at 800 959 4246. For Invesco-related questions or comments, please email me directly at phil@invesco.com.
All of us at Invesco look forward to serving your investment management needs. Thank you for investing with us.
Sincerely,

Philip Taylor
Senior Managing Director, Invesco Ltd.
|
| 2 Invesco Low Volatility Emerging Markets Fund |
| | | | |

Bruce Crockett | | | | Dear Fellow Shareholders: Among the many important lessons I’ve learned in more than 40 years in a variety of business endeavors is the value of a trusted advocate. As independent chair of the Invesco Funds Board, I can assure you that the members of the Board are strong advocates for the interests of investors in Invesco’s mutual funds. We work hard to represent your interests through oversight of the quality of the investment management services your funds receive and other matters important to your investment, including but not limited to: ∎ Ensuring that Invesco offers a diverse lineup of mutual funds that your financial adviser can use to strive to meet your financial needs as your investment goals change over time. ∎ Monitoring how the portfolio management teams of the Invesco funds are performing in light of changing economic and market conditions. |
| ∎ | Assessing each portfolio management team’s investment performance within the context of the investment strategy described in the fund’s prospectus. |
| ∎ | Monitoring for potential conflicts of interests that may impact the nature of the services that your funds receive. |
We believe one of the most important services we provide our fund shareholders is the annual review of the funds’ advisory and sub-advisory contracts with Invesco Advisers and its affiliates. This review is required by the Investment Company Act of 1940 and focuses on the nature and quality of the services Invesco provides as the adviser to the Invesco funds and the reasonableness of the fees that it charges for those services. Each year, we spend months carefully reviewing information received from Invesco and a variety of independent sources, such as performance and fee data prepared by Lipper, Inc. (a subsidiary of Broadridge Financial Solutions, Inc.), an independent, third-party firm widely recognized as a leader in its field. We also meet with our independent legal counsel and other independent advisers to review and help us assess the information that we have received. Our goal is to assure that you receive quality investment management services for a reasonable fee.
I trust the measures outlined above provide assurance that you have a worthy advocate when it comes to choosing the Invesco Funds.
As always, please contact me at bruce@brucecrockett.com with any questions or concerns you may have. On behalf of the Board, we look forward to continuing to represent your interests and serving your needs.
Sincerely,

Bruce L. Crockett
Independent Chair
Invesco Funds Board of Trustees
|
| 3 Invesco Low Volatility Emerging Markets Fund |
Management’s Discussion of Fund Performance
Performance summary
For the fiscal year ended October 31, 2017, Class A shares of Invesco Low Volatility Emerging Markets Fund (the Fund), at net asset value (NAV), underperformed the Fund’s style-specific benchmark, the MSCI Emerging Markets Index.
Your Fund’s long-term performance appears later in this report.
Fund vs. Indexes
Total returns, 10/31/16 to 10/31/17, at net asset value (NAV). Performance shown does not include applicable contingent deferred sales charges (CDSC) or front-end sales charges, which would have reduced performance.
| | | | | |
| Class A Shares | | | | 18.29 | % |
| Class C Shares | | | | 17.38 | |
| Class R Shares | | | | 17.91 | |
| Class Y Shares | | | | 18.51 | |
| Class R5 Shares | | | | 18.51 | |
| Class R6 Shares | | | | 18.53 | |
| MSCI All Country World Index▼ (Broad Market Index) | | | | 23.20 | |
| MSCI Emerging Markets Index▼ (Style-Specific Index) | | | | 26.45 | |
Lipper Emerging Market Funds Index∎ (Peer Group Index) | | | | 24.58 | |
Source(s): ▼FactSet Research Systems Inc., ∎Lipper Inc. | | | | | |
Market conditions and your Fund
The reporting period began with major US stock market indexes posting gains and most hitting record highs following the US presidential election. Investors believed that the new administration’s plans to reduce tax rates, scale back regulations and increase infrastructure spending had the potential to stimulate economic growth. However, that was called into question in the first quarter of 2017, when it appeared that enacting significant regulatory and tax reform might be more difficult than previously anticipated.
Outside the US, Brexit (the UK’s plan to leave the European Union) remained a source of political and economic uncertainty, while improved economic data and confidence surveys raised the prospect of less accommodative monetary policy in continental Europe. In Asia, increased exports helped Japan’s economy, while China’s
economy continued to stabilize. Most international markets, including emerging markets, performed well during the reporting period. In addition to an improving global economic outlook, other positive tailwinds for international markets included continued weakness in the US dollar and reduced expectations for a major shift in US trade policy.
Interestingly, while 2017 marked the eighth year of the global bull market, we saw a shift in leadership as international stocks outperformed US stocks in the first three quarters of 2017 due primarily to a weaker dollar. Emerging markets stocks, as measured by the MSCI Emerging Markets Index, were also aided by a weaker dollar and outperformed broad US markets. Prior to 2017, international stocks had trailed US stocks for four consecutive years and in six of the last seven years. As the reporting period came to a close,
we held the view that both non-US developed and emerging equity markets appeared somewhat fully valued despite material discounts to the US market. In addition, recent earnings growth and earnings revision trends improved for many non-US developed markets.
The Fund seeks to provide long-term growth of capital while achieving a lower volatility level than its style-specific benchmark over a full market cycle. The Fund seeks long-term capital growth through stock selection using a proprietary multi-factor model based on fundamental and behavioral factors to forecast individual security returns and risk and rank companies relative to peers within their respective countries and sectors. The multi-factor model forecasts a return for each stock in the investable universe and is based on four concepts: Earnings Expectations, Market Sentiment, Management and Quality, and Value.1 For the reporting period, the Fund had a lower volatility level than its style-specific benchmark, the MSCI Emerging Markets Index.
For the reporting period, stock selection in both the consumer discretionary and materials sectors, along with the Fund’s overweight exposure in these sectors, contributed to the Fund’s performance relative to its style-specific benchmark. This contribution was offset by adverse stock selection in the financials and consumer staples sectors. The largest detractor from relative returns during the reporting period was significant underweight exposure to the information technology (IT) sector. In addition, a large overweight exposure to the utilities sector held back the Fund’s relative returns.
From a geographic perspective, underweight allocation in China and overweight exposure to Mexico hindered Fund performance relative to the style-specific benchmark. An overweight allocation in Brazil and Thailand added to Fund performance, as did stock selection in India.
| | | | | |
| Portfolio Composition | | |
By sector | % of total net assets |
| | | | | |
| Industrials | | | | 14.7 | % |
| Financials | | | | 13.3 | |
| Materials | | | | 13.2 | |
| Consumer Discretionary | | | | 11.5 | |
| Consumer Staples | | | | 10.6 | |
| Utilities | | | | 8.8 | |
| Health Care | | | | 6.6 | |
| Information Technology | | | | 5.9 | |
| Energy | | | | 4.8 | |
| Real Estate | | | | 4.3 | |
| Telecommunication Services | | | | 2.0 | |
Money Market Funds Plus Other Assets Less Liabilities | | | | 4.3 | |
| | | | | |
| Top 10 Equity Holdings* |
% of total net assets |
| | | | | |
1. InterGlobe Aviation Ltd.-REGS | | | | 1.6 | % |
2. Braskem S.A.-Preference Shares-ADR | | | | 1.6 | |
3. Thai Oil PCL | | | | 1.5 | |
4. HITEJINRO Co., Ltd. | | | | 1.5 | |
5. KT&G Corp. | | | | 1.5 | |
6. Lotte Himart Co., Ltd. | | | | 1.5 | |
7. Sun TV Network Ltd. | | | | 1.5 | |
8. Kuala Lumpur Kepong Bhd. | | | | 1.4 | |
9. Samsung Electronics Co., Ltd. | | | | 1.4 | |
10. China Shenhua Energy Co. Ltd.-ClassH | | | | 1.4 | |
| | | | | |
Total Net Assets | | | | $46.2 million | |
| |
Total Number of Holdings* | | | | 107 | |
The Fund’s holdings are subject to change, and there is no assurance that the Fund will continue to hold any particular security.
*Excluding money market fund holdings.
Data presented here are as of October 31, 2017.
|
| 4 Invesco Low Volatility Emerging Markets Fund |
Stock selection in South Africa and South Korea detracted from Fund performance during the reporting period.
The top individual contributor to Fund performance for the fiscal year was Magazine Luiza, a Brazilian retailer. The company’s stock price almost quadrupled during the fiscal year on the heels of growing revenue, declining borrowing costs and a nascent economic recovery in Brazil. Despite underperforming in South Korea as a whole, two large IT conglomerates, SK Hynix and Samsung Electronics, delivered strong absolute performance. Even with issues in Samsung’s smart phone division, the company’s stock rose based on a large cash reserve, as well as favorably viewed organizational changes.
A key detractor from Fund performance during the reporting period was Alrosa PJSC, a Russian company engaged in the exploration, mining and sales of diamonds. Yuzhou Properties, a Chinese investment holding company that engages in property development and home construction within mainland China, also detracted from Fund performance.
At the close of the reporting period, relative to the Fund’s style-specific index, the Fund held overweight positions in the consumer discretionary, consumer staples, industrials, materials and utilities sectors, and underweight positions in the financials, IT and telecommunication services sectors. Geographically, the Fund held overweight positions in Brazil, Mexico, South Africa and India, and under- weight positions in China, South Korea and Taiwan.
Please note, the Fund’s strategy is principally implemented through equity investments, but the Fund may also use futures contracts, a derivative instrument, to gain exposure to the equity market. During the reporting period, the Fund invested in MSCI Emerging Markets Index futures contracts, which generated a positive return. Derivatives can be a cost-effective way to gain exposure to asset classes. However, derivatives may amplify traditional investment risks through the creation of leverage and may be less liquid than traditional securities.
Thank you for your investment in Invesco Low Volatility Emerging Markets Fund.
| 1 | The Model’s investment concepts – Earnings Expectations, Market Sentiment, Management and Quality, and Value are the foundation of the Fund’s stock selection process. Factors considered in the Earnings Expectations concept include, but are not limited to, earnings momentum and earnings revisions. Similarly, Market Sentiment evaluates measures of stock price momentum, while the Management and Quality concept assesses capital efficiency. Lastly, the Value concept evaluates cash flow, dividend and earnings yield. |
The views and opinions expressed in management’s discussion of Fund performance are those of Invesco Advisers, Inc. These views and opinions are subject to change at any time based on factors such as market and economic conditions. These views and opinions may not be relied upon as investment advice or recommendations, or as an offer for a particular security. The information is not a complete analysis of every aspect of any market, country, industry, security or the Fund. Statements of fact are from sources considered reliable, but Invesco Advisers, Inc. makes no representation or warranty as to their completeness or accuracy. Although historical performance is no guarantee of future results, these insights may help you understand our investment management philosophy.
See important Fund and, if applicable, index disclosures later in this report.
| | |

| | Michael Abata Chartered Financial Analyst, Portfolio Manager, is manager of Invesco Low Volatility Emerging Markets Fund. |
| He joined Invesco in 2011. Mr. Abata earned a BA in economics from Binghamton University. |
| | | |

| | Uwe Draeger Portfolio Manager, is manager of Invesco Low Volatility Emerging Markets Fund. |
| He joined Invesco in 2005. Mr. Draeger earned a Diplom-Ökonom degree from Hoch-schule für Ökonomie Berlin, an MA from City of London Polytechnic and an MBA from Anglia Business School (Cambridge). |
| | | |

| | Nils Huter Chartered Financial Analyst, Portfolio Manager, is manager of Invesco Low Volatility Emerging Markets Fund. |
| He joined Invesco in 2007. Mr. Huter earned a business administration degree, Diplom Kaufmann (FH), the University of Applied Sciences and Arts in Hildesheim. |
| | |

| | Donna Chapman Wilson Portfolio Manager and Director of Portfolio Management, is manager of Invesco Low Volatility Emerging Markets Fund. |
| She joined Invesco in 1997. Ms. Chapman Wilson earned a BA in economics from Hampton University and an MBA in finance from the Wharton School of the University of Pennsylvania. |
|
| 5 Invesco Low Volatility Emerging Markets Fund |
Your Fund’s Long-Term Performance
Results of a $10,000 Investment – Oldest Share Class(es) since Inception
Fund and index data from 12/17/13
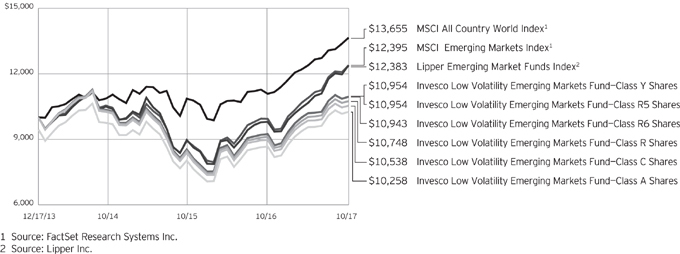
Past performance cannot guarantee comparable future results.
The data shown in the chart include reinvested distributions, applicable sales charges and Fund expenses including management fees. Index
results include reinvested dividends, but they do not reflect sales charges. Performance of the peer group, if applicable, reflects fund expenses and management fees; performance of a
market index does not. Performance shown in the chart and table(s) does not reflect deduction of taxes a shareholder would pay on Fund distributions or sale of Fund shares.
|
| 6 Invesco Low Volatility Emerging Markets Fund |
| | | | | |
Average Annual Total Returns | |
| As of 10/31/17, including maximum applicable sales charges | |
| | | | | |
| |
| Class A Shares | | | | | |
| Inception (12/17/13) | | | | 0.66 | % |
| 1 Year | | | | 11.82 | |
| |
| Class C Shares | | | | | |
| Inception (12/17/13) | | | | 1.36 | % |
| 1 Year | | | | 16.38 | |
| |
| Class R Shares | | | | | |
| Inception (12/17/13) | | | | 1.88 | % |
| 1 Year | | | | 17.91 | |
| |
| Class Y Shares | | | | | |
| Inception (12/17/13) | | | | 2.38 | % |
| 1 Year | | | | 18.51 | |
| |
| Class R5 Shares | | | | | |
| Inception (12/17/13) | | | | 2.38 | % |
| 1 Year | | | | 18.51 | |
| |
| Class R6 Shares | | | | | |
| Inception (12/17/13) | | | | 2.36 | % |
| 1 Year | | | | 18.53 | |
The performance data quoted represent past performance and cannot guarantee comparable future results; current performance may be lower or higher. Please visit invesco.com/performance for the most recent month-end performance. Performance figures reflect reinvested distributions, changes in net asset value and the effect of the maximum sales charge unless otherwise stated. Investment return and principal value will fluctuate so that you may have a gain or loss when you sell shares.
The net annual Fund operating expense ratio set forth in the most recent Fund prospectus as of the date of this report for Class A, Class C, Class R, Class Y, Class R5 and Class R6 shares was 1.34%, 2.09%, 1.59%, 1.09%, 1.09% and 1.09%, respectively.1 The total annual Fund operating expense ratio set forth in the most recent Fund prospectus as of the date of this report for Class A, Class C, Class R, Class Y, Class R5 and Class R6 shares was 2.28%, 3.03%, 2.53%, 2.03%, 1.88% and 1.88%, respectively. The expense ratios presented above may vary from the expense ratios presented in other sections of this report that are based on expenses incurred during the period covered by this report.
Class A share performance reflects the maximum 5.50% sales charge, and Class C share performance reflects the applicable contingent deferred sales
| | | | | |
Average Annual Total Returns | |
| As of 9/30/17, the most recent calendar quarter end, including maximum applicable sales charges | |
| |
| Class A Shares | | | | | |
| Inception (12/17/13) | | | | 0.45 | % |
| 1 Year | | | | 11.26 | |
| |
| Class C Shares | | | | | |
| Inception (12/17/13) | | | | 1.20 | % |
| 1 Year | | | | 15.81 | |
| |
| Class R Shares | | | | | |
| Inception (12/17/13) | | | | 1.73 | % |
| 1 Year | | | | 17.46 | |
| |
| Class Y Shares | | | | | |
| Inception (12/17/13) | | | | 2.21 | % |
| 1 Year | | | | 17.94 | |
| |
| Class R5 Shares | | | | | |
| Inception (12/17/13) | | | | 2.21 | % |
| 1 Year | | | | 17.94 | |
| |
| Class R6 Shares | | | | | |
| Inception (12/17/13) | | | | 2.19 | % |
| 1 Year | | | | 17.96 | |
charge (CDSC) for the period involved. The CDSC on Class C shares is 1% for the first year after purchase. Class R, Class Y, Class R5 and Class R6 class shares do not have a front-end sales charge or a CDSC; therefore, performance is at net asset value.
The performance of the Fund’s share classes will differ primarily due to different sales charge structures and class expenses.
Fund performance reflects any applicable fee waivers and/or expense reimbursements. Had the adviser not waived fees and/or reimbursed expenses currently or in the past, returns would have been lower. See current prospectus for more information.
| 1 | Total annual Fund operating expenses after any contractual fee waivers and/or expense reimbursements by the adviser in effect through at least February 28, 2019. See current prospectus for more information. |
|
| 7 Invesco Low Volatility Emerging Markets Fund |
Invesco Low Volatility Emerging Markets Fund’s investment objective is long-term growth of capital.
| ∎ | | Unless otherwise stated, information presented in this report is as of October 31, 2017, and is based on total net assets. |
| ∎ | | Unless otherwise noted, all data provided by Invesco. |
| ∎ | | To access your Fund’s reports/prospectus, visit invesco.com/fundreports. |
About share classes
| ∎ | | Class R shares are generally available only to employer sponsored retirement and benefit plans. Please see the prospectus for more information. |
| ∎ | | Class Y shares are available only to certain investors. Please see the prospectus for more information. |
| ∎ | | Class R5 shares and Class R6 shares are available for use by retirement plans that meet certain standards and for institutional investors. Class R6 shares are also available through intermediaries that have established an agreement with Invesco Distributors, Inc. to make such shares available for use in retail omnibus accounts. Please see the prospectus for more information. |
Principal risks of investing in the Fund
| ∎ | | Depositary receipts risk. Investing in depositary receipts involves the same risks as direct investments in foreign securities. In addition, the underlying issuers of certain depositary receipts are under no obligation to distribute shareholder communications or pass through any voting rights with respect to the deposited securities to the holders of such receipts. The Fund may therefore receive less timely information or have less control than if it invested directly in the foreign issuer. |
| ∎ | | Derivatives risk. The value of a derivative instrument depends largely on (and is derived from) the value of an underlying security, currency, commodity, interest rate, index or other asset (each referred to as an underlying asset). In addition to risks relating to the underlying assets, the use of derivatives may include other, possibly greater, risks, including counterparty, leverage and liquidity risks. Counterparty risk is the risk that the counterparty to the derivative contract will default on its obligation to pay the Fund the amount owed or otherwise perform under the derivative contract. Derivatives create leverage risk |
| | | because they do not require payment up front equal to the economic exposure created by owning the derivative. As a result, an adverse change in the value of the underlying asset could result in the Fund sustaining a loss that is substantially greater than the amount invested in the derivative, which may make the Fund’s returns more volatile and increase the risk of loss. Derivative instruments may also be less liquid than more traditional investments and the Fund may be unable to sell or close out its derivative positions at a desirable time or price. This risk may be more acute under adverse market conditions, during which the Fund may be most in need of liquidating its derivative positions. Derivatives may also be harder to value, less tax efficient and subject to changing government regulation that could impact the Fund’s ability to use certain derivatives or their cost. Also, derivatives used for hedging or to gain or limit exposure to a particular market segment may not provide the expected benefits, particularly during adverse market conditions. |
| ∎ | | Emerging markets securities risk. Emerging markets (also referred to as developing markets) are generally subject to greater market volatility, political, social and economic instability, uncertain trading markets and more governmental limitations on foreign investment than more developed markets. In addition, companies operating in emerging markets may be subject to lower trading volume and greater price fluctuations than companies in more developed markets. Securities law and the enforcement of systems of taxation in many emerging market countries may change quickly and unpredictably. In addition, investments in emerging markets securities may also be subject to additional transaction costs, delays in settlement procedures, and lack of timely information. |
| ∎ | | Foreign securities risk. The Fund’s foreign investments may be adversely affected by political and social instability, changes in |
| | | economic or taxation policies, difficulty in enforcing obligations, decreased liquidity or increased volatility. Foreign investments also involve the risk of the possible seizure, nationalization or expropriation of the issuer or foreign deposits (in which the Fund could lose its entire investments in a certain market) and the possible adoption of foreign governmental restrictions such as exchange controls. Unless the Fund has hedged its foreign securities risk, foreign securities risk also involves the risk of negative foreign currency rate fluctuations, which may cause the value of securities denominated in such foreign currency (or other instruments through which the Fund has exposure to foreign currencies) to decline in value. Currency exchange rates may fluctuate significantly over short periods of time. Currency hedging strategies, if used, are not always successful. |
| ∎ | | Geographic focus risk. The Fund may from time to time invest a substantial amount of its assets in securities of issuers located in a single country or a limited number of countries. Adverse economic, political or social conditions in those countries may therefore have a significant negative impact on the Fund’s investment performance. |
| ∎ | | Management risk. The Fund is actively managed and depends heavily on the Adviser’s judgment about markets, interest rates or the attractiveness, relative values, liquidity, or potential appreciation of particular investments made for the Fund’s portfolio. The Fund could experience losses if these judgments prove to be incorrect. There is no guarantee that the portfolio manager’s stock selection process will produce lower volatility than the broader markets in which the Fund invests. In addition, the Fund’s investment strategy to seek lower volatility may cause the Fund to underperform the broader markets in which the Fund invests during market rallies. Such underperformance could be significant during sudden or significant market rallies. Additionally, legislative, regulatory, or tax developments may adversely affect management of the Fund and, therefore, the ability of the Fund to achieve its investment objective. |
|
This report must be accompanied or preceded by a currently effective Fund prospectus, which contains more complete information, including sales charges and expenses. Investors should read it carefully before investing. |
|
|
| NOT FDIC INSURED | MAY LOSE VALUE | NO BANK GUARANTEE |
|
| 8 Invesco Low Volatility Emerging Markets Fund |
| ∎ | | Market risk. The market values of the Fund’s investments, and therefore the value of the Fund’s shares, will go up and down, sometimes rapidly or unpredictably. Market risk may affect a single issuer, industry or section of the economy, or it may affect the market as a whole. Individual stock prices tend to go up and down more dramatically than those of certain other types of investments, such as bonds. During a general downturn in the financial markets, multiple asset classes may decline in value. When markets perform well, there can be no assurance that specific investments held by the Fund will rise in value. |
| ∎ | | Preferred securities risk. Preferred securities are subject to issuer-specific and market risks applicable generally to equity securities. Preferred securities also may be subordinated to bonds or other debt instruments, subjecting them to a greater risk of non-payment, may be less liquid than many other securities, such as common stocks, and generally offer no voting rights with respect to the issuer. |
| ∎ | | Small- and mid-capitalization companies risks. Small- and mid-capitalization companies tend to be more vulnerable to changing market conditions, may have little or no operating history or track record of success, and may have more limited product lines and markets, less experienced management and fewer financial resources than larger companies. These companies’ securities may be more volatile and less liquid than those of more established companies, and their returns may vary, sometimes significantly, from the overall securities market. |
About indexes used in this report
| ∎ | | The MSCI All Country World Index is an unmanaged index considered representative of large- and mid-cap stocks across developed and emerging markets. The index is computed using the net return, which withholds applicable taxes for non-resident investors. |
| ∎ | | The MSCI Emerging Markets Index is an unmanaged index considered representative of stocks of developing countries. The index is computed using the net return, which withholds applicable taxes for non-resident investors. |
| ∎ | | The Lipper Emerging Market Funds Index is an unmanaged index considered representative of emerging market funds tracked by Lipper. |
| ∎ | | The Fund is not managed to track the performance of any particular index, including the index(es) described here, and consequently, the performance of the Fund may deviate significantly from the performance of the index(es). |
| ∎ | | A direct investment cannot be made in an index. Unless otherwise indicated, index results include reinvested dividends, and they do not reflect sales charges. Performance of the peer group, if applicable, reflects fund expenses; performance of a market index does not. |
Other information
| ∎ | | The returns shown in management’s discussion of Fund performance are based on net asset values (NAVs) calculated for shareholder transactions. Generally accepted accounting principles require adjustments to be made to the net assets of the Fund at period end for financial reporting purposes, and as such, the NAVs for shareholder transactions and the returns based on those NAVs may differ from the NAVs and returns reported in the Financial Highlights. |
| ∎ | | Industry classifications used in this report are generally according to the Global Industry Classification Standard, which was developed by and is the exclusive property and a service mark of MSCI Inc. and Standard & Poor’s. |
|
| 9 Invesco Low Volatility Emerging Markets Fund |
Schedule of Investments
October 31, 2017
| | | | | | | | |
| | | Shares | | | Value | |
Common Stocks & Other Equity Interests–95.73% | |
| Brazil–9.80% | |
Braskem S.A.–Preference Shares–ADR(a) | | | 45,700 | | | $ | 726,439 | |
CPFL Energia S.A. | | | 71,500 | | | | 601,061 | |
Ecorodovias Infraestrutura e Logistica S.A. | | | 156,900 | | | | 585,623 | |
Estacio Participacoes S.A. | | | 29,600 | | | | 266,385 | |
Magazine Luiza S.A. | | | 17,100 | | | | 333,501 | |
MRV Engenharia e Participacoes S.A. | | | 121,800 | | | | 471,741 | |
Qualicorp S.A. | | | 47,300 | | | | 505,779 | |
Smiles Fidelidade S.A. | | | 22,800 | | | | 588,661 | |
Transmissora Alianca de Energia Eletrica S.A.(b) | | | 71,000 | | | | 446,015 | |
| | | | | | | | 4,525,205 | |
|
| Chile–3.78% | |
Banco de Chile | | | 2,391,811 | | | | 367,539 | |
Embotelladora Andina S.A.–Preference Shares–Class B | | | 23,201 | | | | 119,153 | |
Enel Américas S.A.–ADR | | | 61,586 | | | | 652,812 | |
Enel Chile S.A. | | | 3,530,159 | | | | 412,224 | |
Enel Generación Chile S.A. | | | 220,605 | | | | 192,667 | |
| | | | | | | | 1,744,395 | |
|
| China–7.28% | |
China Shenhua Energy Co. Ltd.–Class H | | | 274,500 | | | | 655,867 | |
Chongqing Rural Commercial Bank Co., Ltd.–Class H | | | 925,000 | | | | 629,091 | |
Guangzhou Automobile Group Co., Ltd.–Class H | | | 240,000 | | | | 596,816 | |
Jiangsu Expressway Co. Ltd.–Class H | | | 134,000 | | | | 205,891 | |
Longfor Properties Co. Ltd. | | | 204,000 | | | | 478,565 | |
Yantai Changyu Pioneer Wine Co. Ltd.–Class B | | | 64,900 | | | | 168,044 | |
Yuzhou Properties Co. Ltd. | | | 1,275,000 | | | | 629,214 | |
| | | | | | | | 3,363,488 | |
|
| Colombia–0.24% | |
Cemex Latam Holdings S.A.(a) | | | 31,898 | | | | 113,040 | |
|
| Hong Kong–0.35% | |
Kingboard Laminates Holdings Ltd. | | | 96,000 | | | | 161,202 | |
|
| India–13.03% | |
Bharat Electronics Ltd. | | | 90,072 | | | | 256,803 | |
Hero MotoCorp Ltd. | | | 9,468 | | | | 562,969 | |
Hindustan Petroleum Corp. Ltd. | | | 15,949 | | | | 110,559 | |
InterGlobe Aviation Ltd.–REGS(c) | | | 39,345 | | | | 758,279 | |
KEC International Ltd. | | | 94,406 | | | | 426,921 | |
NHPC Ltd. | | | 660,346 | | | | 291,689 | |
NMDC Ltd. | | | 289,228 | | | | 572,448 | |
Power Finance Corp. Ltd. | | | 265,111 | | | | 570,164 | |
Rural Electrification Corp. Ltd. | | | 208,383 | | | | 557,426 | |
Sun TV Network Ltd. | | | 51,067 | | | | 675,530 | |
Tata Steel Ltd. | | | 54,124 | | | | 588,323 | |
Vedanta Ltd. | | | 126,484 | | | | 648,268 | |
| | | | | | | | 6,019,379 | |
| | | | | | | | |
| | | Shares | | | Value | |
| Malaysia–5.96% | |
AirAsia Bhd. | | | 756,000 | | | $ | 596,654 | |
Kuala Lumpur Kepong Bhd. | | | 114,800 | | | | 667,316 | |
Petronas Dagangan Bhd. | | | 31,300 | | | | 177,209 | |
PPB Group Bhd. | | | 45,300 | | | | 179,616 | |
Public Bank Bhd. | | | 110,500 | | | | 534,071 | |
Telekom Malaysia Bhd. | | | 116,900 | | | | 175,405 | |
Tenaga Nasional Bhd. | | | 47,800 | | | | 169,423 | |
Top Glove Corp. Bhd. | | | 166,800 | | | | 252,250 | |
| | | | | | | | 2,751,944 | |
|
| Mexico–5.15% | |
Coca-Cola FEMSA, S.A.B. de C.V.–Series L | | | 60,300 | | | | 407,632 | |
Gruma, S.A.B. de C.V.–Class B | | | 15,260 | | | | 200,292 | |
Grupo Aeroportuario del Centro Norte, S.A.B. de C.V. | | | 106,800 | | | | 539,532 | |
Industrias Bachoco, S.A.B. de C.V.–Series B | | | 36,100 | | | | 177,794 | |
Megacable Holdings S.A.B. de C.V.–Series CPO(d) | | | 68,400 | | | | 271,011 | |
Nemak, S.A.B. de C.V.–REGS(c) | | | 181,300 | | | | 136,462 | |
Wal-Mart de México, S.A.B. de C.V.–Series V | | | 288,900 | | | | 646,775 | |
| | | | | | | | 2,379,498 | |
|
| Philippines–0.36% | |
Aboitiz Equity Ventures Inc. | | | 114,090 | | | | 165,768 | |
|
| Poland–2.24% | |
Powszechny Zaklad Ubezpieczen S.A. | | | 45,554 | | | | 588,028 | |
Tauron Polska Energia S.A.(a) | | | 462,192 | | | | 447,016 | |
| | | | | | | | 1,035,044 | |
|
| Qatar–0.35% | |
Qatar Islamic Bank (S.A.Q) | | | 6,376 | | | | 162,756 | |
|
| Russia–5.88% | |
Alrosa PJSC | | | 395,466 | | | | 508,577 | |
Inter RAO UES PJSC | | | 10,032,000 | | | | 614,019 | |
LUKOIL PJSC–ADR | | | 11,302 | | | | 599,345 | |
Magnitogorsk Iron & Steel Works PJSC | | | 783,800 | | | | 591,788 | |
Novolipetsk Steel PSJC–GDR–REGS(c) | | | 17,448 | | | | 402,176 | |
| | | | | | | | 2,715,905 | |
|
| South Africa–9.23% | |
AECI Ltd. | | | 17,036 | | | | 127,364 | |
AVI Ltd. | | | 69,594 | | | | 487,617 | |
Barclays Africa Group Ltd. | | | 57,603 | | | | 571,022 | |
Bidvest Group Ltd. (The) | | | 23,931 | | | | 290,316 | |
Kumba Iron Ore Ltd. | | | 8,952 | | | | 172,240 | |
Liberty Holdings Ltd. | | | 55,324 | | | | 434,549 | |
Mondi Ltd. | | | 18,236 | | | | 438,963 | |
Nedbank Group Ltd. | | | 32,148 | | | | 471,570 | |
Netcare Ltd. | | | 50,563 | | | | 89,542 | |
Reunert Ltd. | | | 54,452 | | | | 267,852 | |
Sappi Ltd. | | | 85,625 | | | | 573,583 | |
Super Group Ltd.(a) | | | 68,235 | | | | 192,587 | |
Tsogo Sun Holdings Ltd. | | | 98,915 | | | | 146,116 | |
| | | | | | | | 4,263,321 | |
See accompanying Notes to Financial Statements which are an integral part of the financial statements.
10 Invesco Low Volatility Emerging Markets Fund
| | | | | | | | |
| | | Shares | | | Value | |
| South Korea–16.07% | |
Chong Kun Dang Pharmaceutical Corp. | | | 4,232 | | | $ | 424,960 | |
Daewon Pharmaceutical Co., Ltd. | | | 7,978 | | | | 127,111 | |
Hankook Tire Co. Ltd. | | | 5,033 | | | | 242,589 | |
Hanwha Corp. | | | 16,405 | | | | 653,804 | |
HITEJINRO Co., Ltd. | | | 29,177 | | | | 692,743 | |
Hyundai Development Co. | | | 13,904 | | | | 497,662 | |
Korea United Pharm., Inc. | | | 8,850 | | | | 191,600 | |
KT&G Corp. | | | 7,250 | | | | 685,952 | |
Kwang Dong Pharmaceutical Co., Ltd. | | | 14,396 | | | | 104,082 | |
LG Display Co., Ltd. | | | 16,550 | | | | 435,832 | |
Lotte Chemical Corp. | | | 315 | | | | 103,890 | |
Lotte Himart Co., Ltd. | | | 10,330 | | | | 683,233 | |
Samsung Electronics Co., Ltd. | | | 267 | | | | 657,273 | |
Samyang Corp. | | | 1,631 | | | | 140,712 | |
SK Hynix Inc. | | | 8,136 | | | | 598,259 | |
SL Corp. | | | 8,141 | | | | 166,767 | |
Woori Bank | | | 43,423 | | | | 635,644 | |
Yuhan Corp. | | | 2,074 | | | | 378,345 | |
| | | | | | | | 7,420,458 | |
|
| Taiwan–4.26% | |
Chunghwa Telecom Co., Ltd. | | | 150,000 | | | | 512,217 | |
General Interface Solution Holding Ltd. | | | 29,000 | | | | 267,158 | |
Powertech Technology Inc. | | | 192,000 | | | | 601,246 | |
St. Shine Optical Co., Ltd. | | | 24,000 | | | | 587,102 | |
| | | | | | | | 1,967,723 | |
|
| Thailand–5.92% | |
Airports of Thailand PCL | | | 267,700 | | | | 477,345 | |
Intouch Holdings PCL | | | 134,752 | | | | 235,212 | |
Krung Thai Bank PCL | | | 1,138,500 | | | | 623,592 | |
| | | | | | | | |
| | | Shares | | | Value | |
| Thailand–(continued) | |
Mega Lifesciences PCL | | | 305,400 | | | $ | 386,024 | |
Ratchaburi Electricity Generating Holding PCL | | | 133,300 | | | | 223,651 | |
Thai Oil PCL | | | 226,900 | | | | 697,214 | |
Thai Vegetable Oil PCL(a) | | | 108,500 | | | | 90,613 | |
| | | | | | | | 2,733,651 | |
|
| Turkey–3.94% | |
BIM Birlesik Magazalar A.S. | | | 10,397 | | | | 212,188 | |
Soda Sanayii A.S. | | | 381,007 | | | | 527,223 | |
TAV Havalimanlari Holding A.S. | | | 96,990 | | | | 482,394 | |
Tekfen Holding A.S. | | | 177,701 | | | | 599,987 | |
| | | | | | | | 1,821,792 | |
|
| United Arab Emirates–1.89% | |
Aldar Properties PJSC | | | 876,734 | | | | 568,083 | |
DAMAC Properties Dubai Co. PJSC | | | 284,236 | | | | 305,663 | |
| | | | | | | | 873,746 | |
Total Common Stocks & Other Equity Interests
(Cost $37,535,815) | | | | 44,218,315 | |
|
Money Market Funds–1.16% | |
Invesco Government & Agency Portfolio– Institutional Class, 0.95%(e) | | | 320,527 | | | | 320,527 | |
Invesco Treasury Portfolio–Institutional Class, 0.94%(e) | | | 213,684 | | | | 213,684 | |
Total Money Market Funds
(Cost $534,211) | | | | 534,211 | |
TOTAL INVESTMENTS IN SECURITIES–96.89% (Cost $38,070,026) | | | | 44,752,526 | |
OTHER ASSETS LESS LIABILITIES–3.11% | | | | 1,434,883 | |
NET ASSETS–100.00% | | | $ | 46,187,409 | |
Investment Abbreviations:
| | |
| ADR | | – American Depositary Receipt |
| CPO | | – Certificates of Ordinary Participation |
| GDR | | – Global Depositary Receipt |
| PJSC | | - Private Joint Stock Company |
| REGS | | – Regulation S |
Notes to Schedule of Investments:
| (a) | Non-income producing security. |
| (b) | Each unit represents two preferred shares and one common shares. |
| (c) | Security purchased or received in a transaction exempt from registration under the Securities Act of 1933, as amended (the “1933 Act”). The security may be resold pursuant to an exemption from registration under the 1933 Act, typically to qualified institutional buyers. The aggregate value of these securities at October 31, 2017 was $1,296,917, which represented 2.81% of the Fund's Net Assets. |
| (d) | Each CPO represents two Series A shares. |
| (e) | The money market fund and the Fund are affiliated by having the same investment adviser. The rate shown is the 7-day SEC standardized yield as of October 31, 2017. |
| | | | | | | | | | | | | | | | | | | | |
| Open Futures Contracts–Equity Risk(a) | | | | |
| Long Futures Contracts | | Number of
Contracts | | | Expiration Month | | | Notional
Value | | | Value | | | Unrealized
Appreciation | |
MSCI Emerging Markets Mini Index | | | 9 | | | | December-2017 | | | $ | 505,890 | | | $ | 11,710 | | | $ | 11,710 | |
| (a) | Futures contracts collateralized by $18,900 cash held with Bank of America Merrill Lynch, the futures commission merchant. |
See accompanying Notes to Financial Statements which are an integral part of the financial statements.
11 Invesco Low Volatility Emerging Markets Fund
Statement of Assets and Liabilities
October 31, 2017
| | | | |
Assets: | | | | |
Investments in securities, at value (Cost $37,535,815) | | $ | 44,218,315 | |
Investments in affiliated money market funds, at value and cost | | | 534,211 | |
Other investments: | | | | |
Variation margin receivable — futures | | | 4,365 | |
Foreign currencies, at value (Cost $1,496,840) | | | 1,486,082 | |
Deposits with brokers: | | | | |
Cash collateral — exchange-traded futures contracts | | | 18,900 | |
Receivable for: | | | | |
Fund shares sold | | | 6,516 | |
Dividends | | | 19,676 | |
Fund expenses absorbed | | | 27,811 | |
Investment for trustee deferred compensation and retirement plans | | | 7,273 | |
Other assets | | | 56,420 | |
Total assets | | | 46,379,569 | |
| |
Liabilities: | | | | |
Payable for: | | | | |
Investments purchased | | | 8,761 | |
Fund shares reacquired | | | 20,212 | |
Accrued foreign taxes | | | 84,851 | |
Accrued fees to affiliates | | | 4,834 | |
Accrued trustees’ and officers’ fees and benefits | | | 1,584 | |
Accrued other operating expenses | | | 64,645 | |
Trustee deferred compensation and retirement plans | | | 7,273 | |
Total liabilities | | | 192,160 | |
Net assets applicable to shares outstanding | | $ | 46,187,409 | |
| |
Net assets consist of: | | | | |
Shares of beneficial interest | | $ | 32,881,780 | |
Undistributed net investment income | | | 917,833 | |
Undistributed net realized gain | | | 5,704,362 | |
Net unrealized appreciation | | | 6,683,434 | |
| | | $ | 46,187,409 | |
| | | | |
Net Assets: | | | | |
Class A | | $ | 7,471,009 | |
Class C | | $ | 323,314 | |
Class R | | $ | 23,499 | |
Class Y | | $ | 1,823,187 | |
Class R5 | | $ | 9,929 | |
Class R6 | | $ | 36,536,471 | |
|
Shares outstanding, no par value,
with an unlimited number of shares authorized: | |
Class A | | | 768,705 | |
Class C | | | 33,496 | |
Class R | | | 2,422 | |
Class Y | | | 187,111 | |
Class R5 | | | 1,019 | |
Class R6 | | | 3,753,021 | |
Class A: | | | | |
Net asset value per share | | $ | 9.72 | |
Maximum offering price per share | | | | |
(Net asset value of $9.72 ¸ 94.50%) | | $ | 10.29 | |
Class C: | | | | |
Net asset value and offering price per share | | $ | 9.65 | |
Class R: | | | | |
Net asset value and offering price per share | | $ | 9.70 | |
Class Y: | | | | |
Net asset value and offering price per share | | $ | 9.74 | |
Class R5: | | | | |
Net asset value and offering price per share | | $ | 9.74 | |
Class R6: | | | | |
Net asset value and offering price per share | | $ | 9.74 | |
See accompanying Notes to Financial Statements which are an integral part of the financial statements.
12 Invesco Low Volatility Emerging Markets Fund
Statement of Operations
For the year ended October 31, 2017
| | | | |
Investment income: | | | | |
Dividends (net of foreign withholding taxes of $158,229) | | $ | 1,513,319 | |
Dividends from affiliated money market funds | | | 2,875 | |
Total investment income | | | 1,516,194 | |
| |
Expenses: | | | | |
Advisory fees | | | 431,734 | |
Administrative services fees | | | 50,000 | |
Custodian fees | | | 74,010 | |
Distribution fees: | | | | |
Class A | | | 15,733 | |
Class C | | | 1,940 | |
Class R | | | 119 | |
Transfer agent fees —A, C, R and Y | | | 17,549 | |
Transfer agent fees —R5 | | | 1 | |
Transfer agent fees —R6 | | | 164 | |
Trustees’ and officers’ fees and benefits | | | 20,425 | |
Registration and filing fees | | | 78,143 | |
Reports to shareholders | | | 24,304 | |
Professional services fees | | | 68,157 | |
Other | | | 15,193 | |
Total expenses | | | 797,472 | |
Less: Fees waived, expenses reimbursed and expense offset arrangement(s) | | | (254,089 | ) |
Net expenses | | | 543,383 | |
Net investment income | | | 972,811 | |
| |
Realized and unrealized gain (loss) from: | | | | |
Net realized gain (loss) from: | | | | |
Investment securities (net of foreign taxes of $157,799) | | | 5,486,137 | |
Foreign currencies | | | (28,914 | ) |
Futures contracts | | | 266,686 | |
| | | | 5,723,909 | |
Change in net unrealized appreciation (depreciation) of: | | | | |
Investment securities (net of foreign taxes of $134,971) | | | 1,368,212 | |
Foreign currencies | | | (5,950 | ) |
Futures contracts | | | 10,492 | |
| | | | 1,372,754 | |
Net realized and unrealized gain | | | 7,096,663 | |
Net increase in net assets resulting from operations | | $ | 8,069,474 | |
See accompanying Notes to Financial Statements which are an integral part of the financial statements.
13 Invesco Low Volatility Emerging Markets Fund
Statement of Changes in Net Assets
For the years ended October 31, 2017 and 2016
| | | | | | | | |
| | | 2017 | | | 2016 | |
Operations: | | | | | | | | |
Net investment income | | $ | 972,811 | | | $ | 710,549 | |
Net realized gain | | | 5,723,909 | | | | 1,795,098 | |
Change in net unrealized appreciation | | | 1,372,754 | | | | 5,700,909 | |
Net increase in net assets resulting from operations | | | 8,069,474 | | | | 8,206,556 | |
| | |
Distributions to shareholders from net investment income: | | | | | | | | |
Class A | | | (35,912 | ) | | | (15,051 | ) |
Class C | | | (179 | ) | | | (69 | ) |
Class R | | | (235 | ) | | | (137 | ) |
Class Y | | | (29,372 | ) | | | (14,541 | ) |
Class R5 | | | (1,859 | ) | | | (1,322 | ) |
Class R6 | | | (563,343 | ) | | | (1,322 | ) |
Total distributions from net investment income | | | (630,900 | ) | | | (32,442 | ) |
| | |
Distributions to shareholders from net realized gains: | | | | | | | | |
Class A | | | (103,932 | ) | | | — | |
Class C | | | (3,794 | ) | | | — | |
Class R | | | (935 | ) | | | — | |
Class Y | | | (72,517 | ) | | | — | |
Class R5 | | | (4,589 | ) | | | — | |
Class R6 | | | (1,390,853 | ) | | | — | |
Total distributions from net realized gains | | | (1,576,620 | ) | | | — | |
| | |
Share transactions-net: | | | | | | | | |
Class A | | | 3,026,098 | | | | 1,857,102 | |
Class C | | | 59,423 | | | | 189,226 | |
Class R | | | (5,494 | ) | | | 1,464 | |
Class Y | | | (543,569 | ) | | | 556,260 | |
Class R5 | | | (138,308 | ) | | | — | |
Class R6 | | | (5,053,148 | ) | | | 29,026,790 | |
Net increase (decrease) in net assets resulting from share transactions | | | (2,654,998 | ) | | | 31,630,842 | |
Net increase in net assets | | | 3,206,956 | | | | 39,804,956 | |
| | |
Net assets: | | | | | | | | |
Beginning of year | | | 42,980,453 | | | | 3,175,497 | |
End of year (includes undistributed net investment income of $917,833 and $615,905, respectively) | | $ | 46,187,409 | | | $ | 42,980,453 | |
Notes to Financial Statements
October 31, 2017
NOTE 1—Significant Accounting Policies
Invesco Low Volatility Emerging Markets Fund (the “Fund”) is a series portfolio of AIM Investment Funds (Invesco Investment Funds) (the “Trust”). The Trust is organized as a Delaware statutory trust and is registered under the Investment Company Act of 1940, as amended (the “1940 Act”), as an open-end series management investment company consisting of twenty separate series portfolios, each authorized to issue an unlimited number of shares of beneficial interest. The assets, liabilities and operations of each portfolio are accounted for separately. Information presented in these financial statements pertains only to the Fund. Matters affecting each portfolio or class will be voted on exclusively by the shareholders of such portfolio or class.
The Fund’s investment objective is long-term growth of capital.
The Fund currently consists of six different classes of shares: Class A, Class C, Class R, Class Y, Class R5 and Class R6. Class Y shares are available only to certain investors. Class A shares are sold with a front-end sales charge unless certain waiver criteria are met and under certain circumstances load waived shares may be subject to contingent deferred sales charges (“CDSC”). Class C shares are sold with a CDSC. Class R, Class Y, Class R5 and Class R6 shares are sold at net asset value.
14 Invesco Low Volatility Emerging Markets Fund
The Fund is an investment company and accordingly follows the investment company accounting and reporting guidance in accordance with Financial Accounting Standards Board Accounting Standards Codification Topic 946, Financial Services — Investment Companies.
The following is a summary of the significant accounting policies followed by the Fund in the preparation of its financial statements.
| A. | Security Valuations — Securities, including restricted securities, are valued according to the following policy. |
A security listed or traded on an exchange (except convertible securities) is valued at its last sales price or official closing price as of the close of the customary trading session on the exchange where the security is principally traded, or lacking any sales or official closing price on a particular day, the security may be valued at the closing bid price on that day. Securities traded in the over-the-counter market are valued based on prices furnished by independent pricing services or market makers. When such securities are valued by an independent pricing service they may be considered fair valued. Futures contracts are valued at the final settlement price set by an exchange on which they are principally traded. Listed options are valued at the mean between the last bid and asked prices from the exchange on which they are principally traded. Options not listed on an exchange are valued by an independent source at the mean between the last bid and asked prices. For purposes of determining net asset value (“NAV”) per share, futures and option contracts generally are valued 15 minutes after the close of the customary trading session of the New York Stock Exchange (“NYSE”).
Investments in open-end and closed-end registered investment companies that do not trade on an exchange are valued at the end-of-day net asset value per share. Investments in open-end and closed-end registered investment companies that trade on an exchange are valued at the last sales price or official closing price as of the close of the customary trading session on the exchange where the security is principally traded.
Debt obligations (including convertible securities) and unlisted equities are fair valued using an evaluated quote provided by an independent pricing service. Evaluated quotes provided by the pricing service may be determined without exclusive reliance on quoted prices, and may reflect appropriate factors such as institution-size trading in similar groups of securities, developments related to specific securities, dividend rate (for unlisted equities), yield (for debt obligations), quality, type of issue, coupon rate (for debt obligations), maturity (for debt obligations), individual trading characteristics and other market data. Pricing services generally value debt obligations assuming orderly transactions of institutional round lot size, but a fund may hold or transact in the same securities in smaller, odd lot sizes. Odd lots often trade at lower prices than institutional round lots. Debt obligations are subject to interest rate and credit risks. In addition, all debt obligations involve some risk of default with respect to interest and/or principal payments.
Foreign securities’ (including foreign exchange contracts) prices are converted into U.S. dollar amounts using the applicable exchange rates as of the close of the NYSE. If market quotations are available and reliable for foreign exchange-traded equity securities, the securities will be valued at the market quotations. Because trading hours for certain foreign securities end before the close of the NYSE, closing market quotations may become unreliable. If between the time trading ends on a particular security and the close of the customary trading session on the NYSE, events occur that the investment adviser determines are significant and make the closing price unreliable, the Fund may fair value the security. If the event is likely to have affected the closing price of the security, the security will be valued at fair value in good faith using procedures approved by the Board of Trustees. Adjustments to closing prices to reflect fair value may also be based on a screening process of an independent pricing service to indicate the degree of certainty, based on historical data, that the closing price in the principal market where a foreign security trades is not the current value as of the close of the NYSE. Foreign securities’ prices meeting the approved degree of certainty that the price is not reflective of current value will be priced at the indication of fair value from the independent pricing service. Multiple factors may be considered by the independent pricing service in determining adjustments to reflect fair value and may include information relating to sector indices, American Depositary Receipts and domestic and foreign index futures. Foreign securities may have additional risks including exchange rate changes, potential for sharply devalued currencies and high inflation, political and economic upheaval, the relative lack of issuer information, relatively low market liquidity and the potential lack of strict financial and accounting controls and standards.
Securities for which market prices are not provided by any of the above methods may be valued based upon quotes furnished by independent sources. The last bid price may be used to value equity securities. The mean between the last bid and asked prices is used to value debt obligations, including corporate loans.
Securities for which market quotations are not readily available or became unreliable are valued at fair value as determined in good faith by or under the supervision of the Trust’s officers following procedures approved by the Board of Trustees. Issuer specific events, market trends, bid/asked quotes of brokers and information providers and other market data may be reviewed in the course of making a good faith determination of a security’s fair value.
The Fund may invest in securities that are subject to interest rate risk, meaning the risk that the prices will generally fall as interest rates rise and, conversely, the prices will generally rise as interest rates fall. Specific securities differ in their sensitivity to changes in interest rates depending on their individual characteristics. Changes in interest rates may result in increased market volatility, which may affect the value and/or liquidity of certain Fund investments.
Valuations change in response to many factors including the historical and prospective earnings of the issuer, the value of the issuer’s assets, general economic conditions, interest rates, investor perceptions and market liquidity. Because of the inherent uncertainties of valuation, the values reflected in the financial statements may materially differ from the value received upon actual sale of those investments.
| B. | Securities Transactions and Investment Income — Securities transactions are accounted for on a trade date basis. Realized gains or losses on sales are computed on the basis of specific identification of the securities sold. Interest income (net of withholding tax, if any) is recorded on the accrual basis from settlement date. Dividend income (net of withholding tax, if any) is recorded on the ex-dividend date. |
The Fund may periodically participate in litigation related to Fund investments. As such, the Fund may receive proceeds from litigation settlements. Any proceeds received are included in the Statement of Operations as realized gain (loss) for investments no longer held and as unrealized gain (loss) for investments still held.
Brokerage commissions and mark ups are considered transaction costs and are recorded as an increase to the cost basis of securities purchased and/or a reduction of proceeds on a sale of securities. Such transaction costs are included in the determination of net realized and unrealized gain (loss) from investment securities reported in the Statement of Operations and the Statement of Changes in Net Assets and the net realized and unrealized gains (losses) on securities per share in the Financial Highlights. Transaction costs are included in the calculation of the Fund's net asset value and, accordingly, they reduce the Fund’s total returns. These transaction costs are not considered operating expenses and are not reflected in net investment income reported in the Statement of Operations and the Statement of Changes in Net Assets, or the net
15 Invesco Low Volatility Emerging Markets Fund
investment income per share and the ratios of expenses and net investment income reported in the Financial Highlights, nor are they limited by any expense limitation arrangements between the Fund and the investment adviser.
The Fund allocates income and realized and unrealized capital gains and losses to a class based on the relative net assets of each class.
| C. | Country Determination — For the purposes of making investment selection decisions and presentation in the Schedule of Investments, the investment adviser may determine the country in which an issuer is located and/or credit risk exposure based on various factors. These factors include the laws of the country under which the issuer is organized, where the issuer maintains a principal office, the country in which the issuer derives 50% or more of its total revenues and the country that has the primary market for the issuer’s securities, as well as other criteria. Among the other criteria that may be evaluated for making this determination are the country in which the issuer maintains 50% or more of its assets, the type of security, financial guarantees and enhancements, the nature of the collateral and the sponsor organization. Country of issuer and/or credit risk exposure has been determined to be the United States of America, unless otherwise noted. |
| D. | Distributions — Distributions from net investment income and net realized capital gain, if any, are generally declared and paid annually and recorded on the ex-dividend date. The Fund may elect to treat a portion of the proceeds from redemptions as distributions for federal income tax purposes. |
| E. | Federal Income Taxes — The Fund intends to comply with the requirements of Subchapter M of the Internal Revenue Code of 1986, as amended (the “Internal Revenue Code”), necessary to qualify as a regulated investment company and to distribute substantially all of the Fund’s taxable earnings to shareholders. As such, the Fund will not be subject to federal income taxes on otherwise taxable income (including net realized capital gain) that is distributed to shareholders. Therefore, no provision for federal income taxes is recorded in the financial statements. |
The Fund recognizes the tax benefits of uncertain tax positions only when the position is more likely than not to be sustained. Management has analyzed the Fund’s uncertain tax positions and concluded that no liability for unrecognized tax benefits should be recorded related to uncertain tax positions. Management is not aware of any tax positions for which it is reasonably possible that the total amounts of unrecognized tax benefits will change materially in the next 12 months.
The Fund files tax returns in the U.S. Federal jurisdiction and certain other jurisdictions. Generally, the Fund is subject to examinations by such taxing authorities for up to three years after the filing of the return for the tax period.
| F. | Expenses — Fees provided for under the Rule 12b-1 plan of a particular class of the Fund are charged to the operations of such class. Transfer agency fees and expenses and other shareholder recordkeeping fees and expenses attributable to Class R5 and Class R6 are allocated to each share class based on relative net assets. Sub-accounting fees attributable to Class R5 are charged to the operations of the class. Transfer agency fees and expenses and other shareholder recordkeeping fees and expenses relating to all other classes are allocated among those classes based on relative net assets. All other expenses are allocated among the classes based on relative net assets. |
| G. | Accounting Estimates — The preparation of financial statements in conformity with accounting principles generally accepted in the United States of America (“GAAP”) requires management to make estimates and assumptions that affect the reported amounts of assets and liabilities at the date of the financial statements and the reported amounts of revenues and expenses during the reporting period including estimates and assumptions related to taxation. Actual results could differ from those estimates by a significant amount. In addition, the Fund monitors for material events or transactions that may occur or become known after the period-end date and before the date the financial statements are released to print. |
| H. | Indemnifications — Under the Trust’s organizational documents, each Trustee, officer, employee or other agent of the Trust is indemnified against certain liabilities that may arise out of the performance of their duties to the Fund. Additionally, in the normal course of business, the Fund enters into contracts, including the Fund’s servicing agreements, that contain a variety of indemnification clauses. The Fund’s maximum exposure under these arrangements is unknown as this would involve future claims that may be made against the Fund that have not yet occurred. The risk of material loss as a result of such indemnification claims is considered remote. |
| I. | Foreign Currency Translations — Foreign currency is valued at the close of the NYSE based on quotations posted by banks and major currency dealers. Portfolio securities and other assets and liabilities denominated in foreign currencies are translated into U.S. dollar amounts at date of valuation. Purchases and sales of portfolio securities (net of foreign taxes withheld on disposition) and income items denominated in foreign currencies are translated into U.S. dollar amounts on the respective dates of such transactions. The Fund does not separately account for the portion of the results of operations resulting from changes in foreign exchange rates on investments and the fluctuations arising from changes in market prices of securities held. The combined results of changes in foreign exchange rates and the fluctuation of market prices on investments (net of estimated foreign tax withholding) are included with the net realized and unrealized gain or loss from investments in the Statement of Operations. Reported net realized foreign currency gains or losses arise from (1) sales of foreign currencies, (2) currency gains or losses realized between the trade and settlement dates on securities transactions, and (3) the difference between the amounts of dividends, interest, and foreign withholding taxes recorded on the Fund’s books and the U.S. dollar equivalent of the amounts actually received or paid. Net unrealized foreign currency gains and losses arise from changes in the fair values of assets and liabilities, other than investments in securities at fiscal period end, resulting from changes in exchange rates. |
The Fund may invest in foreign securities, which may be subject to foreign taxes on income, gains on investments or currency repatriation, a portion of which may be recoverable. Foreign taxes, if any, are recorded based on the tax regulations and rates that exist in the foreign markets in which the Fund invests and are shown in the Statement of Operations.
| J. | Forward Foreign Currency Contracts — The Fund may engage in foreign currency transactions either on a spot (i.e. for prompt delivery and settlement) basis, or through forward foreign currency contracts, to manage or minimize currency or exchange rate risk. |
The Fund may also enter into forward foreign currency contracts for the purchase or sale of a security denominated in a foreign currency in order to “lock in” the U.S. dollar price of that security, or the Fund may also enter into forward foreign currency contracts that do not provide for physical settlement of the two currencies, but instead are settled by a single cash payment calculated as the difference between the agreed upon exchange rate and the spot rate at settlement based upon an agreed upon notional amount (non-deliverable forwards). The Fund will set aside liquid assets in an amount equal to the daily mark-to-market obligation for forward foreign currency contracts.
A forward foreign currency contract is an obligation between two parties (“Counterparties”) to purchase or sell a specific currency for an agreed-upon price at a future date. The use of forward foreign currency contracts does not eliminate fluctuations in the price of the underlying securities the Fund owns or intends to acquire but establishes a rate of exchange in advance. Fluctuations in the value of these contracts are
16 Invesco Low Volatility Emerging Markets Fund
measured by the difference in the contract date and reporting date exchange rates and are recorded as unrealized appreciation (depreciation) until the contracts are closed. When the contracts are closed, realized gains (losses) are recorded. Realized and unrealized gains (losses) on the contracts are included in the Statement of Operations. The primary risks associated with forward foreign currency contracts include failure of the Counterparty to meet the terms of the contract and the value of the foreign currency changing unfavorably. These risks may be in excess of the amounts reflected in the Statement of Assets and Liabilities.
| K. | Futures Contracts — The Fund may enter into futures contracts to manage exposure to interest rate, equity and market price movements and/or currency risks. A futures contract is an agreement between two parties (“Counterparties”) to purchase or sell a specified underlying security, currency or commodity (or delivery of a cash settlement price, in the case of an index future) for a fixed price at a future date. The Fund currently invests only in exchange-traded futures and they are standardized as to maturity date and underlying financial instrument. Initial margin deposits required upon entering into futures contracts are satisfied by the segregation of specific securities or cash as collateral at the futures commission merchant (broker). During the period the futures contracts are open, changes in the value of the contracts are recognized as unrealized gains or losses by recalculating the value of the contracts on a daily basis. Subsequent or variation margin payments are received or made depending upon whether unrealized gains or losses are incurred. These amounts are reflected as receivables or payables on the Statement of Assets and Liabilities. When the contracts are closed or expire, the Fund recognizes a realized gain or loss equal to the difference between the proceeds from, or cost of, the closing transaction and the Fund’s basis in the contract. The net realized gain (loss) and the change in unrealized gain (loss) on futures contracts held during the period is included on the Statement of Operations. The primary risks associated with futures contracts are market risk and the absence of a liquid secondary market. If the Fund were unable to liquidate a futures contract and/or enter into an offsetting closing transaction, the Fund would continue to be subject to market risk with respect to the value of the contracts and continue to be required to maintain the margin deposits on the futures contracts. Futures contracts have minimal Counterparty risk since the exchange’s clearinghouse, as Counterparty to all exchange-traded futures, guarantees the futures against default. Risks may exceed amounts recognized in the Statement of Assets and Liabilities. |
| L. | Collateral — To the extent the Fund has designated or segregated a security as collateral and that security is subsequently sold, it is the Fund’s practice to replace such collateral no later than the next business day. |
NOTE 2—Advisory Fees and Other Fees Paid to Affiliates
The Trust has entered into a master investment advisory agreement with Invesco Advisers, Inc. (the “Adviser” or “Invesco”). Under the terms of the investment advisory agreement, the Fund accrues daily and pays monthly an advisory fee to the Adviser based on the annual rate of the Fund’s average daily net assets as follows:
| | | | | | | | |
| Average Daily Net Assets | | Rate | |
First $250 million | | | 0 | .935% | | | | |
Next $250 million | | | 0 | .910% | | | | |
Next $500 million | | | 0 | .885% | | | | |
Next $1.5 billion | | | 0 | .860% | | | | |
Next $2.5 billion | | | 0 | .835% | | | | |
Next $2.5 billion | | | 0 | .810% | | | | |
Next $2.5 billion | | | 0 | .785% | | | | |
Over $10 billion | | | 0 | .760% | | | | |
For the year ended October 31, 2017, the effective advisory fees incurred by the Fund was 0.935%.
Under the terms of a master sub-advisory agreement between the Adviser and each of Invesco Asset Management Deutschland GmbH, Invesco Asset Management Limited, Invesco Asset Management (Japan) Limited, Invesco Hong Kong Limited, Invesco Senior Secured Management, Inc. and Invesco Canada Ltd. and separate sub-advisory agreements with Invesco PowerShares Capital Management LLC and Invesco Asset Management (India) Private Limited (collectively, the “Affiliated Sub-Advisers”) the Adviser, not the Fund, will pay 40% of the fees paid to the Adviser to any such Affiliated Sub-Adviser(s) that provide(s) discretionary investment management services to the Fund based on the percentage of assets allocated to such Affiliated Sub-Adviser(s).
Effective January 1, 2017, the Adviser has contractually agreed, through at least February 28, 2019, to waive advisory fees and/or reimburse expenses to the extent necessary to limit total annual fund operating expenses after fee waiver and/or expense reimbursement (excluding certain items discussed below) of Class A, Class C, Class R, Class Y, Class R5 and Class R6 shares to 1.33%, 2.08%, 1.58%, 1.08%, 1.08% and 1.08%, respectively, of the Fund's average daily net assets (the “expense limits”). Prior to January 1, 2017, the Adviser had contractually agreed to waive advisory fees and/or reimburse expenses to the extent necessary to limit total annual fund operating expenses after fee waiver and/or expense reimbursement (excluding certain items discussed below) of Class A, Class C, Class R, Class Y, Class R5 and Class R6 shares to 1.72%, 2.47%, 1.97%, 1.47%, 1.47% and 1.47%, respectively, of the Fund's average daily net assets. In determining the Adviser's obligation to waive advisory fees and/or reimburse expenses, the following expenses are not taken into account, and could cause total annual fund operating expenses after fee waiver and/or expense reimbursement to exceed the numbers reflected above: (1) interest; (2) taxes; (3) dividend expense on short sales; (4) extraordinary or non-routine items, including litigation expenses; and (5) expenses that the Fund has incurred but did not actually pay because of an expense offset arrangement. Unless Invesco continues the fee waiver agreement, it will terminate on February 28, 2018. During its term, the fee waiver agreement cannot be terminated or amended to increase the expense limits without approval of the Board of Trustees.
Further, the Adviser has contractually agreed, through at least June 30, 2019, to waive the advisory fee payable by the Fund in an amount equal to 100% of the net advisory fees the Adviser receives from the affiliated money market funds on investments by the Fund of uninvested cash in such affiliated money market funds.
For the year ended October 31, 2017, the Adviser waived advisory fees of $236,375 and reimbursed class level expenses of $11,992, $370, $45, $4,813, $1, and $164 of Class A, Class C, Class R, Class Y, Class R5 and Class R6 shares, respectively.
17 Invesco Low Volatility Emerging Markets Fund
The Trust has entered into a master administrative services agreement with Invesco pursuant to which the Fund has agreed to pay Invesco for certain administrative costs incurred in providing accounting services to the Fund. For the year ended October 31, 2017, expenses incurred under the agreement are shown in the Statement of Operations as Administrative services fees.
The Trust has entered into a transfer agency and service agreement with Invesco Investment Services, Inc. (“IIS”) pursuant to which the Fund has agreed to pay IIS a fee for providing transfer agency and shareholder services to the Fund and reimburse IIS for certain expenses incurred by IIS in the course of providing such services. IIS may make payments to intermediaries that provide omnibus account services, sub-accounting services and/or networking services. All fees payable by IIS to intermediaries that provide omnibus account services or sub-accounting services are charged back to the Fund, subject to certain limitations approved by the Trust's Board of Trustees. For the year ended October 31, 2017, expenses incurred under the agreement are shown in the Statement of Operations as Transfer agent fees.
The Trust has entered into master distribution agreements with Invesco Distributors, Inc. (“IDI”) to serve as the distributor for the Class A, Class C, Class R, Class Y, Class R5 and Class R6 shares of the Fund. The Trust has adopted plans pursuant to Rule 12b-1 under the 1940 Act with respect to the Fund’s Class A, Class C and Class R shares (collectively the “Plans”). The Fund, pursuant to the Plans, pays IDI compensation at the annual rate of 0.25% of the Fund’s average daily net assets of Class A shares, 1.00% of the average daily net assets of Class C shares and 0.50% of the average daily net assets of Class R shares. The fees are accrued daily and paid monthly. Of the Plan payments, up to 0.25% of the average daily net assets of each class of shares may be paid to furnish continuing personal shareholder services to customers who purchase and own shares of such classes. Any amounts not paid as a service fee under the Plans would constitute an asset-based sales charge. Rules of the Financial Industry Regulatory Authority (“FINRA”) impose a cap on the total sales charges, including asset-based sales charges, that may be paid by any class of shares of the Fund. For the year ended October 31, 2017, expenses incurred under the Plans are shown in the Statement of Operations as Distribution fees.
Front-end sales commissions and CDSC (collectively, the “sales charges”) are not recorded as expenses of the Fund. Front-end sales commissions are deducted from proceeds from the sales of Fund shares prior to investment in Class A shares of the Fund. CDSC are deducted from redemption proceeds prior to remittance to the shareholder. During the year ended October 31, 2017, IDI advised the Fund that IDI retained $2,884 in front-end sales commissions from the sale of Class A shares and $31 from Class C shares for CDSC imposed upon redemptions by shareholders.
Certain officers and trustees of the Trust are officers and directors of the Adviser, IIS and/or IDI.
NOTE 3—Additional Valuation Information
GAAP defines fair value as the price that would be received to sell an asset or paid to transfer a liability in an orderly transaction between market participants at the measurement date, under current market conditions. GAAP establishes a hierarchy that prioritizes the inputs to valuation methods, giving the highest priority to readily available unadjusted quoted prices in an active market for identical assets (Level 1) and the lowest priority to significant unobservable inputs (Level 3), generally when market prices are not readily available or are unreliable. Based on the valuation inputs, the securities or other investments are tiered into one of three levels. Changes in valuation methods may result in transfers in or out of an investment’s assigned level:
| | Level 1 — | Prices are determined using quoted prices in an active market for identical assets. |
| | Level 2 — | Prices are determined using other significant observable inputs. Observable inputs are inputs that other market participants may use in pricing a security. These may include quoted prices for similar securities, interest rates, prepayment speeds, credit risk, yield curves, loss severities, default rates, discount rates, volatilities and others. |
| | Level 3 — | Prices are determined using significant unobservable inputs. In situations where quoted prices or observable inputs are unavailable (for example, when there is little or no market activity for an investment at the end of the period), unobservable inputs may be used. Unobservable inputs reflect the Fund’s own assumptions about the factors market participants would use in determining fair value of the securities or instruments and would be based on the best available information. |
The following is a summary of the tiered valuation input levels, as of October 31, 2017. The level assigned to the securities valuations may not be an indication of the risk or liquidity associated with investing in those securities. Because of the inherent uncertainties of valuation, the values reflected in the financial statements may materially differ from the value received upon actual sale of those investments.
The Fund’s policy is to recognize transfers in and out of the valuation levels as of the end of the reporting period. During the year ended October 31, 2017, there were transfers from Level 1 to Level 2 of $4,513,773 and from Level 2 to Level 1 of $6,559,066, due to foreign fair value adjustments.
| | | | | | | | | | | | | | | | |
| | | Level 1 | | | Level 2 | | | Level 3 | | | Total | |
Brazil | | $ | 4,525,205 | | | $ | — | | | $ | — | | | $ | 4,525,205 | |
Chile | | | 1,744,395 | | | | — | | | | — | | | | 1,744,395 | |
China | | | 2,049,941 | | | | 1,313,547 | | | | — | | | | 3,363,488 | |
Colombia | | | 113,040 | | | | — | | | | — | | | | 113,040 | |
Hong Kong | | | 161,202 | | | | — | | | | — | | | | 161,202 | |
India | | | 5,617,132 | | | | 402,247 | | | | — | | | | 6,019,379 | |
Malaysia | | | 2,217,872 | | | | 534,072 | | | | — | | | | 2,751,944 | |
Mexico | | | 2,379,498 | | | | — | | | | — | | | | 2,379,498 | |
Philippines | | | 165,768 | | | | — | | | | — | | | | 165,768 | |
Poland | | | 1,035,044 | | | | — | | | | — | | | | 1,035,044 | |
Qatar | | | 162,756 | | | | — | | | | — | | | | 162,756 | |
Russian Federation | | | 1,001,521 | | | | 1,714,384 | | | | — | | | | 2,715,905 | |
South Africa | | | 3,101,083 | | | | 1,162,238 | | | | — | | | | 4,263,321 | |
South Korea | | | 5,018,438 | | | | 2,402,020 | | | | — | | | | 7,420,458 | |
18 Invesco Low Volatility Emerging Markets Fund
| | | | | | | | | | | | | | | | |
| | | Level 1 | | | Level 2 | | | Level 3 | | | Total | |
Taiwan, Province of China | | $ | 512,217 | | | $ | 1,455,506 | | | $ | — | | | $ | 1,967,723 | |
Thailand | | | 2,036,437 | | | | 697,214 | | | | — | | | | 2,733,651 | |
Turkey | | | 1,609,604 | | | | 212,188 | | | | — | | | | 1,821,792 | |
United Arab Emirates | | | 873,746 | | | | — | | | | — | | | | 873,746 | |
Money Market Funds | | | 534,211 | | | | — | | | | — | | | | 534,211 | |
| | | | 34,859,110 | | | | 9,893,416 | | | | — | | | | 44,752,526 | |
Futures Contracts* | | | 11,710 | | | | — | | | | — | | | | 11,710 | |
Total Investments | | $ | 34,870,820 | | | $ | 9,893,416 | | | $ | — | | | $ | 44,764,236 | |
| * | Unrealized appreciation. |
NOTE 4—Derivative Investments
Value of Derivative Investments at Period-End
The table below summarizes the value of the Fund’s derivative investments, detailed by primary risk exposure, held as of October 31, 2017:
| | | | |
| | | Value | |
| Derivative Assets | | Equity Risk | |
Unrealized appreciation on futures contracts — Exchange-Traded(a) | | $ | 11,710 | |
Derivatives not subject to master netting agreement | | | (11,710 | ) |
Total Derivative Assets subject to master netting agreements | | $ | — | |
| (a) | The daily variation margin receivable (payable) at period-end is recorded in the Statement of Assets and Liabilities. |
Effect of Derivative Investments for the year ended October 31, 2017
The table below summarizes the gains on derivative investments, detailed by primary risk exposure, recognized in earnings during the period:
| | | | |
| | | Location of Gain on
Statement of Operations | |
| | | Equity Risk | |
Realized Gain: | | | | |
Futures contracts | | $ | 266,686 | |
Change in Net Unrealized Appreciation : | | | | |
Futures contracts | | | 10,492 | |
Total | | $ | 277,178 | |
The table below summarizes the average notional value of futures contracts outstanding during the period.
| | | | |
| | | Futures
Contracts | |
Average notional value | | $ | 928,159 | |
NOTE 5—Expense Offset Arrangement(s)
The expense offset arrangement is comprised of transfer agency credits which result from balances in demand deposit accounts used by the transfer agent for clearing shareholder transactions. For the year ended October 31, 2017, the Fund received credits from this arrangement, which resulted in the reduction of the Fund’s total expenses of $329.
NOTE 6—Trustees' and Officers' Fees and Benefits
Trustees’ and Officers’ Fees and Benefits include amounts accrued by the Fund to pay remuneration to certain Trustees and Officers of the Fund. Trustees have the option to defer compensation payable by the Fund, and Trustees’ and Officers’ Fees and Benefits also include amounts accrued by the Fund to fund such deferred compensation amounts. Those Trustees who defer compensation have the option to select various Invesco Funds in which their deferral accounts shall be deemed to be invested. Obligations under the deferred compensation plan represent unsecured claims against the general assets of the Fund.
NOTE 7—Cash Balances
The Fund is permitted to temporarily carry a negative or overdrawn balance in its account with State Street Bank and Trust Company, the custodian bank. Such balances, if any at period-end, are shown in the Statement of Assets and Liabilities under the payable caption Amount due custodian. To compensate the custodian bank for such overdrafts, the overdrawn Fund may either (1) leave funds as a compensating balance in the account so the custodian bank can be compensated by earning the additional interest; or (2) compensate by paying the custodian bank at a rate agreed upon by the custodian bank and Invesco, not to exceed the contractually agreed upon rate.
19 Invesco Low Volatility Emerging Markets Fund
NOTE 8—Distributions to Shareholders and Tax Components of Net Assets
Tax Character of Distributions to Shareholders Paid During the Fiscal Years Ended October 31, 2017 and 2016:
| | | | | | | | |
| | | 2017 | | | 2016 | |
Ordinary income | | $ | 2,207,520 | | | $ | 32,442 | |
Tax Components of Net Assets at Period-End:
| | | | |
| | | 2017 | |
Undistributed ordinary income | | $ | 3,493,027 | |
Undistributed long-term gain | | | 3,176,841 | |
Net unrealized appreciation — investments | | | 6,652,998 | |
Net unrealized appreciation (depreciation) — foreign currencies | | | (10,776 | ) |
Temporary book/tax differences | | | (6,461 | ) |
Shares of beneficial interest | | | 32,881,780 | |
Total net assets | | $ | 46,187,409 | |
The difference between book-basis and tax-basis unrealized appreciation (depreciation) is due to differences in the timing of recognition of gains and losses on investments for tax and book purposes. The Fund’s net unrealized appreciation (depreciation) difference is attributable primarily to wash sales, passive foreign investment companies and futures contracts.
The temporary book/tax differences are a result of timing differences between book and tax recognition of income and/or expenses. The Fund’s temporary book/tax differences are the result of the trustee deferral of compensation and retirement plan benefits.
Capital loss carryforward is calculated and reported as of a specific date. Results of transactions and other activity after that date may affect the amount of capital loss carryforward actually available for the Fund to utilize. Capital losses generated in years beginning after December 22, 2010 can be carried forward for an unlimited period, whereas previous losses expire in eight tax years. Capital losses with an expiration period may not be used to offset capital gains until all net capital losses without an expiration date have been utilized. Capital loss carryforwards with no expiration date will retain their character as either short-term or long-term capital losses instead of as short-term capital losses as under prior law. The ability to utilize capital loss carryforwards in the future may be limited under the Internal Revenue Code and related regulations based on the results of future transactions.
The Fund does not have a capital loss carryforward as of October 31, 2017.
NOTE 9—Investment Transactions
The aggregate amount of investment securities (other than short-term securities, U.S. Treasury obligations and money market funds, if any) purchased and sold by the Fund during the year ended October 31, 2017 was $23,974,881 and $29,192,766, respectively. Cost of investments, including any derivatives, on a tax basis includes the adjustments for financial reporting purposes as of the most recently completed federal income tax reporting period-end.
| | | | |
| Unrealized Appreciation (Depreciation) of Investments on a Tax Basis | |
Aggregate unrealized appreciation of investments | | $ | 7,790,804 | |
Aggregate unrealized (depreciation) of investments | | | (1,137,806 | ) |
Net unrealized appreciation of investments | | $ | 6,652,998 | |
Cost of investments for tax purposes is $38,111,238.
NOTE 10—Reclassification of Permanent Differences
Primarily as a result of differing book/tax treatment of foreign currency transactions, passive foreign investment companies and foreign capital gain, on October 31, 2017, undistributed net investment income was decreased by $39,983 and undistributed net realized gain (loss) was increased by $39,983. This reclassification had no effect on the net assets of the Fund.
20 Invesco Low Volatility Emerging Markets Fund
NOTE 11—Share Information
| | | | | | | | | | | | | | | | |
| | | Summary of Share Activity | |
| | | Years ended October 31, | |
| | | 2017(a) | | | 2016 | |
| | | Shares | | | Amount | | | Shares | | | Amount | |
Sold: | | | | | | | | | | | | | | | | |
Class A | | | 1,066,732 | | | $ | 9,578,200 | | | | 275,849 | | | $ | 2,238,184 | |
Class C | | | 38,430 | | | | 348,928 | | | | 30,165 | | | | 236,911 | |
Class R | | | 459 | | | | 4,242 | | | | 2,519 | | | | 20,393 | |
Class Y | | | 199,976 | | | | 1,764,679 | | | | 75,991 | | | | 652,971 | |
Class R6(b) | | | 1,113,879 | | | | 9,802,466 | | | | 5,111,134 | | | | 36,140,706 | |
| | | | |
Issued as reinvestment of dividends: | | | | | | | | | | | | | | | | |
Class A | | | 9,568 | | | | 76,541 | | | | 561 | | | | 3,960 | |
Class C | | | 456 | | | | 3,652 | | | | 8 | | | | 55 | |
Class R | | | 98 | | | | 786 | | | | 13 | | | | 89 | |
Class Y | | | 5,460 | | | | 43,731 | | | | 387 | | | | 2,735 | |
Class R6 | | | 243,469 | | | | 1,947,749 | | | | — | | | | — | |
| | | | |
Reacquired: | | | | | | | | | | | | | | | | |
Class A | | | (726,230 | ) | | | (6,628,643 | ) | | | (47,244 | ) | | | (385,042 | ) |
Class C | | | (34,600 | ) | | | (293,157 | ) | | | (6,119 | ) | | | (47,740 | ) |
Class R | | | (1,163 | ) | | | (10,522 | ) | | | (2,323 | ) | | | (19,018 | ) |
Class Y | | | (247,850 | ) | | | (2,351,979 | ) | | | (11,902 | ) | | | (99,446 | ) |
Class R5 | | | (13,982 | ) | | | (138,308 | ) | | | — | | | | — | |
Class R6 | | | (1,877,418 | ) | | | (16,803,363 | ) | | | (853,044 | ) | | | (7,113,916 | ) |
Net increase (decrease) in share activity | | | (222,716 | ) | | $ | (2,654,998 | ) | | | 4,575,995 | | | $ | 31,630,842 | |
| (a) | 79% of the outstanding shares of the Fund are owned by the Adviser. |
| (b) | On February 18, 2016, 4,986,532 Class R6 shares valued at $35,254,781 were sold to affiliated mutual funds. |
21 Invesco Low Volatility Emerging Markets Fund
NOTE 12—Financial Highlights
The following schedule presents financial highlights for a share of the Fund outstanding throughout the periods indicated.
| | | | | | | | | | | | | | | | | | | | | | | | | | | | | | | | | | | | | | | | | | | | | | | | | | | | | | | | |
| | | Net asset
value,
beginning
of period | | | Net
investment
income(a) | | | Net gains
(losses)
on securities
(both
realized and
unrealized) | | | Total from
investment
operations | | | Dividends
from net
investment
income | | | Distributions
from net
realized
gains | | | Total
distributions | | | Net asset
value, end
of period | | | Total
return(b) | | | Net assets,
end of period
(000's omitted) | | | Ratio of
expenses
to average net assets
with fee waivers
and/or expenses
absorbed | | | Ratio of
expenses
to average net
assets without
fee waivers
and/or expenses
absorbed | | | Ratio of net
investment
income
to average
net assets | | | Portfolio
turnover(c) | |
Class A | | | | | | | | | | | | | | | | | | | | | | | | | | | | | | | | | | | | | | | | | | | | | | | | | | | | | | | | |
Year ended 10/31/17 | | $ | 8.64 | | | $ | 0.17 | | | $ | 1.32 | | | $ | 1.49 | | | $ | (0.10 | ) | | $ | (0.31 | ) | | $ | (0.41 | ) | | $ | 9.72 | | | | 18.29 | % | | $ | 7,471 | | | | 1.39 | %(d) | | | 2.09 | %(d) | | | 1.89 | %(d) | | | 54 | % |
Year ended 10/31/16 | | | 8.08 | | | | 0.17 | | | | 0.46 | | | | 0.63 | | | | (0.07 | ) | | | — | | | | (0.07 | ) | | | 8.64 | | | | 7.98 | | | | 3,617 | | | | 1.72 | | | | 2.27 | | | | 2.08 | | | | 63 | |
Year ended 10/31/15 | | | 10.32 | | | | 0.14 | | | | (1.91 | ) | | | (1.77 | ) | | | (0.35 | ) | | | (0.12 | ) | | | (0.47 | ) | | | 8.08 | | | | (17.67 | ) | | | 1,531 | | | | 1.72 | | | | 7.99 | | | | 1.52 | | | | 105 | |
Year ended 10/31/14(e) | | | 10.00 | | | | 0.15 | | | | 0.17 | | | | 0.32 | | | | — | | | | — | | | | — | | | | 10.32 | | | | 3.20 | | | | 1,705 | | | | 1.71 | (f) | | | 10.36 | (f) | | | 1.69 | (f) | | | 38 | |
Class C | | | | | | | | | | | | | | | | | | | | | | | | | | | | | | | | | | | | | | | | | | | | | | | | | | | | | | | | |
Year ended 10/31/17 | | | 8.55 | | | | 0.10 | | | | 1.32 | | | | 1.42 | | | | (0.01 | ) | | | (0.31 | ) | | | (0.32 | ) | | | 9.65 | | | | 17.38 | | | | 323 | | | | 2.14 | (d) | | | 2.84 | (d) | | | 1.14 | (d) | | | 54 | |
Year ended 10/31/16 | | | 8.00 | | | | 0.11 | | | | 0.45 | | | | 0.56 | | | | (0.01 | ) | | | — | | | | (0.01 | ) | | | 8.55 | | | | 7.08 | | | | 250 | | | | 2.47 | | | | 3.02 | | | | 1.33 | | | | 63 | |
Year ended 10/31/15 | | | 10.26 | | | | 0.07 | | | | (1.90 | ) | | | (1.83 | ) | | | (0.31 | ) | | | (0.12 | ) | | | (0.43 | ) | | | 8.00 | | | | (18.29 | ) | | | 41 | | | | 2.47 | | | | 8.74 | | | | 0.77 | | | | 105 | |
Year ended 10/31/14(e) | | | 10.00 | | | | 0.09 | | | | 0.17 | | | | 0.26 | | | | — | | | | — | | | | — | | | | 10.26 | | | | 2.60 | | | | 57 | | | | 2.46 | (f) | | | 11.11 | (f) | | | 0.94 | (f) | | | 38 | |
Class R | | | | | | | | | | | | | | | | | | | | | | | | | | | | | | | | | | | | | | | | | | | | | | | | | | | | | | | | |
Year ended 10/31/17 | | | 8.62 | | | | 0.14 | | | | 1.32 | | | | 1.46 | | | | (0.07 | ) | | | (0.31 | ) | | | (0.38 | ) | | | 9.70 | | | | 17.91 | | | | 23 | | | | 1.64 | (d) | | | 2.34 | (d) | | | 1.64 | (d) | | | 54 | |
Year ended 10/31/16 | | | 8.06 | | | | 0.15 | | | | 0.46 | | | | 0.61 | | | | (0.05 | ) | | | — | | | | (0.05 | ) | | | 8.62 | | | | 7.68 | | | | 26 | | | | 1.97 | | | | 2.52 | | | | 1.83 | | | | 63 | |
Year ended 10/31/15 | | | 10.30 | | | | 0.12 | | | | (1.90 | ) | | | (1.78 | ) | | | (0.34 | ) | | | (0.12 | ) | | | (0.46 | ) | | | 8.06 | | | | (17.81 | ) | | | 23 | | | | 1.97 | | | | 8.24 | | | | 1.27 | | | | 105 | |
Year ended 10/31/14(e) | | | 10.00 | | | | 0.13 | | | | 0.17 | | | | 0.30 | | | | — | | | | — | | | | — | | | | 10.30 | | | | 3.00 | | | | 14 | | | | 1.96 | (f) | | | 10.61 | (f) | | | 1.44 | (f) | | | 38 | |
Class Y | | | | | | | | | | | | | | | | | | | | | | | | | | | | | | | | | | | | | | | | | | | | | | | | | | | | | | | | |
Year ended 10/31/17 | | | 8.66 | | | | 0.19 | | | | 1.32 | | | | 1.51 | | | | (0.12 | ) | | | (0.31 | ) | | | (0.43 | ) | | | 9.74 | | | | 18.51 | | | | 1,823 | | | | 1.14 | (d) | | | 1.84 | (d) | | | 2.14 | (d) | | | 54 | |
Year ended 10/31/16 | | | 8.10 | | | | 0.19 | | | | 0.46 | | | | 0.65 | | | | (0.09 | ) | | | — | | | | (0.09 | ) | | | 8.66 | | | | 8.25 | | | | 1,987 | | | | 1.47 | | | | 2.02 | | | | 2.33 | | | | 63 | |
Year ended 10/31/15 | | | 10.35 | | | | 0.16 | | | | (1.92 | ) | | | (1.76 | ) | | | (0.37 | ) | | | (0.12 | ) | | | (0.49 | ) | | | 8.10 | | | | (17.50 | ) | | | 1,337 | | | | 1.47 | | | | 7.74 | | | | 1.77 | | | | 105 | |
Year ended 10/31/14(e) | | | 10.00 | | | | 0.18 | | | | 0.17 | | | | 0.35 | | | | — | | | | — | | | | — | | | | 10.35 | | | | 3.50 | | | | 1,411 | | | | 1.46 | (f) | | | 10.11 | (f) | | | 1.94 | (f) | | | 38 | |
Class R5 | | | | | | | | | | | | | | | | | | | | | | | | | | | | | | | | | | | | | | | | | | | | | | | | | | | | | | | | |
Year ended 10/31/17 | | | 8.66 | | | | 0.19 | | | | 1.32 | | | | 1.51 | | | | (0.12 | ) | | | (0.31 | ) | | | (0.43 | ) | | | 9.74 | | | | 18.51 | | | | 10 | | | | 1.14 | (d) | | | 1.65 | (d) | | | 2.14 | (d) | | | 54 | |
Year ended 10/31/16 | | | 8.10 | | | | 0.18 | | | | 0.47 | | | | 0.65 | | | | (0.09 | ) | | | — | | | | (0.09 | ) | | | 8.66 | | | | 8.25 | | | | 130 | | | | 1.47 | | | | 1.87 | | | | 2.33 | | | | 63 | |
Year ended 10/31/15 | | | 10.35 | | | | 0.16 | | | | (1.92 | ) | | | (1.76 | ) | | | (0.37 | ) | | | (0.12 | ) | | | (0.49 | ) | | | 8.10 | | | | (17.50 | ) | | | 122 | | | | 1.47 | | | | 7.64 | | | | 1.77 | | | | 105 | |
Year ended 10/31/14(e) | | | 10.00 | | | | 0.18 | | | | 0.17 | | | | 0.35 | | | | — | | | | — | | | | — | | | | 10.35 | | | | 3.50 | | | | 477 | | | | 1.46 | (f) | | | 10.06 | (f) | | | 1.94 | (f) | | | 38 | |
Class R6 | | | | | | | | | | | | | | | | | | | | | | | | | | | | | | | | | | | | | | | | | | | | | | | | | | | | | | | | |
Year ended 10/31/17 | | | 8.65 | | | | 0.19 | | | | 1.33 | | | | 1.52 | | | | (0.12 | ) | | | (0.31 | ) | | | (0.43 | ) | | | 9.74 | | | | 18.65 | | | | 36,536 | | | | 1.14 | (d) | | | 1.65 | (d) | | | 2.14 | (d) | | | 54 | |
Year ended 10/31/16 | | | 8.10 | | | | 0.19 | | | | 0.45 | | | | 0.64 | | | | (0.09 | ) | | | — | | | | (0.09 | ) | | | 8.65 | | | | 8.12 | | | | 36,970 | | | | 1.47 | | | | 1.87 | | | | 2.33 | | | | 63 | |
Year ended 10/31/15 | | | 10.35 | | | | 0.16 | | | | (1.92 | ) | | | (1.76 | ) | | | (0.37 | ) | | | (0.12 | ) | | | (0.49 | ) | | | 8.10 | | | | (17.50 | ) | | | 122 | | | | 1.47 | | | | 7.64 | | | | 1.77 | | | | 105 | |
Year ended 10/31/14(e) | | | 10.00 | | | | 0.18 | | | | 0.17 | | | | 0.35 | | | | — | | | | — | | | | — | | | | 10.35 | | | | 3.50 | | | | 155 | | | | 1.46 | (f) | | | 10.06 | (f) | | | 1.94 | (f) | | | 38 | |
| (a) | Calculated using average shares outstanding. |
| (b) | Includes adjustments in accordance with accounting principles generally accepted in the United States of America and as such, the net asset value for financial reporting purposes and the returns based upon those net asset values may differ from the net asset value and returns for shareholder transactions. Does not include sales charges and is not annualized for periods less than one year, if applicable. |
| (c) | Portfolio turnover is calculated at the fund level and is not annualized for periods less than one year, if applicable. |
| (d) | Ratios are based on average daily net assets (000's omitted) of $6,293, $194, $24, $2,526, $119, and $37,018 for Class A, Class C, Class R, Class Y, Class R5 and Class R6 shares, respectively. |
| (e) | Commencement date of December 17, 2013. |
22 Invesco Low Volatility Emerging Markets Fund
Report of Independent Registered Public Accounting Firm
To the Board of Trustees of AIM Investment Funds (Invesco Investment Funds)
and Shareholders of Invesco Low Volatility Emerging Markets Fund:
In our opinion, the accompanying statement of assets and liabilities, including the schedule of investments, and the related statements of operations and of changes in net assets and the financial highlights present fairly, in all material respects, the financial position of Invesco Low Volatility Emerging Markets Fund (one of the portfolios constituting the AIM Investment Funds (Invesco Investment Funds), hereafter referred to as the “Fund”) as of October 31, 2017, the results of its operations for the year then ended, the changes in its net assets for each of the two years in the period then ended and the financial highlights for each of the three years in the period then ended and for the period December 17, 2013 (commencement of investment operations) through October 31, 2014, in conformity with accounting principles generally accepted in the United States of America. These financial statements and financial highlights (hereafter referred to as “financial statements”) are the responsibility of the Fund’s management. Our responsibility is to express an opinion on these financial statements based on our audits. We conducted our audits of these financial statements in accordance with the standards of the Public Company Accounting Oversight Board (United States). Those standards require that we plan and perform the audit to obtain reasonable assurance about whether the financial statements are free of material misstatement. An audit includes examining, on a test basis, evidence supporting the amounts and disclosures in the financial statements, assessing the accounting principles used and significant estimates made by management, and evaluating the overall financial statement presentation. We believe that our audits, which included confirmation of securities as of October 31, 2017 by correspondence with the custodian, transfer agent and brokers, and when replies were not received from brokers, we performed other auditing procedures, provide a reasonable basis for our opinion.
PricewaterhouseCoopers LLP
Houston, Texas
December 21, 2017
23 Invesco Low Volatility Emerging Markets Fund
Calculating your ongoing Fund expenses
Example
As a shareholder of the Fund, you incur two types of costs: (1) transaction costs, which may include sales charges (loads) on purchase payments or contingent deferred sales charges on redemptions, if any; and (2) ongoing costs, including management fees, distribution and/or service (12b-1) fees, and other Fund expenses. This example is intended to help you understand your ongoing costs (in dollars) of investing in the Fund and to compare these costs with ongoing costs of investing in other mutual funds. The example is based on an investment of $1,000 invested at the beginning of the period and held for the entire period May 1, 2017 through October 31, 2017.
Actual expenses
The table below provides information about actual account values and actual expenses. You may use the information in this table, together with the amount you invested, to estimate the expenses that you paid over the period. Simply divide your account value by $1,000 (for example, an $8,600 account value divided by $1,000 = 8.6), then multiply the result by the number in the table under the heading entitled “Actual Expenses Paid During Period” to estimate the expenses you paid on your account during this period.
Hypothetical example for comparison purposes
The table below also provides information about hypothetical account values and hypothetical expenses based on the Fund’s actual expense ratio and an assumed rate of return of 5% per year before expenses, which is not the Fund’s actual return.
The hypothetical account values and expenses may not be used to estimate the actual ending account balance or expenses you paid for the period. You may use this information to compare the ongoing costs of investing in the Fund and other funds. To do so, compare this 5% hypothetical example with the 5% hypothetical examples that appear in the shareholder reports of the other funds.
Please note that the expenses shown in the table are meant to highlight your ongoing costs only and do not reflect any transaction costs, such as sales charges (loads) on purchase payments or contingent deferred sales charges on redemptions, if any. Therefore, the hypothetical information is useful in comparing ongoing costs only, and will not help you determine the relative total costs of owning different funds. In addition, if these transaction costs were included, your costs would have been higher.
| | | | | | | | | | | | | | | | | | | | | | | | |
Class | | Beginning
Account Value
(05/01/17) | | | ACTUAL | | | HYPOTHETICAL (5% annual return before
expenses) | | | Annualized
Expense
Ratio | |
| | | Ending
Account Value
(10/31/17)1 | | | Expenses
Paid During
Period2 | | | Ending
Account Value
(10/31/17) | | | Expenses
Paid During
Period2 | | |
| Class A | | $ | 1,000.00 | | | $ | 1,072.80 | | | $ | 6.95 | | | $ | 1,018.50 | | | $ | 6.77 | | | | 1.33 | % |
| Class C | | | 1,000.00 | | | | 1,068.70 | | | | 10.85 | | | | 1,014.72 | | | | 10.56 | | | | 2.08 | |
| Class R | | | 1,000.00 | | | | 1,071.80 | | | | 8.25 | | | | 1,017.24 | | | | 8.03 | | | | 1.58 | |
| Class Y | | | 1,000.00 | | | | 1,073.90 | | | | 5.65 | | | | 1,019.76 | | | | 5.50 | | | | 1.08 | |
| Class R5 | | | 1,000.00 | | | | 1,073.90 | | | | 5.65 | | | | 1,019.76 | | | | 5.50 | | | | 1.08 | |
| Class R6 | | | 1,000.00 | | | | 1,073.90 | | | | 5.65 | | | | 1,019.76 | | | | 5.50 | | | | 1.08 | |
| 1 | The actual ending account value is based on the actual total return of the Fund for the period May 1, 2017 through October 31, 2017, after actual expenses and will differ from the hypothetical ending account value which is based on the Fund’s expense ratio and a hypothetical annual return of 5% before expenses. |
| 2 | Expenses are equal to the Fund’s annualized expense ratio as indicated above multiplied by the average account value over the period, multiplied by 184/365 to reflect the most recent fiscal half year. |
24 Invesco Low Volatility Emerging Markets Fund
Approval of Investment Advisory and Sub-Advisory Contracts
The Board of Trustees (the Board) of AIM Investment Funds (Invesco Investment Funds) is required under the Investment Company Act of 1940, as amended, to approve annually the renewal of Invesco Low Volatility Emerging Markets Fund’s (the Fund) investment advisory agreements. During contract renewal meetings held on June 12-13, 2017, the Board as a whole, and the disinterested or “independent” Trustees, who comprise over 75% of the Board, voting separately, approved the continuance for the Fund of the Master Investment Advisory Agreement with Invesco Advisers, Inc. (Invesco Advisers and the investment advisory agreement) and the Master Intergroup Sub-Advisory Contract for Mutual Funds with Invesco Asset Management Deutschland GmbH, Invesco Asset Management Limited, Invesco Asset Management (Japan) Limited, Invesco Hong Kong Limited, Invesco Senior Secured Management, Inc. and Invesco Canada Ltd. and separate Sub-Advisory Contracts with Invesco PowerShares Capital Management LLC and Invesco Asset Management (India) Private Limited (collectively, the Affiliated Sub-Advisers and the sub-advisory contracts) for another year, effective July 1, 2017.
In evaluating the fairness and reasonableness of compensation under the Fund’s investment advisory agreement and sub-advisory contracts, the Board considered, among other things, the factors discussed below. The Board determined that continuation of the Fund’s investment advisory agreement and the sub-advisory contracts is in the best interest of the Fund and its shareholders and that the compensation payable to Invesco Advisers and the Affiliated Sub-Advisers under the agreements is fair and reasonable.
The Board’s Fund Evaluation Process
The Board’s Investments Committee has established three Sub-Committees, which meet throughout the year to review the performance of funds advised by Invesco Advisers (the Invesco Funds). Over the course of each year, the Sub-Committees meet with portfolio managers for their assigned Invesco Funds and other members of management to review the performance, investment objective(s), policies, strategies, limitations and investment risks of these funds. The Board had the benefit of reports from the Sub-Committees and Investments Committee throughout the year in considering approval of the continuance of each Invesco Fund’s investment advisory agreement and sub-advisory contracts for another year.
During the contract renewal process, the Board receives comparative performance and fee data regarding the Invesco Funds prepared by Invesco Advisers and Broadridge Financial Solutions, Inc. (Broadridge), an independent provider of investment company data. The Board also receives an independent written
evaluation from the Senior Officer, an officer of the Invesco Funds who reports directly to the independent Trustees. The Senior Officer’s evaluation is prepared as part of his responsibility to manage the process by which the Invesco Funds’ proposed management fees are negotiated during the annual contract renewal process to ensure they are negotiated in a manner that is at arms’ length and reasonable. In addition to meetings with Invesco Advisers and fund counsel, the independent Trustees also discuss the continuance of the investment advisory agreement and sub-advisory contracts in separate sessions with the Senior Officer and with independent legal counsel.
The Trustees recognized that the advisory fee rates for the Invesco Funds are, in most cases, the result of years of review and negotiation. The Trustees’ deliberations and conclusions in a particular year may be based in part on their deliberations and conclusions regarding these arrangements throughout the year and in prior years. The Trustees’ review and conclusions are based on the comprehensive consideration of all information presented to them and are not the result of any single determinative factor. Moreover, one Trustee may have weighed a particular piece of information or factor differently than another Trustee.
The discussion below is a summary of the Senior Officer’s independent written evaluation with respect to the Fund’s investment advisory agreement as well as a discussion of the material factors and related conclusions that formed the basis for the Board’s approval of the Fund’s investment advisory agreement and sub-advisory contracts. This information is current as of June 13, 2017, and does not reflect consideration of factors that became known to the Board after that date.
Factors and Conclusions and Summary of Independent Written Fee Evaluation
| A. | Nature, Extent and Quality of Services Provided by Invesco Advisers and the Affiliated Sub-Advisers |
The Board reviewed the advisory services provided to the Fund by Invesco Advisers under the Fund’s investment advisory agreement, the performance of Invesco Advisers in providing these services, and the credentials and experience of the officers and employees of Invesco Advisers who provide these services, including the Fund’s portfolio manager or managers. The Board’s review included consideration of Invesco Advisers’ investment process oversight, credit analysis and investment risk management. The Board also considered non-advisory services that Invesco Advisers and its affiliates provide to the Invesco Funds such as various back office support functions, trading operations, internal audit, valuation and legal and compliance.
In determining whether to continue the Fund’s investment advisory agreement, the Board considered the benefits of reapproving an existing relationship as contrasted with the greater uncertainty that may be associated with entering into a new relationship. The Board concluded that the nature, extent and quality of the services provided to the Fund by Invesco Advisers are appropriate and satisfactory.
The Board reviewed the services that may be provided by the Affiliated Sub-Advisers under the sub-advisory contracts and the credentials and experience of the officers and employees of the Affiliated Sub-Advisers who provide these services. The Board noted that the Affiliated Sub-Advisers have offices and personnel that are located in financial centers around the world. As a result, the Board noted that the Affiliated Sub-Advisers can provide research and investment analysis on the markets and economies of various countries in which the Fund may invest, make recommendations regarding securities and assist with security trades. The Board concluded that the sub-advisory contracts may benefit the Fund and its shareholders by permitting Invesco Advisers to use the resources and talents of the Affiliated Sub-Advisers in managing the Fund. The Board concluded that the nature, extent and quality of the services that may be provided by the Affiliated Sub-Advisers are appropriate and satisfactory.
| B. | Fund Investment Performance |
The Board considered Fund investment performance as a relevant factor in considering whether to approve the investment advisory agreement as well as the sub-advisory contracts for the Fund, as Invesco Asset Management Deutschland GmbH currently manages assets of the Fund.
The Board noted that the Fund had only three years of performance history and compared the Fund’s investment performance during the past one and three calendar years to the performance of funds in the Broadridge performance universe and against the Lipper Emerging Markets Funds Index. The Board noted that performance of Class A shares of the Fund was in the second quintile of its performance universe for the one year period and the fourth quintile for the three year period (the first quintile being the best performing funds and the fifth quintile being the worst performing funds). The Board noted that performance of Class A shares of the Fund was above the performance of the Index for the one year period and below the performance of the Index for the three year period. The Trustees also reviewed more recent Fund performance and this review did not change their conclusions.
| C. | Advisory and Sub-Advisory Fees |
The Board compared the Fund’s contractual management fee rate to the contractual management fee rates of funds in the Fund’s
25 Invesco Low Volatility Emerging Markets Fund
Broadridge expense group at a common asset level. The Board noted that the contractual management fee rate for Class A shares of the Fund was below the median contractual management fee rate of funds in its expense group. The Board noted that the term “contractual management fee” for funds in the expense group may include both advisory and certain administrative services fees, but that Broadridge does not provide information on a fund by fund basis as to what is included. The Board noted that Invesco Advisers does not separately charge the Invesco Funds for the administrative services included in the term as defined by Broadridge. The Board also reviewed the methodology used by Broadridge in providing expense group information, which includes using each fund’s contractual management fee schedule (including any applicable breakpoints) as reported in the most recent prospectus or statement of additional information for each fund in the expense group.
The Board noted that Invesco Advisers has contractually agreed to waive fees and/or limit expenses of the Fund through at least February 28, 2018 in an amount necessary to limit total annual operating expenses to a specified percentage of average daily net assets for each class of the Fund.
The Board also compared the Fund’s effective advisory fee rate (the advisory fee rate after advisory fee waivers and before other expense limitations/waivers) to the effective advisory fee rates of other mutual funds advised by Invesco Advisers and its affiliates with investment strategies comparable to those of the Fund, based on asset balances as of December 31, 2016. The Board noted that the Fund’s rate was above the rate of one such mutual fund and the same as the rate of one such mutual fund. The Board noted that Invesco Advisers and its affiliates do not manage other client accounts with investment strategies comparable to those of the Fund.
The Board also considered the services that may be provided by the Affiliated Sub-Advisers pursuant to the sub-advisory contracts, as well as the fees payable by Invesco Advisers to the Affiliated Sub-Advisers pursuant to the sub-advisory contracts. The Board noted that Invesco Advisers retains overall responsibility for, and provides services to, sub-advised Invesco Funds, including oversight of the Affiliated Sub-Advisers as well as the additional services described herein other than day-to-day portfolio management. The Board also noted that the sub-advisory fees are not paid directly by the Fund, but rather, are payable by Invesco Advisers to the Affiliated Sub-Advisers.
| D. | Economies of Scale and Breakpoints |
The Board considered the extent to which there are economies of scale in the provision of advisory services to the Fund. The Board also considered that the Fund may benefit from economies of scale through contractual breakpoints in the Fund’s advisory fee schedule. The Board noted that the Fund shares directly in economies of scale through lower fees charged
by third party service providers based on the combined size of the Invesco Funds advised by Invesco Advisers.
| E. | Profitability and Financial Resources |
The Board reviewed information from Invesco Advisers concerning the costs of the advisory and other services that Invesco Advisers and its affiliates provide to the Fund and the Invesco Funds and the profitability of Invesco Advisers and its affiliates in providing these services. The Board noted that Invesco Advisers continues to operate at a net profit from services Invesco Advisers and its affiliates provide to the Invesco Funds and the Fund. The Board did not deem the level of profits realized by Invesco Advisers and its affiliates from providing services to the Fund to be excessive given the nature, quality and extent of the services provided. The Board received and accepted information from Invesco Advisers demonstrating that Invesco Advisers and each Affiliated Sub-Adviser are financially sound and have the resources necessary to perform their obligations under the investment advisory agreement and sub-advisory contracts.
| F. | Collateral Benefits to Invesco Advisers and its Affiliates |
The Board considered various other benefits received by Invesco Advisers and its affiliates from the relationship with the Fund, including the fees received for providing transfer agency and distribution services to the Fund. The Board considered comparative information regarding fees charged for these services, including information provided by Broadridge and other independent sources. The Board considered the performance of Invesco Advisers and its affiliates in providing these services and the organizational structure employed to provide these services. The Board also considered that these services are provided to the Fund pursuant to written contracts that are reviewed and approved on an annual basis by the Board; and that the services are required for the operation of the Fund.
The Board considered the benefits realized by Invesco Advisers and the Affiliated Sub-Advisers as a result of portfolio brokerage transactions executed through “soft dollar” arrangements. The Board noted that soft dollar arrangements may result in the Fund bearing costs to purchase research that may be used by Invesco Advisers or the Affiliated Sub-Advisers with other clients and may reduce Invesco Adviser’s or the Affiliated Sub-Adviser’s expenses. The Board also considered that it receives periodic reports from the Chief Compliance Officer of the Invesco Funds demonstrating that these arrangements are consistent with regulatory requirements. The Board did not deem the soft dollar arrangements to be inappropriate.
The Board considered that the Fund’s uninvested cash and cash collateral from any securities lending arrangements may be invested in money market funds advised by Invesco Advisers pursuant to procedures approved by the Board. The Board noted that Invesco Advisers receives advisory fees from these affiliated money market funds
attributable to such investments, although Invesco Advisers has contractually agreed to waive through varying periods the advisory fees payable by the Invesco Funds with respect to certain investments in the affiliated money market funds. The waiver is in an amount equal to 100% of the net advisory fee Invesco Advisers receives from the affiliated money market funds with respect to the Fund’s investment in the affiliated money market funds of uninvested cash, but not cash collateral. The Board concluded that the amount of advisory fees received by Invesco Advisers from the Fund’s investment of cash collateral from any securities lending arrangements in the affiliated money market funds is fair and reasonable.
The Board also considered that the Fund may use an affiliated broker to execute certain trades for the Fund to, among other things, control information leakage, and was advised that such trades would be executed in compliance with rules under the federal securities laws and consistent with best execution obligations.
26 Invesco Low Volatility Emerging Markets Fund
Tax Information
Form 1099-DIV, Form 1042-S and other year-end tax information provide shareholders with actual calendar year amounts that should be included in their tax returns. Shareholders should consult their tax advisors.
The following distribution information is being provided as required by the Internal Revenue Code or to meet a specific state’s requirement.
The Fund designates the following amounts or, if subsequently determined to be different, the maximum amount allowable for its fiscal year ended October 31, 2017:
| | | | |
Federal and State Income Tax | |
Qualified Dividend Income* | | | 39.10 | % |
Corporate Dividends Received Deduction* | | | 0.00 | % |
U.S. Treasury Obligations* | | | 0.00 | % |
Foreign Taxes | | $ | 0.0332 | per share |
Foreign Income | | $ | 0.3538 | per share |
| | * | The above percentages are based on ordinary income dividends paid to shareholders during the Fund’s fiscal year. |
27 Invesco Low Volatility Emerging Markets Fund
Trustees and Officers
The address of each trustee and officer is AIM Investment Funds (Invesco Investment Funds) (the “Trust”), 11 Greenway Plaza, Suite 1000, Houston, Texas 77046-1173. The trustees serve for the life of the Trust, subject to their earlier death, incapacitation, resignation, retirement or removal as more specifically provided in the Trust’s organizational documents. Each officer serves for a one year term or until their successors are elected and qualified. Column two below includes length of time served with predecessor entities, if any.
| | | | | | | | |
Name, Year of Birth and Position(s) Held with the Trust | | Trustee and/
or Officer Since | | Principal Occupation(s)
During Past 5 Years | | Number of
Funds in Fund
Complex
Overseen by
Trustee | | Other Directorship(s)
Held by Trustee During Past 5 Years |
| Interested Persons | | | | | | | | |
| Martin L. Flanagan1 — 1960 Trustee | | 2007 | | Executive Director, Chief Executive Officer and President, Invesco Ltd. (ultimate parent of Invesco and a global investment management firm); Trustee, The Invesco Funds; Vice Chair, Investment Company Institute; and Member of Executive Board, SMU Cox School of Business Formerly: Advisor to the Board, Invesco Advisers, Inc. (formerly known as Invesco Institutional (N.A.), Inc.); Chairman and Chief Executive Officer, Invesco Advisers, Inc. (registered investment adviser); Director, Chairman, Chief Executive Officer and President, Invesco Holding Company (US), Inc. (formerly IVZ Inc.) (holding company), Invesco Group Services, Inc. (service provider) and Invesco North American Holdings, Inc. (holding company); Director, Chief Executive Officer and President, Invesco Holding Company Limited (parent of Invesco and a global investment management firm); Director, Invesco Ltd.; Chairman, Investment Company Institute and President, Co-Chief Executive Officer, Co-President, Chief Operating Officer and Chief Financial Officer, Franklin Resources, Inc. (global investment management organization) | | 158 | | None |
Philip A. Taylor2 — 1954 Trustee and Senior Vice President | | 2006 | | Head of the Americas and Senior Managing Director, Invesco Ltd.; Director, Invesco Advisers, Inc. (formerly known as Invesco Institutional (N.A.), Inc.) (registered investment adviser); Director, Chairman, Chief Executive Officer and President, Invesco Management Group, Inc. (formerly known as Invesco Aim Management Group, Inc.) (financial services holding company); Director and Chairman, Invesco Investment Services, Inc. (formerly known as Invesco Aim Investment Services, Inc.) (registered transfer agent); Chief Executive Officer, Invesco Corporate Class Inc. (corporate mutual fund company); Director, Chairman and Chief Executive Officer, Invesco Canada Ltd. (formerly known as Invesco Trimark Ltd./Invesco Trimark Ltèe) (registered investment adviser and registered transfer agent); Trustee and Senior Vice President, The Invesco Funds; Director, Invesco Investment Advisers LLC (formerly known as Van Kampen Asset Management). Formerly: Co-Chairman, Co-President and Co-Chief Executive Officer, Invesco Advisers, Inc. (formerly known as Invesco Institutional (N.A.), Inc.) (registered investment adviser); Director, Chief Executive Officer and President, Van Kampen Exchange Corp; President and Principal Executive Officer, The Invesco Funds (other than AIM Treasurer’s Series Trust (Invesco Treasurer’s Series Trust), Short-Term Investments Trust and Invesco Management Trust); Executive Vice President, The Invesco Funds (AIM Treasurer’s Series Trust (Invesco Treasurer’s Series Trust), Short-Term Investments Trust and Invesco Management Trust only); Director and President, INVESCO Funds Group, Inc. (registered investment adviser and registered transfer agent); Director and Chairman, IVZ Distributors, Inc. (formerly known as INVESCO Distributors, Inc.) (registered broker dealer); Director, President and Chairman, Invesco Inc. (holding company), Invesco Canada Holdings Inc. (holding company), Trimark Investments Ltd./Placements Trimark Ltèe and Invesco Financial Services Ltd/Services Financiers Invesco Ltèe; Chief Executive Officer, Invesco Canada Fund Inc. (corporate mutual fund company); Director and Chairman, Van Kampen Investor Services Inc.; Director, Chief Executive Officer and President, 1371 Preferred Inc. (holding company) and Van Kampen Investments Inc.; Director and President, AIM GP Canada Inc. (general partner for limited partnerships) and Van Kampen Advisors, Inc.; Director and Chief Executive Officer, Invesco Trimark Dealer Inc. (registered broker dealer); Director, Invesco Distributors, Inc. (formerly known as Invesco Aim Distributors, Inc.) (registered broker dealer); Manager, Invesco PowerShares Capital Management LLC; Director, Chief Executive Officer and President, Invesco Advisers, Inc.; Director, Chairman, Chief Executive Officer and President, Invesco Aim Capital Management, Inc.; President, Invesco Trimark Dealer Inc. and Invesco Trimark Ltd./Invesco Trimark Ltèe; Director and President, AIM Trimark Corporate Class Inc. and AIM Trimark Canada Fund Inc.; Senior Managing Director, Invesco Holding Company Limited; Director and Chairman, Fund Management Company (former registered broker dealer); President and Principal Executive Officer, The Invesco Funds (AIM Treasurer’s Series Trust (Invesco Treasurer’s Series Trust), and Short-Term Investments Trust only); President, AIM Trimark Global Fund Inc. and AIM Trimark Canada Fund Inc. | | 158 | | None |
| 1 | Mr. Flanagan is considered an interested person (within the meaning of Section 2(a)(19) of the 1940 Act) of the Trust because he is an officer of the Adviser to the Trust, and an officer and a director of Invesco Ltd., ultimate parent of the Adviser. |
| 2 | Mr. Taylor is considered an interested person (within the meaning of Section 2(a)(19) of the 1940 Act) of the Trust because he is an officer and a director of the Adviser. |
T-1 Invesco Low Volatility Emerging Markets Fund
Trustees and Officers—(continued)
| | | | | | | | |
Name, Year of Birth and Position(s) Held with the Trust | | Trustee and/
or Officer Since | | Principal Occupation(s) During Past 5 Years | | Number of
Funds in Fund
Complex
Overseen by
Trustee | | Other Directorship(s)
Held by Trustee During Past 5 Years |
| Independent Trustees | | | | | | | | |
Bruce L. Crockett — 1944 Trustee and Chair | | 2001 | | Chairman, Crockett Technologies Associates (technology consulting company) Formerly: Director, Captaris (unified messaging provider); Director, President and Chief Executive Officer, COMSAT Corporation; Chairman, Board of Governors of INTELSAT (international communications company); ACE Limited (insurance company); Independent Directors Council and Investment Company Institute: Member of the Audit Committee, Investment Company Institute; Member of the Executive Committee and Chair of the Governance Committee, Independent Directors Council | | 158 | | Director and Chairman of the Audit Committee, ALPS (Attorneys Liability Protection Society) (insurance company); Director and Member of the Audit Committee, Ferroglobe PLC (metallurgical company) |
David C. Arch — 1945 Trustee | | 2010 | | Chairman of Blistex Inc. (consumer health care products manufacturer); Member, World Presidents’ Organization | | 158 | | Board member of the Illinois Manufacturers’ Association |
James T. Bunch — 1942 Trustee | | 2003 | | Managing Member, Grumman Hill Group LLC (family office/private equity investments) Formerly: Chairman of the Board, Denver Film Society; Chairman of the Board of Trustees, Evans Scholarship Foundation; Chairman, Board of Governors, Western Golf Association | | 158 | | Trustee, Evans Scholarship Foundation |
Jack M. Fields — 1952 Trustee | | 2001 | | Chief Executive Officer, Twenty First Century Group, Inc. (government affairs company); and Discovery Learning Alliance (non-profit) Formerly: Owner and Chief Executive Officer, Dos Angeles Ranch L.P. (cattle, hunting, corporate entertainment); Director, Insperity, Inc. (formerly known as Administaff) (human resources provider); Chief Executive Officer, Texana Timber LP (sustainable forestry company); Director of Cross Timbers Quail Research Ranch (non-profit); and member of the U.S. House of Representatives | | 158 | | None |
Cynthia Hostetler — 1962 Trustee | | 2017 | | Non-Executive Director and Trustee of a number of public and private business corporations Formerly: Head of Investment Funds and Private Equity, Overseas Private Investment Corporation; President, First Manhattan Bancorporation, Inc.; Attorney, Simpson Thacher & Bartlett LLP | | 158 | | Vulcan Materials Company (construction materials company); Trilinc Global Impact Fund; Aberdeen Investment Funds (4 portfolios); Artio Global Investment LLC (mutual fund complex); Edgen Group, Inc. (specialized energy and infrastructure products distributor) |
Eli Jones — 1961 Trustee | | 2016 | | Professor and Dean, Mays Business School — Texas A&M University Formerly: Professor and Dean, Walton College of Business, University of Arkansas and E.J. Ourso College of Business, Louisiana State University; Director, Arvest Bank | | 158 | | Insperity, Inc. (formerly known as Administaff) (human resources provider) |
Prema Mathai-Davis — 1950 Trustee | | 2001 | | Retired. Formerly: Chief Executive Officer, YWCA of the U.S.A. | | 158 | | None |
Teresa M. Ressel — 1962 Trustee | | 2017 | | Non-executive director and trustee of a number of public and private business corporations Formerly: Chief Financial Officer, Olayan America, The Olayan Group (international investor/commercial/industrial); Chief Executive Officer, UBS Securities LLC; Group Chief Operating Officer, Americas, UBS AG; Assistant Secretary for Management & Budget and CFO, US Department of the Treasury; Chief Compliance Officer, Kaiser Permanente (healthcare consortium); Program Manager, Hewlett-Packard; Nuclear Engineering, General Dynamics Corporation (aerospace and defense company) | | 158 | | Atlantic Power Corporation (power generation company); ON Semiconductor Corp. (semiconductor supplier) |
Larry Soll — 1942 Trustee | | 2003 | | Retired. Formerly: Chairman, Chief Executive Officer and President, Synergen Corp. (a biotechnology company) | | 158 | | None |
Ann Barnett Stern — 1957 Trustee | | 2017 | | President and Chief Executive Officer, Houston Endowment Inc. (private philanthropic institution) Formerly: Executive Vice President and General Counsel, Texas Children’s Hospital; Attorney, Beck, Redden and Secrest, LLP; Business Law Instructor, University of St. Thomas; Attorney, Andrews & Kurth LLP | | 158 | | Federal Reserve Bank of Dallas |
Raymond Stickel, Jr. — 1944 Trustee | | 2005 | | Retired. Formerly: Director, Mainstay VP Series Funds, Inc. (25 portfolios); Partner, Deloitte & Touche | | 158 | | None |
Robert C. Troccoli — 1949 Trustee | | 2016 | | Adjunct Professor, University of Denver — Daniels College of Business Formerly: Senior Partner, KPMG LLP | | 158 | | None |
T-2 Invesco Low Volatility Emerging Markets Fund
Trustees and Officers—(continued)
| | | | | | | | |
Name, Year of Birth and Position(s) Held with the Trust | | Trustee and/
or Officer Since | | Principal Occupation(s) During Past 5 Years | | Number of
Funds in Fund
Complex
Overseen by
Trustee | | Other Directorship(s)
Held by Trustee During Past 5 Years |
| Independent Trustees—(continued) |
Christopher L. Wilson — 1957 Trustee | | 2017 | | Managing Partner, CT2, LLC (investing and consulting firm) Formerly: President/Chief Executive Officer, Columbia Funds, Bank of America Corporation; President/Chief Executive Officer, CDC IXIS Asset Management Services, Inc.; Principal & Director of Operations, Scudder Funds, Scudder, Stevens & Clark, Inc.; Assistant Vice President, Fidelity Investments | | 158 | | TD Asset Management USA Inc. (mutual fund complex) (22 portfolios); ISO New England, Inc. (non-profit organization managing regional electricity market) |
| Other Officers | | | | | | | | |
Sheri Morris — 1964 President, Principal Executive Officer and Treasurer | | 1999 | | President, Principal Executive Officer and Treasurer, The Invesco Funds; Vice President, Invesco Advisers, Inc. (formerly known as Invesco Institutional (N.A.), Inc.) (registered investment adviser); and Vice President, PowerShares Exchange-Traded Fund Trust, PowerShares Exchange-Traded Fund Trust II, PowerShares India Exchange-Traded Fund Trust, PowerShares Actively Managed Exchange-Traded Fund Trust and PowerShares Actively Managed Exchange-Traded Commodity Fund Trust Formerly: Vice President and Principal Financial Officer, The Invesco Funds; Vice President, Invesco Aim Advisers, Inc., Invesco Aim Capital Management, Inc. and Invesco Aim Private Asset Management, Inc.; Assistant Vice President and Assistant Treasurer, The Invesco Funds and Assistant Vice President, Invesco Advisers, Inc., Invesco Aim Capital Management, Inc. and Invesco Aim Private Asset Management, Inc.; and Treasurer, PowerShares Exchange-Traded Fund Trust, PowerShares Exchange-Traded Fund Trust II, PowerShares India Exchange-Traded Fund Trust and PowerShares Actively Managed Exchange-Traded Fund Trust | | N/A | | N/A |
Russell C. Burk — 1958 Senior Vice President and Senior Officer | | 2005 | | Senior Vice President and Senior Officer, The Invesco Funds | | N/A | | N/A |
John M. Zerr — 1962 Senior Vice President, Chief Legal Officer and Secretary | | 2006 | | Director, Senior Vice President, Secretary and General Counsel, Invesco Management Group, Inc. (formerly known as Invesco AIM Management Group, Inc.); Senior Vice President, Invesco Advisers, Inc. (formerly known as Invesco Institutional (N.A.), Inc.) (registered investment adviser); Senior Vice President and Secretary, Invesco Distributors, Inc. (formerly known as Invesco AIM Distributors, Inc.); Director, Vice President and Secretary, Invesco Investment Services, Inc. (formerly known as Invesco AIM Investment Services, Inc.) Senior Vice President, Chief Legal Officer and Secretary, The Invesco Funds; Managing Director, Invesco PowerShares Capital Management LLC; Director, Secretary and General Counsel, Invesco Investment Advisers LLC (formerly known as Van Kampen Asset Management); Secretary and General Counsel, Invesco Capital Markets, Inc. (formerly known as Van Kampen Funds Inc.) and Chief Legal Officer, PowerShares Exchange-Traded Fund Trust, PowerShares Exchange-Traded Fund Trust II, PowerShares India Exchange-Traded Fund Trust, PowerShares Actively Managed Exchange-Traded Fund Trust and PowerShares Actively Managed Exchange-Traded Commodity Fund Trust; Manager and Secretary, Invesco Indexing LLC Formerly: Director, Secretary, General Counsel and Senior Vice President, Van Kampen Exchange Corp.; Director, Vice President and Secretary, IVZ Distributors, Inc. (formerly known as INVESCO Distributors, Inc.); Director and Vice President, INVESCO Funds Group, Inc.; Director and Vice President, Van Kampen Advisors Inc.; Director, Vice President, Secretary and General Counsel, Van Kampen Investor Services Inc.; Director, Invesco Distributors, Inc. (formerly known as Invesco AIM Distributors, Inc.); Director, Senior Vice President, General Counsel and Secretary, Invesco AIM Advisers, Inc. and Van Kampen Investments Inc.; Director, Vice President and Secretary, Fund Management Company; Director, Senior Vice President, Secretary, General Counsel and Vice President, Invesco AIM Capital Management, Inc.; Chief Operating Officer and General Counsel, Liberty Ridge Capital, Inc. (an investment adviser); Vice President and Secretary, PBHG Funds (an investment company) and PBHG Insurance Series Fund (an investment company); Chief Operating Officer, General Counsel and Secretary, Old Mutual Investment Partners (a broker-dealer); General Counsel and Secretary, Old Mutual Fund Services (an administrator) and Old Mutual Shareholder Services (a shareholder servicing center); Executive Vice President, General Counsel and Secretary, Old Mutual Capital, Inc. (an investment adviser); and Vice President and Secretary, Old Mutual Advisors Funds (an investment company) | | N/A | | N/A |
Gregory G. McGreevey — 1962 Senior Vice President | | 2012 | | Senior Managing Director, Invesco Ltd.; Director, Chairman, President, and Chief Executive Officer, Invesco Advisers, Inc. (formerly known as Invesco Institutional (N.A.), Inc.) (registered investment adviser); Senior Vice President, Invesco Management Group, Inc.; Director, Invesco Mortgage Capital, Inc. and Invesco Senior Secured Management, Inc.; and Senior Vice President, The Invesco Funds Formerly: Assistant Vice President, The Invesco Funds | | N/A | | N/A |
T-3 Invesco Low Volatility Emerging Markets Fund
Trustees and Officers—(continued)
| | | | | | | | |
Name, Year of Birth and Position(s) Held with the Trust | | Trustee and/
or Officer Since | | Principal Occupation(s) During Past 5 Years | | Number of
Funds in Fund
Complex
Overseen by
Trustee | | Other Directorship(s)
Held by Trustee During Past 5 Years |
| Other Officers—(continued) | | | | | | | | |
Kelli Gallegos — 1970 Vice President, Principal Financial Officer and Assistant Treasurer | | 2008 | | Vice President, Principal Financial Officer and Assistant Treasurer, The Invesco Funds; Assistant Treasurer, Invesco PowerShares Capital Management LLC, PowerShares Exchange-Traded Fund Trust, PowerShares Exchange-Traded Fund Trust II, PowerShares India Exchange-Traded Fund Trust, PowerShares Actively Managed Exchange-Traded Fund Trust and PowerShares Actively Managed Exchange-Traded Commodity Fund Trust Formerly: Assistant Vice President, The Invesco Funds | | N/A | | N/A |
Tracy Sullivan — 1962 Vice President, Chief Tax Officer and Assistant Treasurer | | 2008 | | Vice President, Chief Tax Officer and Assistant Treasurer, The Invesco Funds; Assistant Treasurer, Invesco PowerShares Capital Management LLC, PowerShares Exchange-Traded Fund Trust, PowerShares Exchange-Traded Fund Trust II, PowerShares India Exchange-Traded Fund Trust, PowerShares Actively Managed Exchange-Traded Fund Trust and PowerShares Actively Managed Exchange-Traded Commodity Fund Trust Formerly: Assistant Vice President, The Invesco Funds | | N/A | | N/A |
Crissie M. Wisdom — 1969 Anti-Money Laundering Compliance Officer | | 2013 | | Anti-Money Laundering Compliance Officer, Invesco Advisers, Inc. (formerly known as Invesco Institutional (N.A.), Inc.) (registered investment adviser), Invesco Capital Markets, Inc. (formerly known as Van Kampen Funds Inc.), Invesco Distributors, Inc., Invesco Investment Services, Inc., Invesco Management Group, Inc., The Invesco Funds, and PowerShares Exchange-Traded Fund Trust, PowerShares Exchange-Traded Fund Trust II, PowerShares India Exchange-Traded Fund Trust, PowerShares Actively Managed Exchange-Traded Fund Trust and PowerShares Actively Managed Exchange-Traded Commodity Fund Trust; Anti-Money Laundering Compliance Officer and Bank Secrecy Act Officer, INVESCO National Trust Company and Invesco Trust Company; and Fraud Prevention Manager and Controls and Risk Analysis Manager for Invesco Investment Services, Inc. Formerly: Anti-Money Laundering Compliance Officer, Van Kampen Exchange Corp. | | N/A | | N/A |
Robert R. Leveille — 1969 Chief Compliance Officer | | 2016 | | Chief Compliance Officer, Invesco Advisers, Inc. (registered investment adviser); and Chief Compliance Officer, The Invesco Funds Formerly: Chief Compliance Officer, Putnam Investments and the Putnam Funds | | N/A | | N/A |
The Statement of Additional Information of the Trust includes additional information about the Fund’s Trustees and is available upon request, without charge, by calling 1.800.959.4246. Please refer to the Fund’s Statement of Additional Information for information on the Fund’s sub-advisers.
| | | | | | |
Office of the Fund 11 Greenway Plaza, Suite 1000 Houston, TX 77046-1173 | | Investment Adviser Invesco Advisers, Inc. 1555 Peachtree Street, N.E. Atlanta, GA 30309 | | Distributor Invesco Distributors, Inc. 11 Greenway Plaza, Suite 1000 Houston, TX 77046-1173 | | Auditors PricewaterhouseCoopers LLP 1000 Louisiana Street, Suite 5800 Houston, TX 77002-5678 |
| | | |
| | | | | | |
Counsel to the Fund Stradley Ronon Stevens & Young, LLP 2005 Market Street, Suite 2600 Philadelphia, PA 19103-7018 | | Counsel to the Independent Trustees Goodwin Procter LLP 901 New York Avenue, N.W. Washington, D.C. 20001 | | Transfer Agent Invesco Investment Services, Inc. 11 Greenway Plaza, Suite 1000 Houston, TX 77046-1173 | | Custodian State Street Bank and Trust Company 225 Franklin Street Boston, MA 02110-2801 |
T-4 Invesco Low Volatility Emerging Markets Fund
Explore High-Conviction Investing with Invesco

Go paperless with eDelivery
Visit invesco.com/edelivery to enjoy the convenience and security of anytime electronic access to your investment documents.
With eDelivery, you can elect to have any or all of the following materials delivered straight to your inbox to download, save and print from your own computer:
| ∎ | | Fund reports and prospectuses |
Invesco mailing information
Send general correspondence to Invesco Investment Services, Inc., P.O. Box 219078, Kansas City, MO 64121-9078.
Important notice regarding delivery of security holder documents
To reduce Fund expenses, only one copy of most shareholder documents may be mailed to shareholders with multiple accounts at the same address (Householding). Mailing of your shareholder documents may be householded indefinitely unless you instruct us otherwise. If you do not want the mailing of these documents to be combined with those for other members of your household, please contact Invesco Investment Services, Inc. at 800 959 4246 or contact your financial institution. We will begin sending you individual copies for each account within 30 days after receiving your request.
Fund holdings and proxy voting information
The Fund provides a complete list of its holdings four times in each fiscal year, at the quarter ends. For the second and fourth quarters, the lists appear in the Fund’s semiannual and annual reports to shareholders. For the first and third quarters, the Fund files the lists with the Securities and Exchange Commission (SEC) on Form N-Q. The most recent list of portfolio holdings is available at invesco.com/completeqtrholdings. Shareholders can also look up the Fund’s Forms N-Q on the SEC website at sec.gov. Copies of the Fund’s Forms N-Q may be reviewed and copied at the SEC Public Reference Room in Washington, D.C. You can obtain information on the operation of the Public Reference Room, including information about duplicating fee charges, by calling 202 551 8090 or 800 732 0330, or by electronic request at the following email address: publicinfo@sec.gov. The SEC file numbers for the Fund are shown below.
A description of the policies and procedures that the Fund uses to determine how to vote proxies relating to portfolio securities is available without charge, upon request, from our Client Services department at 800 959 4246 or at invesco.com/proxyguidelines. The information is also available on the SEC website, sec.gov.
| | |
Information regarding how the Fund voted proxies related to its portfolio securities during the most recent 12-month period ended June 30 is available at invesco.com/proxysearch. The information is also available on the SEC website, sec.gov. Invesco Advisers, Inc. is an investment adviser; it provides investment advisory services to individual and institutional clients and does not sell securities. Invesco Distributors, Inc. is the US distributor for Invesco Ltd.’s retail mutual funds, exchange-traded funds and institutional money market funds. Both are wholly owned, indirect subsidiaries of Invesco Ltd. | |  |
| | | | | | | | |
| SEC file numbers: 811-05426 and 033-19338 | | Invesco Distributors, Inc. | | LVEM-AR-1 | | 12152017 | | 1148 |
Letters to Shareholders
| | | | |

Philip Taylor | | | | Dear Shareholders: This annual report includes information about your Fund, including performance data and a complete list of its investments as of the close of the reporting period. Inside is a discussion of how your Fund was managed and the factors that affected its performance during the reporting period. American voters went to the polls just days after the start of the reporting period, and their decisions quickly affected markets. The US stock market rallied strongly after the election, with major market indexes rising, and setting record highs, throughout the reporting period. Generally positive economic data, strong corporate earnings and hope for tax and regulatory reform contributed to the rally. US and global bond markets, as well as emerging market equities, sold off immediately following the election – with the US bond market eventually |
recovering most of its losses. Overseas, economic data were mixed, prompting the European Central Bank and central banks in China and Japan, among other countries, to maintain extraordinarily accommodative monetary policies. Citing positive economic trends – specifically, realized and expected labor market conditions and inflation – the US Federal Reserve raised interest rates three times during the reporting period: first in December 2016, and then again in March and June 2017. Health care and tax reform proved to be more difficult than expected to enact, with little progress achieved by the end of the reporting period.
Short-term market volatility can prompt some investors to abandon their investment plans – and can cause others to settle for whatever returns the market has to offer. The investment professionals at Invesco, in contrast, invest with high conviction. This means that, no matter the asset class or the strategy, each investment team has a passion to exceed. We want to help investors achieve better outcomes, such as seeking higher returns, helping mitigate risk and generating income. Of course, investing with high conviction can’t guarantee a profit or ensure success; no investment strategy can. To learn more about how we invest with high conviction, visit invesco.com/HighConviction.
You, too, can invest with high conviction by maintaining a long-term investment perspective and by working with your financial adviser on a regular basis. During periods of short-term market volatility or uncertainty, your financial adviser can keep you focused on your long-term investment goals – a new home, a child’s college education or a secure retirement. He or she also can share research about the economy, the markets and individual investment options.
Visit our website for more information on your investments
Our website, invesco.com/us, offers a wide range of market insights and investment perspectives. On the website, you’ll find detailed information about our funds, including performance, holdings and portfolio manager commentaries. You can access information about your account by completing a simple, secure online registration. To do so, select “Log In” on the right side of the homepage, and then select “Register for Individual Account Access.”
In addition to the resources accessible on our website and through our mobile app, you can obtain timely updates to help you stay informed about the markets and the economy by connecting with Invesco on Twitter, LinkedIn or Facebook. You can access our blog at blog.invesco.us.com. Our goal is to provide you the information you want, when and where you want it.
Finally, I’m pleased to share with you Invesco’s commitment to both the Principles for Responsible Investment and to considering environmental, social and governance issues in our robust investment process. I invite you to learn more at invesco.com/esg.
Have questions?
For questions about your account, contact an Invesco client services representative at 800 959 4246. For Invesco-related questions or comments, please email me directly at phil@invesco.com.
All of us at Invesco look forward to serving your investment management needs. Thank you for investing with us.
Sincerely,

Philip Taylor
Senior Managing Director, Invesco Ltd.
|
| 2 Invesco Macro Allocation Strategy Fund |
| | | | |

Bruce Crockett | | | | Dear Fellow Shareholders: Among the many important lessons I’ve learned in more than 40 years in a variety of business endeavors is the value of a trusted advocate. As independent chair of the Invesco Funds Board, I can assure you that the members of the Board are strong advocates for the interests of investors in Invesco’s mutual funds. We work hard to represent your interests through oversight of the quality of the investment management services your funds receive and other matters important to your investment, including but not limited to: ∎ Ensuring that Invesco offers a diverse lineup of mutual funds that your financial adviser can use to strive to meet your financial needs as your investment goals change over time. ∎ Monitoring how the portfolio management teams of the Invesco funds are performing in light of changing economic and market conditions. |
| ∎ | Assessing each portfolio management team’s investment performance within the context of the investment strategy described in the fund’s prospectus. |
| ∎ | Monitoring for potential conflicts of interests that may impact the nature of the services that your funds receive. |
We believe one of the most important services we provide our fund shareholders is the annual review of the funds’ advisory and sub-advisory contracts with Invesco Advisers and its affiliates. This review is required by the Investment Company Act of 1940 and focuses on the nature and quality of the services Invesco provides as the adviser to the Invesco funds and the reasonableness of the fees that it charges for those services. Each year, we spend months carefully reviewing information received from Invesco and a variety of independent sources, such as performance and fee data prepared by Lipper, Inc. (a subsidiary of Broadridge Financial Solutions, Inc.), an independent, third-party firm widely recognized as a leader in its field. We also meet with our independent legal counsel and other independent advisers to review and help us assess the information that we have received. Our goal is to assure that you receive quality investment management services for a reasonable fee.
I trust the measures outlined above provide assurance that you have a worthy advocate when it comes to choosing the Invesco Funds.
As always, please contact me at bruce@brucecrockett.com with any questions or concerns you may have. On behalf of the Board, we look forward to continuing to represent your interests and serving your needs.
Sincerely,

Bruce L. Crockett
Independent Chair
Invesco Funds Board of Trustees
|
| 3 Invesco Macro Allocation Strategy Fund |
Management’s Discussion of Fund Performance
Performance summary
For the fiscal year ended October 31, 2017, Class A shares of Invesco Macro Allocation Strategy Fund (the Fund), at net asset value (NAV), outperformed the Bloomberg Barclays 3-Month Treasury Bellwether Index, the Fund’s broad market/style-specific benchmark.
Your Fund’s long-term performance appears later in this report.
Fund vs. Indexes
Total returns, 10/31/16 to 10/31/17, at net asset value (NAV). Performance shown does not include applicable contingent deferred sales charges (CDSC) or front-end sales charges, which would have reduced performance.
| | | | | |
| Class A Shares | | | | 6.55 | % |
| Class C Shares | | | | 5.90 | |
| Class R Shares | | | | 6.32 | |
| Class Y Shares | | | | 6.82 | |
| Class R5 Shares | | | | 6.93 | |
| Class R6 Shares | | | | 6.83 | |
Bloomberg Barclays 3-Month Treasury Bellwether Index▼ (Broad Market/Style-Specific Index) | | | | 0.73 | |
| Lipper Absolute Return Funds Index∎ (Peer Group Index) | | | | 6.18 | |
Source(s): ▼FactSet Research Systems Inc.; ∎Lipper Inc. | | | | | |
Market conditions and your Fund
During the fiscal year ended October 31, 2017, each of the strategic asset classes in which the Fund invests (directly or indirectly through derivatives), with the exception of fixed income, provided positive contributions to Fund performance. Within the tactical allocation process, equities contributed to Fund performance while bonds and commodities detracted. For the reporting period, the Fund at NAV reported positive absolute performance.
The Fund invests in derivatives, such as swaps and futures, which are expected to correspond to the performance of US and international equity, fixed income and commodity markets. The strategic allocation portion of the investment process, which is designed to drive approximately 20% of the Fund’s results over time, involves first selecting representative assets for each asset class (equities, fixed income and commodities) from a universe of more than 50 investments. Next, we seek to construct the portfolio so that an approximately equal amount of risk comes from our equity, fixed income and commodity allocations. Tactical adjustments to the Fund’s portfolio, which are
designed to drive the majority of the Fund’s results over time, are made on a monthly basis to try and take advantage of short-term market dynamics.
The results from the smaller strategic allocation were positive for the reporting period as the risk-balanced exposure to equities and commodities proved beneficial and outperformed the Fund’s strategic exposure to bonds, the prices of which fell throughout the fiscal year.
Results from the Fund’s tactical allocation process were beneficial in the aggregate for the reporting period, but exhibited mixed results across the different asset classes.
The Fund’s tactical exposure to developed equity markets, achieved through futures and swaps, was the largest contributor to Fund results for the reporting period. Our long bias to the six developed equity markets (Europe, Asia ex-Japan, Japan, the UK, and US small- and large-caps) that are used in the strategy benefited Fund performance. From a regional perspective, the Fund’s overweight exposure to Asian equities led results in the asset class. Hong Kong equities posted strong gains and traded in sympathy with
emerging markets, while Japanese equities powered higher throughout the reporting period based on increased exports. Overweight exposure to US large- and small-cap equities also boosted Fund performance as stocks surged after the US presidential election on the belief that the new administration’s plans to reduce tax rates, scale back regulations and increase infrastructure spending had the potential to stimulate economic growth. However, that was called into question after the first quarter of 2017, when it appeared that enacting significant regulatory and tax reform might be more difficult than previously anticipated. Despite the prospect of less accommodative monetary policy from the European Central Bank and uncertainty surrounding Brexit (the UK’s plan to leave the European Union), European and UK equities performed strongly during the reporting period due to improved economic data and positive confidence surveys, rewarding our overweight exposure to these markets.
Tactical exposure to bonds detracted from Fund performance for the reporting period, and results were mixed across the different bond markets in which the strategy invests. Our short bias to Australian and US government bonds, particularly early in the reporting period, proved beneficial as yields jumped in the latter months of 2016; this produced a positive contribution from these two markets. Positioning across German, UK and Canadian government bonds suffered in February and June. In February, the strategy was short these markets when prices rallied meaningfully as fears of a renewed Greek financial crisis and fears of nationalist candidates gaining ground in European polls prompted investors to seek so-called “safe havens.”1 In June, major central banks indicated the need to increase interest rates and remove excessive monetary accommodation. These actions drove yields higher and hurt Fund performance, due to our overweight stance. These market events resulted in losses that outweighed our gains in the US and Australia.
| | | | | | | | | | |
| Target Risk Allocation and |
| Notional Asset Weights as of 10/31/17 |
| By asset class | | | | | | |
Asset Class | | Target Risk
Allocation* | | Notional Asset
Weights** |
| Equities | | | | 72.20 | % | | | | 53.37 | % |
| Fixed Income | | | | 3.60 | | | | | -13.23 | |
| Commodities | | | | 24.20 | | | | | 18.29 | |
| Total | | | | 100.00 | | | | | 58.43 | |
| * | Reflects the risk that each asset class is expected to contribute to the overall risk of the Fund as measured by standard deviation and estimates of risk based on historical data. Standard deviation measures the annualized fluctuations (volatility) of monthly returns. |
| ** | Proprietary models determine the Notional Asset Weights necessary to achieve the Target Risk Allocations. Total Notional Asset Weight greater than 100% is achieved through derivatives and other instruments that create leverage. |
| | | | | |
| |
| Total Net Assets | | | $ | 43.1 million | |
|
| 4 Invesco Macro Allocation Strategy Fund |
The Fund’s tactical exposure to commodities also detracted from Fund performance for the reporting period. Commodity markets have been mired in an extended bear market, with many individual commodities struggling with oversupply and weak demand. While results for the asset class overall were negative, not all of the commodity sectors produced negative results. The largest detractor from Fund results within the asset class was our positioning in agricultural commodities. Many of these commodities, including grains and meats, were in a state of oversupply, which depressed prices, but not in a persistent fashion. Price trends across many of these commodities were very choppy, making tactical positioning difficult. Our general bias to be underweight or short these assets resulted in losses across most agricultural commodity exposures for the reporting period.
Our exposure to energy commodities also weighed on Fund results. The energy commodity sector started the fiscal year plagued by high inventories and rising US production and rig counts. These conditions lasted throughout much of the first half of 2017. Oil and distillate prices then rebounded in the third quarter of 2017 as the US rig count declined and expectations rose for an extension of OPEC’s production cuts. Severe weather also affected energy prices in the third quarter of 2017 as hurricanes forced refinery shutdowns that further boosted prices. Natural gas prices rose at the beginning of the fiscal year, but those gains were not enough to outweigh the losses from rising US output at the end of the fiscal year. These countervailing forces produced choppy price action across energy commodities during the reporting period, again making positioning difficult. Our general long bias to these assets produced mixed results, with gains in heating oil and gas oil, but losses in Brent crude and West Texas Intermediate crude, natural gas and gasoline.
Our exposure to precious metals also detracted from Fund results as we maintained a long bias over the reporting period, but prices of gold and silver declined. The metals were pressured as the US Federal Reserve raised short-term interest rates three times during the reporting period – in December 2016, and in March and June 2017 – and by expectations for another increase in December 2017. The Fund’s positioning in industrial metals produced positive results, which helped to offset tactical losses incurred in other commodity
sectors. Increased industrial metals prices during the reporting period were supported by strong manufacturing and import growth data out of China and by indications that China intended to cut production to curb pollution. The Fund’s general overweight exposure to copper and aluminum benefited from these trends.
Please note that our strategy is principally implemented with derivative instruments that include futures and total return swaps. Therefore, all or most of the performance of the strategy, both positive and negative, can be attributed to these instruments. Derivatives can be a cost-effective way to gain exposure to asset classes. However, derivatives may amplify traditional investment risks through the creation of leverage and may be less liquid than traditional securities.
We thank you for your investment in Invesco Macro Allocation Strategy Fund.
| 1 | So-called “safe haven” assets do not imply risk-free investing. |
The views and opinions expressed in management’s discussion of Fund performance are those of Invesco Advisers, Inc. These views and opinions are subject to change at any time based on factors such as market and economic conditions. These views and opinions may not be relied upon as investment advice or recommendations, or as an offer for a particular security. The information is not a complete analysis of every aspect of any market, country, industry, security or the Fund. Statements of fact are from sources considered reliable, but Invesco Advisers, Inc. makes no representation or warranty as to their completeness or accuracy. Although historical performance is no guarantee of future results, these insights may help you understand our investment management philosophy.
See important Fund and, if applicable, index disclosures later in this report.
| | |
 | | Scott Wolle Chartered Financial Analyst, Portfolio Manager, is lead manager of Invesco Macro Allocation |
| Strategy Fund. He joined Invesco in 1999. Mr. Wolle earned a BS in finance from Virginia Polytechnic Institute and State University and an MBA from Duke University Fuqua School of Business. |
| | |
 | | Mark Ahnrud Chartered Financial Analyst, Portfolio Manager, is manager of Invesco Macro Allocation Strategy |
| Fund. He joined Invesco in 2000. Mr. Ahnrud earned a BS in finance and investments from Babson College and an MBA from Duke University Fuqua School of Business. |
| | |
 | | Chris Devine Chartered Financial Analyst, Portfolio Manager, is manager of Invesco Macro Allocation Strategy |
| Fund. He joined Invesco in 1998. Mr. Devine earned a BA in economics from Wake Forest University and an MBA from the University of Georgia. |
| | |
 | | Scott Hixon Chartered Financial Analyst, Portfolio Manager, is manager of Invesco Macro Allocation Strategy |
| Fund. He joined Invesco in 1994. Mr. Hixon earned a BBA in finance from Georgia Southern University and an MBA in finance from Georgia State University. |
| | |
 | | Christian Ulrich Chartered Financial Analyst, Portfolio Manager, is manager of Invesco Macro Allocation Strategy |
| Fund. He joined Invesco in 2000. Mr. Ulrich earned the equivalent of a BBA from the KV Zurich Business School in Zurich, Switzerland. |
Assisted by the Invesco Global Asset Allocation Team
|
| 5 Invesco Macro Allocation Strategy Fund |
Your Fund’s Long-Term Performance
Results of a $10,000 Investment – Oldest Share Class(es) since Inception
Fund and index data from 9/26/12
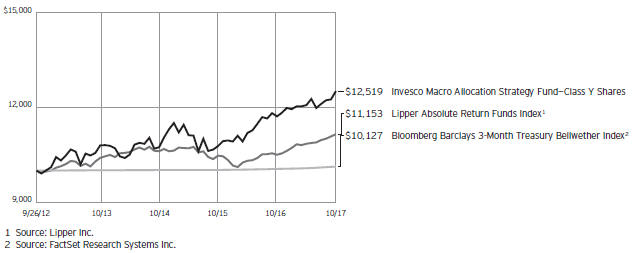
Past performance cannot guarantee comparable future results.
The data shown in the chart include reinvested distributions, applicable sales charges and Fund expenses including
management fees. Index results include reinvested dividends, but they do not reflect sales charges. Performance of the peer group, if applicable, reflects fund expenses and management fees; performance
of a market index does not. Performance shown in the chart and table(s) does not reflect deduction of taxes a shareholder would pay on Fund distributions or sale of Fund shares.
|
| 6 Invesco Macro Allocation Strategy Fund |
| | | | | |
Average Annual Total Returns |
| As of 10/31/17, including maximum applicable sales charges |
| | | | | |
| |
| Class A Shares | | | | | |
| Inception | | | | 3.07 | % |
| 5 Years | | | | 3.31 | |
| 1 Year | | | | 0.66 | |
| |
| Class C Shares | | | | | |
| Inception | | | | 3.47 | % |
| 5 Years | | | | 3.75 | |
| 1 Year | | | | 4.96 | |
| |
| Class R Shares | | | | | |
| Inception | | | | 4.01 | % |
| 5 Years | | | | 4.28 | |
| 1 Year | | | | 6.32 | |
| |
| Class Y Shares | | | | | |
| Inception (9/26/12) | | | | 4.51 | % |
| 5 Years | | | | 4.78 | |
| 1 Year | | | | 6.82 | |
| |
| Class R5 Shares | | | | | |
| Inception | | | | 4.53 | % |
| 5 Years | | | | 4.81 | |
| 1 Year | | | | 6.93 | |
| |
| Class R6 Shares | | | | | |
| Inception | | | | 4.49 | % |
| 5 Years | | | | 4.77 | |
| 1 Year | | | | 6.83 | |
On August 28, 2013, Class H1 shares converted to Class Y shares.
Class A shares incepted on August 28, 2013. Performance shown prior to that date is that of Class H1 shares and includes the 12b-1 fees applicable to Class H1 shares.
Class C shares incepted on August 28, 2013. Performance shown prior to that date is that of Class H1 shares and includes the 12b-1 fees applicable to Class H1 shares.
Class R shares incepted on August 28, 2013. Performance shown prior to that date is that of Class H1 shares and includes the 12b-1 fees applicable to Class H1 shares.
Class R5 shares incepted on August 28, 2013. Performance shown prior to that date is that of Class H1 shares and includes the 12b-1 fees applicable to Class H1 shares.
Class R6 shares incepted on August 28, 2013. Performance shown prior to that date is that of Class H1 shares and includes the 12b-1 fees applicable to Class H1 shares.
The performance data quoted represent past performance and cannot guarantee comparable future results;
| | | | | |
Average Annual Total Returns |
| As of 9/30/17, the most recent calendar quarter end, including maximum applicable sales charges |
| | | | | |
| |
| Class A Shares | | | | | |
| Inception | | | | 2.69 | % |
| 5 Years | | | | 2.66 | |
| 1 Year | | | | -2.25 | |
| |
| Class C Shares | | | | | |
| Inception | | | | 3.12 | % |
| 5 Years | | | | 3.09 | |
| 1 Year | | | | 1.88 | |
| |
| Class R Shares | | | | | |
| Inception | | | | 3.64 | % |
| 5 Years | | | | 3.61 | |
| 1 Year | | | | 3.20 | |
| |
| Class Y Shares | | | | | |
| Inception (9/26/12) | | | | 4.15 | % |
| 5 Years | | | | 4.12 | |
| 1 Year | | | | 3.70 | |
| |
| Class R5 Shares | | | | | |
| Inception | | | | 4.17 | % |
| 5 Years | | | | 4.14 | |
| 1 Year | | | | 3.81 | |
| |
| Class R6 Shares | | | | | |
| Inception | | | | 4.13 | % |
| 5 Years | | | | 4.10 | |
| 1 Year | | | | 3.70 | |
current performance may be lower or higher. Please visit invesco.com/performance for the most recent month-end performance. Performance figures reflect reinvested distributions, changes in net asset value and the effect of the maximum sales charge unless otherwise stated. Investment return and principal value will fluctuate so that you may have a gain or loss when you sell shares.
The net annual Fund operating expense ratio set forth in the most recent Fund prospectus as of the date of this report for Class A, Class C, Class R, Class Y, Class R5 and Class R6 shares was 1.45%, 2.20%, 1.70%, 1.20%, 1.20% and 1.20%, respectively.1,2 The total annual Fund operating expense ratio set forth in the most recent Fund prospectus as of the date of this report for Class A, Class C, Class R, Class Y, Class R5 and Class R6 shares was 1.87%, 2.62%, 2.12%, 1.62%, 1.51% and 1.51%, respectively. The expense ratios presented above may vary from the expense ratios presented in other sections of this report that are based on expenses incurred during the period covered by this report.
Class A share performance reflects the maximum 5.50% sales charge, and Class C share performance reflects the applicable contingent deferred sales charge (CDSC) for the period involved. The CDSC on Class C shares is 1% for the first year after purchase. Class R, Class Y, Class R5 and Class R6 shares do not have a front-end sales charge or a CDSC; therefore, performance is at net asset value.
The performance of the Fund’s share classes will differ primarily due to different sales charge structures and class expenses.
Fund performance reflects any applicable fee waivers and/or expense reimbursements. Had the adviser not waived fees and/or reimbursed expenses currently or in the past, returns would have been lower. See current prospectus for more information.
| 1 | Total annual Fund operating expenses after any contractual fee waivers and/or expense reimbursements by the adviser in effect through at least February 28, 2019. See current prospectus for more information. |
| 2 | Total annual Fund operating expenses after any contractual fee waivers and/or expense reimbursements by the adviser in effect through at least June 30, 2019. See current prospectus for more information. |
|
| 7 Invesco Macro Allocation Strategy Fund |
Invesco Macro Allocation Strategy Fund’s investment objective is to seek a positive absolute return over a complete economic and market cycle.
| ∎ | | Unless otherwise stated, information presented in this report is as of October 31, 2017, and is based on total net assets. |
| ∎ | | Unless otherwise noted, all data provided by Invesco. |
| ∎ | | To access your Fund’s reports/prospectus, visit invesco.com/fundreports. |
About share classes
| ∎ | | Class R shares are generally available only to employer sponsored retirement and benefit plans. Please see the prospectus for more information. |
| ∎ | | Class Y shares are available only to certain investors. Please see the prospectus for more information. |
| ∎ | | Class R5 shares and Class R6 shares are available for use by retirement plans that meet certain standards and for institutional investors. Class R6 shares are also available through intermediaries that have established an agreement with Invesco Distributors, Inc. to make such shares available for use in retail omnibus accounts. Please see the prospectus for more information. |
Principal risks of investing in the Fund
| ∎ | | Changing fixed income market conditions risk. The current low interest rate environment was created in part by the Federal Reserve Board (FRB) and certain foreign central banks keeping the federal funds and equivalent foreign rates near, at or below zero. Increases in the federal funds and equivalent foreign rates may expose fixed income markets to heightened volatility and reduced liquidity for certain fixed income investments, particularly those with longer maturities. In addition, decreases in fixed income dealer market-making capacity may also potentially lead to heightened volatility and reduced liquidity in the fixed income markets. As a result, the value of the Fund’s investments and share price may decline. Changes in central bank policies could also result in higher than normal shareholder redemptions, which could potentially increase portfolio turnover and the Fund’s transaction costs. |
| ∎ | | Commodities tax risk. The tax treatment of commodity-linked derivative instruments may be adversely affected by changes in legislation, regulations or other legally binding authority. If, as a |
| | | result of any such adverse action, the income of the Fund from certain commodity-linked derivatives was treated as non-qualifying income, the Fund might fail to qualify as a regulated investment company and be subject to federal income tax at the Fund level. As a result of a recent announcement by the Internal Revenue Service, the Fund intends to invest in commodity-linked notes: (a) directly, generally only to the extent that it obtains an opinion of counsel confirming that income from such investments should be qualifying income because such commodity-linked notes constitute securities under section 2(a) (36) of the 1940 Act or (b) indirectly through the Subsidiary. Should the Internal Revenue Service issue further guidance, or Congress enact legislation, that adversely affects the tax treatment of the Fund’s use of commodity-linked notes or the Subsidiary (which guidance might be applied to the Fund retroactively), it could, among other consequences, limit the Fund’s ability to pursue its investment strategy. |
| ∎ | | Commodity-linked notes risk. In addition to risks associated with the underlying commodities, investments in commodity-linked notes may be subject to additional risks, such as non-payment of interest and loss of principal, counterparty risk, lack of a secondary market and risk of greater volatility than traditional equity and debt securities. The value of the commodity-linked notes the Fund buys may fluctuate significantly because the values of the underlying investments to which they are linked are themselves volatile. Additionally, certain commodity-linked notes employ “economic” leverage by requiring payment by the issuer of an amount that is a multiple of the price increase or decrease of the underlying commodity, commodity index, or other economic variable. Such economic leverage will increase the volatility of the value of these commodity-linked notes and the Fund to the extent it invests in such notes. |
| ∎ | | Commodity risk. The Fund may have investment exposure to the commodities markets and/or a particular sector of the commodities markets, which may subject the Fund to greater volatility than investments in traditional securities, such as stocks and bonds. Volatility in the commodities markets may be caused by changes in overall market movements, domestic and foreign political and economic events and policies, war, acts of terrorism, changes in domestic or foreign interest rates and/ or investor expectations concerning interest rates, domestic and foreign inflation rates, investment and trading activities of mutual funds, hedge funds and commodities funds, and factors such as drought, floods, weather, livestock disease, embargoes, tariffs and other regulatory developments or supply and demand disruptions. Because the Fund’s performance may be linked to the performance of volatile commodities, investors should be willing to assume the risks of potentially significant fluctuations in the value of the Fund’s shares. |
| ∎ | | Correlation risk. Because the Fund’s investment strategy seeks to balance risk across three asset classes and, within each asset class, across different countries and investments, to the extent either the asset classes or the selected countries and investments become correlated in a way not anticipated by the Adviser, the Fund’s risk allocation process may result in magnified risks and loss instead of balancing (reducing) the risk of loss. |
| ∎ | | Debt securities risk. The prices of debt securities held by the Fund will be affected by changes in interest rates, the creditworthiness of the issuer and other factors. An increase in prevailing interest rates typically causes the value of existing debt securities to fall and often has a greater impact on longer-duration debt securities and higher quality debt securities. Falling interest rates will cause the Fund to reinvest the proceeds of debt securities that have been repaid by the issuer at lower interest rates. Falling interest rates may also reduce the Fund’s distributable income because interest payments on floating rate debt instruments held by the Fund will decline. The Fund could lose money |
|
This report must be accompanied or preceded by a currently effective Fund prospectus, which contains more complete information, including sales charges and expenses. Investors should read it carefully before investing. |
|
| |
NOT FDIC INSURED | MAY LOSE VALUE | NO BANK GUARANTEE
|
| 8 Invesco Macro Allocation Strategy Fund |
| | on investments in debt securities if the issuer or borrower fails to meet its obligations to make interest payments and/or to repay principal in a timely manner. Changes in an issuer’s financial strength, the market’s perception of such strength or in the credit rating of the issuer or the security may affect the value of debt securities. The Adviser’s credit analysis may fail to anticipate such changes, which could result in buying a debt security at an inopportune time or failing to sell a debt security in advance of a price decline or other credit event. |
| ∎ | | Derivatives risk. The value of a derivative instrument depends largely on (and is derived from) the value of an underlying security, currency, commodity, interest rate, index or other asset (each referred to as an underlying asset). In addition to risks relating to the underlying assets, the use of derivatives may include other, possibly greater, risks, including counterparty, leverage and liquidity risks. Counterparty risk is the risk that the counterparty to the derivative contract will default on its obligation to pay the Fund the amount owed or otherwise perform under the derivative contract. Derivatives create leverage risk because they do not require payment up front equal to the economic exposure created by owning the derivative. As a result, an adverse change in the value of the underlying asset could result in the Fund sustaining a loss that is substantially greater than the amount invested in the derivative, which may make the Fund’s returns more volatile and increase the risk of loss. Derivative instruments may also be less liquid than more traditional investments and the Fund may be unable to sell or close out its derivative positions at a desirable time or price. This risk may be more acute under adverse market conditions, during which the Fund may be most in need of liquidating its derivative positions. Derivatives may also be harder to value, less tax efficient and subject to changing government regulation that could impact the Fund’s ability to use certain derivatives or their cost. The SEC has proposed new regulations related to the use of derivatives and related instruments by registered investment companies. If adopted as proposed, these regulations would limit the Fund’s ability to engage in derivatives transactions and may result in increased costs or require the Fund to modify its investment strategies or to |
| | liquidate. Also, derivatives used for hedging or to gain or limit exposure to a particular market segment may not provide the expected benefits, particularly during adverse market conditions. These risks are greater for the Fund than most other mutual funds because the Fund will implement its investment strategy primarily through derivative instruments rather than direct investments in stocks/bonds. |
| ∎ | | Emerging markets securities risk. Emerging markets (also referred to as developing markets) are generally subject to greater market volatility, political, social and economic instability, uncertain trading markets and more governmental limitations on foreign investment than more developed markets. In addition, companies operating in emerging markets may be subject to lower trading volume and greater price fluctuations than companies in more developed markets. Securities law and the enforcement of systems of taxation in many emerging market countries may change quickly and unpredictably. In addition, investments in emerging markets securities may also be subject to additional transaction costs, delays in settlement procedures, and lack of timely information. |
| ∎ | | Exchange-traded funds risk. In addition to the risks associated with the underlying assets held by the exchange-traded fund, investments in exchange-traded funds are subject to the following additional risks: (1) an exchange-traded fund’s shares may trade above or below its net asset value; (2) an active trading market for the exchange-traded fund’s shares may not develop or be maintained; (3) trading an exchange-traded fund’s shares may be halted by the listing exchange; (4) a passively managed exchange-traded fund may not track the performance of the reference asset; and (5) a passively managed exchange-traded fund may hold troubled securities. Investment in exchange-traded funds may involve duplication of management fees and certain other expenses, as the Fund indirectly bears its proportionate share of any expenses paid by the exchange-traded funds in which it invests. Further, certain exchange-traded funds in which the Fund may invest are leveraged, which may result in economic leverage, permitting the Fund to gain exposure that is greater than would be the case in an unlevered instrument and potentially resulting in greater volatility. |
| ∎ | | Exchange-traded notes risk. Exchange-traded notes are subject to credit risk, counterparty risk, and the risk that the value of the exchange-traded note may drop due to a downgrade in the issuer’s credit rating. The value of an exchange-traded note may also be influenced by time to maturity, level of supply and demand for the exchange-traded note, volatility and lack of liquidity in the underlying market, changes in the applicable interest rates, and economic, legal, political, or geographic events that affect the referenced underlying market or assets. The Fund will bear its proportionate share of any fees and expenses borne by an exchange-traded note in which it invests. For certain exchange-traded notes, there may be restrictions on the Fund’s right to redeem its investment, which is meant to be held until maturity. |
| ∎ | | Foreign government debt risk. Investments in foreign government debt securities (sometimes referred to as sovereign debt securities) involve certain risks in addition to those relating to foreign securities or debt securities generally. The issuer of the debt or the governmental authorities that control the repayment of the debt may be unable or unwilling to repay principal or interest when due in accordance with the terms of such debt, and the Fund may have limited recourse in the event of a default against the defaulting government. Without the approval of debt holders, some governmental debtors have in the past been able to reschedule or restructure their debt payments or declare moratoria on payments. |
| ∎ | | Foreign securities risk. The Fund’s foreign investments may be adversely affected by political and social instability, changes in economic or taxation policies, difficulty in enforcing obligations, decreased liquidity or increased volatility. Foreign investments also involve the risk of the possible seizure, nationalization or expropriation of the issuer or foreign deposits (in which the Fund could lose its entire investments in a certain market) and the possible adoption of foreign governmental restrictions such as exchange controls. Unless the Fund has hedged its foreign securities risk, foreign securities risk also involves the risk of negative foreign currency rate fluctuations, which may cause the value of securities denominated in such foreign currency (or other instruments through which the Fund has exposure to foreign currencies) to decline in value. Currency |
|
| 9 Invesco Macro Allocation Strategy Fund |
| | exchange rates may fluctuate significantly over short periods of time. Currency hedging strategies, if used, are not always successful. |
| ∎ | | Management risk. The Fund is actively managed and depends heavily on the Adviser’s judgment about markets, interest rates or the attractiveness, relative values, liquidity, or potential appreciation of particular investments made for the Fund’s portfolio. The Fund could experience losses if these judgments prove to be incorrect. Because the Fund’s investment process relies heavily on its asset allocation process, market movements that are counter to the portfolio managers’ expectations may have a significant adverse effect on the Fund’s net asset value. Additionally, legislative, regulatory, or tax developments may adversely affect management of the Fund and, therefore, the ability of the Fund to achieve its investment objective. |
| ∎ | | Market risk. The market values of the Fund’s investments, and therefore the value of the Fund’s shares, will go up and down, sometimes rapidly or unpredictably. Market risk may affect a single issuer, industry or section of the economy, or it may affect the market as a whole. Individual stock prices tend to go up and down more dramatically than those of certain other types of investments, such as bonds. During a general downturn in the financial markets, multiple asset classes may decline in value. When markets perform well, there can be no assurance that specific investments held by the Fund will rise in value. |
| ∎ | | Non-diversification risk. The Fund is non-diversified and can invest a greater portion of its assets in the obligations or securities of a small number of issuers or any single issuer than a diversified fund can. A change in the value of one or a few issuers’ securities will therefore affect the value of the Fund more than if it was a diversified fund. |
| ∎ | | Short position risk. Because the Fund’s potential loss on a short position arises from increases in the value of the asset sold short, the Fund will incur a loss on a short position, which is theoretically unlimited, if the price of the asset sold short increases from the short sale price. The counterparty to a short position or other market factors may prevent the Fund from closing out a short position at a desirable time or price and may reduce or eliminate any gain or result in a loss. In a rising market, the Fund’s short positions will cause the Fund to underperform the overall |
| | | market and its peers that do not engage in shorting. If the Fund holds both long and short positions, and both positions decline simultaneously, the short positions will not provide any buffer (hedge) from declines in value of the Fund’s long positions. Certain types of short positions involve leverage, which may exaggerate any losses, potentially more than the actual cost of the investment, and will increase the volatility of the Fund’s returns. |
| ∎ | | Subsidiary risk. By investing in the Subsidiary, the Fund is indirectly exposed to risks associated with the Subsidiary’s investments. The Subsidiary is not registered under the Investment Company Act of 1940, as amended (1940 Act), and, except as otherwise noted in the prospectus, is not subject to the investor protections of the 1940 Act. Changes in the laws of the United States and/or the Cayman Islands, under which the Fund and the Subsidiary, respectively, are organized, could result in the inability of the Fund and/or the Subsidiary to operate as described in the prospectus and the SAI, and could negatively affect the Fund and its shareholders. |
| ∎ | | US government obligations risk. Obligations of US government agencies and authorities receive varying levels of support and may not be backed by the full faith and credit of the US government, which could affect the Fund’s ability to recover should they default. No assurance can be given that the US government will provide financial support to its agencies and authorities if it is not obligated by law to do so. |
| ∎ | | Volatility risk. Although the Fund’s investment strategy targets a specific volatility level, certain of the Fund’s investments may appreciate or decrease significantly in value over short periods of time. This may cause the Fund’s net asset value per share to experience significant increases or declines in value over short periods of time. |
About indexes used in this report
| ∎ | | The Bloomberg Barclays 3-Month Treasury Bellwether Index measures the performance of Treasury bills with maturities of less than three months. |
| ∎ | | The Lipper Absolute Return Funds Index is an unmanaged index considered representative of absolute return funds tracked by Lipper. |
| ∎ | | The Fund is not managed to track the performance of any particular index, including the index(es) described here, and consequently, the performance of the Fund may deviate significantly from the performance of the index(es). |
| ∎ | | A direct investment cannot be made in an index. Unless otherwise indicated, index results include reinvested dividends, and they do not reflect sales charges. Performance of the peer group, if applicable, reflects fund expenses; performance of a market index does not. |
Other information
| ∎ | | The returns shown in management’s discussion of Fund performance are based on net asset values (NAVs) calculated for shareholder transactions. Generally accepted accounting principles require adjustments to be made to the net assets of the Fund at period end for financial reporting purposes, and as such, the NAVs for shareholder transactions and the returns based on those NAVs may differ from the NAVs and returns reported in the Financial Highlights. |
|
| 10 Invesco Macro Allocation Strategy Fund |
Consolidated Schedule of Investments
October 31, 2017
| | | | | | | | | | | | | | | | |
| | | Interest
Rate | | | Maturity
Date | | | Principal
Amount | | | Value | |
U.S. Treasury Securities–29.99% | | | | | | | | | |
| U.S. Treasury Bills–12.53%(a)(b) | | | | | | | | | |
U.S. Treasury Bills | | | 1.12 | % | | | 01/04/2018 | | | $ | 585,000 | | | $ | 583,922 | |
U.S. Treasury Bills | | | 1.11 | % | | | 02/08/2018 | | | | 2,710,000 | | | | 2,701,690 | |
U.S. Treasury Bills | | | 1.12 | % | | | 02/08/2018 | | | | 2,120,000 | | | | 2,113,500 | |
| | | | | | | | | | | | | | | | 5,399,112 | |
| | | | |
| U.S. Treasury Notes–17.46%(c) | | | | | | | | | | | | | | | | |
U.S. Treasury Floating Rate Notes (3 mo. U.S. Treasury Bill Money Market Yield Rate +0.27%) | | | 1.38 | % | | | 01/31/2018 | | | | 2,640,000 | | | | 2,642,071 | |
U.S. Treasury Floating Rate Notes (3 mo. U.S. Treasury Bill Money Market Yield Rate +0.19%) | | | 1.30 | % | | | 04/30/2018 | | | | 2,380,000 | | | | 2,382,717 | |
U.S. Treasury Floating Rate Notes (3 mo. U.S. Treasury Bill Money Market Yield Rate +0.17%) | | | 1.28 | % | | | 07/31/2018 | | | | 2,500,000 | | | | 2,503,825 | |
| | | | | | | | | | | | | | | | 7,528,613 | |
Total U.S. Treasury Securities (Cost $12,920,802) | | | | | | | | | | | | | | | 12,927,725 | |
| | | | |
| | | | | | | | | Shares | | | | |
| | | | |
Money Market Funds–69.60% | | | | | | | | | | | | | | | | |
Invesco Government & Agency Portfolio–Institutional Class, 0.95%(d) | | | | | | | | | | | 17,033,082 | | | | 17,033,082 | |
Invesco STIC (Global Series) PLC – U.S. Dollar Liquidity Portfolio (Ireland)–Institutional Class, 1.00%(d) | | | | | | | | | | | 4,633,049 | | | | 4,633,049 | |
Treasury Portfolio–Institutional Class, 0.94%(d) | | | | | | | | | | | 8,336,721 | | | | 8,336,721 | |
Total Money Market Funds (Cost $30,002,852) | | | | | | | | | | | | | | | 30,002,852 | |
TOTAL INVESTMENTS IN SECURITIES–99.59% (Cost $42,923,654) | | | | | | | | | | | | | | | 42,930,577 | |
OTHER ASSETS LESS LIABILITIES–0.41% | | | | | | | | | | | | | | | 177,598 | |
NET ASSETS–100.00% | | | | | | | | | | | $ | 43,108,175 | |
| | | | | | | | | | | | | | | | | | | | |
| Open Futures Contracts | |
| Long Futures Contracts | | Number of
Contracts | | | Expiration
Month | | | Notional
Value | | | Value | | | Unrealized
Appreciation
(Depreciation) | |
Brent Crude | | | 16 | | | | January-2018 | | | $ | 975,040 | | | $ | 85,807 | | | $ | 85,807 | |
Cotton No. 2 | | | 17 | | | | December-2017 | | | | 581,230 | | | | (37,370 | ) | | | (37,370 | ) |
Gas Oil | | | 19 | | | | December-2017 | | | | 1,040,725 | | | | 128,457 | | | | 128,457 | |
Gasoline Reformulated Blendstock Oxygenate Blending | | | 19 | | | | December-2017 | | | | 1,382,535 | | | | 111,048 | | | | 111,048 | |
Heating Oil | | | 13 | | | | April-2018 | | | | 1,011,629 | | | | 71,694 | | | | 71,694 | |
Silver | | | 4 | | | | December-2017 | | | | 333,860 | | | | (18,618 | ) | | | (18,618 | ) |
Soybeans | | | 2 | | | | July-2018 | | | | 101,225 | | | | 1,860 | | | | 1,860 | |
WTI Crude | | | 7 | | | | April-2018 | | | | 382,690 | | | | 24,939 | | | | 24,939 | |
Subtotal — Commodity Risk | | | | | | | | | | | | | | | 367,817 | | | | 367,817 | |
Dow Jones EURO STOXX 50 Index | | | 96 | | | | December-2017 | | | | 4,113,122 | | | | 239,603 | | | | 239,603 | |
E-Mini Russell 2000 Index | | | 40 | | | | December-2017 | | | | 3,005,400 | | | | 151,891 | | | | 151,891 | |
E-Mini S&P 500 Index | | | 24 | | | | December-2017 | | | | 3,087,240 | | | | 104,236 | | | | 104,236 | |
FTSE 100 Index | | | 42 | | | | December-2017 | | | | 4,166,327 | | | | 52,289 | | | | 52,289 | |
Hang Seng Index | | | 23 | | | | November-2017 | | | | 4,156,946 | | | | (2,040 | ) | | | (2,040 | ) |
Tokyo Stock Price Index | | | 30 | | | | December-2017 | | | | 4,652,124 | | | | 462,999 | | | | 462,999 | |
Subtotal — Equity Risk | | | | | | | | | | | | | | | 1,008,978 | | | | 1,008,978 | |
U.S. Treasury Long Bonds | | | 3 | | | | December-2017 | | | | 457,406 | | | | (9,187 | ) | | | (9,187 | ) |
Subtotal — Interest Rate Risk | | | | | | | | | | | | | | | (9,187 | ) | | | (9,187 | ) |
Subtotal — Long Futures Contracts | | | | | | | | | | | | | | $ | 1,367,608 | | | $ | 1,367,608 | |
See accompanying Notes to Consolidated Financial Statements which are an integral part of the financial statements.
11 Invesco Macro Allocation Strategy Fund
| | | | | | | | | | | | | | | | | | | | |
| Open Futures Contracts–(continued) | |
| Short Futures Contracts | | Number of
Contracts | | | Expiration
Month | | | Notional
Value | | | Value | | | Unrealized
Appreciation
(Depreciation) | |
Cocoa | | | 14 | | | | March-2018 | | | $ | (292,460 | ) | | $ | (1,032 | ) | | $ | (1,032 | ) |
Coffee | | | 10 | | | | December-2017 | | | | (469,125 | ) | | | 8,290 | | | | 8,290 | |
Corn | | | 21 | | | | December-2017 | | | | (363,038 | ) | | | 6,563 | | | | 6,563 | |
Wheat | | | 7 | | | | December-2017 | | | | (146,475 | ) | | | 7,912 | | | | 7,912 | |
Subtotal — Commodity Risk | | | | | | | | | | | | | | | 21,733 | | | | 21,733 | |
Australia 10 Year Bonds | | | 2 | | | | December-2017 | | | | (197,248 | ) | | | 1,049 | | | | 1,049 | |
Canada 10 Year Bonds | | | 8 | | | | December-2017 | | | | (852,213 | ) | | | (3,114 | ) | | | (3,114 | ) |
Euro Bonds | | | 14 | | | | December-2017 | | | | (2,654,225 | ) | | | (23,916 | ) | | | (23,916 | ) |
Long Gilt | | | 15 | | | | December-2017 | | | | (2,477,400 | ) | | | (1,783 | ) | | | (1,783 | ) |
Subtotal — Interest Rate Risk | | | | | | | | | | | | | | | (27,764 | ) | | | (27,764 | ) |
Subtotal — Short Futures Contracts | | | | | | | | | | | | | | | (6,031 | ) | | | (6,031 | ) |
Total Futures Contracts | | | | | | | | | | | | | | $ | 1,361,577 | | | $ | 1,361,577 | |
| | | | | | | | | | | | | | | | | | | | | | | | | | | | | | | | | | | | | | |
| Open Over-The-Counter Total Return Swap Agreements(e) | |
| Counterparty | | Pay/
Receive | | Reference Entity(f) | | | Fixed
Rate | | | Payment
Frequency | | | Number of
Contracts | | | Maturity
Date | | | Notional
Value | | | Upfront Payments Paid
(Received) | | | Value | | | Unrealized Appreciation (Depreciation) | |
Barclays Bank PLC | | Receive | |
| Barclays Live Cattle Roll Yield
Excess Return Index |
| | | 0.47 | % | | | Monthly | | | | 1,460 | | | | January-2018 | | | $ | 191,833 | | | $ | — | | | $ | 6,596 | | | $ | 6,596 | |
Merrill Lynch International | | Receive | |
| Merrill Lynch Gold Excess Return
Index |
| | | 0.14 | | | | Monthly | | | | 1,980 | | | | June-2018 | | | | 321,038 | | | | — | | | | 0 | | | | 0 | |
Merrill Lynch International | | Receive | |
| MLCX Natural Gas Annual Excess
Return Index |
| | | 0.25 | | | | Monthly | | | | 14,600 | | | | September-2018 | | | | 648,093 | | | | — | | | | 0 | | | | 0 | |
Morgan Stanley Capital Services LLC | | Receive | |
| S&P GSCI Aluminum Dynamic Roll
Index Excess Return |
| | | 0.38 | | | | Monthly | | | | 7,000 | | | | October-2018 | | | | 815,555 | | | | — | | | | 7,725 | | | | 7,725 | |
Subtotal — Appreciation | | | | | | | | | | | | | | | | | | | | | | | | | | | — | | | | 14,321 | | | | 14,321 | |
Barclays Bank PLC | | Receive | |
| Barclays Commodity Strategy 1452
Excess Return Index |
| | | 0.33 | | | | Monthly | | | | 2,200 | | | | October-2018 | | | | 1,252,459 | | | | — | | | | (30,626 | ) | | | (30,626 | ) |
Barclays Bank PLC | | Receive | |
| Barclays Soybean Meal S2 Nearby
Excess Return Index |
| | | 0.30 | | | | Monthly | | | | 120 | | | | March-2018 | | | | 121,440 | | | | — | | | | (4,753 | ) | | | (4,753 | ) |
Goldman Sachs International | | Pay | |
| Enhanced Strategy AB141 on the
S&P GSCI Sugar Excess Return Index |
| | | 0.15 | | | | Monthly | | | | 830 | | | | October-2018 | | | | 171,468 | | | | — | | | | (3,805 | ) | | | (3,805 | ) |
JPMorgan Chase Bank, N.A. | | Receive | | | S&P GSCI Gold Index Excess Return | | | | 0.09 | | | | Monthly | | | | 4,780 | | | | October-2018 | | | | 498,578 | | | | — | | | | (4,049 | ) | | | (4,049 | ) |
Subtotal — Depreciation | | | | | | | | | | | | | | | | | | | | | | | | | | | — | | | | (43,233 | ) | | | (43,233 | ) |
Total–Open Over-The-Counter Total Return Swap Agreements — Commodity Risk | | | | | | | | | | | | | | | $ | — | | | $ | (28,912 | ) | | $ | (28,912 | ) |
Notes to Consolidated Schedule of Investments:
| (a) | Security traded on a discount basis. The interest rate shown represents the discount rate at the time of purchase by the Fund. |
| (b) | All or a portion of the value was pledged as collateral to cover margin requirements for open futures contracts. See Note 1L. |
| (c) | Interest or dividend rate is redetermined periodically. Rate shown is the rate in effect on October 31, 2017. |
| (d) | The money market fund and the Fund are affiliated by having the same investment adviser. The rate shown is the 7-day SEC standardized yield as of October 31, 2017. |
| (e) | The Fund receives or pays payments based on any positive or negative return on the Reference Entity, respectively. |
| (f) | The table below includes additional information regarding the underlying components of certain reference entities that are not publically available. |
See accompanying Notes to Consolidated Financial Statements which are an integral part of the financial statements.
12 Invesco Macro Allocation Strategy Fund
| | | | | | |
| Reference Entity Components | |
| Reference Entity | | Underlying Components | | % | |
Barclays Live Cattle Roll Yield Excess Return Index | |
| | Long Futures Contracts | | | | |
| | Live Cattle | | | 100 | % |
|
Merrill Lynch Gold Excess Return Index | |
| | Long Futures Contracts | | | | |
| | Gold | | | 100 | % |
|
MLCX Natural Gas Annual Excess Return Index | |
| | Long Futures Contracts | | | | |
| | Natural Gas | | | 100 | % |
|
S&P GSCI Aluminum Dynamic Roll Index Excess Return Index | |
| | Long Futures Contracts | | | | |
| | Aluminum | | | 100 | % |
|
Barclays Commodity Strategy 1452 Excess Return Index | |
| | Long Futures Contracts | | | | |
| | Copper | | | 100 | % |
|
Barclays Soybean Meal S2 Nearby Excess Return Index | |
| | Long Futures Contracts | | | | |
| | Soybean Meal | | | 100 | % |
|
Enhanced Strategy AB141 on the S&P GSCI Sugar Excess Return Index | |
| | Long Futures Contracts | | | | |
| | Sugar | | | 100 | % |
|
S&P GSCI Gold Index Excess Return | |
| | Long Futures Contracts | | | | |
| | Gold | | | 100 | % |
See accompanying Notes to Consolidated Financial Statements which are an integral part of the financial statements.
13 Invesco Macro Allocation Strategy Fund
Consolidated Statement of Assets and Liabilities
October 31, 2017
| | | | |
Assets: | | | | |
Investments in securities, at value (Cost $12,920,802) | | $ | 12,927,725 | |
Investments in affiliated money market funds, at value and cost | | | 30,002,852 | |
Other investments: | | | | |
Variation margin receivable — futures contracts | | | 66,702 | |
Swaps receivable — OTC | | | 525 | |
Unrealized appreciation on swap agreements — OTC | | | 14,321 | |
Deposits with brokers: | | | | |
Cash collateral — OTC derivatives | | | 40,000 | |
Receivable for: | | | | |
Fund shares sold | | | 218,857 | |
Dividends and interest | | | 25,128 | |
Investment for trustee deferred compensation and retirement plans | | | 15,812 | |
Other assets | | | 52,144 | |
Total assets | | | 43,364,066 | |
| |
Liabilities: | | | | |
Other investments: | | | | |
Swaps payable — OTC | | | 31,618 | |
Unrealized depreciation on swap agreements — OTC | | | 43,233 | |
Payable for: | | | | |
Fund shares reacquired | | | 53,854 | |
Accrued fees to affiliates | | | 33,712 | |
Accrued trustees’ and officers’ fees and benefits | | | 1,897 | |
Accrued other operating expenses | | | 74,747 | |
Trustee deferred compensation and retirement plans | | | 16,830 | |
Total liabilities | | | 255,891 | |
Net assets applicable to shares outstanding | | $ | 43,108,175 | |
| |
Net assets consist of: | | | | |
Shares of beneficial interest | | $ | 41,620,027 | |
Undistributed net investment income (loss) | | | 13,744 | |
Undistributed net realized gain | | | 134,816 | |
Net unrealized appreciation | | | 1,339,588 | |
| | | $ | 43,108,175 | |
| | | | |
Net Assets: | | | | |
Class A | | $ | 4,645,126 | |
Class C | | $ | 7,398,210 | |
Class R | | $ | 54,012 | |
Class Y | | $ | 30,656,751 | |
Class R5 | | $ | 9,186 | |
Class R6 | | $ | 344,890 | |
|
Shares outstanding, no par value,
with an unlimited number of shares authorized: | |
Class A | | | 483,721 | |
Class C | | | 773,250 | |
Class R | | | 5,620 | |
Class Y | | | 3,179,841 | |
Class R5 | | | 952 | |
Class R6 | | | 35,804 | |
Class A: | | | | |
Net asset value per share | | $ | 9.60 | |
Maximum offering price per share | | | | |
(Net asset value of $9.60 ¸ 94.50%) | | $ | 10.16 | |
Class C: | | | | |
Net asset value and offering price per share | | $ | 9.57 | |
Class R: | | | | |
Net asset value and offering price per share | | $ | 9.61 | |
Class Y: | | | | |
Net asset value and offering price per share | | $ | 9.64 | |
Class R5: | | | | |
Net asset value and offering price per share | | $ | 9.65 | |
Class R6: | | | | |
Net asset value and offering price per share | | $ | 9.63 | |
See accompanying Notes to Consolidated Financial Statements which are an integral part of the financial statements.
14 Invesco Macro Allocation Strategy Fund
Consolidated Statement of Operations
For the year ended October 31, 2017
| | | | |
Investment income: | | | | |
Dividends from affiliated money market funds | | $ | 196,254 | |
Interest | | | 127,542 | |
Total investment income | | | 323,796 | |
| |
Expenses: | | | | |
Advisory fees | | | 508,419 | |
Administrative services fees | | | 50,000 | |
Custodian fees | | | 8,686 | |
Distribution fees: | | | | |
Class A | | | 12,858 | |
Class C | | | 70,988 | |
Class R | | | 238 | |
Transfer agent fees — A, C, R and Y | | | 50,382 | |
Transfer agent fees — R5 | | | 4 | |
Transfer agent fees — R6 | | | 131 | |
Trustees’ and officers’ fees and benefits | | | 20,398 | |
Registration and filing fees | | | 115,195 | |
Reports to shareholders | | | 30,705 | |
Professional services fees | | | 81,622 | |
Other | | | 16,400 | |
Total expenses | | | 966,026 | |
Less: Fees waived and expenses reimbursed | | | (383,109 | ) |
Net expenses | | | 582,917 | |
Net investment income (loss) | | | (259,121 | ) |
| |
Realized and unrealized gain (loss) from: | | | | |
Net realized gain (loss) from: | | | | |
Investment securities | | | 22,167 | |
Foreign currencies | | | (55,635 | ) |
Futures contracts | | | 2,394,862 | |
Swap agreements | | | (171,603 | ) |
| | | | 2,189,791 | |
Change in net unrealized appreciation (depreciation) of: | | | | |
Investment securities | | | (15,347 | ) |
Futures contracts | | | 1,079,946 | |
Swap agreements | | | 3,442 | |
| | | | 1,068,041 | |
Net realized and unrealized gain | | | 3,257,832 | |
Net increase in net assets resulting from operations | | $ | 2,998,711 | |
See accompanying Notes to Consolidated Financial Statements which are an integral part of the financial statements.
15 Invesco Macro Allocation Strategy Fund
Consolidated Statement of Changes in Net Assets
For the years ended October 31, 2017 and 2016
| | | | | | | | |
| | | 2017 | | | 2016 | |
Operations: | | | | | | | | |
Net investment income (loss) | | $ | (259,121 | ) | | $ | (955,375 | ) |
Net realized gain | | | 2,189,791 | | | | 11,224,512 | |
Change in net unrealized appreciation (depreciation) | | | 1,068,041 | | | | (3,205,189 | ) |
Net increase in net assets resulting from operations | | | 2,998,711 | | | | 7,063,948 | |
| | |
Distributions to shareholders from net investment income: | | | | | | | | |
Class A | | | (772,744 | ) | | | (166,666 | ) |
Class C | | | (831,705 | ) | | | (98,610 | ) |
Class R | | | (5,116 | ) | | | (476 | ) |
Class Y | | | (4,694,776 | ) | | | (1,082,051 | ) |
Class R5 | | | (1,244 | ) | | | (236 | ) |
Class R6 | | | (30,239 | ) | | | (2,605,719 | ) |
Total distributions from net investment income | | | (6,335,824 | ) | | | (3,953,758 | ) |
| | |
Share transactions–net: | | | | | | | | |
Class A | | | (789,636 | ) | | | (1,863,678 | ) |
Class C | | | 283,439 | | | | (1,087,693 | ) |
Class R | | | 14,526 | | | | 15,171 | |
Class Y | | | (4,893,657 | ) | | | (11,607,532 | ) |
Class R6 | | | 121,068 | | | | (100,961,921 | ) |
Net increase (decrease) in net assets resulting from share transactions | | | (5,264,260 | ) | | | (115,505,653 | ) |
Net increase (decrease) in net assets | | | (8,601,373 | ) | | | (112,395,463 | ) |
| | |
Net assets: | | | | | | | | |
Beginning of year | | | 51,709,548 | | | | 164,105,011 | |
End of year (includes undistributed net investment income (loss) of $13,744 and $6,320,075, respectively) | | $ | 43,108,175 | | | $ | 51,709,548 | |
Notes to Consolidated Financial Statements
October 31, 2017
NOTE 1—Significant Accounting Policies
Invesco Macro Allocation Strategy Fund (the “Fund”) is a series portfolio of AIM Investment Funds (Invesco Investment Funds) (the “Trust”). The Trust is organized as a Delaware statutory trust and is registered under the Investment Company Act of 1940, as amended (the “1940 Act”), as an open-end series management investment company consisting of twenty separate series portfolios, each authorized to issue an unlimited number of shares of beneficial interest. The assets, liabilities and operations of each portfolio are accounted for separately. Information presented in these consolidated financial statements pertains only to the Fund. Matters affecting each portfolio or class will be voted on exclusively by the shareholders of such portfolio or class.
The Fund will seek to gain exposure to the commodity markets primarily through investments in the Invesco Cayman Commodity Fund V Ltd. (the “Subsidiary”), a wholly-owned subsidiary of the Fund organized under the laws of the Cayman Islands. The Subsidiary was organized by the Fund to invest in commodity-linked derivatives and other securities that may provide leveraged and non-leveraged exposure to commodities. The Fund may invest up to 25% of its total assets in the Subsidiary.
The Fund’s investment objective is to seek a positive absolute return over a complete economic and market cycle.
The Fund currently consists of six different classes of shares: Class A, Class C, Class R, Class Y, Class R5 and Class R6. Class Y shares are available only to certain investors. Class A shares are sold with a front-end sales charge unless certain waiver criteria are met and under certain circumstances load waiver shares may be subject to contingent deferred sales charges (“CDSC”). Class C shares are sold with a CDSC. Class R, Class Y, Class R5 and Class R6 shares are sold at net asset value.
The Fund is an investment company and accordingly follows the investment company accounting and reporting guidance in accordance with Financial Accounting Standards Board Accounting Standards Codification Topic 946, Financial Services — Investment Companies.
The following is a summary of the significant accounting policies followed by the Fund in the preparation of its consolidated financial statements.
| A. | Security Valuations — Securities, including restricted securities, are valued according to the following policy. |
Debt obligations (including convertible securities) and unlisted equities are fair valued using an evaluated quote provided by an independent pricing service. Evaluated quotes provided by the pricing service may be determined without exclusive reliance on quoted prices, and may reflect appropriate factors such as institution-size trading in similar groups of securities, developments related to specific securities, dividend rate (for unlisted equities), yield (for debt obligations), quality, type of issue, coupon rate (for debt obligations), maturity (for debt obligations), individual
16 Invesco Macro Allocation Strategy Fund
trading characteristics and other market data. Pricing services generally value debt obligations assuming orderly transactions of institutional round lot size, but a fund may hold or transact in the same securities in smaller, odd lot sizes. Odd lots often trade at lower prices than institutional round lots. Debt obligations are subject to interest rate and credit risks. In addition, all debt obligations involve some risk of default with respect to interest and/or principal payments.
A security listed or traded on an exchange (except convertible securities) is valued at its last sales price or official closing price as of the close of the customary trading session on the exchange where the security is principally traded, or lacking any sales or official closing price on a particular day, the security may be valued at the closing bid price on that day. Securities traded in the over-the-counter market are valued based on prices furnished by independent pricing services or market makers. When such securities are valued by an independent pricing service they may be considered fair valued. Futures contracts are valued at the final settlement price set by an exchange on which they are principally traded. Listed options are valued at the mean between the last bid and asked prices from the exchange on which they are principally traded. Options not listed on an exchange are valued by an independent source at the mean between the last bid and asked prices. For purposes of determining net asset value (“NAV”) per share, futures and option contracts generally are valued 15 minutes after the close of the customary trading session of the New York Stock Exchange (“NYSE”).
Investments in open-end and closed-end registered investment companies that do not trade on an exchange are valued at the end-of-day net asset value per share. Investments in open-end and closed-end registered investment companies that trade on an exchange are valued at the last sales price or official closing price as of the close of the customary trading session on the exchange where the security is principally traded.
Swap agreements are fair valued using an evaluated quote, if available, provided by an independent pricing service. Evaluated quotes provided by the pricing service are valued based on a model which may include end-of-day net present values, spreads, ratings, industry, company performance and returns of referenced assets. Centrally cleared swap agreements are valued at the daily settlement price determined by the relevant exchange or clearinghouse.
Foreign securities’ (including foreign exchange contracts) prices are converted into U.S. dollar amounts using the applicable exchange rates as of the close of the NYSE. If market quotations are available and reliable for foreign exchange-traded equity securities, the securities will be valued at the market quotations. Because trading hours for certain foreign securities end before the close of the NYSE, closing market quotations may become unreliable. If between the time trading ends on a particular security and the close of the customary trading session on the NYSE, events occur that the investment adviser determines are significant and make the closing price unreliable, the Fund may fair value the security. If the event is likely to have affected the closing price of the security, the security will be valued at fair value in good faith using procedures approved by the Board of Trustees. Adjustments to closing prices to reflect fair value may also be based on a screening process of an independent pricing service to indicate the degree of certainty, based on historical data, that the closing price in the principal market where a foreign security trades is not the current value as of the close of the NYSE. Foreign securities’ prices meeting the approved degree of certainty that the price is not reflective of current value will be priced at the indication of fair value from the independent pricing service. Multiple factors may be considered by the independent pricing service in determining adjustments to reflect fair value and may include information relating to sector indices, American Depositary Receipts and domestic and foreign index futures. Foreign securities may have additional risks including exchange rate changes, potential for sharply devalued currencies and high inflation, political and economic upheaval, the relative lack of issuer information, relatively low market liquidity and the potential lack of strict financial and accounting controls and standards.
Securities for which market prices are not provided by any of the above methods may be valued based upon quotes furnished by independent sources. The last bid price may be used to value equity securities. The mean between the last bid and asked prices is used to value debt obligations, including corporate loans.
Securities for which market quotations are not readily available or became unreliable are valued at fair value as determined in good faith by or under the supervision of the Trust’s officers following procedures approved by the Board of Trustees. Issuer specific events, market trends, bid/asked quotes of brokers and information providers and other market data may be reviewed in the course of making a good faith determination of a security’s fair value.
The Fund may invest in securities that are subject to interest rate risk, meaning the risk that the prices will generally fall as interest rates rise and, conversely, the prices will generally rise as interest rates fall. Specific securities differ in their sensitivity to changes in interest rates depending on their individual characteristics. Changes in interest rates may result in increased market volatility, which may affect the value and/or liquidity of certain Fund investments.
Valuations change in response to many factors including the historical and prospective earnings of the issuer, the value of the issuer’s assets, general economic conditions, interest rates, investor perceptions and market liquidity. Because of the inherent uncertainties of valuation, the values reflected in the consolidated financial statements may materially differ from the value received upon actual sale of those investments.
| B. | Securities Transactions and Investment Income — Securities transactions are accounted for on a trade date basis. Realized gains or losses on sales are computed on the basis of specific identification of the securities sold. Interest income (net of withholding tax, if any) is recorded on the accrual basis from settlement date. Bond premiums and discounts are amortized and/or accreted over the lives of the respective securities. Pay-in-kind income received in the form of securities in-lieu of cash is recorded as interest income. Dividend income (net of withholding tax, if any) is recorded on the ex-dividend date. |
The Fund may periodically participate in litigation related to Fund investments. As such, the Fund may receive proceeds from litigation settlements. Any proceeds received are included in the Consolidated Statement of Operations as realized gain (loss) for investments no longer held and as unrealized gain (loss) for investments still held.
Brokerage commissions and mark ups are considered transaction costs and are recorded as an increase to the cost basis of securities purchased and/or a reduction of proceeds on a sale of securities. Such transaction costs are included in the determination of net realized and unrealized gain (loss) from investment securities reported in the Consolidated Statement of Operations and the Consolidated Statement of Changes in Net Assets and the net realized and unrealized gains (losses) on securities per share in the Financial Highlights. Transaction costs are included in the calculation of the Fund’s net asset value and, accordingly, they reduce the Fund’s total returns. These transaction costs are not considered operating expenses and are not reflected in net investment income reported in the Consolidated Statement of Operations and the Consolidated Statement of Changes in Net Assets, or the net investment income per share and the ratios of expenses and net investment income reported in the Financial Highlights, nor are they limited by any expense limitation arrangements between the Fund and the investment adviser.
The Fund allocates income and realized and unrealized capital gains and losses to a class based on the relative net assets of each class.
17 �� Invesco Macro Allocation Strategy Fund
| C. | Country Determination — For the purposes of making investment selection decisions and presentation in the Consolidated Schedule of Investments, the investment adviser may determine the country in which an issuer is located and/or credit risk exposure based on various factors. These factors include the laws of the country under which the issuer is organized, where the issuer maintains a principal office, the country in which the issuer derives 50% or more of its total revenues and the country that has the primary market for the issuer’s securities, as well as other criteria. Among the other criteria that may be evaluated for making this determination are the country in which the issuer maintains 50% or more of its assets, the type of security, financial guarantees and enhancements, the nature of the collateral and the sponsor organization. Country of issuer and/or credit risk exposure has been determined to be the United States of America, unless otherwise noted. |
| D. | Distributions — Distributions from net investment income and net realized capital gain, if any, are generally declared and paid annually and recorded on the ex-dividend date. The Fund may elect to treat a portion of the proceeds from redemptions as distributions for federal income tax purposes. |
| E. | Federal Income Taxes — The Fund intends to comply with the requirements of Subchapter M of the Internal Revenue Code of 1986, as amended (the “Internal Revenue Code”), necessary to qualify as a regulated investment company and to distribute substantially all of the Fund’s taxable earnings to shareholders. As such, the Fund will not be subject to federal income taxes on otherwise taxable income (including net realized capital gain) that is distributed to shareholders. Therefore, no provision for federal income taxes is recorded in the consolidated financial statements. |
The Fund recognizes the tax benefits of uncertain tax positions only when the position is more likely than not to be sustained. Management has analyzed the Fund’s uncertain tax positions and concluded that no liability for unrecognized tax benefits should be recorded related to uncertain tax positions. Management is not aware of any tax positions for which it is reasonably possible that the total amounts of unrecognized tax benefits will change materially in the next 12 months.
The Subsidiary is classified as a controlled foreign corporation under Subchapter N of the Internal Revenue Code. Therefore, the Fund is required to increase its taxable income by its share of the Subsidiary’s income. Net investment losses of the Subsidiary cannot be deducted by the Fund in the current period nor carried forward to offset taxable income in future periods.
The Fund files tax returns in the U.S. Federal jurisdiction and certain other jurisdictions. Generally the Fund is subject to examinations by such taxing authorities for up to three years after the filing of the return for the tax period.
| F. | Expenses — Fees provided for under the Rule 12b-1 plan of a particular class of the Fund are charged to the operations of such class. Transfer agency fees and expenses and other shareholder recordkeeping fees and expenses attributable to Class R5 and Class R6 are allocated to each share class based on relative net assets. Sub-accounting fees attributable to Class R5 are charged to the operations of the class. Transfer agency fees and expenses and other shareholder recordkeeping fees and expenses relating to all other classes are allocated among those classes based on relative net assets. All other expenses are allocated among the classes based on relative net assets. |
| G. | Accounting Estimates — The financial statements are prepared on a consolidated basis in conformity with accounting principles generally accepted in the United States of America (“GAAP”), which requires management to make estimates and assumptions that affect the reported amounts of assets and liabilities at the date of the financial statements and the reported amounts of revenues and expenses during the reporting period including estimates and assumptions related to taxation. Actual results could differ from those estimates by a significant amount. The accompanying financial statements reflect the financial position of the Fund and its Subsidiary and the results of operations on a consolidated basis. All inter-company accounts and transactions have been eliminated in consolidation. |
In addition, the Fund monitors for material events or transactions that may occur or become known after the period-end date and before the date the consolidated financial statements are released to print.
| H. | Indemnifications — Under the Trust’s organizational documents, each Trustee, officer, employee or other agent of the Trust, and under the Subsidiary’s organizational documents, the directors and officers of the Subsidiary, are indemnified against certain liabilities that may arise out of the performance of their duties to the Fund and/or the Subsidiary, respectively. Additionally, in the normal course of business, the Fund enters into contracts, including the Fund’s servicing agreements, that contain a variety of indemnification clauses. The Fund’s maximum exposure under these arrangements is unknown as this would involve future claims that may be made against the Fund that have not yet occurred. The risk of material loss as a result of such indemnification claims is considered remote. |
| I. | Structured Securities — The Fund may invest in structured securities. Structured securities are a type of derivative security whose value is determined by reference to changes in the value of underlying securities, currencies, interest rates, commodities, indices or other financial indicators (“reference instruments”). Most structured securities are fixed-income securities that have maturities of three years or less. Structured securities may be positively or negatively indexed (i.e., their principal value or interest rates may increase or decrease if the underlying reference instrument appreciates) and may have return characteristics similar to direct investments in the underlying reference instrument. |
Structured securities may entail a greater degree of market risk than other types of debt securities because the investor bears the risk of the reference instruments. In addition to the credit risk of structured securities and the normal risks of price changes in response to changes in interest rates, the principal amount of structured notes or indexed securities may decrease as a result of changes in the value of the underlying reference instruments. Changes in the daily value of structured securities are recorded as unrealized gains (losses) in the Consolidated Statement of Operations. When the structured securities mature or are sold, the Fund recognizes a realized gain (loss) on the Consolidated Statement of Operations.
| J. | Foreign Currency Translations — Foreign currency is valued at the close of the NYSE based on quotations posted by banks and major currency dealers. Portfolio securities and other assets and liabilities denominated in foreign currencies are translated into U.S. dollar amounts at date of valuation. Purchases and sales of portfolio securities (net of foreign taxes withheld on disposition) and income items denominated in foreign currencies are translated into U.S. dollar amounts on the respective dates of such transactions. The Fund does not separately account for the portion of the results of operations resulting from changes in foreign exchange rates on investments and the fluctuations arising from changes in market prices of securities held. The combined results of changes in foreign exchange rates and the fluctuation of market prices on investments (net of estimated foreign tax withholding) are included with the net realized and unrealized gain or loss from investments in the Consolidated Statement of Operations. Reported net realized foreign currency gains or losses arise from (1) sales of foreign currencies, (2) currency gains or losses realized between the trade and settlement dates on securities transactions, and (3) the difference between the amounts of dividends, interest, and foreign withholding taxes recorded on the Fund’s books and the U.S. dollar equivalent of the amounts actually |
18 Invesco Macro Allocation Strategy Fund
| | received or paid. Net unrealized foreign currency gains and losses arise from changes in the fair values of assets and liabilities, other than investments in securities at fiscal period end, resulting from changes in exchange rates. |
The Fund may invest in foreign securities, which may be subject to foreign taxes on income, gains on investments or currency repatriation, a portion of which may be recoverable. Foreign taxes, if any, are recorded based on the tax regulations and rates that exist in the foreign markets in which the Fund invests and are shown in the Consolidated Statement of Operations.
| K. | Forward Foreign Currency Contracts — The Fund may engage in foreign currency transactions either on a spot (i.e. for prompt delivery and settlement) basis, or through forward foreign currency contracts, to manage or minimize currency or exchange rate risk. |
The Fund may also enter into forward foreign currency contracts for the purchase or sale of a security denominated in a foreign currency in order to “lock in” the U.S. dollar price of that security, or the Fund may also enter into forward foreign currency contracts that do not provide for physical settlement of the two currencies, but instead are settled by a single cash payment calculated as the difference between the agreed upon exchange rate and the spot rate at settlement based upon an agreed upon notional amount (non-deliverable forwards). The Fund will set aside liquid assets in an amount equal to the daily mark-to-market obligation for forward foreign currency contracts.
A forward foreign currency contract is an obligation between two parties (“Counterparties”) to purchase or sell a specific currency for an agreed-upon price at a future date. The use of forward foreign currency contracts does not eliminate fluctuations in the price of the underlying securities the Fund owns or intends to acquire but establishes a rate of exchange in advance. Fluctuations in the value of these contracts are measured by the difference in the contract date and reporting date exchange rates and are recorded as unrealized appreciation (depreciation) until the contracts are closed. When the contracts are closed, realized gains (losses) are recorded. Realized and unrealized gains (losses) on the contracts are included in the Consolidated Statement of Operations. The primary risks associated with forward foreign currency contracts include failure of the Counterparty to meet the terms of the contract and the value of the foreign currency changing unfavorably. These risks may be in excess of the amounts reflected in the Consolidated Statement of Assets and Liabilities.
| L. | Futures Contracts — The Fund may enter into futures contracts to equitize the Fund’s cash holdings or to manage exposure to interest rate, equity and market price movements and/or currency risks. A futures contract is an agreement between Counterparties to purchase or sell a specified underlying security, currency or commodity (or delivery of a cash settlement price, in the case of an index future) for a fixed price at a future date. The Fund currently invests only in exchange-traded futures and they are standardized as to maturity date and underlying financial instrument. Initial margin deposits required upon entering into futures contracts are satisfied by the segregation of specific securities or cash as collateral at the futures commission merchant (broker). During the period the futures contracts are open, changes in the value of the contracts are recognized as unrealized gains or losses by recalculating the value of the contracts on a daily basis. Subsequent or variation margin payments are received or made depending upon whether unrealized gains or losses are incurred. These amounts are reflected as receivables or payables on the Consolidated Statement of Assets and Liabilities. When the contracts are closed or expire, the Fund recognizes a realized gain or loss equal to the difference between the proceeds from, or cost of, the closing transaction and the Fund’s basis in the contract. The net realized gain (loss) and the change in unrealized gain (loss) on futures contracts held during the period is included on the Consolidated Statement of Operations. The primary risks associated with futures contracts are market risk and the absence of a liquid secondary market. If the Fund were unable to liquidate a futures contract and/or enter into an offsetting closing transaction, the Fund would continue to be subject to market risk with respect to the value of the contracts and continue to be required to maintain the margin deposits on the futures contracts. Futures contracts have minimal Counterparty risk since the exchange’s clearinghouse, as Counterparty to all exchange-traded futures, guarantees the futures against default. Risks may exceed amounts recognized in the Consolidated Statement of Assets and Liabilities. |
| M. | Swap Agreements — The Fund may enter into various swap transactions, including interest rate, total return, index, currency and credit default swap contracts (“CDS”) for investment purposes or to manage interest rate, currency or credit risk. Such transactions are agreements between Counterparties. These agreements may contain among other conditions, events of default and termination events, and various covenants and representations such as provisions that require the Fund to maintain a pre-determined level of net assets, and/or provide limits regarding the decline of the Fund’s NAV over specific periods of time. If the Fund were to trigger such provisions and have open derivative positions at that time, the Counterparty may be able to terminate such agreement and request immediate payment in an amount equal to the net liability positions, if any. |
Interest rate, total return, index, and currency swap agreements are two-party contracts entered into primarily to exchange the returns (or differentials in rates of returns) earned or realized on particular predetermined investments or instruments. The gross returns to be exchanged or “swapped” between the parties are calculated with respect to a notional amount, i.e., the return on or increase in value of a particular dollar amount invested at a particular interest rate or return of an underlying asset, in a particular foreign currency, or in a “basket” of securities representing a particular index. At the maturity date, a net cash flow is exchanged where the total return is equivalent to the return of the underlying reference less a financing rate, if any. As a receiver, the Fund would receive payments based on any positive total return and would owe payments in the event of a negative total return. As the payer, the Fund would owe payments on any net positive total return, and would receive payment in the event of a negative total return.
Changes in the value of swap agreements are recognized as unrealized gains (losses) in the Consolidated Statement of Operations by “marking to market” on a daily basis to reflect the value of the swap agreement at the end of each trading day. Payments received or paid at the beginning of the agreement are reflected as such on the Consolidated Statement of Assets and Liabilities and may be referred to as upfront payments. The Fund accrues for the fixed payment stream and amortizes upfront payments, if any, on swap agreements on a daily basis with the net amount, recorded as a component of realized gain (loss) on the Consolidated Statement of Operations. A liquidation payment received or made at the termination of a swap agreement is recorded as realized gain (loss) on the Consolidated Statement of Operations. The Fund segregates cash or liquid securities having a value at least equal to the amount of the potential obligation of a Fund under any swap transaction. Cash held as collateral is recorded as deposits with brokers on the Consolidated Statement of Assets and Liabilities. Entering into these agreements involves, to varying degrees, lack of liquidity and elements of credit, market, and Counterparty risk in excess of amounts recognized on the Consolidated Statement of Assets and Liabilities. Such risks involve the possibility that a swap is difficult to sell or liquidate; the Counterparty does not honor its obligations under the agreement and unfavorable interest rates and market fluctuations. It is possible that developments in the swaps market, including potential government regulation, could adversely affect the Fund’s ability to terminate existing swap agreements or to realize amounts to be received under such agreements. A short position in a security poses more risk than holding the same security long. As there is no limit on how much the price of the security can increase, the Fund’s exposure is unlimited.
19 Invesco Macro Allocation Strategy Fund
| N. | Other Risks — The Fund will seek to gain exposure to commodity markets primarily through an investment in the Subsidiary and through investments in exchange-traded funds and commodity-linked derivatives. The Subsidiary, unlike the Fund, may invest without limitation in commodities, commodity-linked derivatives and other securities, such as exchange-traded and commodity-linked notes, that may provide leveraged and non-leveraged exposure to commodity markets. The Fund is indirectly exposed to the risks associated with the Subsidiary’s investments. |
| O. | Leverage Risk — Leverage exists when the Fund can lose more than it originally invests because it purchases or sells an instrument or enters into a transaction without investing an amount equal to the full economic exposure of the instrument or transaction. |
| P. | Collateral — To the extent the Fund has designated or segregated a security as collateral and that security is subsequently sold, it is the Fund’s practice to replace such collateral no later than the next business day. |
NOTE 2—Advisory Fees and Other Fees Paid to Affiliates
The Trust has entered into a master investment advisory agreement with Invesco Advisers, Inc. (the “Adviser” or “Invesco”). Effective January 1, 2017, under the terms of the investment advisory agreement, the Fund accrues daily and pays monthly an advisory fee to the Adviser less the amount paid by the Subsidiary to the Adviser based on the annual rate of the Fund’s average daily net assets as follows:
| | | | |
| Average Daily Net Assets | | Rate | |
First $250 million | | | 1.10% | |
Next $250 million | | | 1.08% | |
Next $500 million | | | 1.05% | |
Next $1.5 billion | | | 1.03% | |
Next $2.5 billion | | | 1.00% | |
Next $2.5 billion | | | 0.98% | |
Next $2.5 billion | | | 0.95% | |
Over $10 billion | | | 0.93% | |
Prior to January 1, 2017, the Fund paid an advisory fee to the Adviser based on the annual rate of the Fund’s average daily net assets as follows:
| | | | |
| Average Daily Net Assets | | Rate | |
First $10 billion | | | 1.50% | |
Over $10 billion | | | 1.25% | |
For the year ended October 31, 2017, the effective advisory fees incurred by the Fund was 1.18%.
The Subsidiary has entered into a separate contract with the Adviser whereby the Adviser provides investment advisory and other services to the Subsidiary. In consideration of these services, the Subsidiary pays an advisory fee to the Adviser based on the annual rate of the Subsidiary’s average daily net assets as set forth in the table above.
Under the terms of a master sub-advisory agreement between the Adviser and each of Invesco Asset Management Deutschland GmbH, Invesco Asset Management Limited, Invesco Asset Management (Japan) Limited, Invesco Hong Kong Limited, Invesco Senior Secured Management, Inc. and Invesco Canada Ltd. and separate sub-advisory agreements with Invesco PowerShares Capital Management LLC and Invesco Asset Management (India) Private Limited (collectively, the “Affiliated Sub-Advisers”) the Adviser, not the Fund, will pay 40% of the fees paid to the Adviser to any such Affiliated Sub-Adviser(s) that provide(s) discretionary investment management services to the Fund based on the percentage of assets allocated to such Affiliated Sub-Adviser(s).
Effective January 1, 2017, the Adviser has contractually agreed, through at least February 28, 2019, to waive advisory fees and/or reimburse expenses to the extent necessary to limit total annual fund operating expenses after fee waiver and/or expense reimbursement (excluding certain items discussed below) of Class A, Class C, Class R, Class Y, Class R5 and Class R6 shares to 1.44%, 2.19%, 1.69%, 1.19%, 1.19% and 1.19%, respectively, of average daily net assets (the “expense limits”). Prior to January 1, 2017, the Adviser had contractually agreed to waive advisory fees and/or reimburse expenses to the extent necessary to limit total annual fund operating expenses after fee waiver and/or expense reimbursement (excluding certain items discussed below) of Class A, Class C, Class R, Class Y, Class R5 and Class R6 shares to 1.65%, 2.40%, 1.90%, 1.40%, 1.40% and 1.40%, respectively, of the Fund’s average daily net assets. In determining the Adviser’s obligation to waive advisory fees and/or reimburse expenses, the following expenses are not taken into account, and could cause total annual fund operating expenses after fee waiver and/or expense reimbursement to exceed the numbers reflected above: (1) interest; (2) taxes; (3) dividend expense on short sales; (4) extraordinary or non-routine items, including litigation expenses; and (5) expenses that the Fund has incurred but did not actually pay because of an expense offset arrangement. Acquired Fund Fees and Expenses are not operating expenses of a Fund directly, but are fees and expenses, including management fees, of the investment companies in which a Fund invests. As a result, the total annual fund operating expenses after expense reimbursement may exceed the expense limits above. Unless Invesco continues the fee waiver agreement, it will terminate on February 28, 2019. During its term, the fee waiver agreement cannot be terminated or amended to increase the expense limits or reduce the advisory fee waiver without approval of the Board of Trustees.
Further, the Adviser has contractually agreed, through at least June 30, 2019, to waive the advisory fee payable by the Fund in an amount equal to 100% of the net advisory fees the Adviser receives from the affiliated money market funds on investments by the Fund of uninvested cash in such affiliated money market funds.
For the year ended October 31, 2017, the Adviser waived advisory fees of $332,592 and reimbursed class level expenses of $6,053, $8,354, $56, $35,919, $4 and $131 of Class A, Class C, Class R, Class Y, Class R5 and Class R6 shares, respectively.
The Trust has entered into a master administrative services agreement with Invesco pursuant to which the Fund has agreed to pay Invesco for certain administrative costs incurred in providing accounting services to the Fund. For the year ended October 31, 2017, expenses incurred under the agreement are shown in the Consolidated Statement of Operations as Administrative services fees.
20 Invesco Macro Allocation Strategy Fund
The Trust has entered into a transfer agency and service agreement with Invesco Investment Services, Inc. (“IIS”) pursuant to which the Fund has agreed to pay IIS a fee for providing transfer agency and shareholder services to the Fund and reimburse IIS for certain expenses incurred by IIS in the course of providing such services. IIS may make payments to intermediaries that provide omnibus account services, sub-accounting services and/or networking services. All fees payable by IIS to intermediaries that provide omnibus account services or sub-accounting services are charged back to the Fund, subject to certain limitations approved by the Trust’s Board of Trustees. For the year ended October 31, 2017, expenses incurred under the agreement are shown in the Consolidated Statement of Operations as Transfer agent fees.
The Trust has entered into master distribution agreements with Invesco Distributors, Inc. (“IDI”) to serve as the distributor for the Class A, Class C, Class R, Class Y, Class R5 and Class R6 shares of the Fund. The Trust has adopted plans pursuant to Rule 12b-1 under the 1940 Act with respect to the Fund’s Class A, Class C and Class R shares (collectively, the “Plans”). The Fund, pursuant to the Plans, pays IDI compensation at the annual rate of 0.25% of the Fund’s average daily net assets of Class A shares, 1.00% of the average daily net assets of Class C shares and 0.50% of the average daily net assets of Class R shares. The fees are accrued daily and paid monthly. Of the Plan payments, up to 0.25% of the average daily net assets of each class of shares may be paid to furnish continuing personal shareholder services to customers who purchase and own shares of such classes. Any amounts not paid as a service fee under the Plans would constitute an asset-based sales charge. Rules of the Financial Industry Regulatory Authority (“FINRA”) impose a cap on the total sales charges, including asset-based sales charges, that may be paid by any class of shares of the Fund. For the year ended October 31, 2017, expenses incurred under the Plans are shown in the Consolidated Statement of Operations as Distribution fees.
Front-end sales commissions and CDSC (collectively, the “sales charges”) are not recorded as expenses of the Fund. Front-end sales commissions are deducted from proceeds from the sales of Fund shares prior to investment in Class A shares of the Fund. CDSC are deducted from redemption proceeds prior to remittance to the shareholder. During the year ended October 31, 2017, IDI advised the Fund that IDI retained $893 in front-end sales commissions from the sale of Class A shares and $174 from Class C shares, for CDSC imposed upon redemptions by shareholders.
Certain officers and trustees of the Trust are officers and directors of the Adviser, IIS and/or IDI.
NOTE 3—Additional Valuation Information
GAAP defines fair value as the price that would be received to sell an asset or paid to transfer a liability in an orderly transaction between market participants at the measurement date, under current market conditions. GAAP establishes a hierarchy that prioritizes the inputs to valuation methods, giving the highest priority to readily available unadjusted quoted prices in an active market for identical assets (Level 1) and the lowest priority to significant unobservable inputs (Level 3), generally when market prices are not readily available or are unreliable. Based on the valuation inputs, the securities or other investments are tiered into one of three levels. Changes in valuation methods may result in transfers in or out of an investment’s assigned level:
| | Level 1 — | Prices are determined using quoted prices in an active market for identical assets. |
| | Level 2 — | Prices are determined using other significant observable inputs. Observable inputs are inputs that other market participants may use in pricing a security. These may include quoted prices for similar securities, interest rates, prepayment speeds, credit risk, yield curves, loss severities, default rates, discount rates, volatilities and others. |
| | Level 3 — | Prices are determined using significant unobservable inputs. In situations where quoted prices or observable inputs are unavailable (for example, when there is little or no market activity for an investment at the end of the period), unobservable inputs may be used. Unobservable inputs reflect the Fund’s own assumptions about the factors market participants would use in determining fair value of the securities or instruments and would be based on the best available information. |
The following is a summary of the tiered valuation input levels, as of October 31, 2017. The level assigned to the securities valuations may not be an indication of the risk or liquidity associated with investing in those securities. Because of the inherent uncertainties of valuation, the values reflected in the consolidated financial statements may materially differ from the value received upon actual sale of those investments.
The Fund’s policy is to recognize transfers in and out of the valuation levels as of the end of the reporting period. During the year ended October 31, 2017, there were no material transfers between valuation levels.
| | | | | | | | | | | | | | | | |
| | | Level 1 | | | Level 2 | | | Level 3 | | | Total | |
U.S. Treasury Securities | | $ | — | | | $ | 12,927,725 | | | $ | — | | | $ | 12,927,725 | |
Money Market Funds | | | 30,002,852 | | | | — | | | | — | | | | 30,002,852 | |
| | | | 30,002,852 | | | | 12,927,725 | | | | — | | | | 42,930,577 | |
Futures Contracts* | | | 1,361,577 | | | | — | | | | — | | | | 1,361,577 | |
Swap Agreements* | | | — | | | | (28,912 | ) | | | — | | | | (28,912 | ) |
Total Investments | | $ | 31,364,429 | | | $ | 12,898,813 | | | $ | — | | | $ | 44,263,242 | |
| * | Unrealized appreciation (depreciation). |
NOTE 4—Derivative Investments
The Fund may enter into an International Swaps and Derivatives Association Master Agreement (“ISDA Master Agreement”) under which a Fund may trade OTC derivatives. An OTC transaction entered into under an ISDA Master Agreement typically involves a collateral posting arrangement, payment netting provisions and close-out netting provisions. These netting provisions allow for reduction of credit risk through netting of contractual obligations. The enforceability of the netting provisions of the ISDA Master Agreement depends on the governing law of the ISDA Master Agreement, among other factors.
For financial reporting purposes, the Fund does not offset OTC derivative assets or liabilities that are subject to ISDA Master Agreements in the Consolidated Statement of Assets and Liabilities.
21 Invesco Macro Allocation Strategy Fund
Value of Derivative Investments at Period-End
The table below summarizes the value of the Fund’s derivative investments, detailed by primary risk exposure, held as of October 31, 2017:
| | | | | | | | | | | | | | | | |
| | | Value | |
| Derivative Assets | | Commodity
Risk | | | Equity
Risk | | | Interest Rate
Risk | | | Total | |
Unrealized appreciation on futures contracts — Exchange-Traded(a) | | $ | 446,570 | | | $ | 1,011,018 | | | $ | 1,049 | | | $ | 1,458,637 | |
Unrealized appreciation on swap agreements — OTC | | | 14,321 | | | | — | | | | — | | | | 14,321 | |
Total Derivative Assets | | | 460,891 | | | | 1,011,018 | | | | 1,049 | | | | 1,472,958 | |
Derivatives not subject to master netting agreements | | | (446,570 | ) | | | (1,011,018 | ) | | | (1,049 | ) | | | (1,458,637 | ) |
Total Derivative Assets subject to master netting agreements | | $ | 14,321 | | | $ | — | | | $ | — | | | $ | 14,321 | |
| |
| | | Value | |
| Derivative Liabilities | | Commodity
Risk | | | Equity
Risk | | | Interest Rate
Risk | | | Total | |
Unrealized depreciation on futures contracts — Exchange-Traded(a) | | $ | (57,020 | ) | | $ | (2,040 | ) | | $ | (38,000 | ) | | $ | (97,060 | ) |
Unrealized depreciation on swap agreements — OTC | | | (43,233 | ) | | | — | | | | — | | | | (43,233 | ) |
Total Derivative Liabilities | | | (100,253 | ) | | | (2,040 | ) | | | (38,000 | ) | | | (140,293 | ) |
Derivatives not subject to master netting agreements | | | 57,020 | | | | 2,040 | | | | 38,000 | | | | 97,060 | |
Total Derivative Liabilities subject to master netting agreements | | $ | (43,233 | ) | | $ | — | | | $ | — | | | $ | (43,233 | ) |
| (a) | The daily variation margin receivable at period-end is recorded in the Consolidated Statement of Assets and Liabilities. |
Offsetting Assets and Liabilities
The table below reflects the Fund’s exposure to Counterparties subject to either an ISDA Master Agreement or other agreement for OTC derivative transactions as of October 31, 2017.
| | | | | | | | | | | | | | | | | | | | | | | | |
| | | Financial
Derivative Assets | | | Financial
Derivative Liabilities | | | | | | Collateral
(Received)/Pledged | | | | |
| Counterparty | | Swap
Agreements | | | Swap
Agreements | | | Net Value of
Derivatives | | | Non-Cash | | | Cash | | | Net
Amount(a) | |
Subsidiary | | | | | | | | | | | | | | | | | | | | | | | | |
Barclays Bank PLC | | $ | 6,604 | | | $ | (35,536 | ) | | $ | (28,932 | ) | | $ | — | | | $ | — | | | $ | (28,932 | ) |
Goldman Sachs International | | | 40 | | | | (3,875 | ) | | | (3,835 | ) | | | — | | | | — | | | | (3,835 | ) |
JPMorgan Chase Bank, N.A. | | | 35 | | | | (4,092 | ) | | | (4,057 | ) | | | — | | | | 4,057 | | | | — | |
Merrill Lynch International | | | 442 | | | | (31,212 | ) | | | (30,770 | ) | | | — | | | | 20,000 | | | | (10,770 | ) |
Morgan Stanley & Co. LLC | | | 7,725 | | | | (136 | ) | | | 7,589 | | | | — | | | | — | | | | 7,589 | |
Total | | $ | 14,846 | | | $ | (74,851 | ) | | $ | (60,005 | ) | | $ | — | | | $ | 24,057 | | | | (35,948 | ) |
| (a) | The Fund and the Subsidiary are recognized as separate legal entities and as such are subject to separate netting arrangements with the Counterparty. |
Effect of Derivative Investments for the year ended October 31, 2017
The table below summarizes the gains (losses) on derivative investments, detailed by primary risk exposure, recognized in earnings during the period:
| | | | | | | | | | | | | | | | |
| | | Location of Gain (Loss) on
Consolidated Statement of Operations | |
| | | Commodity
Risk | | | Equity
Risk | | | Interest Rate
Risk | | | Total | |
Realized Gain (Loss): | | | | | | | | | | | | | | | | |
Futures contracts | | $ | (1,184,298 | ) | | $ | 4,159,321 | | | $ | (580,161 | ) | | $ | 2,394,862 | |
Swap agreements | | | (171,603 | ) | | | — | | | | — | | | | (171,603 | ) |
Change in Net Unrealized Appreciation (Depreciation): | | | | | | | | | | | | | | | | |
Futures contracts | | | 196,282 | | | | 811,060 | | | | 72,604 | | | | 1,079,946 | |
Swap agreements | | | 3,442 | | | | — | | | | — | | | | 3,442 | |
Total | | $ | (1,156,177 | ) | | $ | 4,970,381 | | | $ | (507,557 | ) | | $ | 3,306,647 | |
The table below summarizes the average notional value of futures contracts and swap agreements outstanding during the period.
| | | | | | | | |
| | | Futures
Contracts | | | Swap
Agreements | |
Average notional value | | $ | 43,814,416 | | | $ | 5,222,302 | |
22 Invesco Macro Allocation Strategy Fund
NOTE 5—Trustees’ and Officers’ Fees and Benefits
Trustees’ and Officers’ Fees and Benefits include amounts accrued by the Fund to pay remuneration to certain Trustees and Officers of the Fund. Trustees have the option to defer compensation payable by the Fund, and Trustees’ and Officers’ Fees and Benefits also include amounts accrued by the Fund to fund such deferred compensation amounts. Those Trustees who defer compensation have the option to select various Invesco Funds in which their deferral accounts shall be deemed to be invested. Finally, certain current Trustees were eligible to participate in a retirement plan that provided for benefits to be paid upon retirement to Trustees over a period of time based on the number of years of service. The Fund may have certain former Trustees who also participate in a retirement plan and receive benefits under such plan. Trustees’ and Officers’ Fees and Benefits include amounts accrued by the Fund to fund such retirement benefits. Obligations under the deferred compensation and retirement plans represent unsecured claims against the general assets of the Fund.
NOTE 6—Cash Balances
The Fund is permitted to temporarily carry a negative or overdrawn balance in its account with State Street Bank and Trust Company, the custodian bank. Such balances, if any at period-end, are shown in the Consolidated Statement of Assets and Liabilities under the payable caption Amount due custodian. To compensate the custodian bank for such overdrafts, the overdrawn Fund may either (1) leave funds as a compensating balance in the account so the custodian bank can be compensated by earning the additional interest; or (2) compensate by paying the custodian bank at a rate agreed upon by the custodian bank and Invesco, not to exceed the contractually agreed upon rate.
NOTE 7—Distributions to Shareholders and Tax Components of Net Assets
Tax Character of Distributions to Shareholders Paid During the Fiscal Years Ended October 31, 2017 and 2016:
| | | | | | | | |
| | | 2017 | | | 2016 | |
Ordinary income | | $ | 6,335,824 | | | $ | 3,953,758 | |
Tax Components of Net Assets at Period-End:
| | | | |
| | | 2017 | |
Undistributed ordinary income | | $ | 791,026 | |
Undistributed long-term gain | | | 1,082,571 | |
Net unrealized appreciation —investments | | | 465,608 | |
Temporary book/tax differences | | | (15,172 | ) |
Capital loss carryforward | | | (835,885 | ) |
Shares of beneficial interest | | | 41,620,027 | |
Total net assets | | $ | 43,108,175 | |
The difference between book-basis and tax-basis unrealized appreciation (depreciation) is due to differences in the timing of recognition of gains and losses on investments for tax and book purposes. The Fund’s net unrealized appreciation difference is attributable primarily to futures contracts and swap agreements.
The temporary book/tax differences are a result of timing differences between book and tax recognition of income and/or expenses. The Fund’s temporary book/tax differences are the result of the trustee deferral of compensation and retirement plan benefits.
Capital loss carryforward is calculated and reported as of a specific date. Results of transactions and other activity after that date may affect the amount of capital loss carryforward actually available for the Fund to utilize. The ability to utilize capital loss carryforward in the future may be limited under the Internal Revenue Code and related regulations based on the results of future transactions.
The Fund has a capital loss carryforward as of October 31, 2017, as follows:
| | | | | | | | | | | | |
| Capital Loss Carryforward* | |
| Expiration | | Short-Term | | | Long-Term | | | Total | |
Not subject to expiration | | $ | 835,885 | | | $ | — | | | $ | 835,885 | |
| * | Capital loss carryforward as of the date listed above is reduced for limitations, if any, to the extent required by the Internal Revenue Code and may be further limited depending upon a variety of factors, including the realization of net unrealized gains or losses as of the date of any reorganization. |
23 Invesco Macro Allocation Strategy Fund
NOTE 8—Investment Transactions
The aggregate amount of long-term U.S. Treasury obligations purchased and sold by the Fund during the year ended October 31, 2017 was $2,143,641 and $7,032,975, respectively. Cost of investments, including any derivatives, on a tax basis includes the adjustments for financial reporting purposes as of the most recently completed federal income tax reporting period-end.
| | | | |
| Unrealized Appreciation (Depreciation) of Investments on a Tax Basis | |
Aggregate unrealized appreciation of investments | | $ | 605,931 | |
Aggregate unrealized (depreciation) of investments | | | (140,323 | ) |
Net unrealized appreciation of investments | | $ | 465,608 | |
Cost of investments for tax purposes is $43,797,634.
NOTE 9—Reclassification of Permanent Differences
Primarily as a result of differing book/tax treatment of futures contracts, swap agreement income and subsidiary suspended passive losses, on October 31, 2017, undistributed net investment income (loss) was increased by $288,614, undistributed net realized gain was increased by $906,525 and shares of beneficial interest was decreased by $1,195,139. This reclassification had no effect on the net assets of the Fund.
NOTE 10—Share Information
| | | | | | | | | | | | | | | | |
| | | Summary of Share Activity | |
| | | Years ended October 31, | |
| | | 2017(a) | | | 2016 | |
| | | Shares | | | Amount | | | Shares | | | Amount | |
Sold: | | | | | | | | | | | | | | | | |
Class A | | | 262,417 | | | $ | 2,502,087 | | | | 129,199 | | | $ | 1,279,591 | |
Class C | | | 318,952 | | | | 2,978,514 | | | | 315,795 | | | | 3,058,442 | |
Class R | | | 1,140 | | | | 10,600 | | | | 1,530 | | | | 14,874 | |
Class Y | | | 2,196,857 | | | | 20,535,016 | | | | 2,456,126 | | | | 24,345,778 | |
Class R6 | | | 24,701 | | | | 230,307 | | | | 373,114 | | | | 3,591,990 | |
| | | | |
Issued as reinvestment of dividends: | | | | | | | | | | | | | | | | |
Class A | | | 75,549 | | | | 698,067 | | | | 16,934 | | | | 161,717 | |
Class C | | | 68,885 | | | | 638,566 | | | | 9,852 | | | | 94,186 | |
Class R | | | 423 | | | | 3,926 | | | | 31 | | | | 297 | |
Class Y | | | 392,090 | | | | 3,630,752 | | | | 82,229 | | | | 786,117 | |
Class R6 | | | 3,135 | | | | 28,995 | | | | 272,540 | | | | 2,605,482 | |
| | | | |
Reacquired: | | | | | | | | | | | | | | | | |
Class A | | | (426,075 | ) | | | (3,989,790 | ) | | | (339,177 | ) | | | (3,304,986 | ) |
Class C | | | (353,558 | ) | | | (3,333,641 | ) | | | (434,039 | ) | | | (4,240,321 | ) |
Class Y | | | (3,102,594 | ) | | | (29,059,425 | ) | | | (3,749,930 | ) | | | (36,739,427 | ) |
Class R6(b) | | | (14,790 | ) | | | (138,234 | ) | | | (10,975,099 | ) | | | (107,159,393 | ) |
Net increase (decrease) in share activity | | | (552,868 | ) | | $ | (5,264,260 | ) | | | (11,840,895 | ) | | $ | (115,505,653 | ) |
| (a) | There are entities that are record owners of more than 5% of the outstanding shares of the Fund and in the aggregate own 78% of the outstanding shares of the Fund. IDI has an agreement with these entities to sell Fund shares. The Fund, Invesco and/or Invesco affiliates may make payments to these entities, which are considered to be related to the Fund, for providing services to the Fund, Invesco and/or Invesco affiliates including but not limited to services such as securities brokerage, distribution, third party record keeping and account servicing. The Fund has no knowledge as to whether all or any portion of the shares owned of record by these entities are also owned beneficially. |
| (b) | On February 18, 2016, 10,015,047 Class R6 shares valued at $97,847,008 were redeemed by affiliated mutual funds. |
24 Invesco Macro Allocation Strategy Fund
NOTE 11—Financial Highlights
The following schedule presents financial highlights for a share of the Fund outstanding throughout the periods indicated.
| | | | | | | | | | | | | | | | | | | | | | | | | | | | | | | | | | | | | | | | | | | | | | | | | | | | | | | | |
| | | Net asset
value,
beginning
of period | | | Net
investment
income
(loss)(a) | | | Net gains
on securities
(both
realized and
unrealized) | | | Total from
investment
operations | | | Dividends
from net
investment
income | | | Distributions
from net
realized
gains | | | Total
distributions | | | Net asset
value, end
of period | | | Total
return(b) | | | Net assets,
end of period
(000’s omitted) | | | Ratio of
expenses
to average
net assets
with fee waivers
and/or expenses
absorbed | | | Ratio of
expenses
to average net
assets without
fee waivers
and/or expenses
absorbed | | | Ratio of net
investment
income
(loss)
to average
net assets | | | Portfolio
turnover(c) | |
Class A | | | | | | | | | | | | | | | | | | | | | | | | | | | | | | | | | | | | | | | | | | | | | | | | | | | | | | | | |
Year ended 10/31/17 | | $ | 10.26 | | | $ | (0.06 | ) | | $ | 0.68 | | | $ | 0.62 | | | $ | (1.28 | ) | | $ | — | | | $ | (1.28 | ) | | $ | 9.60 | | | | 6.55 | % | | $ | 4,645 | | | | 1.41 | %(d) | | | 2.30 | %(d) | | | (0.66 | )%(d) | | | 25 | % |
Year ended 10/31/16 | | | 9.70 | | | | (0.13 | ) | | | 0.91 | | | | 0.78 | | | | (0.22 | ) | | | — | | | | (0.22 | ) | | | 10.26 | | | | 8.21 | | | | 5,865 | | | | 1.63 | | | | 2.19 | | | | (1.31 | ) | | | 75 | |
Year ended 10/31/15 | | | 10.02 | | | | (0.16 | ) | | | 0.18 | | | | 0.02 | | | | (0.15 | ) | | | (0.19 | ) | | | (0.34 | ) | | | 9.70 | | | | 0.18 | | | | 7,418 | | | | 1.70 | (e) | | | 2.03 | (e) | | | (1.64 | )(e) | | | 0 | |
Year ended 10/31/14 | | | 10.78 | | | | (0.17 | ) | | | 0.09 | | | | (0.08 | ) | | | — | | | | (0.68 | ) | | | (0.68 | ) | | | 10.02 | | | | (0.64 | ) | | | 6,996 | | | | 1.73 | | | | 2.06 | | | | (1.68 | ) | | | 0 | |
Year ended 10/31/13(f) | | | 10.52 | | | | (0.04 | ) | | | 0.30 | | | | 0.26 | | | | — | | | | — | | | | — | | | | 10.78 | | | | 2.47 | | | | 607 | | | | 1.99 | (g) | | | 2.04 | (g) | | | (1.92 | )(g) | | | 0 | |
Class C | | | | | | | | | | | | | | | | | | | | | | | | | | | | | | | | | | | | | | | | | | | | | | | | | | | | | | | | |
Year ended 10/31/17 | | | 10.20 | | | | (0.13 | ) | | | 0.69 | | | | 0.56 | | | | (1.19 | ) | | | — | | | | (1.19 | ) | | | 9.57 | | | | 5.90 | | | | 7,398 | | | | 2.16 | (d) | | | 3.05 | (d) | | | (1.41 | )(d) | | | 25 | |
Year ended 10/31/16 | | | 9.62 | | | | (0.20 | ) | | | 0.90 | | | | 0.70 | | | | (0.12 | ) | | | — | | | | (0.12 | ) | | | 10.20 | | | | 7.41 | | | | 7,540 | | | | 2.38 | | | | 2.94 | | | | (2.06 | ) | | | 75 | |
Year ended 10/31/15 | | | 9.94 | | | | (0.24 | ) | | | 0.18 | | | | (0.06 | ) | | | (0.07 | ) | | | (0.19 | ) | | | (0.26 | ) | | | 9.62 | | | | (0.63 | ) | | | 8,155 | | | | 2.45 | (e) | | | 2.78 | (e) | | | (2.39 | )(e) | | | 0 | |
Year ended 10/31/14 | | | 10.78 | | | | (0.24 | ) | | | 0.08 | | | | (0.16 | ) | | | — | | | | (0.68 | ) | | | (0.68 | ) | | | 9.94 | | | | (1.42 | ) | | | 12,136 | | | | 2.48 | | | | 2.81 | | | | (2.43 | ) | | | 0 | |
Year ended 10/31/13(f) | | | 10.52 | | | | (0.05 | ) | | | 0.31 | | | | 0.26 | | | | — | | | | — | | | | — | | | | 10.78 | | | | 2.47 | | | | 818 | | | | 2.74 | (g) | | | 2.79 | (g) | | | (2.67 | )(g) | | | 0 | |
Class R | | | | | | | | | | | | | | | | | | | | | | | | | | | | | | | | | | | | | | | | | | | | | | | | | | | | | | | | |
Year ended 10/31/17 | | | 10.25 | | | | (0.09 | ) | | | 0.70 | | | | 0.61 | | | | (1.25 | ) | | | — | | | | (1.25 | ) | | | 9.61 | | | | 6.42 | | | | 54 | | | | 1.66 | (d) | | | 2.55 | (d) | | | (0.91 | )(d) | | | 25 | |
Year ended 10/31/16 | | | 9.69 | | | | (0.15 | ) | | | 0.90 | | | | 0.75 | | | | (0.19 | ) | | | — | | | | (0.19 | ) | | | 10.25 | | | | 7.86 | | | | 42 | | | | 1.88 | | | | 2.44 | | | | (1.56 | ) | | | 75 | |
Year ended 10/31/15 | | | 10.00 | | | | (0.19 | ) | | | 0.20 | | | | 0.01 | | | | (0.13 | ) | | | (0.19 | ) | | | (0.32 | ) | | | 9.69 | | | | 0.00 | | | | 24 | | | | 1.95 | (e) | | | 2.28 | (e) | | | (1.89 | )(e) | | | 0 | |
Year ended 10/31/14 | | | 10.78 | | | | (0.19 | ) | | | 0.09 | | | | (0.10 | ) | | | — | | | | (0.68 | ) | | | (0.68 | ) | | | 10.00 | | | | (0.83 | ) | | | 24 | | | | 1.98 | | | | 2.31 | | | | (1.93 | ) | | | 0 | |
Year ended 10/31/13(f) | | | 10.52 | | | | (0.04 | ) | | | 0.30 | | | | 0.26 | | | | — | | | | — | | | | — | | | | 10.78 | | | | 2.47 | | | | 10 | | | | 2.24 | (g) | | | 2.29 | (g) | | | (2.17 | )(g) | | | 0 | |
Class Y | | | | | | | | | | | | | | | | | | | | | | | | | | | | | | | | | | | | | | | | | | | | | | | | | | | | | | | | |
Year ended 10/31/17 | | | 10.29 | | | | (0.04 | ) | | | 0.70 | | | | 0.66 | | | | (1.31 | ) | | | — | | | | (1.31 | ) | | | 9.64 | | | | 6.93 | | | | 30,657 | | | | 1.16 | (d) | | | 2.05 | (d) | | | (0.41 | )(d) | | | 25 | |
Year ended 10/31/16 | | | 9.73 | | | | (0.10 | ) | | | 0.91 | | | | 0.81 | | | | (0.25 | ) | | | — | | | | (0.25 | ) | | | 10.29 | | | | 8.51 | | | | 38,019 | | | | 1.38 | | | | 1.94 | | | | (1.06 | ) | | | 75 | |
Year ended 10/31/15 | | | 10.05 | | | | (0.14 | ) | | | 0.19 | | | | 0.05 | | | | (0.18 | ) | | | (0.19 | ) | | | (0.37 | ) | | | 9.73 | | | | 0.44 | | | | 47,740 | | | | 1.45 | (e) | | | 1.78 | (e) | | | (1.39 | )(e) | | | 0 | |
Year ended 10/31/14 | | | 10.79 | | | | (0.14 | ) | | | 0.08 | | | | (0.06 | ) | | | — | | | | (0.68 | ) | | | (0.68 | ) | | | 10.05 | | | | (0.44 | ) | | | 36,645 | | | | 1.48 | | | | 1.81 | | | | (1.43 | ) | | | 0 | |
Year ended 10/31/13 | | | 9.91 | | | | (0.19 | ) | | | 1.07 | | | | 0.88 | | | | — | | | | — | | | | — | | | | 10.79 | | | | 8.88 | | | | 6,972 | | | | 1.82 | | | | 1.87 | | | | (1.75 | ) | | | 0 | |
Class R5 | | | | | | | | | | | | | | | | | | | | | | | | | | | | | | | | | | | | | | | | | | | | | | | | | | | | | | | | |
Year ended 10/31/17 | | | 10.30 | | | | (0.04 | ) | | | 0.70 | | | | 0.66 | | | | (1.31 | ) | | | — | | | | (1.31 | ) | | | 9.65 | | | | 6.93 | | | | 9 | | | | 1.15 | (d) | | | 1.97 | (d) | | | (0.40 | )(d) | | | 25 | |
Year ended 10/31/16 | | | 9.74 | | | | (0.10 | ) | | | 0.91 | | | | 0.81 | | | | (0.25 | ) | | | — | | | | (0.25 | ) | | | 10.30 | | | | 8.50 | | | | 10 | | | | 1.38 | | | | 1.83 | | | | (1.06 | ) | | | 75 | |
Year ended 10/31/15 | | | 10.06 | | | | (0.14 | ) | | | 0.19 | | | | 0.05 | | | | (0.18 | ) | | | (0.19 | ) | | | (0.37 | ) | | | 9.74 | | | | 0.44 | | | | 9 | | | | 1.45 | (e) | | | 1.65 | (e) | | | (1.39 | )(e) | | | 0 | |
Year ended 10/31/14 | | | 10.79 | | | | (0.14 | ) | | | 0.09 | | | | (0.05 | ) | | | — | | | | (0.68 | ) | | | (0.68 | ) | | | 10.06 | | | | (0.34 | ) | | | 10 | | | | 1.48 | | | | 1.69 | | | | (1.43 | ) | | | 0 | |
Year ended 10/31/13(f) | | | 10.52 | | | | (0.03 | ) | | | 0.30 | | | | 0.27 | | | | — | | | | — | | | | — | | | | 10.79 | | | | 2.57 | | | | 10 | | | | 1.75 | (g) | | | 1.80 | (g) | | | (1.68 | )(g) | | | 0 | |
Class R6 | | | | | | | | | | | | | | | | | | | | | | | | | | | | | | | | | | | | | | | | | | | | | | | | | | | | | | | | |
Year ended 10/31/17 | | | 10.29 | | | | (0.04 | ) | | | 0.69 | | | | 0.65 | | | | (1.31 | ) | | | — | | | | (1.31 | ) | | | 9.63 | | | | 6.83 | | | | 345 | | | | 1.15 | (d) | | | 1.97 | (d) | | | (0.40 | )(d) | | | 25 | |
Year ended 10/31/16 | | | 9.73 | | | | (0.10 | ) | | | 0.91 | | | | 0.81 | | | | (0.25 | ) | | | — | | | | (0.25 | ) | | | 10.29 | | | | 8.51 | | | | 234 | | | | 1.38 | | | | 1.83 | | | | (1.06 | ) | | | 75 | |
Year ended 10/31/15 | | | 10.05 | | | | (0.14 | ) | | | 0.19 | | | | 0.05 | | | | (0.18 | ) | | | (0.19 | ) | | | (0.37 | ) | | | 9.73 | | | | 0.44 | | | | 100,759 | | | | 1.45 | (e) | | | 1.65 | (e) | | | (1.39 | )(e) | | | 0 | |
Year ended 10/31/14 | | | 10.80 | | | | (0.14 | ) | | | 0.07 | | | | (0.07 | ) | | | — | | | | (0.68 | ) | | | (0.68 | ) | | | 10.05 | | | | (0.53 | ) | | | 112,019 | | | | 1.48 | | | | 1.69 | | | | (1.43 | ) | | | 0 | |
Year ended 10/31/13(f) | | | 10.52 | | | | (0.03 | ) | | | 0.31 | | | | 0.28 | | | | — | | | | — | | | | — | | | | 10.80 | | | | 2.66 | | | | 109,848 | | | | 1.71 | (g) | | | 1.76 | (g) | | | (1.64 | )(g) | | | 0 | |
| (a) | Calculated using average shares outstanding. |
| (b) | Includes adjustments in accordance with accounting principles generally accepted in the United States of America and as such, the net asset value for financial reporting purposes and the returns based upon those net asset values may differ from the net asset value and returns for shareholder transactions. Does not include sales charges and is not annualized for periods less than one year, if applicable. |
| (c) | Portfolio turnover is calculated at the fund level and is not annualized for periods less than one year, if applicable. |
| (d) | Ratios are based on average daily net assets (000’s omitted) of $5,143, $7,099, $48, $30,521, $9 and $297 for Class A, Class C, Class R, Class Y, Class R5 and Class R6 shares, respectively. |
| (e) | In addition to the fees and expenses which the Fund bears directly, the Fund indirectly bears a pro rata share of the fees and expenses of the underlying funds in which the Fund invests. Because the underlying funds have varied expenses and fee levels and the Fund may own different proportions at different times, the amount of fees and expenses incurred indirectly by the Fund will vary. Estimated underlying fund expenses are not expenses that are incurred directly by the Fund. They are expenses that are incurred directly by the underlying funds and are deducted from the value of the funds the Fund invests in. The effect of the estimated underlying fund expenses that the Fund bears indirectly is included in the Fund’s total return. Estimated acquired fund fees from underlying funds were 0.11%. |
| (f) | Commencement date of August 28, 2013 for Class A, Class C, Class R, Class R5 and Class R6 shares, respectively. |
25 Invesco Macro Allocation Strategy Fund
Report of Independent Registered Public Accounting Firm
To the Board of Trustees of AIM Investment Funds (Invesco Investment Funds) and Shareholders of Invesco Macro Allocation Strategy Fund:
In our opinion, the accompanying consolidated statement of assets and liabilities, including the consolidated schedule of investments, and the related consolidated statements of operations and of changes in net assets and the financial highlights present fairly, in all material respects, the consolidated financial position of Invesco Macro Allocation Strategy Fund and its subsidiary (one of the portfolios constituting the AIM Investment Funds (Invesco Investment Funds), hereafter referred to as the “Fund”) as of October 31, 2017, the results of their operations for the year then ended, the changes in their net assets for each of the two years in the period then ended and the financial highlights for each of the periods indicated therein, in conformity with accounting principles generally accepted in the United States of America. These consolidated financial statements and financial highlights (hereafter referred to as “financial statements”) are the responsibility of the Fund’s management. Our responsibility is to express an opinion on these financial statements based on our audits. We conducted our audits of these financial statements in accordance with the standards of the Public Company Accounting Oversight Board (United States). Those standards require that we plan and perform the audit to obtain reasonable assurance about whether the financial statements are free of material misstatement. An audit includes examining, on a test basis, evidence supporting the amounts and disclosures in the financial statements, assessing the accounting principles used and significant estimates made by management, and evaluating the overall financial statement presentation. We believe that our audits, which included confirmation of securities as of October 31, 2017 by correspondence with the custodian, transfer agent and brokers, and when replies were not received from brokers, we performed other auditing procedures, provide a reasonable basis for our opinion.
PricewaterhouseCoopers LLP
Houston, Texas
December 21, 2017
26 Invesco Macro Allocation Strategy Fund
Calculating your ongoing Fund expenses
Example
As a shareholder of the Fund, you incur two types of costs: (1) transaction costs, which may include sales charges (loads) on purchase payments or contingent deferred sales charges on redemptions, if any; and (2) ongoing costs, including management fees, distribution and/or service (12b-1) fees, and other Fund expenses. This example is intended to help you understand your ongoing costs (in dollars) of investing in the Fund and to compare these costs with ongoing costs of investing in other mutual funds. The example is based on an investment of $1,000 invested at the beginning of the period and held for the entire period May 1, 2017 through October 31, 2017.
Actual expenses
The table below provides information about actual account values and actual expenses. You may use the information in this table, together with the amount you invested, to estimate the expenses that you paid over the period. Simply divide your account value by $1,000 (for example, an $8,600 account value divided by $1,000 = 8.6), then multiply the result by the number in the table under the heading entitled “Actual Expenses Paid During Period” to estimate the expenses you paid on your account during this period.
Hypothetical example for comparison purposes
The table below also provides information about hypothetical account values and hypothetical expenses based on the Fund’s actual expense ratio and an assumed rate of return of 5% per year before expenses, which is not the Fund’s actual return.
The hypothetical account values and expenses may not be used to estimate the actual ending account balance or expenses you paid for the period. You may use this information to compare the ongoing costs of investing in the Fund and other funds. To do so, compare this 5% hypothetical example with the 5% hypothetical examples that appear in the shareholder reports of the other funds.
Please note that the expenses shown in the table are meant to highlight your ongoing costs only and do not reflect any transaction costs, such as sales charges (loads) on purchase payments or contingent deferred sales charges on redemptions, if any. Therefore, the hypothetical information is useful in comparing ongoing costs only, and will not help you determine the relative total costs of owning different funds. In addition, if these transaction costs were included, your costs would have been higher.
| | | | | | | | | | | | | | | | | | | | | | | | |
| | | | | | ACTUAL | | | HYPOTHETICAL
(5% annual return before
expenses) | | | Annualized
Expense
Ratio | |
| 1,Class | | Beginning
Account Value
(05/01/17) | | | Ending
Account Value
(10/31/17)1 | | | Expenses
Paid During
Period2 | | | Ending
Account Value
(10/31/17) | | | Expenses
Paid During
Period2 | | |
| A | | $ | 1,000.00 | | | $ | 1,034.50 | | | $ | 7.03 | | | $ | 1,018.30 | | | $ | 6.97 | | | | 1.37 | % |
| C | | | 1,000.00 | | | | 1,031.30 | | | | 10.85 | | | | 1,014.52 | | | | 10.76 | | | | 2.12 | |
| R | | | 1,000.00 | | | | 1,033.30 | | | | 8.30 | | | | 1,017.04 | | | | 8.24 | | | | 1.62 | |
| Y | | | 1,000.00 | | | | 1,036.60 | | | | 5.75 | | | | 1,019.56 | | | | 5.70 | | | | 1.12 | |
| R5 | | | 1,000.00 | | | | 1,036.50 | | | | 5.75 | | | | 1,019.56 | | | | 5.70 | | | | 1.12 | |
| R6 | | | 1,000.00 | | | | 1,035.50 | | | | 5.75 | | | | 1,019.56 | | | | 5.70 | | | | 1.12 | |
| 1 | The actual ending account value is based on the actual total return of the Fund for the period May 1, 2017 through October 31, 2017, after actual expenses and will differ from the hypothetical ending account value which is based on the Fund’s expense ratio and a hypothetical annual return of 5% before expenses. |
| 2 | Expenses are equal to the Fund’s annualized expense ratio as indicated above multiplied by the average account value over the period, multiplied by 184/365 to reflect the most recent fiscal half year. |
27 Invesco Macro Allocation Strategy Fund
Approval of Investment Advisory and Sub-Advisory Contracts
The Board of Trustees (the Board) of AIM Investment Funds (Invesco Investment Funds) is required under the Investment Company Act of 1940, as amended, to approve annually the renewal of Invesco Macro Allocation Strategy Fund’s (the Fund) investment advisory agreements. During contract renewal meetings held on June 12-13, 2017, the Board as a whole, and the disinterested or “independent” Trustees, who comprise over 75% of the Board, voting separately, approved the continuance for the Fund of the Master Investment Advisory Agreement with Invesco Advisers, Inc. (Invesco Advisers and the investment advisory agreement) and the Master Intergroup Sub-Advisory Contract for Mutual Funds with Invesco Asset Management Deutschland GmbH, Invesco Asset Management Limited, Invesco Asset Management (Japan) Limited, Invesco Hong Kong Limited, Invesco Senior Secured Management, Inc. and Invesco Canada Ltd. and separate Sub-Advisory Contracts with Invesco PowerShares Capital Management LLC and Invesco Asset Management (India) Private Limited (collectively, the Affiliated Sub-Advisers and the sub-advisory contracts) for another year, effective July 1, 2017.
In evaluating the fairness and reasonableness of compensation under the Fund’s investment advisory agreement and sub-advisory contracts, the Board considered, among other things, the factors discussed below. The Board determined that continuation of the Fund’s investment advisory agreement and the sub-advisory contracts is in the best interest of the Fund and its shareholders and that the compensation payable to Invesco Advisers and the Affiliated Sub-Advisers under the agreements is fair and reasonable.
The Board’s Fund Evaluation Process
The Board’s Investments Committee has established three Sub-Committees, which meet throughout the year to review the performance of funds advised by Invesco Advisers (the Invesco Funds). Over the course of each year, the Sub-Committees meet with portfolio managers for their assigned Invesco Funds and other members of management to review the performance, investment objective(s), policies, strategies, limitations and investment risks of these funds. The Board had the benefit of reports from the Sub-Committees and Investments Committee throughout the year in considering approval of the continuance of each Invesco Fund’s investment advisory agreement and sub-advisory contracts for another year.
During the contract renewal process, the Board receives comparative performance and fee data regarding the Invesco Funds prepared by Invesco Advisers and Broadridge Financial Solutions, Inc. (Broadridge), an independent provider of investment company data. The Board also receives an independent written
evaluation from the Senior Officer, an officer of the Invesco Funds who reports directly to the independent Trustees. The Senior Officer’s evaluation is prepared as part of his responsibility to manage the process by which the Invesco Funds’ proposed management fees are negotiated during the annual contract renewal process to ensure they are negotiated in a manner that is at arms’ length and reasonable. In addition to meetings with Invesco Advisers and fund counsel, the independent Trustees also discuss the continuance of the investment advisory agreement and sub-advisory contracts in separate sessions with the Senior Officer and with independent legal counsel.
The Trustees recognized that the advisory fee rates for the Invesco Funds are, in most cases, the result of years of review and negotiation. The Trustees’ deliberations and conclusions in a particular year may be based in part on their deliberations and conclusions regarding these arrangements throughout the year and in prior years. The Trustees’ review and conclusions are based on the comprehensive consideration of all information presented to them and are not the result of any single determinative factor. Moreover, one Trustee may have weighed a particular piece of information or factor differently than another Trustee.
The discussion below is a summary of the Senior Officer’s independent written evaluation with respect to the Fund’s investment advisory agreement as well as a discussion of the material factors and related conclusions that formed the basis for the Board’s approval of the Fund’s investment advisory agreement and sub-advisory contracts. This information is current as of June 13, 2017, and does not reflect consideration of factors that became known to the Board after that date.
Factors and Conclusions and Summary of Independent Written Fee Evaluation
| A. | Nature, Extent and Quality of Services Provided by Invesco Advisers and the Affiliated Sub-Advisers |
The Board reviewed the advisory services provided to the Fund by Invesco Advisers under the Fund’s investment advisory agreement, the performance of Invesco Advisers in providing these services, and the credentials and experience of the officers and employees of Invesco Advisers who provide these services, including the Fund’s portfolio manager or managers. The Board’s review included consideration of Invesco Advisers’ investment process oversight, credit analysis and investment risk management. The Board also considered non-advisory services that Invesco Advisers and its affiliates provide to the Invesco Funds such as various back office support functions, trading operations, internal audit, valuation and legal and compliance.
In determining whether to continue the Fund’s investment advisory agreement, the Board considered the benefits of reapproving an existing relationship as contrasted with the greater uncertainty that may be associated with entering into a new relationship. The Board concluded that the nature, extent and quality of the services provided to the Fund by Invesco Advisers are appropriate and satisfactory.
The Board reviewed the services that may be provided by the Affiliated Sub-Advisers under the sub-advisory contracts and the credentials and experience of the officers and employees of the Affiliated Sub-Advisers who provide these services. The Board noted that the Affiliated Sub-Advisers have offices and personnel that are located in financial centers around the world. As a result, the Board noted that the Affiliated Sub-Advisers can provide research and investment analysis on the markets and economies of various countries in which the Fund may invest, make recommendations regarding securities and assist with security trades. The Board concluded that the sub-advisory contracts may benefit the Fund and its shareholders by permitting Invesco Advisers to use the resources and talents of the Affiliated Sub-Advisers in managing the Fund. The Board concluded that the nature, extent and quality of the services that may be provided by the Affiliated Sub-Advisers are appropriate and satisfactory.
| B. | Fund Investment Performance |
The Board considered Fund investment performance as a relevant factor in considering whether to approve the investment advisory agreement. The Board did not view Fund performance as a relevant factor in considering whether to approve the sub-advisory contracts for the Fund, as no Affiliated Sub-Adviser currently manages assets of the Fund.
The Board noted that the Fund recently began operations and that comparative performance data for only the past four calendar years was available. The Board compared the Fund’s investment performance during the past one and three calendar years to the performance of funds in the Broadridge performance universe and against the Lipper Absolute Return Funds Index. The Board noted that performance of Class Y shares of the Fund was in the first quintile of its performance universe for the one and three year periods (the first quintile being the best performing funds and the fifth quintile being the worst performing funds). The Board noted that performance of Class Y shares of the Fund was above the performance of the Index for the one and three year periods. The Trustees also reviewed more recent Fund performance and this review did not change their conclusions.
| C. | Advisory and Sub-Advisory Fees |
The Board compared the Fund’s contractual management fee rate to the contractual
28 Invesco Macro Allocation Strategy Fund
management fee rates of funds in the Fund’s Broadridge expense group at a common asset level. The Board noted that the contractual management fee rate for Class Y shares of the Fund was above the median contractual management fee rate of funds in its expense group. The Board noted that the term “contractual management fee” for funds in the expense group may include both advisory and certain administrative services fees, but that Broadridge does not provide information on a fund by fund basis as to what is included. The Board noted that Invesco Advisers does not separately charge the Invesco Funds for the administrative services included in the term as defined by Broadridge. The Board also reviewed the methodology used by Broadridge in providing expense group information, which includes using each fund’s contractual management fee schedule (including any applicable breakpoints) as reported in the most recent prospectus or statement of additional information for each fund in the expense group.
The Board noted that Invesco Advisers has contractually agreed to waive fees and/or limit expenses of the Fund through at least February 28, 2018 in an amount necessary to limit total annual operating expenses to a specified percentage of average daily net assets for each class of the Fund.
The Board noted that Invesco Advisers and the Affiliated Sub-Advisers do not manage other mutual funds with investment strategies comparable to those of the Fund.
The Board also considered the services that may be provided by the Affiliated Sub-Advisers pursuant to the sub-advisory contracts, as well as the fees payable by Invesco Advisers to the Affiliated Sub-Advisers pursuant to the sub-advisory contracts. The Board also noted that the sub-advisory fees are not paid directly by the Fund, but rather, are payable by Invesco Advisers to the Affiliated Sub-Advisers.
| D. | Economies of Scale and Breakpoints |
The Board considered the extent to which there are economies of scale in the provision of advisory services to the Fund. The Board also considered that the Fund may benefit from economies of scale through contractual breakpoints in the Fund’s advisory fee schedule. The Board noted that the Fund shares directly in economies of scale through lower fees charged by third party service providers based on the combined size of the Invesco Funds advised by Invesco Advisers.
| E. | Profitability and Financial Resources |
The Board reviewed information from Invesco Advisers concerning the costs of the advisory and other services that Invesco Advisers and its affiliates provide to the Fund and the Invesco Funds and the profitability of Invesco Advisers and its affiliates in providing these services. The Board noted that Invesco Advisers continues to operate at a net profit from services Invesco Advisers and its affiliates provide to the Invesco Funds and the Fund. The Board did not deem the level of profits realized by Invesco Advisers and its affiliates from providing services to the Fund
to be excessive given the nature, quality and extent of the services provided. The Board received and accepted information from Invesco Advisers demonstrating that Invesco Advisers and each Affiliated Sub-Adviser are financially sound and have the resources necessary to perform their obligations under the investment advisory agreement and sub-advisory contracts.
| F. | Collateral Benefits to Invesco Advisers and its Affiliates |
The Board considered various other benefits received by Invesco Advisers and its affiliates from the relationship with the Fund, including the fees received for providing transfer agency and distribution services to the Fund. The Board considered comparative information regarding fees charged for these services, including information provided by Broadridge and other independent sources. The Board considered the performance of Invesco Advisers and its affiliates in providing these services and the organizational structure employed to provide these services. The Board also considered that these services are provided to the Fund pursuant to written contracts that are reviewed and approved on an annual basis by the Board; and that the services are required for the operation of the Fund.
The Board considered the benefits realized by Invesco Advisers and the Affiliated Sub-Advisers as a result of portfolio brokerage transactions executed through “soft dollar” arrangements. The Board noted that soft dollar arrangements may result in the Fund bearding costs to purchase research that shifts the payment obligation for research services from Invesco Advisers and the Affiliated Sub-Advisers to the Invesco Funds and that the research received may be used by Invesco Advisers or the Affiliated Sub-Advisers with other clients of Invesco Advisers and may reduce Invesco Advisers’ and the Affiliated Sub-Advisers’ expenses. The Board also considered that it receives periodic reports from the Chief Compliance Officer of the Invesco Funds demonstrating that these arrangements are consistent with regulatory requirements. The Board did not deem the soft dollar arrangements to be inappropriate.
The Board considered that the Fund’s uninvested cash and cash collateral from any securities lending arrangements may be invested in money market funds advised by Invesco Advisers pursuant to procedures approved by the Board. The Board noted that Invesco Advisers receives advisory fees from these affiliated money market funds attributable to such investments, although Invesco Advisers has contractually agreed to waive through varying periods the advisory fees payable by the Invesco Funds with respect to certain investments in the affiliated money market funds. The waiver is in an amount equal to 100% of the net advisory fee Invesco Advisers receives from the affiliated money market funds with respect to the Fund’s investment in the affiliated money market funds of uninvested cash, but not cash collateral. The
Board concluded that the amount of advisory fees received by Invesco Advisers from the Fund’s investment of cash collateral from any securities lending arrangements in the affiliated money market funds is fair and reasonable.
The Board also considered that the Fund may use an affiliated broker to execute certain trades for the Fund to, among other things, control information leakage, and was advised that such trades would be executed in compliance with rules under the federal securities laws and consistent with best execution obligations.
29 Invesco Macro Allocation Strategy Fund
Tax Information
Form 1099-DIV, Form 1042-S and other year-end tax information provide shareholders with actual calendar year amounts that should be included in their tax returns. Shareholders should consult their tax advisors.
The following distribution information is being provided as required by the Internal Revenue Code or to meet a specific state’s requirement.
The Fund designates the following amounts or, if subsequently determined to be different, the maximum amount allowable for its fiscal year ended October 31, 2017:
| | | | |
Federal and State Income Tax | |
Qualified Dividend Income* | | | 0.00 | % |
Corporate Dividends Received Deduction* | | | 0.00 | % |
U.S. Treasury Obligations* | | | 47.91 | % |
| | * | The above percentages are based on ordinary income dividends paid to shareholders during the Fund’s fiscal year. |
30 Invesco Macro Allocation Strategy Fund
Trustees and Officers
The address of each trustee and officer is AIM Investment Funds (Invesco Investment Funds) (the “Trust”), 11 Greenway Plaza, Suite 1000, Houston, Texas 77046-1173. The trustees serve for the life of the Trust, subject to their earlier death, incapacitation, resignation, retirement or removal as more specifically provided in the Trust’s organizational documents. Each officer serves for a one year term or until their successors are elected and qualified. Column two below includes length of time served with predecessor entities, if any.
| | | | | | | | |
Name, Year of Birth and Position(s) Held with the Trust | | Trustee and/
or Officer Since | | Principal Occupation(s)
During Past 5 Years | | Number of
Funds in Fund
Complex
Overseen by
Trustee | | Other Directorship(s)
Held by Trustee During Past 5 Years |
| Interested Persons | | | | | | | | |
| Martin L. Flanagan1 — 1960 Trustee | | 2007 | | Executive Director, Chief Executive Officer and President, Invesco Ltd. (ultimate parent of Invesco and a global investment management firm); Trustee, The Invesco Funds; Vice Chair, Investment Company Institute; and Member of Executive Board, SMU Cox School of Business Formerly: Advisor to the Board, Invesco Advisers, Inc. (formerly known as Invesco Institutional (N.A.), Inc.); Chairman and Chief Executive Officer, Invesco Advisers, Inc. (registered investment adviser); Director, Chairman, Chief Executive Officer and President, Invesco Holding Company (US), Inc. (formerly IVZ Inc.) (holding company), Invesco Group Services, Inc. (service provider) and Invesco North American Holdings, Inc. (holding company); Director, Chief Executive Officer and President, Invesco Holding Company Limited (parent of Invesco and a global investment management firm); Director, Invesco Ltd.; Chairman, Investment Company Institute and President, Co-Chief Executive Officer, Co-President, Chief Operating Officer and Chief Financial Officer, Franklin Resources, Inc. (global investment management organization) | | 158 | | None |
Philip A. Taylor2 — 1954 Trustee and Senior Vice President | | 2006 | | Head of the Americas and Senior Managing Director, Invesco Ltd.; Director, Invesco Advisers, Inc. (formerly known as Invesco Institutional (N.A.), Inc.) (registered investment adviser); Director, Chairman, Chief Executive Officer and President, Invesco Management Group, Inc. (formerly known as Invesco Aim Management Group, Inc.) (financial services holding company); Director and Chairman, Invesco Investment Services, Inc. (formerly known as Invesco Aim Investment Services, Inc.) (registered transfer agent); Chief Executive Officer, Invesco Corporate Class Inc. (corporate mutual fund company); Director, Chairman and Chief Executive Officer, Invesco Canada Ltd. (formerly known as Invesco Trimark Ltd./Invesco Trimark Ltèe) (registered investment adviser and registered transfer agent); Trustee and Senior Vice President, The Invesco Funds; Director, Invesco Investment Advisers LLC (formerly known as Van Kampen Asset Management). Formerly: Co-Chairman, Co-President and Co-Chief Executive Officer, Invesco Advisers, Inc. (formerly known as Invesco Institutional (N.A.), Inc.) (registered investment adviser); Director, Chief Executive Officer and President, Van Kampen Exchange Corp; President and Principal Executive Officer, The Invesco Funds (other than AIM Treasurer’s Series Trust (Invesco Treasurer’s Series Trust), Short-Term Investments Trust and Invesco Management Trust); Executive Vice President, The Invesco Funds (AIM Treasurer’s Series Trust (Invesco Treasurer’s Series Trust), Short-Term Investments Trust and Invesco Management Trust only); Director and President, INVESCO Funds Group, Inc. (registered investment adviser and registered transfer agent); Director and Chairman, IVZ Distributors, Inc. (formerly known as INVESCO Distributors, Inc.) (registered broker dealer); Director, President and Chairman, Invesco Inc. (holding company), Invesco Canada Holdings Inc. (holding company), Trimark Investments Ltd./Placements Trimark Ltèe and Invesco Financial Services Ltd/Services Financiers Invesco Ltèe; Chief Executive Officer, Invesco Canada Fund Inc. (corporate mutual fund company); Director and Chairman, Van Kampen Investor Services Inc.; Director, Chief Executive Officer and President, 1371 Preferred Inc. (holding company) and Van Kampen Investments Inc.; Director and President, AIM GP Canada Inc. (general partner for limited partnerships) and Van Kampen Advisors, Inc.; Director and Chief Executive Officer, Invesco Trimark Dealer Inc. (registered broker dealer); Director, Invesco Distributors, Inc. (formerly known as Invesco Aim Distributors, Inc.) (registered broker dealer); Manager, Invesco PowerShares Capital Management LLC; Director, Chief Executive Officer and President, Invesco Advisers, Inc.; Director, Chairman, Chief Executive Officer and President, Invesco Aim Capital Management, Inc.; President, Invesco Trimark Dealer Inc. and Invesco Trimark Ltd./Invesco Trimark Ltèe; Director and President, AIM Trimark Corporate Class Inc. and AIM Trimark Canada Fund Inc.; Senior Managing Director, Invesco Holding Company Limited; Director and Chairman, Fund Management Company (former registered broker dealer); President and Principal Executive Officer, The Invesco Funds (AIM Treasurer’s Series Trust (Invesco Treasurer’s Series Trust), and Short-Term Investments Trust only); President, AIM Trimark Global Fund Inc. and AIM Trimark Canada Fund Inc. | | 158 | | None |
| 1 | Mr. Flanagan is considered an interested person (within the meaning of Section 2(a)(19) of the 1940 Act) of the Trust because he is an officer of the Adviser to the Trust, and an officer and a director of Invesco Ltd., ultimate parent of the Adviser. |
| 2 | Mr. Taylor is considered an interested person (within the meaning of Section 2(a)(19) of the 1940 Act) of the Trust because he is an officer and a director of the Adviser. |
T-1 Invesco Macro Allocation Strategy Fund
Trustees and Officers—(continued)
| | | | | | | | |
Name, Year of Birth and Position(s) Held with the Trust | | Trustee and/
or Officer Since | | Principal Occupation(s) During Past 5 Years | | Number of
Funds in Fund
Complex
Overseen by
Trustee | | Other Directorship(s)
Held by Trustee During Past 5 Years |
| Independent Trustees | | | | | | | | |
Bruce L. Crockett — 1944 Trustee and Chair | | 2001 | | Chairman, Crockett Technologies Associates (technology consulting company) Formerly: Director, Captaris (unified messaging provider); Director, President and Chief Executive Officer, COMSAT Corporation; Chairman, Board of Governors of INTELSAT (international communications company); ACE Limited (insurance company); Independent Directors Council and Investment Company Institute: Member of the Audit Committee, Investment Company Institute; Member of the Executive Committee and Chair of the Governance Committee, Independent Directors Council | | 158 | | Director and Chairman of the Audit Committee, ALPS (Attorneys Liability Protection Society) (insurance company); Director and Member of the Audit Committee, Ferroglobe PLC (metallurgical company) |
David C. Arch — 1945 Trustee | | 2010 | | Chairman of Blistex Inc. (consumer health care products manufacturer); Member, World Presidents’ Organization | | 158 | | Board member of the Illinois Manufacturers’ Association |
James T. Bunch — 1942 Trustee | | 2003 | | Managing Member, Grumman Hill Group LLC (family office/private equity investments) Formerly: Chairman of the Board, Denver Film Society; Chairman of the Board of Trustees, Evans Scholarship Foundation; Chairman, Board of Governors, Western Golf Association | | 158 | | Trustee, Evans Scholarship Foundation |
Jack M. Fields — 1952 Trustee | | 2001 | | Chief Executive Officer, Twenty First Century Group, Inc. (government affairs company); and Discovery Learning Alliance (non-profit) Formerly: Owner and Chief Executive Officer, Dos Angeles Ranch L.P. (cattle, hunting, corporate entertainment); Director, Insperity, Inc. (formerly known as Administaff) (human resources provider); Chief Executive Officer, Texana Timber LP (sustainable forestry company); Director of Cross Timbers Quail Research Ranch (non-profit); and member of the U.S. House of Representatives | | 158 | | None |
Cynthia Hostetler — 1962 Trustee | | 2017 | | Non-Executive Director and Trustee of a number of public and private business corporations Formerly: Head of Investment Funds and Private Equity, Overseas Private Investment Corporation; President, First Manhattan Bancorporation, Inc.; Attorney, Simpson Thacher & Bartlett LLP | | 158 | | Vulcan Materials Company (construction materials company); Trilinc Global Impact Fund; Aberdeen Investment Funds (4 portfolios); Artio Global Investment LLC (mutual fund complex); Edgen Group, Inc. (specialized energy and infrastructure products distributor) |
Eli Jones — 1961 Trustee | | 2016 | | Professor and Dean, Mays Business School — Texas A&M University Formerly: Professor and Dean, Walton College of Business, University of Arkansas and E.J. Ourso College of Business, Louisiana State University; Director, Arvest Bank | | 158 | | Insperity, Inc. (formerly known as Administaff) (human resources provider) |
Prema Mathai-Davis — 1950 Trustee | | 2001 | | Retired. Formerly: Chief Executive Officer, YWCA of the U.S.A. | | 158 | | None |
Teresa M. Ressel — 1962 Trustee | | 2017 | | Non-executive director and trustee of a number of public and private business corporations Formerly: Chief Financial Officer, Olayan America, The Olayan Group (international investor/commercial/industrial); Chief Executive Officer, UBS Securities LLC; Group Chief Operating Officer, Americas, UBS AG; Assistant Secretary for Management & Budget and CFO, US Department of the Treasury; Chief Compliance Officer, Kaiser Permanente (healthcare consortium); Program Manager, Hewlett-Packard; Nuclear Engineering, General Dynamics Corporation (aerospace and defense company) | | 158 | | Atlantic Power Corporation (power generation company); ON Semiconductor Corp. (semiconductor supplier) |
Larry Soll — 1942 Trustee | | 2003 | | Retired. Formerly: Chairman, Chief Executive Officer and President, Synergen Corp. (a biotechnology company) | | 158 | | None |
Ann Barnett Stern — 1957 Trustee | | 2017 | | President and Chief Executive Officer, Houston Endowment Inc. (private philanthropic institution) Formerly: Executive Vice President and General Counsel, Texas Children’s Hospital; Attorney, Beck, Redden and Secrest, LLP; Business Law Instructor, University of St. Thomas; Attorney, Andrews & Kurth LLP | | 158 | | Federal Reserve Bank of Dallas |
Raymond Stickel, Jr. — 1944 Trustee | | 2005 | | Retired. Formerly: Director, Mainstay VP Series Funds, Inc. (25 portfolios); Partner, Deloitte & Touche | | 158 | | None |
Robert C. Troccoli — 1949 Trustee | | 2016 | | Adjunct Professor, University of Denver — Daniels College of Business Formerly: Senior Partner, KPMG LLP | | 158 | | None |
T-2 Invesco Macro Allocation Strategy Fund
Trustees and Officers—(continued)
| | | | | | | | |
Name, Year of Birth and Position(s) Held with the Trust | | Trustee and/
or Officer Since | | Principal Occupation(s) During Past 5 Years | | Number of
Funds in Fund
Complex
Overseen by
Trustee | | Other Directorship(s)
Held by Trustee During Past 5 Years |
| Independent Trustees—(continued) |
Christopher L. Wilson — 1957 Trustee | | 2017 | | Managing Partner, CT2, LLC (investing and consulting firm) Formerly: President/Chief Executive Officer, Columbia Funds, Bank of America Corporation; President/Chief Executive Officer, CDC IXIS Asset Management Services, Inc.; Principal & Director of Operations, Scudder Funds, Scudder, Stevens & Clark, Inc.; Assistant Vice President, Fidelity Investments | | 158 | | TD Asset Management USA Inc. (mutual fund complex) (22 portfolios); ISO New England, Inc. (non-profit organization managing regional electricity market) |
| Other Officers | | | | | | | | |
Sheri Morris — 1964 President, Principal Executive Officer and Treasurer | | 1999 | | President, Principal Executive Officer and Treasurer, The Invesco Funds; Vice President, Invesco Advisers, Inc. (formerly known as Invesco Institutional (N.A.), Inc.) (registered investment adviser); and Vice President, PowerShares Exchange-Traded Fund Trust, PowerShares Exchange-Traded Fund Trust II, PowerShares India Exchange-Traded Fund Trust, PowerShares Actively Managed Exchange-Traded Fund Trust and PowerShares Actively Managed Exchange-Traded Commodity Fund Trust Formerly: Vice President and Principal Financial Officer, The Invesco Funds; Vice President, Invesco Aim Advisers, Inc., Invesco Aim Capital Management, Inc. and Invesco Aim Private Asset Management, Inc.; Assistant Vice President and Assistant Treasurer, The Invesco Funds and Assistant Vice President, Invesco Advisers, Inc., Invesco Aim Capital Management, Inc. and Invesco Aim Private Asset Management, Inc.; and Treasurer, PowerShares Exchange-Traded Fund Trust, PowerShares Exchange-Traded Fund Trust II, PowerShares India Exchange-Traded Fund Trust and PowerShares Actively Managed Exchange-Traded Fund Trust | | N/A | | N/A |
Russell C. Burk — 1958 Senior Vice President and Senior Officer | | 2005 | | Senior Vice President and Senior Officer, The Invesco Funds | | N/A | | N/A |
John M. Zerr — 1962 Senior Vice President, Chief Legal Officer and Secretary | | 2006 | | Director, Senior Vice President, Secretary and General Counsel, Invesco Management Group, Inc. (formerly known as Invesco AIM Management Group, Inc.); Senior Vice President, Invesco Advisers, Inc. (formerly known as Invesco Institutional (N.A.), Inc.) (registered investment adviser); Senior Vice President and Secretary, Invesco Distributors, Inc. (formerly known as Invesco AIM Distributors, Inc.); Director, Vice President and Secretary, Invesco Investment Services, Inc. (formerly known as Invesco AIM Investment Services, Inc.) Senior Vice President, Chief Legal Officer and Secretary, The Invesco Funds; Managing Director, Invesco PowerShares Capital Management LLC; Director, Secretary and General Counsel, Invesco Investment Advisers LLC (formerly known as Van Kampen Asset Management); Secretary and General Counsel, Invesco Capital Markets, Inc. (formerly known as Van Kampen Funds Inc.) and Chief Legal Officer, PowerShares Exchange-Traded Fund Trust, PowerShares Exchange-Traded Fund Trust II, PowerShares India Exchange-Traded Fund Trust, PowerShares Actively Managed Exchange-Traded Fund Trust and PowerShares Actively Managed Exchange-Traded Commodity Fund Trust; Manager and Secretary, Invesco Indexing LLC Formerly: Director, Secretary, General Counsel and Senior Vice President, Van Kampen Exchange Corp.; Director, Vice President and Secretary, IVZ Distributors, Inc. (formerly known as INVESCO Distributors, Inc.); Director and Vice President, INVESCO Funds Group, Inc.; Director and Vice President, Van Kampen Advisors Inc.; Director, Vice President, Secretary and General Counsel, Van Kampen Investor Services Inc.; Director, Invesco Distributors, Inc. (formerly known as Invesco AIM Distributors, Inc.); Director, Senior Vice President, General Counsel and Secretary, Invesco AIM Advisers, Inc. and Van Kampen Investments Inc.; Director, Vice President and Secretary, Fund Management Company; Director, Senior Vice President, Secretary, General Counsel and Vice President, Invesco AIM Capital Management, Inc.; Chief Operating Officer and General Counsel, Liberty Ridge Capital, Inc. (an investment adviser); Vice President and Secretary, PBHG Funds (an investment company) and PBHG Insurance Series Fund (an investment company); Chief Operating Officer, General Counsel and Secretary, Old Mutual Investment Partners (a broker-dealer); General Counsel and Secretary, Old Mutual Fund Services (an administrator) and Old Mutual Shareholder Services (a shareholder servicing center); Executive Vice President, General Counsel and Secretary, Old Mutual Capital, Inc. (an investment adviser); and Vice President and Secretary, Old Mutual Advisors Funds (an investment company) | | N/A | | N/A |
Gregory G. McGreevey — 1962 Senior Vice President | | 2012 | | Senior Managing Director, Invesco Ltd.; Director, Chairman, President, and Chief Executive Officer, Invesco Advisers, Inc. (formerly known as Invesco Institutional (N.A.), Inc.) (registered investment adviser); Senior Vice President, Invesco Management Group, Inc.; Director, Invesco Mortgage Capital, Inc. and Invesco Senior Secured Management, Inc.; and Senior Vice President, The Invesco Funds Formerly: Assistant Vice President, The Invesco Funds | | N/A | | N/A |
T-3 Invesco Macro Allocation Strategy Fund
Trustees and Officers—(continued)
| | | | | | | | |
Name, Year of Birth and Position(s) Held with the Trust | | Trustee and/
or Officer Since | | Principal Occupation(s) During Past 5 Years | | Number of
Funds in Fund
Complex
Overseen by
Trustee | | Other Directorship(s)
Held by Trustee During Past 5 Years |
| Other Officers—(continued) | | | | | | | | |
Kelli Gallegos — 1970 Vice President, Principal Financial Officer and Assistant Treasurer | | 2008 | | Vice President, Principal Financial Officer and Assistant Treasurer, The Invesco Funds; Assistant Treasurer, Invesco PowerShares Capital Management LLC, PowerShares Exchange-Traded Fund Trust, PowerShares Exchange-Traded Fund Trust II, PowerShares India Exchange-Traded Fund Trust, PowerShares Actively Managed Exchange-Traded Fund Trust and PowerShares Actively Managed Exchange-Traded Commodity Fund Trust Formerly: Assistant Vice President, The Invesco Funds | | N/A | | N/A |
Tracy Sullivan — 1962 Vice President, Chief Tax Officer and Assistant Treasurer | | 2008 | | Vice President, Chief Tax Officer and Assistant Treasurer, The Invesco Funds; Assistant Treasurer, Invesco PowerShares Capital Management LLC, PowerShares Exchange-Traded Fund Trust, PowerShares Exchange-Traded Fund Trust II, PowerShares India Exchange-Traded Fund Trust, PowerShares Actively Managed Exchange-Traded Fund Trust and PowerShares Actively Managed Exchange-Traded Commodity Fund Trust Formerly: Assistant Vice President, The Invesco Funds | | N/A | | N/A |
Crissie M. Wisdom — 1969 Anti-Money Laundering Compliance Officer | | 2013 | | Anti-Money Laundering Compliance Officer, Invesco Advisers, Inc. (formerly known as Invesco Institutional (N.A.), Inc.) (registered investment adviser), Invesco Capital Markets, Inc. (formerly known as Van Kampen Funds Inc.), Invesco Distributors, Inc., Invesco Investment Services, Inc., Invesco Management Group, Inc., The Invesco Funds, and PowerShares Exchange-Traded Fund Trust, PowerShares Exchange-Traded Fund Trust II, PowerShares India Exchange-Traded Fund Trust, PowerShares Actively Managed Exchange-Traded Fund Trust and PowerShares Actively Managed Exchange-Traded Commodity Fund Trust; Anti-Money Laundering Compliance Officer and Bank Secrecy Act Officer, INVESCO National Trust Company and Invesco Trust Company; and Fraud Prevention Manager and Controls and Risk Analysis Manager for Invesco Investment Services, Inc. Formerly: Anti-Money Laundering Compliance Officer, Van Kampen Exchange Corp. | | N/A | | N/A |
Robert R. Leveille — 1969 Chief Compliance Officer | | 2016 | | Chief Compliance Officer, Invesco Advisers, Inc. (registered investment adviser); and Chief Compliance Officer, The Invesco Funds Formerly: Chief Compliance Officer, Putnam Investments and the Putnam Funds | | N/A | | N/A |
The Statement of Additional Information of the Trust includes additional information about the Fund’s Trustees and is available upon request, without charge, by calling 1.800.959.4246. Please refer to the Fund’s Statement of Additional Information for information on the Fund’s sub-advisers.
| | | | | | |
Office of the Fund 11 Greenway Plaza, Suite 1000 Houston, TX 77046-1173 | | Investment Adviser Invesco Advisers, Inc. 1555 Peachtree Street, N.E. Atlanta, GA 30309 | | Distributor Invesco Distributors, Inc. 11 Greenway Plaza, Suite 1000 Houston, TX 77046-1173 | | Auditors PricewaterhouseCoopers LLP 1000 Louisiana Street, Suite 5800 Houston, TX 77002-5678 |
| | | |
| | | | | | |
Counsel to the Fund Stradley Ronon Stevens & Young, LLP 2005 Market Street, Suite 2600 Philadelphia, PA 19103-7018 | | Counsel to the Independent Trustees Goodwin Procter LLP 901 New York Avenue, N.W. Washington, D.C. 20001 | | Transfer Agent Invesco Investment Services, Inc. 11 Greenway Plaza, Suite 1000 Houston, TX 77046-1173 | | Custodian State Street Bank and Trust Company 225 Franklin Street Boston, MA 02110-2801 |
T-4 Invesco Macro Allocation Strategy Fund
Explore High-Conviction Investing with Invesco

Go paperless with eDelivery
Visit invesco.com/edelivery to enjoy the convenience and security of anytime electronic access to your investment documents.
With eDelivery, you can elect to have any or all of the following materials delivered straight to your inbox to download, save and print from your own computer:
| ∎ | | Fund reports and prospectuses |
Invesco mailing information
Send general correspondence to Invesco Investment Services, Inc., P.O. Box 219078, Kansas City, MO 64121-9078.
Important notice regarding delivery of security holder documents
To reduce Fund expenses, only one copy of most shareholder documents may be mailed to shareholders with multiple accounts at the same address (Householding). Mailing of your shareholder documents may be householded indefinitely unless you instruct us otherwise. If you do not want the mailing of these documents to be combined with those for other members of your household, please contact Invesco Investment Services, Inc. at 800 959 4246 or contact your financial institution. We will begin sending you individual copies for each account within 30 days after receiving your request.
Fund holdings and proxy voting information
The Fund provides a complete list of its holdings four times in each fiscal year, at the quarter ends. For the second and fourth quarters, the lists appear in the Fund’s semiannual and annual reports to shareholders. For the first and third quarters, the Fund files the lists with the Securities and Exchange Commission (SEC) on Form N-Q. The most recent list of portfolio holdings is available at invesco.com/completeqtrholdings. Shareholders can also look up the Fund’s Forms N-Q on the SEC website at sec.gov. Copies of the Fund’s Forms N-Q may be reviewed and copied at the SEC Public Reference Room in Washington, D.C. You can obtain information on the operation of the Public Reference Room, including information about duplicating fee charges, by calling 202 551 8090 or 800 732 0330, or by electronic request at the following email address: publicinfo@sec.gov. The SEC file numbers for the Fund are shown below.
A description of the policies and procedures that the Fund uses to determine how to vote proxies relating to portfolio securities is available without charge, upon request, from our Client Services department at 800 959 4246 or at invesco.com/proxyguidelines. The information is also available on the SEC website, sec.gov.
| | |
Information regarding how the Fund voted proxies related to its portfolio securities during the most recent 12-month period ended June 30 is available at invesco.com/proxysearch. The information is also available on the SEC website, sec.gov. Invesco Advisers, Inc. is an investment adviser; it provides investment advisory services to individual and institutional clients and does not sell securities. Invesco Distributors, Inc. is the US distributor for Invesco Ltd.’s retail mutual funds, exchange-traded funds and institutional money market funds. Both are wholly owned, indirect subsidiaries of Invesco Ltd. | |  |
| | | | | | | | |
| SEC file numbers: 811-05426 and 033-19338 | | Invesco Distributors, Inc. | | MAS-AR-1 | | 12192017 | | 0934 |
Letters to Shareholders
| | | | |

Philip Taylor | | | | Dear Shareholders: This annual report includes information about your Fund, including performance data and a complete list of its investments as of the close of the reporting period. Inside is a discussion of how your Fund was managed and the factors that affected its performance during the reporting period. American voters went to the polls just days after the start of the reporting period, and their decisions quickly affected markets. The US stock market rallied strongly after the election, with major market indexes rising, and setting record highs, throughout the reporting period. Generally positive economic data, strong corporate earnings and hope for tax and regulatory reform contributed to the rally. US and global bond markets, as well as emerging market equities, sold off immediately following the election – with the US bond market eventually recovering most of its losses. Overseas, economic data were mixed, prompting the European Central Bank and central banks in China and Japan, among other countries, to maintain |
extraordinarily accommodative monetary policies. Citing positive economic trends – specifically, realized and expected labor market conditions and inflation – the US Federal Reserve raised interest rates three times during the reporting period: first in December 2016, and then again in March and June 2017. Health care and tax reform proved to be more difficult than expected to enact, with little progress achieved by the end of the reporting period.
Short-term market volatility can prompt some investors to abandon their investment plans – and can cause others to settle for whatever returns the market has to offer. The investment professionals at Invesco, in contrast, invest with high conviction. This means that, no matter the asset class or the strategy, each investment team has a passion to exceed. We want to help investors achieve better outcomes, such as seeking higher returns, helping mitigate risk and generating income. Of course, investing with high conviction can’t guarantee a profit or ensure success; no investment strategy can. To learn more about how we invest with high conviction, visit invesco.com/HighConviction.
You, too, can invest with high conviction by maintaining a long-term investment perspective and by working with your financial adviser on a regular basis. During periods of short-term market volatility or uncertainty, your financial adviser can keep you focused on your long-term investment goals – a new home, a child’s college education or a secure retirement. He or she also can share research about the economy, the markets and individual investment options.
Visit our website for more information on your investments
Our website, invesco.com/us, offers a wide range of market insights and investment perspectives. On the website, you’ll find detailed information about our funds, including performance, holdings and portfolio manager commentaries. You can access information about your account by completing a simple, secure online registration. To do so, select “Log In” on the right side of the homepage, and then select “Register for Individual Account Access.”
In addition to the resources accessible on our website and through our mobile app, you can obtain timely updates to help you stay informed about the markets and the economy by connecting with Invesco on Twitter, LinkedIn or Facebook. You can access our blog at blog.invesco.us.com. Our goal is to provide you the information you want, when and where you want it.
Finally, I’m pleased to share with you Invesco’s commitment to both the Principles for Responsible Investment and to considering environmental, social and governance issues in our robust investment process. I invite you to learn more at invesco.com/esg.
Have questions?
For questions about your account, contact an Invesco client services representative at 800 959 4246. For Invesco-related questions or comments, please email me directly at phil@invesco.com.
All of us at Invesco look forward to serving your investment management needs. Thank you for investing with us.
Sincerely,

Philip Taylor
Senior Managing Director, Invesco Ltd.
| | | | |

Bruce Crockett | | | | Dear Fellow Shareholders: Among the many important lessons I’ve learned in more than 40 years in a variety of business endeavors is the value of a trusted advocate. As independent chair of the Invesco Funds Board, I can assure you that the members of the Board are strong advocates for the interests of investors in Invesco’s mutual funds. We work hard to represent your interests through oversight of the quality of the investment management services your funds receive and other matters important to your investment, including but not limited to: ∎ Ensuring that Invesco offers a diverse lineup of mutual funds that your financial adviser can use to strive to meet your financial needs as your investment goals change over time. ∎ Monitoring how the portfolio management teams of the Invesco funds are performing in light of changing economic and market conditions. |
∎ Assessing each portfolio management team’s investment performance within the context of the investment strategy described in the fund’s prospectus.
∎ Monitoring for potential conflicts of interests that may impact the nature of the services that your funds receive.
We believe one of the most important services we provide our fund shareholders is the annual review of the funds’ advisory and sub-advisory contracts with Invesco Advisers and its affiliates. This review is required by the Investment Company Act of 1940 and focuses on the nature and quality of the services Invesco provides as the adviser to the Invesco funds and the reasonableness of the fees that it charges for those services. Each year, we spend months carefully reviewing information received from Invesco and a variety of independent sources, such as performance and fee data prepared by Lipper, Inc. (a subsidiary of Broadridge Financial Solutions, Inc.), an independent, third-party firm widely recognized as a leader in its field. We also meet with our independent legal counsel and other independent advisers to review and help us assess the information that we have received. Our goal is to assure that you receive quality investment management services for a reasonable fee.
I trust the measures outlined above provide assurance that you have a worthy advocate when it comes to choosing the Invesco Funds.
As always, please contact me at bruce@brucecrockett.com with any questions or concerns you may have. On behalf of the Board, we look forward to continuing to represent your interests and serving your needs.
Sincerely,

Bruce L. Crockett
Independent Chair
Invesco Funds Board of Trustees
Management’s Discussion of Fund Performance
Performance summary
For the fiscal year ended October 31, 2017, Class A shares of Invesco MLP Fund (the Fund), at net asset value (NAV), underperformed the Fund’s style-specific benchmark, the Alerian MLP Index.
Your Fund’s long-term performance appears later in this report.
Fund vs. Indexes
Total returns, 10/31/16 to 10/31/17, at net asset value (NAV). Performance shown does not include applicable contingent deferred sales charges (CDSC) or front-end sales charges, which would have reduced performance.
| | | | | |
| Class A Shares | | | | -4.88 | % |
| Class C Shares | | | | -5.45 | |
| Class R Shares | | | | -5.12 | |
| Class Y Shares | | | | -4.61 | |
| Class R5 Shares | | | | -4.63 | |
| Class R6 Shares | | | | -4.63 | |
| S&P 500 Index▼ (Broad Market Index) | | | | 23.63 | |
| Alerian MLP Index▼ (Style-Specific Index) | | | | -3.39 | |
| Lipper Energy MLP Funds Index∎ (Peer Group Index) | | | | -2.32 | |
Source(s): ▼FactSet Research Systems Inc.; ∎Lipper, Inc. | | | | | |
Market conditions and your Fund
Despite highly destructive hurricanes that threatened to derail a years-long recovery, the US economy continued to expand throughout the fiscal year ended October 31, 2017. Gross domestic product (GDP) – the value of all goods and services produced in the US – grew by 1.8% in the fourth quarter of 2016, by 1.2% in the first quarter and by 3.1% in the second quarter of 2017.1 Inflation remained subdued even as the labor market continued to strengthen. Unemployment continued its multiyear decline, hitting just 4.2% in September – a 16-year low.2
Given signs of an improving economy, the US Federal Reserve (the Fed) raised interest rates three times during the
reporting period, most recently in June 2017.3 The Fed pledged that “realized and expected economic conditions relative to its objectives of maximum employment and 2 percent inflation” will guide its future actions. At the close of the reporting period, Fed policy remained accommodative, and the fed funds target rate stood at a range of 1.00% to 1.25% – up 75 basis points for the reporting period.3 (A basis point is 0.01%.)
Despite the Fed’s actions, major US stock market indexes repeatedly hit all-time highs throughout the reporting period. The stock market rally began immediately following the outcome of the US presidential election in November 2016, based on investors’ hopes for reduced regulation, lowered corporate
| | | | |
| |
| Portfolio Composition | |
| By MILP sector | | | % of total net assets | |
| | | | |
| |
Refined Products Pipelines & Terminals | | | 29.5 | % |
Pipelines & Midstream Diversified | | | 22.3 | |
| Gathering & Processing MLP | | | 16.2 | |
| Midstream Diversified | | | 10.5 | |
| Natural Gas Pipelines & Storage | | | 8.1 | |
| Marine | | | 3.1 | |
| General Partner (C-Corp.) | | | 2.6 | |
| Refinery Logistics | | | 1.5 | |
| Non-Traditional | | | 1.4 | |
| Oilfield Services | | | 1.1 | |
| Global Infrastructure | | | 1.0 | |
| Gathering & Processing | | | 0.9 | |
| General Partner (MLP) | | | 0.8 | |
Money Market Funds Plus Other Assets Less Liabilities | | | 1.0 | |
| | | | |
| |
| Top 10 Equity Holdings* | |
| | | % of total net assets | |
| | | | |
| |
| 1. Energy Transfer Partners, L.P. | | | 10.5 | % |
2. Magellan Midstream Partners, L.P. | | | 9.3 | |
| 3. MPLX L.P. | | | 9.0 | |
4. Enterprise Products Partners L.P. | | | 8.2 | |
| 5. Williams Partners L.P. | | | 6.3 | |
6. Plains All American Pipeline, L.P. | | | 5.1 | |
| 7. EQT Midstream Partners L.P. | | | 3.6 | |
| 8. GasLog Partners L.P. | | | 3.1 | |
| 9. Phillips 66 Partners L.P. | | | 3.0 | |
| 10. Rice Midstream Partners L.P. | | | 2.8 | |
| | | | |
| | |
Total Net Assets | | $ | 9.98 billion | |
| |
Total Number of Holdings* | | | 33 | |
The Fund’s holdings are subject to change, and there is no assurance that the Fund will continue to hold any particular security.
*Excluding money market fund holdings.
Data presented here are as of October 31, 2017.
and personal tax rates and increased infrastructure spending. The stock market rally continued throughout the reporting period, fueled by generally positive economic data, strong corporate earnings and improved consumer confidence – even as the prospect for health care and tax reform faded somewhat.
Given investor sentiment toward volatile commodity prices and uncertainty surrounding energy companies, master limited partnership (MLP) equities experienced losses during the reporting period, underperforming broad market equities. Additionally, Hurricane Harvey disrupted operations for companies with exposure to Gulf Coast infrastructure, though very little damage was seen at the asset level.
A combination of effective OPEC production cuts and evidence of demand growth supported crude oil prices – from $48.14 per barrel at the beginning of the reporting period to $61.37 per barrel at the end. Natural gas prices, which aver aged $3.07 per million cubic feet, were essentially flat during the fiscal year.4
In this environment, the Fund had a negative return and underperformed its style-specific benchmark during the reporting period. On an absolute basis, Fund holdings in the marine MLP sector contributed to the Fund’s performance. Pipelines and midstream diversified, as well as gathering and processing MLP sectors, were the largest detractors from the Fund’s absolute performance.
The Fund underperformed its style-specific benchmark primarily due to security selection and overweight position in the pipelines and midstream diversified MLP sector. Security selection in the gathering and processing MLP sector, out-of-benchmark exposure to the general partner MLP sector, as well as a combination of security selection and overweight allocation in the natural gas pipelines and storage MLP sector also hurt the Fund’s relative performance.
Positive contributors to the Fund’s performance relative to its style-specific benchmark included: security selection in and underweight exposure to the refined products pipelines and terminals MLP sector, security selection in and overweight exposure to the marine MLP sector, underweight exposure to the non-traditional MLP sector, and a lack of exposure to the propane MLP sector. Ancillary cash held by the Fund was also beneficial during the reporting period, given the overall decline in MLP equities.
Individual contributors to the Fund’s absolute performance included Enterprise Products Partners and ONEOK, Inc. (formerly, ONEOK Partners, L.P.). Enterprise Products Partners is one of the largest publicly traded MLPs with over 50,000 miles of pipelines carrying natural gas, natural gas liquid (NGL), crude oil, refined products and petrochemicals. It also owns salt dome storage capacity, natural gas processing plants, NGL fractionators and NGL import/export terminals in the Houston Ship Channel. During the fiscal year, Enterprise announced plans to develop an ethylene marine export terminal that would be connected to its existing Houston Ship Channel storage and systems, as well as plans to expand capacity at an existing natural gas processing facility in West Texas. Additionally, Enterprise increased its quarterly distribution during the fiscal year. ONEOK Partners was an owner of a premier NGL system that connects supply in the midcontinent, Permian and Rocky Mountains with key market centers. During the fiscal year, ONEOK Partners announced a definitive merger agreement in which ONEOK, Inc. would acquire all of its outstanding common stock at a significant increase to its previous day’s closing price. The acquisition completed at the end of the second quarter 2017, thus the Fund held a position in ONEOK, Inc. as of the end of the reporting period.
Individual detractors from the Fund’s absolute performance included Energy Transfer Partners and Plains All American Pipeline. Energy Transfer Partners suffered setbacks and a halt in the development of its Rover natural gas pipeline in Ohio, which was set to deliver gas from the Marcellus shale to the Midwest in the second half of 2017. Plains All American Pipeline detracted following lower-than-expected second quarter 2017 earnings. Additionally, Plains reduced earnings guidance for the full year 2017 and 2018 and noted a potential distribution cut. During the reporting period, we viewed Plains as owning key pipeline infrastructure in the Permian basin and we added to the Fund’s position on share price weakness.
During the reporting period, the Fund held overweight positions relative to its style-specific benchmark in the following MLP sectors: pipelines and midstream diversified, gathering and processing, natural gas pipelines and storage, and marine. The Fund held underweight positions in the following MLP sectors: non-traditional, coal, and refined products pipelines and terminals. Out-of-benchmark exposures included the following MLP sectors: general partner and oilfield
services. The Fund lacked exposure to the propane MLP sector in which the style-specific benchmark had minor exposure.
In general, we believed OPEC’s agreement to limit crude oil production to be beneficial for US production growth throughout 2017 and into 2018. Further, we believed the presidential administration’s focus on reducing overall regulation could benefit certain midstream energy companies in the process of receiving approvals for new projects. Additionally, we viewed the lifting of the US crude oil export ban as being instrumental for continued US midstream infrastructure buildout, which would also be beneficial for midstream services companies that tend to be influenced more by the volume, rather than by the price of energy.
We believed that the Permian and Marcellus basins remained the strongest basins with drilling economics that were relatively attractive and production volumes insulated from downward pressure. Despite distribution cuts from upstream MLPs, our expectations for distribution growth among companies focused on refined products, natural gas pipelines and storage remained positive, given the contractual nature of existing cash flows, combined with a healthy project backlog. In general, the Fund remained focused on companies that exhibit a relatively high fee-based cash flow, have access to a growing asset base through both organic capital expenditures and acquisitions, and operate in what we view to be the most attractive natural resource basins in the US.
As always, we thank you for your investment in Invesco MLP Fund.
| 1 | Source: Bureau of Economic Analysis |
| 2 | Sources: Bureau of Labor Statistics, Bloomberg L.P. |
| 3 | Source: US Federal Reserve |
The views and opinions expressed in management’s discussion of Fund performance are those of Invesco Advisers, Inc. These views and opinions are subject to change at any time based on factors such as market and economic conditions. These views and opinions may not be relied upon as investment advice or recommendations, or as an offer for a particular security. The information is not a complete analysis of every aspect of any market, country, industry, security or the Fund. Statements of fact are from sources considered reliable, but Invesco Advisers, Inc. makes no representation or warranty as to their completeness or accuracy. Although historical performance is no guarantee of future results, these insights may help you understand our investment management philosophy.
See important Fund and, if applicable, index disclosures later in this report.
| | |
 | | Joe Rodriguez, Jr. Portfolio Manager, is lead manager of Invesco MLP Fund. He is Head of Global Securities with |
Invesco Real Estate, where he oversees all phases of the unit, including securities research and administration. Mr. Rodriguez joined Invesco in 1990. He earned a BBA in economics and finance and an MBA in finance from Baylor University. |
 | | Mark Blackburn Chartered Financial Analyst, Portfolio Manager, is manager of Invesco MLP Fund. He joined |
Invesco in 1998. Mr. Blackburn earned a BS in accounting from Louisiana State University and an MBA from Southern Methodist University. He is also a Certified Public Accountant. |
 | | James Cowen Portfolio Manager, is manager of Invesco MLP Fund. He joined Invesco in 2000. Mr. Cowen earned a |
Master of Town and Country Planning degree from the University of Manchester and a Master of Philosophy degree in land economy from Cambridge University. |
 | | Paul Curbo Chartered Financial Analyst, Portfolio Manager, is manager of Invesco MLP Fund. He joined |
Invesco in 1998. Mr. Curbo earned a BBA in finance from The University of Texas at Austin. |
 | | Darin Turner Portfolio Manager, is manager of Invesco MLP Fund. He joined Invesco in 2005. Mr. Turner earned a BBA |
in finance from Baylor University, an MS in real estate from The University of Texas at Arlington and an MBA specializing in investments from Southern Methodist University. |
 | | Ping-Ying Wang Chartered Financial Analyst, Portfolio Manager, is manager of Invesco MLP Fund. She joined |
| Invesco in 1998. Ms. Wang earned a BS in international finance from the People’s University of China and a PhD in finance from The University of Texas at Dallas. |
Your Fund’s Long-Term Performance
Results of a $10,000 Investment – Oldest Share Class(es) since Inception
Fund and index data from 8/29/14
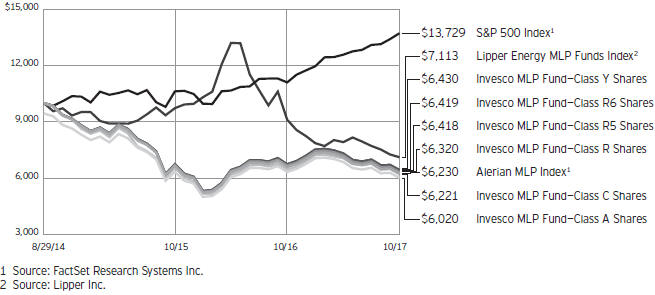
Past performance cannot guarantee comparable future results.
The data shown in the chart include reinvested distributions, applicable sales charges and Fund expenses including management fees. Index results include reinvested dividends, but they do not reflect sales charges. Performance of the peer group, if applicable, reflects fund expenses and management fees; performance of a market index does not.
Performance shown in the chart and table(s) does not reflect deduction of taxes a shareholder would pay on Fund distributions or sale of Fund shares.
| | | | | |
| Average Annual Total Returns |
| As of 10/31/17, including maximum applicable sales charges |
| |
| | | | | |
| Class A Shares | | | | | |
| Inception (8/29/14) | | | | -14.78 | % |
| 1 Year | | | | -10.07 | |
| |
| Class C Shares | | | | | |
| Inception (8/29/14) | | | | -13.89 | % |
| 1 Year | | | | -6.35 | |
| |
| Class R Shares | | | | | |
| Inception (8/29/14) | | | | -13.47 | % |
| 1 Year | | | | -5.12 | |
| |
| Class Y Shares | | | | | |
| Inception (8/29/14) | | | | -12.99 | % |
| 1 Year | | | | -4.61 | |
| |
| Class R5 Shares | | | | | |
| Inception (8/29/14) | | | | -13.04 | % |
| 1 Year | | | | -4.63 | |
| |
| Class R6 Shares | | | | | |
| Inception (8/29/14) | | | | -13.04 | % |
| 1 Year | | | | -4.63 | |
The performance data quoted represent past performance and cannot guarantee comparable future results; current performance may be lower or higher. Please visit invesco.com/performance for the most recent month-end performance. Performance figures reflect reinvested distributions, changes in net asset value and the effect of the maximum sales charge unless otherwise stated. Investment return and principal value will fluctuate so that you may have a gain or loss when you sell shares.
The net annual Fund operating expense ratio set forth in the most recent Fund prospectus as of the date of this report for Class A, Class C, Class R, Class Y, Class R5 and Class R6 shares was 1.98%, 2.73%, 2.23%, 1.73%, 1.73% and 1.73%, respectively.1 The total annual Fund operating expense ratio set forth in the most recent Fund prospectus as of the date of this report for Class A, Class C, Class R, Class Y, Class R5 and Class R6 shares was 5.45%, 6.20%, 5.70%, 5.20%, 5.14% and 5.14%, respectively. The expense ratios presented above may vary from the expense ratios presented in other sections of this report that are based on expenses incurred during the period covered by this report.
| | | | | |
Average Annual Total Returns |
| As of 9/30/17, the most recent calendar quarter end, including maximum applicable sales charges |
| | | | | |
| |
| Class A Shares | | | | | |
| Inception (8/29/14) | | | | -13.97 | % |
| 1 Year | | | | -10.58 | |
| |
| Class C Shares | | | | | |
| Inception (8/29/14) | | | | -13.04 | % |
| 1 Year | | | | -6.86 | |
| |
| Class R Shares | | | | | |
| Inception (8/29/14) | | | | -12.60 | % |
| 1 Year | | | | -5.47 | |
| |
| Class Y Shares | | | | | |
| Inception (8/29/14) | | | | -12.16 | % |
| 1 Year | | | | -5.14 | |
| |
| Class R5 Shares | | | | | |
| Inception (8/29/14) | | | | -12.16 | % |
| 1 Year | | | | -5.14 | |
| |
| Class R6 Shares | | | | | |
| Inception (8/29/14) | | | | -12.16 | % |
| 1 Year | | | | -5.14 | |
Class A share performance reflects the maximum 5.50% sales charge, and Class C share performance reflects the applicable contingent deferred sales charge (CDSC) for the period involved. The CDSC on Class C shares is 1% for the first year after purchase. Class R, Class Y, Class R5 and Class R6 class shares do not have a front-end sales charge or a CDSC; therefore, performance is at net asset value.
The performance of the Fund’s share classes will differ primarily due to different sales charge structures and class expenses.
Fund performance reflects any applicable fee waivers and/or expense reimbursements. Had the adviser not waived fees and/or reimbursed expenses currently or in the past, returns would have been lower. See current prospectus for more information.
| 1 | Total annual Fund operating expenses after any contractual fee waivers and/or expense reimbursements by the adviser in effect through at least February 28, 2018. See current prospectus for more information. |
Invesco MLP Fund’s investment objective is capital appreciation and, secondarily, income.
| ∎ | | Unless otherwise stated, information presented in this report is as of October 31, 2017, and is based on total net assets. |
| ∎ | | Unless otherwise noted, all data provided by Invesco. |
| ∎ | | To access your Fund’s reports/prospectus, visit invesco.com/fundreports. |
About share classes
| ∎ | | Class R shares are generally available only to employer sponsored retirement and benefit plans. Please see the prospectus for more information. |
| ∎ | | Class Y shares are available only to certain investors. Please see the prospectus for more information. |
| ∎ | | Class R5 shares and Class R6 shares are available for use by retirement plans that meet certain standards and for institutional investors. Class R6 shares are also available through intermediaries that have established an agreement with Invesco Distributors, Inc. to make such shares available for use in retail omnibus accounts. Please see the prospectus for more information. |
Principal risks of investing in the Fund
| ∎ | | Debt securities risk. The prices of debt securities held by the Fund will be affected by changes in interest rates, the creditworthiness of the issuer and other factors. An increase in prevailing interest rates typically causes the value of existing debt securities to fall and often has a greater impact on longer-duration debt securities and higher quality debt securities. Falling interest rates will cause the Fund to reinvest the proceeds of debt securities that have been repaid by the issuer at lower interest rates. Falling interest rates may also reduce the Fund’s distributable income because interest payments on floating rate debt instruments held by the Fund will decline. The Fund could lose money on investments in debt securities if the issuer or borrower fails to meet its obligations to make interest payments and/or to repay principal in a timely manner. Changes in an issuer’s financial strength, the market’s perception of such strength or in the credit rating of the issuer or the security may affect the value of debt securities. The Adviser’s credit analysis may fail to anticipate such changes, which could result |
| | in buying a debt security at an inopportune time or failing to sell a debt security in advance of a price decline or other credit event. |
| ∎ | | Deferred tax risk. The Fund is classified for federal tax purposes as a taxable regular corporation or so-called Sub-chapter “C” corporation. As a “C” corporation, the Fund is subject to U.S. federal income tax on its taxable income at the graduated rates applicable to corporations (currently at a maximum rate of 35%) as well as state and local income taxes. The Fund will not benefit from the current favorable federal income tax rates on long-term capital gains and Fund income, losses and expenses will not be passed through to the Fund’s shareholders. An investment strategy whereby a fund is taxed as a regular corporation, or “C” corporation, rather than as a regulated investment company for U.S. federal income tax purposes, is a relatively recent strategy for open-end registered investment companies such as the Fund. This strategy involves complicated accounting, tax, net asset value (NAV) and share valuation aspects that would cause the Fund to differ significantly from most other open-end registered investment companies. |
| ∎ | | Energy infrastructure MLP risk. The Fund will concentrate its investments in the energy sector. Energy infrastructure MLPs are subject to a variety of industry specific risk factors, including reduced volumes of energy commodities available for transporting, processing, storing or distributing; changes in energy commodity prices; a sustained reduced demand for crude oil, natural gas and refined petroleum products; depletion of the natural gas reserves or other commodities if not replaced; natural disasters, extreme weather and environmental hazards; rising interest rates which could drive investors into other investment opportunities; environmental damage claims; and threats of attack by terrorists on energy assets. |
| | | In addition, taxes, government regulation, international politics, price and supply fluctuations, volatile interest rates and energy conservation may cause difficulties for energy infrastructure MLPs. |
| ∎ | | High yield debt securities (junk bond) risk. Investments in high yield debt securities (“junk bonds”) and other lower-rated securities will subject the Fund to substantial risk of loss. These securities are considered to be speculative with respect to the issuer’s ability to pay interest and principal when due, are more susceptible to default or decline in market value and are less liquid than investment grade debt securities. Prices of high yield debt securities tend to be very volatile. |
| ∎ | | Management risk. The Fund is actively managed and depends heavily on the Adviser’s judgment about markets, interest rates or the attractiveness, relative values, liquidity, or potential appreciation of particular investments made for the Fund’s portfolio. The Fund could experience losses if these judgments prove to be incorrect. Additionally, legislative, regulatory, or tax developments may adversely affect management of the Fund and, therefore, the ability of the Fund to achieve its investment objective. |
| ∎ | | Market risk. The market values of the Fund’s investments, and therefore the value of the Fund’s shares, will go up and down, sometimes rapidly or unpredictably. Market risk may affect a single issuer, industry or section of the economy, or it may affect the market as a whole. Individual stock prices tend to go up and down more dramatically than those of certain other types of investments, such as bonds. During a general downturn in the financial markets, multiple asset classes may decline in value. When markets perform well, there can be no assurance that specific investments held by the Fund will rise in value. |
| ∎ | | MLP risk. The Fund invests principally in securities of MLPs, which are subject to the following risks: |
| | - | Limited partner risk. An MLP is a public limited partnership or limited liability company taxed as a partnership under the Internal Revenue Code of 1986, as amended (the Code). Although the characteristics of MLPs closely resemble a |
|
This report must be accompanied or preceded by a currently effective Fund prospectus, which contains more complete information, including sales charges and expenses. Investors should read it carefully before investing. |
|
|
| NOT FDIC INSURED | MAY LOSE VALUE | NO BANK GUARANTEE |
| | traditional limited partnership, a major difference is that MLPs may trade on a public exchange or in the over-the-counter market. The risks of investing in an MLP are similar to those of investing in a partnership, including more flexible governance structures, which could result in less protection for investors than investments in a corporation. Investors in an MLP normally would not be liable for the debts of the MLP beyond the amount that the investor has contributed but investors may not be shielded to the same extent that a shareholder of a corporation would be. In certain circumstances, creditors of an MLP would have the right to seek return of capital distributed to a limited partner, which right would continue after an investor sold its investment in the MLP. |
| | - | Liquidity risk. The ability to trade on a public exchange or in the over-the-counter market provides a certain amount of liquidity not found in many limited partnership investments. However, MLP interests may be less liquid than conventional publicly traded securities and, therefore, more difficult to trade at desirable times and/or prices. |
| | - | Interest rate risk. In addition, MLP distributions may be reduced by fees and other expenses incurred by the MLP. MLPs generally are considered interest-rate sensitive investments. During periods of interest rate volatility, these investments may not provide attractive returns. |
| | - | General partner risk. The holder of the general partner or managing member interest can be liable in certain circumstances for amounts greater than the amount of the holder’s investment in the general partner or managing member. |
| ∎ | | MLP tax risk. MLPs taxed as partnerships do not pay U.S. federal income tax at the partnership level. A change in current tax law, or a change in the underlying business mix of a given MLP, however, could result in an MLP being classified as a corporation for U.S. federal income tax purposes, which would have the effect of reducing the amount of cash available for |
| | distribution by the MLP and, as a result, could result in a reduction of the value of the Fund’s investment, and consequently your investment in the Fund and lower income. Each year, the Fund will send you an annual tax statement (Form 1099) to assist you in completing your federal, state and local tax returns. If an MLP in which the Fund invests amends its partnership tax return, the Fund will, when necessary, send you a corrected Form 1099, which could, in turn, require you to amend your federal, state or local tax returns. |
| ∎ | | Non-diversification risk. The Fund is non-diversified and can invest a greater portion of its assets in the obligations or securities of a small number of issuers or any single issuer than a diversified fund can. A change in the value of one or a few issuers’ securities will therefore affect the value of the Fund more than if it was a diversified fund. |
| ∎ | | Small- and mid-capitalization companies risks. Small- and mid-capitalization companies tend to be more vulnerable to changing market conditions, may have little or no operating history or track record of success, and may have more limited product lines and markets, less experienced management and fewer financial resources than larger companies. These companies’ securities may be more volatile and less liquid than those of more established companies, and their returns may vary, sometimes significantly, from the overall securities market. |
About indexes used in this report
| ∎ | | The S&P 500® Index is an unmanaged index considered representative of the US stock market. |
| ∎ | | The Alerian MLP Index is designed to capture the performance of energy master limited partnerships (MLPs). |
| ∎ | | The Lipper Energy MLP Funds Index is an unmanaged index considered representative of energy MLP funds tracked by Lipper. |
| ∎ | | The Fund is not managed to track the performance of any particular index, including the index(es) described here, and consequently, the performance of the Fund may deviate significantly from the performance of the index(es). |
| ∎ | | A direct investment cannot be made in an index. Unless otherwise indicated, index results include reinvested dividends, and they do not reflect sales charges. Performance of the peer group, if applicable, reflects fund expenses; performance of a market index does not. |
Other information
| ∎ | | CPA® and Certified Public Accountant® are trademarks owned by the American Institute of Certified Public Accountants. |
| ∎ | | The returns shown in management’s discussion of Fund performance are based on net asset values (NAVs) calculated for shareholder transactions. Generally accepted accounting principles require adjustments to be made to the net assets of the Fund at period end for financial reporting purposes, and as such, the NAVs for shareholder transactions and the returns based on those NAVs may differ from the NAVs and returns reported in the Financial Highlights. |
| ∎ | | Sector classifications used in this report are generally according to the Energy MLP Classification Standard, which was developed by and is the exclusive property and a service mark of Alerian. |
Schedule of Investments(a)
October 31, 2017
| | | | | | | | |
| | | Units | | | Value | |
Master Limited Partnerships–93.42% | |
| Gathering & Processing MLP–16.22% | |
Antero Midstream Partners L.P. | | | 8,360 | | | $ | 239,932 | |
DCP Midstream, L.P. | | | 8,196 | | | | 271,124 | |
Enable Midstream Partners, L.P. | | | 4,316 | | | | 65,128 | |
EnLink Midstream Partners, L.P. | | | 8,023 | | | | 122,832 | |
EQT Midstream Partners L.P. | | | 4,966 | | | | 362,816 | |
Rice Midstream Partners L.P. | | | 13,634 | | | | 282,769 | |
Western Gas Partners, L.P. | | | 5,720 | | | | 273,931 | |
| | | | | | | | 1,618,532 | |
|
| General Partner (MLP)–0.75% | |
Energy Transfer Equity, L.P. | | | 4,245 | | | | 75,349 | |
|
| Marine–3.09% | |
GasLog Partners L.P. (Monaco) | | | 12,968 | | | | 307,990 | |
|
| Midstream Diversified–10.48% | |
Energy Transfer Partners, L.P. | | | 60,025 | | | | 1,045,035 | |
|
| Natural Gas Pipelines & Storage–8.08% | |
Boardwalk Pipeline Partners, L.P. | | | 14,983 | | | | 210,062 | |
Cheniere Energy Partners, L.P. | | | 9,117 | | | | 255,185 | |
Tallgrass Energy Partners L.P. | | | 5,799 | | | | 253,068 | |
TC Pipelines, L.P. | | | 1,643 | | | | 87,555 | |
| | | | | | | | 805,870 | |
|
| Non-Traditional–1.43% | |
Westlake Chemical Partners L.P. | | | 6,394 | | | | 142,266 | |
|
| Pipelines & Midstream Diversified–22.32% | |
Enbridge Energy Partners, L.P. | | | 17,719 | | | | 267,203 | |
Enterprise Products Partners L.P. | | | 33,340 | | | | 816,830 | |
Plains All American Pipeline, L.P. | | | 25,630 | | | | 511,831 | |
Williams Partners L.P. | | | 17,023 | | | | 630,532 | |
| | | | | | | | 2,226,396 | |
|
| Refined Products Pipelines & Terminals–29.51% | |
Andeavor Logistics L.P. | | | 5,372 | | | | 242,707 | |
Buckeye Partners, L.P. | | | 3,065 | | | | 162,782 | |
Delek Logistics Partners L.P. | | | 4,086 | | | | 125,440 | |
Genesis Energy, L.P. | | | 7,192 | | | | 167,502 | |
| | | | | | | | |
| | | Units | | | Value | |
| Refined Products Pipelines & Terminals–(continued) | |
Magellan Midstream Partners, L.P. | | | 13,541 | | | $ | 930,402 | |
MPLX L.P. | | | 25,352 | | | | 893,912 | |
PBF Logistics L.P. | | | 6,113 | | | | 120,426 | |
Phillips 66 Partners L.P. | | | 5,973 | | | | 301,099 | |
| | | | | | | | 2,944,270 | |
|
| Refinery Logistics–1.54% | |
Shell Midstream Partners, L.P. | | | 6,064 | | | | 154,086 | |
Total Master Limited Partnerships
(Cost $9,925,985) | | | | 9,319,794 | |
| | |
| | | Shares | | | | |
Common Stocks–5.57% | |
| Gathering & Processing–0.90% | |
Targa Resources Corp. | | | 2,164 | | | | 89,806 | |
|
| General Partner (C-Corp.)–2.63% | |
ONEOK, Inc. | | | 1,329 | | | | 72,110 | |
Williams Cos., Inc. (The) | | | 6,662 | | | | 189,867 | |
| | | | | | | | 261,977 | |
|
| Global Infrastructure–0.99% | |
Cheniere Energy, Inc.(b) | | | 2,104 | | | | 98,341 | |
|
| Oilfield Services–1.05% | |
U.S. Silica Holdings, Inc. | | | 3,449 | | | | 105,229 | |
Total Common Stocks
(Cost $599,737) | | | | 555,353 | |
|
Money Market Funds–0.96% | |
Invesco Government & Agency Portfolio–Institutional Class, 0.95%(c) | | | 57,682 | | | | 57,682 | |
Invesco Treasury Portfolio–Institutional Class, 0.94%(c) | | | 38,455 | | | | 38,455 | |
Total Money Market Funds
(Cost $96,137) | | | | 96,137 | |
TOTAL INVESTMENTS IN SECURITIES–99.95% (Cost $10,621,859) | | | | 9,971,284 | |
OTHER ASSETS LESS LIABILITIES–0.05% | | | | 4,620 | |
NET ASSETS–100.00% | | | $ | 9,975,904 | |
Notes to Schedule of Investments:
| (a) | Sector classifications used in this report are generally according to the Energy MLP Classification Standard, which was developed by and is the exclusive property and a service mark of Alerian. |
| (b) | Non-income producing security. |
| (c) | The money market fund and the Fund are affiliated by having the same investment adviser. The rate shown is the 7-day SEC standardized yield as of October 31, 2017. |
See accompanying Notes to Financial Statements which are an integral part of the financial statements.
10 Invesco MLP Fund
Statement of Assets and Liabilities
October 31, 2017
| | | | |
Assets: | | | | |
Investments in securities, at value (Cost $10,525,722) | | $ | 9,875,147 | |
Investments in affiliated money market funds, at value and cost | | | 96,137 | |
Receivable for: | | | | |
Fund shares sold | | | 6,446 | |
Dividends | | | 44,642 | |
Fund expenses absorbed | | | 186,958 | |
Deferred tax asset, net | | | 0 | |
Other assets | | | 44,904 | |
Total assets | | | 10,254,234 | |
| |
Liabilities: | | | | |
Payable for: | | | | |
Fund shares reacquired | | | 1,190 | |
Accrued fees to affiliates | | | 10,348 | |
Accrued trustees’ and officers’ fees and benefits | | | 1,955 | |
Accrued other operating expenses | | | 264,837 | |
Total liabilities | | | 278,330 | |
Net assets applicable to shares outstanding | | $ | 9,975,904 | |
| |
Net assets consist of: | | | | |
Shares of beneficial interest | | $ | 13,521,155 | |
Undistributed net investment income (loss), net of taxes | | | (1,422,768 | ) |
Undistributed net realized gain (loss), net of taxes | | | (1,471,908 | ) |
Net unrealized appreciation (depreciation), net of taxes | | | (650,575 | ) |
| | | $ | 9,975,904 | |
| | | | |
Net Assets: | | | | |
Class A | | $ | 3,618,679 | |
Class C | | $ | 1,087,529 | |
Class R | | $ | 347,249 | |
Class Y | | $ | 4,911,507 | |
Class R5 | | $ | 5,470 | |
Class R6 | | $ | 5,470 | |
|
Shares outstanding, no par value,
with an unlimited number of shares authorized: | |
Class A | | | 662,333 | |
Class C | | | 199,327 | |
Class R | | | 63,569 | |
Class Y | | | 898,704 | |
Class R5 | | | 1,001 | |
Class R6 | | | 1,001 | |
Class A: | | | | |
Net asset value per share | | $ | 5.46 | |
Maximum offering price per share | | | | |
(Net asset value of $5.46 ¸ 94.50%) | | $ | 5.78 | |
Class C: | | | | |
Net asset value and offering price per share | | $ | 5.46 | |
Class R: | | | | |
Net asset value and offering price per share | | $ | 5.46 | |
Class Y: | | | | |
Net asset value and offering price per share | | $ | 5.47 | |
Class R5: | | | | |
Net asset value and offering price per share | | $ | 5.46 | |
Class R6: | | | | |
Net asset value and offering price per share | | $ | 5.46 | |
See accompanying Notes to Financial Statements which are an integral part of the financial statements.
11 Invesco MLP Fund
Statement of Operations
For the year ended October 31, 2017
| | | | |
Investment income: | | | | |
Dividends (net of return of capital distributions of $669,624) | | $ | 41,332 | |
Dividends from affiliated money market funds | | | 881 | |
Total investment income | | | 42,213 | |
| |
Expenses: | | | | |
Advisory fees | | | 110,203 | |
Administrative services fees | | | 50,000 | |
Custodian fees | | | 8,136 | |
Distribution fees: | | | | |
Class A | | | 11,462 | |
Class C | | | 12,233 | |
Class R | | | 1,455 | |
Transfer agent fees — A, C, R and Y | | | 19,973 | |
Transfer agent fees — R5 | | | 6 | |
Transfer agent fees — R6 | | | 6 | |
Trustees’ and officers’ fees and benefits | | | 20,392 | |
Registration and filing fees | | | 82,968 | |
Reports to shareholders | | | 19,804 | |
Professional services fees | | | 189,888 | |
Taxes | | | 2,072 | |
Other | | | 9,123 | |
Total expenses, before waivers and taxes | | | 537,721 | |
Less: Fees waived, expenses reimbursed and expense offset arrangement(s) | | | (393,687 | ) |
Net expenses, before taxes | | | 144,034 | |
Net investment income (loss), before taxes | | | (101,821 | ) |
Net tax expense (benefit) | | | 0 | |
Net investment income (loss), net of taxes | | | (101,821 | ) |
| |
Realized and unrealized gain (loss) from: | | | | |
Net realized gain from: | | | | |
Investment securities | | | 282,901 | |
Net tax expense (benefit) | | | 0 | |
Net realized gain, net of taxes | | | 282,901 | |
Change in net unrealized appreciation (depreciation) of: | | | | |
Investment securities | | | (882,581 | ) |
Net tax expense (benefit) | | | 0 | |
Net change in net unrealized appreciation (depreciation) of investment securities, net of taxes | | | (882,581 | ) |
Net realized and unrealized gain (loss), net of taxes | | | (599,680 | ) |
Net increase (decrease) in net assets resulting from operations | | $ | (701,501 | ) |
See accompanying Notes to Financial Statements which are an integral part of the financial statements.
12 Invesco MLP Fund
Statement of Changes in Net Assets
For the years ended October 31, 2017 and 2016
| | | | | | | | |
| | | 2017 | | | 2016 | |
Operations: | | | | | | | | |
Net investment income (loss), net of taxes | | $ | (101,821 | ) | | $ | (80,805 | ) |
Net realized gain (loss), net of taxes | | | 282,901 | | | | (575,663 | ) |
Change in net unrealized appreciation (depreciation), net of taxes | | | (882,581 | ) | | | 1,016,948 | |
Net increase (decrease) in net assets resulting from operations | | | (701,501 | ) | | | 360,480 | |
| | |
Return of Capital: | | | | | | | | |
Class A | | | (241,759 | ) | | | (182,591 | ) |
Class C | | | (55,987 | ) | | | (25,040 | ) |
Class R | | | (14,486 | ) | | | (8,321 | ) |
Class Y | | | (273,122 | ) | | | (163,922 | ) |
Class R5 | | | (344 | ) | | | (358 | ) |
Class R6 | | | (344 | ) | | | (358 | ) |
Total return of capital | | | (586,042 | ) | | | (380,590 | ) |
| | |
Share transactions–net: | | | | | | | | |
Class A | | | 23,111 | | | | 1,616,085 | |
Class C | | | (55,702 | ) | | | 1,089,108 | |
Class R | | | 139,522 | | | | 176,423 | |
Class Y | | | 2,025,103 | | | | 1,433,308 | |
Net increase in net assets resulting from share transactions | | | 2,132,034 | | | | 4,314,924 | |
Net increase in net assets | | | 844,491 | | | | 4,294,814 | |
| | |
Net assets: | | | | | | | | |
Beginning of year | | | 9,131,413 | | | | 4,836,599 | |
End of year (includes undistributed net investment income (loss), net of taxes of $(1,422,768) and $(725,036), respectively) | | $ | 9,975,904 | | | $ | 9,131,413 | |
Notes to Financial Statements
October 31, 2017
NOTE 1—Significant Accounting Policies
Invesco MLP Fund (the “Fund”) is a series portfolio of AIM Investment Funds (Invesco Investment Funds) (the “Trust”). The Trust is organized as a Delaware statutory trust and is registered under the Investment Company Act of 1940, as amended (the “1940 Act”), as an open-end series management investment company consisting of twenty separate series portfolios, each authorized to issue an unlimited number of shares of beneficial interest. The assets, liabilities and operations of each portfolio are accounted for separately. Information presented in these financial statements pertains only to the Fund. Matters affecting each portfolio or class will be voted on exclusively by the shareholders of such portfolio or class.
The Fund’s investment objective is capital appreciation and secondarily income.
The Fund currently consists of six different classes of shares: Class A, Class C, Class R, Class Y, Class R5 and Class R6. Class Y shares are available only to certain investors. Class A shares are sold with a front-end sales charge unless certain waiver criteria are met and under certain circumstances load waived shares may be subject to contingent deferred sales charges (“CDSC”). Class C shares are sold with a CDSC. Class R, Class Y, Class R5 and Class R6 shares are sold at net asset value.
The Fund is an investment company and accordingly follows the investment company accounting and reporting guidance in accordance with Financial Accounting Standards Board Accounting Standards Codification Topic 946, Financial Services — Investment Companies.
The following is a summary of the significant accounting policies followed by the Fund in the preparation of its financial statements.
| A. | Security Valuations — Securities, including restricted securities, are valued according to the following policy. |
A security listed or traded on an exchange (except convertible securities) is valued at its last sales price or official closing price as of the close of the customary trading session on the exchange where the security is principally traded, or lacking any sales or official closing price on a particular day, the security may be valued at the closing bid price on that day. Securities traded in the over-the-counter market are valued based on prices furnished by independent pricing services or market makers. When such securities are valued by an independent pricing service they may be considered fair valued. Futures contracts are valued at the final settlement price set by an exchange on which they are principally traded. Listed options are valued at the mean between the last bid and asked prices from the exchange on which they are principally traded. Options not listed on an exchange are valued by an independent source at the mean between the last bid and asked prices. For purposes of determining net asset value (“NAV”) per share, futures and option contracts generally are valued 15 minutes after the close of the customary trading session of the New York Stock Exchange (“NYSE”).
13 Invesco MLP Fund
Investments in open-end and closed-end registered investment companies that do not trade on an exchange are valued at the end-of-day net asset value per share. Investments in open-end and closed-end registered investment companies that trade on an exchange are valued at the last sales price or official closing price as of the close of the customary trading session on the exchange where the security is principally traded.
Debt obligations (including convertible securities) and unlisted equities are fair valued using an evaluated quote provided by an independent pricing service. Evaluated quotes provided by the pricing service may be determined without exclusive reliance on quoted prices, and may reflect appropriate factors such as institution-size trading in similar groups of securities, developments related to specific securities, dividend rate (for unlisted equities), yield (for debt obligations), quality, type of issue, coupon rate (for debt obligations), maturity (for debt obligations), individual trading characteristics and other market data. Pricing services generally value debt obligations assuming orderly transactions of institutional round lot size, but a fund may hold or transact in the same securities in smaller, odd lot sizes. Odd lots often trade at lower prices than institutional round lots. Debt obligations are subject to interest rate and credit risks. In addition, all debt obligations involve some risk of default with respect to interest and/or principal payments.
Foreign securities’ (including foreign exchange contracts) prices are converted into U.S. dollar amounts using the applicable exchange rates as of the close of the NYSE. If market quotations are available and reliable for foreign exchange-traded equity securities, the securities will be valued at the market quotations. Because trading hours for certain foreign securities end before the close of the NYSE, closing market quotations may become unreliable. If between the time trading ends on a particular security and the close of the customary trading session on the NYSE, events occur that the investment adviser determines are significant and make the closing price unreliable, the Fund may fair value the security. If the event is likely to have affected the closing price of the security, the security will be valued at fair value in good faith using procedures approved by the Board of Trustees. Adjustments to closing prices to reflect fair value may also be based on a screening process of an independent pricing service to indicate the degree of certainty, based on historical data, that the closing price in the principal market where a foreign security trades is not the current value as of the close of the NYSE. Foreign securities’ prices meeting the approved degree of certainty that the price is not reflective of current value will be priced at the indication of fair value from the independent pricing service. Multiple factors may be considered by the independent pricing service in determining adjustments to reflect fair value and may include information relating to sector indices, American Depositary Receipts and domestic and foreign index futures. Foreign securities may have additional risks including exchange rate changes, potential for sharply devalued currencies and high inflation, political and economic upheaval, the relative lack of issuer information, relatively low market liquidity and the potential lack of strict financial and accounting controls and standards.
Securities for which market prices are not provided by any of the above methods may be valued based upon quotes furnished by independent sources. The last bid price may be used to value equity securities. The mean between the last bid and asked prices is used to value debt obligations, including corporate loans.
Securities for which market quotations are not readily available or became unreliable are valued at fair value as determined in good faith by or under the supervision of the Trust’s officers following procedures approved by the Board of Trustees. Issuer specific events, market trends, bid/asked quotes of brokers and information providers and other market data may be reviewed in the course of making a good faith determination of a security’s fair value.
The Fund may invest in securities that are subject to interest rate risk, meaning the risk that the prices will generally fall as interest rates rise and, conversely, the prices will generally rise as interest rates fall. Specific securities differ in their sensitivity to changes in interest rates depending on their individual characteristics. Changes in interest rates may result in increased market volatility, which may affect the value and/or liquidity of certain Fund investments.
Valuations change in response to many factors including the historical and prospective earnings of the issuer, the value of the issuer’s assets, general economic conditions, interest rates, investor perceptions and market liquidity. Because of the inherent uncertainties of valuation, the values reflected in the financial statements may materially differ from the value received upon actual sale of those investments.
| B. | Securities Transactions and Investment Income — Securities transactions are accounted for on a trade date basis. Realized gains or losses on sales are computed on the basis of specific identification of the securities sold. Interest income (net of withholding tax, if any) is recorded on the accrual basis from settlement date. Dividend income (net of withholding tax, if any) is recorded on the ex-dividend date. |
The Fund may periodically participate in litigation related to Fund investments. As such, the Fund may receive proceeds from litigation settlements. Any proceeds received are included in the Statement of Operations as realized gain (loss) for investments no longer held and as unrealized gain (loss) for investments still held.
Brokerage commissions and mark ups are considered transaction costs and are recorded as an increase to the cost basis of securities purchased and/or a reduction of proceeds on a sale of securities. Such transaction costs are included in the determination of net realized and unrealized gain (loss) from investment securities reported in the Statement of Operations and the Statement of Changes in Net Assets and the net realized and unrealized gains (losses) on securities per share in the Financial Highlights. Transaction costs are included in the calculation of the Fund’s net asset value and, accordingly, they reduce the Fund’s total returns. These transaction costs are not considered operating expenses and are not reflected in net investment income reported in the Statement of Operations and the Statement of Changes in Net Assets, or the net investment income per share and the ratios of expenses and net investment income reported in the Financial Highlights, nor are they limited by any expense limitation arrangements between the Fund and the investment adviser.
The Fund allocates income and realized and unrealized capital gains and losses to a class based on the relative net assets of each class.
| C. | Country Determination — For the purposes of making investment selection decisions and presentation in the Schedule of Investments, the investment adviser may determine the country in which an issuer is located and/or credit risk exposure based on various factors. These factors include the laws of the country under which the issuer is organized, where the issuer maintains a principal office, the country in which the issuer derives 50% or more of its total revenues and the country that has the primary market for the issuer’s securities, as well as other criteria. Among the other criteria that may be evaluated for making this determination are the country in which the issuer maintains 50% or more of its assets, the type of security, financial guarantees and enhancements, the nature of the collateral and the sponsor organization. Country of issuer and/or credit risk exposure has been determined to be the United States of America, unless otherwise noted. |
| D. | Distributions – Distributions, if any, are declared and paid quarterly and are recorded on the ex-dividend date. The estimated characterization of the distribution paid will be either ordinary income or a return of capital. The actual tax character of a distribution made by the Fund will not be determined until after the Fund’s fiscal year end. It is anticipated that a significant portion of a distribution will be return of capital. |
14 Invesco MLP Fund
| E. | Master Limited Partnerships — The Fund primarily invests in Master Limited Partnerships (“MLPs”). MLPs are publicly traded partnerships and limited liability companies taxed as partnerships under the Internal Revenue Code of 1986, as amended (the “Internal Revenue Code”). The Fund principally invests in MLPs that derive their revenue primarily from businesses involved in the gathering, transporting, processing, treating, storing, refining, distributing, mining or marketing of natural gas, natural gas liquids, crude oil, refined products or coal (“energy infrastructure MLPs”). The Fund is a partner in each MLP; accordingly, the Fund is required to take into account the Fund’s allocable share of income, gains, losses, deductions, expenses, and tax credits recognized by each MLP. |
The Fund is non-diversified and will concentrate its investments in the energy sector. Energy infrastructure MLPs are subject to a variety of industry specific risk factors that may adversely affect their business or operations, including a decrease in production or reduced volumes of natural gas or other energy commodities available for transporting, processing, storing or distributing; changes in energy commodity prices; a sustained reduced demand for crude oil, natural gas and refined petroleum products; depletion of natural gas reserves or other commodities if not replaced; natural disasters, extreme weather and environmental hazards; rising interest rates, how facilities are constructed, maintained and operated, environmental and safety controls, and the prices they may charge for products and services. In addition, taxes, government regulation, international politics, price, and supply fluctuations, volatile interest rates and energy conservation may cause difficulties for energy infrastructure MLPs.
MLPs may be less liquid and subject to more abrupt or erratic price movements than conventional publicly traded securities.
| F. | Return of Capital — Distributions received from the Fund’s investments in MLPs generally are comprised of income and return of capital. The Fund records investment income and return of capital based on estimates made at the time such distributions are received. The return of capital portion of the distribution is a reduction to investment income that results in an equivalent reduction in the cost basis of the associated investments and increases net realized gains (losses) and change in unrealized appreciation (depreciation). Such estimates are based on historical information available from each MLP and other industry sources. These estimates will subsequently be revised and may materially differ primarily based on information received from the MLPs after their tax reporting periods are concluded. For the year ended October 31, 2017, the Fund estimated that 100% of the MLP distributions received would be treated as return of capital. |
| G. | Federal Income Taxes — The Fund does not intend to qualify as a regulated investment company pursuant to Subchapter M of the Internal Revenue Code. The Fund is treated as a regular corporation, or “C” corporation, for U.S. federal income tax purposes and generally is subject to U.S. federal income tax on its taxable income at the graduated rates applicable to corporations. In addition, as a regular corporation, the Fund may be subject to state and local taxes in jurisdictions in which the MLPs operate. The estimate state tax rate is based on a periodic analysis of the Fund’s holdings. The Fund may also be subject to a federal alternative minimum tax on its alternative minimum taxable income to the extent that the alternative minimum tax exceeds the Fund’s regular federal income tax liability. |
Taxes include current and deferred taxes. Current taxes reflect the estimated tax liability of the Fund as of a measurement date based on taxable income. Deferred taxes reflect estimates of (i) taxes on net unrealized gains (losses), which are attributable to the difference between fair market value and tax basis, (ii) the net tax effects of temporary differences between the carrying amounts of assets and liabilities for financial reporting purposes and the amounts used for tax purposes, and (iii) the net tax benefit of accumulated net operating losses, capital loss carryforwards and other tax attributes.
The Fund’s deferred tax asset (“DTA”) and/or liability balances are estimated using estimates of effective tax rates expected to apply to taxable income in the years such balances are realized. A DTA will be recognized for temporary book/tax differences, net of unrealized losses, and carryforwards (net operating losses, capital loss carryforward, or tax credits). To the extent the Fund has a DTA, the Fund will assess whether a valuation allowance is required to offset the value of a portion, or all, of the DTA. Prior year ordinary income or capital gains (carrybacks), unrealized net gains, future reversals of existing taxable timing differences, forecast of future profitability (based on historical evidence), potential tax planning strategies, unsettled circumstances, and other evidence will be used in determining the valuation allowance. The valuation allowance is reviewed periodically and the Fund may modify its estimates or assumptions regarding the net deferred tax asset or liability balances and any applicable valuation allowance.
The Fund recognizes interest and penalties associated with underpayment of federal and state income taxes, if any, in tax expense. The Fund recognizes the tax benefits of uncertain tax positions only when the position is more likely than not to be sustained. Management has analyzed the Fund’s uncertain tax positions and concluded that no liability for unrecognized tax benefits should be recorded related to uncertain tax positions. Management is not aware of any tax positions for which it is reasonably possible that the total amounts of unrecognized tax benefits will change materially in the next 12 months.
The Fund files tax returns in the U.S. Federal jurisdiction and certain other jurisdictions. Generally, the Fund is subject to examinations by such taxing authorities for up to three years after the filing of the return for the tax period.
| H. | Expenses — Fees provided for under the Rule 12b-1 plan of a particular class of the Fund are charged to the operations of such class. Transfer agency fees and expenses and other shareholder recordkeeping fees and expenses attributable to Class R5 and Class R6 are allocated to each share class based on relative net assets. Sub-accounting fees attributable to Class R5 are charged to the operations of the class. Transfer agency fees and expenses and other shareholder recordkeeping fees and expenses relating to all other classes are allocated among those classes based on relative net assets. All other expenses are allocated among the classes based on relative net assets. |
| I. | Accounting Estimates — The preparation of financial statements in conformity with accounting principles generally accepted in the United States of America (“GAAP”) requires management to make estimates and assumptions that affect the reported amounts of assets and liabilities at the date of the financial statements and the reported amounts of revenues and expenses during the reporting period including estimates and assumptions related to taxation. Actual results could differ from those estimates by a significant amount. In addition, the Fund monitors for material events or transactions that may occur or become known after the period-end date and before the date the financial statements are released to print. |
| J. | Indemnifications — Under the Trust’s organizational documents, each Trustee, officer, employee or other agent of the Trust is indemnified against certain liabilities that may arise out of the performance of their duties to the Fund. Additionally, in the normal course of business, the Fund enters into contracts, including the Fund’s servicing agreements, that contain a variety of indemnification clauses. The Fund’s maximum exposure under these arrangements is unknown as this would involve future claims that may be made against the Fund that have not yet occurred. The risk of material loss as a result of such indemnification claims is considered remote. |
15 Invesco MLP Fund
NOTE 2—Advisory Fees and Other Fees Paid to Affiliates
The Trust has entered into a master investment advisory agreement with Invesco Advisers, Inc. (the “Adviser” or “Invesco”). Under the terms of the investment advisory agreement, the Fund accrues daily and pays monthly an advisory fee to the Adviser based on the annual rate of the Fund’s average daily net assets as follows:
| | | | |
| Average Daily Net Assets | | Rate | |
First $1.0 billion | | | 1.00% | |
Next $1.5 billion | | | 0.95% | |
Next $2.0 billion | | | 0.93% | |
Next $3.5 billion | | | 0.91% | |
Over $8 billion | | | 0.90% | |
For the year ended October 31, 2017, the effective advisory fees incurred by the Fund was 1.00%.
Under the terms of a master sub-advisory agreement between the Adviser and each of Invesco Asset Management Deutschland GmbH, Invesco Asset Management Limited, Invesco Asset Management (Japan) Limited, Invesco Hong Kong Limited, Invesco Senior Secured Management, Inc. and Invesco Canada Ltd. and separate sub-advisory agreements with Invesco PowerShares Capital Management LLC and Invesco Asset Management (India) Private Limited (collectively, the “Affiliated Sub-Advisers”) the Adviser, not the Fund, will pay 40% of the fees paid to the Adviser to any such Affiliated Sub-Adviser(s) that provide(s) discretionary investment management services to the Fund based on the percentage of assets allocated to such Affiliated Sub-Adviser(s).
Effective January 1, 2017, the Adviser has contractually agreed, through at least February 28, 2019, to waive advisory fees and/or reimburse expenses of all shares to the extent necessary to limit total annual fund operating expenses after fee waiver and/or expense reimbursement (excluding certain items discussed below) of Class A, Class C, Class R, Class Y, Class R5 and Class R6 shares to 1.28%, 2.03%, 1.53%, 1.03%, 1.03% and 1.03%, respectively, of the Fund’s average daily net assets (the “expense limits”). Prior to January 1, 2017, The Adviser had contractually agreed to waive advisory fees and/or reimburse expenses of all shares to the extent necessary to limit total annual fund operating expenses after fee waiver and/or expense reimbursement (excluding certain items discussed below) of Class A, Class C, Class R, Class Y, Class R5 and Class R6 shares to 1.50%, 2.25%, 1.75%, 1.25%, 1.25% and 1.25%, respectively, of the Fund’s average daily net assets. In determining the Adviser’s obligation to waive advisory fees and/or reimburse expenses, the following expenses are not taken into account, and could cause the total annual fund operating expenses after fee waiver and/or expense reimbursement to exceed the numbers reflected above: (1) interest; (2) taxes; (3) dividend expense on short sales; (4) extraordinary or non-routine items, including litigation expenses; and (5) expenses that the Fund has incurred but did not actually pay because of an expense offset arrangement. Unless Invesco continues the fee waiver agreement, it will terminate on February 28, 2019. During its term, the fee waiver agreement cannot be terminated or amended to increase the expense limits without approval of the Board of Trustees.
Further, the Adviser has contractually agreed, through at least June 30, 2019, to waive the advisory fee payable by the Fund in an amount equal to 100% of the net advisory fees the Adviser receives from the affiliated money market funds on investments by the Fund of uninvested cash in such affiliated money market funds.
For the year ended October 31, 2017, the Adviser waived advisory fees and reimbursed fund level expenses of $373,701 and reimbursed class level expenses of $8,182, $2,183, $519, $8,760, $6 and $6 of Class A, Class C, Class R, Class Y, Class R5 and Class R6 shares, respectively.
The Trust has entered into a master administrative services agreement with Invesco pursuant to which the Fund has agreed to pay Invesco for certain administrative costs incurred in providing accounting services to the Fund. For the year ended October 31, 2017, expenses incurred under the agreement are shown in the Statement of Operations as Administrative services fees.
The Trust has entered into a transfer agency and service agreement with Invesco Investment Services, Inc. (“IIS”) pursuant to which the Fund has agreed to pay IIS a fee for providing transfer agency and shareholder services to the Fund and reimburse IIS for certain expenses incurred by IIS in the course of providing such services. IIS may make payments to intermediaries that provide omnibus account services, sub-accounting services and/or networking services. All fees payable by IIS to intermediaries that provide omnibus account services or sub-accounting services are charged back to the Fund, subject to certain limitations approved by the Trust’s Board of Trustees. For the year ended October 31, 2017, expenses incurred under the agreement are shown in the Statement of Operations as Transfer agent fees.
The Trust has entered into master distribution agreements with Invesco Distributors, Inc. (“IDI”) to serve as the distributor for the Class A, Class C, Class R, Class Y, Class R5 and Class R6 shares of the Fund. The Trust has adopted plans pursuant to Rule 12b-1 under the 1940 Act with respect to the Fund’s Class A, Class C and Class R shares (collectively the “Plans”). The Fund, pursuant to the Plans, pays IDI compensation at the annual rate of 0.25% of the Fund’s average daily net assets of Class A shares, 1.00% of the average daily net assets of Class C shares and 0.50% of the average daily net assets of Class R shares. The fees are accrued daily and paid monthly. Of the Plan payments, up to 0.25% of the average daily net assets of each class of shares may be paid to furnish continuing personal shareholder services to customers who purchase and own shares of such classes. Any amounts not paid as a service fee under the Plans would constitute an asset-based sales charge. Rules of the Financial Industry Regulatory Authority (“FINRA”) impose a cap on the total sales charges, including asset-based sales charges, that may be paid by any class of shares of the Fund. For the year ended October 31, 2017, expenses incurred under the Plans are shown in the Statement of Operations as Distribution fees.
Front-end sales commissions and CDSC (collectively, the “sales charges”) are not recorded as expenses of the Fund. Front-end sales commissions are deducted from proceeds from the sales of Fund shares prior to investment in Class A shares of the Fund. CDSC are deducted from redemption proceeds prior to remittance to the shareholder. During the year ended October 31, 2017, IDI advised the Fund that IDI retained $1,826 in front-end sales commissions from the sale of Class A shares and $84 from Class C shares for CDSC imposed upon redemptions by shareholders.
Certain officers and trustees of the Trust are officers and directors of the Adviser, IIS and/or IDI.
16 Invesco MLP Fund
NOTE 3—Additional Valuation Information
GAAP defines fair value as the price that would be received to sell an asset or paid to transfer a liability in an orderly transaction between market participants at the measurement date, under current market conditions. GAAP establishes a hierarchy that prioritizes the inputs to valuation methods, giving the highest priority to readily available unadjusted quoted prices in an active market for identical assets (Level 1) and the lowest priority to significant unobservable inputs (Level 3), generally when market prices are not readily available or are unreliable. Based on the valuation inputs, the securities or other investments are tiered into one of three levels. Changes in valuation methods may result in transfers in or out of an investment’s assigned level:
| | Level 1 — | Prices are determined using quoted prices in an active market for identical assets. |
| | Level 2 — | Prices are determined using other significant observable inputs. Observable inputs are inputs that other market participants may use in pricing a security. These may include quoted prices for similar securities, interest rates, prepayment speeds, credit risk, yield curves, loss severities, default rates, discount rates, volatilities and others. |
| | Level 3 — | Prices are determined using significant unobservable inputs. In situations where quoted prices or observable inputs are unavailable (for example, when there is little or no market activity for an investment at the end of the period), unobservable inputs may be used. Unobservable inputs reflect the Fund’s own assumptions about the factors market participants would use in determining fair value of the securities or instruments and would be based on the best available information. |
As of October 31, 2017, all of the securities in this Fund were valued based on Level 1 inputs (see the Schedule of Investments for security categories). The level assigned to the securities valuations may not be an indication of the risk or liquidity associated with investing in those securities. Because of the inherent uncertainties of valuation, the values reflected in the financial statements may materially differ from the value received upon actual sale of those investments.
The Fund’s policy is to recognize transfers in and out of the valuation levels as of the end of the reporting period. During the year ended October 31, 2017, there were no material transfers between valuation levels.
NOTE 4—Expense Offset Arrangement(s)
The expense offset arrangement is comprised of transfer agency credits which result from balances in demand deposit accounts used by the transfer agent for clearing shareholder transactions. For the year ended October 31, 2017, the Fund received credits from this arrangement, which resulted in the reduction of the Fund’s total expenses of $330.
NOTE 5—Trustees’ and Officers’ Fees and Benefits
Trustees’ and Officers’ Fees and Benefits include amounts accrued by the Fund to pay remuneration to certain Trustees and Officers of the Fund.
NOTE 6—Cash Balances
The Fund is permitted to temporarily carry a negative or overdrawn balance in its account with State Street Bank and Trust Company, the custodian bank. Such balances, if any at period-end, are shown in the Statement of Assets and Liabilities under the payable caption Amount due custodian. To compensate the custodian bank for such overdrafts, the overdrawn Fund may either (1) leave funds as a compensating balance in the account so the custodian bank can be compensated by earning the additional interest; or (2) compensate by paying the custodian bank at a rate agreed upon by the custodian bank and Invesco, not to exceed the contractually agreed upon rate.
NOTE 7—Distributions to Shareholders and Tax Components of Net Assets
Total taxes have been computed by applying the federal statutory tax rate of 34% plus a blended state and other tax rate of 2.73%. The Fund applied this rate to net investment income (loss) and realized and unrealized gains (losses) on investments before taxes in computing its total tax expense (benefit).
The provision for taxes differs from the amount derived from applying the statutory tax rate to net investment income (loss) and realized and unrealized gains (losses) before taxes at period-end as follows:
| | | | | | | | |
Provision at statutory rates | | $ | (239,191 | ) | | | 34.00 | % |
State and other taxes, net of federal tax benefit | | | (15,288 | ) | | | 2.17 | |
Permanent differences, current period | | | (3,356 | ) | | | 0.48 | |
Valuation allowance | | | 256,663 | | | | (36.48 | ) |
Return to provision | | | 1,172 | | | | (0.17 | ) |
Total | | $ | 0 | | | | 0.00 | % |
17 �� Invesco MLP Fund
Components of the Fund’s Net Deferred Tax Asset at Period-End:
| | | | |
Deferred Tax Assets: | | | | |
Net operating loss carryforward | | $ | 149,267 | |
Capital loss carryforward | | | 580,544 | |
Unrealized gains on investment securities | | | 126,629 | |
Total Deferred Tax Assets | | | 856,440 | |
Valuation allowance | | | (856,440 | ) |
Deferred Tax Asset, Net | | $ | 0 | |
The Fund has a capital loss carryforward as of October 31, 2017, of $1,621,958. Capital losses may be carried forward for 5 years and accordingly, would begin to expire as of October 31, 2019.
The Fund has a federal net operating loss carryforward as of October 31, 2017, of $417,212, which expires in 2034. As of October 31, 2017, the Fund has state net operating losses of approximately $412,030. If not utilized, these net operating losses will expire in various years through October 31, 2037.
At October 31, 2017, based on the net unrealized losses on the Fund’s investment securities, the Fund has recorded a valuation allowance to offset the DTA as the Fund has determined at October 31, 2017 based on historical evidence it is unlikely the DTA will be realized.
Tax Character of Distributions to Shareholders Paid During the Fiscal Years Ended October 31, 2017 and 2016:
| | | | | | | | |
| | | 2017 | | | 2016 | |
Return of capital | | $ | 586,042 | | | $ | 380,590 | |
NOTE 8—Investment Transactions
The aggregate amount of investment securities (other than short-term securities, U.S. Treasury obligations and money market funds, if any) purchased and sold by the Fund during the year ended October 31, 2017 was $12,182,875 and $10,086,269, respectively. Cost of investments, including any derivatives, on a tax basis includes the adjustments for financial reporting purposes as of the most recently completed federal income tax reporting period-end.
| | | | |
| Unrealized Appreciation (Depreciation) of Investments on a Tax Basis | |
Aggregate unrealized appreciation of investments | | $ | 138,624 | |
Aggregate unrealized (depreciation) of investments | | | (491,081 | ) |
Net unrealized appreciation (depreciation) of investments | | $ | (352,457 | ) |
Cost of investments for tax purposes is $10,323,741.
NOTE 9—Reclassification of Permanent Differences
Primarily as a result of differing book/tax treatment of dividends received, on October 31, 2017, undistributed net investment income (loss) was decreased by $9,869 and shares of beneficial interest was increased by $9,869. This reclassification had no effect on the net assets of the Fund.
18 Invesco MLP Fund
NOTE 10—Share Information
| | | | | | | | | | | | | | | | |
| | | Summary of Share Activity | |
| | | Years ended October 31, | |
| | | 2017(a) | | | 2016 | |
| | | Shares | | | Amount | | | Shares | | | Amount | |
Sold: | | | | | | | | | | | | | | | | |
Class A | | | 296,058 | | | $ | 1,878,977 | | | | 320,430 | | | $ | 1,847,014 | |
Class C | | | 87,078 | | | | 549,317 | | | | 182,453 | | | | 1,102,203 | |
Class R | | | 29,368 | | | | 173,908 | | | | 33,865 | | | | 174,013 | |
Class Y | | | 640,024 | | | | 4,089,555 | | | | 292,748 | | | | 1,626,732 | |
| | | | |
Issued as reinvestment of dividends: | | | | | | | | | | | | | | | | |
Class A | | | 27,561 | | | | 166,884 | | | | 20,756 | | | | 117,814 | |
Class C | | | 7,831 | | | | 47,155 | | | | 3,359 | | | | 19,487 | |
Class R | | | 2,368 | | | | 14,173 | | | | 1,379 | | | | 7,992 | |
Class Y | | | 20,960 | | | | 126,518 | | | | 11,016 | | | | 63,540 | |
| | | | |
Reacquired: | | | | | | | | | | | | | | | | |
Class A | | | (329,385 | ) | | | (2,022,750 | ) | | | (58,763 | ) | | | (348,743 | ) |
Class C | | | (107,583 | ) | | | (652,174 | ) | | | (5,647 | ) | | | (32,582 | ) |
Class R | | | (7,876 | ) | | | (48,559 | ) | | | (944 | ) | | | (5,582 | ) |
Class Y(b) | | | (346,686 | ) | | | (2,190,970 | ) | | | (43,714 | ) | | | (256,964 | ) |
Net increase in share activity | | | 319,718 | | | $ | 2,132,034 | | | | 756,938 | | | $ | 4,314,924 | |
| (a) | There are entities that are record owners of more than 5% of the outstanding shares of the Fund and in the aggregate own 43% of the outstanding shares of the Fund. IDI has an agreement with these entities to sell Fund shares. The Fund, Invesco and/or Invesco affiliates may make payments to these entities, which are considered to be related to the Fund, for providing services to the Fund, Invesco and/or Invesco affiliates including but not limited to services such as securities brokerage, distribution, third party record keeping and account servicing. The Trust has no knowledge as to whether all or any portion of the shares owned of record by these entities are also owned beneficially. |
| | In addition, 16% of the outstanding shares of the Fund are owned by the Adviser or an affiliated of the Adviser. |
| (b) | On March 14, 2017, 175,247 Class Y shares valued at $1,140,858 were sold by the Adviser or an affiliate of the Adviser. |
19 Invesco MLP Fund
NOTE 11—Financial Highlights
The following schedule presents financial highlights for a share of the Fund outstanding throughout the periods indicated.
| | | | | | | | | | | | | | | | |
| | | Class A | |
| | | Years ended October 31, | |
| | | 2017 | | | 2016 | | | 2015 | | | 2014(a) | |
Net asset value, beginning of period | | $ | 6.06 | | | $ | 6.45 | | | $ | 9.35 | | | $ | 10.00 | |
Net investment income (loss)(b) | | | (0.06 | ) | | | (0.07 | ) | | | (0.09 | ) | | | (0.01 | ) |
Net gains (losses) on securities (both realized and unrealized) | | | (0.21 | ) | | | 0.02 | | | | (2.51 | ) | | | (0.64 | ) |
Total from investment operations | | | (0.27 | ) | | | (0.05 | ) | | | (2.60 | ) | | | (0.65 | ) |
Less: | | | | | | | | | | | | | | | | |
Return of capital | | | (0.33 | ) | | | (0.34 | ) | | | (0.30 | ) | | | — | |
Net asset value, end of period | | $ | 5.46 | | | $ | 6.06 | | | $ | 6.45 | | | $ | 9.35 | |
Total return(c) | | | (4.88 | )% | | | (0.14 | )% | | | (28.30 | )% | | | (6.50 | )% |
Net assets, end of period (000’s omitted) | | $ | 3,619 | | | $ | 4,050 | | | $ | 2,489 | | | $ | 1,931 | |
Portfolio turnover rate(d) | | | 93 | % | | | 57 | % | | | 107 | % | | | 5 | % |
| | | |
Ratios/supplemental data based on average net assets: | | | | | | | | | | | | | |
Ratio of expenses: | | | | | | | | | | | | | | | | |
With fee waivers and/or expense reimbursements, before taxes | | | 1.33 | %(e) | | | 1.50 | % | | | 1.50 | % | | | 1.49 | %(f) |
Tax expense (benefit)(g) | | | 0 | %(e) | | | 0 | % | | | 0 | % | | | 0 | %(f) |
With fee waivers and/or expense reimbursements, after taxes(g) | | | 1.33 | %(e) | | | 1.50 | % | | | 1.50 | % | | | 1.49 | %(f) |
Without fee waivers and/or expense reimbursements, after taxes(g) | | | 4.90 | %(e) | | | 4.75 | % | | | 6.37 | % | | | 72.56 | %(f) |
Ratio of net investment income (loss), before taxes | | | (0.95 | )%(e) | | | (1.28 | )% | | | (1.16 | )% | | | (0.54 | )%(f) |
Ratio of net investment income (loss), after taxes(h) | | | (0.95 | )%(e) | | | (1.28 | )% | | | (1.16 | )% | | | (0.54 | )%(f) |
| (a) | Commencement date of August 29, 2014. |
| (b) | Calculated using average shares outstanding. |
| (c) | Includes adjustments in accordance with accounting principles generally accepted in the United States of America and as such, the net asset value for financial reporting purposes and the returns based upon those net asset values may differ from the net asset value and returns for shareholder transactions. Does not include sales charges and is not annualized for periods less than one year, if applicable. |
| (d) | Portfolio turnover is calculated at the fund level and is not annualized for periods less than one year, if applicable. |
| (e) | Ratios are based on average daily net assets (000’s omitted) of $4,585. |
| (g) | Ratio includes tax expense derived from net investment income (loss) and realized and unrealized gains (losses). |
| (h) | Ratio includes tax expense derived from net investment income (loss) only. |
20 Invesco MLP Fund
NOTE 11—Financial Highlights—(continued)
| | | | | | | | | | | | | | | | |
| | | Class C | |
| | | Years ended October 31, | |
| | | 2017 | | | 2016 | | | 2015 | | | 2014(a) | |
Net asset value, beginning of period | | $ | 6.05 | | | $ | 6.45 | | | $ | 9.34 | | | $ | 10.00 | |
Net investment income (loss)(b) | | | (0.10 | ) | | | (0.12 | ) | | | (0.16 | ) | | | (0.02 | ) |
Net gains (losses) on securities (both realized and unrealized) | | | (0.21 | ) | | | 0.02 | | | | (2.49 | ) | | | (0.64 | ) |
Total from investment operations | | | (0.31 | ) | | | (0.10 | ) | | | (2.65 | ) | | | (0.66 | ) |
Less: | | | | | | | | | | | | | | | | |
Return of capital | | | (0.28 | ) | | | (0.30 | ) | | | (0.24 | ) | | | — | |
Net asset value, end of period | | $ | 5.46 | | | $ | 6.05 | | | $ | 6.45 | | | $ | 9.34 | |
Total return(c) | | | (5.45 | )% | | | (1.08 | )% | | | (28.78 | )% | | | (6.60 | )% |
Net assets, end of period (000’s omitted) | | $ | 1,088 | | | $ | 1,283 | | | $ | 205 | | | $ | 1,713 | |
Portfolio turnover rate(d) | | | 93 | % | | | 57 | % | | | 107 | % | | | 5 | % |
| | | |
Ratios/supplemental data based on average net assets: | | | | | | | | | | | | | |
Ratio of expenses: | | | | | | | | | | | | | | | | |
With fee waivers and/or expense reimbursements, before taxes | | | 2.08 | %(e) | | | 2.25 | % | | | 2.25 | % | | | 2.24 | %(f) |
Tax expense (benefit)(g) | | | 0 | %(e) | | | 0 | % | | | 0 | % | | | 0 | %(f) |
With fee waivers and/or expense reimbursements, after taxes(g) | | | 2.08 | %(e) | | | 2.25 | % | | | 2.25 | % | | | 2.24 | %(f) |
Without fee waivers and/or expense reimbursements, after taxes(g) | | | 5.65 | %(e) | | | 5.50 | % | | | 7.12 | % | | | 73.31 | %(f) |
Ratio of net investment income (loss), before taxes | | | (1.70 | )%(e) | | | (2.03 | )% | | | (1.91 | )% | | | (1.29 | )%(f) |
Ratio of net investment income (loss), after taxes(h) | | | (1.70 | )%(e) | | | (2.03 | )% | | | (1.91 | )% | | | (1.29 | )%(f) |
| (a) | Commencement date of August 29, 2014. |
| (b) | Calculated using average shares outstanding. |
| (c) | Includes adjustments in accordance with accounting principles generally accepted in the United States of America and as such, the net asset value for financial reporting purposes and the returns based upon those net asset values may differ from the net asset value and returns for shareholder transactions. Does not include sales charges and is not annualized for periods less than one year, if applicable. |
| (d) | Portfolio turnover is calculated at the fund level and is not annualized for periods less than one year, if applicable. |
| (e) | Ratios are based on average daily net assets (000’s omitted) of $1,223. |
| (g) | Ratio includes tax expense derived from net investment income (loss) and realized and unrealized gains (losses). |
| (h) | Ratio includes tax expense derived from net investment income (loss) only. |
21 Invesco MLP Fund
NOTE 11—Financial Highlights—(continued)
| | | | | | | | | | | | | | | | |
| | | Class R | |
| | | Years ended October 31, | |
| | | 2017 | | | 2016 | | | 2015 | | | 2014(a) | |
Net asset value, beginning of period | | $ | 6.06 | | | $ | 6.45 | | | $ | 9.35 | | | $ | 10.00 | |
Net investment income (loss)(b) | | | (0.07 | ) | | | (0.09 | ) | | | (0.11 | ) | | | (0.01 | ) |
Net gains (losses) on securities (both realized and unrealized) | | | (0.22 | ) | | | 0.03 | | | | (2.51 | ) | | | (0.64 | ) |
Total from investment operations | | | (0.29 | ) | | | (0.06 | ) | | | (2.62 | ) | | | (0.65 | ) |
Less: | | | | | | | | | | | | | | | | |
Return of capital | | | (0.31 | ) | | | (0.33 | ) | | | (0.28 | ) | | | — | |
Net asset value, end of period | | $ | 5.46 | | | $ | 6.06 | | | $ | 6.45 | | | $ | 9.35 | |
Total return(c) | | | (5.12 | )% | | | (0.39 | )% | | | (28.48 | )% | | | (6.50 | )% |
Net assets, end of period (000’s omitted) | | $ | 347 | | | $ | 241 | | | $ | 35 | | | $ | 21 | |
Portfolio turnover rate(d) | | | 93 | % | | | 57 | % | | | 107 | % | | | 5 | % |
| | | |
Ratios/supplemental data based on average net assets: | | | | | | | | | | | | | |
Ratio of expenses: | | | | | | | | | | | | | | | | |
With fee waivers and/or expense reimbursements, before taxes | | | 1.58 | %(e) | | | 1.75 | % | | | 1.75 | % | | | 1.74 | %(f) |
Tax expense (benefit)(g) | | | 0 | %(e) | | | 0 | % | | | 0 | % | | | 0 | %(f) |
With fee waivers and/or expense reimbursements, after taxes(g) | | | 1.58 | %(e) | | | 1.75 | % | | | 1.75 | % | | | 1.74 | %(f) |
Without fee waivers and/or expense reimbursements, after taxes(g) | | | 5.15 | %(e) | | | 5.00 | % | | | 6.62 | % | | | 72.80 | %(f) |
Ratio of net investment income (loss), before taxes | | | (1.20 | )%(e) | | | (1.53 | )% | | | (1.41 | )% | | | (0.79 | )%(f) |
Ratio of net investment income (loss), after taxes(h) | | | (1.20 | )%(e) | | | (1.53 | )% | | | (1.41 | )% | | | (0.79 | )%(f) |
| (a) | Commencement date of August 29, 2014. |
| (b) | Calculated using average shares outstanding. |
| (c) | Includes adjustments in accordance with accounting principles generally accepted in the United States of America and as such, the net asset value for financial reporting purposes and the returns based upon those net asset values may differ from the net asset value and returns for shareholder transactions. Does not include sales charges and is not annualized for periods less than one year, if applicable. |
| (d) | Portfolio turnover is calculated at the fund level and is not annualized for periods less than one year, if applicable. |
| (e) | Ratios are based on average daily net assets (000’s omitted) of $291. |
| (g) | Ratio includes tax expense derived from net investment income (loss) and realized and unrealized gains (losses). |
| (h) | Ratio includes tax expense derived from net investment income (loss) only. |
22 Invesco MLP Fund
NOTE 11—Financial Highlights—(continued)
| | | | | | | | | | | | | | | | |
| | | Class Y | |
| | | Years ended October 31, | |
| | | 2017 | | | 2016 | | | 2015 | | | 2014(a) | |
Net asset value, beginning of period | | $ | 6.07 | | | $ | 6.46 | | | $ | 9.36 | | | $ | 10.00 | |
Net investment income (loss)(b) | | | (0.04 | ) | | | (0.06 | ) | | | (0.07 | ) | | | (0.01 | ) |
Net gains (losses) on securities (both realized and unrealized) | | | (0.22 | ) | | | 0.03 | | | | (2.51 | ) | | | (0.63 | ) |
Total from investment operations | | | (0.26 | ) | | | (0.03 | ) | | | (2.58 | ) | | | (0.64 | ) |
Less: | | | | | | | | | | | | | | | | |
Return of capital | | | (0.34 | ) | | | (0.36 | ) | | | (0.32 | ) | | | — | |
Net asset value, end of period | | $ | 5.47 | | | $ | 6.07 | | | $ | 6.46 | | | $ | 9.36 | |
Total return(c) | | | (4.61 | )% | | | 0.14 | % | | | (28.07 | )% | | | (6.40 | )% |
Net assets, end of period (000’s omitted) | | $ | 4,912 | | | $ | 3,545 | | | $ | 2,094 | | | $ | 1,628 | |
Portfolio turnover rate(d) | | | 93 | % | | | 57 | % | | | 107 | % | | | 5 | % |
| | | |
Ratios/supplemental data based on average net assets: | | | | | | | | | | | | | |
Ratio of expenses: | | | | | | | | | | | | | | | | |
With fee waivers and/or expense reimbursements, before taxes | | | 1.08 | %(e) | | | 1.25 | % | | | 1.25 | % | | | 1.24 | %(f) |
Tax expense (benefit)(g) | | | 0 | %(e) | | | 0 | % | | | 0 | % | | | 0 | %(f) |
With fee waivers and/or expense reimbursements, after taxes(g) | | | 1.08 | %(e) | | | 1.25 | % | | | 1.25 | % | | | 1.24 | %(f) |
Without fee waivers and/or expense reimbursements, after taxes(g) | | | 4.65 | %(e) | | | 4.50 | % | | | 6.12 | % | | | 72.31 | %(f) |
Ratio of net investment income (loss), before taxes | | | (0.70 | )%(e) | | | (1.03 | )% | | | (0.91 | )% | | | (0.29 | )%(f) |
Ratio of net investment income (loss), after taxes(h) | | | (0.70 | )%(e) | | | (1.03 | )% | | | (0.91 | )% | | | (0.29 | )%(f) |
| (a) | Commencement date of August 29, 2014. |
| (b) | Calculated using average shares outstanding. |
| (c) | Includes adjustments in accordance with accounting principles generally accepted in the United States of America and as such, the net asset value for financial reporting purposes and the returns based upon those net asset values may differ from the net asset value and returns for shareholder transactions. Does not include sales charges and is not annualized for periods less than one year, if applicable. |
| (d) | Portfolio turnover is calculated at the fund level and is not annualized for periods less than one year, if applicable. |
| (e) | Ratios are based on average daily net assets (000’s omitted) of $4,909. |
| (g) | Ratio includes tax expense derived from net investment income (loss) and realized and unrealized gains (losses). |
| (h) | Ratio includes tax expense derived from net investment income (loss) only. |
23 Invesco MLP Fund
NOTE 11—Financial Highlights—(continued)
| | | | | | | | | | | | | | | | |
| | | Class R5 | |
| | | Years ended October 31, | |
| | | 2017 | | | 2016 | | | 2015 | | | 2014(a) | |
Net asset value, beginning of period | | $ | 6.06 | | | $ | 6.46 | | | $ | 9.36 | | | $ | 10.00 | |
Net investment income (loss)(b) | | | (0.04 | ) | | | (0.06 | ) | | | (0.07 | ) | | | (0.01 | ) |
Net gains (losses) on securities (both realized and unrealized) | | | (0.22 | ) | | | 0.02 | | | | (2.51 | ) | | | (0.63 | ) |
Total from investment operations | | | (0.26 | ) | | | (0.04 | ) | | | (2.58 | ) | | | (0.64 | ) |
Less: | | | | | | | | | | | | | | | | |
Return of capital | | | (0.34 | ) | | | (0.36 | ) | | | (0.32 | ) | | | — | |
Net asset value, end of period | | $ | 5.46 | | | $ | 6.06 | | | $ | 6.46 | | | $ | 9.36 | |
Total return(c) | | | (4.63 | )% | | | (0.03 | )% | | | (28.07 | )% | | | (6.40 | )% |
Net assets, end of period (000’s omitted) | | $ | 5 | | | $ | 6 | | | $ | 6 | | | $ | 9 | |
Portfolio turnover rate(d) | | | 93 | % | | | 57 | % | | | 107 | % | | | 5 | % |
| | | |
Ratios/supplemental data based on average net assets: | | | | | | | | | | | | | |
Ratio of expenses: | | | | | | | | | | | | | | | | |
With fee waivers and/or expense reimbursements, before taxes | | | 1.08 | %(e) | | | 1.25 | % | | | 1.25 | % | | | 1.24 | %(f) |
Tax expense (benefit)(g) | | | 0 | %(e) | | | 0 | % | | | 0 | % | | | 0 | %(f) |
With fee waivers and/or expense reimbursements, after taxes(g) | | | 1.08 | %(e) | | | 1.25 | % | | | 1.25 | % | | | 1.24 | %(f) |
Without fee waivers and/or expense reimbursements, after taxes(g) | | | 4.57 | %(e) | | | 4.44 | % | | | 6.10 | % | | | 72.28 | %(f) |
Ratio of net investment income (loss), before taxes | | | (0.70 | )%(e) | | | (1.03 | )% | | | (0.91 | )% | | | (0.29 | )%(f) |
Ratio of net investment income (loss), after taxes(h) | | | (0.70 | )%(e) | | | (1.03 | )% | | | (0.91 | )% | | | (0.29 | )%(f) |
| (a) | Commencement date of August 29, 2014. |
| (b) | Calculated using average shares outstanding. |
| (c) | Includes adjustments in accordance with accounting principles generally accepted in the United States of America and as such, the net asset value for financial reporting purposes and the returns based upon those net asset values may differ from the net asset value and returns for shareholder transactions. Does not include sales charges and is not annualized for periods less than one year, if applicable. |
| (d) | Portfolio turnover is calculated at the fund level and is not annualized for periods less than one year, if applicable. |
| (e) | Ratios are based on average daily net assets (000’s omitted) of $6. |
| (g) | Ratio includes tax expense derived from net investment income (loss) and realized and unrealized gains (losses). |
| (h) | Ratio includes tax expense derived from net investment income (loss) only. |
24 Invesco MLP Fund
NOTE 11—Financial Highlights—(continued)
| | | | | | | | | | | | | | | | |
| | | Class R6 | |
| | | Years ended October 31, | |
| | | 2017 | | | 2016 | | | 2015 | | | 2014(a) | |
Net asset value, beginning of period | | $ | 6.06 | | | $ | 6.46 | | | $ | 9.36 | | | $ | 10.00 | |
Net investment income (loss)(b) | | | (0.04 | ) | | | (0.06 | ) | | | (0.07 | ) | | | (0.01 | ) |
Net gains (losses) on securities (both realized and unrealized) | | | (0.22 | ) | | | 0.02 | | | | (2.51 | ) | | | (0.63 | ) |
Total from investment operations | | | (0.26 | ) | | | (0.04 | ) | | | (2.58 | ) | | | (0.64 | ) |
Less: | | | | | | | | | | | | | | | | |
Return of capital | | | (0.34 | ) | | | (0.36 | ) | | | (0.32 | ) | | | — | |
Net asset value, end of period | | $ | 5.46 | | | $ | 6.06 | | | $ | 6.46 | | | $ | 9.36 | |
Total return(c) | | | (4.63 | )% | | | (0.03 | )% | | | (28.07 | )% | | | (6.40 | )% |
Net assets, end of period (000’s omitted) | | $ | 5 | | | $ | 6 | | | $ | 6 | | | $ | 9 | |
Portfolio turnover rate(d) | | | 93 | % | | | 57 | % | | | 107 | % | | | 5 | % |
| | | |
Ratios/supplemental data based on average net assets: | | | | | | | | | | | | | |
Ratio of expenses: | | | | | | | | | | | | | | | | |
With fee waivers and/or expense reimbursements, before taxes | | | 1.08 | %(e) | | | 1.25 | % | | | 1.25 | % | | | 1.24 | %(f) |
Tax expense (benefit)(g) | | | 0 | %(e) | | | 0 | % | | | 0 | % | | | 0 | %(f) |
With fee waivers and/or expense reimbursements, after taxes(g) | | | 1.08 | %(e) | | | 1.25 | % | | | 1.25 | % | | | 1.24 | %(f) |
Without fee waivers and/or expense reimbursements, after taxes(g) | | | 4.57 | %(e) | | | 4.44 | % | | | 6.10 | % | | | 72.23 | %(f) |
Ratio of net investment income (loss), before taxes | | | (0.70 | )%(e) | | | (1.03 | )% | | | (0.91 | )% | | | (0.29 | )%(f) |
Ratio of net investment income (loss), after taxes(h) | | | (0.70 | )%(e) | | | (1.03 | )% | | | (0.91 | )% | | | (0.29 | )%(f) |
| (a) | Commencement date of August 29, 2014. |
| (b) | Calculated using average shares outstanding. |
| (c) | Includes adjustments in accordance with accounting principles generally accepted in the United States of America and as such, the net asset value for financial reporting purposes and the returns based upon those net asset values may differ from the net asset value and returns for shareholder transactions. Does not include sales charges and is not annualized for periods less than one year, if applicable. |
| (d) | Portfolio turnover is calculated at the fund level and is not annualized for periods less than one year, if applicable. |
| (e) | Ratios are based on average daily net assets (000’s omitted) of $6. |
| (g) | Ratio includes tax expense derived from net investment income (loss) and realized and unrealized gains (losses). |
| (h) | Ratio includes tax expense derived from net investment income (loss) only. |
25 Invesco MLP Fund
Report of Independent Registered Public Accounting Firm
To the Board of Trustees of AIM Investment Funds (Invesco Investment Funds)
and Shareholders of Invesco MLP Fund:
In our opinion, the accompanying statement of assets and liabilities, including the schedule of investments, and the related statements of operations and of changes in net assets and the financial highlights present fairly, in all material respects, the financial position of Invesco MLP Fund (one of the portfolios constituting the AIM Investment Funds (Invesco Investment Funds), hereafter referred to as the “Fund”) as of October 31, 2017, the results of its operations for the year then ended, the changes in its net assets for each of the two years in the period then ended and the financial highlights for each of the three years in the period then ended and for the period August 29, 2014 (commencement of investment operations) through October 31, 2014, in conformity with accounting principles generally accepted in the United States of America. These financial statements and financial highlights (hereafter referred to as “financial statements”) are the responsibility of the Fund’s management. Our responsibility is to express an opinion on these financial statements based on our audits. We conducted our audits of these financial statements in accordance with the standards of the Public Company Accounting Oversight Board (United States). Those standards require that we plan and perform the audit to obtain reasonable assurance about whether the financial statements are free of material misstatement. An audit includes examining, on a test basis, evidence supporting the amounts and disclosures in the financial statements, assessing the accounting principles used and significant estimates made by management, and evaluating the overall financial statement presentation. We believe that our audits, which included confirmation of securities as of October 31, 2017 by correspondence with the custodian and transfer agent, provide a reasonable basis for our opinion.
PricewaterhouseCoopers LLP
Houston, Texas
December 21, 2017
26 Invesco MLP Fund
Calculating your ongoing Fund expenses
Example
As a shareholder of the Fund, you incur two types of costs: (1) transaction costs, which may include sales charges (loads) on purchase payments or contingent deferred sales charges on redemptions, if any; and (2) ongoing costs, including management fees, distribution and/or service (12b-1) fees, and other Fund expenses. This example is intended to help you understand your ongoing costs (in dollars) of investing in the Fund and to compare these costs with ongoing costs of investing in other mutual funds. The example is based on an investment of $1,000 invested at the beginning of the period and held for the entire period May 1, 2017 through October 31, 2017.
Actual expenses
The table below provides information about actual account values and actual expenses. You may use the information in this table, together with the amount you invested, to estimate the expenses that you paid over the period. Simply divide your account value by $1,000 (for example, an $8,600 account value divided by $1,000 = 8.6), then multiply the result by the number in the table under the heading entitled “Actual Expenses Paid During Period” to estimate the expenses you paid on your account during this period.
Hypothetical example for comparison purposes
The table below also provides information about hypothetical account values and hypothetical expenses based on the Fund’s actual expense ratio and an assumed rate of return of 5% per year before expenses, which is not the Fund’s actual return.
The hypothetical account values and expenses may not be used to estimate the actual ending account balance or expenses you paid for the period. You may use this information to compare the ongoing costs of investing in the Fund and other funds. To do so, compare this 5% hypothetical example with the 5% hypothetical examples that appear in the shareholder reports of the other funds.
Please note that the expenses shown in the table are meant to highlight your ongoing costs only and do not reflect any transaction costs, such as sales charges (loads) on purchase payments or contingent deferred sales charges on redemptions, if any. Therefore, the hypothetical information is useful in comparing ongoing costs only, and will not help you determine the relative total costs of owning different funds. In addition, if these transaction costs were included, your costs would have been higher.
| | | | | | | | | | | | | | | | | | | | | | | | |
| | | | | | ACTUAL | | | HYPOTHETICAL (5% annual return before
expenses) | | | | |
| Class | | Beginning
Account Value
(05/01/17) | | | Ending
Account Value
(10/31/17)1 | | | Expenses
Paid During
Period2 | | | Ending
Account Value
(10/31/17) | | | Expenses
Paid During
Period2 | | | Annualized
Expense
Ratio | |
| A | | $ | 1,000.00 | | | $ | 877.40 | | | $ | 6.06 | | | $ | 1,018.75 | | | $ | 6.51 | | | | 1.28 | % |
| C | | | 1,000.00 | | | | 875.40 | | | | 9.60 | | | | 1,014.97 | | | | 10.31 | | | | 2.03 | |
| R | | | 1,000.00 | | | | 876.30 | | | | 7.24 | | | | 1,017.49 | | | | 7.78 | | | | 1.53 | |
| Y | | | 1,000.00 | | | | 878.80 | | | | 4.88 | | | | 1,020.01 | | | | 5.24 | | | | 1.03 | |
| R5 | | | 1,000.00 | | | | 878.50 | | | | 4.88 | | | | 1,020.01 | | | | 5.24 | | | | 1.03 | |
| R6 | | | 1,000.00 | | | | 878.50 | | | | 4.88 | | | | 1,020.01 | | | | 5.24 | | | | 1.03 | |
| 1 | The actual ending account value is based on the actual total return of the Fund for the period May 1, 2017 through October 31, 2017, after actual expenses and will differ from the hypothetical ending account value which is based on the Fund’s expense ratio and a hypothetical annual return of 5% before expenses. |
| 2 | Expenses are equal to the Fund’s annualized expense ratio as indicated above multiplied by the average account value over the period, multiplied by 184/365 to reflect the most recent fiscal half year. |
27 Invesco MLP Fund
Approval of Investment Advisory and Sub-Advisory Contracts
The Board of Trustees (the Board) of AIM Investment Funds (Invesco Investment Funds) is required under the Investment Company Act of 1940, as amended, to approve annually the renewal of Invesco MLP Fund’s (the Fund) investment advisory agreements. During contract renewal meetings held on June 12-13, 2017, the Board as a whole, and the disinterested or “independent” Trustees, who comprise over 75% of the Board, voting separately, approved the continuance for the Fund of the Master Investment Advisory Agreement with Invesco Advisers, Inc. (Invesco Advisers and the investment advisory agreement) and the Master Intergroup Sub-Advisory Contract for Mutual Funds with Invesco Asset Management Deutschland GmbH, Invesco Asset Management Limited, Invesco Asset Management (Japan) Limited, Invesco Hong Kong Limited, Invesco Senior Secured Management, Inc. and Invesco Canada Ltd. and separate Sub-Advisory Contracts with Invesco PowerShares Capital Management LLC and Invesco Asset Management (India) Private Limited (collectively, the Affiliated Sub-Advisers and the sub-advisory contracts) for another year, effective July 1, 2017.
In evaluating the fairness and reasonableness of compensation under the Fund’s investment advisory agreement and sub-advisory contracts, the Board considered, among other things, the factors discussed below. The Board determined that continuation of the Fund’s investment advisory agreement and the sub-advisory contracts is in the best interest of the Fund and its shareholders and that the compensation payable to Invesco Advisers and the Affiliated Sub-Advisers under the agreements is fair and reasonable.
The Board’s Fund Evaluation Process
The Board’s Investments Committee has established three Sub-Committees, which meet throughout the year to review the performance of funds advised by Invesco Advisers (the Invesco Funds). Over the course of each year, the Sub-Committees meet with portfolio managers for their assigned Invesco Funds and other members of management to review the performance, investment objective(s), policies, strategies, limitations and investment risks of these funds. The Board had the benefit of reports from the Sub-Committees and Investments Committee throughout the year in considering approval of the continuance of each Invesco Fund’s investment advisory agreement and sub-advisory contracts for another year.
During the contract renewal process, the Board receives comparative performance and fee data regarding the Invesco Funds prepared by Invesco Advisers and Broadridge Financial Solutions, Inc. (Broadridge), an independent provider of investment company data. The Board also receives an independent written
evaluation from the Senior Officer, an officer of the Invesco Funds who reports directly to the independent Trustees. The Senior Officer’s evaluation is prepared as part of his responsibility to manage the process by which the Invesco Funds’ proposed management fees are negotiated during the annual contract renewal process to ensure they are negotiated in a manner that is at arms’ length and reasonable. In addition to meetings with Invesco Advisers and fund counsel, the independent Trustees also discuss the continuance of the investment advisory agreement and sub-advisory contracts in separate sessions with the Senior Officer and with independent legal counsel.
The Trustees recognized that the advisory fee rates for the Invesco Funds are, in most cases, the result of years of review and negotiation. The Trustees’ deliberations and conclusions in a particular year may be based in part on their deliberations and conclusions regarding these arrangements throughout the year and in prior years. The Trustees’ review and conclusions are based on the comprehensive consideration of all information presented to them and are not the result of any single determinative factor. Moreover, one Trustee may have weighed a particular piece of information or factor differently than another Trustee.
The discussion below is a summary of the Senior Officer’s independent written evaluation with respect to the Fund’s investment advisory agreement as well as a discussion of the material factors and related conclusions that formed the basis for the Board’s approval of the Fund’s investment advisory agreement and sub-advisory contracts. This information is current as of June 13, 2017, and does not reflect consideration of factors that became known to the Board after that date.
Factors and Conclusions and Summary of Independent Written Fee Evaluation
| A. | Nature, Extent and Quality of Services Provided by Invesco Advisers and the Affiliated Sub-Advisers |
The Board reviewed the advisory services provided to the Fund by Invesco Advisers under the Fund’s investment advisory agreement, the performance of Invesco Advisers in providing these services, and the credentials and experience of the officers and employees of Invesco Advisers who provide these services, including the Fund’s portfolio manager or managers. The Board’s review included consideration of Invesco Advisers’ investment process oversight, credit analysis and investment risk management. The Board also considered non-advisory services that Invesco Advisers and its affiliates provide to the Invesco Funds such as various back office support functions, trading operations, internal audit, valuation and legal and compliance.
In determining whether to continue the Fund’s investment advisory agreement, the Board considered the benefits of reapproving an existing relationship as contrasted with the greater uncertainty that may be associated with entering into a new relationship. The Board concluded that the nature, extent and quality of the services provided to the Fund by Invesco Advisers are appropriate and satisfactory.
The Board reviewed the services that may be provided by the Affiliated Sub-Advisers under the sub-advisory contracts and the credentials and experience of the officers and employees of the Affiliated Sub-Advisers who provide these services. The Board noted that the Affiliated Sub-Advisers have offices and personnel that are located in financial centers around the world. As a result, the Board noted that the Affiliated Sub-Advisers can provide research and investment analysis on the markets and economies of various countries in which the Fund may invest, make recommendations regarding securities and assist with security trades. The Board concluded that the sub-advisory contracts may benefit the Fund and its shareholders by permitting Invesco Advisers to use the resources and talents of the Affiliated Sub-Advisers in managing the Fund. The Board concluded that the nature, extent and quality of the services that may be provided by the Affiliated Sub-Advisers are appropriate and satisfactory.
| B. | Fund Investment Performance |
The Board considered Fund investment performance as a relevant factor in considering whether to approve the investment advisory agreement as well as the sub-advisory contracts for the Fund, as Invesco Asset Management Limited currently manages assets of the Fund.
The Board noted that the Fund had only two years of performance history and compared the Fund’s investment performance during the past one and two calendar years to the performance of funds in the Broadridge performance universe and against Lipper Energy MLP Funds Index. The Board noted that performance of Class A shares of the Fund was in the fourth quintile of its performance universe for the one and two year periods (the first quintile being the best performing funds and the fifth quintile being the worst performing funds). The Board noted that performance of Class A shares of the Fund was below the performance of the Index for the one and two year periods. The Trustees also reviewed more recent Fund performance and this review did not change their conclusions.
| C. | Advisory and Sub-Advisory Fees |
The Board compared the Fund’s contractual management fee rate to the contractual management fee rates of funds in the Fund’s Broadridge expense group at a common asset level. The Board noted that the contractual management fee rate for Class A shares of the
28 Invesco MLP Fund
Fund was below the median contractual management fee rate of funds in its expense group. The Board noted that the term “contractual management fee” for funds in the expense group may include both advisory and certain administrative services fees, but that Broadridge does not provide information on a fund by fund basis as to what is included. The Board noted that Invesco Advisers does not separately charge the Invesco Funds for the administrative services included in the term as defined by Broadridge. The Board also reviewed the methodology used by Broadridge in providing expense group information, which includes using each fund’s contractual management fee schedule (including any applicable breakpoints) as reported in the most recent prospectus or statement of additional information for each fund in the expense group.
The Board noted that Invesco Advisers has contractually agreed to waive fees and/or limit expenses of the Fund through at least February 28, 2018 in an amount necessary to limit total annual operating expenses to a specified percentage of average daily net assets for each class of the Fund.
The Board noted that Invesco Advisers and the Affiliated Sub-Advisers do not manage other mutual funds or client accounts with investment strategies comparable to those of the Fund.
The Board also considered the services that may be provided by the Affiliated Sub-Advisers pursuant to the sub-advisory contracts, as well as the fees payable by Invesco Advisers to the Affiliated Sub-Advisers pursuant to the sub-advisory contracts. The Board noted that Invesco Advisers retains overall responsibility for, and provides services to, sub-advised Invesco Funds, including oversight of the Affiliated Sub-Advisers as well as the additional services described herein other than day-to-day portfolio management. The Board also noted that the sub-advisory fees are not paid directly by the Fund, but rather, are payable by Invesco Advisers to the Affiliated Sub-Advisers.
| D. | Economies of Scale and Breakpoints |
The Board considered the extent to which there are economies of scale in the provision of advisory services to the Fund. The Board also considered that the Fund may benefit from economies of scale through contractual breakpoints in the Fund’s advisory fee schedule. The Board noted that the Fund shares directly in economies of scale through lower fees charged by third party service providers based on the combined size of the Invesco Funds advised by Invesco Advisers.
| E. | Profitability and Financial Resources |
The Board reviewed information from Invesco Advisers concerning the costs of the advisory and other services that Invesco Advisers and its affiliates provide to the Fund and the Invesco Funds and the profitability of Invesco Advisers and its affiliates in providing these services. The Board noted that Invesco Advisers continues to operate at a net profit from services Invesco Advisers and its affiliates provide to the Invesco Funds. The Board noted that Invesco Advisers
and its subsidiaries did not make a profit from managing the Fund. The Board received and accepted information from Invesco Advisers demonstrating that Invesco Advisers and each Affiliated Sub-Adviser are financially sound and have the resources necessary to perform their obligations under the investment advisory agreement and sub-advisory contracts.
| F. | Collateral Benefits to Invesco Advisers and its Affiliates |
The Board considered various other benefits received by Invesco Advisers and its affiliates from the relationship with the Fund, including the fees received for providing transfer agency and distribution services to the Fund. The Board considered comparative information regarding fees charged for these services, including information provided by Broadridge and other independent sources. The Board considered the performance of Invesco Advisers and its affiliates in providing these services and the organizational structure employed to provide these services. The Board also considered that these services are provided to the Fund pursuant to written contracts that are reviewed and approved on an annual basis by the Board; and that the services are required for the operation of the Fund.
The Board considered the benefits realized by Invesco Advisers and the Affiliated Sub-Advisers as a result of portfolio brokerage transactions executed through “soft dollar” arrangements. The Board noted that soft dollar arrangements may result in the Fund bearing costs to purchase research that may be used by Invesco Advisers or the Affiliated Sub-Advisers with other clients and may reduce Invesco Adviser’s or the Affiliated Sub-Adviser’s expenses. The Board also considered that it receives periodic reports from the Chief Compliance Officer of the Invesco Funds demonstrating that these arrangements are consistent with regulatory requirements. The Board did not deem the soft dollar arrangements to be inappropriate.
The Board considered that the Fund’s uninvested cash and cash collateral from any securities lending arrangements may be invested in money market funds advised by Invesco Advisers pursuant to procedures approved by the Board. The Board noted that Invesco Advisers receives advisory fees from these affiliated money market funds attributable to such investments, although Invesco Advisers has contractually agreed to waive through varying periods the advisory fees payable by the Invesco Funds with respect to certain investments in the affiliated money market funds. The waiver is in an amount equal to 100% of the net advisory fee Invesco Advisers receives from the affiliated money market funds with respect to the Fund’s investment in the affiliated money market funds of uninvested cash, but not cash collateral. The Board concluded that the amount of advisory fees received by Invesco Advisers from the Fund’s investment of cash collateral from any
securities lending arrangements in the affiliated money market funds is fair and reasonable.
The Board also considered that the Fund may use an affiliated broker to execute certain trades for the Fund to, among other things, control information leakage, and was advised that such trades would be executed in compliance with rules under the federal securities laws and consistent with best execution obligations.
29 Invesco MLP Fund
Trustees and Officers
The address of each trustee and officer is AIM Investment Funds (Invesco Investment Funds) (the “Trust”), 11 Greenway Plaza, Suite 1000, Houston, Texas 77046-1173. The trustees serve for the life of the Trust, subject to their earlier death, incapacitation, resignation, retirement or removal as more specifically provided in the Trust’s organizational documents. Each officer serves for a one year term or until their successors are elected and qualified. Column two below includes length of time served with predecessor entities, if any.
| | | | | | | | |
Name, Year of Birth and Position(s) Held with the Trust | | Trustee and/
or Officer Since | | Principal Occupation(s)
During Past 5 Years | | Number of
Funds in Fund
Complex
Overseen by
Trustee | | Other Directorship(s)
Held by Trustee During Past 5 Years |
| Interested Persons | | | | | | | | |
| Martin L. Flanagan1 — 1960 Trustee | | 2007 | | Executive Director, Chief Executive Officer and President, Invesco Ltd. (ultimate parent of Invesco and a global investment management firm); Trustee, The Invesco Funds; Vice Chair, Investment Company Institute; and Member of Executive Board, SMU Cox School of Business Formerly: Advisor to the Board, Invesco Advisers, Inc. (formerly known as Invesco Institutional (N.A.), Inc.); Chairman and Chief Executive Officer, Invesco Advisers, Inc. (registered investment adviser); Director, Chairman, Chief Executive Officer and President, Invesco Holding Company (US), Inc. (formerly IVZ Inc.) (holding company), Invesco Group Services, Inc. (service provider) and Invesco North American Holdings, Inc. (holding company); Director, Chief Executive Officer and President, Invesco Holding Company Limited (parent of Invesco and a global investment management firm); Director, Invesco Ltd.; Chairman, Investment Company Institute and President, Co-Chief Executive Officer, Co-President, Chief Operating Officer and Chief Financial Officer, Franklin Resources, Inc. (global investment management organization) | | 158 | | None |
Philip A. Taylor2 — 1954 Trustee and Senior Vice President | | 2006 | | Head of the Americas and Senior Managing Director, Invesco Ltd.; Director, Invesco Advisers, Inc. (formerly known as Invesco Institutional (N.A.), Inc.) (registered investment adviser); Director, Chairman, Chief Executive Officer and President, Invesco Management Group, Inc. (formerly known as Invesco Aim Management Group, Inc.) (financial services holding company); Director and Chairman, Invesco Investment Services, Inc. (formerly known as Invesco Aim Investment Services, Inc.) (registered transfer agent); Chief Executive Officer, Invesco Corporate Class Inc. (corporate mutual fund company); Director, Chairman and Chief Executive Officer, Invesco Canada Ltd. (formerly known as Invesco Trimark Ltd./Invesco Trimark Ltèe) (registered investment adviser and registered transfer agent); Trustee and Senior Vice President, The Invesco Funds; Director, Invesco Investment Advisers LLC (formerly known as Van Kampen Asset Management). Formerly: Co-Chairman, Co-President and Co-Chief Executive Officer, Invesco Advisers, Inc. (formerly known as Invesco Institutional (N.A.), Inc.) (registered investment adviser); Director, Chief Executive Officer and President, Van Kampen Exchange Corp; President and Principal Executive Officer, The Invesco Funds (other than AIM Treasurer’s Series Trust (Invesco Treasurer’s Series Trust), Short-Term Investments Trust and Invesco Management Trust); Executive Vice President, The Invesco Funds (AIM Treasurer’s Series Trust (Invesco Treasurer’s Series Trust), Short-Term Investments Trust and Invesco Management Trust only); Director and President, INVESCO Funds Group, Inc. (registered investment adviser and registered transfer agent); Director and Chairman, IVZ Distributors, Inc. (formerly known as INVESCO Distributors, Inc.) (registered broker dealer); Director, President and Chairman, Invesco Inc. (holding company), Invesco Canada Holdings Inc. (holding company), Trimark Investments Ltd./Placements Trimark Ltèe and Invesco Financial Services Ltd/Services Financiers Invesco Ltèe; Chief Executive Officer, Invesco Canada Fund Inc. (corporate mutual fund company); Director and Chairman, Van Kampen Investor Services Inc.; Director, Chief Executive Officer and President, 1371 Preferred Inc. (holding company) and Van Kampen Investments Inc.; Director and President, AIM GP Canada Inc. (general partner for limited partnerships) and Van Kampen Advisors, Inc.; Director and Chief Executive Officer, Invesco Trimark Dealer Inc. (registered broker dealer); Director, Invesco Distributors, Inc. (formerly known as Invesco Aim Distributors, Inc.) (registered broker dealer); Manager, Invesco PowerShares Capital Management LLC; Director, Chief Executive Officer and President, Invesco Advisers, Inc.; Director, Chairman, Chief Executive Officer and President, Invesco Aim Capital Management, Inc.; President, Invesco Trimark Dealer Inc. and Invesco Trimark Ltd./Invesco Trimark Ltèe; Director and President, AIM Trimark Corporate Class Inc. and AIM Trimark Canada Fund Inc.; Senior Managing Director, Invesco Holding Company Limited; Director and Chairman, Fund Management Company (former registered broker dealer); President and Principal Executive Officer, The Invesco Funds (AIM Treasurer’s Series Trust (Invesco Treasurer’s Series Trust), and Short-Term Investments Trust only); President, AIM Trimark Global Fund Inc. and AIM Trimark Canada Fund Inc. | | 158 | | None |
| 1 | Mr. Flanagan is considered an interested person (within the meaning of Section 2(a)(19) of the 1940 Act) of the Trust because he is an officer of the Adviser to the Trust, and an officer and a director of Invesco Ltd., ultimate parent of the Adviser. |
| 2 | Mr. Taylor is considered an interested person (within the meaning of Section 2(a)(19) of the 1940 Act) of the Trust because he is an officer and a director of the Adviser. |
T-1 Invesco MLP Fund
Trustees and Officers—(continued)
| | | | | | | | |
Name, Year of Birth and Position(s) Held with the Trust | | Trustee and/
or Officer Since | | Principal Occupation(s) During Past 5 Years | | Number of
Funds in Fund
Complex
Overseen by
Trustee | | Other Directorship(s)
Held by Trustee During Past 5 Years |
| Independent Trustees | | | | | | | | |
Bruce L. Crockett — 1944 Trustee and Chair | | 2001 | | Chairman, Crockett Technologies Associates (technology consulting company) Formerly: Director, Captaris (unified messaging provider); Director, President and Chief Executive Officer, COMSAT Corporation; Chairman, Board of Governors of INTELSAT (international communications company); ACE Limited (insurance company); Independent Directors Council and Investment Company Institute: Member of the Audit Committee, Investment Company Institute; Member of the Executive Committee and Chair of the Governance Committee, Independent Directors Council | | 158 | | Director and Chairman of the Audit Committee, ALPS (Attorneys Liability Protection Society) (insurance company); Director and Member of the Audit Committee, Ferroglobe PLC (metallurgical company) |
David C. Arch — 1945 Trustee | | 2010 | | Chairman of Blistex Inc. (consumer health care products manufacturer); Member, World Presidents’ Organization | | 158 | | Board member of the Illinois Manufacturers’ Association |
James T. Bunch — 1942 Trustee | | 2003 | | Managing Member, Grumman Hill Group LLC (family office/private equity investments) Formerly: Chairman of the Board, Denver Film Society; Chairman of the Board of Trustees, Evans Scholarship Foundation; Chairman, Board of Governors, Western Golf Association | | 158 | | Trustee, Evans Scholarship Foundation |
Jack M. Fields — 1952 Trustee | | 2001 | | Chief Executive Officer, Twenty First Century Group, Inc. (government affairs company); and Discovery Learning Alliance (non-profit) Formerly: Owner and Chief Executive Officer, Dos Angeles Ranch L.P. (cattle, hunting, corporate entertainment); Director, Insperity, Inc. (formerly known as Administaff) (human resources provider); Chief Executive Officer, Texana Timber LP (sustainable forestry company); Director of Cross Timbers Quail Research Ranch (non-profit); and member of the U.S. House of Representatives | | 158 | | None |
Cynthia Hostetler — 1962 Trustee | | 2017 | | Non-Executive Director and Trustee of a number of public and private business corporations Formerly: Head of Investment Funds and Private Equity, Overseas Private Investment Corporation; President, First Manhattan Bancorporation, Inc.; Attorney, Simpson Thacher & Bartlett LLP | | 158 | | Vulcan Materials Company (construction materials company); Trilinc Global Impact Fund; Aberdeen Investment Funds (4 portfolios); Artio Global Investment LLC (mutual fund complex); Edgen Group, Inc. (specialized energy and infrastructure products distributor) |
Eli Jones — 1961 Trustee | | 2016 | | Professor and Dean, Mays Business School — Texas A&M University Formerly: Professor and Dean, Walton College of Business, University of Arkansas and E.J. Ourso College of Business, Louisiana State University; Director, Arvest Bank | | 158 | | Insperity, Inc. (formerly known as Administaff) (human resources provider) |
Prema Mathai-Davis — 1950 Trustee | | 2001 | | Retired. Formerly: Chief Executive Officer, YWCA of the U.S.A. | | 158 | | None |
Teresa M. Ressel — 1962 Trustee | | 2017 | | Non-executive director and trustee of a number of public and private business corporations Formerly: Chief Financial Officer, Olayan America, The Olayan Group (international investor/commercial/industrial); Chief Executive Officer, UBS Securities LLC; Group Chief Operating Officer, Americas, UBS AG; Assistant Secretary for Management & Budget and CFO, US Department of the Treasury; Chief Compliance Officer, Kaiser Permanente (healthcare consortium); Program Manager, Hewlett-Packard; Nuclear Engineering, General Dynamics Corporation (aerospace and defense company) | | 158 | | Atlantic Power Corporation (power generation company); ON Semiconductor Corp. (semiconductor supplier) |
Larry Soll — 1942 Trustee | | 2003 | | Retired. Formerly: Chairman, Chief Executive Officer and President, Synergen Corp. (a biotechnology company) | | 158 | | None |
Ann Barnett Stern — 1957 Trustee | | 2017 | | President and Chief Executive Officer, Houston Endowment Inc. (private philanthropic institution) Formerly: Executive Vice President and General Counsel, Texas Children’s Hospital; Attorney, Beck, Redden and Secrest, LLP; Business Law Instructor, University of St. Thomas; Attorney, Andrews & Kurth LLP | | 158 | | Federal Reserve Bank of Dallas |
Raymond Stickel, Jr. — 1944 Trustee | | 2005 | | Retired. Formerly: Director, Mainstay VP Series Funds, Inc. (25 portfolios); Partner, Deloitte & Touche | | 158 | | None |
Robert C. Troccoli — 1949 Trustee | | 2016 | | Adjunct Professor, University of Denver — Daniels College of Business Formerly: Senior Partner, KPMG LLP | | 158 | | None |
T-2 Invesco MLP Fund
Trustees and Officers—(continued)
| | | | | | | | |
Name, Year of Birth and Position(s) Held with the Trust | | Trustee and/
or Officer Since | | Principal Occupation(s) During Past 5 Years | | Number of
Funds in Fund
Complex
Overseen by
Trustee | | Other Directorship(s)
Held by Trustee During Past 5 Years |
| Independent Trustees—(continued) |
Christopher L. Wilson — 1957 Trustee | | 2017 | | Managing Partner, CT2, LLC (investing and consulting firm) Formerly: President/Chief Executive Officer, Columbia Funds, Bank of America Corporation; President/Chief Executive Officer, CDC IXIS Asset Management Services, Inc.; Principal & Director of Operations, Scudder Funds, Scudder, Stevens & Clark, Inc.; Assistant Vice President, Fidelity Investments | | 158 | | TD Asset Management USA Inc. (mutual fund complex) (22 portfolios); ISO New England, Inc. (non-profit organization managing regional electricity market) |
| Other Officers | | | | | | | | |
Sheri Morris — 1964 President, Principal Executive Officer and Treasurer | | 1999 | | President, Principal Executive Officer and Treasurer, The Invesco Funds; Vice President, Invesco Advisers, Inc. (formerly known as Invesco Institutional (N.A.), Inc.) (registered investment adviser); and Vice President, PowerShares Exchange-Traded Fund Trust, PowerShares Exchange-Traded Fund Trust II, PowerShares India Exchange-Traded Fund Trust, PowerShares Actively Managed Exchange-Traded Fund Trust and PowerShares Actively Managed Exchange-Traded Commodity Fund Trust Formerly: Vice President and Principal Financial Officer, The Invesco Funds; Vice President, Invesco Aim Advisers, Inc., Invesco Aim Capital Management, Inc. and Invesco Aim Private Asset Management, Inc.; Assistant Vice President and Assistant Treasurer, The Invesco Funds and Assistant Vice President, Invesco Advisers, Inc., Invesco Aim Capital Management, Inc. and Invesco Aim Private Asset Management, Inc.; and Treasurer, PowerShares Exchange-Traded Fund Trust, PowerShares Exchange-Traded Fund Trust II, PowerShares India Exchange-Traded Fund Trust and PowerShares Actively Managed Exchange-Traded Fund Trust | | N/A | | N/A |
Russell C. Burk — 1958 Senior Vice President and Senior Officer | | 2005 | | Senior Vice President and Senior Officer, The Invesco Funds | | N/A | | N/A |
John M. Zerr — 1962 Senior Vice President, Chief Legal Officer and Secretary | | 2006 | | Director, Senior Vice President, Secretary and General Counsel, Invesco Management Group, Inc. (formerly known as Invesco AIM Management Group, Inc.); Senior Vice President, Invesco Advisers, Inc. (formerly known as Invesco Institutional (N.A.), Inc.) (registered investment adviser); Senior Vice President and Secretary, Invesco Distributors, Inc. (formerly known as Invesco AIM Distributors, Inc.); Director, Vice President and Secretary, Invesco Investment Services, Inc. (formerly known as Invesco AIM Investment Services, Inc.) Senior Vice President, Chief Legal Officer and Secretary, The Invesco Funds; Managing Director, Invesco PowerShares Capital Management LLC; Director, Secretary and General Counsel, Invesco Investment Advisers LLC (formerly known as Van Kampen Asset Management); Secretary and General Counsel, Invesco Capital Markets, Inc. (formerly known as Van Kampen Funds Inc.) and Chief Legal Officer, PowerShares Exchange-Traded Fund Trust, PowerShares Exchange-Traded Fund Trust II, PowerShares India Exchange-Traded Fund Trust, PowerShares Actively Managed Exchange-Traded Fund Trust and PowerShares Actively Managed Exchange-Traded Commodity Fund Trust; Manager and Secretary, Invesco Indexing LLC Formerly: Director, Secretary, General Counsel and Senior Vice President, Van Kampen Exchange Corp.; Director, Vice President and Secretary, IVZ Distributors, Inc. (formerly known as INVESCO Distributors, Inc.); Director and Vice President, INVESCO Funds Group, Inc.; Director and Vice President, Van Kampen Advisors Inc.; Director, Vice President, Secretary and General Counsel, Van Kampen Investor Services Inc.; Director, Invesco Distributors, Inc. (formerly known as Invesco AIM Distributors, Inc.); Director, Senior Vice President, General Counsel and Secretary, Invesco AIM Advisers, Inc. and Van Kampen Investments Inc.; Director, Vice President and Secretary, Fund Management Company; Director, Senior Vice President, Secretary, General Counsel and Vice President, Invesco AIM Capital Management, Inc.; Chief Operating Officer and General Counsel, Liberty Ridge Capital, Inc. (an investment adviser); Vice President and Secretary, PBHG Funds (an investment company) and PBHG Insurance Series Fund (an investment company); Chief Operating Officer, General Counsel and Secretary, Old Mutual Investment Partners (a broker-dealer); General Counsel and Secretary, Old Mutual Fund Services (an administrator) and Old Mutual Shareholder Services (a shareholder servicing center); Executive Vice President, General Counsel and Secretary, Old Mutual Capital, Inc. (an investment adviser); and Vice President and Secretary, Old Mutual Advisors Funds (an investment company) | | N/A | | N/A |
Gregory G. McGreevey — 1962 Senior Vice President | | 2012 | | Senior Managing Director, Invesco Ltd.; Director, Chairman, President, and Chief Executive Officer, Invesco Advisers, Inc. (formerly known as Invesco Institutional (N.A.), Inc.) (registered investment adviser); Senior Vice President, Invesco Management Group, Inc.; Director, Invesco Mortgage Capital, Inc. and Invesco Senior Secured Management, Inc.; and Senior Vice President, The Invesco Funds Formerly: Assistant Vice President, The Invesco Funds | | N/A | | N/A |
T-3 Invesco MLP Fund
Trustees and Officers—(continued)
| | | | | | | | |
Name, Year of Birth and Position(s) Held with the Trust | | Trustee and/
or Officer Since | | Principal Occupation(s) During Past 5 Years | | Number of
Funds in Fund
Complex
Overseen by
Trustee | | Other Directorship(s)
Held by Trustee During Past 5 Years |
| Other Officers—(continued) | | | | | | | | |
Kelli Gallegos — 1970 Vice President, Principal Financial Officer and Assistant Treasurer | | 2008 | | Vice President, Principal Financial Officer and Assistant Treasurer, The Invesco Funds; Assistant Treasurer, Invesco PowerShares Capital Management LLC, PowerShares Exchange-Traded Fund Trust, PowerShares Exchange-Traded Fund Trust II, PowerShares India Exchange-Traded Fund Trust, PowerShares Actively Managed Exchange-Traded Fund Trust and PowerShares Actively Managed Exchange-Traded Commodity Fund Trust Formerly: Assistant Vice President, The Invesco Funds | | N/A | | N/A |
Tracy Sullivan — 1962 Vice President, Chief Tax Officer and Assistant Treasurer | | 2008 | | Vice President, Chief Tax Officer and Assistant Treasurer, The Invesco Funds; Assistant Treasurer, Invesco PowerShares Capital Management LLC, PowerShares Exchange-Traded Fund Trust, PowerShares Exchange-Traded Fund Trust II, PowerShares India Exchange-Traded Fund Trust, PowerShares Actively Managed Exchange-Traded Fund Trust and PowerShares Actively Managed Exchange-Traded Commodity Fund Trust Formerly: Assistant Vice President, The Invesco Funds | | N/A | | N/A |
Crissie M. Wisdom — 1969 Anti-Money Laundering Compliance Officer | | 2013 | | Anti-Money Laundering Compliance Officer, Invesco Advisers, Inc. (formerly known as Invesco Institutional (N.A.), Inc.) (registered investment adviser), Invesco Capital Markets, Inc. (formerly known as Van Kampen Funds Inc.), Invesco Distributors, Inc., Invesco Investment Services, Inc., Invesco Management Group, Inc., The Invesco Funds, and PowerShares Exchange-Traded Fund Trust, PowerShares Exchange-Traded Fund Trust II, PowerShares India Exchange-Traded Fund Trust, PowerShares Actively Managed Exchange-Traded Fund Trust and PowerShares Actively Managed Exchange-Traded Commodity Fund Trust; Anti-Money Laundering Compliance Officer and Bank Secrecy Act Officer, INVESCO National Trust Company and Invesco Trust Company; and Fraud Prevention Manager and Controls and Risk Analysis Manager for Invesco Investment Services, Inc. Formerly: Anti-Money Laundering Compliance Officer, Van Kampen Exchange Corp. | | N/A | | N/A |
Robert R. Leveille — 1969 Chief Compliance Officer | | 2016 | | Chief Compliance Officer, Invesco Advisers, Inc. (registered investment adviser); and Chief Compliance Officer, The Invesco Funds Formerly: Chief Compliance Officer, Putnam Investments and the Putnam Funds | | N/A | | N/A |
The Statement of Additional Information of the Trust includes additional information about the Fund’s Trustees and is available upon request, without charge, by calling 1.800.959.4246. Please refer to the Fund’s Statement of Additional Information for information on the Fund’s sub-advisers.
| | | | | | |
Office of the Fund 11 Greenway Plaza, Suite 1000 Houston, TX 77046-1173 | | Investment Adviser Invesco Advisers, Inc. 1555 Peachtree Street, N.E. Atlanta, GA 30309 | | Distributor Invesco Distributors, Inc. 11 Greenway Plaza, Suite 1000 Houston, TX 77046-1173 | | Auditors PricewaterhouseCoopers LLP 1000 Louisiana Street, Suite 5800 Houston, TX 77002-5678 |
| | | |
| | | | | | |
Counsel to the Fund Stradley Ronon Stevens & Young, LLP 2005 Market Street, Suite 2600 Philadelphia, PA 19103-7018 | | Counsel to the Independent Trustees Goodwin Procter LLP 901 New York Avenue, N.W. Washington, D.C. 20001 | | Transfer Agent Invesco Investment Services, Inc. 11 Greenway Plaza, Suite 1000 Houston, TX 77046-1173 | | Custodian State Street Bank and Trust Company 225 Franklin Street Boston, MA 02110-2801 |
T-4 Invesco MLP Fund
Explore High-Conviction Investing with Invesco

Go paperless with eDelivery
Visit invesco.com/edelivery to enjoy the convenience and security of anytime electronic access to your investment documents.
With eDelivery, you can elect to have any or all of the following materials delivered straight to your inbox to download, save and print from your own computer:
| ∎ | | Fund reports and prospectuses |
Invesco mailing information
Send general correspondence to Invesco Investment Services, Inc., P.O. Box 219078, Kansas City, MO 64121-9078.
Important notice regarding delivery of security holder documents
To reduce Fund expenses, only one copy of most shareholder documents may be mailed to shareholders with multiple accounts at the same address (Householding). Mailing of your shareholder documents may be householded indefinitely unless you instruct us otherwise. If you do not want the mailing of these documents to be combined with those for other members of your household, please contact Invesco Investment Services, Inc. at 800 959 4246 or contact your financial institution. We will begin sending you individual copies for each account within 30 days after receiving your request.
Fund holdings and proxy voting information
The Fund provides a complete list of its holdings four times in each fiscal year, at the quarter ends. For the second and fourth quarters, the lists appear in the Fund’s semiannual and annual reports to shareholders. For the first and third quarters, the Fund files the lists with the Securities and Exchange Commission (SEC) on Form N-Q. The most recent list of portfolio holdings is available at invesco.com/completeqtrholdings. Shareholders can also look up the Fund’s Forms N-Q on the SEC website at sec.gov. Copies of the Fund’s Forms N-Q may be reviewed and copied at the SEC Public Reference Room in Washington, D.C. You can obtain information on the operation of the Public Reference Room, including information about duplicating fee charges, by calling 202 551 8090 or 800 732 0330, or by electronic request at the following email address: publicinfo@sec.gov. The SEC file numbers for the Fund are shown below.
A description of the policies and procedures that the Fund uses to determine how to vote proxies relating to portfolio securities is available without charge, upon request, from our Client Services department at 800 959 4246 or at invesco.com/proxyguidelines. The information is also available on the SEC website, sec.gov.
| | |
Information regarding how the Fund voted proxies related to its portfolio securities during the most recent 12-month period ended June 30 is available at invesco.com/proxysearch. The information is also available on the SEC website, sec.gov. Invesco Advisers, Inc. is an investment adviser; it provides investment advisory services to individual and institutional clients and does not sell securities. Invesco Distributors, Inc. is the US distributor for Invesco Ltd.’s retail mutual funds, exchange-traded funds and institutional money market funds. Both are wholly owned, indirect subsidiaries of Invesco Ltd. | |  |
| | | | | | | | |
| SEC file numbers: 811-05426 and 033-19338 | | Invesco Distributors, Inc. | | MLP-AR-1 | | 12182017 | | 1002 |
Letters to Shareholders
| | |

Philip Taylor | | Dear Shareholders: This annual report includes information about your Fund, including performance data and a complete list of its investments as of the close of the reporting period. Inside is a discussion of how your Fund was managed and the factors that affected its performance during the reporting period. American voters went to the polls just days after the start of the reporting period, and their decisions quickly affected markets. The US stock market rallied strongly after the election, with major market indexes rising, and setting record highs, throughout the reporting period. Generally positive economic data, strong corporate earnings and hope for tax and regulatory reform contributed to the rally. US and global bond markets, as well as emerging market equities, sold off immediately following the election – with the US bond market eventually recovering most of its losses. Overseas, economic data were mixed, prompting the European Central Bank and central banks in China and Japan, among other countries, to |
maintain extraordinarily accommodative monetary policies. Citing positive economic trends – specifically, realized and expected labor market conditions and inflation – the US Federal Reserve raised interest rates three times during the reporting period: first in December 2016, and then again in March and June 2017. Health care and tax reform proved to be more difficult than expected to enact, with little progress achieved by the end of the reporting period.
Short-term market volatility can prompt some investors to abandon their investment plans – and can cause others to settle for whatever returns the market has to offer. The investment professionals at Invesco, in contrast, invest with high conviction. This means that, no matter the asset class or the strategy, each investment team has a passion to exceed. We want to help investors achieve better outcomes, such as seeking higher returns, helping mitigate risk and generating income. Of course, investing with high conviction can’t guarantee a profit or ensure success; no investment strategy can. To learn more about how we invest with high conviction, visit invesco.com/HighConviction.
You, too, can invest with high conviction by maintaining a long-term investment perspective and by working with your financial adviser on a regular basis. During periods of short-term market volatility or uncertainty, your financial adviser can keep you focused on your long-term investment goals – a new home, a child’s college education or a secure retirement. He or she also can share research about the economy, the markets and individual investment options.
Visit our website for more information on your investments
Our website, invesco.com/us, offers a wide range of market insights and investment perspectives. On the website, you’ll find detailed information about our funds, including performance, holdings and portfolio manager commentaries. You can access information about your account by completing a simple, secure online registration. To do so, select “Log In” on the right side of the homepage, and then select “Register for Individual Account Access.”
In addition to the resources accessible on our website and through our mobile app, you can obtain timely updates to help you stay informed about the markets and the economy by connecting with Invesco on Twitter, LinkedIn or Facebook. You can access our blog at blog.invesco.us.com. Our goal is to provide you the information you want, when and where you want it.
Finally, I’m pleased to share with you Invesco’s commitment to both the Principles for Responsible Investment and to considering environmental, social and governance issues in our robust investment process. I invite you to learn more at invesco.com/esg.
Have questions?
For questions about your account, contact an Invesco client services representative at 800 959 4246. For Invesco-related questions or comments, please email me directly at phil@invesco.com.
All of us at Invesco look forward to serving your investment management needs. Thank you for investing with us.
Sincerely,

Philip Taylor
Senior Managing Director, Invesco Ltd.
2 Invesco Multi-Asset Income Fund
| | | | | | |

Bruce Crockett | | | | Dear Fellow Shareholders: Among the many important lessons I’ve learned in more than 40 years in a variety of business endeavors is the value of a trusted advocate. As independent chair of the Invesco Funds Board, I can assure you that the members of the Board are strong advocates for the interests of investors in Invesco’s mutual funds. We work hard to represent your interests through oversight of the quality of the investment management services your funds receive and other matters important to your investment, including but not limited to: |
| | | | ∎ | | Ensuring that Invesco offers a diverse lineup of mutual funds that your financial adviser can use to strive to meet your financial needs as your investment goals change over time. |
| | | | ∎ | | Monitoring how the portfolio management teams of the Invesco funds are performing in light of changing economic and market conditions. |
| ∎ | | Assessing each portfolio management team’s investment performance within the context of the investment strategy described in the fund’s prospectus. |
| ∎ | | Monitoring for potential conflicts of interests that may impact the nature of the services that your funds receive. |
We believe one of the most important services we provide our fund shareholders is the annual review of the funds’ advisory and sub-advisory contracts with Invesco Advisers and its affiliates. This review is required by the Investment Company Act of 1940 and focuses on the nature and quality of the services Invesco provides as the adviser to the Invesco funds and the reasonableness of the fees that it charges for those services. Each year, we spend months carefully reviewing information received from Invesco and a variety of independent sources, such as performance and fee data prepared by Lipper, Inc. (a subsidiary of Broadridge Financial Solutions, Inc.), an independent, third-party firm widely recognized as a leader in its field. We also meet with our independent legal counsel and other independent advisers to review and help us assess the information that we have received. Our goal is to assure that you receive quality investment management services for a reasonable fee.
I trust the measures outlined above provide assurance that you have a worthy advocate when it comes to choosing the Invesco Funds.
As always, please contact me at bruce@brucecrockett.com with any questions or concerns you may have. On behalf of the Board, we look forward to continuing to represent your interests and serving your needs.
Sincerely,

Independent Chair
Invesco Funds Board of Trustees
3 Invesco Multi-Asset Income Fund
Management’s Discussion of Fund Performance
| | | | |
Performance summary For the fiscal year ended October 31, 2017, Class A shares of Invesco Multi-Asset Income Fund (the Fund), at net asset value (NAV), underperformed the Custom Invesco Multi-Asset Income Index, the Fund’s style-specific benchmark. Your Fund’s long-term performance appears later in this report. | |
Fund vs. Indexes Total returns, 10/31/16 to 10/31/17, at net asset value (NAV). Performance shown does not include applicable contingent deferred sales charges (CDSC) or front-end sales charges, which would have reduced performance. | |
| |
Class A Shares | | | 9.64% | |
Class C Shares | | | 8.83 | |
Class R Shares | | | 9.37 | |
Class Y Shares | | | 9.91 | |
Class R5 Shares | | | 9.81 | |
Class R6 Shares | | | 9.91 | |
Bloomberg Barclays U.S. Aggregate Index▼ (Broad Market Index) | | | 0.90 | |
Custom Invesco Multi-Asset Income Index∎ (Style-Specific Index) | | | 12.27 | |
| Lipper Mixed-Asset Target Allocation Conservative Funds Index◆ (Peer Group Index) | | | 7.82 | |
| |
| Source(s): ▼FactSet Research Systems, Inc.; ∎Invesco, FactSet Research Systems, Inc.; ◆Lipper Inc. | | | | |
Market conditions and your Fund
For the fiscal year ended October 31, 2017, Invesco Multi-Asset Income Fund, at NAV, provided positive returns, led by gains in US large-cap preferred equities, US high yield securities, US mortgage real estate investment trusts (REITs), emerging market government bonds and master limited partnerships (MLPs). Conversely, equity REITs and US 30-year STRIPS were the only strategic asset classes that detracted from Fund performance. Tactical allocation shifts helped Fund performance, with the strategy maintaining a consistent overweight allocation to equity risk, which proved timely. The tactical step of the investment process allows the Fund to adapt to short-term market dynamics by shifting its sensitivity to equity or fixed income markets, which are used as proxies for risk metrics incurred within the strategic allocation.
Preferred securities were the top contributor to Fund performance for the reporting period. Over the fiscal year, the asset class experienced a positive change in overall sentiment after a dismal 2016. The tide turned on multiple fronts. Bank and insurance fundamentals were strong and improving, and capital levels appeared likely to remain healthy and supportive for preferred investors. While markets were potentially underestimating the speed of future US Federal Reserve (the Fed) interest rate hikes, recent rate hikes by the Fed point to a cautious approach.
The US high yield market also contributed to Fund performance for the fiscal year. This was consistent with a market environment in which investors favored riskier investments. Moreover, tightening credit spreads across the rating spectrum enhanced the Fund’s coupon income. Additionally, energy prices, which rallied
substantially over the reporting period, exerted positive influence on the performance of high yield securities, leading to firmer prices and tightening credit spreads in the high yield energy sub-sector.
Mortgage REITs (i.e., bundles of mortgages that pass homeowners’ payments on to investors) also contributed to Fund performance for the reporting period. Despite the Fed moving toward a tightening stance in monetary policy, many conditions improved for the asset class during the reporting period. Chief among them were steadily falling mortgage default rates, rising housing prices, a stronger economy and a declining unemployment rate. All these factors enhanced the ability of homeowners to service their debt, which in turn aided mortgage REIT dividend payments and security prices.
Exposure to emerging market debt also contributed to Fund performance. The asset class’ performance often exhibits an inherent inverse correlation with the valuation of the US dollar. This feature stems from the fact that dollar-denominated debt becomes more expensive to service with a weaker local currency. This phenomenon was experienced at the beginning of the reporting period, given expectations of higher growth and inflation in the US. Weakening of the dollar due to softening economic data points, concerns about the implementation of increased infrastructure spending, the possibility of a major tax overhaul and efforts to repeal the Affordable Care Act by the new administration all proved supportive of emerging market debt. During the reporting period, market participants acknowledged the widespread and synchronized growth in emerging economies, with aggregate manufacturing data exhibiting signs of expansion. While a global normalization of monetary policy
| | |
Portfolio Composition | | |
By security type | | % of total net assets |
| | | | | |
| |
| U.S. Dollar-Denominated Bonds & Notes | | | | 40.0 | % |
| Preferred Stocks | | | | 22.0 | |
| Common Stocks & Other Equity Interests | | | | 14.4 | |
| U.S. Treasury Securities | | | | 8.3 | |
| Exchange-Traded Notes | | | | 8.2 | |
| Non-U.S. Dollar-Denominated Bonds & Notes | | | | 0.2 | |
| Variable Rate Senior Loan Interests | | | | 0.1 | |
| Money Market Funds Plus Other Assets Less Liabilities | | | | 6.8 | |
| | | | |
Top Five Debt Issuers | | |
| | | | % of total net assets |
| | | | |
| | |
| 1. | | U.S. Treasury Securities | | 8.3% |
| 2. | | El Salvador Government International Bond | | 0.6 |
| 3. | | Kazakhstan Government International Bond | | 0.6 |
| 4. | | Argentine Republic Government International Bond | | 0.6 |
| 5. | | Mexico Government International Bond | | 0.6 |
| | | | | |
Total Net Assets | | | | $657.1 million | |
| | | | | |
| |
| Total Number of Holdings* | | | | 709 | |
The Fund’s holdings are subject to change, and there is no assurance that the Fund will continue to hold any particular security.
*Excluding money market fund holdings.
Data presented here are as of October 31, 2017.
4 Invesco Multi-Asset Income Fund
could temporarily hamper performance in emerging market assets, a more gradual approach to this normalization process should be supportive.
MLPs, another contributor to Fund performance, tend to perform in unison with energy commodities. With the outcome of last year’s presidential election outcome elevating expectations of increased infrastructure spending, prices of West Texas Intermediate crude oil recovered from its early 2016 lows, which in turn pushed valuations of MLPs higher. While crude prices remained fairly range bound for the remainder of the reporting period, rig counts and production trends continued to improve the supply/demand balance, further supporting MLPs.
The top detractor from Fund performance was our exposure to 30-year US STRIPS. By the nature of its design, this type of security tends to exhibit significant sensitivity to changes in interest rates. This is the role this asset plays in the portfolio: providing some protection in the event of market contraction leading to lower interest rates. With the Fed gradually raising rates, US STRIPS struggled for most of the reporting period.
The Fund’s tactical allocation was a net contributor to overall results. While overweight exposure to equity markets proved beneficial to Fund performance, the Fund’s sovereign debt exposure represented a challenge. Canadian government bonds, in particular, struggled, following two 50-basis point rate increases during the reporting period. (A basis point is 0.01%.) German bunds and UK gilts also suffered as the European Central Bank and the Bank of England indicated potentially more conservative monetary policies, including curbing or even abandoning their quantitative easing programs.
We expect positive global economic growth to continue going forward, with improving employment and rising personal incomes likely to spur consumer spending and business investment. We anticipate the Fed will continue to tighten monetary policy at a gradual pace and to begin reducing the size of its balance sheet. Although not representing an immediate threat to global economic growth yet, geopolitical tensions with North Korea continue. Unexpected inflationary pressures might also be on the horizon as extremely expansive monetary policies have created imbalances. Nevertheless, the high income rates and yield-spreads relative to US Treasuries and corporate bonds could help to cushion the impact of rising interest rates over time.
Please note that our strategy utilizes derivative instruments that include futures and total return swaps. Therefore, some of the performance of the strategy, both positive and negative, can be attributed to these instruments. Derivatives can be a cost-effective way to gain exposure to asset classes. However, derivatives may amplify traditional investment risks through the creation of leverage and may be less liquid than traditional securities.
Thank you for your continued investment in Invesco Multi-Asset Income Fund.
The views and opinions expressed in management’s discussion of Fund performance are those of Invesco Advisers, Inc. These views and opinions are subject to change at any time based on factors such as market and economic conditions. These views and opinions may not be relied upon as investment advice or recommendations, or as an offer for a particular security. The information is not a complete analysis of every aspect of any market, country, industry, security or the Fund. Statements of fact are from sources considered reliable, but Invesco Advisers, Inc. makes no representation or warranty as to their completeness or accuracy. Although historical performance is no guarantee of future results, these insights may help you understand our investment management philosophy.
See important Fund and, if applicable, index disclosures later in this report.
| | |
 | | Scott Wolle Chartered Financial Analyst, Portfolio Manager, is lead manager of Invesco Multi-Asset Income |
| Fund. He joined Invesco in 1999. Mr. Wolle earned a BS in finance from Virginia Polytechnic Institute and State University and an MBA from Duke University Fuqua School of Business. |
| | |
 | | Mark Ahnrud Chartered Financial Analyst, Portfolio Manager, is manager of Invesco Multi-Asset Income Fund. He |
| joined Invesco in 2000. Mr. Ahnrud earned a BS in finance and investments from Babson College and an MBA from Duke University Fuqua School of Business. |
| | |
 | | Chris Devine Chartered Financial Analyst, Portfolio Manager, is manager of Invesco Multi-Asset Income Fund. He |
| joined Invesco in 1998. Mr. Devine earned a BA in economics from Wake Forest University and an MBA from the University of Georgia. |
| | |
 | | Scott Hixon Chartered Financial Analyst, Portfolio Manager, is manager of Invesco Multi-Asset Income Fund. He |
| joined Invesco in 1994. Mr. Hixon earned a BBA in finance from Georgia Southern University and an MBA in finance from Georgia State University. |
| | |
 | | Peter Hubbard Portfolio Manager, is manager of Invesco Multi-Asset Income Fund. He joined Invesco in 2005. |
| Mr. Hubbard earned a BA in business and economics from Wheaton College. |
| | |
 | | Christian Ulrich Chartered Financial Analyst, Portfolio Manager, is manager of Invesco Multi-Asset Income Fund. He |
| joined Invesco in 2000. Mr. Ulrich earned the equivalent of a BBA from the KV Zurich Business School in Zurich, Switzerland. |
5 Invesco Multi-Asset Income Fund
Your Fund’s Long-Term Performance
Results of a $10,000 Investment – Oldest Share Class(es) since Inception
Fund and index data from 12/14/11
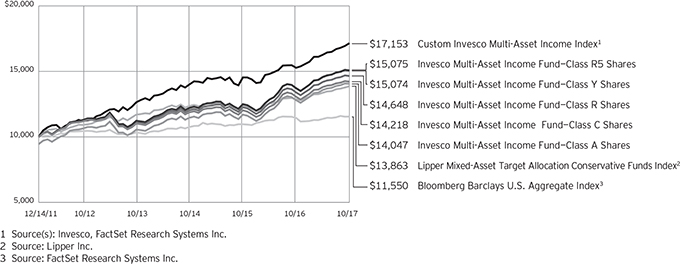
Past performance cannot guarantee comparable future results.
The data shown in the chart include reinvested distributions, applicable sales charges and Fund expenses including management fees. Index results include reinvested dividends, but they do not reflect sales charges. Performance of the peer group, if applicable, reflects fund expenses and management fees; performance
of a market index does not. Performance shown in the chart and table(s) does not reflect deduction of taxes a shareholder would pay on Fund distributions or sale of Fund shares.
6 Invesco Multi-Asset Income Fund
| | | | |
| Average Annual Total Returns | |
| As of 10/31/17, including maximum applicable sales charges | |
| |
Class A Shares | | | | |
Inception (12/14/11) | | | 5.95 | % |
5 Years | | | 4.51 | |
1 Year | | | 3.62 | |
| |
Class C Shares | | | | |
Inception (12/14/11) | | | 6.17 | % |
5 Years | | | 4.90 | |
1 Year | | | 7.83 | |
| |
Class R Shares | | | | |
Inception (12/14/11) | | | 6.70 | % |
5 Years | | | 5.43 | |
1 Year | | | 9.37 | |
| |
Class Y Shares | | | | |
Inception (12/14/11) | | | 7.23 | % |
5 Years | | | 5.94 | |
1 Year | | | 9.91 | |
| |
Class R5 Shares | | | | |
Inception (12/14/11) | | | 7.23 | % |
5 Years | | | 5.94 | |
1 Year | | | 9.81 | |
| |
Class R6 Shares | | | | |
Inception | | | 7.20 | % |
5 Years | | | 5.94 | |
1 Year | | | 9.91 | |
Class R6 shares incepted on September 24, 2012. Performance shown prior to that date is that of Class A shares and includes the 12b-1 fees applicable to Class A shares.
The performance data quoted represent past performance and cannot guarantee comparable future results; current performance may be lower or higher. Please visit invesco.com/performance for the most recent month-end performance. Performance figures reflect reinvested distributions, changes in net asset value and the effect of the maximum sales charge unless otherwise stated. Investment return and principal value will fluctuate so that you may have a gain or loss when you sell shares.
The net annual Fund operating expense ratio set forth in the most recent Fund prospectus as of the date of this report for Class A, Class C, Class R, Class Y, Class R5 and Class R6 shares was 0.85%, 1.60%, 1.10%, 0.60%, 0.60% and 0.60%, respectively.1,2 The total annual Fund operating expense ratio set forth in the most recent Fund prospectus as of the date of this report for Class A, Class C, Class R, Class Y,
| | |
| Average Annual Total Returns |
| As of 9/30/17, the most recent calendar quarter end, including maximum applicable sales charges |
| | | | |
| |
Class A Shares | | | | |
Inception (12/14/11) | | | 6.09 | % |
5 Years | | | 4.71 | |
1 Year | | | 2.01 | |
| |
Class C Shares | | | | |
Inception (12/14/11) | | | 6.32 | % |
5 Years | | | 5.12 | |
1 Year | | | 6.19 | |
| |
Class R Shares | | | | |
Inception (12/14/11) | | | 6.86 | % |
5 Years | | | 5.64 | |
1 Year | | | 7.72 | |
| |
Class Y Shares | | | | |
Inception (12/14/11) | | | 7.38 | % |
5 Years | | | 6.15 | |
1 Year | | | 8.16 | |
| |
Class R5 Shares | | | | |
Inception (12/14/11) | | | 7.40 | % |
5 Years | | | 6.19 | |
1 Year | | | 8.26 | |
| |
Class R6 Shares | | | | |
Inception | | | 7.35 | % |
5 Years | | | 6.17 | |
1 Year | | | 8.16 | |
Class R5 and Class R6 shares was 1.14%, 1.89%, 1.39%, 0.89%, 0.76% and 0.76%, respectively. The expense ratios presented above may vary from the expense ratios presented in other sections of this report that are based on expenses incurred during the period covered by this report.
Class A share performance reflects the maximum 5.50% sales charge, and Class C share performance reflects the applicable contingent deferred sales charge (CDSC) for the period involved. The CDSC on Class C shares is 1% for the first year after purchase. Class R, Class Y, Class R5 and Class R6 shares do not have a front-end sales charge or a CDSC; therefore, performance is at net asset value.
The performance of the Fund’s share classes will differ primarily due to different sales charge structures and class expenses.
Fund performance reflects any applicable fee waivers and/or expense reimbursements. Had the adviser not waived fees and/or reimbursed expenses currently or in the past, returns would have been lower. See current prospectus for more information.
| 1 | Total annual Fund operating expenses after any contractual fee waivers and/or expense reimbursements by the adviser in effect through at least February 28, 2019. See current prospectus for more information. |
| 2 | Total annual Fund operating expenses after any contractual fee waivers and/or expense reimbursements by the adviser in effect through at least June 30, 2019. See current prospectus for more information. |
7 Invesco Multi-Asset Income Fund
Invesco Multi-Asset Income Fund’s investment objective is to provide current income.
| ∎ | | Unless otherwise stated, information presented in this report is as of October 31, 2017, and is based on total net assets. |
| ∎ | | Unless otherwise noted, all data provided by Invesco. |
| ∎ | | To access your Fund’s reports/prospectus, visit invesco.com/fundreports. |
About share classes
| ∎ | | Class R shares are generally available only to employer sponsored retirement and benefit plans. Please see the prospectus for more information. |
| ∎ | | Class Y shares are available only to certain investors. Please see the prospectus for more information. |
| ∎ | | Class R5 shares and Class R6 shares are available for use by retirement plans that meet certain standards and for institutional investors. Class R6 shares are also available through intermediaries that have established an agreement with Invesco Distributors, Inc. to make such shares available for use in retail omnibus accounts. Please see the prospectus for more information. |
Principal risks of investing in the Fund
| ∎ | | Active trading risk. Active trading of portfolio securities may result in added expenses, a lower return and increased tax liability. |
| ∎ | | Bank loan risk. There are a number of risks associated with an investment in bank loans including credit risk, interest rate risk, liquidity risk and prepayment risk. Lack of an active trading market, restrictions on resale, irregular trading activity, wide bid/ask spreads and extended trade settlement periods may impair the Fund’s ability to sell bank loans within its desired time frame or at an acceptable price and its ability to accurately value existing and prospective investments. Extended trade settlement periods may result in cash not being immediately available to the Fund. As a result, the Fund may have to sell other investments or engage in borrowing transactions to raise cash to meet its obligations. The risk of holding bank loans is also directly tied to the risk of insolvency or bankruptcy of the issuing banks. These risks could cause the Fund to lose income or principal on a particular investment, which in turn could affect the Fund’s returns. |
| | The value of bank loans can be affected by and sensitive to changes in government regulation and to economic downturns in the United States and abroad. Bank loans generally are floating rate loans, which are subject to interest rate risk as the interest paid on the floating rate loans adjusts periodically based on changes in widely accepted reference rates. |
| ∎ | | Changing fixed income market conditions risk. The current low interest rate environment was created in part by the Federal Reserve Board (FRB) and certain foreign central banks keeping the federal funds and equivalent foreign rates near, at or below zero. Increases in the federal funds and equivalent foreign rates may expose fixed income markets to heightened volatility and reduced liquidity for certain fixed income investments, particularly those with longer maturities. In addition, decreases in fixed income dealer market-making capacity may also potentially lead to heightened volatility and reduced liquidity in the fixed income markets. As a result, the value of the Fund’s investments and share price may decline. Changes in central bank policies could also result in higher than normal shareholder redemptions, which could potentially increase portfolio turnover and the Fund’s transaction costs. |
| ∎ | | Commodities tax risk. The tax treatment of commodity-linked derivative instruments may be adversely affected by changes in legislation, regulations or other legally binding authority. If, as a result of any such adverse action, the income of the Fund from certain commodity-linked derivatives was treated as non-qualifying income, the Fund might fail to qualify as a regulated investment company and be subject to federal income tax at the Fund level. As a result of a recent announcement by the Internal Revenue Service, the Fund intends to invest in commodity-linked notes: (a) directly, generally only to the extent that it obtains an opinion of |
| | | counsel confirming that income from such investments should be qualifying income because such commodity-linked notes constitute securities under section 2(a)(36) of the 1940 Act or (b) indirectly through the Subsidiary. Should the Internal Revenue Service issue further guidance, or Congress enact legislation, that adversely affects the tax treatment of the Fund’s use of commodity-linked notes or the Subsidiary (which guidance might be applied to the Fund retroactively), it could, among other consequences, limit the Fund’s ability to pursue its investment strategy. |
| ∎ | | Commodity risk. The Fund may have investment exposure to the commodities markets and/or a particular sector of the commodities markets, which may subject the Fund to greater volatility than investments in traditional securities, such as stocks and bonds. Volatility in the commodities markets may be caused by changes in overall market movements, domestic and foreign political and economic events and policies, war, acts of terrorism, changes in domestic or foreign interest rates and/or investor expectations concerning interest rates, domestic and foreign inflation rates, investment and trading activities of mutual funds, hedge funds and commodities funds, and factors such as drought, floods, weather, live-stock disease, embargoes, tariffs and other regulatory developments or supply and demand disruptions. Because the Fund’s performance may be linked to the performance of volatile commodities, investors should be willing to assume the risks of potentially significant fluctuations in the value of the Fund’s shares. |
| ∎ | | Credit linked notes risk. Risks of credit linked notes include those risks associated with the underlying reference obligation including but not limited to market risk, interest rate risk, credit risk, default risk and, in some cases, foreign currency risk. An investor in a credit linked note bears counterparty risk or the risk that the issuer of the credit linked note will default or become bankrupt and not make timely payment of principal and interest of the structured security. Credit linked notes may |
|
This report must be accompanied or preceded by a currently effective Fund prospectus, which contains more complete information, including sales charges and expenses. Investors should read it carefully before investing. |
|
|
| NOT FDIC INSURED | MAY LOSE VALUE | NO BANK GUARANTEE |
8 Invesco Multi-Asset Income Fund
be less liquid than other investments and therefore harder to dispose of at the desired time and price. In addition, credit linked notes may be leveraged and, as a result, small changes in the value of the underlying reference obligation may produce disproportionate losses to the Fund.
| ∎ | | Debt securities risk. The prices of debt securities held by the Fund will be affected by changes in interest rates, the creditworthiness of the issuer and other factors. An increase in prevailing interest rates typically causes the value of existing debt securities to fall and often has a greater impact on longer-duration debt securities and higher quality debt securities. Falling interest rates will cause the Fund to reinvest the proceeds of debt securities that have been repaid by the issuer at lower interest rates. Falling interest rates may also reduce the Fund’s distributable income because interest payments on floating rate debt instruments held by the Fund will decline. The Fund could lose money on investments in debt securities if the issuer or borrower fails to meet its obligations to make interest payments and/or to repay principal in a timely manner. Changes in an issuer’s financial strength, the market’s perception of such strength or in the credit rating of the issuer or the security may affect the value of debt securities. The Adviser’s credit analysis may fail to anticipate such changes, which could result in buying a debt security at an inopportune time or failing to sell a debt security in advance of a price decline or other credit event. |
| ∎ | | Derivatives risk. The value of a derivative instrument depends largely on (and is derived from) the value of an underlying security, currency, commodity, interest rate, index or other asset (each referred to as an underlying asset). In addition to risks relating to the underlying assets, the use of derivatives may include other, possibly greater, risks, including counterparty, leverage and liquidity risks. Counterparty risk is the risk that the counterparty to the derivative contract will default on its obligation to pay the Fund the amount owed or otherwise perform under the derivative contract. |
| | | Derivatives create leverage risk because they do not require payment up front equal to the economic exposure created by owning the derivative. As a result, an adverse change in the value of the underlying asset could result in the Fund sustaining a loss that is substantially greater than the amount invested in the derivative, which may make the Fund’s returns more volatile and increase the risk of loss. Derivative instruments may also be less liquid than more traditional investments and the Fund may be unable to sell or close out its derivative positions at a desirable time or price. This risk may be more acute under adverse market conditions, during which the Fund may be most in need of liquidating its derivative positions. Derivatives may also be harder to value, less tax efficient and subject to changing government regulation that could impact the Fund’s ability to use certain derivatives or their cost. Also, derivatives used for hedging or to gain or limit exposure to a particular market segment may not provide the expected benefits, particularly during adverse market conditions. These risks are greater for the Fund than mutual funds that do not use derivative instruments or that use derivative instruments to a lesser extent than the Fund to implement their investment strategies. |
| ∎ | | Dividend paying security risk. Securities that pay high dividends as a group can fall out of favor with the market, causing such companies to underperform companies that do not pay high dividends. Also, changes in the dividend policies of such companies and the capital resources available for such companies’ dividend payments may affect the fund. |
| ∎ | | Emerging markets securities risk. Emerging markets (also referred to as developing markets) are generally subject to greater market volatility, political, social and economic instability, uncertain trading markets and more governmental limitations on foreign investment than more developed markets. In addition, companies operating in emerging markets may be subject to lower trading volume and greater price fluctuations than companies in more |
| | | developed markets. Securities law and the enforcement of systems of taxation in many emerging market countries may change quickly and unpredictably. In addition, investments in emerging markets securities may also be subject to additional transaction costs, delays in settlement procedures, and lack of timely information. |
| ∎ | | Exchange-traded funds risk. In addition to the risks associated with the underlying assets held by the exchange-traded fund, investments in exchange-traded funds are subject to the following additional risks: (1) an exchange-traded fund’s shares may trade above or below its net asset value; (2) an active trading market for the exchange-traded fund’s shares may not develop or be maintained; (3) trading an exchange-traded fund’s shares may be halted by the listing exchange; (4) a passively managed exchange-traded fund may not track the performance of the reference asset; and (5) a passively managed exchange-traded fund may hold troubled securities. Investment in exchange-traded funds may involve duplication of management fees and certain other expenses, as the Fund indirectly bears its proportionate share of any expenses paid by the exchange-traded funds in which it invests. Further, certain exchange-traded funds in which the Fund may invest are leveraged, which may result in economic leverage, permitting the Fund to gain exposure that is greater than would be the case in an unlevered instrument and potentially resulting in greater volatility. |
| ∎ | | Exchange-traded notes risk. Exchange-traded notes are subject to credit risk, counterparty risk, and the risk that the value of the exchange-traded note may drop due to a downgrade in the issuer’s credit rating. The value of an exchange-traded note may also be influenced by time to maturity, level of supply and demand for the exchange-traded note, volatility and lack of liquidity in the underlying market, changes in the applicable interest rates, and economic, legal, political, or geographic events that affect the referenced underlying market or assets. The Fund will bear its proportionate share of any fees and expenses borne by an exchange-traded |
continued on page 10
9 Invesco Multi-Asset Income Fund
continued from page 9
| | note in which it invests. For certain exchange-traded notes, there may be restrictions on the Fund’s right to redeem its investment, which is meant to be held until maturity. |
| ∎ | | Financial services sector risk. The Fund may be susceptible to adverse economic or regulatory occurrences affecting the financial services sector. Financial services companies are subject to extensive government regulation and are disproportionately affected by unstable interest rates, each of which could adversely affect the profitability of such companies. Financial services companies may also have concentrated portfolios, which makes them especially vulnerable to unstable economic conditions. |
| ∎ | | Foreign currency tax risk. If the US Treasury Department were to exercise its authority to issue regulations that exclude from the definition of “qualifying income” foreign currency gains not directly related to the Fund’s business of investing in securities, the Fund may be unable to qualify as a regulated investment company for one or more years. In this event, the Fund’s Board of Trustees may authorize a significant change in investment strategy or other action. |
| ∎ | | Foreign government debt risk. Investments in foreign government debt securities (sometimes referred to as sovereign debt securities) involve certain risks in addition to those relating to foreign securities or debt securities generally. The issuer of the debt or the governmental authorities that control the repayment of the debt may be unable or unwilling to repay principal or interest when due in accordance with the terms of such debt, and the Fund may have limited recourse in the event of a default against the defaulting government. Without the approval of debt holders, some governmental debtors have in the past been able to reschedule or restructure their debt payments or declare moratoria on payments. |
| ∎ | | Foreign securities risk. The Fund’s foreign investments may be adversely affected by political and social instability, changes in economic or taxation policies, difficulty in enforcing obligations, decreased liquidity or increased volatility. Foreign investments also involve the risk of the possible seizure, nationalization or expropriation of the issuer or foreign deposits (in which the Fund could lose its entire investments in a certain market) and the possible adoption of foreign governmental restrictions |
| | | such as exchange controls. Unless the Fund has hedged its foreign securities risk, foreign securities risk also involves the risk of negative foreign currency rate fluctuations, which may cause the value of securities denominated in such foreign currency (or other instruments through which the Fund has exposure to foreign currencies) to decline in value. Currency exchange rates may fluctuate significantly over short periods of time. Currency hedging strategies, if used, are not always successful. |
| ∎ | | High yield debt securities (junk bond) risk. Investments in high yield debt securities (“junk bonds”) and other lower-rated securities will subject the Fund to substantial risk of loss. These securities are considered to be speculative with respect to the issuer’s ability to pay interest and principal when due, are more susceptible to default or decline in market value and are less liquid than investment grade debt securities. Prices of high yield debt securities tend to be very volatile. |
| ∎ | | Indexing risk. Certain portions of the Fund’s assets are managed pursuant to an indexing approach (Indexed Assets) and, therefore, the adverse performance of a particular security necessarily will not result in the elimination of the security from the Indexed Assets. Ordinarily, the Fund will not sell portfolio securities of the Indexed Assets except to reflect additions or deletions of the securities that comprise the index the Fund seeks to track with respect to the Indexed Assets (Underlying Index), or as may be necessary to raise cash to pay Fund shareholders who sell Fund shares. As such, the Indexed Assets, and therefore the Fund, will be negatively affected by declines in the securities represented by the Underlying Index. Also, there is no guarantee that the Fund will be able to correlate the performance of the Indexed Assets with that of the Underlying Index. |
| ∎ | | Investment companies risk. Investing in other investment companies could result in the duplication of certain fees, including management and administrative fees, and may expose the Fund to the risks of owning the underlying investments that the other investment company holds. |
| ∎ | | Liquidity risk. The Fund may be unable to sell illiquid investments at the time or price it desires and, as a result, could lose its entire investment in such investments. Liquid securities can become |
| | | illiquid during periods of market stress. If a significant amount of the Fund’s securities become illiquid, the Fund may not be able to timely pay redemption proceeds and may need to sell securities at significantly reduced prices. |
| ∎ | | Management risk. Certain portions of the Fund’s assets are actively managed and depend heavily on the Adviser’s judgment about markets, interest rates or the attractiveness, relative values, liquidity, or potential appreciation of particular investments made for the Fund’s portfolio. The Fund could experience losses if these judgments prove to be incorrect. Because the Fund’s investment process relies heavily on its asset allocation process, market movements that are counter to the portfolio managers’ expectations may have a significant adverse effect on the Fund’s net asset value. Additionally, legislative, regulatory, or tax developments may adversely affect management of the Fund and, therefore, the ability of the Fund to achieve its investment objective. |
| ∎ | | Market risk. The market values of the Fund’s investments, and therefore the value of the Fund’s shares, will go up and down, sometimes rapidly or unpredictably. Market risk may affect a single issuer, industry or section of the economy, or it may affect the market as a whole. Individual stock prices tend to go up and down more dramatically than those of certain other types of investments, such as bonds. During a general downturn in the financial markets, multiple asset classes may decline in value. When markets perform well, there can be no assurance that specific investments held by the Fund will rise in value. |
| ∎ | | MLP risk. The Fund invests in securities of MLPs, which are subject to the following risks: |
| | - | Limited partner risk. An MLP is a public limited partnership or limited liability company taxed as a partnership under the Internal Revenue Code of 1986, as amended (the Code). Although the characteristics of MLPs closely resemble a traditional limited partnership, a major difference is that MLPs may trade on a public exchange or in the over-the-counter market. The risks of investing in an MLP are similar to those of investing in a partnership, including more flexible governance structures, which could result in less protection for investors than |
10 Invesco Multi-Asset Income Fund
| | investments in a corporation. Investors in an MLP normally would not be liable for the debts of the MLP beyond the amount that the investor has contributed but investors may not be shielded to the same extent that a shareholder of a corporation would be. In certain circumstances, creditors of an MLP would have the right to seek return of capital distributed to a limited partner, which right would continue after an investor sold its investment in the MLP. |
| | - | Liquidity risk. The ability to trade on a public exchange or in the over-the-counter market provides a certain amount of liquidity not found in many limited partnership investments. However, MLP interests may be less liquid than conventional publicly traded securities and, therefore, more difficult to trade at desirable times and/or prices. |
| | - | Interest rate risk. In addition, MLP distributions may be reduced by fees and other expenses incurred by the MLP. MLPs generally are considered interest-rate sensitive investments. During periods of interest rate volatility, these investments may not provide attractive returns. |
| | - | General partner risk. The holder of the general partner or managing member interest can be liable in certain circumstances for amounts greater than the amount of the holder’s investment in the general partner or managing member. |
Additionally, if the Fund were to invest more than 25% of its total assets in MLPs that are taxed as partnerships this could cause the Fund to lose its status as regulated investment company under Subchapter M of the Code.
| ∎ | | MLP tax risk. MLPs taxed as partnerships do not pay US federal income tax at the partnership level. A change in current tax law, or a change in the underlying business mix of a given MLP, however, could result in an MLP being classified as a corporation for US federal income tax purposes, which would have the effect of reducing the amount of cash available for distribution by the MLP and, as a result, could result in a reduction of the value of the Fund’s investment, and consequently your investment in the Fund and lower income. Each year, the Fund will send you an annual tax statement (Form 1099) to assist you in completing your |
| | federal, state and local tax returns. If an MLP in which the Fund invests amends its partnership tax return, the Fund will, when necessary, send you a corrected Form 1099, which could, in turn, require you to amend your federal, state or local tax returns. |
| ∎ | | Mortgage- and asset-backed securities risk. Mortgage- and asset-backed securities, including collateralized debt obligations and collateralized mortgage obligations, are subject to prepayment or call risk, which is the risk that a borrower’s payments may be received earlier or later than expected due to changes in prepayment rates on underlying loans. This could result in the Fund reinvesting these early payments at lower interest rates, thereby reducing the Fund’s income. Mortgage- and asset-backed securities also are subject to extension risk, which is the risk that an unexpected rise in interest rates could reduce the rate of prepayments, causing the price of the mortgage- and asset-backed securities and the Fund’s share price to fall. An unexpectedly high rate of defaults on the mortgages held by a mortgage pool may adversely affect the value of mortgage-backed securities and could result in losses to the Fund. The Fund may invest in mortgage pools that include subprime mortgages, which are loans made to borrowers with weakened credit histories or with lower capacity to make timely payments on their mortgages. Privately issued mortgage-related securities are not subject to the same underwriting requirements as those with government or government-sponsored entity guarantees and, therefore, mortgage loans underlying privately issued mortgage-related securities may have less favorable collateral, credit risk or other underwriting characteristics, and wider variances in interest rate, term, size, purpose and borrower characteristics. |
| ∎ | | Non-correlation risk. The return of the Fund’s assets managed pursuant to an indexing approach (Indexed Assets) may not match the return of the index the Fund seeks to track with respect to the Indexed Assets (Underlying Index) for a number of reasons. For example, the Fund incurs operating expenses not applicable to the Underlying Index, and incurs costs in buying and selling securities, especially when rebalancing securities holdings to reflect changes in the Underlying Index. In addition, the performance of the Indexed Assets and |
| | the Underlying Index may vary due to asset valuation differences and differences between the Indexed Assets and the Underlying Index resulting from legal restrictions, costs or liquidity constraints. |
| ∎ | | Preferred securities risk. Preferred securities are subject to issuer-specific and market risks applicable generally to equity securities. Preferred securities also may be subordinated to bonds or other debt instruments, subjecting them to a greater risk of non-payment, may be less liquid than many other securities, such as common stocks, and generally offer no voting rights with respect to the issuer. |
| ∎ | | REIT risk/real estate risk. Investments in real estate related instruments may be affected by economic, legal, cultural, environmental or technological factors that affect property values, rents or occupancies of real estate related to the Fund’s holdings. Shares of real estate related companies, which tend to be small- and mid-cap companies, may be more volatile and less liquid. |
| ∎ | | Sampling risk. The Fund’s use of a sampling methodology with respect to assets managed pursuant to an indexing approach (Indexed Assets) may result in the Indexed Assets including a smaller number of securities than are in the index the Fund seeks to track with respect to the Indexed Assets (Underlying Index), and in the Indexed Assets including securities that are not included in the Underlying Index. As a result, an adverse development to an issuer of securities included in the Indexed Assets could result in a greater decline in the Fund’s NAV than would be the case if all of the securities in the Underlying Index were included in the Indexed Assets. The Fund’s use of a sampling methodology may also include the risk that the Indexed Assets may not track the return of the Underlying Index as well as they would have if the Indexed Assets included all of the securities in the Underlying Index. To the extent the assets in the Indexed Assets are smaller, these risks will be greater. |
| ∎ | | Short position risk. Because the Fund’s potential loss on a short position arises from increases in the value of the asset sold short, the Fund will incur a loss on a short position, which is theoretically unlimited, if the price of the asset sold short increases from the short sale price. The counterparty to a short position or other market factors may prevent |
continued on page 12
11 Invesco Multi-Asset Income Fund
continued from page 11
| | the Fund from closing out a short position at a desirable time or price and may reduce or eliminate any gain or result in a loss. In a rising market, the Fund’s short positions will cause the Fund to underperform the overall market and its peers that do not engage in shorting. If the Fund holds both long and short positions, and both positions decline simultaneously, the short positions will not provide any buffer (hedge) from declines in value of the Fund’s long positions. Certain types of short positions involve leverage, which may exaggerate any losses, potentially more than the actual cost of the investment, and will increase the volatility of the Fund’s returns. |
| ∎ | | Subsidiary risk. By investing in the Subsidiary, the Fund is indirectly exposed to risks associated with the Subsidiary’s investments. The Subsidiary is not registered under the Investment Company Act of 1940, as amended (1940 Act), and, except as otherwise noted in this prospectus, is not subject to the investor protections of the 1940 Act. Changes in the laws of the United States and/or the Cayman Islands, under which the Fund and the Subsidiary, respectively, are organized, could result in the inability of the Fund and/or the Subsidiary to operate as described in this prospectus and the SAI, and could negatively affect the Fund and its shareholders. |
| ∎ | | US government obligations risk. Obligations of US government agencies and authorities receive varying levels of support and may not be backed by the full faith and credit of the US government, which could affect the Fund’s ability to recover should they default. No assurance can be given that the US government will provide financial support to its agencies and authorities if it is not obligated by law to do so. |
About indexes used in this report
| ∎ | | The Bloomberg Barclays U.S. Aggregate Index is an unmanaged index considered representative of the US investment grade, fixed-rate bond market. |
| ∎ | | The Custom Invesco Multi-Asset Income Index, created by Invesco to serve as a benchmark for Invesco Multi-Asset Income Fund, comprises the following indexes: S&P 500 (50%) and Bloomberg Barclays U.S. Universal (50%). |
| ∎ | | The Lipper Mixed-Asset Target Allocation Conservative Funds Index is an unmanaged index considered representative of mixed-asset target allocation conservative funds tracked by Lipper. |
| ∎ | | The S&P 500® Index is an unmanaged index considered representative of the US stock market. |
| ∎ | | The Bloomberg Barclays U.S. Universal Index is an unmanaged index comprising US dollar-denominated, taxable bonds that are rated investment grade or below investment grade. |
| ∎ | | The Fund is not managed to track the performance of any particular index, including the index(es) described here, and consequently, the performance of the Fund may deviate significantly from the performance of the index(es). |
| ∎ | | A direct investment cannot be made in an index. Unless otherwise indicated, index results include reinvested dividends, and they do not reflect sales charges. Performance of the peer group, if applicable, reflects fund expenses; performance of a market index does not. |
Other information
| ∎ | | The returns shown in management’s discussion of Fund performance are based on net asset values (NAVs) calculated for shareholder transactions. Generally accepted accounting principles require adjustments to be made to the net assets of the Fund at period end for financial reporting purposes, and as such, the NAVs for shareholder transactions and the returns based on those NAVs may differ from the NAVs and returns reported in the Financial Highlights. |
12 Invesco Multi-Asset Income Fund
Schedule of Investments(a)
October 31, 2017
| | | | | | | | |
| | | Principal
Amount | | | Value | |
U.S. Dollar Denominated Bonds & Notes–40.52% | |
| Advertising–0.16% | |
Lamar Media Corp., Sr. Unsec. Gtd. Global Notes, 5.75%, 02/01/2026 | | $ | 945,000 | | | $ | 1,022,963 | |
|
| Aerospace & Defense–0.32% | |
Arconic Inc., Sr. Unsec. Global Notes, 5.13%, 10/01/2024 | | | 300,000 | | | | 322,907 | |
Bombardier Inc. (Canada), Sr. Unsec. Notes, 6.00%, 10/15/2022(b) | | | 390,000 | | | | 386,100 | |
TransDigm Inc., Sr. Unsec. Gtd. Sub. Global Notes,
6.50%, 07/15/2024 | | | 245,000 | | | | 253,575 | |
6.50%, 05/15/2025 | | | 1,126,000 | | | | 1,164,002 | |
| | | | | | | | 2,126,584 | |
|
| Agricultural & Farm Machinery–0.07% | |
Titan International Inc., Sr. Sec. Gtd. First Lien Global Notes, 6.88%, 10/01/2020 | | | 459,000 | | | | 473,631 | |
|
| Air Freight & Logistics–0.03% | |
XPO Logistics, Inc., Sr. Unsec. Gtd. Notes, 6.50%, 06/15/2022(b) | | | 200,000 | | | | 210,786 | |
|
| Airlines–0.07% | |
Air Canada (Canada), Sr. Unsec. Gtd. Notes, 7.75%, 04/15/2021(b) | | | 425,000 | | | | 487,688 | |
|
| Alternative Carriers–0.31% | |
CenturyLink, Inc.,
Series S, Sr. Unsec. Notes, 6.45%, 06/15/2021 | | | 535,000 | | | | 567,159 | |
Series Y, Sr. Unsec. Global Notes, 7.50%, 04/01/2024 | | | 377,000 | | | | 401,505 | |
Level 3 Financing, Inc., Sr. Unsec. Gtd. Global Notes, 5.25%, 03/15/2026 | | | 727,000 | | | | 753,135 | |
5.38%, 05/01/2025 | | | 296,000 | | | | 310,060 | |
| | | | | | | | 2,031,859 | |
|
| Aluminum–0.21% | |
Alcoa Nederland Holding B.V., Sr. Unsec. Gtd. Notes, 6.75%, 09/30/2024(b) | | | 550,000 | | | | 614,086 | |
Novelis Corp., Sr. Unsec. Gtd. Notes, 6.25%, 08/15/2024(b) | | | 731,000 | | | | 773,032 | |
| | | | | | | | 1,387,118 | |
|
| Apparel Retail–0.32% | |
Gap, Inc. (The), Sr. Unsec. Global Bonds, 5.95%, 04/12/2021 | | | 289,000 | | | | 312,404 | |
Hot Topic, Inc., Sr. Sec. Gtd. First Lien Notes, 9.25%, 06/15/2021(b) | | | 481,000 | | | | 401,034 | |
| | | | | | | | |
| | | Principal
Amount | | | Value | |
| Apparel Retail–(continued) | |
L Brands, Inc., Sr. Unsec. Gtd. Global Notes, 5.63%, 02/15/2022 | | $ | 1,146,000 | | | $ | 1,231,377 | |
6.75%, 07/01/2036 | | | 30,000 | | | | 29,475 | |
6.88%, 11/01/2035 | | | 120,000 | | | | 119,700 | |
| | | | | | | | 2,093,990 | |
|
| Asset Management & Custody Banks–0.22% | |
Prime Security Services Borrower, LLC/Prime Finance, Inc., Sec. Gtd. Second Lien Notes, 9.25%, 05/15/2023(b) | | | 1,287,000 | | | | 1,429,471 | |
|
| Auto Parts & Equipment–0.16% | |
Dana Financing Luxembourg S.a.r.l., Sr. Unsec. Gtd. Notes, 5.75%, 04/15/2025(b) | | | 100,000 | | | | 106,250 | |
Dana Inc., Sr. Unsec. Notes, 5.50%, 12/15/2024 | | | 520,000 | | | | 551,200 | |
Delphi Jersey Holdings PLC, Sr. Unsec. Notes, 5.00%, 10/01/2025(b) | | | 152,000 | | | | 153,520 | |
Tenneco Inc., Sr. Unsec. Gtd. Global Notes, 5.38%, 12/15/2024 | | | 250,000 | | | | 263,438 | |
| | | | | | | | 1,074,408 | |
|
| Automotive Retail–0.18% | |
Lithia Motors, Inc., Sr. Unsec. Gtd. Notes, 5.25%, 08/01/2025(b) | | | 177,000 | | | | 186,071 | |
Murphy Oil USA, Inc., Sr. Unsec. Gtd. Global Notes, 5.63%, 05/01/2027 | | | 590,000 | | | | 627,613 | |
Penske Automotive Group Inc., Sr. Unsec. Sub. Gtd. Notes, 5.50%, 05/15/2026 | | | 371,000 | | | | 382,594 | |
| | | | | | | | 1,196,278 | |
|
| Broadcasting–0.56% | |
AMC Networks Inc., Sr. Unsec. Gtd. Global Notes, 4.75%, 08/01/2025 | | | 86,000 | | | | 86,107 | |
5.00%, 04/01/2024 | | | 565,000 | | | | 576,653 | |
Clear Channel Worldwide Holdings, Inc.,
Series B, Sr. Unsec. Gtd. Global Notes, 6.50%, 11/15/2022 | | | 335,000 | | | | 348,400 | |
Sr. Unsec. Gtd. Sub. Global Notes, 7.63%, 03/15/2020 | | | 1,070,000 | | | | 1,072,675 | |
Netflix, Inc., Sr. Unsec. Global Notes, 5.75%, 03/01/2024 | | | 529,000 | | | | 568,014 | |
Nexstar Broadcasting, Inc., Sr. Unsec. Gtd. Notes, 5.63%, 08/01/2024(b) | | | 492,000 | | | | 506,145 | |
Tribune Media Co., Sr. Unsec. Gtd. Global Notes, 5.88%, 07/15/2022 | | | 490,000 | | | | 510,825 | |
| | | | | | | | 3,668,819 | |
See accompanying Notes to Financial Statements which are an integral part of the financial statements.
13 Invesco Multi-Asset Income Fund
| | | | | | | | |
| | | Principal
Amount | | | Value | |
| Building Products–0.21% | | | | | | | | |
Builders FirstSource, Inc.,
Sr. Sec. Gtd. First Lien Notes, 5.63%, 09/01/2024(b) | | $ | 195,000 | | | $ | 206,700 | |
Sr. Unsec. Gtd. Notes, 10.75%, 08/15/2023(b) | | | 426,000 | | | | 485,640 | |
Standard Industries Inc.,
Sr. Unsec. Notes, 5.00%, 02/15/2027(b) | | | 314,000 | | | | 328,036 | |
6.00%, 10/15/2025(b) | | | 350,000 | | | | 380,187 | |
| | | | | | | | 1,400,563 | |
|
| Cable & Satellite–2.39% | |
Altice Financing S.A. (Luxembourg), Sr. Sec. Gtd. First Lien Bonds, 7.50%, 05/15/2026(b) | | | 400,000 | | | | 440,500 | |
Altice Luxembourg S.A. (Luxembourg), Sr. Unsec. Gtd. Notes, 7.63%, 02/15/2025(b) | | | 750,000 | | | | 816,562 | |
Altice US Finance I Corp., Sr. Sec. Notes, 5.50%, 05/15/2026(b) | | | 415,000 | | | | 432,637 | |
CCO Holdings LLC/CCO Holdings Capital Corp.,
Sr. Unsec. Global Notes, 5.75%, 09/01/2023 | | | 510,000 | | | | 529,762 | |
Sr. Unsec. Notes, 5.75%, 02/15/2026(b) | | | 1,830,000 | | | | 1,917,565 | |
CSC Holdings LLC,
Sr. Unsec. Global Notes, 6.75%, 11/15/2021 | | | 365,000 | | | | 403,325 | |
Sr. Unsec. Gtd. Notes, 6.63%, 10/15/2025(b) | | | 200,000 | | | | 219,700 | |
Sr. Unsec. Notes, 10.13%, 01/15/2023(b) | | | 1,250,000 | | | | 1,434,375 | |
10.88%, 10/15/2025(b) | | | 400,000 | | | | 491,000 | |
DISH DBS Corp., Sr. Unsec. Gtd. Global Notes, 5.88%, 11/15/2024 | | | 1,627,000 | | | | 1,635,135 | |
6.75%, 06/01/2021 | | | 150,000 | | | | 157,875 | |
7.88%, 09/01/2019 | | | 725,000 | | | | 785,175 | |
Intelsat Jackson Holdings S.A. (Luxembourg),
Sr. Sec. Gtd. First Lien Notes, 8.00%, 02/15/2024(b) | | | 175,000 | | | | 186,813 | |
Sr. Unsec. Gtd. Global Bonds, 5.50%, 08/01/2023 | | | 420,000 | | | | 359,625 | |
Sr. Unsec. Gtd. Global Notes, 7.25%, 10/15/2020 | | | 901,000 | | | | 871,447 | |
7.50%, 04/01/2021 | | | 333,000 | | | | 317,183 | |
Sirius XM Radio Inc., Sr. Unsec. Gtd. Notes,
5.38%, 04/15/2025(b) | | | 2,000 | | | | 2,113 | |
5.38%, 07/15/2026(b) | | | 419,000 | | | | 442,569 | |
6.00%, 07/15/2024(b) | | | 673,000 | | | | 720,110 | |
Unitymedia Hessen GmbH & Co. KG/Unitymedia NRW GmbH (Germany), Sr. Sec. Gtd. First Lien Bonds, 5.00%, 01/15/2025(b) | | | 500,000 | | | | 523,750 | |
| | | | | | | | |
| | | Principal
Amount | | | Value | |
| Cable & Satellite–(continued) | |
UPC Holding B.V. (Netherlands), Sr. Sec. First Lien Notes, 5.50%, 01/15/2028(b) | | $ | 200,000 | | | $ | 199,500 | |
UPCB Finance IV Ltd. (Netherlands), Sr. Sec. First Lien Notes, 5.38%, 01/15/2025(b) | | | 400,000 | | | | 411,000 | |
Virgin Media Finance PLC (United Kingdom), Sr. Unsec. Gtd. Notes, 6.00%, 10/15/2024(b) | | | 200,000 | | | | 210,250 | |
Virgin Media Secured Finance PLC (United Kingdom), Sr. Sec. Gtd. First Lien Notes, 5.50%, 08/15/2026(b) | | | 800,000 | | | | 839,000 | |
VTR Finance B.V. (Chile), Sr. Sec. First Lien Notes, 6.88%, 01/15/2024(b) | | | 600,000 | | | | 637,650 | |
Ziggo Secured Finance B.V. (Netherlands), Sr. Sec. Gtd. First Lien Notes, 5.50%, 01/15/2027(b) | | | 700,000 | | | | 715,750 | |
| | | | | | | | 15,700,371 | |
|
| Casinos & Gaming–0.78% | |
Boyd Gaming Corp., Sr. Unsec. Gtd. Global Notes, 6.38%, 04/01/2026 | | | 628,000 | | | | 690,800 | |
6.88%, 05/15/2023 | | | 220,000 | | | | 237,050 | |
Codere Finance 2 (Luxembourg) S.A. (Spain), Sr. Sec. Gtd. First Lien Notes, 7.63%, 11/01/2021(b) | | | 400,000 | | | | 405,780 | |
MGM Resorts International,
Sr. Unsec. Gtd. Global Notes, 6.63%, 12/15/2021 | | | 45,000 | | | | 50,400 | |
Sr. Unsec. Gtd. Notes, 4.63%, 09/01/2026 | | | 899,000 | | | | 903,495 | |
6.00%, 03/15/2023 | | | 230,000 | | | | 252,747 | |
7.75%, 03/15/2022 | | | 188,000 | | | | 218,841 | |
Pinnacle Entertainment, Inc., Sr. Unsec. Global Notes, 5.63%, 05/01/2024 | | | 721,000 | | | | 748,038 | |
Scientific Games International Inc., Sr. Unsec. Gtd. Global Notes, 10.00%, 12/01/2022 | | | 703,000 | | | | 779,451 | |
Wynn Las Vegas LLC/Wynn Las Vegas Capital Corp., Sr. Unsec. Gtd. Notes, 5.25%, 05/15/2027(b) | | | 470,000 | | | | 480,575 | |
5.50%, 03/01/2025(b) | | | 334,000 | | | | 351,535 | |
| | | | | | | | 5,118,712 | |
|
| Coal & Consumable Fuels–0.07% | |
SunCoke Energy Partners, L.P./ SunCoke Energy Partners Finance Corp., Sr. Unsec. Gtd. Notes, 7.50%, 06/15/2025(b) | | | 463,000 | | | | 488,465 | |
See accompanying Notes to Financial Statements which are an integral part of the financial statements.
14 Invesco Multi-Asset Income Fund
| | | | | | | | |
| | | Principal
Amount | | | Value | |
| Commodity Chemicals–0.12% | |
Koppers Inc., Sr. Unsec. Gtd. Notes, 6.00%, 02/15/2025(b) | | $ | 356,000 | | | $ | 382,700 | |
Valvoline Inc., Sr. Unsec. Gtd. Notes, 5.50%, 07/15/2024(b) | | | 403,000 | | | | 428,188 | |
| | | | | | | | 810,888 | |
|
| Communications Equipment–0.35% | |
CommScope Technologies LLC, Sr. Unsec. Gtd. Notes, 6.00%, 06/15/2025(b) | | | 1,140,000 | | | | 1,208,400 | |
Hughes Satellite Systems Corp.,
Sr. Sec. Gtd. First Lien Global Notes, 5.25%, 08/01/2026 | | | 686,000 | | | | 704,062 | |
Sr. Unsec. Gtd. Global Notes, 7.63%, 06/15/2021 | | | 357,000 | | | | 402,027 | |
| | | | | | | | 2,314,489 | |
|
| Construction & Engineering–0.06% | |
AECOM, Sr. Unsec. Gtd. Global Notes, 5.13%, 03/15/2027 | | | 396,000 | | | | 408,375 | |
|
| Construction Machinery & Heavy Trucks–0.24% | |
Meritor Inc., Sr. Unsec. Gtd. Notes, 6.25%, 02/15/2024 | | | 658,000 | | | | 706,527 | |
Oshkosh Corp., Sr. Unsec. Gtd. Global Notes, 5.38%, 03/01/2025 | | | 368,000 | | | | 391,920 | |
Terex Corp., Sr. Unsec. Gtd. Notes, 5.63%, 02/01/2025(b) | | | 459,000 | | | | 489,409 | |
| | | | | | | | 1,587,856 | |
|
| Consumer Finance–0.53% | |
Ally Financial Inc.,
Sr. Unsec. Global Notes, 5.13%, 09/30/2024 | | | 1,675,000 | | | | 1,838,312 | |
Sr. Unsec. Gtd. Global Notes, 8.00%, 03/15/2020 | | | 280,000 | | | | 315,350 | |
Discover Financial Services, Inc., Series C, Jr. Unsec. Sub. Global Notes, 5.50%(c) | | | 316,000 | | | | 322,715 | |
Navient Corp., Sr. Unsec. Medium-Term Notes, 7.25%, 01/25/2022 | | | 230,000 | | | | 250,413 | |
8.00%, 03/25/2020 | | | 705,000 | | | | 779,025 | |
| | | | | | | | 3,505,815 | |
|
| Copper–0.21% | |
First Quantum Minerals Ltd. (Zambia), Sr. Unsec. Gtd. Notes, 7.00%, 02/15/2021(b) | | | 810,000 | | | | 843,412 | |
Freeport-McMoRan Inc., Sr. Unsec. Gtd. Global Notes, 5.40%, 11/14/2034 | | | 570,000 | | | | 558,600 | |
| | | | | | | | 1,402,012 | |
| | | | | | | | |
| | | Principal
Amount | | | Value | |
| Data Processing & Outsourced Services–0.35% | |
First Data Corp.,
Sec. Gtd. Second Lien Notes, 5.75%, 01/15/2024(b) | | $ | 225,000 | | | $ | 236,250 | |
Sr. Sec. Gtd. First Lien Notes, 5.00%, 01/15/2024(b) | | | 60,000 | | | | 62,550 | |
Sr. Unsec. Gtd. Notes, 7.00%, 12/01/2023(b) | | | 1,850,000 | | | | 1,984,162 | |
| | | | | | | | 2,282,962 | |
|
| Diversified Banks–0.23% | |
Bank of America Corp., Series K, Jr. Unsec. Sub. Global Notes,
8.00%(c) | | | 173,000 | | | | 175,604 | |
Dresdner Funding Trust I (Germany), REGS, Jr. Unsec. Sub. Euro Notes, 8.15%, 06/30/2031(b) | | | 100,000 | | | | 130,626 | |
JPMorgan Chase & Co., Series 1, Jr. Unsec. Sub. Global Notes,
7.90%(c) | | | 235,000 | | | | 241,286 | |
Royal Bank of Scotland Group PLC (The) (United Kingdom), Unsec. Sub. Global Bonds, 5.13%, 05/28/2024 | | | 600,000 | | | | 642,875 | |
6.13%, 12/15/2022 | | | 285,000 | | | | 317,202 | |
| | | | | | | | 1,507,593 | |
|
| Diversified Chemicals–0.28% | |
Chemours Co. (The), Sr. Unsec. Gtd. Global Notes, 6.63%, 05/15/2023 | | | 1,278,000 | | | | 1,361,070 | |
7.00%, 05/15/2025 | | | 70,000 | | | | 78,400 | |
Trinseo Materials Operating S.C.A./Trinseo Materials Finance, Inc., Sr. Unsec. Gtd. Notes, 5.38%, 09/01/2025(b) | | | 354,000 | | | | 373,470 | |
| | | | | | | | 1,812,940 | |
|
| Diversified Metals & Mining–0.18% | |
HudBay Minerals, Inc. (Canada), Sr. Unsec. Gtd. Notes, 7.63%, 01/15/2025(b) | | | 437,000 | | | | 483,978 | |
Teck Resources Ltd. (Canada),
Sr. Unsec. Gtd. Global Notes, 4.75%, 01/15/2022 | | | 291,000 | | | | 308,460 | |
Sr. Unsec. Notes, 6.13%, 10/01/2035 | | | 330,000 | | | | 375,375 | |
| | | | | | | | 1,167,813 | |
|
| Diversified Support Services–0.02% | |
Jaguar Holding Co. II/Pharmaceutical Product Development, LLC, Sr. Unsec. Gtd. Notes, 6.38%, 08/01/2023(b) | | | 125,000 | | | | 130,781 | |
See accompanying Notes to Financial Statements which are an integral part of the financial statements.
15 Invesco Multi-Asset Income Fund
| | | | | | | | |
| | | Principal
Amount | | | Value | |
| Electric Utilities–0.34% | |
NextEra Energy Capital Holdings Inc.,
Jr. Unsec. Gtd. Sub. Investment Units, 5.00%, 01/15/2073 | | $ | 32,700 | | | $ | 826,983 | |
Series K, Jr. Unsec. Gtd. Sub. Investment Units, 5.25%, 06/01/2076 | | | 50,000 | | | | 1,284,500 | |
Southern Co. (The), Series B, Jr. Unsec. Sub. Global Notes, 5.50%, 03/15/2057 | | | 84,000 | | | | 89,434 | |
| | | | | | | | 2,200,917 | |
|
| Electrical Components & Equipment–0.28% | |
EnerSys, Sr. Unsec. Gtd. Notes, 5.00%, 04/30/2023(b) | | | 919,000 | | | | 967,248 | |
Sensata Technologies B.V., Sr. Unsec. Gtd. Notes, 4.88%, 10/15/2023(b) | | | 99,000 | | | | 104,321 | |
5.00%, 10/01/2025(b) | | | 709,000 | | | | 758,630 | |
| | | | | | | | 1,830,199 | |
|
| Environmental & Facilities Services–0.10% | |
Advanced Disposal Services, Inc., Sr. Unsec. Gtd. Notes, 5.63%, 11/15/2024(b) | | | 112,000 | | | | 116,760 | |
Core & Main LP, Sr. Unsec. Notes, 6.13%, 08/15/2025(b) | | | 478,000 | | | | 485,170 | |
Wrangler Buyer Corp., Sr. Unsec. Notes, 6.00%, 10/01/2025(b) | | | 50,000 | | | | 51,375 | |
| | | | | | | | 653,305 | |
|
| Financial Exchanges & Data–0.10% | |
MSCI Inc., Sr. Unsec. Gtd. Notes, 5.25%, 11/15/2024(b) | | | 500,000 | | | | 531,250 | |
5.75%, 08/15/2025(b) | | | 100,000 | | | | 108,500 | |
| | | | | | | | 639,750 | |
|
| Food Distributors–0.12% | |
US Foods, Inc., Sr. Unsec. Gtd. Notes, 5.88%, 06/15/2024(b) | | | 717,000 | | | | 760,916 | |
|
| Food Retail–0.22% | |
Albertsons Cos. LLC/ Safeway Inc./New Albertson’s, Inc./Albertson’s LLC, Sr. Unsec. Gtd. Global Notes, 6.63%, 06/15/2024 | | | 587,000 | | | | 554,715 | |
Ingles Markets, Inc., Sr. Unsec. Global Notes, 5.75%, 06/15/2023 | | | 904,000 | | | | 892,700 | |
| | | | | | | | 1,447,415 | |
| | |
| Gas Utilities–0.34% | | | | | | | | |
AmeriGas Partners, L.P./AmeriGas Finance Corp., Sr. Unsec. Global Notes,
5.63%, 05/20/2024 | | | 144,000 | | | | 152,460 | |
5.88%, 08/20/2026 | | | 875,000 | | | | 914,375 | |
Ferrellgas L.P./Ferrellgas Finance Corp., Sr. Unsec. Global Notes, 6.50%, 05/01/2021 | | | 230,000 | | | | 219,075 | |
| | | | | | | | |
| | | Principal
Amount | | | Value | |
| Gas Utilities–(continued) | |
NGL Energy Partners L.P./NGL Energy Finance Corp., Sr. Unsec. Gtd. Global Notes, 6.13%, 03/01/2025 | | $ | 10,000 | | | $ | 9,525 | |
Suburban Propane Partners, L.P./Suburban Energy Finance Corp., Sr. Unsec. Global Notes, 5.50%, 06/01/2024 | | | 937,000 | | | | 937,000 | |
| | | | | | | | 2,232,435 | |
|
| General Merchandise Stores–0.06% | |
Dollar Tree, Inc., Sr. Unsec. Gtd. Global Notes, 5.75%, 03/01/2023 | | | 370,000 | | | | 390,813 | |
|
| Health Care Equipment–0.09% | |
Hill-Rom Holdings, Inc., Sr. Unsec. Gtd. Notes, 5.00%, 02/15/2025(b) | | | 495,000 | | | | 508,613 | |
Teleflex Inc., Sr. Unsec. Gtd. Global Notes,
4.88%, 06/01/2026 | | | 56,000 | | | | 59,080 | |
5.25%, 06/15/2024 | | | 22,000 | | | | 23,375 | |
| | | | | | | | 591,068 | |
|
| Health Care Facilities–1.27% | |
Acadia Healthcare Co., Inc., Sr. Unsec. Gtd. Global Notes, 6.50%, 03/01/2024 | | | 575,000 | | | | 608,781 | |
Community Health Systems, Inc.,
Sr. Sec. Gtd. First Lien Global Notes, 5.13%, 08/01/2021 | | | 450,000 | | | | 437,625 | |
Sr. Sec. Gtd. First Lien Notes, 6.25%, 03/31/2023 | | | 612,000 | | | | 589,815 | |
Sr. Unsec. Gtd. Global Notes, 6.88%, 02/01/2022 | | | 122,470 | | | | 90,015 | |
8.00%, 11/15/2019 | | | 370,000 | | | | 353,813 | |
HCA, Inc.,
Sr. Sec. Gtd. First Lien Global Notes, 5.88%, 03/15/2022 | | | 200,000 | | | | 219,500 | |
Sr. Sec. Gtd. First Lien Notes, 5.25%, 04/15/2025 | | | 1,907,000 | | | | 2,035,722 | |
Sr. Unsec. Gtd. Global Notes, 5.88%, 05/01/2023 | | | 45,000 | | | | 48,319 | |
7.50%, 02/15/2022 | | | 116,000 | | | | 131,950 | |
Sr. Unsec. Gtd. Notes, 5.38%, 02/01/2025 | | | 270,000 | | | | 278,354 | |
5.88%, 02/15/2026 | | | 790,000 | | | | 832,462 | |
HealthSouth Corp., Sr. Unsec. Gtd. Global Notes, 5.75%, 09/15/2025 | | | 540,000 | | | | 559,575 | |
LifePoint Health, Inc.,
Sr. Unsec. Gtd. Global Notes, 5.38%, 05/01/2024 | | | 345,000 | | | | 347,588 | |
Sr. Unsec. Gtd. Notes, 5.88%, 12/01/2023 | | | 261,000 | | | | 269,208 | |
See accompanying Notes to Financial Statements which are an integral part of the financial statements.
16 Invesco Multi-Asset Income Fund
| | | | | | | | |
| | | Principal
Amount | | | Value | |
| Health Care Facilities–(continued) | |
Tenet Healthcare Corp.,
Sec. Gtd. Second Lien Notes, 7.50%, 01/01/2022(b) | | $ | 31,000 | | | $ | 32,744 | |
Sr. Sec. Gtd. First Lien Global Notes, 6.00%, 10/01/2020 | | | 100,000 | | | | 105,375 | |
Sr. Unsec. Global Notes, 6.75%, 06/15/2023 | | | 1,266,000 | | | | 1,193,205 | |
8.13%, 04/01/2022 | | | 195,000 | | | | 195,975 | |
| | | | | | | | 8,330,026 | |
| | |
| Health Care Services–0.49% | | | | | | | | |
AMN Healthcare, Inc., Sr. Unsec. Gtd. Notes, 5.13%, 10/01/2024(b) | | | 210,000 | | | | 217,350 | |
DaVita Inc., Sr. Unsec. Gtd. Global Notes, 5.00%, 05/01/2025 | | | 396,000 | | | | 391,050 | |
Eagle Holding Co. II, LLC, Sr. Unsec. PIK Notes, 8.38% PIK Rate, 7.63% Cash Rate, 05/15/2022(b)(d) | | | 679,000 | | | | 702,765 | |
MEDNAX, Inc., Sr. Unsec. Gtd. Notes, 5.25%, 12/01/2023(b) | | | 626,000 | | | | 652,605 | |
MPH Acquisition Holdings LLC, Sr. Unsec. Gtd. Notes, 7.13%, 06/01/2024(b) | | | 772,000 | | | | 832,795 | |
Surgery Center Holdings, Inc., Sr. Unsec. Gtd. Notes, 6.75%, 07/01/2025(b) | | | 55,000 | | | | 50,325 | |
8.88%, 04/15/2021(b) | | | 77,000 | | | | 78,925 | |
Team Health Holdings, Inc., Sr. Unsec. Gtd. Notes, 6.38%, 02/01/2025(b) | | | 315,000 | | | | 291,375 | |
| | | | | | | | 3,217,190 | |
|
| Home Improvement Retail–0.12% | |
Hillman Group Inc. (The), Sr. Unsec. Gtd. Notes, 6.38%, 07/15/2022(b) | | | 771,000 | | | | 769,073 | |
|
| Homebuilding–0.70% | |
Ashton Woods USA LLC/Ashton Woods Finance Co., Sr. Unsec. Notes,
6.75%, 08/01/2025(b) | | | 494,000 | | | | 491,530 | |
6.88%, 02/15/2021(b) | | | 245,000 | | | | 252,656 | |
Beazer Homes USA, Inc.,
Sr. Unsec. Gtd. Global Notes,
6.75%, 03/15/2025 | | | 745,000 | | | | 791,786 | |
8.75%, 03/15/2022 | | | 250,000 | | | | 278,425 | |
Sr. Unsec. Notes, 5.88%, 10/15/2027(b) | | | 72,000 | | | | 72,180 | |
CalAtlantic Group, Inc.,
Sr. Unsec. Gtd. Global Notes, 8.38%, 01/15/2021 | | | 50,000 | | | | 58,375 | |
Sr. Unsec. Gtd. Notes, 5.25%, 06/01/2026 | | | 130,000 | | | | 138,938 | |
5.38%, 10/01/2022 | | | 702,000 | | | | 767,812 | |
KB Home, Sr. Unsec. Gtd. Notes, 7.50%, 09/15/2022 | | | 223,000 | | | | 259,237 | |
| | | | | | | | |
| | | Principal
Amount | | | Value | |
| Homebuilding–(continued) | | | | | | | | |
Lennar Corp., Sr. Unsec. Gtd. Global Notes, 4.75%, 11/15/2022 | | $ | 250,000 | | | $ | 265,000 | |
Meritage Homes Corp., Sr. Unsec. Gtd. Global Notes, 6.00%, 06/01/2025 | | | 516,000 | | | | 557,280 | |
7.15%, 04/15/2020 | | | 65,000 | | | | 71,663 | |
Taylor Morrison Communities Inc./ Taylor Morrison Holdings II, Inc., Sr. Unsec. Gtd. Notes, 5.88%, 04/15/2023(b) | | | 569,000 | | | | 612,028 | |
| | | | | | | | 4,616,910 | |
|
| Household Products–0.30% | |
Reynolds Group Issuer Inc./LLC (New Zealand),
Sr. Sec. Gtd. First Lien Notes, 5.13%, 07/15/2023(b) | | | 41,000 | | | | 42,743 | |
Sr. Unsec. Gtd. Notes, 7.00%, 07/15/2024(b) | | | 1,038,000 | | | | 1,110,011 | |
Spectrum Brands, Inc., Sr. Unsec. Gtd. Global Notes, 5.75%, 07/15/2025 | | | 635,000 | | | | 677,659 | |
Springs Industries, Inc., Sr. Sec. Global Notes, 6.25%, 06/01/2021 | | | 106,000 | | | | 109,445 | |
| | | | | | | | 1,939,858 | |
|
| Independent Power Producers & Energy Traders–0.38% | |
AES Corp. (The),
Sr. Unsec. Global Notes, 8.00%, 06/01/2020 | | | 30,000 | | | | 34,350 | |
Sr. Unsec. Notes, 5.50%, 04/15/2025 | | | 1,029,000 | | | | 1,093,312 | |
Calpine Corp., Sr. Unsec. Global Notes, 5.38%, 01/15/2023 | | | 234,000 | | | | 228,442 | |
Dynegy Inc., Sr. Unsec. Gtd. Global Notes, 7.38%, 11/01/2022 | | | 260,000 | | | | 279,175 | |
NRG Energy, Inc., Sr. Unsec. Gtd. Global Notes, 6.25%, 05/01/2024 | | | 504,000 | | | | 536,760 | |
6.63%, 03/15/2023 | | | 205,000 | | | | 212,688 | |
6.63%, 01/15/2027 | | | 113,000 | | | | 120,910 | |
| | | | | | | | 2,505,637 | |
|
| Industrial Machinery–0.19% | |
CBC Ammo LLC/CBC FinCo Inc. (Brazil), Sr. Unsec. Notes, 7.25%, 11/15/2021(b) | | | 205,000 | | | | 208,588 | |
Mueller Industries, Inc., Unsec. Sub. Deb., 6.00%, 03/01/2027 | | | 309,000 | | | | 319,042 | |
Stanley Black & Decker Inc., Jr. Unsec. Sub. Investment Units, 5.75%, 07/25/2052 | | | 22,500 | | | | 571,050 | |
TriMas Corp., Sr. Unsec. Gtd. Notes, 4.88%, 10/15/2025(b) | | | 178,000 | | | | 180,336 | |
| | | | | | | | 1,279,016 | |
See accompanying Notes to Financial Statements which are an integral part of the financial statements.
17 Invesco Multi-Asset Income Fund
| | | | | | | | |
| | | Principal
Amount | | | Value | |
| Integrated Telecommunication Services–0.89% | |
Cincinnati Bell Inc., Sr. Unsec. Gtd. Notes, 7.00%, 07/15/2024(b) | | $ | 502,000 | | | $ | 502,000 | |
Frontier Communications Corp., Sr. Unsec. Global Notes, 8.50%, 04/15/2020 | | | 194,000 | | | | 192,303 | |
10.50%, 09/15/2022 | | | 855,000 | | | | 752,143 | |
11.00%, 09/15/2025 | | | 725,000 | | | | 617,156 | |
SFR Group S.A. (France),
Sr. Sec. Gtd. First Lien Bonds, 6.00%, 05/15/2022(b) | | | 925,000 | | | | 965,469 | |
Sr. Sec. Gtd. First Lien Notes, 7.38%, 05/01/2026(b) | | | 400,000 | | | | 431,500 | |
T-Mobile USA, Inc., Sr. Unsec. Gtd. Global Bonds, 6.50%, 01/15/2026 | | | 1,665,000 | | | | 1,846,269 | |
Telecom Italia Capital S.A. (Italy), Sr. Unsec. Gtd. Global Notes, 6.38%, 11/15/2033 | | | 114,000 | | | | 132,810 | |
7.20%, 07/18/2036 | | | 320,000 | | | | 398,080 | |
| | | | | | | | 5,837,730 | |
|
| Leisure Facilities–0.22% | |
Cedar Fair L.P./Canada’s Wonderland Co./Magnum Management Corp., Sr. Unsec. Gtd. Notes, 5.38%, 04/15/2027(b) | | | 700,000 | | | | 741,125 | |
Six Flags Entertainment Corp., Sr. Unsec. Gtd. Notes, 4.88%, 07/31/2024(b) | | | 689,000 | | | | 710,531 | |
| | | | | | | | 1,451,656 | |
|
| Managed Health Care–0.17% | |
Centene Corp., Sr. Unsec. Notes, 4.75%, 01/15/2025 | | | 237,000 | | | | 245,295 | |
Molina Healthcare, Inc., Sr. Unsec. Gtd. Notes, 4.88%, 06/15/2025(b) | | | 192,000 | | | | 191,040 | |
WellCare Health Plans Inc., Sr. Unsec. Notes, 5.25%, 04/01/2025 | | | 670,000 | | | | 706,850 | |
| | | | | | | | 1,143,185 | |
|
| Metal & Glass Containers–0.24% | |
Ardagh Packaging Finance PLC / Ardagh Holdings USA Inc. (Ireland), Sr. Unsec. Gtd. Notes, 6.00%, 02/15/2025(b) | | | 600,000 | | | | 638,250 | |
Ball Corp., Sr. Unsec. Gtd. Global Notes, 5.25%, 07/01/2025 | | | 505,000 | | | | 556,762 | |
Berry Global, Inc.,
Sec. Gtd. Second Lien Global Notes,
5.13%, 07/15/2023 | | | 256,000 | | | | 269,760 | |
6.00%, 10/15/2022 | | | 85,000 | | | | 90,313 | |
Sec. Gtd. Second Lien Notes, 5.50%, 05/15/2022 | | | 15,000 | | | | 15,581 | |
| | | | | | | | 1,570,666 | |
| | | | | | | | |
| | | Principal
Amount | | | Value | |
| Movies & Entertainment–0.20% | |
AMC Entertainment Holdings, Inc., Sr. Unsec. Gtd. Sub. Global Notes, 5.75%, 06/15/2025 | | $ | 925,000 | | | $ | 904,188 | |
Lions Gate Entertainment Corp., Sr. Unsec. Gtd. Notes, 5.88%, 11/01/2024(b) | | | 395,000 | | | | 420,675 | |
| | | | | | | | 1,324,863 | |
|
| Multi-Utilities–0.14% | |
Dominion Energy, Inc., Series A, Jr. Unsec. Sub. Investment Units, 5.25%, 07/30/2076 | | | 36,100 | | | | 914,413 | |
|
| Oil & Gas Drilling–0.32% | |
Ensco PLC, Sr. Unsec. Global Notes, 4.50%, 10/01/2024 | | | 631,000 | | | | 520,575 | |
Noble Holding International Ltd. (United Kingdom), Sr. Unsec. Gtd. Global Notes, 7.75%, 01/15/2024 | | | 547,000 | | | | 492,300 | |
Precision Drilling Corp. (Canada), Sr. Unsec. Gtd. Global Notes, 5.25%, 11/15/2024 | | | 610,000 | | | | 573,400 | |
6.50%, 12/15/2021 | | | 136,000 | | | | 138,040 | |
7.75%, 12/15/2023 | | | 25,000 | | | | 25,750 | |
Transocean Inc., Sr. Unsec. Gtd. Global Notes, 7.50%, 04/15/2031 | | | 355,000 | | | | 318,612 | |
| | | | | | | | 2,068,677 | |
|
| Oil & Gas Equipment & Services–0.26% | |
Archrock Partners, L.P./Archrock Partners Finance Corp., Sr. Unsec. Gtd. Global Notes, 6.00%, 10/01/2022 | | | 510,000 | | | | 509,362 | |
SESI, L.L.C., Sr. Unsec. Gtd. Global Notes, 7.13%, 12/15/2021 | | | 487,000 | | | | 500,392 | |
Weatherford International Ltd., Sr. Unsec. Gtd. Notes, 6.50%, 08/01/2036 | | | 365,000 | | | | 305,688 | |
8.25%, 06/15/2023 | | | 405,000 | | | | 408,038 | |
| | | | | | | | 1,723,480 | |
|
| Oil & Gas Exploration & Production–1.85% | |
Antero Resources Corp., Sr. Unsec. Gtd. Global Notes, 5.63%, 06/01/2023 | | | 721,000 | | | | 758,852 | |
California Resources Corp., Sec. Gtd. Second Lien Notes, 8.00%,
12/15/2022(b) | | | 328,000 | | | | 218,530 | |
Callon Petroleum Co., Sr. Unsec. Gtd. Global Notes, 6.13%, 10/01/2024 | | | 699,000 | | | | 730,455 | |
Concho Resources Inc., Sr. Unsec. Gtd. Global Notes, 4.38%, 01/15/2025 | | | 425,000 | | | | 449,505 | |
Continental Resources Inc., Sr. Unsec. Gtd. Global Notes, 3.80%, 06/01/2024 | | | 735,000 | | | | 717,544 | |
See accompanying Notes to Financial Statements which are an integral part of the financial statements.
18 Invesco Multi-Asset Income Fund
| | | | | | | | |
| | | Principal
Amount | | | Value | |
| Oil & Gas Exploration & Production–(continued) | |
Denbury Resources Inc., Sr. Unsec. Gtd. Sub. Notes, 5.50%, 05/01/2022 | | $ | 198,000 | | | $ | 125,235 | |
EP Energy LLC/Everest Acquisition Finance Inc., Sr. Sec. Gtd. First Lien Notes, 8.00%, 11/29/2024(b) | | | 461,000 | | | | 472,525 | |
Genesis Energy L.P./Genesis Energy Finance Corp., Sr. Unsec. Gtd. Notes, 6.50%, 10/01/2025 | | | 179,000 | | | | 182,133 | |
Gulfport Energy Corp., Sr. Unsec. Gtd. Global Notes, 6.00%, 10/15/2024 | | | 416,000 | | | | 418,080 | |
6.63%, 05/01/2023 | | | 230,000 | | | | 236,900 | |
Newfield Exploration Co., Sr. Unsec. Global Notes, 5.63%, 07/01/2024 | | | 707,000 | | | | 767,979 | |
Oasis Petroleum Inc., Sr. Unsec. Gtd. Global Notes, 6.88%, 01/15/2023 | | | 647,000 | | | | 664,792 | |
Parsley Energy LLC/Parsley Finance Corp., Sr. Unsec. Gtd. Notes, 6.25%, 06/01/2024(b) | | | 795,000 | | | | 846,675 | |
QEP Resources, Inc.,
Sr. Unsec. Global Notes, 5.25%, 05/01/2023 | | | 383,000 | | | | 380,128 | |
Sr. Unsec. Notes, 6.88%, 03/01/2021 | | | 278,000 | | | | 296,765 | |
Range Resources Corp., Sr. Unsec. Gtd. Global Notes, 4.88%, 05/15/2025 | | | 1,016,000 | | | | 985,520 | |
RSP Permian, Inc., Sr. Unsec. Gtd. Notes, 5.25%, 01/15/2025(b) | | | 709,000 | | | | 724,952 | |
SM Energy Co., Sr. Unsec. Global Notes,
6.13%, 11/15/2022 | | | 265,000 | | | | 267,650 | |
6.75%, 09/15/2026 | | | 225,000 | | | | 232,031 | |
Southwestern Energy Co., Sr. Unsec. Global Notes, 4.10%, 03/15/2022 | | | 742,000 | | | | 732,725 | |
Whiting Petroleum Corp., Sr. Unsec. Gtd. Global Notes, 6.25%, 04/01/2023 | | | 850,000 | | | | 852,125 | |
WildHorse Resource Development Corp., Sr. Unsec. Gtd. Notes, 6.88%, 02/01/2025(b) | | | 503,000 | | | | 500,485 | |
WPX Energy Inc., Sr. Unsec. Notes, 5.25%, 09/15/2024 | | | 569,000 | | | | 573,979 | |
| | | | | | | | 12,135,565 | |
|
| Oil & Gas Storage & Transportation–0.94% | |
Andeavor Logistics L.P./Tesoro Logistics Finance Corp.,
Sr. Unsec. Gtd. Global Notes, 6.38%, 05/01/2024 | | | 372,000 | | | | 409,200 | |
Sr. Unsec. Gtd. Notes, 5.25%, 01/15/2025 | | | 193,000 | | | | 208,199 | |
| | | | | | | | |
| | | Principal
Amount | | | Value | |
| Oil & Gas Storage & Transportation–(continued) | |
Antero Midstream Partners LP/Antero Midstream Finance Corp., Sr. Unsec. Gtd. Global Notes, 5.38%, 09/15/2024 | | $ | 729,000 | | | $ | 763,627 | |
Energy Transfer Equity, L.P., Sr. Sec. First Lien Notes, 5.88%, 01/15/2024 | | | 844,000 | | | | 919,960 | |
Holly Energy Partners L.P./Holly Energy Finance Corp., Sr. Unsec. Gtd. Notes, 6.00%, 08/01/2024(b) | | | 537,000 | | | | 565,192 | |
NGPL PipeCo. LLC, Sr. Unsec. Bonds, 4.88%, 08/15/2027(b) | | | 320,000 | | | | 332,000 | |
Plains All American Pipeline, L.P., Series B, Jr. Unsec. Sub. Notes,
6.13%(c) | | | 351,000 | | | | 358,652 | |
Sabine Pass Liquefaction, LLC, Sr. Sec. First Lien Global Notes, 5.63%, 03/01/2025 | | | 545,000 | | | | 606,339 | |
SemGroup Corp., Sr. Unsec. Gtd. Notes, 6.38%, 03/15/2025(b) | | | 535,000 | | | | 529,650 | |
Targa Resources Partners L.P./Targa Resources Partners Finance Corp.,
Sr. Unsec. Gtd. Global Bonds, 5.13%, 02/01/2025 | | | 542,000 | | | | 560,292 | |
5.25%, 05/01/2023 | | | 114,000 | | | | 117,563 | |
Sr. Unsec. Gtd. Global Notes, 6.75%, 03/15/2024 | | | 150,000 | | | | 161,813 | |
Williams Cos., Inc. (The), Sr. Unsec. Global Notes, 4.55%, 06/24/2024 | | | 591,000 | | | | 620,550 | |
| | | | | | | | 6,153,037 | |
|
| Other Diversified Financial Services–0.11% | |
Lincoln Finance Ltd. (Netherlands), Sr. Sec. Gtd. First Lien Notes, 7.38%, 04/15/2021(b) | | | 200,000 | | | | 212,250 | |
LPL Holdings Inc., Sr. Unsec. Gtd. Notes, 5.75%, 09/15/2025(b) | | | 390,000 | | | | 406,575 | |
VFH Parent LLC/Orchestra Co-Issuer Inc., Sec. Gtd. Second Lien Notes, 6.75%, 06/15/2022(b) | | | 101,000 | | | | 105,293 | |
| | | | | | | | 724,118 | |
|
| Packaged Foods & Meats–0.26% | |
B&G Foods, Inc., Sr. Unsec. Gtd. Notes, 5.25%, 04/01/2025 | | | 191,000 | | | | 195,536 | |
JBS Investments GmbH (Brazil), Sr. Unsec. Gtd. Notes, 7.25%, 04/03/2024(b) | | | 590,000 | | | | 584,838 | |
Lamb Weston Holdings, Inc., Sr. Unsec. Gtd. Notes, 4.63%, 11/01/2024(b) | | | 555,000 | | | | 582,750 | |
TreeHouse Foods, Inc., Sr. Unsec. Gtd. Notes, 6.00%, 02/15/2024(b) | | | 315,000 | | | | 338,625 | |
| | | | | | | | 1,701,749 | |
See accompanying Notes to Financial Statements which are an integral part of the financial statements.
19 Invesco Multi-Asset Income Fund
| | | | | | | | |
| | | Principal
Amount | | | Value | |
| Paper Packaging–0.12% | |
Graphic Packaging International Inc., Sr. Unsec. Gtd. Notes, 4.88%, 11/15/2022 | | $ | 303,000 | | | $ | 324,210 | |
Plastipak Holdings Inc., Sr. Unsec. Notes, 6.25%, 10/15/2025(b) | | | 461,000 | | | | 471,949 | |
| | | | | | | | 796,159 | |
|
| Paper Products–0.16% | |
Clearwater Paper Corp., Sr. Unsec. Gtd. Global Notes, 4.50%, 02/01/2023 | | | 515,000 | | | | 516,287 | |
Mercer International Inc. (Canada), Sr. Unsec. Global Notes, 6.50%, 02/01/2024 | | | 329,000 | | | | 348,740 | |
7.75%, 12/01/2022 | | | 98,000 | | | | 104,064 | |
PH Glatfelter Co., Sr. Unsec. Gtd. Global Notes, 5.38%, 10/15/2020 | | | 100,000 | | | | 101,625 | |
| | | | | | | | 1,070,716 | |
|
| Pharmaceuticals–0.32% | |
Catalent Pharma Solutions, Inc., Sr. Unsec. Gtd. Notes, 4.88%, 01/15/2026(b) | | | 97,000 | | | | 98,698 | |
Endo DAC/Endo Finance LLC/Endo Finco Inc., Sr. Unsec. Gtd. Notes, 6.00%, 07/15/2023(b) | | | 200,000 | | | | 163,000 | |
Valeant Pharmaceuticals International, Inc.,
Sr. Sec. Gtd. First Lien Notes, 5.50%, 11/01/2025(b) | | | 112,000 | | | | 114,660 | |
Sr. Unsec. Gtd. Notes, 5.63%, 12/01/2021(b) | | | 1,380,000 | | | | 1,264,425 | |
6.13%, 04/15/2025(b) | | | 100,000 | | | | 84,375 | |
7.25%, 07/15/2022(b) | | | 155,000 | | | | 149,575 | |
7.50%, 07/15/2021(b) | | | 250,000 | | | | 247,187 | |
| | | | | | | | 2,121,920 | |
|
| Railroads–0.14% | |
Kenan Advantage Group Inc. (The), Sr. Unsec. Notes, 7.88%, 07/31/2023(b) | | | 876,000 | | | | 913,230 | |
|
| Regional Banks–0.17% | |
CIT Group Inc., Sr. Unsec. Global Notes,
5.00%, 08/15/2022 | | | 806,000 | | | | 868,465 | |
5.00%, 08/01/2023 | | | 210,000 | | | | 227,682 | |
| | | | | | | | 1,096,147 | |
|
| Restaurants–0.37% | |
1011778 BC ULC/ New Red Finance, Inc. (Canada), Sec. Gtd. Second Lien Notes, 5.00%, 10/15/2025(b) | | | 295,000 | | | | 300,900 | |
5.00%, 10/15/2025(b) | | | 1,094,000 | | | | 1,115,880 | |
| | | | | | | | |
| | | Principal
Amount | | | Value | |
| Restaurants–(continued) | |
Aramark Services, Inc.,
Sr. Unsec. Gtd. Global Notes, 4.75%, 06/01/2026 | | $ | 165,000 | | | $ | 172,999 | |
Sr. Unsec. Gtd. Notes, 5.00%, 04/01/2025(b) | | | 211,000 | | | | 226,034 | |
Carrols Restaurant Group, Inc.,
Sec. Gtd. Second Lien Global Notes, 8.00%, 05/01/2022 | | | 256,000 | | | | 271,680 | |
Sec. Gtd. Second Lien Notes, 8.00%, 05/01/2022(b) | | | 118,000 | | | | 125,227 | |
KFC Holding Co./Pizza Hut Holdings LLC/Taco Bell of America LLC, Sr. Unsec. Gtd. Notes, 4.75%, 06/01/2027(b) | | | 240,000 | | | | 246,900 | |
| | | | | | | | 2,459,620 | |
|
| Security & Alarm Services–0.01% | |
ADT Corp. (The), Sr. Sec. Gtd. First Lien Global Notes, 6.25%, 10/15/2021 | | | 70,000 | | | | 77,797 | |
|
| Semiconductors–0.12% | |
Micron Technology, Inc., Sr. Unsec. Global Notes, 5.50%, 02/01/2025 | | | 442,000 | | | | 471,835 | |
NXP B.V./NXP Funding LLC (Netherlands), Sr. Unsec. Gtd. Notes, 3.88%, 09/01/2022(b) | | | 300,000 | | | | 312,375 | |
| | | | | | | | 784,210 | |
|
| Sovereign Debt–16.18% | |
Argentine Republic Government International Bond (Argentina),
Sr. Unsec. Global Bonds, 7.13%, 07/06/2036 | | | 1,200,000 | | | | 1,293,600 | |
7.63%, 04/22/2046 | | | 1,250,000 | | | | 1,405,000 | |
REGS, Sr. Unsec. Euro Notes, 7.13%, 06/28/2117(b) | | | 1,200,000 | | | | 1,234,200 | |
Brazilian Government International Bond (Brazil), Sr. Unsec. Global Bonds,
5.63%, 01/07/2041 | | | 1,200,000 | | | | 1,219,200 | |
7.13%, 01/20/2037 | | | 1,100,000 | | | | 1,317,800 | |
8.25%, 01/20/2034 | | | 1,025,000 | | | | 1,334,550 | |
Chile Government International Bond (Chile), Sr. Unsec. Global Notes,
3.13%, 03/27/2025 | | | 1,100,000 | | | | 1,133,000 | |
3.13%, 01/21/2026 | | | 1,200,000 | | | | 1,230,000 | |
3.86%, 06/21/2047 | | | 1,200,000 | | | | 1,217,250 | |
Colombia Government International Bond (Colombia), Sr. Unsec. Global Bonds, 5.63%, 02/26/2044 | | | 1,100,000 | | | | 1,228,150 | |
6.13%, 01/18/2041 | | | 1,050,000 | | | | 1,238,475 | |
7.38%, 09/18/2037 | | | 900,000 | | | | 1,192,500 | |
See accompanying Notes to Financial Statements which are an integral part of the financial statements.
20 Invesco Multi-Asset Income Fund
| | | | | | | | |
| | | Principal
Amount | | | Value | |
| Sovereign Debt–(continued) | |
Croatia Government International Bond (Croatia), REGS, Sr. Unsec. Euro Notes, 5.50%, 04/04/2023(b) | | $ | 1,100,000 | | | $ | 1,216,706 | |
6.00%, 01/26/2024(b) | | | 1,100,000 | | | | 1,254,726 | |
6.38%, 03/24/2021(b) | | | 1,100,000 | | | | 1,215,875 | |
Dominican Republic International Bond (Dominican Repubic),
REGS, Sr. Unsec. Euro Bonds, 7.45%, 04/30/2044(b) | | | 1,100,000 | | | | 1,311,750 | |
Sr. Unsec. Euro Notes, 5.95%, 01/25/2027(b) | | | 1,200,000 | | | | 1,294,800 | |
6.85%, 01/27/2045(b) | | | 1,150,000 | | | | 1,285,125 | |
El Salvador Government International Bond (El Salvador),
REGS, Sr. Unsec. Euro Notes, 7.63%, 02/01/2041(b) | | | 1,350,000 | | | | 1,414,125 | |
7.65%, 06/15/2035(b) | | | 1,300,000 | | | | 1,361,750 | |
8.25%, 04/10/2032(b) | | | 1,200,000 | | | | 1,341,000 | |
Hungary Government International Bond (Hungary), Sr. Unsec. Global Notes,
5.38%, 03/25/2024 | | | 1,050,000 | | | | 1,195,536 | |
5.75%, 11/22/2023 | | | 1,050,000 | | | | 1,208,490 | |
7.63%, 03/29/2041 | | | 790,000 | | | | 1,220,352 | |
Indonesia Government International Bond (Indonesia), REGS, Sr. Unsec. Euro Bonds, 6.63%, 02/17/2037(b) | | | 1,000,000 | | | | 1,287,455 | |
7.75%, 01/17/2038(b) | | | 850,000 | | | | 1,215,166 | |
8.50%, 10/12/2035(b) | | | 850,000 | | | | 1,273,909 | |
Kazakhstan Government International Bond (Kazakhstan),
REGS, Sr. Unsec. Euro Notes, 4.88%, 10/14/2044(b) | | | 1,350,000 | | | | 1,407,210 | |
Sr. Unsec. Medium-Term Euro Notes, 5.13%, 07/21/2025(b) | | | 1,150,000 | | | | 1,280,746 | |
6.50%, 07/21/2045(b) | | | 1,100,000 | | | | 1,379,838 | |
Korea International Bond (South Korea),
Sr. Unsec. Global Bonds, 2.75%, 01/19/2027 | | | 1,170,000 | | | | 1,146,395 | |
Sr. Unsec. Global Notes, 3.88%, 09/11/2023 | | | 1,200,000 | | | | 1,270,476 | |
4.13%, 06/10/2044 | | | 1,000,000 | | | | 1,151,470 | |
Lebanon Government International Bond (Lebanon),
REGS, Sr. Unsec. Euro Bonds, 7.25%, 03/23/2037(b) | | | 1,100,000 | | | | 1,051,930 | |
Sr. Unsec. Euro Notes, 6.75%, 11/29/2027(b) | | | 1,150,000 | | | | 1,111,374 | |
Sr. Unsec. Medium-Term Global Euro Notes, 6.65%, 02/26/2030(b) | | | 1,200,000 | | | | 1,129,939 | |
Lithuania Government International Bond (Lithuania), REGS, Sr. Unsec. Euro Notes, 6.13%, 03/09/2021(b) | | | 1,600,000 | | | | 1,794,800 | |
6.63%, 02/01/2022(b) | | | 1,550,000 | | | | 1,815,183 | |
| | | | | | | | |
| | | Principal
Amount | | | Value | |
| Sovereign Debt–(continued) | |
Mexico Government International Bond (Mexico),
Sr. Unsec. Global Notes,
4.60%, 01/23/2046 | | $ | 1,350,000 | | | $ | 1,322,325 | |
5.55%, 01/21/2045 | | | 1,170,000 | | | | 1,313,617 | |
Series A, Sr. Unsec. Medium-Term Global Notes, 6.05%, 01/11/2040 | | | 1,100,000 | | | | 1,292,225 | |
Pakistan Government International Bond (Pakistan), REGS, Sr. Unsec. Euro Notes, 8.25%, 04/15/2024(b) | | | 1,600,000 | | | | 1,788,878 | |
8.25%, 09/30/2025(b) | | | 900,000 | | | | 1,013,707 | |
Panama Government International Bond (Panama), Sr. Unsec. Global Bonds,
3.88%, 03/17/2028 | | | 1,200,000 | | | | 1,257,000 | |
7.13%, 01/29/2026 | | | 950,000 | | | | 1,225,500 | |
8.88%, 09/30/2027 | | | 850,000 | | | | 1,234,625 | |
Peruvian Government International Bond (Peru), Sr. Unsec. Global Bonds,
4.13%, 08/25/2027 | | | 1,070,000 | | | | 1,175,395 | |
5.63%, 11/18/2050 | | | 1,000,000 | | | | 1,264,500 | |
8.75%, 11/21/2033 | | | 850,000 | | | | 1,336,625 | |
Philippine Government International Bond (Philippines),
Sr. Unsec. Global Bonds, 6.38%, 10/23/2034 | | | 850,000 | | | | 1,140,714 | |
9.50%, 02/02/2030 | | | 725,000 | | | | 1,152,386 | |
Sr. Unsec. Global Notes, 7.75%, 01/14/2031 | | | 800,000 | | | | 1,152,181 | |
Qatar Government International Bond (Qatar),
REGS, Sr. Unsec. Euro Bonds, 4.63%, 06/02/2046(b) | | | 1,100,000 | | | | 1,133,440 | |
Sr. Unsec. Euro Notes, 5.75%, 01/20/2042(b) | | | 1,025,000 | | | | 1,223,537 | |
6.40%, 01/20/2040(b) | | | 1,000,000 | | | | 1,279,050 | |
Republic of Poland Government International Bond (Poland),
Sr. Unsec. Global Notes, 3.00%, 03/17/2023 | | | 1,150,000 | | | | 1,175,835 | |
Sr. Unsec. Global Notes, 3.25%, 04/06/2026 | | | 1,175,000 | | | | 1,204,136 | |
4.00%, 01/22/2024 | | | 1,220,000 | | | | 1,309,197 | |
Republic of South Africa Government International Bond (South Africa),
Sr. Unsec. Global Bonds, 5.00%, 10/12/2046 | | | 1,200,000 | | | | 1,071,065 | |
5.38%, 07/24/2044 | | | 1,150,000 | | | | 1,084,153 | |
Sr. Unsec. Global Notes, 6.25%, 03/08/2041 | | | 1,000,000 | | | | 1,051,459 | |
Romanian Government International Bond (Romania), REGS, Sr. Unsec. Medium-Term Euro Notes,
4.38%, 08/22/2023(b) | | | 1,170,000 | | | | 1,253,719 | |
4.88%, 01/22/2024(b) | | | 1,100,000 | | | | 1,210,736 | |
6.13%, 01/22/2044(b) | | | 1,030,000 | | | | 1,310,252 | |
See accompanying Notes to Financial Statements which are an integral part of the financial statements.
21 Invesco Multi-Asset Income Fund
| | | | | | | | |
| | | Principal
Amount | | | Value | |
| Sovereign Debt–(continued) | |
Russian Foreign Bond (Russia), REGS, Sr. Unsec. Euro Bonds, 4.88%, 09/16/2023(b) | | $ | 1,200,000 | | | $ | 1,307,662 | |
5.63%, 04/04/2042(b) | | | 1,200,000 | | | | 1,326,301 | |
5.88%, 09/16/2043(b) | | | 1,000,000 | | | | 1,144,916 | |
Serbia International Bond (Serbia), REGS, Sr. Unsec. Euro Notes, 7.25%, 09/28/2021(b) | | | 3,200,000 | | | | 3,685,834 | |
Slovenia Government International Bond (Slovenia), REGS, Sr. Unsec. Euro Notes, 5.25%, 02/18/2024(b) | | | 1,100,000 | | | | 1,253,296 | |
5.50%, 10/26/2022(b) | | | 1,100,000 | | | | 1,247,105 | |
5.85%, 05/10/2023(b) | | | 1,050,000 | | | | 1,213,637 | |
Sri Lanka Government International Bond (Sri Lanka),
REGS, Sr. Unsec. Euro Bonds, 6.83%, 07/18/2026(b) | | | 1,150,000 | | | | 1,278,050 | |
6.85%, 11/03/2025(b) | | | 1,150,000 | | | | 1,279,358 | |
Sr. Unsec. Euro Notes, 6.13%, 06/03/2025(b) | | | 1,150,000 | | | | 1,230,038 | |
Third Pakistan International Sukuk Co. Ltd. (The) (Pakistan), REGS, Sr. Unsec. Euro Bonds, 5.50%, 10/13/2021(b) | | | 900,000 | | | | 918,412 | |
Turkey Government International Bond (Turkey), Sr. Unsec. Global Notes,
6.88%, 03/17/2036 | | | 1,050,000 | | | | 1,158,712 | |
7.25%, 03/05/2038 | | | 1,030,000 | | | | 1,185,923 | |
8.00%, 02/14/2034 | | | 1,020,000 | | | | 1,248,526 | |
Ukraine Government International Bond (Ukraine),
Sr. Unsec. Notes, 7.75%, 09/01/2025(b) | | | 1,100,000 | | | | 1,146,706 | |
REGS, Sr. Unsec. Euro Notes, 7.75%, 09/01/2022(b) | | | 1,200,000 | | | | 1,284,724 | |
7.75%, 09/01/2025(b) | | | 200,000 | | | | 208,492 | |
7.75%, 09/01/2026(b) | | | 1,200,000 | | | | 1,239,636 | |
Venezuela Government International Bond (Venezuela), REGS, Sr. Unsec. Euro Bonds, 6.00%, 12/09/2020(b) | | | 2,015,000 | | | | 800,963 | |
8.25%, 10/13/2024(b) | | | 2,300,000 | | | | 787,750 | |
9.00%, 05/07/2023(b) | | | 2,150,000 | | | | 747,125 | |
| | | | | | | | 106,349,274 | |
|
| Specialized Consumer Services–0.16% | |
ServiceMaster Co., LLC (The),
Sr. Unsec. Gtd. Notes, 5.13%, 11/15/2024(b) | | | 742,000 | | | | 766,115 | |
Sr. Unsec. Notes, 7.45%, 08/15/2027 | | | 254,000 | | | | 277,495 | |
| | | | | | | | 1,043,610 | |
|
| Specialized Finance–0.22% | |
AerCap Global Aviation Trust (Ireland), Jr. Unsec. Gtd. Sub. Notes, 6.50%, 06/15/2045(b) | | | 200,000 | | | | 219,000 | |
| | | | | | | | |
| | | Principal
Amount | | | Value | |
| Specialized Finance–(continued) | |
Aircastle Ltd.,
Sr. Unsec. Global Notes, 7.63%, 04/15/2020 | | $ | 70,000 | | | $ | 77,787 | |
Sr. Unsec. Notes, 5.00%, 04/01/2023 | | | 883,000 | | | | 935,980 | |
5.50%, 02/15/2022 | | | 187,000 | | | | 201,960 | |
| | | | | | | | 1,434,727 | |
|
| Specialized REIT’s–0.70% | |
CyrusOne L.P./CyrusOne Finance Corp., Sr. Unsec. Gtd. Notes, 5.00%, 03/15/2024(b) | | | 60,000 | | | | 63,075 | |
5.38%, 03/15/2027(b) | | | 310,000 | | | | 332,087 | |
Equinix Inc., Sr. Unsec. Notes, 5.75%, 01/01/2025 | | | 18,000 | | | | 19,395 | |
5.88%, 01/15/2026 | | | 1,220,000 | | | | 1,325,225 | |
GLP Capital LP/GLP Financing II Inc., Sr. Unsec. Gtd. Notes, 5.38%, 04/15/2026 | | | 300,000 | | | | 325,500 | |
Iron Mountain Inc.,
Sr. Unsec. Gtd. Notes, 6.00%, 08/15/2023 | | | 203,000 | | | | 214,673 | |
Sr. Unsec. Sub. Gtd. Global Notes, 5.75%, 08/15/2024 | | | 115,000 | | | | 118,450 | |
Iron Mountain US Holdings, Inc., Sr. Unsec. Gtd. Notes, 5.38%, 06/01/2026(b) | | | 653,000 | | | | 685,650 | |
Rayonier A.M. Products Inc., Sr. Unsec. Gtd. Notes, 5.50%, 06/01/2024(b) | | | 534,000 | | | | 520,650 | |
SBA Communications Corp., Sr. Unsec. Global Notes, 4.88%, 07/15/2022 | | | 79,000 | | | | 81,765 | |
4.88%, 09/01/2024 | | | 891,000 | | | | 917,730 | |
| | | | | | | | 4,604,200 | |
|
| Specialty Chemicals–0.45% | |
Ashland LLC, Sr. Unsec. Gtd. Global Notes, 4.75%, 08/15/2022 | | | 480,000 | | | | 507,696 | |
Axalta Coating Systems, LLC, Sr. Unsec. Gtd. Notes, 4.88%, 08/15/2024(b) | | | 300,000 | | | | 314,250 | |
GCP Applied Technologies Inc., Sr. Unsec. Gtd. Notes, 9.50%, 02/01/2023(b) | | | 265,000 | | | | 297,462 | |
Kraton Polymers LLC/Kraton Polymers Capital Corp., Sr. Unsec. Gtd. Notes, 10.50%, 04/15/2023(b) | | | 402,000 | | | | 458,280 | |
PolyOne Corp., Sr. Unsec. Global Notes, 5.25%, 03/15/2023 | | | 572,000 | | | | 617,760 | |
PQ Corp., Sr. Sec. Gtd. First Lien Notes, 6.75%, 11/15/2022(b) | | | 315,000 | | | | 341,775 | |
Venator Finance S.a.r.l./Venator Materials Corp., Sr. Unsec. Gtd. Notes, 5.75%, 07/15/2025(b) | | | 370,000 | | | | 392,200 | |
| | | | | | | | 2,929,423 | |
See accompanying Notes to Financial Statements which are an integral part of the financial statements.
22 Invesco Multi-Asset Income Fund
| | | | | | | | |
| | | Principal
Amount | | | Value | |
| Steel–0.24% | |
ArcelorMittal (Luxembourg), Sr. Unsec. Global Notes, 7.50%, 10/15/2039 | | $ | 335,000 | | | $ | 420,006 | |
Steel Dynamics, Inc., Sr. Unsec. Gtd. Global Notes, 5.00%, 12/15/2026 | | | 224,000 | | | | 237,440 | |
5.50%, 10/01/2024 | | | 75,000 | | | | 80,511 | |
United States Steel Corp., Sr. Unsec. Global Notes, 6.88%, 08/15/2025 | | | 821,000 | | | | 836,907 | |
| | | | | | | | 1,574,864 | |
|
| Systems Software–0.06% | |
Symantec Corp., Sr. Unsec. Notes, 5.00%, 04/15/2025(b) | | | 362,000 | | | | 379,195 | |
|
| Technology Distributors–0.09% | |
CDW LLC/CDW Finance Corp., Sr. Unsec. Gtd. Notes, 5.00%, 09/01/2025 | | | 552,000 | | | | 580,290 | |
|
| Technology Hardware, Storage & Peripherals–0.45% | |
Dell International LLC/ EMC Corp., Sr. Unsec. Gtd. Notes, 7.13%, 06/15/2024(b) | | | 1,335,000 | | | | 1,474,051 | |
Diebold Nixdorf, Inc., Sr. Unsec. Gtd. Global Notes, 8.50%, 04/15/2024 | | | 439,000 | | | | 463,694 | |
Western Digital Corp., Sr. Unsec. Gtd. Global Notes, 10.50%, 04/01/2024 | | | 839,000 | | | | 986,664 | |
| | | | | | | | 2,924,409 | |
|
| Trading Companies & Distributors–0.44% | |
BMC East, LLC, Sr. Sec. Gtd. First Lien Notes, 5.50%, 10/01/2024(b) | | | 426,000 | | | | 447,300 | |
Fly Leasing Ltd. (Ireland), Sr. Unsec. Global Notes, 6.38%, 10/15/2021 | | | 200,000 | | | | 209,250 | |
6.75%, 12/15/2020 | | | 200,000 | | | | 208,260 | |
H&E Equipment Services, Inc., Sr. Unsec. Gtd. Notes, 5.63%, 09/01/2025(b) | | | 717,000 | | | | 759,124 | |
Herc Rentals Inc., Sec. Gtd. Second Lien Notes, 7.75%, 06/01/2024(b) | | | 501,000 | | | | 552,352 | |
United Rentals North America, Inc., Sr. Unsec. Gtd. Global Notes, 5.50%, 07/15/2025 | | | 50,000 | | | | 53,625 | |
Sr. Unsec. Gtd. Notes, 5.50%, 05/15/2027 | | | 151,000 | | | | 161,948 | |
5.88%, 09/15/2026 | | | 475,000 | | | | 519,828 | |
| | | | | | | | 2,911,687 | |
|
| Trucking–0.15% | |
Avis Budget Car Rental LLC/Avis Budget Finance Inc., Sr. Unsec. Gtd. Notes, 5.25%, 03/15/2025(b) | | | 180,000 | | | | 176,625 | |
6.38%, 04/01/2024(b) | | | 230,000 | | | | 239,775 | |
| | | | | | | | |
| | | Principal
Amount | | | Value | |
Trucking–(continued) | |
Hertz Corp. (The),
Sec. Gtd. Second Lien Notes, 7.63%, 06/01/2022(b) | | $ | 134,000 | | | $ | 140,057 | |
Sr. Unsec. Gtd. Global Notes, 6.75%, 04/15/2019 | | | 330,000 | | | | 331,031 | |
7.38%, 01/15/2021 | | | 79,000 | | | | 79,593 | |
| | | | | | | | 967,081 | |
|
| Wireless Telecommunication Services–0.64% | |
CB Escrow Corp., Sr. Unsec. Notes, 8.00%, 10/15/2025(b) | | | 72,000 | | | | 74,700 | |
Sprint Communications Inc., Sr. Unsec. Global Notes, 11.50%, 11/15/2021 | | | 235,000 | | | | 295,512 | |
Sprint Corp., Sr. Unsec. Gtd. Global Notes,
7.25%, 09/15/2021 | | | 1,004,000 | | | | 1,096,870 | |
7.88%, 09/15/2023 | | | 1,858,000 | | | | 2,080,960 | |
Wind Acquisition Finance S.A. (Italy), Sec. Gtd. Second Lien Notes, 7.38%, 04/23/2021(b) | | | 450,000 | | | | 468,585 | |
Wind Tre S.p.A. (Italy), Sr. Sec. Gtd. Notes, 5.00%, 01/20/2026(b) | | | 200,000 | | | | 201,549 | |
| | | | | | | | 4,218,176 | |
Total U.S. Dollar Denominated Bonds & Notes
(Cost $262,710,217) | | | | 266,233,632 | |
| | |
| | | Shares | | | | |
|
Preferred Stocks–21.46% | |
| Alternative Carriers–0.82% | |
Qwest Corp., 6.13% Pfd. | | | 21,800 | | | | 553,284 | |
Qwest Corp., 6.50% Pfd. | | | 47,600 | | | | 1,201,900 | |
Qwest Corp., 6.63% Pfd. | | | 33,300 | | | | 853,812 | |
Qwest Corp., 6.75% Pfd. | | | 50,000 | | | | 1,275,000 | |
Qwest Corp., 6.88% Pfd. | | | 23,800 | | | | 611,898 | |
Qwest Corp., 7.00% Pfd. | | | 12,000 | | | | 304,200 | |
Qwest Corp., 7.00% Pfd. | | | 16,300 | | | | 413,531 | |
Qwest Corp., 7.50% Pfd. | | | 6,256 | | | | 161,843 | |
| | | | | | | | 5,375,468 | |
|
| Asset Management & Custody Banks–1.03% | |
Apollo Investment Corp., 6.88% Pfd. | | | 13,100 | | | | 338,504 | |
Ares Management, L.P., Series A, 7.00% Pfd. | | | 12,600 | | | | 337,932 | |
Bank of New York Mellon Corp. (The), 5.20% Pfd. | | | 25,400 | | | | 641,096 | |
Carlyle Group LP (The), Series A, 5.88% Pfd. | | | 18,100 | | | | 457,749 | |
KKR & Co. L.P., Series A, 6.75% Sr. Pfd. | | | 9,800 | | | | 269,402 | |
KKR & Co. L.P., Series B, 6.50% Pfd. | | | 9,800 | | | | 268,030 | |
Legg Mason, Inc., 5.45% Pfd. | | | 21,800 | | | | 548,270 | |
Legg Mason, Inc., 6.38% Pfd. | | | 11,300 | | | | 302,049 | |
Northern Trust Corp., Series C, 5.85% Pfd. | | | 18,500 | | | | 490,805 | |
See accompanying Notes to Financial Statements which are an integral part of the financial statements.
23 Invesco Multi-Asset Income Fund
| | | | | | | | |
| | | Shares | | | Value | |
| Asset Management & Custody Banks–(continued) | |
OM Asset Management PLC, 5.13% Pfd. | | | 4,200 | | | $ | 104,790 | |
Prospect Capital Corp., 6.25% Pfd. | | | 7,400 | | | | 189,440 | |
State Street Corp., Series C, 5.25% Pfd. | | | 13,000 | | | | 327,340 | |
State Street Corp., Series D, 5.90% Pfd. | | | 23,100 | | | | 640,101 | |
State Street Corp., Series E, 6.00% Pfd. | | | 42,900 | | | | 1,155,297 | |
State Street Corp., Series G, 5.35% Pfd. | | | 26,200 | | | | 712,640 | |
| | | | | | | | 6,783,445 | |
|
| Cable & Satellite–0.05% | |
Comcast Corp., 5.00% Pfd. | | | 12,500 | | | | 318,625 | |
|
| Consumer Finance–0.74% | |
Capital One Financial Corp., Series B, 6.00% Pfd. | | | 26,100 | | | | 662,679 | |
Capital One Financial Corp., Series C, 6.25% Pfd. | | | 19,000 | | | | 507,300 | |
Capital One Financial Corp., Series D, 6.70% Pfd. | | | 18,500 | | | | 500,425 | |
Capital One Financial Corp., Series F, 6.20% Pfd. | | | 18,500 | | | | 499,870 | |
Capital One Financial Corp., Series G, 5.20% Pfd. | | | 36,100 | | | | 899,251 | |
Capital One Financial Corp., Series H, 6.00% Pfd. | | | 31,600 | | | | 841,508 | |
Discover Financial Services, Series B, 6.50% Pfd. | | | 24,000 | | | | 609,600 | |
Navient Corp., 6.00% Pfd. | | | 14,300 | | | | 346,775 | |
| | | | | | | | 4,867,408 | |
|
| Diversified Banks–6.83% | |
Bank of America Corp., Series 3, 6.38% Pfd. | | | 3,300 | | | | 85,800 | |
Bank of America Corp., Series I, 6.63% Pfd. | | | 20,451 | | | | 531,931 | |
Bank of America Corp., Series W, 6.63% Pfd. | | | 109,500 | | | | 2,956,500 | |
Bank of America Corp., Series Y, 6.50% Pfd. | | | 95,200 | | | | 2,547,552 | |
Bank of America Corp., Class CC, 6.20% Pfd. | | | 92,300 | | | | 2,473,640 | |
Bank of America Corp., Series EE, 6.00% Pfd. | | | 85,700 | | | | 2,265,051 | |
Barclays Bank PLC (United Kingdom), Series 5, 8.13% Pfd. | | | 40,000 | | | | 1,067,200 | |
Citigroup Inc., Series J, 7.13% Pfd. | | | 55,400 | | | | 1,595,520 | |
Citigroup Inc., Series K, 6.88% Pfd. | | | 50,800 | | | | 1,467,612 | |
Citigroup Inc., Series L, 6.88% Pfd. | | | 26,200 | | | | 707,138 | |
Citigroup Inc., Series S, 6.30% Pfd. | | | 64,600 | | | | 1,748,722 | |
HSBC Holdings PLC (United Kingdom), Series 2, 8.00% Pfd. | | | 68,000 | | | | 1,829,200 | |
ING Groep NV (Netherlands), 6.38% Pfd. | | | 30,000 | | | | 771,000 | |
| | | | | | | | |
| | | Shares | | | Value | |
| Diversified Banks–(continued) | |
JPMorgan Chase & Co., Series O, 5.50% Pfd. | | | 12,400 | | | $ | 311,240 | |
JPMorgan Chase & Co., Series P, 5.45% Pfd. | | | 18,100 | | | | 455,396 | |
JPMorgan Chase & Co., Series T, 6.70% Pfd. | | | 14,300 | | | | 382,525 | |
JPMorgan Chase & Co., Series W, 6.30% Pfd. | | | 19,000 | | | | 505,590 | |
JPMorgan Chase & Co., Series Y, 6.13% Pfd. | | | 76,200 | | | | 2,042,160 | |
JPMorgan Chase & Co., Series AA, 6.10% Pfd. | | | 104,800 | | | | 2,817,024 | |
JPMorgan Chase & Co., Series BB, 6.15% Pfd. | | | 104,800 | | | | 2,831,696 | |
Royal Bank of Scotland Group PLC (The) (United Kingdom), Series S, 6.60% Pfd. | | | 17,600 | | | | 451,440 | |
Santander Finance Preferred SAU (Spain), 6.50% Pfd. | | | 3,400 | | | | 87,448 | |
US Bancorp, Series F, 6.50% Pfd. | | | 69,300 | | | | 1,994,454 | |
Wells Fargo & Co., 5.20% Pfd. | | | 64,600 | | | | 1,618,876 | |
Wells Fargo & Co., 6.63% Pfd. | | | 35,700 | | | | 1,021,377 | |
Wells Fargo & Co., Series J, 8.00% Pfd. | | | 14,900 | | | | 380,248 | |
Wells Fargo & Co., Series O, 5.13% Pfd. | | | 60,000 | | | | 1,501,800 | |
Wells Fargo & Co., Series P, 5.25% Pfd. | | | 22,600 | | | | 567,486 | |
Wells Fargo & Co., Series Q, 5.85% Pfd. | | | 33,300 | | | | 907,092 | |
Wells Fargo & Co., Series T, 6.00% Pfd. | | | 50,800 | | | | 1,327,912 | |
Wells Fargo & Co., Series V, 6.00% Pfd. | | | 38,100 | | | | 1,005,840 | |
Wells Fargo & Co., Series W, 5.70% Pfd. | | | 38,100 | | | | 981,837 | |
Wells Fargo & Co., Series X, 5.50% Pfd. | | | 92,900 | | | | 2,360,589 | |
Wells Fargo & Co., Series Y, 5.63% Pfd. | | | 50,800 | | | | 1,315,847 | |
| | | | | | | | 44,914,743 | |
|
| Diversified Capital Markets–0.73% | |
Deutsche Bank Contingent Capital Trust III (Germany), 7.60% Pfd. | | | 78,600 | | | | 2,046,744 | |
Deutsche Bank Contingent Capital Trust V (Germany), 8.05% Pfd. | | | 104,800 | | | | 2,763,576 | |
| | | | | | | | 4,810,320 | |
|
| Diversified REIT’s–0.37% | |
PS Business Parks, Inc., Series T, 6.00% Pfd. | | | 4,531 | | | | 114,453 | |
PS Business Parks, Inc., Series U, 5.75% Pfd. | | | 13,100 | | | | 330,513 | |
PS Business Parks, Inc., Series W, 5.20% Pfd. | | | 13,100 | | | | 331,430 | |
PS Business Parks, Inc., Series X, 5.25% Pfd. | | | 10,400 | | | | 261,560 | |
See accompanying Notes to Financial Statements which are an integral part of the financial statements.
24 Invesco Multi-Asset Income Fund
| | | | | | | | |
| | | Shares | | | Value | |
| Diversified REIT’s–(continued) | |
Spirit Realty Capital Inc., Series A, 6.00% Pfd. | | | 7,800 | | | $ | 192,192 | |
VEREIT Inc., Series F, 6.70% Pfd. | | | 46,200 | | | | 1,181,334 | |
| | | | | | | | 2,411,482 | |
|
| Electric Utilities–1.23% | |
Alabama Power Co., Series A, 5.00% Pfd. | | | 11,300 | | | | 288,489 | |
Duke Energy Corp., 5.13% Pfd. | | | 23,100 | | | | 590,898 | |
Entergy Arkansas, Inc., 4.88% Pfd. | | | 16,700 | | | | 418,335 | |
Entergy Arkansas, Inc., 4.90% Pfd. | | | 11,500 | | | | 289,455 | |
Entergy Louisiana, LLC, 4.88% Pfd. | | | 18,500 | | | | 461,390 | |
Entergy Louisiana, LLC, 5.25% Pfd. | | | 8,000 | | | | 200,800 | |
Entergy Mississippi, Inc., 4.90% Pfd. | | | 12,200 | | | | 304,512 | |
Entergy Texas Inc., 5.63% Pfd. | | | 9,200 | | | | 239,752 | |
Georgia Power Co., Series 2017A, 5.00% Pfd. | | | 12,200 | | | | 305,000 | |
Interstate Power & Light Co., Series D, 5.10% Pfd. | | | 9,000 | | | | 230,580 | |
Pacific Gas & Electric Co., Series A, 6.00% Pfd. | | | 3,200 | | | | 96,736 | |
PPL Capital Funding, Inc., Series B, 5.90% Pfd. | | | 21,400 | | | | 545,486 | |
SCE Trust IV, Series J, 5.38% Pfd. | | | 24,000 | | | | 648,480 | |
SCE Trust V, Series K, 5.45% Pfd. | | | 17,600 | | | | 482,768 | |
SCE Trust VI, 5.00% Pfd. | | | 33,800 | | | | 851,760 | |
Southern Co. (The), 5.25% Pfd. | | | 46,200 | | | | 1,172,094 | |
Southern Co. (The), 6.25% Pfd. | | | 35,700 | | | | 963,186 | |
| | | | | | | | 8,089,721 | |
|
| Health Care REIT’s–0.15% | |
Senior Housing Properties Trust, 5.63% Pfd. | | | 27,700 | | | | 697,763 | |
Ventas Realty L.P. / Ventas Capital Corp., 5.45% Pfd. | | | 12,300 | | | | 311,067 | |
| | | | | | | | 1,008,830 | |
|
| Industrial Conglomerates–0.36% | |
General Electric Co., 4.70% Pfd. | | | 29,300 | | | | 742,755 | |
General Electric Co., 4.88% Pfd. | | | 32,300 | | | | 809,115 | |
General Electric Co., 4.88% Pfd. | | | 31,600 | | | | 792,844 | |
| | | | | | | | 2,344,714 | |
|
| Integrated Telecommunication Services–0.09% | |
Verizon Communications Inc., 5.90% Pfd. | | | 23,100 | | | | 621,390 | |
|
| Internet Software & Services–0.15% | |
eBay Inc., 6.00% Pfd. | | | 35,700 | | | | 966,756 | |
|
| Investment Banking & Brokerage–1.91% | |
BGC Partners Inc., 8.13% Pfd. | | | 4,400 | | | | 114,180 | |
Charles Schwab Corp. (The), Series B, 6.00% Pfd. | | | 12,400 | | | | 314,712 | |
Charles Schwab Corp. (The), Series C, 6.00% Pfd. | | | 26,200 | | | | 718,142 | |
| | | | | | | | |
| | | Shares | | | Value | |
| Investment Banking & Brokerage–(continued) | |
Charles Schwab Corp. (The), Series D, 5.95% Pfd. | | | 42,900 | | | $ | 1,175,460 | |
Goldman Sachs Group, Inc. (The), Series I, 5.95% Pfd. | | | 7,800 | | | | 195,156 | |
Goldman Sachs Group, Inc. (The), Series J, 5.50% Pfd. | | | 31,600 | | | | 848,460 | |
Goldman Sachs Group, Inc. (The), Series K, 6.38% Pfd. | | | 57,700 | | | | 1,657,144 | |
Goldman Sachs Group, Inc. (The), Series N, 6.30% Pfd. | | | 71,600 | | | | 1,955,396 | |
Morgan Stanley, Series E, 7.13% Pfd. | | | 12,500 | | | | 361,875 | |
Morgan Stanley, Series F, 6.88% Pfd. | | | 23,100 | | | | 659,505 | |
Morgan Stanley, Series G, 6.63% Pfd. | | | 23,100 | | | | 618,618 | |
Morgan Stanley, Series I, 6.38% Pfd. | | | 69,300 | | | | 1,940,400 | |
Morgan Stanley, Series K, 5.85% Pfd. | | | 57,700 | | | | 1,557,900 | |
Stifel Financial Corp., 5.20% Pfd. | | | 9,200 | | | | 229,816 | |
Stifel Financial Corp., Series A, 6.25% Pfd. | | | 6,500 | | | | 173,875 | |
| | | | | | | | 12,520,639 | |
|
| Life & Health Insurance–0.62% | |
Aegon N.V. (Netherlands), 6.38% Pfd. | | | 6,700 | | | | 173,530 | |
Aegon N.V. (Netherlands), 8.00% Pfd. | | | 45,100 | | | | 1,185,228 | |
Aflac Inc., 5.50% Pfd. | | | 23,100 | | | | 583,506 | |
Prudential Financial Inc., 5.70% Pfd. | | | 29,500 | | | | 758,150 | |
Prudential Financial Inc., 5.75% Pfd. | | | 24,800 | | | | 630,416 | |
Prudential PLC (United Kingdom), 6.75% Pfd. | | | 12,300 | | | | 325,950 | |
Torchmark Corp., 5.88% Pfd. | | | 3,900 | | | | 99,177 | |
Torchmark Corp., 6.13% Pfd. | | | 12,500 | | | | 339,875 | |
| | | | | | | | 4,095,832 | |
|
| Mortgage REIT’s–0.06% | |
Wells Fargo Real Estate Investment Corp., Series A, 6.38% Pfd. | | | 14,600 | | | | 386,900 | |
|
| Multi-Line Insurance–0.20% | |
American Financial Group, Inc., 6.00% Pfd. | | | 12,200 | | | | 319,274 | |
Hartford Financial Services Group Inc. (The), 7.88% Pfd. | | | 28,600 | | | | 855,998 | |
Kemper Corp., 7.38% Pfd. | | | 5,300 | | | | 140,238 | |
| | | | | | | | 1,315,510 | |
|
| Multi-Utilities–0.21% | |
DTE Energy Co., Series B, 5.38% Pfd. | | | 19,900 | | | | 512,226 | |
DTE Energy Co., Series F, 6.00% Pfd. | | | 14,600 | | | | 398,580 | |
See accompanying Notes to Financial Statements which are an integral part of the financial statements.
25 Invesco Multi-Asset Income Fund
| | | | | | | | |
| | | Shares | | | Value | |
| Multi-Utilities–(continued) | |
Integrys Holding, Inc., 6.00% Pfd. | | | 15,450 | | | $ | 437,428 | |
| | | | | | | | 1,348,234 | |
|
| Office REIT’s–0.33% | |
Boston Properties, Inc., 5.25% Pfd. | | | 9,000 | | | | 234,990 | |
Equity Commonwealth, 5.75% Pfd. | | | 5,900 | | | | 148,090 | |
Government Properties Income Trust, 5.88% Pfd. | | | 12,900 | | | | 333,465 | |
SL Green Realty Corp., Series I, 6.50% Pfd. | | | 9,300 | | | | 235,104 | |
Vornado Realty Trust, Series L, 5.40% Pfd. | | | 49,400 | | | | 1,249,820 | |
| | | | | | | | 2,201,469 | |
|
| Office Services & Supplies–0.08% | |
Pitney Bowes Inc., 6.70% Pfd. | | | 19,600 | | | | 503,916 | |
|
| Oil & Gas Refining & Marketing–0.11% | |
NuStar Energy L.P., Series A, 8.50% Pfd. | | | 27,600 | | | | 724,500 | |
|
| Oil & Gas Storage & Transportation–0.01% | |
Targa Resources Partners LP, Series A, 9.00% Pfd. | | | 3,600 | | | | 95,076 | |
|
| Other Diversified Financial Services–0.07% | |
KKR Financial Holdings LLC, Series A, 7.38% Pfd. | | | 16,900 | | | | 428,753 | |
|
| Property & Casualty Insurance–1.01% | |
Allstate Corp. (The), 5.10% Pfd. | | | 13,100 | | | | 349,508 | |
Allstate Corp. (The), 5.63% Pfd. | | | 13,100 | | | | 335,360 | |
Allstate Corp. (The), Series C, 6.75% Pfd. | | | 13,100 | | | | 344,268 | |
Allstate Corp. (The), Series E, 6.63% Pfd. | | | 33,800 | | | | 906,854 | |
Allstate Corp. (The), Series F, 6.25% Pfd. | | | 20,800 | | | | 560,976 | |
Arch Capital Group Ltd., Series E, 5.25% Pfd. | | | 28,300 | | | | 704,953 | |
Arch Capital Group Ltd., Series F, 5.45% Pfd. | | | 11,900 | | | | 301,546 | |
Argo Group U.S. Inc., 6.50% Pfd. | | | 6,800 | | | | 172,448 | |
Aspen Insurance Holdings Ltd. (Bermuda), 5.63% Pfd. | | | 12,500 | | | | 316,625 | |
Aspen Insurance Holdings Ltd. (Bermuda), 5.95% Pfd. | | | 11,500 | | | | 309,810 | |
Assured Guaranty Municipal Holdings Inc., 6.25% Pfd. | | | 9,900 | | | | 260,667 | |
AXIS Capital Holdings Ltd., Series E, 5.50% Pfd. | | | 36,900 | | | | 934,677 | |
Hanover Insurance Group, Inc. (The), 6.35% Pfd. | | | 5,900 | | | | 150,361 | |
Selective Insurance Group, Inc., 5.88% Pfd. | | | 5,900 | | | | 151,040 | |
W. R. Berkley Corp., 5.63% Pfd. | | | 13,100 | | | | 327,238 | |
W. R. Berkley Corp., 5.75% Pfd. | | | 19,600 | | | | 515,480 | |
| | | | | | | | 6,641,811 | |
| | | | | | | | |
| | | Shares | | | Value | |
| Regional Banks–2.06% | |
Associated Banc-Corp, Series D, 5.38% Pfd. | | | 4,100 | | | $ | 101,516 | |
BB&T Corp., Series D, 5.85% Pfd. | | | 23,800 | | | | 610,232 | |
BB&T Corp., Series E, 5.63% Pfd. | | | 53,100 | | | | 1,356,174 | |
BB&T Corp., Series H, 5.63% Pfd. | | | 60,000 | | | | 1,605,000 | |
BOK Financial Corp., 5.38% Pfd. | | | 7,100 | | | | 180,837 | |
CIT Group Inc., Series A, 5.80% Pfd. | | | 70,000 | | | | 72,692 | |
Commerce Bancshares Inc., Series B, 6.00% Pfd. | | | 6,900 | | | | 182,574 | |
Cullen/Frost Bankers, Inc., 5.38% Pfd. | | | 7,100 | | | | 180,269 | |
Fifth Third Bancorp, Series I, 6.63% Pfd. | | | 20,800 | | | | 592,592 | |
First Horizon National Corp., Series A, 6.20% Pfd. | | | 3,500 | | | | 89,670 | |
First Republic Bank, Series D, 5.50% Pfd. | | | 10,100 | | | | 255,227 | |
First Republic Bank, Series E, 7.00% Pfd. | | | 4,500 | | | | 119,925 | |
First Republic Bank, Series F, 5.70% Pfd. | | | 7,900 | | | | 209,903 | |
First Republic Bank, Series G, 5.50% Pfd. | | | 9,500 | | | | 244,530 | |
First Republic Bank, Series H, 5.13% Pfd. | | | 7,100 | | | | 179,275 | |
FNB Corp., 7.25% Pfd. | | | 3,400 | | | | 98,566 | |
Hancock Holding Co., 5.95% Pfd. | | | 4,700 | | | | 123,093 | |
Huntington Bancshares, Inc., Series C, 5.88% Pfd. | | | 7,900 | | | | 204,847 | |
Huntington Bancshares, Inc., Series D, 6.25% Pfd. | | | 17,000 | | | | 471,920 | |
KeyCorp, Series E, 6.13% Pfd. | | | 23,100 | | | | 674,289 | |
People’s United Financial, Inc., Series A, 5.63% Pfd. | | | 11,500 | | | | 310,040 | |
PNC Financial Services Group, Inc. (The), Series P, 6.13% Pfd. | | | 85,700 | | | | 2,418,454 | |
Regions Financial Corp., Series A, 6.38% Pfd. | | | 19,000 | | | | 482,600 | |
Regions Financial Corp., Series B, 6.38% Pfd. | | | 28,600 | | | | 810,810 | |
Sterling Bancorp., Series A, 6.50% Pfd. | | | 4,100 | | | | 107,174 | |
SunTrust Banks, Inc., Series E, 5.88% Pfd. | | | 21,400 | | | | 547,626 | |
TCF Financial Corp., Series B, 6.45% Pfd. | | | 3,700 | | | | 95,090 | |
TCF Financial Corp., Series C, 5.70% Pfd. | | | 7,900 | | | | 203,030 | |
Texas Capital Bancshares, Inc., Series A, 6.50% Pfd. | | | 12,400 | | | | 317,440 | |
Valley National Bancorp, Series A, 6.25% Pfd. | | | 9,400 | | | | 258,970 | |
Valley National Bancorp., Series B, 5.50% Pfd. | | | 3,900 | | | | 102,960 | |
Webster Financial Corp., Series E, 6.40% Pfd. | | | 3,900 | | | | 98,787 | |
See accompanying Notes to Financial Statements which are an integral part of the financial statements.
26 Invesco Multi-Asset Income Fund
| | | | | | | | |
| | | Shares | | | Value | |
| Regional Banks–(continued) | |
Wintrust Financial Corp., Series D, 6.50% Pfd. | | | 4,100 | | | $ | 114,759 | |
Zions Bancorp., Series G, 6.30% Pfd. | | | 4,900 | | | | 135,987 | |
| | | | | | | | 13,556,858 | |
|
| Reinsurance–0.52% | |
Maiden Holdings, Ltd., 6.63% Pfd. | | | 3,600 | | | | 94,428 | |
Maiden Holdings, Ltd., Series A, 8.25% Pfd. | | | 9,100 | | | | 75,075 | |
Maiden Holdings, Ltd., Series C, 7.13% Pfd. | | | 9,000 | | | | 233,640 | |
Maiden Holdings, Ltd., Series D, 6.70% Pfd. | | | 11,900 | | | | 297,500 | |
PartnerRe Ltd. (Bermuda), Series H, 7.25% Pfd. | | | 27,700 | | | | 806,624 | |
Reinsurance Group of America, Inc., 5.75% Pfd. | | | 23,100 | | | | 642,180 | |
Reinsurance Group of America, Inc., 6.20% Pfd. | | | 12,200 | | | | 342,210 | |
RenaissanceRe Holdings Ltd. (Bermuda), Series E, 5.38% Pfd. | | | 18,500 | | | | 473,600 | |
Validus Holdings Ltd., Series B, 5.80% Pfd. | | | 10,700 | | | | 270,389 | |
Validus Holdings, Ltd., Series A, 5.88% Pfd. | | | 6,900 | | | | 177,192 | |
| | | | | | | | 3,412,838 | |
|
| Residential REIT’s–0.04% | |
American Homes 4 Rent, Series F, 5.88% Pfd. | | | 5,600 | | | | 144,200 | |
American Homes 4 Rent, Series G, 5.88% Pfd. | | | 4,500 | | | | 117,000 | |
| | | | | | | | 261,200 | |
|
| Retail REIT’s–0.36% | |
CBL & Associates Properties, Inc., Series D, 7.38% Pfd. | | | 27,000 | | | | 666,360 | |
DDR Corp., Series A, 6.38% Pfd. | | | 11,500 | | | | 292,560 | |
DDR Corp., Series J, 6.50% Pfd. | | | 11,000 | | | | 277,530 | |
Kimco Realty Corp., Series I, 6.00% Pfd. | | | 3,762 | | | | 94,802 | |
Kimco Realty Corp., Series L, 5.13% Pfd. | | | 9,100 | | | | 226,044 | |
National Retail Properties, Inc., Series E, 5.70% Pfd. | | | 9,200 | | | | 240,028 | |
National Retail Properties, Inc., Series F, 5.20% Pfd. | | | 19,000 | | | | 477,090 | |
Washington Prime Group Inc., Series H, 7.50% Pfd. | | | 4,400 | | | | 110,924 | |
| | | | | | | | 2,385,338 | |
|
| Specialized REIT’s–0.90% | |
Digital Realty Trust Inc., Series C, 6.63% Pfd. | | | 8,400 | | | | 233,604 | |
Digital Realty Trust, Inc., Series G, 5.88% Pfd. | | | 17,400 | | | | 444,048 | |
| | | | | | | | |
| | | Shares | | | Value | |
| Specialized REIT’s–(continued) | |
Digital Realty Trust, Inc., Series H, 7.38% Pfd. | | | 16,700 | | | $ | 445,723 | |
Digital Realty Trust Inc., Series J, 5.25% Pfd. | | | 18,100 | | | | 452,319 | |
EPR Properties, Series F, 6.63% Pfd. | | | 3,900 | | | | 98,553 | |
Public Storage, Series A, 5.88% Pfd. | | | 8,400 | | | | 224,952 | |
Public Storage, Series B, 5.40% Pfd. | | | 27,100 | | | | 700,264 | |
Public Storage, Series C, 5.13% Pfd. | | | 30,400 | | | | 774,288 | |
Public Storage, Series D, 4.95% Pfd. | | | 33,800 | | | | 847,366 | |
Public Storage, Series E, 4.90% Pfd. | | | 38,100 | | | | 950,595 | |
Public Storage, Series F, 5.15% Pfd. | | | 8,100 | | | | 204,120 | |
Public Storage, Series G, 5.05% Pfd. | | | 11,800 | | | | 298,894 | |
Public Storage, Series Y, 6.38% Pfd. | | | 8,100 | | | | 214,650 | |
| | | | | | | | 5,889,376 | |
|
| Thrifts & Mortgage Finance–0.10% | |
New York Community Bancorp Inc., Series A, 6.38% Pfd. | | | 23,200 | | | | 647,976 | |
|
| Trading Companies & Distributors–0.03% | |
GATX Corp., 5.63% Pfd. | | | 6,800 | | | | 175,855 | |
|
| Wireless Telecommunication Services–0.29% | |
Telephone & Data Systems Inc., 5.88% Pfd. | | | 12,200 | | | | 308,416 | |
Telephone & Data Systems Inc., 7.00% Pfd. | | | 21,700 | | | | 550,312 | |
United States Cellular Corp., 6.95% Pfd. | | | 5,000 | | | | 126,900 | |
United States Cellular Corp., 7.25% Pfd. | | | 16,700 | | | | 447,727 | |
United States Cellular Corp., 7.25% Pfd. | | | 17,300 | | | | 460,872 | |
| | | | | | | | 1,894,227 | |
Total Preferred Stocks
(Cost $139,267,269) | | | | | | | 140,999,210 | |
|
Common Stocks & Other Equity Interests–14.37% | |
| Diversified REIT’s–0.98% | | | | | | | | |
Gladstone Commercial Corp. | | | 63,921 | | | | 1,384,533 | |
Global Net Lease, Inc. | | | 87,666 | | | | 1,893,585 | |
Gramercy Property Trust | | | 31,551 | | | | 937,065 | |
Investors Real Estate Trust | | | 138,554 | | | | 810,541 | |
Lexington Realty Trust | | | 140,517 | | | | 1,422,032 | |
| | | | | | | | 6,447,756 | |
|
| Health Care REIT’s–1.20% | |
Global Medical REIT, Inc. | | | 206,371 | | | | 1,745,899 | |
Medical Properties Trust Inc. | | | 108,178 | | | | 1,431,195 | |
See accompanying Notes to Financial Statements which are an integral part of the financial statements.
27 Invesco Multi-Asset Income Fund
| | | | | | | | |
| | | Shares | | | Value | |
| Health Care REIT’s–(continued) | |
New Senior Investment Group Inc. | | | 235,720 | | | $ | 2,107,337 | |
Sabra Health Care REIT, Inc. | | | 58,846 | | | | 1,172,212 | |
Senior Housing Properties Trust | | | 78,288 | | | | 1,440,499 | |
| | | | | | | | 7,897,142 | |
|
| Hotel and Resort REIT’s–1.69% | |
Apple Hospitality REIT, Inc. | | | 70,857 | | | | 1,342,032 | |
Ashford Hospitality Trust, Inc. | | | 242,908 | | | | 1,707,643 | |
Chatham Lodging Trust | | | 62,636 | | | | 1,362,333 | |
Chesapeake Lodging Trust | | | 47,682 | | | | 1,330,328 | |
Hospitality Properties Trust | | | 54,227 | | | | 1,549,808 | |
LaSalle Hotel Properties | | | 43,615 | | | | 1,230,379 | |
MGM Growth Properties LLC–Class A | | | 32,930 | | | | 971,764 | |
RLJ Lodging Trust | | | 21,086 | | | | 456,723 | |
Xenia Hotels & Resorts, Inc. | | | 53,883 | | | | 1,172,494 | |
| | | | | | | | 11,123,504 | |
|
| Industrial REIT’s–0.15% | |
STAG Industrial, Inc. | | | 35,123 | | | | 958,858 | |
|
| Mortgage REIT’s–8.17% | |
AG Mortgage Investment Trust, Inc. | | | 86,982 | | | | 1,636,131 | |
AGNC Investment Corp. | | | 210,510 | | | | 4,237,566 | |
Annaly Capital Management, Inc. | | | 181,618 | | | | 2,081,342 | |
Anworth Mortgage Asset Corp. | | | 278,977 | | | | 1,559,481 | |
Apollo Commercial Real Estate Finance, Inc. | | | 92,431 | | | | 1,670,228 | |
Blackstone Mortgage Trust, Inc.–Class A | | | 71,890 | | | | 2,288,259 | |
Capstead Mortgage Corp. | | | 114,907 | | | | 1,013,480 | |
Cherry Hill Mortgage Investment Corp. | | | 58,964 | | | | 1,073,735 | |
Chimera Investment Corp. | | | 293,583 | | | | 5,372,569 | |
CYS Investments, Inc. | | | 321,527 | | | | 2,572,216 | |
Ellington Residential Mortgage REIT | | | 39,186 | | | | 524,309 | |
Ladder Capital Corp. | | | 82,766 | | | | 1,112,375 | |
MFA Financial, Inc. | | | 571,539 | | | | 4,709,481 | |
MTGE Investment Corp. | | | 116,820 | | | | 2,114,442 | |
New Residential Investment Corp. | | | 335,975 | | | | 5,923,239 | |
Orchid Island Capital Inc. | | | 233,885 | | | | 2,329,495 | |
PennyMac Mortgage Investment Trust | | | 64,084 | | | | 1,029,189 | |
Redwood Trust, Inc. | | | 65,585 | | | | 1,030,340 | |
Starwood Property Trust, Inc. | | | 201,074 | | | | 4,325,102 | |
Two Harbors Investment Corp. | | | 559,066 | | | | 5,478,847 | |
Western Asset Mortgage Capital Corp. | | | 160,213 | | | | 1,613,345 | |
| | | | | | | | 53,695,171 | |
|
| Office REIT’s–0.47% | |
Franklin Street Properties Corp. | | | 149,213 | | | | 1,492,130 | |
Government Properties Income Trust | | | 87,951 | | | | 1,598,070 | |
| | | | | | | | 3,090,200 | |
| | | | | | | | |
| | | Shares | | | Value | |
| Residential REIT’s–0.37% | |
Independence Realty Trust, Inc. | | | 132,705 | | | $ | 1,346,956 | |
Preferred Apartment Communities, Inc.–Class A | | | 55,443 | | | | 1,100,543 | |
| | | | | | | | 2,447,499 | |
|
| Retail REIT’s–0.98% | |
CBL & Associates Properties, Inc. | | | 319,810 | | | | 2,507,310 | |
Whitestone REIT | | | 130,102 | | | | 1,738,163 | |
Washington Prime Group Inc. | | | 276,944 | | | | 2,168,472 | |
| | | | | | | | 6,413,945 | |
|
| Specialized REIT’s–0.36% | |
CoreCivic, Inc. | | | 45,648 | | | | 1,125,679 | |
Geo Group Inc. (The) | | | 48,025 | | | | 1,246,236 | |
| | | | | | | | 2,371,915 | |
Total Common Stocks & Other Equity Interests
(Cost $91,788,053) | | | | 94,445,990 | |
| | |
| | | Principal
Amount | | | | |
U.S. Treasury Securities–8.33% | |
| U.S. Treasury Bills–0.04% | | | | | | | | |
1.05%, 02/01/2018(e)(f) | | $ | 10,000 | | | | 9,971 | |
1.09%, 02/01/2018(e)(f) | | | 130,000 | | | | 129,625 | |
1.11%, 02/01/2018(e)(f) | | | 125,000 | | | | 124,639 | |
| | | | | | | | 264,235 | |
|
| U.S. Treasury STRIPS–8.29% | |
2.71%, 11/15/2045(e)(g) | | | 28,685,000 | | | | 12,602,743 | |
2.88%, 11/15/2045(e)(g) | | | 4,900,000 | | | | 2,152,813 | |
2.91%, 11/15/2045(e)(g) | | | 3,000,000 | | | | 1,318,049 | |
2.94%, 11/15/2045(e)(g) | | | 4,800,000 | | | | 2,108,878 | |
2.96%, 11/15/2045(e)(g) | | | 19,000,000 | | | | 8,347,642 | |
2.97%, 11/15/2045(e)(g) | | | 5,200,000 | | | | 2,284,618 | |
2.98%, 11/15/2045(e)(g) | | | 4,300,000 | | | | 1,889,203 | |
2.99%, 11/15/2045(e)(g) | | | 2,300,000 | | | | 1,010,505 | |
3.02%, 11/15/2045(e)(g) | | | 7,100,000 | | | | 3,119,382 | |
3.03%, 11/15/2045(e)(g) | | | 1,500,000 | | | | 659,024 | |
3.08%, 11/15/2045(e)(g) | | | 5,900,000 | | | | 2,592,162 | |
3.10%, 11/15/2045(e)(g) | | | 900,000 | | | | 395,415 | |
3.13%, 11/15/2045(e)(g) | | | 2,100,000 | | | | 922,634 | |
3.14%, 11/15/2045(e)(g) | | | 7,000,000 | | | | 3,075,447 | |
3.17%, 11/15/2045(e)(g) | | | 2,800,000 | | | | 1,230,179 | |
3.19%, 11/15/2045(e)(g) | | | 3,000,000 | | | | 1,318,049 | |
3.23%, 11/15/2045(e)(g) | | | 5,200,000 | | | | 2,284,618 | |
3.24%, 11/15/2045(e)(g) | | | 2,200,000 | | | | 966,569 | |
3.27%, 11/15/2045(e)(g) | | | 11,015,000 | | | | 4,839,436 | |
3.31%, 11/15/2045(e)(g) | | | 3,100,000 | | | | 1,361,984 | |
| | | | | | | | 54,479,350 | |
Total U.S. Treasury Securities
(Cost $54,670,603) | | | | | | | 54,743,585 | |
See accompanying Notes to Financial Statements which are an integral part of the financial statements.
28 Invesco Multi-Asset Income Fund
| | | | | | | | |
| | |
Shares | | | Value | |
Exchange-Traded Notes–8.16% | |
ETRACS Alerian MLP Infrastructure Index ETN, 7.27%, 04/02/2040(h) | | | 1,067,000 | | | $ | 25,063,830 | |
JPMorgan Alerian MLP Index ETN, 6.28%, 05/24/2024(h) | | | 1,056,000 | | | | 28,575,360 | |
Total Exchange-Traded Notes
(Cost $58,354,690) | | | | | | | 53,639,190 | |
| | |
| | | Principal
Amount | | | | |
Non-U.S. Dollar Denominated Bonds & Notes–0.25%(i) | |
| Cable & Satellite–0.08% | | | | | | | | |
SES S.A. (Luxembourg), REGS, Jr. Unsec. Gtd. Sub. Euro Bonds, 4.63%(b)(c) | | EUR | 400,000 | | | | 505,275 | |
|
| Electric Utilities–0.04% | |
Enel S.p.A. (Italy), REGS, Jr. Unsec. Sub. Euro Bonds, 6.63%, 09/15/2076(b) | | GBP | 200,000 | | | | 301,940 | |
|
| Food Retail–0.05% | |
Iceland Bondco PLC (United Kingdom), REGS, Sr. Sec. Gtd. Euro Notes, 4.63%, 03/15/2025(b) | | GBP | 250,000 | | | | 322,926 | |
|
| Health Care Services–0.04% | |
Synlab Unsecured Bondco PLC (United Kingdom), REGS, Sr. Unsec. Gtd. Euro Bonds, 8.25%, 07/01/2023(b) | | EUR | 200,000 | | | | 256,783 | |
| | | | | | | | |
| | | Principal
Amount | | | Value | |
| Restaurants–0.04% | |
PizzaExpress Financing 2 PLC (United Kingdom), REGS, Sr. Sec. Gtd. First Lien Euro Bonds, 6.63%, 08/01/2021(b) | | GBP | 200,000 | | | $ | 259,476 | |
Total Non-U.S. Dollar Denominated Bonds & Notes
(Cost $1,540,698) | | | | 1,646,400 | |
|
Variable Rate Senior Loan Interests–0.12%(j) | |
| Food & Drug Retailers–0.12% | |
Albertson’s LLC, Term Loan B-4, 3.99% (3 mo. USD LIBOR + 2.75%), 08/25/2021
(Cost $770,597) | | $ | 802,988 | | | | 780,219 | |
| | |
| | | Shares | | | | |
Money Market Funds–5.31% | |
Invesco Government & Agency Portfolio–Institutional Class,
0.95%(k) | | | 20,955,834 | | | | 20,955,834 | |
Invesco Treasury Portfolio–Institutional Class,
0.94%(k) | | | 13,970,556 | | | | 13,970,556 | |
Total Money Market Funds
(Cost $34,926,390) | | | | | | | 34,926,390 | |
TOTAL INVESTMENTS IN SECURITIES–98.52%
(Cost $644,028,517) | | | | 647,414,616 | |
OTHER ASSETS LESS LIABILITIES–1.48% | | | | 9,705,894 | |
NET ASSETS–100.00% | | | $ | 657,120,510 | |
Investment Abbreviations:
| | |
| Deb. | | – Debentures |
| ETN | | – Exchange-Traded Notes |
| EUR | | – Euro |
| GBP | | – British Pound |
| Gtd. | | – Guaranteed |
| Jr. | | – Junior |
| LIBOR | | – London Interbank Offered Rate |
| MLP | | – Master Limited Partnership |
| Pfd. | | – Preferred |
| | |
| PIK | | – Payment in Kind |
| REGS | | – Regulation S |
| REIT | | – Real Estate Investment Trust |
| Sec. | | – Secured |
| Sr. | | – Senior |
| STRIPS | | – Separately Traded Registered Interest and Principal Security |
| Sub. | | – Subordinated |
| Unsec. | | – Unsecured |
| USD | | – United States Dollar |
Notes to Schedule of Investments:
| (a) | Industry and/or sector classifications used in this report are generally according to the Global Industry Classification Standard, which was developed by and is the exclusive property and a service mark of MSCI Inc. and Standard & Poor’s. |
| (b) | Security purchased or received in a transaction exempt from registration under the Securities Act of 1933, as amended (the “1933 Act”). The security may be resold pursuant to an exemption from registration under the 1933 Act, typically to qualified institutional buyers. The aggregate value of these securities at October 31, 2017 was $124,563,216, which represented 18.96% of the Fund’s Net Assets. |
| (c) | Perpetual bond with no specified maturity date. |
| (d) | All or a portion of this security is Pay-in-Kind. Pay-in-Kind securities pay interest income in the form of securities. |
| (e) | Security traded on a discount basis. The interest rate shown represents the discount rate at the time of purchase by the Fund. |
| (f) | All or a portion of the value was pledged as collateral to cover margin requirements for open swap agreements. See Note 1L. |
| (g) | All or a portion of the value was pledged as collateral to cover margin requirements for open futures contracts. See Note 1K. |
| (h) | Interest or dividend rate is redetermined periodically. Rate shown is the rate in effect on October 31, 2017. |
| (i) | Foreign denominated security. Principal amount is denominated in the currency indicated. |
| (j) | Variable rate senior loan interests are, at present, not readily marketable, not registered under the 1933 Act, and may be subject to contractual and legal restrictions on sale. Variable rate senior loan interests in the Fund’s portfolio generally have variable rates which adjust to a base, such as the London Interbank Offered Rate (“LIBOR”), on set dates, typically every 30 days but not greater than one year; and/or have interest rates that float at a margin above a widely recognized base lending rate such as the Prime Rate of a designated U.S. bank. |
| (k) | The money market fund and the Fund are affiliated by having the same investment adviser. The rate shown is the 7-day SEC standardized yield as of October 31, 2017. |
See accompanying Notes to Financial Statements which are an integral part of the financial statements.
29 Invesco Multi-Asset Income Fund
| | | | | | | | | | | | | | | | | | | | |
| Open Futures Contracts | |
| | | Number of
Contracts | | | Expiration
Month | | | Notional
Value | | | Value | | | Unrealized
Appreciation
(Depreciation) | |
Long Futures Contracts | | | | | | | | | | | | | | | | | | | | |
Dow Jones Euro STOXX 50 Index | | | 512 | | | | December-2017 | | | $ | 21,936,651 | | | $ | 1,156,335 | | | $ | 1,156,335 | |
E-Mini Russell 2000 | | | 215 | | | | December-2017 | | | | 16,154,025 | | | | 673,443 | | | | 673,443 | |
E-Mini S&P 500 Index | | | 126 | | | | December-2017 | | | | 16,208,010 | | | | 520,833 | | | | 520,833 | |
FTSE 100 Index | | | 219 | | | | December-2017 | | | | 21,724,421 | | | | 262,708 | | | | 262,708 | |
Hang Seng Index | | | 119 | | | | November-2017 | | | | 21,507,678 | | | | (12,393 | ) | | | (12,393 | ) |
Topix Stock Price Index | | | 150 | | | | December-2017 | | | | 23,260,621 | | | | 2,256,291 | | | | 2,256,291 | |
Subtotal — Equity Risk | | | | | | | | | | | | | | | 4,857,217 | | | | 4,857,217 | |
Subtotal — Long | | | | | | | | | | | | | | | 4,857,217 | | | | 4,857,217 | |
| | | | | | | | | | | | | | | | | | | | | |
Short Futures Contracts | | | | | | | | | | | | | | | | | | | | |
Euro Bonds | | | 110 | | | | December-2017 | | | | (20,854,622 | ) | | | (193,373 | ) | | | (193,373 | ) |
Long Gilt | | | 127 | | | | December-2017 | | | | (20,975,316 | ) | | | 60,288 | | | | 60,288 | |
U.S. Treasury Long Bonds | | | 66 | | | | December-2017 | | | | (10,062,938 | ) | | | 77,999 | | | | 77,999 | |
Subtotal — Interest Rate Risk | | | | | | | | | | | | | | | (55,086 | ) | | | (55,086 | ) |
Subtotal — Short | | | | | | | | | | | | | | | (55,086 | ) | | | (55,086 | ) |
Total Futures Contracts | | | | | | | | | | | | | | | | | | $ | 4,802,131 | |
| | | | | | | | | | | | | | | | | | | | | | |
| Open Forward Foreign Currency Contracts | |
Settlement Date | | Counterparty | | | | | Unrealized
Appreciation
(Depreciation) | |
| | | Contract to | | |
| | | Deliver | | | Receive | | |
11/30/2017 | | Barclays Bank PLC | | | GBP | | | | 244,000 | | | | USD | | | | 324,614 | | | $ | 214 | |
11/30/2017 | | Deutsche Bank Securities Inc. | | | EUR | | | | 793,994 | | | | USD | | | | 938,440 | | | | 12,023 | |
Subtotal | | | | | | | | | | | | | | | | | | | 12,237 | |
11/30/2017 | | Citigroup Global Markets Inc. | | | GBP | | | | 365,156 | | | | USD | | | | 468,438 | | | | (17,039 | ) |
11/30/2017 | | Goldman Sachs International | | �� | USD | | | | 248,152 | | | | EUR | | | | 210,000 | | | | (3,128 | ) |
Subtotal | | | | | | | | | | | | | | | | | | | | | (20,167 | ) |
Total Forward Foreign Currency Contracts — Currency Risk | | | | | | | | | | | | | | | $ | (7,930 | ) |
| | | | | | | | | | | | | | | | | | | | | | | | | | | | | | | | | | | | |
| Open Centrally Cleared Credit Default Swap Agreements — Credit Risk | |
| Reference Entity | | Buy/Sell
Protection | | | (Pay)/Receive
Fixed Rate | | | Payment
Frequency | | | Maturity
Date | | | Implied
Credit
Spread(a) | | | Notional
Value | | | Upfront
Payments
Paid | | | Value | | | Unrealized
Appreciation(b) | |
Markit iTraxx Europe Index | | | Sell | | | | 5.00 | % | | | Quarterly | | | | 06/20/2022 | | | | 2.80 | % | | $ | 4,950,000 | | | $ | 326,949 | | | $ | 446,129 | | | $ | 119,180 | |
| (a) | Implied credit spreads represent the current level, as of October 31, 2017, at which protection could be bought or sold given the terms of the existing credit default swap agreement and serve as an indicator of the current status of the payment/performance risk of the credit default swap agreement. An implied credit spread that has widened or increased since entry into the initial agreement may indicate a deteriorating credit profile and increased risk of default for the reference entity. A declining or narrowing spread may indicate an improving credit profile or decreased risk of default for the reference entity. Alternatively, credit spreads may increase or decrease reflecting the general tolerance for risk in the credit markets generally. |
| (b) | The daily variation margin receivable at period-end is recorded in the Statement of Assets and Liabilities. |
Currency Abbreviations:
| | |
| EUR | | – Euro |
| GBP | | – British Pound Sterling |
| USD | | – U.S. Dollar |
See accompanying Notes to Financial Statements which are an integral part of the financial statements.
30 Invesco Multi-Asset Income Fund
Statement of Assets and Liabilities
October 31, 2017
| | | | |
Assets: | |
Investments in securities, at value (Cost $609,102,127) | | $ | 612,488,226 | |
Investments in affiliated money market funds, at value and cost | | | 34,926,390 | |
Other investments: | | | | |
Variation margin receivable — futures | | | 160,219 | |
Variation margin receivable — centrally cleared swap agreements | | | 6,903 | |
Unrealized appreciation on forward foreign currency contracts outstanding | | | 12,237 | |
Cash | | | 315,493 | |
Foreign currencies, at value (Cost $21,245) | | | 21,051 | |
Receivable for: | | | | |
Investments sold | | | 108,063 | |
Fund shares sold | | | 7,487,093 | |
Dividends and interest | | | 4,361,188 | |
Fund expenses absorbed | | | 43,981 | |
Investment for trustee deferred compensation and retirement plans | | | 27,195 | |
Other assets | | | 101,820 | |
Total assets | | | 660,059,859 | |
|
Liabilities: | |
Other investments: | | | | |
Unrealized depreciation on forward foreign currency contracts outstanding | | | 20,167 | |
Payable for: | | | | |
Investments purchased | | | 1,494,087 | |
Fund shares reacquired | | | 1,007,724 | |
Accrued fees to affiliates | | | 202,676 | |
Accrued trustees’ and officers’ fees and benefits | | | 2,352 | |
Accrued other operating expenses | | | 181,386 | |
Trustee deferred compensation and retirement plans | | | 30,957 | |
Total liabilities | | | 2,939,349 | |
Net assets applicable to shares outstanding | | $ | 657,120,510 | |
|
Net assets consist of: | |
Shares of beneficial interest | | $ | 647,671,396 | |
Undistributed net investment income | | | (67,769 | ) |
Undistributed net realized gain | | | 1,216,949 | |
Net unrealized appreciation | | | 8,299,934 | |
| | | $ | 657,120,510 | |
| | | | |
Net Assets: | |
Class A | | $ | 191,394,898 | |
Class C | | $ | 74,211,353 | |
Class R | | $ | 1,608,370 | |
Class Y | | $ | 328,798,342 | |
Class R5 | | $ | 30,109 | |
Class R6 | | $ | 61,077,438 | |
|
Shares outstanding, no par value,
with an unlimited number of shares authorized: | |
Class A | | | 17,387,561 | |
Class C | | | 6,747,676 | |
Class R | | | 146,140 | |
Class Y | | | 29,862,697 | |
Class R5 | | | 2,734 | |
Class R6 | | | 5,547,189 | |
Class A: | | | | |
Net asset value per share | | $ | 11.01 | |
Maximum offering price per share | | | | |
(Net asset value of $11.01 ¸ 94.50%) | | $ | 11.65 | |
Class C: | | | | |
Net asset value and offering price per share | | $ | 11.00 | |
Class R: | | | | |
Net asset value and offering price per share | | $ | 11.01 | |
Class Y: | | | | |
Net asset value and offering price per share | | $ | 11.01 | |
Class R5: | | | | |
Net asset value and offering price per share | | $ | 11.01 | |
Class R6: | | | | |
Net asset value and offering price per share | | $ | 11.01 | |
See accompanying Notes to Financial Statements which are an integral part of the financial statements.
31 Invesco Multi-Asset Income Fund
Statement of Operations
For the year ended October 31, 2017
| | | | |
Investment income: | |
Interest | | $ | 9,496,846 | |
Dividends (net of foreign withholding taxes of $1,613) | | | 10,652,046 | |
Dividends from affiliated money market funds | | | 176,061 | |
Total investment income | | | 20,324,953 | |
| |
Expenses: | | | | |
Advisory fees | | | 1,936,678 | |
Administrative services fees | | | 111,786 | |
Custodian fees | | | 62,619 | |
Distribution fees: | | | | |
Class A | | | 314,667 | |
Class C | | | 443,920 | |
Class R | | | 5,340 | |
Transfer agent fees — A, C, R and Y | | | 389,667 | |
Transfer agent fees — R5 | | | 7 | |
Transfer agent fees — R6 | | | 666 | |
Trustees’ and officers’ fees and benefits | | | 25,091 | |
Registration and filing fees | | | 118,658 | |
Licensing Fees | | | 165,700 | |
Reports to shareholders | | | 85,162 | |
Professional services fees | | | 67,079 | |
Other | | | 32,601 | |
Total expenses | | | 3,759,641 | |
Less: Fees waived, expenses reimbursed and expense offset arrangement(s) | | | (689,891 | ) |
Net expenses | | | 3,069,750 | |
Net investment income | | | 17,255,203 | |
| |
Realized and unrealized gain from: | | | | |
Net realized gain (loss) from: | | | | |
Investment securities (includes net gains (losses) from securities sold to affiliates of $(2,979)) | | | 2,988,245 | |
Foreign currencies | | | (135,646 | ) |
Forward foreign currency contracts | | | (37,157 | ) |
Futures contracts | | | 7,520,571 | |
Swap agreements | | | 252,372 | |
| | | | 10,588,385 | |
Change in net unrealized appreciation (depreciation) of: | | | | |
Investment securities | | $ | (1,295,125 | ) |
Foreign currencies | | | 2,485 | |
Forward foreign currency contracts | | | (59,546 | ) |
Futures contracts | | | 4,487,348 | |
Swap agreements | | | 86,727 | |
| | | | 3,221,889 | |
Net realized and unrealized gain | | | 13,810,274 | |
Net increase in net assets resulting from operations | | $ | 31,065,477 | |
See accompanying Notes to Financial Statements which are an integral part of the financial statements.
32 Invesco Multi-Asset Income Fund
Statement of Changes in Net Assets
For the years ended October 31, 2017 and 2016
| | | | | | | | |
| | | 2017 | | | 2016 | |
Operations: | | | | | |
Net investment income | | $ | 17,255,203 | | | $ | 6,729,718 | |
Net realized gain | | | 10,588,385 | | | | 981,215 | |
Change in net unrealized appreciation | | | 3,221,889 | | | | 1,893,239 | |
Net increase in net assets resulting from operations | | | 31,065,477 | | | | 9,604,172 | |
| | |
Distributions to shareholders from net investment income: | | | | | | | | |
Class A | | | (5,659,946 | ) | | | (2,847,881 | ) |
Class C | | | (1,660,348 | ) | | | (751,745 | ) |
Class R | | | (45,346 | ) | | | (17,519 | ) |
Class Y | | | (7,006,185 | ) | | | (825,464 | ) |
Class R5 | | | (1,289 | ) | | | (587 | ) |
Class R6 | | | (2,679,432 | ) | | | (2,805,712 | ) |
Total distributions from net investment income | | | (17,052,546 | ) | | | (7,248,908 | ) |
| | |
Share transactions–net: | | | | | | | | |
Class A | | | 94,789,727 | | | | 37,737,567 | |
Class C | | | 48,232,871 | | | | 6,501,206 | |
Class R | | | 1,023,387 | | | | 194,926 | |
Class Y | | | 293,115,564 | | | | 18,353,047 | |
Class R5 | | | 9,180 | | | | 9,064 | |
Class R6 | | | 9,119,307 | | | | (18,420,097 | ) |
Net increase in net assets resulting from share transactions | | | 446,290,036 | | | | 44,375,713 | |
Net increase in net assets | | | 460,302,967 | | | | 46,730,977 | |
| | |
Net assets: | | | | | | | | |
Beginning of year | | | 196,817,543 | | | | 150,086,566 | |
End of year (includes undistributed net investment income of $(67,769) and $(145,929), respectively) | | $ | 657,120,510 | | | $ | 196,817,543 | |
Notes to Financial Statements
October 31, 2017
NOTE 1—Significant Accounting Policies
Invesco Multi-Asset Income Fund (the “Fund”) is a series portfolio of AIM Investment Funds (Invesco Investment Funds) (the “Trust”). The Trust is organized as a Delaware statutory trust and is registered under the Investment Company Act of 1940, as amended (the “1940 Act”), as an open-end series management investment company consisting of twenty separate series portfolios, each authorized to issue an unlimited number of shares of beneficial interest. The assets, liabilities and operations of each portfolio are accounted for separately. Information presented in these financial statements pertains only to the Fund. Matters affecting each portfolio or class will be voted on exclusively by the shareholders of such portfolio or class.
The Fund’s investment objective is to provide current income.
The Fund currently consists of six different classes of shares: Class A, Class C, Class R, Class Y, Class R5 and Class R6. Class Y shares are available only to certain investors. Class A shares are sold with a front-end sales charge unless certain waiver criteria are met and under certain circumstances load waived shares may be subject to contingent deferred sales charges (“CDSC”). Class C shares are sold with a CDSC. Class R, Class Y, Class R5 and Class R6 shares are sold at net asset value.
The Fund is an investment company and accordingly follows the investment company accounting and reporting guidance in accordance with Financial Accounting Standards Board Accounting Standards Codification Topic 946, Financial Services — Investment Companies.
The following is a summary of the significant accounting policies followed by the Fund in the preparation of its financial statements.
| A. | Security Valuations — Securities, including restricted securities, are valued according to the following policy. |
Debt obligations (including convertible securities) and unlisted equities are fair valued using an evaluated quote provided by an independent pricing service. Evaluated quotes provided by the pricing service may be determined without exclusive reliance on quoted prices, and may reflect appropriate factors such as institution-size trading in similar groups of securities, developments related to specific securities, dividend rate (for unlisted equities), yield (for debt obligations), quality, type of issue, coupon rate (for debt obligations), maturity (for debt obligations), individual trading characteristics and other market data. Pricing services generally value debt obligations assuming orderly transactions of institutional round lot size, but a fund may hold or transact in the same securities in smaller, odd lot sizes. Odd lots often trade at lower prices than
33 Invesco Multi-Asset Income Fund
institutional round lots. Debt obligations are subject to interest rate and credit risks. In addition, all debt obligations involve some risk of default with respect to interest and/or principal payments.
A security listed or traded on an exchange (except convertible securities) is valued at its last sales price or official closing price as of the close of the customary trading session on the exchange where the security is principally traded, or lacking any sales or official closing price on a particular day, the security may be valued at the closing bid price on that day. Securities traded in the over-the-counter market are valued based on prices furnished by independent pricing services or market makers. When such securities are valued by an independent pricing service they may be considered fair valued. Futures contracts are valued at the final settlement price set by an exchange on which they are principally traded. Listed options are valued at the mean between the last bid and asked prices from the exchange on which they are principally traded. Options not listed on an exchange are valued by an independent source at the mean between the last bid and asked prices. For purposes of determining net asset value (“NAV”) per share, futures and option contracts generally are valued 15 minutes after the close of the customary trading session of the New York Stock Exchange (“NYSE”).
Investments in open-end and closed-end registered investment companies that do not trade on an exchange are valued at the end-of-day net asset value per share. Investments in open-end and closed-end registered investment companies that trade on an exchange are valued at the last sales price or official closing price as of the close of the customary trading session on the exchange where the security is principally traded.
Swap agreements are fair valued using an evaluated quote, if available, provided by an independent pricing service. Evaluated quotes provided by the pricing service are valued based on a model which may include end-of-day net present values, spreads, ratings, industry, company performance and returns of referenced assets. Centrally cleared swap agreements are valued at the daily settlement price determined by the relevant exchange or clearinghouse.
Foreign securities’ (including foreign exchange contracts) prices are converted into U.S. dollar amounts using the applicable exchange rates as of the close of the NYSE. If market quotations are available and reliable for foreign exchange-traded equity securities, the securities will be valued at the market quotations. Because trading hours for certain foreign securities end before the close of the NYSE, closing market quotations may become unreliable. If between the time trading ends on a particular security and the close of the customary trading session on the NYSE, events occur that the investment adviser determines are significant and make the closing price unreliable, the Fund may fair value the security. If the event is likely to have affected the closing price of the security, the security will be valued at fair value in good faith using procedures approved by the Board of Trustees. Adjustments to closing prices to reflect fair value may also be based on a screening process of an independent pricing service to indicate the degree of certainty, based on historical data, that the closing price in the principal market where a foreign security trades is not the current value as of the close of the NYSE. Foreign securities’ prices meeting the approved degree of certainty that the price is not reflective of current value will be priced at the indication of fair value from the independent pricing service. Multiple factors may be considered by the independent pricing service in determining adjustments to reflect fair value and may include information relating to sector indices, American Depositary Receipts and domestic and foreign index futures. Foreign securities may have additional risks including exchange rate changes, potential for sharply devalued currencies and high inflation, political and economic upheaval, the relative lack of issuer information, relatively low market liquidity and the potential lack of strict financial and accounting controls and standards.
Securities for which market prices are not provided by any of the above methods may be valued based upon quotes furnished by independent sources. The last bid price may be used to value equity securities. The mean between the last bid and asked prices is used to value debt obligations, including corporate loans.
Securities for which market quotations are not readily available or became unreliable are valued at fair value as determined in good faith by or under the supervision of the Trust’s officers following procedures approved by the Board of Trustees. Issuer specific events, market trends, bid/asked quotes of brokers and information providers and other market data may be reviewed in the course of making a good faith determination of a security’s fair value.
The Fund may invest in securities that are subject to interest rate risk, meaning the risk that the prices will generally fall as interest rates rise and, conversely, the prices will generally rise as interest rates fall. Specific securities differ in their sensitivity to changes in interest rates depending on their individual characteristics. Changes in interest rates may result in increased market volatility, which may affect the value and/or liquidity of certain Fund investments.
Valuations change in response to many factors including the historical and prospective earnings of the issuer, the value of the issuer’s assets, general economic conditions, interest rates, investor perceptions and market liquidity. Because of the inherent uncertainties of valuation, the values reflected in the financial statements may materially differ from the value received upon actual sale of those investments.
| B. | Securities Transactions and Investment Income — Securities transactions are accounted for on a trade date basis. Realized gains or losses on sales are computed on the basis of specific identification of the securities sold. Interest income (net of withholding tax, if any) is recorded on the accrual basis from settlement date. Bond premiums and discounts are amortized and/or accreted over the lives of the respective securities. Pay-in-kind income received in the form of securities in-lieu of cash is recorded as interest income. Paydown gains and losses on mortgage and asset-backed securities are recorded as adjustments to interest income. Dividend income (net of withholding tax, if any) is recorded on the ex-dividend date. |
The Fund may periodically participate in litigation related to Fund investments. As such, the Fund may receive proceeds from litigation settlements. Any proceeds received are included in the Statement of Operations as realized gain (loss) for investments no longer held and as unrealized gain (loss) for investments still held.
Brokerage commissions and mark ups are considered transaction costs and are recorded as an increase to the cost basis of securities purchased and/or a reduction of proceeds on a sale of securities. Such transaction costs are included in the determination of net realized and unrealized gain (loss) from investment securities reported in the Statement of Operations and the Statement of Changes in Net Assets and the net realized and unrealized gains (losses) on securities per share in the Financial Highlights. Transaction costs are included in the calculation of the Fund’s net asset value and, accordingly, they reduce the Fund’s total returns. These transaction costs are not considered operating expenses and are not reflected in net investment income reported in the Statement of Operations and the Statement of Changes in Net Assets, or the net investment income per share and the ratios of expenses and net investment income reported in the Financial Highlights, nor are they limited by any expense limitation arrangements between the Fund and the investment adviser.
The Fund allocates income and realized and unrealized capital gains and losses to a class based on the relative net assets of each class.
34 Invesco Multi-Asset Income Fund
The Fund recharacterizes distributions received from REIT investments based on information provided by the REIT into the following categories: ordinary income, long-term and short-term capital gains, and return of capital. If information is not available on a timely basis from the REIT, the recharacterization will be based on available information which may include the previous year’s allocation. If new or additional information becomes available from the REIT at a later date, a recharacterization will be made in the following year. The Fund records as dividend income the amount recharacterized as ordinary income and as realized gain the amount recharacterized as capital gain in the Statement of Operations, and the amount recharacterized as return of capital as a reduction of the cost of the related investment. These recharacterizations are reflected in the accompanying financial statements.
| C. | Country Determination — For the purposes of making investment selection decisions and presentation in the Schedule of Investments, the investment adviser may determine the country in which an issuer is located and/or credit risk exposure based on various factors. These factors include the laws of the country under which the issuer is organized, where the issuer maintains a principal office, the country in which the issuer derives 50% or more of its total revenues and the country that has the primary market for the issuer’s securities, as well as other criteria. Among the other criteria that may be evaluated for making this determination are the country in which the issuer maintains 50% or more of its assets, the type of security, financial guarantees and enhancements, the nature of the collateral and the sponsor organization. Country of issuer and/or credit risk exposure has been determined to be the United States of America, unless otherwise noted. |
| D. | Distributions — Distributions from net investment income, if any, are declared and paid monthly. Distributions from net realized capital gain, if any, are generally declared and paid annually and recorded on the ex-dividend date. The Fund may elect to treat a portion of the proceeds from redemptions as distributions for federal income tax purposes. |
| E. | Federal Income Taxes — The Fund intends to comply with the requirements of Subchapter M of the Internal Revenue Code of 1986, as amended (the “Internal Revenue Code”), necessary to qualify as a regulated investment company and to distribute substantially all of the Fund’s taxable earnings to shareholders. As such, the Fund will not be subject to federal income taxes on otherwise taxable income (including net realized capital gain) that is distributed to shareholders. Therefore, no provision for federal income taxes is recorded in the financial statements. |
The Fund recognizes the tax benefits of uncertain tax positions only when the position is more likely than not to be sustained. Management has analyzed the Fund’s uncertain tax positions and concluded that no liability for unrecognized tax benefits should be recorded related to uncertain tax positions. Management is not aware of any tax positions for which it is reasonably possible that the total amounts of unrecognized tax benefits will change materially in the next 12 months.
The Fund files tax returns in the U.S. Federal jurisdiction and certain other jurisdictions. Generally, the Fund is subject to examinations by such taxing authorities for up to three years after the filing of the return for the tax period.
| F. | Expenses — Fees provided for under the Rule 12b-1 plan of a particular class of the Fund are charged to the operations of such class. Transfer agency fees and expenses and other shareholder recordkeeping fees and expenses attributable to Class R5 and Class R6 are allocated to each share class based on relative net assets. Sub-accounting fees attributable to Class R5 are charged to the operations of the class. Transfer agency fees and expenses and other shareholder recordkeeping fees and expenses relating to all other classes are allocated among those classes based on relative net assets. All other expenses are allocated among the classes based on relative net assets. |
| G. | Accounting Estimates — The preparation of financial statements in conformity with accounting principles generally accepted in the United States of America (“GAAP”) requires management to make estimates and assumptions that affect the reported amounts of assets and liabilities at the date of the financial statements and the reported amounts of revenues and expenses during the reporting period including estimates and assumptions related to taxation. Actual results could differ from those estimates by a significant amount. In addition, the Fund monitors for material events or transactions that may occur or become known after the period-end date and before the date the financial statements are released to print. |
| H. | Indemnifications — Under the Trust’s organizational documents, each Trustee, officer, employee or other agent of the Trust is indemnified against certain liabilities that may arise out of the performance of their duties to the Fund. Additionally, in the normal course of business, the Fund enters into contracts, including the Fund’s servicing agreements, that contain a variety of indemnification clauses. The Fund’s maximum exposure under these arrangements is unknown as this would involve future claims that may be made against the Fund that have not yet occurred. The risk of material loss as a result of such indemnification claims is considered remote. |
| I. | Foreign Currency Translations — Foreign currency is valued at the close of the NYSE based on quotations posted by banks and major currency dealers. Portfolio securities and other assets and liabilities denominated in foreign currencies are translated into U.S. dollar amounts at date of valuation. Purchases and sales of portfolio securities (net of foreign taxes withheld on disposition) and income items denominated in foreign currencies are translated into U.S. dollar amounts on the respective dates of such transactions. The Fund does not separately account for the portion of the results of operations resulting from changes in foreign exchange rates on investments and the fluctuations arising from changes in market prices of securities held. The combined results of changes in foreign exchange rates and the fluctuation of market prices on investments (net of estimated foreign tax withholding) are included with the net realized and unrealized gain or loss from investments in the Statement of Operations. Reported net realized foreign currency gains or losses arise from (1) sales of foreign currencies, (2) currency gains or losses realized between the trade and settlement dates on securities transactions, and (3) the difference between the amounts of dividends, interest, and foreign withholding taxes recorded on the Fund’s books and the U.S. dollar equivalent of the amounts actually received or paid. Net unrealized foreign currency gains and losses arise from changes in the fair values of assets and liabilities, other than investments in securities at fiscal period end, resulting from changes in exchange rates. |
The Fund may invest in foreign securities, which may be subject to foreign taxes on income, gains on investments or currency repatriation, a portion of which may be recoverable. Foreign taxes, if any, are recorded based on the tax regulations and rates that exist in the foreign markets in which the Fund invests and are shown in the Statement of Operations.
| J. | Forward Foreign Currency Contracts — The Fund may engage in foreign currency transactions either on a spot (i.e. for prompt delivery and settlement) basis, or through forward foreign currency contracts, to manage or minimize currency or exchange rate risk. |
The Fund may also enter into forward foreign currency contracts for the purchase or sale of a security denominated in a foreign currency in order to “lock in” the U.S. dollar price of that security, or the Fund may also enter into forward foreign currency contracts that do not provide for physical settlement of the two currencies, but instead are settled by a single cash payment calculated as the difference between the agreed upon exchange rate and the spot rate at settlement based upon an agreed upon notional amount (non-deliverable forwards). The Fund will set aside liquid assets in an amount equal to the daily mark-to-market obligation for forward foreign currency contracts.
35 Invesco Multi-Asset Income Fund
A forward foreign currency contract is an obligation between two parties (“Counterparties”) to purchase or sell a specific currency for an agreed-upon price at a future date. The use of forward foreign currency contracts does not eliminate fluctuations in the price of the underlying securities the Fund owns or intends to acquire but establishes a rate of exchange in advance. Fluctuations in the value of these contracts are measured by the difference in the contract date and reporting date exchange rates and are recorded as unrealized appreciation (depreciation) until the contracts are closed. When the contracts are closed, realized gains (losses) are recorded. Realized and unrealized gains (losses) on the contracts are included in the Statement of Operations. The primary risks associated with forward foreign currency contracts include failure of the Counterparty to meet the terms of the contract and the value of the foreign currency changing unfavorably. These risks may be in excess of the amounts reflected in the Statement of Assets and Liabilities.
| K. | Futures Contracts — The Fund may enter into futures contracts to manage exposure to interest rate, equity and market price movements and/or currency risks. A futures contract is an agreement between Counterparties to purchase or sell a specified underlying security, currency or commodity (or delivery of a cash settlement price, in the case of an index future) for a fixed price at a future date. The Fund currently invests only in exchange-traded futures and they are standardized as to maturity date and underlying financial instrument. Initial margin deposits required upon entering into futures contracts are satisfied by the segregation of specific securities or cash as collateral at the futures commission merchant (broker). During the period the futures contracts are open, changes in the value of the contracts are recognized as unrealized gains or losses by recalculating the value of the contracts on a daily basis. Subsequent or variation margin payments are received or made depending upon whether unrealized gains or losses are incurred. These amounts are reflected as receivables or payables on the Statement of Assets and Liabilities. When the contracts are closed or expire, the Fund recognizes a realized gain or loss equal to the difference between the proceeds from, or cost of, the closing transaction and the Fund’s basis in the contract. The net realized gain (loss) and the change in unrealized gain (loss) on futures contracts held during the period is included on the Statement of Operations. The primary risks associated with futures contracts are market risk and the absence of a liquid secondary market. If the Fund were unable to liquidate a futures contract and/or enter into an offsetting closing transaction, the Fund would continue to be subject to market risk with respect to the value of the contracts and continue to be required to maintain the margin deposits on the futures contracts. Futures contracts have minimal Counterparty risk since the exchange’s clearinghouse, as Counterparty to all exchange-traded futures, guarantees the futures against default. Risks may exceed amounts recognized in the Statement of Assets and Liabilities. |
| L. | Swap Agreements — The Fund may enter into various swap transactions, including interest rate, total return, index, currency and credit default swap contracts (“CDS”) for investment purposes or to manage interest rate, currency or credit risk. Such transactions are agreements between Counterparties. A swap agreement may be negotiated bilaterally and traded over-the-counter (“OTC”) between two parties (“uncleared/OTC”) or, in some instances, must be transacted through a future commission merchant (“FCM”) and cleared through a clearinghouse that serves as a central Counterparty (“centrally cleared swap”). These agreements may contain among other conditions, events of default and termination events, and various covenants and representations such as provisions that require the Fund to maintain a pre-determined level of net assets, and/or provide limits regarding the decline of the Fund’s NAV over specific periods of time. If the Fund were to trigger such provisions and have open derivative positions at that time, the Counterparty may be able to terminate such agreement and request immediate payment in an amount equal to the net liability positions, if any. |
Interest rate, total return, index, and currency swap agreements are two-party contracts entered into primarily to exchange the returns (or differentials in rates of returns) earned or realized on particular predetermined investments or instruments. The gross returns to be exchanged or “swapped” between the parties are calculated with respect to a notional amount, i.e., the return on or increase in value of a particular dollar amount invested at a particular interest rate or return of an underlying asset, in a particular foreign currency, or in a “basket” of securities representing a particular index.
In a centrally cleared swap, the Fund’s ultimate Counterparty is a central clearinghouse. The Fund initially will enter into centrally cleared swaps through an executing broker. When a fund enters into a centrally cleared swap, it must deliver to the central Counterparty (via the FCM) an amount referred to as “initial margin.” Initial margin requirements are determined by the central Counterparty, but an FCM may require additional initial margin above the amount required by the central Counterparty. Initial margin deposits required upon entering into centrally cleared swaps are satisfied by cash or securities as collateral at the FCM. Securities deposited as initial margin are designated on the Schedule of Investments and cash deposited is recorded on the Statement of Assets and Liabilities. During the term of a cleared swap agreement, a “variation margin” amount may be required to be paid by the Fund or may be received by the Fund, based on the daily change in price of the underlying reference instrument subject to the swap agreement and is recorded as a receivable or payable for variation margin in the Statement of Assets and Liabilities until the centrally cleared swap is terminated at which time a realized gain or loss is recorded.
A CDS is an agreement between Counterparties to exchange the credit risk of an issuer. A buyer of a CDS is said to buy protection by paying a fixed payment over the life of the agreement and in some situations an upfront payment to the seller of the CDS. If a defined credit event occurs (such as payment default or bankruptcy), the Fund as a protection buyer would cease paying its fixed payment, the Fund would deliver eligible bonds issued by the reference entity to the seller, and the seller would pay the full notional value, or the “par value”, of the referenced obligation to the Fund. A seller of a CDS is said to sell protection and thus would receive a fixed payment over the life of the agreement and an upfront payment, if applicable. If a credit event occurs, the Fund as a protection seller would cease to receive the fixed payment stream, the Fund would pay the buyer “par value” or the full notional value of the referenced obligation, and the Fund would receive the eligible bonds issued by the reference entity. In turn, these bonds may be sold in order to realize a recovery value. Alternatively, the seller of the CDS and its Counterparty may agree to net the notional amount and the market value of the bonds and make a cash payment equal to the difference to the buyer of protection. If no credit event occurs, the Fund receives the fixed payment over the life of the agreement. As the seller, the Fund would effectively add leverage to its portfolio because, in addition to its total net assets, the Fund would be subject to investment exposure on the notional amount of the CDS. In connection with these agreements, cash and securities may be identified as collateral in accordance with the terms of the respective swap agreements to provide assets of value and recourse in the event of default under the swap agreement or bankruptcy/insolvency of a party to the swap agreement. If a Counterparty becomes bankrupt or otherwise fails to perform its obligations due to financial difficulties, the Fund may experience significant delays in obtaining any recovery in a bankruptcy or other reorganization proceeding. The Fund may obtain only limited recovery or may obtain no recovery in such circumstances. The Fund’s maximum risk of loss from Counterparty risk, either as the protection seller or as the protection buyer, is the value of the contract. The risk may be mitigated by having a master netting arrangement between the Fund and the Counterparty and by the designation of collateral by the Counterparty to cover the Fund’s exposure to the Counterparty.
36 Invesco Multi-Asset Income Fund
Implied credit spreads represent the current level at which protection could be bought or sold given the terms of the existing CDS contract and serve as an indicator of the current status of the payment/performance risk of the CDS. An implied spread that has widened or increased since entry into the initial contract may indicate a deteriorating credit profile and increased risk of default for the reference entity. A declining or narrowing spread may indicate an improving credit profile or decreased risk of default for the reference entity. Alternatively, credit spreads may increase or decrease reflecting the general tolerance for risk in the credit markets.
An interest rate swap is an agreement between Counterparties pursuant to which the parties exchange a floating rate payment for a fixed rate payment based on a specified notional amount.
Changes in the value of centrally cleared and OTC swap agreements are recognized as unrealized gains (losses) in the Statement of Operations by “marking to market” on a daily basis to reflect the value of the swap agreement at the end of each trading day. Payments received or paid at the beginning of the agreement are reflected as such on the Statement of Assets and Liabilities and may be referred to as upfront payments. The Fund accrues for the fixed payment stream and amortizes upfront payments, if any, on swap agreements on a daily basis with the net amount, recorded as a component of realized gain (loss) on the Statement of Operations. A liquidation payment received or made at the termination of a swap agreement is recorded as realized gain (loss) on the Statement of Operations. The Fund segregates cash or liquid securities having a value at least equal to the amount of the potential obligation of a Fund under any swap transaction. Cash held as collateral is recorded as deposits with brokers on the Statement of Assets and Liabilities. Entering into these agreements involves, to varying degrees, lack of liquidity and elements of credit, market, and Counterparty risk in excess of amounts recognized on the Statement of Assets and Liabilities. Such risks involve the possibility that a swap is difficult to sell or liquidate; the Counterparty does not honor its obligations under the agreement and unfavorable interest rates and market fluctuations. It is possible that developments in the swaps market, including potential government regulation, could adversely affect the Fund’s ability to terminate existing swap agreements or to realize amounts to be received under such agreements. A short position in a security poses more risk than holding the same security long. As there is no limit on how much the price of the security can increase, the Fund’s exposure is unlimited.
Notional amounts of each individual credit default swap agreement outstanding as of October 31, 2017 for which the Fund is the seller of protection are disclosed in the open swap agreements table. These potential amounts would be partially offset by any recovery values of the respective referenced obligations, upfront payments received upon entering into the agreement, or net amounts received from the settlement of buy protection credit default swap agreements entered into by the Fund for the same referenced entity or entities.
| M. | Other Risks — The Fund may invest in lower-quality debt securities, i.e., “junk bonds”. Investments in lower-rated securities or unrated securities of comparable quality tend to be more sensitive to economic conditions than higher rated securities. Junk bonds involve a greater risk of default by the issuer because such securities are generally unsecured and are often subordinated to other creditors’ claim. |
| N. | Leverage Risk — Leverage exists when the Fund can lose more than it originally invests because it purchases or sells an instrument or enters into a transaction without investing an amount equal to the full economic exposure of the instrument or transaction. |
| O. | Collateral — To the extent the Fund has designated or segregated a security as collateral and that security is subsequently sold, it is the Fund’s practice to replace such collateral no later than the next business day. |
NOTE 2—Advisory Fees and Other Fees Paid to Affiliates
The Trust has entered into a master investment advisory agreement with Invesco Advisers, Inc. (the “Adviser” or “Invesco”). Under the terms of the investment advisory agreement, the Fund accrues daily and pays monthly an advisory fee to the Adviser based on the annual rate of the Fund’s average daily net assets as follows:
Effective January 1, 2017, the Fund pays an advisory fee to the Adviser based on the annual rate of the Fund’s average daily net assets as follows:
| | | | |
| Average Daily Net Assets | | Rate | |
First $500 million | | | 0.50% | |
Next $500 million | | | 0.45% | |
Next $500 million | | | 0.40% | |
Over $1.5 billion | | | 0.39% | |
Prior to January 1, 2017, the Fund had paid an advisory fee to the Adviser based on the annual rate of the Fund’s average daily net assets as follows:
| | | | |
| Average Daily Net Assets | | Rate | |
First $500 million | | | 0.65% | |
Next $500 million | | | 0.60% | |
Next $500 million | | | 0.55% | |
Over $1.5 billion | | | 0.54% | |
For the year ended October 31, 2017, the effective advisory fees incurred by the Fund was 0.51%.
Under the terms of a master sub-advisory agreement between the Adviser and each of Invesco Asset Management Deutschland GmbH, Invesco Asset Management Limited, Invesco Asset Management (Japan) Limited, Invesco Hong Kong Limited, Invesco Senior Secured Management, Inc. and Invesco Canada Ltd. and separate sub-advisory agreements with Invesco PowerShares Capital Management LLC and Invesco Asset Management (India) Private Limited (collectively, the “Affiliated Sub-Advisers”) the Adviser, not the Fund, will pay 40% of the fees paid to the Adviser to any such Affiliated Sub-Adviser(s) that provide(s) discretionary investment management services to the Fund based on the percentage of assets allocated to such Affiliated Sub-Adviser(s).
Effective January 1, 2017, the Adviser has contractually agreed, through at least February 28, 2019, to waive advisory fees and/or reimburse expenses of all shares to the extent necessary to limit total annual fund operating expenses after fee waiver and/or expense reimbursement (excluding certain items discussed below) of Class A, Class C, Class R, Class Y, Class R5 and Class R6 shares to 0.85%, 1.60%, 1.10%, 0.60%,
37 Invesco Multi-Asset Income Fund
0.60% and 0.60%, respectively, of the Fund’s average daily net assets (the “expense limits”). Prior to January 1, 2017, the Adviser had contractually agreed to waive advisory fees and/or reimburse expenses of all shares to the extent necessary to limit total annual fund operating expenses after fee waiver and/or expense reimbursement (excluding certain items discussed below) of Class A, Class C, Class R, Class Y, Class R5 and Class R6 shares to 1.05%, 1.80%, 1.30%, 0.80%, 0.80% and 0.80%, respectively, of the Fund’s average daily net assets. In determining the Adviser’s obligation to waive advisory fees and/or reimburse expenses, the following expenses are not taken into account, and could cause the total annual fund operating expenses after fee waiver and/or expense reimbursement to exceed the numbers reflected above: (1) interest; (2) taxes; (3) dividend expense on short sales; (4) extraordinary or non-routine items, including litigation expenses; and (5) expenses that the Fund has incurred but did not actually pay because of an expense offset arrangement. Unless Invesco continues the fee waiver agreement, it will terminate on February 28, 2019. During its term, the fee waiver agreement cannot be terminated or amended to increase the expense limits or reduce the advisory fee waiver without approval of the Board of Trustees.
Further, the Adviser has contractually agreed, through at least June 30, 2019, to waive the advisory fee payable by the Fund in an amount equal to 100% of the net advisory fees the Adviser receives from the affiliated money market funds on investments by the Fund of uninvested cash in such affiliated money market funds.
For the year ended October 31, 2017, the Adviser waived advisory fees of $299,551 and reimbursed class level expenses of $152,248, $53,696, $1,292, $181,296, $8 and $666 of Class A, Class C, Class R, Class Y, Class R5 and Class R6 shares, respectively.
The Trust has entered into a master administrative services agreement with Invesco pursuant to which the Fund has agreed to pay Invesco for certain administrative costs incurred in providing accounting services to the Fund. For the year ended October 31, 2017, expenses incurred under the agreement are shown in the Statement of Operations as Administrative services fees.
The Trust has entered into a transfer agency and service agreement with Invesco Investment Services, Inc. (“IIS”) pursuant to which the Fund has agreed to pay IIS a fee for providing transfer agency and shareholder services to the Fund and reimburse IIS for certain expenses incurred by IIS in the course of providing such services. IIS may make payments to intermediaries that provide omnibus account services, sub-accounting services and/or networking services. All fees payable by IIS to intermediaries that provide omnibus account services or sub-accounting services are charged back to the Fund, subject to certain limitations approved by the Trust’s Board of Trustees. For the year ended October 31, 2017, expenses incurred under the agreement are shown in the Statement of Operations as Transfer agent fees.
The Trust has entered into master distribution agreements with Invesco Distributors, Inc. (“IDI”) to serve as the distributor for the Class A, Class C, Class R, Class Y, Class R5 and Class R6 shares of the Fund. The Trust has adopted plans pursuant to Rule 12b-1 under the 1940 Act with respect to the Fund’s Class A, Class C and Class R shares (collectively the “Plans”). The Fund, pursuant to the Plans, pays IDI compensation at the annual rate of 0.25% of the Fund’s average daily net assets of Class A shares, 1.00% of the average daily net assets of Class C shares and 0.50% of the average daily net assets of Class R shares. The fees are accrued daily and paid monthly. Of the Plan payments, up to 0.25% of the average daily net assets of each class of shares may be paid to furnish continuing personal shareholder services to customers who purchase and own shares of such classes. Any amounts not paid as a service fee under the Plans would constitute an asset-based sales charge. Rules of the Financial Industry Regulatory Authority (“FINRA”) impose a cap on the total sales charges, including asset-based sales charges, that may be paid by any class of shares of the Fund. For the year ended October 31, 2017, expenses incurred under the Plans are shown in the Statement of Operations as Distribution fees.
Front-end sales commissions and CDSC (collectively, the “sales charges”) are not recorded as expenses of the Fund. Front-end sales commissions are deducted from proceeds from the sales of Fund shares prior to investment in Class A shares of the Fund. CDSC are deducted from redemption proceeds prior to remittance to the shareholder. During the year ended October 31, 2017, IDI advised the Fund that IDI retained $111,254 in front-end sales commissions from the sale of Class A shares and $4,334 and $6,559 from Class A and Class C shares, respectively, for CDSC imposed upon redemptions by shareholders.
Certain officers and trustees of the Trust are officers and directors of the Adviser, IIS and/or IDI.
NOTE 3—Additional Valuation Information
GAAP defines fair value as the price that would be received to sell an asset or paid to transfer a liability in an orderly transaction between market participants at the measurement date, under current market conditions. GAAP establishes a hierarchy that prioritizes the inputs to valuation methods, giving the highest priority to readily available unadjusted quoted prices in an active market for identical assets (Level 1) and the lowest priority to significant unobservable inputs (Level 3), generally when market prices are not readily available or are unreliable. Based on the valuation inputs, the securities or other investments are tiered into one of three levels. Changes in valuation methods may result in transfers in or out of an investment’s assigned level:
| | Level 1 — | Prices are determined using quoted prices in an active market for identical assets. |
| | Level 2 — | Prices are determined using other significant observable inputs. Observable inputs are inputs that other market participants may use in pricing a security. These may include quoted prices for similar securities, interest rates, prepayment speeds, credit risk, yield curves, loss severities, default rates, discount rates, volatilities and others. |
| | Level 3 — | Prices are determined using significant unobservable inputs. In situations where quoted prices or observable inputs are unavailable (for example, when there is little or no market activity for an investment at the end of the period), unobservable inputs may be used. Unobservable inputs reflect the Fund’s own assumptions about the factors market participants would use in determining fair value of the securities or instruments and would be based on the best available information. |
38 Invesco Multi-Asset Income Fund
The following is a summary of the tiered valuation input levels, as of October 31, 2017. The level assigned to the securities valuations may not be an indication of the risk or liquidity associated with investing in those securities. Because of the inherent uncertainties of valuation, the values reflected in the financial statements may materially differ from the value received upon actual sale of those investments.
The Fund’s policy is to recognize transfers in and out of the valuation levels as of the end of the reporting period. During the year ended October 31, 2017, there were no material transfers between valuation levels.
| | | | | | | | | | | | | | | | |
| | | Level 1 | | | Level 2 | | | Level 3 | | | Total | |
U.S. Dollar Denominated Bonds & Notes | | $ | — | | | $ | 266,233,632 | | | $ | — | | | $ | 266,233,632 | |
Preferred Stocks | | | 139,037,256 | | | | 1,961,954 | | | | — | | | | 140,999,210 | |
Common Stocks & Other Equity Interests | | | 94,445,990 | | | | — | | | | — | | | | 94,445,990 | |
U.S. Treasury Securities | | | — | | | | 54,743,585 | | | | — | | | | 54,743,585 | |
Exchange-Traded Notes | | | 53,639,190 | | | | — | | | | — | | | | 53,639,190 | |
Non-U.S. Dollar Denominated Bonds & Notes | | | — | | | | 1,646,400 | | | | — | | | | 1,646,400 | |
Variable Rate Senior Loan Interests | | | — | | | | 780,219 | | | | — | | | | 780,219 | |
Money Market Funds | | | 34,926,390 | | | | — | | | | — | | | | 34,926,390 | |
| | | | 322,048,826 | | | | 325,365,790 | | | | — | | | | 647,414,616 | |
Futures Contracts* | | | 4,802,131 | | | | — | | | | — | | | | 4,802,131 | |
Forward Foreign Currency Contracts* | | | — | | | | (7,930 | ) | | | — | | | | (7,930 | ) |
Swap Agreements* | | | — | | | | 119,180 | | | | — | | | | 119,180 | |
Total Investments | | $ | 326,850,957 | | | $ | 325,477,040 | | | $ | — | | | $ | 652,327,997 | |
| * | Unrealized appreciation (depreciation). |
NOTE 4—Derivative Investments
The Fund may enter into an International Swaps and Derivatives Association Master Agreement (“ISDA Master Agreement”) under which a Fund may trade OTC derivatives. An OTC transaction entered into under an ISDA Master Agreement typically involves a collateral posting arrangement, payment netting provisions and close-out netting provisions. These netting provisions allow for reduction of credit risk through netting of contractual obligations. The enforceability of the netting provisions of the ISDA Master Agreement depends on the governing law of the ISDA Master Agreement, among other factors.
For financial reporting purposes, the Fund does not offset OTC derivative assets or liabilities that are subject to ISDA Master Agreements in the Statement of Assets and Liabilities.
Value of Derivative Investments at Period-End
The table below summarizes the value of the Fund’s derivative investments, detailed by primary risk exposure, held as of October 31, 2017:
| | | | | | | | | | | | | | | | | | | | |
| | | Value | |
| Derivative Assets | | Credit
Risk | | | Currency
Risk | | | Equity
Risk | | | Interest
Rate Risk | | | Total | |
Unrealized appreciation on futures contracts — Exchange-Traded(a) | | $ | — | | | $ | — | | | $ | 4,869,610 | | | $ | 138,287 | | | $ | 5,007,897 | |
Unrealized appreciation on swap agreements — Centrally Cleared(a) | | | 119,180 | | | | — | | | | — | | | | — | | | | 119,180 | |
Unrealized appreciation on forward foreign currency contracts outstanding | | | — | | | | 12,237 | | | | — | | | | — | | | | 12,237 | |
Total Derivative Assets | | | 119,180 | | | | 12,237 | | | | 4,869,610 | | | | 138,287 | | | | 5,139,314 | |
Derivatives not subject to master netting agreements | | | (119,180 | ) | | | — | | | | (4,869,610 | ) | | | (138,287 | ) | | | (5,127,077 | ) |
Total Derivative Assets subject to master netting agreements | | $ | — | | | $ | 12,237 | | | $ | — | | | $ | — | | | $ | 12,237 | |
| |
| | | Value | |
| Derivative Liabilities | | Credit
Risk | | | Currency
Risk | | | Equity
Risk | | | Interest
Rate Risk | | | Total | |
Unrealized depreciation on futures contracts — Exchange-Traded(a) | | $ | — | | | $ | — | | | $ | (12,393 | ) | | $ | (193,373 | ) | | $ | (205,766 | ) |
Unrealized depreciation on forward foreign currency contracts outstanding | | | — | | | | (20,167 | ) | | | — | | | | — | | | | (20,167 | ) |
Total Derivative Liabilities | | | — | | | | (20,167 | ) | | | (12,393 | ) | | | (193,373 | ) | | | (225,933 | ) |
Derivatives not subject to master netting agreements | | | — | | | | — | | | | 12,393 | | | | 193,373 | | | | 205,766 | |
Total Derivative Liabilities subject to master netting agreements | | $ | — | | | $ | (20,167 | ) | | $ | — | | | $ | — | | | $ | (20,167 | ) |
| (a) | The daily variation margin receivable (payable) at period-end is recorded in the Statement of Assets and Liabilities. |
39 Invesco Multi-Asset Income Fund
Offsetting Assets and Liabilities
The table below reflects the Fund’s exposure to Counterparties subject to either an ISDA Master Agreement or other agreement for OTC derivative transactions as of October 31, 2017.
| | | | | | | | | | | | | | | | | | | | | | | | |
| | | Financial
Derivative
Assets | | | Financial
Derivative
Liabilities | | | | | | Collateral
(Received)/Pledged | | | | |
| Counterparty | | Forward Foreign
Currency
Contracts | | | Forward
Foreign
Currency
Contracts | | | Net Value of
Derivatives | | | Non-Cash | | | Cash | | | Net
Amount | |
Barclays Bank PLC | | $ | 214 | | | $ | — | | | $ | 214 | | | $ | — | | | $ | — | | | $ | 214 | |
Citigroup Global Markets Inc. | | | — | | | | (17,039 | ) | | | (17,039 | ) | | | — | | | | — | | | | (17,039 | ) |
Deutsche Bank Securities Inc. | | | 12,023 | | | | — | | | | 12,023 | | | | — | | | | — | | | | 12,023 | |
Goldman Sachs International | | | — | | | | (3,128 | ) | | | (3,128 | ) | | | — | | | | — | | | | (3,128 | ) |
Total | | $ | 12,237 | | | $ | (20,167 | ) | | $ | (7,930 | ) | | $ | — | | | $ | — | | | $ | (7,930 | ) |
Effect of Derivative Investments for the year ended October 31, 2017
The table below summarizes the gains (losses) on derivative investments, detailed by primary risk exposure, recognized in earnings during the period:
| | | | | | | | | | | | | | | | | | | | |
| | | Location of Gain (Loss) on Statement of Operations | |
| | Credit
Risk | | | Currency
Risk | | | Equity
Risk | | | Interest
Rate Risk | | | Total | |
Realized Gain (Loss): | | | | | | | | | | | | | | | | | | | | |
Forward foreign currency contracts | | $ | — | | | $ | (37,157 | ) | | $ | — | | | $ | — | | | $ | (37,157 | ) |
Futures contracts | | | — | | | | — | | | | 8,688,524 | | | | (1,167,953 | ) | | | 7,520,571 | |
Swap agreements | | | 252,372 | | | | — | | | | — | | | | — | | | | 252,372 | |
Change in Net Unrealized Appreciation (Depreciation): | | | | | | | | | | | | | | | | | | | | |
Forward foreign currency contracts | | | — | | | | (59,546 | ) | | | — | | | | — | | | | (59,546 | ) |
Futures contracts | | | — | | | | — | | | | 4,731,182 | | | | (243,834 | ) | | | 4,487,348 | |
Swap agreements | | | 86,727 | | | | — | | | | — | | | | — | | | | 86,727 | |
Total | | $ | 339,099 | | | $ | (96,703 | ) | | $ | 13,419,706 | | | $ | (1,411,787 | ) | | $ | 12,250,315 | |
The table below summarizes the twelve month average notional value of forward foreign currency contracts and futures contracts and the nine month average notional value of swap agreements outstanding during the period.
| | | | | | | | | | | | |
| | | Forward Foreign
Currency Contracts | | | Futures
Contracts | | | Swap
Agreements | |
Average notional value | | $ | 1,574,873 | | | $ | 114,503,648 | | | $ | 3,858,556 | |
NOTE 5—Security Transactions with Affiliated Funds
The Fund is permitted to purchase or sell securities from or to certain other Invesco Funds under specified conditions outlined in procedures adopted by the Board of Trustees of the Trust. The procedures have been designed to ensure that any purchase or sale of securities by the Fund from or to another fund or portfolio that is or could be considered an affiliate by virtue of having a common investment adviser (or affiliated investment advisers), common Trustees and/or common officers complies with Rule 17a-7 of the 1940 Act. Further, as defined under the procedures, each transaction is effected at the current market price. Pursuant to these procedures, for the year ended October 31, 2017, the Fund engaged in securities sales of $90,781, which resulted in net realized gains (losses) of $(2,979).
NOTE 6—Expense Offset Arrangement(s)
The expense offset arrangement is comprised of transfer agency credits which result from balances in demand deposit accounts used by the transfer agent for clearing shareholder transactions. For the year ended October 31, 2017, the Fund received credits from this arrangement, which resulted in the reduction of the Fund’s total expenses of $1,134.
NOTE 7—Trustees’ and Officers’ Fees and Benefits
Trustees’ and Officers’ Fees and Benefits include amounts accrued by the Fund to pay remuneration to certain Trustees and Officers of the Fund. Trustees have the option to defer compensation payable by the Fund, and Trustees’ and Officers’ Fees and Benefits also include amounts accrued by the Fund to fund such deferred compensation amounts. Those Trustees who defer compensation have the option to select various Invesco Funds in which their deferral accounts shall be deemed to be invested. Finally, certain current Trustees were eligible to participate in a retirement plan that provided for benefits to be paid upon retirement to Trustees over a period of time based on the number of years of service. The Fund may have certain former Trustees who also participate in a retirement plan and receive benefits under such plan. Trustees’ and Officers’ Fees and Benefits include amounts accrued by the Fund to fund such retirement benefits. Obligations under the deferred compensation and retirement plans represent unsecured claims against the general assets of the Fund.
40 Invesco Multi-Asset Income Fund
NOTE 8—Cash Balances
The Fund is permitted to temporarily carry a negative or overdrawn balance in its account with State Street Bank and Trust Company, the custodian bank. Such balances, if any at period-end, are shown in the Statement of Assets and Liabilities under the payable caption Amount due custodian. To compensate the custodian bank for such overdrafts, the overdrawn Fund may either (1) leave funds as a compensating balance in the account so the custodian bank can be compensated by earning the additional interest; or (2) compensate by paying the custodian bank at a rate agreed upon by the custodian bank and Invesco, not to exceed the contractually agreed upon rate.
NOTE 9—Distributions to Shareholders and Tax Components of Net Assets
Tax Character of Distributions to Shareholders Paid During the Fiscal Years Ended October 31, 2017 and 2016:
| | | | | | | | |
| | | 2017 | | | 2016 | |
Ordinary income | | $ | 17,052,546 | | | $ | 7,248,908 | |
Tax Components of Net Assets at Period-End:
| | | | |
| | | 2017 | |
Undistributed ordinary income | | $ | 2,432,277 | |
Undistributed long-term gain | | | 4,502,172 | |
Net unrealized appreciation — investments | | | 2,542,543 | |
Net unrealized appreciation — foreign currencies | | | 454 | |
Temporary book/tax differences | | | (28,332 | ) |
Shares of beneficial interest | | | 647,671,396 | |
Total net assets | | $ | 657,120,510 | |
The difference between book-basis and tax-basis unrealized appreciation (depreciation) is due to differences in the timing of recognition of gains and losses on investments for tax and book purposes. The Fund’s net unrealized appreciation difference is attributable primarily to wash sales and bond premiums.
The temporary book/tax differences are a result of timing differences between book and tax recognition of income and/or expenses. The Fund’s temporary book/tax differences are the result of the trustee deferral of compensation and retirement plan benefits.
Capital loss carryforward is calculated and reported as of a specific date. Results of transactions and other activity after that date may affect the amount of capital loss carryforward actually available for the Fund to utilize. The ability to utilize capital loss carryforwards in the future may be limited under the Internal Revenue Code and related regulations based on the results of future transactions.
The Fund does not have a capital loss carryforward as of October 31, 2017.
NOTE 10—Investment Transactions
The aggregate amount of investment securities (other than short-term securities, U.S. Treasury obligations and money market funds, if any) purchased and sold by the Fund during the year ended October 31, 2017 was $512,889,248 and $118,008,255, respectively. During the same period, purchases and sales of U.S. Treasury obligations were $58,456,126 and $20,287,595, respectively. Cost of investments, including any derivatives, on a tax basis includes the adjustments for financial reporting purposes as of the most recently completed federal income tax reporting period-end.
| | | | |
| Unrealized Appreciation (Depreciation) of Investments on a Tax Basis | |
Aggregate unrealized appreciation of investments | | $ | 11,938,903 | |
Aggregate unrealized (depreciation) of investments | | | (9,396,360 | ) |
Net unrealized appreciation of investments | | $ | 2,542,543 | |
Cost of investments for tax purposes is $650,112,403.
NOTE 11—Reclassification of Permanent Differences
Primarily as a result of differing book/tax treatment of bond premium amortization, foreign currency transactions, futures contracts and swap agreements income, on October 31, 2017, undistributed net investment income was decreased by $124,497 undistributed net realized gain was increased by $189,149 and shares of beneficial interest was decreased by $64,652. This reclassification had no effect on the net assets of the Fund.
41 Invesco Multi-Asset Income Fund
NOTE 12—Share Information
| | | | | | | | | | | | | | | | |
| | | Summary of Share Activity | |
| | | Years ended October 31, | |
| | | 2017(a) | | | 2016 | |
| | | Shares | | | Amount | | | Shares | | | Amount | |
Sold: | | | | | | | | | | | | | | | | |
Class A | | | 14,849,703 | | | $ | 161,218,349 | | | | 5,267,027 | | | $ | 55,774,372 | |
Class C | | | 4,808,469 | | | | 52,215,702 | | | | 973,923 | | | | 10,215,089 | |
Class R | | | 107,694 | | | | 1,162,484 | | | | 35,654 | | | | 374,579 | |
Class Y | | | 31,062,629 | | | | 338,133,338 | | | | 2,466,882 | | | | 25,860,783 | |
Class R5 | | | 1,574 | | | | 16,577 | | | | 838 | | | | 9,002 | |
Class R6 | | | 628,573 | | | | 6,736,724 | | | | 949,592 | | | | 9,507,580 | |
| | | | |
Issued as reinvestment of dividends: | | | | | | | | | | | | | | | | |
Class A | | | 466,849 | | | | 5,048,168 | | | | 250,608 | | | | 2,538,721 | |
Class C | | | 119,493 | | | | 1,292,176 | | | | 64,533 | | | | 650,905 | |
Class R | | | 4,152 | | | | 44,882 | | | | 1,661 | | | | 16,789 | |
Class Y | | | 521,000 | | | | 5,680,154 | | | | 71,597 | | | | 730,390 | |
Class R5 | | | 72 | | | | 771 | | | | 6 | | | | 62 | |
Class R6 | | | 248,948 | | | | 2,679,432 | | | | 275,154 | | | | 2,746,085 | |
| | | | |
Reacquired: | | | | | | | | | | | | | | | | |
Class A | | | (6,642,263 | ) | | | (71,476,790 | ) | | | (2,020,290 | ) | | | (20,575,526 | ) |
Class C | | | (488,324 | ) | | | (5,275,007 | ) | | | (430,535 | ) | | | (4,364,788 | ) |
Class R | | | (16,941 | ) | | | (183,979 | ) | | | (19,673 | ) | | | (196,442 | ) |
Class Y | | | (4,673,930 | ) | | | (50,697,928 | ) | | | (816,554 | ) | | | (8,238,126 | ) |
Class R5 | | | (757 | ) | | | (8,168 | ) | | | — | | | | — | |
Class R6(b) | | | (27,712 | ) | | | (296,849 | ) | | | (3,221,075 | ) | | | (30,673,762 | ) |
Net increase in share activity | | | 40,969,229 | | | $ | 446,290,036 | | | | 3,849,348 | | | $ | 44,375,713 | |
| (a) | There are entities that are record owners of more than 5% of the outstanding shares of the Fund and in the aggregate own 69% of the outstanding shares of the Fund. IDI has an agreement with these entities to sell Fund shares. The Fund, Invesco and/or Invesco affiliates may make payments to these entities, which are considered to be related to the Fund, for providing services to the Fund, Invesco and/or Invesco affiliates including but not limited to services such as securities brokerage, distribution, third party record keeping and account servicing. The Fund has no knowledge as to whether all or any portion of the shares owned of record by these entities are also owned beneficially. |
| | In addition, 9% of the outstanding shares of the Fund are owned by the Adviser or an affiliate of the Adviser. |
| (b) | On February 18, 2016, 3,221,845 Class R6 shares valued at $30,671,968 were redeemed by affiliated mutual funds. |
42 Invesco Multi-Asset Income Fund
NOTE 13—Financial Highlights
The following schedule presents financial highlights for a share of the Fund outstanding throughout the periods indicated.
| | | | | | | | | | | | | | | | | | | | | | | | | | | | | | | | | | | | | | | | | | | | | | | | | | | | | | | | |
| | | Net asset value, beginning of period | | | Net investment income(a) | | | Net gains (losses)
on securities (both realized and unrealized) | | | Total from investment operations | | | Dividends from net investment income | | | Distributions from net realized
gains | | | Total distributions | | | Net asset value, end of period | | | Total return(b) | | | Net assets, end of period (000’s omitted) | | | Ratio of expenses to average net assets with fee waivers and/or expenses absorbed | | | Ratio of expenses to average net
assets without fee waivers and/or expenses absorbed | | | Ratio of net investment income to average net assets | | | Portfolio turnover(c) | |
Class A | |
Year ended 10/31/17 | | $ | 10.51 | | | $ | 0.49 | | | $ | 0.50 | | | $ | 0.99 | | | $ | (0.49 | ) | | $ | — | | | $ | (0.49 | ) | | $ | 11.01 | | | | 9.64 | % | | $ | 191,395 | | | | 0.86 | %(d) | | | 1.06 | %(d) | | | 4.53 | %(d) | | | 40 | % |
Year ended 10/31/16 | | | 10.09 | | | | 0.47 | | | | 0.45 | | | | 0.92 | | | | (0.50 | ) | | | — | | | | (0.50 | ) | | | 10.51 | | | | 9.44 | | | | 91,585 | | | | 1.04 | | | | 1.28 | | | | 4.60 | | | | 101 | |
Year ended 10/31/15 | | | 10.37 | | | | 0.46 | | | | (0.25 | ) | | | 0.21 | | | | (0.49 | ) | | | — | | | | (0.49 | ) | | | 10.09 | | | | 2.02 | | | | 52,613 | | | | 0.99 | | | | 1.27 | | | | 4.52 | | | | 120 | |
Year ended 10/31/14 | | | 10.04 | | | | 0.48 | | | | 0.37 | | | | 0.85 | | | | (0.52 | ) | | | — | | | | (0.52 | ) | | | 10.37 | | | | 8.66 | | | | 42,104 | | | | 0.88 | | | | 1.28 | | | | 4.69 | | | | 89 | |
Year ended 10/31/13 | | | 10.83 | | | | 0.50 | | | | (0.58 | ) | | | (0.08 | ) | | | (0.55 | ) | | | (0.16 | ) | | | (0.71 | ) | | | 10.04 | | | | (0.83 | ) | | | 40,515 | | | | 0.88 | | | | 1.22 | | | | 4.83 | | | | 86 | |
Class C | | | | | | | | | | | | | | | | | | | | | | | | | | | | | | | | | | | | | | | | | | | | | | | | | | | | | | | | |
Year ended 10/31/17 | | | 10.50 | | | | 0.41 | | | | 0.50 | | | | 0.91 | | | | (0.41 | ) | | | — | | | | (0.41 | ) | | | 11.00 | | | | 8.83 | | | | 74,211 | | | | 1.61 | (d) | | | 1.81 | (d) | | | 3.78 | (d) | | | 40 | |
Year ended 10/31/16 | | | 10.08 | | | | 0.39 | | | | 0.45 | | | | 0.84 | | | | (0.42 | ) | | | — | | | | (0.42 | ) | | | 10.50 | | | | 8.62 | | | | 24,238 | | | | 1.79 | | | | 2.03 | | | | 3.85 | | | | 101 | |
Year ended 10/31/15 | | | 10.36 | | | | 0.39 | | | | (0.26 | ) | | | 0.13 | | | | (0.41 | ) | | | — | | | | (0.41 | ) | | | 10.08 | | | | 1.26 | | | | 17,133 | | | | 1.74 | | | | 2.02 | | | | 3.77 | | | | 120 | |
Year ended 10/31/14 | | | 10.03 | | | | 0.40 | | | | 0.37 | | | | 0.77 | | | | (0.44 | ) | | | — | | | | (0.44 | ) | | | 10.36 | | | | 7.85 | | | | 14,854 | | | | 1.63 | | | | 2.03 | | | | 3.94 | | | | 89 | |
Year ended 10/31/13 | | | 10.82 | | | | 0.42 | | | | (0.58 | ) | | | (0.16 | ) | | | (0.47 | ) | | | (0.16 | ) | | | (0.63 | ) | | | 10.03 | | | | (1.58 | ) | | | 16,592 | | | | 1.63 | | | | 1.97 | | | | 4.08 | | | | 86 | |
Class R | | | | | | | | | | | | | | | | | | | | | | | | | | | | | | | | | | | | | | | | | | | | | | | | | | | | | | | | |
Year ended 10/31/17 | | | 10.51 | | | | 0.46 | | | | 0.50 | | | | 0.96 | | | | (0.46 | ) | | | — | | | | (0.46 | ) | | | 11.01 | | | | 9.37 | | | | 1,608 | | | | 1.11 | (d) | | | 1.31 | (d) | | | 4.28 | (d) | | | 40 | |
Year ended 10/31/16 | | | 10.08 | | | | 0.44 | | | | 0.46 | | | | 0.90 | | | | (0.47 | ) | | | — | | | | (0.47 | ) | | | 10.51 | | | | 9.28 | | | | 538 | | | | 1.29 | | | | 1.53 | | | | 4.35 | | | | 101 | |
Year ended 10/31/15 | | | 10.36 | | | | 0.44 | | | | (0.26 | ) | | | 0.18 | | | | (0.46 | ) | | | — | | | | (0.46 | ) | | | 10.08 | | | | 1.77 | | | | 339 | | | | 1.24 | | | | 1.52 | | | | 4.27 | | | | 120 | |
Year ended 10/31/14 | | | 10.03 | | | | 0.46 | | | | 0.36 | | | | 0.82 | | | | (0.49 | ) | | | — | | | | (0.49 | ) | | | 10.36 | | | | 8.39 | | | | 141 | | | | 1.13 | | | | 1.53 | | | | 4.44 | | | | 89 | |
Year ended 10/31/13 | | | 10.83 | | | | 0.47 | | | | (0.59 | ) | | | (0.12 | ) | | | (0.52 | ) | | | (0.16 | ) | | | (0.68 | ) | | | 10.03 | | | | (1.17 | ) | | | 51 | | | | 1.13 | | | | 1.47 | | | | 4.58 | | | | 86 | |
Class Y | | | | | | | | | | | | | | | | | | | | | | | | | | | | | | | | | | | | | | | | | | | | | | | | | | | | | | | | |
Year ended 10/31/17 | | | 10.51 | | | | 0.52 | | | | 0.50 | | | | 1.02 | | | | (0.52 | ) | | | — | | | | (0.52 | ) | | | 11.01 | | | | 9.91 | | | | 328,798 | | | | 0.61 | (d) | | | 0.81 | (d) | | | 4.78 | (d) | | | 40 | |
Year ended 10/31/16 | | | 10.09 | | | | 0.50 | | | | 0.44 | | | | 0.94 | | | | (0.52 | ) | | | — | | | | (0.52 | ) | | | 10.51 | | | | 9.71 | | | | 31,049 | | | | 0.79 | | | | 1.03 | | | | 4.85 | | | | 101 | |
Year ended 10/31/15 | | | 10.37 | | | | 0.49 | | | | (0.26 | ) | | | 0.23 | | | | (0.51 | ) | | | — | | | | (0.51 | ) | | | 10.09 | | | | 2.28 | | | | 12,424 | | | | 0.74 | | | | 1.02 | | | | 4.77 | | | | 120 | |
Year ended 10/31/14 | | | 10.05 | | | | 0.51 | | | | 0.35 | | | | 0.86 | | | | (0.54 | ) | | | — | | | | (0.54 | ) | | | 10.37 | | | | 8.82 | | | | 6,725 | | | | 0.63 | | | | 1.03 | | | | 4.94 | | | | 89 | |
Year ended 10/31/13 | | | 10.84 | | | | 0.53 | | | | (0.58 | ) | | | (0.05 | ) | | | (0.58 | ) | | | (0.16 | ) | | | (0.74 | ) | | | 10.05 | | | | (0.57 | ) | | | 7,409 | | | | 0.63 | | | | 0.97 | | | | 5.08 | | | | 86 | |
Class R5 | | | | | | | | | | | | | | | | | | | | | | | | | | | | | | | | | | | | | | | | | | | | | | | | | | | | | | | | |
Year ended 10/31/17 | | | 10.52 | | | | 0.52 | | | | 0.49 | | | | 1.01 | | | | (0.52 | ) | | | — | | | | (0.52 | ) | | | 11.01 | | | | 9.81 | | | | 30 | | | | 0.61 | (d) | | | 0.72 | (d) | | | 4.78 | (d) | | | 40 | |
Year ended 10/31/16 | | | 10.09 | | | | 0.50 | | | | 0.45 | | | | 0.95 | | | | (0.52 | ) | | | — | | | | (0.52 | ) | | | 10.52 | | | | 9.82 | | | | 19 | | | | 0.79 | | | | 0.90 | | | | 4.85 | | | | 101 | |
Year ended 10/31/15 | | | 10.37 | | | | 0.49 | | | | (0.26 | ) | | | 0.23 | | | | (0.51 | ) | | | — | | | | (0.51 | ) | | | 10.09 | | | | 2.28 | | | | 10 | | | | 0.74 | | | | 0.89 | | | | 4.77 | | | | 120 | |
Year ended 10/31/14 | | | 10.05 | | | | 0.50 | | | | 0.36 | | | | 0.86 | | | | (0.54 | ) | | | — | | | | (0.54 | ) | | | 10.37 | | | | 8.82 | | | | 10 | | | | 0.63 | | | | 0.90 | | | | 4.94 | | | | 89 | |
Year ended 10/31/13 | | | 10.84 | | | | 0.54 | | | | (0.59 | ) | | | (0.05 | ) | | | (0.58 | ) | | | (0.16 | ) | | | (0.74 | ) | | | 10.05 | | | | (0.57 | ) | | | 10 | | | | 0.63 | | | | 0.90 | | | | 5.08 | | | | 86 | |
Class R6 | | | | | | | | | | | | | | | | | | | | | | | | | | | | | | | | | | | | | | | | | | | | | | | | | | | | | | | | |
Year ended 10/31/17 | | | 10.51 | | | | 0.52 | | | | 0.50 | | | | 1.02 | | | | (0.52 | ) | | | — | | | | (0.52 | ) | | | 11.01 | | | | 9.91 | | | | 61,077 | | | | 0.61 | (d) | | | 0.69 | (d) | | | 4.78 | (d) | | | 40 | |
Year ended 10/31/16 | | | 10.09 | | | | 0.49 | | | | 0.45 | | | | 0.94 | | | | (0.52 | ) | | | — | | | | (0.52 | ) | | | 10.51 | | | | 9.71 | | | | 49,388 | | | | 0.79 | | | | 0.90 | | | | 4.85 | | | | 101 | |
Year ended 10/31/15 | | | 10.37 | | | | 0.49 | | | | (0.26 | ) | | | 0.23 | | | | (0.51 | ) | | | — | | | | (0.51 | ) | | | 10.09 | | | | 2.28 | | | | 67,568 | | | | 0.74 | | | | 0.89 | | | | 4.77 | | | | 120 | |
Year ended 10/31/14 | | | 10.04 | | | | 0.50 | | | | 0.37 | | | | 0.87 | | | | (0.54 | ) | | | — | | | | (0.54 | ) | | | 10.37 | | | | 8.93 | | | | 51,057 | | | | 0.63 | | | | 0.90 | | | | 4.94 | | | | 89 | |
Year ended 10/31/13 | | | 10.84 | | | | 0.53 | | | | (0.59 | ) | | | (0.06 | ) | | | (0.58 | ) | | | (0.16 | ) | | | (0.74 | ) | | | 10.04 | | | | (0.67 | ) | | | 171,140 | | | | 0.63 | | | | 0.85 | | | | 5.08 | | | | 86 | |
| (a) | Calculated using average shares outstanding. |
| (b) | Includes adjustments in accordance with accounting principles generally accepted in the United States of America and as such, the net asset value for financial reporting purposes and the returns based upon those net asset values may differ from the net asset value and returns for shareholder transactions. Does not include sales charges and is not annualized for periods less than one year, if applicable. |
| (c) | Portfolio turnover is calculated at the fund level and is not annualized for periods less than one year, if applicable. |
| (d) | Ratios are based on average daily net assets (000’s omitted) of $125,867, $44,392, $1,068, $149,881, $27 and $56,095 for Class A, Class C, Class R, Class Y, Class R5 and Class R6 shares, respectively. |
43 Invesco Multi-Asset Income Fund
Report of Independent Registered Public Accounting Firm
To the Board of Trustees of AIM Investment Funds (Invesco Investment Funds)
and Shareholders of Invesco Multi-Asset Income Fund:
In our opinion, the accompanying statement of assets and liabilities, including the schedule of investments, and the related statements of operations and of changes in net assets and the financial highlights present fairly, in all material respects, the financial position of Invesco Multi-Asset Income Fund (one of the portfolios constituting the AIM Investment Funds (Invesco Investment Funds), hereafter referred to as the “Fund”) as of October 31, 2017, the results of its operations for the year then ended, the changes in its net assets for each of the two years in the period then ended and the financial highlights for each of the five years in the period then ended, in conformity with accounting principles generally accepted in the United States of America. These financial statements and financial highlights (hereafter referred to as “financial statements”) are the responsibility of the Fund’s management. Our responsibility is to express an opinion on these financial statements based on our audits. We conducted our audits of these financial statements in accordance with the standards of the Public Company Accounting Oversight Board (United States). Those standards require that we plan and perform the audit to obtain reasonable assurance about whether the financial statements are free of material misstatement. An audit includes examining, on a test basis, evidence supporting the amounts and disclosures in the financial statements, assessing the accounting principles used and significant estimates made by management, and evaluating the overall financial statement presentation. We believe that our audits, which included confirmation of securities as of October 31, 2017 by correspondence with the custodian, transfer agent and brokers, and when replies were not received from brokers, we performed other auditing procedures, provide a reasonable basis for our opinion.
PricewaterhouseCoopers LLP
Houston, Texas
December 21, 2017
44 Invesco Multi-Asset Income Fund
Calculating your ongoing Fund expenses
Example
As a shareholder of the Fund, you incur two types of costs: (1) transaction costs, which may include sales charges (loads) on purchase payments or contingent deferred sales charges on redemptions, if any; and (2) ongoing costs, including management fees, distribution and/or service (12b-1) fees, and other Fund expenses. This example is intended to help you understand your ongoing costs (in dollars) of investing in the Fund and to compare these costs with ongoing costs of investing in other mutual funds. The example is based on an investment of $1,000 invested at the beginning of the period and held for the entire period May 1, 2017 through October 31, 2017.
Actual expenses
The table below provides information about actual account values and actual expenses. You may use the information in this table, together with the amount you invested, to estimate the expenses that you paid over the period. Simply divide your account value by $1,000 (for example, an $8,600 account value divided by $1,000 = 8.6), then multiply the result by the number in the table under the heading entitled “Actual Expenses Paid During Period” to estimate the expenses you paid on your account during this period.
Hypothetical example for comparison purposes
The table below also provides information about hypothetical account values and hypothetical expenses based on the Fund’s actual expense ratio and an assumed rate of return of 5% per year before expenses, which is not the Fund’s actual return.
The hypothetical account values and expenses may not be used to estimate the actual ending account balance or expenses you paid for the period. You may use this information to compare the ongoing costs of investing in the Fund and other funds. To do so, compare this 5% hypothetical example with the 5% hypothetical examples that appear in the shareholder reports of the other funds.
Please note that the expenses shown in the table are meant to highlight your ongoing costs only and do not reflect any transaction costs, such as sales charges (loads) on purchase payments or contingent deferred sales charges on redemptions, if any. Therefore, the hypothetical information is useful in comparing ongoing costs only, and will not help you determine the relative total costs of owning different funds. In addition, if these transaction costs were included, your costs would have been higher.
| | | | | | | | | | | | | | | | | | | | | | | | |
| Class | | Beginning
Account Value
(05/01/17) | | | ACTUAL | | | HYPOTHETICAL
(5% annual return before
expenses) | | | Annualized
Expense
Ratio | |
| | | Ending
Account Value
(10/31/17)1 | | | Expenses
Paid During
Period2 | | | Ending
Account Value
(10/31/17) | | | Expenses
Paid During
Period2 | | |
A | | $ | 1,000.00 | | | $ | 1,033.30 | | | $ | 4.31 | | | $ | 1,020.97 | | | $ | 4.28 | | | | 0.84 | % |
C | | | 1,000.00 | | | | 1,029.40 | | | | 8.13 | | | | 1,017.19 | | | | 8.08 | | | | 1.59 | |
R | | | 1,000.00 | | | | 1,032.00 | | | | 5.58 | | | | 1,019.71 | | | | 5.55 | | | | 1.09 | |
Y | | | 1,000.00 | | | | 1,034.60 | | | | 3.03 | | | | 1,022.23 | | | | 3.01 | | | | 0.59 | |
R5 | | | 1,000.00 | | | | 1,033.60 | | | | 3.02 | | | | 1,022.23 | | | | 3.01 | | | | 0.59 | |
R6 | | | 1,000.00 | | | | 1,034.60 | | | | 3.03 | | | | 1,022.23 | | | | 3.01 | | | | 0.59 | |
| 1 | The actual ending account value is based on the actual total return of the Fund for the period May 1, 2017 through October 31, 2017, after actual expenses and will differ from the hypothetical ending account value which is based on the Fund’s expense ratio and a hypothetical annual return of 5% before expenses. |
| 2 | Expenses are equal to the Fund’s annualized expense ratio as indicated above multiplied by the average account value over the period, multiplied by 184/365 to reflect the most recent fiscal half year. |
45 Invesco Multi-Asset Income Fund
Approval of Investment Advisory and Sub-Advisory Contracts
The Board of Trustees (the Board) of AIM Investment Funds (Invesco Investment Funds) is required under the Investment Company Act of 1940, as amended, to approve annually the renewal of Invesco Multi-Asset Income Fund’s (the Fund) investment advisory agreements. During contract renewal meetings held on June 12-13, 2017, the Board as a whole, and the disinterested or “independent” Trustees, who comprise over 75% of the Board, voting separately, approved the continuance for the Fund of the Master Investment Advisory Agreement with Invesco Advisers, Inc. (Invesco Advisers and the investment advisory agreement) and the Master Intergroup Sub-Advisory Contract for Mutual Funds with Invesco Asset Management Deutschland GmbH, Invesco Asset Management Limited, Invesco Asset Management (Japan) Limited, Invesco Hong Kong Limited, Invesco Senior Secured Management, Inc. and Invesco Canada Ltd. and separate Sub-Advisory Contracts with Invesco PowerShares Capital Management LLC and Invesco Asset Management (India) Private Limited (collectively, the Affiliated Sub-Advisers and the sub-advisory contracts) for another year, effective July 1, 2017.
In evaluating the fairness and reasonableness of compensation under the Fund’s investment advisory agreement and sub-advisory contracts, the Board considered, among other things, the factors discussed below. The Board determined that continuation of the Fund’s investment advisory agreement and the sub-advisory contracts is in the best interest of the Fund and its shareholders and that the compensation payable to Invesco Advisers and the Affiliated Sub-Advisers under the agreements is fair and reasonable.
The Board’s Fund Evaluation Process
The Board’s Investments Committee has established three Sub-Committees, which meet throughout the year to review the performance of funds advised by Invesco Advisers (the Invesco Funds). Over the course of each year, the Sub-Committees meet with portfolio managers for their assigned Invesco Funds and other members of management to review the performance, investment objective(s), policies, strategies, limitations and investment risks of these funds. The Board had the benefit of reports from the Sub-Committees and Investments Committee throughout the year in considering approval of the continuance of each Invesco Fund’s investment advisory agreement and sub-advisory contracts for another year.
During the contract renewal process, the Board receives comparative performance and fee data regarding the Invesco Funds prepared by Invesco Advisers and Broadridge Financial Solutions, Inc. (Broadridge), an independent provider of investment company data. The Board also receives an independent written
evaluation from the Senior Officer, an officer of the Invesco Funds who reports directly to the independent Trustees. The Senior Officer’s evaluation is prepared as part of his responsibility to manage the process by which the Invesco Funds’ proposed management fees are negotiated during the annual contract renewal process to ensure they are negotiated in a manner that is at arms’ length and reasonable. In addition to meetings with Invesco Advisers and fund counsel, the independent Trustees also discuss the continuance of the investment advisory agreement and sub-advisory contracts in separate sessions with the Senior Officer and with independent legal counsel.
The Trustees recognized that the advisory fee rates for the Invesco Funds are, in most cases, the result of years of review and negotiation. The Trustees’ deliberations and conclusions in a particular year may be based in part on their deliberations and conclusions regarding these arrangements throughout the year and in prior years. The Trustees’ review and conclusions are based on the comprehensive consideration of all information presented to them and are not the result of any single determinative factor. Moreover, one Trustee may have weighed a particular piece of information or factor differently than another Trustee.
The discussion below is a summary of the Senior Officer’s independent written evaluation with respect to the Fund’s investment advisory agreement as well as a discussion of the material factors and related conclusions that formed the basis for the Board’s approval of the Fund’s investment advisory agreement and sub-advisory contracts. This information is current as of June 13, 2017, and does not reflect consideration of factors that became known to the Board after that date.
Factors and Conclusions and Summary of Independent Written Fee Evaluation
| A. | Nature, Extent and Quality of Services Provided by Invesco Advisers and the Affiliated Sub-Advisers |
The Board reviewed the advisory services provided to the Fund by Invesco Advisers under the Fund’s investment advisory agreement, the performance of Invesco Advisers in providing these services, and the credentials and experience of the officers and employees of Invesco Advisers who provide these services, including the Fund’s portfolio manager or managers. The Board’s review included consideration of Invesco Advisers’ investment process oversight, credit analysis and investment risk management. The Board also considered non-advisory services that Invesco Advisers and its affiliates provide to the Invesco Funds such as various back office support functions, trading operations, internal audit, valuation and legal and compliance.
In determining whether to continue the Fund’s investment advisory agreement, the Board considered the benefits of reapproving an existing relationship as contrasted with the greater uncertainty that may be associated with entering into a new relationship. The Board concluded that the nature, extent and quality of the services provided to the Fund by Invesco Advisers are appropriate and satisfactory.
The Board reviewed the services that may be provided by the Affiliated Sub-Advisers under the sub-advisory contracts and the credentials and experience of the officers and employees of the Affiliated Sub-Advisers who provide these services. The Board noted that the Affiliated Sub-Advisers have offices and personnel that are located in financial centers around the world. As a result, the Board noted that the Affiliated Sub-Advisers can provide research and investment analysis on the markets and economies of various countries in which the Fund may invest, make recommendations regarding securities and assist with security trades. The Board concluded that the sub-advisory contracts may benefit the Fund and its shareholders by permitting Invesco Advisers to use the resources and talents of the Affiliated Sub-Advisers in managing the Fund. The Board concluded that the nature, extent and quality of the services that may be provided by the Affiliated Sub-Advisers are appropriate and satisfactory.
| B. | Fund Investment Performance |
The Board considered Fund investment performance as a relevant factor in considering whether to approve the investment advisory agreement. The Board did not view Fund performance as a relevant factor in considering whether to approve the sub-advisory contracts for the Fund, as no Affiliated Sub-Adviser currently manages assets of the Fund.
The Board compared the Fund’s investment performance over multiple time periods ending December 31, 2016 to the performance of funds in the Broadridge performance universe and against the Lipper Mixed-Asset Target Allocation Conservative Funds Index. The Board noted that performance of Class A shares of the Fund was in the first quintile of its performance universe for the one, three and five year periods (the first quintile being the best performing funds and the fifth quintile being the worst performing funds). The Board noted that performance of Class A shares of the Fund was above the performance of the Index for the one, three and five year periods. The Trustees also reviewed more recent Fund performance and this review did not change their conclusions.
| C. | Advisory and Sub-Advisory Fees |
The Board compared the Fund’s contractual management fee rate to the contractual management fee rates of funds in the Fund’s Broadridge expense group at a common asset level. The Board noted that the contractual
46 Invesco Multi-Asset Income Fund
management fee rate for Class A shares of the Fund was at the median contractual management fee rate of funds in its expense group. The Board noted that the term “contractual management fee” for funds in the expense group may include both advisory and certain administrative services fees, but that Broadridge does not provide information on a fund by fund basis as to what is included. The Board noted that Invesco Advisers does not separately charge the Invesco Funds for the administrative services included in the term as defined by Broadridge. The Board also reviewed the methodology used by Broadridge in providing expense group information, which includes using each fund’s contractual management fee schedule (including any applicable breakpoints) as reported in the most recent prospectus or statement of additional information for each fund in the expense group.
The Board noted that Invesco Advisers has contractually agreed to waive fees and/or limit expenses of the Fund through at least February 28, 2018 in an amount necessary to limit total annual operating expenses to a specified percentage of average daily net assets for each class of the Fund.
The Board noted that Invesco Advisers and its affiliates manage two other mutual funds using an investment process substantially similar to the investment process used for the Fund. The Board noted that both of the other mutual funds are fund of funds and Invesco Advisers does not charge advisory fees at the fund level. Invesco Advisors and the Affiliated Sub-Advisers do not manage other client accounts using an investment process substantially similar to the investment process used for the Fund.
The Board also considered the services that may be provided by the Affiliated Sub-Advisers pursuant to the sub-advisory contracts, as well as the fees payable by Invesco Advisers to the Affiliated Sub-Advisers pursuant to the sub-advisory contracts. The Board also noted that the sub-advisory fees are not paid directly by the Fund, but rather, are payable by Invesco Advisers to the Affiliated Sub-Advisers.
| D. | Economies of Scale and Breakpoints |
The Board considered the extent to which there are economies of scale in the provision of advisory services to the Fund. The Board also considered that the Fund may benefit from economies of scale through contractual breakpoints in the Fund’s advisory fee schedule. The Board noted that the Fund shares directly in economies of scale through lower fees charged by third party service providers based on the combined size of the Invesco Funds advised by Invesco Advisers.
| E. | Profitability and Financial Resources |
The Board reviewed information from Invesco Advisers concerning the costs of the advisory and other services that Invesco Advisers and its affiliates provide to the Fund and the Invesco Funds and the profitability of Invesco Advisers and its affiliates in providing these services. The Board noted that Invesco Advisers continues to operate at a net profit from services Invesco
Advisers and its affiliates provide to the Invesco Funds and the Fund. The Board did not deem the level of profits realized by Invesco Advisers and its affiliates from providing services to the Fud to be excessive given the nature, quality and extent of the services provided. The Board received and accepted information from Invesco Advisers demonstrating that Invesco Advisers and each Affiliated Sub-Adviser are financially sound and have the resources necessary to perform their obligations under the investment advisory agreement and sub-advisory contracts.
| F. | Collateral Benefits to Invesco Advisers and its Affiliates |
The Board considered various other benefits received by Invesco Advisers and its affiliates from the relationship with the Fund, including the fees received for providing transfer agency and distribution services to the Fund. The Board considered comparative information regarding fees charged for these services, including information provided by Broadridge and other independent sources. The Board considered the performance of Invesco Advisers and its affiliates in providing these services and the organizational structure employed to provide these services. The Board also considered that these services are provided to the Fund pursuant to written contracts that are reviewed and approved on an annual basis by the Board; and that the services are required for the operation of the Fund.
The Board considered the benefits realized by Invesco Advisers and the Affiliated Sub-Advisers as a result of portfolio brokerage transactions executed through “soft dollar” arrangements. Invesco Advisers noted that the Fund does not execute brokerage transactions through “soft dollar” arrangements to any significant degree.
The Board considered that the Fund’s uninvested cash and cash collateral from any securities lending arrangements may be invested in money market funds advised by Invesco Advisers pursuant to procedures approved by the Board. The Board noted that Invesco Advisers receives advisory fees from these affiliated money market funds attributable to such investments, although Invesco Advisers has contractually agreed to waive through varying periods the advisory fees payable by the Invesco Funds with respect to certain investments in the affiliated money market funds. The waiver is in an amount equal to 100% of the net advisory fee Invesco Advisers receives from the affiliated money market funds with respect to the Fund’s investment in the affiliated money market funds of uninvested cash, but not cash collateral. The Board concluded that the amount of advisory fees received by Invesco Advisers from the Fund’s investment of cash collateral from any securities lending arrangements in the affiliated money market funds is fair and reasonable.
47 Invesco Multi-Asset Income Fund
Tax Information
Form 1099-DIV, Form 1042-S and other year-end tax information provide shareholders with actual calendar year amounts that should be included in their tax returns. Shareholders should consult their tax advisors.
The following distribution information is being provided as required by the Internal Revenue Code or to meet a specific state’s requirement.
The Fund designates the following amounts or, if subsequently determined to be different, the maximum amount allowable for its fiscal year ended October 31, 2017:
| | | | |
Federal and State Income Tax | |
Qualified Dividend Income* | | | 0.00 | % |
Corporate Dividends Received Deduction* | | | 0.00 | % |
U.S. Treasury Obligations* | | | 3.94 | % |
| | * | The above percentages are based on ordinary income dividends paid to shareholders during the Fund’s fiscal year. |
48 Invesco Multi-Asset Income Fund
Trustees and Officers
The address of each trustee and officer is AIM Investment Funds (Invesco Investment Funds) (the “Trust”), 11 Greenway Plaza, Suite 1000, Houston, Texas 77046-1173. The trustees serve for the life of the Trust, subject to their earlier death, incapacitation, resignation, retirement or removal as more specifically provided in the Trust’s organizational documents. Each officer serves for a one year term or until their successors are elected and qualified. Column two below includes length of time served with predecessor entities, if any.
| | | | | | | | |
Name, Year of Birth and Position(s) Held with the Trust | | Trustee and/
or Officer Since | | Principal Occupation(s)
During Past 5 Years | | Number of
Funds in Fund
Complex
Overseen by
Trustee | | Other Directorship(s)
Held by Trustee During Past 5 Years |
| Interested Persons | | | | | | | | |
| Martin L. Flanagan1 — 1960 Trustee | | 2007 | | Executive Director, Chief Executive Officer and President, Invesco Ltd. (ultimate parent of Invesco and a global investment management firm); Trustee, The Invesco Funds; Vice Chair, Investment Company Institute; and Member of Executive Board, SMU Cox School of Business Formerly: Advisor to the Board, Invesco Advisers, Inc. (formerly known as Invesco Institutional (N.A.), Inc.); Chairman and Chief Executive Officer, Invesco Advisers, Inc. (registered investment adviser); Director, Chairman, Chief Executive Officer and President, Invesco Holding Company (US), Inc. (formerly IVZ Inc.) (holding company), Invesco Group Services, Inc. (service provider) and Invesco North American Holdings, Inc. (holding company); Director, Chief Executive Officer and President, Invesco Holding Company Limited (parent of Invesco and a global investment management firm); Director, Invesco Ltd.; Chairman, Investment Company Institute and President, Co-Chief Executive Officer, Co-President, Chief Operating Officer and Chief Financial Officer, Franklin Resources, Inc. (global investment management organization) | | 158 | | None |
Philip A. Taylor2 — 1954 Trustee and Senior Vice President | | 2006 | | Head of the Americas and Senior Managing Director, Invesco Ltd.; Director, Invesco Advisers, Inc. (formerly known as Invesco Institutional (N.A.), Inc.) (registered investment adviser); Director, Chairman, Chief Executive Officer and President, Invesco Management Group, Inc. (formerly known as Invesco Aim Management Group, Inc.) (financial services holding company); Director and Chairman, Invesco Investment Services, Inc. (formerly known as Invesco Aim Investment Services, Inc.) (registered transfer agent); Chief Executive Officer, Invesco Corporate Class Inc. (corporate mutual fund company); Director, Chairman and Chief Executive Officer, Invesco Canada Ltd. (formerly known as Invesco Trimark Ltd./Invesco Trimark Ltèe) (registered investment adviser and registered transfer agent); Trustee and Senior Vice President, The Invesco Funds; Director, Invesco Investment Advisers LLC (formerly known as Van Kampen Asset Management). Formerly: Co-Chairman, Co-President and Co-Chief Executive Officer, Invesco Advisers, Inc. (formerly known as Invesco Institutional (N.A.), Inc.) (registered investment adviser); Director, Chief Executive Officer and President, Van Kampen Exchange Corp; President and Principal Executive Officer, The Invesco Funds (other than AIM Treasurer’s Series Trust (Invesco Treasurer’s Series Trust), Short-Term Investments Trust and Invesco Management Trust); Executive Vice President, The Invesco Funds (AIM Treasurer’s Series Trust (Invesco Treasurer’s Series Trust), Short-Term Investments Trust and Invesco Management Trust only); Director and President, INVESCO Funds Group, Inc. (registered investment adviser and registered transfer agent); Director and Chairman, IVZ Distributors, Inc. (formerly known as INVESCO Distributors, Inc.) (registered broker dealer); Director, President and Chairman, Invesco Inc. (holding company), Invesco Canada Holdings Inc. (holding company), Trimark Investments Ltd./Placements Trimark Ltèe and Invesco Financial Services Ltd/Services Financiers Invesco Ltèe; Chief Executive Officer, Invesco Canada Fund Inc. (corporate mutual fund company); Director and Chairman, Van Kampen Investor Services Inc.; Director, Chief Executive Officer and President, 1371 Preferred Inc. (holding company) and Van Kampen Investments Inc.; Director and President, AIM GP Canada Inc. (general partner for limited partnerships) and Van Kampen Advisors, Inc.; Director and Chief Executive Officer, Invesco Trimark Dealer Inc. (registered broker dealer); Director, Invesco Distributors, Inc. (formerly known as Invesco Aim Distributors, Inc.) (registered broker dealer); Manager, Invesco PowerShares Capital Management LLC; Director, Chief Executive Officer and President, Invesco Advisers, Inc.; Director, Chairman, Chief Executive Officer and President, Invesco Aim Capital Management, Inc.; President, Invesco Trimark Dealer Inc. and Invesco Trimark Ltd./Invesco Trimark Ltèe; Director and President, AIM Trimark Corporate Class Inc. and AIM Trimark Canada Fund Inc.; Senior Managing Director, Invesco Holding Company Limited; Director and Chairman, Fund Management Company (former registered broker dealer); President and Principal Executive Officer, The Invesco Funds (AIM Treasurer’s Series Trust (Invesco Treasurer’s Series Trust), and Short-Term Investments Trust only); President, AIM Trimark Global Fund Inc. and AIM Trimark Canada Fund Inc. | | 158 | | None |
| 1 | Mr. Flanagan is considered an interested person (within the meaning of Section 2(a)(19) of the 1940 Act) of the Trust because he is an officer of the Adviser to the Trust, and an officer and a director of Invesco Ltd., ultimate parent of the Adviser. |
| 2 | Mr. Taylor is considered an interested person (within the meaning of Section 2(a)(19) of the 1940 Act) of the Trust because he is an officer and a director of the Adviser. |
T-1 Invesco Multi-Asset Income Fund
Trustees and Officers—(continued)
| | | | | | | | |
Name, Year of Birth and Position(s) Held with the Trust | | Trustee and/
or Officer Since | | Principal Occupation(s) During Past 5 Years | | Number of
Funds in Fund
Complex
Overseen by
Trustee | | Other Directorship(s)
Held by Trustee During Past 5 Years |
| Independent Trustees | | | | | | | | |
Bruce L. Crockett — 1944 Trustee and Chair | | 2001 | | Chairman, Crockett Technologies Associates (technology consulting company) Formerly: Director, Captaris (unified messaging provider); Director, President and Chief Executive Officer, COMSAT Corporation; Chairman, Board of Governors of INTELSAT (international communications company); ACE Limited (insurance company); Independent Directors Council and Investment Company Institute: Member of the Audit Committee, Investment Company Institute; Member of the Executive Committee and Chair of the Governance Committee, Independent Directors Council | | 158 | | Director and Chairman of the Audit Committee, ALPS (Attorneys Liability Protection Society) (insurance company); Director and Member of the Audit Committee, Ferroglobe PLC (metallurgical company) |
David C. Arch — 1945 Trustee | | 2010 | | Chairman of Blistex Inc. (consumer health care products manufacturer); Member, World Presidents’ Organization | | 158 | | Board member of the Illinois Manufacturers’ Association |
James T. Bunch — 1942 Trustee | | 2003 | | Managing Member, Grumman Hill Group LLC (family office/private equity investments) Formerly: Chairman of the Board, Denver Film Society; Chairman of the Board of Trustees, Evans Scholarship Foundation; Chairman, Board of Governors, Western Golf Association | | 158 | | Trustee, Evans Scholarship Foundation |
Jack M. Fields — 1952 Trustee | | 2001 | | Chief Executive Officer, Twenty First Century Group, Inc. (government affairs company); and Discovery Learning Alliance (non-profit) Formerly: Owner and Chief Executive Officer, Dos Angeles Ranch L.P. (cattle, hunting, corporate entertainment); Director, Insperity, Inc. (formerly known as Administaff) (human resources provider); Chief Executive Officer, Texana Timber LP (sustainable forestry company); Director of Cross Timbers Quail Research Ranch (non-profit); and member of the U.S. House of Representatives | | 158 | | None |
Cynthia Hostetler — 1962 Trustee | | 2017 | | Non-Executive Director and Trustee of a number of public and private business corporations Formerly: Head of Investment Funds and Private Equity, Overseas Private Investment Corporation; President, First Manhattan Bancorporation, Inc.; Attorney, Simpson Thacher & Bartlett LLP | | 158 | | Vulcan Materials Company (construction materials company); Trilinc Global Impact Fund; Aberdeen Investment Funds (4 portfolios); Artio Global Investment LLC (mutual fund complex); Edgen Group, Inc. (specialized energy and infrastructure products distributor) |
Eli Jones — 1961 Trustee | | 2016 | | Professor and Dean, Mays Business School — Texas A&M University Formerly: Professor and Dean, Walton College of Business, University of Arkansas and E.J. Ourso College of Business, Louisiana State University; Director, Arvest Bank | | 158 | | Insperity, Inc. (formerly known as Administaff) (human resources provider) |
Prema Mathai-Davis — 1950 Trustee | | 2001 | | Retired. Formerly: Chief Executive Officer, YWCA of the U.S.A. | | 158 | | None |
Teresa M. Ressel — 1962 Trustee | | 2017 | | Non-executive director and trustee of a number of public and private business corporations Formerly: Chief Financial Officer, Olayan America, The Olayan Group (international investor/commercial/industrial); Chief Executive Officer, UBS Securities LLC; Group Chief Operating Officer, Americas, UBS AG; Assistant Secretary for Management & Budget and CFO, US Department of the Treasury; Chief Compliance Officer, Kaiser Permanente (healthcare consortium); Program Manager, Hewlett-Packard; Nuclear Engineering, General Dynamics Corporation (aerospace and defense company) | | 158 | | Atlantic Power Corporation (power generation company); ON Semiconductor Corp. (semiconductor supplier) |
Larry Soll — 1942 Trustee | | 2003 | | Retired. Formerly: Chairman, Chief Executive Officer and President, Synergen Corp. (a biotechnology company) | | 158 | | None |
Ann Barnett Stern — 1957 Trustee | | 2017 | | President and Chief Executive Officer, Houston Endowment Inc. (private philanthropic institution) Formerly: Executive Vice President and General Counsel, Texas Children’s Hospital; Attorney, Beck, Redden and Secrest, LLP; Business Law Instructor, University of St. Thomas; Attorney, Andrews & Kurth LLP | | 158 | | Federal Reserve Bank of Dallas |
Raymond Stickel, Jr. — 1944 Trustee | | 2005 | | Retired. Formerly: Director, Mainstay VP Series Funds, Inc. (25 portfolios); Partner, Deloitte & Touche | | 158 | | None |
Robert C. Troccoli — 1949 Trustee | | 2016 | | Adjunct Professor, University of Denver — Daniels College of Business Formerly: Senior Partner, KPMG LLP | | 158 | | None |
T-2 Invesco Multi-Asset Income Fund
Trustees and Officers—(continued)
| | | | | | | | |
Name, Year of Birth and Position(s) Held with the Trust | | Trustee and/
or Officer Since | | Principal Occupation(s) During Past 5 Years | | Number of
Funds in Fund
Complex
Overseen by
Trustee | | Other Directorship(s)
Held by Trustee During Past 5 Years |
| Independent Trustees—(continued) |
Christopher L. Wilson — 1957 Trustee | | 2017 | | Managing Partner, CT2, LLC (investing and consulting firm) Formerly: President/Chief Executive Officer, Columbia Funds, Bank of America Corporation; President/Chief Executive Officer, CDC IXIS Asset Management Services, Inc.; Principal & Director of Operations, Scudder Funds, Scudder, Stevens & Clark, Inc.; Assistant Vice President, Fidelity Investments | | 158 | | TD Asset Management USA Inc. (mutual fund complex) (22 portfolios); ISO New England, Inc. (non-profit organization managing regional electricity market) |
| Other Officers | | | | | | | | |
Sheri Morris — 1964 President, Principal Executive Officer and Treasurer | | 1999 | | President, Principal Executive Officer and Treasurer, The Invesco Funds; Vice President, Invesco Advisers, Inc. (formerly known as Invesco Institutional (N.A.), Inc.) (registered investment adviser); and Vice President, PowerShares Exchange-Traded Fund Trust, PowerShares Exchange-Traded Fund Trust II, PowerShares India Exchange-Traded Fund Trust, PowerShares Actively Managed Exchange-Traded Fund Trust and PowerShares Actively Managed Exchange-Traded Commodity Fund Trust Formerly: Vice President and Principal Financial Officer, The Invesco Funds; Vice President, Invesco Aim Advisers, Inc., Invesco Aim Capital Management, Inc. and Invesco Aim Private Asset Management, Inc.; Assistant Vice President and Assistant Treasurer, The Invesco Funds and Assistant Vice President, Invesco Advisers, Inc., Invesco Aim Capital Management, Inc. and Invesco Aim Private Asset Management, Inc.; and Treasurer, PowerShares Exchange-Traded Fund Trust, PowerShares Exchange-Traded Fund Trust II, PowerShares India Exchange-Traded Fund Trust and PowerShares Actively Managed Exchange-Traded Fund Trust | | N/A | | N/A |
Russell C. Burk — 1958 Senior Vice President and Senior Officer | | 2005 | | Senior Vice President and Senior Officer, The Invesco Funds | | N/A | | N/A |
John M. Zerr — 1962 Senior Vice President, Chief Legal Officer and Secretary | | 2006 | | Director, Senior Vice President, Secretary and General Counsel, Invesco Management Group, Inc. (formerly known as Invesco AIM Management Group, Inc.); Senior Vice President, Invesco Advisers, Inc. (formerly known as Invesco Institutional (N.A.), Inc.) (registered investment adviser); Senior Vice President and Secretary, Invesco Distributors, Inc. (formerly known as Invesco AIM Distributors, Inc.); Director, Vice President and Secretary, Invesco Investment Services, Inc. (formerly known as Invesco AIM Investment Services, Inc.) Senior Vice President, Chief Legal Officer and Secretary, The Invesco Funds; Managing Director, Invesco PowerShares Capital Management LLC; Director, Secretary and General Counsel, Invesco Investment Advisers LLC (formerly known as Van Kampen Asset Management); Secretary and General Counsel, Invesco Capital Markets, Inc. (formerly known as Van Kampen Funds Inc.) and Chief Legal Officer, PowerShares Exchange-Traded Fund Trust, PowerShares Exchange-Traded Fund Trust II, PowerShares India Exchange-Traded Fund Trust, PowerShares Actively Managed Exchange-Traded Fund Trust and PowerShares Actively Managed Exchange-Traded Commodity Fund Trust; Manager and Secretary, Invesco Indexing LLC Formerly: Director, Secretary, General Counsel and Senior Vice President, Van Kampen Exchange Corp.; Director, Vice President and Secretary, IVZ Distributors, Inc. (formerly known as INVESCO Distributors, Inc.); Director and Vice President, INVESCO Funds Group, Inc.; Director and Vice President, Van Kampen Advisors Inc.; Director, Vice President, Secretary and General Counsel, Van Kampen Investor Services Inc.; Director, Invesco Distributors, Inc. (formerly known as Invesco AIM Distributors, Inc.); Director, Senior Vice President, General Counsel and Secretary, Invesco AIM Advisers, Inc. and Van Kampen Investments Inc.; Director, Vice President and Secretary, Fund Management Company; Director, Senior Vice President, Secretary, General Counsel and Vice President, Invesco AIM Capital Management, Inc.; Chief Operating Officer and General Counsel, Liberty Ridge Capital, Inc. (an investment adviser); Vice President and Secretary, PBHG Funds (an investment company) and PBHG Insurance Series Fund (an investment company); Chief Operating Officer, General Counsel and Secretary, Old Mutual Investment Partners (a broker-dealer); General Counsel and Secretary, Old Mutual Fund Services (an administrator) and Old Mutual Shareholder Services (a shareholder servicing center); Executive Vice President, General Counsel and Secretary, Old Mutual Capital, Inc. (an investment adviser); and Vice President and Secretary, Old Mutual Advisors Funds (an investment company) | | N/A | | N/A |
Gregory G. McGreevey — 1962 Senior Vice President | | 2012 | | Senior Managing Director, Invesco Ltd.; Director, Chairman, President, and Chief Executive Officer, Invesco Advisers, Inc. (formerly known as Invesco Institutional (N.A.), Inc.) (registered investment adviser); Senior Vice President, Invesco Management Group, Inc.; Director, Invesco Mortgage Capital, Inc. and Invesco Senior Secured Management, Inc.; and Senior Vice President, The Invesco Funds Formerly: Assistant Vice President, The Invesco Funds | | N/A | | N/A |
T-3 Invesco Multi-Asset Income Fund
Trustees and Officers—(continued)
| | | | | | | | |
Name, Year of Birth and Position(s) Held with the Trust | | Trustee and/
or Officer Since | | Principal Occupation(s) During Past 5 Years | | Number of
Funds in Fund
Complex
Overseen by
Trustee | | Other Directorship(s)
Held by Trustee During Past 5 Years |
| Other Officers—(continued) | | | | | | | | |
Kelli Gallegos — 1970 Vice President, Principal Financial Officer and Assistant Treasurer | | 2008 | | Vice President, Principal Financial Officer and Assistant Treasurer, The Invesco Funds; Assistant Treasurer, Invesco PowerShares Capital Management LLC, PowerShares Exchange-Traded Fund Trust, PowerShares Exchange-Traded Fund Trust II, PowerShares India Exchange-Traded Fund Trust, PowerShares Actively Managed Exchange-Traded Fund Trust and PowerShares Actively Managed Exchange-Traded Commodity Fund Trust Formerly: Assistant Vice President, The Invesco Funds | | N/A | | N/A |
Tracy Sullivan — 1962 Vice President, Chief Tax Officer and Assistant Treasurer | | 2008 | | Vice President, Chief Tax Officer and Assistant Treasurer, The Invesco Funds; Assistant Treasurer, Invesco PowerShares Capital Management LLC, PowerShares Exchange-Traded Fund Trust, PowerShares Exchange-Traded Fund Trust II, PowerShares India Exchange-Traded Fund Trust, PowerShares Actively Managed Exchange-Traded Fund Trust and PowerShares Actively Managed Exchange-Traded Commodity Fund Trust Formerly: Assistant Vice President, The Invesco Funds | | N/A | | N/A |
Crissie M. Wisdom — 1969 Anti-Money Laundering Compliance Officer | | 2013 | | Anti-Money Laundering Compliance Officer, Invesco Advisers, Inc. (formerly known as Invesco Institutional (N.A.), Inc.) (registered investment adviser), Invesco Capital Markets, Inc. (formerly known as Van Kampen Funds Inc.), Invesco Distributors, Inc., Invesco Investment Services, Inc., Invesco Management Group, Inc., The Invesco Funds, and PowerShares Exchange-Traded Fund Trust, PowerShares Exchange-Traded Fund Trust II, PowerShares India Exchange-Traded Fund Trust, PowerShares Actively Managed Exchange-Traded Fund Trust and PowerShares Actively Managed Exchange-Traded Commodity Fund Trust; Anti-Money Laundering Compliance Officer and Bank Secrecy Act Officer, INVESCO National Trust Company and Invesco Trust Company; and Fraud Prevention Manager and Controls and Risk Analysis Manager for Invesco Investment Services, Inc. Formerly: Anti-Money Laundering Compliance Officer, Van Kampen Exchange Corp. | | N/A | | N/A |
Robert R. Leveille — 1969 Chief Compliance Officer | | 2016 | | Chief Compliance Officer, Invesco Advisers, Inc. (registered investment adviser); and Chief Compliance Officer, The Invesco Funds Formerly: Chief Compliance Officer, Putnam Investments and the Putnam Funds | | N/A | | N/A |
The Statement of Additional Information of the Trust includes additional information about the Fund’s Trustees and is available upon request, without charge, by calling 1.800.959.4246. Please refer to the Fund’s Statement of Additional Information for information on the Fund’s sub-advisers.
| | | | | | |
Office of the Fund 11 Greenway Plaza, Suite 1000 Houston, TX 77046-1173 | | Investment Adviser Invesco Advisers, Inc. 1555 Peachtree Street, N.E. Atlanta, GA 30309 | | Distributor Invesco Distributors, Inc. 11 Greenway Plaza, Suite 1000 Houston, TX 77046-1173 | | Auditors PricewaterhouseCoopers LLP 1000 Louisiana Street, Suite 5800 Houston, TX 77002-5678 |
| | | |
| | | | | | |
Counsel to the Fund Stradley Ronon Stevens & Young, LLP 2005 Market Street, Suite 2600 Philadelphia, PA 19103-7018 | | Counsel to the Independent Trustees Goodwin Procter LLP 901 New York Avenue, N.W. Washington, D.C. 20001 | | Transfer Agent Invesco Investment Services, Inc. 11 Greenway Plaza, Suite 1000 Houston, TX 77046-1173 | | Custodian State Street Bank and Trust Company 225 Franklin Street Boston, MA 02110-2801 |
T-4 Invesco Multi-Asset Income Fund
Explore High-Conviction Investing with Invesco

Go paperless with eDelivery
Visit invesco.com/edelivery to enjoy the convenience and security of anytime electronic access to your investment documents.
With eDelivery, you can elect to have any or all of the following materials delivered straight to your inbox to download, save and print from your own computer:
| ∎ | | Fund reports and prospectuses |
Invesco mailing information
Send general correspondence to Invesco Investment Services, Inc., P.O. Box 219078, Kansas City, MO 64121-9078.
Important notice regarding delivery of security holder documents
To reduce Fund expenses, only one copy of most shareholder documents may be mailed to shareholders with multiple accounts at the same address (Householding). Mailing of your shareholder documents may be householded indefinitely unless you instruct us otherwise. If you do not want the mailing of these documents to be combined with those for other members of your household, please contact Invesco Investment Services, Inc. at 800 959 4246 or contact your financial institution. We will begin sending you individual copies for each account within 30 days after receiving your request.
Fund holdings and proxy voting information
The Fund provides a complete list of its holdings four times in each fiscal year, at the quarter ends. For the second and fourth quarters, the lists appear in the Fund’s semiannual and annual reports to shareholders. For the first and third quarters, the Fund files the lists with the Securities and Exchange Commission (SEC) on Form N-Q. The most recent list of portfolio holdings is available at invesco.com/completeqtrholdings. Shareholders can also look up the Fund’s Forms N-Q on the SEC website at sec.gov. Copies of the Fund’s Forms N-Q may be reviewed and copied at the SEC Public Reference Room in Washington, D.C. You can obtain information on the operation of the Public Reference Room, including information about duplicating fee charges, by calling 202 551 8090 or 800 732 0330, or by electronic request at the following email address: publicinfo@sec.gov. The SEC file numbers for the Fund are shown below.
A description of the policies and procedures that the Fund uses to determine how to vote proxies relating to portfolio securities is available without charge, upon request, from our Client Services department at 800 959 4246 or at invesco.com/proxyguidelines. The information is also available on the SEC website, sec.gov.
| | |
Information regarding how the Fund voted proxies related to its portfolio securities during the most recent 12-month period ended June 30 is available at invesco.com/proxysearch. The information is also available on the SEC website, sec.gov. Invesco Advisers, Inc. is an investment adviser; it provides investment advisory services to individual and institutional clients and does not sell securities. Invesco Distributors, Inc. is the US distributor for Invesco Ltd.’s retail mutual funds, exchange-traded funds and institutional money market funds. Both are wholly owned, indirect subsidiaries of Invesco Ltd. | |  |
| | | | | | | | |
| SEC file numbers: 811-05426 and 033-19338 | | Invesco Distributors, Inc. | | MAIN-AR-1 | | 12212017 | | 1141 |
Letters to Shareholders
| | | | |

Philip Taylor | | | | Dear Shareholders: This annual report includes information about your Fund, including performance data and a complete list of its investments as of the close of the reporting period. Inside is a discussion of how your Fund was managed and the factors that affected its performance during the reporting period. American voters went to the polls just days after the start of the reporting period, and their decisions quickly affected markets. The US stock market rallied strongly after the election, with major market indexes rising, and setting record highs, throughout the reporting period. Generally positive economic data, strong corporate earnings and hope for tax and regulatory reform contributed to the rally. US and global bond markets, as well as emerging market equities, sold off immediately following the election – with the US bond market eventually recovering most of its losses. Overseas, economic data were mixed, prompting the European Central Bank and central banks in China and Japan, among other countries, to maintain extraordinarily accommodative |
monetary policies. Citing positive economic trends – specifically, realized and expected labor market conditions and inflation – the US Federal Reserve raised interest rates three times during the reporting period: first in December 2016, and then again in March and June 2017. Health care and tax reform proved to be more difficult than expected to enact, with little progress achieved by the end of the reporting period.
Short-term market volatility can prompt some investors to abandon their investment plans – and can cause others to settle for whatever returns the market has to offer. The investment professionals at Invesco, in contrast, invest with high conviction. This means that, no matter the asset class or the strategy, each investment team has a passion to exceed. We want to help investors achieve better outcomes, such as seeking higher returns, helping mitigate risk and generating income. Of course, investing with high conviction can’t guarantee a profit or ensure success; no investment strategy can. To learn more about how we invest with high conviction, visit invesco.com/HighConviction.
You, too, can invest with high conviction by maintaining a long-term investment perspective and by working with your financial adviser on a regular basis. During periods of short-term market volatility or uncertainty, your financial adviser can keep you focused on your long-term investment goals – a new home, a child’s college education or a secure retirement. He or she also can share research about the economy, the markets and individual investment options.
Visit our website for more information on your investments
Our website, invesco.com/us, offers a wide range of market insights and investment perspectives. On the website, you’ll find detailed information about our funds, including performance, holdings and portfolio manager commentaries. You can access information about your account by completing a simple, secure online registration. To do so, select “Log In” on the right side of the homepage, and then select “Register for Individual Account Access.”
In addition to the resources accessible on our website and through our mobile app, you can obtain timely updates to help you stay informed about the markets and the economy by connecting with Invesco on Twitter, LinkedIn or Facebook. You can access our blog at blog.invesco.us.com. Our goal is to provide you the information you want, when and where you want it.
Finally, I’m pleased to share with you Invesco’s commitment to both the Principles for Responsible Investment and to considering environmental, social and governance issues in our robust investment process. I invite you to learn more at invesco.com/esg.
Have questions?
For questions about your account, contact an Invesco client services representative at 800 959 4246. For Invesco-related questions or comments, please email me directly at phil@invesco.com.
All of us at Invesco look forward to serving your investment management needs. Thank you for investing with us.
Sincerely,

Philip Taylor
Senior Managing Director, Invesco Ltd.
|
| 2 Invesco Pacific Growth Fund |
| | | | |

Bruce Crockett | | | | Dear Fellow Shareholders: Among the many important lessons I’ve learned in more than 40 years in a variety of business endeavors is the value of a trusted advocate. As independent chair of the Invesco Funds Board, I can assure you that the members of the Board are strong advocates for the interests of investors in Invesco’s mutual funds. We work hard to represent your interests through oversight of the quality of the investment management services your funds receive and other matters important to your investment, including but not limited to: ∎ Ensuring that Invesco offers a diverse lineup of mutual funds that your financial adviser can use to strive to meet your financial needs as your investment goals change over time. ∎ Monitoring how the portfolio management teams of the Invesco funds are performing in light of changing economic and market conditions. |
| ∎ | | Assessing each portfolio management team’s investment performance within the context of the investment strategy described in the fund’s prospectus. |
| ∎ | | Monitoring for potential conflicts of interests that may impact the nature of the services that your funds receive. |
We believe one of the most important services we provide our fund shareholders is the annual review of the funds’ advisory and sub-advisory contracts with Invesco Advisers and its affiliates. This review is required by the Investment Company Act of 1940 and focuses on the nature and quality of the services Invesco provides as the adviser to the Invesco funds and the reasonableness of the fees that it charges for those services. Each year, we spend months carefully reviewing information received from Invesco and a variety of independent sources, such as performance and fee data prepared by Lipper, Inc. (a subsidiary of Broadridge Financial Solutions, Inc.), an independent, third-party firm widely recognized as a leader in its field. We also meet with our independent legal counsel and other independent advisers to review and help us assess the information that we have received. Our goal is to assure that you receive quality investment management services for a reasonable fee.
I trust the measures outlined above provide assurance that you have a worthy advocate when it comes to choosing the Invesco Funds.
As always, please contact me at bruce@brucecrockett.com with any questions or concerns you may have. On behalf of the Board, we look forward to continuing to represent your interests and serving your needs.
Sincerely,

Bruce L. Crockett
Independent Chair
Invesco Funds Board of Trustees
|
| 3 Invesco Pacific Growth Fund |
Management’s Discussion of Fund Performance
Performance summary
For the fiscal year ended October 31, 2017, Class A shares of Invesco Pacific Growth Fund (the Fund), at net asset value (NAV), outperformed the MSCI All Country Asia Pacific Index, the Fund’s style-specific benchmark.
Your Fund’s long-term performance appears later in this report.
Fund vs. Indexes
Total returns, 10/31/16 to 10/31/17, at net asset value (NAV). Performance shown does not include applicable contingent deferred sales charges (CDSC) or front-end sales charges, which would have reduced performance.
| | | | | |
| Class A Shares | | | | 28.09 | % |
| Class B Shares | | | | 27.08 | |
| Class C Shares | | | | 27.11 | |
| Class R Shares | | | | 27.75 | |
| Class Y Shares | | | | 28.43 | |
| Class R5 Shares | | | | 28.53 | |
| Class R6 Shares* | | | | 28.33 | |
| MSCI EAFE Index▼ (Broad Market Index) | | | | 23.44 | |
| MSCI All Country Asia Pacific Index▼ (Style-Specific Index) | | | | 23.70 | |
| Lipper Pacific Region Funds Index∎ (Peer Group Index) | | | | 22.30 | |
Source(s): ▼FactSet Research Systems Inc.; ∎Lipper Inc. | | | | | |
*Class R6 shares incepted on April 4, 2017. See page 7 for more details. | | | | | |
Market conditions and your Fund
For the fiscal year ended October 31, 2017, Asia Pacific markets were strong amid favorable earnings and discounted valuations compared to developed markets. The reporting period started off with Asia Pacific markets exhibiting weakness at the end of 2016, as increasing concerns about possible US protectionist policies overshadowed the region’s positive economic developments. A strong US dollar also had a negative impact, with most Asian currencies trending lower.
In the first half of 2017, Asia Pacific markets strengthened, posting double-digit gains across key markets. India’s market ended the first quarter as the best-performing Asian market, with its economy gradually recovering from the temporary disruption caused by a demonetization of its currency. Asia Pacific markets extended their gains in the second quarter as economic conditions
further improved. Corporate earnings were strong as sales rose and lower costs expanded profit margins.
In the second half of 2017, Asia Pacific markets continued their year-to-date gains. Macroeconomic data remained strong, with official manufacturing Purchasing Managers’ Index and industrial profits data indicating robust domestic economies. Japanese stocks rallied in September as investors finally stepped into the markets with hope that strong corporate earnings, combined with a decent macro economy and Prime Minister Abe’s decision to call a snap election, would push Japanese stocks higher.
On a geographic basis, positive stock selection in Japan was the leading contributor to Fund performance versus the MSCI All Country Asia Pacific Index. Stock selection in China and India contributed to Fund outperformance versus the style-specific index, as well.
In contrast, negative stock selection in South Korea was the leading detractor from the Fund’s performance versus the style-specific index. Holdings in Thailand, Indonesia and Singapore detracted from relative results. An underweight position in Indonesia was also a drag on the Fund’s relative performance.
At the sector level, stock selection in and overweight exposure to the information technology (IT) sector led out performance versus the MSCI All Country Asia Pacific Index. Contributors included China-based internet gaming leader Tencent Holdings and Japan-based Yaskawa Electric, which both delivered solid earnings for the reporting period.
Stock selection in the industrials and financials sectors also contributed to Fund performance relative to its style-specific index during the reporting period. Airport owner and operator Beijing Capital International Airport was the largest contributor within the industrials sector. We sold our position in Beijing Capital International Airport before the close of the reporting period. Bajaj Finance, an Indian financial services company, was a leading contributor within the financials sector. The consumer finance company recovered strongly from a fourth quarter 2016 correction due to temporary disruption from demonetization.
Conversely, stock selection in the utilities sector detracted from both absolute and relative Fund performance. Guangdong Investment, a Chinese company that operates utilities through its subsidiaries, was the leading detractor from relative Fund performance within the sector. Australia-based APA Group, a company that owns and operates natural gas and electricity assets, also detracted from the Fund’s relative performance during the reporting period. We sold our positions in Guangdong Investment and APA Group before the close of the reporting period.
| | | | | |
Portfolio Composition | |
| By sector | | | | % of total net assets | |
| | | | | |
| |
| Information Technology | | | | 35.6 | % |
| Industrials | | | | 17.4 | |
| Consumer Discretionary | | | | 14.1 | |
| Financials | | | | 11.3 | |
| Consumer Staples | | | | 9.9 | |
| Materials | | | | 5.6 | |
| Real Estate | | | | 1.7 | |
| Health Care | | | | 1.1 | |
| Telecommunication Services | | | | 0.8 | |
| | | | | |
Money Market Funds Plus Other Assets Less Liabilities | | | | 2.5 | |
| | | | | | | | | | |
Top 10 Equity Holdings* |
| | % of total net assets |
| | | | | | | | | | |
| | |
| 1. | | Tencent Holdings Ltd. | | | | 9.0 | % |
| 2. | | Taiwan Semiconductor Manufacturing Co. Ltd. | | | | 5.1 | |
| 3. | | Samsung Electronics Co., Ltd. | | | | 4.9 | |
| 4. | | AIA Group Ltd. | | | | 3.1 | |
| 5. | | Maruti Suzuki India Ltd. | | | | 2.6 | |
| 6. | | Britannia Industries Ltd. | | | | 2.3 | |
| 7. | | Sumitomo Metal Mining Co., Ltd. | | | | 2.3 | |
| 8. | | Bajaj Finance Ltd. | | | | 2.2 | |
| 9. | | Komatsu Ltd. | | | | 2.1 | |
| 10. | | Baidu, Inc.-ADR | | | | 2.1 | |
| | | | | |
Total Net Assets | | | | $104.8 million | |
| Total Number of Holdings* | | | | 58 | |
The Fund’s holdings are subject to change, and there is no assurance that the Fund will continue to hold any particular security.
*Excluding money market fund holdings.
Data presented here are as of October 31, 2017.
|
| 4 Invesco Pacific Growth Fund |
Underweight exposure to the relatively strong materials sector was another detractor from Fund performance versus the style-specific index.
The Fund’s cash position, which averaged around 3.5% during the reporting period, was a key detractor from relative Fund performance, given rising equity markets.
During the reporting period, the Fund’s Asia Pacific ex-Japan allocation favored consumer-related sectors, with overweight positions in the IT, consumer discretionary and consumer staples sectors and underweight positions in the financials and energy sectors. The Fund’s Japan position focused on attractively priced stocks across a broad range of sectors that have sound corporate governance and competent management and are transforming to create sustainable corporate value.
We continue to look for stocks that have a competitive edge to successfully expand businesses over the long term, and stocks with positive fundamentals and prospects across a broad range of sectors.
We thank you for your continued investment in Invesco Pacific Growth Fund.
The views and opinions expressed in management’s discussion of Fund performance are those of Invesco Advisers, Inc. These views and opinions are subject to change at any time based on factors such as market and economic conditions. These views and opinions may not be relied upon as investment advice or recommendations, or as an offer for a particular security. The information is not a complete analysis of every aspect of any market, country, industry, security or the Fund. Statements of fact are from sources considered reliable, but Invesco Advisers, Inc. makes no representation or warranty as to their completeness or accuracy. Although historical performance is no guarantee of future results, these insights may help you understand our investment management philosophy.
See important Fund and, if applicable, index disclosures later in this report.
| | |
 | | Paul Chan Chartered Financial Analyst, Portfolio Manager, is manager of Invesco Pacific Growth Fund. He joined Invesco in 2001. Mr. Chan |
| earned a BS in economics from the University of Manitoba. |
| |
 | | Daiji Ozawa Chartered Financial Analyst, Portfolio Manager, is manager of Invesco Pacific Growth Fund. He joined Invesco in 2010. Mr. Ozawa |
| earned a BA in political science from Waseda University. |
|
| 5 Invesco Pacific Growth Fund |
Your Fund’s Long-Term Performance
Results of a $10,000 Investment – Oldest Share Class(es)
Fund and index data from 10/31/07
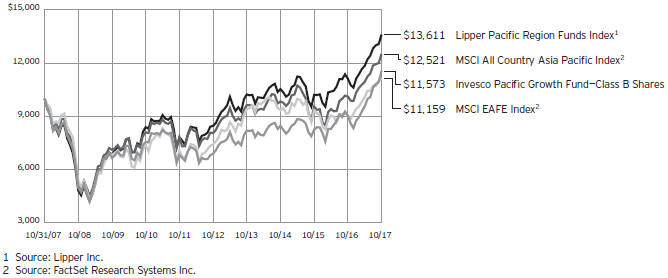
Past performance cannot guarantee comparable future results.
The data shown in the chart include reinvested distributions, applicable sales charges and Fund expenses including management fees. Results for Class B shares are calculated as if a hypothetical shareholder had liquidated his entire investment in the Fund at the close of the reporting period and paid the contingent deferred sales charges, if applicable.
Index results include reinvested dividends, but they do not reflect sales charges. Performance of the peer group, if applicable, reflects fund expenses and management fees; performance of a market index does not. Performance shown in the chart and table(s) does not reflect deduction of taxes a shareholder would pay on Fund distributions or sale of Fund shares.
|
| 6 Invesco Pacific Growth Fund |
| | | | |
Average Annual Total Returns | |
| As of 10/31/17, including maximum applicable sales charges | |
| |
| Class A Shares | | | | |
| Inception (7/28/97) | | | 3.06 | % |
| 10 Years | | | 1.50 | |
| 5 Years | | | 10.16 | |
| 1 Year | | | 21.05 | |
| |
| Class B Shares | | | | |
| Inception (11/30/90) | | | 5.50 | % |
| 10 Years | | | 1.47 | |
| 5 Years | | | 10.31 | |
| 1 Year | | | 22.08 | |
| |
| Class C Shares | | | | |
| Inception (7/28/97) | | | 2.60 | % |
| 10 Years | | | 1.34 | |
| 5 Years | | | 10.58 | |
| 1 Year | | | 26.11 | |
| |
| Class R Shares | | | | |
| Inception (3/31/08) | | | 4.19 | % |
| 5 Years | | | 11.12 | |
| 1 Year | | | 27.75 | |
| |
| Class Y Shares | | | | |
| Inception (7/28/97) | | | 3.60 | % |
| 10 Years | | | 2.35 | |
| 5 Years | | | 11.69 | |
| 1 Year | | | 28.43 | |
| |
| Class R5 Shares | | | | |
| 10 Years | | | 2.33 | % |
| 5 Years | | | 11.84 | |
| 1 Year | | | 28.53 | |
| |
| Class R6 Shares | | | | |
| 10 Years | | | 2.10 | % |
| 5 Years | | | 11.46 | |
| 1 Year | | | 28.33 | |
Effective June 1, 2010, Class A, Class B, Class C, Class R, Class W and Class I shares of the predecessor fund, Morgan Stanley Pacific Growth Fund Inc., advised by Morgan Stanley Investment Advisors Inc. were reorganized into Class A, Class B, Class C, Class R, Class A and Class Y shares, respectively, of Invesco Pacific Growth Fund. Returns shown above, prior to June 1, 2010, for Class A, Class B, Class C, Class R and Class Y shares are blended returns of the predecessor fund and Invesco Pacific Growth Fund. Share class returns will differ from the predecessor fund because of different expenses.
Class R5 shares incepted on May 23, 2011. Performance shown prior to that date is that of the Fund’s and the predecessor
| | | | |
Average Annual Total Returns | |
| As of 9/30/17, the most recent calendar quarter end, including maximum applicable sales charges | |
| |
| Class A Shares | | | | |
| Inception (7/28/97) | | | 2.78 | % |
| 10 Years | | | 1.81 | |
| 5 Years | | | 9.17 | |
| 1 Year | | | 11.44 | |
| |
| Class B Shares | | | | |
| Inception (11/30/90) | | | 5.29 | % |
| 10 Years | | | 1.78 | |
| 5 Years | | | 9.31 | |
| 1 Year | | | 12.04 | |
| |
| Class C Shares | | | | |
| Inception (7/28/97) | | | 2.33 | % |
| 10 Years | | | 1.65 | |
| 5 Years | | | 9.59 | |
| 1 Year | | | 16.04 | |
| |
| Class R Shares | | | | |
| Inception (3/31/08) | | | 3.62 | % |
| 5 Years | | | 10.13 | |
| 1 Year | | | 17.63 | |
| |
| Class Y Shares | | | | |
| Inception (7/28/97) | | | 3.32 | % |
| 10 Years | | | 2.66 | |
| 5 Years | | | 10.68 | |
| 1 Year | | | 18.22 | |
| |
| Class R5 Shares | | | | |
| 10 Years | | | 2.64 | % |
| 5 Years | | | 10.84 | |
| 1 Year | | | 18.37 | |
| |
| Class R6 Shares | | | | |
| 10 Years | | | 2.41 | % |
| 5 Years | | | 10.45 | |
| 1 Year | | | 18.12 | |
fund’s Class A shares and includes the 12b-1 fees applicable to Class A shares.
Class R6 shares incepted on April 4, 2017. Performance shown prior to that date is that of the Fund’s and the predecessor fund’s Class A shares and includes the 12b-1 fees applicable to Class A shares.
The performance data quoted represent past performance and cannot guarantee comparable future results; current performance may be lower or higher. Please visit invesco.com/performance for the most recent month-end performance. Performance figures reflect reinvested distributions, changes in net asset value and the effect of the maximum sales charge unless otherwise stated.
Investment return and principal value will fluctuate so that you may have a gain or loss when you sell shares.
The total annual Fund operating expense ratio set forth in the most recent Fund prospectus as of the date of this report for Class A, Class B, Class C, Class R, Class Y, Class R5 and Class R6 shares was 1.64%, 2.39%, 2.37%, 1.89%, 1.39%, 1.28% and 1.22%, respectively. The expense ratios presented above may vary from the expense ratios presented in other sections of this report that are based on expenses incurred during the period covered by this report.
Class A share performance reflects the maximum 5.50% sales charge, and Class B and Class C share performance reflects the applicable contingent deferred sales charge (CDSC) for the period involved. The CDSC on Class B shares declines from 5% beginning at the time of purchase to 0% at the beginning of the seventh year. The CDSC on Class C shares is 1% for the first year after purchase. Class R, Class Y, Class R5 and Class R6 shares do not have a front-end sales charge or a CDSC; therefore, performance is at net asset value.
The performance of the Fund’s share classes will differ primarily due to different sales charge structures and class expenses.
Fund performance reflects any applicable fee waivers and/or expense reimbursements. Had the adviser not waived fees and/or reimbursed expenses currently or in the past, returns would have been lower. See current prospectus for more information.
|
| 7 Invesco Pacific Growth Fund |
Invesco Pacific Growth’s Fund’s investment objective is long-term growth of capital.
| ∎ | | Unless otherwise stated, information presented in this report is as of October 31, 2017, and is based on total net assets. |
| ∎ | | Unless otherwise noted, all data provided by Invesco. |
| ∎ | | To access your Fund’s reports/prospectus, visit invesco.com/fundreports. |
About share classes
| ∎ | | Class B shares may not be purchased for new or additional investments. Please see the prospectus for more information. |
| ∎ | | Class R shares are generally available only to employer sponsored retirement and benefit plans. Please see the prospectus for more information. |
| ∎ | | Class Y shares are available only to certain investors. Please see the prospectus for more information. |
| ∎ | | Class R5 shares and Class R6 shares are available for use by retirement plans that meet certain standards and for institutional investors. Class R6 shares are also available through intermediaries that have established an agreement with Invesco Distributors, Inc. to make such shares available for use in retail omnibus accounts. Please see the prospectus for more information. |
Principal risks of investing in the Fund
| ∎ | | Asia Pacific region (including Japan) risk. The level of development of the economies of countries in the Asia Pacific region varies greatly. Furthermore, since the economies of the countries in the region are largely intertwined, if an economic recession is experienced by any of these countries, it will likely adversely impact the economic performance of other countries in the region. Certain economies in the region may be adversely affected by increased competition, high inflation rates, undeveloped financial services sectors, currency fluctuations or restrictions, political and social instability and increased economic volatility. The Fund’s Japanese investments may be adversely affected by protectionist trade policies, slow economic activity worldwide, dependence on exports and international trade, increasing competition from Asia’s other low-cost emerging economies, political and social instability, regional and global conflicts |
| | | and natural disasters, as well as by commodity markets fluctuations related to Japan’s limited natural resource supply. |
| ∎ | | Depositary receipts risk. Investing in depositary receipts involves the same risks as direct investments in foreign securities. In addition, the underlying issuers of certain depositary receipts are under no obligation to distribute shareholder communications or pass through any voting rights with respect to the deposited securities to the holders of such receipts. The Fund may therefore receive less timely information or have less control than if it invested directly in the foreign issuer. |
| ∎ | | Derivatives risk. The value of a derivative instrument depends largely on (and is derived from) the value of an underlying security, currency, commodity, interest rate, index or other asset (each referred to as an underlying asset). In addition to risks relating to the underlying assets, the use of derivatives may include other, possibly greater, risks, including counterparty, leverage and liquidity risks. Counterparty risk is the risk that the counterparty to the derivative contract will default on its obligation to pay the Fund the amount owed or otherwise perform under the derivative contract. Derivatives create leverage risk because they do not require payment up front equal to the economic exposure created by owning the derivative. As a result, an adverse change in the value of the underlying asset could result in the Fund sustaining a loss that is substantially greater than the amount invested in the derivative, which may make the Fund’s returns more volatile and increase the risk of loss. Derivative instruments may also be less liquid than more traditional investments and the Fund may be unable to sell or close out its derivative positions at a desirable time or price. This risk may be more acute under adverse market conditions, during which the Fund may be |
| | | most in need of liquidating its derivative positions. Derivatives may also be harder to value, less tax efficient and subject to changing government regulation that could impact the Fund’s ability to use certain derivatives or their cost. Also, derivatives used for hedging or to gain or limit exposure to a particular market segment may not provide the expected benefits, particularly during adverse market conditions. |
| ∎ | | Emerging markets securities risk. Emerging markets (also referred to as developing markets) are generally subject to greater market volatility, political, social and economic instability, uncertain trading markets and more governmental limitations on foreign investment than more developed markets. In addition, companies operating in emerging markets may be subject to lower trading volume and greater price fluctuations than companies in more developed markets. Securities law and the enforcement of systems of taxation in many emerging market countries may change quickly and unpredictably. In addition, investments in emerging markets securities may also be subject to additional transaction costs, delays in settlement procedures, and lack of timely information. |
| ∎ | | Foreign securities risk. The Fund’s foreign investments may be adversely affected by political and social instability, changes in economic or taxation policies, difficulty in enforcing obligations, decreased liquidity or increased volatility. Foreign investments also involve the risk of the possible seizure, nationalization or expropriation of the issuer or foreign deposits (in which the Fund could lose its entire investments in a certain market) and the possible adoption of foreign governmental restrictions such as exchange controls. Unless the Fund has hedged its foreign securities risk, foreign securities risk also involves the risk of negative foreign currency rate fluctuations, which may cause the value of securities denominated in such foreign currency (or other instruments through which the Fund has exposure to foreign currencies) to decline in value. Currency exchange rates may fluctuate significantly over short periods of time. Currency hedging strategies, if used, are not always successful. |
|
This report must be accompanied or preceded by a currently effective Fund prospectus, which contains more complete information, including sales charges and expenses. Investors should read it carefully before investing. |
|
|
| NOT FDIC INSURED | MAY LOSE VALUE | NO BANK GUARANTEE |
|
| 8 Invesco Pacific Growth Fund |
| ∎ | | Geographic focus risk. The Fund may from time to time invest a substantial amount of its assets in securities of issuers located in a single country or a limited number of countries. Adverse economic, political or social conditions in those countries may therefore have a significant negative impact on the Fund’s investment performance. |
| ∎ | | Growth investing risk. Growth stocks tend to be more expensive relative to the issuing company’s earnings or assets compared with other types of stock. As a result, they tend to be more sensitive to changes in, or investors’ expectations of, the issuing company’s earnings and can be more volatile. |
| ∎ | | Management risk. The Fund is actively managed and depends heavily on the Adviser’s judgment about markets, interest rates or the attractiveness, relative values, liquidity, or potential appreciation of particular investments made for the Fund’s portfolio. The Fund could experience losses if these judgments prove to be incorrect. Additionally, legislative, regulatory, or tax developments may adversely affect management of the Fund and, therefore, the ability of the Fund to achieve its investment objective. |
| ∎ | | Market risk. The market values of the Fund’s investments, and therefore the value of the Fund’s shares, will go up and down, sometimes rapidly or unpredictably. Market risk may affect a single issuer, industry or section of the economy, or it may affect the market as a whole. Individual stock prices tend to go up and down more dramatically than those of certain other types of investments, such as bonds. During a general downturn in the financial markets, multiple asset classes may decline in value. When markets perform well, there can be no assurance that specific investments held by the Fund will rise in value. |
| ∎ | | Preferred securities risk. Preferred securities are subject to issuer-specific and market risks applicable generally to equity securities. Preferred securities also may be subordinated to bonds or other debt instruments, subjecting them to a greater risk of non-payment, may be less liquid than many other securities, such as common stocks, and generally offer no voting rights with respect to the issuer. |
| ∎ | | Small- and mid-capitalization companies risks. Small- and mid-capitalization companies tend to be more vulnerable to changing market conditions, may have little or no operating history or track record of success, and may have more limited product lines and markets, less experienced management and fewer financial resources than larger companies. These companies’ securities may be more volatile and less liquid than those of more established companies, and their returns may vary, sometimes significantly, from the overall securities market |
About indexes used in this report
| ∎ | | The MSCI EAFE® Index is an unmanaged index considered representative of stocks of Europe, Australasia and the Far East. The index is computed using the net return, which withholds applicable taxes for non-resident investors. |
| ∎ | | The MSCI All Country Asia Pacific Index is an unmanaged index considered representative of Asia Pacific region stock markets. The index is computed using the net return, which withholds applicable taxes for non-resident investors. |
| ∎ | | The Lipper Pacific Region Funds Index is an unmanaged index considered representative of Pacific region funds tracked by Lipper. |
| ∎ | | The Fund is not managed to track the performance of any particular index, including the index(es) described here, and consequently, the performance of the Fund may deviate significantly from the performance of the index(es). |
| ∎ | | A direct investment cannot be made in an index. Unless otherwise indicated, index results include reinvested dividends, and they do not reflect sales charges. Performance of the peer group, if applicable, reflects fund expenses; performance of a market index does not. |
Other information
| ∎ | | The returns shown in management’s discussion of Fund performance are based on net asset values (NAVs) calculated for shareholder transactions. Generally accepted accounting principles require adjustments to be made to the net assets of the Fund at period end |
| | | for financial reporting purposes, and as such, the NAVs for shareholder transactions and the returns based on those NAVs may differ from the NAVs and returns reported in the Financial Highlights. |
| ∎ | | Industry classifications used in this report are generally according to the Global Industry Classification Standard, which was developed by and is the exclusive property and a service mark of MSCI Inc. and Standard & Poor’s. |
|
| 9 Invesco Pacific Growth Fund |
Schedule of Investments
October 31, 2017
| | | | | | | | |
| | | Shares | | | Value | |
Common Stocks & Other Equity Interests–97.52% | |
| Australia–5.40% | |
Cochlear Ltd. | | | 8,261 | | | $ | 1,115,365 | |
Commonwealth Bank of Australia | | | 484 | | | | 28,758 | |
National Australia Bank Ltd. | | | 30,256 | | | | 759,482 | |
Orora Ltd. | | | 823,356 | | | | 2,142,669 | |
Treasury Wine Estates Ltd. | | | 133,597 | | | | 1,610,045 | |
| | | | | | | | 5,656,319 | |
|
| China–15.48% | |
Baidu, Inc.–ADR(a) | | | 8,820 | | | | 2,151,551 | |
China Animal Healthcare Ltd.(a)(b) | | | 349,000 | | | | 58,156 | |
China Literature Ltd.(a)(c) | | | 165 | | | | 1,175 | |
Ping An Insurance (Group) Co. of China Ltd.–Class H | | | 237,000 | | | | 2,080,973 | |
Semiconductor Manufacturing International Corp.(a) | | | 349,500 | | | | 535,804 | |
Sunny Optical Technology Group Co., Ltd. | | | 67,000 | | | | 980,773 | |
Tencent Holdings Ltd. | | | 208,100 | | | | 9,373,256 | |
ZTE Corp.–Class H(a) | | | 300,600 | | | | 1,042,278 | |
| | | | | | | | 16,223,966 | |
|
| Hong Kong–3.05% | |
AIA Group Ltd. | | | 424,800 | | | | 3,196,319 | |
Henderson Land Development Co. Ltd. | | | 121 | | | | 789 | |
| | | | | | | | 3,197,108 | |
|
| India–8.87% | |
Bajaj Finance Ltd. | | | 83,463 | | | | 2,321,070 | |
Britannia Industries Ltd. | | | 33,795 | | | | 2,421,590 | |
Eicher Motors Ltd. | | | 3,724 | | | | 1,853,928 | |
Maruti Suzuki India Ltd. | | | 21,270 | | | | 2,697,452 | |
| | | | | | | | 9,294,040 | |
|
| Indonesia–2.56% | |
PT Telekomunikasi Indonesia Persero Tbk | | | 2,828,100 | | | | 844,603 | |
PT Unilever Indonesia Tbk | | | 502,300 | | | | 1,836,915 | |
| | | | | | | | 2,681,518 | |
|
| Japan–41.63% | |
Aida Engineering, Ltd. | | | 117,500 | | | | 1,360,564 | |
Daikin Industries, Ltd. | | | 19,200 | | | | 2,126,887 | |
Daiwa House Industry Co., Ltd. | | | 48,900 | | | | 1,793,680 | |
Fukushima Industries Corp. | | | 44,600 | | | | 1,724,411 | |
H.I.S. Co., Ltd. | | | 56,000 | | | | 1,885,596 | |
Hitachi High-Technologies Corp. | | | 35,800 | | | | 1,501,835 | |
K’s Holdings Corp. | | | 51,100 | | | | 1,172,251 | |
Kakaku.com, Inc. | | | 94,200 | | | | 1,295,133 | |
Komatsu Ltd. | | | 67,900 | | | | 2,234,907 | |
Konoike Transport Co., Ltd. | | | 98,200 | | | | 1,507,248 | |
Mitsubishi Corp. | | | 73,300 | | | | 1,717,722 | |
Nidec Corp. | | | 16,200 | | | | 2,144,648 | |
| | | | | | | | |
| | | Shares | | | Value | |
| Japan–(continued) | |
Nifco Inc. | | | 29,000 | | | $ | 1,897,874 | |
Omron Corp. | | | 33,800 | | | | 1,886,453 | |
Otsuka Corp. | | | 24,500 | | | | 1,659,337 | |
Paltac Corp. | | | 33,400 | | | | 1,320,547 | |
Persol Holdings Co., Ltd. | | | 37,600 | | | | 926,688 | |
Pilot Corp. | | | 18,800 | | | | 950,199 | |
Resorttrust, Inc. | | | 75,300 | | | | 1,487,087 | |
SCSK Corp. | | | 26,600 | | | | 1,149,447 | |
Sekisui Chemical Co., Ltd. | | | 83,800 | | | | 1,690,835 | |
Seria Co., Ltd. | | | 13,200 | | | | 750,040 | |
Sompo Holdings, Inc. | | | 47,600 | | | | 1,903,098 | |
Sumitomo Metal Mining Co., Ltd. | | | 59,900 | | | | 2,366,232 | |
Tsubakimoto Chain Co. | | | 190,000 | | | | 1,632,903 | |
Yamaha Motor Co., Ltd. | | | 62,900 | | | | 1,883,308 | |
Yaskawa Electric Corp. | | | 46,400 | | | | 1,648,834 | |
| | | | | | | | 43,617,764 | |
|
| Philippines–1.51% | |
Ayala Corp. | | | 78,980 | | | | 1,579,600 | |
|
| South Korea–10.95% | |
AMOREPACIFIC Group | | | 13,299 | | | | 1,700,751 | |
BGFretail Co., Ltd. | | | 17,214 | | | | 1,215,370 | |
NAVER Corp. | | | 2,206 | | | | 1,767,012 | |
Nongshim Co., Ltd. | | | 2,864 | | | | 888,337 | |
Ottogi Corp. | | | 1,079 | | | | 730,993 | |
Samsung Electronics Co., Ltd. | | | 2,102 | | | | 5,174,483 | |
| | | | | | | | 11,476,946 | |
|
| Taiwan–6.78% | |
Largan Precision Co., Ltd. | | | 9,000 | | | | 1,717,119 | |
Taiwan Semiconductor Manufacturing Co. Ltd. | | | 667,143 | | | | 5,388,007 | |
| | | | | | | | 7,105,126 | |
|
| Thailand–1.29% | |
Siam Cement PCL (The) | | | 92,200 | | | | 1,354,087 | |
Total Common Stocks & Other Equity Interests
(Cost $75,747,144) | | | | 102,186,474 | |
|
Money Market Funds–3.21% | |
Invesco Government & Agency Portfolio–Institutional Class, 0.95%(d) | | | 2,021,286 | | | | 2,021,286 | |
Invesco Treasury Portfolio–Institutional Class, 0.94%(d) | | | 1,347,523 | | | | 1,347,523 | |
Total Money Market Funds
(Cost $3,368,809) | | | | 3,368,809 | |
TOTAL INVESTMENTS IN SECURITIES–100.73%
(Cost $79,115,953) | | | | 105,555,283 | |
OTHER ASSETS LESS LIABILITIES–(0.73)% | | | | (768,593 | ) |
NET ASSETS–100.00% | | | $ | 104,786,690 | |
See accompanying Notes to Financial Statements which are an integral part of the financial statements.
10 Invesco Pacific Growth Fund
Investment Abbreviations:
| | |
| ADR | | – American Depositary Receipt |
Notes to Schedule of Investments:
| (a) | Non-income producing security. |
| (b) | Security valued using significant unobservable inputs (Level 3). See Note 3. |
| (c) | Security purchased or received in transaction exempt from registration under the Securities Act of 1933, as amended (the “1933 Act”). The security may be resold pursuant to an exemption from registration under the 1933 Act, typically to qualified institutional buyers. The value of this security at October 31, 2017 represented less than 1% of the Fund’s Net Assets. |
| (d) | The money market fund and the Fund are affiliated by having the same investment adviser. The rate shown is the 7-day SEC standardized yield as of October 31, 2017. |
See accompanying Notes to Financial Statements which are an integral part of the financial statements.
11 Invesco Pacific Growth Fund
Statement of Assets and Liabilities
October 31, 2017
| | | | |
Assets: | |
Investments in securities, at value (Cost $75,747,144) | | $ | 102,186,474 | |
Investments in affiliated money market funds, at value and cost | | | 3,368,809 | |
Foreign currencies, at value (Cost $908,155) | | | 908,348 | |
Receivable for: | | | | |
Fund shares sold | | | 231,058 | |
Dividends | | | 327,608 | |
Investment for trustee deferred compensation and retirement plans | | | 43,261 | |
Other assets | | | 46,490 | |
Total assets | | | 107,112,048 | |
|
Liabilities: | |
Payable for: | | | | |
Investments purchased | | | 1,972,743 | |
Fund shares reacquired | | | 63,386 | |
Accrued foreign taxes | | | 63,634 | |
Accrued fees to affiliates | | | 58,809 | |
Accrued trustees’ and officers’ fees and benefits | | | 1,988 | |
Accrued other operating expenses | | | 70,091 | |
Trustee deferred compensation and retirement plans | | | 94,707 | |
Total liabilities | | | 2,325,358 | |
Net assets applicable to shares outstanding | | $ | 104,786,690 | |
|
Net assets consist of: | |
Shares of beneficial interest | | $ | 78,681,729 | |
Undistributed net investment income (loss) | | | (303,338 | ) |
Undistributed net realized gain (loss) | | | (28,535 | ) |
Net unrealized appreciation | | | 26,436,834 | |
| | | $ | 104,786,690 | |
| | | | |
Net Assets: | |
Class A | | $ | 80,319,108 | |
Class B | | $ | 113,515 | |
Class C | | $ | 5,535,246 | |
Class R | | $ | 283,297 | |
Class Y | | $ | 18,505,144 | |
Class R5 | | $ | 17,932 | |
Class R6 | | $ | 12,448 | |
|
Shares outstanding, no par value,
with an unlimited number of shares authorized: | |
Class A | | | 2,388,427 | |
Class B | | | 3,659 | |
Class C | | | 178,019 | |
Class R | | | 8,522 | |
Class Y | | | 540,467 | |
Class R5 | | | 523 | |
Class R6 | | | 363 | |
Class A: | | | | |
Net asset value per share | | $ | 33.63 | |
Maximum offering price per share | | | | |
(Net asset value of $33.63 ¸ 94.50%) | | $ | 35.59 | |
Class B: | | | | |
Net asset value and offering price per share | | $ | 31.02 | |
Class C: | | | | |
Net asset value and offering price per share | | $ | 31.09 | |
Class R: | | | | |
Net asset value and offering price per share | | $ | 33.24 | |
Class Y: | | | | |
Net asset value and offering price per share | | $ | 34.24 | |
Class R5: | | | | |
Net asset value and offering price per share | | $ | 34.29 | |
Class R6: | | | | |
Net asset value and offering price per share | | $ | 34.29 | |
See accompanying Notes to Financial Statements which are an integral part of the financial statements.
12 Invesco Pacific Growth Fund
Statement of Operations
For the year ended October 31, 2017
| | | | |
Investment income: | |
Dividends (net of foreign withholding taxes of $132,816) | | $ | 1,145,765 | |
Dividends from affiliated money market funds (includes securities lending income of $1,500) | | | 16,650 | |
Total investment income | | | 1,162,415 | |
| |
Expenses: | | | | |
Advisory fees | | | 707,519 | |
Administrative services fees | | | 50,000 | |
Custodian fees | | | 63,954 | |
Distribution fees: | | | | |
Class A | | | 165,091 | |
Class B | | | 1,175 | |
Class C | | | 45,681 | |
Class R | | | 1,216 | |
Transfer agent fees — A, B, C, R and Y | | | 148,631 | |
Transfer agent fees — R5 | | | 15 | |
Transfer agent fees — R6 | | | 6 | |
Trustees’ and officers’ fees and benefits | | | 21,740 | |
Registration and filing fees | | | 87,348 | |
Reports to shareholders | | | 51,511 | |
Professional services fees | | | 76,032 | |
Other | | | 16,073 | |
Total expenses | | | 1,435,992 | |
Less: Fees waived and expense offset arrangement(s) | | | (2,770 | ) |
Net expenses | | | 1,433,222 | |
Net investment income (loss) | | | (270,807 | ) |
|
Realized and unrealized gain (loss) from: | |
Net realized gain (loss) from: | | | | |
Investment securities (net of foreign taxes of $4,105) | | | 7,562,421 | |
Foreign currencies | | | (104,541 | ) |
| | | | 7,457,880 | |
Change in net unrealized appreciation of: | | | | |
Investment securities (net of foreign taxes of $11,861) | | | 14,011,232 | |
Foreign currencies | | | 7,793 | |
| | | | 14,019,025 | |
Net realized and unrealized gain | | | 21,476,905 | |
Net increase in net assets resulting from operations | | $ | 21,206,098 | |
See accompanying Notes to Financial Statements which are an integral part of the financial statements.
13 Invesco Pacific Growth Fund
Statement of Changes in Net Assets
For the years ended October 31, 2017 and 2016
| | | | | | | | |
| | | 2017 | | | 2016 | |
Operations: | | | | | |
Net investment income (loss) | | $ | (270,807 | ) | | $ | 114,377 | |
Net realized gain (loss) | | | 7,457,880 | | | | (1,027,017 | ) |
Change in net unrealized appreciation | | | 14,019,025 | | | | 8,105,866 | |
Net increase in net assets resulting from operations | | | 21,206,098 | | | | 7,193,226 | |
| | |
Distributions to shareholders from net investment income: | | | | | | | | |
Class A | | | (127,208 | ) | | | — | |
Class Y | | | (33,986 | ) | | | — | |
Class R5 | | | (79 | ) | | | — | |
Total distributions from net investment income | | | (161,273 | ) | | | — | |
| | |
Share transactions–net: | | | | | | | | |
Class A | | | (1,865,239 | ) | | | (7,698,132 | ) |
Class B | | | (39,194 | ) | | | (162,410 | ) |
Class C | | | (95,579 | ) | | | (764,548 | ) |
Class R | | | (18,654 | ) | | | (20,547 | ) |
Class Y | | | 5,284,080 | | | | 6,323,559 | |
Class R6 | | | 10,005 | | | | — | |
Net increase (decrease) in net assets resulting from share transactions | | | 3,275,419 | | | | (2,322,078 | ) |
Net increase in net assets | | | 24,320,244 | | | | 4,871,148 | |
| | |
Net assets: | | | | | | | | |
Beginning of year | | | 80,466,446 | | | | 75,595,298 | |
End of year (includes undistributed net investment income (loss) of $(303,338) and $43,531, respectively) | | $ | 104,786,690 | | | $ | 80,466,446 | |
Notes to Financial Statements
October 31, 2017
NOTE 1—Significant Accounting Policies
Invesco Pacific Growth Fund (the “Fund”) is a series portfolio of AIM Investment Funds (Invesco Investment Funds) (the “Trust”). The Trust is organized as a Delaware statutory trust and is registered under the Investment Company Act of 1940, as amended (the “1940 Act”), as an open-end series management investment company consisting of twenty separate series portfolios, each authorized to issue an unlimited number of shares of beneficial interest. The assets, liabilities and operations of each portfolio are accounted for separately. Information presented in these financial statements pertains only to the Fund. Matters affecting each portfolio or class will be voted on exclusively by the shareholders of such portfolio or class.
The Fund’s investment objective is long-term growth of capital.
The Fund currently consists of seven different classes of shares: Class A, Class B, Class C, Class R, Class Y, Class R5 and Class R6. Class Y shares are available only to certain investors. Class A shares are sold with a front-end sales charge unless certain waiver criteria are met and under certain circumstances load waived shares may be subject to contingent deferred sales charges (“CDSC”). Class C shares are sold with a CDSC. Class R, Class Y, Class R5 and Class R6 shares are sold at net asset value. Effective November 30, 2010, new or additional investments in Class B shares are no longer permitted. Existing shareholders of Class B shares may continue to reinvest dividends and capital gains distributions in Class B shares until they convert to Class A shares. Also, shareholders in Class B shares will be able to exchange those shares for Class B shares of other Invesco Funds offering such shares until they convert to Class A shares. Generally, Class B shares will automatically convert to Class A shares on or about the month-end, which is at least eight years after the date of purchase. Redemption of Class B shares prior to the conversion date will be subject to a CDSC.
The Fund is an investment company and accordingly follows the investment company accounting and reporting guidance in accordance with Financial Accounting Standards Board Accounting Standards Codification Topic 946, Financial Services — Investment Companies.
The following is a summary of the significant accounting policies followed by the Fund in the preparation of its financial statements.
| A. | Security Valuations — Securities, including restricted securities, are valued according to the following policy. |
A security listed or traded on an exchange (except convertible securities) is valued at its last sales price or official closing price as of the close of the customary trading session on the exchange where the security is principally traded, or lacking any sales or official closing price on a particular day, the security may be valued at the closing bid price on that day. Securities traded in the over-the-counter market are valued based on prices furnished by independent pricing services or market makers. When such securities are valued by an independent pricing service they may be considered fair valued. Futures contracts are valued at the final settlement price set by an exchange on which they are principally traded. Listed options are valued at the mean between the last bid and asked prices from the exchange on which they are principally traded. Options not
14 Invesco Pacific Growth Fund
listed on an exchange are valued by an independent source at the mean between the last bid and asked prices. For purposes of determining net asset value (“NAV”) per share, futures and option contracts generally are valued 15 minutes after the close of the customary trading session of the New York Stock Exchange (“NYSE”).
Investments in open-end and closed-end registered investment companies that do not trade on an exchange are valued at the end-of-day net asset value per share. Investments in open-end and closed-end registered investment companies that trade on an exchange are valued at the last sales price or official closing price as of the close of the customary trading session on the exchange where the security is principally traded.
Debt obligations (including convertible securities) and unlisted equities are fair valued using an evaluated quote provided by an independent pricing service. Evaluated quotes provided by the pricing service may be determined without exclusive reliance on quoted prices, and may reflect appropriate factors such as institution-size trading in similar groups of securities, developments related to specific securities, dividend rate (for unlisted equities), yield (for debt obligations), quality, type of issue, coupon rate (for debt obligations), maturity (for debt obligations), individual trading characteristics and other market data. Pricing services generally value debt obligations assuming orderly transactions of institutional round lot size, but a fund may hold or transact in the same securities in smaller, odd lot sizes. Odd lots often trade at lower prices than institutional round lots. Debt obligations are subject to interest rate and credit risks. In addition, all debt obligations involve some risk of default with respect to interest and/or principal payments.
Foreign securities’ (including foreign exchange contracts) prices are converted into U.S. dollar amounts using the applicable exchange rates as of the close of the NYSE. If market quotations are available and reliable for foreign exchange-traded equity securities, the securities will be valued at the market quotations. Because trading hours for certain foreign securities end before the close of the NYSE, closing market quotations may become unreliable. If between the time trading ends on a particular security and the close of the customary trading session on the NYSE, events occur that the investment adviser determines are significant and make the closing price unreliable, the Fund may fair value the security. If the event is likely to have affected the closing price of the security, the security will be valued at fair value in good faith using procedures approved by the Board of Trustees. Adjustments to closing prices to reflect fair value may also be based on a screening process of an independent pricing service to indicate the degree of certainty, based on historical data, that the closing price in the principal market where a foreign security trades is not the current value as of the close of the NYSE. Foreign securities’ prices meeting the approved degree of certainty that the price is not reflective of current value will be priced at the indication of fair value from the independent pricing service. Multiple factors may be considered by the independent pricing service in determining adjustments to reflect fair value and may include information relating to sector indices, American Depositary Receipts and domestic and foreign index futures. Foreign securities may have additional risks including exchange rate changes, potential for sharply devalued currencies and high inflation, political and economic upheaval, the relative lack of issuer information, relatively low market liquidity and the potential lack of strict financial and accounting controls and standards.
Securities for which market prices are not provided by any of the above methods may be valued based upon quotes furnished by independent sources. The last bid price may be used to value equity securities. The mean between the last bid and asked prices is used to value debt obligations, including corporate loans.
Securities for which market quotations are not readily available or became unreliable are valued at fair value as determined in good faith by or under the supervision of the Trust’s officers following procedures approved by the Board of Trustees. Issuer specific events, market trends, bid/asked quotes of brokers and information providers and other market data may be reviewed in the course of making a good faith determination of a security’s fair value.
The Fund may invest in securities that are subject to interest rate risk, meaning the risk that the prices will generally fall as interest rates rise and, conversely, the prices will generally rise as interest rates fall. Specific securities differ in their sensitivity to changes in interest rates depending on their individual characteristics. Changes in interest rates may result in increased market volatility, which may affect the value and/or liquidity of certain Fund investments.
Valuations change in response to many factors including the historical and prospective earnings of the issuer, the value of the issuer’s assets, general economic conditions, interest rates, investor perceptions and market liquidity. Because of the inherent uncertainties of valuation, the values reflected in the financial statements may materially differ from the value received upon actual sale of those investments.
| B. | Securities Transactions and Investment Income — Securities transactions are accounted for on a trade date basis. Realized gains or losses on sales are computed on the basis of specific identification of the securities sold. Interest income (net of withholding tax, if any) is recorded on the accrual basis from settlement date. Dividend income (net of withholding tax, if any) is recorded on the ex-dividend date. |
The Fund may periodically participate in litigation related to Fund investments. As such, the Fund may receive proceeds from litigation settlements. Any proceeds received are included in the Statement of Operations as realized gain (loss) for investments no longer held and as unrealized gain (loss) for investments still held.
Brokerage commissions and mark ups are considered transaction costs and are recorded as an increase to the cost basis of securities purchased and/or a reduction of proceeds on a sale of securities. Such transaction costs are included in the determination of net realized and unrealized gain (loss) from investment securities reported in the Statement of Operations and the Statement of Changes in Net Assets and the net realized and unrealized gains (losses) on securities per share in the Financial Highlights. Transaction costs are included in the calculation of the Fund’s net asset value and, accordingly, they reduce the Fund’s total returns. These transaction costs are not considered operating expenses and are not reflected in net investment income reported in the Statement of Operations and the Statement of Changes in Net Assets, or the net investment income per share and the ratios of expenses and net investment income reported in the Financial Highlights, nor are they limited by any expense limitation arrangements between the Fund and the investment adviser.
The Fund allocates income and realized and unrealized capital gains and losses to a class based on the relative net assets of each class.
| C. | Country Determination — For the purposes of making investment selection decisions and presentation in the Schedule of Investments, the investment adviser may determine the country in which an issuer is located and/or credit risk exposure based on various factors. These factors include the laws of the country under which the issuer is organized, where the issuer maintains a principal office, the country in which the issuer derives 50% or more of its total revenues and the country that has the primary market for the issuer’s securities, as well as other criteria. Among the other criteria that may be evaluated for making this determination are the country in which the issuer maintains 50% or more of its assets, the type of security, financial guarantees and enhancements, the nature of the collateral and the sponsor organization. Country of issuer and/or credit risk exposure has been determined to be the United States of America, unless otherwise noted. |
15 Invesco Pacific Growth Fund
| D. | Distributions — Distributions from net investment income and net realized capital gain, if any, are generally declared and paid annually and recorded on the ex-dividend date. The Fund may elect to treat a portion of the proceeds from redemptions as distributions for federal income tax purposes. |
| E. | Federal Income Taxes — The Fund intends to comply with the requirements of Subchapter M of the Internal Revenue Code of 1986, as amended (the “Internal Revenue Code”), necessary to qualify as a regulated investment company and to distribute substantially all of the Fund’s taxable earnings to shareholders. As such, the Fund will not be subject to federal income taxes on otherwise taxable income (including net realized capital gain) that is distributed to shareholders. Therefore, no provision for federal income taxes is recorded in the financial statements. |
The Fund recognizes the tax benefits of uncertain tax positions only when the position is more likely than not to be sustained. Management has analyzed the Fund’s uncertain tax positions and concluded that no liability for unrecognized tax benefits should be recorded related to uncertain tax positions. Management is not aware of any tax positions for which it is reasonably possible that the total amounts of unrecognized tax benefits will change materially in the next 12 months.
The Fund files tax returns in the U.S. Federal jurisdiction and certain other jurisdictions. Generally, the Fund is subject to examinations by such taxing authorities for up to three years after the filing of the return for the tax period.
| F. | Expenses — Fees provided for under the Rule 12b-1 plan of a particular class of the Fund are charged to the operations of such class. Transfer agency fees and expenses and other shareholder recordkeeping fees and expenses attributable to Class R5 and Class R6 are charged to such class. Sub-accounting fees attributable to Class R5 are charged to the operations of the class. Transfer agency fees and expenses and other shareholder recordkeeping fees and expenses relating to all other classes are allocated among those classes based on relative net assets. All other expenses are allocated among the classes based on relative net assets. |
| G. | Accounting Estimates — The preparation of financial statements in conformity with accounting principles generally accepted in the United States of America (“GAAP”) requires management to make estimates and assumptions that affect the reported amounts of assets and liabilities at the date of the financial statements and the reported amounts of revenues and expenses during the reporting period including estimates and assumptions related to taxation. Actual results could differ from those estimates by a significant amount. In addition, the Fund monitors for material events or transactions that may occur or become known after the period-end date and before the date the financial statements are released to print. |
| H. | Indemnifications — Under the Trust’s organizational documents, each Trustee, officer, employee or other agent of the Trust is indemnified against certain liabilities that may arise out of the performance of their duties to the Fund. Additionally, in the normal course of business, the Fund enters into contracts, including the Fund’s servicing agreements, that contain a variety of indemnification clauses. The Fund’s maximum exposure under these arrangements is unknown as this would involve future claims that may be made against the Fund that have not yet occurred. The risk of material loss as a result of such indemnification claims is considered remote. |
| I. | Securities Lending — The Fund may lend portfolio securities having a market value up to one-third of the Fund’s total assets. Such loans are secured by collateral equal to no less than the market value of the loaned securities determined daily by the securities lending provider. Such collateral will be cash or debt securities issued or guaranteed by the U.S. Government or any of its sponsored agencies. Cash collateral received in connection with these loans is invested in short-term money market instruments or affiliated money market funds and is shown as such on the Schedule of Investments. The Fund bears the risk of loss with respect to the investment of collateral. It is the Fund’s policy to obtain additional collateral from or return excess collateral to the borrower by the end of the next business day, following the valuation date of the securities loaned. Therefore, the value of the collateral held may be temporarily less than the value of the securities on loan. When loaning securities, the Fund retains certain benefits of owning the securities, including the economic equivalent of dividends or interest generated by the security. Lending securities entails a risk of loss to the Fund if, and to the extent that, the market value of the securities loaned were to increase and the borrower did not increase the collateral accordingly, and the borrower failed to return the securities. The securities loaned are subject to termination at the option of the borrower or the Fund. Upon termination, the borrower will return to the Fund the securities loaned and the Fund will return the collateral. Upon the failure of the borrower to return the securities, collateral may be liquidated and the securities may be purchased on the open market to replace the loaned securities. The Fund could experience delays and costs in gaining access to the collateral and the securities may lose value during the delay which could result in potential losses to the Fund. Some of these losses may be indemnified by the lending agent. The Fund bears the risk of any deficiency in the amount of the collateral available for return to the borrower due to any loss on the collateral invested. Dividends received on cash collateral investments for securities lending transactions, which are net of compensation to counterparties, are included in Dividends from affiliated money market funds on the Statement of Operations. The aggregate value of securities out on loan, if any, is shown as a footnote on the Statement of Assets and Liabilities. |
| J. | Foreign Currency Translations — Foreign currency is valued at the close of the NYSE based on quotations posted by banks and major currency dealers. Portfolio securities and other assets and liabilities denominated in foreign currencies are translated into U.S. dollar amounts at date of valuation. Purchases and sales of portfolio securities (net of foreign taxes withheld on disposition) and income items denominated in foreign currencies are translated into U.S. dollar amounts on the respective dates of such transactions. The Fund does not separately account for the portion of the results of operations resulting from changes in foreign exchange rates on investments and the fluctuations arising from changes in market prices of securities held. The combined results of changes in foreign exchange rates and the fluctuation of market prices on investments (net of estimated foreign tax withholding) are included with the net realized and unrealized gain or loss from investments in the Statement of Operations. Reported net realized foreign currency gains or losses arise from (1) sales of foreign currencies, (2) currency gains or losses realized between the trade and settlement dates on securities transactions, and (3) the difference between the amounts of dividends, interest, and foreign withholding taxes recorded on the Fund’s books and the U.S. dollar equivalent of the amounts actually received or paid. Net unrealized foreign currency gains and losses arise from changes in the fair values of assets and liabilities, other than investments in securities at fiscal period end, resulting from changes in exchange rates. |
The Fund may invest in foreign securities, which may be subject to foreign taxes on income, gains on investments or currency repatriation, a portion of which may be recoverable. Foreign taxes, if any, are recorded based on the tax regulations and rates that exist in the foreign markets in which the Fund invests and are shown in the Statement of Operations.
| K. | Forward Foreign Currency Contracts — The Fund may engage in foreign currency transactions either on a spot (i.e. for prompt delivery and settlement) basis, or through forward foreign currency contracts, to manage or minimize currency or exchange rate risk. |
16 Invesco Pacific Growth Fund
The Fund may also enter into forward foreign currency contracts for the purchase or sale of a security denominated in a foreign currency in order to “lock in” the U.S. dollar price of that security, or the Fund may also enter into forward foreign currency contracts that do not provide for physical settlement of the two currencies, but instead are settled by a single cash payment calculated as the difference between the agreed upon exchange rate and the spot rate at settlement based upon an agreed upon notional amount (non-deliverable forwards). The Fund will set aside liquid assets in an amount equal to the daily mark-to-market obligation for forward foreign currency contracts.
A forward foreign currency contract is an obligation between two parties (“Counterparties”) to purchase or sell a specific currency for an agreed-upon price at a future date. The use of forward foreign currency contracts does not eliminate fluctuations in the price of the underlying securities the Fund owns or intends to acquire but establishes a rate of exchange in advance. Fluctuations in the value of these contracts are measured by the difference in the contract date and reporting date exchange rates and are recorded as unrealized appreciation (depreciation) until the contracts are closed. When the contracts are closed, realized gains (losses) are recorded. Realized and unrealized gains (losses) on the contracts are included in the Statement of Operations. The primary risks associated with forward foreign currency contracts include failure of the Counterparty to meet the terms of the contract and the value of the foreign currency changing unfavorably. These risks may be in excess of the amounts reflected in the Statement of Assets and Liabilities.
NOTE 2—Advisory Fees and Other Fees Paid to Affiliates
The Trust has entered into a master investment advisory agreement with Invesco Advisers, Inc. (the “Adviser” or “Invesco”). Under the terms of the investment advisory agreement, the Fund accrues daily and pays monthly an advisory fee to the Adviser based on the annual rate of the Fund’s average daily net assets as follows:
| | | | |
| Average Daily Net Assets | | Rate | |
First $1 billion | | | 0.87% | |
Next $1 billion | | | 0.82% | |
Over $2 billion | | | 0.77% | |
For the year ended October 31, 2017, the effective advisory fees incurred by the Fund was 0.87%.
Under the terms of a master sub-advisory agreement between the Adviser and each of Invesco Asset Management Deutschland GmbH, Invesco Asset Management Limited, Invesco Asset Management (Japan) Limited, Invesco Hong Kong Limited, Invesco Senior Secured Management, Inc. and Invesco Canada Ltd. (collectively, the “Affiliated Sub-Advisers”) the Adviser, not the Fund, will pay 40% of the fees paid to the Adviser to any such Affiliated Sub-Adviser(s) that provide(s) discretionary investment management services to the Fund based on the percentage of assets allocated to such Affiliated Sub-Adviser(s).
The Adviser has contractually agreed, through at least June 30, 2018, to waive advisory fees and/or reimburse expenses of all shares to the extent necessary to limit total annual fund operating expenses after fee waiver and/or expense reimbursement (excluding certain items discussed below) of Class A, Class B, Class C, Class R, Class Y, Class R5 and Class R6 shares to 2.25%, 3.00%, 3.00%, 2.50%, 2.00%, 2.00% and 2.00%, respectively, of the Fund’s average daily net assets (the “expense limits”). In determining the Adviser’s obligation to waive advisory fees and/or reimburse expenses, the following expenses are not taken into account, and could cause the total annual fund operating expenses after fee waiver and/or expense reimbursement to exceed the numbers reflected above: (1) interest; (2) taxes; (3) dividend expense on short sales; (4) extraordinary or non-routine items, including litigation expenses; and (5) expenses that the Fund has incurred but did not actually pay because of an expense offset arrangement. Unless Invesco continues the fee waiver agreement, it will terminate on June 30, 2018. During its term, the fee waiver agreement cannot be terminated or amended to increase the expense limits without approval of the Board of Trustees. The Adviser did not waive fees and/or reimburse expenses during the period under these expense limits.
Further, the Adviser has contractually agreed, through at least June 30, 2019, to waive the advisory fee payable by the Fund in an amount equal to 100% of the net advisory fees the Adviser receives from the affiliated money market funds on investments by the Fund of uninvested cash (excluding investments of cash collateral from securities lending) in such affiliated money market funds.
For the year ended October 31, 2017, the Adviser waived advisory fees of $1,929.
The Trust has entered into a master administrative services agreement with Invesco pursuant to which the Fund has agreed to pay Invesco for certain administrative costs incurred in providing accounting services to the Fund. For the year ended October 31, 2017, expenses incurred under the agreement are shown in the Statement of Operations as Administrative services fees.
The Trust has entered into a transfer agency and service agreement with Invesco Investment Services, Inc. (“IIS”) pursuant to which the Fund has agreed to pay IIS a fee for providing transfer agency and shareholder services to the Fund and reimburse IIS for certain expenses incurred by IIS in the course of providing such services. IIS may make payments to intermediaries that provide omnibus account services, sub-accounting services and/or networking services. All fees payable by IIS to intermediaries that provide omnibus account services or sub-accounting services are charged back to the Fund, subject to certain limitations approved by the Trust’s Board of Trustees. For the year ended October 31, 2017, expenses incurred under the agreement are shown in the Statement of Operations as Transfer agent fees.
Shares of the Fund are distributed by Invesco Distributors, Inc. (“IDI”), an affiliate of the Adviser. The Fund has adopted a Plan of Distribution (the “Plan”) pursuant to Rule 12b-1 under the 1940 Act. The Plan provides that the Fund will reimburse IDI for distribution related expenses that IDI incurs up to a maximum of the following annual rates: (1) Class A — up to 0.25% of the average daily net assets of Class A shares; (2) Class B — up to 1.00% of the average daily net assets of Class B shares; (3) Class C — up to 1.00% of the average daily net assets of Class C shares; and (4) Class R — up to 0.50% of the average daily net assets of Class R shares. The fees are accrued daily and paid monthly.
In the case of Class B shares, provided that the Plan continues in effect, any cumulative expenses incurred by IDI, but not yet reimbursed to IDI, may be recovered through the payment of future distribution fees from the Fund pursuant to the Plan and contingent deferred sales charges paid by investors upon redemption of Class B shares.
For the year ended October 31, 2017, expenses incurred under these agreements are shown in the Statement of Operations as Distribution fees.
Front-end sales commissions and CDSC (collectively, the “sales charges”) are not recorded as expenses of the Fund. Front-end sales commissions are deducted from proceeds from the sales of Fund shares prior to investment in Class A shares of the Fund. CDSC are deducted from redemption
17 Invesco Pacific Growth Fund
proceeds prior to remittance to the shareholder. During the year ended October 31, 2017, IDI advised the Fund that IDI retained $4,332 in front-end sales commissions from the sale of Class A shares and $804 and $671 from Class A and Class C shares, respectively, for CDSC imposed on redemptions by shareholders.
Certain officers and trustees of the Trust are officers and directors of the Adviser, IIS and/or IDI.
NOTE 3—Additional Valuation Information
GAAP defines fair value as the price that would be received to sell an asset or paid to transfer a liability in an orderly transaction between market participants at the measurement date, under current market conditions. GAAP establishes a hierarchy that prioritizes the inputs to valuation methods, giving the highest priority to readily available unadjusted quoted prices in an active market for identical assets (Level 1) and the lowest priority to significant unobservable inputs (Level 3), generally when market prices are not readily available or are unreliable. Based on the valuation inputs, the securities or other investments are tiered into one of three levels. Changes in valuation methods may result in transfers in or out of an investment’s assigned level:
| | Level 1 — | Prices are determined using quoted prices in an active market for identical assets. |
| | Level 2 — | Prices are determined using other significant observable inputs. Observable inputs are inputs that other market participants may use in pricing a security. These may include quoted prices for similar securities, interest rates, prepayment speeds, credit risk, yield curves, loss severities, default rates, discount rates, volatilities and others. |
| | Level 3 — | Prices are determined using significant unobservable inputs. In situations where quoted prices or observable inputs are unavailable (for example, when there is little or no market activity for an investment at the end of the period), unobservable inputs may be used. Unobservable inputs reflect the Fund’s own assumptions about the factors market participants would use in determining fair value of the securities or instruments and would be based on the best available information. |
The following is a summary of the tiered valuation input levels, as of October 31, 2017. The level assigned to the securities valuations may not be an indication of the risk or liquidity associated with investing in those securities. Because of the inherent uncertainties of valuation, the values reflected in the financial statements may materially differ from the value received upon actual sale of those investments.
The Fund’s policy is to recognize transfers in and out of the valuation levels as of the end of the reporting period.
During the year ended October 31, 2017, there were transfers from Level 1 to Level 2 of $26,127,823 due to foreign fair value adjustments and security low volume trading and from Level 2 to Level 1 of $6,963,133 due to foreign fair value adjustments.
| | | | | | | | | | | | | | | | |
| | | Level 1 | | | Level 2 | | | Level 3 | | | Total | |
Australia | | $ | 2,171,427 | | | $ | 3,484,892 | | | $ | — | | | $ | 5,656,319 | |
China | | | 6,792,554 | | | | 9,373,256 | | | | 58,156 | | | | 16,223,966 | |
Hong Kong | | | 3,197,108 | | | | — | | | | — | | | | 3,197,108 | |
India | | | 9,294,040 | | | | — | | | | — | | | | 9,294,040 | |
Indonesia | | | 1,836,915 | | | | 844,603 | | | | — | | | | 2,681,518 | |
Japan | | | 7,812,694 | | | | 35,805,070 | | | | — | | | | 43,617,764 | |
Philippines | | | 1,579,600 | | | | — | | | | — | | | | 1,579,600 | |
South Korea | | | 1,619,330 | | | | 9,857,616 | | | | — | | | | 11,476,946 | |
Taiwan | | | — | | | | 7,105,126 | | | | — | | | | 7,105,126 | |
Thailand | | | 1,354,087 | | | | — | | | | — | | | | 1,354,087 | |
Money Market Funds | | | 3,368,809 | | | | — | | | | — | | | | 3,368,809 | |
Total Investments | | $ | 39,026,564 | | | $ | 66,470,563 | | | $ | 58,156 | | | $ | 105,555,283 | |
NOTE 4—Expense Offset Arrangement(s)
The expense offset arrangement is comprised of transfer agency credits which result from balances in demand deposit accounts used by the transfer agent for clearing shareholder transactions. For the year ended October 31, 2017, the Fund received credits from this arrangement, which resulted in the reduction of the Fund’s total expenses of $841.
NOTE 5—Trustees’ and Officers’ Fees and Benefits
Trustees’ and Officers’ Fees and Benefits include amounts accrued by the Fund to pay remuneration to certain Trustees and Officers of the Fund. Trustees have the option to defer compensation payable by the Fund, and Trustees’ and Officers’ Fees and Benefits also include amounts accrued by the Fund to fund such deferred compensation amounts. Those Trustees who defer compensation have the option to select various Invesco Funds in which their deferral accounts shall be deemed to be invested. Finally, certain current Trustees were eligible to participate in a retirement plan that provided for benefits to be paid upon retirement to Trustees over a period of time based on the number of years of service. The Fund may have certain former Trustees who also participate in a retirement plan and receive benefits under such plan. Trustees’ and Officers’ Fees and Benefits include amounts accrued by the Fund to fund such retirement benefits. Obligations under the deferred compensation and retirement plans represent unsecured claims against the general assets of the Fund.
18 Invesco Pacific Growth Fund
NOTE 6—Cash Balances
The Fund is permitted to temporarily carry a negative or overdrawn balance in its account with State Street Bank and Trust Company, the custodian bank. Such balances, if any at period-end, are shown in the Statement of Assets and Liabilities under the payable caption Amount due custodian. To compensate the custodian bank for such overdrafts, the overdrawn Fund may either (1) leave funds as a compensating balance in the account so the custodian bank can be compensated by earning the additional interest; or (2) compensate by paying the custodian bank at a rate agreed upon by the custodian bank and Invesco, not to exceed the contractually agreed upon rate.
NOTE 7—Distributions to Shareholders and Tax Components of Net Assets
Tax Character of Distributions to Shareholders Paid During the Fiscal Years Ended October 31, 2017 and 2016:
| | | | | | | | |
| | | 2017 | | | 2016 | |
Ordinary income | | $ | 161,273 | | | $ | — | |
Tax Components of Net Assets at Period-End:
| | | | |
| | | 2017 | |
Net unrealized appreciation — investments | | $ | 26,410,795 | |
Net unrealized appreciation (depreciation) — foreign currencies | | | (2,496 | ) |
Temporary book/tax differences | | | (90,239 | ) |
Late-Year ordinary loss deferral | | | (213,099 | ) |
Shares of beneficial interest | | | 78,681,729 | |
Total net assets | | $ | 104,786,690 | |
The difference between book-basis and tax-basis unrealized appreciation (depreciation) is due to differences in the timing of recognition of gains and losses on investments for tax and book purposes. The Fund’s net unrealized appreciation difference is attributable primarily to wash sales.
The temporary book/tax differences are a result of timing differences between book and tax recognition of income and/or expenses. The Fund’s temporary book/tax differences are the result of the trustee deferral of compensation and retirement plan benefits.
Capital loss carryforward is calculated and reported as of a specific date. Results of transactions and other activity after that date may affect the amount of capital loss carryforward actually available for the Fund to utilize. Capital losses generated in years beginning after December 22, 2010 can be carried forward for an unlimited period, whereas previous losses expire in eight tax years. Capital losses with an expiration period may not be used to offset capital gains until all net capital losses without an expiration date have been utilized. Capital loss carryforwards with no expiration date will retain their character as either short-term or long-term capital losses instead of as short-term capital losses as under prior law. The ability to utilize capital loss carryforwards in the future may be limited under the Internal Revenue Code and related regulations based on the results of future transactions.
The Fund does not have a capital loss carryforward as of October 31, 2017.
NOTE 8—Investment Transactions
The aggregate amount of investment securities (other than short-term securities, U.S. Treasury obligations and money market funds, if any) purchased and sold by the Fund during the year ended October 31, 2017 was $47,310,470 and $46,745,429, respectively. Cost of investments, including any derivatives, on a tax basis includes the adjustments for financial reporting purposes as of the most recently completed federal income tax reporting period-end.
| | | | |
| Unrealized Appreciation (Depreciation) of Investments on a Tax Basis | |
Aggregate unrealized appreciation of investments | | $ | 27,022,095 | |
Aggregate unrealized (depreciation) of investments | | | (611,300 | ) |
Net unrealized appreciation of investments | | $ | 26,410,795 | |
Cost of investments for tax purposes is $79,144,488.
NOTE 9—Reclassification of Permanent Differences
Primarily as a result of differing book/tax treatment of expired capital loss carryforward, on October 31, 2017, undistributed net investment income (loss) was increased by $85,211, undistributed net realized gain (loss) was increased by $8,200,215 and shares of beneficial interest was decreased by $8,285,426. This reclassification had no effect on the net assets of the Fund.
19 Invesco Pacific Growth Fund
NOTE 10—Share Information
| | | | | | | | | | | | | | | | |
| | | Summary of Share Activity | |
| | | Years ended October 31, | |
| | | 2017(a) | | | 2016 | |
| | | Shares | | | Amount | | | Shares | | | Amount | |
Sold: | | | | | | | | | | | | | | | | |
Class A | | | 290,634 | | | $ | 8,440,185 | | | | 279,894 | | | $ | 6,771,918 | |
Class B | | | 729 | | | | 18,298 | | | | 275 | | | | 5,882 | |
Class C | | | 26,250 | | | | 727,646 | | | | 27,117 | | | | 623,727 | |
Class R | | | 3,293 | | | | 94,438 | | | | 2,450 | | | | 60,652 | |
Class Y | | | 511,747 | | | | 15,124,117 | | | | 366,237 | | | | 9,295,285 | |
Class R6(b) | | | 363 | | | | 10,005 | | | | — | | | | — | |
| | | | |
Issued as reinvestment of dividends: | | | | | | | | | | | | | | | | |
Class A | | | 4,418 | | | | 109,144 | | | | — | | | | — | |
Class Y | | | 1,176 | | | | 29,500 | | | | — | | | | — | |
| | | | |
Automatic conversion of Class B shares to Class A shares: | | | | | | | | | | | | | | | | |
Class A | | | 1,408 | | | | 40,737 | | | | 4,452 | | | | 112,008 | |
Class B | | | (1,522 | ) | | | (40,737 | ) | | | (4,785 | ) | | | (112,008 | ) |
| | | | |
Reacquired: | | | | | | | | | | | | | | | | |
Class A | | | (382,697 | ) | | | (10,455,305 | ) | | | (581,521 | ) | | | (14,582,058 | ) |
Class B | | | (716 | ) | | | (16,755 | ) | | | (2,418 | ) | | | (56,284 | ) |
Class C | | | (31,304 | ) | | | (823,225 | ) | | | (60,951 | ) | | | (1,388,275 | ) |
Class R | | | (4,061 | ) | | | (113,092 | ) | | | (3,457 | ) | | | (81,199 | ) |
Class Y | | | (364,417 | ) | | | (9,869,537 | ) | | | (121,219 | ) | | | (2,971,726 | ) |
Net increase (decrease) in share activity | | | 55,301 | | | $ | 3,275,419 | | | | (93,926 | ) | | $ | (2,322,078 | ) |
| (a) | There are entities that are record owners of more than 5% of the outstanding shares of the Fund and in the aggregate own 62% of the outstanding shares of the Fund. IDI has an agreement with these entities to sell Fund shares. The Fund, Invesco and/or Invesco affiliates may make payments to these entities, which are considered to be related to the Fund, for providing services to the Fund, Invesco and/or Invesco affiliates including but not limited to services such as securities brokerage, distribution, third party record keeping and account servicing. The Fund has no knowledge as to whether all or any portion of the shares owned of record by these entities are also owned beneficially. |
| (b) | Commencement date of April 4, 2017. |
20 Invesco Pacific Growth Fund
NOTE 11—Financial Highlights
The following schedule presents financial highlights for a share of the Fund outstanding throughout the periods indicated.
| | | | | | | | | | | | | | | | | | | | | | | | | | | | | | | | | | | | | | | | | | | | | | | | |
| | | Net asset
value,
beginning
of period | | | Net
Investment
Income
(loss)(a) | | | Net gains
(losses)
on securities
(both
realized and
unrealized) | | | Total from
Investment
operations | | | Dividends
from net
investment
income | | | Net asset
value, end
of period | | | Total
Return(b) | | | Net assets,
end of period
(000’s omitted) | | | Ratio of
expenses
to average
net assets
with fee waivers
and/or expenses
absorbed | | | Ratio of
expenses
to average net
assets without
fee waivers
and/or expenses
absorbed | | | Ratio of net
investment
income (loss)
to average
net assets | | | Portfolio
turnover(c) | |
Class A | | | | | | | | | | | | | | | | | | | | | | | | | | | | | | | | | | | | | | | | | | | | | | | | |
Year ended 10/31/17 | | $ | 26.31 | | | $ | (0.09 | ) | | $ | 7.46 | | | $ | 7.37 | | | $ | (0.05 | ) | | $ | 33.63 | | | | 28.09 | % | | $ | 80,319 | | | | 1.75 | %(d) | | | 1.75 | %(d) | | | (0.32 | )%(d) | | | 59 | % |
Year ended 10/31/16 | | | 24.03 | | | | 0.04 | | | | 2.24 | | | | 2.28 | | | | — | | | | 26.31 | | | | 9.49 | | | | 65,107 | | | | 1.64 | | | | 1.64 | | | | 0.17 | | | | 31 | |
Year ended 10/31/15 | | | 24.51 | | | | 0.05 | | | | (0.50 | ) | | | (0.45 | ) | | | (0.03 | ) | | | 24.03 | | | | (1.84 | ) | | | 66,599 | | | | 1.78 | | | | 1.78 | | | | 0.21 | | | | 137 | |
Year ended 10/31/14 | | | 23.90 | | | | 0.14 | | | | 0.82 | | | | 0.96 | | | | (0.35 | ) | | | 24.51 | | | | 4.10 | (e) | | | 73,457 | | | | 1.77 | (e) | | | 1.77 | (e) | | | 0.60 | (e) | | | 63 | |
Year ended 10/31/13 | | | 20.05 | | | | 0.12 | | | | 3.83 | | | | 3.95 | | | | (0.10 | ) | | | 23.90 | | | | 19.76 | | | | 79,672 | | | | 1.81 | | | | 1.81 | | | | 0.56 | | | | 87 | |
Class B | | | | | | | | | | | | | | | | | | | | | | | | | | | | | | | | | | | | | | | | | | | | | | | | |
Year ended 10/31/17 | | | 24.40 | | | | (0.28 | ) | | | 6.90 | | | | 6.62 | | | | — | | | | 31.02 | | | | 27.13 | | | | 114 | | | | 2.50 | (d) | | | 2.50 | (d) | | | (1.07 | )(d) | | | 59 | |
Year ended 10/31/16 | | | 22.46 | | | | (0.13 | ) | | | 2.07 | | | | 1.94 | | | | — | | | | 24.40 | | | | 8.64 | | | | 126 | | | | 2.39 | | | | 2.39 | | | | (0.58 | ) | | | 31 | |
Year ended 10/31/15 | | | 23.05 | | | | (0.12 | ) | | | (0.47 | ) | | | (0.59 | ) | | | — | | | | 22.46 | | | | (2.56 | ) | | | 272 | | | | 2.53 | | | | 2.53 | | | | (0.54 | ) | | | 137 | |
Year ended 10/31/14 | | | 22.49 | | | | (0.04 | ) | | | 0.77 | | | | 0.73 | | | | (0.17 | ) | | | 23.05 | | | | 3.28 | | | | 480 | | | | 2.53 | | | | 2.53 | | | | (0.16 | ) | | | 63 | |
Year ended 10/31/13 | | | 18.92 | | | | (0.04 | ) | | | 3.61 | | | | 3.57 | | | | — | | | | 22.49 | | | | 18.87 | | | | 889 | | | | 2.56 | | | | 2.56 | | | | (0.19 | ) | | | 87 | |
Class C | | | | | | | | | | | | | | | | | | | | | | | | | | | | | | | | | | | | | | | | | | | | | | | | |
Year ended 10/31/17 | | | 24.46 | | | | (0.28 | ) | | | 6.91 | | | | 6.63 | | | | — | | | | 31.09 | | | | 27.11 | (f) | | | 5,535 | | | | 2.49 | (d)(f) | | | 2.49 | (d)(f) | | | (1.06 | )(d)(f) | | | 59 | |
Year ended 10/31/16 | | | 22.50 | | | | (0.13 | ) | | | 2.09 | | | | 1.96 | | | | — | | | | 24.46 | | | | 8.71 | (f) | | | 4,477 | | | | 2.37 | (f) | | | 2.37 | (f) | | | (0.56 | )(f) | | | 31 | |
Year ended 10/31/15 | | | 23.09 | | | | (0.12 | ) | | | (0.47 | ) | | | (0.59 | ) | | | — | | | | 22.50 | | | | (2.55 | ) | | | 4,880 | | | | 2.53 | | | | 2.53 | | | | (0.54 | ) | | | 137 | |
Year ended 10/31/14 | | | 22.53 | | | | (0.03 | ) | | | 0.76 | | | | 0.73 | | | | (0.17 | ) | | | 23.09 | | | | 3.28 | (f) | | | 4,638 | | | | 2.52 | (f) | | | 2.52 | (f) | | | (0.15 | )(f) | | | 63 | |
Year ended 10/31/13 | | | 18.95 | | | | (0.04 | ) | | | 3.62 | | | | 3.58 | | | | — | | | | 22.53 | | | | 18.89 | | | | 5,049 | | | | 2.56 | | | | 2.56 | | | | (0.19 | ) | | | 87 | |
Class R | | | | | | | | | | | | | | | | | | | | | | | | | | | | | | | | | | | | | | | | | | | | | | | | |
Year ended 10/31/17 | | | 26.02 | | | | (0.16 | ) | | | 7.38 | | | | 7.22 | | | | — | | | | 33.24 | | | | 27.75 | | | | 283 | | | | 2.00 | (d) | | | 2.00 | (d) | | | (0.57 | )(d) | | | 59 | |
Year ended 10/31/16 | | | 23.82 | | | | (0.02 | ) | | | 2.22 | | | | 2.20 | | | | — | | | | 26.02 | | | | 9.24 | | | | 242 | | | | 1.89 | | | | 1.89 | | | | (0.08 | ) | | | 31 | |
Year ended 10/31/15 | | | 24.33 | | | | (0.01 | ) | | | (0.50 | ) | | | (0.51 | ) | | | — | | | | 23.82 | | | | (2.10 | ) | | | 245 | | | | 2.03 | | | | 2.03 | | | | (0.04 | ) | | | 137 | |
Year ended 10/31/14 | | | 23.74 | | | | 0.08 | | | | 0.80 | | | | 0.88 | | | | (0.29 | ) | | | 24.33 | | | | 3.78 | | | | 344 | | | | 2.03 | | | | 2.03 | | | | 0.34 | | | | 63 | |
Year ended 10/31/13 | | | 19.93 | | | | 0.07 | | | | 3.80 | | | | 3.87 | | | | (0.06 | ) | | | 23.74 | | | | 19.44 | | | | 295 | | | | 2.06 | | | | 2.06 | | | | 0.31 | | | | 87 | |
Class Y | | | | | | | | | | | | | | | | | | | | | | | | | | | | | | | | | | | | | | | | | | | | | | | | |
Year ended 10/31/17 | | | 26.79 | | | | (0.02 | ) | | | 7.59 | | | | 7.57 | | | | (0.12 | ) | | | 34.24 | | | | 28.43 | | | | 18,505 | | | | 1.50 | (d) | | | 1.50 | (d) | | | (0.07 | )(d) | | | 59 | |
Year ended 10/31/16 | | | 24.41 | | | | 0.11 | | | | 2.27 | | | | 2.38 | | | | — | | | | 26.79 | | | | 9.75 | | | | 10,501 | | | | 1.39 | | | | 1.39 | | | | 0.42 | | | | 31 | |
Year ended 10/31/15 | | | 24.90 | | | | 0.12 | | | | (0.52 | ) | | | (0.40 | ) | | | (0.09 | ) | | | 24.41 | | | | (1.59 | ) | | | 3,587 | | | | 1.53 | | | | 1.53 | | | | 0.46 | | | | 137 | |
Year ended 10/31/14 | | | 24.28 | | | | 0.20 | | | | 0.82 | | | | 1.02 | | | | (0.40 | ) | | | 24.90 | | | | 4.34 | | | | 2,944 | | | | 1.53 | | | | 1.53 | | | | 0.84 | | | | 63 | |
Year ended 10/31/13 | | | 20.37 | | | | 0.18 | | | | 3.88 | | | | 4.06 | | | | (0.15 | ) | | | 24.28 | | | | 20.03 | | | | 3,291 | | | | 1.56 | | | | 1.56 | | | | 0.81 | | | | 87 | |
Class R5 | | | | | | | | | | | | | | | | | | | | | | | | | | | | | | | | | | | | | | | | | | | | | | | | |
Year ended 10/31/17 | | | 26.84 | | | | 0.00 | | | | 7.60 | | | | 7.60 | | | | (0.15 | ) | | | 34.29 | | | | 28.53 | | | | 18 | | | | 1.42 | (d) | | | 1.42 | (d) | | | 0.01 | (d) | | | 59 | |
Year ended 10/31/16 | | | 24.42 | | | | 0.13 | | | | 2.29 | | | | 2.42 | | | | — | | | | 26.84 | | | | 9.91 | | | | 14 | | | | 1.28 | | | | 1.28 | | | | 0.53 | | | | 31 | |
Year ended 10/31/15 | | | 24.92 | | | | 0.15 | | | | (0.52 | ) | | | (0.37 | ) | | | (0.13 | ) | | | 24.42 | | | | (1.47 | ) | | | 13 | | | | 1.39 | | | | 1.39 | | | | 0.60 | | | | 137 | |
Year ended 10/31/14 | | | 24.30 | | | | 0.24 | | | | 0.82 | | | | 1.06 | | | | (0.44 | ) | | | 24.92 | | | | 4.48 | | | | 13 | | | | 1.37 | | | | 1.37 | | | | 1.00 | | | | 63 | |
Year ended 10/31/13 | | | 20.39 | | | | 0.21 | | | | 3.89 | | | | 4.10 | | | | (0.19 | ) | | | 24.30 | | | | 20.23 | | | | 13 | | | | 1.43 | | | | 1.43 | | | | 0.94 | | | | 87 | |
Class R6 | | | | | | | | | | | | | | | | | | | | | | | | | | | | | | | | | | | | | | | | | | | | | | | | |
Year ended 10/31/17(g) | | | 27.48 | | | | 0.00 | | | | 6.81 | | | | 6.81 | | | | — | | | | 34.29 | | | | 24.78 | | | | 12 | | | | 1.39 | (d)(h) | | | 1.39 | (d)(h) | | | 0.04 | (d)(h) | | | 59 | |
| (a) | Calculated using average shares outstanding. |
| (b) | Includes adjustments in accordance with accounting principles generally accepted in the United States of America and as such, the net asset value for financial reporting purposes and the returns based upon those net asset values may differ from the net asset value and returns for shareholder transactions. Does not include sales charges and is not annualized for periods less than one year, if applicable. |
| (c) | Portfolio turnover is calculated at the fund level and is not annualized for periods less than one year, if applicable. |
| (d) | Ratios are based on average daily net assets (000’s omitted) of $66,791, $117, $4,595, $243, $9,556, $15 and $11 for Class A, Class B, Class C, Class R, Class Y, Class R5 and Class R6 shares, respectively. |
| (e) | The total return, ratio of expenses to average net assets and ratio of net investment income (loss) to average net assets reflect actual 12b-1 fees of 0.24% for Class A shares for the year ended October 31, 2014. |
| (f) | The total return, ratio of expenses to average net assets and ratio of net investment income (loss) to average net assets reflect actual 12b-1 fees of 0.99%, 0.98% and 0.99% for Class C shares for the years ended October 31, 2017, 2016 and 2014, respectively. |
| (g) | Commencement date of April 4, 2017. |
NOTE 12—Subsequent Event
On December 1, 2017, the Fund’s Board of Trustees approved the early conversion of the remaining assets in the Fund’s Class B shares into Class A shares to occur on or about January 26, 2018. At the close of business on or about January 26, 2018, (the “Conversion Date”) all outstanding Class B shares of the Fund will be converted to Class A shares of the Fund, which is prior to the date the Class B shares would normally be converted to Class A shares. Once the conversion is completed, Class B shares will be closed and become inactive. No contingent deferred sales charges will be payable in connection with this early conversion. The conversion of the Fund’s Class B shares into Class A shares on the Conversion Date is not expected to be a taxable event for federal income tax purposes, and should not result in the recognition of gain or loss by converting shareholders, although each shareholder should consult with his or her own tax adviser.
21 Invesco Pacific Growth Fund
Report of Independent Registered Public Accounting Firm
To the Board of Trustees of AIM Investment Funds (Invesco Investment Funds) and Shareholders of Invesco Pacific Growth Fund:
In our opinion, the accompanying statement of assets and liabilities, including the schedule of investments, and the related statements of operations and of changes in net assets and the financial highlights present fairly, in all material respects, the financial position of Invesco Pacific Growth Fund (one of the portfolios constituting the AIM Investment Funds (Invesco Investment Funds), hereafter referred to as the “Fund”) as of October 31, 2017, the results of its operations for the year then ended, the changes in its net assets for each of the two years in the period then ended and the financial highlights for each of the periods indicated therein, in conformity with accounting principles generally accepted in the United States of America. These financial statements and financial highlights (hereafter referred to as “financial statements”) are the responsibility of the Fund’s management. Our responsibility is to express an opinion on these financial statements based on our audits. We conducted our audits of these financial statements in accordance with the standards of the Public Company Accounting Oversight Board (United States). Those standards require that we plan and perform the audit to obtain reasonable assurance about whether the financial statements are free of material misstatement. An audit includes examining, on a test basis, evidence supporting the amounts and disclosures in the financial statements, assessing the accounting principles used and significant estimates made by management, and evaluating the overall financial statement presentation. We believe that our audits, which included confirmation of securities as of October 31, 2017 by correspondence with the custodian, transfer agent and brokers, and when replies were not received from brokers, we performed other auditing procedures, provide a reasonable basis for our opinion.
PricewaterhouseCoopers LLP
Houston, Texas
December 21, 2017
22 Invesco Pacific Growth Fund
Calculating your ongoing Fund expenses
Example
As a shareholder of the Fund, you incur two types of costs: (1) transaction costs, which may include sales charges (loads) on purchase payments or contingent deferred sales charges on redemptions, if any; and (2) ongoing costs, including management fees, distribution and/or service (12b-1) fees, and other Fund expenses. This example is intended to help you understand your ongoing costs (in dollars) of investing in the Fund and to compare these costs with ongoing costs of investing in other mutual funds. The example is based on an investment of $1,000 invested at the beginning of the period and held for the entire period May 1, 2017 through October 31, 2017.
Actual expenses
The table below provides information about actual account values and actual expenses. You may use the information in this table, together with the amount you invested, to estimate the expenses that you paid over the period. Simply divide your account value by $1,000 (for example, an $8,600 account value divided by $1,000 = 8.6), then multiply the result by the number in the table under the heading entitled “Actual Expenses Paid During Period” to estimate the expenses you paid on your account during this period.
Hypothetical example for comparison purposes
The table below also provides information about hypothetical account values and hypothetical expenses based on the Fund’s actual expense ratio and an assumed rate of return of 5% per year before expenses, which is not the Fund’s actual return.
The hypothetical account values and expenses may not be used to estimate the actual ending account balance or expenses you paid for the period. You may use this information to compare the ongoing costs of investing in the Fund and other funds. To do so, compare this 5% hypothetical example with the 5% hypothetical examples that appear in the shareholder reports of the other funds.
Please note that the expenses shown in the table are meant to highlight your ongoing costs only and do not reflect any transaction costs, such as sales charges (loads) on purchase payments or contingent deferred sales charges on redemptions, if any. Therefore, the hypothetical information is useful in comparing ongoing costs only, and will not help you determine the relative total costs of owning different funds. In addition, if these transaction costs were included, your costs would have been higher.
| | | | | | | | | | | | | | | | | | | | | | | | |
| Class | | Beginning
Account Value
(05/01/17) | | | ACTUAL | | | HYPOTHETICAL (5% annual return before expenses) | | | Annualized
Expense
Ratio | |
| | | Ending
Account Value
(10/31/17)1 | | | Expenses
Paid During
Period2 | | | Ending
Account Value
(10/31/17) | | | Expenses
Paid During
Period2 | | |
A | | $ | 1,000.00 | | | $ | 1,211.00 | | | $ | 9.47 | | | $ | 1,016.64 | | | $ | 8.64 | | | | 1.70 | % |
B | | | 1,000.00 | | | | 1,206.10 | | | | 13.62 | | | | 1,012.85 | | | | 12.43 | | | | 2.45 | |
C | | | 1,000.00 | | | | 1,206.00 | | | | 13.62 | | | | 1,012.85 | | | | 12.43 | | | | 2.45 | |
R | | | 1,000.00 | | | | 1,209.20 | | | | 10.86 | | | | 1,015.38 | | | | 9.91 | | | | 1.95 | |
Y | | | 1,000.00 | | | | 1,212.50 | | | | 8.09 | | | | 1,017.90 | | | | 7.38 | | | | 1.45 | |
R5 | | | 1,000.00 | | | | 1,212.90 | | | | 7.86 | | | | 1,018.10 | | | | 7.17 | | | | 1.41 | |
R6 | | | 1,000.00 | | | | 1,212.90 | | | | 7.86 | | | | 1,018.10 | | | | 7.17 | | | | 1.41 | |
| 1 | The actual ending account value is based on the actual total return of the Fund for the period May 1, 2017 through October 31, 2017, after actual expenses and will differ from the hypothetical ending account value which is based on the Fund’s expense ratio and a hypothetical annual return of 5% before expenses. |
| 2 | Expenses are equal to the Fund’s annualized expense ratio as indicated above multiplied by the average account value over the period, multiplied by 184/365 to reflect the most recent fiscal half year. |
23 Invesco Pacific Growth Fund
Approval of Investment Advisory and Sub-Advisory Contracts
The Board of Trustees (the Board) of AIM Investment Funds (Invesco Investment Funds) is required under the Investment Company Act of 1940, as amended, to approve annually the renewal of Invesco Pacific Growth Fund’s (the Fund) investment advisory agreements. During contract renewal meetings held on June 12-13, 2017, the Board as a whole, and the disinterested or “independent” Trustees, who comprise over 75% of the Board, voting separately, approved the continuance for the Fund of the Master Investment Advisory Agreement with Invesco Advisers, Inc. (Invesco Advisers and the investment advisory agreement) and the Master Intergroup Sub-Advisory Contract for Mutual Funds with Invesco Asset Management Deutschland GmbH, Invesco Asset Management Limited, Invesco Asset Management (Japan) Limited, Invesco Hong Kong Limited, Invesco Senior Secured Management, Inc. and Invesco Canada Ltd. (collectively, the Affiliated Sub-Advisers and the sub-advisory contracts) for another year, effective July 1, 2017.
In evaluating the fairness and reasonableness of compensation under the Fund’s investment advisory agreement and sub-advisory contracts, the Board considered, among other things, the factors discussed below. The Board determined that continuation of the Fund’s investment advisory agreement and the sub-advisory contracts is in the best interest of the Fund and its shareholders and that the compensation payable to Invesco Advisers and the Affiliated Sub-Advisers under the agreements is fair and reasonable.
The Board’s Fund Evaluation Process
The Board’s Investments Committee has established three Sub-Committees, which meet throughout the year to review the performance of funds advised by Invesco Advisers (the Invesco Funds). Over the course of each year, the Sub-Committees meet with portfolio managers for their assigned Invesco Funds and other members of management to review the performance, investment objective(s), policies, strategies, limitations and investment risks of these funds. The Board had the benefit of reports from the Sub-Committees and Investments Committee throughout the year in considering approval of the continuance of each Invesco Fund’s investment advisory agreement and sub-advisory contracts for another year.
During the contract renewal process, the Board receives comparative performance and fee data regarding the Invesco Funds prepared by Invesco Advisers and Broadridge Financial Solutions, Inc. (Broadridge), an independent provider of investment company data. The Board also receives an independent written evaluation from the Senior Officer, an officer of the Invesco Funds who reports directly to the independent Trustees. The Senior Officer’s
evaluation is prepared as part of his responsibility to manage the process by which the Invesco Funds’ proposed management fees are negotiated during the annual contract renewal process to ensure they are negotiated in a manner that is at arms’ length and reasonable. In addition to meetings with Invesco Advisers and fund counsel, the independent Trustees also discuss the continuance of the investment advisory agreement and sub-advisory contracts in separate sessions with the Senior Officer and with independent legal counsel.
The Trustees recognized that the advisory fee rates for the Invesco Funds are, in most cases, the result of years of review and negotiation. The Trustees’ deliberations and conclusions in a particular year may be based in part on their deliberations and conclusions regarding these arrangements throughout the year and in prior years. The Trustees’ review and conclusions are based on the comprehensive consideration of all information presented to them and are not the result of any single determinative factor. Moreover, one Trustee may have weighed a particular piece of information or factor differently than another Trustee.
The discussion below is a summary of the Senior Officer’s independent written evaluation with respect to the Fund’s investment advisory agreement as well as a discussion of the material factors and related conclusions that formed the basis for the Board’s approval of the Fund’s investment advisory agreement and sub-advisory contracts. This information is current as of June 13, 2017, and does not reflect consideration of factors that became known to the Board after that date.
Factors and Conclusions and Summary of Independent Written Fee Evaluation
| A. | Nature, Extent and Quality of Services Provided by Invesco Advisers and the Affiliated Sub-Advisers |
The Board reviewed the advisory services provided to the Fund by Invesco Advisers under the Fund’s investment advisory agreement, the performance of Invesco Advisers in providing these services, and the credentials and experience of the officers and employees of Invesco Advisers who provide these services, including the Fund’s portfolio manager or managers. The Board’s review included consideration of Invesco Advisers’ investment process oversight, credit analysis and investment risk management. The Board also considered non-advisory services that Invesco Advisers and its affiliates provide to the Invesco Funds such as various back office support functions, trading operations, internal audit, valuation and legal and compliance.
In determining whether to continue the Fund’s investment advisory agreement, the Board considered the benefits of reapproving an
existing relationship as contrasted with the greater uncertainty that may be associated with entering into a new relationship. The Board concluded that the nature, extent and quality of the services provided to the Fund by Invesco Advisers are appropriate and satisfactory.
The Board reviewed the services that may be provided by the Affiliated Sub-Advisers under the sub-advisory contracts and the credentials and experience of the officers and employees of the Affiliated Sub-Advisers who provide these services. The Board noted that the Affiliated Sub-Advisers have offices and personnel that are located in financial centers around the world. As a result, the Board noted that the Affiliated Sub-Advisers can provide research and investment analysis on the markets and economies of various countries in which the Fund may invest, make recommendations regarding securities and assist with security trades. The Board concluded that the sub-advisory contracts may benefit the Fund and its shareholders by permitting Invesco Advisers to use the resources and talents of the Affiliated Sub-Advisers in managing the Fund. The Board concluded that the nature, extent and quality of the services that may be provided by the Affiliated Sub-Advisers are appropriate and satisfactory.
| B. | Fund Investment Performance |
The Board considered Fund investment performance as a relevant factor in considering whether to approve the investment advisory agreement as well as the sub-advisory contracts for the Fund, as Invesco Asset Management (Japan) Limited and Invesco Hong Kong Limited currently manage assets of the Fund.
The Board compared the Fund’s investment performance over multiple time periods ending December 31, 2016 to the performance of funds in the Broadridge performance universe and against the Lipper Pacific Region Funds Index. The Board noted that performance of Class A shares of the Fund was in the fifth quintile of its performance universe for the one year period, the third quintile for the three year period and the fourth quintile for the five year period (the first quintile being the best performing funds and the fifth quintile being the worst performing funds). The Board noted that performance of Class A shares of the Fund was below the performance of the Index for the one, three and five year periods. The Trustees also reviewed more recent Fund performance and this review did not change their conclusions.
| C. | Advisory and Sub-Advisory Fees |
The Board compared the Fund’s contractual management fee rate to the contractual management fee rates of funds in the Fund’s Broadridge expense group at a common asset level. The Board noted that the contractual management fee rate for Class A shares of the Fund was below the median contractual management fee rate of funds in its expense
24 Invesco Pacific Growth Fund
group. The Board noted that the term “contractual management fee” for funds in the expense group may include both advisory and certain administrative services fees, but that Broadridge does not provide information on a fund by fund basis as to what is included. The Board noted that Invesco Advisers does not separately charge the Invesco Funds for the administrative services included in the term as defined by Broadridge. The Board also reviewed the methodology used by Broadridge in providing expense group information, which includes using each fund’s contractual management fee schedule (including any applicable breakpoints) as reported in the most recent prospectus or statement of additional information for each fund in the expense group.
The Board noted that Invesco Advisers and the Affiliated Sub-Advisers do not manage other mutual funds or client accounts with investment strategies comparable to those of the Fund.
The Board also considered the services that may be provided by the Affiliated Sub-Advisers pursuant to the sub-advisory contracts, as well as the fees payable by Invesco Advisers to the Affiliated Sub-Advisers pursuant to the sub-advisory contracts. The Board noted that Invesco Advisers retains overall responsibility for, and provides services to, sub-advised Invesco Funds, including oversight of the Affiliated Sub-Advisers as well as the additional services described herein other than day-to-day portfolio management. The Board also noted that the sub-advisory fees are not paid directly by the Fund, but rather, are payable by Invesco Advisers to the Affiliated Sub-Advisers.
| D. | Economies of Scale and Breakpoints |
The Board considered the extent to which there are economies of scale in the provision of advisory services to the Fund. The Board also considered that the Fund may benefit from economies of scale through contractual breakpoints in the Fund’s advisory fee schedule. The Board noted that the Fund shares directly in economies of scale through lower fees charged by third party service providers based on the combined size of the Invesco Funds advised by Invesco Advisers.
| E. | Profitability and Financial Resources |
The Board reviewed information from Invesco Advisers concerning the costs of the advisory and other services that Invesco Advisers and its affiliates provide to the Fund and the Invesco Funds and the profitability of Invesco Advisers and its affiliates in providing these services. The Board noted that Invesco Advisers continues to operate at a net profit from services Invesco Advisers and its affiliates provide to the Invesco Funds and the Fund. The Board did not deem the level of profits realized by Invesco Advisers and its affiliates from providing services to the Fund to be excessive given the nature, quality and extent of the services provided. The Board received and accepted information from Invesco Advisers demonstrating that Invesco Advisers and each Affiliated Sub-Adviser are financially sound and have the resources necessary to
perform their obligations under the investment advisory agreement and sub-advisory contracts.
| F. | Collateral Benefits to Invesco Advisers and its Affiliates |
The Board considered various other benefits received by Invesco Advisers and its affiliates from the relationship with the Fund, including the fees received for providing transfer agency and distribution services to the Fund. The Board considered comparative information regarding fees charged for these services, including information provided by Broadridge and other independent sources. The Board considered the performance of Invesco Advisers and its affiliates in providing these services and the organizational structure employed to provide these services. The Board also considered that these services are provided to the Fund pursuant to written contracts that are reviewed and approved on an annual basis by the Board; and that the services are required for the operation of the Fund.
The Board considered the benefits realized by Invesco Advisers and the Affiliated Sub-Advisers as a result of portfolio brokerage transactions executed through “soft dollar” arrangements. The Board noted that soft dollar arrangements may result in the Fund bearing costs to purchase research that may be used by Invesco Advisers or the Affiliated Sub-Advisers with other clients and may reduce Invesco Adviser’s or the Affiliated Sub-Adviser’s expenses. The Board also considered that it receives periodic reports from the Chief Compliance Officer of the Invesco Funds demonstrating that these arrangements are consistent with regulatory requirements. The Board did not deem the soft dollar arrangements to be inappropriate.
The Board considered that the Fund’s uninvested cash and cash collateral from any securities lending arrangements may be invested in money market funds advised by Invesco Advisers pursuant to procedures approved by the Board. The Board noted that Invesco Advisers receives advisory fees from these affiliated money market funds attributable to such investments, although Invesco Advisers has contractually agreed to waive through varying periods the advisory fees payable by the Invesco Funds with respect to certain investments in the affiliated money market funds. The waiver is in an amount equal to 100% of the net advisory fee Invesco Advisers receives from the affiliated money market funds with respect to the Fund’s investment in the affiliated money market funds of uninvested cash, but not cash collateral. The Board concluded that the amount of advisory fees received by Invesco Advisers from the Fund’s investment of cash collateral from any securities lending arrangements in the affiliated money market funds is fair and reasonable.
The Board also considered that the Fund may use an affiliated broker to execute certain trades for the Fund to, among other things, control information leakage, and was advised that such trades would be executed in compliance with rules under the federal
securities laws and consistent with best execution obligations.
25 Invesco Pacific Growth Fund
Tax Information
Form 1099-DIV, Form 1042-S and other year-end tax information provide shareholders with actual calendar year amounts that should be included in their tax returns. Shareholders should consult their tax advisors.
The following distribution information is being provided as required by the Internal Revenue Code or to meet a specific state’s requirement.
The Fund designates the following amounts or, if subsequently determined to be different, the maximum amount allowable for its fiscal year ended October 31, 2017:
| | | | |
Federal and State Income Tax | |
Qualified Dividend Income* | | | 15.73 | % |
Corporate Dividends Received Deduction* | | | 1.71 | % |
U.S. Treasury Obligations* | | | 0 | % |
| | * | The above percentages are based on ordinary income dividends paid to shareholders during the Fund’s fiscal year. |
26 Invesco Pacific Growth Fund
Trustees and Officers
The address of each trustee and officer is AIM Investment Funds (Invesco Investment Funds) (the “Trust”), 11 Greenway Plaza, Suite 1000, Houston, Texas 77046-1173. The trustees serve for the life of the Trust, subject to their earlier death, incapacitation, resignation, retirement or removal as more specifically provided in the Trust’s organizational documents. Each officer serves for a one year term or until their successors are elected and qualified. Column two below includes length of time served with predecessor entities, if any.
| | | | | | | | |
Name, Year of Birth and Position(s) Held with the Trust | | Trustee and/
or Officer Since | | Principal Occupation(s)
During Past 5 Years | | Number of
Funds in Fund
Complex
Overseen by
Trustee | | Other Directorship(s)
Held by Trustee During Past 5 Years |
| Interested Persons | | | | | | | | |
| Martin L. Flanagan1 — 1960 Trustee | | 2007 | | Executive Director, Chief Executive Officer and President, Invesco Ltd. (ultimate parent of Invesco and a global investment management firm); Trustee, The Invesco Funds; Vice Chair, Investment Company Institute; and Member of Executive Board, SMU Cox School of Business Formerly: Advisor to the Board, Invesco Advisers, Inc. (formerly known as Invesco Institutional (N.A.), Inc.); Chairman and Chief Executive Officer, Invesco Advisers, Inc. (registered investment adviser); Director, Chairman, Chief Executive Officer and President, Invesco Holding Company (US), Inc. (formerly IVZ Inc.) (holding company), Invesco Group Services, Inc. (service provider) and Invesco North American Holdings, Inc. (holding company); Director, Chief Executive Officer and President, Invesco Holding Company Limited (parent of Invesco and a global investment management firm); Director, Invesco Ltd.; Chairman, Investment Company Institute and President, Co-Chief Executive Officer, Co-President, Chief Operating Officer and Chief Financial Officer, Franklin Resources, Inc. (global investment management organization) | | 158 | | None |
Philip A. Taylor2 — 1954 Trustee and Senior Vice President | | 2006 | | Head of the Americas and Senior Managing Director, Invesco Ltd.; Director, Invesco Advisers, Inc. (formerly known as Invesco Institutional (N.A.), Inc.) (registered investment adviser); Director, Chairman, Chief Executive Officer and President, Invesco Management Group, Inc. (formerly known as Invesco Aim Management Group, Inc.) (financial services holding company); Director and Chairman, Invesco Investment Services, Inc. (formerly known as Invesco Aim Investment Services, Inc.) (registered transfer agent); Chief Executive Officer, Invesco Corporate Class Inc. (corporate mutual fund company); Director, Chairman and Chief Executive Officer, Invesco Canada Ltd. (formerly known as Invesco Trimark Ltd./Invesco Trimark Ltèe) (registered investment adviser and registered transfer agent); Trustee and Senior Vice President, The Invesco Funds; Director, Invesco Investment Advisers LLC (formerly known as Van Kampen Asset Management). Formerly: Co-Chairman, Co-President and Co-Chief Executive Officer, Invesco Advisers, Inc. (formerly known as Invesco Institutional (N.A.), Inc.) (registered investment adviser); Director, Chief Executive Officer and President, Van Kampen Exchange Corp; President and Principal Executive Officer, The Invesco Funds (other than AIM Treasurer’s Series Trust (Invesco Treasurer’s Series Trust), Short-Term Investments Trust and Invesco Management Trust); Executive Vice President, The Invesco Funds (AIM Treasurer’s Series Trust (Invesco Treasurer’s Series Trust), Short-Term Investments Trust and Invesco Management Trust only); Director and President, INVESCO Funds Group, Inc. (registered investment adviser and registered transfer agent); Director and Chairman, IVZ Distributors, Inc. (formerly known as INVESCO Distributors, Inc.) (registered broker dealer); Director, President and Chairman, Invesco Inc. (holding company), Invesco Canada Holdings Inc. (holding company), Trimark Investments Ltd./Placements Trimark Ltèe and Invesco Financial Services Ltd/Services Financiers Invesco Ltèe; Chief Executive Officer, Invesco Canada Fund Inc. (corporate mutual fund company); Director and Chairman, Van Kampen Investor Services Inc.; Director, Chief Executive Officer and President, 1371 Preferred Inc. (holding company) and Van Kampen Investments Inc.; Director and President, AIM GP Canada Inc. (general partner for limited partnerships) and Van Kampen Advisors, Inc.; Director and Chief Executive Officer, Invesco Trimark Dealer Inc. (registered broker dealer); Director, Invesco Distributors, Inc. (formerly known as Invesco Aim Distributors, Inc.) (registered broker dealer); Manager, Invesco PowerShares Capital Management LLC; Director, Chief Executive Officer and President, Invesco Advisers, Inc.; Director, Chairman, Chief Executive Officer and President, Invesco Aim Capital Management, Inc.; President, Invesco Trimark Dealer Inc. and Invesco Trimark Ltd./Invesco Trimark Ltèe; Director and President, AIM Trimark Corporate Class Inc. and AIM Trimark Canada Fund Inc.; Senior Managing Director, Invesco Holding Company Limited; Director and Chairman, Fund Management Company (former registered broker dealer); President and Principal Executive Officer, The Invesco Funds (AIM Treasurer’s Series Trust (Invesco Treasurer’s Series Trust), and Short-Term Investments Trust only); President, AIM Trimark Global Fund Inc. and AIM Trimark Canada Fund Inc. | | 158 | | None |
| 1 | Mr. Flanagan is considered an interested person (within the meaning of Section 2(a)(19) of the 1940 Act) of the Trust because he is an officer of the Adviser to the Trust, and an officer and a director of Invesco Ltd., ultimate parent of the Adviser. |
| 2 | Mr. Taylor is considered an interested person (within the meaning of Section 2(a)(19) of the 1940 Act) of the Trust because he is an officer and a director of the Adviser. |
T-1 Invesco Pacific Growth Fund
Trustees and Officers—(continued)
| | | | | | | | |
Name, Year of Birth and Position(s) Held with the Trust | | Trustee and/
or Officer Since | | Principal Occupation(s) During Past 5 Years | | Number of
Funds in Fund
Complex
Overseen by
Trustee | | Other Directorship(s)
Held by Trustee During Past 5 Years |
| Independent Trustees | | | | | | | | |
Bruce L. Crockett — 1944 Trustee and Chair | | 2001 | | Chairman, Crockett Technologies Associates (technology consulting company) Formerly: Director, Captaris (unified messaging provider); Director, President and Chief Executive Officer, COMSAT Corporation; Chairman, Board of Governors of INTELSAT (international communications company); ACE Limited (insurance company); Independent Directors Council and Investment Company Institute: Member of the Audit Committee, Investment Company Institute; Member of the Executive Committee and Chair of the Governance Committee, Independent Directors Council | | 158 | | Director and Chairman of the Audit Committee, ALPS (Attorneys Liability Protection Society) (insurance company); Director and Member of the Audit Committee, Ferroglobe PLC (metallurgical company) |
David C. Arch — 1945 Trustee | | 2010 | | Chairman of Blistex Inc. (consumer health care products manufacturer); Member, World Presidents’ Organization | | 158 | | Board member of the Illinois Manufacturers’ Association |
James T. Bunch — 1942 Trustee | | 2003 | | Managing Member, Grumman Hill Group LLC (family office/private equity investments) Formerly: Chairman of the Board, Denver Film Society; Chairman of the Board of Trustees, Evans Scholarship Foundation; Chairman, Board of Governors, Western Golf Association | | 158 | | Trustee, Evans Scholarship Foundation |
Jack M. Fields — 1952 Trustee | | 2001 | | Chief Executive Officer, Twenty First Century Group, Inc. (government affairs company); and Discovery Learning Alliance (non-profit) Formerly: Owner and Chief Executive Officer, Dos Angeles Ranch L.P. (cattle, hunting, corporate entertainment); Director, Insperity, Inc. (formerly known as Administaff) (human resources provider); Chief Executive Officer, Texana Timber LP (sustainable forestry company); Director of Cross Timbers Quail Research Ranch (non-profit); and member of the U.S. House of Representatives | | 158 | | None |
Cynthia Hostetler — 1962 Trustee | | 2017 | | Non-Executive Director and Trustee of a number of public and private business corporations Formerly: Head of Investment Funds and Private Equity, Overseas Private Investment Corporation; President, First Manhattan Bancorporation, Inc.; Attorney, Simpson Thacher & Bartlett LLP | | 158 | | Vulcan Materials Company (construction materials company); Trilinc Global Impact Fund; Aberdeen Investment Funds (4 portfolios); Artio Global Investment LLC (mutual fund complex); Edgen Group, Inc. (specialized energy and infrastructure products distributor) |
Eli Jones — 1961 Trustee | | 2016 | | Professor and Dean, Mays Business School — Texas A&M University Formerly: Professor and Dean, Walton College of Business, University of Arkansas and E.J. Ourso College of Business, Louisiana State University; Director, Arvest Bank | | 158 | | Insperity, Inc. (formerly known as Administaff) (human resources provider) |
Prema Mathai-Davis — 1950 Trustee | | 2001 | | Retired. Formerly: Chief Executive Officer, YWCA of the U.S.A. | | 158 | | None |
Teresa M. Ressel — 1962 Trustee | | 2017 | | Non-executive director and trustee of a number of public and private business corporations Formerly: Chief Financial Officer, Olayan America, The Olayan Group (international investor/commercial/industrial); Chief Executive Officer, UBS Securities LLC; Group Chief Operating Officer, Americas, UBS AG; Assistant Secretary for Management & Budget and CFO, US Department of the Treasury; Chief Compliance Officer, Kaiser Permanente (healthcare consortium); Program Manager, Hewlett-Packard; Nuclear Engineering, General Dynamics Corporation (aerospace and defense company) | | 158 | | Atlantic Power Corporation (power generation company); ON Semiconductor Corp. (semiconductor supplier) |
Larry Soll — 1942 Trustee | | 2003 | | Retired. Formerly: Chairman, Chief Executive Officer and President, Synergen Corp. (a biotechnology company) | | 158 | | None |
Ann Barnett Stern — 1957 Trustee | | 2017 | | President and Chief Executive Officer, Houston Endowment Inc. (private philanthropic institution) Formerly: Executive Vice President and General Counsel, Texas Children’s Hospital; Attorney, Beck, Redden and Secrest, LLP; Business Law Instructor, University of St. Thomas; Attorney, Andrews & Kurth LLP | | 158 | | Federal Reserve Bank of Dallas |
Raymond Stickel, Jr. — 1944 Trustee | | 2005 | | Retired. Formerly: Director, Mainstay VP Series Funds, Inc. (25 portfolios); Partner, Deloitte & Touche | | 158 | | None |
Robert C. Troccoli — 1949 Trustee | | 2016 | | Adjunct Professor, University of Denver — Daniels College of Business Formerly: Senior Partner, KPMG LLP | | 158 | | None |
T-2 Invesco Pacific Growth Fund
Trustees and Officers—(continued)
| | | | | | | | |
Name, Year of Birth and Position(s) Held with the Trust | | Trustee and/
or Officer Since | | Principal Occupation(s) During Past 5 Years | | Number of
Funds in Fund
Complex
Overseen by
Trustee | | Other Directorship(s)
Held by Trustee During Past 5 Years |
| Independent Trustees—(continued) |
Christopher L. Wilson — 1957 Trustee | | 2017 | | Managing Partner, CT2, LLC (investing and consulting firm) Formerly: President/Chief Executive Officer, Columbia Funds, Bank of America Corporation; President/Chief Executive Officer, CDC IXIS Asset Management Services, Inc.; Principal & Director of Operations, Scudder Funds, Scudder, Stevens & Clark, Inc.; Assistant Vice President, Fidelity Investments | | 158 | | TD Asset Management USA Inc. (mutual fund complex) (22 portfolios); ISO New England, Inc. (non-profit organization managing regional electricity market) |
| Other Officers | | | | | | | | |
Sheri Morris — 1964 President, Principal Executive Officer and Treasurer | | 1999 | | President, Principal Executive Officer and Treasurer, The Invesco Funds; Vice President, Invesco Advisers, Inc. (formerly known as Invesco Institutional (N.A.), Inc.) (registered investment adviser); and Vice President, PowerShares Exchange-Traded Fund Trust, PowerShares Exchange-Traded Fund Trust II, PowerShares India Exchange-Traded Fund Trust, PowerShares Actively Managed Exchange-Traded Fund Trust and PowerShares Actively Managed Exchange-Traded Commodity Fund Trust Formerly: Vice President and Principal Financial Officer, The Invesco Funds; Vice President, Invesco Aim Advisers, Inc., Invesco Aim Capital Management, Inc. and Invesco Aim Private Asset Management, Inc.; Assistant Vice President and Assistant Treasurer, The Invesco Funds and Assistant Vice President, Invesco Advisers, Inc., Invesco Aim Capital Management, Inc. and Invesco Aim Private Asset Management, Inc.; and Treasurer, PowerShares Exchange-Traded Fund Trust, PowerShares Exchange-Traded Fund Trust II, PowerShares India Exchange-Traded Fund Trust and PowerShares Actively Managed Exchange-Traded Fund Trust | | N/A | | N/A |
Russell C. Burk — 1958 Senior Vice President and Senior Officer | | 2005 | | Senior Vice President and Senior Officer, The Invesco Funds | | N/A | | N/A |
John M. Zerr — 1962 Senior Vice President, Chief Legal Officer and Secretary | | 2006 | | Director, Senior Vice President, Secretary and General Counsel, Invesco Management Group, Inc. (formerly known as Invesco AIM Management Group, Inc.); Senior Vice President, Invesco Advisers, Inc. (formerly known as Invesco Institutional (N.A.), Inc.) (registered investment adviser); Senior Vice President and Secretary, Invesco Distributors, Inc. (formerly known as Invesco AIM Distributors, Inc.); Director, Vice President and Secretary, Invesco Investment Services, Inc. (formerly known as Invesco AIM Investment Services, Inc.) Senior Vice President, Chief Legal Officer and Secretary, The Invesco Funds; Managing Director, Invesco PowerShares Capital Management LLC; Director, Secretary and General Counsel, Invesco Investment Advisers LLC (formerly known as Van Kampen Asset Management); Secretary and General Counsel, Invesco Capital Markets, Inc. (formerly known as Van Kampen Funds Inc.) and Chief Legal Officer, PowerShares Exchange-Traded Fund Trust, PowerShares Exchange-Traded Fund Trust II, PowerShares India Exchange-Traded Fund Trust, PowerShares Actively Managed Exchange-Traded Fund Trust and PowerShares Actively Managed Exchange-Traded Commodity Fund Trust; Manager and Secretary, Invesco Indexing LLC Formerly: Director, Secretary, General Counsel and Senior Vice President, Van Kampen Exchange Corp.; Director, Vice President and Secretary, IVZ Distributors, Inc. (formerly known as INVESCO Distributors, Inc.); Director and Vice President, INVESCO Funds Group, Inc.; Director and Vice President, Van Kampen Advisors Inc.; Director, Vice President, Secretary and General Counsel, Van Kampen Investor Services Inc.; Director, Invesco Distributors, Inc. (formerly known as Invesco AIM Distributors, Inc.); Director, Senior Vice President, General Counsel and Secretary, Invesco AIM Advisers, Inc. and Van Kampen Investments Inc.; Director, Vice President and Secretary, Fund Management Company; Director, Senior Vice President, Secretary, General Counsel and Vice President, Invesco AIM Capital Management, Inc.; Chief Operating Officer and General Counsel, Liberty Ridge Capital, Inc. (an investment adviser); Vice President and Secretary, PBHG Funds (an investment company) and PBHG Insurance Series Fund (an investment company); Chief Operating Officer, General Counsel and Secretary, Old Mutual Investment Partners (a broker-dealer); General Counsel and Secretary, Old Mutual Fund Services (an administrator) and Old Mutual Shareholder Services (a shareholder servicing center); Executive Vice President, General Counsel and Secretary, Old Mutual Capital, Inc. (an investment adviser); and Vice President and Secretary, Old Mutual Advisors Funds (an investment company) | | N/A | | N/A |
Gregory G. McGreevey — 1962 Senior Vice President | | 2012 | | Senior Managing Director, Invesco Ltd.; Director, Chairman, President, and Chief Executive Officer, Invesco Advisers, Inc. (formerly known as Invesco Institutional (N.A.), Inc.) (registered investment adviser); Senior Vice President, Invesco Management Group, Inc.; Director, Invesco Mortgage Capital, Inc. and Invesco Senior Secured Management, Inc.; and Senior Vice President, The Invesco Funds Formerly: Assistant Vice President, The Invesco Funds | | N/A | | N/A |
T-3 Invesco Pacific Growth Fund
Trustees and Officers—(continued)
| | | | | | | | |
Name, Year of Birth and Position(s) Held with the Trust | | Trustee and/
or Officer Since | | Principal Occupation(s) During Past 5 Years | | Number of
Funds in Fund
Complex
Overseen by
Trustee | | Other Directorship(s)
Held by Trustee During Past 5 Years |
| Other Officers—(continued) | | | | | | | | |
Kelli Gallegos — 1970 Vice President, Principal Financial Officer and Assistant Treasurer | | 2008 | | Vice President, Principal Financial Officer and Assistant Treasurer, The Invesco Funds; Assistant Treasurer, Invesco PowerShares Capital Management LLC, PowerShares Exchange-Traded Fund Trust, PowerShares Exchange-Traded Fund Trust II, PowerShares India Exchange-Traded Fund Trust, PowerShares Actively Managed Exchange-Traded Fund Trust and PowerShares Actively Managed Exchange-Traded Commodity Fund Trust Formerly: Assistant Vice President, The Invesco Funds | | N/A | | N/A |
Tracy Sullivan — 1962 Vice President, Chief Tax Officer and Assistant Treasurer | | 2008 | | Vice President, Chief Tax Officer and Assistant Treasurer, The Invesco Funds; Assistant Treasurer, Invesco PowerShares Capital Management LLC, PowerShares Exchange-Traded Fund Trust, PowerShares Exchange-Traded Fund Trust II, PowerShares India Exchange-Traded Fund Trust, PowerShares Actively Managed Exchange-Traded Fund Trust and PowerShares Actively Managed Exchange-Traded Commodity Fund Trust Formerly: Assistant Vice President, The Invesco Funds | | N/A | | N/A |
Crissie M. Wisdom — 1969 Anti-Money Laundering Compliance Officer | | 2013 | | Anti-Money Laundering Compliance Officer, Invesco Advisers, Inc. (formerly known as Invesco Institutional (N.A.), Inc.) (registered investment adviser), Invesco Capital Markets, Inc. (formerly known as Van Kampen Funds Inc.), Invesco Distributors, Inc., Invesco Investment Services, Inc., Invesco Management Group, Inc., The Invesco Funds, and PowerShares Exchange-Traded Fund Trust, PowerShares Exchange-Traded Fund Trust II, PowerShares India Exchange-Traded Fund Trust, PowerShares Actively Managed Exchange-Traded Fund Trust and PowerShares Actively Managed Exchange-Traded Commodity Fund Trust; Anti-Money Laundering Compliance Officer and Bank Secrecy Act Officer, INVESCO National Trust Company and Invesco Trust Company; and Fraud Prevention Manager and Controls and Risk Analysis Manager for Invesco Investment Services, Inc. Formerly: Anti-Money Laundering Compliance Officer, Van Kampen Exchange Corp. | | N/A | | N/A |
Robert R. Leveille — 1969 Chief Compliance Officer | | 2016 | | Chief Compliance Officer, Invesco Advisers, Inc. (registered investment adviser); and Chief Compliance Officer, The Invesco Funds Formerly: Chief Compliance Officer, Putnam Investments and the Putnam Funds | | N/A | | N/A |
The Statement of Additional Information of the Trust includes additional information about the Fund’s Trustees and is available upon request, without charge, by calling 1.800.959.4246. Please refer to the Fund’s Statement of Additional Information for information on the Fund’s sub-advisers.
| | | | | | |
Office of the Fund 11 Greenway Plaza, Suite 1000 Houston, TX 77046-1173 | | Investment Adviser Invesco Advisers, Inc. 1555 Peachtree Street, N.E. Atlanta, GA 30309 | | Distributor Invesco Distributors, Inc. 11 Greenway Plaza, Suite 1000 Houston, TX 77046-1173 | | Auditors PricewaterhouseCoopers LLP 1000 Louisiana Street, Suite 5800 Houston, TX 77002-5678 |
| | | |
| | | | | | |
Counsel to the Fund Stradley Ronon Stevens & Young, LLP 2005 Market Street, Suite 2600 Philadelphia, PA 19103-7018 | | Counsel to the Independent Trustees Goodwin Procter LLP 901 New York Avenue, N.W. Washington, D.C. 20001 | | Transfer Agent Invesco Investment Services, Inc. 11 Greenway Plaza, Suite 1000 Houston, TX 77046-1173 | | Custodian State Street Bank and Trust Company 225 Franklin Street Boston, MA 02110-2801 |
T-4 Invesco Pacific Growth Fund
Explore High-Conviction Investing with Invesco

Go paperless with eDelivery
Visit invesco.com/edelivery to enjoy the convenience and security of anytime electronic access to your investment documents.
With eDelivery, you can elect to have any or all of the following materials delivered straight to your inbox to download, save and print from your own computer:
| ∎ | | Fund reports and prospectuses |
Invesco mailing information
Send general correspondence to Invesco Investment Services, Inc., P.O. Box 219078, Kansas City, MO 64121-9078.
Important notice regarding delivery of security holder documents
To reduce Fund expenses, only one copy of most shareholder documents may be mailed to shareholders with multiple accounts at the same address (Householding). Mailing of your shareholder documents may be householded indefinitely unless you instruct us otherwise. If you do not want the mailing of these documents to be combined with those for other members of your household, please contact Invesco Investment Services, Inc. at 800 959 4246 or contact your financial institution. We will begin sending you individual copies for each account within 30 days after receiving your request.
Fund holdings and proxy voting information
The Fund provides a complete list of its holdings four times in each fiscal year, at the quarter ends. For the second and fourth quarters, the lists appear in the Fund’s semiannual and annual reports to shareholders. For the first and third quarters, the Fund files the lists with the Securities and Exchange Commission (SEC) on Form N-Q. The most recent list of portfolio holdings is available at invesco.com/completeqtrholdings. Shareholders can also look up the Fund’s Forms N-Q on the SEC website at sec.gov. Copies of the Fund’s Forms N-Q may be reviewed and copied at the SEC Public Reference Room in Washington, D.C. You can obtain information on the operation of the Public Reference Room, including information about duplicating fee charges, by calling 202 551 8090 or 800 732 0330, or by electronic request at the following email address: publicinfo@sec.gov. The SEC file numbers for the Fund are shown below.
A description of the policies and procedures that the Fund uses to determine how to vote proxies relating to portfolio securities is available without charge, upon request, from our Client Services department at 800 959 4246 or at invesco.com/proxyguidelines. The information is also available on the SEC website, sec.gov.
| | |
Information regarding how the Fund voted proxies related to its portfolio securities during the most recent 12-month period ended June 30 is available at invesco.com/proxysearch. The information is also available on the SEC website, sec.gov. Invesco Advisers, Inc. is an investment adviser; it provides investment advisory services to individual and institutional clients and does not sell securities. Invesco Distributors, Inc. is the US distributor for Invesco Ltd.’s retail mutual funds, exchange-traded funds and institutional money market funds. Both are wholly owned, indirect subsidiaries of Invesco Ltd. | |  |
| | | | | | | | |
| SEC file numbers: 811-05426 and 033-19338 | | Invesco Distributors, Inc. | | MS-PGRO-AR-1 | | 12132017 | | 1022 |
Letters to Shareholders
| | |

Philip Taylor | | Dear Shareholders: This annual report includes information about your Fund, including performance data and a complete list of its investments as of the close of the reporting period. Inside is a discussion of how your Fund was managed and the factors that affected its performance during the reporting period. American voters went to the polls just days after the start of the reporting period, and their decisions quickly affected markets. The US stock market rallied strongly after the election, with major market indexes rising, and setting record highs, throughout the reporting period. Generally positive economic data, strong corporate earnings and hope for tax and regulatory reform contributed to the rally. US and global bond markets, as well as emerging market equities, sold off immediately following the election – with the US bond market eventually recovering most of its losses. Overseas, economic data were mixed, prompting the European Central Bank and central banks in China and Japan, among other countries, to maintain |
extraordinarily accommodative monetary policies. Citing positive economic trends – specifically, realized and expected labor market conditions and inflation – the US Federal Reserve raised interest rates three times during the reporting period: first in December 2016, and then again in March and June 2017. Health care and tax reform proved to be more difficult than expected to enact, with little progress achieved by the end of the reporting period.
Short-term market volatility can prompt some investors to abandon their investment plans – and can cause others to settle for whatever returns the market has to offer. The investment professionals at Invesco, in contrast, invest with high conviction. This means that, no matter the asset class or the strategy, each investment team has a passion to exceed. We want to help investors achieve better outcomes, such as seeking higher returns, helping mitigate risk and generating income. Of course, investing with high conviction can’t guarantee a profit or ensure success; no investment strategy can. To learn more about how we invest with high conviction, visit invesco.com/HighConviction.
You, too, can invest with high conviction by maintaining a long-term investment perspective and by working with your financial adviser on a regular basis. During periods of short-term market volatility or uncertainty, your financial adviser can keep you focused on your long-term investment goals – a new home, a child’s college education or a secure retirement. He or she also can share research about the economy, the markets and individual investment options.
Visit our website for more information on your investments
Our website, invesco.com/us, offers a wide range of market insights and investment perspectives. On the website, you’ll find detailed information about our funds, including performance, holdings and portfolio manager commentaries. You can access information about your account by completing a simple, secure online registration. To do so, select “Log In” on the right side of the homepage, and then select “Register for Individual Account Access.”
In addition to the resources accessible on our website and through our mobile app, you can obtain timely updates to help you stay informed about the markets and the economy by connecting with Invesco on Twitter, LinkedIn or Facebook. You can access our blog at blog.invesco.us.com. Our goal is to provide you the information you want, when and where you want it.
Finally, I’m pleased to share with you Invesco’s commitment to both the Principles for Responsible Investment and to considering environmental, social and governance issues in our robust investment process. I invite you to learn more at invesco.com/esg.
Have questions?
For questions about your account, contact an Invesco client services representative at 800 959 4246. For Invesco-related questions or comments, please email me directly at phil@invesco.com.
All of us at Invesco look forward to serving your investment management needs. Thank you for investing with us.
Sincerely,

Philip Taylor
Senior Managing Director, Invesco Ltd.
2 Invesco Select Companies Fund
| | | | |
 | | Dear Fellow Shareholders: Among the many important lessons I’ve learned in more than 40 years in a variety of business endeavors is the value of a trusted advocate. As independent chair of the Invesco Funds Board, I can assure you that the members of the Board are strong advocates for the interests of investors in Invesco’s mutual funds. We work hard to represent your interests through oversight of the quality of the investment management services your funds receive and other matters important to your investment, including but not limited to: |
| Bruce Crockett | | ∎ | | Ensuring that Invesco offers a diverse lineup of mutual funds that your financial adviser can use to strive to meet your financial needs as your investment goals change over time. |
| | ∎ | | Monitoring how the portfolio management teams of the Invesco funds are performing in light of changing economic and market conditions. |
| ∎ | Assessing each portfolio management team’s investment performance within the context of the investment strategy described in the fund’s prospectus. |
| ∎ | Monitoring for potential conflicts of interests that may impact the nature of the services that your funds receive. |
We believe one of the most important services we provide our fund shareholders is the annual review of the funds’ advisory and sub-advisory contracts with Invesco Advisers and its affiliates. This review is required by the Investment Company Act of 1940 and focuses on the nature and quality of the services Invesco provides as the adviser to the Invesco funds and the reasonableness of the fees that it charges for those services. Each year, we spend months carefully reviewing information received from Invesco and a variety of independent sources, such as performance and fee data prepared by Lipper, Inc. (a subsidiary of Broadridge Financial Solutions, Inc.), an independent, third-party firm widely recognized as a leader in its field. We also meet with our independent legal counsel and other independent advisers to review and help us assess the information that we have received. Our goal is to assure that you receive quality investment management services for a reasonable fee.
I trust the measures outlined above provide assurance that you have a worthy advocate when it comes to choosing the Invesco Funds.
As always, please contact me at bruce@brucecrockett.com with any questions or concerns you may have. On behalf of the Board, we look forward to continuing to represent your interests and serving your needs.
Sincerely,

Bruce L. Crockett
Independent Chair
Invesco Funds Board of Trustees
3 Invesco Select Companies Fund
Management’s Discussion of Fund Performance
| | | | | |
Performance summary For the fiscal year ended October 31, 2017, Class A shares of Invesco Select Companies Fund (the Fund), at net asset value (NAV), underperformed the Fund’s style-specific benchmark, the Russell 2000 Index. Your Fund’s long-term performance appears later in this report. |
| | | | | |
Fund vs. Indexes Total returns, 10/31/16 to 10/31/17, at net asset value (NAV). Performance shown does not include applicable contingent deferred sales charges (CDSC) or front-end sales charges, which would have reduced performance. |
| | | | |
| |
| Class A Shares | | | 25.71 | % |
| Class B Shares | | | 24.80 | |
| Class C Shares | | | 24.77 | |
| Class R Shares | | | 25.45 | |
| Class Y Shares | | | 26.00 | |
| Class R5 Shares | | | 26.09 | |
| Class R6 Shares* | | | 26.00 | |
| S&P 500 Indexq (Broad Market Index) | | | 23.63 | |
| Russell 2000 Indexq (Style-Specific Index) | | | 27.85 | |
| Lipper Small-Cap Core Funds Index∎ (Peer Group Index) | | | 26.22 | |
Source(s): qFactSet Research Systems Inc.; ∎Lipper Inc. *Class R6 shares incepted on April 4, 2017. See page 7 for more information. | | | | |
Market conditions and your Fund
Despite highly destructive hurricanes that threatened to derail a years-long recovery, the US economy continued to expand throughout the fiscal year ended October 31, 2017. Gross domestic product (GDP) – the value of all goods and services produced in the US – grew by 1.8% in the fourth quarter of 2016, by 1.2% in the first quarter and by 3.1% in the second quarter of 2017.1 Inflation remained subdued even as the labor market continued to strengthen. Unemployment continued its multiyear decline, hitting just 4.2% in September – a 16-year low.2
Given signs of an improving economy, the US Federal Reserve (the Fed) raised interest rates three times during the reporting period, most recently in June 2017.3 The Fed pledged that “realized and expected economic conditions relative to its objectives of maximum employment
and 2 percent inflation” will guide its future actions. At the close of the reporting period, Fed policy remained accommodative, and the fed funds target rate stood at a range of 1.00% to 1.25% – up 75 basis points for the reporting period.3 (A basis point is 0.01%.)
Despite the Fed’s actions, major US stock market indexes repeatedly hit all-time highs throughout the reporting period. The stock market rally began immediately following the outcome of the US presidential election in November 2016, based on investors’ hopes for reduced regulation, lowered corporate and personal tax rates and increased infrastructure spending. The stock market rally continued throughout the reporting period, fueled by generally positive economic data, strong corporate earnings and improved consumer confidence – even as the prospect for health care and tax reform faded somewhat.
Before we discuss the Fund’s results during the fiscal year, it is helpful to briefly explain how we manage the Fund for shareholders. We view ourselves as business people buying businesses, and we consider the purchase of a stock as an ownership interest in a business. We strive to develop a proprietary view of a business through in-depth, fundamental research that includes careful financial statement analysis and meetings with company management. We then seek to purchase businesses whose stock prices are below what we have calculated to be the true value of the company based on an estimate of its future free cash flows.
Our investment approach focuses on individual businesses rather than market sectors. Therefore, the Fund shares little in common with sector weightings of various market indexes. However, if we were to broadly categorize businesses with which we had the most success during the fiscal year, our investments in select financials and information technology (IT) stocks were the largest contributors to the Fund’s absolute performance.
Relative to the Fund’s style-specific benchmark, security selection in the financials and telecommunication services sectors were beneficial to the Fund’s relative performance. Additionally, security selection in and underweight exposure to the real estate sector also helped the Fund’s relative performance. Conversely, security selection in the IT and industrials sectors detracted from the Fund’s relative performance. Additionally, cash holdings hurt the Fund’s relative performance, given strong equity performance during the fiscal year.
Encore Capital Group, a financial company that buys consumer receivables from major banks and credit unions and works to collect as much of the outstanding debt as possible, was the top contributor to the Fund’s performance, given
| | |
Portfolio Composition |
| By sector | | % of total net assets |
| |
| Information Technology | | 31.6% |
| Industrials | | 16.2 |
| Consumer Discretionary | | 10.9 |
| Health Care | | 8.4 |
| Materials | | 8.0 |
| Energy | | 7.3 |
| Financials | | 7.3 |
| Real Estate | | 3.8 |
| Money Market Funds Plus Other Assets Less Liabilities | | 6.5 |
| | | | |
| Top 10 Equity Holdings* | | |
| | | % of total net assets |
| | |
| 1. | | Encore Capital Group, Inc. | | 7.3% |
| 2. | | GasLog Ltd. | | 5.7 |
| 3. | | Microsemi Corp. | | 5.4 |
| 4. | | CommScope Holding Co., Inc. | | 5.3 |
| 5. | | Charles River Laboratories International, Inc. | | 5.0 |
| 6. | | Spirit Airlines Inc. | | 4.8 |
| 7. | | Liberty Broadband Corp.- Class A | | 4.7 |
| 8. | | Regal-Beloit Corp. | | 4.7 |
| 9. | | John Wiley & Sons, Inc.-Class A | | 4.7 |
| 10. | | Axalta Coating Systems Ltd. | | 4.7 |
| | | | |
| Total Net Assets | | | $477.5 million | |
Total Number of Holdings* | | | 24 | |
| The Fund’s holdings are subject to change, and there is no assurance that the Fund will continue to hold any particular security. | |
| *Excluding money market fund holdings. | |
| Data presented here are as of October 31, 2017. | |
4 Invesco Select Companies Fund
solid earnings and improved outlook for the market environment.
Also among the Fund’s top contributors were General Communications and Liberty Broadband. During the reporting period, General Communications announced it would be acquired by Liberty Interactive (not a Fund holding), which owns Liberty Broadband, at a price that represented a significant premium to the previous day’s trading price and our original purchase price. We sold our position in General Communications during the reporting period because the Fund would participate in the new, combined company through its existing position in Liberty Broadband.
Spirit Airlines, an ultra-low-cost US airline operator, was among the largest detractors from the Fund’s performance. The company’s stock price declined due to continued pricing pressure from increased competition. Despite the weakness during the reporting period, we believed Spirit would continue to gain market share with its unique operating model.
In addition, Alere was also among the Fund’s top detractors during the fiscal year. We sold our remaining stake in the company, given our concerns that its acquisition by Abbott Laboratories (not a Fund holding) would be cancelled, and because we believed Alere’s intrinsic value was below the share price it was trading at.
During the fiscal year, we made new investments in Siteone Landscape Supply, the largest wholesale distributor of landscape supplies in the US with a growing presence in Canada, and Sabre, a leading technology provider for the global travel industry. Generally, we sell Fund holdings when they reach full valuation; if new, relatively more attractive investment opportunities exist; or if new information changes our thesis on the future of a business. We sold Mitel Networks and Cubic during the reporting period.
During the reporting period, we continued to focus on finding quality businesses we believed were trading at attractive values relative to their long-term prospects. In contrast, the market is often driven by short-term events or outlooks in both good times and bad. Market volatility allows us to take advantage of investment opportunities we believe may benefit the Fund in the long term. While we can never predict future Fund performance, we pledge to you that we will adhere to our discipline of being business people who buy businesses – and we will continually strive to upgrade the quality of the Fund’s portfolio.
As always, we thank you for your investment in Invesco Select Companies Fund and for sharing our long-term investment perspective.
| 1 | Source: Bureau of Economic Analysis |
| 2 | Sources: Bureau of Labor Statistics, Bloomberg |
| 3 | Source: US Federal Reserve |
The views and opinions expressed in management’s discussion of Fund performance are those of Invesco Advisers, Inc. These views and opinions are subject to change at any time based on factors such as market and economic conditions. These views and opinions may not be relied upon as investment advice or recommendations, or as an offer for a particular security. The information is not a complete analysis of every aspect of any market, country, industry, security or the Fund. Statements of fact are from sources considered reliable, but Invesco Advisers, Inc. makes no representation or warranty as to their completeness or accuracy. Although historical performance is no guarantee of future results, these insights may help you understand our investment management philosophy.
See important Fund and, if applicable, index disclosures later in this report.
| | |
 | | Rob Mikalachki Chartered Financial Analyst, Portfolio Manager, is lead manager of Invesco Select Companies |
| Fund. He joined Invesco in 1999. Mr. Mikalachki earned a business degree from Wilfrid Laurier University. |
| | |
 | | Virginia Au Chartered Financial Analyst, Portfolio Manager, is manager of Invesco Select Companies Fund. She |
| joined Invesco in 2006. Ms. Au earned a Bachelor of Commerce degree in finance from The University of British Columbia. |
| | |
 | | Jason Whiting Chartered Financial Analyst, Portfolio Manager, is manager of Invesco Select Companies Fund. He |
| joined Invesco in 2003. Mr. Whiting earned a BBA from Wilfrid Laurier University. |
5 Invesco Select Companies Fund
Your Fund’s Long-Term Performance
Results of a $10,000 Investment – Oldest Share Class(es)
Fund and index data from 10/31/07
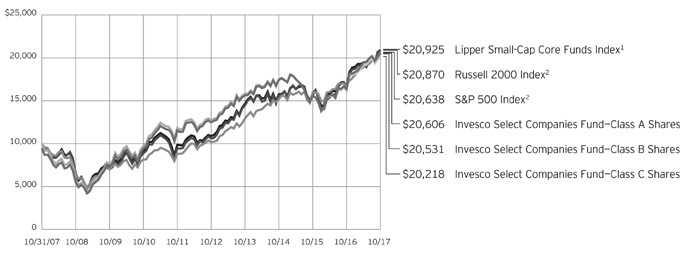
| 2 | Source: FactSet Research Systems Inc. |
Past performance cannot guarantee comparable future results.
The data shown in the chart include reinvested distributions, applicable sales charges and Fund expenses including management fees. Results for Class B shares are calculated as if a hypothetical
shareholder had liquidated his entire investment in the Fund at the close of the reporting period and paid the contingent deferred sales charges, if applicable. Index results include reinvested dividends, but they do not reflect sales charges. Performance of the peer group,
if applicable, reflects fund expenses and management fees; performance of a market index does not. Performance shown in the chart and table(s) does not reflect deduction of taxes a shareholder would pay on Fund distributions or sale of Fund shares.
| ∎ | | US government obligations risk. Obligations of US government agencies and authorities receive varying levels of support and may not be backed by the full faith and credit of the US government, which could affect the Fund’s ability to recover should they default. No assurance can be given that the US government will provide financial support to its agencies and authorities if it is not obligated by law to do so. |
| ∎ | | Value investing style risk. A value investing style subjects the Fund to the risk that the valuations never improve or that the returns on value equity securities are less than returns on other styles of investing or the overall stock market. |
About indexes used in this report
| ∎ | | The S&P 500® Index is an unmanaged index considered representative of the US stock market. |
| ∎ | | The Russell 2000® Index is an unmanaged index considered representative of small-cap stocks. The Russell 2000 Index is a trademark/service mark of the Frank Russell Co. Russell® is a trademark of the Frank Russell Co. |
| ∎ | | The Lipper Small-Cap Core Funds Index is an unmanaged index considered representative of small-cap core funds tracked by Lipper. |
| ∎ | | The Fund is not managed to track the performance of any particular index, including the index(es) described here, and consequently, the performance of the Fund may deviate significantly from the performance of the index(es). |
| ∎ | | A direct investment cannot be made in an index. Unless otherwise indicated, index results include reinvested dividends, and they do not reflect sales charges. Performance of the peer group, if applicable, reflects fund expenses; performance of a market index does not. |
Other information
| ∎ | | The returns shown in management’s discussion of Fund performance are based on net asset values (NAVs) calculated for shareholder transactions. Generally accepted accounting principles require adjustments to be made to the net assets of the Fund at period end for financial reporting purposes, and as such, the NAVs for shareholder transactions and the returns based on those NAVs may differ from the NAVs and returns reported in the Financial Highlights. |
| ∎ | | Industry classifications used in this report are generally according to the Global Industry Classification Standard, which was developed by and is the exclusive property and a service mark of MSCI Inc. and Standard & Poor’s. |
6 Invesco Select Companies Fund
| | | | | | |
| | | Average Annual Total Returns | |
| | As of 10/31/17, including maximum applicable sales charges | |
| | | |
| | |
| | | Class A Shares | | | | |
| | | Inception (11/4/03) | | | 10.01% | |
| | | 10 Years | | | 7.50 | |
| | | 5 Years | | | 9.26 | |
| | | 1 Year | | | 18.82 | |
| | |
| | | Class B Shares | | | | |
| | | Inception (11/4/03) | | | 9.99% | |
| | | 10 Years | | | 7.46 | |
| | | 5 Years | | | 9.43 | |
| | | 1 Year | | | 19.80 | |
| | |
| | | Class C Shares | | | | |
| | | Inception (11/4/03) | | | 9.64% | |
| | | 10 Years | | | 7.29 | |
| | | 5 Years | | | 9.69 | |
| | | 1 Year | | | 23.77 | |
| | |
| | | Class R Shares | | | | |
| | | Inception (4/30/04) | | | 10.14% | |
| | | 10 Years | | | 7.84 | |
| | | 5 Years | | | 10.23 | |
| | | 1 Year | | | 25.45 | |
| | |
| | | Class Y Shares | | | | |
| | | 10 Years | | | 8.34% | |
| | | 5 Years | | | 10.78 | |
| | | 1 Year | | | 26.00 | |
| | |
| | | Class R5 Shares | | | | |
| | | Inception (4/30/04) | | | 10.84% | |
| | | 10 Years | | | 8.52 | |
| | | 5 Years | | | 10.87 | |
| | | 1 Year | | | 26.09 | |
| | |
| | | Class R6 Shares | | | | |
| | | 10 Years | | | 8.13% | |
| | | 5 Years | | | 10.56 | |
| | 1 Year | | | 26.00 | |
| | | | | | |
| | | Average Annual Total Returns | |
| | As of 9/30/17, the most recent calendar quarter end, including maximum applicable sales charges | |
| | | |
| | |
| | | Class A Shares | | | | |
| | | Inception (11/4/03) | | | 9.88% | |
| | | 10 Years | | | 7.39 | |
| | | 5 Years | | | 8.41 | |
| | | 1 Year | | | 13.94 | |
| | |
| | | Class B Shares | | | | |
| | | Inception (11/4/03) | | | 9.87% | |
| | | 10 Years | | | 7.36 | |
| | | 5 Years | | | 8.58 | |
| | | 1 Year | | | 14.66 | |
| | |
| | | Class C Shares | | | | |
| | | Inception (11/4/03) | | | 9.52% | |
| | | 10 Years | | | 7.20 | |
| | | 5 Years | | | 8.84 | |
| | | 1 Year | | | 18.71 | |
| | |
| | | Class R Shares | | | | |
| | | Inception (4/30/04) | | | 10.02% | |
| | | 10 Years | | | 7.73 | |
| | | 5 Years | | | 9.37 | |
| | | 1 Year | | | 20.28 | |
| | |
| | | Class Y Shares | | | | |
| | | 10 Years | | | 8.24% | |
| | | 5 Years | | | 9.92 | |
| | | 1 Year | | | 20.88 | |
| | |
| | | Class R5 Shares | | | | |
| | | Inception (4/30/04) | | | 10.73% | |
| | | 10 Years | | | 8.42 | |
| | | 5 Years | | | 10.02 | |
| | | 1 Year | | | 21.05 | |
| | |
| | | Class R6 Shares | | | | |
| | | 10 Years | | | 8.03% | |
| | | 5 Years | | | 9.70 | |
| | 1 Year | | | 20.84 | |
the expense ratios presented in other sections of this report that are based on expenses incurred during the period covered by this report.
Class A share performance reflects the maximum 5.50% sales charge, and Class B and Class C share performance reflects the applicable contingent deferred sales charge (CDSC) for the period involved. The CDSC on Class B shares declines from 5% beginning at the time of purchase to 0% at the beginning of the seventh year. The CDSC on Class C shares is 1% for the first year after purchase. Class R, Class Y, Class R5 and Class R6 shares do not have a front-end sales charge or a CDSC; therefore, performance is at net asset value.
The performance of the Fund’s share classes will differ primarily due to different sales charge structures and class expenses.
Fund performance reflects any applicable fee waivers and/or expense reimbursements. Had the adviser not waived fees and/or reimbursed expenses currently or in the past, returns would have been lower. See current prospectus for more information.
| 1 | Total annual Fund operating expenses after any contractual fee waivers and/or expense reimbursements by the adviser in effect through at least June 30, 2019. See current prospectus for more information. |
Class Y shares incepted on October 3, 2008. Performance shown prior to that date is that of Class A shares and includes the 12b-1 fees applicable to Class A shares.
Class R6 shares incepted on April 4, 2017. Performance shown prior to that date is that of Class A shares and includes the 12b-1 fees applicable to Class A shares.
The performance data quoted represent past performance and cannot guarantee comparable future results; current performance may be lower or higher. Please visit invesco.com/performance for the most recent month-end performance. Performance figures reflect reinvested distributions, changes in net asset value and the effect of the maximum
sales charge unless otherwise stated. Investment return and principal value will fluctuate so that you may have a gain or loss when you sell shares.
The net annual Fund operating expense ratio set forth in the most recent Fund prospectus as of the date of this report for Class A, Class B, Class C, Class R, Class Y, Class R5 and Class R6 shares was 1.25%, 2.00%, 2.00%, 1.50%, 1.00%, 0.90% and 0.85%, respectively.1 The total annual Fund operating expense ratio set forth in the most recent Fund prospectus as of the date of this report for Class A, Class B, Class C, Class R, Class Y, Class R5 and Class R6 shares was 1.26%, 2.01%, 2.01%, 1.51%, 1.01%, 0.91% and 0.86%, respectively. The expense ratios presented above may vary from
7 Invesco Select Companies Fund
Invesco Select Companies Fund’s investment objective is long-term growth of capital.
| ∎ | Unless otherwise stated, information presented in this report is as of October 31, 2017, and is based on total net assets. |
| ∎ | Unless otherwise noted, all data provided by Invesco. |
| ∎ | To access your Fund’s reports/prospectus, visit invesco.com/fundreports. |
About share classes
| ∎ | Class B shares may not be purchased for new or additional investments. Please see the prospectus for more information. |
| ∎ | Class R shares are generally available only to employer sponsored retirement and benefit plans. Please see the prospectus for more information. |
| ∎ | Class Y shares are available only to certain investors. Please see the prospectus for more information. |
| ∎ | Class R5 shares and Class R6 shares are available for use by retirement plans that meet certain standards and for institutional investors. Class R6 shares are also available through intermediaries that have established an agreement with Invesco Distributors, Inc. to make such shares available for use in retail omnibus accounts. Please see the prospectus for more information. |
Principal risks of investing in the Fund
| ∎ | Cash/cash equivalents risk. In rising markets, holding cash or cash equivalents will negatively affect the Fund’s performance relative to its benchmark. |
| ∎ | Debt securities risk. The prices of debt securities held by the Fund will be affected by changes in interest rates, the creditworthiness of the issuer and other factors. An increase in prevailing interest rates typically causes the value of existing debt securities to fall and often has a greater impact on longer-duration debt securities and higher quality debt securities. Falling interest rates will cause the Fund to reinvest the proceeds of debt securities that have been repaid by the issuer at lower interest rates. Falling interest rates may also reduce the Fund’s distributable income because interest payments on floating rate debt instruments held by the Fund will decline. The Fund could lose money on investments in debt securities if the issuer or borrower fails to meet its obligations to make interest payments |
| | and/or to repay principal in a timely manner. Changes in an issuer’s financial strength, the market’s perception of such strength or in the credit rating of the issuer or the security may affect the value of debt securities. The Adviser’s credit analysis may fail to anticipate such changes, which could result in buying a debt security at an inopportune time or failing to sell a debt security in advance of a price decline or other credit event. |
| ∎ | Foreign securities risk. The Fund’s foreign investments may be adversely affected by political and social instability, changes in economic or taxation policies, difficulty in enforcing obligations, decreased liquidity or increased volatility. Foreign investments also involve the risk of the possible seizure, nationalization or expropriation of the issuer or foreign deposits (in which the Fund could lose its entire investments in a certain market) and the possible adoption of foreign governmental restrictions such as exchange controls. Unless the Fund has hedged its foreign securities risk, foreign securities risk also involves the risk of negative foreign currency rate fluctuations, which may cause the value of securities denominated in such foreign currency (or other instruments through which the Fund has exposure to foreign currencies) to decline in value. Currency exchange rates may fluctuate significantly over short periods of time. Currency hedging strategies, if used, are not always successful. |
| ∎ | Limited number of holdings risk. Because the Fund may hold a more limited number of securities than other funds with a similar investment strategy, a change in the value of these securities could significantly affect the value of your investment in the Fund. |
| ∎ | Management risk. The Fund is actively managed and depends heavily on the Adviser’s judgment about markets, interest rates or the attractiveness, relative values, liquidity, or potential appreciation |
| | of particular investments made for the Fund’s portfolio. The Fund could experience losses if these judgments prove to be incorrect. Additionally, legislative, regulatory, or tax developments may adversely affect management of the Fund and, therefore, the ability of the Fund to achieve its investment objective. |
| ∎ | Market risk. The market values of the Fund’s investments, and therefore the value of the Fund’s shares, will go up and down, sometimes rapidly or unpredictably. Market risk may affect a single issuer, industry or section of the economy, or it may affect the market as a whole. Individual stock prices tend to go up and down more dramatically than those of certain other types of investments, such as bonds. During a general downturn in the financial markets, multiple asset classes may decline in value. When markets perform well, there can be no assurance that specific investments held by the Fund will rise in value. |
| ∎ | Sector focus risk. The Fund may from time to time invest a significant amount of its assets (i.e. over 25%) in one market sector or group of related industries. In this event, the Fund’s performance will depend to a greater extent on the overall condition of the sector or group of industries and there is increased risk that the Fund will lose significant value if conditions adversely affect that sector or group of industries. |
| ∎ | Small- and mid-capitalization companies risks. Small- and mid-capitalization companies tend to be more vulnerable to changing market conditions, may have little or no operating history or track record of success, and may have more limited product lines and markets, less experienced management and fewer financial resources than larger companies. These companies’ securities may be more volatile and less liquid than those of more established companies, and their returns may vary, sometimes significantly, from the overall securities market. |
| | |
| |
This report must be accompanied or preceded by a currently effective Fund prospectus, which contains more complete information, including sales charges and expenses. Investors should read it carefully before investing. | | continued on page 6 |
| | |
| | | |
| NOT FDIC INSURED | MAY LOSE VALUE | NO BANK GUARANTEE | | |
8 Invesco Select Companies Fund
Schedule of Investments(a)
October 31, 2017
| | | | | | | | |
| | | Shares | | | Value | |
Common Stocks–93.50% | |
| Airlines–4.83% | |
Spirit Airlines Inc.(b) | | | 621,810 | | | $ | 23,062,933 | |
|
| Application Software–2.78% | |
Nuance Communications, Inc.(b) | | | 899,784 | | | | 13,262,816 | |
|
| Automotive Retail–1.57% | |
America's Car-Mart, Inc.(b) | | | 175,394 | | | | 7,515,633 | |
|
| Cable & Satellite–4.68% | |
Liberty Broadband Corp.–Class A(b) | | | 259,076 | | | | 22,334,942 | |
|
| Commodity Chemicals–3.32% | |
Chemtrade Logistics Income Fund (Canada) | | | 1,045,784 | | | | 15,855,775 | |
|
| Communications Equipment–5.29% | |
CommScope Holding Co., Inc.(b) | | | 786,536 | | | | 25,279,267 | |
|
| Consumer Finance–7.26% | |
Encore Capital Group, Inc.(b) | | | 746,777 | | | | 34,687,792 | |
|
| Data Processing & Outsourced Services–10.30% | |
Alliance Data Systems Corp. | | | 66,801 | | | | 14,945,388 | |
Global Payments Inc. | | | 192,765 | | | | 20,037,922 | |
Sabre Corp. | | | 726,795 | | | | 14,216,110 | |
| | | | | | | | 49,199,420 | |
|
| Diversified Support Services–2.15% | |
Performant Financial Corp.(b)(c) | | | 5,527,196 | | | | 10,280,585 | |
|
| Electrical Components & Equipment–4.68% | |
Regal-Beloit Corp. | | | 275,077 | | | | 22,322,498 | |
|
| Health Care Supplies–3.40% | |
Cooper Cos., Inc. (The) | | | 67,612 | | | | 16,244,459 | |
|
| IT Consulting & Other Services–4.48% | |
Booz Allen Hamilton Holding Corp. | | | 565,823 | | | | 21,382,451 | |
|
| Life Sciences Tools & Services–5.00% | |
Charles River Laboratories International, Inc.(b) | | | 205,310 | | | | 23,875,500 | |
| | | | | | | | |
| | | Shares | | | Value | |
| Oil & Gas Equipment & Services–1.53% | |
ION Geophysical Corp.(b)(c) | | | 938,485 | | | $ | 7,320,183 | |
|
| Oil & Gas Storage & Transportation–5.73% | |
GasLog Ltd. (Monaco) | | | 1,585,397 | | | | 27,348,098 | |
|
| Other Diversified Financial Services–0.00% | |
Brompton Corp. (Canada)(b)(d) | | | 69,374 | | | | 0 | |
|
| Publishing–4.66% | |
John Wiley & Sons, Inc.–Class A | | | 407,525 | | | | 22,271,241 | |
|
| Real Estate Services–3.85% | |
Colliers International Group Inc. (Canada) | | | 313,971 | | | | 18,401,168 | |
|
| Semiconductors–5.41% | |
Microsemi Corp.(b) | | | 484,010 | | | | 25,831,614 | |
|
| Specialty Chemicals–4.66% | |
Axalta Coating Systems Ltd.(b) | | | 668,706 | | | | 22,234,474 | |
|
| Systems Software–3.35% | |
TiVo Corp. | | | 879,815 | | | | 15,968,642 | |
|
| Trading Companies & Distributors–4.57% | |
SiteOne Landscape Supply, Inc.(b) | | | 343,662 | | | | 21,825,974 | |
Total Common Stocks
(Cost $379,813,546) | | | | 446,505,465 | |
| | |
Money Market Funds–6.61% | | | | | | | | |
Invesco Government & Agency Portfolio–Institutional Class, 0.95%(e) | | | 18,928,268 | | | | 18,928,268 | |
Invesco Treasury Portfolio–Institutional Class, 0.94%(e) | | | 12,618,846 | | | | 12,618,846 | |
Total Money Market Funds
(Cost $31,547,114) | | | | 31,547,114 | |
TOTAL INVESTMENTS IN SECURITIES–100.11%
(Cost $411,360,660) | | | | 478,052,579 | |
OTHER ASSETS LESS LIABILITIES–(0.11)% | | | | (504,047 | ) |
NET ASSETS–100.00% | | | $ | 477,548,532 | |
Notes to Schedule of Investments:
| (a) | Industry and/or sector classifications used in this report are generally according to the Global Industry Classification Standard, which was developed by and is the exclusive property and a service mark of MSCI Inc. and Standard & Poor’s. |
| (b) | Non-income producing security. |
| (c) | Affiliated company during the period. The Investment Company Act of 1940 defines an “affiliated person” as an issuance in which a fund holds 5% or more of the outstanding voting securities. The Fund has not owned enough of the outstanding voting securities of the issuer to have control (as defined in the Investment Company Act of 1940) of that issuer. The aggregate value of these securities as of October 31, 2017 was $17,600,768, which represented 3.69% of the Fund’s Net Assets. See Note 4. |
| (d) | Security valued using significant unobservable inputs (Level 3). See Note 3. |
| (e) | The money market fund and the Fund are affiliated by having the same investment adviser. The rate shown is the 7-day SEC standardized yield as of October 31, 2017. |
See accompanying Notes to Financial Statements which are an integral part of the financial statements.
9 Invesco Select Companies Fund
Statement of Assets and Liabilities
October 31, 2017
| | | | |
Assets: | | | | |
Investments in securities, at value (Cost $255,739,424) | | $ | 428,904,697 | |
Investments in affiliates, at value (Cost $155,621,236) | | | 49,147,882 | |
Foreign currencies, at value (Cost $69,338) | | | 68,903 | |
Receivable for: | | | | |
Investments sold | | | 2,007,009 | |
Fund shares sold | | | 491,923 | |
Dividends | | | 99,242 | |
Investment for trustee deferred compensation and retirement plans | | | 158,838 | |
Other assets | | | 57,394 | |
Total assets | | | 480,935,888 | |
| |
Liabilities: | | | | |
Payable for: | | | | |
Fund shares reacquired | | | 2,782,168 | |
Accrued fees to affiliates | | | 381,003 | |
Accrued trustees’ and officers’ fees and benefits | | | 2,438 | |
Accrued other operating expenses | | | 46,358 | |
Trustee deferred compensation and retirement plans | | | 175,389 | |
Total liabilities | | | 3,387,356 | |
Net assets applicable to shares outstanding | | $ | 477,548,532 | |
| |
Net assets consist of: | | | | |
Shares of beneficial interest | | $ | 349,501,948 | |
Undistributed net investment income (loss) | | | (690,920 | ) |
Undistributed net realized gain | | | 62,058,642 | |
Net unrealized appreciation | | | 66,678,862 | |
| | | $ | 477,548,532 | |
| | | | |
Net Assets: | | | | |
Class A | | $ | 250,619,360 | |
Class B | | $ | 1,199,114 | |
Class C | | $ | 95,456,878 | |
Class R | | $ | 22,747,493 | |
Class Y | | $ | 80,571,887 | |
Class R5 | | $ | 26,942,814 | |
Class R6 | | $ | 10,986 | |
|
Shares outstanding, no par value,
with an unlimited number of shares authorized: | |
Class A | | | 12,347,700 | |
Class B | | | 68,240 | |
Class C | | | 5,443,464 | |
Class R | | | 1,170,847 | |
Class Y | | | 3,882,594 | |
Class R5 | | | 1,246,479 | |
Class R6 | | | 508 | |
Class A: | | | | |
Net asset value per share | | $ | 20.30 | |
Maximum offering price per share | | | | |
(Net asset value of $20.30 ¸ 94.50%) | | $ | 21.48 | |
Class B: | | | | |
Net asset value and offering price per share | | $ | 17.57 | |
Class C: | | | | |
Net asset value and offering price per share | | $ | 17.54 | |
Class R: | | | | |
Net asset value and offering price per share | | $ | 19.43 | |
Class Y: | | | | |
Net asset value and offering price per share | | $ | 20.75 | |
Class R5: | | | | |
Net asset value and offering price per share | | $ | 21.62 | |
Class R6: | | | | |
Net asset value and offering price per share | | $ | 21.63 | |
See accompanying Notes to Financial Statements which are an integral part of the financial statements.
10 Invesco Select Companies Fund
Statement of Operations
For the year ended October 31, 2017
| | | | |
Investment income: | |
Dividends (net of foreign withholding taxes of $150,082) | | $ | 4,398,865 | |
Dividends from affiliates | | | 292,687 | |
Total investment income | | | 4,691,552 | |
| |
Expenses: | | | | |
Advisory fees | | | 3,916,481 | |
Administrative services fees | | | 150,256 | |
Custodian fees | | | 16,904 | |
Distribution fees: | | | | |
Class A | | | 707,458 | |
Class B | | | 18,873 | |
Class C | | | 1,045,971 | |
Class R | | | 135,249 | |
Transfer agent fees — A, B, C, R and Y | | | 1,011,749 | |
Transfer agent fees — R5 | | | 31,823 | |
Transfer agent fees — R6 | | | 1 | |
Trustees’ and officers’ fees and benefits | | | 28,746 | |
Registration and filing fees | | | 103,234 | |
Reports to shareholders | | | 132,884 | |
Professional services fees | | | 51,733 | |
Other | | | 16,756 | |
Total expenses | | | 7,368,118 | |
Less: Fees waived and expense offset arrangement(s) | | | (54,415 | ) |
Net expenses | | | 7,313,703 | |
Net investment income (loss) | | | (2,622,151 | ) |
| |
Realized and unrealized gain (loss) from: | | | | |
Net realized gain (loss) from: | | | | |
Investment securities | | | 67,410,052 | |
Foreign currencies | | | (23,750 | ) |
| | | | 67,386,302 | |
Change in net unrealized appreciation (depreciation) of: | | | | |
Investment securities | | | 59,580,083 | |
Foreign currencies | | | (12,773 | ) |
| | | | 59,567,310 | |
Net realized and unrealized gain | | | 126,953,612 | |
Net increase in net assets resulting from operations | | $ | 124,331,461 | |
See accompanying Notes to Financial Statements which are an integral part of the financial statements.
11 Invesco Select Companies Fund
Statement of Changes in Net Assets
For the years ended October 31, 2017 and 2016
| | | | | | | | |
| | | 2017 | | | 2016 | |
Operations: | | | | | | | | |
Net investment income (loss) | | $ | (2,622,151 | ) | | $ | (3,817,407 | ) |
Net realized gain | | | 67,386,302 | | | | 22,461,203 | |
Change in net unrealized appreciation (depreciation) | | | 59,567,310 | | | | (2,473,372 | ) |
Net increase in net assets resulting from operations | | | 124,331,461 | | | | 16,170,424 | |
| | |
Distributions to shareholders from net realized gains: | | | | | | | | |
Class A | | | (11,477,261 | ) | | | (90,607,514 | ) |
Class B | | | (93,782 | ) | | | (852,464 | ) |
Class C | | | (4,283,225 | ) | | | (27,331,498 | ) |
Class R | | | (1,126,806 | ) | | | (9,286,133 | ) |
Class Y | | | (1,868,112 | ) | | | (25,445,697 | ) |
Class R5 | | | (1,176,563 | ) | | | (9,411,972 | ) |
Total distributions from net realized gains | | | (20,025,749 | ) | | | (162,935,278 | ) |
| | |
Share transactions–net: | | | | | | | | |
Class A | | | (109,707,186 | ) | | | (88,653,328 | ) |
Class B | | | (1,432,978 | ) | | | (960,874 | ) |
Class C | | | (22,745,157 | ) | | | (2,538,965 | ) |
Class R | | | (12,166,848 | ) | | | (7,773,269 | ) |
Class Y | | | (18,922,200 | ) | | | (43,089,014 | ) |
Class R5 | | | (12,357,659 | ) | | | (10,311,968 | ) |
Class R6 | | | 10,034 | | | | — | |
Net increase (decrease) in net assets resulting from share transactions | | | (177,321,994 | ) | | | (153,327,418 | ) |
Net increase (decrease) in net assets | | | (73,016,282 | ) | | | (300,092,272 | ) |
| | |
Net assets: | | | | | | | | |
Beginning of year | | | 550,564,814 | | | | 850,657,086 | |
End of year (includes undistributed net investment income (loss) of $(690,920) and $(3,138,618), respectively) | | $ | 477,548,532 | | | $ | 550,564,814 | |
Notes to Financial Statements
October 31, 2017
NOTE 1—Significant Accounting Policies
Invesco Select Companies Fund (the “Fund”) is a series portfolio of AIM Investment Funds (Invesco Investment Funds) (the “Trust”). The Trust is organized as a Delaware statutory trust and is registered under the Investment Company Act of 1940, as amended (the “1940 Act”), as an open-end series management investment company consisting of twenty separate series portfolios, each authorized to issue an unlimited number of shares of beneficial interest. The assets, liabilities and operations of each portfolio are accounted for separately. Information presented in these financial statements pertains only to the Fund. Matters affecting each portfolio or class will be voted on exclusively by the shareholders of such portfolio or class.
The Fund’s investment objective is long-term growth of capital.
The Fund currently consists of seven different classes of shares: Class A, Class B, Class C, Class R, Class Y, Class R5 and Class R6. Effective April 4, 2017, the Fund began offering Class R6 shares. Class Y shares are available only to certain investors. Class A shares are sold with a front-end sales charge unless certain waiver criteria are met and under certain circumstances load waived shares may be subject to contingent deferred sales charges (“CDSC”). Class C shares are sold with a CDSC. Class R, Class Y, Class R5 and Class R6 shares are sold at net asset value. Effective November 30, 2010, new or additional investments in Class B shares are no longer permitted. Existing shareholders of Class B shares may continue to reinvest dividends and capital gains distributions in Class B shares until they convert to Class A shares. Also, shareholders in Class B shares will be able to exchange those shares for Class B shares of other Invesco Funds offering such shares until they convert to Class A shares. Generally, Class B shares will automatically convert to Class A shares on or about the month-end, which is at least eight years after the date of purchase. Redemption of Class B shares prior to the conversion date will be subject to a CDSC.
Effective the open of business on October 17, 2016, the Fund re-opened public sales of its shares to all investors.
The Fund is an investment company and accordingly follows the investment company accounting and reporting guidance in accordance with Financial Accounting Standards Board Accounting Standards Codification Topic 946, Financial Services — Investment Companies.
12 Invesco Select Companies Fund
The following is a summary of the significant accounting policies followed by the Fund in the preparation of its financial statements.
| A. | Security Valuations — Securities, including restricted securities, are valued according to the following policy. |
A security listed or traded on an exchange (except convertible securities) is valued at its last sales price or official closing price as of the close of the customary trading session on the exchange where the security is principally traded, or lacking any sales or official closing price on a particular day, the security may be valued at the closing bid price on that day. Securities traded in the over-the-counter market are valued based on prices furnished by independent pricing services or market makers. When such securities are valued by an independent pricing service they may be considered fair valued. Futures contracts are valued at the final settlement price set by an exchange on which they are principally traded. Listed options are valued at the mean between the last bid and asked prices from the exchange on which they are principally traded. Options not listed on an exchange are valued by an independent source at the mean between the last bid and asked prices. For purposes of determining net asset value (“NAV”) per share, futures and option contracts generally are valued 15 minutes after the close of the customary trading session of the New York Stock Exchange (“NYSE”).
Investments in open-end and closed-end registered investment companies that do not trade on an exchange are valued at the end-of-day net asset value per share. Investments in open-end and closed-end registered investment companies that trade on an exchange are valued at the last sales price or official closing price as of the close of the customary trading session on the exchange where the security is principally traded.
Debt obligations (including convertible securities) and unlisted equities are fair valued using an evaluated quote provided by an independent pricing service. Evaluated quotes provided by the pricing service may be determined without exclusive reliance on quoted prices, and may reflect appropriate factors such as institution-size trading in similar groups of securities, developments related to specific securities, dividend rate (for unlisted equities), yield (for debt obligations), quality, type of issue, coupon rate (for debt obligations), maturity (for debt obligations), individual trading characteristics and other market data. Pricing services generally value debt obligations assuming orderly transactions of institutional round lot size, but a fund may hold or transact in the same securities in smaller, odd lot sizes. Odd lots often trade at lower prices than institutional round lots. Debt obligations are subject to interest rate and credit risks. In addition, all debt obligations involve some risk of default with respect to interest and/or principal payments.
Foreign securities’ (including foreign exchange contracts) prices are converted into U.S. dollar amounts using the applicable exchange rates as of the close of the NYSE. If market quotations are available and reliable for foreign exchange-traded equity securities, the securities will be valued at the market quotations. Because trading hours for certain foreign securities end before the close of the NYSE, closing market quotations may become unreliable. If between the time trading ends on a particular security and the close of the customary trading session on the NYSE, events occur that the investment adviser determines are significant and make the closing price unreliable, the Fund may fair value the security. If the event is likely to have affected the closing price of the security, the security will be valued at fair value in good faith using procedures approved by the Board of Trustees. Adjustments to closing prices to reflect fair value may also be based on a screening process of an independent pricing service to indicate the degree of certainty, based on historical data, that the closing price in the principal market where a foreign security trades is not the current value as of the close of the NYSE. Foreign securities' prices meeting the approved degree of certainty that the price is not reflective of current value will be priced at the indication of fair value from the independent pricing service. Multiple factors may be considered by the independent pricing service in determining adjustments to reflect fair value and may include information relating to sector indices, American Depositary Receipts and domestic and foreign index futures. Foreign securities may have additional risks including exchange rate changes, potential for sharply devalued currencies and high inflation, political and economic upheaval, the relative lack of issuer information, relatively low market liquidity and the potential lack of strict financial and accounting controls and standards.
Securities for which market prices are not provided by any of the above methods may be valued based upon quotes furnished by independent sources. The last bid price may be used to value equity securities. The mean between the last bid and asked prices is used to value debt obligations, including corporate loans.
Securities for which market quotations are not readily available or became unreliable are valued at fair value as determined in good faith by or under the supervision of the Trust's officers following procedures approved by the Board of Trustees. Issuer specific events, market trends, bid/asked quotes of brokers and information providers and other market data may be reviewed in the course of making a good faith determination of a security’s fair value.
The Fund may invest in securities that are subject to interest rate risk, meaning the risk that the prices will generally fall as interest rates rise and, conversely, the prices will generally rise as interest rates fall. Specific securities differ in their sensitivity to changes in interest rates depending on their individual characteristics. Changes in interest rates may result in increased market volatility, which may affect the value and/or liquidity of certain Fund investments.
Valuations change in response to many factors including the historical and prospective earnings of the issuer, the value of the issuer's assets, general economic conditions, interest rates, investor perceptions and market liquidity. Because of the inherent uncertainties of valuation, the values reflected in the financial statements may materially differ from the value received upon actual sale of those investments.
| B. | Securities Transactions and Investment Income — Securities transactions are accounted for on a trade date basis. Realized gains or losses on sales are computed on the basis of specific identification of the securities sold. Interest income (net of withholding tax, if any) is recorded on the accrual basis from settlement date. Dividend income (net of withholding tax, if any) is recorded on the ex-dividend date. |
The Fund may periodically participate in litigation related to Fund investments. As such, the Fund may receive proceeds from litigation settlements. Any proceeds received are included in the Statement of Operations as realized gain (loss) for investments no longer held and as unrealized gain (loss) for investments still held.
Brokerage commissions and mark ups are considered transaction costs and are recorded as an increase to the cost basis of securities purchased and/or a reduction of proceeds on a sale of securities. Such transaction costs are included in the determination of net realized and unrealized gain (loss) from investment securities reported in the Statement of Operations and the Statement of Changes in Net Assets and the net realized and unrealized gains (losses) on securities per share in the Financial Highlights. Transaction costs are included in the calculation of the Fund's net asset value and, accordingly, they reduce the Fund's total returns. These transaction costs are not considered operating expenses and are not reflected in net investment income reported in the Statement of Operations and the Statement of Changes in Net Assets, or the net investment income per share and the ratios of expenses and net investment income reported in the Financial Highlights, nor are they limited by any expense limitation arrangements between the Fund and the investment adviser.
13 Invesco Select Companies Fund
The Fund allocates income and realized and unrealized capital gains and losses to a class based on the relative net assets of each class.
| C. | Country Determination — For the purposes of making investment selection decisions and presentation in the Schedule of Investments, the investment adviser may determine the country in which an issuer is located and/or credit risk exposure based on various factors. These factors include the laws of the country under which the issuer is organized, where the issuer maintains a principal office, the country in which the issuer derives 50% or more of its total revenues and the country that has the primary market for the issuer's securities, as well as other criteria. Among the other criteria that may be evaluated for making this determination are the country in which the issuer maintains 50% or more of its assets, the type of security, financial guarantees and enhancements, the nature of the collateral and the sponsor organization. Country of issuer and/or credit risk exposure has been determined to be the United States of America, unless otherwise noted. |
| D. | Distributions — Distributions from net investment income and net realized capital gain, if any, are generally declared and paid annually and recorded on the ex-dividend date. The Fund may elect to treat a portion of the proceeds from redemptions as distributions for federal income tax purposes. |
| E. | Federal Income Taxes — The Fund intends to comply with the requirements of Subchapter M of the Internal Revenue Code of 1986, as amended (the “Internal Revenue Code”), necessary to qualify as a regulated investment company and to distribute substantially all of the Fund's taxable earnings to shareholders. As such, the Fund will not be subject to federal income taxes on otherwise taxable income (including net realized capital gain) that is distributed to shareholders. Therefore, no provision for federal income taxes is recorded in the financial statements. |
The Fund recognizes the tax benefits of uncertain tax positions only when the position is more likely than not to be sustained. Management has analyzed the Fund's uncertain tax positions and concluded that no liability for unrecognized tax benefits should be recorded related to uncertain tax positions. Management is not aware of any tax positions for which it is reasonably possible that the total amounts of unrecognized tax benefits will change materially in the next 12 months.
The Fund files tax returns in the U.S. Federal jurisdiction and certain other jurisdictions. Generally, the Fund is subject to examinations by such taxing authorities for up to three years after the filing of the return for the tax period.
| F. | Expenses — Fees provided for under the Rule 12b-1 plan of a particular class of the Fund are charged to the operations of such class. Transfer agency fees and expenses and other shareholder recordkeeping fees and expenses attributable to Class R5 are charged to such class. Transfer agency fees and expenses and other shareholder recordkeeping fees and expenses relating to all other classes are allocated among those classes based on relative net assets. All other expenses are allocated among the classes based on relative net assets. |
| G. | Accounting Estimates — The preparation of financial statements in conformity with accounting principles generally accepted in the United States of America (“GAAP”) requires management to make estimates and assumptions that affect the reported amounts of assets and liabilities at the date of the financial statements and the reported amounts of revenues and expenses during the reporting period including estimates and assumptions related to taxation. Actual results could differ from those estimates by a significant amount. In addition, the Fund monitors for material events or transactions that may occur or become known after the period-end date and before the date the financial statements are released to print. |
| H. | Indemnifications — Under the Trust's organizational documents, each Trustee, officer, employee or other agent of the Trust is indemnified against certain liabilities that may arise out of the performance of their duties to the Fund. Additionally, in the normal course of business, the Fund enters into contracts, including the Fund's servicing agreements, that contain a variety of indemnification clauses. The Fund's maximum exposure under these arrangements is unknown as this would involve future claims that may be made against the Fund that have not yet occurred. The risk of material loss as a result of such indemnification claims is considered remote. |
| I. | Foreign Currency Translations — Foreign currency is valued at the close of the NYSE based on quotations posted by banks and major currency dealers. Portfolio securities and other assets and liabilities denominated in foreign currencies are translated into U.S. dollar amounts at date of valuation. Purchases and sales of portfolio securities (net of foreign taxes withheld on disposition) and income items denominated in foreign currencies are translated into U.S. dollar amounts on the respective dates of such transactions. The Fund does not separately account for the portion of the results of operations resulting from changes in foreign exchange rates on investments and the fluctuations arising from changes in market prices of securities held. The combined results of changes in foreign exchange rates and the fluctuation of market prices on investments (net of estimated foreign tax withholding) are included with the net realized and unrealized gain or loss from investments in the Statement of Operations. Reported net realized foreign currency gains or losses arise from (1) sales of foreign currencies, (2) currency gains or losses realized between the trade and settlement dates on securities transactions, and (3) the difference between the amounts of dividends, interest, and foreign withholding taxes recorded on the Fund's books and the U.S. dollar equivalent of the amounts actually received or paid. Net unrealized foreign currency gains and losses arise from changes in the fair values of assets and liabilities, other than investments in securities at fiscal period end, resulting from changes in exchange rates. |
The Fund may invest in foreign securities, which may be subject to foreign taxes on income, gains on investments or currency repatriation, a portion of which may be recoverable. Foreign taxes, if any, are recorded based on the tax regulations and rates that exist in the foreign markets in which the Fund invests and are shown in the Statement of Operations.
| J. | Forward Foreign Currency Contracts — The Fund may engage in foreign currency transactions either on a spot (i.e. for prompt delivery and settlement) basis, or through forward foreign currency contracts, to manage or minimize currency or exchange rate risk. |
The Fund may also enter into forward foreign currency contracts for the purchase or sale of a security denominated in a foreign currency in order to “lock in” the U.S. dollar price of that security, or the Fund may also enter into forward foreign currency contracts that do not provide for physical settlement of the two currencies, but instead are settled by a single cash payment calculated as the difference between the agreed upon exchange rate and the spot rate at settlement based upon an agreed upon notional amount (non-deliverable forwards). The Fund will set aside liquid assets in an amount equal to the daily mark-to-market obligation for forward foreign currency contracts.
A forward foreign currency contract is an obligation between two parties (“Counterparties”) to purchase or sell a specific currency for an agreed-upon price at a future date. The use of forward foreign currency contracts does not eliminate fluctuations in the price of the underlying securities the Fund owns or intends to acquire but establishes a rate of exchange in advance. Fluctuations in the value of these contracts are measured by the difference in the contract date and reporting date exchange rates and are recorded as unrealized appreciation (depreciation) until the contracts are closed. When the contracts are closed, realized gains (losses) are recorded. Realized and unrealized gains (losses) on the contracts are included in the Statement of Operations. The primary risks associated with forward foreign currency contracts include failure of the
14 Invesco Select Companies Fund
Counterparty to meet the terms of the contract and the value of the foreign currency changing unfavorably. These risks may be in excess of the amounts reflected in the Statement of Assets and Liabilities.
NOTE 2—Advisory Fees and Other Fees Paid to Affiliates
The Trust has entered into a master investment advisory agreement with Invesco Advisers, Inc. (the “Adviser” or “Invesco”). Under the terms of the investment advisory agreement, the Fund accrues daily and pays monthly an advisory fee to the Adviser based on the annual rate of the Fund's average daily net assets as follows:
| | | | | | | | |
| Average Daily Net Assets | | Rate | |
First $250 million | | | 0 | .745% | | | | |
Next $250 million | | | 0 | .73% | | | | |
Next $500 million | | | 0 | .715% | | | | |
Next $1.5 billion | | | 0 | .70% | | | | |
Next $2.5 billion | | | 0 | .685% | | | | |
Next $2.5 billion | | | 0 | .67% | | | | |
Next $2.5 billion | | | 0 | .655% | | | | |
Over $10 billion | | | 0 | .64% | | | | |
For the year ended October 31, 2017, the effective advisory fees incurred by the Fund was 0.74%.
Under the terms of a master sub-advisory agreement between the Adviser and each of Invesco Asset Management Deutschland GmbH, Invesco Asset Management Limited, Invesco Asset Management (Japan) Limited, Invesco Hong Kong Limited, Invesco Senior Secured Management, Inc. and Invesco Canada Ltd. (collectively, the “Affiliated Sub-Advisers”) the Adviser, not the Fund, will pay 40% of the fees paid to the Adviser to any such Affiliated Sub-Adviser(s) that provide(s) discretionary investment management services to the Fund based on the percentage of assets allocated to such Affiliated Sub-Adviser(s).
The Adviser has contractually agreed, through at least June 30, 2018, to waive advisory fees and/or reimburse expenses to the extent necessary to limit total annual fund operating expenses after fee waivers and/or expense reimbursements (excluding certain items discussed below) of Class A, Class B, Class C, Class R, Class Y, Class R5 and Class R6 shares to 2.00%, 2.75%, 2.75%, 2.25%, 1.75%, 1.75% and 1.75%, respectively of the Fund's average daily net assets (the “expense limits”). In determining the Adviser's obligation to waive advisory fees and/or reimburse expenses, the following expenses are not taken into account, and could cause the total annual fund operating expenses after fee waivers and/or expense reimbursements to exceed the numbers reflected above: (1) interest; (2) taxes; (3) dividend expense on short sales; (4) extraordinary or non-routine items, including litigation expenses; and (5) expenses that the Fund has incurred but did not actually pay because of an expense offset arrangement. Unless Invesco continues the fee waiver agreement, it will terminate on June 30, 2018. During its term, the fee waiver agreement cannot be terminated or amended to increase the expense limits or reduce the advisory fee waiver without approval of the Board of Trustees. The Adviser did not waive fees and/or reimburse expenses during the period under these expense limits.
Further, the Adviser has contractually agreed, through at least June 30, 2019, to waive the advisory fee payable by the Fund in an amount equal to 100% of the net advisory fees the Adviser receives from the affiliated money market funds on investments by the Fund of uninvested cash in such affiliated money market funds.
For the year ended October 31, 2017, the Adviser waived advisory fees of $48,855.
The Trust has entered into a master administrative services agreement with Invesco pursuant to which the Fund has agreed to pay Invesco for certain administrative costs incurred in providing accounting services to the Fund. For the year ended October 31, 2017, expenses incurred under the agreement are shown in the Statement of Operations as Administrative services fees.
The Trust has entered into a transfer agency and service agreement with Invesco Investment Services, Inc. (“IIS”) pursuant to which the Fund has agreed to pay IIS a fee for providing transfer agency and shareholder services to the Fund and reimburse IIS for certain expenses incurred by IIS in the course of providing such services. IIS may make payments to intermediaries that provide omnibus account services, sub-accounting services and/or networking services. All fees payable by IIS to intermediaries that provide omnibus account services or sub-accounting services are charged back to the Fund, subject to certain limitations approved by the Trust's Board of Trustees. For the year ended October 31, 2017, expenses incurred under the agreement are shown in the Statement of Operations as Transfer agent fees.
The Trust has entered into master distribution agreements with Invesco Distributors, Inc. (“IDI”) to serve as the distributor for the Class A, Class B, Class C, Class R, Class Y, Class R5 and Class R6 shares of the Fund. The Trust has adopted plans pursuant to Rule 12b-1 under the 1940 Act with respect to the Fund's Class A, Class B, Class C and Class R shares (collectively, the “Plans”). The Fund, pursuant to the Plans, pays IDI compensation at the annual rate of 0.25% of the Fund's average daily net assets of Class A shares, 1.00% of the average daily net assets of Class B and Class C shares and 0.50% of the average daily net assets of Class R shares. The fees are accrued daily and paid monthly. Of the Plan payments, up to 0.25% of the average daily net assets of each class of shares may be paid to furnish continuing personal shareholder services to customers who purchase and own shares of such classes. Any amounts not paid as a service fee under the Plans would constitute an asset-based sales charge. Rules of the Financial Industry Regulatory Authority (“FINRA”) impose a cap on the total sales charges, including asset-based sales charges, that may be paid by any class of shares of the Fund. For the year ended October 31, 2017, expenses incurred under the Plans are shown in the Statement of Operations as Distribution fees.
Front-end sales commissions and CDSC (collectively, the “sales charges”) are not recorded as expenses of the Fund. Front-end sales commissions are deducted from proceeds from the sales of Fund shares prior to investment in Class A shares of the Fund. CDSC are deducted from redemption proceeds prior to remittance to the shareholder. During the year ended October 31, 2017, IDI advised the Fund that IDI retained $20,470 in front-end sales commissions from the sale of Class A shares and $5 and $1,563 from Class A and Class C shares, respectively, for CDSC imposed on redemptions by shareholders.
15 Invesco Select Companies Fund
For the year ended October 31, 2017, the fund incurred $2,893 in brokerage commissions with Invesco Capital Markets, Inc., an affiliate of the Adviser and IDI for portfolio transactions executed on behalf of the Fund.
Certain officers and trustees of the Trust are officers and directors of the Adviser, IIS and/or IDI.
NOTE 3—Additional Valuation Information
GAAP defines fair value as the price that would be received to sell an asset or paid to transfer a liability in an orderly transaction between market participants at the measurement date, under current market conditions. GAAP establishes a hierarchy that prioritizes the inputs to valuation methods, giving the highest priority to readily available unadjusted quoted prices in an active market for identical assets (Level 1) and the lowest priority to significant unobservable inputs (Level 3), generally when market prices are not readily available or are unreliable. Based on the valuation inputs, the securities or other investments are tiered into one of three levels. Changes in valuation methods may result in transfers in or out of an investment's assigned level:
| | Level 1 — | Prices are determined using quoted prices in an active market for identical assets. |
| | Level 2 — | Prices are determined using other significant observable inputs. Observable inputs are inputs that other market participants may use in pricing a security. These may include quoted prices for similar securities, interest rates, prepayment speeds, credit risk, yield curves, loss severities, default rates, discount rates, volatilities and others. |
| | Level 3 — | Prices are determined using significant unobservable inputs. In situations where quoted prices or observable inputs are unavailable (for example, when there is little or no market activity for an investment at the end of the period), unobservable inputs may be used. Unobservable inputs reflect the Fund's own assumptions about the factors market participants would use in determining fair value of the securities or instruments and would be based on the best available information. |
The following is a summary of the tiered valuation input levels, as of October 31, 2017. The level assigned to the securities valuations may not be an indication of the risk or liquidity associated with investing in those securities. Because of the inherent uncertainties of valuation, the values reflected in the financial statements may materially differ from the value received upon actual sale of those investments.
The Fund's policy is to recognize transfers in and out of the valuation levels as of the end of the reporting period. During the year ended October 31, 2017, there were no material transfers between valuation levels.
| | | | | | | | | | | | | | | | |
| | | Level 1 | | | Level 2 | | | Level 3 | | | Total | |
Common Stocks | | $ | 446,505,465 | | | $ | — | | | $ | 0 | | | $ | 446,505,465 | |
Money Market Funds | | | 31,547,114 | | | | — | | | | — | | | | 31,547,114 | |
Total Investments | | $ | 478,052,579 | | | $ | — | | | $ | 0 | | | $ | 478,052,579 | |
NOTE 4—Investments in Other Affiliates
The 1940 Act defines an “affiliated person” as an issuance in which a fund holds 5% or more of the outstanding voting securities. The Fund has not owned enough of the outstanding voting securities of the issuer to have control (as defined in the 1940 Act) of that issuer. The following is a summary of the investments in other affiliates (excluding affiliated money market funds) for the year ended October 31, 2017.
| | | | | | | | | | | | | | | | | | | | | | | | | | | | |
| | | Value
10/31/16 | | | Purchases
at Cost | | | Proceeds
from Sales | | | Change in
Unrealized
Appreciation
(Depreciation) | | | Realized
Gain (Loss) | | | Value
10/31/17 | | | Dividend
Income | |
America’s Car-Mart, Inc.(a) | | $ | 26,875,338 | | | $ | | | | $ | (20,000,665 | ) | | $ | (573,453 | ) | | $ | 1,214,413 | | | $ | 7,515,633 | | | $ | — | |
Encore Capital Group, Inc.(a) | | | 31,706,504 | | | | | | | | (28,046,543 | ) | | | 41,427,463 | | | | (10,399,632 | ) | | | 34,687,792 | | | | — | |
Hampshire Group, Ltd.(a) | | | 7,114 | | | | | | | | (1,184 | ) | | | 8,148,285 | | | | (8,154,215 | ) | | | — | | | | — | |
ION Geophysical Corp. | | | 5,537,067 | | | | | | | | — | | | | 1,783,219 | | | | (103 | ) | | | 7,320,183 | | | | — | |
Performant Financial Corp. | | | 16,526,316 | | | | | | | | — | | | | (6,245,731 | ) | | | — | | | | 10,280,585 | | | | — | |
Total | | $ | 80,652,339 | | | $ | — | | | $ | (48,048,392 | ) | | $ | 44,539,783 | | | $ | (17,339,537 | ) | | $ | 59,804,193 | | | $ | — | |
| (a) | As of October 31, 2017, this security is no longer considered as an affiliate of the Fund. |
NOTE 5—Expense Offset Arrangement(s)
The expense offset arrangement is comprised of transfer agency credits which result from balances in demand deposit accounts used by the transfer agent for clearing shareholder transactions. For the year ended October 31, 2017, the Fund received credits from this arrangement, which resulted in the reduction of the Fund's total expenses of $5,560.
NOTE 6—Trustees’ and Officers’ Fees and Benefits
Trustees’ and Officers’ Fees and Benefits include amounts accrued by the Fund to pay remuneration to certain Trustees and Officers of the Fund. Trustees have the option to defer compensation payable by the Fund, and Trustees’ and Officers’ Fees and Benefits also include amounts accrued by the Fund to fund such deferred compensation amounts. Those Trustees who defer compensation have the option to select various Invesco Funds in which their deferral accounts shall be deemed to be invested. Finally, certain current Trustees were eligible to participate in a retirement plan that provided for benefits to be paid upon retirement to Trustees over a period of time based on the number of years of service. The Fund may have certain former Trustees who also participate in a retirement plan and receive benefits under such plan. Trustees’ and Officers’ Fees and Benefits include amounts accrued by the Fund to fund such retirement benefits. Obligations under the deferred compensation and retirement plans represent unsecured claims against the general assets of the Fund.
16 Invesco Select Companies Fund
NOTE 7—Cash Balances
The Fund is permitted to temporarily carry a negative or overdrawn balance in its account with State Street Bank and Trust Company, the custodian bank. Such balances, if any at period-end, are shown in the Statement of Assets and Liabilities under the payable caption Amount due custodian. To compensate the custodian bank for such overdrafts, the overdrawn Fund may either (1) leave funds as a compensating balance in the account so the custodian bank can be compensated by earning the additional interest; or (2) compensate by paying the custodian bank at a rate agreed upon by the custodian bank and Invesco, not to exceed the contractually agreed upon rate.
NOTE 8—Distributions to Shareholders and Tax Components of Net Assets
Tax Character of Distributions to Shareholders Paid During the Fiscal Years Ended October 31, 2017 and 2016:
| | | | | | | | |
| | | 2017 | | | 2016 | |
Long-term capital gain | | $ | 20,025,749 | | | $ | 162,935,278 | |
Tax Components of Net Assets at Period-End:
| | | | |
| | | 2017 | |
Undistributed long-term gain | | $ | 62,256,197 | |
Net unrealized appreciation — investments | | | 66,494,365 | |
Net unrealized appreciation (depreciation) — foreign currencies | | | (13,057 | ) |
Temporary book/tax differences | | | (162,371 | ) |
Late-Year ordinary loss deferral | | | (528,550 | ) |
Shares of beneficial interest | | | 349,501,948 | |
Total net assets | | $ | 477,548,532 | |
The difference between book-basis and tax-basis unrealized appreciation (depreciation) is due to differences in the timing of recognition of gains and losses on investments for tax and book purposes. The Fund's net unrealized appreciation difference is attributable primarily to wash sales.
The temporary book/tax differences are a result of timing differences between book and tax recognition of income and/or expenses. The Fund's temporary book/tax differences are the result of the trustee deferral of compensation and retirement plan benefits.
Capital loss carryforward is calculated and reported as of a specific date. Results of transactions and other activity after that date may affect the amount of capital loss carryforward actually available for the Fund to utilize. Capital losses generated in years beginning after December 22, 2010 can be carried forward for an unlimited period, whereas previous losses expire in eight tax years. Capital losses with an expiration period may not be used to offset capital gains until all net capital losses without an expiration date have been utilized. Capital loss carryforwards with no expiration date will retain their character as either short-term or long-term capital losses instead of as short-term capital losses as under prior law. The ability to utilize capital loss carryforwards in the future may be limited under the Internal Revenue Code and related regulations based on the results of future transactions.
The Fund does not have a capital loss carryforward as of October 31, 2017.
NOTE 9—Investment Transactions
The aggregate amount of investment securities (other than short-term securities, U.S. Treasury obligations and money market funds, if any) purchased and sold by the Fund during the year ended October 31, 2017 was $77,725,729 and $283,322,642, respectively. Cost of investments, including any derivatives, on a tax basis includes the adjustments for financial reporting purposes as of the most recently completed federal income tax reporting period-end.
| | | | |
| Unrealized Appreciation (Depreciation) of Investments on a Tax Basis | |
Aggregate unrealized appreciation of investments | | $ | 179,722,019 | |
Aggregate unrealized (depreciation) of investments | | | (113,227,654 | ) |
Net unrealized appreciation of investments | | $ | 66,494,365 | |
Cost of investments for tax purposes is $411,558,214.
NOTE 10—Reclassification of Permanent Differences
Primarily as a result of differing book/tax treatment of net operating loss, on October 31, 2017, undistributed net investment income (loss) was increased by $5,069,849 and undistributed net realized gain was decreased by $5,069,849. This reclassification had no effect on the net assets of the Fund.
17 Invesco Select Companies Fund
NOTE 11—Share Information
| | | | | | | | | | | | | | | | |
| | | Summary of Share Activity | |
| | | Years ended October 31, | |
| | | 2017(a) | | | 2016 | |
| | | Shares | | | Amount | | | Shares | | | Amount | |
Sold: | | | | | | | | | | | | | | | | |
Class A | | | 1,845,496 | | | $ | 34,443,840 | | | | 1,203,364 | | | $ | 19,243,385 | |
Class B | | | 2,943 | | | | 48,034 | | | | 1,546 | | | | 21,378 | |
Class C | | | 408,324 | | | | 6,540,411 | | | | 69,465 | | | | 978,040 | |
Class R | | | 253,977 | | | | 4,586,806 | | | | 378,007 | | | | 5,747,730 | |
Class Y | | | 4,260,684 | | | | 80,495,148 | | | | 921,734 | | | | 15,071,060 | |
Class R5 | | | 331,743 | | | | 6,615,166 | | | | 446,188 | | | | 7,561,416 | |
Class R6(b) | | | 508 | | | | 10,034 | | | | — | | | | — | |
| | | | |
Issued as reinvestment of dividends: | | | | | | | | | | | | | | | | |
Class A | | | 633,827 | | | | 11,434,236 | | | | 5,815,428 | | | | 85,254,170 | |
Class B | | | 5,839 | | | | 91,796 | | | | 61,365 | | | | 794,066 | |
Class C | | | 270,789 | | | | 4,248,675 | | | | 2,045,411 | | | | 26,406,259 | |
Class R | | | 65,096 | | | | 1,126,806 | | | | 657,658 | | | | 9,286,133 | |
Class Y | | | 99,489 | | | | 1,831,586 | | | | 1,568,201 | | | | 23,381,875 | |
Class R5 | | | 61,424 | | | | 1,176,274 | | | | 603,276 | | | | 9,338,706 | |
| | | | |
Automatic conversion of Class B shares to Class A shares: | | | | | | | | | | | | | | | | |
Class A | | | 55,745 | | | | 1,070,373 | | | | 71,499 | | | | 1,143,484 | |
Class B | | | (64,158 | ) | | | (1,070,373 | ) | | | (81,026 | ) | | | (1,143,484 | ) |
| | | | |
Reacquired: | | | | | | | | | | | | | | | | |
Class A | | | (8,433,372 | ) | | | (156,655,635 | ) | | | (12,105,276 | ) | | | (194,294,367 | ) |
Class B | | | (30,697 | ) | | | (502,435 | ) | | | (44,170 | ) | | | (632,834 | ) |
Class C | | | (2,032,569 | ) | | | (33,534,243 | ) | | | (2,101,670 | ) | | | (29,923,264 | ) |
Class R | | | (992,218 | ) | | | (17,880,460 | ) | | | (1,485,324 | ) | | | (22,807,132 | ) |
Class Y | | | (5,247,516 | ) | | | (101,248,934 | ) | | | (4,863,702 | ) | | | (81,541,949 | ) |
Class R5 | | | (1,010,295 | ) | | | (20,149,099 | ) | | | (1,608,274 | ) | | | (27,212,090 | ) |
Net increase (decrease) in share activity | | | (9,514,941 | ) | | $ | (177,321,994 | ) | | | (8,446,300 | ) | | $ | (153,327,418 | ) |
| (a) | There are entities that are record owners of more than 5% of the outstanding shares of the Fund and in the aggregate own 33% of the outstanding shares of the Fund. IDI has an agreement with these entities to sell Fund shares. The Fund, Invesco and/or Invesco affiliates may make payments to these entities, which are considered to be related to the Fund, for providing services to the Fund, Invesco and/or Invesco affiliates including but not limited to services such as securities brokerage, distribution, third party record keeping and account servicing. The Fund has no knowledge as to whether all or any portion of the shares owned of record by these entities are also owned beneficially. |
| (b) | Commencement date of April 4, 2017. |
18 Invesco Select Companies Fund
NOTE 12—Financial Highlights
The following schedule presents financial highlights for a share of the Fund outstanding throughout the periods indicated.
| | | | | | | | | | | | | | | | | | | | | | | | | | | | | | | | | | | | | | | | | | | | | | | | | | | | | | | | |
| | | Net asset
value,
beginning
of period | | | Net
investment
income
(loss)(a) | | | Net gains
(losses)
on securities
(both
realized and
unrealized) | | | Total from
investment
operations | | | Dividends
from net
investment
income | | | Distributions
from net
realized
gains | | | Total
distributions | | | Net asset
value, end
of period | | | Total
return(b) | | | Net assets,
end of period
(000’s omitted) | | | Ratio of
expenses
to average
net assets
with fee waivers
and/or expenses
absorbed | | | Ratio of
expenses
to average net
assets without
fee waivers
and/or expenses
absorbed | | | Ratio of net
investment
income (loss)
to average
net assets | | | Portfolio
turnover(c) | |
Class A | | | | | | | | | | | | | | | | | | | | | | | | | | | | | | | | | | | | | | | | | | | | | | | | | | | | | | | | |
Year ended 10/31/17 | | $ | 16.72 | | | $ | (0.07 | ) | | $ | 4.29 | | | $ | 4.22 | | | $ | — | | | $ | (0.64 | ) | | $ | (0.64 | ) | | $ | 20.30 | | | | 25.71 | % | | $ | 250,619 | | | | 1.27 | %(d) | | | 1.28 | %(d) | | | (0.39 | )%(d) | | | 16 | % |
Year ended 10/31/16 | | | 20.44 | | | | (0.08 | ) | | | 0.56 | | | | 0.48 | | | | — | | | | (4.20 | ) | | | (4.20 | ) | | | 16.72 | | | | 5.22 | | | | 305,003 | | | | 1.24 | | | | 1.25 | | | | (0.53 | ) | | | 20 | |
Year ended 10/31/15 | | | 25.47 | | | | (0.19 | ) | | | (2.37 | ) | | | (2.56 | ) | | | — | | | | (2.47 | ) | | | (2.47 | ) | | | 20.44 | | | | (10.79 | ) | | | 475,536 | | | | 1.17 | | | | 1.20 | | | | (0.86 | ) | | | 14 | |
Year ended 10/31/14 | | | 23.95 | | | | (0.06 | ) | | | 2.71 | | | | 2.65 | | | | — | | | | (1.13 | ) | | | (1.13 | ) | | | 25.47 | | | | 11.66 | | | | 754,310 | | | | 1.16 | | | | 1.20 | | | | (0.28 | ) | | | 10 | |
Year ended 10/31/13 | | | 20.57 | | | | (0.12 | ) | | | 4.95 | | | | 4.83 | | | | (0.23 | ) | | | (1.22 | ) | | | (1.45 | ) | | | 23.95 | | | | 25.11 | | | �� | 883,072 | | | | 1.16 | | | | 1.20 | | | | (0.55 | ) | | | 19 | |
Class B | | | | | | | | | | | | | | | | | | | | | | | | | | | | | | | | | | | | | | | | | | | | | | | | | | | | | | | | |
Year ended 10/31/17 | | | 14.65 | | | | (0.19 | ) | | | 3.75 | | | | 3.56 | | | | — | | | | (0.64 | ) | | | (0.64 | ) | | | 17.57 | | | | 24.80 | | | | 1,199 | | | | 2.02 | (d) | | | 2.03 | (d) | | | (1.14 | )(d) | | | 16 | |
Year ended 10/31/16 | | | 18.59 | | | | (0.18 | ) | | | 0.44 | | | | 0.26 | | | | — | | | | (4.20 | ) | | | (4.20 | ) | | | 14.65 | | | | 4.36 | | | | 2,261 | | | | 1.99 | | | | 2.00 | | | | (1.28 | ) | | | 20 | |
Year ended 10/31/15 | | | 23.55 | | | | (0.33 | ) | | | (2.16 | ) | | | (2.49 | ) | | | — | | | | (2.47 | ) | | | (2.47 | ) | | | 18.59 | | | | (11.44 | ) | | | 4,027 | | | | 1.92 | | | | 1.95 | | | | (1.61 | ) | | | 14 | |
Year ended 10/31/14 | | | 22.40 | | | | (0.23 | ) | | | 2.51 | | | | 2.28 | | | | — | | | | (1.13 | ) | | | (1.13 | ) | | | 23.55 | | | | 10.77 | | | | 9,039 | | | | 1.91 | | | | 1.95 | | | | (1.03 | ) | | | 10 | |
Year ended 10/31/13 | | | 19.32 | | | | (0.26 | ) | | | 4.65 | | | | 4.39 | | | | (0.09 | ) | | | (1.22 | ) | | | (1.31 | ) | | | 22.40 | | | | 24.22 | | | | 11,551 | | | | 1.91 | | | | 1.95 | | | | (1.30 | ) | | | 19 | |
Class C | | | | | | | | | | | | | | | | | | | | | | | | | | | | | | | | | | | | | | | | | | | | | | | | | | | | | | | | |
Year ended 10/31/17 | | | 14.63 | | | | (0.19 | ) | | | 3.74 | | | | 3.55 | | | | — | | | | (0.64 | ) | | | (0.64 | ) | | | 17.54 | | | | 24.77 | | | | 95,457 | | | | 2.02 | (d) | | | 2.03 | (d) | | | (1.14 | )(d) | | | 16 | |
Year ended 10/31/16 | | | 18.57 | | | | (0.18 | ) | | | 0.44 | | | | 0.26 | | | | — | | | | (4.20 | ) | | | (4.20 | ) | | | 14.63 | | | | 4.39 | | | | 99,413 | | | | 1.99 | | | | 2.00 | | | | (1.28 | ) | | | 20 | |
Year ended 10/31/15 | | | 23.53 | | | | (0.33 | ) | | | (2.16 | ) | | | (2.49 | ) | | | — | | | | (2.47 | ) | | | (2.47 | ) | | | 18.57 | | | | (11.45 | ) | | | 125,947 | | | | 1.92 | | | | 1.95 | | | | (1.61 | ) | | | 14 | |
Year ended 10/31/14 | | | 22.37 | | | | (0.23 | ) | | | 2.52 | | | | 2.29 | | | | — | | | | (1.13 | ) | | | (1.13 | ) | | | 23.53 | | | | 10.83 | | | | 180,853 | | | | 1.91 | | | | 1.95 | | | | (1.03 | ) | | | 10 | |
Year ended 10/31/13 | | | 19.30 | | | | (0.26 | ) | | | 4.64 | | | | 4.38 | | | | (0.09 | ) | | | (1.22 | ) | | | (1.31 | ) | | | 22.37 | | | | 24.19 | | | | 182,221 | | | | 1.91 | | | | 1.95 | | | | (1.30 | ) | | | 19 | |
Class R | | | | | | | | | | | | | | | | | | | | | | | | | | | | | | | | | | | | | | | | | | | | | | | | | | | | | | | | |
Year ended 10/31/17 | | | 16.06 | | | | (0.11 | ) | | | 4.12 | | | | 4.01 | | | | — | | | | (0.64 | ) | | | (0.64 | ) | | | 19.43 | | | | 25.45 | | | | 22,747 | | | | 1.52 | (d) | | | 1.53 | (d) | | | (0.64 | )(d) | | | 16 | |
Year ended 10/31/16 | | | 19.86 | | | | (0.12 | ) | | | 0.52 | | | | 0.40 | | | | — | | | | (4.20 | ) | | | (4.20 | ) | | | 16.06 | | | | 4.90 | | | | 29,623 | | | | 1.49 | | | | 1.50 | | | | (0.78 | ) | | | 20 | |
Year ended 10/31/15 | | | 24.88 | | | | (0.24 | ) | | | (2.31 | ) | | | (2.55 | ) | | | — | | | | (2.47 | ) | | | (2.47 | ) | | | 19.86 | | | | (11.03 | ) | | | 45,561 | | | | 1.42 | | | | 1.45 | | | | (1.11 | ) | | | 14 | |
Year ended 10/31/14 | | | 23.48 | | | | (0.12 | ) | | | 2.65 | | | | 2.53 | | | | — | | | | (1.13 | ) | | | (1.13 | ) | | | 24.88 | | | | 11.37 | | | | 70,177 | | | | 1.41 | | | | 1.45 | | | | (0.53 | ) | | | 10 | |
Year ended 10/31/13 | | | 20.19 | | | | (0.17 | ) | | | 4.86 | | | | 4.69 | | | | (0.18 | ) | | | (1.22 | ) | | | (1.40 | ) | | | 23.48 | | | | 24.83 | | | | 76,385 | | | | 1.41 | | | | 1.45 | | | | (0.80 | ) | | | 19 | |
Class Y | | | | | | | | | | | | | | | | | | | | | | | | | | | | | | | | | | | | | | | | | | | | | | | | | | | | | | | | |
Year ended 10/31/17 | | | 17.04 | | | | (0.01 | ) | | | 4.36 | | | | 4.35 | | | | — | | | | (0.64 | ) | | | (0.64 | ) | | | 20.75 | | | | 26.00 | | | | 80,572 | | | | 1.02 | (d) | | | 1.03 | (d) | | | (0.14 | )(d) | | | 16 | |
Year ended 10/31/16 | | | 20.71 | | | | (0.04 | ) | | | 0.57 | | | | 0.53 | | | | — | | | | (4.20 | ) | | | (4.20 | ) | | | 17.04 | | | | 5.44 | | | | 81,269 | | | | 0.99 | | | | 1.00 | | | | (0.28 | ) | | | 20 | |
Year ended 10/31/15 | | | 25.71 | | | | (0.13 | ) | | | (2.40 | ) | | | (2.53 | ) | | | — | | | | (2.47 | ) | | | (2.47 | ) | | | 20.71 | | | | (10.56 | ) | | | 147,927 | | | | 0.92 | | | | 0.95 | | | | (0.61 | ) | | | 14 | |
Year ended 10/31/14 | | | 24.11 | | | | (0.01 | ) | | | 2.74 | | | | 2.73 | | | | — | | | | (1.13 | ) | | | (1.13 | ) | | | 25.71 | | | | 11.92 | | | | 304,629 | | | | 0.91 | | | | 0.95 | | | | (0.03 | ) | | | 10 | |
Year ended 10/31/13 | | | 20.69 | | | | (0.06 | ) | | | 4.98 | | | | 4.92 | | | | (0.28 | ) | | | (1.22 | ) | | | (1.50 | ) | | | 24.11 | | | | 25.47 | | | | 372,632 | | | | 0.91 | | | | 0.95 | | | | (0.30 | ) | | | 19 | |
Class R5 | | | | | | | | | | | | | | | | | | | | | | | | | | | | | | | | | | | | | | | | | | | | | | | | | | | | | | | | |
Year ended 10/31/17 | | | 17.71 | | | | (0.01 | ) | | | 4.56 | | | | 4.55 | | | | — | | | | (0.64 | ) | | | (0.64 | ) | | | 21.62 | | | | 26.15 | | | | 26,943 | | | | 0.92 | (d) | | | 0.93 | (d) | | | (0.04 | )(d) | | | 16 | |
Year ended 10/31/16 | | | 21.33 | | | | (0.03 | ) | | | 0.61 | | | | 0.58 | | | | — | | | | (4.20 | ) | | | (4.20 | ) | | | 17.71 | | | | 5.54 | | | | 32,996 | | | | 0.89 | | | | 0.90 | | | | (0.18 | ) | | | 20 | |
Year ended 10/31/15 | | | 26.38 | | | | (0.12 | ) | | | (2.46 | ) | | | (2.58 | ) | | | — | | | | (2.47 | ) | | | (2.47 | ) | | | 21.33 | | | | (10.47 | ) | | | 51,659 | | | | 0.85 | | | | 0.88 | | | | (0.54 | ) | | | 14 | |
Year ended 10/31/14 | | | 24.69 | | | | 0.01 | | | | 2.81 | | | | 2.82 | | | | — | | | | (1.13 | ) | | | (1.13 | ) | | | 26.38 | | | | 12.01 | | | | 66,042 | | | | 0.84 | | | | 0.88 | | | | 0.04 | | | | 10 | |
Year ended 10/31/13 | | | 21.16 | | | | (0.05 | ) | | | 5.10 | | | | 5.05 | | | | (0.30 | ) | | | (1.22 | ) | | | (1.52 | ) | | | 24.69 | | | | 25.53 | | | | 81,527 | | | | 0.83 | | | | 0.87 | | | | (0.22 | ) | | | 19 | |
Class R6 | | | | | | | | | | | | | | | | | | | | | | | | | | | | | | | | | | | | | | | | | | | | | | | | | | | | | | | | |
Year ended 10/31/17(e) | | | 20.05 | | | | 0.01 | | | | 1.57 | | | | 1.58 | | | | — | | | | — | | | | — | | | | 21.63 | | | | 7.88 | | | | 11 | | | | 0.84 | (d)(f) | | | 0.85 | (d)(f) | | | 0.04 | (d)(f) | | | 16 | |
| (a) | Calculated using average shares outstanding. |
| (b) | Includes adjustments in accordance with accounting principles generally accepted in the United States of America and as such, the net asset value for financial reporting purposes and the returns based upon those net asset values may differ from the net asset value and returns for shareholder transactions. Does not include sales charges and is not annualized for periods less than one year, if applicable. |
| (c) | Portfolio turnover is calculated at the fund level and is not annualized for periods less than one year, if applicable. |
| (d) | Ratios are based on average daily net assets (000's omitted) of $282,983, $1,887, $104,597, $27,050, $83,643, $31,859 and $10 for Class A, Class B, Class C, Class R, Class Y, Class R5 and Class R6 shares, respectively. |
| (e) | Commencement date of April 4, 2017. |
NOTE 13—Subsequent Event
On December 1, 2017, the Fund’s Board of Trustees approved the early conversion of the remaining assets in the Fund’s Class B shares into Class A shares to occur on or about January 26, 2018. At the close of business on or about January 26, 2018, (the “Conversion Date”) all outstanding Class B shares of the Fund will be converted to Class A shares of the Fund, which is prior to the date the Class B shares would normally be converted to Class A shares. Once the conversion is completed, Class B shares will be closed and become inactive. No contingent deferred sales charges will be payable in connection with this early conversion. The conversion of the Fund’s Class B shares into Class A shares on the Conversion Date is not expected to be a taxable event for federal income tax purposes, and should not result in the recognition of gain or loss by converting shareholders, although each shareholder should consult with his or her own tax adviser.
19 Invesco Select Companies Fund
Report of Independent Registered Public Accounting Firm
To the Board of Trustees of AIM Investment Funds (Invesco Investment Funds)
and Shareholders of Invesco Select Companies Fund:
In our opinion, the accompanying statement of assets and liabilities, including the schedule of investments, and the related statements of operations and of changes in net assets and the financial highlights present fairly, in all material respects, the financial position of Invesco Select Companies Fund (one of the portfolios constituting the AIM Investment Funds (Invesco Investment Funds), hereafter referred to as the “Fund”) as of October 31, 2017, the results of its operations for the year then ended, the changes in its net assets for each of the two years in the period then ended and the financial highlights for the period indicated therein, in conformity with accounting principles generally accepted in the United States of America. These financial statements and financial highlights (hereafter referred to as “financial statements”) are the responsibility of the Fund’s management. Our responsibility is to express an opinion on these financial statements based on our audits. We conducted our audits of these financial statements in accordance with the standards of the Public Company Accounting Oversight Board (United States). Those standards require that we plan and perform the audit to obtain reasonable assurance about whether the financial statements are free of material misstatement. An audit includes examining, on a test basis, evidence supporting the amounts and disclosures in the financial statements, assessing the accounting principles used and significant estimates made by management, and evaluating the overall financial statement presentation. We believe that our audits, which included confirmation of securities as of October 31, 2017 by correspondence with the custodian, transfer agent and brokers, and when replies were not received from brokers, we performed other auditing procedures, provide a reasonable basis for our opinion.
PricewaterhouseCoopers LLP
Houston, Texas
December 21, 2017
20 Invesco Select Companies Fund
Calculating your ongoing Fund expenses
Example
As a shareholder of the Fund, you incur two types of costs: (1) transaction costs, which may include sales charges (loads) on purchase payments or contingent deferred sales charges on redemptions, if any; and (2) ongoing costs, including management fees, distribution and/or service (12b-1) fees, and other Fund expenses. This example is intended to help you understand your ongoing costs (in dollars) of investing in the Fund and to compare these costs with ongoing costs of investing in other mutual funds. The example is based on an investment of $1,000 invested at the beginning of the period and held for the entire period May 1, 2017 through October 31, 2017.
Actual expenses
The table below provides information about actual account values and actual expenses. You may use the information in this table, together with the amount you invested, to estimate the expenses that you paid over the period. Simply divide your account value by $1,000 (for example, an $8,600 account value divided by $1,000 = 8.6), then multiply the result by the number in the table under the heading entitled “Actual Expenses Paid During Period” to estimate the expenses you paid on your account during this period.
Hypothetical example for comparison purposes
The table below also provides information about hypothetical account values and hypothetical expenses based on the Fund's actual expense ratio and an assumed rate of return of 5% per year before expenses, which is not the Fund's actual return.
The hypothetical account values and expenses may not be used to estimate the actual ending account balance or expenses you paid for the period. You may use this information to compare the ongoing costs of investing in the Fund and other funds. To do so, compare this 5% hypothetical example with the 5% hypothetical examples that appear in the shareholder reports of the other funds.
Please note that the expenses shown in the table are meant to highlight your ongoing costs only and do not reflect any transaction costs, such as sales charges (loads) on purchase payments or contingent deferred sales charges on redemptions, if any. Therefore, the hypothetical information is useful in comparing ongoing costs only, and will not help you determine the relative total costs of owning different funds. In addition, if these transaction costs were included, your costs would have been higher.
| | | | | | | | | | | | | | | | | | | | | | | | |
| Class | | Beginning
Account Value
(05/01/17) | | | ACTUAL | | | HYPOTHETICAL (5% annual return before
expenses) | | | Annualized
Expense
Ratio | |
| | | Ending
Account Value
(10/31/17)1 | | | Expenses
Paid During
Period2 | | | Ending
Account Value
(10/31/17) | | | Expenses
Paid During
Period2 | | |
| A | | $ | 1,000.00 | | | $ | 1,056.70 | | | $ | 6.58 | | | $ | 1,018.80 | | | $ | 6.46 | | | | 1.27 | % |
| B | | | 1,000.00 | | | | 1,052.70 | | | | 10.45 | | | | 1,015.02 | | | | 10.26 | | | | 2.02 | |
| C | | | 1,000.00 | | | | 1,052.80 | | | | 10.45 | | | | 1,015.02 | | | | 10.26 | | | | 2.02 | |
| R | | | 1,000.00 | | | | 1,055.40 | | | | 7.87 | | | | 1,017.54 | | | | 7.73 | | | | 1.52 | |
| Y | | | 1,000.00 | | | | 1,057.60 | | | | 5.29 | | | | 1,020.06 | | | | 5.19 | | | | 1.02 | |
| R5 | | | 1,000.00 | | | | 1,058.30 | | | | 4.88 | | | | 1,020.47 | | | | 4.79 | | | | 0.94 | |
| R6 | | | 1,000.00 | | | | 1,059.30 | | | | 4.41 | | | | 1,020.92 | | | | 4.33 | | | | 0.85 | |
| 1 | The actual ending account value is based on the actual total return of the Fund for the period May 1, 2017 through October 31, 2017, after actual expenses and will differ from the hypothetical ending account value which is based on the Fund's expense ratio and a hypothetical annual return of 5% before expenses. |
| 2 | Expenses are equal to the Fund's annualized expense ratio as indicated above multiplied by the average account value over the period, multiplied by 184/365 to reflect the most recent fiscal half year. |
21 Invesco Select Companies Fund
Approval of Investment Advisory and Sub-Advisory Contracts
The Board of Trustees (the Board) of AIM Investment Funds (Invesco Investment Funds) is required under the Investment Company Act of 1940, as amended, to approve annually the renewal of Invesco Select Companies Fund’s (the Fund) investment advisory agreements. During contract renewal meetings held on June 12-13, 2017, the Board as a whole, and the disinterested or “independent” Trustees, who comprise over 75% of the Board, voting separately, approved the continuance for the Fund of the Master Investment Advisory Agreement with Invesco Advisers, Inc. (Invesco Advisers and the investment advisory agreement) and the Master Intergroup Sub-Advisory Contract for Mutual Funds with Invesco Asset Management Deutschland GmbH, Invesco Asset Management Limited, Invesco Asset Management (Japan) Limited, Invesco Hong Kong Limited, Invesco Senior Secured Management, Inc. and Invesco Canada Ltd. (collectively, the Affiliated Sub-Advisers and the sub-advisory contracts) for another year, effective July 1, 2017.
In evaluating the fairness and reasonableness of compensation under the Fund’s investment advisory agreement and sub-advisory contracts, the Board considered, among other things, the factors discussed below. The Board determined that continuation of the Fund’s investment advisory agreement and the sub-advisory contracts is in the best interest of the Fund and its shareholders and that the compensation payable to Invesco Advisers and the Affiliated Sub-Advisers under the agreements is fair and reasonable.
The Board’s Fund Evaluation Process
The Board’s Investments Committee has established three Sub-Committees, which meet throughout the year to review the performance of funds advised by Invesco Advisers (the Invesco Funds). Over the course of each year, the Sub-Committees meet with portfolio managers for their assigned Invesco Funds and other members of management to review the performance, investment objective(s), policies, strategies, limitations and investment risks of these funds. The Board had the benefit of reports from the Sub-Committees and Investments Committee throughout the year in considering approval of the continuance of each Invesco Fund’s investment advisory agreement and sub-advisory contracts for another year.
During the contract renewal process, the Board receives comparative performance and fee data regarding the Invesco Funds prepared by Invesco Advisers and Broadridge Financial Solutions, Inc. (Broadridge), an independent provider of investment company data. The Board also receives an independent written evaluation from the Senior Officer, an officer of the Invesco Funds who reports directly to the independent Trustees. The Senior Officer’s
evaluation is prepared as part of his responsibility to manage the process by which the Invesco Funds’ proposed management fees are negotiated during the annual contract renewal process to ensure they are negotiated in a manner that is at arms’ length and reasonable. In addition to meetings with Invesco Advisers and fund counsel, the independent Trustees also discuss the continuance of the investment advisory agreement and sub-advisory contracts in separate sessions with the Senior Officer and with independent legal counsel.
The Trustees recognized that the advisory fee rates for the Invesco Funds are, in most cases, the result of years of review and negotiation. The Trustees’ deliberations and conclusions in a particular year may be based in part on their deliberations and conclusions regarding these arrangements throughout the year and in prior years. The Trustees’ review and conclusions are based on the comprehensive consideration of all information presented to them and are not the result of any single determinative factor. Moreover, one Trustee may have weighed a particular piece of information or factor differently than another Trustee.
The discussion below is a summary of the Senior Officer’s independent written evaluation with respect to the Fund’s investment advisory agreement as well as a discussion of the material factors and related conclusions that formed the basis for the Board’s approval of the Fund’s investment advisory agreement and sub-advisory contracts. This information is current as of June 13, 2017, and does not reflect consideration of factors that became known to the Board after that date.
Factors and Conclusions and Summary of Independent Written Fee Evaluation
| A. | Nature, Extent and Quality of Services Provided by Invesco Advisers and the Affiliated Sub-Advisers |
The Board reviewed the advisory services provided to the Fund by Invesco Advisers under the Fund’s investment advisory agreement, the performance of Invesco Advisers in providing these services, and the credentials and experience of the officers and employees of Invesco Advisers who provide these services, including the Fund’s portfolio manager or managers. The Board’s review included consideration of Invesco Advisers’ investment process oversight, credit analysis and investment risk management. The Board also considered non-advisory services that Invesco Advisers and its affiliates provide to the Invesco Funds such as various back office support functions, trading operations, internal audit, valuation and legal and compliance.
In determining whether to continue the Fund’s investment advisory agreement, the Board considered the benefits of reapproving an
existing relationship as contrasted with the greater uncertainty that may be associated with entering into a new relationship. The Board concluded that the nature, extent and quality of the services provided to the Fund by Invesco Advisers are appropriate and satisfactory.
The Board reviewed the services that may be provided by the Affiliated Sub-Advisers under the sub-advisory contracts and the credentials and experience of the officers and employees of the Affiliated Sub-Advisers who provide these services. The Board noted that the Affiliated Sub-Advisers have offices and personnel that are located in financial centers around the world. As a result, the Board noted that the Affiliated Sub-Advisers can provide research and investment analysis on the markets and economies of various countries in which the Fund may invest, make recommendations regarding securities and assist with security trades. The Board concluded that the sub-advisory contracts may benefit the Fund and its shareholders by permitting Invesco Advisers to use the resources and talents of the Affiliated Sub-Advisers in managing the Fund. The Board concluded that the nature, extent and quality of the services that may be provided by the Affiliated Sub-Advisers are appropriate and satisfactory.
| B. | Fund Investment Performance |
The Board considered Fund investment performance as a relevant factor in considering whether to approve the investment advisory agreement as well as the sub-advisory contracts for the Fund, as Invesco Canada Ltd. currently manages assets of the Fund.
The Board compared the Fund’s investment performance over multiple time periods ending December 31, 2016 to the performance of funds in the Broadridge performance universe and against the Lipper Small-Cap Core Funds Index. The Board noted that performance of Class A shares of the Fund was in the second quintile of its performance universe for the one year period, the fourth quintile for the three year period and the fifth quintile for the five year period (the first quintile being the best performing funds and the fifth quintile being the worst performing funds). The Board noted that performance of Class A shares of the Fund was above the performance of the Index for the one year period and below the performance of the Index for the three and five year periods. The Trustees also reviewed more recent Fund performance and this review did not change their conclusions.
| C. | Advisory and Sub-Advisory Fees |
The Board compared the Fund’s contractual management fee rate to the contractual management fee rates of funds in the Fund’s Broadridge expense group at a common asset level. The Board noted that the contractual management fee rate for Class A shares of the Fund was below the median contractual
22 Invesco Select Companies Fund
management fee rate of funds in its expense group. The Board noted that the term “contractual management fee” for funds in the expense group may include both advisory and certain administrative services fees, but that Broadridge does not provide information on a fund by fund basis as to what is included. The Board noted that Invesco Advisers does not separately charge the Invesco Funds for the administrative services included in the term as defined by Broadridge. The Board also reviewed the methodology used by Broadridge in providing expense group information, which includes using each fund’s contractual management fee schedule (including any applicable breakpoints) as reported in the most recent prospectus or statement of additional information for each fund in the expense group.
The Board also compared the Fund’s effective advisory fee rate (the advisory fee rate after advisory fee waivers and before other expense limitations/waivers) to the effective advisory fee rates of other mutual funds advised by Invesco Advisers and its affiliates with investment strategies comparable to those of the Fund, based on asset balances as of December 31, 2016. The Board noted that the Fund’s rate was below the effective advisory fee rate of one off-shore advised by Invesco Advisers using a similar investment process. The Board also noted how the Fund’s rate compared to the effective sub-adviser fee rate of one fund sub-advised by Invesco Advisers. The Board noted that Invesco Advisers and the Affiliated Sub-Advisers do not manage other client accounts with investment strategies comparable to those of the Fund.
The Board also considered the services that may be provided by the Affiliated Sub-Advisers pursuant to the sub-advisory contracts, as well as the fees payable by Invesco Advisers to the Affiliated Sub-Advisers pursuant to the sub-advisory contracts. The Board noted that Invesco Advisers retains overall responsibility for, and provides services to, sub-advised Invesco Funds, including oversight of the Affiliated Sub-Advisers as well as the additional services described herein other than day-to-day portfolio management. The Board also noted that the sub-advisory fees are not paid directly by the Fund, but rather, are payable by Invesco Advisers to the Affiliated Sub-Advisers.
| D. | Economies of Scale and Breakpoints |
The Board considered the extent to which there are economies of scale in the provision of advisory services to the Fund. The Board also considered that the Fund benefits from economies of scale through contractual breakpoints in the Fund’s advisory fee schedule. The Board noted that the Fund shares directly in economies of scale through lower fees charged by third party service providers based on the combined size of the Invesco Funds advised by Invesco Advisers.
| E. | Profitability and Financial Resources |
The Board reviewed information from Invesco Advisers concerning the costs of the advisory and other services that Invesco Advisers and its
affiliates provide to the Fund and the Invesco Funds and the profitability of Invesco Advisers and its affiliates in providing these services. The Board noted that Invesco Advisers continues to operate at a net profit from services Invesco Advisers and its affiliates provide to the Invesco Funds and the Fund. The Board received and accepted information from Invesco Advisers demonstrating that Invesco Advisers and each Affiliated Sub-Adviser are financially sound and have the resources necessary to perform their obligations under the investment advisory agreement and sub-advisory contracts.
| F. | Collateral Benefits to Invesco Advisers and its Affiliates |
The Board considered various other benefits received by Invesco Advisers and its affiliates from the relationship with the Fund, including the fees received for providing transfer agency and distribution services to the Fund. The Board considered comparative information regarding fees charged for these services, including information provided by Broadridge and other independent sources. The Board considered the performance of Invesco Advisers and its affiliates in providing these services and the organizational structure employed to provide these services. The Board also considered that these services are provided to the Fund pursuant to written contracts that are reviewed and approved on an annual basis by the Board; and that the services are required for the operation of the Fund.
The Board considered the benefits realized by Invesco Advisers and the Affiliated Sub-Advisers as a result of portfolio brokerage transactions executed through “soft dollar” arrangements. The Board noted that soft dollar arrangements may result in the Fund bearing costs to purchase research that may be used by Invesco Advisers or the Affiliated Sub-Advisers with other clients and may reduce Invesco Advisers’ or the Affiliated Sub-Advisers’ expenses. The Board also considered that it receives periodic reports from the Chief Compliance Officer of the Invesco Funds demonstrating that these arrangements are consistent with regulatory requirements. The Board did not deem the soft dollar arrangements to be inappropriate.
The Board considered that the Fund’s uninvested cash and cash collateral from any securities lending arrangements may be invested in money market funds advised by Invesco Advisers pursuant to procedures approved by the Board. The Board noted that Invesco Advisers receives advisory fees from these affiliated money market funds attributable to such investments, although Invesco Advisers has contractually agreed to waive through varying periods the advisory fees payable by the Invesco Funds with respect to certain investments in the affiliated money market funds. The waiver is in an amount equal to 100% of the net advisory fee Invesco Advisers receives from the affiliated money market funds with respect to the Fund’s investment in the affiliated money market funds of uninvested cash, but not cash collateral. The
Board concluded that the amount of advisory fees received by Invesco Advisers from the Fund’s investment of cash collateral from any securities lending arrangements in the affiliated money market funds is fair and reasonable.
The Board also considered that the Fund may use an affiliated broker to execute certain trades for the Fund to, among other things, control information leakage, and was advised that such trades would be executed in compliance with rules under the federal securities laws and consistent with best execution obligations.
23 Invesco Select Companies Fund
Tax Information
Form 1099-DIV, Form 1042-S and other year-end tax information provide shareholders with actual calendar year amounts that should be included in their tax returns. Shareholders should consult their tax advisors.
The following distribution information is being provided as required by the Internal Revenue Code or to meet a specific state's requirement.
The Fund designates the following amounts or, if subsequently determined to be different, the maximum amount allowable for its fiscal year ended October 31, 2017:
| | | | |
Federal and State Income Tax | |
Long-Term Capital Gain Distributions | | $ | 20,025,749 | |
Qualified Dividend Income* | | | 0.00 | % |
Corporate Dividends Received Deduction* | | | 0.00 | % |
U.S. Treasury Obligations* | | | 0.00 | % |
| | * | The above percentages are based on ordinary income dividends paid to shareholders during the Fund’s fiscal year. |
24 Invesco Select Companies Fund
Trustees and Officers
The address of each trustee and officer is AIM Investment Funds (Invesco Investment Funds) (the “Trust”), 11 Greenway Plaza, Suite 1000, Houston, Texas 77046-1173. The trustees serve for the life of the Trust, subject to their earlier death, incapacitation, resignation, retirement or removal as more specifically provided in the Trust’s organizational documents. Each officer serves for a one year term or until their successors are elected and qualified. Column two below includes length of time served with predecessor entities, if any.
| | | | | | | | |
Name, Year of Birth and Position(s) Held with the Trust | | Trustee and/
or Officer Since | | Principal Occupation(s)
During Past 5 Years | | Number of
Funds in Fund
Complex
Overseen by
Trustee | | Other Directorship(s)
Held by Trustee During Past 5 Years |
| Interested Persons | | | | | | | | |
| Martin L. Flanagan1 — 1960 Trustee | | 2007 | | Executive Director, Chief Executive Officer and President, Invesco Ltd. (ultimate parent of Invesco and a global investment management firm); Trustee, The Invesco Funds; Vice Chair, Investment Company Institute; and Member of Executive Board, SMU Cox School of Business Formerly: Advisor to the Board, Invesco Advisers, Inc. (formerly known as Invesco Institutional (N.A.), Inc.); Chairman and Chief Executive Officer, Invesco Advisers, Inc. (registered investment adviser); Director, Chairman, Chief Executive Officer and President, Invesco Holding Company (US), Inc. (formerly IVZ Inc.) (holding company), Invesco Group Services, Inc. (service provider) and Invesco North American Holdings, Inc. (holding company); Director, Chief Executive Officer and President, Invesco Holding Company Limited (parent of Invesco and a global investment management firm); Director, Invesco Ltd.; Chairman, Investment Company Institute and President, Co-Chief Executive Officer, Co-President, Chief Operating Officer and Chief Financial Officer, Franklin Resources, Inc. (global investment management organization) | | 158 | | None |
Philip A. Taylor2 — 1954 Trustee and Senior Vice President | | 2006 | | Head of the Americas and Senior Managing Director, Invesco Ltd.; Director, Invesco Advisers, Inc. (formerly known as Invesco Institutional (N.A.), Inc.) (registered investment adviser); Director, Chairman, Chief Executive Officer and President, Invesco Management Group, Inc. (formerly known as Invesco Aim Management Group, Inc.) (financial services holding company); Director and Chairman, Invesco Investment Services, Inc. (formerly known as Invesco Aim Investment Services, Inc.) (registered transfer agent); Chief Executive Officer, Invesco Corporate Class Inc. (corporate mutual fund company); Director, Chairman and Chief Executive Officer, Invesco Canada Ltd. (formerly known as Invesco Trimark Ltd./Invesco Trimark Ltèe) (registered investment adviser and registered transfer agent); Trustee and Senior Vice President, The Invesco Funds; Director, Invesco Investment Advisers LLC (formerly known as Van Kampen Asset Management). Formerly: Co-Chairman, Co-President and Co-Chief Executive Officer, Invesco Advisers, Inc. (formerly known as Invesco Institutional (N.A.), Inc.) (registered investment adviser); Director, Chief Executive Officer and President, Van Kampen Exchange Corp; President and Principal Executive Officer, The Invesco Funds (other than AIM Treasurer’s Series Trust (Invesco Treasurer’s Series Trust), Short-Term Investments Trust and Invesco Management Trust); Executive Vice President, The Invesco Funds (AIM Treasurer’s Series Trust (Invesco Treasurer’s Series Trust), Short-Term Investments Trust and Invesco Management Trust only); Director and President, INVESCO Funds Group, Inc. (registered investment adviser and registered transfer agent); Director and Chairman, IVZ Distributors, Inc. (formerly known as INVESCO Distributors, Inc.) (registered broker dealer); Director, President and Chairman, Invesco Inc. (holding company), Invesco Canada Holdings Inc. (holding company), Trimark Investments Ltd./Placements Trimark Ltèe and Invesco Financial Services Ltd/Services Financiers Invesco Ltèe; Chief Executive Officer, Invesco Canada Fund Inc. (corporate mutual fund company); Director and Chairman, Van Kampen Investor Services Inc.; Director, Chief Executive Officer and President, 1371 Preferred Inc. (holding company) and Van Kampen Investments Inc.; Director and President, AIM GP Canada Inc. (general partner for limited partnerships) and Van Kampen Advisors, Inc.; Director and Chief Executive Officer, Invesco Trimark Dealer Inc. (registered broker dealer); Director, Invesco Distributors, Inc. (formerly known as Invesco Aim Distributors, Inc.) (registered broker dealer); Manager, Invesco PowerShares Capital Management LLC; Director, Chief Executive Officer and President, Invesco Advisers, Inc.; Director, Chairman, Chief Executive Officer and President, Invesco Aim Capital Management, Inc.; President, Invesco Trimark Dealer Inc. and Invesco Trimark Ltd./Invesco Trimark Ltèe; Director and President, AIM Trimark Corporate Class Inc. and AIM Trimark Canada Fund Inc.; Senior Managing Director, Invesco Holding Company Limited; Director and Chairman, Fund Management Company (former registered broker dealer); President and Principal Executive Officer, The Invesco Funds (AIM Treasurer’s Series Trust (Invesco Treasurer’s Series Trust), and Short-Term Investments Trust only); President, AIM Trimark Global Fund Inc. and AIM Trimark Canada Fund Inc. | | 158 | | None |
| 1 | Mr. Flanagan is considered an interested person (within the meaning of Section 2(a)(19) of the 1940 Act) of the Trust because he is an officer of the Adviser to the Trust, and an officer and a director of Invesco Ltd., ultimate parent of the Adviser. |
| 2 | Mr. Taylor is considered an interested person (within the meaning of Section 2(a)(19) of the 1940 Act) of the Trust because he is an officer and a director of the Adviser. |
T-1 Invesco Select Companies Fund
Trustees and Officers—(continued)
| | | | | | | | |
Name, Year of Birth and Position(s) Held with the Trust | | Trustee and/
or Officer Since | | Principal Occupation(s) During Past 5 Years | | Number of
Funds in Fund
Complex
Overseen by
Trustee | | Other Directorship(s)
Held by Trustee During Past 5 Years |
| Independent Trustees | | | | | | | | |
Bruce L. Crockett — 1944 Trustee and Chair | | 2001 | | Chairman, Crockett Technologies Associates (technology consulting company) Formerly: Director, Captaris (unified messaging provider); Director, President and Chief Executive Officer, COMSAT Corporation; Chairman, Board of Governors of INTELSAT (international communications company); ACE Limited (insurance company); Independent Directors Council and Investment Company Institute: Member of the Audit Committee, Investment Company Institute; Member of the Executive Committee and Chair of the Governance Committee, Independent Directors Council | | 158 | | Director and Chairman of the Audit Committee, ALPS (Attorneys Liability Protection Society) (insurance company); Director and Member of the Audit Committee, Ferroglobe PLC (metallurgical company) |
David C. Arch — 1945 Trustee | | 2010 | | Chairman of Blistex Inc. (consumer health care products manufacturer); Member, World Presidents’ Organization | | 158 | | Board member of the Illinois Manufacturers’ Association |
James T. Bunch — 1942 Trustee | | 2003 | | Managing Member, Grumman Hill Group LLC (family office/private equity investments) Formerly: Chairman of the Board, Denver Film Society; Chairman of the Board of Trustees, Evans Scholarship Foundation; Chairman, Board of Governors, Western Golf Association | | 158 | | Trustee, Evans Scholarship Foundation |
Jack M. Fields — 1952 Trustee | | 2001 | | Chief Executive Officer, Twenty First Century Group, Inc. (government affairs company); and Discovery Learning Alliance (non-profit) Formerly: Owner and Chief Executive Officer, Dos Angeles Ranch L.P. (cattle, hunting, corporate entertainment); Director, Insperity, Inc. (formerly known as Administaff) (human resources provider); Chief Executive Officer, Texana Timber LP (sustainable forestry company); Director of Cross Timbers Quail Research Ranch (non-profit); and member of the U.S. House of Representatives | | 158 | | None |
Cynthia Hostetler — 1962 Trustee | | 2017 | | Non-Executive Director and Trustee of a number of public and private business corporations Formerly: Head of Investment Funds and Private Equity, Overseas Private Investment Corporation; President, First Manhattan Bancorporation, Inc.; Attorney, Simpson Thacher & Bartlett LLP | | 158 | | Vulcan Materials Company (construction materials company); Trilinc Global Impact Fund; Aberdeen Investment Funds (4 portfolios); Artio Global Investment LLC (mutual fund complex); Edgen Group, Inc. (specialized energy and infrastructure products distributor) |
Eli Jones —��1961 Trustee | | 2016 | | Professor and Dean, Mays Business School — Texas A&M University Formerly: Professor and Dean, Walton College of Business, University of Arkansas and E.J. Ourso College of Business, Louisiana State University; Director, Arvest Bank | | 158 | | Insperity, Inc. (formerly known as Administaff) (human resources provider) |
Prema Mathai-Davis — 1950 Trustee | | 2001 | | Retired. Formerly: Chief Executive Officer, YWCA of the U.S.A. | | 158 | | None |
Teresa M. Ressel — 1962 Trustee | | 2017 | | Non-executive director and trustee of a number of public and private business corporations Formerly: Chief Financial Officer, Olayan America, The Olayan Group (international investor/commercial/industrial); Chief Executive Officer, UBS Securities LLC; Group Chief Operating Officer, Americas, UBS AG; Assistant Secretary for Management & Budget and CFO, US Department of the Treasury; Chief Compliance Officer, Kaiser Permanente (healthcare consortium); Program Manager, Hewlett-Packard; Nuclear Engineering, General Dynamics Corporation (aerospace and defense company) | | 158 | | Atlantic Power Corporation (power generation company); ON Semiconductor Corp. (semiconductor supplier) |
Larry Soll — 1942 Trustee | | 2003 | | Retired. Formerly: Chairman, Chief Executive Officer and President, Synergen Corp. (a biotechnology company) | | 158 | | None |
Ann Barnett Stern — 1957 Trustee | | 2017 | | President and Chief Executive Officer, Houston Endowment Inc. (private philanthropic institution) Formerly: Executive Vice President and General Counsel, Texas Children’s Hospital; Attorney, Beck, Redden and Secrest, LLP; Business Law Instructor, University of St. Thomas; Attorney, Andrews & Kurth LLP | | 158 | | Federal Reserve Bank of Dallas |
Raymond Stickel, Jr. — 1944 Trustee | | 2005 | | Retired. Formerly: Director, Mainstay VP Series Funds, Inc. (25 portfolios); Partner, Deloitte & Touche | | 158 | | None |
Robert C. Troccoli — 1949 Trustee | | 2016 | | Adjunct Professor, University of Denver — Daniels College of Business Formerly: Senior Partner, KPMG LLP | | 158 | | None |
T-2 Invesco Select Companies Fund
Trustees and Officers—(continued)
| | | | | | | | |
Name, Year of Birth and Position(s) Held with the Trust | | Trustee and/
or Officer Since | | Principal Occupation(s) During Past 5 Years | | Number of
Funds in Fund
Complex
Overseen by
Trustee | | Other Directorship(s)
Held by Trustee During Past 5 Years |
| Independent Trustees—(continued) |
Christopher L. Wilson — 1957 Trustee | | 2017 | | Managing Partner, CT2, LLC (investing and consulting firm) Formerly: President/Chief Executive Officer, Columbia Funds, Bank of America Corporation; President/Chief Executive Officer, CDC IXIS Asset Management Services, Inc.; Principal & Director of Operations, Scudder Funds, Scudder, Stevens & Clark, Inc.; Assistant Vice President, Fidelity Investments | | 158 | | TD Asset Management USA Inc. (mutual fund complex) (22 portfolios); ISO New England, Inc. (non-profit organization managing regional electricity market) |
| Other Officers | | | | | | | | |
Sheri Morris — 1964 President, Principal Executive Officer and Treasurer | | 1999 | | President, Principal Executive Officer and Treasurer, The Invesco Funds; Vice President, Invesco Advisers, Inc. (formerly known as Invesco Institutional (N.A.), Inc.) (registered investment adviser); and Vice President, PowerShares Exchange-Traded Fund Trust, PowerShares Exchange-Traded Fund Trust II, PowerShares India Exchange-Traded Fund Trust, PowerShares Actively Managed Exchange-Traded Fund Trust and PowerShares Actively Managed Exchange-Traded Commodity Fund Trust Formerly: Vice President and Principal Financial Officer, The Invesco Funds; Vice President, Invesco Aim Advisers, Inc., Invesco Aim Capital Management, Inc. and Invesco Aim Private Asset Management, Inc.; Assistant Vice President and Assistant Treasurer, The Invesco Funds and Assistant Vice President, Invesco Advisers, Inc., Invesco Aim Capital Management, Inc. and Invesco Aim Private Asset Management, Inc.; and Treasurer, PowerShares Exchange-Traded Fund Trust, PowerShares Exchange-Traded Fund Trust II, PowerShares India Exchange-Traded Fund Trust and PowerShares Actively Managed Exchange-Traded Fund Trust | | N/A | | N/A |
Russell C. Burk — 1958 Senior Vice President and Senior Officer | | 2005 | | Senior Vice President and Senior Officer, The Invesco Funds | | N/A | | N/A |
John M. Zerr — 1962 Senior Vice President, Chief Legal Officer and Secretary | | 2006 | | Director, Senior Vice President, Secretary and General Counsel, Invesco Management Group, Inc. (formerly known as Invesco AIM Management Group, Inc.); Senior Vice President, Invesco Advisers, Inc. (formerly known as Invesco Institutional (N.A.), Inc.) (registered investment adviser); Senior Vice President and Secretary, Invesco Distributors, Inc. (formerly known as Invesco AIM Distributors, Inc.); Director, Vice President and Secretary, Invesco Investment Services, Inc. (formerly known as Invesco AIM Investment Services, Inc.) Senior Vice President, Chief Legal Officer and Secretary, The Invesco Funds; Managing Director, Invesco PowerShares Capital Management LLC; Director, Secretary and General Counsel, Invesco Investment Advisers LLC (formerly known as Van Kampen Asset Management); Secretary and General Counsel, Invesco Capital Markets, Inc. (formerly known as Van Kampen Funds Inc.) and Chief Legal Officer, PowerShares Exchange-Traded Fund Trust, PowerShares Exchange-Traded Fund Trust II, PowerShares India Exchange-Traded Fund Trust, PowerShares Actively Managed Exchange-Traded Fund Trust and PowerShares Actively Managed Exchange-Traded Commodity Fund Trust; Manager and Secretary, Invesco Indexing LLC Formerly: Director, Secretary, General Counsel and Senior Vice President, Van Kampen Exchange Corp.; Director, Vice President and Secretary, IVZ Distributors, Inc. (formerly known as INVESCO Distributors, Inc.); Director and Vice President, INVESCO Funds Group, Inc.; Director and Vice President, Van Kampen Advisors Inc.; Director, Vice President, Secretary and General Counsel, Van Kampen Investor Services Inc.; Director, Invesco Distributors, Inc. (formerly known as Invesco AIM Distributors, Inc.); Director, Senior Vice President, General Counsel and Secretary, Invesco AIM Advisers, Inc. and Van Kampen Investments Inc.; Director, Vice President and Secretary, Fund Management Company; Director, Senior Vice President, Secretary, General Counsel and Vice President, Invesco AIM Capital Management, Inc.; Chief Operating Officer and General Counsel, Liberty Ridge Capital, Inc. (an investment adviser); Vice President and Secretary, PBHG Funds (an investment company) and PBHG Insurance Series Fund (an investment company); Chief Operating Officer, General Counsel and Secretary, Old Mutual Investment Partners (a broker-dealer); General Counsel and Secretary, Old Mutual Fund Services (an administrator) and Old Mutual Shareholder Services (a shareholder servicing center); Executive Vice President, General Counsel and Secretary, Old Mutual Capital, Inc. (an investment adviser); and Vice President and Secretary, Old Mutual Advisors Funds (an investment company) | | N/A | | N/A |
Gregory G. McGreevey — 1962 Senior Vice President | | 2012 | | Senior Managing Director, Invesco Ltd.; Director, Chairman, President, and Chief Executive Officer, Invesco Advisers, Inc. (formerly known as Invesco Institutional (N.A.), Inc.) (registered investment adviser); Senior Vice President, Invesco Management Group, Inc.; Director, Invesco Mortgage Capital, Inc. and Invesco Senior Secured Management, Inc.; and Senior Vice President, The Invesco Funds Formerly: Assistant Vice President, The Invesco Funds | | N/A | | N/A |
T-3 Invesco Select Companies Fund
Trustees and Officers—(continued)
| | | | | | | | |
Name, Year of Birth and Position(s) Held with the Trust | | Trustee and/
or Officer Since | | Principal Occupation(s) During Past 5 Years | | Number of
Funds in Fund
Complex
Overseen by
Trustee | | Other Directorship(s)
Held by Trustee During Past 5 Years |
| Other Officers—(continued) | | | | | | | | |
Kelli Gallegos — 1970 Vice President, Principal Financial Officer and Assistant Treasurer | | 2008 | | Vice President, Principal Financial Officer and Assistant Treasurer, The Invesco Funds; Assistant Treasurer, Invesco PowerShares Capital Management LLC, PowerShares Exchange-Traded Fund Trust, PowerShares Exchange-Traded Fund Trust II, PowerShares India Exchange-Traded Fund Trust, PowerShares Actively Managed Exchange-Traded Fund Trust and PowerShares Actively Managed Exchange-Traded Commodity Fund Trust Formerly: Assistant Vice President, The Invesco Funds | | N/A | | N/A |
Tracy Sullivan — 1962 Vice President, Chief Tax Officer and Assistant Treasurer | | 2008 | | Vice President, Chief Tax Officer and Assistant Treasurer, The Invesco Funds; Assistant Treasurer, Invesco PowerShares Capital Management LLC, PowerShares Exchange-Traded Fund Trust, PowerShares Exchange-Traded Fund Trust II, PowerShares India Exchange-Traded Fund Trust, PowerShares Actively Managed Exchange-Traded Fund Trust and PowerShares Actively Managed Exchange-Traded Commodity Fund Trust Formerly: Assistant Vice President, The Invesco Funds | | N/A | | N/A |
Crissie M. Wisdom — 1969 Anti-Money Laundering Compliance Officer | | 2013 | | Anti-Money Laundering Compliance Officer, Invesco Advisers, Inc. (formerly known as Invesco Institutional (N.A.), Inc.) (registered investment adviser), Invesco Capital Markets, Inc. (formerly known as Van Kampen Funds Inc.), Invesco Distributors, Inc., Invesco Investment Services, Inc., Invesco Management Group, Inc., The Invesco Funds, and PowerShares Exchange-Traded Fund Trust, PowerShares Exchange-Traded Fund Trust II, PowerShares India Exchange-Traded Fund Trust, PowerShares Actively Managed Exchange-Traded Fund Trust and PowerShares Actively Managed Exchange-Traded Commodity Fund Trust; Anti-Money Laundering Compliance Officer and Bank Secrecy Act Officer, INVESCO National Trust Company and Invesco Trust Company; and Fraud Prevention Manager and Controls and Risk Analysis Manager for Invesco Investment Services, Inc. Formerly: Anti-Money Laundering Compliance Officer, Van Kampen Exchange Corp. | | N/A | | N/A |
Robert R. Leveille — 1969 Chief Compliance Officer | | 2016 | | Chief Compliance Officer, Invesco Advisers, Inc. (registered investment adviser); and Chief Compliance Officer, The Invesco Funds Formerly: Chief Compliance Officer, Putnam Investments and the Putnam Funds | | N/A | | N/A |
The Statement of Additional Information of the Trust includes additional information about the Fund’s Trustees and is available upon request, without charge, by calling 1.800.959.4246. Please refer to the Fund’s Statement of Additional Information for information on the Fund’s sub-advisers.
| | | | | | |
Office of the Fund 11 Greenway Plaza, Suite 1000 Houston, TX 77046-1173 | | Investment Adviser Invesco Advisers, Inc. 1555 Peachtree Street, N.E. Atlanta, GA 30309 | | Distributor Invesco Distributors, Inc. 11 Greenway Plaza, Suite 1000 Houston, TX 77046-1173 | | Auditors PricewaterhouseCoopers LLP 1000 Louisiana Street, Suite 5800 Houston, TX 77002-5678 |
| | | |
| | | | | | |
Counsel to the Fund Stradley Ronon Stevens & Young, LLP 2005 Market Street, Suite 2600 Philadelphia, PA 19103-7018 | | Counsel to the Independent Trustees Goodwin Procter LLP 901 New York Avenue, N.W. Washington, D.C. 20001 | | Transfer Agent Invesco Investment Services, Inc. 11 Greenway Plaza, Suite 1000 Houston, TX 77046-1173 | | Custodian State Street Bank and Trust Company 225 Franklin Street Boston, MA 02110-2801 |
T-4 Invesco Select Companies Fund
Explore High-Conviction Investing with Invesco

Go paperless with eDelivery
Visit invesco.com/edelivery to enjoy the convenience and security of anytime electronic access to your investment documents.
With eDelivery, you can elect to have any or all of the following materials delivered straight to your inbox to download, save and print from your own computer:
∎ Fund reports and prospectuses
∎ Quarterly statements
∎ Daily confirmations
∎ Tax forms
Invesco mailing information
Send general correspondence to Invesco Investment Services, Inc., P.O. Box 219078, Kansas City, MO 64121-9078.
Important notice regarding delivery of security holder documents
To reduce Fund expenses, only one copy of most shareholder documents may be mailed to shareholders with multiple accounts at the same address (Householding). Mailing of your shareholder documents may be householded indefinitely unless you instruct us otherwise. If you do not want the mailing of these documents to be combined with those for other members of your household, please contact Invesco Investment Services, Inc. at 800 959 4246 or contact your financial institution. We will begin sending you individual copies for each account within 30 days after receiving your request.
Fund holdings and proxy voting information
The Fund provides a complete list of its holdings four times in each fiscal year, at the quarter ends. For the second and fourth quarters, the lists appear in the Fund’s semiannual and annual reports to shareholders. For the first and third quarters, the Fund files the lists with the Securities and Exchange Commission (SEC) on Form N-Q. The most recent list of portfolio holdings is available at invesco.com/completeqtrholdings. Shareholders can also look up the Fund’s Forms N-Q on the SEC website at sec.gov. Copies of the Fund’s Forms N-Q may be reviewed and copied at the SEC Public Reference Room in Washington, D.C. You can obtain information on the operation of the Public Reference Room, including information about duplicating fee charges, by calling 202 551 8090 or 800 732 0330, or by electronic request at the following email address: publicinfo@sec.gov. The SEC file numbers for the Fund are shown below.
A description of the policies and procedures that the Fund uses to determine how to vote proxies relating to portfolio securities is available without charge, upon request, from our Client Services department at 800 959 4246 or at invesco.com/proxyguidelines. The information is also available on the SEC website, sec.gov.
| | |
Information regarding how the Fund voted proxies related to its portfolio securities during the most recent 12-month period ended June 30 is available at invesco.com/proxysearch. The information is also available on the SEC website, sec.gov. Invesco Advisers, Inc. is an investment adviser; it provides investment advisory services to individual and institutional clients and does not sell securities. Invesco Distributors, Inc. is the US distributor for Invesco Ltd.’s retail mutual funds, exchange-traded funds and institutional money market funds. Both are wholly owned, indirect subsidiaries of Invesco Ltd. | |  |
| | | | | | | | | | | | |
SEC file numbers: 811-05426 and 033-19338 | | Invesco Distributors, Inc. | | SCO-AR-1 | | | 12112017 | | |
| 1040
|
|
Letters to Shareholders
| | |

Philip Taylor | | Dear Shareholders: This annual report includes information about your Fund, including performance data and a complete list of its investments as of the close of the reporting period. Inside is a discussion of how your Fund was managed and the factors that affected its performance during the reporting period. American voters went to the polls just days after the start of the reporting period, and their decisions quickly affected markets. The US stock market rallied strongly after the election, with major market indexes rising, and setting record highs, throughout the reporting period. Generally positive economic data, strong corporate earnings and hope for tax and regulatory reform contributed to the rally. US and global bond markets, as well as emerging market equities, sold off immediately following the election – with the US bond market eventually recovering most of its losses. Overseas, economic data were mixed, prompting the European Central Bank and central banks in China and Japan, |
among other countries, to maintain extraordinarily accommodative monetary policies. Citing positive economic trends – specifically, realized and expected labor market conditions and inflation – the US Federal Reserve raised interest rates three times during the reporting period: first in December 2016, and then again in March and June 2017. Health care and tax reform proved to be more difficult than expected to enact, with little progress achieved by the end of the reporting period.
Short-term market volatility can prompt some investors to abandon their investment plans – and can cause others to settle for whatever returns the market has to offer. The investment professionals at Invesco, in contrast, invest with high conviction. This means that, no matter the asset class or the strategy, each investment team has a passion to exceed. We want to help investors achieve better outcomes, such as seeking higher returns, helping mitigate risk and generating income. Of course, investing with high conviction can’t guarantee a profit or ensure success; no investment strategy can. To learn more about how we invest with high conviction, visit invesco.com/HighConviction.
You, too, can invest with high conviction by maintaining a long-term investment perspective and by working with your financial adviser on a regular basis. During periods of short-term market volatility or uncertainty, your financial adviser can keep you focused on your long-term investment goals – a new home, a child’s college education or a secure retirement. He or she also can share research about the economy, the markets and individual investment options.
Visit our website for more information on your investments
Our website, invesco.com/us, offers a wide range of market insights and investment perspectives. On the website, you’ll find detailed information about our funds, including performance, holdings and portfolio manager commentaries. You can access information about your account by completing a simple, secure online registration. To do so, select “Log In” on the right side of the homepage, and then select “Register for Individual Account Access.”
In addition to the resources accessible on our website and through our mobile app, you can obtain timely updates to help you stay informed about the markets and the economy by connecting with Invesco on Twitter, LinkedIn or Facebook. You can access our blog at blog.invesco.us.com. Our goal is to provide you the information you want, when and where you want it.
Finally, I’m pleased to share with you Invesco’s commitment to both the Principles for Responsible Investment and to considering environmental, social and governance issues in our robust investment process. I invite you to learn more at invesco.com/esg.
Have questions?
For questions about your account, contact an Invesco client services representative at 800 959 4246. For Invesco-related questions or comments, please email me directly at phil@invesco.com.
All of us at Invesco look forward to serving your investment management needs. Thank you for investing with us.
Sincerely,

Philip Taylor
Senior Managing Director, Invesco Ltd.
2 Invesco World Bond Fund
| | | | |
 | | Dear Fellow Shareholders: Among the many important lessons I’ve learned in more than 40 years in a variety of business endeavors is the value of a trusted advocate. As independent chair of the Invesco Funds Board, I can assure you that the members of the Board are strong advocates for the interests of investors in Invesco’s mutual funds. We work hard to represent your interests through oversight of the quality of the investment management services your funds receive and other matters important to your investment, including but not limited to: |
| Bruce Crockett | | ∎ | | Ensuring that Invesco offers a diverse lineup of mutual funds that your financial adviser can use to strive to meet your financial needs as your investment goals change over time. |
| | ∎ | | Monitoring how the portfolio management teams of the Invesco funds are performing in light of changing economic and market conditions. |
| ∎ | Assessing each portfolio management team’s investment performance within the context of the investment strategy described in the fund’s prospectus. |
| ∎ | Monitoring for potential conflicts of interests that may impact the nature of the services that your funds receive. |
We believe one of the most important services we provide our fund shareholders is the annual review of the funds’ advisory and sub-advisory contracts with Invesco Advisers and its affiliates. This review is required by the Investment Company Act of 1940 and focuses on the nature and quality of the services Invesco provides as the adviser to the Invesco funds and the reasonableness of the fees that it charges for those services. Each year, we spend months carefully reviewing information received from Invesco and a variety of independent sources, such as performance and fee data prepared by Lipper, Inc. (a subsidiary of Broadridge Financial Solutions, Inc.), an independent, third-party firm widely recognized as a leader in its field. We also meet with our independent legal counsel and other independent advisers to review and help us assess the information that we have received. Our goal is to assure that you receive quality investment management services for a reasonable fee.
I trust the measures outlined above provide assurance that you have a worthy advocate when it comes to choosing the Invesco Funds. As always, please contact me at bruce@brucecrockett.com with any questions or concerns you may have. On behalf of the Board, we look forward to continuing to represent your interests and serving your needs.
Sincerely,

Bruce L. Crockett
Independent Chair
Invesco Funds Board of Trustees
3 Invesco World Bond Fund
Management’s Discussion of Fund Performance
| | |
Performance summary For the fiscal year ended October 31, 2017, Class A shares of Invesco World Bond Fund (the Fund), at net asset value (NAV), outperformed the Fund’s broad market/ style-specific index, the Bloomberg Barclays Global Aggregate Index. Your Fund’s long-term performance appears later in this report. |
| | |
Fund vs. Indexes Total returns, 10/31/16 to 10/31/17, at net asset value (NAV). Performance shown does not include applicable contingent deferred sales charges (CDSC) or front-end sales charges, which would have reduced performance. |
| | | | |
| |
| Class A Shares | | | 2.63 | % |
| Class B Shares | | | 1.80 | |
| Class C Shares | | | 1.80 | |
| Class Y Shares | | | 2.81 | |
| Class R5 Shares | | | 2.81 | |
| Class R6 Shares | | | 2.91 | |
| Bloomberg Barclays Global Aggregate Indexq (Broad Market/Style-Specific Index)* | | | 1.18 | |
| Bloomberg Barclays Global Aggregate ex-U.S. Indexq (Former Broad Market/Style-Specific Index)* | | | 1.26 | |
| Lipper Global Income Funds Index∎ (Peer Group Index)* | | | 3.53 | |
| Lipper International Income Funds Index∎ (Former Peer Group Index)* | | | 3.36 | |
Source(s): qFactSet Research Systems Inc.; ∎Lipper Inc. *The Fund has changed its broad market/style-specific index from the Bloomberg Barclays Global Aggregate ex-U.S. Index to the Bloomberg Barclays Global Aggregate Index. The Fund also has changed its peer group index from the Lipper International Income Funds Index to the Lipper Global Income Funds Index. These changes were made in connection with repositioning the Fund as a global fixed income fund. | |
Market conditions and your Fund
The reporting period began with a spike in government yields following the US presidential election. Investors believed that the new administration’s plans to reduce tax rates, scale back regulations and increase infrastructure spending had the potential to stimulate economic growth. US Federal Reserve Board (the Fed) policy, as well as the Fed’s acknowledgement of a stronger US economy and a significantly improved employment picture, supported rising yields and a steepening yield curve. This was confirmed when the Fed hiked rates in December 2016, and indicated additional rate hikes were likely in 2017.
The new year brought global economic growth, tightening financial conditions and political uncertainty. The bond market’s initial focus was the Fed and its March meeting to decide US interest rate policy. In late February, statements from Fed officials took on a more hawkish tone. This continued into March, and by the time of the Fed’s meeting on March 15, a 25 basis point hike was fully “priced in” to financial markets. (One basis point equals 0.01%.) The statement accompanying the 25 basis point increase and official Fed forecasts, however, suggested more gradual interest rate hikes than the tone of earlier communications had led the market to expect. This shift in tone helped ease pressure on US Treasuries,
which subsequently drove other core government bond yields lower. Also early in 2017, numerous questions were raised about the Trump administration’s fiscal and tax plans, while uncertainty across Europe abated when the perceived market-friendly candidate, Emmanuel Macron, defeated far right candidate Marine le Pen in the French presidential election.
Amid this backdrop, the US inflation rate remained stubbornly low during the reporting period despite an improving employment picture and an overall brighter outlook for the economy with respect to growth. Despite tame inflation numbers, the Fed raised the federal funds target rate another 25 basis points at its June meeting, stating that the US economy was strengthening and any weakness in inflation was transitory. By August, increasing geopolitical concerns surrounding the Korean peninsula raised market uncertainty along with market volatility. Global central banks also became increasingly hawkish as European Central Bank president Mario Draghi alluded to plans to reduce the amount of economic stimulus in 2018.
In the final two months of the reporting period, global interest rates rose in reaction to stronger economic growth and higher inflation expectations, combined with increased expectations that the Fed would raise rates one more time in 2017. The 10-year US Treasury yield ended the reporting period at 2.38%, 54 basis points higher than at the beginning of the reporting period.1
The broader global bond market, as represented by the Bloomberg Barclays Global Aggregate Index, gained 1.18% for the fiscal year. Rising interest rates weighed on global treasuries, which produced negative returns. However, all other bond sectors (government-related,
| | | | |
Portfolio Composition | | | | |
By sector | | | % of total net assets | |
| |
Sovereign Debt | | | 27.6 | % |
U.S. Treasury Securities | | | 18.3 | |
Financials | | | 17.8 | |
Energy | | | 11.2 | |
Materials | | | 4.0 | |
Information Technology | | | 2.7 | |
Utilities | | | 2.4 | |
Telecommunication Services | | | 2.3 | |
Consumer Discretionary | | | 2.1 | |
Other Sectors, Each Less than 2% | | | 3.3 | |
Money Market Funds | | | | |
Plus Other Assets Less Liabilities | | | 8.3 | |
| | | | | | |
Top Five Debt Issuers* | | | | |
| | | % of total net assets | |
| | |
| 1. | | U.S. Treasury Securities | | | 18.2% | |
| 2. | | Indonesia Treasury Bond | | | 3.7 | |
| 3. | | Japan Government Forty Year Bond | | | 3.3 | |
| 4. | | Apple Inc. | | | 2.7 | |
| 5. | | Italy Buoni Poliennali de Tesoro | | | 2.6 | |
| | |
Total Net Assets | | $32.3 million |
| |
Total Number of Holdings* | | 74 |
The Fund’s holdings are subject to change, and there is no assurance that the Fund will continue to hold any particular security.
*Excluding money market fund holdings.
Data presented here are as of October 31, 2017.
4 Invesco World Bond Fund
corporate and securitized) posted positive returns for the fiscal year as strong global growth and stable inflation helped to drive returns. Global high yield and emerging market debt provided strong gains, supported by solid global economic growth and global demand for assets with adequate yield.
The Fund generated positive returns for the reporting period and, at NAV, outperformed its broad market/style-specific benchmark, the Bloomberg Barclays Global Aggregate Bond Index. The Fund’s out of index exposure to high yield corporate credit denominated in US dollars was one of the most notable contributors to the Fund’s relative performance. Security selection within investment grade credit denominated in US dollars also added to Fund performance relative to the broad market/style-specific index. The Fund’s use of total return swaps and credit default swaps to hedge credit risk detracted from relative returns. With respect to foreign currencies, the Fund’s exposure to the Polish zloty, Turkish lira and Russian ruble contributed to relative performance, while exposure to the Taiwanese dollar, Colombian peso and Brazilian real detracted.
During the reporting period, the Fund used active duration and yield curve positioning for risk management and for generating alpha versus its broad market/ style-specific index. Alpha is a measure of performance on a risk-adjusted basis. Duration measures a portfolio’s price sensitivity to interest rate changes. Yield curve positioning refers to actively emphasizing points (maturities) along the yield curve with favorable risk-return expectations. Duration and yield curve positioning across the various global yield curves contributed to Fund performance versus the Fund’s broad market/style-specific index during the reporting period. Duration was managed with cash bonds and futures positions. Buying and selling interest rate futures contracts across multiple global yield curves was an important tool we used to manage interest rate risk and maintain our targeted portfolio duration.
Please note that we implemented our strategy using derivative instruments, including futures, forwards, swaps and options. Therefore, a portion of the performance of the strategy, both positive and negative, can be attributed to these instruments. Derivatives can be a cost-effective way to gain or hedge exposure to certain risks. However, derivatives may amplify traditional investment risks through the creation of leverage and may be less liquid than traditional securities.
Part of the Fund’s strategy to manage credit and currency risk in the portfolio during the reporting period entailed purchasing and selling credit and currency derivatives. We sought to manage credit market risk by purchasing and selling protection through credit default swaps at various points throughout the fiscal year. The currency management was carried out via currency forwards and options on an as-needed basis and we believe this strategy was effective in managing the currency positioning within the Fund.
We wish to remind you that the Fund is subject to interest rate risk, meaning when interest rates rise, the value of fixed income securities tends to fall. The risk may be greater in the current market environment because interest rates are at or near historic lows. The degree to which the value of fixed income securities may decline due to rising interest rates may vary depending on the speed and magnitude of the increase in interest rates, as well as individual security characteristics such as price, maturity, duration and coupon and market forces such as supply and demand for similar securities. We are monitoring interest rates, and the market, economic and geopolitical factors that may impact the direction, speed and magnitude of changes to interest rates across the maturity spectrum, including the potential impact of monetary policy changes by the Fed and certain foreign central banks. If interest rates rise, markets may experience increased volatility, which may affect the value and/ or liquidity of certain of the Fund’s investments.
Thank you for investing in Invesco World Bond Fund and for sharing our long-term investment horizon.
1 Source: Bloomberg
The views and opinions expressed in management’s discussion of Fund performance are those of Invesco Advisers, Inc. These views and opinions are subject to change at any time based on factors such as market and economic conditions. These views and opinions may not be relied upon as investment advice or recommendations, or as an offer for a particular security. The information is not a complete analysis of every aspect of any market, country, industry, security or the Fund. Statements of fact are from sources considered reliable, but Invesco Advisers, Inc. makes no representation or warranty as to their completeness or accuracy. Although historical performance is no guarantee of future results, these insights may help you understand our investment management philosophy.
See important Fund and, if applicable, index disclosures later in this report.
| | |
 | | Avi Hooper Chartered Financial Analyst, Portfolio Manager, is lead manager of Invesco World Bond Fund. He |
| joined Invesco in 2010. Mr. Hooper earned a BAS with a focus in accounting and finance from York University. |
| | |
 | | Josef Portelli Chartered Financial Analyst, Portfolio Manager, is manager of Invesco World Bond Fund. He joined |
| Invesco in 2012. Mr. Portelli earned a degree in accountancy and finance from the University of Malta. |
| | |
 | | Raymund Uy Chartered Financial Analyst, Portfolio Manager and Head of Currencies for Invesco Fixed Income, is |
| manager of Invesco World Bond Fund. He joined Invesco in 2012. Mr. Uy earned a BBA from Hofstra University. |
| | |
 | | Robert Waldner Chartered Financial Analyst, Portfolio Manager, is manager of Invesco World Bond Fund. He joined |
| Invesco in 2013. Mr. Waldner earned a BSE degree in civil engineering from Princeton University. |
5 Invesco World Bond Fund
Your Fund’s Long-Term Performance
Results of a $10,000 Investment – Oldest Share Class(es)
Fund and index data from 10/31/07
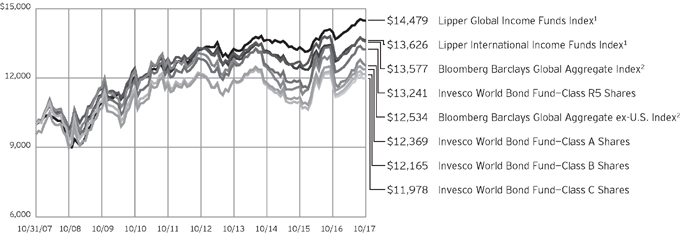
1 Source: Lipper Inc.
2 Source: FactSet Research Systems Inc.
Past performance cannot guarantee comparable future results.
During the reporting period, the Fund changed its broad market/style-specific index from the Bloomberg Barclays Global Aggregate ex-U.S. Index to the Bloomberg Barclays Global Aggregate Index. The Fund also changed its peer group index from the Lipper International Income Funds Index to the Lipper Global Income Funds Index. These changes were made in connection with repositioning the Fund as a global fixed income fund.
Because this is the first reporting period since we have adopted the new index, SEC guidelines require that we compare performance to both the old and new indexes.
The data shown in the chart include reinvested distributions, applicable sales charges and Fund expenses including management fees. Results for Class B shares are calculated as if a hypothetical shareholder had liquidated his entire investment in the Fund at the close of the reporting period and paid the contingent
deferred sales charges, if applicable. Index results include reinvested dividends, but they do not reflect sales charges. Performance of the peer group, if applicable, reflects fund expenses and management fees; performance of a market index does not. Performance shown in the chart and table(s) does not reflect deduction of taxes a shareholder would pay on Fund distributions or sale of Fund shares.
6 Invesco World Bond Fund
| | | | | | |
Average Annual Total Returns | | | |
As of 10/31/17, including maximum applicable sales charges | | | |
| | |
Class A Shares | | | | | | |
Inception (3/31/06) | | | 3.16 | % | | |
10 Years | | | 2.15 | | | |
5 Years | | | -0.44 | | | |
1 Year | | | -1.70 | | | |
| | |
Class B Shares | | | | | | |
Inception (3/31/06) | | | 3.01 | % | | |
10 Years | | | 1.98 | | | |
5 Years | | | -0.71 | | | |
1 Year | | | -3.20 | | | |
| | |
Class C Shares | | | | | | |
Inception (3/31/06) | | | 2.76 | % | | |
10 Years | | | 1.82 | | | |
5 Years | | | -0.34 | | | |
1 Year | | | 0.80 | | | |
| | |
Class Y Shares | | | | | | |
10 Years | | | 2.82 | % | | |
5 Years | | | 0.66 | | | |
1 Year | | | 2.81 | | | |
| | |
Class R5 Shares | | | | | | |
Inception (3/31/06) | | | 3.80 | % | | |
10 Years | | | 2.85 | | | |
5 Years | | | 0.66 | | | |
1 Year | | | 2.81 | | | |
| | |
Class R6 Shares | | | | | | |
10 Years | | | 2.73 | % | | |
5 Years | | | 0.68 | | | |
1 Year | | | 2.91 | | | |
Class Y shares incepted on October 3, 2008. Performance shown prior to that date is that of Class A shares and includes the 12b-1 fees applicable to Class A shares.
Class R6 shares incepted on September 24, 2012. Performance shown prior to that date is that of Class A shares and includes the 12b-1 fees applicable to Class A shares.
The performance data quoted represent past performance and cannot guarantee comparable future results; current performance may be lower or higher. Please visit invesco.com/performance for the most recent month-end performance. Performance figures reflect reinvested distributions, changes in net asset value and the effect of the maximum sales charge unless otherwise stated. Investment return and principal value will fluctuate so that you may have a gain or loss when you sell shares.
| | | | | | |
Average Annual Total Returns | | | |
| As of 9/30/17, the most recent calendar quarter end, including maximum applicable sales charges | | | |
| | |
Class A Shares | | | | | | |
Inception (3/31/06) | | | 3.19 | % | | |
10 Years | | | 2.34 | | | |
5 Years | | | -0.51 | | | |
1 Year | | | -5.20 | | | |
| | |
Class B Shares | | | | | | |
Inception (3/31/06) | | | 3.04 | % | | |
10 Years | | | 2.17 | | | |
5 Years | | | -0.76 | | | |
1 Year | | | -6.57 | | | |
| | |
Class C Shares | | | | | | |
Inception (3/31/06) | | | 2.79 | % | | |
10 Years | | | 2.02 | | | |
5 Years | | | -0.38 | | | |
1 Year | | | -2.71 | | | |
| | |
Class Y Shares | | | | | | |
10 Years | | | 3.01 | % | | |
5 Years | | | 0.62 | | | |
1 Year | | | -0.75 | | | |
| | |
Class R5 Shares | | | | | | |
Inception (3/31/06) | | | 3.83 | % | | |
10 Years | | | 3.04 | | | |
5 Years | | | 0.60 | | | |
1 Year | | | -0.76 | | | |
| | |
Class R6 Shares | | | | | | |
10 Years | | | 2.92 | % | | |
5 Years | | | 0.62 | | | |
1 Year | | | -0.66 | | | |
The net annual Fund operating expense ratio set forth in the most recent Fund prospectus as of the date of this report for Class A, Class B, Class C, Class Y, Class R5 and Class R6 shares was 0.94%, 1.69%, 1.69%, 0.69%, 0.69% and 0.69%, respectively.1 The total annual Fund operating expense ratio set forth in the most recent Fund prospectus as of the date of this report for Class A, Class B, Class C, Class Y, Class R5 and Class R6 shares was 1.84%, 2.59%, 2.59%, 1.59%, 1.30% and 1.30%, respectively. The expense ratios presented above may vary from the expense ratios presented in other sections of this report that are based on expenses incurred during the period covered by this report.
Class A share performance reflects the maximum 4.25% sales charge, and Class B and Class C share performance reflects the applicable contingent deferred sales charge (CDSC) for the
period involved. The CDSC on Class B shares declines from 5% beginning at the time of purchase to 0% at the beginning of the seventh year. The CDSC on Class C shares is 1% for the first year after purchase. Class Y, Class R5 and Class R6 shares do not have a front-end sales charge or a CDSC; therefore, performance is at net asset value.
The performance of the Fund’s share classes will differ primarily due to different sales charge structures and class expenses.
Fund performance reflects any applicable fee waivers and/or expense reimbursements. Had the adviser not waived fees and/or reimbursed expenses currently or in the past, returns would have been lower. See current prospectus for more information.
| 1 | Total annual Fund operating expenses after any contractual fee waivers and/or expense reimbursements by the adviser in effect through at least February 28, 2019. See current prospectus for more information. |
7 Invesco World Bond Fund
Invesco World Bond Fund’s investment objective is total return, comprised of current income and capital appreciation.
| ∎ | Unless otherwise stated, information presented in this report is as of October 31, 2017, and is based on total net assets. |
| ∎ | Unless otherwise noted, all data provided by Invesco. |
| ∎ | To access your Fund’s reports/prospectus, visit invesco.com/fundreports. |
About share classes
| ∎ | Class B shares may not be purchased for new or additional investments. Please see the prospectus for more information. |
| ∎ | Class Y shares are available to only certain investors. Please see the prospectus for more information. |
| ∎ | Class R5 shares and Class R6 shares are available for use by retirement plans that meet certain standards and for institutional investors. Class R6 shares are also available through intermediaries that have established an agreement with Invesco Distributors, Inc. to make such shares available for use in retail omnibus accounts. Please see the prospectus for more information. |
Principal risks of investing in the Fund
| ∎ | Active trading risk. Active trading of portfolio securities may result in added expenses, a lower return and increased tax liability. |
| ∎ | Changing fixed income market conditions risk. The current low interest rate environment was created in part by the Federal Reserve Board (FRB) and certain foreign central banks keeping the federal funds and equivalent foreign rates near, at or below zero. Increases in the federal funds and equivalent foreign rates may expose fixed income markets to heightened volatility and reduced liquidity for certain fixed income investments, particularly those with longer maturities. In addition, decreases in fixed income dealer market-making capacity may also potentially lead to heightened volatility and reduced liquidity in the fixed income markets. As a result, the value of the Fund’s investments and share price may decline. Changes in central bank policies could also result in higher than normal shareholder redemptions, which could potentially increase portfolio turnover and the Fund’s transaction costs. |
| ∎ | Collateralized loan obligations risk. CLOs are subject to the risks of substantial losses due to actual defaults by underlying borrowers, which will be greater during periods of economic or financial stress. CLOs may also lose value due to collateral defaults and disappearance of subordinate tranches, market anticipation of defaults, and investor aversion to CLO securities as a class. The risks of CLOs will be greater if the Fund invests in CLOs that hold loans of uncreditworthy borrowers or if the Fund holds subordinate tranches of the CLO that absorbs losses from the defaults before senior tranches. In addition, CLOs are subject to interest rate risk and credit risk. |
| ∎ | Debt securities risk. The prices of debt securities held by the Fund will be affected by changes in interest rates, the creditworthiness of the issuer and other factors. An increase in prevailing interest rates typically causes the value of existing debt securities to fall and often has a greater impact on longer-duration debt securities and higher quality debt securities. Falling interest rates will cause the Fund to reinvest the proceeds of debt securities that have been repaid by the issuer at lower interest rates. Falling interest rates may also reduce the Fund’s distributable income because interest payments on floating rate debt instruments held by the Fund will decline. The Fund could lose money on investments in debt securities if the issuer or borrower fails to meet its obligations to make interest payments and/or to repay principal in a timely manner. Changes in an issuer’s financial strength, the market’s perception of such strength or in the credit rating of the issuer or the security may affect the value of debt securities. The Adviser’s credit analysis may fail to anticipate such changes, which could result in buying a debt security at an inopportune time or failing to sell a debt security in advance of a price decline or other credit event. |
| ∎ | Derivatives risk. The value of a derivative instrument depends largely on (and is derived from) the value of an underlying security, currency, commodity, interest rate, index or other asset (each referred to as an underlying asset). In addition to risks relating to the underlying assets, the use of derivatives may include other, possibly greater, risks, including counterparty, leverage and liquidity risks. Counterparty risk is the risk that the counterparty to the derivative contract will default on its obligation to pay the Fund the amount owed or otherwise perform under the derivative contract. Derivatives create leverage risk because they do not require payment up front equal to the economic exposure created by owning the derivative. As a result, an adverse change in the value of the underlying asset could result in the Fund sustaining a loss that is substantially greater than the amount invested in the derivative, which may make the Fund’s returns more volatile and increase the risk of loss. Derivative instruments may also be less liquid than more traditional investments and the Fund may be unable to sell or close out its derivative positions at a desirable time or price. This risk may be more acute under adverse market conditions, during which the Fund may be most in need of liquidating its derivative positions. Derivatives may also be harder to value, less tax efficient and subject to changing government regulation that could impact the Fund’s ability to use certain derivatives or their cost. Also, derivatives used for hedging or to gain or limit exposure to a particular market segment may not provide the expected benefits, particularly during adverse market conditions. |
| ∎ | Emerging markets securities risk. Emerging markets (also referred to as developing markets) are generally subject to greater market volatility, political, social and economic instability, uncertain trading markets and more governmental limitations on foreign investment than more developed markets. In addition, companies operating in emerging markets may be subject to lower trading volume and greater price fluctuations than companies in more developed markets. Securities law and the enforcement of systems of taxation |
This report must be accompanied or preceded by a currently effective Fund prospectus, which contains more complete information, including sales charges and expenses. Investors should read it carefully before investing.
NOT FDIC INSURED | MAY LOSE VALUE | NO BANK GUARANTEE
8 Invesco World Bond Fund
| | in many emerging market countries may change quickly and unpredictably. In addition, investments in emerging markets securities may also be subject to additional transaction costs, delays in settlement procedures, and lack of timely information. |
| ∎ | Exchange-traded funds risk. In addition to the risks associated with the underlying assets held by the exchange-traded fund, investments in exchange-traded funds are subject to the following additional risks: (1) an exchange-traded fund’s shares may trade above or below its net asset value; (2) an active trading market for the exchange-traded fund’s shares may not develop or be maintained; (3) trading an exchange-traded fund’s shares may be halted by the listing exchange; (4) a passively managed exchange-traded fund may not track the performance of the reference asset; and (5) a passively managed exchange-traded fund may hold troubled securities. Investment in exchange-traded funds may involve duplication of management fees and certain other expenses, as the Fund indirectly bears its proportionate share of any expenses paid by the exchange-traded funds in which it invests. Further, certain exchange-traded funds in which the Fund may invest are leveraged, which may result in economic leverage, permitting the Fund to gain exposure that is greater than would be the case in an unlevered instrument and potentially resulting in greater volatility. |
| ∎ | Foreign currency tax risk. If the US Treasury Department were to exercise its authority to issue regulations that exclude from the definition of “qualifying income” foreign currency gains not directly related to the Fund’s business of investing in securities, the Fund may be unable to qualify as a regulated investment company for one or more years. In this event, the Fund’s Board of Trustees may authorize a significant change in investment strategy or other action. |
| ∎ | Foreign government debt risk. Investments in foreign government debt securities (sometimes referred to as sovereign debt securities) involve certain risks in addition to those relating to foreign securities or debt securities generally. The issuer of the debt or the governmental authorities that control the |
| | repayment of the debt may be unable or unwilling to repay principal or interest when due in accordance with the terms of such debt, and the Fund may have limited recourse in the event of a default against the defaulting government. Without the approval of debt holders, some governmental debtors have in the past been able to reschedule or restructure their debt payments or declare moratoria on payments. |
| ∎ | Foreign securities risk. The Fund’s foreign investments may be adversely affected by political and social instability, changes in economic or taxation policies, difficulty in enforcing obligations, decreased liquidity or increased volatility. Foreign investments also involve the risk of the possible seizure, nationalization or expropriation of the issuer or foreign deposits (in which the Fund could lose its entire investments in a certain market) and the possible adoption of foreign governmental restrictions such as exchange controls. Unless the Fund has hedged its foreign securities risk, foreign securities risk also involves the risk of negative foreign currency rate fluctuations, which may cause the value of securities denominated in such foreign currency (or other instruments through which the Fund has exposure to foreign currencies) to decline in value. Currency exchange rates may fluctuate significantly over short periods of time. Currency hedging strategies, if used, are not always successful. |
| ∎ | High yield debt securities (junk bond) risk. Investments in high yield debt securities (“junk bonds”) and other lower-rated securities will subject the Fund to substantial risk of loss. These securities are considered to be speculative with respect to the issuer’s ability to pay interest and principal when due, are more susceptible to default or decline in market value and are less liquid than investment grade debt securities. Prices of high yield debt securities tend to be very volatile. |
| ∎ | Liquidity risk. The Fund may be unable to sell illiquid investments at the time or price it desires and, as a result, could lose its entire investment in such investments. Liquid securities can become illiquid during periods of market stress. If a significant amount of the Fund’s securities |
| | become illiquid, the Fund may not be able to timely pay redemption proceeds and may need to sell securities at significantly reduced prices. |
| ∎ | Management risk. The Fund is actively managed and depends heavily on the Adviser’s judgment about markets, interest rates or the attractiveness, relative values, liquidity, or potential appreciation of particular investments made for the Fund’s portfolio. The Fund could experience losses if these judgments prove to be incorrect. Additionally, legislative, regulatory, or tax developments may adversely affect management of the Fund and, therefore, the ability of the Fund to achieve its investment objective. |
| ∎ | Market risk. The market values of the Fund’s investments, and therefore the value of the Fund’s shares, will go up and down, sometimes rapidly or unpredictably. Market risk may affect a single issuer, industry or section of the economy, or it may affect the market as a whole. Individual stock prices tend to go up and down more dramatically than those of certain other types of investments, such as bonds. During a general downturn in the financial markets, multiple asset classes may decline in value. When markets perform well, there can be no assurance that specific investments held by the Fund will rise in value. |
| ∎ | Mortgage- and asset-backed securities risk. Mortgage- and asset-backed securities, including collateralized debt obligations and collateralized mortgage obligations, are subject to prepayment or call risk, which is the risk that a borrower’s payments may be received earlier or later than expected due to changes in prepayment rates on underlying loans. This could result in the Fund reinvesting these early payments at lower interest rates, thereby reducing the Fund’s income. Mortgage- and asset-backed securities also are subject to extension risk, which is the risk that an unexpected rise in interest rates could reduce the rate of prepayments, causing the price of the mortgage- and asset-backed securities and the Fund’s share price to fall. An unexpectedly high rate of defaults on the mortgages held by a mortgage pool may adversely affect the value of mortgage-backed |
continued on page 10
9 Invesco World Bond Fund
continued from page 9
| | securities and could result in losses to the Fund. The Fund may invest in mortgage pools that include subprime mortgages, which are loans made to borrowers with weakened credit histories or with lower capacity to make timely payments on their mortgages. Privately issued mortgage-related securities are not subject to the same underwriting requirements as those with government or government-sponsored entity guarantees and, therefore, mortgage loans underlying privately issued mortgage-related securities may have less favorable collateral, credit risk or other underwriting characteristics, and wider variances in interest rate, term, size, purpose and borrower characteristics. |
| ∎ | Non-diversification risk. The Fund is non-diversified and can invest a greater portion of its assets in the obligations or securities of a small number of issuers or any single issuer than a diversified fund can. A change in the value of one or a few issuers’ securities will therefore affect the value of the Fund more than if it was a diversified fund. |
| ∎ | US government obligations risk. Obligations of US government agencies and authorities receive varying levels of support and may not be backed by the full faith and credit of the US government, which could affect the Fund’s ability to recover should they default. No assurance can be given that the US government will provide financial support to its agencies and authorities if it is not obligated by law to do so. |
| ∎ | When-issued, delayed delivery and forward commitment risks. When-issued and delayed delivery transactions subject the Fund to market risk because the value or yield of a security at delivery may be more or less than the purchase price or yield generally available when delivery occurs, and counterparty risk because the Fund relies on the buyer or seller, as the case may be, to consummate the transaction. These transactions also have a leveraging effect on the Fund because the Fund commits to purchase securities that it does not have to pay for until a later date, which increases the Fund’s overall investment exposure and, as a result, its volatility. |
| ∎ | Zero coupon or pay-in-kind securities risk. The value, interest rates, and liquidity of non-cash paying instruments, such as zero coupon and pay-in-kind securities, are subject to greater fluctuation than other types of securities. The higher yields and interest |
| | rates on pay-in-kind securities reflect the payment deferral and increased credit risk associated with such instruments and that such investments may represent a higher credit risk than loans that periodically pay interest. |
About indexes used in this report
| ∎ | The Bloomberg Barclays Global Aggregate Index is an unmanaged index considered representative of global investment grade, fixed-income markets. |
| ∎ | The Lipper Global Income Funds Index is an unmanaged index considered representative of global income funds tracked by Lipper. |
| ∎ | The Bloomberg Barclays Global Aggregate ex-U.S. Index is an unmanaged index considered representative of bonds of foreign countries. |
| ∎ | The Lipper International Income Funds Index is an unmanaged index considered representative of international income funds tracked by Lipper. |
| ∎ | The Fund is not managed to track the performance of any particular index, including the index(es) described here, and consequently, the performance of the Fund may deviate significantly from the performance of the index(es). |
| ∎ | A direct investment cannot be made in an index. Unless otherwise indicated, index results include reinvested dividends, and they do not reflect sales charges. Performance of the peer group, if applicable, reflects fund expenses; performance of a market index does not. |
Other information
| ∎ | The returns shown in management’s discussion of Fund performance are based on net asset values (NAVs) calculated for shareholder transactions. Generally accepted accounting principles require adjustments to be made to the net assets of the Fund at period end for financial reporting purposes, and as such, the NAVs for shareholder transactions and the returns based on those NAVs may differ from the NAVs and returns reported in the Financial Highlights. |
10 Invesco World Bond Fund
Schedule of Investments
October 31, 2017
| | | | | | | | |
| | | Principal
Amount | | | Value | |
Non U.S. Dollar Denominated Bonds & Notes–44.35%(a) | |
| Australia–2.23% | |
Australia Government Bond, Series TB136, REGS, Sr. Unsec. Bonds, 4.75%, 04/21/2027(b) | | AUD | 800,000 | | | $ | 720,989 | |
|
| Austria–1.49% | |
OMV AG, REGS, Jr. Unsec. Sub. Euro Bonds, 6.75%(b)(c) | | EUR | 400,000 | | | | 480,464 | |
|
| Brazil–1.48% | |
Brazil Notas do Tesouro Nacional, Series F, Unsec. Notes, 10.00%, 01/01/2027 | | BRL | 1,500,000 | | | | 478,497 | |
|
| Canada–2.93% | |
City of Ottawa, Unsec. Bonds, 3.10%, 07/27/2048 | | CAD | 500,000 | | | | 373,494 | |
Province of British Columbia, Unsec. Bonds, 2.80%, 06/18/2048 | | CAD | 290,000 | | | | 216,458 | |
Province of Ontario, Unsec. Bonds, 3.45%, 06/02/2045 | | CAD | 430,000 | | | | 356,409 | |
| | | | | | | | 946,361 | |
|
| France–1.68% | |
Orange S.A., REGS, Jr. Unsec. Sub. Euro Notes, 5.88%(b)(c) | | GBP | 200,000 | | | | 297,176 | |
TOTAL S.A., REGS, Jr. Unsec. Sub. Medium-Term Euro Notes, 2.63%(b)(c) | | EUR | 200,000 | | | | 246,222 | |
| | | | | | | | 543,398 | |
|
| Germany–0.59% | |
Volkswagen International Finance N.V., REGS, Jr. Unsec. Gtd. Sub. Euro Bonds, 3.88%(b)(c) | | EUR | 160,000 | | | | 192,041 | |
|
| India–1.46% | |
Province of British Columbia, Sr. Unsec. Bonds, 6.60%, 01/09/2020(b) | | INR | 30,000,000 | | | | 471,586 | |
|
| Indonesia–3.70% | |
Indonesia Treasury Bond, Series FR54, Sr. Unsec. Bonds, 9.50%, 07/15/2031 | | IDR | 6,200,000,000 | | | | 544,511 | |
Series FR72, Sr. Unsec. Bonds, 8.25%, 05/15/2036 | | IDR | 4,300,000,000 | | | | 343,195 | |
Series FR75, Sr. Unsec. Bonds, 7.50%, 05/15/2038 | | IDR | 4,100,000,000 | | | | 308,641 | |
| | | | | | | | 1,196,347 | |
|
| Italy–2.58% | |
Italy Buoni Poliennali del Tesoro, REGS, Sr. Unsec. Euro Bonds, 2.80%, 03/01/2067(b) | | EUR | 800,000 | | | | 834,520 | |
| | | | | | | | |
| | | Principal
Amount | | | Value | |
| Ivory Coast–0.38% | |
Ivory Coast Government International Bond, Sr. Unsec. Bonds, 5.13%, 06/15/2025(b) | | EUR | 100,000 | | | $ | 123,401 | |
|
| Japan–3.28% | |
Japan Government Forty Year Bond, Series 9, Sr. Unsec. Bonds, 0.40%, 03/20/2056 | | JPY | 150,000,000 | | | | 1,059,744 | |
|
| Luxembourg–0.59% | |
SES S.A., REGS, Jr. Unsec. Gtd. Sub. Euro Bonds, 4.63%(b)(c) | | EUR | 150,000 | | | | 189,478 | |
|
| Mexico–1.35% | |
Petróleos Mexicanos, REGS, Sr. Unsec. Gtd. Medium-Term Euro Notes, 2.75%, 04/21/2027(b) | | EUR | 400,000 | | | | 438,075 | |
|
| Netherlands–3.27% | |
Achmea B.V., Series 1, Jr. Unsec. Sub. Medium-Term Euro Notes, 6.00%(c) | | EUR | 500,000 | | | | 616,334 | |
Coöperatieve Rabobank U.A., REGS, Jr. Unsec. Sub. Euro
Bonds, 5.50%(b)(c) | | EUR | 200,000 | | | | 256,132 | |
IPD 3 B.V., Sr. Sec. Gtd. Notes, 4.50%, 07/15/2022(b) | | EUR | 150,000 | | | | 184,433 | |
| | | | | | | | 1,056,899 | |
|
| Peru–0.74% | |
Peru Government Bond, REGS, Sr. Unsec. Bonds, 6.15%, 08/12/2032(b) | | PEN | 737,000 | | | | 238,187 | |
|
| Russia–1.15% | |
Russian Federal Bond — OFZ, Series 6218, Unsec. Bonds, 8.50%, 09/17/2031 | | RUB | 20,000,000 | | | | 370,928 | |
|
| Spain–2.44% | |
Spain Government Bond, REGS, Sr. Unsec. Euro Bonds, 3.45%, 07/30/2066(b) | | EUR | 615,000 | | | | 788,741 | |
|
| Switzerland–0.84% | |
UBS Group AG, REGS, Jr. Unsec. Sub. Euro Bonds, 5.75%(b)(c) | | EUR | 200,000 | | | | 271,494 | |
|
| United Kingdom–7.27% | |
Boparan Finance PLC, REGS, Sr. Sec. Gtd. First Lien Euro Notes, 5.50%, 07/15/2021(b) | | GBP | 200,000 | | | | 252,734 | |
Coventry Building Society (The), REGS, Jr. Unsec. Sub. Euro Bonds, 6.38%(b)(c) | | GBP | 280,000 | | | | 390,172 | |
Direct Line Insurance Group PLC, REGS, Unsec. Gtd. Sub. Euro Notes, 9.25%, 04/27/2042(b) | | GBP | 280,000 | | | | 478,433 | |
See accompanying Notes to Financial Statements which are an integral part of the financial statements.
11 Invesco World Bond Fund
| | | | | | | | |
| | | Principal
Amount | | | Value | |
| United Kingdom–(continued) | |
Nationwide Building Society, REGS, Jr. Unsec. Sub. Medium-Term Euro Notes, 6.88%(b)(c) | | GBP | 200,000 | | | $ | 281,295 | |
NGG Finance PLC, REGS, Unsec. Gtd. Sub. Euro Notes, 5.63%, 06/18/2073(b) | | GBP | 250,000 | | | | 379,399 | |
Scottish Widows Ltd., REGS, Unsec. Sub. Euro Notes, 5.50%, 06/16/2023(b) | | GBP | 150,000 | | | | 225,376 | |
United Kingdom Gilt, REGS, Unsec. Bonds, 3.50%, 07/22/2068(b) | | GBP | 160,000 | | | | 343,054 | |
| | | | | | | | 2,350,463 | |
|
| United States–4.90% | |
Apple Inc., REGS, Sr. Unsec. Medium-Term Notes, 3.70%, 08/28/2022(b) | | AUD | 1,100,000 | | | | 873,987 | |
Goldman Sachs Group, Inc. (The), REGS, Sr. Unsec. Medium-Term DIP Notes, 5.00%, 08/08/2018(b) | | AUD | 600,000 | | | | 468,946 | |
Verizon Communications Inc., Sr. Unsec. Euro Bonds, 2.88%, 01/15/2038 | | EUR | 200,000 | | | | 240,397 | |
| | | | | | | | 1,583,330 | |
Total Non U.S. Dollar Denominated Bonds & Notes (Cost $13,773,649) | | | | 14,334,943 | |
|
U.S. Dollar Denominated Bonds & Notes–28.65% | |
| Bahrain–2.00% | |
Bahrain Government International Bond, Sr. Unsec. Notes, 6.75%, 09/20/2029(b) | | $ | 200,000 | | | | 199,424 | |
Oil and Gas Holding Co. B.S.C.C. (The), Sr. Unsec. Notes, 7.50%, 10/25/2027(b) | | | 429,000 | | | | 446,169 | |
| | | | | | | | 645,593 | |
|
| Brazil–2.73% | |
Braskem Netherlands Finance B.V., Sr. Unsec. Gtd. Notes, 4.50%, 01/10/2028(b) | | | 398,000 | | | | 396,269 | |
Petrobras Global Finance B.V. | | | | | | | | |
Sr. Unsec. Gtd. Global Notes, | | | | | | | | |
7.38%, 01/17/2027 | | | 110,000 | | | | 122,320 | |
8.75%, 05/23/2026 | | | 300,000 | | | | 364,125 | |
| | | | | | | | 882,714 | |
|
| Cayman Islands–0.57% | |
SPARC EM SPC Panama Metro Line 2 S.P., Gtd. Sr. Sec. Notes, 0.00%, 12/05/2022(b)(d) | | | 200,000 | | | | 183,000 | |
|
| Colombia–0.63% | |
Avianca Holdings S.A./ Avianca Leasing LLC/ Grupo Taca Holdings, REGS, Sr. Unsec. Gtd. Euro Notes, 8.38%, 05/10/2020(b) | | | 200,000 | | | | 204,620 | |
| | | | | | | | |
| | | Principal
Amount | | | Value | |
| Ecuador–0.67% | |
Ecuador Government International Bond, Sr. Unsec. Notes, 9.63%, 06/02/2027(b) | | $ | 200,000 | | | $ | 215,500 | |
|
| Ireland–0.90% | |
AerCap Global Aviation Trust, Jr. Unsec. Gtd. Sub. Notes, 6.50%, 06/15/2045(b) | | | 267,000 | | | | 292,365 | |
|
| Ivory Coast–0.59% | |
Ivory Coast Government International Bond, REGS, Sr. Unsec. Euro Bonds, 5.75%, 12/31/2032(b)(e) | | | 193,000 | | | | 190,817 | |
|
| Mexico–2.14% | |
Mexico City Airport Trust, Sr. Sec. Notes, 4.25%, 10/31/2026(b) | | | 219,000 | | | | 224,749 | |
Petróleos Mexicanos, Sr. Unsec. Gtd. Notes, 6.50%, 03/13/2027(b) | | | 233,000 | | | | 254,587 | |
SixSigma Networks México, S.A. de C.V., REGS, Sr. Unsec. Gtd. Euro Notes, 8.25%, 11/07/2021(b) | | | 200,000 | | | | 211,500 | |
| | | | | | | | 690,836 | |
|
| Netherlands–1.02% | |
ING Groep N.V., Jr. Unsec. Sub. Global Notes, 6.50%(c) | | | 300,000 | | | | 330,030 | |
|
| Oman–0.92% | |
Oman Government International Bond, Sr. Unsec. Notes, 6.50%, 03/08/2047(b) | | | 288,000 | | | | 297,186 | |
|
| Turkey–4.42% | |
Finansbank A.S., Sr. Unsec. Notes, 4.88%, 05/19/2022(b) | | | 515,000 | | | | 509,484 | |
Turkiye Garanti Bankasi A.S., Unsec. Sub. Notes, 6.13%, 05/24/2027(b) | | | 200,000 | | | | 198,100 | |
Turkiye Is Bankasi A.S., Sr. Unsec. Notes, 6.13%, 04/25/2024(b) | | | 380,000 | | | | 379,736 | |
Yapi ve Kredi Bankasi A.S., Sr. Unsec. Notes, 5.85%, 06/21/2024(b) | | | 345,000 | | | | 341,021 | |
| | | | | | | | 1,428,341 | |
|
| Ukraine–1.42% | |
Ukraine Government International Bond, | | | | | | | | |
Sr. Unsec. Notes,
7.38%, 09/25/2032(b) | | | 251,000 | | | | 247,949 | |
REGS, Sr. Unsec. Euro Notes,
7.75%, 09/01/2024(b) | | | 200,000 | | | | 210,070 | |
| | | | | | | | 458,019 | |
See accompanying Notes to Financial Statements which are an integral part of the financial statements.
12 Invesco World Bond Fund
| | | | | | | | |
| | | Principal
Amount | | | Value | |
| United Arab Emirates–0.79% | |
Abu Dhabi Crude Oil Pipeline LLC, Sr. Sec. Bonds, 4.60%, 11/02/2047(b) | | $ | 250,000 | | | $ | 255,852 | |
|
| United States–8.21% | |
Cantor Fitzgerald, L.P., Unsec. Notes, 6.50%, 06/17/2022(b) | | | 246,000 | | | | 275,621 | |
DISH DBS Corp., Sr. Unsec. Gtd. Global Notes, 5.88%, 11/15/2024 | | | 300,000 | | | | 301,500 | |
Enterprise Products Operating LLC, Series E, Jr. Unsec. Sub. Gtd. Deb., 5.25%, 08/16/2077 | | | 215,000 | | | | 221,450 | |
NGPL PipeCo. LLC, | | | | | | | | |
Sr. Unsec. Bonds, | | | | | | | | |
4.88%, 08/15/2027(b) | | | 56,000 | | | | 58,100 | |
Sr. Unsec. Notes, | | | | | | | | |
4.38%, 08/15/2022(b) | | | 56,000 | | | | 57,750 | |
Plains All American Pipeline, L.P., Series B, Jr. Unsec. Sub. Notes, 6.13%(c) | | | 355,000 | | | | 362,739 | |
Southern Co. (The), Series B, Jr. Unsec. Sub. Global Notes, 5.50%, 03/15/2057 | | | 197,000 | | | | 209,744 | |
SunCoke Energy Partners, L.P./ SunCoke Energy Partners Finance Corp., Sr. Unsec. Gtd. Notes, 7.50%, 06/15/2025(b) | | | 300,000 | | | | 316,500 | |
United States Steel Corp., Sr. Unsec. Global Notes, 6.88%, 08/15/2025 | | | 357,000 | | | | 363,917 | |
VEREIT Operating Partnership, L.P., Sr. Unsec. Gtd. Global Notes, 3.95%, 08/15/2027 | | | 150,000 | | | | 150,086 | |
Wells Fargo & Co., Series U, Jr. Unsec. Sub. Global Notes, 5.88%(c) | | | 300,000 | | | | 335,775 | |
| | | | | | | | 2,653,182 | |
|
| Zambia–1.64% | |
First Quantum Minerals Ltd., | | | | | | | | |
Sr. Unsec. Gtd. Notes, | | | | | | | | |
7.25%, 04/01/2023(b) | | | 200,000 | | | | 212,500 | |
7.50%, 04/01/2025(b) | | | 300,000 | | | | 318,750 | |
| | | | | | | | 531,250 | |
Total U.S. Dollar Denominated Bonds & Notes
(Cost $8,869,943) | | | | 9,259,305 | |
| | | | | | | | |
| | | Principal
Amount | | | Value | |
U.S. Treasury Securities–18.26% | |
| U.S. Treasury Inflation — Indexed Notes–6.24% | |
0.13%, 04/15/2022 | | $ | 2,018,920 | (f) | | $ | 2,015,802 | |
|
| U.S. Treasury Notes–12.02% | |
2.00%, 11/15/2026 | | | 4,000,000 | | | | 3,885,234 | |
Total U.S. Treasury Securities
(Cost $5,883,778) | | | | | | | 5,901,036 | |
|
U.S. Government Sponsored Agency Mortgage-Backed Securities–0.31% | |
| United States–0.31% | |
Freddie Mac Multifamily Securitization, Series K038, Class X1, Variable Rate Pass Through Ctfs., 1.18%, 03/25/2024 (Cost $101,237)(g) | | | 1,651,469 | | | | 100,389 | |
| | |
| | | Shares | | | | |
|
Money Market Funds–2.14% | |
Invesco Government & Agency Portfolio–Institutional Class, 0.95%(h) | | | 415,757 | | | | 415,757 | |
Invesco Treasury Portfolio–Institutional Class, 0.94%(h) | | | 277,172 | | | | 277,172 | |
Total Money Market Funds
(Cost $692,929) | | | | | | | 692,929 | |
|
Options Purchased–0.19% | |
(Cost $63,877)(i) | | | 4,650,000 | | | | 62,372 | |
TOTAL INVESTMENTS IN SECURITIES–93.90%
(Cost $29,385,413) | | | | 30,350,974 | |
OTHER ASSETS LESS LIABILITIES–6.10% | | | | 1,971,718 | |
NET ASSETS–100.00% | | | $ | 32,322,692 | |
Investment Abbreviations:
| | |
| AUD | | – Australian Dollar |
| BRL | | – Brazilian Real |
| CAD | | – Canadian Dollar |
| Ctfs. | | – Certificates |
| Deb. | | – Debentures |
| DIP | | – Debtor-in-possession |
| EUR | | – Euro |
| GBP | | – British Pound Sterling |
| Gtd. | | – Guaranteed |
| IDR | | – Indonesian Rupiah |
| | |
| INR | | – Indian Rupee |
| JPY | | – Japanese Yen |
| Jr. | | – Junior |
| PEN | | – Peruvian Sol |
| REGS | | – Regulation S |
| RUB | | – Russian Ruble |
| Sec. | | – Secured |
| Sr. | | – Senior |
| Sub. | | – Subordinated |
| Unsec. | | – Unsecured |
See accompanying Notes to Financial Statements which are an integral part of the financial statements.
13 Invesco World Bond Fund
Notes to Schedule of Investments:
| (a) | Foreign denominated security. Principal amount is denominated in the currency indicated. |
| (b) | Security purchased or received in a transaction exempt from registration under the Securities Act of 1933, as amended (the “1933 Act”). The security may be resold pursuant to an exemption from registration under the 1933 Act, typically to qualified institutional buyers. The aggregate value of these securities at October 31, 2017 was $15,923,954, which represented 49.27% of the Fund’s Net Assets. |
| (c) | Perpetual bond with no specified maturity date. |
| (d) | Zero coupon bond issued at a discount. |
| (e) | Step coupon bond. Rate shown is the rate in effect on October 31, 2017. |
| (f) | Principal amount of security and interest payments are adjusted for inflation. See Note 1I. |
| (g) | Interest rate is redetermined periodically based on the cash flows generated by the pool of assets backing the security, less any applicable fees. The rate shown is the rate in effect October 31, 2017. |
| (h) | The money market fund and the Fund are affiliated by having the same investment adviser. The rate shown is the 7-day SEC standardized yield as of October 31, 2017. |
| (i) | The table below details options purchased. See Note 1M and 1N: |
| | | | | | | | | | | | | | | | | | | | | | | | |
| Open Over-The-Counter Foreign Currency Options Purchased | |
| Description | | Type of
Contract | | | Counterparty | | | Expiration
Date | | | Exercise
Price | | | Notional
Value | | | Value | |
USD versus NOK | | | Call | | | | Barclays Bank PLC | | | | 12/13/2017 | | | NOK | 8.10 | | | USD | 650,000 | | | $ | 9,619 | |
| | | | | | | | | | | | | | | | | | | | | | | | |
AUD versus JPY | | | Put | | | | Goldman Sachs International | | | | 11/06/2017 | | | JPY | 86.00 | | | AUD | 1,000,000 | | | | 617 | |
EUR versus USD | | | Put | | | | Barclays Bank PLC | | | | 03/01/2018 | | | USD | 1.14 | | | EUR | 500,000 | | | | 3,099 | |
USD versus MXN | | | Put | | | | Citibank, N.A. | | | | 07/17/2018 | | | MXN | 22.00 | | | USD | 1,000,000 | | | | 15,183 | |
Subtotal — Put | | | | | | | | | | | | | | | | | | | | | | | 18,899 | |
Subtotal Foreign Currency Options Purchased — Currency Risk | | | | | | | | | | | $ | 28,518 | |
| | | | | | | | | | | | | | | | | | | | | | | | | | | | | | | | |
| | | Open Over-The-Counter Interest Rate Swaptions Purchased — Interest Rate Risk | |
| Description | | Type of
Contract | | | Counterparty | | Exercise
Rate | | | Pay/
Receive
Exercise
Rate | | Floating
Rate Index | | | Payment
Frequency | | | Expiration
Date | | | Notional
Value | | | Value | |
10 Year Interest Rate Swap | | | Put | | | Morgan Stanley & Co. International PLC | | | 2.25 | % | | Pay | | | 3 month USD LIBOR | | | | Quarterly | | | | 03/26/2018 | | | $ | 1,500,000 | | | $ | 33,854 | |
Total Options Purchased (Cost $63,877) | | | | | | | $ | 62,372 | |
| | | | | | | | | | | | | | | | | | | | | | | | | | | | | | |
| Open Over-The-Counter Foreign Currency Options Written — Currency Risk | |
| Description | | Type of
Contract | | | Counterparty | | Expiration
Date | | | Exercise
Price | | | Premiums
Received | | | Notional Value | | | Value | | | Unrealized Appreciation | |
MXN versus USD | | | Call | | | Citibank, N.A. | | | 07/17/2018 | | | | MXN 22.00 | | | $ | (22,595 | ) | | | USD 1,000,000 | | | $ | (22,032 | ) | | $ | 563 | |
| | | | | | | | | | | | | | | | | | | | |
| Open Futures Contracts(a) | |
| Short Futures Contracts | | Number of
Contracts | | | Expiration
Month | | | Notional
Value | | | Value | | | Unrealized
Appreciation
(Depreciation) | |
Euro-BTP | | | 5 | | | | December-2017 | | | $ | (813,042 | ) | | $ | (17,273 | ) | | $ | (17,273 | ) |
Euro-Buxl 30 Year Bonds | | | 2 | | | | December-2017 | | | | (387,026 | ) | | | (7,522 | ) | | | (7,522 | ) |
U.S. Treasury 10 Year Treasury Notes | | | 31 | | | | December-2017 | | | | (3,873,063 | ) | | | (8,480 | ) | | | (8,480 | ) |
U.S. Treasury Ultra Bonds | | | 3 | | | | December-2017 | | | | (494,344 | ) | | | (7,976 | ) | | | (7,976 | ) |
Total Futures Contracts — Interest Rate Risk | | | | | | | | | | | | | | $ | (41,251 | ) | | $ | (41,251 | ) |
| (a) | Futures contracts collateralized by $68,759 cash held with Bank of America Merrill Lynch, the futures commission merchant. |
See accompanying Notes to Financial Statements which are an integral part of the financial statements.
14 Invesco World Bond Fund
| | | | | | | | | | | | | | | | | | | | | | |
| Open Forward Foreign Currency Contracts | |
| | | | | Contract to | | | Unrealized
Appreciation
(Depreciation) | |
Settlement
Date | | Counterparty | | Deliver | | | Receive | | |
11/03/2017 | | Morgan Stanley & Co. LLC | | | BRL | | | | 1,600,000 | | | | USD | | | | 505,529 | | | $ | 16,622 | |
11/30/2017 | | Barclays Bank PLC | | | AUD | | | | 2,580,000 | | | | USD | | | | 2,039,780 | | | | 65,842 | |
11/30/2017 | | Barclays Bank PLC | | | CNY | | | | 2,100,000 | | | | USD | | | | 319,431 | | | | 3,494 | |
11/30/2017 | | Barclays Bank PLC | | | HUF | | | | 250,000,000 | | | | USD | | | | 959.097 | | | | 22,434 | |
11/30/2017 | | Barclays Bank PLC | | | JPY | | | | 40,000,000 | | | | USD | | | | 355,032 | | | | 2,751 | |
11/30/2017 | | Barclays Bank PLC | | | MXN | | | | 6,000,000 | | | | USD | | | | 330,996 | | | | 19,742 | |
11/30/2017 | | Barclays Bank PLC | | | RUB | | | | 20,000,000 | | | | USD | | | | 343,820 | | | | 3,528 | |
11/30/2017 | | Barclays Bank PLC | | | SEK | | | | 12,000,000 | | | | USD | | | | 1,472,070 | | | | 36,015 | |
11/30/2017 | | Barclays Bank PLC | | | TRY | | | | 4,400,000 | | | | USD | | | | 1,207,938 | | | | 58,375 | |
11/30/2017 | | Barclays Bank PLC | | | USD | | | | 366,850 | | | | RUB | | | | 22,000,000 | | | | 7,471 | |
11/30/2017 | | Barclays Bank PLC | | | ZAR | | | | 2,300,000 | | | | USD | | | | 171,067 | | | | 9,272 | |
11/30/2017 | | Citigroup Global Markets Inc. | | | CAD | | | | 1,400,000 | | | | USD | | | | 1,115,937 | | | | 30,439 | |
11/30/2017 | | Citigroup Global Markets Inc. | | | PLN | | | | 3,300,000 | | | | USD | | | | 908,140 | | | | 1,470 | |
11/30/2017 | | Citigroup Global Markets Inc. | | | RUB | | | | 60,000,000 | | | | USD | | | | 1,035,912 | | | | 15,036 | |
11/30/2017 | | Citigroup Global Markets Inc. | | | USD | | | | 398,307 | | | | GBP | | | | 300,000 | | | | 546 | |
11/30/2017 | | Citigroup Global Markets Inc. | | | USD | | | | 457,596 | | | | INR | | | | 30,000,000 | | | | 4,707 | |
11/30/2017 | | Citigroup Global Markets Inc. | | | USD | | | | 441,813 | | | | KRW | | | | 500,000,000 | | | | 5,540 | |
11/30/2017 | | Citigroup Global Markets Inc. | | | ZAR | | | | 18,450,000 | | | | USD | | | | 1,374,297 | | | | 76,418 | |
11/30/2017 | | Deutsche Bank Securities Inc. | | | AUD | | | | 500,000 | | | | USD | | | | 394,388 | | | | 11,842 | |
11/30/2017 | | Deutsche Bank Securities Inc. | | | HUF | | | | 90,000,000 | | | | USD | | | | 347,469 | | | | 10,270 | |
11/30/2017 | | Goldman Sachs International | | | AUD | | | | 400,000 | | | | USD | | | | 311,819 | | | | 5,782 | |
11/30/2017 | | Goldman Sachs International | | | CHF | | | | 770,000 | | | | USD | | | | 782,120 | | | | 8,706 | |
11/30/2017 | | Goldman Sachs International | | | CLP | | | | 300,000,000 | | | | USD | | | | 472,813 | | | | 770 | |
11/30/2017 | | Goldman Sachs International | | | CNY | | | | 3,200,000 | | | | USD | | | | 489,867 | | | | 8,440 | |
11/30/2017 | | Goldman Sachs International | | | COP | | | | 1,000,000,000 | | | | USD | | | | 329,489 | | | | 1,683 | |
11/30/2017 | | Goldman Sachs International | | | HUF | | | | 90,000,000 | | | | USD | | | | 347,966 | | | | 10,767 | |
11/30/2017 | | Goldman Sachs International | | | JPY | | | | 90,000,000 | | | | USD | | | | 811,277 | | | | 18,647 | |
11/30/2017 | | Goldman Sachs International | | | MXN | | | | 18,000,000 | | | | USD | | | | 960,498 | | | | 26,738 | |
11/30/2017 | | Goldman Sachs International | | | TRY | | | | 6,600,000 | | | | USD | | | | 1,785,594 | | | | 61,249 | |
11/30/2017 | | Goldman Sachs International | | | USD | | | | 902,618 | | | | CZK | | | | 20,000,000 | | | | 6,672 | |
11/30/2017 | | Goldman Sachs International | | | USD | | | | 333,209 | | | | RUB | | | | 20,000,000 | | | | 7,082 | |
11/30/2017 | | Goldman Sachs International | | | USD | | | | 323,031 | | | | ZAR | | | | 4,600,000 | | | | 559 | |
11/30/2017 | | Goldman Sachs International | | | ZAR | | | | 14,200,000 | | | | USD | | | | 1,041,395 | | | | 42,485 | |
11/30/2017 | | Merrill Lynch International | | | CLP | | | | 430,000,000 | | | | USD | | | | 691,986 | | | | 15,391 | |
11/30/2017 | | Merrill Lynch International | | | CNY | | | | 2,500,000 | | | | USD | | | | 377,725 | | | | 1,610 | |
11/30/2017 | | Merrill Lynch International | | | HUF | | | | 170,000,000 | | | | USD | | | | 644,477 | | | | 7,546 | |
11/30/2017 | | Merrill Lynch International | | | INR | | | | 55,000,000 | | | | USD | | | | 849,027 | | | | 1,472 | |
11/30/2017 | | Merrill Lynch International | | | USD | | | | 663,990 | | | | CLP | | | | 430,000,000 | | | | 12,605 | |
11/30/2017 | | Merrill Lynch International | | | USD | | | | 455,650 | | | | INR | | | | 30,000,000 | | | | 6,653 | |
11/30/2017 | | Morgan Stanley & Co. LLC | | | COP | | | | 1,000,000,000 | | | | USD | | | | 330,306 | | | | 2,500 | |
11/30/2017 | | Morgan Stanley & Co. LLC | | | IDR | | | | 11,100,000,000 | | | | USD | | | | 816,948 | | | | 1,620 | |
11/30/2017 | | Morgan Stanley & Co. LLC | | | MXN | | | | 6,000,000 | | | | USD | | | | 330,215 | | | | 18,961 | |
11/30/2017 | | Morgan Stanley & Co. LLC | | | PLN | | | | 2,500,000 | | | | USD | | | | 693,597 | | | | 6,725 | |
12/01/2017 | | Merrill Lynch International | | | PHP | | | | 55,000,000 | | | | USD | | | | 1,071,992 | | | | 11,256 | |
12/04/2017 | | Merrill Lynch International | | | BRL | | | | 1,200,000 | | | | USD | | | | 375,469 | | | | 10,274 | |
12/04/2017 | | Morgan Stanley & Co. LLC | | | BRL | | | | 2,100,000 | | | | USD | | | | 644,103 | | | | 5,011 | |
12/22/2017 | | Goldman Sachs International | | | USD | | | | 1,270,850 | | | | TWD | | | | 40,000,000 | | | | 60,036 | |
Subtotal — Appreciation | | | | 763,054 | |
See accompanying Notes to Financial Statements which are an integral part of the financial statements.
15 Invesco World Bond Fund
| | | | | | | | | | | | | | | | | | | | | | |
| Open Forward Foreign Currency Contracts—(continued) | |
| | | | | Contract to | | | Unrealized
Appreciation
(Depreciation) | |
Settlement
Date | | Counterparty | | Deliver | | | Receive | | |
11/03/2017 | | Morgan Stanley & Co. LLC | | | USD | | | | 493,961 | | | | BRL | | | | 1,600,000 | | | $ | (5,054 | ) |
11/30/2017 | | Barclays Bank PLC | | | TWD | | | | 40,000,000 | | | | USD | | | | 1,326,260 | | | | (2,842 | ) |
11/30/2017 | | Barclays Bank PLC | | | USD | | | | 1,316,106 | | | | CLP | | | | 830,000,000 | | | | (10,119 | ) |
11/30/2017 | | Barclays Bank PLC | | | USD | | | | 382,611 | | | | HUF | | | | 100,000,000 | | | | (7,946 | ) |
11/30/2017 | | Barclays Bank PLC | | | USD | | | | 731,495 | | | | JPY | | | | 80,000,000 | | | | (26,934 | ) |
11/30/2017 | | Barclays Bank PLC | | | USD | | | | 753,534 | | | | RUB | | | | 43,500,000 | | | | (13,400 | ) |
11/30/2017 | | Barclays Bank PLC | | | USD | | | | 2,148,653 | | | | TRY | | | | 7,700,000 | | | | (136,918 | ) |
11/30/2017 | | Barclays Bank PLC | | | USD | | | | 1,346,121 | | | | TWD | | | | 40,000,000 | | | | (17,019 | ) |
11/30/2017 | | Barclays Bank PLC | | | USD | | | | 935,612 | | | | ZAR | | | | 12,800,000 | | | | (35,186 | ) |
11/30/2017 | | Citigroup Global Markets Inc. | | | GBP | | | | 1,080,000 | | | | USD | | | | 1,397,802 | | | | (38,067 | ) |
11/30/2017 | | Citigroup Global Markets Inc. | | | INR | | | | 35,000,000 | | | | USD | | | | 529,982 | | | | (9,372 | ) |
11/30/2017 | | Citigroup Global Markets Inc. | | | KRW | | | | 100,000,000 | | | | USD | | | | 88,468 | | | | (1,002 | ) |
11/30/2017 | | Citigroup Global Markets Inc. | | | USD | | | | 1,010,468 | | | | CAD | | | | 1,250,000 | | | | (41,273 | ) |
11/30/2017 | | Citigroup Global Markets Inc. | | | USD | | | | 912,825 | | | | PLN | | | | 3,300,000 | | | | (6,155 | ) |
11/30/2017 | | Citigroup Global Markets Inc. | | | USD | | | | 342,700 | | | | RUB | | | | 20,000,000 | | | | (2,409 | ) |
11/30/2017 | | Citigroup Global Markets Inc. | | | USD | | | | 889,158 | | | | ZAR | | | | 12,000,000 | | | | (45,009 | ) |
11/30/2017 | | Deutsche Bank Securities Inc. | | | USD | | | | 493,902 | | | | HUF | | | | 130,000,000 | | | | (6,838 | ) |
11/30/2017 | | Deutsche Bank Securities Inc. | | | USD | | | | 638,191 | | | | EUR | | | | 539,959 | | | | (8,176 | ) |
11/30/2017 | | Goldman Sachs International | | | CZK | | | | 10,000,000 | | | | USD | | | | 453,968 | | | | (677 | ) |
11/30/2017 | | Goldman Sachs International | | | MXN | | | | 8,000,000 | | | | USD | | | | 413,781 | | | | (1,223 | ) |
11/30/2017 | | Goldman Sachs International | | | TRY | | | | 1,200,000 | | | | USD | | | | 310,691 | | | | (2,826 | ) |
11/30/2017 | | Goldman Sachs International | | | USD | | | | 1,182,320 | | | | CNY | | | | 7,800,000 | | | | (8,840 | ) |
11/30/2017 | | Goldman Sachs International | | | USD | | | | 340,026 | | | | COP | | | | 1,000,000,000 | | | | (12,220 | ) |
11/30/2017 | | Goldman Sachs International | | | USD | | | | 602,085 | | | | EUR | | | | 500,000 | | | | (18,694 | ) |
11/30/2017 | | Goldman Sachs International | | | USD | | | | 327,467 | | | | HUF | | | | 85,000,000 | | | | (9,002 | ) |
11/30/2017 | | Goldman Sachs International | | | USD | | | | 4,765,913 | | | | JPY | | | | 519,611,320 | | | | (189,695 | ) |
11/30/2017 | | Goldman Sachs International | | | USD | | | | 1,308,702 | | | | MXN | | | | 24,000,000 | | | | (63,688 | ) |
11/30/2017 | | Goldman Sachs International | | | USD | | | | 1,489,937 | | | | SEK | | | | 12,000,000 | | | | (53,882 | ) |
11/30/2017 | | Goldman Sachs International | | | USD | | | | 572,041 | | | | TRY | | | | 2,100,000 | | | | (23,386 | ) |
11/30/2017 | | Morgan Stanley & Co. LLC | | | IDR | | | | 2,300,000,000 | | | | USD | | | | 168,560 | | | | (382 | ) |
11/30/2017 | | Morgan Stanley & Co. LLC | | | USD | | | | 341,297 | | | | COP | | | | 1,000,000,000 | | | | (13,491 | ) |
11/30/2017 | | Morgan Stanley & Co. LLC | | | USD | | | | 334,760 | | | | MXN | | | | 6,000,000 | | | | (23,506 | ) |
11/30/2017 | | Morgan Stanley & Co. LLC | | | USD | | | | 700944 | | | | PLN | | | | 2,500,000 | | | | (14,072 | ) |
11/30/2017 | | Morgan Stanley & Co. LLC | | | USD | | | | 172,741 | | | | RUB | | | | 10,000,000 | | | | (2,596 | ) |
12/04/2017 | | Morgan Stanley & Co. LLC | | | USD | | | | 304,739 | | | | BRL | | | | 1,000,000 | | | | (409 | ) |
12/22/2017 | | Goldman Sachs International | | | TWD | | | | 40,000,000 | | | | USD | | | | 1,242,236 | | | | (88,650 | ) |
Subtotal — Depreciation | | | | (940,958 | ) |
Total Open Forward Foreign Currency Contracts — Currency Risk | | | $ | (177,904 | ) |
See accompanying Notes to Financial Statements which are an integral part of the financial statements.
16 Invesco World Bond Fund
| | | | | | | | | | | | | | | | | | | | | | | | | | | | | | | | | | | | | | |
| Open Over-The-Counter Credit Default Swap Agreements | |
| Counterparty | | Reference Entity | | Buy/Sell
Protection | | | (Pay)/
Receive
Fixed Rate | | | Payment
Frequency | | | Maturity
Date | | | Implied
Credit
Spread(a) | | | Notional
Value | | | Upfront
Payments
Paid | | | Value | | | Unrealized
Appreciation | |
Barclays Bank PLC | | Republic of Turkey | | | Buy | | | | 1.00 | % | | | Quarterly | | | | 12/20/2022 | | | | 1.84 | % | | $ | (2,000,000 | ) | | $ | 76,685 | | | $ | 79,236 | | | $ | 2,551 | |
Goldman Sachs International | | Republic of South Africa | | | Buy | | | | 1.00 | % | | | Quarterly | | | | 12/20/2022 | | | | 1.83 | | | | (2,400,000 | ) | | | 82,881 | | | | 94,393 | | | | 11,512 | |
Total Over-The-Counter Credit Default Swap Agreements — Credit Risk | | | $ | 159,566 | | | $ | 173,629 | | | $ | 14,063 | |
| (a) | Implied credit spreads represent the current level, as of October 31, 2017, at which protection could be bought or sold given the terms of the existing credit default swap agreement and serve as an indicator of the current status of the payment/performance risk of the credit default swap agreement. An implied credit spread that has widened or increased since entry into the initial agreement may indicate a deteriorating credit profile and increased risk of default for the reference entity. A declining or narrowing spread may indicate an improving credit profile or decreased risk of default for the reference entity. Alternatively, credit spreads may increase or decrease reflecting the general tolerance for risk in the credit markets generally. |
| | | | | | | | | | | | | | | | | | | | | | | | | | | | | | | | |
| Open Centrally Cleared Interest Rate Swap Agreements(a) | |
Pay/
Receive
Floating
Rate | | Floating Rate Index | | Payment
Frequency | | (Pay)/
Receive
Fixed Rate | | | Payment
Frequency | | | Maturity
Date | | | Notional
Value | | | Upfront
Payments
Paid
(Received) | | | Value | | | Unrealized
Appreciation
(Depreciation)(b) | |
Pay | | Overnight Brazil DI Rate | | Daily | | | 8.51 | % | | | Daily | | | | 01/02/2018 | | | BRL | 27,000,000 | | | $ | — | | | $ | 15,864 | | | $ | 15,864 | |
Pay | | 3 Month CBA | | Quarterly | | | 1.92 | | | | Semi-Annually | | | | 09/27/2019 | | | CAD | 7,500,000 | | | | — | | | | 17,196 | | | | 17,196 | |
Pay | | 3 Month USD LIBOR | | Quarterly | | | 2.49 | | | | Semi-Annually | | | | 03/28/2028 | | | USD | 142,000 | | | | — | | | | 1,143 | | | | 1,143 | |
Subtotal — Appreciation | | | | | | | | | | | | | | | | | | | | | | | 34,203 | | | | 34,203 | |
Receive | | Overnight Brazil DI Rate | | Daily | | | 8.38 | | | | Daily | | | | 01/02/2019 | | | BRL | (8,000,000) | | | | — | | | | (27,032) | | | | (27,032) | |
Pay | | 28-Day MXN TIIE | | Monthly | | | 6.72 | | | | Monthly | | | | 06/23/2022 | | | MXN | 50,000,000 | | | | — | | | | (52,895) | | | | (52,895) | |
Receive | | 3 Month CBA | | Quarterly | | | 2.39 | | | | Semi-Annually | | | | 09/27/2027 | | | CAD | (1,400,000) | | | | — | | | | (9,139) | | | | (9,139) | |
Pay | | 3 Month USD LIBOR | | Quarterly | | | 2.25 | | | | Semi-Annually | | | | 03/28/2028 | | | USD | 750,000 | | | | — | | | | (10,373) | | | | (10,373) | |
Pay | | 3 Month USD LIBOR | | Quarterly | | | 2.37 | | | | Semi-Annually | | | | 03/28/2028 | | | USD | 150,000 | | | | — | | | | (364) | | | | (364) | |
Receive | | 6 Month BUBOR | | Semi-Annually | | | 2.42 | | | | Semi-Annually | | | | 08/21/2027 | | | HUF | (280,000,000) | | | | — | | | | (38,497) | | | | (38,497) | |
Subtotal — Depreciation | | | | | | | | | | | | | | | | | | | | | | | (138,300) | | | | (138,300) | |
Total Centrally Cleared Interest Rate Swap Agreements—Interest Rate Risk | | | $ | — | | | $ | (104,097) | | | $ | (104,097) | |
| (a) | Centrally Cleared swap agreements collateralized by $137,000 cash held with Credit Suisse, the swaps commission merchant. |
| (b) | The daily variation margin receivable (payable) at period-end is recorded in the Statement of Assets and Liabilities. |
Abbreviations:
| | |
| AUD | | – Australian Dollar |
| BRL | | – Brazilian Real |
| BUBOR | | – Budapest Interbank Offered Rate |
| CAD | | – Canadian Dollar |
| CBA | | – Canadian Bankers Acceptances |
| CHF | | – Swiss Franc |
| CLP | | – Chilean Peso |
| CNY | | – Chinese Yuan |
| COP | | – Colombian Peso |
| CZK | | – Czech Koruna |
| DI | | – Interbank Deposit |
| EUR | | – Euro |
| GBP | | – British Pound Sterling |
| HUF | | – Hungarian Forint |
| IDR | | – Indonesian Rupiah |
| | |
| INR | | – Indian Rupee |
| JPY | | – Japanese Yen |
| KRW | | – South Korean Won |
| LIBOR | | – London Interbank Offered Rate |
| MXN | | – Mexican Peso |
| NOK | | – Norwegian Krone |
| PHP | | – Philippine Peso |
| PLN | | – Polish Zloty |
| RUB | | – Russian Ruble |
| SEK | | – Swedish Krona |
| TIIE | | – Interbank Equilibrium Interest Rate |
| TRY | | – Turkish Lira |
| TWD | | – New Taiwan Dollar |
| USD | | – U.S. Dollar |
| ZAR | | – South African Rand |
See accompanying Notes to Financial Statements which are an integral part of the financial statements.
17 Invesco World Bond Fund
Statement of Assets and Liabilities
October 31, 2017
| | | | |
Assets: | |
Investments in securities, at value (Cost $28,692,484) | | $ | 29,658,045 | |
Investments in affiliated money market funds, at value and cost | | | 692,929 | |
Other investments: | | | | |
Variation margin receivable — centrally cleared swap agreements | | | 4,543 | |
Swaps receivable — centrally cleared | | | 86 | |
Swaps receivable — OTC | | | 4,300 | |
Premiums paid on swap agreements — OTC | | | 159,566 | |
Unrealized appreciation on forward foreign currency contracts outstanding | | | 763,054 | |
Unrealized appreciation on swap agreements — OTC (premiums paid $159,566) | | | 14,063 | |
Foreign currencies, at value (Cost $1,784,108) | | | 1,764,145 | |
Deposits with brokers: | | | | |
Cash collateral — exchange-traded futures contracts | | | 68,759 | |
Cash collateral — centrally cleared swap agreements | | | 137,000 | |
Receivable for: | | | | |
Fund shares sold | | | 2,611 | |
Dividends and interest | | | 391,691 | |
Investment for trustee deferred compensation and retirement plans | | | 39,633 | |
Other assets | | | 38,620 | |
Total assets | | | 33,739,045 | |
|
Liabilities: | |
Other investments: | | | | |
Options written, at value (premiums received $22,595) | | | 22,032 | |
Swaps payable — centrally cleared | | | 85 | |
Swaps payable — OTC | | | 9,683 | |
Variation margin payable — futures contracts | | | 1,520 | |
Unrealized depreciation on forward foreign currency contracts outstanding | | | 940,958 | |
Payable for: | | | | |
Investments purchased | | | 250,000 | |
Fund shares reacquired | | | 52,234 | |
Accrued fees to affiliates | | | 30,838 | |
Accrued trustees’ and officers’ fees and benefits | | | 2,344 | |
Accrued other operating expenses | | | 64,925 | |
Trustee deferred compensation and retirement plans | | | 41,734 | |
Total liabilities | | | 1,416,353 | |
Net assets applicable to shares outstanding | | $ | 32,322,692 | |
|
Net assets consist of: | |
Shares of beneficial interest | | $ | 32,779,291 | |
Undistributed net investment income | | | 48,176 | |
Undistributed net realized gain (loss) | | | (1,143,174 | ) |
Net unrealized appreciation | | | 638,399 | |
| | | $ | 32,322,692 | |
| | | | |
Net Assets: | |
Class A | | $ | 22,150,322 | |
Class B | | $ | 217,345 | |
Class C | | $ | 4,146,612 | |
Class Y | | $ | 5,796,807 | |
Class R5 | | $ | 844 | |
Class R6 | | $ | 10,762 | |
|
Shares outstanding, no par value,
with an unlimited number of shares authorized: | |
Class A | | | 2,124,565 | |
Class B | | | 20,862 | |
Class C | | | 398,393 | |
Class Y | | | 556,412 | |
Class R5 | | | 81 | |
Class R6 | | | 1,032 | |
Class A: | | | | |
Net asset value per share | | $ | 10.43 | |
Maximum offering price per share | | | | |
(Net asset value of $10.43 ¸ 95.75%) | | $ | 10.89 | |
Class B: | | | | |
Net asset value and offering price per share | | $ | 10.42 | |
Class C: | | | | |
Net asset value and offering price per share | | $ | 10.41 | |
Class Y: | | | | |
Net asset value and offering price per share | | $ | 10.42 | |
Class R5: | | | | |
Net asset value and offering price per share | | $ | 10.42 | |
Class R6: | | | | |
Net asset value and offering price per share | | $ | 10.43 | |
See accompanying Notes to Financial Statements which are an integral part of the financial statements.
18 Invesco World Bond Fund
Statement of Operations
For the year ended October 31, 2017
| | | | |
Investment income: | |
Interest (net of foreign withholding taxes of $4,385) | | $ | 1,458,154 | |
Dividends from affiliated money market funds | | | 13,581 | |
Total investment income | | | 1,471,735 | |
| |
Expenses: | | | | |
Advisory fees | | | 229,531 | |
Administrative services fees | | | 50,000 | |
Custodian fees | | | 46,135 | |
Distribution fees: | | | | |
Class A | | | 58,323 | |
Class B | | | 3,457 | |
Class C | | | 42,584 | |
Transfer agent fees — A, B, C and Y | | | 105,411 | |
Transfer agent fees — R5 | | | 1 | |
Transfer agent fees — R6 | | | 11 | |
Trustees’ and officers’ fees and benefits | | | 20,994 | |
Registration and filing fees | | | 83,563 | |
Reports to shareholders | | | 69,724 | |
Professional services fees | | | 70,484 | |
Other | | | 17,815 | |
Total expenses | | | 798,033 | |
Less: Fees waived, expenses reimbursed and expense offset arrangement(s) | | | (446,523 | ) |
Net expenses | | | 351,510 | |
Net investment income | | | 1,120,225 | |
| |
Realized and unrealized gain (loss) from: | | | | |
Net realized gain (loss) from: | | | | |
Investment securities | | | (736,175 | ) |
Foreign currencies | | | 60,199 | |
Forward foreign currency contracts | | | (996,032 | ) |
Futures contracts | | | 33,685 | |
Option contracts written | | | 13,780 | |
Swap agreements | | | (221,244 | ) |
| | | | (1,845,787 | ) |
Change in net unrealized appreciation (depreciation) of: | | | | |
Investment securities | | | 1,257,352 | |
Foreign currencies | | | (13,354 | ) |
Forward foreign currency contracts | | | (162,396 | ) |
Futures contracts | | | (94,274 | ) |
Option contracts written | | | 563 | |
Swap agreements | | | 171,961 | |
| | | | 1,159,852 | |
Net realized and unrealized gain (loss) | | | (685,935 | ) |
Net increase in net assets resulting from operations | | $ | 434,290 | |
See accompanying Notes to Financial Statements which are an integral part of the financial statements.
19 Invesco World Bond Fund
Statement of Changes in Net Assets
For the years ended October 31, 2017 and 2016
| | | | | | | | |
| | | 2017 | | | 2016 | |
Operations: | | | | | |
Net investment income | | $ | 1,120,225 | | | $ | 1,056,032 | |
Net realized gain (loss) | | | (1,845,787 | ) | | | (188,528 | ) |
Change in net unrealized appreciation | | | 1,159,852 | | | | 1,891,966 | |
Net increase in net assets resulting from operations | | | 434,290 | | | | 2,759,470 | |
| | |
Distributions to shareholders from net investment income: | | | | | | | | |
Class A | | | (87,346 | ) | | | (230,285 | ) |
Class B | | | (1,299 | ) | | | (274 | ) |
Class C | | | (15,969 | ) | | | (5,811 | ) |
Class Y | | | (27,636 | ) | | | (75,009 | ) |
Class R5 | | | (3 | ) | | | (10 | ) |
Class R6 | | | (39 | ) | | | (30,564 | ) |
Total distributions from net investment income | | | (132,292 | ) | | | (341,953 | ) |
| | |
Return of Capital: | | | | | | | | |
Class A | | | (536,224 | ) | | | (180,952 | ) |
Class B | | | (5,196 | ) | | | (4,447 | ) |
Class C | | | (63,221 | ) | | | (34,564 | ) |
Class Y | | | (188,272 | ) | | | (38,737 | ) |
Class R5 | | | (22 | ) | | | (5 | ) |
Class R6 | | | (272 | ) | | | (42,369 | ) |
Total return of capital: | | | (793,207 | ) | | | (301,074 | ) |
| | |
Share transactions–net: | | | | | | | | |
Class A | | | (6,443,931 | ) | | | 853,114 | |
Class B | | | (243,332 | ) | | | (473,800 | ) |
Class C | | | (935,714 | ) | | | (196,968 | ) |
Class Y | | | (4,540,530 | ) | | | 8,535,582 | |
Class R5 | | | 9 | | | | — | |
Class R6 | | | — | | | | (19,308,820 | ) |
Net increase (decrease) in net assets resulting from share transactions | | | (12,163,498 | ) | | | (10,590,892 | ) |
Net increase (decrease) in net assets | | | (12,654,707 | ) | | | (8,474,449 | ) |
| | |
Net assets: | | | | | | | | |
Beginning of year | | | 44,977,399 | | | | 53,451,848 | |
End of year (includes undistributed net investment income of $48,176 and $(114,802), respectively) | | $ | 32,322,692 | | | $ | 44,977,399 | |
Notes to Financial Statements
October 31, 2017
NOTE 1—Significant Accounting Policies
Invesco World Bond Fund (the “Fund”) is a series portfolio of AIM Investment Funds (Invesco Investment Funds) (the “Trust”). The Trust is organized as a Delaware statutory trust and is registered under the Investment Company Act of 1940, as amended (the “1940 Act”), as an open-end series management investment company consisting of twenty separate series portfolios, each authorized to issue an unlimited number of shares of beneficial interest. The assets, liabilities and operations of each portfolio are accounted for separately. Information presented in these financial statements pertains only to the Fund. Matters affecting each portfolio or class will be voted on exclusively by the shareholders of such portfolio or class.
The Fund’s investment objective is total return, comprised of current income and capital appreciation.
The Fund currently consists of six different classes of shares: Class A, Class B, Class C, Class Y, Class R5 and Class R6. Class Y shares are available only to certain investors. Class A shares are sold with a front-end sales charge unless certain waiver criteria are met and under certain circumstances load waived shares may be subject to contingent deferred sales charges (“CDSC”). Class C shares are sold with a CDSC. Class Y, Class R5 and Class R6 shares are sold at net asset value. Effective November 30, 2010, new or additional investments in Class B shares are no longer permitted. Existing shareholders of Class B shares may continue to reinvest dividends and capital gains distributions in Class B shares until they convert to Class A shares.
20 Invesco World Bond Fund
Also, shareholders in Class B shares will be able to exchange those shares for Class B shares of other Invesco Funds offering such shares until they convert to Class A shares. Generally, Class B shares will automatically convert to Class A shares on or about the month-end, which is at least eight years after the date of purchase. Redemption of Class B shares prior to the conversion date will be subject to a CDSC.
The Fund is an investment company and accordingly follows the investment company accounting and reporting guidance in accordance with Financial Accounting Standards Board Accounting Standards Codification Topic 946, Financial Services — Investment Companies.
The following is a summary of the significant accounting policies followed by the Fund in the preparation of its financial statements.
| A. | Security Valuations — Securities, including restricted securities, are valued according to the following policy. |
Debt obligations (including convertible securities) and unlisted equities are fair valued using an evaluated quote provided by an independent pricing service. Evaluated quotes provided by the pricing service may be determined without exclusive reliance on quoted prices, and may reflect appropriate factors such as institution-size trading in similar groups of securities, developments related to specific securities, dividend rate (for unlisted equities), yield (for debt obligations), quality, type of issue, coupon rate (for debt obligations), maturity (for debt obligations), individual trading characteristics and other market data. Pricing services generally value debt obligations assuming orderly transactions of institutional round lot size, but a fund may hold or transact in the same securities in smaller, odd lot sizes. Odd lots often trade at lower prices than institutional round lots. Debt obligations are subject to interest rate and credit risks. In addition, all debt obligations involve some risk of default with respect to interest and/or principal payments.
A security listed or traded on an exchange (except convertible securities) is valued at its last sales price or official closing price as of the close of the customary trading session on the exchange where the security is principally traded, or lacking any sales or official closing price on a particular day, the security may be valued at the closing bid price on that day. Securities traded in the over-the-counter market are valued based on prices furnished by independent pricing services or market makers. When such securities are valued by an independent pricing service they may be considered fair valued. Futures contracts are valued at the final settlement price set by an exchange on which they are principally traded. Listed options are valued at the mean between the last bid and asked prices from the exchange on which they are principally traded. Options not listed on an exchange are valued by an independent source at the mean between the last bid and asked prices. For purposes of determining net asset value (“NAV”) per share, futures and option contracts generally are valued 15 minutes after the close of the customary trading session of the New York Stock Exchange (“NYSE”).
Investments in open-end and closed-end registered investment companies that do not trade on an exchange are valued at the end-of-day net asset value per share. Investments in open-end and closed-end registered investment companies that trade on an exchange are valued at the last sales price or official closing price as of the close of the customary trading session on the exchange where the security is principally traded.
Swap agreements are fair valued using an evaluated quote, if available, provided by an independent pricing service. Evaluated quotes provided by the pricing service are valued based on a model which may include end-of-day net present values, spreads, ratings, industry, company performance and returns of referenced assets. Centrally cleared swap agreements are valued at the daily settlement price determined by the relevant exchange or clearinghouse.
Foreign securities’ (including foreign exchange contracts) prices are converted into U.S. dollar amounts using the applicable exchange rates as of the close of the NYSE. If market quotations are available and reliable for foreign exchange-traded equity securities, the securities will be valued at the market quotations. Because trading hours for certain foreign securities end before the close of the NYSE, closing market quotations may become unreliable. If between the time trading ends on a particular security and the close of the customary trading session on the NYSE, events occur that the investment adviser determines are significant and make the closing price unreliable, the Fund may fair value the security. If the event is likely to have affected the closing price of the security, the security will be valued at fair value in good faith using procedures approved by the Board of Trustees. Adjustments to closing prices to reflect fair value may also be based on a screening process of an independent pricing service to indicate the degree of certainty, based on historical data, that the closing price in the principal market where a foreign security trades is not the current value as of the close of the NYSE. Foreign securities’ prices meeting the approved degree of certainty that the price is not reflective of current value will be priced at the indication of fair value from the independent pricing service. Multiple factors may be considered by the independent pricing service in determining adjustments to reflect fair value and may include information relating to sector indices, American Depositary Receipts and domestic and foreign index futures. Foreign securities may have additional risks including exchange rate changes, potential for sharply devalued currencies and high inflation, political and economic upheaval, the relative lack of issuer information, relatively low market liquidity and the potential lack of strict financial and accounting controls and standards.
Securities for which market prices are not provided by any of the above methods may be valued based upon quotes furnished by independent sources. The last bid price may be used to value equity securities. The mean between the last bid and asked prices is used to value debt obligations, including corporate loans.
Securities for which market quotations are not readily available or became unreliable are valued at fair value as determined in good faith by or under the supervision of the Trust’s officers following procedures approved by the Board of Trustees. Issuer specific events, market trends, bid/asked quotes of brokers and information providers and other market data may be reviewed in the course of making a good faith determination of a security’s fair value.
The Fund may invest in securities that are subject to interest rate risk, meaning the risk that the prices will generally fall as interest rates rise and, conversely, the prices will generally rise as interest rates fall. Specific securities differ in their sensitivity to changes in interest rates depending on their individual characteristics. Changes in interest rates may result in increased market volatility, which may affect the value and/or liquidity of certain Fund investments.
Valuations change in response to many factors including the historical and prospective earnings of the issuer, the value of the issuer’s assets, general economic conditions, interest rates, investor perceptions and market liquidity. Because of the inherent uncertainties of valuation, the values reflected in the financial statements may materially differ from the value received upon actual sale of those investments.
| B. | Securities Transactions and Investment Income — Securities transactions are accounted for on a trade date basis. Realized gains or losses on sales are computed on the basis of specific identification of the securities sold. Interest income (net of withholding tax, if any) is recorded on the accrual basis from settlement date. Bond premiums and discounts are amortized and/or accreted over the lives of the respective securities. Pay-in-kind income received in the form of securities in-lieu of cash is recorded as interest income. Dividend income (net of withholding tax, if any) is recorded on the ex-dividend date. |
21 Invesco World Bond Fund
The Fund may periodically participate in litigation related to Fund investments. As such, the Fund may receive proceeds from litigation settlements. Any proceeds received are included in the Statement of Operations as realized gain (loss) for investments no longer held and as unrealized gain (loss) for investments still held.
Brokerage commissions and mark ups are considered transaction costs and are recorded as an increase to the cost basis of securities purchased and/or a reduction of proceeds on a sale of securities. Such transaction costs are included in the determination of net realized and unrealized gain (loss) from investment securities reported in the Statement of Operations and the Statement of Changes in Net Assets and the net realized and unrealized gains (losses) on securities per share in the Financial Highlights. Transaction costs are included in the calculation of the Fund’s net asset value and, accordingly, they reduce the Fund’s total returns. These transaction costs are not considered operating expenses and are not reflected in net investment income reported in the Statement of Operations and the Statement of Changes in Net Assets, or the net investment income per share and the ratios of expenses and net investment income reported in the Financial Highlights, nor are they limited by any expense limitation arrangements between the Fund and the investment adviser.
The Fund allocates income and realized and unrealized capital gains and losses to a class based on the relative net assets of each class.
| C. | Country Determination — For the purposes of making investment selection decisions and presentation in the Schedule of Investments, the investment adviser may determine the country in which an issuer is located and/or credit risk exposure based on various factors. These factors include the laws of the country under which the issuer is organized, where the issuer maintains a principal office, the country in which the issuer derives 50% or more of its total revenues and the country that has the primary market for the issuer’s securities, as well as other criteria. Among the other criteria that may be evaluated for making this determination are the country in which the issuer maintains 50% or more of its assets, the type of security, financial guarantees and enhancements, the nature of the collateral and the sponsor organization. Country of issuer and/or credit risk exposure has been determined to be the United States of America, unless otherwise noted. |
| D. | Distributions — Distributions from net investment income, if any, are declared daily and paid monthly. Distributions from net realized capital gain, if any, are generally declared and paid annually and recorded on the ex-dividend date. The Fund may elect to treat a portion of the proceeds from redemptions as distributions for federal income tax purposes. |
| E. | Federal Income Taxes — The Fund intends to comply with the requirements of Subchapter M of the Internal Revenue Code of 1986, as amended (the “Internal Revenue Code”), necessary to qualify as a regulated investment company and to distribute substantially all of the Fund’s taxable earnings to shareholders. As such, the Fund will not be subject to federal income taxes on otherwise taxable income (including net realized capital gain) that is distributed to shareholders. Therefore, no provision for federal income taxes is recorded in the financial statements. |
The Fund recognizes the tax benefits of uncertain tax positions only when the position is more likely than not to be sustained. Management has analyzed the Fund’s uncertain tax positions and concluded that no liability for unrecognized tax benefits should be recorded related to uncertain tax positions. Management is not aware of any tax positions for which it is reasonably possible that the total amounts of unrecognized tax benefits will change materially in the next 12 months.
The Fund files tax returns in the U.S. Federal jurisdiction and certain other jurisdictions. Generally, the Fund is subject to examinations by such taxing authorities for up to three years after the filing of the return for the tax period.
| F. | Expenses — Fees provided for under the Rule 12b-1 plan of a particular class of the Fund are charged to the operations of such class. Transfer agency fees and expenses and other shareholder recordkeeping fees and expenses attributable to Class R5 and Class R6 are allocated to each share class based on relative net assets. Sub-accounting fees attributable to Class R5 are charged to the operations of the class. Transfer agency fees and expenses and other shareholder recordkeeping fees and expenses relating to all other classes are allocated among those classes based on relative net assets. All other expenses are allocated among the classes based on relative net assets. |
| G. | Accounting Estimates — The preparation of financial statements in conformity with accounting principles generally accepted in the United States of America (“GAAP”) requires management to make estimates and assumptions that affect the reported amounts of assets and liabilities at the date of the financial statements and the reported amounts of revenues and expenses during the reporting period including estimates and assumptions related to taxation. Actual results could differ from those estimates by a significant amount. In addition, the Fund monitors for material events or transactions that may occur or become known after the period-end date and before the date the financial statements are released to print. |
| H. | Indemnifications — Under the Trust’s organizational documents, each Trustee, officer, employee or other agent of the Trust is indemnified against certain liabilities that may arise out of the performance of their duties to the Fund. Additionally, in the normal course of business, the Fund enters into contracts, including the Fund’s servicing agreements, that contain a variety of indemnification clauses. The Fund’s maximum exposure under these arrangements is unknown as this would involve future claims that may be made against the Fund that have not yet occurred. The risk of material loss as a result of such indemnification claims is considered remote. |
| I. | Treasury Inflation-Protected Securities — The Fund may invest in Treasury Inflation-Protected Securities (“TIPS”). TIPS are fixed income securities whose principal value is periodically adjusted to the rate of inflation. The principal value of TIPS will be adjusted upward or downward, and any increase or decrease in the principal amount of TIPS will be included as interest income in the Statement of Operations, even though investors do not receive their principal until maturity. |
| J. | Foreign Currency Translations — Foreign currency is valued at the close of the NYSE based on quotations posted by banks and major currency dealers. Portfolio securities and other assets and liabilities denominated in foreign currencies are translated into U.S. dollar amounts at date of valuation. Purchases and sales of portfolio securities (net of foreign taxes withheld on disposition) and income items denominated in foreign currencies are translated into U.S. dollar amounts on the respective dates of such transactions. The Fund does not separately account for the portion of the results of operations resulting from changes in foreign exchange rates on investments and the fluctuations arising from changes in market prices of securities held. The combined results of changes in foreign exchange rates and the fluctuation of market prices on investments (net of estimated foreign tax withholding) are included with the net realized and unrealized gain or loss from investments in the Statement of Operations. Reported net realized foreign currency gains or losses arise from (1) sales of foreign currencies, (2) currency gains or losses realized between the trade and settlement dates on securities transactions, and (3) the difference between the amounts of dividends, interest, and foreign withholding taxes recorded on the Fund’s books and the U.S. dollar equivalent of the amounts actually received or paid. Net unrealized foreign currency gains and losses arise from changes in the fair values of assets and liabilities, other than investments in securities at fiscal period end, resulting from changes in exchange rates. |
22 Invesco World Bond Fund
The Fund may invest in foreign securities, which may be subject to foreign taxes on income, gains on investments or currency repatriation, a portion of which may be recoverable. Foreign taxes, if any, are recorded based on the tax regulations and rates that exist in the foreign markets in which the Fund invests and are shown in the Statement of Operations.
| K. | Forward Foreign Currency Contracts — The Fund may engage in foreign currency transactions either on a spot (i.e. for prompt delivery and settlement) basis, or through forward foreign currency contracts, to manage or minimize currency or exchange rate risk. |
The Fund may also enter into forward foreign currency contracts for the purchase or sale of a security denominated in a foreign currency in order to “lock in” the U.S. dollar price of that security, or the Fund may also enter into forward foreign currency contracts that do not provide for physical settlement of the two currencies, but instead are settled by a single cash payment calculated as the difference between the agreed upon exchange rate and the spot rate at settlement based upon an agreed upon notional amount (non-deliverable forwards). The Fund will set aside liquid assets in an amount equal to the daily mark-to-market obligation for forward foreign currency contracts.
A forward foreign currency contract is an obligation between two parties (“Counterparties”) to purchase or sell a specific currency for an agreed-upon price at a future date. The use of forward foreign currency contracts does not eliminate fluctuations in the price of the underlying securities the Fund owns or intends to acquire but establishes a rate of exchange in advance. Fluctuations in the value of these contracts are measured by the difference in the contract date and reporting date exchange rates and are recorded as unrealized appreciation (depreciation) until the contracts are closed. When the contracts are closed, realized gains (losses) are recorded. Realized and unrealized gains (losses) on the contracts are included in the Statement of Operations. The primary risks associated with forward foreign currency contracts include failure of the Counterparty to meet the terms of the contract and the value of the foreign currency changing unfavorably. These risks may be in excess of the amounts reflected in the Statement of Assets and Liabilities.
| L. | Futures Contracts — The Fund may enter into futures contracts to manage exposure to interest rate, equity and market price movements and/or currency risks. A futures contract is an agreement between Counterparties to purchase or sell a specified underlying security, currency or commodity (or delivery of a cash settlement price, in the case of an index future) for a fixed price at a future date. The Fund currently invests only in exchange-traded futures and they are standardized as to maturity date and underlying financial instrument. Initial margin deposits required upon entering into futures contracts are satisfied by the segregation of specific securities or cash as collateral at the futures commission merchant (broker). During the period the futures contracts are open, changes in the value of the contracts are recognized as unrealized gains or losses by recalculating the value of the contracts on a daily basis. Subsequent or variation margin payments are received or made depending upon whether unrealized gains or losses are incurred. These amounts are reflected as receivables or payables on the Statement of Assets and Liabilities. When the contracts are closed or expire, the Fund recognizes a realized gain or loss equal to the difference between the proceeds from, or cost of, the closing transaction and the Fund’s basis in the contract. The net realized gain (loss) and the change in unrealized gain (loss) on futures contracts held during the period is included on the Statement of Operations. The primary risks associated with futures contracts are market risk and the absence of a liquid secondary market. If the Fund were unable to liquidate a futures contract and/or enter into an offsetting closing transaction, the Fund would continue to be subject to market risk with respect to the value of the contracts and continue to be required to maintain the margin deposits on the futures contracts. Futures contracts have minimal Counterparty risk since the exchange’s clearinghouse, as Counterparty to all exchange-traded futures, guarantees the futures against default. Risks may exceed amounts recognized in the Statement of Assets and Liabilities. |
| M. | Call Options Purchased and Written — The Fund may write call options and/or buy call options. A covered call option gives the purchaser of such option the right to buy, and the writer the obligation to sell, the underlying security or foreign currency at the stated exercise price during the option period. An uncovered call option exists without the ownership of the underlying security. Options written by the Fund normally will have expiration dates between three and nine months from the date written. The exercise price of a call option may be below, equal to, or above the current market value of the underlying security at the time the option is written. |
Additionally, the Fund may enter into an option on a swap agreement, also called a “swaption”. A swaption is an option that gives the buyer the right, but not the obligation, to enter into a swap on a future date in exchange for paying a market-based premium. A receiver swaption gives the owner the right to receive the total return of a specified asset, reference rate or index. Swaptions also include options that allow an existing swap to be terminated or extended by one of the Counterparties.
When the Fund writes a covered call option, an amount equal to the premium received by the Fund is recorded as an asset and an equivalent liability in the Statement of Assets and Liabilities. The amount of the liability is subsequently “marked-to-market” to reflect the current market value of the option written. If a written covered call option expires on the stipulated expiration date, or if the Fund enters into a closing purchase transaction, the Fund realizes a gain (or a loss if the closing purchase transaction exceeds the premium received when the option was written) without regard to any unrealized gain or loss on the underlying security, and the liability related to such option is extinguished. If a written covered call option is exercised, the Fund realizes a gain or a loss from the sale of the underlying security and the proceeds of the sale are increased by the premium originally received. Realized and unrealized gains and losses on call options written are included in the Statement of Operations as Net realized gain (loss) from and Change in net unrealized appreciation (depreciation) of Option contracts written. A risk in writing a covered call option is that the Fund gives up the opportunity for profit if the market price of the security increases and the option is exercised. The risk in writing an uncovered call option is that the Fund may incur significant losses if the value of the written security exceeds the exercise price of the option.
When the Fund buys a call option, an amount equal to the premium paid by the Fund is recorded as an investment on the Statement of Assets and Liabilities. The amount of the investment is subsequently “marked-to-market” to reflect the current value of the option purchased. Realized and unrealized gains and losses on call options purchased are included in the Statement of Operations as Net realized gain (loss) from and Change in net unrealized appreciation (depreciation) of Investment securities. A risk in buying an option is that the Fund pays a premium whether or not the option is exercised. In addition, there can be no assurance that a liquid secondary market will exist for any option purchased.
| N. | Put Options Purchased and Written — The Fund may purchase and write put options including options on securities indexes, or foreign currency and/or futures contracts. By purchasing a put option, the Fund obtains the right (but not the obligation) to sell the option’s underlying instrument at a fixed strike price. In return for this right, the Fund pays an option premium. The option’s underlying instrument may be a security, securities index, or a futures contract. |
23 Invesco World Bond Fund
Additionally, the Fund may enter into an option on a swap agreement, also called a “swaption”. A swaption is an option that gives the buyer the right, but not the obligation, to enter into a swap on a future date in exchange for paying a market-based premium. A receiver swaption gives the owner the right to receive the total return of a specified asset, reference rate or index. Swaptions also include options that allow an existing swap to be terminated or extended by one of the Counterparties.
Put options may be used by the Fund to hedge securities it owns by locking in a minimum price at which the Fund can sell. If security prices fall, the put option could be exercised to offset all or a portion of the Fund’s resulting losses. At the same time, because the maximum the Fund has at risk is the cost of the option, purchasing put options does not eliminate the potential for the Fund to profit from an increase in the value of the underlying portfolio securities. The Fund may write put options to earn additional income in the form of option premiums if it expects the price of the underlying instrument to remain stable or rise during the option period so that the option will not be exercised. The risk in this strategy is that the price of the underlying securities may decline by an amount greater than the premium received. Put options written are reported as a liability in the Statement of Assets and Liabilities. Realized and unrealized gains and losses on put options purchased and put options written are included in the Statement of Operations as Net realized gain (loss) from and Change in net unrealized appreciation (depreciation) of Investment securities and Option contracts written, respectively. A risk in buying an option is that the Fund pays a premium whether or not the option is exercised. In addition, there can be no assurance that a liquid secondary market will exist for any option purchased.
| O. | Swap Agreements — The Fund may enter into various swap transactions, including interest rate, total return, index, currency and credit default swap contracts (“CDS”) for investment purposes or to manage interest rate, currency or credit risk. Such transactions are agreements between Counterparties. A swap agreement may be negotiated bilaterally and traded over-the-counter (“OTC”) between two parties (“uncleared/OTC”) or, in some instances, must be transacted through a future commission merchant (“FCM”) and cleared through a clearinghouse that serves as a central Counterparty (“centrally cleared swap”). These agreements may contain among other conditions, events of default and termination events, and various covenants and representations such as provisions that require the Fund to maintain a pre-determined level of net assets, and/or provide limits regarding the decline of the Fund’s NAV over specific periods of time. If the Fund were to trigger such provisions and have open derivative positions at that time, the Counterparty may be able to terminate such agreement and request immediate payment in an amount equal to the net liability positions, if any. |
Interest rate, total return, index, and currency swap agreements are two-party contracts entered into primarily to exchange the returns (or differentials in rates of returns) earned or realized on particular predetermined investments or instruments. The gross returns to be exchanged or “swapped” between the parties are calculated with respect to a notional amount, i.e., the return on or increase in value of a particular dollar amount invested at a particular interest rate or return of an underlying asset, in a particular foreign currency, or in a “basket” of securities representing a particular index.
In a centrally cleared swap, the Fund’s ultimate Counterparty is a central clearinghouse. The Fund initially will enter into centrally cleared swaps through an executing broker. When a fund enters into a centrally cleared swap, it must deliver to the central Counterparty (via the FCM) an amount referred to as “initial margin.” Initial margin requirements are determined by the central Counterparty, but an FCM may require additional initial margin above the amount required by the central Counterparty. Initial margin deposits required upon entering into centrally cleared swaps are satisfied by cash or securities as collateral at the FCM. Securities deposited as initial margin are designated on the Schedule of Investments and cash deposited is recorded on the Statement of Assets and Liabilities. During the term of a cleared swap agreement, a “variation margin” amount may be required to be paid by the Fund or may be received by the Fund, based on the daily change in price of the underlying reference instrument subject to the swap agreement and is recorded as a receivable or payable for variation margin in the Statement of Assets and Liabilities until the centrally cleared swap is terminated at which time a realized gain or loss is recorded.
A CDS is an agreement between Counterparties to exchange the credit risk of an issuer. A buyer of a CDS is said to buy protection by paying a fixed payment over the life of the agreement and in some situations an upfront payment to the seller of the CDS. If a defined credit event occurs (such as payment default or bankruptcy), the Fund as a protection buyer would cease paying its fixed payment, the Fund would deliver eligible bonds issued by the reference entity to the seller, and the seller would pay the full notional value, or the “par value”, of the referenced obligation to the Fund. A seller of a CDS is said to sell protection and thus would receive a fixed payment over the life of the agreement and an upfront payment, if applicable. If a credit event occurs, the Fund as a protection seller would cease to receive the fixed payment stream, the Fund would pay the buyer “par value” or the full notional value of the referenced obligation, and the Fund would receive the eligible bonds issued by the reference entity. In turn, these bonds may be sold in order to realize a recovery value. Alternatively, the seller of the CDS and its Counterparty may agree to net the notional amount and the market value of the bonds and make a cash payment equal to the difference to the buyer of protection. If no credit event occurs, the Fund receives the fixed payment over the life of the agreement. As the seller, the Fund would effectively add leverage to its portfolio because, in addition to its total net assets, the Fund would be subject to investment exposure on the notional amount of the CDS. In connection with these agreements, cash and securities may be identified as collateral in accordance with the terms of the respective swap agreements to provide assets of value and recourse in the event of default under the swap agreement or bankruptcy/insolvency of a party to the swap agreement. If a Counterparty becomes bankrupt or otherwise fails to perform its obligations due to financial difficulties, the Fund may experience significant delays in obtaining any recovery in a bankruptcy or other reorganization proceeding. The Fund may obtain only limited recovery or may obtain no recovery in such circumstances. The Fund’s maximum risk of loss from Counterparty risk, either as the protection seller or as the protection buyer, is the value of the contract. The risk may be mitigated by having a master netting arrangement between the Fund and the Counterparty and by the designation of collateral by the Counterparty to cover the Fund’s exposure to the Counterparty.
Implied credit spreads represent the current level at which protection could be bought or sold given the terms of the existing CDS contract and serve as an indicator of the current status of the payment/performance risk of the CDS. An implied spread that has widened or increased since entry into the initial contract may indicate a deteriorating credit profile and increased risk of default for the reference entity. A declining or narrowing spread may indicate an improving credit profile or decreased risk of default for the reference entity. Alternatively, credit spreads may increase or decrease reflecting the general tolerance for risk in the credit markets.
An interest rate swap is an agreement between Counterparties pursuant to which the parties exchange a floating rate payment for a fixed rate payment based on a specified notional amount.
24 Invesco World Bond Fund
Changes in the value of centrally cleared and OTC swap agreements are recognized as unrealized gains (losses) in the Statement of Operations by “marking to market” on a daily basis to reflect the value of the swap agreement at the end of each trading day. Payments received or paid at the beginning of the agreement are reflected as such on the Statement of Assets and Liabilities and may be referred to as upfront payments. The Fund accrues for the fixed payment stream and amortizes upfront payments, if any, on swap agreements on a daily basis with the net amount, recorded as a component of realized gain (loss) on the Statement of Operations. A liquidation payment received or made at the termination of a swap agreement is recorded as realized gain (loss) on the Statement of Operations. The Fund segregates cash or liquid securities having a value at least equal to the amount of the potential obligation of a Fund under any swap transaction. Cash held as collateral is recorded as deposits with brokers on the Statement of Assets and Liabilities. Entering into these agreements involves, to varying degrees, lack of liquidity and elements of credit, market, and Counterparty risk in excess of amounts recognized on the Statement of Assets and Liabilities. Such risks involve the possibility that a swap is difficult to sell or liquidate; the Counterparty does not honor its obligations under the agreement and unfavorable interest rates and market fluctuations. It is possible that developments in the swaps market, including potential government regulation, could adversely affect the Fund’s ability to terminate existing swap agreements or to realize amounts to be received under such agreements. A short position in a security poses more risk than holding the same security long. As there is no limit on how much the price of the security can increase, the Fund’s exposure is unlimited.
Notional amounts of each individual credit default swap agreement outstanding as of October 31, 2017 for which the Fund is the seller of protection are disclosed in the open swap agreements table. These potential amounts would be partially offset by any recovery values of the respective referenced obligations, upfront payments received upon entering into the agreement, or net amounts received from the settlement of buy protection credit default swap agreements entered into by the Fund for the same referenced entity or entities.
| P. | Leverage Risk — Leverage exists when the Fund can lose more than it originally invests because it purchases or sells an instrument or enters into a transaction without investing an amount equal to the full economic exposure of the instrument or transaction. |
| Q. | Collateral — To the extent the Fund has designated or segregated a security as collateral and that security is subsequently sold, it is the Fund’s practice to replace such collateral no later than the next business day. |
NOTE 2—Advisory Fees and Other Fees Paid to Affiliates
The Trust has entered into a master investment advisory agreement with Invesco Advisers, Inc. (the “Adviser” or “Invesco”). Under the terms of the investment advisory agreement, the Fund accrues daily and pays monthly an advisory fee to the Adviser based on the annual rate of the Fund’s average daily net assets as follows:
| | | | | | | | |
| Average Daily Net Assets | | Rate | |
First $250 million | | | 0 | .65% | | | | |
Next $250 million | | | 0 | .59% | | | | |
Next $500 million | | | 0 | .565% | | | | |
Next $1.5 billion | | | 0 | .54% | | | | |
Next $2.5 billion | | | 0 | .515% | | | | |
Next $5 billion | | | 0 | .49% | | | | |
Over $10 billion | | | 0 | .465% | | | | |
For the year ended October 31, 2017, the effective advisory fees incurred by the Fund was 0.65%.
Under the terms of a master sub-advisory agreement between the Adviser and each of Invesco Asset Management Deutschland GmbH, Invesco Asset Management Limited, Invesco Asset Management (Japan) Limited, Invesco Hong Kong Limited, Invesco Senior Secured Management, Inc. and Invesco Canada Ltd. (collectively, the “Affiliated Sub-Advisers”) the Adviser, not the Fund, will pay 40% of the fees paid to the Adviser to any such Affiliated Sub-Adviser(s) that provide(s) discretionary investment management services to the Fund based on the percentage of assets allocated to such Affiliated Sub-Adviser(s).
Effective December 1, 2016, the Adviser has contractually agreed, through at least February 28, 2019, to waive advisory fees and/or reimburse expenses to the extent necessary to limit total annual fund operating expenses after fee waiver and/or expense reimbursement (excluding certain items discussed below) of Class A, Class B, Class C, Class Y, Class R5 and Class R6 shares to 0.94%, 1.69%, 1.69%, 0.69%, 0.69% and 0.69%, respectively, of the Fund’s average daily net assets (the “expense limits”). Prior to December 1, 2016, the Adviser had contractually agreed to waive advisory fees and/or reimburse expenses to the extent necessary to limit total annual fund operating expenses after fee waiver and/or expense reimbursement (excluding certain items discussed below) of Class A, Class B, Class C, Class Y, Class R5 and Class R6 shares to 1.10%, 1.85%, 1.85%, 0.85%, 0.85% and 0.85%, respectively, of the Fund’s average daily net assets. In determining the Adviser’s obligation to waive advisory fees and/or reimburse expenses, the following expenses are not taken into account, and could cause total annual fund operating expenses after fee waiver and/or expense reimbursement to exceed the numbers reflected above: (1) interest; (2) taxes; (3) dividend expense on short sales; (4) extraordinary or non-routine items, including litigation expenses; and (5) expenses that the Fund has incurred but did not actually pay because of an expense offset arrangement. Unless Invesco continues the fee waiver agreement, it will terminate on February 28, 2019. During its term, the fee waiver agreement cannot be terminated or amended to increase the expense limits or reduce the advisory fee waiver without approval of the Board of Trustees.
Further, the Adviser has contractually agreed, through at least June 30, 2019, to waive the advisory fee payable by the Fund in an amount equal to 100% of the net advisory fees the Adviser receives from the affiliated money market funds on investments by the Fund of uninvested cash in such affiliated money market funds.
For the year ended October 31, 2017, the Adviser waived advisory fees and reimbursed fund expenses of $341,101 and reimbursed class level expenses of $68,705, $1,018, $12,541, $21,698, $1 and $11 of Class A, Class B, Class C, Class Y, Class R5 and Class R6 shares, respectively.
The Trust has entered into a master administrative services agreement with Invesco pursuant to which the Fund has agreed to pay Invesco for certain administrative costs incurred in providing accounting services to the Fund. For the year ended October 31, 2017, expenses incurred under the agreement are shown in the Statement of Operations as Administrative services fees.
25 Invesco World Bond Fund
The Trust has entered into a transfer agency and service agreement with Invesco Investment Services, Inc. (“IIS”) pursuant to which the Fund has agreed to pay IIS a fee for providing transfer agency and shareholder services to the Fund and reimburse IIS for certain expenses incurred by IIS in the course of providing such services. IIS may make payments to intermediaries that provide omnibus account services, sub-accounting services and/or networking services. All fees payable by IIS to intermediaries that provide omnibus account services or sub-accounting services are charged back to the Fund, subject to certain limitations approved by the Trust’s Board of Trustees. For the year ended October 31, 2017, expenses incurred under the agreement are shown in the Statement of Operations as Transfer agent fees.
The Trust has entered into master distribution agreements with Invesco Distributors, Inc. (“IDI”) to serve as the distributor for the Class A, Class B, Class C, Class Y, Class R5 and Class R6 shares of the Fund. The Trust has adopted plans pursuant to Rule 12b-1 under the 1940 Act with respect to the Fund’s Class A, Class B and Class C shares (collectively, the “Plans”). The Fund, pursuant to the Plans, pays IDI compensation at the annual rate of 0.25% of the Fund’s average daily net assets of Class A shares and 1.00% of the average daily net assets of Class B and Class C shares. The fees are accrued daily and paid monthly. Of the Plan payments, up to 0.25% of the average daily net assets of each class of shares may be paid to furnish continuing personal shareholder services to customers who purchase and own shares of such classes. Any amounts not paid as a service fee under the Plans would constitute an asset-based sales charge. Rules of the Financial Industry Regulatory Authority (“FINRA”) impose a cap on the total sales charges, including asset-based sales charges, that may be paid by any class of shares of the Fund. For the year ended October 31, 2017, expenses incurred under the Plans are shown in the Statement of Operations as Distribution fees.
Front-end sales commissions and CDSC (collectively, the “sales charges”) are not recorded as expenses of the Fund. Front-end sales commissions are deducted from proceeds from the sales of Fund shares prior to investment in Class A shares of the Fund. CDSC are deducted from redemption proceeds prior to remittance to the shareholder. During the year ended October 31, 2017, IDI advised the Fund that IDI retained $1,912 in front-end sales commissions from the sale of Class A shares and $100, $20 and $61 from Class A, Class B and Class C shares, respectively, for CDSC imposed on redemptions by shareholders.
Certain officers and trustees of the Trust are officers and directors of the Adviser, IIS and/or IDI.
NOTE 3—Additional Valuation Information
GAAP defines fair value as the price that would be received to sell an asset or paid to transfer a liability in an orderly transaction between market participants at the measurement date, under current market conditions. GAAP establishes a hierarchy that prioritizes the inputs to valuation methods, giving the highest priority to readily available unadjusted quoted prices in an active market for identical assets (Level 1) and the lowest priority to significant unobservable inputs (Level 3), generally when market prices are not readily available or are unreliable. Based on the valuation inputs, the securities or other investments are tiered into one of three levels. Changes in valuation methods may result in transfers in or out of an investment’s assigned level:
| | Level 1 — | Prices are determined using quoted prices in an active market for identical assets. |
| | Level 2 — | Prices are determined using other significant observable inputs. Observable inputs are inputs that other market participants may use in pricing a security. These may include quoted prices for similar securities, interest rates, prepayment speeds, credit risk, yield curves, loss severities, default rates, discount rates, volatilities and others. |
| | Level 3 — | Prices are determined using significant unobservable inputs. In situations where quoted prices or observable inputs are unavailable (for example, when there is little or no market activity for an investment at the end of the period), unobservable inputs may be used. Unobservable inputs reflect the Fund’s own assumptions about the factors market participants would use in determining fair value of the securities or instruments and would be based on the best available information. |
The following is a summary of the tiered valuation input levels, as of October 31, 2017. The level assigned to the securities valuations may not be an indication of the risk or liquidity associated with investing in those securities. Because of the inherent uncertainties of valuation, the values reflected in the financial statements may materially differ from the value received upon actual sale of those investments.
The Fund’s policy is to recognize transfers in and out of the valuation levels as of the end of the reporting period. During the year ended October 31, 2017, there were no material transfers between valuation levels.
| | | | | | | | | | | | | | | | |
| | | Level 1 | | | Level 2 | | | Level 3 | | | Total | |
Non U.S. Denominated Bonds & Notes | | $ | — | | | $ | 14,334,943 | | | $ | — | | | $ | 14,334,943 | |
U.S. Denominated Bonds & Notes | | | — | | | | 9,259,305 | | | | — | | | | 9,259,305 | |
U.S. Treasury Securities | | | — | | | | 5,901,036 | | | | — | | | | 5,901,036 | |
U.S. Government Sponsored Agency Mortgage-Backed Securities | | | — | | | | 100,389 | | | | — | | | | 100,389 | |
Money Market Funds | | | 692,929 | | | | — | | | | — | | | | 692,929 | |
Options Purchased | | | — | | | | 62,372 | | | | — | | | | 62,372 | |
| | | | 692,929 | | | | 29,658,045 | | | | — | | | | 30,350,974 | |
Forward Foreign Currency Contracts* | | | — | | | | (177,904 | ) | | | — | | | | (177,904 | ) |
Futures Contracts* | | | (41,251 | ) | | | — | | | | — | | | | (41,251 | ) |
Options Written* | | | — | | | | (22,032 | ) | | | — | | | | (22,032 | ) |
Swap Agreements* | | | — | | | | (90,034 | ) | | | — | | | | (90,034 | ) |
Total Investments | | $ | 651,678 | | | $ | 29,368,075 | | | $ | — | | | $ | 30,019,753 | |
| * | Forward foreign currency contracts, futures contracts and swap agreements are valued at unrealized appreciation (depreciation). Options written are shown at value. |
26 Invesco World Bond Fund
NOTE 4—Derivative Investments
The Fund may enter into an International Swaps and Derivatives Association Master Agreement (“ISDA Master Agreement”) under which a fund may trade OTC derivatives. An OTC transaction entered into under an ISDA Master Agreement typically involves a collateral posting arrangement, payment netting provisions and close-out netting provisions. These netting provisions allow for reduction of credit risk through netting of contractual obligations. The enforceability of the netting provisions of the ISDA Master Agreement depends on the governing law of the ISDA Master Agreement, among other factors.
For financial reporting purposes, the Fund does not offset OTC derivative assets or liabilities that are subject to ISDA Master Agreements in the Statement of Assets and Liabilities.
Value of Derivative Investments at Period-End
The table below summarizes the value of the Fund’s derivative investments, detailed by primary risk exposure, held as of October 31, 2017:
| | | | | | | | | | | | | | | | |
| | | Value | |
| Derivative Assets | | Credit
Risk | | | Currency
Risk | | | Interest Rate
Risk | | | Total | |
Unrealized appreciation on swap agreements — Centrally Cleared(a) | | $ | — | | | $ | — | | | $ | 34,203 | | | $ | 34,203 | |
Unrealized appreciation on swap agreements — OTC | | | 14,063 | | | | — | | | | — | | | | 14,063 | |
Options purchased, at value — OTC(b) | | | — | | | | 28,518 | | | | 33,854 | | | | 62,372 | |
Unrealized appreciation on forward foreign currency contracts outstanding | | | — | | | | 763,054 | | | | — | | | | 763,054 | |
Total Derivative Assets | | | 14,063 | | | | 791,572 | | | | 68,057 | | | | 873,692 | |
Derivatives not subject to master netting agreements | | | — | | | | — | | | | (34,203 | ) | | | (34,203 | ) |
Total Derivative Assets subject to master netting agreements | | $ | 14,063 | | | $ | 791,572 | | | $ | 33,854 | | | $ | 839,489 | |
| |
| | | Value | |
| Derivative Liabilities | | Credit
Risk | | | Currency
Risk | | | Interest Rate
Risk | | | Total | |
Unrealized depreciation on futures contracts — Exchange-Traded(a) | | $ | — | | | $ | — | | | $ | (41,251 | ) | | $ | (41,251 | ) |
Unrealized depreciation on swap agreements — Centrally Cleared(a) | | | — | | | | — | | | | (138,300 | ) | | | (138,300 | ) |
Options written, at value — OTC | | | — | | | | (22,032 | ) | | | — | | | | (22,032 | ) |
Unrealized depreciation on forward foreign currency contracts outstanding | | | — | | | | (940,958 | ) | | | — | | | | (940,958 | ) |
Total Derivative Liabilities | | | — | | | | (962,990 | ) | | | (179,551 | ) | | | (1,142,541 | ) |
Derivatives not subject to master netting agreements | | | — | | | | — | | | | 179,551 | | | | 179,551 | |
Total Derivative Liabilities subject to master netting agreements | | $ | — | | | $ | (962,990 | ) | | $ | — | | | $ | (962,990 | ) |
| (a) | The daily variation margin receivable (payable) at period-end is recorded in the Statement of Assets and Liabilities. |
| (b) | Options purchased, at value as reported in the Schedule of Investments. |
| | | | | | | | | | | | | | | | | | | | | | | | | | | | | | | | | | | | | | | | | | | | | | | | |
| | | Financial Derivative Assets | | | Financial Derivative Liabilities | | | | | | Collateral
(Received)/Pledged | | | | |
| Counterparty | | Forward
Foreign
Currency
Contracts | | | Options
Purchased | | | Swap
Agreements | | | Total
Assets | | | Forward
Foreign
Currency
Contracts | | | Options
Written | | | Swap
Agreements | | | Total
Liabilities | | | Net Value of
Derivatives | | | Non-Cash | | | Cash | | | Net
Amount | |
Barclays Bank PLC | | $ | 228,924 | | | $ | 12,718 | | | $ | 83,536 | | | $ | 325,178 | | | $ | (250,364 | ) | | $ | — | | | $ | (6,883 | ) | | $ | (257,247 | ) | | $ | 67,931 | | | $ | — | | | $ | — | | | $ | 67,931 | |
Citibank, N.A. | | | — | | | | 15,183 | | | | — | | | | 15,183 | | | | — | | | | (22,032 | ) | | | — | | | | (22,032 | ) | | | (6,849 | ) | | | — | | | | — | | | | (6,849 | ) |
Citigroup Global Markets Inc. | | | 134,156 | | | | — | | | | — | | | | 134,156 | | | | (143,287 | ) | | | — | | | | — | | | | (143,287 | ) | | | (9,131 | ) | | | — | | | | — | | | | (9,131 | ) |
Deutsche Bank Securities Inc. | | | 22,112 | | | | — | | | | — | | | | 22,112 | | | | (15,014 | ) | | | — | | | | — | | | | (15,014 | ) | | | 7,098 | | | | — | | | | — | | | | 7,098 | |
Goldman Sachs International | | | 259,616 | | | | 617 | | | | 94,393 | | | | 354,626 | | | | (472,783 | ) | | | — | | | | (2,800 | ) | | | (475,583 | ) | | | (120,957 | ) | | | — | | | | — | | | | (120,957 | ) |
Merrill Lynch International | | | 66,807 | | | | — | | | | — | | | | 66,807 | | | | — | | | | — | | | | — | | | | — | | | | 66,807 | | | | — | | | | — | | | | 66,807 | |
Morgan Stanley & Co. International PLC | | | — | | | | 33,854 | | | | — | | | | 33,854 | | | | — | | | | — | | | | — | | | | — | | | | 33,854 | | | | — | | | | — | | | | 33,854 | |
Morgan Stanley & Co. LLC | | | 51,439 | | | | — | | | | — | | | | 51,439 | | | | (59,510 | ) | | | — | | | | — | | | | (59,510 | ) | | | (8,071 | ) | | | — | | | | — | | | | (8,071 | ) |
Total | | $ | 763,054 | | | $ | 62,372 | | | $ | 177,929 | | | $ | 1,003,355 | | | $ | (940,958 | ) | | $ | (22,032 | ) | | $ | (9,683 | ) | | $ | (972,673 | ) | | $ | 30,682 | | | $ | — | | | $ | — | | | $ | 30,682 | |
27 Invesco World Bond Fund
Effect of Derivative Investments for the year ended October 31, 2017
The table below summarizes the gains (losses) on derivative investments, detailed by primary risk exposure, recognized in earnings during the period:
| | | | | | | | | | | | | | | | | | | | |
| | | Location of Gain (Loss) on Statement of Operations | |
| | | Credit
Risk | | | Currency
Risk | | | Equity
Risk | | | Interest Rate
Risk | | | Total | |
Realized Gain (Loss): | | | | | | | | | | | | | | | | | | | | |
Forward foreign currency contracts | | $ | — | | | $ | (996,032 | ) | | $ | — | | | $ | — | | | $ | (996,032 | ) |
Futures contracts | | | — | | | | — | | | | — | | | | 33,685 | | | | 33,685 | |
Options purchased(a) | | | — | | | | (77,255 | ) | | | — | | | | (793 | ) | | | (78,048 | ) |
Options written | | | 969 | | | | 12,811 | | | | — | | | | — | | | | 13,780 | |
Swap agreements | | | (225,362 | ) | | | — | | | | (32,079 | ) | | | 36,197 | | | | (221,244 | ) |
Change in Net Unrealized Appreciation (Depreciation): | | | | | | | | | | | | | | | | | | | | |
Forward foreign currency contracts | | | — | | | | (162,396 | ) | | | — | | | | — | | | | (162,396 | ) |
Futures contracts | | | — | | | | — | | | | — | | | | (94,274 | ) | | | (94,274 | ) |
Options purchased(a) | | | — | | | | (11,509 | ) | | | — | | | | 10,004 | | | | (1,505 | ) |
Options written | | | — | | | | 563 | | | | — | | | | — | | | | 563 | |
Swap agreements | | | 156,970 | | | | — | | | | 11,347 | | | | 3,644 | | | | 171,961 | |
Total | | $ | (67,423 | ) | | $ | (1,233,818 | ) | | $ | (20,732 | ) | | $ | (11,537 | ) | | $ | (1,333,510 | ) |
| (a) | Options purchased are included in the net realized gain (loss) from investment securities and the change in net unrealized appreciation (depreciation) of investment securities. |
The table below summarizes the twelve month average notional value of forward foreign currency contracts, futures contracts, options purchased and swap agreements and the six month average notional value of options written.
| | | | | | | | | | | | | | | | | | | | |
| | | Forward
Foreign Currency
Contracts | | | Futures
Contracts | | | Options
Purchased | | | Options
Written | | | Swap
Agreements | |
Average notional value | | $ | 57,496,652 | | | $ | 2,870,134 | | | $ | 62,703,212 | | | $ | 1,035,269 | | | $ | 17,811,283 | |
NOTE 5—Expense Offset Arrangement(s)
The expense offset arrangement is comprised of transfer agency credits which result from balances in demand deposit accounts used by the transfer agent for clearing shareholder transactions. For the year ended October 31, 2017, the Fund received credits from this arrangement, which resulted in the reduction of the Fund’s total expenses of $1,448.
NOTE 6—Trustees’ and Officers’ Fees and Benefits
Trustees’ and Officers’ Fees and Benefits include amounts accrued by the Fund to pay remuneration to certain Trustees and Officers of the Fund. Trustees have the option to defer compensation payable by the Fund, and Trustees’ and Officers’ Fees and Benefits also include amounts accrued by the Fund to fund such deferred compensation amounts. Those Trustees who defer compensation have the option to select various Invesco Funds in which their deferral accounts shall be deemed to be invested. Finally, certain current Trustees were eligible to participate in a retirement plan that provided for benefits to be paid upon retirement to Trustees over a period of time based on the number of years of service. The Fund may have certain former Trustees who also participate in a retirement plan and receive benefits under such plan. Trustees’ and Officers’ Fees and Benefits include amounts accrued by the Fund to fund such retirement benefits. Obligations under the deferred compensation and retirement plans represent unsecured claims against the general assets of the Fund.
NOTE 7—Cash Balances
The Fund may borrow for leveraging in an amount up to 5% of the Fund’s total assets (excluding the amount borrowed) at the time the borrowing is made. In doing so, the Fund is permitted to temporarily carry a negative or overdrawn balance in its account with State Street Bank and Trust Company, the custodian bank. Such balances, if any at period end, are shown in the Statement of Assets and Liabilities under the payable caption Amount due custodian. To compensate the custodian bank for such overdrafts, the overdrawn Fund may either (1) leave funds as a compensating balance in the account so the custodian bank can be compensated by earning the additional interest; or (2) compensate by paying the custodian bank at a rate agreed upon by the custodian bank and Invesco, not to exceed the contractually agreed upon rate. The Fund may not purchase additional securities when any borrowings from banks exceed 5% of the Fund’s total assets.
28 Invesco World Bond Fund
NOTE 8—Distributions to Shareholders and Tax Components of Net Assets
Tax Character of Distributions to Shareholders Paid During the Fiscal Years Ended October 31, 2017 and 2016:
| | | | | | | | | | | | |
| | | 2017 | | | | | | 2016 | |
Ordinary income | | $ | 132,292 | | | | | | | $ | 185,147 | |
Long-term capital gain | | | — | | | | | | | | 156,806 | |
Return of capital | | | 793,207 | | | | | | | | 301,074 | |
Total distributions | | $ | 925,499 | | | | | | | $ | 643,027 | |
Tax Components of Net Assets at Period-End:
| | | | |
| | | 2017 | |
Net unrealized appreciation — investments | | $ | 744,243 | |
Net unrealized appreciation (depreciation) — foreign currencies | | | (18,536 | ) |
Temporary book/tax differences | | | (37,664 | ) |
Capital loss carryforward | | | (1,144,642 | ) |
Shares of beneficial interest | | | 32,779,291 | |
Total net assets | | $ | 32,322,692 | |
The difference between book-basis and tax-basis unrealized appreciation (depreciation) is due to differences in the timing of recognition of gains and losses on investments for tax and book purposes. The Fund’s net unrealized appreciation difference is attributable primarily to futures contracts, straddles and wash sales.
The temporary book/tax differences are a result of timing differences between book and tax recognition of income and/or expenses. The Fund’s temporary book/tax differences are the result of the trustee deferral of compensation and retirement plan benefits.
Capital loss carryforward is calculated and reported as of a specific date. Results of transactions and other activity after that date may affect the amount of capital loss carryforward actually available for the Fund to utilize. Capital losses generated in years beginning after December 22, 2010 can be carried forward for an unlimited period, whereas previous losses expire in eight tax years. Capital losses with an expiration period may not be used to offset capital gains until all net capital losses without an expiration date have been utilized. Capital loss carryforwards with no expiration date will retain their character as either short-term or long-term capital losses instead of as short-term capital losses as under prior law. The ability to utilize capital loss carryforwards in the future may be limited under the Internal Revenue Code and related regulations based on the results of future transactions.
The Fund has a capital loss carryforward as of October 31, 2017 as follows:
| | | | | | | | | | | | |
| Capital Loss Carryforward* | |
| Expiration | | Short-Term | | | Long-Term | | | Total | |
Not subject to expiration | | $ | 676,863 | | | $ | 467,779 | | | $ | 1,144,642 | |
| * | Capital loss carryforward as of the date listed above is reduced for limitations, if any, to the extent required by the Internal Revenue Code and may be further limited depending upon a variety of factors, including the realization of net unrealized gains or losses as of the date of any reorganization. |
NOTE 9—Investment Transactions
The aggregate amount of investment securities (other than short-term securities, U.S. Treasury obligations and money market funds, if any) purchased and sold by the Fund during the year ended October 31, 2017 was $69,540,473 and $89,142,974, respectively. During the same period, purchases and sales of U.S. Treasury obligations were $10,167,611 and $4,275,068, respectively. Cost of investments, including any derivatives, on a tax basis includes the adjustments for financial reporting purposes as of the most recently completed federal income tax reporting period-end.
| | | | |
| Unrealized Appreciation (Depreciation) of Investments on a Tax Basis | |
Aggregate unrealized appreciation of investments | | $ | 2,165,519 | |
Aggregate unrealized (depreciation) of investments | | | (1,421,276 | ) |
Net unrealized appreciation of investments | | $ | 744,243 | |
Cost of investments for tax purposes is $29,275,510.
NOTE 10—Reclassification of Permanent Differences
Primarily as a result of differing book/tax treatment of foreign currency transactions, distributions and swap agreement income, on October 31, 2017, undistributed net investment income was decreased by $31,748, undistributed net realized gain (loss) was increased by $824,954 and shares of beneficial interest was decreased by $793,206. This reclassification had no effect on the net assets of the Fund.
29 Invesco World Bond Fund
NOTE 11—Share Information
| | | | | | | | | | | | | | | | |
| | | Summary of Share Activity | |
| | | Years ended October 31, | |
| | | 2017(a) | | | 2016 | |
| | | Shares | | | Amount | | | Shares | | | Amount | |
Sold: | | | | | | | | | | | | | | | | |
Class A | | | 386,135 | | | $ | 3,976,564 | | | | 981,590 | | | $ | 10,283,740 | |
Class B | | | 2,297 | | | | 22,928 | | | | 5,051 | | | | 51,039 | |
Class C | | | 88,362 | | | | 906,574 | | | | 215,278 | | | | 2,170,817 | |
Class Y | | | 611,943 | | | | 6,211,858 | | | | 1,491,034 | | | | 15,491,121 | |
Class R5 | | | 2,567 | | | | 27,121 | | | | — | | | | — | |
Class R6 | | | — | | | | — | | | | 129,251 | | | | 1,243,370 | |
| | | | |
Issued as reinvestment of dividends: | | | | | | | | | | | | | | | | |
Class A | | | 56,789 | | | | 577,805 | | | | 36,686 | | | | 380,582 | |
Class B | | | 600 | | | | 6,090 | | | | 425 | | | | 4,396 | |
Class C | | | 6,981 | | | | 70,996 | | | | 3,461 | | | | 36,065 | |
Class Y | | | 18,568 | | | | 188,436 | | | | 9,101 | | | | 95,884 | |
Class R6 | | | — | | | | — | | | | 7,558 | | | | 72,784 | |
| | | | |
Automatic conversion of Class B shares to Class A shares: | | | | | | | | | | | | | | | | |
Class A | | | 18,145 | | | | 185,281 | | | | 36,838 | | | | 372,595 | |
Class B | | | (18,156 | ) | | | (185,281 | ) | | | (36,896 | ) | | | (372,595 | ) |
| | | | |
Reacquired: | | | | | | | | | | | | | | | | |
Class A | | | (1,101,023 | ) | | | (11,183,581 | ) | | | (984,775 | ) | | | (10,183,803 | ) |
Class B | | | (8,550 | ) | | | (87,069 | ) | | | (15,599 | ) | | | (156,640 | ) |
Class C | | | (188,446 | ) | | | (1,913,284 | ) | | | (237,901 | ) | | | (2,403,850 | ) |
Class Y | | | (1,081,055 | ) | | | (10,940,824 | ) | | | (668,294 | ) | | | (7,051,423 | ) |
Class R5 | | | (2,567 | ) | | | (27,112 | ) | | | — | | | | — | |
Class R6(b) | | | — | | | | — | | | | (2,114,835 | ) | | | (20,624,974 | ) |
Net increase (decrease) in share activity | | | (1,207,410 | ) | | $ | (12,163,498 | ) | | | (1,142,027 | ) | | $ | (10,590,892 | ) |
| (a) | There are entities that are record owners of more than 5% of the outstanding shares of the Fund and in the aggregate own 41% of the outstanding shares of the Fund. IDI has an agreement with these entities to sell Fund shares. The Fund, Invesco and/or Invesco affiliates may make payments to these entities, which are considered to be related to the Fund, for providing services to the Fund, Invesco and/or Invesco affiliates including but not limited to services such as securities brokerage, distribution, third party record keeping and account servicing. The Fund has no knowledge as to whether all or any portion of the shares owned of record by these entities are also owned beneficially. |
| (b) | On February 18, 2016, 2,112,864 Class R6 shares valued at $20,600,421 were redeemed by affiliated mutual funds. |
30 Invesco World Bond Fund
NOTE 12—Financial Highlights
The following schedule presents financial highlights for a share of the Fund outstanding throughout the periods indicated.
| | | | | | | | | | | | | | | | | | | | | | | | | | | | | | | | | | | | | | | | | | | | | | | | | | | | | | | | | | | | |
| | | Net asset
value,
beginning
of period | | | Net
investment
income(a) | | | Net gains
(losses)
on securities
(both
realized and
unrealized) | | | Total from
investment
operations | | | Dividends
from net
investment
income | | | Distributions
from net
realized
gains | | | Return of
Capital | | | Total
distributions | | | Net asset
value, end
of period | | | Total
return(b) | | | Net assets,
end of period
(000’s omitted) | | | Ratio of
expenses
to average
net assets
with fee waivers
and/or expenses
absorbed | | | Ratio of
expenses
to average net
assets without
fee waivers and/or expenses
absorbed | | | Ratio of net
investment
income
to average
net assets | | | Portfolio
turnover(c) | |
Class A | | | | | | | | | | | | | | | | | | | | | | | | | | | | | | | | | | | | | | | | | | | | | | | | | | | | | | | | | | | | |
Year ended 10/31/17 | | $ | 10.44 | | | $ | 0.33 | | | $ | (0.07 | ) | | $ | 0.26 | | | $
| (0.04
| )
| | $ | — | | | $ | (0.23 | ) | | $ | (0.27 | ) | | $ | 10.43 | | | | 2.63 | % | | $ | 22,150 | | | | 0.95 | %(d) | | | 2.21 | %(d) | | | 3.22 | %(d) | | | 245 | % |
Year ended 10/31/16 | | | 9.81 | | | | 0.25 | | | | 0.54 | | | | 0.79 | | | | (0.08 | ) | | | — | | | | (0.08 | ) | | | (0.16 | ) | | | 10.44 | | | | 8.02 | | | | 28,870 | | | | 1.10 | | | | 1.84 | | | | 2.36 | | | | 246 | |
Year ended 10/31/15 | | | 10.63 | | | | 0.18 | | | | (0.74 | ) | | | (0.56 | ) | | | — | | | | (0.14 | ) | | | (0.12 | ) | | | (0.26 | ) | | | 9.81 | | | | (5.38 | ) | | | 26,426 | | | | 1.10 | | | | 1.72 | | | | 1.79 | | | | 135 | |
Year ended 10/31/14 | | | 11.07 | | | | 0.20 | | | | (0.30 | ) | | | (0.10 | ) | | | (0.12 | ) | | | (0.22 | ) | | | — | | | | (0.34 | ) | | | 10.63 | | | | (0.97 | ) | | | 32,668 | | | | 1.10 | | | | 1.68 | | | | 1.83 | | | | 237 | |
Year ended 10/31/13 | | | 11.37 | | | | 0.18 | | | | (0.37 | ) | | | (0.19 | ) | | | (0.11 | ) | | | — | | | | — | | | | (0.11 | ) | | | 11.07 | | | | (1.68 | ) | | | 33,019 | | | | 1.10 | | | | 1.68 | | | | 1.65 | | | | 233 | |
Class B | | | | | | | | | | | | | | | | | | | | | | | | | | | | | | | | | | | | | | | | | | | | | | | | | | | | | | | | | | | | |
Year ended 10/31/17 | | | 10.43 | | | | 0.25 | | | | (0.07 | ) | | | 0.18 | | | | (0.03 | ) | | | — | | | | (0.16 | ) | | | (0.19 | ) | | | 10.42 | | | | 1.80 | | | | 217 | | | | 1.70 | (d) | | | 2.96 | (d) | | | 2.47 | (d) | | | 245 | |
Year ended 10/31/16 | | | 9.79 | | | | 0.16 | | | | 0.56 | | | | 0.72 | | | | (0.05 | ) | | | — | | | | (0.03 | ) | | | (0.08 | ) | | | 10.43 | | | | 7.35 | | | | 466 | | | | 1.85 | | | | 2.59 | | | | 1.61 | | | | 246 | |
Year ended 10/31/15 | | | 10.62 | | | | 0.10 | | | | (0.75 | ) | | | (0.65 | ) | | | — | | | | (0.14 | ) | | | (0.04 | ) | | | (0.18 | ) | | | 9.79 | | | | (6.19 | ) | | | 898 | | | | 1.85 | | | | 2.47 | | | | 1.04 | | | | 135 | |
Year ended 10/31/14 | | | 11.05 | | | | 0.12 | | | | (0.30 | ) | | | (0.18 | ) | | | (0.03 | ) | | | (0.22 | ) | | | — | | | | (0.25 | ) | | | 10.62 | | | | (1.63 | ) | | | 1,867 | | | | 1.85 | | | | 2.43 | | | | 1.08 | | | | 237 | |
Year ended 10/31/13 | | | 11.36 | | | | 0.10 | | | | (0.38 | ) | | | (0.28 | ) | | | (0.03 | ) | | | — | | | | — | | | | (0.03 | ) | | | 11.05 | | | | (2.50 | ) | | | 2,850 | | | | 1.85 | | | | 2.43 | | | | 0.90 | | | | 233 | |
Class C | | | | | | | | | | | | | | | | | | | | | | | | | | | | | | | | | | | | | | | | | | | | | | | | | | | | | | | | | | | | |
Year ended 10/31/17 | | | 10.42 | | | | 0.25 | | | | (0.07 | ) | | | 0.18 | | | | (0.03 | ) | | | — | | | | (0.16 | ) | | | (0.19 | ) | | | 10.41 | | | | 1.80 | | | | 4,147 | | | | 1.70 | (d) | | | 2.96 | (d) | | | 2.47 | (d) | | | 245 | |
Year ended 10/31/16 | | | 9.79 | | | | 0.17 | | | | 0.54 | | | | 0.71 | | | | (0.05 | ) | | | — | | | | (0.03 | ) | | | (0.08 | ) | | | 10.42 | | | | 7.24 | | | | 5,121 | | | | 1.85 | | | | 2.59 | | | | 1.61 | | | | 246 | |
Year ended 10/31/15 | | | 10.61 | | | | 0.10 | | | | (0.74 | ) | | | (0.64 | ) | | | — | | | | (0.14 | ) | | | (0.04 | ) | | | (0.18 | ) | | | 9.79 | | | | (6.10 | ) | | | 4,998 | | | | 1.85 | | | | 2.47 | | | | 1.04 | | | | 135 | |
Year ended 10/31/14 | | | 11.04 | | | | 0.12 | | | | (0.30 | ) | | | (0.18 | ) | | | (0.03 | ) | | | (0.22 | ) | | | — | | | | (0.25 | ) | | | 10.61 | | | | (1.63 | ) | | | 6,441 | | | | 1.85 | | | | 2.43 | | | | 1.08 | | | | 237 | |
Year ended 10/31/13 | | | 11.35 | | | | 0.10 | | | | (0.38 | ) | | | (0.28 | ) | | | (0.03 | ) | | | — | | | | — | | | | (0.03 | ) | | | 11.04 | | | | (2.50 | ) | | | 5,562 | | | | 1.85 | | | | 2.43 | | | | 0.90 | | | | 233 | |
Class Y | | | | | | | | | | | | | | | | | | | | | | | | | | | | | | | | | | | | | | | | | | | | | | | | | | | | | | | | | | | | |
Year ended 10/31/17 | | | 10.44 | | | | 0.35 | | | | (0.07 | ) | | | 0.28 | | | | (0.04 | ) | | | — | | | | (0.26 | ) | | | (0.30 | ) | | | 10.42 | | | | 2.81 | | | | 5,797 | | | | 0.70 | (d) | | | 1.96 | (d) | | | 3.47 | (d) | | | 245 | |
Year ended 10/31/16 | | | 9.80 | | | | 0.27 | | | | 0.55 | | | | 0.82 | | | | (0.07 | ) | | | — | | | | (0.11 | ) | | | (0.18 | ) | | | 10.44 | | | | 8.40 | | | | 10,509 | | | | 0.85 | | | | 1.59 | | | | 2.61 | | | | 246 | |
Year ended 10/31/15 | | | 10.63 | | | | 0.21 | | | | (0.76 | ) | | | (0.55 | ) | | | — | | | | (0.14 | ) | | | (0.14 | ) | | | (0.28 | ) | | | 9.80 | | | | (5.23 | ) | | | 1,716 | | | | 0.85 | | | | 1.47 | | | | 2.04 | | | | 135 | |
Year ended 10/31/14 | | | 11.06 | | | | 0.23 | | | | (0.30 | ) | | | (0.07 | ) | | | (0.14 | ) | | | (0.22 | ) | | | — | | | | (0.36 | ) | | | 10.63 | | | | (0.63 | ) | | | 4,989 | | | | 0.85 | | | | 1.43 | | | | 2.08 | | | | 237 | |
Year ended 10/31/13 | | | 11.37 | | | | 0.21 | | | | (0.39 | ) | | | (0.18 | ) | | | (0.13 | ) | | | — | | | | — | | | | (0.13 | ) | | | 11.06 | | | | (1.52 | ) | | | 982 | | | | 0.85 | | | | 1.43 | | | | 1.90 | | | | 233 | |
Class R5 | | | | | | | | | | | | | | | | | | | | | | | | | | | | | | | | | | | | | | | | | | | | | | | | | | | | | | | | | | | | |
Year ended 10/31/17 | | | 10.44 | | | | 0.36 | | | | (0.08 | ) | | | 0.28 | | | | (0.04 | ) | | | — | | | | (0.26 | ) | | | (0.30 | ) | | | 10.42 | | | | 2.81 | | | | 1 | | | | 0.70 | (d) | | | 1.77 | (d) | | | 3.47 | (d) | | | 245 | |
Year ended 10/31/16 | | | 9.81 | | | | 0.27 | | | | 0.54 | | | | 0.81 | | | | (0.07 | ) | | | — | | | | (0.11 | ) | | | (0.18 | ) | | | 10.44 | | | | 8.29 | | | | 1 | | | | 0.85 | | | | 1.30 | | | | 2.61 | | | | 246 | |
Year ended 10/31/15 | | | 10.64 | | | | 0.21 | | | | (0.76 | ) | | | (0.55 | ) | | | – | | | | (0.14 | ) | | | (0.14 | ) | | | (0.28 | ) | | | 9.81 | | | | (5.23 | ) | | | 1 | | | | 0.85 | | | | 1.16 | | | | 2.04 | | | | 135 | |
Year ended 10/31/14 | | | 11.07 | | | | 0.23 | | | | (0.30 | ) | | | (0.07 | ) | | | (0.14 | ) | | | (0.22 | ) | | | — | | | | (0.36 | ) | | | 10.64 | | | | (0.63 | ) | | | 118 | | | | 0.85 | | | | 1.15 | | | | 2.08 | | | | 237 | |
Year ended 10/31/13 | | | 11.37 | | | | 0.21 | | | | (0.38 | ) | | | (0.17 | ) | | | (0.13 | ) | | | — | | | | — | | | | (0.13 | ) | | | 11.07 | | | | (1.43 | ) | | | 282 | | | | 0.85 | | | | 1.16 | | | | 1.90 | | | | 233 | |
Class R6 | | | | | | | | | | | | | | | | | | | | | | | | | | | | | | | | | | | | | | | | | | | | | | | | | | | | | | | | | | | | |
Year ended 10/31/17 | | | 10.44 | | | | 0.36 | | | | (0.07 | ) | | | 0.29 | | | | (0.04 | ) | | | — | | | | (0.26 | ) | | | (0.30 | ) | | | 10.43 | | | | 2.91 | | | | 11 | | | | 0.70 | (d) | | | 1.77 | (d) | | | 3.47 | (d) | | | 245 | |
Year ended 10/31/16 | | | 9.81 | | | | 0.25 | | | | 0.56 | | | | 0.81 | | | | (0.07 | ) | | | — | | | | (0.11 | ) | | | (0.18 | ) | | | 10.44 | | | | 8.29 | | | | 11 | | | | 0.85 | | | | 1.30 | | | | 2.61 | | | | 246 | |
Year ended 10/31/15 | | | 10.63 | | | | 0.20 | | | | (0.74 | ) | | | (0.54 | ) | | | — | | | | (0.14 | )�� | | | (0.14 | ) | | | (0.28 | ) | | | 9.81 | | | | (5.14 | ) | | | 19,413 | | | | 0.85 | | | | 1.16 | | | | 2.04 | | | | 135 | |
Year ended 10/31/14 | | | 11.07 | | | | 0.23 | | | | (0.31 | ) | | | (0.08 | ) | | | (0.14 | ) | | | (0.22 | ) | | | — | | | | (0.36 | ) | | | 10.63 | | | | (0.72 | ) | | | 12,637 | | | | 0.85 | | | | 1.14 | | | | 2.08 | | | | 237 | |
Year ended 10/31/13 | | | 11.37 | | | | 0.21 | | | | (0.38 | ) | | | (0.17 | ) | | | (0.13 | ) | | | — | | | | — | | | | (0.13 | ) | | | 11.07 | | | | (1.43 | ) | | | 8,752 | | | | 0.85 | | | | 1.16 | | | | 1.90 | | | | 233 | |
| (a) | Calculated using average shares outstanding. |
| (b) | Includes adjustments in accordance with accounting principles generally accepted in the United States of America and as such, the net asset value for financial reporting purposes and the returns based upon those net asset values may differ from the net asset value and returns for shareholder transactions. Does not include sales charges and is not annualized for periods less than one year, if applicable. |
| (c) | Portfolio turnover is calculated at the fund level and is not annualized for periods less than one year, if applicable. |
| (d) | Ratios are based on average daily net assets (000’s omitted) of $23,329, $346, $4,258, $7,368, $1 and $11 for Class A, Class B, Class C, Class Y, Class R5 and Class R6 shares, respectively. |
NOTE 13—Subsequent Event
On December 1, 2017, the Fund’s Board of Trustees approved the early conversion of the remaining assets in the Fund’s Class B shares into Class A shares to occur on or about January 26, 2018. At the close of business on or about January 26, 2018, (the “Conversion Date”) all outstanding Class B shares of the Fund will be converted to Class A shares of the Fund, which is prior to the date the Class B shares would normally be converted to Class A shares. Once the conversion is completed, Class B shares will be closed and become inactive. No contingent deferred sales charges will be payable in connection with this early conversion. The conversion of the Fund’s Class B shares into Class A shares on the Conversion Date is not expected to be a taxable event for federal income tax purposes, and should not result in the recognition of gain or loss by converting shareholders, although each shareholder should consult with his or her own tax adviser.
31 Invesco World Bond Fund
Report of Independent Registered Public Accounting Firm
To the Board of Trustees of AIM Investment Funds (Invesco Investment Funds) and Shareholders of Invesco World Bond Fund:
In our opinion, the accompanying statement of assets and liabilities, including the schedule of investments, and the related statements of operations and of changes in net assets and the financial highlights present fairly, in all material respects, the financial position of Invesco World Bond Fund (one of the portfolios constituting the AIM Investment Funds (Invesco Investment Funds), hereafter referred to as the “Fund”) as of October 31, 2017, the results of its operations for the year then ended, the changes in its net assets for each of the two years in the period then ended and the financial highlights for each of the five years in the period then ended, in conformity with accounting principles generally accepted in the United States of America. These financial statements and financial highlights (hereafter referred to as “financial statements”) are the responsibility of the Fund’s management. Our responsibility is to express an opinion on these financial statements based on our audits. We conducted our audits of these financial statements in accordance with the standards of the Public Company Accounting Oversight Board (United States). Those standards require that we plan and perform the audit to obtain reasonable assurance about whether the financial statements are free of material misstatement. An audit includes examining, on a test basis, evidence supporting the amounts and disclosures in the financial statements, assessing the accounting principles used and significant estimates made by management, and evaluating the overall financial statement presentation. We believe that our audits, which included confirmation of securities as of October 31, 2017 by correspondence with the custodian, transfer agent and brokers, and when replies were not received from brokers, we performed other auditing procedures, provide a reasonable basis for our opinion.
PricewaterhouseCoopers LLP
Houston, Texas
December 21, 2017
32 Invesco World Bond Fund
Calculating your ongoing Fund expenses
Example
As a shareholder of the Fund, you incur two types of costs: (1) transaction costs, which may include sales charges (loads) on purchase payments or contingent deferred sales charges on redemptions, if any; and (2) ongoing costs, including management fees, distribution and/or service (12b-1) fees, and other Fund expenses. This example is intended to help you understand your ongoing costs (in dollars) of investing in the Fund and to compare these costs with ongoing costs of investing in other mutual funds. The example is based on an investment of $1,000 invested at the beginning of the period and held for the entire period May 1, 2017 through October 31, 2017.
Actual expenses
The table below provides information about actual account values and actual expenses. You may use the information in this table, together with the amount you invested, to estimate the expenses that you paid over the period. Simply divide your account value by $1,000 (for example, an $8,600 account value divided by $1,000 = 8.6), then multiply the result by the number in the table under the heading entitled “Actual Expenses Paid During Period” to estimate the expenses you paid on your account during this period.
Hypothetical example for comparison purposes
The table below also provides information about hypothetical account values and hypothetical expenses based on the Fund’s actual expense ratio and an assumed rate of return of 5% per year before expenses, which is not the Fund’s actual return.
The hypothetical account values and expenses may not be used to estimate the actual ending account balance or expenses you paid for the period. You may use this information to compare the ongoing costs of investing in the Fund and other funds. To do so, compare this 5% hypothetical example with the 5% hypothetical examples that appear in the shareholder reports of the other funds.
Please note that the expenses shown in the table are meant to highlight your ongoing costs only and do not reflect any transaction costs, such as sales charges (loads) on purchase payments or contingent deferred sales charges on redemptions, if any. Therefore, the hypothetical information is useful in comparing ongoing costs only, and will not help you determine the relative total costs of owning different funds. In addition, if these transaction costs were included, your costs would have been higher.
| | | | | | | | | | | | | | | | | | | | | | | | |
| Class | | Beginning
Account Value
(05/01/17) | | | ACTUAL | | | HYPOTHETICAL
(5% annual return before
expenses) | | | Annualized
Expense
Ratio | |
| | | Ending
Account Value
(10/31/17)1 | | | Expenses
Paid During
Period2 | | | Ending
Account Value
(10/31/17) | | | Expenses
Paid During
Period2 | | |
| A | | $ | 1,000.00 | | | $ | 1,034.90 | | | $ | 4.82 | | | $ | 1,020.47 | | | $ | 4.79 | | | | 0.94 | % |
| B | | | 1,000.00 | | | | 1,031.00 | | | | 8.65 | | | | 1,016.69 | | | | 8.59 | | | | 1.69 | |
| C | | | 1,000.00 | | | | 1,031.10 | | | | 8.65 | | | | 1,016.69 | | | | 8.59 | | | | 1.69 | |
| Y | | | 1,000.00 | | | | 1,036.20 | | | | 3.54 | | | | 1,021.73 | | | | 3.52 | | | | 0.69 | |
| R5 | | | 1,000.00 | | | | 1,036.20 | | | | 3.54 | | | | 1,021.73 | | | | 3.52 | | | | 0.69 | |
| R6 | | | 1,000.00 | | | | 1,036.20 | | | | 3.54 | | | | 1,021.73 | | | | 3.52 | | | | 0.69 | |
| 1 | The actual ending account value is based on the actual total return of the Fund for the period May 1, 2017 through October 31, 2017, after actual expenses and will differ from the hypothetical ending account value which is based on the Fund’s expense ratio and a hypothetical annual return of 5% before expenses. |
| 2 | Expenses are equal to the Fund’s annualized expense ratio as indicated above multiplied by the average account value over the period, multiplied by 184/365 to reflect the most recent fiscal half year. |
33 Invesco World Bond Fund
Approval of Investment Advisory and Sub-Advisory Contracts
The Board of Trustees (the Board) of AIM Investment Funds (Invesco Investment Funds) is required under the Investment Company Act of 1940, as amended, to approve annually the renewal of Invesco World Bond Fund’s (formerly, Invesco International Total Return Fund) (the Fund) investment advisory agreements. During contract renewal meetings held on June 12-13, 2017, the Board as a whole, and the disinterested or “independent” Trustees, who comprise over 75% of the Board, voting separately, approved the continuance for the Fund of the Master Investment Advisory Agreement with Invesco Advisers, Inc. (Invesco Advisers and the investment advisory agreement) and the Master Intergroup Sub-Advisory Contract for Mutual Funds with Invesco Asset Management Deutschland GmbH, Invesco Asset Management Limited, Invesco Asset Management (Japan) Limited, Invesco Hong Kong Limited, Invesco Senior Secured Management, Inc. and Invesco Canada Ltd. (collectively, the Affiliated Sub-Advisers and the sub-advisory contracts) for another year, effective July 1, 2017.
In evaluating the fairness and reasonableness of compensation under the Fund’s investment advisory agreement and sub-advisory contracts, the Board considered, among other things, the factors discussed below. The Board determined that continuation of the Fund’s investment advisory agreement and the sub-advisory contracts is in the best interest of the Fund and its shareholders and that the compensation payable to Invesco Advisers and the Affiliated Sub-Advisers under the agreements is fair and reasonable.
The Board’s Fund Evaluation Process
The Board’s Investments Committee has established three Sub-Committees, which meet throughout the year to review the performance of funds advised by Invesco Advisers (the Invesco Funds). Over the course of each year, the Sub-Committees meet with portfolio managers for their assigned Invesco Funds and other members of management to review the performance, investment objective(s), policies, strategies, limitations and investment risks of these funds. The Board had the benefit of reports from the Sub-Committees and Investments Committee throughout the year in considering approval of the continuance of each Invesco Fund’s investment advisory agreement and sub-advisory contracts for another year.
During the contract renewal process, the Board receives comparative performance and fee data regarding the Invesco Funds prepared by Invesco Advisers and Broadridge Financial Solutions, Inc. (Broadridge), an independent provider of investment company data. The Board also receives an independent written evaluation from the Senior Officer, an officer of the Invesco Funds who reports directly to the
independent Trustees. The Senior Officer’s evaluation is prepared as part of his responsibility to manage the process by which the Invesco Funds’ proposed management fees are negotiated during the annual contract renewal process to ensure they are negotiated in a manner that is at arms’ length and reasonable. In addition to meetings with Invesco Advisers and fund counsel, the independent Trustees also discuss the continuance of the investment advisory agreement and sub-advisory contracts in separate sessions with the Senior Officer and with independent legal counsel.
The Trustees recognized that the advisory fee rates for the Invesco Funds are, in most cases, the result of years of review and negotiation. The Trustees’ deliberations and conclusions in a particular year may be based in part on their deliberations and conclusions regarding these arrangements throughout the year and in prior years. The Trustees’ review and conclusions are based on the comprehensive consideration of all information presented to them and are not the result of any single determinative factor. Moreover, one Trustee may have weighed a particular piece of information or factor differently than another Trustee.
The discussion below is a summary of the Senior Officer’s independent written evaluation with respect to the Fund’s investment advisory agreement as well as a discussion of the material factors and related conclusions that formed the basis for the Board’s approval of the Fund’s investment advisory agreement and sub-advisory contracts. This information is current as of June 13, 2017, and does not reflect consideration of factors that became known to the Board after that date.
Factors and Conclusions and Summary of Independent Written Fee Evaluation
| A. | Nature, Extent and Quality of Services Provided by Invesco Advisers and the Affiliated Sub-Advisers |
The Board reviewed the advisory services provided to the Fund by Invesco Advisers under the Fund’s investment advisory agreement, the performance of Invesco Advisers in providing these services, and the credentials and experience of the officers and employees of Invesco Advisers who provide these services, including the Fund’s portfolio manager or managers. The Board’s review included consideration of Invesco Advisers’ investment process oversight, credit analysis and investment risk management. The Board also considered non-advisory services that Invesco Advisers and its affiliates provide to the Invesco Funds such as various back office support functions, trading operations, internal audit, valuation and legal and compliance.
In determining whether to continue the Fund’s investment advisory agreement, the
Board considered the benefits of reapproving an existing relationship as contrasted with the greater uncertainty that may be associated with entering into a new relationship. The Board concluded that the nature, extent and quality of the services provided to the Fund by Invesco Advisers are appropriate and satisfactory.
The Board reviewed the services that may be provided by the Affiliated Sub-Advisers under the sub-advisory contracts and the credentials and experience of the officers and employees of the Affiliated Sub-Advisers who provide these services. The Board noted that the Affiliated Sub-Advisers have offices and personnel that are located in financial centers around the world. As a result, the Board noted that the Affiliated Sub-Advisers can provide research and investment analysis on the markets and economies of various countries in which the Fund may invest, make recommendations regarding securities and assist with security trades. The Board concluded that the sub-advisory contracts may benefit the Fund and its shareholders by permitting Invesco Advisers to use the resources and talents of the Affiliated Sub-Advisers in managing the Fund. The Board concluded that the nature, extent and quality of the services that may be provided by the Affiliated Sub-Advisers are appropriate and satisfactory.
| B. | Fund Investment Performance |
The Board considered Fund investment performance as a relevant factor in considering whether to approve the investment advisory agreement as well as the sub-advisory contracts for the Fund, as Invesco Asset Management Limited currently manages assets of the Fund.
The Board noted that the name of the Fund was changed and the benchmark was changed to the Lipper Global Income Funds Index effective December 1, 2016. The Board compared the Fund’s investment performance during over multiple time periods ending December 31, 2106 to the performance of funds in the Broadridge performance universe and against the Lipper International Income Funds Index. The Board noted that performance of Class A shares of the Fund was in the second quintile of its performance universe for the one year period and the third quintile for the three and five year periods (the first quintile being the best performing funds and the fifth quintile being the worst performing funds). The Board noted that performance of Class A shares of the Fund was above the performance of the Index for the one year period and below the performance of the Index for the three and five year periods. Invesco Advisers noted that the Fund has broader exposure to the U.S. Dollar effective with the name change. The Trustees also reviewed more recent Fund performance and this review did not change their conclusions.
34 Invesco World Bond Fund
| C. | Advisory and Sub-Advisory Fees |
The Board compared the Fund’s contractual management fee rate to the contractual management fee rates of funds in the Fund’s Broadridge expense group at a common asset level. The Board noted that the contractual management fee rate for Class A shares of the Fund was below the median contractual management fee rate of funds in its expense group. The Board noted that the term “contractual management fee” for funds in the expense group may include both advisory and certain administrative services fees, but that Broadridge does not provide information on a fund by fund basis as to what is included. The Board noted that Invesco Advisers does not separately charge the Invesco Funds for the administrative services included in the term as defined by Broadridge. The Board also reviewed the methodology used by Broadridge in providing expense group information, which includes using each fund’s contractual management fee schedule (including any applicable breakpoints) as reported in the most recent prospectus or statement of additional information for each fund in the expense group.
The Board noted that Invesco Advisers has contractually agreed to waive fees and/or limit expenses of the Fund through at least February 28, 2018 in an amount necessary to limit total annual operating expenses to a specificed percentage of average daily net assets for each class of the Fund.
The Board noted that Invesco Advisers and the Affiliated Sub-Advisers do not manage other mutual funds or client accounts with investment strategies comparable to those of the Fund.
The Board also considered the services that may be provided by the Affiliated Sub-Advisers pursuant to the sub-advisory contracts, as well as the fees payable by Invesco Advisers to the Affiliated Sub-Advisers pursuant to the sub-advisory contracts. The Board noted that Invesco Advisers retains overall responsibility for, and provides services to, sub-advised Invesco Funds, including oversight of the Affiliated Sub-Advisers as well as the additional services described herein other than day-to-day portfolio management. The Board also noted that the sub-advisory fees are not paid directly by the Fund, but rather, are payable by Invesco Advisers to the Affiliated Sub-Advisers.
| D. | Economies of Scale and Breakpoints |
The Board considered the extent to which there are economies of scale in the provision of advisory services to the Fund. The Board also considered that the Fund may benefit from economies of scale through contractual breakpoints in the Fund’s advisory fee schedule. The Board noted that the Fund shares directly in economies of scale through lower fees charged by third party service providers based on the combined size of the Invesco Funds advised by Invesco Advisers.
| E. | Profitability and Financial Resources |
The Board reviewed information from Invesco Advisers concerning the costs of the advisory and other services that Invesco Advisers and its
affiliates provide to the Fund and the Invesco Funds and the profitability of Invesco Advisers and its affiliates in providing these services. The Board noted that Invesco Advisers continues to operate at a net profit from services Invesco Advisers and its affiliates provide to the Invesco Funds. The Board noted that although Invesco Advisers received a minimal amount of revenues from advising the Fund, Invesco Advisers and its subsidiaries did not make a profit from managing the Fund. The Board received and accepted information from Invesco Advisers demonstrating that Invesco Advisers and each Affiliated Sub-Adviser are financially sound and have the resources necessary to perform their obligations under the investment advisory agreement and sub-advisory contracts.
| F. | Collateral Benefits to Invesco Advisers and its Affiliates |
The Board considered various other benefits received by Invesco Advisers and its affiliates from the relationship with the Fund, including the fees received for providing transfer agency and distribution services to the Fund. The Board considered comparative information regarding fees charged for these services, including information provided by Broadridge and other independent sources. The Board considered the performance of Invesco Advisers and its affiliates in providing these services and the organizational structure employed to provide these services. The Board also considered that these services are provided to the Fund pursuant to written contracts that are reviewed and approved on an annual basis by the Board; and that the services are required for the operation of the Fund.
The Board considered the benefits realized by Invesco Advisers and the Affiliated Sub-Advisers as a result of portfolio brokerage transactions executed through “soft dollar” arrangements. Invesco Advisers noted that the Fund does not execute brokerage transactions through “soft dollar” arrangements to any significant degree.
The Board considered that the Fund’s uninvested cash and cash collateral from any securities lending arrangements may be invested in money market funds advised by Invesco Advisers pursuant to procedures approved by the Board. The Board noted that Invesco Advisers receives advisory fees from these affiliated money market funds attributable to such investments, although Invesco Advisers has contractually agreed to waive through varying periods the advisory fees payable by the Invesco Funds with respect to certain investments in the affiliated money market funds. The waiver is in an amount equal to 100% of the net advisory fee Invesco Advisers receives from the affiliated money market funds with respect to the Fund’s investment in the affiliated money market funds of uninvested cash, but not cash collateral. The Board concluded that the amount of advisory fees received by Invesco Advisers from the Fund’s investment of cash collateral from any securities lending arrangements in the affiliated money market funds is fair and reasonable.
35 Invesco World Bond Fund
Tax Information
Form 1099-DIV, Form 1042-S and other year-end tax information provide shareholders with actual calendar year amounts that should be included in their tax returns. Shareholders should consult their tax advisors.
The following distribution information is being provided as required by the Internal Revenue Code or to meet a specific state’s requirement.
The Fund designates the following amounts or, if subsequently determined to be different, the maximum amount allowable for its fiscal year ended October 31, 2017:
| | | | |
Federal and State Income Tax | | | |
Qualified Dividend Income* | | | 4.65 | % |
Corporate Dividends Received Deduction* | | | 4.65 | % |
U.S. Treasury Obligations* | | | 5.59 | % |
| | * | The above percentages are based on ordinary income dividends paid to shareholders during the Fund’s fiscal year. |
36 Invesco World Bond Fund
Trustees and Officers
The address of each trustee and officer is AIM Investment Funds (Invesco Investment Funds) (the “Trust”), 11 Greenway Plaza, Suite 1000, Houston, Texas 77046-1173. The trustees serve for the life of the Trust, subject to their earlier death, incapacitation, resignation, retirement or removal as more specifically provided in the Trust’s organizational documents. Each officer serves for a one year term or until their successors are elected and qualified. Column two below includes length of time served with predecessor entities, if any.
| | | | | | | | |
Name, Year of Birth and Position(s) Held with the Trust | | Trustee and/
or Officer Since | | Principal Occupation(s)
During Past 5 Years | | Number of
Funds in Fund
Complex
Overseen by
Trustee | | Other Directorship(s)
Held by Trustee During Past 5 Years |
| Interested Persons | | | | | | | | |
| Martin L. Flanagan1 — 1960 Trustee | | 2007 | | Executive Director, Chief Executive Officer and President, Invesco Ltd. (ultimate parent of Invesco and a global investment management firm); Trustee, The Invesco Funds; Vice Chair, Investment Company Institute; and Member of Executive Board, SMU Cox School of Business Formerly: Advisor to the Board, Invesco Advisers, Inc. (formerly known as Invesco Institutional (N.A.), Inc.); Chairman and Chief Executive Officer, Invesco Advisers, Inc. (registered investment adviser); Director, Chairman, Chief Executive Officer and President, Invesco Holding Company (US), Inc. (formerly IVZ Inc.) (holding company), Invesco Group Services, Inc. (service provider) and Invesco North American Holdings, Inc. (holding company); Director, Chief Executive Officer and President, Invesco Holding Company Limited (parent of Invesco and a global investment management firm); Director, Invesco Ltd.; Chairman, Investment Company Institute and President, Co-Chief Executive Officer, Co-President, Chief Operating Officer and Chief Financial Officer, Franklin Resources, Inc. (global investment management organization) | | 158 | | None |
Philip A. Taylor2 — 1954 Trustee and Senior Vice President | | 2006 | | Head of the Americas and Senior Managing Director, Invesco Ltd.; Director, Invesco Advisers, Inc. (formerly known as Invesco Institutional (N.A.), Inc.) (registered investment adviser); Director, Chairman, Chief Executive Officer and President, Invesco Management Group, Inc. (formerly known as Invesco Aim Management Group, Inc.) (financial services holding company); Director and Chairman, Invesco Investment Services, Inc. (formerly known as Invesco Aim Investment Services, Inc.) (registered transfer agent); Chief Executive Officer, Invesco Corporate Class Inc. (corporate mutual fund company); Director, Chairman and Chief Executive Officer, Invesco Canada Ltd. (formerly known as Invesco Trimark Ltd./Invesco Trimark Ltèe) (registered investment adviser and registered transfer agent); Trustee and Senior Vice President, The Invesco Funds; Director, Invesco Investment Advisers LLC (formerly known as Van Kampen Asset Management). Formerly: Co-Chairman, Co-President and Co-Chief Executive Officer, Invesco Advisers, Inc. (formerly known as Invesco Institutional (N.A.), Inc.) (registered investment adviser); Director, Chief Executive Officer and President, Van Kampen Exchange Corp; President and Principal Executive Officer, The Invesco Funds (other than AIM Treasurer’s Series Trust (Invesco Treasurer’s Series Trust), Short-Term Investments Trust and Invesco Management Trust); Executive Vice President, The Invesco Funds (AIM Treasurer’s Series Trust (Invesco Treasurer’s Series Trust), Short-Term Investments Trust and Invesco Management Trust only); Director and President, INVESCO Funds Group, Inc. (registered investment adviser and registered transfer agent); Director and Chairman, IVZ Distributors, Inc. (formerly known as INVESCO Distributors, Inc.) (registered broker dealer); Director, President and Chairman, Invesco Inc. (holding company), Invesco Canada Holdings Inc. (holding company), Trimark Investments Ltd./Placements Trimark Ltèe and Invesco Financial Services Ltd/Services Financiers Invesco Ltèe; Chief Executive Officer, Invesco Canada Fund Inc. (corporate mutual fund company); Director and Chairman, Van Kampen Investor Services Inc.; Director, Chief Executive Officer and President, 1371 Preferred Inc. (holding company) and Van Kampen Investments Inc.; Director and President, AIM GP Canada Inc. (general partner for limited partnerships) and Van Kampen Advisors, Inc.; Director and Chief Executive Officer, Invesco Trimark Dealer Inc. (registered broker dealer); Director, Invesco Distributors, Inc. (formerly known as Invesco Aim Distributors, Inc.) (registered broker dealer); Manager, Invesco PowerShares Capital Management LLC; Director, Chief Executive Officer and President, Invesco Advisers, Inc.; Director, Chairman, Chief Executive Officer and President, Invesco Aim Capital Management, Inc.; President, Invesco Trimark Dealer Inc. and Invesco Trimark Ltd./Invesco Trimark Ltèe; Director and President, AIM Trimark Corporate Class Inc. and AIM Trimark Canada Fund Inc.; Senior Managing Director, Invesco Holding Company Limited; Director and Chairman, Fund Management Company (former registered broker dealer); President and Principal Executive Officer, The Invesco Funds (AIM Treasurer’s Series Trust (Invesco Treasurer’s Series Trust), and Short-Term Investments Trust only); President, AIM Trimark Global Fund Inc. and AIM Trimark Canada Fund Inc. | | 158 | | None |
| 1 | Mr. Flanagan is considered an interested person (within the meaning of Section 2(a)(19) of the 1940 Act) of the Trust because he is an officer of the Adviser to the Trust, and an officer and a director of Invesco Ltd., ultimate parent of the Adviser. |
| 2 | Mr. Taylor is considered an interested person (within the meaning of Section 2(a)(19) of the 1940 Act) of the Trust because he is an officer and a director of the Adviser. |
T-1 Invesco World Bond Fund
Trustees and Officers—(continued)
| | | | | | | | |
Name, Year of Birth and Position(s) Held with the Trust | | Trustee and/
or Officer Since | | Principal Occupation(s) During Past 5 Years | | Number of
Funds in Fund
Complex
Overseen by
Trustee | | Other Directorship(s)
Held by Trustee During Past 5 Years |
| Independent Trustees | | | | | | | | |
Bruce L. Crockett — 1944 Trustee and Chair | | 2001 | | Chairman, Crockett Technologies Associates (technology consulting company) Formerly: Director, Captaris (unified messaging provider); Director, President and Chief Executive Officer, COMSAT Corporation; Chairman, Board of Governors of INTELSAT (international communications company); ACE Limited (insurance company); Independent Directors Council and Investment Company Institute: Member of the Audit Committee, Investment Company Institute; Member of the Executive Committee and Chair of the Governance Committee, Independent Directors Council | | 158 | | Director and Chairman of the Audit Committee, ALPS (Attorneys Liability Protection Society) (insurance company); Director and Member of the Audit Committee, Ferroglobe PLC (metallurgical company) |
David C. Arch — 1945 Trustee | | 2010 | | Chairman of Blistex Inc. (consumer health care products manufacturer); Member, World Presidents’ Organization | | 158 | | Board member of the Illinois Manufacturers’ Association |
James T. Bunch — 1942 Trustee | | 2003 | | Managing Member, Grumman Hill Group LLC (family office/private equity investments) Formerly: Chairman of the Board, Denver Film Society; Chairman of the Board of Trustees, Evans Scholarship Foundation; Chairman, Board of Governors, Western Golf Association | | 158 | | Trustee, Evans Scholarship Foundation |
Jack M. Fields — 1952 Trustee | | 2001 | | Chief Executive Officer, Twenty First Century Group, Inc. (government affairs company); and Discovery Learning Alliance (non-profit) Formerly: Owner and Chief Executive Officer, Dos Angeles Ranch L.P. (cattle, hunting, corporate entertainment); Director, Insperity, Inc. (formerly known as Administaff) (human resources provider); Chief Executive Officer, Texana Timber LP (sustainable forestry company); Director of Cross Timbers Quail Research Ranch (non-profit); and member of the U.S. House of Representatives | | 158 | | None |
Cynthia Hostetler — 1962 Trustee | | 2017 | | Non-Executive Director and Trustee of a number of public and private business corporations Formerly: Head of Investment Funds and Private Equity, Overseas Private Investment Corporation; President, First Manhattan Bancorporation, Inc.; Attorney, Simpson Thacher & Bartlett LLP | | 158 | | Vulcan Materials Company (construction materials company); Trilinc Global Impact Fund; Aberdeen Investment Funds (4 portfolios); Artio Global Investment LLC (mutual fund complex); Edgen Group, Inc. (specialized energy and infrastructure products distributor) |
Eli Jones — 1961 Trustee | | 2016 | | Professor and Dean, Mays Business School — Texas A&M University Formerly: Professor and Dean, Walton College of Business, University of Arkansas and E.J. Ourso College of Business, Louisiana State University; Director, Arvest Bank | | 158 | | Insperity, Inc. (formerly known as Administaff) (human resources provider) |
Prema Mathai-Davis — 1950 Trustee | | 2001 | | Retired. Formerly: Chief Executive Officer, YWCA of the U.S.A. | | 158 | | None |
Teresa M. Ressel — 1962 Trustee | | 2017 | | Non-executive director and trustee of a number of public and private business corporations Formerly: Chief Financial Officer, Olayan America, The Olayan Group (international investor/commercial/industrial); Chief Executive Officer, UBS Securities LLC; Group Chief Operating Officer, Americas, UBS AG; Assistant Secretary for Management & Budget and CFO, US Department of the Treasury; Chief Compliance Officer, Kaiser Permanente (healthcare consortium); Program Manager, Hewlett-Packard; Nuclear Engineering, General Dynamics Corporation (aerospace and defense company) | | 158 | | Atlantic Power Corporation (power generation company); ON Semiconductor Corp. (semiconductor supplier) |
Larry Soll — 1942 Trustee | | 2003 | | Retired. Formerly: Chairman, Chief Executive Officer and President, Synergen Corp. (a biotechnology company) | | 158 | | None |
Ann Barnett Stern — 1957 Trustee | | 2017 | | President and Chief Executive Officer, Houston Endowment Inc. (private philanthropic institution) Formerly: Executive Vice President and General Counsel, Texas Children’s Hospital; Attorney, Beck, Redden and Secrest, LLP; Business Law Instructor, University of St. Thomas; Attorney, Andrews & Kurth LLP | | 158 | | Federal Reserve Bank of Dallas |
Raymond Stickel, Jr. — 1944 Trustee | | 2005 | | Retired. Formerly: Director, Mainstay VP Series Funds, Inc. (25 portfolios); Partner, Deloitte & Touche | | 158 | | None |
Robert C. Troccoli — 1949 Trustee | | 2016 | | Adjunct Professor, University of Denver — Daniels College of Business Formerly: Senior Partner, KPMG LLP | | 158 | | None |
T-2 Invesco World Bond Fund
Trustees and Officers—(continued)
| | | | | | | | |
Name, Year of Birth and Position(s) Held with the Trust | | Trustee and/
or Officer Since | | Principal Occupation(s) During Past 5 Years | | Number of
Funds in Fund
Complex
Overseen by
Trustee | | Other Directorship(s)
Held by Trustee During Past 5 Years |
| Independent Trustees—(continued) |
Christopher L. Wilson — 1957 Trustee | | 2017 | | Managing Partner, CT2, LLC (investing and consulting firm) Formerly: President/Chief Executive Officer, Columbia Funds, Bank of America Corporation; President/Chief Executive Officer, CDC IXIS Asset Management Services, Inc.; Principal & Director of Operations, Scudder Funds, Scudder, Stevens & Clark, Inc.; Assistant Vice President, Fidelity Investments | | 158 | | TD Asset Management USA Inc. (mutual fund complex) (22 portfolios); ISO New England, Inc. (non-profit organization managing regional electricity market) |
| Other Officers | | | | | | | | |
Sheri Morris — 1964 President, Principal Executive Officer and Treasurer | | 1999 | | President, Principal Executive Officer and Treasurer, The Invesco Funds; Vice President, Invesco Advisers, Inc. (formerly known as Invesco Institutional (N.A.), Inc.) (registered investment adviser); and Vice President, PowerShares Exchange-Traded Fund Trust, PowerShares Exchange-Traded Fund Trust II, PowerShares India Exchange-Traded Fund Trust, PowerShares Actively Managed Exchange-Traded Fund Trust and PowerShares Actively Managed Exchange-Traded Commodity Fund Trust Formerly: Vice President and Principal Financial Officer, The Invesco Funds; Vice President, Invesco Aim Advisers, Inc., Invesco Aim Capital Management, Inc. and Invesco Aim Private Asset Management, Inc.; Assistant Vice President and Assistant Treasurer, The Invesco Funds and Assistant Vice President, Invesco Advisers, Inc., Invesco Aim Capital Management, Inc. and Invesco Aim Private Asset Management, Inc.; and Treasurer, PowerShares Exchange-Traded Fund Trust, PowerShares Exchange-Traded Fund Trust II, PowerShares India Exchange-Traded Fund Trust and PowerShares Actively Managed Exchange-Traded Fund Trust | | N/A | | N/A |
Russell C. Burk — 1958 Senior Vice President and Senior Officer | | 2005 | | Senior Vice President and Senior Officer, The Invesco Funds | | N/A | | N/A |
John M. Zerr — 1962 Senior Vice President, Chief Legal Officer and Secretary | | 2006 | | Director, Senior Vice President, Secretary and General Counsel, Invesco Management Group, Inc. (formerly known as Invesco AIM Management Group, Inc.); Senior Vice President, Invesco Advisers, Inc. (formerly known as Invesco Institutional (N.A.), Inc.) (registered investment adviser); Senior Vice President and Secretary, Invesco Distributors, Inc. (formerly known as Invesco AIM Distributors, Inc.); Director, Vice President and Secretary, Invesco Investment Services, Inc. (formerly known as Invesco AIM Investment Services, Inc.) Senior Vice President, Chief Legal Officer and Secretary, The Invesco Funds; Managing Director, Invesco PowerShares Capital Management LLC; Director, Secretary and General Counsel, Invesco Investment Advisers LLC (formerly known as Van Kampen Asset Management); Secretary and General Counsel, Invesco Capital Markets, Inc. (formerly known as Van Kampen Funds Inc.) and Chief Legal Officer, PowerShares Exchange-Traded Fund Trust, PowerShares Exchange-Traded Fund Trust II, PowerShares India Exchange-Traded Fund Trust, PowerShares Actively Managed Exchange-Traded Fund Trust and PowerShares Actively Managed Exchange-Traded Commodity Fund Trust; Manager and Secretary, Invesco Indexing LLC Formerly: Director, Secretary, General Counsel and Senior Vice President, Van Kampen Exchange Corp.; Director, Vice President and Secretary, IVZ Distributors, Inc. (formerly known as INVESCO Distributors, Inc.); Director and Vice President, INVESCO Funds Group, Inc.; Director and Vice President, Van Kampen Advisors Inc.; Director, Vice President, Secretary and General Counsel, Van Kampen Investor Services Inc.; Director, Invesco Distributors, Inc. (formerly known as Invesco AIM Distributors, Inc.); Director, Senior Vice President, General Counsel and Secretary, Invesco AIM Advisers, Inc. and Van Kampen Investments Inc.; Director, Vice President and Secretary, Fund Management Company; Director, Senior Vice President, Secretary, General Counsel and Vice President, Invesco AIM Capital Management, Inc.; Chief Operating Officer and General Counsel, Liberty Ridge Capital, Inc. (an investment adviser); Vice President and Secretary, PBHG Funds (an investment company) and PBHG Insurance Series Fund (an investment company); Chief Operating Officer, General Counsel and Secretary, Old Mutual Investment Partners (a broker-dealer); General Counsel and Secretary, Old Mutual Fund Services (an administrator) and Old Mutual Shareholder Services (a shareholder servicing center); Executive Vice President, General Counsel and Secretary, Old Mutual Capital, Inc. (an investment adviser); and Vice President and Secretary, Old Mutual Advisors Funds (an investment company) | | N/A | | N/A |
Gregory G. McGreevey — 1962 Senior Vice President | | 2012 | | Senior Managing Director, Invesco Ltd.; Director, Chairman, President, and Chief Executive Officer, Invesco Advisers, Inc. (formerly known as Invesco Institutional (N.A.), Inc.) (registered investment adviser); Senior Vice President, Invesco Management Group, Inc.; Director, Invesco Mortgage Capital, Inc. and Invesco Senior Secured Management, Inc.; and Senior Vice President, The Invesco Funds Formerly: Assistant Vice President, The Invesco Funds | | N/A | | N/A |
T-3 Invesco World Bond Fund
Trustees and Officers—(continued)
| | | | | | | | |
Name, Year of Birth and Position(s) Held with the Trust | | Trustee and/
or Officer Since | | Principal Occupation(s) During Past 5 Years | | Number of
Funds in Fund
Complex
Overseen by
Trustee | | Other Directorship(s)
Held by Trustee During Past 5 Years |
| Other Officers—(continued) | | | | | | | | |
Kelli Gallegos — 1970 Vice President, Principal Financial Officer and Assistant Treasurer | | 2008 | | Vice President, Principal Financial Officer and Assistant Treasurer, The Invesco Funds; Assistant Treasurer, Invesco PowerShares Capital Management LLC, PowerShares Exchange-Traded Fund Trust, PowerShares Exchange-Traded Fund Trust II, PowerShares India Exchange-Traded Fund Trust, PowerShares Actively Managed Exchange-Traded Fund Trust and PowerShares Actively Managed Exchange-Traded Commodity Fund Trust Formerly: Assistant Vice President, The Invesco Funds | | N/A | | N/A |
Tracy Sullivan — 1962 Vice President, Chief Tax Officer and Assistant Treasurer | | 2008 | | Vice President, Chief Tax Officer and Assistant Treasurer, The Invesco Funds; Assistant Treasurer, Invesco PowerShares Capital Management LLC, PowerShares Exchange-Traded Fund Trust, PowerShares Exchange-Traded Fund Trust II, PowerShares India Exchange-Traded Fund Trust, PowerShares Actively Managed Exchange-Traded Fund Trust and PowerShares Actively Managed Exchange-Traded Commodity Fund Trust Formerly: Assistant Vice President, The Invesco Funds | | N/A | | N/A |
Crissie M. Wisdom — 1969 Anti-Money Laundering Compliance Officer | | 2013 | | Anti-Money Laundering Compliance Officer, Invesco Advisers, Inc. (formerly known as Invesco Institutional (N.A.), Inc.) (registered investment adviser), Invesco Capital Markets, Inc. (formerly known as Van Kampen Funds Inc.), Invesco Distributors, Inc., Invesco Investment Services, Inc., Invesco Management Group, Inc., The Invesco Funds, and PowerShares Exchange-Traded Fund Trust, PowerShares Exchange-Traded Fund Trust II, PowerShares India Exchange-Traded Fund Trust, PowerShares Actively Managed Exchange-Traded Fund Trust and PowerShares Actively Managed Exchange-Traded Commodity Fund Trust; Anti-Money Laundering Compliance Officer and Bank Secrecy Act Officer, INVESCO National Trust Company and Invesco Trust Company; and Fraud Prevention Manager and Controls and Risk Analysis Manager for Invesco Investment Services, Inc. Formerly: Anti-Money Laundering Compliance Officer, Van Kampen Exchange Corp. | | N/A | | N/A |
Robert R. Leveille — 1969 Chief Compliance Officer | | 2016 | | Chief Compliance Officer, Invesco Advisers, Inc. (registered investment adviser); and Chief Compliance Officer, The Invesco Funds Formerly: Chief Compliance Officer, Putnam Investments and the Putnam Funds | | N/A | | N/A |
The Statement of Additional Information of the Trust includes additional information about the Fund’s Trustees and is available upon request, without charge, by calling 1.800.959.4246. Please refer to the Fund’s Statement of Additional Information for information on the Fund’s sub-advisers.
| | | | | | |
Office of the Fund 11 Greenway Plaza, Suite 1000 Houston, TX 77046-1173 | | Investment Adviser Invesco Advisers, Inc. 1555 Peachtree Street, N.E. Atlanta, GA 30309 | | Distributor Invesco Distributors, Inc. 11 Greenway Plaza, Suite 1000 Houston, TX 77046-1173 | | Auditors PricewaterhouseCoopers LLP 1000 Louisiana Street, Suite 5800 Houston, TX 77002-5678 |
| | | |
| | | | | | |
Counsel to the Fund Stradley Ronon Stevens & Young, LLP 2005 Market Street, Suite 2600 Philadelphia, PA 19103-7018 | | Counsel to the Independent Trustees Goodwin Procter LLP 901 New York Avenue, N.W. Washington, D.C. 20001 | | Transfer Agent Invesco Investment Services, Inc. 11 Greenway Plaza, Suite 1000 Houston, TX 77046-1173 | | Custodian State Street Bank and Trust Company 225 Franklin Street Boston, MA 02110-2801 |
T-4 Invesco World Bond Fund
Explore High-Conviction Investing with Invesco

Go paperless with eDelivery
Visit invesco.com/edelivery to enjoy the convenience and security of anytime electronic access to your investment documents.
With eDelivery, you can elect to have any or all of the following materials delivered straight to your inbox to download, save and print from your own computer:
| ∎ | | Fund reports and prospectuses |
Invesco mailing information
Send general correspondence to Invesco Investment Services, Inc., P.O. Box 219078, Kansas City, MO 64121-9078.
Important notice regarding delivery of security holder documents
To reduce Fund expenses, only one copy of most shareholder documents may be mailed to shareholders with multiple accounts at the same address (Householding). Mailing of your shareholder documents may be householded indefinitely unless you instruct us otherwise. If you do not want the mailing of these documents to be combined with those for other members of your household, please contact Invesco Investment Services, Inc. at 800 959 4246 or contact your financial institution. We will begin sending you individual copies for each account within 30 days after receiving your request.
Fund holdings and proxy voting information
The Fund provides a complete list of its holdings four times in each fiscal year, at the quarter ends. For the second and fourth quarters, the lists appear in the Fund’s semiannual and annual reports to shareholders. For the first and third quarters, the Fund files the lists with the Securities and Exchange Commission (SEC) on Form N-Q. The most recent list of portfolio holdings is available at invesco.com/completeqtrholdings. Shareholders can also look up the Fund’s Forms N-Q on the SEC website at sec.gov. Copies of the Fund’s Forms N-Q may be reviewed and copied at the SEC Public Reference Room in Washington, D.C. You can obtain information on the operation of the Public Reference Room, including information about duplicating fee charges, by calling 202 551 8090 or 800 732 0330, or by electronic request at the following email address: publicinfo@sec.gov. The SEC file numbers for the Fund are shown below.
A description of the policies and procedures that the Fund uses to determine how to vote proxies relating to portfolio securities is available without charge, upon request, from our Client Services department at 800 959 4246 or at invesco.com/proxyguidelines. The information is also available on the SEC website, sec.gov.
| | |
Information regarding how the Fund voted proxies related to its portfolio securities during the most recent 12-month period ended June 30 is available at invesco.com/proxysearch. The information is also available on the SEC website, sec.gov. Invesco Advisers, Inc. is an investment adviser; it provides investment advisory services to individual and institutional clients and does not sell securities. Invesco Distributors, Inc. is the US distributor for Invesco Ltd.’s retail mutual funds, exchange-traded funds and institutional money market funds. Both are wholly owned, indirect subsidiaries of Invesco Ltd. | |  |
| | | | | | | | |
| SEC file numbers: 811-05426 and 033-19338 | | Invesco Distributors, Inc. | | WBD-AR-1 | | 12202017 | | 1436 |
There were no amendments to the Code of Ethics (the “Code”) that applies to the Registrant’s Principal Executive Officer (“PEO”) and Principal Financial Officer (“PFO”) during the period covered by the report. The Registrant did not grant any waivers, including implicit waivers, from any provisions of the Code to the PEO or PFO during the period covered by this report.
| ITEM 3. | AUDIT COMMITTEE FINANCIAL EXPERT. |
The Board of Trustees has determined that the Registrant has at least one audit committee financial expert serving on its Audit Committee. The Audit Committee financial expert is Raymond Stickel, Jr. Mr. Stickel is “independent” within the meaning of that term as used in Form N-CSR.
| ITEM 4. | PRINCIPAL ACCOUNTANT FEES AND SERVICES. |
PricewaterhouseCoopers LLP informed the Trust that it has identified an issue related to its independence under Rule 2-01(c)(1)(ii)(A) of Regulation S-X (referred to as the Loan Rule). The Loan Rule prohibits accounting firms, such as PricewaterhouseCoopers LLP, from being deemed independent if they have certain financial relationships with their audit clients or certain affiliates of those clients. The Trust is required under various securities laws to have its financial statements audited by an independent accounting firm.
The Loan Rule specifically provides that an accounting firm would not be independent if it or certain affiliates and covered persons receives a loan from a lender that is a record or beneficial owner of more than ten percent of an audit client’s equity securities (referred to as a “more than ten percent owner”). For purposes of the Loan Rule, audit clients include the Funds as well as all registered investment companies advised by the Adviser and its affiliates, including other subsidiaries of the Adviser’s parent company, Invesco Ltd. (collectively, the Invesco Fund Complex). PricewaterhouseCoopers LLP informed the Trust it and certain affiliates and covered persons have relationships with lenders who hold, as record owner, more than ten percent of the shares of certain funds within the Invesco Fund Complex, which may implicate the Loan Rule.
On June 20, 2016, the SEC Staff issued a “no-action” letter to another mutual fund complex (see Fidelity Management & Research Company et al., No-Action Letter) related to the audit independence issue described above. In that letter, the SEC confirmed that it would not recommend enforcement action against a fund that relied on audit services performed by an audit firm that was not in compliance with the Loan Rule in certain specified circumstances. In connection with prior independence determinations, PricewaterhouseCoopers LLP communicated, as contemplated by the no-action letter, that it believes that it remains objective and impartial and that a reasonable investor possessing all the facts would conclude that PricewaterhouseCoopers LLP is able to exhibit the requisite objectivity and impartiality to report on the Funds’ financial statements as the independent registered public accounting firm. PricewaterhouseCoopers LLP also represented that it has complied with PCAOB Rule 3526(b)(1) and (2), which are conditions to the Funds relying on the no action letter, and affirmed that it is an independent accountant within the meaning of PCAOB Rule 3520. Therefore, the Adviser, the Funds and PricewaterhouseCoopers LLP concluded that PricewaterhouseCoopers LLP could continue as the Funds’ independent registered public accounting firm. The Invesco Fund Complex relied upon the no-action letter in reaching this conclusion.
If in the future the independence of PricewaterhouseCoopers LLP is called into question under the Loan Rule by circumstances that are not addressed in the SEC’s no-action letter, the Funds will need to take other action in order for the Funds’ filings with the SEC containing financial statements to be deemed compliant with applicable securities laws. Such additional actions could result in additional costs, impair the ability of the Funds to issue new shares or have other material adverse effects on the Funds. The SEC no-action relief was initially set to expire 18 months from issuance but has been extended by the SEC without an expiration date, except that the no-action letter will be withdrawn upon the effectiveness of any amendments to the Loan Rule designed to address the concerns expressed in the letter.
(a) to (d)
Fees Billed by PWC Related to the Registrant
PWC billed the Registrant aggregate fees for services rendered to the Registrant for the last two fiscal years as follows:
| | | | |
| | | Fees Billed for
Services Rendered to
the Registrant for
fiscal year end 2017 | | Fees Billed for
Services Rendered to
the Registrant for
fiscal year end 2016 |
Audit Fees | | $ 821,050 | | $ 931,700 |
Audit-Related Fees(1) | | $ 13,500 | | $ 4,000 |
Tax Fees(2) | | $ 488,039 | | $ 318,830 |
All Other Fees | | $ 0 | | $ 0 |
Total Fees | | $ 1,322,589 | | $ 1,254,530 |
(g) PWC billed the Registrant aggregate non-audit fees of $501,539 for the fiscal year ended 2017, and $322,830 for the fiscal year ended 2016, for non-audit services rendered to the Registrant.
| | (1) | Audit-Related fees for the fiscal year end 2017 include fees billed for reviewing regulatory filings. Audit-Related fees for the fiscal year end 2016 include fees billed for reviewing regulatory filings. |
| | (2) | Tax fees for the fiscal year end October 31, 2017 includes fees billed for reviewing tax returns and/or services related to tax compliance. Tax fees for fiscal year end October 31, 2016 includes fees billed for reviewing tax returns and/or services related to tax compliance. |
Fees Billed by PWC Related to Invesco and Invesco Affiliates
PWC billed Invesco Advisers, Inc. (“Invesco”), the Registrant’s adviser, and any entity controlling, controlled by or under common control with Invesco that provides ongoing services to the Registrant (“Invesco Affiliates”) aggregate fees for pre-approved non-audit services rendered to Invesco and Invesco Affiliates for the last two fiscal years as follows:
| | | | | | | | |
| | | Fees Billed for Non-
Audit Services
Rendered to Invesco
and Invesco Affiliates
for fiscal year end
2017 That Were
Required
to be Pre-Approved
by the Registrant’s
Audit Committee | | | Fees Billed for Non-
Audit Services
Rendered to Invesco
and Invesco Affiliates
for fiscal year end
2016 That Were
Required
to be Pre-Approved
by the Registrant’s
Audit Committee | |
Audit-Related Fees | | | $ 662,000 | | | | $ 635,000 | |
Tax Fees | | | $ 0 | | | | $ 0 | |
All Other Fees | | | $ 1,245,000 | | | | $ 2,193,000 | |
Total Fees(1) | | | $ 1,907,000 | | | | $ 2,828,000 | |
| (1) | Audit-Related fees for the year end 2017 include fees billed related to reviewing controls at a service organization. Audit-Related fees for the year end 2016 include fees billed related to reviewing controls at a service organization. |
All other fees for the year end 2017 include fees billed related to the assessments for certain of the company’s risk management tools, current state analysis against regulatory requirements and identification of structural and organizational alternatives, informed by industry practices, for certain of the company’s administrative activities and functions. All other fees for the year end 2016 include fees billed related to the identification of structural and organizational alternatives, informed by industry practices, for certain of the company’s administrative activities and functions.
(e)(2) There were no amounts that were pre-approved by the Audit Committee pursuant to the de minimis exception under Rule 2-01 of Regulation S-X.
(g) Including the fees for services not required to be pre-approved by the registrant’s audit committee, PWC billed Invesco and Invesco Affiliates aggregate non-audit fees of $4,890,000 for the fiscal year ended October 31, 2017, and $5,032,000 for the fiscal year ended October 31, 2016, for non-audit services rendered to Invesco and Invesco Affiliates.
PWC provided audit services to the Investment Company complex of approximately $22 million.
(h) The Audit Committee also has considered whether the provision of non-audit services that were rendered to Invesco and Invesco Affiliates that were not required to be pre-approved pursuant to SEC regulations, if any, is compatible with maintaining PWC’s independence.
(f) Not applicable.
(e)(1)
PRE-APPROVAL OF AUDIT AND NON-AUDIT SERVICES
POLICIES AND PROCEDURES
As adopted by the Audit Committees
of the Invesco Funds (the “Funds”)
Last Amended March 29, 2017
| | I. | Statement of Principles |
The Audit Committees (the “Audit Committee”) of the Boards of Trustees of the Funds (the “Board”) have adopted these policies and procedures (the “Procedures”) with respect to the pre-approval of audit and non-audit services to be provided by the Funds’ independent auditor (the “Auditor”) to the Funds, and to the Funds’ investment adviser(s) and any entity controlling, controlled by, or under common control with the investment adviser(s) that provides ongoing services to the Funds (collectively, “Service Affiliates”).
Under Section 202 of the Sarbanes-Oxley Act of 2002, all audit and non-audit services provided to the Funds by the Auditor must be preapproved by the Audit Committee. Rule 2-01 of Regulation S-X requires that the Audit Committee also pre-approve a Service Affiliate’s engagement of the Auditor for non-audit services if the engagement relates directly to the operations and financial reporting of the Funds (a “Service Affiliate’s Covered Engagement”).
These Procedures set forth the procedures and the conditions pursuant to which the Audit Committee may pre-approve audit and non-audit services for the Funds and a Service Affiliate’s Covered Engagement pursuant to rules and regulations of the Securities and Exchange Commission (“SEC”) and other organizations and regulatory bodies applicable to the Funds (“Applicable Rules”).1 They address both general pre-approvals without consideration of specific case-by-case services (“general pre-approvals”) and pre-approvals on a case-by-case basis (“specific pre-approvals”). Any services requiring pre-approval that are not within the scope of general pre-approvals hereunder are subject to specific pre-approval. These Procedures also address the delegation by the Audit Committee of pre-approval authority to the Audit Committee Chair or Vice Chair.
| | II. | Pre-Approval of Fund Audit Services |
The annual Fund audit services engagement, including terms and fees, is subject to specific pre-approval by the Audit Committee. Audit services include the annual financial statement audit and other procedures required to be performed by an independent auditor to be able to form an opinion on the Funds’ financial statements. The Audit Committee will receive, review and consider sufficient information concerning a proposed Fund audit engagement to make a reasonable evaluation of the Auditor’s qualifications and independence. The Audit Committee will oversee the Fund audit services engagement as necessary, including approving any changes in terms, audit scope, conditions and fees.
In addition to approving the Fund audit services engagement at least annually and specifically approving any changes, the Audit Committee may generally or specifically pre-approve engagements for other audit services, which are those services that only an independent auditor reasonably can provide. Other audit services may include services associated with SEC registration statements, periodic reports and other documents filed with the SEC.
1 Applicable Rules include, for example, New York Stock Exchange (“NYSE”) rules applicable to closed-end funds managed by Invesco and listed on NYSE.
| | III. | General and Specific Pre-Approval of Non-Audit Fund Services |
The Audit Committee will consider, at least annually, the list of General Pre-Approved Non-Audit Services which list may be terminated or modified at any time by the Audit Committee. To inform the Audit Committee’s review and approval of General Pre-Approved Non-Audit Services, the Funds’ Treasurer (or his or her designee) and Auditor shall provide such information regarding independence or other matters as the Audit Committee may request.
Any services or fee ranges that are not within the scope of General Pre-Approved Non-Audit Services have not received general pre-approval and require specific pre-approval. Each request for specific pre-approval by the Audit Committee for services to be provided by the Auditor to the Funds must be submitted to the Audit Committee by the Funds’ Treasurer (or his or her designee) and must include detailed information about the services to be provided, the fees or fee ranges to be charged, and other relevant information sufficient to allow the Audit Committee to consider whether to pre-approve such engagement, including evaluating whether the provision of such services will impair the independence of the Auditor and is otherwise consistent with Applicable Rules.
| | IV. | Non-Audit Service Types |
The Audit Committee may provide either general or specific pre-approval of audit-related, tax or other services, each as described in more detail below.
“Audit-related services” are assurance and related services that are reasonably related to the performance of the audit or review of the Fund’s financial statements or that are traditionally performed by an independent auditor. Audit-related services include, among others, accounting consultations related to accounting, financial reporting or disclosure matters not classified as “Audit services”; assistance with understanding and implementing new accounting and financial reporting guidance from rulemaking authorities; services related to mergers, acquisitions or dispositions; compliance with ratings agency requirements and interfund lending activities; and assistance with internal control reporting requirements.
“Tax services” include, but are not limited to, the review and signing of the Funds’ federal tax returns, the review of required distributions by the Funds and consultations regarding tax matters such as the tax treatment of new investments or the impact of new regulations. The Audit Committee will not approve proposed services of the Auditor which the Audit Committee believes are to be provided in connection with a service or transaction initially recommended by the Auditor, the sole business purpose of which may be tax avoidance and the tax treatment of which may not be supported in the Internal Revenue Code and related regulations. The Audit Committee will consult with the Funds’ Treasurer (or his or her designee) and may consult with outside counsel or advisers as necessary to ensure the consistency of tax services rendered by the Auditor with the foregoing policy. The Auditor shall not represent any Fund or any Service Affiliate before a tax court, district court or federal court of claims.
Each request to provide tax services under either the general or specific pre-approval of the Audit Committee will include a description from the Auditor in writing of (i) the scope of the service, the fee structure for the engagement, and any side letter or other amendment to the engagement letter, or any other agreement (whether oral, written, or otherwise) between the Auditor and the Funds, relating to the service; and (ii) any compensation arrangement or other agreement, such as a referral agreement, a referral fee or fee-sharing arrangement, between the Auditor (or an affiliate of the Auditor) and any person (other than the Funds or Service Affiliates receiving the services) with respect to the promoting, marketing, or recommending of a transaction covered by the service. The Auditor will also discuss with
the Audit Committee the potential effects of the services on the independence of the Auditor, and document the substance of its discussion with the Audit Committee.
The Audit Committee may pre-approve other non-audit services so long as the Audit Committee believes that the service will not impair the independence of the Auditor. Appendix I includes a list of services that the Auditor is prohibited from performing by the SEC rules. Appendix I also includes a list of services that would impair the Auditor’s independence unless the Audit Committee reasonably concludes that the results of the services will not be subject to audit procedures during an audit of the Funds’ financial statements.
| | V. | Pre-Approval of Service Affiliate’s Covered Engagements |
Rule 2-01 of Regulation S-X requires that the Audit Committee pre-approve a Service Affiliate’s engagement of the Auditor for non-audit services if the engagement relates directly to the operations and financial reporting of the Funds, defined above as a “Service Affiliate’s Covered Engagement”.
The Audit Committee may provide either general or specific pre-approval of any Service Affiliate’s Covered Engagement, including for audit-related, tax or other services, as described above, if the Audit Committee believes that the provision of the services to a Service Affiliate will not impair the independence of the Auditor with respect to the Funds. Any Service Affiliate’s Covered Engagements that are not within the scope of General Pre-Approved Non-Audit Services have not received general pre-approval and require specific pre-approval.
Each request for specific pre-approval by the Audit Committee of a Service Affiliate’s Covered Engagement must be submitted to the Audit Committee by the Funds’ Treasurer (or his or her designee) and must include detailed information about the services to be provided, the fees or fee ranges to be charged, a description of the current status of the pre-approval process involving other audit committees in the Invesco investment company complex (as defined in Rule 2-201 of Regulation S-X) with respect to the proposed engagement, and other relevant information sufficient to allow the Audit Committee to consider whether the provision of such services will impair the independence of the Auditor from the Funds. Additionally, the Funds’ Treasurer (or his or her designee) and the Auditor will provide the Audit Committee with a statement that the proposed engagement requires pre-approval by the Audit Committee, the proposed engagement, in their view, will not impair the independence of the Auditor and is consistent with Applicable Rules, and the description of the proposed engagement provided to the Audit Committee is consistent with that presented to or approved by the Invesco audit committee.
Information about all Service Affiliate engagements of the Auditor for non-audit services, whether or not subject to pre-approval by the Audit Committee, shall be provided to the Audit Committee at least quarterly, to allow the Audit Committee to consider whether the provision of such services is compatible with maintaining the Auditor’s independence from the Funds. The Funds’ Treasurer and Auditor shall provide the Audit Committee with sufficiently detailed information about the scope of services provided and the fees for such services, to ensure that the Audit Committee can adequately consider whether the provision of such services is compatible with maintaining the Auditor’s independence from the Funds.
| | VI. | Pre-Approved Fee Levels or Established Amounts |
Pre-approved fee levels or ranges for audit and non-audit services to be provided by the Auditor to the Funds, and for a Service Affiliate’s Covered Engagement, under general pre-approval or specific pre-approval will be set periodically by the Audit Committee. Any proposed fees exceeding 110% of the maximum pre-approved fee levels or ranges for such services or engagements will be promptly presented
to the Audit Committee and will require specific pre-approval by the Audit Committee before payment of any additional fees is made.
The Audit Committee hereby delegates, subject to the dollar limitations set forth below, specific authority to its Chair, or in his or her absence, Vice Chair, to pre-approve audit and non-audit services proposed to be provided by the Auditor to the Funds and/or a Service Affiliate’s Covered Engagement, between Audit Committee meetings. Such delegation does not preclude the Chair or Vice Chair from declining, on a case by case basis, to exercise his or her delegated authority and instead convening the Audit Committee to consider and pre-approve any proposed services or engagements.
Notwithstanding the foregoing, the Audit Committee must pre-approve: (a) any non-audit services to be provided to the Funds for which the fees are estimated to exceed $500,000; (b) any Service Affiliate’s Covered Engagement for which the fees are estimated to exceed $500,000; or (c) any cost increase to any previously approved service or engagement that exceeds the greater of $250,000 or 50% of the previously approved fees up to a maximum increase of $500,000.
| | VIII. | Compliance with Procedures |
Notwithstanding anything herein to the contrary, failure to pre-approve any services or engagements that are not required to be pre-approved pursuant to the de minimis exception provided for in Rule 2-01(c)(7)(i)(C) of Regulation S-X shall not constitute a violation of these Procedures. The Audit Committee has designated the Funds’ Treasurer to ensure services and engagements are pre-approved in compliance with these Procedures. The Funds’ Treasurer will immediately report to the Chair of the Audit Committee, or the Vice Chair in his or her absence, any breach of these Procedures that comes to the attention of the Funds’ Treasurer or any services or engagements that are not required to be pre-approved pursuant to the de minimis exception provided for in Rule 2-01(c)(7)(i)(C) of Regulation S-X.
On at least an annual basis, the Auditor will provide the Audit Committee with a summary of all non-audit services provided to any entity in the investment company complex (as defined in section 2-01(f)(14) of Regulation S-X, including the Funds and Service Affiliates) that were not pre-approved, including the nature of services provided and the associated fees.
| | IX. | Amendments to Procedures |
All material amendments to these Procedures must be approved in advance by the Audit Committee. Non-material amendments to these Procedures may be made by the Legal and Compliance Departments and will be reported to the Audit Committee at the next regularly scheduled meeting of the Audit Committee.
Appendix I
Non-Audit Services That May Impair the Auditor’s Independence
The Auditor is not independent if, at any point during the audit and professional engagement, the Auditor provides the following non-audit services:
| | • | | Broker-dealer, investment adviser, or investment banking services; |
| | • | | Expert services unrelated to the audit; |
| | • | | Any service or product provided for a contingent fee or a commission; |
| | • | | Services related to marketing, planning, or opining in favor of the tax treatment of confidential transactions or aggressive tax position transactions, a significant purpose of which is tax avoidance; |
| | • | | Tax services for persons in financial reporting oversight roles at the Fund; and |
| | • | | Any other service that the Public Company Oversight Board determines by regulation is impermissible. |
An Auditor is not independent if, at any point during the audit and professional engagement, the Auditor provides the following non-audit services unless it is reasonable to conclude that the results of the services will not be subject to audit procedures during an audit of the Funds’ financial statements:
| | • | | Bookkeeping or other services related to the accounting records or financial statements of the audit client; |
| | • | | Financial information systems design and implementation; |
| | • | | Appraisal or valuation services, fairness opinions, or contribution-in-kind reports; |
| | • | | Actuarial services; and |
| | • | | Internal audit outsourcing services. |
| ITEM 5. | AUDIT COMMITTEE OF LISTED REGISTRANTS. |
Not applicable.
| ITEM 6. | SCHEDULE OF INVESTMENTS. |
Investments in securities of unaffiliated issuers is included as part of the reports to stockholders filed under Item 1 of this Form.
| ITEM 7. | DISCLOSURE OF PROXY VOTING POLICIES AND PROCEDURES FOR CLOSED-END MANAGEMENT INVESTMENT COMPANIES. |
Not applicable.
| ITEM 8. | PORTFOLIO MANAGERS OF CLOSED-END MANAGEMENT COMPANIES. |
Not applicable.
| ITEM 9. | PURCHASES OF EQUITY SECURITIES BY CLOSED-END MANAGEMENT INVESTMENT COMPANY AND AFFILIATED PURCHASERS. |
Not applicable.
| ITEM 10. | SUBMISSION OF MATTERS TO A VOTE OF SECURITY HOLDERS. |
None
| ITEM 11. | CONTROLS AND PROCEDURES. |
| (a) | As of November 17, 2017, an evaluation was performed under the supervision and with the participation of the officers of the Registrant, including the PEO and PFO, to assess the effectiveness of the Registrant’s disclosure controls and procedures, as that term is defined in Rule 30a-3(c) under the Investment Company Act of 1940 (the “Act”), as amended. Based on that evaluation, the Registrant’s officers, including the PEO and PFO, concluded that, as of November 17, 2017, the Registrant’s disclosure controls and procedures were reasonably designed to ensure: (1) that information required to be disclosed by the Registrant on Form N-CSR is recorded, processed, summarized and reported within the time periods specified by the rules and forms of the Securities and Exchange Commission; and (2) that material information relating to the Registrant is made known to the PEO and PFO as appropriate to allow timely decisions regarding required disclosure. |
| (b) | There have been no changes in the Registrant’s internal control over financial reporting (as defined in Rule 30a-3(d) under the Act) that occurred during the second fiscal quarter of the period covered by this report that have materially affected, or are reasonably likely to materially affect, the Registrant’s internal control over financial reporting. |
| ITEM 12. | DISCLOSURE OF SECURITIES LENDING ACTIVITIES FOR CLOSED-END MANAGEMENT INVESTMENT COMPANIES. |
Not applicable.
| 13(a) (2) | Certifications of principal executive officer and principal financial officer as required by Rule 30a-2(a) under the Investment Company Act of 1940. |
SIGNATURES
Pursuant to the requirements of the Securities Exchange Act of 1934 and the Investment Company Act of 1940, the Registrant has duly caused this report to be signed on its behalf by the undersigned, thereunto duly authorized.
Registrant: AIM Investment Funds (Invesco Investment Funds)
| | |
| By: | | /s/ Sheri Morris |
| | Sheri Morris |
| | Principal Executive Officer |
| |
| Date: | | January 8, 2018 |
Pursuant to the requirements of the Securities and Exchange Act of 1934 and the Investment Company Act of 1940, this report has been signed below by the following persons on behalf of the Registrant and in the capacities and on the dates indicated.
| | |
| By: | | /s/ Sheri Morris |
| | Sheri Morris |
| | Principal Executive Officer |
| |
| Date: | | January 8, 2018 |
| | |
| By: | | /s/ Kelli Gallegos |
| | Kelli Gallegos |
| | Principal Financial Officer |
| |
| Date: | | January 8, 2018 |
EXHIBIT INDEX
| | |
| 12(a) (1) | | Code of Ethics. |
| |
| 12(a) (2) | | Certifications of principal executive officer and principal financial officer as required by Rule 30a-2(a) under the Investment Company Act of 1940. |
| |
| 12(a) (3) | | Not applicable. |
| |
| 12(b) | | Certifications of principal executive officer and principal financial officer as required by Rule 30a-2(b) under the Investment Company Act of 1940. |