| | | | |
OMB APPROVAL |
| OMB Number: | | 3235-0570 |
| Expires: | | January 31, 2017 |
| Estimated average burden |
| hours per response: | | 20.6 |
UNITED STATES
SECURITIES AND EXCHANGE COMMISSION
Washington, D.C. 20549
FORM N-CSR
CERTIFIED SHAREHOLDER REPORT OF REGISTERED
MANAGEMENT INVESTMENT COMPANIES
Investment Company Act file number 811-05426
AIM Investment Funds (Invesco Investment Funds)*
(Exact name of registrant as specified in charter)
11 Greenway Plaza, Suite 1000
Houston, Texas 77046
(Address of principal executive offices) (Zip code)
Philip A. Taylor
11 Greenway Plaza, Suite 1000
Houston, Texas 77046
(Name and address of agent for service)
Registrant’s telephone number, including area code: (713) 626-1919
Date of fiscal year end: 10/31
Date of reporting period: 10/31/15
| * | Funds included are: Invesco Strategic Income Fund and Invesco Unconstrained Bond Fund. |
Item 1. Report to Stockholders.
Letters to Shareholders
| | |

Philip Taylor | | Dear Shareholders: |
| | This annual report includes information about your Fund, including performance data and a complete list of its investments as of the close of the reporting period. Inside is a discussion of how your Fund was managed and the factors that affected its performance during the reporting period. I hope you find this report of interest. |
| | The US economy expanded and unemployment declined throughout the reporting period. Continuing low energy prices benefited consumers, but a strong US dollar crimped corporate profits. The US Federal Reserve signaled that it was increasingly likely to raise interest rates, based on generally positive economic data, but uncertainty remained about when it might act. Overseas, the story was much different. Low energy prices hurt the economies of some oil-producing nations, such as Brazil and Russia. During the reporting period, the European |
| Central Bank as well as central banks in China and Japan – among other countries – either instituted or maintained extraordinarily accommodative monetary policies in response to economic weakness. |
Investor uncertainty, such as we saw for much of the reporting period – and market volatility, such as we saw at the end of the reporting period – are unfortunate facts of life when it comes to investing. Some investors use these things as excuses to delay saving and investing for their long-term financial goals. That’s why Invesco encourages investors to work with a professional financial adviser who can stress the importance of starting to save and invest early and the importance of adhering to a disciplined investment plan – when times are good and when they’re uncertain. A financial adviser who knows your unique financial situation, investment goals and risk tolerance can be an invaluable partner as you seek to achieve your financial goals. He or she can offer a long-term perspective when markets are volatile and time-tested advice and guidance when your financial situation or investment goals change. |
Timely information when and where you want it
Invesco’s efforts to help investors achieve their financial objectives include providing individual investors and financial professionals with timely information about the markets, the economy and investing – whenever and wherever they want it.
Our website, invesco.com/us, offers a wide range of market insights and investment perspectives. On the website, you’ll find detailed information about our funds, including prices, performance, holdings and portfolio manager commentaries. You can access information about your account by completing a simple, secure online registration. Click on the “Need to register” link in the “Account Access” box on our homepage to get started.
Invesco’s mobile apps for iPhone® and iPad® (both available free from the App StoreSM) allow you to obtain the same detailed information, monitor your account and create customizable watch lists. Also, they allow you to access investment insights from our investment leaders, market strategists, economists and retirement experts. You can sign up to be alerted when new commentary is added, and you can watch portfolio manager videos and have instant access to Invesco news and updates wherever you may be.
In addition to the resources accessible on our website and through our mobile app, you can obtain timely updates to help you stay informed about the markets, the economy and investing by connecting with Invesco on Twitter, LinkedIn or Facebook. You can access our blog at blog.invesco.us.com. Our goal is to provide you the information you want, when and where you want it.
Have questions?
For questions about your account, feel free to contact an Invesco client services representative at 800 959 4246. For Invesco-related questions or comments, please email me directly at phil@invesco.com.
All of us at Invesco look forward to serving your investment management needs for many years to come. Thank you for investing with us.
|
| Sincerely, |
 |
| Philip Taylor |
| Senior Managing Director, Invesco Ltd. |
iPhone and iPad are trademarks of Apple Inc., registered in the US and other countries. App Store is a service mark of Apple Inc. Invesco Distributors, Inc. is not affiliated with Apple Inc.
| | |
| 2 | | Invesco Strategic Income Fund |
| | | | |

Bruce Crockett | | Dear Fellow Shareholders: |
| | Among the many important lessons I’ve learned in more than 40 years in a variety of business endeavors is the value of a trusted advocate. |
| | As independent chair of the Invesco Funds Board, I can assure you that the members of the Board are strong advocates for the interests of investors in Invesco’s mutual funds. We work hard to represent your interests through oversight of the quality of the investment management services your funds receive and other matters important to your investment, including but not limited to: |
| | n | | Ensuring that Invesco offers a diverse lineup of mutual funds that your financial adviser can use to strive to meet your financial needs as your investment goals change over time. |
| | n | | Monitoring how the portfolio management teams of the Invesco funds are performing in light of changing economic and market conditions. |
| n | | Assessing each portfolio management team’s investment performance within the context of the investment strategy described in the fund’s prospectus. |
| n | | Monitoring for potential conflicts of interests that may impact the nature of the services that your funds receive. |
We believe one of the most important services we provide our fund shareholders is the annual review of the funds’ advisory and sub-advisory contracts with Invesco Advisers and its affiliates. This review is required by the Investment Company Act of 1940 and focuses on the nature and quality of the services Invesco provides as the adviser to the Invesco funds and the reasonableness of the fees that it charges for those services. Each year, we spend months carefully reviewing information received from Invesco and a variety of independent sources, such as performance and fee data prepared by Lipper Inc., an independent, third-party firm widely recognized as a leader in its field. We also meet with our independent legal counsel and other independent advisers to review and help us assess the information that we have received. Our goal is to assure that you receive quality investment management services for a reasonable fee.
I trust the measures outlined above provide assurance that you have a worthy advocate when it comes to choosing the Invesco Funds.
As always, please contact me at bruce@brucecrockett.com with any questions or concerns you may have. On behalf of the Board, we look forward to continuing to represent your interests and serving your needs.
|
| Sincerely, |

|
Bruce L. Crockett |
| Independent Chair |
| Invesco Funds Board of Trustees |
| | |
| 3 | | Invesco Strategic Income Fund |
Management’s Discussion of Fund Performance
|
Performance summary |
For the fiscal year ended October 31, 2015, Class A shares of Invesco Strategic Income Fund (the Fund), at net asset value (NAV), performed in line with the Barclays U.S. Aggregate Index, the Fund’s broad market/style-specific benchmark. Your Fund’s long-term performance appears later in this report. |
| | | | |
Fund vs. Indexes | |
| Total returns, 10/31/14 to 10/31/15, at net asset value (NAV). Performance shown does not include applicable contingent deferred sales charges (CDSC) or front-end sales charges, which would have reduced performance. | |
Class A Shares | | | 1.96 | % |
| Class C Shares | | | 1.20 | |
| Class R Shares | | | 1.71 | |
| Class Y Shares | | | 2.33 | |
| Class R5 Shares | | | 2.33 | |
| Class R6 Shares | | | 2.33 | |
| Barclays U.S. Aggregate Indexq (Broad Market/Style-Specific Index) | | | 1.96 | |
| Lipper Multi-Sector Income Funds Indexn (Peer Group Index) | | | -1.12 | |
Source(s): qFactSet Research Systems Inc.; nLipper Inc. | | | | |
Market conditions and your Fund
Global divergence with respect to growth, inflation and economic policy dominated global bond markets during the fiscal year ended October 31, 2015. Moderate growth in the US and UK led to the beginnings of tighter monetary policy, starting with the end of the US Federal Reserve’s (the Fed) quantitative easing (QE) program in addition to speculation on whether both regions’ central banks would lift short-term interest rates for the first time since before the onset of the 2007-2011 financial crisis. In the rest of the world, particularly in the eurozone and Asia, slowing growth and deflationary trends kept economic policies accommodative in an effort to foster growth.
Tepid global growth, together with deflationary concerns, weighed on long-term interest rates and supported government bond prices. Even in the US and UK, a bias toward central bank tightening had the effect of only flattening yield curves, with short-term government yields rising, while long-dated yields declined, weighed down by slower growth and strong investor demand for high quality yields that both countries offered.
Though developed market yields broadly declined, the fiscal year was marked by considerable interest rate volatility. The fiscal year began on the back of a US bond market rally as slowing global growth and lower inflation helped to push US Treasury yields lower and subsequently, bond prices higher. The downtrend
| | | | |
| Portfolio Composition* | |
| By security type | | % of total investments | |
| |
Mortgage-Backed Securities | | | 36.2% | |
U.S. Dollar Denominated Bonds & Notes | | | 31.2 | |
Asset-Backed Securities | | | 20.8 | |
Non- U.S. Dollar Denominated Bonds & Notes | | | 6.4 | |
U.S. Treasury Securities | | | 2.5 | |
Credit-Linked Securities | | | 1.5 | |
Municipal Obligations | | | 1.0 | |
U.S. Government Sponsored Agency Mortgage-Backed Securities | | | 0.4 | |
| | | | |
Total Net Assets | | $ | 38.8 million | |
| |
Total Number of Holdings* | | | 149 | |
| | | | | | |
| Top 10 Debt Issuers* | |
| | | % of total net assets | |
| | |
1. | | Wells Fargo Mortgage Backed Securities Trust | | | 5.4% | |
2. | | JPMBB Commercial Mortgage Securities Trust | | | 3.9 | |
3. | | COMM Mortgage Trust | | | 3.6 | |
4. | | U.S. Treasury | | | 2.6 | |
5. | | Carlyle Global Market Strategies CLO Ltd. | | | 2.5 | |
6. | | International Lease Finance Corp. | | | 2.3 | |
7. | | JP Morgan Mortgage Trust | | | 2.2 | |
8. | | Seneca Park CLO Ltd. | | | 2.1 | |
9. | | Ally Financial Inc. | | | 1.8 | |
10. | | Fannie Mae Connecticut Avenue Securities | | | 1.6 | |
The Fund’s holdings are subject to change, and there is no assurance that the Fund will continue to hold any particular security.
*Excluding options purchased and money market fund holdings.
Data presented here are as of October 31, 2015.
accelerated through the end of 2014 as oil prices hit lows not seen since the height of the financial crisis and as global deflationary fears began to set in. As quickly as US Treasury yields declined in 2014, they snapped back even faster during the first half of 2015. Helping to drive developed market interest rates higher following the implementation of the European Central Bank’s (ECB) version of the Fed’s QE program (commitment by the ECB to purchase longer-dated euro-area fixed income instruments in an effort to lower long-term interest rates to help spur economic growth) was stronger-than-expected economic data and market players’ notions that the rally was overdone. Also supporting higher US interest rates was the end of the Fed’s QE program purchasing long-dated Treasury bonds, coupled with supportive US economic data in the form of stronger economic growth and employment. The volatility within global interest rate markets ensued as the reporting period drew to a close with concerns over Chinese economic growth, in addition to broader market volatility helping drive global interest rates back down. Ten-year US Treasury yields ended 20 basis points lower at 2.14%, having begun the fiscal year at 2.34%.1 A basis point is one one-hundredth of a percentage point.
Within global credit markets, the investment-grade corporate credit, high yield and emerging market debt sectors were weighed down by slower global growth, increased risk aversion stemming from broader financial market volatility, and credit markets’ fundamental relationship to oil – the price of which declined significantly during the reporting period. Credit spreads across these sectors widened relative to their respective government counterparts, while valuations weakened. Falling oil prices brought into question the credit quality and even the long-term solvency of many high yield issuers, while bonds of oil-producing emerging market countries also experienced market stress. As the reporting period drew to a close, global equity market volatility stemming from concerns over China’s economic slowdown sent credit market spreads and yields to their highest levels since 2012, creating investing opportunities in some segments of the credit markets.
The Fund, at NAV, generated a positive return for the reporting period and performed in line with its broad market/style-specific benchmark. One of the largest contributors to the Fund’s performance was sector rotation into both high-yield bonds and bank loans toward the end of
| | |
| 4 | | Invesco Strategic Income Fund |
the reporting period, as these sectors benefited greatly from reduced volatility and a greater appetite for risk by investors. Exposure to structured products, particularly non-agency residential mortgage-backed securities (RMBS) and collateralized loan obligations (CLO) was positive for the Fund’s performance. RMBS benefited from the ongoing improvement in the US housing market while CLO gained in value given institutional demand for their structures and the underlying assets (primarily bank loans) within them. Long US dollar positions versus short developed market currencies, particularly Asian currencies expressed via forward contracts, added value within the Fund as volatile markets led investors to less volatile US dollar-based assets.
One of the greatest detractors from Fund performance for the reporting period was holdings of municipal bonds issued by Puerto Rico. Though these issues were senior in the capital structure and carried less credit risk than much of the commonwealth’s other municipal debt, these issues were stressed and experienced price declines due in part to Puerto Rico’s overall credit default. Exposure to global investment grade (IG) corporate bonds also weighed down on Fund performance. IG corporate bonds were hurt by ongoing strong new issuance as a result of continued heavy mergers and acquisitions, in addition to increased market volatility over the fiscal year. Exposure to emerging market corporate and sovereign bonds also hurt the Fund’s performance as emerging market debt struggled amid the increase in overall market volatility and a decline in risk appetite by investors.
The Fund may use active duration and yield curve positioning for risk management and for attempting to generate excess return versus its broad market/ style-specific benchmark. Duration measures a portfolio’s price sensitivity to interest rate changes. Yield curve positioning refers to actively emphasizing particular points (maturities) along the yield curve with favorable risk-return expectations. Duration of the portfolio was largely maintained between two and three years, and the tactical changes made to duration provided a small boost to Fund returns. Buying and selling US Treasury futures and interest rate swaptions were important tools used for the management of interest rate risk and to maintain the Fund’s targeted portfolio duration.
Part of the Fund’s strategy to manage credit and currency risk in the portfolio entailed purchasing and selling credit and
currency derivatives. We attempted to manage credit risk by purchasing and selling protection through credit default swaps at various points throughout the fiscal year. We attempted to manage currency risk by utilizing currency forwards and options on an as-needed and tactical basis. As a result, some of the performance of the strategy, both positive and negative, can be attributed to these instruments. Derivatives can be a cost-effective way to gain exposure to asset classes. However, derivatives may amplify traditional investment risks through the creation of leverage and may be less liquid than traditional securities.
We wish to remind you that the Fund is subject to interest rate risk, meaning when interest rates rise, the value of fixed income securities tends to fall. The risk may be greater in the current market environment because interest rates are at or near historic lows. The degree to which the value of fixed income securities may decline due to rising interest rates may vary depending on the speed and magnitude of the increase in interest rates, as well as individual security characteristics such as price, maturity, duration and coupon and market forces such as supply and demand for similar securities. The Fund may also invest in senior secured loans, which are an asset class that behaves differently from many traditional fixed income investments. The interest income generated by a portfolio of CLO or asset-backed securities (ABS) structured with, or comprised of senior loans is usually determined by a fixed credit spread over the London Interbank Offered Rate (Libor). Because senior secured loans generally have a very short duration and the coupons or interest rates are usually adjusted every 30 to 90 days as Libor changes, the yield on the portfolio adjusts. Interest rate risk refers to the tendency for traditional fixed income prices to decline when interest rates rise. For senior secured loans, however, interest rates and income are variable and the prices of loans are therefore less sensitive to interest rate changes than traditional fixed income bonds – and senior secured loans provide a natural hedge against rising interest rates. We are monitoring interest rates, and the market, economic and geopolitical factors that may impact the direction, speed and magnitude of changes to interest rates across the maturity spectrum, including the potential impact of monetary policy changes by the Fed and certain foreign central banks. If interest rates rise, markets may experience increased volatility, which may affect the value
and/or liquidity of certain of the Fund’s investments.
Thank you for investing in Invesco Strategic Income Fund and for sharing our long-term investment horizon.
1 Source: Bloomberg LP
The views and opinions expressed in management’s discussion of Fund performance are those of Invesco Advisers, Inc. These views and opinions are subject to change at any time based on factors such as market and economic conditions. These views and opinions may not be relied upon as investment advice or recommendations, or as an offer for a particular security. The information is not a complete analysis of every aspect of any market, country, industry, security or the Fund. Statements of fact are from sources considered reliable, but Invesco Advisers, Inc. makes no representation or warranty as to their completeness or accuracy. Although historical performance is no guarantee of future results, these insights may help you understand our investment management philosophy.
See important Fund and, if applicable, index disclosures later in this report.
| | |
 | | Ivan Bakrac Portfolio Manager and Head of Multi-Sector Portfolio Management for Invesco Fixed Income, is manager of |
| Invesco Strategic Income Fund. He joined Invesco in 2014. Mr. Bakrac earned a BBA in finance and investments from Baruch College and an MS in financial engineering from Polytechnic Institute of New York University. |
| |
 | | Ken Hill Chartered Financial Analyst, Portfolio Manager, is manager of Invesco Strategic Income Fund. He joined |
| Invesco in 2013. Mr. Hill graduated summa cum laude with a BSBA in corporate finance and economics from Western Carolina University. He earned his MS in mathematics from Florida State University. |
| |
 | | Robert Waldner Chartered Financial Analyst, Portfolio Manager, is manager of Invesco Strategic Income Fund. He |
| joined Invesco in 2013. Mr. Waldner earned a BSE degree in civil engineering from Princeton University. |
| | |
| 5 | | Invesco Strategic Income Fund |
Your Fund’s Long-Term Performance
Results of a $10,000 Investment – Oldest Share Class(es) since Inception
Fund and index data from 5/2/14
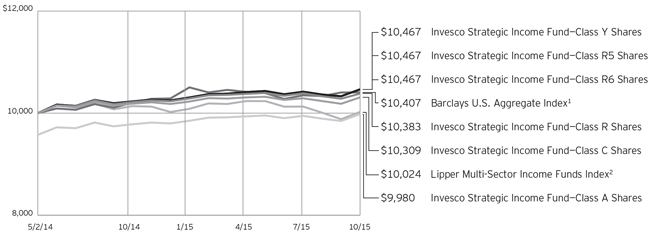
1 Source: FactSet Research Systems Inc.
2 Source: Lipper Inc.
Past performance cannot guarantee comparable future results.
The data shown in the chart include reinvested distributions, applicable sales charges and Fund expenses including
management fees. Index results include reinvested dividends, but they do not reflect sales charges. Performance of the peer group, if applicable, reflects fund expenses and management fees;
performance of a market index does not. Performance shown in the chart and table(s) does not reflect deduction of taxes a shareholder would pay on Fund distributions or sale of Fund shares.
continued from page 10
in a loss. In a rising market, the Fund’s short positions will cause the Fund to underperform the overall market and its peers that do not engage in shorting. If the Fund holds both long and short positions, and both positions decline simultaneously, the short positions will not provide any buffer (hedge) from declines in value of the Fund’s long positions. Certain types of short positions involve leverage, which may exaggerate any losses, potentially more than the actual cost of the investment, and will increase the volatility of the Fund’s returns.
| n | | TBA transactions risk. TBA transactions involve the risk of loss if the securities received are less favorable than what was anticipated by the Fund when entering into the TBA transaction, or if the counterparty fails to deliver the securities. When the Fund enters into a short sale of a TBA mortgage it does not own, the Fund may have to purchase deliverable mortgages to settle the short sale at a higher price than anticipated, thereby causing a loss. As there is no limit on how much the price of mortgage securities can increase, the Fund’s exposure is unlimited. The |
| | | Fund may not always be able to purchase mortgage securities to close out the short position at a particular time or at an acceptable price. In addition, taking short positions results in a form of leverage, which could increase the volatility of the Fund’s share price. |
| n | | U.S. government obligations risk. Obligations of U.S. government agencies and authorities receive varying levels of support and may not be backed by the full faith and credit of the U.S. government, which could affect the Fund’s ability to recover should they default. No assurance can be given that the U.S. government will provide financial support to its agencies and authorities if it is not obligated by law to do so. |
| n | | When-issued, delayed delivery and forward commitment risks. When-issued and delayed delivery transactions subject the Fund to market risk because the value or yield of a security at delivery may be more or less than the purchase price or yield generally available when delivery occurs, and counterparty risk because the Fund relies on the buyer or seller, as the case may be, to consummate the transaction. These transactions also have a |
| | | leveraging effect on the Fund because the Fund commits to purchase securities that it does not have to pay for until a later date, which increases the Fund’s overall investment exposure and, as a result, its volatility. |
| n | | zero coupon or pay-in-kind securities risk. The value, interest rates, and liquidity of non-cash paying instruments, such as zero coupon and pay-in-kind securities, are subject to greater fluctuation than other types of securities. The higher yields and interest rates on pay-in-kind securities reflect the payment deferral and increased credit risk associated with such instruments and that such investments may represent a higher credit risk than loans that periodically pay interest. |
About indexes used in this report
| n | | The Barclays U.S. Aggregate Index is an unmanaged index considered representative of the US investment-grade, fixed-rate bond market. |
| n | | The Lipper Multi-Sector Income Funds Index is an unmanaged index considered representative of multi-sector income funds tracked by Lipper. |
continued on page 7
| | |
| 6 | | Invesco Strategic Income Fund |
| | | | |
| Average Annual Total Returns | |
| As of 10/31/15, including maximum applicable sales charges | |
| |
Class A Shares | | | | |
Inception (5/2/14) | | | -0.13 | % |
1 Year | | | -2.40 | |
| |
Class C Shares | | | | |
Inception (5/2/14) | | | 2.05 | % |
1 Year | | | 0.23 | |
| |
Class R Shares | | | | |
Inception (5/2/14) | | | 2.54 | % |
1 Year | | | 1.71 | |
| |
Class Y Shares | | | | |
Inception (5/2/14) | | | 3.09 | % |
1 Year | | | 2.33 | |
| |
Class R5 Shares | | | | |
Inception (5/2/14) | | | 3.09 | % |
1 Year | | | 2.33 | |
| |
Class R6 Shares | | | | |
Inception (5/2/14) | | | 3.09 | % |
1 Year | | | 2.33 | |
The performance data quoted represent past performance and cannot guarantee comparable future results; current performance may be lower or higher. Please visit invesco.com/performance for the most recent month-end performance. Performance figures reflect reinvested distributions, changes in net asset value and the effect of the maximum sales charge unless otherwise stated. Investment return and principal value will fluctuate so that you may have a gain or loss when you sell shares.
| | | | |
| Average Annual Total Returns | |
| As of 9/30/15, the most recent calendar quarter end, including maximum applicable sales charges | |
| |
Class A Shares | | | | |
Inception (5/2/14) | | | -1.05 | % |
1 Year | | | -3.25 | |
| |
Class C Shares | | | | |
Inception (5/2/14) | | | 1.30 | % |
1 Year | | | -0.63 | |
| |
Class R Shares | | | | |
Inception (5/2/14) | | | 1.78 | % |
1 Year | | | 0.84 | |
| |
Class Y Shares | | | | |
Inception (5/2/14) | | | 2.33 | % |
1 Year | | | 1.35 | |
| |
Class R5 Shares | | | | |
Inception (5/2/14) | | | 2.33 | % |
1 Year | | | 1.35 | |
| |
Class R6 Shares | | | | |
Inception (5/2/14) | | | 2.33 | % |
1 Year | | | 1.35 | |
The net annual Fund operating expense ratio set forth in the most recent Fund prospectus as of the date of this report for Class A, Class C, Class R, Class Y, Class R5 and Class R6 shares was 0.94%, 1.69%, 1.19%, 0.69%, 0.69% and 0.69%, respectively.1,2 The total annual Fund operating expense ratio set forth in the most recent Fund prospectus as of the date of this report for Class A, Class C, Class R, Class Y, Class R5 and Class R6 shares 2.31%, 3.06%, 2.56%, 2.06%, 2.13% and 2.13%,
respectively. The expense ratios presented above may vary from the expense ratios presented in other sections of this report that are based on expenses incurred during the period covered by this report.
Class A share performance reflects the maximum 4.25% sales charge, and Class C share performance reflects the applicable contingent deferred sales charge (CDSC) for the period involved. The CDSC on Class C shares is 1% for the first year after purchase. Class R, Class Y, Class R5 and Class R6 shares do not have a front-end sales charge or a CDSC; therefore, performance is at net asset value.
The performance of the Fund’s share classes will differ primarily due to different sales charge structures and class expenses.
Fund performance reflects any applicable fee waivers and/or expense reimbursements. Had the adviser not waived fees and/or reimbursed expenses currently or in the past, returns would have been lower. See current prospectus for more information.
| 1 | Total annual Fund operating expenses after any contractual fee waivers and/or expense reimbursements by the adviser in effect through at least February 28, 2017. See current prospectus for more information. |
| 2 | Total annual Fund operating expenses after any contractual fee waivers and/or expense reimbursements by the adviser in effect through at least June 30, 2017. See current prospectus for more information. |
continued from page 6
| n | | The Fund is not managed to track the performance of any particular index, including the index(es) described here, and consequently, the performance of the Fund may deviate significantly from the performance of the index(es). |
| n | | A direct investment cannot be made in an index. Unless otherwise indicated, index results include reinvested dividends, and they do not reflect sales charges. Performance of the peer group, if applicable, reflects fund expenses; performance of a market index does not. |
Other information
| n | | The returns shown in management’s discussion of Fund performance are based on net asset values (NAVs) calculated for shareholder transactions. Generally accepted accounting principles require adjustments to be made to the net assets of the Fund at period end for financial reporting purposes, and as such, the NAVs for shareholder transactions and the returns based on those NAVs may differ from the NAVs and returns reported in the Financial Highlights. |
| n | | Industry classifications used in this report are generally according to the Global Industry Classification Standard, which was developed by and is the exclusive property and a service mark of MSCI Inc. and Standard & Poor’s. |
| | |
| 7 | | Invesco Strategic Income Fund |
Invesco Strategic Income Fund’s investment objective is to provide current income and, secondarily, long-term growth of capital.
| n | | Unless otherwise stated, information presented in this report is as of October 31, 2015, and is based on total net assets. |
| n | | Unless otherwise noted, all data provided by Invesco. |
| n | | To access your Fund’s reports/prospectus, visit invesco.com/fundreports. |
About share classes
| n | | Class R shares are generally available only to employer sponsored retirement and benefit plans. Please see the prospectus for more information. |
| n | | Class Y shares are available only to certain investors. Please see the prospectus for more information. |
| n | | Class R5 shares and Class R6 shares are primarily intended for employer sponsored retirement and benefit plans that meet certain standards and for institutional investors. Please see the prospectus for more information. |
Principal risks of investing in the Fund
| n | | Active trading risk. Active trading of portfolio securities may result in added expenses, a lower return and increased tax liability. |
| n | | Bank loan risk. There are a number of risks associated with an investment in bank loans including credit risk, interest rate risk, liquidity risk and prepayment risk. Lack of an active trading market, restrictions on resale, irregular trading activity, wide bid/ask spreads and extended trade settlement periods may impair the Fund’s ability to sell bank loans within its desired time frame or at an acceptable price and its ability to accurately value existing and prospective investments. Extended trade settlement periods may result in cash not being immediately available to the Fund. As a result of such illiquidity, the Fund may have to sell other investments or engage in borrowing transactions to raise cash to meet its obligations. The risk of holding bank loans is also directly tied to the risk of insolvency or bankruptcy of the issuing banks. These risks could cause the Fund to lose income or principal on a particular investment, which in turn could affect the Fund’s returns. The value of bank loans can be affected by and sensitive to changes in government regulation and to economic downturns in the United States and abroad. Bank loans generally |
| | | are floating rate loans, which are subject to interest rate risk as the interest paid on the floating rate loans adjusts periodically based on changes in widely accepted reference rates. |
| n | | Changing fixed income market conditions risk. The current historically low interest rate environment was created in part by the Federal Reserve Board (FRB) and certain foreign central banks keeping the federal funds and equivalent foreign rates at or near zero. There is a risk that interest rates will rise when the FRB and central banks raise these rates. This risk is heightened due to the completion of the FRB’s quantitative easing program and the “tapering” of other similar foreign central bank actions. This eventual increase in the federal funds and equivalent foreign rates may expose fixed income markets to heightened volatility and reduced liquidity for certain fixed income investments, particularly those with longer maturities. In addition, decreases in fixed income dealer market-making capacity may also potentially lead to heightened volatility and reduced liquidity in the fixed income markets. As a result, the value of the Fund’s investments and share price may decline. Changes in central bank policies could also result in higher than normal shareholder redemptions, which could potentially increase portfolio turnover and the Fund’s transaction costs. |
| n | | Collateralized loan obligations risk. CLOs are subject to the risks of substantial losses due to actual defaults by underlying borrowers, which will be greater during periods of economic or financial stress. CLOs may also lose value due to collateral defaults and disappearance of subordinate tranches, market anticipation of defaults, and investor aversion to CLO securities as a class. The risks of CLOs will be greater if the Fund invests in CLOs that hold loans of uncreditworthy borrowers or if the Fund holds subordinate tranches of the CLO that absorbs losses from the |
| | | defaults before senior tranches. In addition, CLOs are subject to interest rate risk and credit risk. The risks related to investments in CLOs are greater for this Fund than for many other mutual funds because the Fund maintains the ability to invest, at any time and from time to time, up to 100% of its assets in such securities. If the Fund’s portfolio managers increase the Fund’s investments in CLOs at an inopportune time, the Fund could suffer significant losses. |
| n | | Convertible securities risk. The market values of convertible securities are affected by market interest rates, the risk of actual issuer default on interest or principal payments and the value of the underlying common stock into which the convertible security may be converted. Additionally, a convertible security is subject to the same types of market and issuer risks as apply to the underlying common stock. In addition, certain convertible securities are subject to involuntary conversions and may undergo principal writedowns upon the occurrence of certain triggering events, and, as a result, are subject to an increased risk of loss. |
| n | | Debt securities risk. The prices of debt securities held by the Fund will be affected by changes in interest rates, the creditworthiness of the issuer and other factors. An increase in prevailing interest rates typically causes the value of existing debt securities to fall and often has a greater impact on longer-duration debt securities and higher quality debt securities. Falling interest rates will cause the Fund to reinvest the proceeds of debt securities that have been repaid by the issuer at lower interest rates. Falling interest rates may also reduce the Fund’s distributable income because interest payments on floating rate debt instruments held by the Fund will decline. The Fund could lose money on investments in debt securities if the issuer or borrower fails to meet its obligations to make interest payments and/or to repay principal in a timely manner. Changes in an issuer’s financial strength, the market’s perception of such strength or in the credit rating of the issuer or the security may affect the value of debt securities. The Adviser’s credit analysis may fail to anticipate |
| | |
This report must be accompanied or preceded by a currently effective Fund prospectus, which contains more complete information, including sales charges and expenses. Investors should read it carefully before investing. | | |
NOT FDIC INSURED | MAY LOSE VALUE | NO BANK GUARANTEE
| | |
| 8 | | Invesco Strategic Income Fund |
such changes, which could result in buying a debt security at an inopportune time or failing to sell a debt security in advance of a price decline or other credit event.
| n | | Derivatives risk. The value of a derivative instrument depends largely on (and is derived from) the value of an underlying security, currency, commodity, interest rate, index or other asset (each referred to as an underlying asset). In addition to risks relating to the underlying assets, the use of derivatives may include other, possibly greater, risks, including counterparty, leverage and liquidity risks. Counterparty risk is the risk that the counterparty to the derivative contract will default on its obligation to pay the Fund the amount owed or otherwise perform under the derivative contract. Derivatives create leverage risk because they do not require payment up front equal to the economic exposure created by owning the derivative. As a result, an adverse change in the value of the underlying asset could result in the Fund sustaining a loss that is substantially greater than the amount invested in the derivative, which may make the Fund’s returns more volatile and increase the risk of loss. Derivative instruments may also be less liquid than more traditional investments and the Fund may be unable to sell or close out its derivative positions at a desirable time or price. This risk may be more acute under adverse market conditions, during which the Fund may be most in need of liquidating its derivative positions. Derivatives may also be harder to value, less tax efficient and subject to changing government regulation that could impact the Fund’s ability to use certain derivatives or their cost. Also, derivatives used for hedging or to gain or limit exposure to a particular market segment may not provide the expected benefits, particularly during adverse market conditions. These risks are greater for the Fund than mutual funds that do not use derivative instruments or that use derivative instruments to a lesser extent than the Fund to implement their investment strategy. |
| n | | Emerging markets securities risk. Emerging markets (also referred to as developing markets) are generally subject to greater market volatility, political, |
| | | social and economic instability, uncertain trading markets and more governmental limitations on foreign investment than more developed markets. In addition, companies operating in emerging markets may be subject to lower trading volume and greater price fluctuations than companies in more developed markets. Securities law and the enforcement of systems of taxation in many emerging market countries may change quickly and unpredictably. In addition, investments in emerging markets securities may also be subject to additional transaction costs, delays in settlement procedures, and lack of timely information. |
| n | | Exchange-traded funds risk. In addition to the risks associated with the underlying assets held by the exchange-traded fund, investments in exchange-traded funds are subject to the following additional risks: (1) an exchange-traded fund’s shares may trade above or below its net asset value; (2) an active trading market for the exchange-traded fund’s shares may not develop or be maintained; (3) trading an exchange-traded fund’s shares may be halted by the listing exchange; (4) a passively managed exchange-traded fund may not track the performance of the reference asset; and (5) a passively managed exchange-traded fund may hold troubled securities. Investment in exchange-traded funds may involve duplication of management fees and certain other expenses, as the Fund indirectly bears its proportionate share of any expenses paid by the exchange-traded funds in which it invests. Further, certain exchange-traded funds in which the Fund may invest are leveraged, which may result in economic leverage, permitting the Fund to gain exposure that is greater than would be the case in an unlevered instrument and potentially resulting in greater volatility. |
| n | | Foreign currency tax risk. If the U.S. Treasury Department were to exercise its authority to issue regulations that exclude from the definition of “qualifying income” foreign currency gains not directly related to the Fund’s business of investing in securities, the Fund may be unable to qualify as a regulated investment company for one or more years. In this event, the Fund’s Board of |
| | | Trustees may authorize a significant change in investment strategy or other action. |
| n | | Foreign government debt risk. Investments in foreign government debt securities (sometimes referred to as sovereign debt securities) involve certain risks in addition to those relating to foreign securities or debt securities generally. The issuer of the debt or the governmental authorities that control the repayment of the debt may be unable or unwilling to repay principal or interest when due in accordance with the terms of such debt, and the Fund may have limited recourse in the event of a default against the defaulting government. Without the approval of debt holders, some governmental debtors have in the past been able to reschedule or restructure their debt payments or declare moratoria on payments. |
| n | | Foreign securities risk. The Fund’s foreign investments may be adversely affected by political and social instability, changes in economic or taxation policies, difficulty in enforcing obligations, decreased liquidity or increased volatility. Foreign investments also involve the risk of the possible seizure, nationalization or expropriation of the issuer or foreign deposits (in which the Fund could lose its entire investments in a certain market) and the possible adoption of foreign governmental restrictions such as exchange controls. Unless the Fund has hedged its foreign securities risk, foreign securities risk also involves the risk of negative foreign currency rate fluctuations, which may cause the value of securities denominated in such foreign currency (or other instruments through which the Fund has exposure to foreign currencies) to decline in value. Currency exchange rates may fluctuate significantly over short periods of time. Currency hedging strategies, if used, are not always successful. |
| n | | High yield debt securities (junk bond) risk. Investments in high yield debt securities (“junk bonds”) and other lower-rated securities will subject the Fund to substantial risk of loss. These securities are considered to be speculative with respect to the issuer’s ability to pay interest and principal when due, are more susceptible to default or decline |
continued on page 10
| | |
| 9 | | Invesco Strategic Income Fund |
continued from page 9
in market value and are less liquid than investment grade debt securities. Prices of high yield debt securities tend to be very volatile.
| n | | Inflation-indexed securities risk. The values of inflation-indexed securities generally fluctuate in response to changes in real interest rates, and the Fund’s income from its investments in these securities is likely to fluctuate considerably more than the income distributions of its investments in more traditional fixed-income securities. |
| n | | Investment companies risk. Investing in other investment companies could result in the duplication of certain fees, including management and administrative fees, and may expose the Fund to the risks of owning the underlying investments that the other investment company holds. |
| n | | Liquidity risk. The Fund may be unable to sell illiquid investments at the time or price it desires and, as a result, could lose its entire investment in such investments. Liquid securities can become illiquid during periods of market stress. If a significant amount of the Fund’s securities become illiquid, the Fund may not be able to timely pay redemption proceeds and may need to sell securities at significantly reduced prices. |
| n | | Management risk. The Fund is actively managed and depends heavily on the Adviser’s judgment about markets, interest rates or the attractiveness, relative values, liquidity, or potential appreciation of particular investments made for the Fund’s portfolio. The Fund could experience losses if these judgments prove to be incorrect. Because the Fund’s investment process relies heavily on its asset allocation process, market movements that are counter to the portfolio managers’ expectations may have a significant adverse effect on the Fund’s net asset value. Additionally, legislative, regulatory, or tax developments may adversely affect management of the Fund and, therefore, the ability of the Fund to achieve its investment objective. |
| n | | Market risk. The market values of the Fund’s investments, and therefore the value of the Fund’s shares, will go up and down, sometimes rapidly or unpredictably. Market risk may affect a single issuer, industry or section of the economy, or it may affect the market as a whole. Individual stock prices tend to go up and down more dramatically than those of certain other types of investments, such as bonds. During a general |
| | | downturn in the financial markets, multiple asset classes may decline in value. When markets perform well, there can be no assurance that specific investments held by the Fund will rise in value. |
| n | | Mortgage- and asset-backed securities risk. Mortgage- and asset-backed securities, including collateralized debt obligations and collateralized mortgage obligations, are subject to prepayment or call risk, which is the risk that a borrower’s payments may be received earlier or later than expected due to changes in prepayment rates on underlying loans. This could result in the Fund reinvesting these early payments at lower interest rates, thereby reducing the Fund’s income. Mortgage- and asset-backed securities also are subject to extension risk, which is the risk that an unexpected rise in interest rates could reduce the rate of prepayments, causing the price of the mortgage- and asset-backed securities and the Fund’s share price to fall. An unexpectedly high rate of defaults on the mortgages held by a mortgage pool may adversely affect the value of mortgage-backed securities and could result in losses to the Fund. The Fund may invest in mortgage pools that include subprime mortgages, which are loans made to borrowers with weakened credit histories or with lower capacity to make timely payments on their mortgages. Privately issued mortgage-related securities are not subject to the same underwriting requirements as those with government or government-sponsored entity guarantee and, therefore, mortgage loans underlying privately issued mortgage-related securities may have less favorable collateral, credit risk or other underwriting characteristics, and wider variances in interest rate, term, size, purpose and borrower characteristics. The risks related to investments in agency and non-agency mortgage-backed securities and CMOs are greater for this Fund than for many other mutual funds because the Fund maintains the ability to invest, at any time and from time to time, up to 100% of its assets in such securities. If the Fund’s portfolio managers increase the Fund’s investments in agency and non-agency mortgage-backed securities at an inopportune time, the Fund could suffer significant losses. |
| n | | Municipal securities risk. The risk of a municipal obligation generally depends on the financial and credit status of the issuer. Constitutional amendments, legislative enactments, executive orders, |
| | | administrative regulations, voter initiatives, and the issuer’s regional economic conditions may affect the municipal security’s value, interest payments, repayment of principal and the Fund’s ability to sell the security. Failure of a municipal security issuer to comply with applicable tax requirements may make income paid thereon taxable, resulting in a decline in the security’s value. In addition, there could be changes in applicable tax laws or tax treatments that reduce or eliminate the current federal income tax exemption on municipal securities or otherwise adversely affect the current federal or state tax status of municipal securities. |
| n | | Non-diversification risk. The Fund is non-diversified and can invest a greater portion of its assets in the obligations or securities of a small number of issuers or any single issuer than a diversified fund can. A change in the value of one or a few issuers’ securities will therefore affect the value of the Fund more than if it was a diversified fund. |
| n | | Reverse repurchase agreement risk. If the market value of securities to be repurchased declines below the repurchase price, or the other party defaults on its obligation, the Fund may be delayed or prevented from completing the transaction. In the event the buyer of securities under a reverse repurchase agreement files for bankruptcy or becomes insolvent, the Fund’s use of the proceeds from the sale of the securities may be restricted. When the Fund engages in reverse repurchase agreements, changes in the value of the Fund’s investments will have a larger effect on its share price than if it did not engage in these transactions due to the effect of leverage, which will make the Fund’s returns more volatile and increase the risk of loss. Additionally, interest expenses related to reverse repurchase agreements could exceed the rate of return on other investments held by the Fund, thereby reducing returns to shareholders. |
| n | | Short position risk. Because a Fund’s potential loss on a short position arises from increases in the value of the asset sold short, the Fund will incur a loss on a short position, which is theoretically unlimited, if the price of the asset sold short increases from the short sale price. The counterparty to a short position or other market factors may prevent the Fund from closing out a short position at a desirable time or price and may reduce or eliminate any gain or result |
continued on page 6
| | |
| 10 | | Invesco Strategic Income Fund |
Schedule of Investments(a)
October 31, 2015
| | | | | | | | |
| | | Principal
Amount | | | Value | |
Asset-Backed Securities–57.22% | |
Adjustable Rate Mortgage Trust, Series 2005-11, Class 2A41, Floating Rate Pass Through Ctfs., 2.82%, 02/25/36(b) | | $ | 145,467 | | | $ | 144,307 | |
ARES XI CLO Ltd., Series 2007-11A, Class E, Floating Rate Pass Through Ctfs., 6.29%,
10/11/21(b)(c) | | | 250,000 | | | | 250,827 | |
Babson Euro CLO 2014-2 B.V. (Netherlands), Series 2014-2A, Class D, Floating Rate Pass Through Ctfs., 3.27%,
11/25/27(c)(d) | | EUR | 250,000 | | | | 260,130 | |
BAMLL Commercial Mortgage Securities Trust, Series 2014-ICTS, Class C, Floating Rate Pass Through Ctfs., 1.60%,
06/15/28(b)(c) | | | 200,000 | | | | 199,523 | |
Banc of America Commercial Mortgage Trust,
Series 2015-UBS7, Class C, Variable Rate Pass Through Ctfs., 4.51%, 09/15/48(b) | | | 250,000 | | | | 247,301 | |
Series 2015-UBS7, Class XA, IO Variable Rate Pass Through Ctfs., 1.09%, 09/15/48(b) | | | 1,878,244 | | | | 123,938 | |
Banc of America Funding Trust, Series 2006-3, Class 5A5, Pass Through Ctfs., 5.50%, 03/25/36 | | | 165,352 | | | | 157,112 | |
Banc of America Mortgage Trust, Series 2005-H, Class 2A1, Floating Rate Pass Through Ctfs., 2.85%, 09/25/35(b) | | | 263,270 | | | | 243,130 | |
BBCMS Trust, Series 2015-RRI, Class D, Floating Rate Pass Through Ctfs., 3.10%, 05/15/32(b)(c) | | | 210,000 | | | | 207,942 | |
BCAP LLC Trust, Series 2009-RR13, Class 15A2, Pass Through Ctfs., 6.00%, 07/26/37(c) | | | 166,804 | | | | 166,182 | |
Bear Stearns Adjustable Rate Mortgage Trust, Series 2005-2, Class A1, Floating Rate Pass Through Ctfs., 2.68%, 03/25/35(b) | | | 221,354 | | | | 222,740 | |
Bear Stearns Commercial Mortgage Securities Trust, Series 2005-PWR9, Class AJ, Variable Rate Pass Through Ctfs., 4.99%, 09/11/42(b) | | | 47,733 | | | | 47,853 | |
Carlyle Global Market Strategies CLO Ltd. (Cayman Islands), Series 2012-2A, Class ER, Floating Rate Pass Through Ctfs., 6.42%, 07/20/23(b)(c) | | | 500,000 | | | | 488,784 | |
Series 2012-3A, Class D, Floating Rate Pass Through Ctfs., 5.82%, 10/04/24(b)(c) | | | 500,000 | | | | 473,843 | |
Cent CLO Ltd. (Cayman Islands), Series 2013-19A, Class C, Floating Rate Pass Through Ctfs., 3.62%, 10/29/25(b)(c) | | | 250,000 | | | | 228,356 | |
Chase Mortgage Finance Trust, Series 2005-A1, Class 3A1, Floating Rate Pass Through Ctfs., 2.45%, 12/25/35(b) | | | 159,946 | | | | 145,910 | |
Series 2007-A1, Class 13A1, Floating Rate Pass Through Ctfs., 4.90%, 03/25/37(b) | | | 261,248 | | | | 245,037 | |
| | | | | | | | |
| | | Principal
Amount | | | Value | |
Citigroup Mortgage Loan Trust, Inc., Series 2005-11, Class A2A, Floating Rate Pass Through Ctfs., 2.73%, 10/25/35(b) | | $ | 80,563 | | | $ | 80,018 | |
Series 2006-AR2, Class 1A2, Floating Rate Pass Through Ctfs., 2.64%, 03/25/36(b) | | | 175,848 | | | | 165,787 | |
COMM Mortgage Trust,
Series 2015-CR23, Class CMD, Variable Rate Pass Through Ctfs., 3.81%, 05/10/48(b)(c) | | | 300,000 | | | | 290,771 | |
Series 2015-CR24, Class B, Variable Rate Pass Through Ctfs., 4.52%, 08/10/55(b)(c) | | | 300,000 | | | | 309,781 | |
Series 2015-CR24, Class XA, IO Variable Rate Pass Through Ctfs., 1.04%, 08/10/55(b) | | | 5,390,645 | | | | 336,482 | |
Series 2015-CR25, Class B, Variable Rate Pass Through Ctfs., 4.70%, 08/10/48(b) | | | 170,000 | | | | 176,366 | |
Series 2015-PC1, Class XA, IO Variable Rate Pass Through Ctfs., 0.95%, 07/10/50(b)(c) | | | 5,990,953 | | | | 294,528 | |
CSAIL Commercial Mortgage Trust, Series 2015-C1, Class B, Pass Through Ctfs., 4.04%, 04/15/50 | | | 165,000 | | | | 166,537 | |
Dryden XI-Leveraged Loan CDO, Series 2006-11A, Class A3, Floating Rate Pass Through Ctfs., 0.70%, 04/12/20(b)(c)(e) | | | 500,000 | | | | 489,174 | |
Eaton Vance CDO VIII Ltd. (Cayman Islands),
Series 2006-8A, Class D, Floating Rate Pass Through Ctfs., 3.74%, 08/15/22(b)(c) | | | 400,000 | | | | 387,282 | |
Fannie Mae Connecticut Avenue Securities, Series 2015-C01, Class 1M2, Floating Rate Pass Through Ctfs., 4.50%, 02/25/25(b) | | | 160,000 | | | | 154,551 | |
Series 2015-C02, Class 2M2, Floating Rate Pass Through Ctfs., 4.20%, 05/25/25(b) | | | 500,000 | | | | 474,550 | |
Foothill CLO Ltd. (Cayman Islands), Series 2007-1A, Class C, Floating Rate Pass Through Ctfs., 1.04%, 02/22/21(b)(c)(e) | | | 250,000 | | | | 247,955 | |
GMACM Mortgage Loan Trust,
Series 2006-AR1, Class 1A1, Floating Rate Pass Through Ctfs., 3.08%, 04/19/36(b) | | | 209,516 | | | | 189,480 | |
GS Mortgage Securities Trust, Series 2015-GC32, Class B, Variable Rate Pass Through Ctfs., 4.55%, 07/10/48(b) | | | 350,000 | | | | 369,301 | |
GSAA Home Equity Trust, Series 2007-7, Class A4, Floating Rate Pass Through Ctfs., 0.47%, 07/25/37(b) | | | 211,838 | | | | 181,751 | |
GSR Mortgage Loan Trust, Series 2006-1F, Class 1A11, Pass Through Ctfs., 5.50%, 02/25/36 | | | 236,593 | | | | 227,026 | |
H/2 Asset Funding (Cayman Islands), Series 2015-1A, Class BFL, Pass Through Ctfs., 2.50%, 06/24/49(c) | | | 400,000 | | | | 391,911 | |
Hamlet II Ltd. (Cayman Islands), Series 2006-2A, Class A2B, Floating Rate Pass Through Ctfs., 0.64%, 05/11/21(b)(c)(e) | | | 500,000 | | | | 482,411 | |
See accompanying Notes to Financial Statements which are an integral part of the financial statements.
11 Invesco Strategic Income Fund
| | | | | | | | |
| | | Principal
Amount | | | Value | |
Highbridge Loan Management Ltd. (Cayman Islands), Series 2015-6A, Class D, Floating Rate Pass Through Ctfs., 3.95%, 05/05/27(b)(c) | | $ | 250,000 | | | $ | 227,816 | |
JP Morgan Chase Commercial Mortgage Securities Trust, Series 2014-FL5, Class B, Floating Rate Pass Through Ctfs., 1.55%, 07/15/31(b)(c) | | | 250,000 | | | | 250,511 | |
JP Morgan Mortgage Trust, Series 2005-A1, Class IB2, Floating Rate Pass Through Ctfs., 2.66%, 02/25/35(b) | | | 161,088 | | | | 138,632 | |
Series 2005-A3, Class 7CA1, Floating Rate Pass Through Ctfs., 2.60%, 06/25/35(b) | | | 152,659 | | | | 148,954 | |
Series 2006-A2, Class 1A1, Floating Rate Pass Through Ctfs., 2.79%, 04/25/36(b) | | | 106,548 | | | | 97,586 | |
Series 2007-A1, Class 2A2, Floating Rate Pass Through Ctfs., 2.68%, 07/25/35(b) | | | 268,537 | | | | 263,889 | |
Series 2007-A4, Class 3A1, Floating Rate Pass Through Ctfs., 5.34%, 06/25/37(b) | | | 219,074 | | | | 199,454 | |
JPMBB Commercial Mortgage Securities Trust,
Series 2013-C17, Class C, Variable Rate Pass Through Ctfs., 5.05%, 01/15/47(b) | | | 380,000 | | | | 391,791 | |
Series 2015-C29, Class C, Variable Rate Pass Through Ctfs., 4.34%, 05/15/48(b) | | | 302,000 | | | | 285,467 | |
Series 2015-C32, Class B, Variable Rate Pass Through Ctfs., 4.39%, 11/15/48(b) | | | 800,000 | | | | 843,989 | |
Magnetite XV Ltd. (Cayman Islands), Series 2015-15A, Class D, Floating Rate Pass Through Ctfs., 4.54%, 10/25/27(b)(c) | | | 250,000 | | | | 237,345 | |
Merrill Lynch Mortgage Investors Trust, Series 2005-3, Class 3A, Floating Rate Pass Through Ctfs., 2.29%, 11/25/35(b) | | | 151,083 | | | | 148,426 | |
Series 2005-A9, Class 2A1C, Floating Rate Pass Through Ctfs., 2.66%, 12/25/35(b) | | | 200,000 | | | | 193,568 | |
Morgan Stanley Bank of America Merrill Lynch Trust,
Series 2014-C18, Class B, Variable Rate Pass Through Ctfs., 4.59%, 10/15/47(b) | | | 250,000 | | | | 264,697 | |
Series 2015-C22, Class XA, IO Variable Rate Pass Through Ctfs., 1.19%, 04/15/48(b) | | | 2,139,916 | | | | 160,166 | |
Series 2015-C26, Class C, Pass Through Ctfs., 4.41%, 11/15/48 | | | 190,000 | | | | 189,280 | |
Morgan Stanley Mortgage Loan Trust, Series 2005-10, Class 1A1, Floating Rate Pass Through Ctfs., 0.90%, 12/25/35(b) | | | 276,611 | | | | 225,123 | |
Series 2005-3AR, Class 3A, Floating Rate Pass Through Ctfs., 2.57%, 07/25/35(b) | | | 266,446 | | | | 230,679 | |
Neuberger Berman CLO XV (Cayman Islands), Series 2013-15A, Class D, Floating Rate Pass Through Ctfs. 3.57%, 10/15/25(b)(c) | | | 250,000 | | | | 229,091 | |
| | | | | | | | |
| | | Principal
Amount | | | Value | |
Neuberger Berman CLO XVII Ltd. (Cayman Islands), Series 2014-17A, Class E1, Floating Rate Pass Through Ctfs., 5.06%, 08/04/25(b)(c) | | $ | 480,000 | | | $ | 377,334 | |
Northwoods Capital X Ltd. (Cayman Islands), Series 2013-10A, Class D, Floating Rate Pass Through Ctfs. 3.91%, 11/04/25(b)(c) | | | 250,000 | | | | 228,449 | |
Octagon Investment Partners XVIII Ltd. (Cayman Islands), Series 2013-1A, Class D, Floating Rate Pass Through Ctfs., 5.57%, 12/16/24(b)(c) | | | 350,000 | | | | 305,271 | |
Octagon Investment Partners XXI Ltd. (Cayman Islands), Series 2014-1A, Class D, Floating Rate Pass Through Ctfs., 6.88%, 11/14/26(b)(c) | | | 250,000 | | | | 235,437 | |
PFP Ltd. (Cayman Islands), Series 2015-2, Class B, Floating Rate Pass Through Ctfs., 2.89%, 07/14/34(b)(c) | | | 230,000 | | | | 229,586 | |
RAIT Trust, Series 2015-FL4, Class B, Floating Rate Pass Through Ctfs., 2.50%, 12/15/31(b)(c) | | | 341,176 | | | | 341,636 | |
Regatta IV Funding Ltd. (Cayman Islands), Series 2014-1A, Class D, Floating Rate Pass Through Ctfs. 3.80%, 07/25/26(b)(c) | | | 290,000 | | | | 262,850 | |
Seneca Park CLO Ltd. (Cayman Islands), Series 2014-1A, Class B2, Pass Through Ctfs., 4.35%, 07/17/26(c) | | | 600,000 | | | | 606,167 | |
Series 2014-1A, Class E, Floating Rate Pass Through Ctfs., 4.99%, 07/17/26(b)(c) | | | 250,000 | | | | 214,750 | |
Stone Tower CLO VII Ltd. (Cayman Islands), Series 2007-7A, Class C, Floating Rate Pass Through Ctfs. 4.54%, 08/30/21(b)(c) | | | 250,000 | | | | 249,103 | |
Structured Adjustable Rate Mortgage Loan Trust,
Series 2004-20, Class 3A1, Floating Rate Pass Through Ctfs., 2.45%, 01/25/35(b) | | | 479,762 | | | | 458,683 | |
Series 2004-8, Class 3A, Floating Rate Pass Through Ctfs., 2.50%, 07/25/34(b) | | | 105,499 | | | | 105,782 | |
Structured Asset Securities Corp., Series 2002-21A, Class B1II, Floating Rate Pass Through Ctfs., 2.57%, 11/25/32(b) | | | 157,116 | | | | 142,739 | |
Symphony CLO XI Ltd. (Cayman Islands), Series 2013-11A, Class C, Floating Rate Pass Through Ctfs., 3.47%, 01/17/25(b)(c) | | | 250,000 | | | | 247,757 | |
Series 2013-11A, Class D, Floating Rate Pass Through Ctfs., 4.32%, 01/17/25(b)(c) | | | 250,000 | | | | 239,364 | |
Symphony CLO XIV Ltd. (Cayman Islands), Series 2014-14A, Class E, Floating Rate Pass Through Ctfs., 4.92%, 07/14/26(b)(c) | | | 250,000 | | | | 213,097 | |
Thornburg Mortgage Securities Trust, Series 2007-2, Class A2A, Floating Rate Pass Through Ctfs. 2.08%, 06/25/37(b) | | | 341,601 | | | | 327,671 | |
Trimaran CLO VII Ltd. (Cayman Islands), Series 2007-1A, Class B2L, Floating Rate Pass Through Ctfs., 3.74%, 06/15/21(b)(c) | | | 350,000 | | | | 340,109 | |
See accompanying Notes to Financial Statements which are an integral part of the financial statements.
12 Invesco Strategic Income Fund
| | | | | | | | |
| | | Principal
Amount | | | Value | |
WaMu Mortgage Trust,
Series 2005-AR12, Class 1A8, Floating Rate Pass Through Ctfs., 2.43%, 10/25/35(b) | | $ | 232,045 | | | $ | 224,025 | |
Series 2006-AR10, Class 3A2, Floating Rate Pass Through Ctfs., 5.88%, 08/25/46(b) | | | 197,965 | | | | 182,771 | |
Series 2006-AR18, Class 1A1, Floating Rate Pass Through Ctfs., 1.79%, 01/25/37(b) | | | 154,256 | | | | 132,169 | |
Wells Fargo Alternative Loan Trust, Series 2007-PA5, Class 1A1, Pass Through Ctfs., 6.25%, 11/25/37 | | | 202,334 | | | | 196,859 | |
Wells Fargo Mortgage Backed Securities Trust,
Series 2005-AR10, Class 2A4, Floating Rate Pass Through Ctfs., 2.71%, 06/25/35(b) | | | 285,097 | | | | 287,757 | |
Series 2005-AR12, Class 2A11, Floating Rate Pass Through Ctfs., 2.69%, 06/25/35(b) | | | 174,377 | | | | 175,939 | |
Series 2005-AR14, Class A1, Floating Rate Pass Through Ctfs., 2.74%, 08/25/35(b) | | | 133,105 | | | | 131,856 | |
Series 2005-AR2, Class 2A2, Floating Rate Pass Through Ctfs., 2.63%, 03/25/35(b) | | | 241,562 | | | | 246,334 | |
Series 2005-AR7, Class 1A1, Floating Rate Pass Through Ctfs., 2.74%, 05/25/35(b) | | | 156,752 | | | | 157,236 | |
Series 2005-AR8, Class 3A3, Floating Rate Pass Through Ctfs., 2.72%, 06/25/35(b) | | | 321,530 | | | | 313,357 | |
Series 2006-AR10, Class 4A1, Floating Rate Pass Through Ctfs., 2.61%, 07/25/36(b) | | | 206,252 | | | | 195,274 | |
Series 2006-AR8, Class 2A3, Floating Rate Pass Through Ctfs., 2.74%, 04/25/36(b) | | | 192,604 | | | | 188,786 | |
Series 2007-7, Class A1, Pass Through Ctfs., 6.00%, 06/25/37 | | | 143,969 | | | | 144,658 | |
Series 2015 LC22, Class B, Variable Rate Pass Through Ctfs., 4.69%, 09/15/58(b) | | | 230,000 | | | | 241,756 | |
WFRBS Commercial Mortgage Trust, Series 2014-C24, Class B, Variable Rate Pass Through Ctfs., 4.20%, 11/15/47(b) | | | 250,000 | | | | 255,467 | |
Total Asset-Backed Securities (Cost $22,318,143) | | | | | | | 22,195,070 | |
|
U.S. Dollar Denominated Bonds & Notes–31.32% | |
| Aerospace & Defense–0.44% | | | | | | | | |
Embraer S.A. (Brazil), Sr. Unsec. Global Notes, 5.15%, 06/15/22 | | | 170,000 | | | | 168,670 | |
|
| Agricultural Products–0.10% | |
Darling Ingredients, Inc., Sr. Unsec. Gtd. Global Notes, 5.38%, 01/15/22 | | | 40,000 | | | | 40,000 | |
|
| Apparel Retail–0.43% | |
Hot Topic, Inc., Sr. Sec. Gtd. First Lien Notes, 9.25%, 06/15/21(c) | | | 170,000 | | | | 164,475 | |
|
| Automotive Retail–1.09% | |
CST Brands, Inc., Sr. Unsec. Gtd. Global Notes, 5.00%, 05/01/23 | | | 415,000 | | | | 422,781 | |
| | | | | | | | |
| | | Principal
Amount | | | Value | |
| Building Products–0.04% | |
Builders FirstSource, Inc., Sr. Sec. First Lien Notes, 7.63%, 06/01/21(c) | | $ | 15,000 | | | $ | 15,994 | |
|
| Cable & Satellite–1.70% | |
CCO Safari II, LLC,
Sr. Sec. First Lien Notes, 3.58%, 07/23/20(c) | | | 98,000 | | | | 98,702 | |
Sr. Sec. Gtd. First Lien Notes, 4.91%, 07/23/25(c) | | | 170,000 | | | | 173,378 | |
VTR Finance B.V. (Chile), Sr. Sec. First Lien Notes, 6.88%, 01/15/24(c) | | | 400,000 | | | | 388,000 | |
| | | | | | | | 660,080 | |
|
| Communications Equipment–0.23% | |
Avaya Inc., Sr. Sec. Gtd. First Lien Notes, 7.00%, 04/01/19(c) | | | 110,000 | | | | 89,925 | |
|
| Consumer Finance–2.88% | |
Ally Financial Inc., Sr. Unsec. Global Notes, 4.13%, 03/30/20 | | | 670,000 | | | | 694,287 | |
Synchrony Financial, Sr. Unsec. Global Notes, 4.50%, 07/23/25 | | | 415,000 | | | | 422,650 | |
| | | | | | | | 1,116,937 | |
|
| Diversified Banks–5.14% | |
Citigroup Inc., Series Q, Jr. Unsec. Sub. Global Notes, 5.95%(f) | | | 170,000 | | | | 170,425 | |
Industrial & Commercial Bank of China Ltd. (China), Unsec. Sub. Notes, 4.88%, 09/21/25(c) | | | 340,000 | | | | 345,162 | |
JPMorgan Chase & Co., Series Z, Jr. Unsec. Sub. Global Notes, 5.30%(f) | | | 300,000 | | | | 301,875 | |
Skandinaviska Enskilda Banken AB (Sweden), REGS, Jr. Unsec. Sub. Medium-Term Euro Notes, 5.75%(c)(f) | | | 400,000 | | | | 394,000 | |
Svenska Handelsbanken AB (Sweden), REGS, Jr. Unsec. Sub. Euro Bonds, 5.25%(c)(f) | | | 400,000 | | | | 387,088 | |
Swedbank AB (Sweden), REGS, Jr. Unsec. Sub. Euro Bonds, 5.50%(c)(f) | | | 400,000 | | | | 397,000 | |
| | | | | | | | 1,995,550 | |
|
| Health Care Facilities–0.83% | |
HCA, Inc., Sr. Sec. Gtd. First Lien Notes, 5.25%, 04/15/25 | | | 310,000 | | | | 322,400 | |
|
| Home Furnishings–1.14% | |
Tempur Sealy International, Inc., Sr. Unsec. Gtd. Notes, 5.63%, 10/15/23(c) | | | 420,000 | | | | 441,000 | |
|
| Homebuilding–2.12% | |
K. Hovnanian Enterprises Inc., Sr. Sec. Gtd. First Lien Notes, 7.25%,
10/15/20(c) | | | 510,000 | | | | 480,675 | |
KB Home, Sr. Unsec. Gtd. Notes, 7.00%, 12/15/21 | | | 335,000 | | | | 341,281 | |
| | | | | | | | 821,956 | |
|
| Independent Power Producers & Energy Traders–1.12% | |
AES Corp., Sr. Unsec. Global Notes, 7.38%, 07/01/21 | | | 40,000 | | | | 42,800 | |
Calpine Corp., Sr. Unsec. Global Notes, 5.38%, 01/15/23 | | | 48,000 | | | | 45,840 | |
5.75%, 01/15/25 | | | 360,000 | | | | 344,700 | |
| | | | | | | | 433,340 | |
See accompanying Notes to Financial Statements which are an integral part of the financial statements.
13 Invesco Strategic Income Fund
| | | | | | | | |
| | | Principal
Amount | | | Value | |
| Integrated Oil & Gas–0.41% | |
Ecopetrol S.A. (Colombia), Sr. Unsec. Global Notes, 5.38%, 06/26/26 | | $ | 170,000 | | | $ | 158,738 | |
|
| Internet Software & Services–0.91% | |
Equinix Inc., Sr. Unsec. Notes, 5.38%, 01/01/22 | | | 337,000 | | | | 353,007 | |
|
| Investment Banking & Brokerage–0.36% | |
Morgan Stanley, Sr. Unsec. Medium-Term Global Notes, 4.00%, 07/23/25 | | | 135,000 | | | | 138,935 | |
|
| Metal & Glass Containers–0.91% | |
Berry Plastics Corp., Sec. Gtd. Second Lien Notes, 6.00%, 10/15/22(c) | | | 337,000 | | | | 354,271 | |
|
| Oil & Gas Exploration & Production–0.31% | |
Pacific Exploration and Production Corp. (Colombia), Sr. Unsec. Gtd. Notes, 5.13%, 03/28/23(c) | | | 320,000 | | | | 120,000 | |
|
| Packaged Foods & Meats–0.51% | |
BRF S.A. (Brazil), Sr. Unsec. Notes, 4.75%, 05/22/24(c) | | | 200,000 | | | | 199,125 | |
|
| Paper Products–0.88% | |
Clearwater Paper Corp., Sr. Unsec. Gtd. Notes, 5.38%, 02/01/25(c) | | | 340,000 | | | | 340,850 | |
|
| Pharmaceuticals–0.49% | |
Valeant Pharmaceuticals International, Inc., Sr. Unsec. Gtd. Notes, 5.50%,
03/01/23(c) | | | 225,000 | | | | 190,125 | |
|
| Railroads–0.52% | |
Lima Metro Line 2 Finance Ltd. (Peru), Sr. Sec. First Lien Bonds, 5.88%, 07/05/34(c) | | | 200,000 | | | | 202,000 | |
|
| Regional Banks–2.29% | |
Branch Banking & Trust Co., Unsec. Sub. Notes, 3.63%, 09/16/25 | | | 340,000 | | | | 342,924 | |
CIT Group Inc., Sr. Unsec. Global Notes, 5.00%, 08/15/22 | | | 336,000 | | | | 355,320 | |
Fifth Third Bancorp, Series J, Jr. Unsec. Sub. Bonds, 4.90%(f) | | | 200,000 | | | | 190,000 | |
| | | | | | | | 888,244 | |
|
| Security & Alarm Services–1.11% | |
ADT Corp. (The), Sr. Unsec. Global Notes, 6.25%, 10/15/21 | | | 400,000 | | | | 432,000 | |
|
| Semiconductors–0.34% | |
NXP B.V./NXP Funding LLC (Netherlands), Sr. Unsec. Gtd. Notes, 5.75%,
02/15/21(c) | | | 125,000 | | | | 132,656 | |
|
| Specialized REIT’s–0.17% | |
Corrections Corp. of America, Sr. Unsec. Gtd. Notes, 5.00%, 10/15/22 | | | 63,000 | | | | 64,162 | |
|
| Tires & Rubber–1.10% | |
Goodyear Tire & Rubber Co. (The), Sr. Unsec. Gtd. Notes, 7.00%, 05/15/22 | | | 390,000 | | | | 425,588 | |
|
| Trading Companies & Distributors–3.35% | |
AerCap Ireland Capital Ltd./AerCap Global Aviation Trust (Netherlands), Sr. Unsec. Gtd. Global Notes, 4.50%, 05/15/21 | | | 400,000 | | | | 409,000 | |
| | | | | | | | |
| | | Principal
Amount | | | Value | |
| Trading Companies & Distributors–(continued) | |
International Lease Finance Corp., Sr. Unsec. Notes, 8.25%, 12/15/20 | | $ | 740,000 | | | $ | 891,700 | |
| | | | | | | | 1,300,700 | |
|
| Wireless Telecommunication Services–0.40% | |
Sprint Corp., Sr. Unsec. Gtd. Global Notes, 7.88%, 09/15/23 | | | 165,000 | | | | 153,863 | |
Total U.S. Dollar Denominated Bonds & Notes
(Cost $12,036,497) | | | | 12,147,372 | |
|
Non-U.S. Dollar Denominated Bonds & Notes–6.43%(d) | |
| Automobile Manufacturers–0.91% | |
Volkswagen International Finance N.V. (Germany), REGS, Jr. Unsec. Sub. Gtd. Bonds, 3.88%(c)(f) | | EUR | 330,000 | | | | 352,563 | |
|
| Diversified Banks–0.90% | |
Bankia S.A. (Spain), REGS, Sr. Unsec. Euro Bonds, 3.50%, 01/17/19(c) | | EUR | 300,000 | | | | 348,855 | |
|
| Electric Utilities–0.80% | |
EDP Finance B.V. (Portugal), REGS, Sr. Unsec. Medium-Term Euro Notes, 2.00%, 04/22/25(c) | | EUR | 300,000 | | | | 309,904 | |
|
| Integrated Telecommunication Services–0.87% | |
Telefonica Europe, B.V. (Spain), REGS, Jr. Unsec. Sub. Gtd. Euro Bonds, 5.00%(c)(f) | | EUR | 300,000 | | | | 337,355 | |
|
| Life & Health Insurance–0.40% | |
Delta Lloyd Levensverzekering N.V. (Netherlands), REGS, Unsec. Sub. Euro Notes, 9.00%, 08/29/42(c) | | EUR | 120,000 | | | | 154,707 | |
|
| Marine–0.34% | |
CMA CGM S.A. (France), Sr. Unsec. Notes, 7.75%, 01/15/21(c) | | EUR | 130,000 | | | | 132,589 | |
|
| Multi-Utilities–0.86% | |
ENGIE (France), REGS, Series NC5, Jr. Unsec. Sub. Euro Notes, 3.00%(c)(f) | | EUR | 300,000 | | | | 333,153 | |
|
| Sovereign Debt–0.51% | |
Brazil Notas do Tesouro Nacional (Brazil), Series F, Unsec. Notes, 10.00%, 01/01/23 | | BRL | 1,000,000 | | | | 199,050 | |
|
| Specialized Finance–0.84% | |
Redexis Gas Finance B.V. (Spain), REGS, Sr. Unsec. Gtd. Medium-Term Euro Notes, 2.75%, 04/08/21(c) | | EUR | 280,000 | | | | 327,801 | |
Total Non-U.S. Dollar Denominated Bonds & Notes
(Cost $2,554,193) | | | | 2,495,977 | |
|
U.S. Treasury Securities–2.55% | |
| U.S. Treasury Bills–1.45%(g) | |
0.00%, 05/26/16(h) | | $ | 115,000 | | | | 114,849 | |
0.03%, 05/26/16(h) | | | 25,000 | | | | 24,967 | |
0.04%, 05/26/16(h) | | | 55,000 | | | | 54,928 | |
0.07%, 05/26/16(h) | | | 20,000 | | | | 19,974 | |
0.09%, 05/26/16(h) | | | 15,000 | | | | 14,980 | |
See accompanying Notes to Financial Statements which are an integral part of the financial statements.
14 Invesco Strategic Income Fund
| | | | | | | | |
| | | Principal
Amount | | | Value | |
| U.S. Treasury Bills–(continued) | |
0.22%, 05/26/16(h) | | $ | 120,000 | | | $ | 119,842 | |
0.23%, 05/26/16(h) | | | 90,000 | | | | 89,881 | |
0.28%, 05/26/16(h) | | | 95,000 | | | | 94,875 | |
0.29%, 05/26/16(h) | | | 30,000 | | | | 29,960 | |
| | | | | | | | 564,256 | |
|
| U.S. Treasury Inflation-Indexed Bonds–1.10% | |
1.38%, 02/15/44 | | | 409,060 | (i) | | | 425,420 | |
Total U.S. Treasury Securities
(Cost $988,580) | | | | 989,676 | |
|
Credit-Linked Securities–1.48% | |
Standard Chartered Bank (United Kingdom), Sr. Unsec. Medium-Term Euro Notes, 8.40%, 07/30/24 (Credit-Linked to India Government Bonds, 8.40%, 07/28/24) (Cost $593,619)(c)(d) | | INR | 36,000,000 | | | | 573,772 | |
|
Municipal Obligations–0.99% | |
Chicago (City of), Illinois; Series 2012 B, Ref. Unlimited Tax GO Bonds, 5.43%, 01/01/42 | | $ | 35,000 | | | | 30,239 | |
Series 2014 B, Ref. Unlimited Tax GO Bonds, 6.31%, 01/01/44 | | | 150,000 | | | | 141,580 | |
Puerto Rico (Commonwealth of); Series 2014 A, Unlimited Tax GO Bonds, 8.00%, 07/01/35 | | | 290,000 | | | | 212,135 | |
Total Municipal Obligations
(Cost $392,373) | | | | 383,954 | |
| | | | | | | | |
| | | Principal
Amount | | | Value | |
U.S. Government Sponsored Agency Mortgage-Backed Securities–0.43% | |
| Collateralized Mortgage Obligations–0.43% | |
Fannie Mae REMICs, IO, 3.00%, 06/25/27(b) | | $ | 852,119 | | | $ | 82,076 | |
Freddie Mac REMICs, IO, 3.00%, 05/15/28(b) | | | 812,887 | | | | 85,101 | |
Total U.S. Government Sponsored Agency Mortgage-Backed Securities
(Cost $181,898) | | | | 167,177 | |
| | |
| | | Shares | | | | |
Money Market Funds–0.17% | |
Liquid Assets Portfolio, Institutional Class, 0.16%(j) | | | 32,117 | | | | 32,117 | |
Premier Portfolio, Institutional Class, 0.12%(j) | | | 32,116 | | | | 32,116 | |
Total Money Market Funds (Cost $64,233) | | | | | | | 64,233 | |
|
Options Purchased–1.50%(k) | |
(Cost $779,612) | | | | | | | 581,311 | |
TOTAL INVESTMENTS–102.09%
(Cost $39,909,148) | | | | 39,598,542 | |
OTHER ASSETS LESS LIABILITIES–(2.09)% | | | | (812,494 | ) |
NET ASSETS–100.00% | | | | | | $ | 38,786,048 | |
Investment Abbreviations:
| | |
| BRL | | – Brazilian Real |
| CDO | | – Collateralized Debt Obligation |
| CLO | | – Collateralized Loan Obligation |
| Ctfs. | | – Certificates |
| EUR | | – Euro |
| GO | | – General Obligation |
| | |
| Gtd. | | – Guaranteed |
| INR | | – Indian Rupee |
| IO | | – Interest Only |
| Jr. | | – Junior |
| Ref. | | – Refunding |
| REGS | | – Regulation S |
| | |
| REIT | | – Real Estate Investment Trust |
| REMICs | | – Real Estate Investment Conduits |
| Sec. | | – Secured |
| Sr. | | – Senior |
| Sub. | | – Subordinated |
| Unsec. | | – Unsecured |
Notes to Schedule of Investments:
| (a) | Industry and/or sector classifications used in this report are generally according to the Global Industry Classification Standard, which was developed by and is the exclusive property and a service mark of MSCI Inc. and Standard & Poor’s. |
| (b) | Interest or dividend rate is redetermined periodically. Rate shown is the rate in effect on October 31, 2015. |
| (c) | Security purchased or received in a transaction exempt from registration under the Securities Act of 1933, as amended (the “1933 Act”). The security may be resold pursuant to an exemption from registration under the 1933 Act, typically to qualified institutional buyers. The aggregate value of these securities at October 31, 2015 was $17,990,198, which represented 46.38% of the Fund’s Net Assets. |
| (d) | Foreign denominated security. Principal amount is denominated in the currency indicated. |
| (e) | All or a portion of the security is pledged as collateral for open reverse repurchase agreements. See Note 1K. The following table presents the Fund’s collateral pledged as of October 31, 2015. |
| | | | | | | | | | | | |
| Counterparty | | Reverse
Repurchase
Agreements | | | Value of
Non-cash
Collateral
Pledged* | | | Net
Amount | |
Royal Bank of Canada | | $ | 1,123,907 | | | $ | (1,123,907 | ) | | $ | — | |
| | * | Amount does not include excess collateral pledged. |
| (f) | Perpetual bond with no specified maturity date. |
| (g) | Security traded on a discount basis. The interest rate shown represents the discount rate at the time of purchase by the Fund. |
| (h) | All or a portion of the value was pledged and/or designated as collateral for open futures contracts and swap agreements. See Note 1N, Note 1Q and Note 4. |
| (i) | Principal amount of security and interest payments are adjusted for inflation. See Note 1I. |
| (j) | The money market fund and the Fund are affiliated by having the same investment adviser. The rate shown is the 7-day SEC standardized yield as of October 31, 2015. |
See accompanying Notes to Financial Statements which are an integral part of the financial statements.
15 Invesco Strategic Income Fund
| (k) | The table below details options purchased: |
| | | | | | | | | | | | | | | | | | | | | | | | | | | | | | |
| Open Over-The-Counter Foreign Currency Options Purchased | |
| Description | | Type of
Contract | | | Counterparty | | Expiration
Date | | | Strike
Price | | | Notional
Value | | | Value | |
USD versus SGD | | | Call | | | Deutsche Bank Securities Inc. | | | 12/23/15 | | | | SGD | | | | 1.449 | | | | USD | | | | 675,000 | | | $ | 1,879 | |
USD versus KRW | | | Call | | | Goldman Sachs International | | | 01/27/16 | | | | KRW | | | | 1,144.000 | | | | USD | | | | 1,550,000 | | | | 35,366 | |
EUR versus USD | | | Put | | | Deutsche Bank Securities Inc. | | | 03/23/16 | | | | USD | | | | 1.090 | | | | EUR | | | | 600,000 | | | | 13,671 | |
Subtotal Foreign Currency Options Purchased — Currency Risk | | | | | | | | | | | | | | | | | | | $ | 50,916 | |
| | | | | | | | | | | | | | | | | | | | | | | | | | | | |
| Open Over-The-Counter Interest Rate Swaptions Purchased | |
| Description | | Type of
Contract | | | Counterparty | | Exercise
Rate | | | Pay/Receive
Exercise Rate | | Floating Rate
Index | | | Expiration
Date | | | Notional
Value | | | Value | |
7 Year Interest Rate Swap | | | Call | | | Bank of America, N.A. | | | 2.165 | % | | Receive | | | 3 Month USD LIBOR | | | | 03/16/16 | | | $ | 4,600,000 | | | $ | 106,048 | |
7 Year Interest Rate Swap | | | Call | | | Citigroup Global Markets Inc. | | | 1.900 | | | Receive | | | 3 Month USD LIBOR | | | | 04/06/16 | | | | 2,450,000 | | | | 31,691 | |
7 Year Interest Rate Swap | | | Call | | | Deutsche Bank Securities Inc. | | | 2.165 | | | Receive | | | 3 Month USD LIBOR | | | | 03/16/16 | | | | 4,600,000 | | | | 106,048 | |
7 Year Interest Rate Swap | | | Call | | | Deutsche Bank Securities Inc. | | | 1.890 | | | Receive | | | 3 Month USD LIBOR | | | | 04/20/16 | | | | 3,000,000 | | | | 38,718 | |
7 Year Interest Rate Swap | | | Call | | | Goldman Sachs International | | | 1.910 | | | Receive | | | 3 Month USD LIBOR | | | | 04/07/16 | | | | 2,400,000 | | | | 31,694 | |
3 Year Interest Rate Swap | | | Put | | | Deutsche Bank Securities Inc. | | | 1.550 | | | Pay | | | 3 Month USD LIBOR | | | | 01/28/16 | | | | 23,900,000 | | | | 27,620 | |
3 Year Interest Rate Swap | | | Put | | | Goldman Sachs International | | | 1.600 | | | Pay | | | 3 Month USD LIBOR | | | | 01/29/16 | | | | 9,200,000 | | | | 8,868 | |
7 Year Interest Rate Swap | | | Put | | | Bank of America, N.A. | | | 2.165 | | | Pay | | | 3 Month USD LIBOR | | | | 03/16/16 | | | | 4,600,000 | | | | 29,085 | |
7 Year Interest Rate Swap | | | Put | | | Citigroup Global Markets Inc. | | | 1.900 | | | Pay | | | 3 Month USD LIBOR | | | | 04/06/16 | | | | 2,450,000 | | | | 36,711 | |
7 Year Interest Rate Swap | | | Put | | | Deutsche Bank Securities Inc. | | | 2.165 | | | Pay | | | 3 Month USD LIBOR | | | | 03/16/16 | | | | 4,600,000 | | | | 29,085 | |
7 Year Interest Rate Swap | | | Put | | | Deutsche Bank Securities Inc. | | | 1.890 | | | Pay | | | 3 Month USD LIBOR | | | | 04/20/16 | | | | 3,000,000 | | | | 49,390 | |
7 Year Interest Rate Swap | | | Put | | | Goldman Sachs International | | | 1.910 | | | Pay | | | 3 Month USD LIBOR | | | | 04/07/16 | | | | 2,400,000 | | | | 35,437 | |
Subtotal Swaptions Purchased — Interest Rate Risk | | | | | | | | | | | | | | $ | 530,395 | |
Total Options Purchased (Cost $779,612) | | | | | | | | | | | | | | $ | 581,311 | |
Abbreviations:
| | |
| EUR | | – Euro |
| KRW | | – South Korean Won |
| LIBOR | | – London Interbank Offered Rate |
| SGD | | – Singapore Dollar |
| USD | | – U.S. Dollar |
See accompanying Notes to Financial Statements which are an integral part of the financial statements.
16 Invesco Strategic Income Fund
Statement of Assets and Liabilities
October 31, 2015
| | | | |
Assets: | |
Investments, at value (Cost $39,844,915) | | $ | 39,534,309 | |
Investments in affiliated money market funds, at value and cost | | | 64,233 | |
Total investments, at value (Cost $39,909,148) | | | 39,598,542 | |
Cash | | | 759,950 | |
Foreign currencies, at value (Cost $151,828) | | | 151,162 | |
Receivable for: | | | | |
Investments sold | | | 124,444 | |
Variation margin — futures | | | 1,767 | |
Fund shares sold | | | 81,145 | |
Dividends and interest | | | 322,908 | |
Fund expenses absorbed | | | 37,679 | |
Premiums paid on swap agreements | | | 48,860 | |
Investment for trustee deferred compensation and retirement plans | | | 3,293 | |
Unrealized appreciation on forward foreign currency contracts outstanding | | | 140,691 | |
Unrealized appreciation on swap agreements — OTC | | | 176,024 | |
Other assets | | | 16,718 | |
Total assets | | | 41,463,183 | |
|
Liabilities: | |
Payable for: | | | | |
Investments purchased | | | 1,378,104 | |
Fund shares reacquired | | | 7,770 | |
Options written, at value (premiums received $16,114) | | | 15,118 | |
Reverse repurchase arrangements | | | 1,117,000 | |
Swaps payable | | | 4,513 | |
Variation margin — centrally cleared swap agreements | | | 14,275 | |
Accrued fees to affiliates | | | 9,647 | |
Accrued trustees’ and officers’ fees and benefits | | | 1,570 | |
Accrued other operating expenses | | | 56,996 | |
Trustee deferred compensation and retirement plans | | | 3,293 | |
Unrealized depreciation on forward foreign currency contracts outstanding | | | 60,246 | |
Unrealized depreciation on swap agreements — OTC | | | 8,603 | |
Total liabilities | | | 2,677,135 | |
Net assets applicable to shares outstanding | | $ | 38,786,048 | |
|
Net assets consist of: | |
Shares of beneficial interest | | $ | 38,903,233 | |
Undistributed net investment income | | | (112,964 | ) |
Undistributed net realized gain (loss) | | | (91,863 | ) |
Net unrealized appreciation | | | 87,642 | |
| | | $ | 38,786,048 | |
| | | | |
Net Assets: | |
Class A | | $ | 18,630,586 | |
Class C | | $ | 3,439,463 | |
Class R | | $ | 55,556 | |
Class Y | | $ | 16,638,304 | |
Class R5 | | $ | 12,322 | |
Class R6 | | $ | 9,817 | |
|
Shares outstanding, $0.01 par value per share,
with an unlimited number of shares authorized: | |
Class A | | | 1,900,147 | |
Class C | | | 350,931 | |
Class R | | | 5,667 | |
Class Y | | | 1,696,554 | |
Class R5 | | | 1,256 | |
Class R6 | | | 1,001 | |
Class A: | | | | |
Net asset value per share | | $ | 9.80 | |
Maximum offering price per share | | | | |
(Net asset value of $9.80 ¸ 95.75%) | | $ | 10.23 | |
Class C: | | | | |
Net asset value and offering price per share | | $ | 9.80 | |
Class R: | | | | |
Net asset value and offering price per share | | $ | 9.80 | |
Class Y: | | | | |
Net asset value and offering price per share | | $ | 9.81 | |
Class R5: | | | | |
Net asset value and offering price per share | | $ | 9.81 | |
Class R6: | | | | |
Net asset value and offering price per share | | $ | 9.81 | |
See accompanying Notes to Financial Statements which are an integral part of the financial statements.
17 Invesco Strategic Income Fund
Statement of Operations
For the year ended October 31, 2015
| | | | |
Investment income: | |
Interest (net of foreign withholding taxes of $1,534) | | $ | 1,058,411 | |
Dividends from affiliates | | | 108,772 | |
Total investment income | | | 1,167,183 | |
| |
Expenses: | | | | |
Advisory fees | | | 186,596 | |
Administrative services fees | | | 50,000 | |
Custodian fees | | | 16,118 | |
Distribution fees: | | | | |
Class A | | | 41,087 | |
Class C | | | 16,346 | |
Class R | | | 276 | |
Interest, facilities and maintenance fees | | | 10,864 | |
Transfer agent fees — A, C, R and Y | | | 16,796 | |
Transfer agent fees — R5 | | | 11 | |
Transfer agent fees — R6 | | | 10 | |
Trustees’ and officers’ fees and benefits | | | 19,142 | |
Registration and filing fees | | | 98,318 | |
Professional services fees | | | 90,297 | |
Other | | | 49,172 | |
Total expenses | | | 595,033 | |
Less: Fees waived and expenses reimbursed | | | (366,131 | ) |
Net expenses | | | 228,902 | |
Net investment income | | | 938,281 | |
| |
Realized and unrealized gain (loss) from: | | | | |
Net realized gain (loss) from: | | | | |
Investment securities | | | (585,370 | ) |
Foreign currencies | | | (13,316 | ) |
Forward foreign currency contracts | | | 437,926 | |
Futures contracts | | | (218,995 | ) |
Option contracts written | | | (3,920 | ) |
Swap agreements | | | 39,082 | |
| | | | (344,593 | ) |
Change in net unrealized appreciation (depreciation) of: | | | | |
Investment securities | | | (219,293 | ) |
Foreign currencies | | | 1,841 | |
Forward foreign currency contracts | | | 5,247 | |
Futures contracts | | | (65,937 | ) |
Option contracts written | | | 996 | |
Swap agreements | | | 346,633 | |
| | | | 69,487 | |
Net realized and unrealized gain (loss) | | | (275,106 | ) |
Net increase in net assets resulting from operations | | $ | 663,175 | |
See accompanying Notes to Financial Statements which are an integral part of the financial statements.
18 Invesco Strategic Income Fund
Statement of Changes in Net Assets
For the year ended October 31, 2015 and the period May 2, 2014 (commencement date) through October 31, 2014
| | | | | | | | |
| | | October 31,
2015 | | | May 2, 2014
(commencement date) through
October 31,
2014 | |
Operations: | | | | | |
Net investment income | | $ | 938,281 | | | $ | 422,489 | |
Net realized gain (loss) | | | (344,593 | ) | | | 128,619 | |
Change in net unrealized appreciation | | | 69,487 | | | | 18,155 | |
Net increase in net assets resulting from operations | | | 663,175 | | | | 569,263 | |
| | |
Distributions to shareholders from net investment income: | | | | | | | | |
Class A | | | (341,946 | ) | | | (220,329 | ) |
Class C | | | (34,097 | ) | | | (3,292 | ) |
Class R | | | (1,150 | ) | | | (181 | ) |
Class Y | | | (269,316 | ) | | | (225,541 | ) |
Class R5 | | | (227 | ) | | | (179 | ) |
Class R6 | | | (206 | ) | | | (179 | ) |
Total distributions from net investment income | | | (646,942 | ) | | | (449,701 | ) |
|
Return of capital: | |
Class A | | | (221,202 | ) | | | — | |
Class C | | | (8,433 | ) | | | — | |
Class R | | | (657 | ) | | | — | |
Class Y | | | (202,768 | ) | | | — | |
Class R5 | | | (175 | ) | | | — | |
Class R6 | | | (160 | ) | | | — | |
Total return of capital | | | (433,395 | ) | | | — | |
| | |
Distributions to shareholders from net realized gains: | | | | | | | | |
Class A | | | (147,461 | ) | | | — | |
Class C | | | (8,651 | ) | | | — | |
Class R | | | (275 | ) | | | — | |
Class Y | | | (128,682 | ) | | | — | |
Class R5 | | | (101 | ) | | | — | |
Class R6 | | | (101 | ) | | | — | |
Total distributions from net realized gains | | | (285,271 | ) | | | — | |
| | |
Share transactions–net: | | | | | | | | |
Class A | | | 4,776,259 | | | | 14,190,714 | |
Class C | | | 2,652,131 | | | | 814,539 | |
Class R | | | 43,739 | | | | 12,833 | |
Class Y | | | 4,111,733 | | | | 12,744,415 | |
Class R5 | | | 2,536 | | | | 10,010 | |
Class R6 | | | — | | | | 10,010 | |
Net increase in net assets resulting from share transactions | | | 11,586,398 | | | | 27,782,521 | |
Net increase in net assets | | | 10,883,965 | | | | 27,902,083 | |
| | |
Net assets: | | | | | | | | |
Beginning of year | | | 27,902,083 | | | | — | |
End of year (includes undistributed net investment income of $(112,964) and $(9,474), respectively) | | $ | 38,786,048 | | | $ | 27,902,083 | |
Notes to Financial Statements
October 31, 2015
NOTE 1—Significant Accounting Policies
Invesco Strategic Income Fund (the “Fund”) is a series portfolio of AIM Investment Funds (Invesco Investment Funds) (the “Trust”). The Trust is organized as a Delaware statutory trust and is registered under the Investment Company Act of 1940, as amended (the “1940 Act”), as an open-end series
19 Invesco Strategic Income Fund
management investment company consisting of twenty-four separate series portfolios, each authorized to issue an unlimited number of shares of beneficial interest. The assets, liabilities and operations of each portfolio are accounted for separately. Information presented in these financial statements pertains only to the Fund. Matters affecting each portfolio or class will be voted on exclusively by the shareholders of such portfolio or class.
The Fund’s primary investment objective is to provide current income and, secondarily, long-term growth of capital.
The Fund currently consists of six different classes of shares: Class A, Class C, Class R, Class Y, Class R5 and Class R6. Class A shares are sold with a front-end sales charge unless certain waiver criteria are met and under certain circumstances load waived shares may be subject to contingent deferred sales charges (“CDSC”). Class C shares are sold with a CDSC. Class R, Class Y, Class R5 and Class R6 shares are sold at net asset value.
The following is a summary of the significant accounting policies followed by the Fund in the preparation of its financial statements.
| A. | Security Valuations — Securities, including restricted securities, are valued according to the following policy. |
A security listed or traded on an exchange (except convertible securities) is valued at its last sales price or official closing price as of the close of the customary trading session on the exchange where the security is principally traded, or lacking any sales or official closing price on a particular day, the security may be valued at the closing bid price on that day. Securities traded in the over-the-counter market are valued based on prices furnished by independent pricing services or market makers. When such securities are valued by an independent pricing service they may be considered fair valued. Futures contracts are valued at the final settlement price set by an exchange on which they are principally traded. Listed options are valued at the mean between the last bid and asked prices from the exchange on which they are principally traded. Options not listed on an exchange are valued by an independent source at the mean between the last bid and asked prices. For purposes of determining net asset value (“NAV”) per share, futures and option contracts generally are valued 15 minutes after the close of the customary trading session of the New York Stock Exchange (“NYSE”).
Investments in open-end and closed-end registered investment companies that do not trade on an exchange are valued at the end-of-day net asset value per share. Investments in open-end and closed-end registered investment companies that trade on an exchange are valued at the last sales price or official closing price as of the close of the customary trading session on the exchange where the security is principally traded.
Swap agreements are fair valued using an evaluated quote, if available, provided by an independent pricing service. Evaluated quotes provided by the pricing service are valued based on a model which may include end-of-day net present values, spreads, ratings, industry, company performance and returns of referenced assets.
Debt obligations (including convertible securities) and unlisted equities are fair valued using an evaluated quote provided by an independent pricing service. Evaluated quotes provided by the pricing service may be determined without exclusive reliance on quoted prices, and may reflect appropriate factors such as institution-size trading in similar groups of securities, developments related to specific securities, dividend rate (for unlisted equities), yield (for debt obligations), quality, type of issue, coupon rate (for debt obligations), maturity (for debt obligations), individual trading characteristics and other market data. Debt obligations are subject to interest rate and credit risks. In addition, all debt obligations involve some risk of default with respect to interest and/or principal payments.
Foreign securities’ (including foreign exchange contracts) prices are converted into U.S. dollar amounts using the applicable exchange rates as of the close of the NYSE. If market quotations are available and reliable for foreign exchange-traded equity securities, the securities will be valued at the market quotations. Because trading hours for certain foreign securities end before the close of the NYSE, closing market quotations may become unreliable. If between the time trading ends on a particular security and the close of the customary trading session on the NYSE, events occur that the Adviser determines are significant and make the closing price unreliable, the Fund may fair value the security. If the event is likely to have affected the closing price of the security, the security will be valued at fair value in good faith using procedures approved by the Board of Trustees. Adjustments to closing prices to reflect fair value may also be based on a screening process of an independent pricing service to indicate the degree of certainty, based on historical data, that the closing price in the principal market where a foreign security trades is not the current value as of the close of the NYSE. Foreign securities’ prices meeting the approved degree of certainty that the price is not reflective of current value will be priced at the indication of fair value from the independent pricing service. Multiple factors may be considered by the independent pricing service in determining adjustments to reflect fair value and may include information relating to sector indices, American Depositary Receipts and domestic and foreign index futures. Foreign securities may have additional risks including exchange rate changes, potential for sharply devalued currencies and high inflation, political and economic upheaval, the relative lack of issuer information, relatively low market liquidity and the potential lack of strict financial and accounting controls and standards.
Securities for which market prices are not provided by any of the above methods may be valued based upon quotes furnished by independent sources. The last bid price may be used to value equity securities. The mean between the last bid and asked prices is used to value debt obligations, including corporate loans.
Securities for which market quotations are not readily available or became unreliable are valued at fair value as determined in good faith by or under the supervision of the Trust’s officers following procedures approved by the Board of Trustees. Issuer specific events, market trends, bid/asked quotes of brokers and information providers and other market data may be reviewed in the course of making a good faith determination of a security’s fair value.
The Fund may invest in securities that are subject to interest rate risk, meaning the risk that the prices will generally fall as interest rates rise and, conversely, the prices will generally rise as interest rates fall. Specific securities differ in their sensitivity to changes in interest rates depending on their individual characteristics. Changes in interest rates may result in increased market volatility, which may affect the value and/or liquidity of certain Fund investments.
Valuations change in response to many factors including the historical and prospective earnings of the issuer, the value of the issuer’s assets, general economic conditions, interest rates, investor perceptions and market liquidity. Because of the inherent uncertainties of valuation, the values reflected in the financial statements may materially differ from the value received upon actual sale of those investments.
| B. | Securities Transactions and Investment Income — Securities transactions are accounted for on a trade date basis. Realized gains or losses on sales are computed on the basis of specific identification of the securities sold. Interest income (net of withholding tax, if any) is recorded on the accrual basis from settlement date. Paydown gains and losses on mortgage and asset-backed securities are recorded as adjustments to interest income. Dividend income (net of withholding tax, if any) is recorded on the ex-dividend date. Bond premiums and discounts are amortized and/or accreted for financial reporting purposes. |
The Fund may periodically participate in litigation related to Fund investments. As such, the Fund may receive proceeds from litigation settlements. Any proceeds received are included in the Statement of Operations as realized gain (loss) for investments no longer held and as unrealized gain (loss) for investments still held.
20 Invesco Strategic Income Fund
Brokerage commissions and mark ups are considered transaction costs and are recorded as an increase to the cost basis of securities purchased and/or a reduction of proceeds on a sale of securities. Such transaction costs are included in the determination of net realized and unrealized gain (loss) from investment securities reported in the Statement of Operations and the Statement of Changes in Net Assets and the net realized and unrealized gains (losses) on securities per share in the Financial Highlights. Transaction costs are included in the calculation of the Fund’s net asset value and, accordingly, they reduce the Fund’s total returns. These transaction costs are not considered operating expenses and are not reflected in net investment income reported in the Statement of Operations and the Statement of Changes in Net Assets, or the net investment income per share and the ratios of expenses and net investment income reported in the Financial Highlights, nor are they limited by any expense limitation arrangements between the Fund and the investment adviser.
The Fund allocates realized and unrealized capital gains and losses to a class based on the relative net assets of each class. The Fund allocates income to a class based on the relative value of the settled shares of each class.
| C. | Country Determination — For the purposes of making investment selection decisions and presentation in the Schedule of Investments, the investment adviser may determine the country in which an issuer is located and/or credit risk exposure based on various factors. These factors include the laws of the country under which the issuer is organized, where the issuer maintains a principal office, the country in which the issuer derives 50% or more of its total revenues and the country that has the primary market for the issuer’s securities, as well as other criteria. Among the other criteria that may be evaluated for making this determination are the country in which the issuer maintains 50% or more of its assets, the type of security, financial guarantees and enhancements, the nature of the collateral and the sponsor organization. Country of issuer and/or credit risk exposure has been determined to be the United States of America, unless otherwise noted. |
| D. | Distributions — Distributions from net investment income, if any, are declared and paid monthly. Distributions from net realized capital gain, if any, are generally declared and paid annually and recorded on the ex-dividend date. The Fund may elect to treat a portion of the proceeds from redemptions as distributions for federal income tax purposes. |
| E. | Federal Income Taxes — The Fund intends to comply with the requirements of Subchapter M of the Internal Revenue Code of 1986, as amended (the “Internal Revenue Code”), necessary to qualify as a regulated investment company and to distribute substantially all of the Fund’s taxable earnings to shareholders. As such, the Fund will not be subject to federal income taxes on otherwise taxable income (including net realized capital gain) that is distributed to shareholders. Therefore, no provision for federal income taxes is recorded in the financial statements. |
The Fund recognizes the tax benefits of uncertain tax positions only when the position is more likely than not to be sustained. Management has analyzed the Fund’s uncertain tax positions and concluded that no liability for unrecognized tax benefits should be recorded related to uncertain tax positions. Management is not aware of any tax positions for which it is reasonably possible that the total amounts of unrecognized tax benefits will change materially in the next 12 months.
The Fund files tax returns in the U.S. Federal jurisdiction and certain other jurisdictions. Generally, the Fund is subject to examinations by such taxing authorities for up to three years after the filing of the return for the tax period.
| F. | Expenses — Fees provided for under the Rule 12b-1 plan of a particular class of the Fund are charged to the operations of such class. Transfer agency fees and expenses and other shareholder recordkeeping fees and expenses attributable to Class R5 and Class R6 are allocated to each share class based on relative net assets. Sub-accounting fees attributable to Class R5 are charged to the operations of the class. Transfer agency fees and expenses and other shareholder recordkeeping fees and expenses relating to all other classes are allocated among those classes based on relative net assets. All other expenses are allocated among the classes based on relative net assets. |
| G. | Accounting Estimates — The preparation of financial statements in conformity with accounting principles generally accepted in the United States of America (“GAAP”) requires management to make estimates and assumptions that affect the reported amounts of assets and liabilities at the date of the financial statements and the reported amounts of revenues and expenses during the reporting period including estimates and assumptions related to taxation. Actual results could differ from those estimates by a significant amount. In addition, the Fund monitors for material events or transactions that may occur or become known after the period-end date and before the date the financial statements are released to print. |
| H. | Indemnifications — Under the Trust’s organizational documents, each Trustee, officer, employee or other agent of the Trust is indemnified against certain liabilities that may arise out of the performance of their duties to the Fund. Additionally, in the normal course of business, the Fund enters into contracts, including the Fund’s servicing agreements, that contain a variety of indemnification clauses. The Fund’s maximum exposure under these arrangements is unknown as this would involve future claims that may be made against the Fund that have not yet occurred. The risk of material loss as a result of such indemnification claims is considered remote. |
| I. | Treasury Inflation-Protected Securities — The Fund may invest in Treasury Inflation-Protected Securities (“TIPS”). TIPS are fixed income securities whose principal value is periodically adjusted to the rate of inflation. The principal value of TIPS will be adjusted upward or downward, and any increase or decrease in the principal amount of TIPS will be included as interest income in the Statement of Operations, even though investors do not receive their principal until maturity. |
| J. | Structured Securities — The Fund may invest in structured securities. Structured securities are a type of derivative security whose value is determined by reference to changes in the value of underlying securities, currencies, interest rates, commodities, indices or other financial indicators (“reference instruments”). Most structured securities are fixed-income securities that have maturities of three years or less. Structured securities may be positively or negatively indexed (i.e., their principal value or interest rates may increase or decrease if the underlying reference instrument appreciates) and may have return characteristics similar to direct investments in the underlying reference instrument. |
Structured securities may entail a greater degree of market risk than other types of debt securities because the investor bears the risk of the reference instruments. In addition to the credit risk of structured securities and the normal risks of price changes in response to changes in interest rates, the principal amount of structured notes or indexed securities may decrease as a result of changes in the value of the underlying reference instruments. Changes in the daily value of structured securities are recorded as unrealized gains (losses) in the Statement of Operations. When the structured securities mature or are sold, the Fund recognizes a realized gain (loss) on the Statement of Operations.
| K. | Reverse Repurchase Agreements — The Fund may enter into reverse repurchase agreements. Reverse repurchase agreements involve the sale of securities held by the Fund, with an agreement that the Fund will repurchase such securities at an agreed upon price and date. The Fund will use the proceeds of a reverse repurchase agreement (which are considered to be borrowings under the 1940 Act) to purchase other permitted securities either maturing, or under an agreement to resell, at a date simultaneous with or prior to the expiration of the reverse repurchase agreement. The agreements are collateralized by the underlying securities and are carried at the amount at which the securities subsequently will be repurchased as specified in the agreements. Expenses under the Reverse Repurchase Agreements are shown in the Statement of Operations as Interest, facilities and maintenance fees. |
21 Invesco Strategic Income Fund
| L. | Foreign Currency Translations — Foreign currency is valued at the close of the NYSE based on quotations posted by banks and major currency dealers. Portfolio securities and other assets and liabilities denominated in foreign currencies are translated into U.S. dollar amounts at date of valuation. Purchases and sales of portfolio securities (net of foreign taxes withheld on disposition) and income items denominated in foreign currencies are translated into U.S. dollar amounts on the respective dates of such transactions. The Fund does not separately account for the portion of the results of operations resulting from changes in foreign exchange rates on investments and the fluctuations arising from changes in market prices of securities held. The combined results of changes in foreign exchange rates and the fluctuation of market prices on investments (net of estimated foreign tax withholding) are included with the net realized and unrealized gain or loss from investments in the Statement of Operations. Reported net realized foreign currency gains or losses arise from (1) sales of foreign currencies, (2) currency gains or losses realized between the trade and settlement dates on securities transactions, and (3) the difference between the amounts of dividends, interest, and foreign withholding taxes recorded on the Fund’s books and the U.S. dollar equivalent of the amounts actually received or paid. Net unrealized foreign currency gains and losses arise from changes in the fair values of assets and liabilities, other than investments in securities at fiscal period end, resulting from changes in exchange rates. |
The Fund may invest in foreign securities, which may be subject to foreign taxes on income, gains on investments or currency repatriation, a portion of which may be recoverable. Foreign taxes, if any, are recorded based on the tax regulations and rates that exist in the foreign markets in which the Fund invests and are shown in the Statement of Operations.
| M. | Forward Foreign Currency Contracts — The Fund may engage in foreign currency transactions either on a spot (i.e. for prompt delivery and settlement) basis, or through forward foreign currency contracts, to manage or minimize currency or exchange rate risk. |
The Fund may also enter into forward foreign currency contracts for the purchase or sale of a security denominated in a foreign currency in order to “lock in” the U.S. dollar price of that security, or the Fund may also enter into forward foreign currency contracts that do not provide for physical settlement of the two currencies, but instead are settled by a single cash payment calculated as the difference between the agreed upon exchange rate and the spot rate at settlement based upon an agreed upon notional amount (non-deliverable forwards). The Fund will set aside liquid assets in an amount equal to daily mark-to-market obligation for forward foreign currency contracts.
A forward foreign currency contract is an obligation between two parties (“Counterparties”) to purchase or sell a specific currency for an agreed-upon price at a future date. The use of forward foreign currency contracts does not eliminate fluctuations in the price of the underlying securities the Fund owns or intends to acquire but establishes a rate of exchange in advance. Fluctuations in the value of these contracts are measured by the difference in the contract date and reporting date exchange rates and are recorded as unrealized appreciation (depreciation) until the contracts are closed. When the contracts are closed, realized gains (losses) are recorded. Realized and unrealized gains (losses) on the contracts are included in the Statement of Operations. The primary risks associated with forward foreign currency contracts include failure of the Counterparty to meet the terms of the contract and the value of the foreign currency changing unfavorably. These risks may be in excess of the amounts reflected in the Statement of Assets and Liabilities.
| N. | Futures Contracts — The Fund may enter into futures contracts to manage exposure to interest rate, equity and market price movements and/or currency risks. A futures contract is an agreement between Counterparties to purchase or sell a specified underlying security, currency or commodity (or delivery of a cash settlement price, in the case of an index future) for a fixed price at a future date. The Fund currently invests only in exchange-traded futures and they are standardized as to maturity date and underlying financial instrument. Initial margin deposits required upon entering into futures contracts are satisfied by the segregation of specific securities or cash as collateral at the futures commission merchant (broker). During the period the futures contracts are open, changes in the value of the contracts are recognized as unrealized gains or losses by recalculating the value of the contracts on a daily basis. Subsequent or variation margin payments are received or made depending upon whether unrealized gains or losses are incurred. These amounts are reflected as receivables or payables on the Statement of Assets and Liabilities. When the contracts are closed or expire, the Fund recognizes a realized gain or loss equal to the difference between the proceeds from, or cost of, the closing transaction and the Fund’s basis in the contract. The net realized gain (loss) and the change in unrealized gain (loss) on futures contracts held during the period is included on the Statement of Operations. The primary risks associated with futures contracts are market risk and the absence of a liquid secondary market. If the Fund were unable to liquidate a futures contract and/or enter into an offsetting closing transaction, the Fund would continue to be subject to market risk with respect to the value of the contracts and continue to be required to maintain the margin deposits on the futures contracts. Futures contracts have minimal Counterparty risk since the exchange’s clearinghouse, as Counterparty to all exchange-traded futures, guarantees the futures against default. Risks may exceed amounts recognized in the Statement of Assets and Liabilities. |
| O. | Call Options Written and Purchased — The Fund may write covered call options and/or buy call options. A covered call option gives the purchaser of such option the right to buy, and the writer the obligation to sell, the underlying security or foreign currency at the stated exercise price during the option period for American style options or at expiration date for European style options. Options written by the Fund normally will have expiration dates between three and nine months from the date written. The exercise price of a call option may be below, equal to, or above the current market value of the underlying security at the time the option is written. |
Additionally, the Fund may enter into an option on a swap agreement, also called a “swaption”. A swaption is an option that gives the buyer the right, but not the obligation, to enter into a swap on a future date in exchange for paying a market-based premium. A receiver swaption gives the owner the right to receive the total return of a specified asset, reference rate or index. Swaptions also include options that allow an existing swap to be terminated or extended by one of the Counterparties.
When the Fund writes a covered call option, an amount equal to the premium received by the Fund is recorded as an asset and an equivalent liability in the Statement of Assets and Liabilities. The amount of the liability is subsequently “marked-to-market” to reflect the current market value of the option written. If a written covered call option expires on the stipulated expiration date, or if the Fund enters into a closing purchase transaction, the Fund realizes a gain (or a loss if the closing purchase transaction exceeds the premium received when the option was written) without regard to any unrealized gain or loss on the underlying security, and the liability related to such option is extinguished. If a written covered call option is exercised, the Fund realizes a gain or a loss from the sale of the underlying security and the proceeds of the sale are increased by the premium originally received. Realized and unrealized gains and losses on these contracts are included in the Statement of Operations. A risk in writing a covered call option is that the Fund gives up the opportunity for profit if the market price of the security increases and the option is exercised.
22 Invesco Strategic Income Fund
When the Fund buys a call option, an amount equal to the premium paid by the Fund is recorded as an investment on the Statement of Assets and Liabilities. The amount of the investment is subsequently “marked-to-market” to reflect the current value of the option purchased. Realized and unrealized gains and losses on these contracts are included in the Statement of Operations. A risk in buying an option is that the Fund pays a premium whether or not the option is exercised. In addition, there can be no assurance that a liquid secondary market will exist for any option purchased.
| P. | Put Options Purchased and Written — The Fund may purchase and write put options including options on securities indexes, or foreign currency and/or futures contracts. By purchasing a put option, the Fund obtains the right (but not the obligation) to sell the option’s underlying instrument at a fixed strike price. In return for this right, the Fund pays an option premium. The option’s underlying instrument may be a security, securities index, or a futures contract. |
Additionally, the Fund may enter into an option on a swap agreement, also called a “swaption”. A swaption is an option that gives the buyer the right, but not the obligation, to enter into a swap on a future date in exchange for paying a market-based premium. A receiver swaption gives the owner the right to receive the total return of a specified asset, reference rate or index. Swaptions also include options that allow an existing swap to be terminated or extended by one of the Counterparties.
Put options may be used by the Fund to hedge securities it owns by locking in a minimum price at which the Fund can sell. If security prices fall, the put option could be exercised to offset all or a portion of the Fund’s resulting losses. At the same time, because the maximum the Fund has at risk is the cost of the option, purchasing put options does not eliminate the potential for the Fund to profit from an increase in the value of the underlying portfolio securities. The Fund may write put options to earn additional income in the form of option premiums if it expects the price of the underlying instrument to remain stable or rise during the option period for American style or on expiration date for European style so that the option will not be exercised. The risk in this strategy is that the price of the underlying securities may decline by an amount greater than the premium received. Put options written are reported as a liability in the Statement of Assets and Liabilities. Realized and unrealized gains and losses on these contracts are included in the Statement of Operations as Net realized gain from Investment securities. A risk in buying an option is that the Fund pays a premium whether or not the option is exercised. In addition, there can be no assurance that a liquid secondary market will exist for any option purchased.
| Q. | Swap Agreements — The Fund may enter into various swap transactions, including interest rate, total return, index, currency and credit default swap contracts (“CDS”) for investment purposes or to manage interest rate, currency or credit risk. Such transactions are agreements between Counterparties. A swap agreement may be negotiated bilaterally and traded over-the-counter (“OTC”) between two parties (“uncleared/OTC”) or, in some instances, must be transacted through a future commission merchant (“FCM”) and cleared through a clearinghouse that serves as a central Counterparty (“centrally cleared swap”). These agreements may contain among other conditions, events of default and termination events, and various covenants and representations such as provisions that require the Fund to maintain a pre-determined level of net assets, and/or provide limits regarding the decline of the Fund’s NAV over specific periods of time. If the Fund were to trigger such provisions and have open derivative positions at that time, the Counterparty may be able to terminate such agreement and request immediate payment in an amount equal to the net liability positions, if any. |
Interest rate, total return, index, and currency swap agreements are two-party contracts entered into primarily to exchange the returns (or differentials in rates of returns) earned or realized on particular predetermined investments or instruments. The gross returns to be exchanged or “swapped” between the parties are calculated with respect to a notional amount, i.e., the return on or increase in value of a particular dollar amount invested at a particular interest rate or return of an underlying asset, in a particular foreign currency, or in a “basket” of securities representing a particular index.
In a centrally cleared swap, the Fund’s ultimate Counterparty is a central clearinghouse. The Fund initially will enter into centrally cleared swaps through an executing broker. When a fund enters into a centrally cleared swap, it must deliver to the central Counterparty (via the FCM) an amount referred to as “initial margin.” Initial margin requirements are determined by the central Counterparty, but an FCM may require additional initial margin above the amount required by the central Counterparty. Initial margin deposits required upon entering into centrally cleared swaps are satisfied by cash or securities as collateral at the FCM. Securities deposited as initial margin are designated on the Schedule of Investments and cash deposited is recorded on the Statement of Assets and Liabilities. During the term of a cleared swap agreement, a “variation margin” amount may be required to be paid by the Fund or may be received by the Fund, based on the daily change in price of the underlying reference instrument subject to the swap agreement and is recorded as a receivable or payable for variation margin in the Statement of Assets and Liabilities until the centrally cleared swap is terminated at which time a realized gain or loss is recorded.
A CDS is an agreement between Counterparties to exchange the credit risk of an issuer. A buyer of a CDS is said to buy protection by paying a fixed payment over the life of the agreement and in some situations an upfront payment to the seller of the CDS. If a defined credit event occurs (such as payment default or bankruptcy), the Fund as a protection buyer would cease paying its fixed payment, the Fund would deliver eligible bonds issued by the reference entity to the seller, and the seller would pay the full notional value, or the “par value”, of the referenced obligation to the Fund. A seller of a CDS is said to sell protection and thus would receive a fixed payment over the life of the agreement and an upfront payment, if applicable. If a credit event occurs, the Fund as a protection seller would cease to receive the fixed payment stream, the Fund would pay the buyer “par value” or the full notional value of the referenced obligation, and the Fund would receive the eligible bonds issued by the reference entity. In turn, these bonds may be sold in order to realize a recovery value. Alternatively, the seller of the CDS and its Counterparty may agree to net the notional amount and the market value of the bonds and make a cash payment equal to the difference to the buyer of protection. If no credit event occurs, the Fund receives the fixed payment over the life of the agreement. As the seller, the Fund would effectively add leverage to its portfolio because, in addition to its total net assets, the Fund would be subject to investment exposure on the notional amount of the CDS. In connection with these agreements, cash and securities may be identified as collateral in accordance with the terms of the respective swap agreements to provide assets of value and recourse in the event of default under the swap agreement or bankruptcy/insolvency of a party to the swap agreement. If a Counterparty becomes bankrupt or otherwise fails to perform its obligations due to financial difficulties, the Fund may experience significant delays in obtaining any recovery in a bankruptcy or other reorganization proceeding. The Fund may obtain only limited recovery or may obtain no recovery in such circumstances. The Fund’s maximum risk of loss from Counterparty risk, either as the protection seller or as the protection buyer, is the value of the contract. The risk may be mitigated by having a master netting arrangement between the Fund and the Counterparty and by the designation of collateral by the Counterparty to cover the Fund’s exposure to the Counterparty.
23 Invesco Strategic Income Fund
Implied credit spreads represent the current level at which protection could be bought or sold given the terms of the existing CDS contract and serve as an indicator of the current status of the payment/performance risk of the CDS. An implied spread that has widened or increased since entry into the initial contract may indicate a deteriorating credit profile and increased risk of default for the reference entity. A declining or narrowing spread may indicate an improving credit profile or decreased risk of default for the reference entity. Alternatively, credit spreads may increase or decrease reflecting the general tolerance for risk in the credit markets.
An interest rate swap is an agreement between Counterparties pursuant to which the parties exchange a floating rate payment for a fixed rate payment based on a specified notional amount.
A total return swap is an agreement in which one party makes payments based on a set rate, either fixed or variable, while the other party makes payments based on the return of an underlying asset, which includes both the income generated and capital gains, if any. The unrealized appreciation (depreciation) on total return swaps includes dividends on the underlying securities and financing rate payable from the Counterparty. At the maturity date, a net cash flow is exchanged where the total return is equivalent to the return of the underlying reference less a financing rate, if any. As a receiver, the Fund would receive payments based on any positive total return and would owe payments in the event of a negative total return. As the payer, the Fund would owe payments on any net positive total return, and would receive payment in the event of a negative total return.
Changes in the value of centrally cleared and OTC swap agreements are recognized as unrealized gains (losses) in the Statement of Operations by “marking to market” on a daily basis to reflect the value of the swap agreement at the end of each trading day. Payments received or paid at the beginning of the agreement are reflected as such on the Statement of Assets and Liabilities and may be referred to as upfront payments. The Fund accrues for the fixed payment stream and amortizes upfront payments, if any, on swap agreements on a daily basis with the net amount, recorded as a component of realized gain (loss) on the Statement of Operations. A liquidation payment received or made at the termination of a swap agreement is recorded as realized gain (loss) on the Statement of Operations. The Fund segregates liquid securities having a value at least equal to the amount of the potential obligation of a Fund under any swap transaction. Entering into these agreements involves, to varying degrees, lack of liquidity and elements of credit, market, and Counterparty risk in excess of amounts recognized on the Statement of Assets and Liabilities. Such risks involve the possibility that a swap is difficult to sell or liquidate; the Counterparty does not honor its obligations under the agreement and unfavorable interest rates and market fluctuations. It is possible that developments in the swaps market, including potential government regulation, could adversely affect the Fund’s ability to terminate existing swap agreements or to realize amounts to be received under such agreements. A short position in a security poses more risk than holding the same security long. As there is no limit on how much the price of the security can increase, the Fund’s exposure is unlimited.
Notional amounts of each individual credit default swap agreement outstanding as of October 31, 2015 for which the Fund is the seller of protection are disclosed in the open swap agreements table. These potential amounts would be partially offset by any recovery values of the respective referenced obligations, upfront payments received upon entering into the agreement, or net amounts received from the settlement of buy protection credit default swap agreements entered into by the Fund for the same referenced entity or entities.
| R. | Leverage Risk — Leverage exists when the Fund can lose more than it originally invests because it purchases or sells an instrument or enters into a transaction without investing an amount equal to the full economic exposure of the instrument or transaction. |
| S. | Collateral — To the extent the Fund has designated or segregated a security as collateral and that security is subsequently sold, it is the Fund’s practice to replace such collateral no later than the next business day. |
NOTE 2—Advisory Fees and Other Fees Paid to Affiliates
The Trust has entered into a master investment advisory agreement with Invesco Advisers, Inc. (the “Adviser” or “Invesco”). Under the terms of the investment advisory agreement, the Fund pays an advisory fee to the Adviser based on the annual rate of the Fund’s average daily net assets as follows:
| | | | |
| Average Daily Net Assets | | Rate | |
First $1 billion | | | 0.60% | |
Next $3.5 billion | | | 0.55% | |
Over $4.5 billion | | | 0.45% | |
For the year ended October 31, 2015, the effective advisory fees incurred by the Fund was 0.60%.
Under the terms of a master sub-advisory agreement between the Adviser and each of Invesco Asset Management Deutschland GmbH, Invesco Asset Management Limited, Invesco Asset Management (Japan) Limited, Invesco Hong Kong Limited, Invesco Senior Secured Management, Inc., Invesco Canada Ltd. and Invesco PowerShares Capital Management LLC (collectively, the “Affiliated Sub-Advisers”) the Adviser, not the Fund, may pay 40% of the fees paid to the Adviser to any such Affiliated Sub-Adviser(s) that provide(s) discretionary investment management services to the Fund based on the percentage of assets allocated to such Affiliated Sub-Adviser(s).
The Adviser has contractually agreed, through at least February 29, 2016, to waive advisory fees and/or reimburse expenses of all shares to the extent necessary to limit total annual fund operating expenses after fee waiver and/or expense reimbursement (excluding certain items discussed below) of Class A, Class C, Class R, Class Y, Class R5 and Class R6 shares to 0.82%, 1.57%, 1.07%, 0.57%, 0.57% and 0.57%, respectively, of average daily net assets. Effective March 1, 2016 through at least February 28, 2017, the Adviser has contractually agreed to waive advisory fees and/or reimburse expenses of all shares to the extent necessary to limit total annual fund operating expenses after fee waiver and /or expense reimbursement (excluding certain items discussed below) of Class A, Class C, Class R, Class Y, Class R5 and Class R6 to 0.84%, 1.59%, 1.09%, 0.59%, 0.59% and 0.59%, respectively. In determining the Adviser’s obligation to waive advisory fees and/or reimburse expenses, the following expenses are not taken into account, and could cause the total annual fund operating expenses after fee waiver and/or expense reimbursement to exceed the numbers reflected above: (1) interest; (2) taxes; (3) dividend expense on short sales; (4) extraordinary or non-routine items, including litigation expenses; and (5) expenses that the Fund has incurred but did not actually pay because of an expense offset arrangement. Acquired Fund Fees and Expenses are not operating expenses of the Fund directly, but are fees and expenses, including management fees of the investment companies in which the Fund invests. As a result, the total annual fund operating expenses after expense reimbursement may exceed the expense limits above. Unless Invesco continues the fee waiver agreement, it will terminate on February 29, 2016. The fee waiver agreement cannot be terminated during its term.
Further, the Adviser has contractually agreed, through at least June 30, 2017, to waive the advisory fee payable by the Fund in an amount equal to 100% of the net advisory fees the Adviser receives on the Fund’s investments in certain affiliated funds.
24 Invesco Strategic Income Fund
For the year ended October 31, 2015, the Adviser waived advisory fees and reimbursed fund level expenses of $349,314 and reimbursed class level expenses of $8,882, $883, $30, $7,001, $11 and $10 of Class A, Class C, Class R, Class Y, Class R5 and Class R6 shares, respectively.
The Trust has entered into a master administrative services agreement with Invesco pursuant to which the Fund has agreed to pay Invesco for certain administrative costs incurred in providing accounting services to the Fund. For the year ended October 31, 2015, expenses incurred under the agreement are shown in the Statement of Operations as Administrative services fees.
The Trust has entered into a transfer agency and service agreement with Invesco Investment Services, Inc. (“IIS”) pursuant to which the Fund has agreed to pay IIS a fee for providing transfer agency and shareholder services to the Fund and reimburse IIS for certain expenses incurred by IIS in the course of providing such services. IIS may make payments to intermediaries that provide omnibus account services, sub-accounting services and/or networking services. All fees payable by IIS to intermediaries that provide omnibus account services or sub-accounting are charged back to the Fund, subject to certain limitations approved by the Trust’s Board of Trustees. For the year ended October 31, 2015, expenses incurred under the agreement are shown in the Statement of Operations as Transfer agent fees.
The Trust has entered into master distribution agreements with Invesco Distributors, Inc. (“IDI”) to serve as the distributor for the Class A, Class C, Class R, Class Y, Class R5 and Class R6 shares of the Fund. The Trust has adopted plans pursuant to Rule 12b-1 under the 1940 Act with respect to the Fund’s Class A, Class C and Class R shares (collectively, the “Plans”). The Fund, pursuant to the Plans, pays IDI compensation at the annual rate of 0.25% of the Fund’s average daily net assets of Class A shares, 1.00% of the average daily net assets of Class C shares and 0.50% of the average daily net assets of Class R shares. Of the Plan payments, up to 0.25% of the average daily net assets of each class of shares may be paid to furnish continuing personal shareholder services to customers who purchase and own shares of such classes. Any amounts not paid as a service fee under the Plans would constitute an asset-based sales charge. Rules of the Financial Industry Regulatory Authority (“FINRA”) impose a cap on the total sales charges, including asset-based sales charges, that may be paid by any class of shares of the Fund. For the year ended October 31, 2015, expenses incurred under the Plans are shown in the Statement of Operations as Distribution fees.
Front-end sales commissions and CDSC (collectively, the “sales charges”) are not recorded as expenses of the Fund. Front-end sales commissions are deducted from proceeds from the sales of Fund shares prior to investment in Class A shares of the Fund. CDSC are deducted from redemption proceeds prior to remittance to the shareholder. During the year ended October 31, 2015, IDI advised the Fund that IDI retained $5,480 in front-end sales commissions from the sale of Class A shares and $5 from Class C shares, respectively, for CDSC imposed upon redemptions by shareholders.
Certain officers and trustees of the Trust are officers and directors of the Adviser, IIS and/or IDI.
NOTE 3—Additional Valuation Information
GAAP defines fair value as the price that would be received to sell an asset or paid to transfer a liability in an orderly transaction between market participants at the measurement date, under current market conditions. GAAP establishes a hierarchy that prioritizes the inputs to valuation methods, giving the highest priority to readily available unadjusted quoted prices in an active market for identical assets (Level 1) and the lowest priority to significant unobservable inputs (Level 3), generally when market prices are not readily available or are unreliable. Based on the valuation inputs, the securities or other investments are tiered into one of three levels. Changes in valuation methods may result in transfers in or out of an investment’s assigned level:
| | Level 1 — | Prices are determined using quoted prices in an active market for identical assets. |
| | Level 2 — | Prices are determined using other significant observable inputs. Observable inputs are inputs that other market participants may use in pricing a security. These may include quoted prices for similar securities, interest rates, prepayment speeds, credit risk, yield curves, loss severities, default rates, discount rates, volatilities and others. |
| | Level 3 — | Prices are determined using significant unobservable inputs. In situations where quoted prices or observable inputs are unavailable (for example, when there is little or no market activity for an investment at the end of the period), unobservable inputs may be used. Unobservable inputs reflect the Fund’s own assumptions about the factors market participants would use in determining fair value of the securities or instruments and would be based on the best available information. |
The following is a summary of the tiered valuation input levels, as of October 31, 2015. The level assigned to the securities valuations may not be an indication of the risk or liquidity associated with investing in those securities. Because of the inherent uncertainties of valuation, the values reflected in the financial statements may materially differ from the value received upon actual sale of those investments.
| | | | | | | | | | | | | | | | |
| | | Level 1 | | | Level 2 | | | Level 3 | | | Total | |
Equity Securities | | $ | 64,233 | | | $ | — | | | $ | — | | | $ | 64,233 | |
U.S. Treasury Securities | | | — | | | | 989,676 | | | | — | | | | 989,676 | |
U.S. Government Sponsored Agency Securities | | | — | | | | 167,177 | | | | — | | | | 167,177 | |
Asset-Backed Securities | | | — | | | | 22,195,070 | | | | — | | | | 22,195,070 | |
Corporate Debt Securities | | | — | | | | 12,147,372 | | | | — | | | | 12,147,372 | |
Foreign Debt Securities | | | — | | | | 2,296,927 | | | | — | | | | 2,296,927 | |
Foreign Sovereign Debt Securities | | | — | | | | 199,050 | | | | — | | | | 199,050 | |
Credit-Linked Securities | | | — | | | | 573,772 | | | | — | | | | 573,772 | |
Municipal Obligations | | | — | | | | 383,954 | | | | — | | | | 383,954 | |
Options Purchased | | | — | | | | 581,311 | | | | — | | | | 581,311 | |
| | | $ | 64,233 | | | $ | 39,534,309 | | | $ | — | | | $ | 39,598,542 | |
Forward Foreign Currency Contracts* | | | — | | | | 80,445 | | | | — | | | | 80,445 | |
Futures Contracts* | | | (18,502 | ) | | | — | | | | — | | | | (18,502 | ) |
Options Written* | | | — | | | | (15,118 | ) | | | — | | | | (15,118 | ) |
Swap Agreements* | | | — | | | | 336,586 | | | | — | | | | 336,586 | |
Total Investments | | $ | 45,731 | | | $ | 39,936,222 | | | $ | — | | | $ | 39,981,953 | |
| * | Forward foreign currency contracts, futures contracts and swap agreements are valued at unrealized appreciation (depreciation). Options written are shown at value. |
25 Invesco Strategic Income Fund
NOTE 4—Derivative Investments
Value of Derivative Investments at Period-End
The table below summarizes the value of the Fund’s derivative investments, detailed by primary risk exposure, held as of October 31, 2015:
| | | | | | | | |
| | | Value | |
| Risk Exposure/Derivative Type | | Assets | | | Liabilities | |
Credit risk: | | | | | | | | |
Swap agreements(a) | | $ | — | | | $ | (8,603 | ) |
Currency risk: | | | | | | | | |
Forward foreign currency contracts(b) | | | 140,691 | | | | (60,246 | ) |
Options purchased(c) | | | 50,916 | | | | — | |
Options written(d) | | | — | | | | (15,118 | ) |
Equity risk: | | | | | | | | |
Options purchased(c) | | | 530,395 | | | | — | |
Swap agreements(a) | | | 176,024 | | | | — | |
Interest rate risk: | | | | | | | | |
Futures contracts(e) | | | 9,145 | | | | (27,647 | ) |
Swap agreements(f) | | | 236,076 | | | | (66,911 | ) |
Total | | $ | 1,143,247 | | | $ | (178,525 | ) |
| (a) | Values are disclosed on the Statement of Assets and Liabilities under the caption Unrealized appreciation on swap agreements — OTC and Unrealized depreciation on swap agreements — OTC. |
| (b) | Values are disclosed on the Statement of Assets and Liabilities under the caption Unrealized appreciation on forward foreign currency contracts outstanding and Unrealized depreciation on forward foreign currency contracts outstanding. |
| (c) | Options purchased at value as reported in the Schedule of Investments. |
| (d) | Values are disclosed on the Statement of Assets and Liabilities under the caption Options written, at value. |
| (e) | Includes cumulative appreciation (depreciation) of futures contracts. Only current day’s variation margin receivable is reported within the Statement of Assets and Liabilities |
| (f) | Includes cumulative appreciation (depreciation) on centrally cleared swap agreements. Only current day’s variation margin receivable (payable) is reported within the Statement of Assets and Liabilities. |
Effect of Derivative Investments for the year ended October 31, 2015
The table below summarizes the gains (losses) on derivative investments, detailed by primary risk exposure, recognized in earnings during the period:
| | | | | | | | | | | | | | | | | | | | |
| | | Location of Gain (Loss) on
Statement of Operations | |
| | | Forward
Foreign Currency
Contracts | | | Futures
Contracts | | | Options
Purchased(a) | | | Options
Written | | | Swap
Agreements | |
Realized Gain (Loss): | | | | | | | | | | | | | | | | | | | | |
Credit risk | | $ | — | | | $ | — | | | $ | — | | | $ | — | | | $ | 134,577 | |
Currency risk | | | 437,926 | | | | — | | | | (9,377 | ) | | | (3,920 | ) | | | — | |
Equity risk | | | — | | | | — | | | | — | | | | — | | | | — | |
Interest rate risk | | | — | | | | (218,995 | ) | | | — | | | | — | | | | (95,495 | ) |
Change in Net Unrealized Appreciation (Depreciation): | | | | | | | | | | | | | | | | | | | | |
Credit risk | | $ | — | | | $ | — | | | $ | — | | | $ | — | | | $ | (8,603 | ) |
Currency risk | | | 5,247 | | | | — | | | | (6,955 | ) | | | 996 | | | | — | |
Equity risk | | | — | | | | — | | | | — | | | | — | | | | 173,013 | |
Interest rate risk | | | — | | | | (65,937 | ) | | | (196,357 | ) | | | — | | | | 182,223 | |
Total | | $ | 443,173 | | | $ | (284,932 | ) | | $ | (212,689 | ) | | $ | (2,924 | ) | | $ | 385,715 | |
| (a) | Options purchased are included in the net realized gain (loss) from investment securities and the change in net unrealized appreciation (depreciation) of investment securities. |
The table below summarizes the twelve month average notional value of forward foreign currency contracts, futures contracts, options purchased and swap agreements and the ten month average notional value of options written outstanding during the period.
| | | | | | | | | | | | | | | | | | | | |
| | | Forward
Foreign Currency
Contracts | | | Futures
Contracts | | | Options
Purchased | | | Options
Written | | | Swap
Agreements | |
Average notional value | | $ | 10,936,694 | | | $ | 13,712,951 | | | $ | 30,132,545 | | | $ | 2,011,035 | | | $ | 20,236,526 | |
26 Invesco Strategic Income Fund
| | | | | | | | | | | | | | | | | | | | | | | | | | |
| Open Forward Foreign Currency Contracts | |
Settlement Date | | Counterparty | | Contract to | | | Notional
Value | | | Unrealized
Appreciation
(Depreciation) | |
| | | Deliver | | | Receive | | | |
11/04/15 | | State Street Bank & Trust Co. | | | BRL | | | | 790,000 | | | | USD | | | | 194,995 | | | $ | 204,599 | | | $ | (9,604 | ) |
11/04/15 | | State Street Bank & Trust Co. | | | USD | | | | 203,059 | | | | BRL | | | | 790,000 | | | | 204,599 | | | | 1,540 | |
11/16/15 | | Deutsche Bank Securities Inc. | | | INR | | | | 37,800,000 | | | | USD | | | | 573,596 | | | | 577,189 | | | | (3,593 | ) |
11/17/15 | | Deutsche Bank Securities Inc. | | | JPY | | | | 41,400,000 | | | | KRW | | | | 402,408,000 | | | | 339,350 | | | | 9,250 | |
11/17/15 | | Deutsche Bank Securities Inc. | | | JPY | | | | 82,800,000 | | | | USD | | | | 691,652 | | | | 686,293 | | | | 5,359 | |
11/17/15 | | Deutsche Bank Securities Inc. | | | KRW | | | | 1,184,784,400 | | | | JPY | | | | 124,200,000 | | | | 993,044 | | | | (8,100 | ) |
11/17/15 | | Deutsche Bank Securities Inc. | | | USD | | | | 671,288 | | | | KRW | | | | 782,376,400 | | | | 685,143 | | | | 13,855 | |
11/17/15 | | State Street Bank & Trust Co. | | | EUR | | | | 2,589,000 | | | | USD | | | | 2,901,396 | | | | 2,847,838 | | | | 53,558 | |
12/02/15 | | State Street Bank & Trust Co. | | | BRL | | | | 790,000 | | | | USD | | | | 201,212 | | | | 202,678 | | | | (1,466 | ) |
12/04/15 | | Goldman Sachs International | | | MYR | | | | 2,165,000 | | | | USD | | | | 510,709 | | | | 503,434 | | | | 7,275 | |
12/04/15 | | Goldman Sachs International | | | USD | | | | 492,157 | | | | MYR | | | | 2,165,000 | | | | 503,434 | | | | 11,277 | |
01/06/16 | | Barclays Bank PLC | | | EUR | | | | 300,000 | | | | MXN | | | | 5,690,382 | | | | 336,418 | | | | 12,400 | |
01/06/16 | | Barclays Bank PLC | | | EUR | | | | 518,649 | | | | USD | | | | 584,028 | | | | 571,128 | | | | 12,900 | |
01/06/16 | | Barclays Bank PLC | | | MXN | | | | 13,750,000 | | | | USD | | | | 821,789 | | | | 828,219 | | | | (6,430 | ) |
01/06/16 | | Barclays Bank PLC | | | USD | | | | 1,372,713 | | | | EUR | | | | 1,218,380 | | | | 1,341,660 | | | | (31,053 | ) |
01/06/16 | | Barclays Bank PLC | | | USD | | | | 1,034,413 | | | | MXN | | | | 17,350,000 | | | | 1,045,062 | | | | 10,649 | |
01/27/16 | | Barclays Bank PLC | | | SGD | | | | 660,000 | | | | USD | | | | 472,394 | | | | 469,766 | | | | 2,628 | |
Total Open Forward Foreign Currency Contracts — Currency Risk | | | | | | | | | | | | | | | | | | | | | | $ | 80,445 | |
Currency Abbreviations:
| | |
| BRL | | – Brazilian Real |
| EUR | | – Euro |
| INR | | – Indian Rupee |
| | |
| JPY | | – Japanese Yen |
| KRW | | – South Korean Won |
| MXN | | – Mexican Peso |
| | |
| MYR | | – Malaysian Ringgit |
| SGD | | – Singapore Dollar |
| USD | | – U.S. Dollar |
| | | | | | | | | | | | | | | | | | | | |
| Open Futures Contracts | |
| Futures Contracts | | Type of
Contract | | | Number of
Contracts | | | Expiration
Month | | | Notional
Value | | | Unrealized
Appreciation (Depreciation) | |
Euro Bobl | | | Short | | | | 14 | | | | December-2015 | | | $ | (1,992,524 | ) | | $ | (11,357 | ) |
Euro Bonds | | | Short | | | | 3 | | | | December-2015 | | | | (518,652 | ) | | | (10,302 | ) |
Euro Schatz | | | Short | | | | 26 | | | | December-2015 | | | | (3,187,458 | ) | | | (5,988 | ) |
U.S. Treasury 2 Year Notes | | | Short | | | | 6 | | | | December-2015 | | | | (1,311,938 | ) | | | 550 | |
U.S. Treasury 5 Year Notes | | | Short | | | | 40 | | | | December-2015 | | | | (4,790,937 | ) | | | 3,298 | |
U.S. Treasury 10 Year Notes | | | Short | | | | 2 | | | | December-2015 | | | | (255,375 | ) | | | 1,964 | |
U.S. Treasury 30 Year Bonds | | | Long | | | | 4 | | | | December-2015 | | | | 625,750 | | | | 1,460 | |
U.S. Treasury Ultra Bonds | | | Short | | | | 1 | | | | December-2015 | | | | (159,750 | ) | | | 1,873 | |
Total Futures Contracts — Interest Rate Risk | | | | | | | | | | | | | | | | | | $ | (18,502 | ) |
| | | | | | | | | | | | | | | | | | | | | | | | | | | | | | | | | | | | | | |
| Open Foreign Currency Options Written—Currency Risk | |
| Description | | Type of
Contract | | | Counterparty | | Expiration
Date | | | Strike
Price | | | Premiums
Received | | | Notional
Value(a) | | | Value | | | Unrealized
Appreciation
(Depreciation) | |
USD versus SGD | | | Call | | | Deutsche Bank Securities Inc. | | | 12/23/15 | | | | SGD | | | | 1.525 | | | $ | 1,864 | | | | USD | | | | 675,000 | | | $ | 179 | | | $ | 1,685 | |
USD versus KRW | | | Call | | | Goldman Sachs International | | | 01/27/16 | | | | KRW | | | | 1,202,000 | | | | 11,411 | | | | USD | | | | 1,550,000 | | | | 12,387 | | | | (976 | ) |
EUR versus USD | | | Put | | | Deutsche Bank Securities Inc. | | | 03/23/16 | | | | USD | | | | 1.000 | | | | 2,839 | | | | EUR | | | | 600,000 | | | | 2,552 | | | | 287 | |
Total Foreign Currency Options Written — Currency Risk | | | | | | | | | | | $ | 16,114 | | | | | | | | | | | $ | 15,118 | | | $ | 996 | |
Currency Abbreviations:
| | |
| EUR | | – Euro |
| KRW | | – South Korean Won |
| SGD | | – Singapore Dollar |
| USD | | – U.S. Dollar |
27 Invesco Strategic Income Fund
| | | | | | | | | | | | | | | | | | | | | | | | |
| Options Written Transactions | |
| | | Call Options | | | Put Options | |
| | | Notional
Value | | | Premiums
Received | | | Notional
Value | | | Premiums
Received | |
Beginning of period | | | USD | | | | — | | | $ | — | | | | EUR | | | | — | | | $ | — | |
Written | | | USD | | | | 4,845,000 | | | | 20,546 | | | | EUR | | | | 6,275,000 | | | | 27,594 | |
Closed | | | USD | | | | (1,770,000 | ) | | | (4,823 | ) | | | EUR | | | | (5,125,000 | ) | | | (22,456 | ) |
Expired | | | USD | | | | (850,000 | ) | | | (2,448 | ) | | | EUR | | | | (550,000 | ) | | | (2,299 | ) |
End of period | | | USD | | | | 2,225,000 | | | $ | 13,275 | | | | EUR | | | | 600,000 | | | $ | 2,839 | |
Currency Abbreviations:
| | |
| EUR | | – Euro |
| USD | | – U.S. Dollar |
| | | | | | | | | | | | | | | | | | | | | | | | | | | | | | |
| Open Over-The-Counter Credit Default Swap Agreements — Credit Risk | |
| Counterparty/Clearinghouse | | Reference Entity | | Buy/Sell Protection | | | (Pay)/Receive Fixed Rate | | | Expiration
Date | | | Implied
Credit
Spread(a) | | | Notional Value | | | Upfront
Payments
Paid (Received) | | | Unrealized Appreciation
(Depreciation) | |
JPMorgan Chase Bank, N.A. | | K. Hovnanian Enterprises Inc. | | | Buy | | | | (5.00 | )% | | | 09/20/20 | | | | 12.22 | % | | $ | 160,000 | | | $ | 48,860 | | | $ | (8,603 | ) |
| (a) | Implied credit spreads represent the current level as of October 31, 2015 at which protection could be bought or sold given the terms of the existing credit default swap contract and serve as an indicator of the current status of the payment/performance risk of the credit default swap contract. An implied credit spread that has widened or increased since entry into the initial contract may indicate a deteriorating credit profile and increased risk of default for the reference entity. A declining or narrowing spread may indicate an improving credit profile or decreased risk of default for the reference entity. Alternatively, credit spreads may increase or decrease reflecting the general tolerance for risk in the credit markets generally. |
| | | | | | | | | | | | | | | | | | | | |
| Open Centrally Cleared Interest Rate Swap Agreements | |
| Counterparty/Clearinghouse | | Pay/Receive
Floating Rate | | Floating Rate
Index | | Fixed
Rate | | | Termination
Date | | | Notional
Value | | | Unrealized
Appreciation
(Depreciation) | |
Credit Suisse Securities (USA) LLC/CME | | Pay | | 3 Month USD LIBOR | | | 1.55 | % | | | 02/01/19 | | | $ | 13,308,822 | | | $ | 111,280 | |
Credit Suisse Securities (USA) LLC/CME | | Pay | | 3 Month USD LIBOR | | | 1.60 | | | | 02/02/19 | | | | 7,250,000 | | | | 73,599 | |
Credit Suisse Securities (USA) LLC/CME | | Pay | | 3 Month USD LIBOR | | | 1.95 | | | | 04/13/23 | | | | 1,020,000 | | | | 1,635 | |
Credit Suisse Securities (USA) LLC/CME | | Receive | | 3 Month USD LIBOR | | | 0.74 | | | | 10/29/17 | | | | (9,750,000 | ) | | | 20,204 | |
Credit Suisse Securities (USA) LLC/CME | | Receive | | 3 Month USD LIBOR | | | 1.51 | | | | 02/02/19 | | | | (16,645,000 | ) | | | (9,258 | ) |
Credit Suisse Securities (USA) LLC/CME | | Receive | | 3 Month USD LIBOR | | | 1.42 | | | | 10/05/20 | | | | (1,500,000 | ) | | | 5,863 | |
Credit Suisse Securities (USA) LLC/CME | | Receive | | 3 Month USD LIBOR | | | 1.72 | | | | 10/05/22 | | | | (3,500,000 | ) | | | 17,073 | |
Credit Suisse Securities (USA) LLC/CME | | Receive | | 3 Month USD LIBOR | | | 1.73 | | | | 10/05/22 | | | | (1,500,000 | ) | | | 6,422 | |
Credit Suisse Securities (USA) LLC/CME | | Receive | | 3 Month USD LIBOR | | | 2.07 | | | | 03/21/23 | | | | (4,110,000 | ) | | | (3,677 | ) |
Credit Suisse Securities (USA) LLC/CME | | Receive | | 3 Month USD LIBOR | | | 2.48 | | | | 07/20/25 | | | | (1,425,000 | ) | | | (53,976 | ) |
Total Centrally Cleared Interest Rate Swap Agreements — Interest Rate Risk | | | | | | | | | | | | | | $ | 169,165 | |
Abbreviations:
| | |
| CME | | – Chicago Mercantile Exchange |
| LIBOR | | – London Interbank Offered Rate |
| USD | | – U.S. Dollar |
| | | | | | | | | | | | | | | | | | | | |
| Open Over-The-Counter Total Return Swap Agreements | |
| Description | | Type of
Contract | | Counterparty | | Number of
Contracts | | | Termination
Date | | | Notional
Value(a) | | | Unrealized
Appreciation | |
Receive a return equal to the Markit iBoxx $ Liquid High Yield Index and pay a floating rate equal to the 3 Month USD LIBOR | | Long | | Goldman Sachs International | | | 23,000 | | | | 12/20/15 | | | $ | 2,300,000 | | | $ | 48,302 | |
Receive a return equal to the Markit iBoxx $ Liquid High Yield Index and pay a floating rate equal to the 3 Month EURIBOR | | Long | | JPMorgan Chase Bank, N.A. | | | 30,400 | | | | 12/20/15 | | | EUR | 3,040,000 | | | | 24,860 | |
Receive a return equal to the Markit iBoxx $ Liquid High Yield Index and pay a floating rate equal to the 3 Month USD LIBOR | | Long | | JPMorgan Chase Bank, N.A. | | | 17,000 | | | | 12/20/15 | | | | 1,700,000 | | | | 7,914 | |
Receive a return equal to the Markit iBoxx $ Liquid High Yield Index and pay a floating rate equal to the 3 Month USD LIBOR | | Long | | JPMorgan Chase Bank, N.A. | | | 30,000 | | | | 12/20/15 | | | | 3,000,000 | | | | 17,744 | |
28 Invesco Strategic Income Fund
| | | | | | | | | | | | | | | | | | | | |
| Open Over-The-Counter Total Return Swap Agreements–(continued) | |
| Description | | Type of
Contract | | Counterparty | | Number of
Contracts | | | Termination
Date | | | Notional
Value(a) | | | Unrealized
Appreciation | |
Receive a return equal to the Markit iBoxx $ Liquid High Yield Index and pay a floating rate equal to the 3 Month USD LIBOR | | Long | | Morgan Stanley & Co. International PLC | | | 10,000 | | | | 12/20/15 | | | $ | 1,000,000 | | | $ | 19,024 | |
Receive a return equal to the Markit iBoxx $ Liquid High Yield Index and pay a floating rate equal to the 3 Month USD LIBOR | | Long | | Morgan Stanley & Co. International PLC | | | 16,000 | | | | 12/20/15 | | | | 1,600,000 | | | | 23,820 | |
Receive a return equal to the Markit iBoxx $ Liquid High Yield Index and pay a floating rate equal to the 3 Month USD LIBOR | | Long | | Morgan Stanley & Co. International PLC | | | 6,250 | | | | 12/20/15 | | | | 625,000 | | | | 2,962 | |
Receive a return equal to the Markit iBoxx $ Liquid High Yield Index and pay a floating rate equal to the 3 Month USD LIBOR | | Long | | Morgan Stanley & Co. International PLC | | | 13,000 | | | | 12/20/15 | | | | 1,300,000 | | | | 4,855 | |
Receive a return equal to the Markit iBoxx $ Liquid High Yield Index and pay a floating rate equal to the 3 Month USD LIBOR | | Long | | Morgan Stanley & Co. International PLC | | | 30,000 | | | | 12/20/15 | | | | 3,000,000 | | | | 26,543 | |
Total Return Swap Agreements — Equity Risk | | | | | | | | | | | | | | $ | 176,024 | |
| (a) | Amounts are denominated in U.S. Dollars unless otherwise noted. |
Abbreviations:
| | |
| LIBOR | | – London Interbank Offered Rate |
| EURIBOR | | – Euro Interbank Offered Rate |
| EUR | | – Euro |
| USD | | – U.S. Dollar |
Offsetting Assets and Liabilities
Accounting Standards Update (“ASU”) No. 2011-11, Disclosures about Offsetting Assets and Liabilities, which was subsequently clarified in Financial Accounting Standards Board ASU 2013-01 “Clarifying the Scope of Disclosures about Offsetting Assets and Liabilities” is intended to enhance disclosures about financial instruments and derivative instruments that are subject to offsetting arrangements on the Statement of Assets and
Liabilities and to enable investors to better understand the effect of those arrangements on the Fund’s financial position. In order for an arrangement to be eligible for netting, the Fund must have a basis to conclude that such netting arrangements are legally enforceable. The Fund enters into netting agreements and collateral agreements in an attempt to reduce the Fund’s Counterparty credit risk by providing for a single net settlement with a Counterparty of all financial transactions covered by the agreement in an event of default as defined under such agreement.
The following tables present derivative instruments that are either subject to an enforceable netting agreement or offset by collateral arrangements as of October 31, 2015.
| | | | | | | | | | | | | | | | | | | | |
| | | | | | Gross Amounts Not Offset in the
Statement of Assets and Liabilities | | | | |
| Counterparty | | Gross amounts
of Recognized
Assets | | | Financial
Instruments | | | Collateral Received | | | Net
Amount | |
| | | | Non-Cash | | | Cash | | |
Bank of America, N.A.(d) | | $ | 135,133 | | | $ | — | | | $ | — | | | $ | — | | | $ | 135,133 | |
Barclays Bank PLC(b) | | | 38,577 | | | | (37,483 | ) | | | — | | | | — | | | | 1,094 | |
Citigroup Global Markets Inc.(d) | | | 68,402 | | | | — | | | | — | | | | — | | | | 68,402 | |
Credit Suisse Securities(c) | | | 236,076 | | | | (71,424 | ) | | | — | | | | — | | | | 164,652 | |
Deutsche Bank Securities Inc.(b) | | | 28,464 | | | | (11,693 | ) | | | — | | | | — | | | | 16,771 | |
Deutsche Bank Securities Inc.(d) | | | 266,411 | | | | — | | | | — | | | | — | | | | 266,411 | |
Goldman Sachs International(a) | | | 48,302 | | | | — | | | | — | | | | — | | | | 48,302 | |
Goldman Sachs International(b) | | | 18,552 | | | | — | | | | — | | | | — | | | | 18,552 | |
Goldman Sachs International(d) | | | 111,365 | | | | — | | | | — | | | | — | | | | 111,365 | |
JPMorgan Chase Bank N.A.(a) | | | 99,378 | | | | (8,603 | ) | | | — | | | | — | | | | 90,775 | |
Morgan Stanley & Co. International PLC(a) | | | 77,204 | | | | — | | | | — | | | | — | | | | 77,204 | |
State Street Bank & Trust Co.(b) | | | 55,098 | | | | (11,070 | ) | | | | | | | | | | | 44,028 | |
Total | | $ | 1,182,962 | | | $ | (140,273 | ) | | $ | — | | | $ | — | | | $ | 1,042,689 | |
29 Invesco Strategic Income Fund
| | | | | | | | | | | | | | | | | | | | |
| | | | | | Gross Amounts Not Offset in the
Statement of Assets and Liabilities | | | | |
| Counterparty | | Gross amounts
of Recognized
Liabilities | | | Financial
Instruments | | | Collateral Pledged | | | Net
Amount | |
| | | | Non-Cash | | | Cash | | |
Barclays Bank PLC(b) | | $ | 37,483 | | | $ | (37,483 | ) | | $ | — | | | $ | — | | | $ | — | |
Credit Suisse Securities(c) | | | 71,424 | | | | (71,424 | ) | | | — | | | | — | | | | — | |
Deutsche Bank Securities Inc.(b) | | | 11,693 | | | | (11,693 | ) | | | — | | | | — | | | | — | |
Deutsche Bank Securities Inc.(e) | | | 2,731 | | | | — | | | | — | | | | — | | | | 2,731 | |
Goldman Sachs International(e) | | | 12,387 | | | | — | | | | — | | | | — | | | | 12,387 | |
JPMorgan Chase Bank N.A.(a) | | | 8,603 | | | | (8,603 | ) | | | — | | | | — | | | | — | |
State Street Bank & Trust Co.(b) | | | 11,070 | | | | (11,070 | ) | | | — | | | | — | | | | — | |
Total | | $ | 155,391 | | | $ | (140,273 | ) | | $ | — | | | $ | — | | | $ | 15,118 | |
| (a) | Swap agreements — OTC Counterparty. |
| (b) | Forward foreign currency contracts — Counterparty. |
| (c) | Swap agreements – centrally cleared Counterparty. Includes cumulative appreciation (depreciation). |
| (d) | Options and Swaptions purchased — Counterparty. |
| (e) | Options written — Counterparty. |
NOTE 5—Investments in Affiliates
The Fund’s Adviser and the adviser for Invesco Floating Rate Fund are subsidiaries of Invesco Ltd. and therefore, Invesco Floating Rate Fund is considered to be affiliated with the Fund. The following is a summary of the transactions in, and earnings from, investments in Invesco Floating Rate Fund for the year ended October 31, 2015.
| | | | | | | | | | | | | | | | | | | | | | | | | | | | |
| | | Value
10/31/14 | | | Purchases
at Cost | | | Proceeds
from Sales | | | Change in
Unrealized
Appreciation | | | Realized
Gain (Loss) | | | Value
10/31/15 | | | Dividend
Income | |
Invesco Floating Rate Fund—Class R6 | | $ | 5,948,846 | | | $ | 105,831 | | | $ | (5,981,815 | ) | | $ | 43,631 | | | $ | (116,493 | ) | | $ | — | | | $ | 107,039 | |
NOTE 6—Trustees’ and Officers’ Fees and Benefits
Trustees’ and Officers’ Fees and Benefits include amounts accrued by the Fund to pay remuneration to certain Trustees and Officers of the Fund. Trustees have the option to defer compensation payable by the Fund, and Trustees’ and Officers’ Fees and Benefits also include amounts accrued by the Fund to fund such deferred compensation amounts. Those Trustees who defer compensation have the option to select various Invesco Funds in which their deferral accounts shall be deemed to be invested. Obligations under the deferred compensation plan represent unsecured claims against the general assets of the Fund.
NOTE 7—Cash Balances and Borrowings
The Fund is permitted to temporarily carry a negative or overdrawn balance in its account with State Street Bank and Trust Company, the custodian bank. Such balances, if any at period end, are shown in the Statement of Assets and Liabilities under the payable caption Amount due custodian. To compensate the custodian bank for such overdrafts, the overdrawn Fund may either (1) leave funds as a compensating balance in the account so the custodian bank can be compensated by earning the additional interest; or (2) compensate by paying the custodian bank at a rate agreed upon by the custodian bank and Invesco, not to exceed the contractually agreed upon rate.
During the year ended October 31, 2015, the average daily balance of borrowings under the reverse repurchase agreements was $1,014,126, with a weighted interest rate of 2.38% and interest expense of $10,864. Expenses under the reverse repurchase agreements are shown in the Statement of Operations as Interest, facilities, and maintenance fees.
Reverse repurchase agreements outstanding as of October 31, 2015 were as follows:
| | | | | | | | | | | | | | | | |
| Counterparty | | Interest
Rate | | | Maturity
Date | | | Face
Value | | | Face Value
Including Accrued
Interest | |
Royal Bank of Canada | | | 1.24 | % | | | February 8, 2016 | | | $ | 232,000 | | | $ | 233,481 | |
Royal Bank of Canada | | | 1.12 | | | | April 18, 2016 | | | | 455,000 | | | | 457,619 | |
Royal Bank of Canada | | | 1.27 | | | | April 18, 2016 | | | | 430,000 | | | | 432,807 | |
Total | | | | | | | | | | $ | 1,117,000 | | | $ | 1,123,907 | |
30 Invesco Strategic Income Fund
NOTE 8—Distributions to Shareholders and Tax Components of Net Assets
Tax Character of Distributions to Shareholders Paid During the Fiscal Year Ended October 31, 2015 and the Period May 2, 2014 (Commencement Date) Through October 31, 2014:
| | | | | | | | |
| | | October 31,
2015 | | | May 2, 2014
(Commencement
Date) through
October 31,
2014 | |
Ordinary income | | $ | 767,392 | | | $ | 449,701 | |
Return of capital | | | 433,395 | | | | — | |
Long-term capital gain | | | 164,821 | | | | — | |
Total distributions | | $ | 1,365,608 | | | $ | 449,701 | |
Tax Components of Net Assets at Period-End:
| | | | |
| | | 2015 | |
Net unrealized appreciation (depreciation) — investments | | $ | (348,005 | ) |
Net unrealized appreciation — other investments | | | 266,336 | |
Temporary book/tax differences | | | (5,161 | ) |
Capital loss carryforward | | | (30,355 | ) |
Shares of beneficial interest | | | 38,903,233 | |
Total net assets | | $ | 38,786,048 | |
The difference between book-basis and tax-basis unrealized appreciation (depreciation) is due to differences in the timing of recognition of gains and losses on investments for tax and book purposes. The Fund’s net unrealized appreciation (depreciation) difference is attributable primarily to wash sales and bond premium amortization.
The temporary book/tax differences are a result of timing differences between book and tax recognition of income and/or expenses. The Fund’s temporary book/tax differences are the result of the trustee deferral of compensation and retirement plan benefits.
Capital loss carryforward is calculated and reported as of a specific date. Results of transactions and other activity after that date may affect the amount of capital loss carryforward actually available for the Fund to utilize. The ability to utilize capital loss carryforward in the future may be limited under the Internal Revenue Code and related regulations based on the results of future transactions.
The Fund has a capital loss carryforward as of October 31, 2015 as follows:
| | | | | | | | | | | | |
| Capital Loss Carryforward* | |
| Expiration | | Short-Term | | | Long-Term | | | Total | |
Not subject to expiration | | $ | 30,355 | | | $ | — | | | $ | 30,355 | |
| * | Capital loss carryforward as of the date listed above is reduced for limitations, if any, to the extent required by the Internal Revenue Code and may be further limited depending upon a variety of factors, including the realization of net unrealized gains or losses as of the date of any reorganization. |
NOTE 9—Investment Securities
The aggregate amount of investment securities (other than short-term securities, U.S. Treasury obligations and money market funds, if any) purchased and sold by the Fund during the year ended October 31, 2015 was $53,301,280 and $40,261,966, respectively. During the same period, purchases and sales of U.S. Treasury obligations were $1,416,634 and $2,562,419, respectively. Cost of investments on a tax basis includes the adjustments for financial reporting purposes as of the most recently completed federal income tax reporting period-end.
| | | | |
| Unrealized Appreciation (Depreciation) of Investment Securities on a Tax Basis | |
Aggregate unrealized appreciation of investment securities | | $ | 484,257 | |
Aggregate unrealized (depreciation) of investment securities | | | (832,262 | ) |
Net unrealized appreciation (depreciation) of investment securities | | $ | (348,005 | ) |
Cost of investments for tax purposes is $39,946,547.
NOTE 10—Reclassification of Permanent Differences
Primarily as a result of differing book/tax treatment of foreign currency transactions, return of capital distributions and bond premium amortization, on October 31, 2015, undistributed net investment income was increased by $38,566, undistributed net realized gain (loss) was increased by $394,828 and shares of beneficial interest was decreased by $433,394. This reclassification had no effect on the net assets of the Fund.
31 Invesco Strategic Income Fund
NOTE 11—Share Information
| | | | | | | | | | | | | | | | |
| | | Summary of Share Activity | |
| | | Year ended
October 31, 2015(a) | | | May 2, 2014
(commencement date) through
October 31, 2014 | |
| | | Shares | | | Amount | | | Shares | | | Amount | |
Sold: | | | | | | | | | | | | | | | | |
Class A | | | 549,006 | | | $ | 5,430,158 | | | | 1,417,557 | | | $ | 14,188,309 | |
Class C | | | 343,220 | | | | 3,371,971 | | | | 82,697 | | | | 833,074 | |
Class R | | | 6,916 | | | | 68,654 | | | | 1,279 | | | | 12,810 | |
Class Y | | | 478,611 | | | | 4,668,801 | | | | 1,283,979 | | | | 12,842,642 | |
Class R5 | | | 255 | | | | 2,536 | | | | 1,001 | | | | 10,010 | |
Class R6 | | | — | | | | — | | | | 1,001 | | | | 10,010 | |
| | | | |
Issued as reinvestment of dividends: | | | | | | | | | | | | | | | | |
Class A | | | 14,672 | | | | 144,580 | | | | 1,058 | | | | 10,624 | |
Class C | | | 4,230 | | | | 41,685 | | | | 315 | | | | 3,156 | |
Class R | | | 169 | | | | 1,664 | | | | 2 | | | | 23 | |
Class Y | | | 1,782 | | | | 17,575 | | | | 276 | | | | 2,773 | |
| | | | |
Reacquired: | | | | | | | | | | | | | | | | |
Class A | | | (81,329 | ) | | | (798,479 | ) | | | (817 | ) | | | (8,219 | ) |
Class C | | | (77,375 | ) | | | (761,525 | ) | | | (2,156 | ) | | | (21,691 | ) |
Class R | | | (2,699 | ) | | | (26,579 | ) | | | — | | | | — | |
Class Y | | | (58,045 | ) | | | (574,643 | ) | | | (10,049 | ) | | | (101,000 | ) |
Net increase in share activity | | | 1,179,413 | | | $ | 11,586,398 | | | | 2,776,143 | | | $ | 27,782,521 | |
| (a) | There are entities that are record owners of more than 5% of the outstanding shares of the Fund and in the aggregate own 20% of the outstanding shares of the Fund. IDI has an agreement with these entities to sell Fund shares. The Fund, Invesco and/or Invesco affiliates may make payments to these entities, which are considered to be related to the Fund, for providing services to the Fund, Invesco and/or Invesco affiliates including but not limited to services such as securities brokerage, distribution, third party record keeping and account servicing. The Fund has no knowledge as to whether all or any portion of the shares owned of record by these entities are also owned beneficially. |
| | In addition, 63% of the outstanding shares of the Fund are owned by affiliated mutual funds. Affiliated mutual funds are mutual funds that are advised by Invesco. |
32 Invesco Strategic Income Fund
NOTE 12—Financial Highlights
The following schedule presents financial highlights for a share of the Fund outstanding throughout the periods indicated.
| | | | | | | | | | | | | | | | | | | | | | | | | | | | | | | | | | | | | | | | | | | | | | | | | | | | | | | | | | | | |
| | | Net
asset
value,
beginning
of
period | | | Net
investment
income(a) | | | Net
gains
(losses)
on securities
(both
realized
and
unrealized) | | | Total
from
investment
operations | | | Dividends
from
net
investment
income | | | Distributions
from
net
realized
gains | | | Return
of
Capital | | | Total
distributions | | | Net
asset
value,
end
of
period | | | Total
return(b) | | | Net
assets,
end
of
period
(000’s
omitted) | | | Ratio
of
expenses
to
average
net
assets
with
fee
waivers
and/or
expenses
absorbed (h) | | | Ratio
of
expenses
to
average
net
assets
without
fee
waivers
and/or
expenses
absorbed (h) | | | Ratio
of
net
investment
income
to
average
net
assets | | | Portfolio
turnover(c) | |
Class A | |
Year ended 10/31/15 | | $ | 10.05 | | | $ | 0.29 | | | $ | (0.10 | ) | | $ | 0.19 | | | $ | (0.21 | ) | | $ | (0.10 | ) | | $ | (0.13 | ) | | $ | (0.44 | ) | | $ | 9.80 | | | | 1.96 | % | | $ | 18,631 | | | | 0.80 | %(d) | | | 1.98 | %(d) | | | 2.95 | %(d) | | | 145 | % |
Year ended 10/31/14(e) | | | 10.00 | | | | 0.16 | | | | 0.06 | | | | 0.22 | | | | (0.17 | ) | | | — | | | | — | | | | (0.17 | ) | | | 10.05 | | | | 2.19 | | | | 14,248 | | | | 0.71 | (f)(g) | | | 2.08 | (f) | | | 3.12 | (f) | | | 57 | |
Class C | | | | | | | | | | | | | | | | | | | | | | | | | | | | | | | | | | | | | | | | | | | | | | | | | | | | | | | | | | | | |
Year ended 10/31/15 | | | 10.05 | | | | 0.22 | | | | (0.10 | ) | | | 0.12 | | | | (0.17 | ) | | | (0.10 | ) | | | (0.10 | ) | | | (0.37 | ) | | | 9.80 | | | | 1.20 | | | | 3,439 | | | | 1.55 | (d) | | | 2.73 | (d) | | | 2.20 | (d) | | | 145 | |
Year ended 10/31/14(e) | | | 10.00 | | | | 0.12 | | | | 0.07 | | | | 0.19 | | | | (0.14 | ) | | | — | | | | — | | | | (0.14 | ) | | | 10.05 | | | | 1.86 | | | | 812 | | | | 1.46 | (f)(g) | | | 2.83 | (f) | | | 2.37 | (f) | | | 57 | |
Class R | | | | | | | | | | | | | | | | | | | | | | | | | | | | | | | | | | | | | | | | | | | | | | | | | | | | | | | | | | | | |
Year ended 10/31/15 | | | 10.05 | | | | 0.27 | | | | (0.10 | ) | | | 0.17 | | | | (0.20 | ) | | | (0.10 | ) | | | (0.12 | ) | | | (0.42 | ) | | | 9.80 | | | | 1.71 | | | | 56 | | | | 1.05 | (d) | | | 2.23 | (d) | | | 2.70 | (d) | | | 145 | |
Year ended 10/31/14(e) | | | 10.00 | | | | 0.15 | | | | 0.06 | | | | 0.21 | | | | (0.16 | ) | | | — | | | | — | | | | (0.16 | ) | | | 10.05 | | | | 2.08 | | | | 13 | | | | 0.96 | (f)(g) | | | 2.33 | (f) | | | 2.87 | (f) | | | 57 | |
Class Y | | | | | | | | | | | | | | | | | | | | | | | | | | | | | | | | | | | | | | | | | | | | | | | | | | | | | | | | | | | | |
Year ended 10/31/15 | | | 10.05 | | | | 0.32 | | | | (0.09 | ) | | | 0.23 | | | | (0.23 | ) | | | (0.10 | ) | | | (0.14 | ) | | | (0.47 | ) | | | 9.81 | | | | 2.33 | | | | 16,638 | | | | 0.55 | (d) | | | 1.73 | (d) | | | 3.20 | (d) | | | 145 | |
Year ended 10/31/14(e) | | | 10.00 | | | | 0.17 | | | | 0.06 | | | | 0.23 | | | | (0.18 | ) | | | — | | | | — | | | | (0.18 | ) | | | 10.05 | | | | 2.29 | | | | 12,808 | | | | 0.46 | (f)(g) | | | 1.83 | (f) | | | 3.37 | (f) | | | 57 | |
Class R5 | | | | | | | | | | | | | | | | | | | | | | | | | | | | | | | | | | | | | | | | | | | | | | | | | | | | | | | | | | | | |
Year ended 10/31/15 | | | 10.05 | | | | 0.32 | | | | (0.09 | ) | | | 0.23 | | | | (0.23 | ) | | | (0.10 | ) | | | (0.14 | ) | | | (0.47 | ) | | | 9.81 | | | | 2.33 | | | | 12 | | | | 0.55 | (d) | | | 1.77 | (d) | | | 3.20 | (d) | | | 145 | |
Year ended 10/31/14(e) | | | 10.00 | | | | 0.17 | | | | 0.06 | | | | 0.23 | | | | (0.18 | ) | | | — | | | | — | | | | (0.18 | ) | | | 10.05 | | | | 2.29 | | | | 10 | | | | 0.46 | (f)(g) | | | 1.90 | (f) | | | 3.37 | (f) | | | 57 | |
Class R6 | | | | | | | | | | | | | | | | | | | | | | | | | | | | | | | | | | | | | | | | | | | | | | | | | | | | | | | | | | | | |
Year ended 10/31/15 | | | 10.05 | | | | 0.32 | | | | (0.09 | ) | | | 0.23 | | | | (0.23 | ) | | | (0.10 | ) | | | (0.14 | ) | | | (0.47 | ) | | | 9.81 | | | | 2.33 | | | | 10 | | | | 0.55 | (d) | | | 1.77 | (d) | | | 3.20 | (d) | | | 145 | |
Year ended 10/31/14(e) | | | 10.00 | | | | 0.17 | | | | 0.06 | | | | 0.23 | | | | (0.18 | ) | | | — | | | | — | | | | (0.18 | ) | | | 10.05 | | | | 2.29 | | | | 10 | | | | 0.46 | (f)(g) | | | 1.90 | (f) | | | 3.37 | (f) | | | 57 | |
| (a) | Calculated using average shares outstanding. |
| (b) | Includes adjustments in accordance with accounting principles generally accepted in the United States of America and as such, the net asset value for financial reporting purposes and the returns based upon those net asset values may differ from the net asset value and returns for shareholder transactions. Does not include sales charges and is not annualized for periods less than one year, if applicable. |
| (c) | Portfolio turnover is calculated at the fund level and is not annualized for periods less than one year, if applicable. |
| (d) | Ratios are based on average daily net assets (000’s omitted) of $16,435, $1,635, $55, $12,954, $11 and $10 for Class A, Class C, Class R, Class Y, Class R5 and Class R6 shares, respectively. |
| (e) | Commencement date of May 2, 2014. |
| (g) | In addition to the fees and expenses which the Fund bears directly, the Fund indirectly bears a pro rata share of the fees and expenses of the underlying funds in which the Fund invests. Because the underlying funds have varied expenses and fee levels and the Fund may own different proportions at different times, the amount of fees and expenses incurred indirectly by the Fund will vary. Estimated underlying fund expenses are not expenses that are incurred directly by the Fund. They are expenses that are incurred directly by the underlying funds and are deducted from the value of the funds the Fund invests in. The effect of the estimated underlying fund expenses that the Fund bears indirectly is included in the Fund’s total return. Estimated acquired fund fees from underlying funds were 0.14% for the period May 2, 2014 (commencement date) through October 31, 2014. |
| (h) | Includes ratio of interest expense to average net assets was 0.03% for the year ended October 31, 2015. |
33 Invesco Strategic Income Fund
Report of Independent Registered Public Accounting Firm
To the Board of Trustees of AIM Investment Funds (Invesco Investment Funds)
and Shareholders of Invesco Strategic Income Fund:
In our opinion, the accompanying statement of assets and liabilities, including the schedule of investments, and the related statements of operations and of changes in net assets and the financial highlights present fairly, in all material respects, the financial position of Invesco Strategic Income Fund (one of the funds constituting AIM Investment Funds (Invesco Investment Funds), hereafter referred to as the “Fund”) at October 31, 2015, the results of its operations for the year then ended, the changes in its net assets and the financial highlights for the year then ended and for the period May 2, 2014 (commencement of operations) through October 31, 2014, in conformity with accounting principles generally accepted in the United States of America. These financial statements and financial highlights (hereafter referred to as “financial statements”) are the responsibility of the Fund’s management. Our responsibility is to express an opinion on these financial statements based on our audits. We conducted our audits of these financial statements in accordance with the standards of the Public Company Accounting Oversight Board (United States). Those standards require that we plan and perform the audit to obtain reasonable assurance about whether the financial statements are free of material misstatement. An audit includes examining, on a test basis, evidence supporting the amounts and disclosures in the financial statements, assessing the accounting principles used and significant estimates made by management, and evaluating the overall financial statement presentation. We believe that our audits, which included confirmation of securities at October 31, 2015 by correspondence with the custodian and brokers, and the application of alternative auditing procedures where confirmations of security purchases have not been received, provide a reasonable basis for our opinion.
PRICEWATERHOUSECOOPERS LLP
December 16, 2015
Houston, Texas
34 Invesco Strategic Income Fund
Calculating your ongoing Fund expenses
Example
As a shareholder of the Fund, you incur two types of costs: (1) transaction costs, which may include sales charges (loads) on purchase payments or contingent deferred sales charges on redemptions, if any; and (2) ongoing costs, including management fees, distribution and/or service (12b-1) fees, and other Fund expenses. This example is intended to help you understand your ongoing costs (in dollars) of investing in the Fund and to compare these costs with ongoing costs of investing in other mutual funds. The example is based on an investment of $1,000 invested at the beginning of the period and held for the entire period May 1, 2015 through October 31, 2015.
Actual expenses
The table below provides information about actual account values and actual expenses. You may use the information in this table, together with the amount you invested, to estimate the expenses that you paid over the period. Simply divide your account value by $1,000 (for example, an $8,600 account value divided by $1,000 = 8.6), then multiply the result by the number in the table under the heading entitled “Actual Expenses Paid During Period” to estimate the expenses you paid on your account during this period.
Hypothetical example for comparison purposes
The table below also provides information about hypothetical account values and hypothetical expenses based on the Fund’s actual expense ratio and an assumed rate of return of 5% per year before expenses, which is not the Fund’s actual return.
The hypothetical account values and expenses may not be used to estimate the actual ending account balance or expenses you paid for the period. You may use this information to compare the ongoing costs of investing in the Fund and other funds. To do so, compare this 5% hypothetical example with the 5% hypothetical examples that appear in the shareholder reports of the other funds.
Please note that the expenses shown in the table are meant to highlight your ongoing costs only and do not reflect any transaction costs, such as sales charges (loads) on purchase payments or contingent deferred sales charges on redemptions, if any. Therefore, the hypothetical information is useful in comparing ongoing costs only, and will not help you determine the relative total costs of owning different funds. In addition, if these transaction costs were included, your costs would have been higher.
| | | | | | | | | | | | | | | | | | | | | | | | |
| Class | | Beginning
Account Value
(05/01/15) | | | ACTUAL | | | HYPOTHETICAL
(5% annual return before
expenses) | | | Annualized
Expense
Ratio | |
| | | Ending
Account Value
(10/31/15)1 | | | Expenses
Paid During
Period2 | | | Ending
Account Value
(10/31/15) | | | Expenses
Paid During
Period2 | | |
A | | $ | 1,000.00 | | | $ | 1,003.80 | | | $ | 4.29 | | | $ | 1,020.92 | | | $ | 4.33 | | | | 0.85 | % |
C | | | 1,000.00 | | | | 1,000.10 | | | | 8.07 | | | | 1,017.14 | | | | 8.13 | | | | 1.60 | |
R | | | 1,000.00 | | | | 1,002.60 | | | | 5.55 | | | | 1,019.66 | | | | 5.60 | | | | 1.10 | |
Y | | | 1,000.00 | | | | 1,005.10 | | | | 3.03 | | | | 1,022.18 | | | | 3.06 | | | | 0.60 | |
R5 | | | 1,000.00 | | | | 1,005.10 | | | | 3.03 | | | | 1,022.18 | | | | 3.06 | | | | 0.60 | |
R6 | | | 1,000.00 | | | | 1,005.10 | | | | 3.03 | | | | 1,022.18 | | | | 3.06 | | | | 0.60 | |
| 1 | The actual ending account value is based on the actual total return of the Fund for the period May 1, 2015 through October 31, 2015, after actual expenses and will differ from the hypothetical ending account value which is based on the Fund’s expense ratio and a hypothetical annual return of 5% before expenses. |
| 2 | Expenses are equal to the Fund’s annualized expense ratio as indicated above multiplied by the average account value over the period, multiplied by 184/365 to reflect the most recent fiscal half year. |
35 Invesco Strategic Income Fund
Approval of Investment Advisory and Sub-Advisory Agreements
The Board of Trustees (the Board) of AIM Investment Funds (Invesco Investment Funds) (the Company) is required under the Investment Company Act of 1940, as amended, to approve annually the renewal of Invesco Strategic Income Fund’s (the Fund) investment advisory agreements. During contract renewal meetings held on June 9-10, 2015, the Board as a whole, and the disinterested or “independent” Trustees, who comprise over 75% of the Board, voting separately, approved the continuance for the Fund of the Master Investment Advisory Agreement with Invesco Advisers, Inc. (Invesco Advisers and the investment advisory agreement) and the Master Intergroup Sub-Advisory Contract for Mutual Funds with Invesco Asset Management Deutschland GmbH, Invesco Asset Management Limited, Invesco Asset Management (Japan) Limited, Invesco Hong Kong Limited, Invesco Senior Secured Management, Inc., Invesco Canada Ltd. and Invesco PowerShares Capital Management LLC (collectively, the Affiliated Sub-Advisers and the sub-advisory contracts) for another year, effective July 1, 2015.
In evaluating the fairness and reasonableness of compensation under the Fund’s investment advisory agreement and sub-advisory contracts, the Board considered, among other things, the factors discussed below. The Board determined that continuation of the Fund’s investment advisory agreement and the sub-advisory contracts is in the best interest of the Fund and its shareholders and that the compensation payable to Invesco Advisers and the Affiliated Sub-Advisers under the agreements is fair and reasonable.
The Board’s Fund Evaluation Process
The Board’s Investments Committee has established three Sub-Committees, each of which is primarily responsible for overseeing the performance and investment management services provided by Invesco Advisers and the Affiliated Sub-Advisers to a number of the funds advised by Invesco Advisers (the Invesco Funds). The Sub-Committees meet throughout the year to review the performance of their assigned Invesco Funds, including reviewing materials prepared under the direction of the independent Senior Officer, an officer of the Invesco Funds who reports directly to the independent Trustees. Over the course of each year, the Sub-Committees meet with portfolio managers for their assigned Invesco Funds and other members of management to review the performance, investment objective(s), policies, strategies, limitations and investment risks of these funds. The Board had the benefit of reports from the Sub-Committees and Investments Committee throughout the year in considering approval of the continuance of each Invesco Fund’s investment advisory agreement and sub-advisory contracts for another year.
During the contract renewal process, the Board receives comparative performance and fee data regarding the Invesco Funds prepared by Invesco Advisers and Lipper Inc. (Lipper), an independent provider of investment company data. The Board also receives a report and this independent written evaluation from the Senior Officer. The Senior Officer’s evaluation is prepared as part of his responsibility to manage the process by which the Invesco Funds’ proposed management fees are negotiated during the annual contract renewal process to ensure they are negotiated in a manner that is at arms’ length and reasonable. In addition to meetings with Invesco Advisers and fund counsel, the independent Trustees also discuss the continuance of the investment advisory agreement and sub-advisory contracts in separate sessions with the Senior Officer and with independent legal counsel.
The Trustees recognized that the advisory fee rates for the Invesco Funds are, in many cases, the result of years of review and negotiation. The Trustees’ deliberations and conclusions in a particular year may be based in part on their deliberations and conclusions regarding these arrangements throughout the year and in prior years. The Trustees’ review and conclusions are based on the comprehensive consideration of all information presented to them and are not the result of any single determinative factor. Moreover, one Trustee may have weighed a particular piece of information or factor differently than another Trustee.
The discussion below is a summary of the Senior Officer’s independent written evaluation with respect to the Fund’s investment advisory agreement as well as a discussion of the material factors and related conclusions that formed the basis for the Board’s approval of the Fund’s investment advisory agreement and sub-advisory contracts. Unless otherwise stated, this information is current as of June 10, 2015, and does not reflect consideration of factors that became known to the Board after that date.
Factors and Conclusions and Summary of Evaluation of Investment Advisory and Sub-Advisory Agreements
| A. | Nature, Extent and Quality of Services Provided by Invesco Advisers and the Affiliated Sub-Advisers |
The Board reviewed the advisory services provided to the Fund by Invesco Advisers under the Fund’s investment advisory agreement, the performance of Invesco Advisers in providing these services, and the credentials and experience of the officers and employees of Invesco Advisers who provide these services, including the Fund’s portfolio manager or managers. The Board’s review of the qualifications of Invesco Advisers to provide advisory services included the Board’s
consideration of Invesco Advisers’ investment process oversight, independent credit analysis and investment risk management. The Board also considered non-advisory services that Invesco Advisers and its affiliates provide to the Invesco Funds such as various back office support functions, equity and fixed income trading operations, internal audit, distribution, valuation and legal and compliance.
In determining whether to continue the Fund’s investment advisory agreement, the Board considered the benefits of reapproving an existing relationship and the greater uncertainty that may be associated with entering into a new relationship. The Board concluded that the nature, extent and quality of the services provided to the Fund by Invesco Advisers are appropriate and satisfactory and consistent with the terms of the Fund’s investment advisory agreement.
The Board reviewed the services that may be provided by the Affiliated Sub-Advisers under the sub-advisory contracts and the credentials and experience of the officers and employees of the Affiliated Sub-Advisers who provide these services. The Board noted that the Affiliated Sub-Advisers have offices and personnel that are located in financial centers around the world. As a result, the Affiliated Sub-Advisers can provide research and investment analysis on the markets and economies of various countries in which the Fund may invest, make recommendations regarding securities and assist with security trades. The Board concluded that the sub-advisory contracts benefit the Fund and its shareholders by permitting Invesco Advisers to use the resources and talents of the Affiliated Sub-Advisers in managing the Fund. The Board concluded that the nature, extent and quality of the services that may be provided by the Affiliated Sub-Advisers are appropriate and satisfactory and consistent with the terms of the Fund’s sub-advisory contracts.
The Board did not consider Fund performance as a relevant factor in considering whether to approve the investment advisory agreement as the Fund had less than one year of performance history.
| C. | Advisory and Sub-Advisory Fees and Fee Waivers |
The Board considered the advisory fee schedule of the Fund and the contractual fee waivers and/or expense limitations that will be in place for the Fund through February 29, 2016. The Board had no comparative Lipper fee data because the Fund was launched in May 2014.
The Board noted that Invesco Advisers and the Affiliated Sub-Advisers do not manage other mutual funds or client accounts with investment strategies comparable to those of the Fund.
The Board also considered the services that may be provided by the Affiliated Sub-Advisers pursuant to the sub-advisory contracts, as well
36 Invesco Strategic Income Fund
as the fees payable by Invesco Advisers to the Affiliated Sub-Advisers pursuant to the sub-advisory contracts. The Board also noted that the sub-advisory fees are not paid directly by the Fund, but rather, are payable by Invesco Advisers to the Affiliated Sub-Advisers.
| D. | Economies of Scale and Breakpoints |
The Board considered the extent to which there are economies of scale in the provision of advisory services to the Fund. The Board also considered whether the Fund benefits from economies of scale through contractual breakpoints in the Fund’s advisory fee schedule. The Board also noted that the Fund shares directly in economies of scale through lower fees charged by third party service providers based on the combined size of the Invesco Funds and other clients advised by Invesco Advisers.
| E. | Profitability and Financial Resources |
The Board reviewed information from Invesco Advisers concerning the costs of the advisory and other services that Invesco Advisers and its affiliates provide to the Fund and the Invesco Funds and the profitability of Invesco Advisers and its affiliates in providing these services. The Board received information from Invesco Advisers about the methodology used to prepare the profitability information. The Board noted that Invesco Advisers continues to operate at a net profit from services Invesco Advisers and its affiliates provide to the Invesco Funds. The Board noted that although Invesco Advisers received a minimal amount of revenues from advising the Fund, Invesco Advisers and its subsidiaries did not make a profit from managing the Fund. The Board received and accepted information from Invesco Advisers demonstrating that Invesco Advisers and each Affiliated Sub-Adviser are financially sound and have the resources necessary to perform their obligations under the investment advisory agreement and sub-advisory contracts.
| F. | Collateral Benefits to Invesco Advisers and its Affiliates |
The Board considered various other benefits received by Invesco Advisers and its affiliates from the relationship with the Fund, including the fees received for providing transfer agency and distribution services to the Fund. The Board considered comparative information regarding fees charged for these services, including information provided by Lipper and other independent sources. The Board considered the performance of Invesco Advisers and its affiliates in providing these services and the organizational structure employed to provide these services. The Board also considered that these services are provided to the Fund pursuant to written contracts that are reviewed and approved on an annual basis by the Board; and that the services are required for the operation of the Fund.
The Board considered the benefits realized by Invesco Advisers and the Affiliated Sub-Advisers as a result of portfolio brokerage transactions executed through “soft dollar” arrangements. Invesco Advisers noted that the Fund does not
execute brokerage transactions through “soft dollar” arrangements to any significant degree.
The Board considered that the Fund’s uninvested cash and cash collateral from any securities lending arrangements may be invested in money market funds advised by Invesco Advisers pursuant to procedures approved by the Board. The Board noted that Invesco Advisers receives advisory fees from these affiliated money market funds attributable to such investments, although Invesco Advisers has contractually agreed to waive through varying periods the advisory fees payable by the Invesco Funds with respect to investments in the affiliated money market funds. The waiver is in an amount equal to 100% of the net advisory fee Invesco Advisers receives from the affiliated money market funds with respect to the Fund’s investment in the affiliated money market funds of uninvested cash, but not cash collateral. The Board concluded that the amount of advisory fees received by Invesco Advisors from the Fund’s investment of cash collateral from any securities lending arrangements in the affiliated money market funds is fair and reasonable.
37 Invesco Strategic Income Fund
Tax Information
Form 1099-DIV, Form 1042-S and other year–end tax information provide shareholders with actual calendar year amounts that should be included in their tax returns. Shareholders should consult their tax advisors.
The following distribution information is being provided as required by the Internal Revenue Code or to meet a specific state’s requirement.
The Fund designates the following amounts or, if subsequently determined to be different, the maximum amount allowable for its fiscal year ended October 31, 2015:
| | | | |
Federal and State Income Tax | |
Long-Term Capital Gain Distributions | | $ | 164,821 | |
Qualified Dividend Income* | | | 0 | % |
Corporate Dividends Received Deduction* | | | 0 | % |
U.S. Treasury Obligations* | | | 1.71 | % |
| | * | The above percentages are based on ordinary income dividends paid to shareholders during the Fund’s fiscal year. |
| | | | |
Non-Resident Alien Shareholders | |
Qualified Short-Term Gains | | $ | 106,662 | |
38 Invesco Strategic Income Fund
Trustees and Officers
The address of each trustee and officer is AIM Investment Funds (Invesco Investment Funds) (the “Trust”), 11 Greenway Plaza, Suite 1000, Houston, Texas 77046-1173. The trustees serve for the life of the Trust, subject to their earlier death, incapacitation, resignation, retirement or removal as more specifically provided in the Trust’s organizational documents. Each officer serves for a one year term or until their successors are elected and qualified. Column two below includes length of time served with predecessor entities, if any.
| | | | | | | | |
Name, Year of Birth and
Position(s) Held with the Trust | | Trustee and/
or Officer Since | | Principal Occupation(s)
During Past 5 Years | | Number of Funds in Fund Complex Overseen by Trustee | | Other Directorship(s) Held by Trustee During Past 5 Years |
| Interested Persons | | | | | | | | |
| Martin L. Flanagan1 — 1960 Trustee | | 2007 | | Executive Director, Chief Executive Officer and President, Invesco Ltd. (ultimate parent of Invesco and a global investment management firm); Advisor to the Board, Invesco Advisers, Inc. (formerly known as Invesco Institutional (N.A.), Inc.); Trustee, The Invesco Funds; Vice Chair, Investment Company Institute; and Member of Executive Board, SMU Cox School of Business Formerly: Chairman and Chief Executive Officer, Invesco Advisers, Inc. (registered investment adviser); Director, Chairman, Chief Executive Officer and President, IVZ Inc. (holding company), INVESCO Group Services, Inc. (service provider) and Invesco North American Holdings, Inc. (holding company); Director, Chief Executive Officer and President, Invesco Holding Company Limited (parent of Invesco and a global investment management firm); Director, Invesco Ltd.; Chairman, Investment Company Institute and President, Co-Chief Executive Officer, Co-President, Chief Operating Officer and Chief Financial Officer, Franklin Resources, Inc. (global investment management organization). | | 145 | | None |
Philip A. Taylor2 — 1954
Trustee, President and Principal Executive Officer | | 2006 | | Head of North American Retail and Senior Managing Director, Invesco Ltd.; Director, Co-Chairman, Co-President and Co-Chief Executive Officer, Invesco Advisers, Inc. (formerly known as Invesco Institutional (N.A.), Inc.) (registered investment adviser); Director, Chairman, Chief Executive Officer and President, Invesco Management Group, Inc. (formerly known as Invesco Aim Management Group, Inc.) (financial services holding company); Director and President, INVESCO Funds Group, Inc. (registered investment adviser and registered transfer agent); Director and Chairman, Invesco Investment Services, Inc. (formerly known as Invesco Aim Investment Services, Inc.) (registered transfer agent) and IVZ Distributors, Inc. (formerly known as INVESCO Distributors, Inc.) (registered broker dealer); Chief Executive Officer, Invesco Corporate Class Inc. (corporate mutual fund company) Director, Chairman and Chief Executive Officer, Invesco Canada Ltd. (formerly known as Invesco Trimark Ltd./Invesco Trimark Ltèe) (registered investment adviser and registered transfer agent); Trustee, President and Principal Executive Officer, The Invesco Funds (other than AIM Treasurer’s Series Trust (Invesco Treasurer’s Series Trust), Short-Term Investments Trust and Invesco Management Trust); Trustee and Executive Vice President, The Invesco Funds (AIM Treasurer’s Series Trust (Invesco Treasurer’s Series Trust), Short-Term Investments Trust and Invesco Management Trust only); Director, Invesco Investment Advisers LLC (formerly known as Van Kampen Asset Management); Director, Chief Executive Officer and President, Van Kampen Exchange Corp. Formerly: Director, President and Chairman, Invesco Inc. (holding company), Invesco Canada Holdings Inc. (holding company), Trimark Investments Ltd./Placements Trimark Ltèe and Invesco Financial Services Ltd/Services Financiers Invesco Ltèe; Chief Executive Officer, Invesco Canada Fund Inc (corporate mutual fund company); Director and Chairman, Van Kampen Investor Services Inc.; Director, Chief Executive Officer and President, 1371 Preferred Inc. (holding company) and Van Kampen Investments Inc.; Director and President, AIM GP Canada Inc. (general partner for limited partnerships) and Van Kampen Advisors, Inc.; Director and Chief Executive Officer, Invesco Trimark Dealer Inc. (registered broker dealer); Director, Invesco Distributors, Inc. (formerly known as Invesco Aim Distributors, Inc.) (registered broker dealer); Manager, Invesco PowerShares Capital Management LLC; Director, Chief Executive Officer and President, Invesco Advisers, Inc.; Director, Chairman, Chief Executive Officer and President, Invesco Aim Capital Management, Inc.; President, Invesco Trimark Dealer Inc. and Invesco Trimark Ltd./Invesco Trimark Ltèe; Director and President, AIM Trimark Corporate Class Inc. and AIM Trimark Canada Fund Inc.; Senior Managing Director, Invesco Holding Company Limited; Director and Chairman, Fund Management Company (former registered broker dealer); President and Principal Executive Officer, The Invesco Funds (AIM Treasurer’s Series Trust (Invesco Treasurer’s Series Trust), and Short-Term Investments Trust only); President, AIM Trimark Global Fund Inc. and AIM Trimark Canada Fund Inc.. | | 145 | | None |
| 1 | Mr. Flanagan is considered an interested person (within the meaning of Section 2(a)(19) of the 1940 Act) of the Trust because he is an officer of the Adviser to the Trust, and an officer and a director of Invesco Ltd., ultimate parent of the Adviser. |
| 2 | Mr. Taylor is considered an interested person (within the meaning of Section 2(a)(19) of the 1940 Act) of the Trust because he is an officer and a director of the Adviser. |
T-1 Invesco Strategic Income Fund
Trustees and Officers—(continued)
| | | | | | | | |
Name, Year of Birth and Position(s) Held with the Trust | | Trustee and/ or Officer Since | | Principal Occupation(s) During Past 5 Years | | Number of Funds in Fund Complex Overseen by Trustee | | Other Directorship(s) Held by Trustee During Past 5 Years |
| Independent Trustees | | | | | | | | |
Bruce L. Crockett — 1944 Trustee and Chair | | 2003 | | Chairman, Crockett Technologies Associates (technology consulting company) Formerly: Director, Captaris (unified messaging provider); Director, President and Chief Executive Officer, COMSAT Corporation; Chairman, Board of Governors of INTELSAT (international communications company); ACE Limited (insurance company); Independent Directors Council and Investment Company Institute | | 145 | | ALPS (Attorneys Liability Protection Society) (insurance company) and Globe Specialty Metals, Inc. (metallurgical company) |
David C. Arch — 1945 Trustee | | 2010 | | Chairman of Blistex Inc., a consumer health care products manufacturer | | 145 | | Board member of the Illinois Manufacturers’ Association; Member of the Board of Visitors, Institute for the Humanities, University of Michigan; Member of the Audit Committee of the Edward-Elmhurst Hospital |
James T. Bunch — 1942 Trustee | | 2000 | | Managing Member, Grumman Hill Group LLC (family office/private equity investments) Formerly: Founder, Green Manning & Bunch Ltd. (investment banking firm) (1988-2010); Executive Committee, United States Golf Association; and Chairman, Board of Governors, Western Golf Association | | 145 | | Chairman of the Board of Trustees, Evans Scholars Foundation; and Chairman of the Board, Denver Film Society |
Rodney F. Dammeyer — 1940 Trustee | | 2010 | | Chairman of CAC, LLC, (private company offering capital investment and management advisory services) Formerly: Prior to 2001, Managing Partner at Equity Group Corporate Investments; Prior to 1995, Chief Executive Officer of Itel Corporation (formerly Anixter International); Prior to 1985, experience includes Senior Vice President and Chief Financial Officer of Household International, Inc., Executive Vice President and Chief Financial Officer of Northwest Industries, Inc. and Partner of Arthur Andersen & Co.; From 1987 to 2010, Director/Trustee of investment companies in the Van Kampen Funds complex | | 145 | | Director of Quidel Corporation and Stericycle, Inc. |
Albert R. Dowden — 1941 Trustee | | 2003 | | Director of a number of public and private business corporations, including the Boss Group, Ltd. (private investment and management); Nature’s Sunshine Products, Inc. and Reich & Tang Funds (5 portfolios) (registered investment company) Formerly: Director, Homeowners of America Holding Corporation/Homeowners of America Insurance Company (property casualty company); Director, Continental Energy Services, LLC (oil and gas pipeline service); Director, CompuDyne Corporation (provider of product and services to the public security market) and Director, Annuity and Life Re (Holdings), Ltd. (reinsurance company); Director, President and Chief Executive Officer, Volvo Group North America, Inc.; Senior Vice President, AB Volvo; Director of various public and private corporations; Chairman, DHJ Media, Inc.; Director, Magellan Insurance Company; and Director, The Hertz Corporation, Genmar Corporation (boat manufacturer), National Media Corporation; Advisory Board of Rotary Power International (designer, manufacturer, and seller of rotary power engines); and Chairman, Cortland Trust, Inc. (registered investment company) | | 145 | | Director of: Nature’s Sunshine Products, Inc., Reich & Tang Funds, Homeowners of America Holding Corporation/ Homeowners of America Insurance Company, the Boss Group |
Jack M. Fields — 1952 Trustee | | 2003 | | Chief Executive Officer, Twenty First Century Group, Inc. (government affairs company); Owner and Chief Executive Officer, Dos Angeles Ranch, L.P. (cattle, hunting, corporate entertainment); and Discovery Global Education Fund (non-profit) Formerly: Chief Executive Officer, Texana Timber LP (sustainable forestry company); Director of Cross Timbers Quail Research Ranch (non-profit); and member of the U.S. House of Representatives | | 145 | | Insperity, Inc. (formerly known as Administaff) |
Prema Mathai-Davis — 1950 Trustee | | 2003 | | Retired. Formerly: Chief Executive Officer, YWCA of the U.S.A. | | 145 | | None |
Larry Soll — 1942 Trustee | | 1997 | | Retired. Formerly: Chairman, Chief Executive Officer and President, Synergen Corp. (a biotechnology company) | | 145 | | None |
Hugo F. Sonnenschein — 1940 Trustee | | 2010 | | President Emeritus and Honorary Trustee of the University of Chicago and the Adam Smith Distinguished Service Professor in the Department of Economics at the University of Chicago. Prior to 2000, President of the University of Chicago | | 145 | | Trustee of the University of Rochester and a member of its investment committee; Member of the National Academy of Sciences and the American Philosophical Society; Fellow of the American Academy of Arts and Sciences |
Raymond Stickel, Jr. — 1944 Trustee | | 2005 | | Retired. Formerly: Director, Mainstay VP Series Funds, Inc. (25 portfolios) and Partner, Deloitte & Touche | | 145 | | None |
T-2 Invesco Strategic Income Fund
Trustees and Officers—(continued)
| | | | | | | | |
Name, Year of Birth and Position(s) Held with the Trust | | Trustee and/ or Officer Since | | Principal Occupation(s) During Past 5 Years | | Number of Funds in Fund Complex Overseen by Trustee | | Other Directorship(s) Held by Trustee During Past 5 Years |
| Independent Trustees—(continued) |
Suzanne H. Woolsey — 1941 Trustee | | 2014 | | Chief Executive Officer of Woolsey Partners LLC | | 145 | | Emeritus Chair of the Board of Trustees of the Institute for Defense Analyses; Trustee of Colorado College; Trustee of California Institute of Technology; Prior to 2014, Director of Fluor Corp.; Prior to 2010, Trustee of the German Marshall Fund of the United States; Prior to 2010 Trustee of the Rocky Mountain Institute |
| Other Officers | | | | | | | | |
Russell C. Burk — 1958
Senior Vice President and Senior Officer | | 2005 | | Senior Vice President and Senior Officer, The Invesco Funds | | N/A | | N/A |
John M. Zerr — 1962
Senior Vice President, Chief Legal Officer and Secretary | | 2006 | | Director, Senior Vice President, Secretary and General Counsel, Invesco Management Group, Inc. (formerly known as Invesco Aim Management Group, Inc.) and Van Kampen Exchange Corp.; Senior Vice President, Invesco Advisers, Inc. (formerly known as Invesco Institutional (N.A.), Inc.) (registered investment adviser); Senior Vice President and Secretary, Invesco Distributors, Inc. (formerly known as Invesco Aim Distributors, Inc.); Director, Vice President and Secretary, Invesco Investment Services, Inc. (formerly known as Invesco Aim Investment Services, Inc.) and IVZ Distributors, Inc. (formerly known as INVESCO Distributors, Inc.); Director and Vice President, INVESCO Funds Group, Inc.; Senior Vice President, Chief Legal Officer and Secretary, The Invesco Funds; Managing Director, Invesco PowerShares Capital Management LLC; Director, Secretary and General Counsel, Invesco Investment Advisers LLC (formerly known as Van Kampen Asset Management); Secretary and General Counsel, Invesco Capital Markets, Inc. (formerly known as Van Kampen Funds Inc.) and Chief Legal Officer, PowerShares Exchange-Traded Fund Trust, PowerShares Exchange-Traded Fund Trust II, PowerShares India Exchange-Traded Fund Trust, PowerShares Actively Managed Exchange-Traded Fund Trust, and PowerShares Actively Managed Exchange-Traded Commodity Fund Trust Formerly: Director and Vice President, Van Kampen Advisors Inc.; Director, Vice President, Secretary and General Counsel, Van Kampen Investor Services Inc.; Director, Invesco Distributors, Inc. (formerly known as Invesco Aim Distributors, Inc.); Director, Senior Vice President, General Counsel and Secretary, Invesco Aim Advisers, Inc. and Van Kampen Investments Inc.; Director, Vice President and Secretary, Fund Management Company; Director, Senior Vice President, Secretary, General Counsel and Vice President, Invesco Aim Capital Management, Inc.; Chief Operating Officer and General Counsel, Liberty Ridge Capital, Inc. (an investment adviser); Vice President and Secretary, PBHG Funds (an investment company) and PBHG Insurance Series Fund (an investment company); Chief Operating Officer, General Counsel and Secretary, Old Mutual Investment Partners (a broker-dealer); General Counsel and Secretary, Old Mutual Fund Services (an administrator) and Old Mutual Shareholder Services (a shareholder servicing center); Executive Vice President, General Counsel and Secretary, Old Mutual Capital, Inc. (an investment adviser); and Vice President and Secretary, Old Mutual Advisors Funds (an investment company) | | N/A | | N/A |
Sheri Morris — 1964
Vice President, Treasurer and Principal Financial Officer | | 2003 | | Vice President, Treasurer and Principal Financial Officer, The Invesco Funds; Vice President, Invesco Advisers, Inc. (formerly known as Invesco Institutional (N.A.), Inc.) (registered investment adviser); and Vice President, PowerShares Exchange-Traded Fund Trust, PowerShares Exchange-Traded Fund Trust II, PowerShares India Exchange-Traded Fund Trust, PowerShares Actively Managed Exchange-Traded Fund Trust, and PowerShares Actively Managed Exchange-Traded Commodity Fund Trust Formerly: Vice President, Invesco Aim Advisers, Inc., Invesco Aim Capital Management, Inc. and Invesco Aim Private Asset Management, Inc.; Assistant Vice President and Assistant Treasurer, The Invesco Funds and Assistant Vice President, Invesco Advisers, Inc., Invesco Aim Capital Management, Inc. and Invesco Aim Private Asset Management, Inc.; and Treasurer, PowerShares Exchange-Traded Fund Trust, PowerShares Exchange-Traded Fund Trust II, PowerShares India Exchange-Traded Fund Trust and PowerShares Actively Managed Exchange-Traded Fund Trust | | N/A | | N/A |
T-3 Invesco Strategic Income Fund
Trustees and Officers—(continued)
| | | | | | | | |
Name, Year of Birth and
Position(s) Held with the Trust | | Trustee and/
or Officer Since | | Principal Occupation(s)
During Past 5 Years | | Number of Funds in Fund Complex Overseen by Trustee | | Other Directorship(s) Held by Trustee During Past 5 Years |
| Other Officers—(continued) | | | | | | | | |
Karen Dunn Kelley — 1960
Vice President | | 2003 | | Senior Managing Director, Investments, Invesco Ltd.; Director, Co-President, Co-Chief Executive Officer, and Co-Chairman, Invesco Advisers, Inc. (formerly known as Invesco Institutional (N.A.), Inc.) (registered investment adviser); Chairman, Invesco Senior Secured Management, Inc.; Senior Vice President, Invesco Management Group, Inc. (formerly known as Invesco Aim Management Group, Inc.); Executive Vice President, Invesco Distributors, Inc. (formerly known as Invesco Aim Distributors, Inc.); Director, Invesco Mortgage Capital Inc. and Invesco Management Company Limited; Vice President, The Invesco Funds (other than AIM Treasurer’s Series Trust (Invesco Treasurer’s Series Trust), Short-Term Investments Trust and Invesco Management Trust); and President and Principal Executive Officer, The Invesco Funds (AIM Treasurer’s Series Trust (Invesco Treasurer’s Series Trust), Short-Term Investments Trust and Invesco Management Trust only) Formerly: Director and President, INVESCO Asset Management (Bermuda) Ltd., Director, INVESCO Global Asset Management Limited and INVESCO Management S.A.; Senior Vice President, Van Kampen Investments Inc. and Invesco Advisers, Inc. (formerly known as Invesco Institutional (N.A.), Inc.) (registered investment adviser); Vice President, Invesco Advisers, Inc. (formerly known as Invesco Institutional (N.A.), Inc.); Director of Cash Management and Senior Vice President, Invesco Advisers, Inc. and Invesco Aim Capital Management, Inc.; Director and President, Fund Management Company; Chief Cash Management Officer, Director of Cash Management, Senior Vice President, and Managing Director, Invesco Aim Capital Management, Inc.; Director of Cash Management, Senior Vice President, and Vice President, Invesco Advisers, Inc. and The Invesco Funds (AIM Treasurer’s Series Trust (Invesco Treasurer’s Series Trust), and Short-Term Investments Trust only) | | N/A | | N/A |
Crissie M. Wisdom — 1969 Anti-Money Laundering Compliance Officer | | 2013 | | Anti-Money Laundering Compliance Officer, Invesco Advisers, Inc. (formerly known as Invesco Institutional (N.A.), Inc.) (registered investment adviser), Invesco Capital Markets, Inc. (formerly known as Van Kampen Funds Inc.), Invesco Distributors, Inc., Invesco Investment Services, Inc., Invesco Management Group, Inc., Van Kampen Exchange Corp., The Invesco Funds, and PowerShares Exchange-Traded Fund Trust, PowerShares Exchange-Traded Fund Trust II, PowerShares India Exchange-Traded Fund Trust, PowerShares Actively Managed Exchange-Traded Fund Trust and PowerShares Actively Managed Exchange-Traded Commodity Fund Trust; Anti-Money Laundering Compliance Officer and Bank Secrecy Act Officer, INVESCO National Trust Company and Invesco Trust Company; and Fraud Prevention Manager and Controls and Risk Analysis Manager for Invesco Investment Services, Inc.. | | N/A | | N/A |
Lisa O. Brinkley — 1959 Chief Compliance Officer | | 2015 | | Senior Vice President and Chief Compliance Officer, Invesco Advisers, Inc. (registered investment adviser) (formerly known as Invesco Institutional (N.A., Inc.); and Chief Compliance Officer, The Invesco Funds Formerly: Global Assurance Officer, Invesco Ltd. and Vice President, The Invesco Funds; Chief Compliance Officer, Invesco Distributors, Inc. (formerly known as Invesco Aim Distributors, Inc.), Invesco Investment Services, Inc.(formerly known as Invesco Aim Investment Services, Inc.) and Van Kampen Investor Services Inc.; Senior Vice President, Invesco Management Group, Inc.; Senior Vice President and Chief Compliance Officer, Invesco Advisers, Inc. and The Invesco Funds; Vice President and Chief Compliance Officer, Invesco Aim Capital Management, Inc. and Invesco Distributors, Inc.; Vice President, Invesco Investment Services, Inc. and Fund Management Company. | | N/A | | N/A |
The Statement of Additional Information of the Trust includes additional information about the Fund’s Trustees and is available upon request, without charge, by calling 1.800.959.4246. Please refer to the Fund’s prospectus for information on the Fund’s sub-advisers.
| | | | | | |
Office of the Fund 11 Greenway Plaza, Suite 1000 Houston, TX 77046-1173 | | Investment Adviser Invesco Advisers, Inc. 1555 Peachtree Street, N.E. Atlanta, GA 30309 | | Distributor
Invesco Distributors, Inc. 11 Greenway Plaza, Suite 1000 Houston, TX 77046-1173 | | Auditors PricewaterhouseCoopers LLP 1000 Louisiana Street, Suite 5800 Houston, TX 77002-5678 |
| | | |
| | | | | | |
Counsel to the Fund Stradley Ronon Stevens & Young, LLP 2005 Market Street, Suite 2600 Philadelphia, PA 19103-7018 | | Counsel to the Independent Trustees Goodwin Procter LLP 901 New York Avenue, N.W. Washington, D.C. 20001 | | Transfer Agent Invesco Investment Services, Inc. 11 Greenway Plaza, Suite 1000 Houston, TX 77046-1173 | | Custodian State Street Bank and Trust Company 225 Franklin Street Boston, MA 02110-2801 |
T-4 Invesco Strategic Income Fund

Invesco mailing information
Send general correspondence to Invesco Investment Services, Inc., P.O. Box 219078, Kansas City, MO 64121-9078.
Important notice regarding delivery of security holder documents
To reduce Fund expenses, only one copy of most shareholder documents may be mailed to shareholders with multiple accounts at the same address (Householding). Mailing of your shareholder documents may be householded indefinitely unless you instruct us otherwise. If you do not want the mailing of these documents to be combined with those for other members of your household, please contact Invesco Investment Services, Inc. at 800 959 4246 or contact your financial institution. We will begin sending you individual copies for each account within 30 days after receiving your request.
| | |
Fund holdings and proxy voting information | | |
| The Fund provides a complete list of its holdings four times in each fiscal year, at the quarter ends. For the second and fourth quarters, the lists appear in the Fund’s semiannual and annual reports to shareholders. For the first and third quarters, the Fund files the lists with the Securities and Exchange Commission (SEC) on Form N-Q. The most recent list of portfolio holdings is available at invesco.com/completeqtrholdings. Shareholders can also look up the Fund’s Forms N-Q on the SEC website at sec.gov. Copies of the Fund’s Forms N-Q may be reviewed and copied at the SEC Public Reference Room in Washington, D.C. You can obtain information on the operation of the Public Reference Room, including information about duplicating fee charges, by calling 202 551 8090 or 800 732 0330, or by electronic request at the following email address: publicinfo@sec.gov. The SEC file numbers for the Fund are shown below. |
A description of the policies and procedures that the Fund uses to determine how to vote proxies relating to portfolio securities is available without charge, upon request, from our Client Services department at 800 959 4246 or at invesco.com/proxyguidelines. The information is also available on the SEC website, sec.gov. |
Information regarding how the Fund voted proxies related to its portfolio securities during the most recent 12-month period ended June 30 is available at invesco.com/proxysearch. The information is also available on the SEC website, sec.gov. | | 
|
Invesco Advisers, Inc. is an investment adviser; it provides investment advisory services to individual and institutional clients and does not sell securities. Invesco Distributors, Inc. is the US distributor for Invesco Ltd.’s retail mutual funds, exchange-traded funds and institutional money market funds. Both are wholly owned, indirect subsidiaries of Invesco Ltd. | |
SEC file numbers: 811-05426 and 033-19338 STI-AR-1 Invesco Distributors, Inc.
Letters to Shareholders
| | |

Philip Taylor | | Dear Shareholders: |
| | This annual report includes information about your Fund, including performance data and a complete list of its investments as of the close of the reporting period. Inside is a discussion of how your Fund was managed and the factors that affected its performance during the reporting period. I hope you find this report of interest. The US economy expanded and unemployment declined throughout the reporting period. Continuing low energy prices benefited consumers, but a strong US dollar crimped corporate profits. The US Federal Reserve signaled that it was increasingly likely to raise interest rates, based on generally positive economic data, but uncertainty remained about when it might act. Overseas, the story was much different. Low energy prices hurt the economies of some oil-producing nations, such as Brazil and Russia. During the reporting period, the European |
Central Bank as well as central banks in China and Japan – among other countries – either instituted or maintained extraordinarily accommodative monetary policies in response to economic weakness.
Investor uncertainty, such as we saw for much of the reporting period – and market volatility, such as we saw at the end of the reporting period – are unfortunate facts of life when it comes to investing. Some investors use these things as excuses to delay saving and investing for their long-term financial goals. That’s why Invesco encourages investors to work with a professional financial adviser who can stress the importance of starting to save and invest early and the importance of adhering to a disciplined investment plan – when times are good and when they’re uncertain. A financial adviser who knows your unique financial situation, investment goals and risk tolerance can be an invaluable partner as you seek to achieve your financial goals. He or she can offer a long-term perspective when markets are volatile and time-tested advice and guidance when your financial situation or investment goals change.
Timely information when and where you want it
Invesco’s efforts to help investors achieve their financial objectives include providing individual investors and financial professionals with timely information about the markets, the economy and investing – whenever and wherever they want it.
Our website, invesco.com/us, offers a wide range of market insights and investment perspectives. On the website, you’ll find detailed information about our funds, including prices, performance, holdings and portfolio manager commentaries. You can access information about your account by completing a simple, secure online registration. Click on the “Need to register” link in the “Account Access” box on our homepage to get started.
Invesco’s mobile apps for iPhone® and iPad® (both available free from the App StoreSM) allow you to obtain the same detailed information, monitor your account and create customizable watch lists. Also, they allow you to access investment insights from our investment leaders, market strategists, economists and retirement experts. You can sign up to be alerted when new commentary is added, and you can watch portfolio manager videos and have instant access to Invesco news and updates wherever you may be.
In addition to the resources accessible on our website and through our mobile app, you can obtain timely updates to help you stay informed about the markets, the economy and investing by connecting with Invesco on Twitter, LinkedIn or Facebook. You can access our blog at blog.invesco.us.com. Our goal is to provide you the information you want, when and where you want it.
Have questions?
For questions about your account, feel free to contact an Invesco client services representative at 800 959 4246. For Invesco-related questions or comments, please email me directly at phil@invesco.com.
All of us at Invesco look forward to serving your investment management needs for many years to come. Thank you for investing with us.
|
| Sincerely, |

|
Philip Taylor |
| Senior Managing Director, Invesco Ltd. |
iPhone and iPad are trademarks of Apple Inc., registered in the US and other countries. App Store is a service mark of Apple Inc. Invesco Distributors, Inc. is not affiliated with Apple Inc.
2 Invesco Unconstrained Bond
| | | | |

Bruce Crockett | | Dear Fellow Shareholders: |
| | Among the many important lessons I’ve learned in more than 40 years in a variety of business endeavors is the value of a trusted advocate. As independent chair of the Invesco Funds Board, I can assure you that the members of the Board are strong advocates for the interests of investors in Invesco’s mutual funds. We work hard to represent your interests through oversight of the quality of the investment management services your funds receive and other matters important to your investment, including but not limited to: |
| | n | | Ensuring that Invesco offers a diverse lineup of mutual funds that your financial adviser can use to strive to meet your financial needs as your investment goals change over time. |
| | n | | Monitoring how the portfolio management teams of the Invesco funds are performing in light of changing economic and market conditions. |
| n | | Assessing each portfolio management team’s investment performance within the context of the investment strategy described in the fund’s prospectus. |
| n | | Monitoring for potential conflicts of interests that may impact the nature of the services that your funds receive. |
We believe one of the most important services we provide our fund shareholders is the annual review of the funds’ advisory and sub-advisory contracts with Invesco Advisers and its affiliates. This review is required by the Investment Company Act of 1940 and focuses on the nature and quality of the services Invesco provides as the adviser to the Invesco funds and the reasonableness of the fees that it charges for those services. Each year, we spend months carefully reviewing information received from Invesco and a variety of independent sources, such as performance and fee data prepared by Lipper Inc., an independent, third-party firm widely recognized as a leader in its field. We also meet with our independent legal counsel and other independent advisers to review and help us assess the information that we have received. Our goal is to assure that you receive quality investment management services for a reasonable fee.
I trust the measures outlined above provide assurance that you have a worthy advocate when it comes to choosing the Invesco Funds.
As always, please contact me at bruce@brucecrockett.com with any questions or concerns you may have. On behalf of the Board, we look forward to continuing to represent your interests and serving your needs.
|
| Sincerely, |

|
Bruce L. Crockett |
| Independent Chair |
| Invesco Funds Board of Trustees |
3 Invesco Unconstrained Bond
Management’s Discussion of Fund Performance
| | | | |
Performance summary | | | | |
For the fiscal year ended October 31, 2015, Class A shares of Invesco Unconstrained Bond Fund (the Fund), at net asset value (NAV), outperformed the Fund’s broad market/style-specific index, the 3-Month USD Libor Index. Your Fund’s long-term performance appears later in this report. | |
| Fund vs. Indexes | | | | |
| Total returns, 10/31/14 to 10/31/15, at net asset value (NAV). Performance shown does not include applicable contingent deferred sales charges (CDSC) or front-end sales charges, which would have reduced performance. | |
| |
Class A Shares | | | 1.39 | % |
Class C Shares | | | 0.59 | |
Class R Shares | | | 1.15 | |
Class Y Shares | | | 1.62 | |
Class R5 Shares | | | 1.62 | |
Class R6 Shares | | | 1.62 | |
3-Month USD Libor Indexq (Broad Market/Style-Specific Index) | | | 0.28 | |
Lipper Alternative Credit Focus Funds Indexn (Peer Group Index) | | | -1.58 | |
Source(s): qBloomberg LP; nLipper Inc. | | | | |
Market conditions and your Fund
Global divergence with respect to growth, inflation and economic policy dominated global bond markets during the fiscal year ended October 31, 2015. Moderate growth in the US and UK led to the beginnings of tighter monetary policy, starting with the end of the US Federal Reserve’s (the Fed) quantitative easing (QE) program in addition to speculation on whether both regions’ central banks would lift short-term interest rates for the first time since before the onset of the 2007-2011 financial crisis. In the rest of the world, particularly in the eurozone and Asia, slowing growth and deflationary trends kept economic policies accommodative in an effort to foster growth. Tepid global
growth, together with deflationary concerns, weighed on long-term interest rates and supported government bond prices. Even in the US and UK, a bias toward central bank tightening had the effect of only flattening yield curves, with short-term government yields rising, while long-dated yields declined, weighed down by slower growth and strong investor demand for high quality yields that both countries offered.
Though developed market yields broadly declined, the fiscal year was marked by considerable interest rate volatility. The fiscal year began on the back of a US bond market rally as slowing global growth and lower inflation helped to push US Treasury yields lower and subsequently,
| | | | |
Portfolio Composition* |
| By security type | | % of total investments |
| |
| Mortgage-Backed Securities | | 37.7% |
| U.S. Dollar Denominated Bonds & Notes | | 25.6 |
Asset-Backed Securities | | 23.5 |
| Non- U.S. Dollar Denominated Bonds & Notes | | 8.2 |
U.S. Treasury Securities | | 1.9 |
Credit-Linked Securities | | 1.5 |
Municipal Obligations | | 1.1 |
| U.S. Government Sponsored Agency Mortgage-Backed Securities | | 0.5 |
| | | | |
Total Net Assets | | $ | 26.0 million | |
| |
Total Number of Holdings* | | | 121 | |
| | | | |
Top 10 Debt Issuers* |
| | % of total net assets |
| | |
1. | | COMM Mortgage Trust | | 4.5% |
2. | | JP Morgan Mortgage Trust | | 4.3 |
3. | | Wells Fargo Mortgage-Backed Securities Trust | | 2.2 |
4. | | International Lease Finance Corp. | | 2.2 |
5. | | WaMu Mortgage Trust | | 2.1 |
6. | | Merrill Lynch Mortgage Investors Trust | | 2.1 |
7. | | Structured Adjustable Rate Mortgage Loan Trust | | 2.0 |
8. | | Fannie Mae Connecticut Avenue Securities | | 1.9 |
9. | | Seneca Park CLO Ltd. | | 1.9 |
10. | | Sudbury Mill CLO Ltd. | | 1.9 |
The Fund’s holdings are subject to change, and there is no assurance that the Fund will continue to hold any particular security.
*Excluding options purchased and money market fund holdings. Data presented here are as of October 31, 2015.
bond prices higher. The down-trend accelerated through the end of 2014 as oil prices hit lows not seen since the height of the financial crisis and as global deflationary fears began to set in. As quickly as US Treasury yields declined in 2014, they snapped back even faster during the first half of 2015. Helping to drive developed market interest rates higher following the implementation of the European Central Bank’s (ECB) version of the Fed’s QE program (commitment by the ECB to purchase longer-dated euro-area fixed income instruments in an effort to lower longer-term interest rates to help spur economic growth) was stronger-than-expected economic data and market players’ notions that the rally was overdone. Also supporting higher US interest rates was the end of the Fed’s QE program purchasing long-dated Treasury bonds, coupled with supportive US economic data in the form of stronger economic growth and employment. The volatility within global interest rate markets ensued as the reporting period drew to a close with concerns over Chinese economic growth, in addition to broader market volatility helping drive global interest rates back down. Ten-year US Treasury yields ended 20 basis points lower at 2.14%, having begun the fiscal year at 2.34%.1 A basis point is one one-hundredth of a percentage point.
Within global credit markets, the investment-grade corporate credit, high yield and emerging market debt sectors were weighed down by slower global growth, increased risk aversion stemming from broader financial market volatility, and credit markets’ fundamental relationship to oil – the price of which declined significantly during the reporting period. Credit spreads across these sectors widened relative to their respective government counterparts, while valuations weakened. Falling oil prices brought into question the credit quality and even the long-term solvency of many high yield issuers, while bonds of oil-producing emerging market countries also experienced market stress. As the reporting period drew to a close, global equity market volatility stemming from concerns over China’s economic slowdown sent credit market spreads and yields to their highest levels since 2012, creating investing opportunities in some segments of the credit markets.
The Fund, at NAV, generated a positive return for the reporting period and outperformed its broad market/style-specific benchmark. One of the largest contributors to the Fund’s performance was sector
4 Invesco Unconstrained Bond
rotation into both high-yield bonds and bank loans toward the end of the reporting period, as these sectors benefited greatly from reduced volatility and a greater appetite for risk by investors. Exposure to structured products, particularly non-agency residential mortgage-backed securities (RMBS) and collateralized loan obligations (CLO) was positive for the Fund’s performance. RMBS benefited from the ongoing improvement in the US housing market while CLO gained in value given institutional demand for their structures and the underlying assets (primarily bank loans) within them. Long US dollar positions versus short developed market currencies, particularly Asian currencies expressed via forward contracts, added value within the Fund as volatile markets led investors to less volatile US dollar-based assets.
One of the greatest detractors from Fund performance for the reporting period was holdings of municipal bonds issued by Puerto Rico. Though these issues were senior in the capital structure and carried less credit risk than much of the commonwealth’s other municipal debt, these issues were stressed and experienced price declines due in part to Puerto Rico’s overall credit default. Exposure to global investment grade (IG) corporate bonds also weighed down on Fund performance. IG corporate bonds were hurt by ongoing strong new issuance as a result of continued heavy mergers and acquisitions, in addition to increased market volatility over the fiscal year. Exposure to emerging market corporate and sovereign bonds also hurt the Fund’s performance as emerging market debt struggled amid the increase in overall market volatility and a decline in risk appetite by investors.
The Fund may use active duration and yield curve positioning for risk management and for attempting to generate excess return versus its broad market/style-specific benchmark. Duration measures a portfolio’s price sensitivity to interest rate changes. Yield curve positioning refers to actively emphasizing particular points (maturities) along the yield curve with favorable risk-return expectations. Duration of the portfolio was largely maintained between one and two years, and the tactical changes made to duration provided a small boost to Fund returns. Buying and selling US Treasury futures and interest rate swaptions were important tools used for the management of interest rate risk and to maintain the Fund’s targeted portfolio duration.
Part of the Fund’s strategy to manage credit and currency risk in the portfolio entailed purchasing and selling credit and
currency derivatives. We attempted to manage credit risk by purchasing and selling protection through credit default swaps at various points throughout the fiscal year. We attempted to manage currency risk by utilizing currency forwards and options on an as-needed and tactical basis. As a result, some of the performance of the strategy, both positive and negative, can be attributed to these instruments. Derivatives can be a cost-effective way to gain exposure to asset classes. However, derivatives may amplify traditional investment risks through the creation of leverage and may be less liquid than traditional securities.
We wish to remind you that the Fund is subject to interest rate risk, meaning when interest rates rise, the value of fixed income securities tend to fall. The risk may be greater in the current market environment because interest rates are at or near historic lows. The degree to which the value of fixed income securities may decline due to rising interest rates may vary depending on the speed and magnitude of the increase in interest rates, as well as individual security characteristics such as price, maturity, duration and coupon, and market forces such as supply and demand for similar securities. The Fund may also invest in senior secured loans, which are an asset class that behaves differently from many traditional fixed income investments. The interest income generated by a portfolio of CLO or asset-backed securities (ABS) structured with, or comprised of senior loans is usually determined by a fixed credit spread over the London Interbank Offered Rate (Libor). Because senior secured loans generally have a very short duration and the coupons or interest rates are usually adjusted every 30 to 90 days as Libor changes, the yield on the portfolio adjusts. Interest rate risk refers to the tendency for traditional fixed income prices to decline when interest rates rise. For senior secured loans, however, interest rates and income are variable and the prices of loans are therefore less sensitive to interest rate changes than traditional fixed income bonds – and senior secured loans provide a natural hedge against rising interest rates. We are monitoring interest rates, and the market, economic and geopolitical factors that may impact the direction, speed and magnitude of changes to interest rates across the maturity spectrum, including the potential impact of monetary policy changes by the Fed and certain foreign central banks. If interest rates rise, markets may experience increased volatility, which may affect the value and/or liquidity of certain of the Fund’s investments.
Thank you for investing in Invesco Unconstrained Bond Fund and for sharing our long-term investment horizon.
1 Source: Bloomberg LP
The views and opinions expressed in management’s discussion of Fund performance are those of Invesco Advisers, Inc. These views and opinions are subject to change at any time based on factors such as market and economic conditions. These views and opinions may not be relied upon as investment advice or recommendations, or as an offer for a particular security. The information is not a complete analysis of every aspect of any market, country, industry, security or the Fund. Statements of fact are from sources considered reliable, but Invesco Advisers, Inc. makes no representation or warranty as to their completeness or accuracy. Although historical performance is no guarantee of future results, these insights may help you understand our investment management philosophy.
See important Fund and, if applicable, index disclosures later in this report.
| | |
 | | Ivan Bakrac Portfolio Manager and Head of Multi-Sector Port- folio Management for Invesco Fixed |
| Portfolio Manager and Head of Multi-Sector Port- folio Management for Invesco Fixed Income, is manager of Invesco Unconstrained Bond Fund. He joined Invesco in 2014. Mr. Bakrac earned a BBA in finance and investments from Baruch College and an MS in financial engineering from Polytechnic Institute of New York University. |
| | |
 | | Ken Hill Chartered Financial Analyst, Portfolio Manager, is manager of Invesco Unconstrained |
| Bond Fund. He joined Invesco in 2013. Mr. Hill graduated summa cum laude with a BSBA in corporate finance and economics from Western Carolina University. He earned his MS in mathematics from Florida State University. |
| | |
 | | Robert Waldner Chartered Financial Analyst, Portfolio Manager, is manager of Invesco Unconstrained |
| Bond Fund. He joined Invesco in 2013. Mr. Waldner earned a BSE degree in civil engineering from Princeton University. |
5 Invesco Unconstrained Bond
Your Fund’s Long-Term Performance
Results of a $10,000 Investment – Oldest Share Class(es) since Inception
Fund and index data from 10/14/14
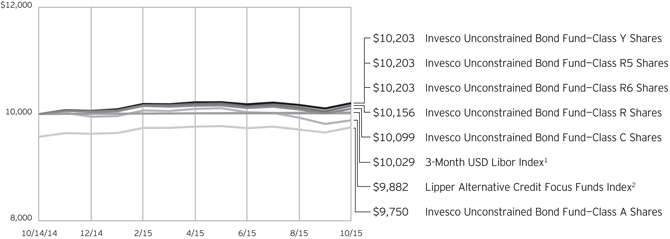
1 Source: Bloomberg LP
2 Source: Lipper Inc.
Past performance cannot guarantee comparable future results.
The data shown in the chart include reinvested distributions, applicable sales charges and Fund expenses including
management fees. Index results include reinvested dividends, but they do not reflect sales charges. Performance of the peer group, if applicable, reflects fund expenses and management fees;
performance of a market index does not. Performance shown in the chart and table(s) does not reflect deduction of taxes a shareholder would pay on Fund distributions or sale of Fund shares.
continued from page 10
| n | | Short position risk. Because a Fund’s potential loss on a short position arises from increases in the value of the asset sold short, the Fund will incur a loss on a short position, which is theoretically unlimited, if the price of the asset sold short increases from the short sale price. The counterparty to a short position or other market factors may prevent the Fund from closing out a short position at a desirable time or price and may reduce or eliminate any gain or result in a loss. In a rising market, the Fund’s short positions will cause the Fund to underperform the overall market and its peers that do not engage in shorting. If the Fund holds both long and short positions, and both positions decline simultaneously, the short positions will not provide any buffer (hedge) from declines in value of the Fund’s long positions. Certain types of short positions involve leverage, which may exaggerate any losses, potentially more than the actual cost of the investment, and will increase the volatility of the Fund’s returns. |
| n | | TBA transactions risk. TBA transactions involve the risk of loss if the securities received are less favorable than what was anticipated by the Fund when entering into the TBA transaction, or if the counterparty fails to deliver the securities. When the Fund enters into a short sale of a TBA mortgage it does not own, the Fund may have to purchase deliverable mortgages to settle the short sale at a higher price than anticipated, thereby causing a loss. As there is no limit on how much the price of mortgage securities can increase, the Fund’s exposure is unlimited. The Fund may not always be able to purchase mortgage securities to close out the short position at a particular time or at an acceptable price. In addition, taking short positions results in a form of leverage, which could increase the volatility of the Fund’s share price. |
| n | | U.S. government obligations risk. Obligations of U.S. government agencies and authorities receive varying levels of support and may not be backed by the full faith and credit of the U.S. government, which could affect the Fund’s |
| | | ability to recover should they default. No assurance can be given that the U.S. government will provide financial support to its agencies and authorities if it is not obligated by law to do so. |
| n | | When-issued, delayed delivery and forward commitment risks. When-issued and delayed delivery transactions subject the Fund to market risk because the value or yield of a security at delivery may be more or less than the purchase price or yield generally available when delivery occurs, and counterparty risk because the Fund relies on the buyer or seller, as the case may be, to consummate the transaction. These transactions also have a leveraging effect on the Fund because the Fund commits to purchase securities that it does not have to pay for until a later date, which increases the Fund’s overall investment exposure and, as a result, its volatility. |
| n | | Zero coupon or pay-in-kind securities risk. The value, interest rates, and liquidity of non-cash paying instruments, such as zero coupon and pay-in-kind securities, are subject to greater |
continued on page 7
6 Invesco Unconstrained Bond
| | | | |
Average Annual Total Returns | |
| As of 10/31/15, including maximum applicable sales charges | |
| |
Class A Shares | | | | |
Inception (10/14/14) | | | -2.39 | % |
1 Year | | | -2.96 | |
| |
Class C Shares | | | | |
Inception (10/14/14) | | | 0.95 | % |
1 Year | | | -0.39 | |
| |
Class R Shares | | | | |
Inception (10/14/14) | | | 1.49 | % |
1 Year | | | 1.15 | |
| |
Class Y Shares | | | | |
Inception (10/14/14) | | | 1.94 | % |
1 Year | | | 1.62 | |
| |
Class R5 Shares | | | | |
Inception (10/14/14) | | | 1.94 | % |
1 Year | | | 1.62 | |
| |
Class R6 Shares | | | | |
Inception (10/14/14) | | | 1.94 | % |
1 Year | | | 1.62 | |
The performance data quoted represent past performance and cannot guarantee comparable future results; current performance may be lower or higher. Please visit invesco.com/performance for the most recent month-end performance. Performance figures reflect reinvested distributions, changes in net asset value and the effect of the maximum sales charge unless otherwise stated. Investment return and principal value
| | | | |
Cumulative Total Returns* | |
| As of 9/30/15, the most recent calendar quarter end, including maximum applicable sales charges | |
| |
Class A Shares | | | | |
Inception (10/14/14) | | | -3.42 | % |
| |
Class C Shares | | | | |
Inception (10/14/14) | | | -0.88 | % |
| |
Class R Shares | | | | |
Inception (10/14/14) | | | 0.51 | % |
| |
Class Y Shares | | | | |
Inception (10/14/14) | | | 1.04 | % |
| |
Class R5 Shares | | | | |
Inception (10/14/14) | | | 1.04 | % |
| |
Class R6 Shares | | | | |
Inception (10/14/14) | | | 1.04 | % |
| * | Cumulative total returns that have not yet been annualized. |
will fluctuate so that you may have a gain or loss when you sell shares.
The net annual Fund operating expense ratio set forth in the most recent Fund prospectus as of the date of this report for Class A, Class C, Class R, Class Y, Class R5 and Class R6 shares was 1.09%, 1.84%, 1.34%, 0.84% 0.84% and 0.84%, respectively.1,2 The total annual Fund operating expense ratio set forth in the most recent Fund prospectus as of the date of this report for Class A, Class C, Class R, Class Y, Class R5 and Class R6 shares was 2.09%, 2.84%, 2.34%, 1.84%, 1.93% and 1.88%, respectively. The expense ratios presented
above may vary from the expense ratios presented in other sections of this report that are based on expenses incurred during the period covered by this report.
Class A share performance reflects the maximum 4.25% sales charge, and Class C share performance reflects the applicable contingent deferred sales charge (CDSC) for the period involved. The CDSC on Class C shares is 1% for the first year after purchase. Class R, Class Y, Class R5 and Class R6 shares do not have a front-end sales charge or a CDSC; therefore, performance is at net asset value.
The performance of the Fund’s share classes will differ primarily due to different sales charge structures and class expenses.
Fund performance reflects any applicable fee waivers and/or expense reimbursements. Had the adviser not waived fees and/or reimbursed expenses currently or in the past, returns would have been lower. See current prospectus for more information.
| 1 | Total annual Fund operating expenses after any contractual fee waivers and/or expense reimbursements by the adviser in effect through at least February 28, 2017. See current prospectus for more information. |
2 Total annual Fund operating expenses after any contractual fee waivers and/or expense reimbursements by the adviser in effect through at least June 30, 2017. See current prospectus for more information.
continued from page 6
fluctuation than other types of securities. The higher yields and interest rates on pay-in-kind securities reflect the payment deferral and increased credit risk associated with such instruments and that such investments may represent a higher credit risk than loans that periodically pay interest
About indexes used in this report
| n | | The 3-Month USD Libor Index is unmanaged index considered representative of the average interest rate at which a selection of banks in London are prepared to lend to one another in American dollars with a maturity of three months. |
| n | | The Lipper Alternative Credit Focus Funds Index is an unmanaged index considered representative of funds that invests in a wide-range of credit-structured |
| | | vehicles by using either fundamental credit research analysis or quantitative credit portfolio modelling trying to benefit from any changes in credit quality, credit spreads, and market liquidity. |
| n | | The Fund is not managed to track the performance of any particular index, including the index(es) described here, and consequently, the performance of the Fund may deviate significantly from the performance of the index(es). |
| n | | A direct investment cannot be made in an index. Unless otherwise indicated, index results include reinvested dividends, and they do not reflect sales charges. Performance of the peer group, if applicable, reflects fund expenses; performance of a market index does not. |
Other information
| n | | The returns shown in management’s discussion of Fund performance are based on net asset values (NAVs) calculated for shareholder transactions. Generally accepted accounting principles require adjustments to be made to the net assets of the Fund at period end for financial reporting purposes, and as such, the NAVs for shareholder transactions and the returns based on those NAVs may differ from the NAVs and returns reported in the Financial Highlights. |
| n | | Industry classifications used in this report are generally according to the Global Industry Classification Standard, which was developed by and is the exclusive property and a service mark of MSCI Inc. and Standard & Poor’s. |
7 Invesco Unconstrained Bond
Invesco Unconstrained Bond Fund’s investment objective is to provide a positive absolute return over a full market cycle.
| n | | Unless otherwise stated, information presented in this report is as of October 31, 2015, and is based on total net assets. |
| n | | Unless otherwise noted, all data provided by Invesco. |
| n | | To access your Fund’s reports/prospectus, visit invesco.com/fundreports. |
About share classes
| n | | Class R shares are generally available only to employer sponsored retirement and benefit plans. Please see the prospectus for more information. |
| n | | Class Y shares are available only to certain investors. Please see the prospectus for more information. |
| n | | Class R5 shares and Class R6 shares are primarily intended for employer sponsored retirement and benefit plans that meet certain standards and for institutional investors. Please see the prospectus for more information. |
Principal risks of investing in the Fund
| n | | Active trading risk. The Fund engages in frequent trading of portfolio securities. Active trading results in added expenses and may result in a lower return and increased tax liability. |
| n | | Bank loan risk. There are a number of risks associated with an investment in bank loans including credit risk, interest rate risk, liquidity risk and prepayment risk. Lack of an active trading market, restrictions on resale, irregular trading activity, wide bid/ask spreads and extended trade settlement periods may impair the Fund’s ability to sell bank loans within its desired time frame or at an acceptable price and its ability to accurately value existing and prospective investments. Extended trade settlement periods may result in cash not being immediately available to the Fund. As a result of such illiquidity, the Fund may have to sell other investments or engage in borrowing transactions to raise cash to meet its obligations. The risk of holding bank loans is also directly tied to the risk of insolvency or bankruptcy of the issuing banks. These risks could cause the Fund to lose income or principal on a particular investment, which in turn could affect the Fund’s returns. The value of bank loans can be affected by and sensitive to changes in government regulation and to economic downturns in the United |
| | | States and abroad. Bank loans generally are floating rate loans, which are subject to interest rate risk as the interest paid on the floating rate loans adjusts periodically based on changes in widely accepted reference rates. |
| n | | Changing fixed income market conditions risk. The current historically low interest rate environment was created in part by the Federal Reserve Board (FRB) and certain foreign central banks keeping the federal funds and equivalent foreign rates at or near zero. There is a risk that interest rates will rise when the FRB and central banks raise these rates. This risk is heightened due to the completion of the FRB’s quantitative easing program and the “tapering” of other similar foreign central bank actions. This eventual increase in the federal funds and equivalent foreign rates may expose fixed income markets to heightened volatility and reduced liquidity for certain fixed income investments, particularly those with longer maturities. In addition, decreases in fixed income dealer market-making capacity may also potentially lead to heightened volatility and reduced liquidity in the fixed income markets. As a result, the value of the Fund’s investments and share price may decline. Changes in central bank policies could also result in higher than normal shareholder redemptions, which could potentially increase portfolio turnover and the Fund’s transaction costs. |
| n | | Collateralized loan obligations risk. CLOs are subject to the risks of substantial losses due to actual defaults by underlying borrowers, which will be greater during periods of economic or financial stress. CLOs may also lose value due to collateral defaults and disappearance of subordinate tranches, market anticipation of defaults, and investor aversion to CLO securities as a class. The risks of CLOs will be greater if the Fund invests in CLOs that hold loans of uncreditworthy borrowers or if the Fund holds subordinate tranches of |
the CLO that absorbs losses from the defaults before senior tranches. In addition, CLOs are subject to interest rate risk and credit risk. The risks related to investments in CLOs are greater for this Fund than for many other mutual funds because the Fund maintains the ability to invest, at any time and from time to time, up to 100% of its assets in such securities. If the Fund’s portfolio managers increase the Fund’s investments in CLOs at an inopportune time, the Fund could suffer significant losses.
| n | | Convertible securities risk. The market values of convertible securities are affected by market interest rates, the risk of actual issuer default on interest or principal payments and the value of the underlying common stock into which the convertible security may be converted. Additionally, a convertible security is subject to the same types of market and issuer risks as apply to the underlying common stock. In addition, certain convertible securities are subject to involuntary conversions and may undergo principal write-downs upon the occurrence of certain triggering events, and, as a result, are subject to an increased risk of loss. |
| n | | Debt securities risk. The prices of debt securities held by the Fund will be affected by changes in interest rates, the creditworthiness of the issuer and other factors. An increase in prevailing interest rates typically causes the value of existing debt securities to fall and often has a greater impact on longer-duration debt securities and higher quality debt securities. Falling interest rates will cause the Fund to reinvest the proceeds of debt securities that have been repaid by the issuer at lower interest rates. Falling interest rates may also reduce the Fund’s distributable income because interest payments on floating rate debt instruments held by the Fund will decline. The Fund could lose money on investments in debt securities if the issuer or borrower fails to meet its obligations to make interest payments and/or to repay principal in a timely manner. Changes in an issuer’s financial strength, the market’s perception of such strength or in the credit rating of the issuer or the security may affect the value of debt securities. The Adviser’s |
| | | | |
This report must be accompanied or preceded by a currently effective Fund prospectus, which contains more complete information, including sales charges and expenses. Investors should read it carefully before investing. | | |
NOT FDIC INSURED | MAY LOSE VALUE | NO BANK GUARANTEE | | |
8 Invesco Unconstrained Bond
| | credit analysis may fail to anticipate such changes, which could result in buying a debt security at an inopportune time or failing to sell a debt security in advance of a price decline or other credit event. |
| n | | Derivatives risk. The value of a derivative instrument depends largely on (and is derived from) the value of an underlying security, currency, commodity, interest rate, index or other asset (each referred to as an underlying asset). In addition to risks relating to the underlying assets, the use of derivatives may include other, possibly greater, risks, including counterparty, leverage and liquidity risks. Counterparty risk is the risk that the counterparty to the derivative contract will default on its obligation to pay the Fund the amount owed or otherwise perform under the derivative contract. Derivatives create leverage risk because they do not require payment up front equal to the economic exposure created by owning the derivative. As a result, an adverse change in the value of the underlying asset could result in the Fund sustaining a loss that is substantially greater than the amount invested in the derivative, which may make the Fund’s returns more volatile and increase the risk of loss. Derivative instruments may also be less liquid than more traditional investments and the Fund may be unable to sell or close out its derivative positions at a desirable time or price. This risk may be more acute under adverse market conditions, during which the Fund may be most in need of liquidating its derivative positions. Derivatives may also be harder to value, less tax efficient and subject to changing government regulation that could impact the Fund’s ability to use certain derivatives or their cost. Also, derivatives used for hedging or to gain or limit exposure to a particular market segment may not provide the expected benefits, particularly during adverse market conditions. These risks are greater for the Fund than mutual funds that do not use derivative instruments or that use derivative instruments to a lesser extent than the Fund to implement their investment strategy. |
| n | | Emerging markets securities risk. Emerging markets (also referred to as developing markets) are generally subject to greater market volatility, political, social and economic instability, uncertain trading markets and more governmental limitations on foreign investment than more developed markets. In addition, companies operating in emerging markets may be subject to lower trading volume and greater price fluctuations than companies in more developed markets. Securities law and the enforcement of systems of taxation in many emerging market countries may change quickly and unpredictably. In addition, investments in emerging markets securities may also be subject to additional transaction costs, delays in settlement procedures, and lack of timely information. |
| n | | Exchange-traded funds risk. In addition to the risks associated with the underlying assets held by the exchange-traded fund, investments in exchange-traded funds are subject to the following additional risks: (1) an exchange-traded fund’s shares may trade above or below its net asset value; (2) an active trading market for the exchange-traded fund’s shares may not develop or be maintained; (3) trading an exchange-traded fund’s shares may be halted by the listing exchange; (4) a passively managed exchange-traded fund may not track the performance of the reference asset; and (5) a passively managed exchange-traded fund may hold troubled securities. Investment in exchange-traded funds may involve duplication of management fees and certain other expenses, as the Fund indirectly bears its proportionate share of any expenses paid by the exchange-traded funds in which it invests. Further, certain exchange-traded funds in which the Fund may invest are leveraged, which may result in economic leverage, permitting the Fund to gain exposure that is greater than would be the case in an unlevered instrument and potentially resulting in greater volatility. |
| n | | Foreign currency tax risk. If the U.S. Treasury Department were to exercise its authority to issue regulations that exclude from the definition of “qualifying income” foreign currency gains not |
| | | directly related to the Fund’s business of investing in securities, the Fund may be unable to qualify as a regulated investment company for one or more years. In this event, the Fund’s Board of Trustees may authorize a significant change in investment strategy or other action. |
| n | | Foreign government debt risk. Investments in foreign government debt securities (sometimes referred to as sovereign debt securities) involve certain risks in addition to those relating to foreign securities or debt securities generally. The issuer of the debt or the governmental authorities that control the repayment of the debt may be unable or unwilling to repay principal or interest when due in accordance with the terms of such debt, and the Fund may have limited recourse in the event of a default against the defaulting government. Without the approval of debt holders, some governmental debtors have in the past been able to reschedule or restructure their debt payments or declare moratoria on payments. |
| n | | Foreign securities risk. The Fund’s foreign investments may be adversely affected by political and social instability, changes in economic or taxation policies, difficulty in enforcing obligations, decreased liquidity or increased volatility. Foreign investments also involve the risk of the possible seizure, nationalization or expropriation of the issuer or foreign deposits (in which the Fund could lose its entire investments in a certain market) and the possible adoption of foreign governmental restrictions such as exchange controls. Unless the Fund has hedged its foreign securities risk, foreign securities risk also involves the risk of negative foreign currency rate fluctuations, which may cause the value of securities denominated in such foreign currency (or other instruments through which the Fund has exposure to foreign currencies) to decline in value. Currency exchange rates may fluctuate significantly over short periods of time. Currency hedging strategies, if used, are not always successful. |
| n | | High yield debt securities (junk bond) risk. Investments in high yield debt securities (“junk bonds”) and other lower-rated |
9 Invesco Unconstrained Bond
continued from page 9
| | | securities will subject the Fund to substantial risk of loss. These securities are considered to be speculative with respect to the issuer’s ability to pay interest and principal when due, are more susceptible to default or decline in market value and are less liquid than investment grade debt securities. Prices of high yield debt securities tend to be very volatile. |
| n | | Inflation-indexed securities risk. The values of inflation-indexed securities generally fluctuate in response to changes in real interest rates, and the Fund’s income from its investments in these securities is likely to fluctuate considerably more than the income distributions of its investments in more traditional fixed-income securities. |
| n | | Investment companies risk. Investing in other investment companies could result in the duplication of certain fees, including management and administrative fees, and may expose the Fund to the risks of owning the underlying investments that the other investment company holds. |
| n | | Liquidity risk. The Fund may be unable to sell illiquid investments at the time or price it desires and, as a result, could lose its entire investment in such investments. Liquid securities can become illiquid during periods of market stress. If a significant amount of the Fund’s securities become illiquid, the Fund may not be able to timely pay redemption proceeds and may need to sell securities at significantly reduced prices. |
| n | | Management risk. The Fund is actively managed and depends heavily on the Adviser’s judgment about markets, interest rates or the attractiveness, relative values, liquidity, or potential appreciation of particular investments made for the Fund’s portfolio. The Fund could experience losses if these judgments prove to be incorrect. Because the Fund’s investment process relies heavily on its asset allocation process, market movements that are counter to the portfolio managers’ expectations may have a significant adverse effect on the Fund’s net asset value. Additionally, legislative, regulatory, or tax developments may adversely affect management of the Fund and, therefore, the ability of the Fund to achieve its investment objective. |
| n | | Market risk. The market values of the Fund’s investments, and therefore the value of the Fund’s shares, will go up |
| | | and down, sometimes rapidly or unpredictably. Market risk may affect a single issuer, industry or section of the economy, or it may affect the market as a whole. Individual stock prices tend to go up and down more dramatically than those of certain other types of investments, such as bonds. During a general downturn in the financial markets, multiple asset classes may decline in value. When markets perform well, there can be no assurance that specific investments held by the Fund will rise in value. |
| n | | Mortgage- and asset-backed securities risk. Mortgage- and asset-backed securities, including collateralized debt obligations and collateralized mortgage obligations, are subject to prepayment or call risk, which is the risk that a borrower’s payments may be received earlier or later than expected due to changes in prepayment rates on underlying loans. This could result in the Fund reinvesting these early payments at lower interest rates, thereby reducing the Fund’s income. Mortgage- and asset-backed securities also are subject to extension risk, which is the risk that an unexpected rise in interest rates could reduce the rate of prepayments, causing the price of the mortgage- and asset-backed securities and the Fund’s share price to fall. An unexpectedly high rate of defaults on the mortgages held by a mortgage pool may adversely affect the value of mortgage-backed securities and could result in losses to the Fund. The Fund may invest in mortgage pools that include subprime mortgages, which are loans made to borrowers with weakened credit histories or with lower capacity to make timely payments on their mortgages. Privately issued mortgage-related securities are not subject to the same underwriting requirements as those with government or government-sponsored entity guarantee and, therefore, mortgage loans underlying privately issued mortgage-related securities may have less favorable collateral, credit risk or other underwriting characteristics, and wider variances in interest rate, term, size, purpose and borrower characteristics. The risks related to investments in agency and non-agency mortgage-backed securities and CMOs are greater for this Fund than for many other mutual funds because the Fund maintains the ability to invest, at any time and from time to time, up to 100% of |
| | | its assets in such securities. If the Fund’s portfolio managers increase the Fund’s investments in agency and non-agency mortgage-backed securities at an inopportune time, the Fund could suffer significant losses. |
| n | | Municipal securities risk. The risk of a municipal obligation generally depends on the financial and credit status of the issuer. Constitutional amendments, legislative enactments, executive orders, administrative regulations, voter initiatives, and the issuer’s regional economic conditions may affect the municipal security’s value, interest payments, repayment of principal and the Fund’s ability to sell the security. Failure of a municipal security issuer to comply with applicable tax requirements may make income paid thereon taxable, resulting in a decline in the security’s value. In addition, there could be changes in applicable tax laws or tax treatments that reduce or eliminate the current federal income tax exemption on municipal securities or otherwise adversely affect the current federal or state tax status of municipal securities. |
| n | | Non-diversification risk. The Fund is non-diversified and can invest a greater portion of its assets in the obligations or securities of a small number of issuers or any single issuer than a diversified fund can. A change in the value of one or a few issuers’ securities will therefore affect the value of the Fund more than if it was a diversified fund. |
| n | | Reverse repurchase agreement risk. If the market value of securities to be repurchased declines below the repurchase price, or the other party defaults on its obligation, the Fund may be delayed or prevented from completing the transaction. In the event the buyer of securities under a reverse repurchase agreement files for bankruptcy or becomes insolvent, the Fund’s use of the proceeds from the sale of the securities may be restricted. When the Fund engages in reverse repurchase agreements, changes in the value of the Fund’s investments will have a larger effect on its share price than if it did not engage in these transactions due to the effect of leverage, which will make the Fund’s returns more volatile and increase the risk of loss. Additionally, interest expenses related to reverse repurchase agreements could exceed the rate of return on other investments held by the Fund, thereby reducing returns to shareholders. |
10 Invesco Unconstrained Bond
Schedule of Investments(a)
October 31, 2015
| | | | | | | | |
| | | Principal
Amount | | | Value | |
Asset-Backed Securities–61.39% | |
Apidos CLO XIX (Cayman Islands), Series 2014-19A, Class C, Floating Rate Pass Through Ctfs. 3.61%, 10/17/26(b)(c) | | $ | 500,000 | | | $ | 494,635 | |
Banc of America Commercial Mortgage Trust,
Series 2015-UBS7, Class B, Variable Rate Pass Through Ctfs., 4.51%, 09/15/48(c) | | | 130,000 | | | | 136,601 | |
Series 2015-UBS7, Class XA, Variable Rate Pass Through Ctfs., 1.09%, 09/15/48(c) | | | 1,418,674 | | | | 93,613 | |
Banc of America Funding Trust, Series 2005-D, Class A1, Floating Rate Pass Through Ctfs., 2.73%, 05/25/35(c) | | | 144,990 | | | | 148,093 | |
Banc of America Mortgage Trust, Series 2005-H, Class 2A1, Floating Rate Pass Through Ctfs., 2.85%, 09/25/35(c) | | | 263,270 | | | | 243,130 | |
BCAP Trust LLC., Series 2009-RR13, Class15A2, Pass Through Ctfs., 6.00%, 07/26/37(b) | | | 127,574 | | | | 127,099 | |
Bear Stearns Adjustable Rate Mortgage Trust, Series 2005-2, Class A1, Floating Rate Pass Through Ctfs., 2.68%, 03/25/35(c) | | | 184,462 | | | | 185,617 | |
Carlyle Global Market Strategies CLO Ltd. (Cayman Islands),
Series 2012-2AR, Class ER, Floating Rate Pass Through Ctfs., 6.42%, 07/20/23(b)(c) | | | 300,000 | | | | 293,270 | |
Series 2012-3A, Class D, Floating Rate Pass Through Ctfs., 5.82%, 10/04/24(b)(c) | | | 300,000 | | | | 284,306 | |
CDGJ Commercial Mortgage Trust, Series 2014-BXCH, Class A, Floating Rate Pass Through Ctfs., 1.60%, 12/15/27(b)(c) | | | 200,000 | | | | 199,496 | |
Cent CLO Ltd. (Cayman Islands), Series 2013-19A, Class C, Floating Rate Pass Through Ctfs., 3.62%, 10/29/25(b)(c) | | | 250,000 | | | | 228,356 | |
Cerberus Onshore II CLO-2 LLC, Series 2014-1A, Class D, Floating Rate Pass Through Ctfs., 4.43%, 10/15/23(b)(c) | | | 350,000 | | | | 341,592 | |
Chase Mortgage Finance Trust, Series 2007-A1, Class 13A1, Floating Rate Pass Through Ctfs., 4.90%, 03/25/37(c) | | | 227,172 | | | | 213,075 | |
Citigroup Commercial Mortgage Trust, Series 2014-388G, Class C, Floating Rate Pass Through Ctfs., 1.60%, 06/15/33(b)(c) | | | 300,000 | | | | 295,308 | |
| | | | | | | | |
| | | Principal
Amount | | | Value | |
Citigroup Mortgage Loan Trust Inc., Series 2005-11, Class A2A, Floating Rate Pass Through Ctfs., 2.73%, 10/25/35(c) | | $ | 161,127 | | | $ | 160,036 | |
Series 2005-3, Class 2A2A, Floating Rate Pass Through Ctfs., 2.71%, 08/25/35(c) | | | 159,496 | | | | 158,668 | |
COMM Mortgage Trust, Series 2014-FL5, Class A, Floating Rate Pass Through Ctfs., 1.57%, 10/15/31(b)(c) | | | 300,000 | | | | 299,546 | |
Series 2015-CR24, Class B, Variable Rate Pass Through Ctfs., 4.52%, 08/10/55(c) | | | 300,000 | | | | 309,781 | |
Series 2015-CR24, Class XA, Variable Rate Pass Through Ctfs., 1.04%, 08/10/55(c) | | | 3,793,417 | | | | 236,784 | |
Series 2015-CR25, Class B, Variable Rate Pass Through Ctfs., 4.70%, 08/10/48(c) | | | 130,000 | | | | 134,868 | |
Series 2015-PC1, Class XA, Variable Rate Pass Through Ctfs., 0.95%, 07/10/50(b)(c) | | | 3,993,968 | | | | 196,352 | |
Credit Suisse First Boston Mortgage Securities Corp.,
Series 2005-10, Class 5A7, Pass Through Ctfs., 6.00%, 11/25/35 | | | 122,718 | | | | 117,257 | |
Series 2005-C3, Class AJ, Pass Through Ctfs., 4.77%, 07/15/37 | | | 5,365 | | | | 5,363 | |
CSAIL Commercial Mortgage Trust, Series 2015-C1, Class B, Pass Through Ctfs., 4.04%, 04/15/50 | | | 130,000 | | | | 131,211 | |
Fannie Mae Connecticut Avenue Securities, Series 2015-C01, Class 1M2, Floating Rate Pass Through Ctfs., 4.50%, 02/25/25(c) | | | 130,000 | | | | 125,572 | |
Series 2015-C02, Class 2M2, Floating Rate Pass Through Ctfs., 4.20%, 05/25/25(c) | | | 400,000 | | | | 379,640 | |
GMACM Mortgage Loan Trust, Series 2005-AR6, Class 4A1, Floating Rate Pass Through Ctfs., 3.17%, 11/19/35(c) | | | 91,189 | | | | 82,913 | |
GS Mortgage Securities Trust, Series 2015-GC32, Class B, Variable Rate Pass Through Ctfs., 4.55%, 07/10/48(c) | | | 150,000 | | | | 158,272 | |
GSAA Home Equity Trust, Series 2005-11, Class 3A5, Floating Rate Pass Through Ctfs., 0.57%, 10/25/35(c) | | | 230,339 | | | | 213,587 | |
GSR Mortgage Loan Trust,
Series 2005-AR7, Class 6A1, Floating Rate Pass Through Ctfs., 2.94%, 11/25/35(c) | | | 209,507 | | | | 202,335 | |
Series 2006 1F, Class 1A11, Pass Through Ctfs., 5.50%, 02/25/36 | | | 201,588 | | | | 193,437 | |
See accompanying Notes to Financial Statements which are an integral part of the financial statements.
11 Invesco Unconstrained Bond Fund
| | | | | | | | |
| | | Principal
Amount | | | Value | |
H/2 Asset Funding (Cayman Islands), Series 2015-1A, Class BFL, Pass Through Ctfs., 2.49%, 06/24/49(b) | | $ | 200,000 | | | $ | 195,956 | |
Highbridge Loan Management CLO Ltd. (Cayman Islands), Series 2015-6A, Class D, Floating Rate Pass Through Ctfs., 3.95%, 05/05/27(b)(c) | | | 250,000 | | | | 227,816 | |
ING IM CLO Ltd. (Cayman Islands), Series 2012-1, Class A2R, Floating Rate Pass Through Ctfs., 2.19%, 03/14/22(b)(c)(d) | | | 500,000 | | | | 495,050 | |
JP Morgan Chase Commercial Mortgage Securities Trust, Series 2014-C20, Class B, Pass Through Ctfs., 4.40%, 07/15/47 | | | 300,000 | | | | 310,432 | |
JP Morgan Mortgage Trust, Series 2005-A3, Class 7CA1, Floating Rate Pass Through Ctfs.,
2.60%, 06/25/35(c) | | | 305,319 | | | | 297,908 | |
Series 2007-A1, Class 2A2, Floating Rate Pass Through Ctfs., 2.64%, 07/25/35(c) | | | 313,982 | | | | 308,548 | |
Series 2007-A1, Class 5A5, Floating Rate Pass Through Ctfs., 2.69%, 07/25/35(c) | | | 170,608 | | | | 174,003 | |
Series 2007-A1, Class 6A1, Floating Rate Pass Through Ctfs., 2.60%, 07/25/35(c) | | | 140,276 | | | | 139,174 | |
Series 2007-A2, Class 4A2, Floating Rate Pass Through Ctfs., 4.88%, 04/25/37(c) | | | 232,312 | | | | 210,654 | |
LB-UBS Commercial Mortgage Trust, Series 2005-C7, Class AJ, Pass Through Ctfs., 5.32%, 11/15/40 | | | 28,358 | | | | 28,392 | |
Magnetite CLO Ltd. (Cayman Islands), Series 2015-15A, Class D, Floating Rate Pass Through Ctfs., 4.32%, 10/25/27(b)(c) | | | 250,000 | | | | 237,345 | |
Merrill Lynch Mortgage Investors Trust, Series 2005-3, Class 3A, Floating Rate Pass Through Ctfs., 2.29%, 11/25/35(c) | | | 122,500 | | | | 120,346 | |
Series 2005-A5, Class A9, Floating Rate Pass Through Ctfs., 2.57%, 06/25/35(c) | | | 165,403 | | | | 162,022 | |
Series 2005-A9, Class 2A1C, Floating Rate Pass Through Ctfs., 2.66%, 12/25/35(c) | | | 260,000 | | | | 251,638 | |
Morgan Stanley Bank of America Merrill Lynch Trust,
Series 2015-C26, Class C, Pass Through Ctfs., 4.41%, 11/15/48 | | | 130,000 | | | | 129,507 | |
Series 2015-C22, Class XA, Variable Rate Pass Through Ctfs., 1.33%, 04/15/48(c) | | | 1,662,168 | | | | 124,408 | |
Series 2015-C25, Class B, Pass Through Ctfs., 4.68%, 10/15/48 | | | 130,000 | | | | 134,518 | |
| | | | | | | | |
| | | Principal
Amount | | | Value | |
Morgan Stanley Mortgage Loan Trust, Series 2005-10, Class A1A, Floating Rate Pass Through Ctfs., 0.90%, 12/25/35(c) | | $ | 228,736 | | | $ | 186,159 | |
Series 2005-3AR, Class 3A, Floating Rate Pass Through Ctfs., 2.57%, 07/25/35(c) | | | 222,945 | | | | 193,017 | |
Northwoods Capital X CLO Ltd. (Cayman Islands), Series 2013-10A, Class D, Floating Rate Pass Through Ctfs., 3.91%, 11/04/25(b)(c) | | | 250,000 | | | | 228,449 | |
Octagon Investment Partners XVIII CLO Ltd. (Cayman Islands), Series 2013-1A, Class D, Floating Rate Pass Through Ctfs., 5.57%, 12/16/24(b)(c) | | | 250,000 | | | | 218,051 | |
Octagon Investment Partners XXI CLO Ltd. (Cayman Islands), Series 2014-1A, Class D, Floating Rate Pass Through Ctfs., 6.88%, 11/14/26(b)(c) | | | 250,000 | | | | 235,437 | |
PFP Ltd. (Cayman Islands), Series 2015-2, Class B, Floating Rate Pass Through Ctfs., 2.89%, 07/14/34(b)(c) | | | 188,000 | | | | 187,662 | |
Regatta IV Funding CLO Ltd. (Cayman Islands), Series 2014-1A, Class D, Floating Rate Pass Through Ctfs., 3.82%, 07/25/26(b)(c) | | | 310,000 | | | | 280,978 | |
RMAT LLC., Series 2015-RPL1, Class A1, Floating Rate Pass Through Ctfs. 3.97%, 05/26/20(b)(c) | | | 191,780 | | | | 192,569 | |
Seneca Park CLO Ltd. (Cayman Islands), Series 2014-1A, Class B2, Pass Through Ctfs., 4.35%, 07/17/26(b) | | | 500,000 | | | | 505,139 | |
Starwood Retail Property Trust, Series 2014-STAR, Class B, Floating Rate Pass Through Ctfs., 1.85%, 11/15/27(b)(c) | | | 250,000 | | | | 248,690 | |
Stone Tower CLO VII Ltd. (Cayman Islands), Series 2007-7A, Class C, Floating Rate Pass Through Ctfs., 4.54%, 08/30/21(b)(c) | | | 250,000 | | | | 249,103 | |
Structured Adjustable Rate Mortgage Loan Trust,
Series 2004-20, Class 1A2, Floating Rate Pass Through Ctfs., 2.47%, 01/25/35(c) | | | 333,573 | | | | 321,123 | |
Series 2004-20, Class 3A1, Floating Rate Pass Through Ctfs., 2.45%, 01/25/35(c) | | | 201,190 | | | | 192,351 | |
Sudbury Mill CLO Ltd. (Cayman Islands), Series 2013-1A, Class B1, Floating Rate Pass Through Ctfs., 2.52%, 01/17/26(b)(c) | | | 500,000 | | | | 495,944 | |
Symphony CLO XI Ltd. (Cayman Islands), Series 2013-11A, Class C, Floating Rate Pass Through Ctfs., 3.47%, 01/17/25(b)(c) | | | 250,000 | | | | 247,757 | |
Series 2013-11A, Class D, Floating Rate Pass Through Ctfs., 4.32%, 01/17/25(b)(c) | | | 250,000 | | | | 239,364 | |
See accompanying Notes to Financial Statements which are an integral part of the financial statements.
12 Invesco Unconstrained Bond Fund
| | | | | | | | |
| | | Principal
Amount | | | Value | |
Trimaran CLO VII Ltd. (Cayman Islands), Series 2007-1A, Class B2L, Floating Rate Pass Through Ctfs., 3.74%, 06/15/21(b)(c) | | $ | 250,000 | | | $ | 242,935 | |
WaMu Mortgage Trust, Series 2006-AR14, Class 1A4, Floating Rate Pass Through Ctfs., 2.02%, 11/25/36(c) | | | 113,546 | | | | 101,342 | |
Series 2007-HY1, Class 3A1, Floating Rate Pass Through Ctfs., 4.34%, 02/25/37(c) | | | 238,018 | | | | 221,362 | |
Series 2007-HY2, Class 2A1, Floating Rate Pass Through Ctfs., 2.54%, 11/25/36(c) | | | 260,011 | | | | 230,006 | |
Wells Fargo Commercial Mortgage Trust, Series 2014-C24, Class B, Pass Through Ctfs., 4.20%, 11/15/47 | | | 250,000 | | | | 255,467 | |
Series 2015-LC22, Class B, Variable Rate Pass Through Ctfs., 4.69%, 09/15/58(c) | | | 180,000 | | | | 189,200 | |
Wells Fargo Mortgage Backed Securities Trust,
Series 2005-AR10, Class 2A4, Floating Rate Pass Through Ctfs., 2.71%, 06/25/35(c) | | | 31,124 | | | | 31,415 | |
Series 2005-AR14, Class A1, Floating Rate Pass Through Ctfs., 2.74%, 08/25/35(c) | | | 208,865 | | | | 206,903 | |
Series 2005-AR16, Class 4A2, Floating Rate Pass Through Ctfs., 2.74%, 10/25/35(c) | | | 216,350 | | | | 216,477 | |
Series 2006-2, Class 2A3, Pass Through Ctfs., 5.50%, 03/25/36 | | | 134,740 | | | | 130,096 | |
Total Asset-Backed Securities
(Cost 16,022,018) | | | | | | | 15,984,526 | |
|
U.S. Dollar Denominated Bonds & Notes–25.67% | |
| Aerospace & Defense–0.50% | |
Embraer S.A. (Brazil), Sr. Unsec. Global Notes, 5.15%, 06/15/22 | | | 130,000 | | | | 128,983 | |
|
| Automotive Retail–1.25% | |
CST Brands, Inc., Sr. Unsec. Gtd. Global Notes, 5.00%, 05/01/23 | | | 320,000 | | | | 326,000 | |
|
| Cable & Satellite–1.47% | |
CCO Safari II, LLC,
Sr. Sec. First Lien Notes, 3.58%, 07/23/20(b) | | | 55,000 | | | | 55,394 | |
Sr. Sec. Gtd. First Lien Notes, 4.91%, 07/23/25(b) | | | 130,000 | | | | 132,583 | |
VTR Finance B.V. (Chile), Sr. Sec. First Lien Notes, 6.88%, 01/15/24(b) | | | 200,000 | | | | 194,000 | |
| | | | | | | | 381,977 | |
|
| Communications Equipment–0.28% | |
Avaya Inc., Sr. Sec. Gtd. First Lien Notes, 7.00%, 04/01/19(b) | | | 90,000 | | | | 73,575 | |
|
| Construction Materials–0.29% | |
Building Materials Corp. of America, Sr. Unsec. Notes, 5.38%, 11/15/24(b) | | | 72,000 | | | | 74,520 | |
| | | | | | | | |
| | | Principal
Amount | | | Value | |
| Consumer Finance–1.27% | |
Synchrony Financial, Sr. Unsec. Global Notes, 4.50%, 07/23/25 | | $ | 325,000 | | | $ | 330,991 | |
|
| Diversified Banks–6.54% | |
Citigroup Inc., Series Q, Jr. Unsec. Sub. Global Notes, 5.95%(e) | | | 130,000 | | | | 130,325 | |
Industrial & Commercial Bank of China Ltd. (China), Unsec. Sub. Notes, 4.88%, 09/21/25(b) | | | 260,000 | | | | 263,947 | |
JPMorgan Chase & Co., Series Z, Jr. Unsec. Sub. Global Notes, 5.30%(e) | | | 130,000 | | | | 130,813 | |
Skandinaviska Enskilda Banken AB (Sweden), REGS, Jr. Unsec. Sub. Medium-Term Euro Notes, 5.75%(b)(e) | | | 400,000 | | | | 394,000 | |
Svenska Handelsbanken AB (Sweden), REGS, Jr. Unsec. Sub. Euro Bonds, 5.25%(b)(e) | | | 400,000 | | | | 387,088 | |
Swedbank AB (Sweden), REGS, Jr. Unsec. Sub. Euro Bonds,
5.50%(b)(e) | | | 400,000 | | | | 397,000 | |
| | | | | | | | 1,703,173 | |
|
| Home Furnishings–0.50% | |
Tempur Sealy International, Inc., Sr. Unsec. Gtd. Notes, 5.63%, 10/15/23(b) | | | 125,000 | | | | 131,250 | |
|
| Homebuilding–1.92% | |
K. Hovnanian Enterprises Inc., Sr. Sec. Gtd. First Lien Notes, 7.25%, 10/15/20(b) | | | 256,000 | | | | 241,280 | |
KB Home, Sr. Unsec. Gtd. Notes, 7.00%, 12/15/21 | | | 255,000 | | | | 259,781 | |
| | | | | | | | 501,061 | |
|
| Integrated Oil & Gas–0.58% | |
Ecopetrol S.A. (Colombia), Sr. Unsec. Global Notes,
4.13%, 01/16/25 | | | 66,000 | | | | 58,163 | |
5.38%, 06/26/26 | | | 100,000 | | | | 93,375 | |
| | | | | | | | 151,538 | |
|
| Internet Software & Services–0.80% | |
Equinix Inc., Sr. Unsec. Notes, 5.38%, 01/01/22 | | | 200,000 | | | | 209,500 | |
|
| Metal & Glass Containers–0.52% | |
Berry Plastic Corp., Sec. Gtd. Second Lien Notes, 6.00%, 10/15/22(b) | | | 130,000 | | | | 136,663 | |
|
| Oil & Gas Exploration & Production–0.35% | |
Pacific Exploration and Production Corp. (Colombia), Sr. Unsec. Gtd. Notes, 5.13%, 03/28/23(b) | | | 240,000 | | | | 90,000 | |
|
| Packaged Foods & Meats–0.76% | |
BRF S.A. (Brazil), Sr. Unsec. Notes, 4.75%, 05/22/24(b) | | | 200,000 | | | | 199,125 | |
|
| Paper Products–1.00% | |
Clearwater Paper Corp., Sr. Unsec. Gtd. Notes, 5.38%, 02/01/25(b) | | | 260,000 | | | | 260,650 | |
See accompanying Notes to Financial Statements which are an integral part of the financial statements.
13 Invesco Unconstrained Bond Fund
| | | | | | | | |
| | | Principal
Amount | | | Value | |
| Pharmaceuticals–0.49% | |
Valeant Pharmaceuticals International, Inc., Sr. Unsec. Gtd. Notes, 5.50%, 03/01/23(b) | | $ | 150,000 | | | $ | 126,750 | |
|
| Regional Banks–1.04% | |
CIT Group Inc., Sr. Unsec. Global Notes, 5.00%, 08/15/22 | | | 255,000 | | | | 269,662 | |
|
| Security & Alarm Services–1.24% | |
ADT Corp. (The), Sr. Unsec. Global Notes, 6.25%, 10/15/21 | | | 300,000 | | | | 324,000 | |
|
| Specialized Finance–2.22% | |
International Lease Finance Corp., Sr. Unsec. Notes,
8.25%, 12/15/20 | | | 480,000 | | | | 578,400 | |
|
| Specialized REIT’s–0.20% | |
Corrections Corp. of America, Sr. Unsec. Gtd. Notes, 5.00%, 10/15/22 | | | 50,000 | | | | 50,922 | |
|
| Tires & Rubber–1.26% | |
Goodyear Tire & Rubber Co. (The), Sr. Unsec. Gtd. Global Notes, 7.00%, 05/15/22 | | | 300,000 | | | | 327,375 | |
|
| Trading Companies & Distributors–0.59% | |
AerCap Ireland Capital Ltd./AerCap Global Aviation Trust (Netherlands), Sr. Unsec. Gtd. Global Notes, 4.50%, 05/15/21 | | | 150,000 | | | | 153,375 | |
|
| Wireless Telecommunication Services–0.60% | |
Sprint Communications Inc., Sr. Unsec. Gtd. Notes, 9.00%, 11/15/18(b) | | | 141,000 | | | | 155,452 | |
Total U.S. Dollar Denominated Bonds and Notes
(Cost $6,645,192) | | | | 6,684,942 | |
|
Non-U.S. Dollar Denominated Bonds & Notes–8.21%(f) | |
| Automobile Manufacturers–0.58% | |
Volkswagen International Finance N.V. (Germany), REGS, Jr. Unsec. Sub. Gtd. Euro Bonds, 3.88%(b)(e) | | EUR | 140,000 | | | $ | 149,572 | |
|
| Diversified Banks–2.82% | |
Bankia S.A. (Spain), REGS, Sr. Unsec. Euro Bonds, 3.50%, 01/17/19(b) | | EUR | 300,000 | | | | 348,856 | |
Intesa Sanpaolo S.p.A. (Italy), REGS, Sr. Unsec. Medium-Term Euro Notes, 1.13%, 01/14/20(b) | | EUR | 350,000 | | | | 386,571 | |
| | | | | | | | 735,427 | |
|
| Electric Utilities–0.95% | |
EDP Finance B.V. (Portugal), REGS, Sr. Unsec. Medium-Term Euro Notes, 2.00%, 04/22/25(b) | | EUR | 240,000 | | | | 247,923 | |
|
| Integrated Telecommunication Services–0.86% | |
Telefonica Europe, B.V. (Spain), REGS, Jr. Unsec. Sub. Gtd. Euro Bonds, 5.00%(b)(e) | | EUR | 200,000 | | | | 224,903 | |
| | | | | | | | |
| | | Principal
Amount | | | Value | |
| Marine–0.39% | |
CMA CGM S.A. (France), Sr. Unsec. Notes, 7.75%, 01/15/21(b) | | EUR | 100,000 | | | $ | 101,992 | |
|
| Multi-Utilities–0.85% | |
Engie S.A. (France), REGS, Jr. Unsec. Sub. Euro Notes, 3.00%(b)(e) | | EUR | 200,000 | | | | 222,102 | |
|
| Sovereign Debt–0.77% | |
Brazil Notas do Tesouro Nacional (Brazil), Series F, Unsec. Notes, 10.00%, 01/01/23 | | BRL | 1,000,000 | | | | 199,050 | |
|
| Specialized Finance–0.99% | |
Redexis Gas Finance B.V. (Spain), REGS, Sr. Unsec. Gtd. Medium-Term Euro Notes, 2.75%, 04/08/21(b) | | EUR | 220,000 | | | | 257,558 | |
Total Non-U.S. Dollar Denominated Bonds & Notes (Cost $2,178,995) | | | | 2,138,527 | |
|
U.S. Treasury Bills–1.90%(g)(h) | |
0.03%, 05/28/16 | | $ | 30,000 | | | | 29,961 | |
0.04%, 05/28/16 | | | 85,000 | | | | 84,888 | |
0.06%, 05/28/16 | | | 100,000 | | | | 99,868 | |
0.07%, 05/28/16 | | | 30,000 | | | | 29,960 | |
0.08%, 05/28/16 | | | 250,000 | | | | 249,671 | |
Total U.S. Treasury Bills
(Cost $494,819) | | | | 494,348 | |
|
Credit-Linked Securities–1.47% | |
Standard Chartered Bank (United Kingdom), Sr. Unsec. Medium-Term Euro Notes, 8.40%, 07/30/24 (Credit-Linked to the India Government Bonds 8.40%, 07/28/24) (Cost 395,746)(b)(f) | | INR | 24,000,000 | | | | 382,514 | |
|
Municipal Obligations–1.11% | |
Chicago (City of), Illinois; Series 2014 B, Ref. Unlimited Tax GO Bonds, 6.31%, 01/01/44 | | | 125,000 | | | | 117,984 | |
Puerto Rico (Commonwealth of); Series 2014 A, Unlimited Tax GO Bonds, 8.00%, 07/01/35 | | | 235,000 | | | | 171,902 | |
Total Municipal Obligations
(Cost $297,419) | | | | 289,886 | |
|
U.S. Government Sponsored Agency Mortgage-Backed Securities–0.52% | |
| Collateralized Mortgage Obligations–0.52% | |
Fannie Mae REMICs, IO, 3.00%, 06/25/27 | | | 730,387 | | | | 70,351 | |
Freddie Mac REMICs, IO, 3.00%, 05/15/28 | | | 631,835 | | | | 66,147 | |
Total U.S. Government Sponsored Agency Mortgage-Backed Securities
(Cost $148,223) | | | | 136,498 | |
See accompanying Notes to Financial Statements which are an integral part of the financial statements.
14 Invesco Unconstrained Bond Fund
| | | | | | | | |
| | | Shares | | | Value | |
Money Market Funds–1.23% | |
Liquid Assets Portfolio–Institutional Class, 0.16%(i) | | | 159,645 | | | $ | 159,645 | |
Premier Portfolio–Institutional Class, 0.12%(i) | | | 159,646 | | | | 159,646 | |
Total Money Market Funds
(Cost $319,291) | | | | | | | 319,291 | |
| | | | | | |
| | | | | Value | |
Options Purchased-2.03%(j) | | | | |
(Cost $743,440) | | | | $ | 527,427 | |
TOTAL INVESTMENTS–103.53%
(Cost $27,245,143) | | | | | 26,957,959 | |
OTHER ASSETS LESS LIABILITIES–(3.53)% | | | | | (918,819 | ) |
NET ASSETS–100.00% | | | | $ | 26,039,140 | |
Investment Abbreviations:
| | |
| BRL | | – Brazil |
| CLO | | – Collateralized Loan Obligation |
| Ctfs. | | – Certificates |
| EUR | | – Euro |
| GO | | – General Obligation |
| Gtd. | | – Guaranteed |
| | |
| INR | | – Indian Rupee |
| IO | | – Interest Only |
| Jr. | | – Junior |
| Ref. | | – Refunding |
| REGS | | – Regulation S |
| REIT | | – Real Estate Investment Trust |
| | |
| REMICs | | – Real Estate Investment Conduits |
| Sec. | | – Secured |
| Sr. | | – Senior |
| Sub. | | – Subordinated |
| Unsec. | | – Unsecured |
Notes to Schedule of Investments:
| (a) | Industry and/or sector classifications used in this report are generally according to the Global Industry Classification Standard, which was developed by and is the exclusive property and a service mark of MSCI Inc. and Standard & Poor’s. |
| (b) | Security purchased or received in a transaction exempt from registration under the Securities Act of 1933, as amended (the “1933 Act”). The security may be resold pursuant to an exemption from registration under the 1933 Act, typically to qualified institutional buyers. The aggregate value of these securities at October 31, 2015 was $13,123,473, which represented 50.40% of the Fund’s Net Assets. |
| (c) | Interest or dividend rate is redetermined periodically. Rate shown is the rate in effect on October 31, 2015. |
| (d) | All or a portion of the security is pledged as collateral for open reverse repurchase agreements. See Note 1J. The following table presents the Fund’s collateral pledged as of October 31, 2015: |
| | | | | | | | | | | | |
| Counterparty | | Reverse
Repurchase
Agreements | | | Value of
Non-cash
Collateral
Pledged* | | | Net
Amount | |
Royal Bank of Canada | | $ | 423,135 | | | $ | (423,135 | ) | | $ | — | |
| | * | Amount does not include excess collateral pledged. |
| (e) | Perpetual bond with no specified maturity date. |
| (f) | Foreign denominated security. Principal amount is denominated in the currency indicated. |
| (g) | Security traded on a discount basis. The interest rate shown represents the discount rate at the time of purchase by the Fund. |
| (h) | All or a portion of the value was pledged and/or designated as collateral to cover margin requirements for open futures contracts and centrally cleared swap agreements. See Note 1M, 1P and Note 4. |
| (i) | The money market fund and the Fund are affiliated by having the same investment adviser. The rate shown is the 7-day SEC standardized yield as of October 31, 2015. |
| (j) | The table below details options purchased: |
| | | | | | | | | | | | | | | | | | | | | | | | | | | | | | |
| Open Over-The-Counter Foreign Currency Options Purchased | |
| Description | | Type of
Contract | | | Counterparty | | | Expiration
Date | | | Strike Price | | | Notional
Value | | | Value | |
EUR versus USD | | | Put | | | | Deutsche Bank Securities Inc. | | | | 03/23/16 | | | USD | | | 1.090 | | | | EUR | | | | 470,000 | | | $ | 10,709 | |
USD versus SGD | | | Call | | | | Deutsche Bank Securities Inc. | | | | 12/23/15 | | | SGD | | | 1.449 | | | | USD | | | | 1,050,000 | | | | 2,923 | |
USD versus KRW | | | Call | | | | Goldman Sachs International | | | | 01/27/16 | | | KRW | | | 1,144 | | | | USD | | | | 1,050,000 | | | | 23,958 | |
Subtotal Foreign Currency Options Purchased — Currency Risk | | | | | | | | | | | | | | | | | | | | | $ | 37,590 | |
Abbreviations:
| | |
| EUR | | – Euro |
| KRW | | – South Korean Won |
| LIBOR | | – London Interbank Offered Rate |
| SGD | | – Singapore Dollar |
| USD | | – U.S. Dollar |
See accompanying Notes to Financial Statements which are an integral part of the financial statements.
15 Invesco Unconstrained Bond Fund
| | | | | | | | | | | | | | | | | | | | | | | | | | | | |
| Open Over-The-Counter Interest Rate Swaptions Purchased | |
| Description | | Type of
Contract | | | Counterparty | | Exercise
Rate | | | Pay/Receive
Exercise Rate | | Floating Rate Index | | | Expiration
Date | | | Notional Value | | | Value | |
3 Year Interest Rate Swap | | | Put | | | Deutsche Bank Securities Inc. | | | 1.550 | | | Pay | | | 3 Month USD LIBOR | | | | 01/28/16 | | | $ | 22,700,000 | | | $ | 26,233 | |
3Year Interest Rate Swap | | | Put | | | Goldman Sachs International | | | 1.600 | | | Pay | | | 3 Month USD LIBOR | | | | 01/29/16 | | | | 13,100,000 | | | | 12,627 | |
7 Year Interest Rate Swap | | | Call | | | Bank of America, N.A. | | | 2.165 | | | Receive | | | 3 Month USD LIBOR | | | | 03/16/16 | | | | 1,500,000 | | | | 34,581 | |
7 Year Interest Rate Swap | | | Call | | | Citigroup Global Markets Inc. | | | 1.900 | | | Receive | | | 3 Month USD LIBOR | | | | 04/06/16 | | | | 2,250,000 | | | | 29,104 | |
7 Year Interest Rate Swap | | | Call | | | Deutsche Bank Securities Inc. | | | 1.890 | | | Receive | | | 3 Month USD LIBOR | | | | 04/20/16 | | | | 3,000,000 | | | | 38,718 | |
7 Year Interest Rate Swap | | | Call | | | Deutsche Bank Securities Inc. | | | 2.165 | | | Receive | | | 3 Month USD LIBOR | | | | 03/16/16 | | | | 7,000,000 | | | | 161,378 | |
7 Year Interest Rate Swap | | | Call | | | Goldman Sachs International | | | 1.910 | | | Receive | | | 3 Month USD LIBOR | | | | 04/07/16 | | | | 1,800,000 | | | | 23,771 | |
7 Year Interest Rate Swap | | | Put | | | Bank of America, N.A. | | | 2.165 | | | Pay | | | 3 Month USD LIBOR | | | | 03/16/16 | | | | 1,500,000 | | | | 9,484 | |
7 Year Interest Rate Swap | | | Put | | | Citigroup Global Markets Inc. | | | 1.900 | | | Pay | | | 3 Month USD LIBOR | | | | 04/06/16 | | | | 2,250,000 | | | | 33,714 | |
7 Year Interest Rate Swap | | | Put | | | Deutsche Bank Securities Inc. | | | 1.890 | | | Pay | | | 3 Month USD LIBOR | | | | 04/20/16 | | | | 3,000,000 | | | | 49,390 | |
7 Year Interest Rate Swap | | | Put | | | Deutsche Bank Securities Inc. | | | 2.165 | | | Pay | | | 3 Month USD LIBOR | | | | 03/16/16 | | | | 7,000,000 | | | | 44,259 | |
7 Year Interest Rate Swap | | | Put | | | Goldman Sachs International | | | 1.910 | | | Pay | | | 3 Month USD LIBOR | | | | 04/07/16 | | | | 1,800,000 | | | | 26,578 | |
Subtotal Swaptions Purchased — Interest Rate Risk | | | | | | | | | | | | | | | | | | | | $ | 489,837 | |
Total Options Purchased (Cost $743,440) | | | | | | | | | | | | | | | | | | | | $ | 527,427 | |
Abbreviations:
| | |
| LIBOR | | – London Interbank Offered Rate |
| USD | | – U.S. Dollar |
See accompanying Notes to Financial Statements which are an integral part of the financial statements.
16 Invesco Unconstrained Bond Fund
Statement of Assets and Liabilities
October 31, 2015
| | | | |
Assets: | |
Investments, at value (Cost $26,925,852) | | $ | 26,638,668 | |
Investments in affiliated money market funds, at value and cost | | | 319,291 | |
Total investments, at value (Cost $27,245,143) | | | 26,957,959 | |
Cash | | | 284,881 | |
Foreign currencies, at value (Cost $118,001) | | | 117,479 | |
Receivable for: | | | | |
Variation margin — futures | | | 2,853 | |
Dividends and interest | | | 225,285 | |
Premiums paid on swap agreements — OTC | | | 32,180 | |
Investment for trustee deferred compensation and retirement plans | | | 1,544 | |
Unrealized appreciation on forward foreign currency contracts outstanding | | | 107,699 | |
Unrealized appreciation on swap agreements — OTC | | | 131,296 | |
Other assets | | | 31,716 | |
Total assets | | | 27,892,892 | |
|
Liabilities: | |
Payable for: | | | | |
Investments purchased | | | 999,869 | |
Fund shares reacquired | | | 17 | |
Options written, at value (premiums received $12,853) | | | 10,669 | |
Amount due custodian | | | 237,209 | |
Reverse repurchase arrangements | | | 423,135 | |
Swaps payable — OTC | | | 3,713 | |
Variation margin — centrally cleared swap agreements | | | 15,312 | |
Accrued fees to affiliates | | | 34,095 | |
Accrued trustees’ and officers’ fees and benefits | | | 1,961 | |
Accrued other operating expenses | | | 53,477 | |
Trustee deferred compensation and retirement plans | | | 1,544 | |
Unrealized depreciation on forward foreign currency contracts outstanding | | | 64,839 | |
Unrealized depreciation on swap agreements — OTC | | | 7,912 | |
Total liabilities | | | 1,853,752 | |
Net assets applicable to shares outstanding | | $ | 26,039,140 | |
|
Net assets consist of: | |
Shares of beneficial interest | | $ | 26,203,391 | |
Undistributed net investment income | | | (89,170 | ) |
Undistributed net realized gain (loss) | | | (40,577 | ) |
Net unrealized appreciation (depreciation) | | | (34,504 | ) |
| | | $ | 26,039,140 | |
| | | | |
Net Assets: | |
Class A | | $ | 13,042,338 | |
Class C | | $ | 256,922 | |
Class R | | $ | 9,914 | |
Class Y | | $ | 12,710,126 | |
Class R5 | | $ | 9,920 | |
Class R6 | | $ | 9,920 | |
|
Shares outstanding, $0.01 par value per share,
with an unlimited number of shares authorized: | |
Class A | | | 1,316,488 | |
Class C | | | 25,948 | |
Class R | | | 1,001 | |
Class Y | | | 1,282,541 | |
Class R5 | | | 1,001 | |
Class R6 | | | 1,001 | |
Class A: | | | | |
Net asset value per share | | $ | 9.91 | |
Maximum offering price per share | | | | |
(Net asset value of $9.91 ¸ 95.75%) | | $ | 10.35 | |
Class C: | | | | |
Net asset value and offering price per share | | $ | 9.90 | |
Class R: | | | | |
Net asset value and offering price per share | | $ | 9.90 | |
Class Y: | | | | |
Net asset value and offering price per share | | $ | 9.91 | |
Class R5: | | | | |
Net asset value and offering price per share | | $ | 9.91 | |
Class R6: | | | | |
Net asset value and offering price per share | | $ | 9.91 | |
See accompanying Notes to Financial Statements which are an integral part of the financial statements.
17 Invesco Unconstrained Bond Fund
Statement of Operations
For the year ended October 31, 2015
| | | | |
Investment income: | |
Interest (net of foreign withholding taxes of $2,319) | | $ | 742,931 | |
Dividends from affiliates | | | 99,520 | |
Total investment income | | | 842,451 | |
| |
Expenses: | | | | |
Advisory fees | | | 179,092 | |
Administrative services fees | | | 50,000 | |
Custodian fees | | | 14,785 | |
Distribution fees: | | | | |
Class A | | | 31,961 | |
Class C | | | 815 | |
Class R | | | 50 | |
Interest | | | 8,403 | |
Transfer agent fees — A, C, R and Y | | | 7,079 | |
Transfer agent fees — R5 | | | 10 | |
Transfer agent fees — R6 | | | 10 | |
Trustees’ and officers’ fees and benefits | | | 20,515 | |
Registration and filing fees | | | 110,848 | |
Professional services fees | | | 71,265 | |
Other | | | 44,202 | |
Total expenses | | | 539,035 | |
Less: Fees waived and expenses reimbursed | | | (313,580 | ) |
Net expenses | | | 225,455 | |
Net investment income | | | 616,996 | |
| |
Realized and unrealized gain (loss) from: | | | | |
Net realized gain (loss) from: | | | | |
Investment securities | | | (103,002 | ) |
Foreign currencies | | | (24,186 | ) |
Forward foreign currency contracts | | | 247,489 | |
Futures contracts | | | (243,164 | ) |
Option contracts written | | | 631 | |
Swap agreements | | | 2,267 | |
| | | | (119,965 | ) |
Change in net unrealized appreciation (depreciation) of: | | | | |
Investment securities | | | (343,076 | ) |
Foreign currencies | | | (1,173 | ) |
Forward foreign currency contracts | | | 19,618 | |
Futures contracts | | | (45,119 | ) |
Option contracts written | | | 2,184 | |
Swap agreements | | | 236,374 | |
| | | | (131,192 | ) |
Net realized and unrealized gain (loss) | | | (251,157 | ) |
Net increase in net assets resulting from operations | | $ | 365,839 | |
See accompanying Notes to Financial Statements which are an integral part of the financial statements.
18 Invesco Unconstrained Bond Fund
Statement of Changes in Net Assets
For the year ended October 31, 2015 and the period, October 14, 2014 (commencement date) through October 31, 2014
| | | | | | | | |
| | | October 31, 2015 | | | October 14, 2014
(commencement date) through October 31,
2014 | |
Operations: | | | | | |
Net investment income | | $ | 616,996 | | | $ | 10,074 | |
Net realized gain (loss) | | | (119,965 | ) | | | (1,289 | ) |
Change in net unrealized appreciation (depreciation) | | | (131,192 | ) | | | 96,688 | |
Net increase in net assets resulting from operations | | | 365,839 | | | | 105,473 | |
| | |
Distributions to shareholders from net investment income: | | | | | | | | |
Class A | | | (300,387 | ) | | | — | |
Class C | | | (939 | ) | | | — | |
Class R | | | (213 | ) | | | — | |
Class Y | | | (327,729 | ) | | | — | |
Class R5 | | | (259 | ) | | | — | |
Class R6 | | | (259 | ) | | | — | |
Total distributions from net investment income | | | (629,786 | ) | | | — | |
| | |
Return of capital: | | | | | | | | |
Class A | | | (21,703 | ) | | | — | |
Class C | | | (139 | ) | | | — | |
Class R | | | (17 | ) | | | — | |
Class Y | | | (21,532 | ) | | | — | |
Class R5 | | | (17 | ) | | | — | |
Class R6 | | | (17 | ) | | | — | |
Total return of capital | | | (43,425 | ) | | | — | |
| | |
Distributions to shareholders from net realized gains: | | | | | | | | |
Class A | | | (19,520 | ) | | | — | |
Class C | | | (36 | ) | | | — | |
Class R | | | (16 | ) | | | — | |
Class Y | | | (19,519 | ) | | | — | |
Class R5 | | | (16 | ) | | | — | |
Class R6 | | | (16 | ) | | | — | |
Total distributions from net realized gains | | | (39,123 | ) | | | — | |
| | |
Share transactions–net: | | | | | | | | |
Class A | | | 684,229 | | | | 12,480,560 | |
Class C | | | 247,895 | | | | 10,010 | |
Class R | | | — | | | | 10,010 | |
Class Y | | | 314,828 | | | | 12,512,610 | |
Class R5 | | | — | | | | 10,010 | |
Class R6 | | | — | | | | 10,010 | |
Net increase in net assets resulting from share transactions | | | 1,246,952 | | | | 25,033,210 | |
Net increase in net assets | | | 900,457 | | | | 25,138,683 | |
| | |
Net assets: | | | | | | | | |
Beginning of year | | | 25,138,683 | | | | — | |
End of year (includes undistributed net investment income of $(89,170) and $15,011, respectively) | | $ | 26,039,140 | | | $ | 25,138,683 | |
Notes to Financial Statements
October 31, 2015
NOTE 1—Significant Accounting Policies
Invesco Unconstrained Bond Fund (the “Fund”) is a series portfolio of AIM Investment Funds (Invesco Investment Funds) (the “Trust”). The Trust is organized as a Delaware statutory trust and is registered under the Investment Company Act of 1940, as amended (the “1940 Act”), as an open-end
19 Invesco Unconstrained Bond Fund
series management investment company consisting of twenty-four separate series portfolios, each authorized to issue an unlimited number of shares of beneficial interest. The assets, liabilities and operations of each portfolio are accounted for separately. Information presented in these financial statements pertains only to the Fund. Matters affecting each portfolio or class will be voted on exclusively by the shareholders of such portfolio or class.
The Fund’s investment objective is to provide a positive absolute return over a full market cycle.
The Fund currently consists of six different classes of shares: Class A, Class C, Class R, Class Y, Class R5 and Class R6. Class A shares are sold with a front-end sales charge unless certain waiver criteria are met and under certain circumstances load waived shares may be subject to contingent deferred sales charges (“CDSC”). Class C shares are sold with a CDSC. Class R, Class Y, Class R5 and Class R6 shares are sold at net asset value.
The following is a summary of the significant accounting policies followed by the Fund in the preparation of its financial statements.
| A. | Security Valuations — Securities, including restricted securities, are valued according to the following policy. |
Debt obligations (including convertible securities) and unlisted equities are fair valued using an evaluated quote provided by an independent pricing service. Evaluated quotes provided by the pricing service may be determined without exclusive reliance on quoted prices, and may reflect appropriate factors such as institution-size trading in similar groups of securities, developments related to specific securities, dividend rate (for unlisted equities), yield (for debt obligations), quality, type of issue, coupon rate (for debt obligations), maturity (for debt obligations), individual trading characteristics and other market data. Debt obligations are subject to interest rate and credit risks. In addition, all debt obligations involve some risk of default with respect to interest and/or principal payments.
A security listed or traded on an exchange (except convertible securities) is valued at its last sales price or official closing price as of the close of the customary trading session on the exchange where the security is principally traded, or lacking any sales or official closing price on a particular day, the security may be valued at the closing bid price on that day. Securities traded in the over-the-counter market are valued based on prices furnished by independent pricing services or market makers. When such securities are valued by an independent pricing service they may be considered fair valued. Futures contracts are valued at the final settlement price set by an exchange on which they are principally traded. Listed options are valued at the mean between the last bid and asked prices from the exchange on which they are principally traded. Options not listed on an exchange are valued by an independent source at the mean between the last bid and asked prices. For purposes of determining net asset value (“NAV”) per share, futures and option contracts generally are valued 15 minutes after the close of the customary trading session of the New York Stock Exchange (“NYSE”).
Investments in open-end and closed-end registered investment companies that do not trade on an exchange are valued at the end-of-day net asset value per share. Investments in open-end and closed-end registered investment companies that trade on an exchange are valued at the last sales price or official closing price as of the close of the customary trading session on the exchange where the security is principally traded.
Swap agreements are fair valued using an evaluated quote, if available, provided by an independent pricing service. Evaluated quotes provided by the pricing service are valued based on a model which may include end-of-day net present values, spreads, ratings, industry, company performance and returns of referenced assets.
Foreign securities’ (including foreign exchange contracts) prices are converted into U.S. dollar amounts using the applicable exchange rates as of the close of the NYSE. If market quotations are available and reliable for foreign exchange-traded equity securities, the securities will be valued at the market quotations. Because trading hours for certain foreign securities end before the close of the NYSE, closing market quotations may become unreliable. If between the time trading ends on a particular security and the close of the customary trading session on the NYSE, events occur that the Adviser determines are significant and make the closing price unreliable, the Fund may fair value the security. If the event is likely to have affected the closing price of the security, the security will be valued at fair value in good faith using procedures approved by the Board of Trustees. Adjustments to closing prices to reflect fair value may also be based on a screening process of an independent pricing service to indicate the degree of certainty, based on historical data, that the closing price in the principal market where a foreign security trades is not the current value as of the close of the NYSE. Foreign securities’ prices meeting the approved degree of certainty that the price is not reflective of current value will be priced at the indication of fair value from the independent pricing service. Multiple factors may be considered by the independent pricing service in determining adjustments to reflect fair value and may include information relating to sector indices, American Depositary Receipts and domestic and foreign index futures. Foreign securities may have additional risks including exchange rate changes, potential for sharply devalued currencies and high inflation, political and economic upheaval, the relative lack of issuer information, relatively low market liquidity and the potential lack of strict financial and accounting controls and standards.
Securities for which market prices are not provided by any of the above methods may be valued based upon quotes furnished by independent sources. The last bid price may be used to value equity securities. The mean between the last bid and asked prices is used to value debt obligations, including corporate loans.
Securities for which market quotations are not readily available or became unreliable are valued at fair value as determined in good faith by or under the supervision of the Trust’s officers following procedures approved by the Board of Trustees. Issuer specific events, market trends, bid/asked quotes of brokers and information providers and other market data may be reviewed in the course of making a good faith determination of a security’s fair value.
The Fund may invest in securities that are subject to interest rate risk, meaning the risk that the prices will generally fall as interest rates rise and, conversely, the prices will generally rise as interest rates fall. Specific securities differ in their sensitivity to changes in interest rates depending on their individual characteristics. Changes in interest rates may result in increased market volatility, which may affect the value and/or liquidity of certain Fund investments.
Valuations change in response to many factors including the historical and prospective earnings of the issuer, the value of the issuer’s assets, general economic conditions, interest rates, investor perceptions and market liquidity. Because of the inherent uncertainties of valuation, the values reflected in the financial statements may materially differ from the value received upon actual sale of those investments.
| B. | Securities Transactions and Investment Income — Securities transactions are accounted for on a trade date basis. Realized gains or losses on sales are computed on the basis of specific identification of the securities sold. Interest income (net of withholding tax, if any) is recorded on the accrual basis from settlement date. Paydown gains and losses on mortgage and asset-backed securities are recorded as adjustments to interest income. Dividend income (net of withholding tax, if any) is recorded on the ex-dividend date. Bond premiums and discounts are amortized and/or accreted for financial reporting purposes. |
The Fund may periodically participate in litigation related to Fund investments. As such, the Fund may receive proceeds from litigation settlements. Any proceeds received are included in the Statement of Operations as realized gain (loss) for investments no longer held and as unrealized gain (loss) for investments still held.
20 Invesco Unconstrained Bond Fund
Brokerage commissions and mark ups are considered transaction costs and are recorded as an increase to the cost basis of securities purchased and/or a reduction of proceeds on a sale of securities. Such transaction costs are included in the determination of net realized and unrealized gain (loss) from investment securities reported in the Statement of Operations and the Statement of Changes in Net Assets and the net realized and unrealized gains (losses) on securities per share in the Financial Highlights. Transaction costs are included in the calculation of the Fund’s net asset value and, accordingly, they reduce the Fund’s total returns. These transaction costs are not considered operating expenses and are not reflected in net investment income reported in the Statement of Operations and the Statement of Changes in Net Assets, or the net investment income per share and the ratios of expenses and net investment income reported in the Financial Highlights, nor are they limited by any expense limitation arrangements between the Fund and the investment adviser.
The Fund allocates realized and unrealized capital gains and losses to a class based on the relative net assets of each class. The Fund allocates income to a class based on the relative value of the settled shares of each class.
| C. | Country Determination — For the purposes of making investment selection decisions and presentation in the Schedule of Investments, the investment adviser may determine the country in which an issuer is located and/or credit risk exposure based on various factors. These factors include the laws of the country under which the issuer is organized, where the issuer maintains a principal office, the country in which the issuer derives 50% or more of its total revenues and the country that has the primary market for the issuer’s securities, as well as other criteria. Among the other criteria that may be evaluated for making this determination are the country in which the issuer maintains 50% or more of its assets, the type of security, financial guarantees and enhancements, the nature of the collateral and the sponsor organization. Country of issuer and/or credit risk exposure has been determined to be the United States of America, unless otherwise noted. |
| D. | Distributions — Distributions from net investment income, if any, are declared and paid monthly. Distributions from net realized capital gain, if any, are generally declared and paid annually and recorded on the ex-dividend date. The Fund may elect to treat a portion of the proceeds from redemptions as distributions for federal income tax purposes. |
| E. | Federal Income Taxes — The Fund intends to comply with the requirements of Subchapter M of the Internal Revenue Code of 1986, as amended (the “Internal Revenue Code”), necessary to qualify as a regulated investment company and to distribute substantially all of the Fund’s taxable earnings to shareholders. As such, the Fund will not be subject to federal income taxes on otherwise taxable income (including net realized capital gain) that is distributed to shareholders. Therefore, no provision for federal income taxes is recorded in the financial statements. |
The Fund recognizes the tax benefits of uncertain tax positions only when the position is more likely than not to be sustained. Management has analyzed the Fund’s uncertain tax positions and concluded that no liability for unrecognized tax benefits should be recorded related to uncertain tax positions. Management is not aware of any tax positions for which it is reasonably possible that the total amounts of unrecognized tax benefits will change materially in the next 12 months.
The Fund files tax returns in the U.S. Federal jurisdiction and certain other jurisdictions. Generally, the Fund is subject to examinations by such taxing authorities for up to three years after the filing of the return for the tax period.
| F. | Expenses — Fees provided for under the Rule 12b-1 plan of a particular class of the Fund are charged to the operations of such class. Transfer agency fees and expenses and other shareholder recordkeeping fees and expenses attributable to Class R5 and Class R6 are allocated to each share class based on relative net assets. Sub-accounting fees attributable to Class R5 are charged to the operations of the class. Transfer agency fees and expenses and other shareholder recordkeeping fees and expenses relating to all other classes are allocated among those classes based on relative net assets. All other expenses are allocated among the classes based on relative net assets. |
| G. | Accounting Estimates — The preparation of financial statements in conformity with accounting principles generally accepted in the United States of America (“GAAP”) requires management to make estimates and assumptions that affect the reported amounts of assets and liabilities at the date of the financial statements and the reported amounts of revenues and expenses during the reporting period including estimates and assumptions related to taxation. Actual results could differ from those estimates by a significant amount. In addition, the Fund monitors for material events or transactions that may occur or become known after the period-end date and before the date the financial statements are released to print. |
| H. | Indemnifications — Under the Trust’s organizational documents, each Trustee, officer, employee or other agent of the Trust is indemnified against certain liabilities that may arise out of the performance of their duties to the Fund. Additionally, in the normal course of business, the Fund enters into contracts, including the Fund’s servicing agreements that contain a variety of indemnification clauses. The Fund’s maximum exposure under these arrangements is unknown as this would involve future claims that may be made against the Fund that have not yet occurred. The risk of material loss as a result of such indemnification claims is considered remote. |
| I. | Structured Securities — The Fund may invest in structured securities. Structured securities are a type of derivative security whose value is determined by reference to changes in the value of underlying securities, currencies, interest rates, commodities, indices or other financial indicators (“reference instruments”). Most structured securities are fixed-income securities that have maturities of three years or less. Structured securities may be positively or negatively indexed (i.e., their principal value or interest rates may increase or decrease if the underlying reference instrument appreciates) and may have return characteristics similar to direct investments in the underlying reference instrument. Structured securities may entail a greater degree of market risk than other types of debt securities because the investor bears the risk of the reference instruments. In addition to the credit risk of structured securities and the normal risks of price changes in response to changes in interest rates, the principal amount of structured notes or indexed securities may decrease as a result of changes in the value of the underlying reference instruments. Changes in the daily value of structured securities are recorded as unrealized gains (losses) in the Statement of Operations. When the structured securities mature or are sold, the Fund recognizes a realized gain (loss) on the Statement of Operations. |
| J. | Reverse Repurchase Agreements — The Fund may enter into reverse repurchase agreements. Reverse repurchase agreements involve the sale of securities held by the Fund, with an agreement that the Fund will repurchase such securities at an agreed upon price and date. The Fund will use the proceeds of a reverse repurchase agreement (which are considered to be borrowings under the 1940 Act) to purchase other permitted securities either maturing, or under an agreement to resell, at a date simultaneous with or prior to the expiration of the reverse repurchase agreement. The agreements are collateralized by the underlying securities and are carried at the amount at which the securities subsequently will be repurchased as specified in the agreements. Expenses under the Reverse Repurchase Agreements are shown in the Statement of Operations as Interest. |
| K. | Foreign Currency Translations — Foreign currency is valued at the close of the NYSE based on quotations posted by banks and major currency dealers. Portfolio securities and other assets and liabilities denominated in foreign currencies are translated into U.S. dollar amounts at |
21 Invesco Unconstrained Bond Fund
| | date of valuation. Purchases and sales of portfolio securities (net of foreign taxes withheld on disposition) and income items denominated in foreign currencies are translated into U.S. dollar amounts on the respective dates of such transactions. The Fund does not separately account for the portion of the results of operations resulting from changes in foreign exchange rates on investments and the fluctuations arising from changes in market prices of securities held. The combined results of changes in foreign exchange rates and the fluctuation of market prices on investments (net of estimated foreign tax withholding) are included with the net realized and unrealized gain or loss from investments in the Statement of Operations. Reported net realized foreign currency gains or losses arise from (1) sales of foreign currencies, (2) currency gains or losses realized between the trade and settlement dates on securities transactions, and (3) the difference between the amounts of dividends, interest, and foreign withholding taxes recorded on the Fund’s books and the U.S. dollar equivalent of the amounts actually received or paid. Net unrealized foreign currency gains and losses arise from changes in the fair values of assets and liabilities, other than investments in securities at fiscal period end, resulting from changes in exchange rates. |
The Fund may invest in foreign securities, which may be subject to foreign taxes on income, gains on investments or currency repatriation, a portion of which may be recoverable. Foreign taxes, if any, are recorded based on the tax regulations and rates that exist in the foreign markets in which the Fund invests and are shown in the Statement of Operations.
| L. | Forward Foreign Currency Contracts — The Fund may engage in foreign currency transactions either on a spot (i.e. for prompt delivery and settlement) basis, or through forward foreign currency contracts, to manage or minimize currency or exchange rate risk. |
The Fund may also enter into forward foreign currency contracts for the purchase or sale of a security denominated in a foreign currency in order to “lock in” the U.S. dollar price of that security, or the Fund may also enter into forward foreign currency contracts that do not provide for physical settlement of the two currencies, but instead are settled by a single cash payment calculated as the difference between the agreed upon exchange rate and the spot rate at settlement based upon an agreed upon notional amount (non-deliverable forwards). The Fund will set aside liquid assets in an amount equal to daily mark-to-market obligation for forward foreign currency contracts.
A forward foreign currency contract is an obligation between two parties (“Counterparties”) to purchase or sell a specific currency for an agreed-upon price at a future date. The use of forward foreign currency contracts does not eliminate fluctuations in the price of the underlying securities the Fund owns or intends to acquire but establishes a rate of exchange in advance. Fluctuations in the value of these contracts are measured by the difference in the contract date and reporting date exchange rates and are recorded as unrealized appreciation (depreciation) until the contracts are closed. When the contracts are closed, realized gains (losses) are recorded. Realized and unrealized gains (losses) on the contracts are included in the Statement of Operations. The primary risks associated with forward foreign currency contracts include failure of the Counterparty to meet the terms of the contract and the value of the foreign currency changing unfavorably. These risks may be in excess of the amounts reflected in the Statement of Assets and Liabilities.
| M. | Futures Contracts — The Fund may enter into futures contracts to manage exposure to interest rate, equity and market price movements and/or currency risks. A futures contract is an agreement between Counterparties to purchase or sell a specified underlying security, currency or commodity (or delivery of a cash settlement price, in the case of an index future) for a fixed price at a future date. The Fund currently invests only in exchange-traded futures and they are standardized as to maturity date and underlying financial instrument. Initial margin deposits required upon entering into futures contracts are satisfied by the segregation of specific securities or cash as collateral at the futures commission merchant (broker). During the period the futures contracts are open, changes in the value of the contracts are recognized as unrealized gains or losses by recalculating the value of the contracts on a daily basis. Subsequent or variation margin payments are received or made depending upon whether unrealized gains or losses are incurred. These amounts are reflected as receivables or payables on the Statement of Assets and Liabilities. When the contracts are closed or expire, the Fund recognizes a realized gain or loss equal to the difference between the proceeds from, or cost of, the closing transaction and the Fund’s basis in the contract. The net realized gain (loss) and the change in unrealized gain (loss) on futures contracts held during the period is included on the Statement of Operations. The primary risks associated with futures contracts are market risk and the absence of a liquid secondary market. If the Fund were unable to liquidate a futures contract and/or enter into an offsetting closing transaction, the Fund would continue to be subject to market risk with respect to the value of the contracts and continue to be required to maintain the margin deposits on the futures contracts. Futures contracts have minimal Counterparty risk since the exchange’s clearinghouse, as Counterparty to all exchange-traded futures, guarantees the futures against default. Risks may exceed amounts recognized in the Statement of Assets and Liabilities. |
| N. | Call Options Written and Purchased — The Fund may write call options and/or buy call options. A covered call option gives the purchaser of such option the right to buy, and the writer the obligation to sell, the underlying security or foreign currency at the stated exercise price during the option period. An uncovered call option exists without the ownership of the underlying security. Options written by the Fund normally will have expiration dates between three and nine months from the date written. The exercise price of a call option may be below, equal to, or above the current market value of the underlying security at the time the option is written. |
When the Fund writes a covered call option, an amount equal to the premium received by the Fund is recorded as an asset and an equivalent liability in the Statement of Assets and Liabilities. The amount of the liability is subsequently “marked-to-market” to reflect the current market value of the option written. If a written covered call option expires on the stipulated expiration date, or if the Fund enters into a closing purchase transaction, the Fund realizes a gain (or a loss if the closing purchase transaction exceeds the premium received when the option was written) without regard to any unrealized gain or loss on the underlying security, and the liability related to such option is extinguished. If a written covered call option is exercised, the Fund realizes a gain or a loss from the sale of the underlying security and the proceeds of the sale are increased by the premium originally received. Realized and unrealized gains and losses on these contracts are included in the Statement of Operations. A risk in writing a covered call option is that the Fund gives up the opportunity for profit if the market price of the security increases and the option is exercised. The risk in writing an uncovered call option is that the Fund may incur significant losses if the value of the written security exceeds the exercise price of the option.
When the Fund buys a call option, an amount equal to the premium paid by the Fund is recorded as an investment on the Statement of Assets and Liabilities. The amount of the investment is subsequently “marked-to-market” to reflect the current value of the option purchased. Realized and unrealized gains and losses on these contracts are included in the Statement of Operations. A risk in buying an option is that the Fund pays a premium whether or not the option is exercised. In addition, there can be no assurance that a liquid secondary market will exist for any option purchased.
| O. | Put Options Purchased and Written — The Fund may purchase and write put options including options on securities indexes, or foreign currency and/or futures contracts. By purchasing a put option, the Fund obtains the right (but not the obligation) to sell the option’s underlying |
22 Invesco Unconstrained Bond Fund
| | instrument at a fixed strike price. In return for this right, the Fund pays an option premium. The option’s underlying instrument may be a security, securities index, or a futures contract. |
Additionally, the Fund may enter into an option on a swap agreement, also called a “swaption”. A swaption is an option that gives the buyer the right, but not the obligation, to enter into a swap on a future date in exchange for paying a market-based premium. A receiver swaption gives the owner the right to receive the total return of a specified asset, reference rate or index. Swaptions also include options that allow an existing swap to be terminated or extended by one of the Counterparties.
Put options may be used by the Fund to hedge securities it owns by locking in a minimum price at which the Fund can sell. If security prices fall, the put option could be exercised to offset all or a portion of the Fund’s resulting losses. At the same time, because the maximum the Fund has at risk is the cost of the option, purchasing put options does not eliminate the potential for the Fund to profit from an increase in the value of the underlying portfolio securities. The Fund may write put options to earn additional income in the form of option premiums if it expects the price of the underlying instrument to remain stable or rise during the option period for American style or on expiration date for European style so that the option will not be exercised. The risk in this strategy is that the price of the underlying securities may decline by an amount greater than the premium received. Put options written are reported as a liability in the Statement of Assets and Liabilities. Realized and unrealized gains and losses on these contracts are included in the Statement of Operations as Net realized gain from Investment securities. A risk in buying an option is that the Fund pays a premium whether or not the option is exercised. In addition, there can be no assurance that a liquid secondary market will exist for any option purchased.
| P. | Swap Agreements — The Fund may enter into various swap transactions, including interest rate, total return, index, currency and credit default swap contracts (“CDS”) for investment purposes or to manage interest rate, currency or credit risk. Such transactions are agreements between Counterparties. A swap agreement may be negotiated bilaterally and traded over-the-counter (“OTC”) between two parties (“uncleared/OTC”) or, in some instances, must be transacted through a future commission merchant (“FCM”) and cleared through a clearinghouse that serves as a central Counterparty (“centrally cleared swap”). These agreements may contain among other conditions, events of default and termination events, and various covenants and representations such as provisions that require the Fund to maintain a pre-determined level of net assets, and/or provide limits regarding the decline of the Fund’s NAV over specific periods of time. If the Fund were to trigger such provisions and have open derivative positions at that time, the Counterparty may be able to terminate such agreement and request immediate payment in an amount equal to the net liability positions, if any. |
Interest rate, total return, index, and currency swap agreements are two-party contracts entered into primarily to exchange the returns (or differentials in rates of returns) earned or realized on particular predetermined investments or instruments. The gross returns to be exchanged or “swapped” between the parties are calculated with respect to a notional amount, i.e., the return on or increase in value of a particular dollar amount invested at a particular interest rate or return of an underlying asset, in a particular foreign currency, or in a “basket” of securities representing a particular index.
In a centrally cleared swap, the Fund’s ultimate Counterparty is a central clearinghouse. The Fund initially will enter into centrally cleared swaps through an executing broker. When a fund enters into a centrally cleared swap, it must deliver to the central Counterparty (via the FCM) an amount referred to as “initial margin.” Initial margin requirements are determined by the central Counterparty, but an FCM may require additional initial margin above the amount required by the central Counterparty. Initial margin deposits required upon entering into centrally cleared swaps are satisfied by cash or securities as collateral at the FCM. Securities deposited as initial margin are designated on the Schedule of Investments and cash deposited is recorded on the Statement of Assets and Liabilities. During the term of a cleared swap agreement, a “variation margin” amount may be required to be paid by the Fund or may be received by the Fund, based on the daily change in price of the underlying reference instrument subject to the swap agreement and is recorded as a receivable or payable for variation margin in the Statement of Assets and Liabilities until the centrally cleared swap is terminated at which time a realized gain or loss is recorded.
A CDS is an agreement between Counterparties to exchange the credit risk of an issuer. A buyer of a CDS is said to buy protection by paying a fixed payment over the life of the agreement and in some situations an upfront payment to the seller of the CDS. If a defined credit event occurs (such as payment default or bankruptcy), the Fund as a protection buyer would cease paying its fixed payment, the Fund would deliver eligible bonds issued by the reference entity to the seller, and the seller would pay the full notional value, or the “par value”, of the referenced obligation to the Fund. A seller of a CDS is said to sell protection and thus would receive a fixed payment over the life of the agreement and an upfront payment, if applicable. If a credit event occurs, the Fund as a protection seller would cease to receive the fixed payment stream, the Fund would pay the buyer “par value” or the full notional value of the referenced obligation, and the Fund would receive the eligible bonds issued by the reference entity. In turn, these bonds may be sold in order to realize a recovery value. Alternatively, the seller of the CDS and its Counterparty may agree to net the notional amount and the market value of the bonds and make a cash payment equal to the difference to the buyer of protection. If no credit event occurs, the Fund receives the fixed payment over the life of the agreement. As the seller, the Fund would effectively add leverage to its portfolio because, in addition to its total net assets, the Fund would be subject to investment exposure on the notional amount of the CDS. In connection with these agreements, cash and securities may be identified as collateral in accordance with the terms of the respective swap agreements to provide assets of value and recourse in the event of default under the swap agreement or bankruptcy/insolvency of a party to the swap agreement. If a Counterparty becomes bankrupt or otherwise fails to perform its obligations due to financial difficulties, the Fund may experience significant delays in obtaining any recovery in a bankruptcy or other reorganization proceeding. The Fund may obtain only limited recovery or may obtain no recovery in such circumstances. The Fund’s maximum risk of loss from Counterparty risk, either as the protection seller or as the protection buyer, is the value of the contract. The risk may be mitigated by having a master netting arrangement between the Fund and the Counterparty and by the designation of collateral by the Counterparty to cover the Fund’s exposure to the Counterparty.
Implied credit spreads represent the current level at which protection could be bought or sold given the terms of the existing CDS contract and serve as an indicator of the current status of the payment/performance risk of the CDS. An implied spread that has widened or increased since entry into the initial contract may indicate a deteriorating credit profile and increased risk of default for the reference entity. A declining or narrowing spread may indicate an improving credit profile or decreased risk of default for the reference entity. Alternatively, credit spreads may increase or decrease reflecting the general tolerance for risk in the credit markets.
An interest rate swap is an agreement between Counterparties pursuant to which the parties exchange a floating rate payment for a fixed rate payment based on a specified notional amount.
23 Invesco Unconstrained Bond Fund
Changes in the value of centrally cleared and OTC swap agreements are recognized as unrealized gains (losses) in the Statement of Operations by “marking to market” on a daily basis to reflect the value of the swap agreement at the end of each trading day. Payments received or paid at the beginning of the agreement are reflected as such on the Statement of Assets and Liabilities and may be referred to as upfront payments. The Fund accrues for the fixed payment stream and amortizes upfront payments, if any, on swap agreements on a daily basis with the net amount, recorded as a component of realized gain (loss) on the Statement of Operations. A liquidation payment received or made at the termination of a swap agreement is recorded as realized gain (loss) on the Statement of Operations. The Fund segregates liquid securities having a value at least equal to the amount of the potential obligation of a Fund under any swap transaction. Entering into these agreements involves, to varying degrees, lack of liquidity and elements of credit, market, and Counterparty risk in excess of amounts recognized on the Statement of Assets and Liabilities. Such risks involve the possibility that a swap is difficult to sell or liquidate; the Counterparty does not honor its obligations under the agreement and unfavorable interest rates and market fluctuations. It is possible that developments in the swaps market, including potential government regulation, could adversely affect the Fund’s ability to terminate existing swap agreements or to realize amounts to be received under such agreements. A short position in a security poses more risk than holding the same security long. As there is no limit on how much the price of the security can increase, the Fund’s exposure is unlimited.
Notional amounts of each individual credit default swap agreement outstanding as of October 31, 2015 for which the Fund is the seller of protection are disclosed in the open swap agreements table. These potential amounts would be partially offset by any recovery values of the respective referenced obligations, upfront payments received upon entering into the agreement, or net amounts received from the settlement of buy protection credit default swap agreements entered into by the Fund for the same referenced entity or entities.
| Q. | Leverage Risk — The Fund may utilize leverage to seek to enhance the yield of the Fund by borrowing. There are risks associated with borrowing in an effort to increase the yield and distributions on the shares, including that the costs of the financial leverage may exceed the income from investments made with such leverage, the higher volatility of the net asset value of the shares, and that fluctuations in the interest rates on the borrowing may affect the yield and distributions to the shareholders. There can be no assurance that the Fund’s leverage strategy will be successful. |
| R. | Other Risks — The Fund is non-diversified and may invest in securities of fewer issuers than if it were diversified. Thus, the value of the Fund’s shares may vary more widely and the Fund may be subject to greater market and credit risk than if the Fund invested more broadly. |
The Fund may invest in lower-quality debt securities, i.e., “junk bonds”. Investments in lower-rated securities or unrated securities of comparable quality tend to be more sensitive to economic conditions than higher rated securities. Junk bonds involve a greater risk of default by the issuer because such securities are generally unsecured and are often subordinated to other creditors’ claim.
| S. | Collateral — To the extent the Fund has designated or segregated a security as collateral and that security is subsequently sold, it is the Fund’s practice to replace such collateral no later than the next business day. |
NOTE 2—Advisory Fees and Other Fees Paid to Affiliates
The Trust has entered into a master investment advisory agreement with Invesco Advisers, Inc. (the “Adviser” or “Invesco”). Under the terms of the investment advisory agreement, the Fund pays an advisory fee to the Adviser based on the annual rate of the Fund’s average daily net assets as follows:
| | | | |
| Average Daily Net Assets | | Rate | |
First $1 billion | | | 0.70% | |
Next $3.5 billion | | | 0.65% | |
Over $4.5 billion | | | 0.55% | |
For the year ended October 31, 2015, the effective advisory fees incurred by the Fund was 0.70%.
Under the terms of a master sub-advisory agreement between the Adviser and each of Invesco Asset Management Deutschland GmbH, Invesco Asset Management Limited, Invesco Asset Management (Japan) Limited, Invesco Hong Kong Limited, Invesco Senior Secured Management, Inc., Invesco Canada Ltd. and Invesco PowerShares Capital Management LLC (collectively, the “Affiliated Sub-Advisers”) the Adviser, not the Fund, may pay 40% of the fees paid to the Adviser to any such Affiliated Sub-Adviser(s) that provide(s) discretionary investment management services to the Fund based on the percentage of assets allocated to such Affiliated Sub-Adviser(s).
The Adviser has contractually agreed, through at least February 28, 2017, to waive advisory fees and/or reimburse expenses of all shares to the extent necessary to limit total annual fund operating expenses after fee waiver and/or expense reimbursement (excluding certain items discussed below) of Class A, Class C, Class R, Class Y, Class R5 and Class R6 shares to 1.03%, 1.78%, 1.28%, 0.78%, 0.78% and 0.78%, respectively, of average daily net assets. In determining the Adviser’s obligation to waive advisory fees and/or reimburse expenses, the following expenses are not taken into account, and could cause the total annual fund operating expenses after fee waiver and/or expense reimbursement to exceed the numbers reflected above: (1) interest; (2) taxes; (3) dividend expense on short sales; (4) extraordinary or non-routine items, including litigation expenses; and (5) expenses that the Fund has incurred but did not actually pay because of an expense offset arrangement. Acquired Fund Fees and Expenses are not operating expenses of the Fund directly, but are fees and expenses, including management fees of the investment companies in which the Fund invests. As a result, the total annual fund operating expenses after expense reimbursement may exceed the expense limits above. Unless Invesco continues the fee waiver agreement, it will terminate on February 28, 2017. The fee waiver agreement cannot be terminated during its term.
Further, the Adviser has contractually agreed, through at least June 30, 2017, to waive the advisory fee payable by the Fund in an amount equal to 100% of the net advisory fees the Adviser receives on the Fund’s investments in certain affiliated funds.
For the year ended October 31, 2015, the Adviser waived advisory fees of $306,481 and reimbursed class level expenses of $3,540, $22, $3, $3,514, $10 and $10 of Class A, Class C, Class R, Class Y, Class R5 and Class R6 shares, respectively.
The Trust has entered into a master administrative services agreement with Invesco pursuant to which the Fund has agreed to pay Invesco for certain administrative costs incurred in providing accounting services to the Fund. For the year ended October 31, 2015, expenses incurred under the agreement are shown in the Statement of Operations as Administrative services fees.
24 Invesco Unconstrained Bond Fund
The Trust has entered into a transfer agency and service agreement with Invesco Investment Services, Inc. (“IIS”) pursuant to which the Fund has agreed to pay IIS a fee for providing transfer agency and shareholder services to the Fund and reimburse IIS for certain expenses incurred by IIS in the course of providing such services. IIS may make payments to intermediaries that provide omnibus account services, sub-accounting services and/or networking services. All fees payable by IIS to intermediaries that provide omnibus account services or sub-accounting are charged back to the Fund, subject to certain limitations approved by the Trust’s Board of Trustees. For the year ended October 31, 2015, expenses incurred under the agreement are shown in the Statement of Operations as Transfer agent fees.
The Trust has entered into master distribution agreements with Invesco Distributors, Inc. (“IDI”) to serve as the distributor for the Class A, Class C, Class R, Class Y, Class R5 and Class R6 shares of the Fund. The Trust has adopted plans pursuant to Rule 12b-1 under the 1940 Act with respect to the Fund’s Class A, Class C and Class R shares (collectively the “Plans”). The Fund, pursuant to the Plans, pays IDI compensation at the annual rate of 0.25% of the Fund’s average daily net assets of Class A shares, 1.00% of the average daily net assets of Class C shares and 0.50% of the average daily net assets of Class R shares. Of the Plan payments, up to 0.25% of the average daily net assets of each class of shares may be paid to furnish continuing personal shareholder services to customers who purchase and own shares of such classes. Any amounts not paid as a service fee under the Plans would constitute an asset-based sales charge. Rules of the Financial Industry Regulatory Authority (“FINRA”) impose a cap on the total sales charges, including asset-based sales charges, that may be paid by any class of shares of the Fund. For the year ended October 31, 2015, expenses incurred under the Plans are shown in the Statement of Operations as Distribution fees.
Front-end sales commissions and CDSC (collectively, the “sales charges”) are not recorded as expenses of the Fund. Front-end sales commissions are deducted from proceeds from the sales of Fund shares prior to investment in Class A shares of the Fund. CDSC are deducted from redemption proceeds prior to remittance to the shareholder. During the year ended October 31, 2015, IDI advised the Fund that IDI retained $497 in front-end sales commissions from the sale of Class A shares and $289 from Class C shares, for CDSC imposed upon redemptions by shareholders.
Certain officers and trustees of the Trust are officers and directors of the Adviser, IIS and/or IDI.
NOTE 3—Additional Valuation Information
GAAP defines fair value as the price that would be received to sell an asset or paid to transfer a liability in an orderly transaction between market participants at the measurement date, under current market conditions. GAAP establishes a hierarchy that prioritizes the inputs to valuation methods, giving the highest priority to readily available unadjusted quoted prices in an active market for identical assets (Level 1) and the lowest priority to significant unobservable inputs (Level 3), generally when market prices are not readily available or are unreliable. Based on the valuation inputs, the securities or other investments are tiered into one of three levels. Changes in valuation methods may result in transfers in or out of an investment’s assigned level:
| | Level 1 — | Prices are determined using quoted prices in an active market for identical assets. |
| | Level 2 — | Prices are determined using other significant observable inputs. Observable inputs are inputs that other market participants may use in pricing a security. These may include quoted prices for similar securities, interest rates, prepayment speeds, credit risk, yield curves, loss severities, default rates, discount rates, volatilities and others. |
| | Level 3 — | Prices are determined using significant unobservable inputs. In situations where quoted prices or observable inputs are unavailable (for example, when there is little or no market activity for an investment at the end of the period), unobservable inputs may be used. Unobservable inputs reflect the Fund’s own assumptions about the factors market participants would use in determining fair value of the securities or instruments and would be based on the best available information. |
The following is a summary of the tiered valuation input levels, as of October 31, 2015. The level assigned to the securities valuations may not be an indication of the risk or liquidity associated with investing in those securities. Because of the inherent uncertainties of valuation, the values reflected in the financial statements may materially differ from the value received upon actual sale of those investments.
| | | | | | | | | | | | | | | | |
| | | Level 1 | | | Level 2 | | | Level 3 | | | Total | |
Equity Securities | | $ | 319,291 | | | $ | — | | | $ | — | | | $ | 319,291 | |
U.S. Treasury Securities | | | — | | | | 494,348 | | | | — | | | | 494,348 | |
Corporate Debt Securities | | | — | | | | 6,684,942 | | | | — | | | | 6,684,942 | |
Credit-Linked Securities | | | — | | | | 382,514 | | | | — | | | | 382,514 | |
U.S. Government Sponsored Agency Securities | | | — | | | | 136,498 | | | | — | | | | 136,498 | |
Asset-Backed Securities | | | — | | | | 15,984,526 | | | | — | | | | 15,984,526 | |
Municipal Obligations | | | — | | | | 289,886 | | | | — | | | | 289,886 | |
Foreign Debt Securities | | | — | | | | 1,939,477 | | | | — | | | | 1,939,477 | |
Foreign Sovereign Debt Securities | | | — | | | | 199,050 | | | | — | | | | 199,050 | |
Options Purchased | | | — | | | | 527,427 | | | | — | | | | 527,427 | |
| | | $ | 319,291 | | | $ | 26,638,668 | | | $ | — | | | $ | 26,957,959 | |
Forward Foreign Currency Contracts* | | | — | | | | 42,860 | | | | — | | | | 42,860 | |
Futures Contracts* | | | (29,980 | ) | | | — | | | | — | | | | (29,980 | ) |
Options Written* | | | — | | | | (10,669 | ) | | | — | | | | (10,669 | ) |
Swap Agreements* | | | — | | | | 238,648 | | | | — | | | | 238,648 | |
Total Investments | | $ | 289,311 | | | $ | 26,909,507 | | | $ | — | | | $ | 27,198,818 | |
| * | Forward foreign currency contracts, futures contracts and swap agreements are valued at unrealized appreciation (depreciation). Options written are shown at value. |
25 Invesco Unconstrained Bond Fund
NOTE 4—Derivative Investments
Value of Derivative Investments at Period-End
The table below summarizes the value of the Fund’s derivative investments, detailed by primary risk exposure, held as of October 31, 2015:
| | | | | | | | |
| | | Value | |
| Risk Exposure/Derivative Type | | Assets | | | Liabilities | |
Credit risk: | | | | | | | | |
Swap agreements(a)(b) | | $ | — | | | $ | (17,194 | ) |
Currency risk: | | | | | | | | |
Forward foreign currency contracts(c) | | | 107,699 | | | | (64,839 | ) |
Options purchased(d) | | | 37,590 | | | | — | |
Options written(e) | | | — | | | | (10,669 | ) |
Interest rate risk: | | | | | | | | |
Futures contracts(f) | | | 6,571 | | | | (36,551 | ) |
Options purchased(d) | | | 489,837 | | | | — | |
Swap agreements(a)(b) | | | 225,690 | | | | (100,965 | ) |
Equity risk: | | | | | | | | |
Swap agreements(a) | | | 131,117 | | | | — | |
Total | | $ | 998,504 | | | $ | (230,218 | ) |
| (a) | Values are disclosed on the Statement of Assets and Liabilities under the captions Unrealized appreciation on swap agreements — OTC and Unrealized depreciation on swap agreements — OTC. |
| (b) | Includes cumulative appreciation (depreciation) of centrally cleared swap agreements. Only current day’s variation margin receivable (payable) is reported within the Statement of Assets and Liabilities. |
| (c) | Values are disclosed on the Statement of Assets and Liabilities under the captions Unrealized appreciation on forward foreign currency contracts outstanding and Unrealized depreciation on forward foreign currency contracts outstanding. |
| (d) | Options purchased at value as reported in the Schedule of Investments. |
| (e) | Values are disclosed on the Statement of Assets and Liabilities under the caption Options written, at value. |
| (f) | Includes cumulative appreciation (depreciation) of futures contracts. Only current day’s variation margin receivable (payable) is reported within the Statement of Assets and Liabilities. |
Effect of Derivative Investments for the year ended October 31, 2015
The table below summarizes the gains (losses) on derivative investments, detailed by primary risk exposure, recognized in earnings during the period:
| | | | | | | | | | | | | | | | | | | | |
| | | Location of Gain (Loss) on
Statement of Operations | |
| | | Forward
Foreign Currency
Contracts | | | Futures
Contracts | | | Options
Purchased(a) | | | Options
Written | | | Swap
Agreements | |
Realized Gain (Loss): | | | | | | | | | | | | | | | | | | | | |
Credit risk | | $ | 247,489 | | | $ | — | | | $ | — | | | $ | — | | | $ | 75,143 | |
Currency risk | | | — | | | | — | | | | (8,488 | ) | | | 631 | | | | — | |
Equity risk | | | — | | | | — | | | | — | | | | — | | | | 15,905 | |
Interest rate risk | | | — | | | | (243,164 | ) | | | (43,050 | ) | | | — | | | | (88,781 | ) |
Change in Net Unrealized Appreciation (Depreciation): | | | | | | | | | | | | | | | | | | | | |
Credit risk | | | — | | | | — | | | | — | | | | | | | | (17,556 | ) |
Currency risk | | | 19,618 | | | | — | | | | (7,251 | ) | | | 2,184 | | | | — | |
Equity risk | | | — | | | | — | | | | — | | | | — | | | | 129,205 | |
Interest rate risk | | | — | | | | (45,119 | ) | | | (209,747 | ) | | | — | | | | 124,725 | |
Total | | $ | 267,107 | | | $ | (288,283 | ) | | $ | (268,536 | ) | | $ | 2,815 | | | $ | 238,641 | |
| (a) | Options purchased are included in the net realized gain (loss) from investment securities and the change in net unrealized appreciation (depreciation) of investment securities. |
The table below summarizes the average notional value of forward foreign currency contracts, futures contracts, options purchased, options written and swap agreements outstanding during the period.
| | | | | | | | | | | | | | | | | | | | |
| | | Forward
Foreign Currency
Contracts | | | Futures
Contracts | | | Options
Purchased | | | Options
Written | | | Swap
Agreements | |
Average notional value | | $ | 7,300,296 | | | $ | 12,670,638 | | | $ | 20,757,871 | | | $ | 1,717,639 | | | $ | 22,635,074 | |
26 Invesco Unconstrained Bond Fund
| | | | | | | | | | | | | | | | | | | | | | | | | | |
| Open Forward Foreign Currency Contracts | |
Settlement
Date | | Counterparty | | Contract to | | | Notional
Value | | | Unrealized
Appreciation
(Depreciation) | |
| | | Deliver | | | Receive | | | |
11/04/15 | | State Street Bank and Trust Co. | | | BRL | | | | 820,000 | | | | USD | | | | 202,399 | | | $ | 212,368 | | | $ | (9,969 | ) |
11/04/15 | | State Street Bank and Trust Co. | | | USD | | | | 210,770 | | | | BRL | | | | 820,000 | | | | 212,369 | | | | 1,599 | |
11/16/15 | | Deutsche Bank Securities Inc. | | | INR | | | | 25,200,000 | | | | USD | | | | 382,397 | | | | 384,793 | | | | (2,396 | ) |
11/17/15 | | Deutsche Bank Securities Inc. | | | JPY | | | | 32,250,000 | | | | KRW | | | | 313,470,000 | | | | 264,349 | | | | 7,206 | |
11/17/15 | | Deutsche Bank Securities Inc. | | | JPY | | | | 64,550,000 | | | | USD | | | | 539,207 | | | | 535,027 | | | | 4,180 | |
11/17/15 | | Deutsche Bank Securities Inc. | | | KRW | | | | 923,406,800 | | | | JPY | | | | 96,800,000 | | | | 773,967 | | | | (6,313 | ) |
11/17/15 | | Deutsche Bank Securities Inc. | | | USD | | | | 523,404 | | | | KRW | | | | 609,936,800 | | | | 534,134 | | | | 10,730 | |
11/17/15 | | State Street Bank and Trust Co. | | | EUR | | | | 2,538,000 | | | | USD | | | | 2,831,629 | | | | 2,791,739 | | | | 39,890 | |
11/17/15 | | State Street Bank and Trust Co. | | | USD | | | | 894,911 | | | | EUR | | | | 799,356 | | | | 879,272 | | | | (15,639 | ) |
12/02/15 | | State Street Bank and Trust Co. | | | BRL | | | | 820,000 | | | | USD | | | | 208,853 | | | | 210,375 | | | | (1,522 | ) |
12/04/15 | | Goldman Sachs International | | | MYR | | | | 1,680,000 | | | | USD | | | | 396,301 | | | | 390,656 | | | | 5,645 | |
12/04/15 | | Goldman Sachs International | | | USD | | | | 381,905 | | | | MYR | | | | 1,680,000 | | | | 390,656 | | | | 8,751 | |
01/06/16 | | Barclays Bank PLC | | | EUR | | | | 456,000 | | | | MXN | | | | 8,649,381 | | | | 511,356 | | | | 18,848 | |
01/06/16 | | Barclays Bank PLC | | | EUR | | | | 283,576 | | | | USD | | | | 318,502 | | | | 312,269 | | | | 6,233 | |
01/06/16 | | Barclays Bank PLC | | | MXN | | | | 11,160,000 | | | | USD | | | | 666,890 | | | | 672,213 | | | | (5,323 | ) |
01/06/16 | | Barclays Bank PLC | | | USD | | | | 933,255 | | | | EUR | | | | 826,000 | | | | 909,578 | | | | (23,677 | ) |
01/06/16 | | Barclays Bank PLC | | | USD | | | | 515,594 | | | | MXN | | | | 8,615,000 | | | | 518,917 | | | | 3,323 | |
01/27/16 | | Barclays Bank PLC | | | SGD | | | | 325,000 | | | | USD | | | | 232,618 | | | | 231,324 | | | | 1,294 | |
Total Open Forward Foreign Currency Contracts — Currency Risk | | | | | | | | | | | | | | | | | | | | | | $ | 42,860 | |
| | | | | | | | | | | | | | | | | | | | |
| Open Futures Contracts | |
| Futures Contracts | | Type of
Contract | | | Number of
Contracts | | | Expiration Month | | | Notional Value | | | Unrealized
Appreciation
(Depreciation) | |
Euro–Bobl | | | Short | | | | 8 | | | | December-2015 | | | $ | (1,138,585 | ) | | $ | (7,942 | ) |
Euro–Bond | | | Short | | | | 2 | | | | December-2015 | | | | (345,768 | ) | | | (6,868 | ) |
Euro–Schatz | | | Short | | | | 20 | | | | December-2015 | | | | (2,451,891 | ) | | | (4,606 | ) |
U.S. Treasury 2 Year Notes | | | Short | | | | 14 | | | | December-2015 | | | | (3,061,188 | ) | | | 1,720 | |
U.S. Treasury 5 Year Notes | | | Short | | | | 44 | | | | December-2015 | | | | (5,270,031 | ) | | | 170 | |
U.S. Treasury 10 Year Notes | | | Long | | | | 12 | | | | December-2015 | | | | 1,532,250 | | | | (15,601 | ) |
U.S. Treasury 30 Year Notes | | | Long | | | | 3 | | | | December-2015 | | | | 469,313 | | | | 4,681 | |
U.S. Treasury Ultra Bonds | | | Short | | | | 1 | | | | December-2015 | | | | (159,750 | ) | | | (1,534 | ) |
Total Futures Contracts — Interest Rate | | | | | | | | | | | | | | | | | | $ | (29,980 | ) |
| | | | | | | | | | | | | | | | | | | | | | | | | | | | | | |
| Open Over-The-Counter Foreign Currency Options Written | |
| Description | | Type of
Contract | | | Counterparty | | Expiration
Date | | | Strike Price | | | Premiums
Received | | | Notional Value | | | Value | | | Unrealized Appreciation (Depreciation) | |
EUR versus USD | | | Put | | | Deutsche Bank Securities Inc. | | | 03/23/16 | | | | USD 1,000 | | | $ | (2,223 | ) | | | EUR 470,000 | | | $ | (1,999 | ) | | $ | 224 | |
USD versus KRW | | | Call | | | Goldman Sachs International | | | 01/27/16 | | | | KRW 1,202 | | | | (7,730 | ) | | | USD 1,050,000 | | | | (8,391 | ) | | | (661 | ) |
USD versus SGD | | | Call | | | Deutsche Bank Securities Inc. | | | 12/23/15 | | | | SGD 1,525 | | | | (2,900 | ) | | | USD 1,050,000 | | | | (279 | ) | | | 2,621 | |
Total Foreign Currency Options Written — Currency Risk | | | | (12,853 | ) | | | | | | $ | (10,669 | ) | | $ | 2,184 | |
Currency Abbreviations:
| | |
| BRL | | – Brazilian Real |
| EUR | | – Euro |
| INR | | – Indian Rupee |
| | |
| JPY | | – Japanese Yen |
| KRW | | – South Korean Won |
| MXN | | – Mexican New Peso |
| | |
| MYR | | – Malaysian Ringgit |
| SGD | | – Singapore Dollar |
| USD | | – U.S. Dollar |
27 Invesco Unconstrained Bond Fund
| | | | | | | | | | | | | | | | | | | | | | | | |
| Options Written Transactions | |
| | | Call Options | | | Put Options | |
| | | Notional Value | | | Premiums
Received | | | Notional Value | | | Premiums
Received | |
Beginning of period | | | USD | | | | — | | | $ | — | | | | EUR | | | | — | | | $ | — | |
Written | | | USD | | | | 4,355,000 | | | | 16,889 | | | | EUR | | | | 4,605,000 | | | | 19,652 | |
Closed | | | USD | | | | (1,520,000 | ) | | | (4,142 | ) | | | EUR | | | | (3,685,000 | ) | | | (15,548 | ) |
Expired | | | USD | | | | (735,000 | ) | | | (2,117 | ) | | | EUR | | | | (450,000 | ) | | | (1,881 | ) |
End of period | | | USD | | | | 2,100,000 | | | $ | 10,630 | | | | EUR | | | | 470,000 | | | $ | 2,223 | |
| | | | | | | | | | | | | | | | | | | | | | | | | | | | | | |
| Open Centrally Cleared Credit Default Swap Agreements-Credit Risk | |
| Counterparty/Clearinghouse | | Reference Entity | | Buy/Sell Protection | | | (Pay)/Receive Fixed Rate | | | Termination
Date | | | Implied
Credit
Spread(a) | | | Notional Value | | | Upfront
Payments
Paid (Received) | | | Unrealized Appreciation (Depreciation) | |
Credit Suisse Securities (USA) LLC/CME | | Markit CDX North America High Yield Index, Series 24 | | | Buy | | | | (5.00 | )% | | | 06/20/20 | | | | 3.59 | % | | $ | 1,287,000 | | | $ | (64,085 | ) | | $ | (9,461 | ) |
| | | | | | | | | | | | | | | | | | | | | | |
| Open Centrally Cleared Interest Rate Swap Agreements | |
| Counterparty/Clearinghouse | | Pay/Receive
Floating Rate | | Floating Rate Index | | | Fixed
Rate | | | Termination
Date | | | Notional Value | | | Unrealized
Appreciation (Depreciation) | |
Credit Suisse Securities (USA) LLC/CME | | Receive | | | 3 Month USD LIBOR | | | | 0.741 | % | | | 10/29/17 | | | $ | (6,500,000 | ) | | $ | 13,469 | |
Credit Suisse Securities (USA) LLC/CME | | Receive | | | 3 Month USD LIBOR | | | | 1.509 | | | | 02/02/19 | | | | (17,275,000 | ) | | | (5,285 | ) |
Credit Suisse Securities (USA) LLC/CME | | Receive | | | 3 Month USD LIBOR | | | | 1.734 | | | | 10/05/22 | | | | (2,700,000 | ) | | | 11,560 | |
Credit Suisse Securities (USA) LLC/CME | | Receive | | | 3 Month USD LIBOR | | | | 2.070 | | | | 03/21/23 | | | | (3,790,000 | ) | | | (2,617 | ) |
Credit Suisse Securities (USA) LLC/CME | | Receive | | | 3 Month USD LIBOR | | | | 2.425 | | | | 07/27/25 | | | | (1,150,000 | ) | | | (37,409 | ) |
Credit Suisse Securities (USA) LLC/CME | | Receive | | | 3 Month USD LIBOR | | | | 2.483 | | | | 07/20/25 | | | | (300,000 | ) | | | (11,363 | ) |
Credit Suisse Securities (USA) LLC/CME | | Receive | | | 3 Month USD LIBOR | | | | 2.456 | | | | 07/17/25 | | | | (1,250,000 | ) | | | (44,291 | ) |
Credit Suisse Securities (USA) LLC/CME | | Pay | | | 3 Month USD LIBOR | | | | 1.55 | | | | 02/01/19 | | | | 12,250,000 | | | | 103,941 | |
Credit Suisse Securities (USA) LLC/CME | | Pay | | | 3 Month USD LIBOR | | | | 1.60 | | | | 02/02/19 | | | | 9,190,000 | | | | 93,940 | |
Credit Suisse Securities (USA) LLC/CME | | Pay | | | 3 Month USD LIBOR | | | | 1.948 | | | | 04/13/23 | | | | 970,000 | | | | 2,780 | |
Total Interest Rate Swap Agreements — Interest Rate Risk | | | | $124,725 | |
Abbreviations:
| | |
| CME | | – Chicago Mercantile Exchange |
| LIBOR | | – London Interbank Offer Rate |
| | |
| EUR | | – Euro |
| SGD | | – Singapore Dollar |
| | | | | | | | | | | | | | | | | | | | | | | | | | | | | | |
| Open Over-The-Counter Credit Default Swap Agreements | |
| Counterparty | | Reference Entity | | Buy/Sell Protection | | | (Pay)/Receive Fixed Rate | | | Termination Date | | | Implied
Credit
Spread(a) | | | Notional Value | | | Upfront
Payments Paid (Received) | | | Unrealized Appreciation (Depreciation) | |
Goldman Sachs International | | McKesson Corp. | | | Buy | | | | (1.00 | )% | | | 03/20/19 | | | | 0.16 | % | | $ | (300,000 | ) | | $ | (7,846 | ) | | $ | (682 | ) |
J.P. Morgan Chase Bank, N.A. | | K. Hovnanian Enterprise Inc. | | | Buy | | | | (5.00 | ) | | | 09/20/20 | | | | 12.22 | | | | (131,000 | ) | | | 40,026 | | | | (7,051 | ) |
Total Credit Default Swap Agreements — Credit Risk | | | | | | | $ | 32,180 | | | $ | (7,733 | ) |
| (a) | Implied credit spreads represent the current level as of October 31, 2015 at which protection could be bought or sold given the terms of the existing credit default swap contract and serve as an indicator of the current status of the payment/performance risk of the credit default swap contract. An implied credit spread that has widened or increased since entry into the initial contract may indicate a deteriorating credit profile and increased risk of default for the reference entity. A declining or narrowing spread may indicate an improving credit profile or decreased risk of default for the reference entity. Alternatively, credit spreads may increase or decrease reflecting the general tolerance for risk in the credit markets generally. |
28 Invesco Unconstrained Bond Fund
| | | | | | | | | | | | | | | | | | | | | | |
| Open Over-The-Counter Total Return Swap Agreements | |
| Description | | Type of
Contract | | | Counterparty | | Number of
Contracts | | | Termination
Date | | | Notional Value | | | Unrealized
Appreciation | |
Receive a return equal to the Euro Liquid High Yield Index and pay a floating rate equal to the 3 Month EURIBOR | | | Long | | | J.P. Morgan Chase Bank, N.A. | | | 23,200 | | | | 12/20/15 | | | | EUR 2,320,000 | | | $ | 18,972 | |
Receive a return equal to the Markit iBoxx USD Liquid Investment Grade and pay a floating rate equal to the 3 Month USD LIBOR | | | Long | | | Goldman Sachs International | | | 14,000 | | | | 12/21/15 | | | | $1,400,000 | | | | 29,402 | |
Receive a return equal to the Markit iBoxx USD Liquid Investment Grade and pay a floating rate equal to the 3 Month USD LIBOR | | | Long | | | Morgan Stanley & Co. International PLC | | | 12,000 | | | | 12/21/15 | | | | 1,200,000 | | | | 22,829 | |
Receive a return equal to the Markit iBoxx USD Liquid Investment Grade and pay a floating rate equal to the 3 Month USD LIBOR | | | Long | | | Morgan Stanley & Co. International PLC | | | 13,000 | | | | 12/21/15 | | | | 1,300,000 | | | | 19,354 | |
Receive a return equal to the Markit iBoxx USD Liquid Leverage Loan Index and pay a floating rate equal to the 3 Month USD LIBOR | | | Long | | | Morgan Stanley & Co. International PLC | | | 5,000 | | | | 12/21/15 | | | | 500,000 | | | | 2,370 | |
Receive a return equal to the Markit iBoxx USD Liquid Leverage Loan Index and pay a floating rate equal to the 3 Month USD LIBOR | | | Long | | | Morgan Stanley & Co. International PLC | | | 7,000 | | | | 12/21/15 | | | | 700,000 | | | | 2,614 | |
Receive a return equal to the Markit iBoxx USD Liquid Leverage Loan Index and pay a floating rate equal to the 3 Month USD LIBOR | | | Long | | | Morgan Stanley & Co. International PLC | | | 20,000 | | | | 12/20/15 | | | | 2,000,000 | | | | 17,695 | |
Receive a return equal to the Markit iBoxx USD Liquid Leverage Loan Index and pay a floating rate equal to the 3 Month USD LIBOR | | | Long | | | J.P. Morgan Chase Bank, N.A. | | | 20,000 | | | | 12/21/15 | | | | 2,000,000 | | | | 11,829 | |
Receive a return equal to the S&P US Leverage Loan Index and pay a floating rate equal to the 3 Month USD LIBOR | | | Long | | | J.P. Morgan Chase Bank, N.A. | | | 13,000 | | | | 12/20/15 | | | | 1,300,000 | | | | 6,052 | |
Total Over-The-Counter Total Return Swap Agreements — Equity Risk | | | $ | 131,117 | |
Abbreviations:
| | |
| EUR | | – Euro |
| EURIBOR | | – Euro Interbank Offer Rate |
| LIBOR | | – London Interbank Offer Rate |
| USD | | – U.S. Dollar |
Offsetting Assets and Liabilities
Accounting Standards Update (“ASU”) No. 2011-11, Disclosures about Offsetting Assets and Liabilities, which was subsequently clarified in Financial Accounting Standards Board ASU 2013-01 “Clarifying the Scope of Disclosures about Offsetting Assets and Liabilities” is intended to enhance disclosures about financial instruments and derivative instruments that are subject to offsetting arrangements on the Statement of Assets and Liabilities and to enable investors to better understand the effect of those arrangements on the Fund’s financial position. In order for an arrangement to be eligible for netting, the Fund must have a basis to conclude that such netting arrangements are legally enforceable. The Fund enters into netting agreements and collateral agreements in an attempt to reduce the Fund’s Counterparty credit risk by providing for a single net settlement with a Counterparty of all financial transactions covered by the agreement in an event of default as defined under such agreement.
29 Invesco Unconstrained Bond Fund
The following tables present derivative instruments that are either subject to an enforceable netting agreement or offset by collateral arrangements as of October 31, 2015.
| | | | | | | | | | | | | | | | | | | | |
| Assets: | | | | | | |
| | | Gross amounts
of Recognized
Assets | | | Gross Amounts Not Offset in the
Statement of Assets and Liabilities | | | Net
Amount | |
Counterparty | | | Financial
Instruments | | | Collateral Received | | |
| | | | Non-Cash | | | Cash | | |
Bank of America, N.A.(a) | | $ | 44,065 | | | $ | — | | | $ | — | | | $ | — | | | $ | 44,065 | |
Barclays Bank PLC(b) | | | 29,697 | | | | (29,000 | ) | | | — | | | | — | | | | 697 | |
Citigroup Global Markets Inc.(a) | | | 62,818 | | | | — | | | | — | | | | — | | | | 62,818 | |
Credit Suisse Securities (USA) LLC/CME(c) | | | 225,690 | | | | (110,426 | ) | | | — | | | | — | | | | 115,264 | |
Deutsche Bank Securities Inc.(b) | | | 22,116 | | | | (8,708 | ) | | | — | | | | — | | | | 13,408 | |
Deutsche Bank Securities Inc.(a) | | | 333,610 | | | | (2,278 | ) | | | — | | | | — | | | | 331,332 | |
Goldman Sachs & Co.(b) | | | 14,396 | | | | — | | | | — | | | | — | | | | 14,396 | |
Goldman Sachs & Co.(a) | | | 86,934 | | | | (8,391 | ) | | | — | | | | — | | | | 78,543 | |
Goldman Sachs & Co.(d) | | | 29,402 | | | | (8,528 | ) | | | — | | | | — | | | | 20,874 | |
J.P. Morgan Securities Inc.(d) | | | 76,879 | | | | (7,051 | ) | | | — | | | | — | | | | 69,828 | |
Morgan Stanley & Co. International PLC(d) | | | 64,862 | | | | — | | | | — | | | | — | | | | 64,862 | |
State Street Bank and Trust Co.(b) | | | 41,489 | | | | (27,130 | ) | | | — | | | | — | | | | 14,359 | |
Total | | $ | 1,031,958 | | | $ | (201,512 | ) | | $ | — | | | $ | — | | | $ | 830,446 | |
| | | | | |
| | | | | | | | | | | | | | | | | | | | |
| Liabilities: | | | | | | |
| | | Gross amounts
of Recognized
Liabilities | | | Gross Amounts Not Offset in the
Statement of Assets and Liabilities | | | Net
Amount | |
Counterparty | | | Financial
Instruments | | | Collateral Pledged | | |
| | | | Non-Cash | | | Cash | | |
Barclays Bank PLC(b) | | $ | 29,000 | | | $ | (29,000 | ) | | $ | — | | | $ | — | | | $ | — | |
Credit Suisse Securities (USA) LLC/CME(c) | | | 110,426 | | | | (110,426 | ) | | | — | | | | — | | | | — | |
Deutsche Bank Securities Inc.(b) | | | 8,708 | | | | (8,708 | ) | | | — | | | | — | | | | — | |
Deutsche Bank Securities Inc.(a) | | | 2,278 | | | | (2,278 | ) | | | — | | | | — | | | | — | |
Goldman Sachs & Co.(a) | | | 8,391 | | | | (8,391 | ) | | | — | | | | — | | | | — | |
Goldman Sachs & Co.(d) | | | 8,528 | | | | (8,528 | ) | | | — | | | | — | | | | — | |
J.P. Morgan Securities Inc.(d) | | | 7,051 | | | | (7,051 | ) | | | — | | | | — | | | | — | |
State Street Bank and Trust Co.(b) | | | 27,130 | | | | (27,130 | ) | | | — | | | | — | | | | — | |
Total | | $ | 201,512 | | | $ | (201,512 | ) | | $ | — | | | $ | — | | | $ | — | |
| (a) | Options contracts — OTC Counterparty. |
| (b) | Forward foreign currency contracts Counterparty. |
| (c) | Swap agreements — centrally cleared Counterparty. Includes cumulative appreciation (depreciation). |
| (d) | Swap agreements — OTC Counterparty. |
NOTE 5—Investments in Affiliates
The Fund’s Adviser and the adviser for Invesco Floating Rate Fund are subsidiaries of Invesco Ltd. and therefore, Invesco Floating Rate Fund is considered to be affiliated with the Fund. The following is a summary of the transactions in, and earnings from, investments in Invesco Floating Rate Fund for the year ended October 31, 2015.
| | | | | | | | | | | | | | | | | | | | | | | | | | | | |
| | | Value 10/31/14 | | | Purchases
at Cost | | | Proceeds
from Sales | | | Change in
Unrealized
Appreciation
(Depreciation) | | | Realized
Gain (Loss) | | | Value 10/31/15 | | | Dividend
Income | |
Invesco Floating Rate Fund | | $ | 5,659,672 | | | $ | 97,374 | | | $ | (5,682,962 | ) | | $ | (22,354 | ) | | $ | (51,730 | ) | | $ | — | | | $ | 98,125 | |
NOTE 6—Trustees’ and Officers’ Fees and Benefits
Trustees’ and Officers’ Fees and Benefits include amounts accrued by the Fund to pay remuneration to certain Trustees and Officers of the Fund. Trustees have the option to defer compensation payable by the Fund, and Trustees’ and Officers’ Fees and Benefits also include amounts accrued by the Fund to fund such deferred compensation amounts. Those Trustees who defer compensation have the option to select various Invesco Funds in which their deferral accounts shall be deemed to be invested. Obligations under the deferred compensation plan represent unsecured claims against the general assets of the Fund.
30 Invesco Unconstrained Bond Fund
NOTE 7—Cash Balances and Borrowings
The Fund is permitted to temporarily carry a negative or overdrawn balance in its account with State Street Bank and Trust Company, the custodian bank. Such balances, if any, at period end, are shown in the Statement of Assets and Liabilities under the payable caption Amount due custodian. To compensate the custodian bank for such overdrafts, the overdrawn Fund may either (1) leave funds as a compensating balance in the account so the custodian bank can be compensated by earning the additional interest; or (2) compensate by paying the custodian bank at a rate agreed upon by the custodian bank and Invesco, not to exceed the contractually agreed upon rate.
During the year ended October 31, 2015, the average daily balance of borrowing under the Reverse Repurchase Agreements for 313 days, was $751,383 with a weighted interest rate of 2.10% and interest expense of $8,043.
Reverse repurchase agreements outstanding as of October 31, 2015 were as follows:
| | | | | | | | | | | | | | | | |
| Counterparty | | Interest
Rate | | | Maturity Date | | | Face Value | | | Face Value
Including Accrued
Interest | |
Royal Bank of Canada | | | 1.93 | % | | | December 23, 2015 | | | $ | 421,000 | | | $ | 423,135 | |
NOTE 8—Distributions to Shareholders and Tax Components of Net Assets
Tax Character of Distributions to Shareholders Paid During the Fiscal Year Ended October 31, 2015 and the Period October 14, 2014 (Commencement Date) Through October 31, 2014:
| | | | | | | | |
| | | 2015 | | | 2014 | |
Ordinary income | | $ | 648,010 | | | $ | — | |
Return of capital | | | 43,425 | | | | — | |
Long-term capital gain | | | 20,899 | | | | — | |
Total distributions | | $ | 712,334 | | | $ | — | |
Tax Components of Net Assets at Period-End:
| | | | |
| | | 2015 | |
Net unrealized appreciation (depreciation) — investments | | | (308,589 | ) |
Net unrealized appreciation (depreciation) — other investments | | | 183,908 | |
Temporary book/tax differences | | | (1,442 | ) |
Capital loss carryforward | | | (38,128 | ) |
Shares of beneficial interest | | | 26,203,391 | |
Total net assets | | | 26,039,140 | |
The difference between book-basis and tax-basis unrealized appreciation (depreciation) is due to differences in the timing of recognition of gains and losses on investments for tax and book purposes. The Fund’s net unrealized appreciation (depreciation) difference is attributable primarily to wash sales and amortization of bond premiums.
The temporary book/tax differences are a result of timing differences between book and tax recognition of income and/or expenses. The Fund’s temporary book/tax differences are the result of the trustee deferral of compensation and retirement plan benefits.
Capital loss carryforward is calculated and reported as of a specific date. Results of transactions and other activity after that date may affect the amount of capital loss carryforward actually available for the Fund to utilize. The ability to utilize capital loss carryforward in the future may be limited under the Internal Revenue Code and related regulations based on the results of future transactions.
The Fund has a capital loss carryforward as of October 31, 2015, as follows:
| | | | | | | | | | | | |
| Capital Loss Carryforward | |
| | | Short-Term | | | Long-Term | | | Total | |
Not subject to expiration | | $ | — | | | $ | 38,128 | | | $ | 38,128 | |
NOTE 9—Investment Securities
The aggregate amount of investment securities (other than short-term securities, U.S. Treasury obligations and money market funds, if any) purchased and sold by the Fund during the year ended October 31, 2015 was $42,637,368 and $32,248,885, respectively. During the same period, purchases and sales of U.S. Treasury obligations were $779,094 and $781,292, respectively. Cost of investments on a tax basis includes the adjustments for financial reporting purposes as of the most recently completed federal income tax reporting period-end.
| | | | |
| Unrealized Appreciation (Depreciation) of Investment Securities on a Tax Basis | |
Aggregate unrealized appreciation of investment securities | | $ | 330,579 | |
Aggregate unrealized (depreciation) of investment securities | | | (639,168 | ) |
Net unrealized appreciation (depreciation) of investment securities | | $ | (308,589 | ) |
Cost of investments for tax purposes is $27,266,548.
31 Invesco Unconstrained Bond Fund
NOTE 10—Reclassification of Permanent Differences
Primarily as a result of differing book/tax treatment of stock issuance cost, foreign currency transactions, return of capital and amortization of bond premiums, on October 31, 2015, undistributed net investment income was decreased by $47,966, undistributed net realized gain (loss) was increased by $118,511 and shares of beneficial interest was decreased by $70,545. This reclassification had no effect on the net assets of the Fund.
NOTE 11—Share Information
| | | | | | | | | | | | | | | | |
| | | Summary of Share Activity | |
| | | Year ended
October 31, 2015(a) | | | October 14, 2014
(commencement date) through
October 31, 2014 | |
| | | Shares | | | Amount | | | Shares | | | Amount | |
Sold: | | | | | | | | | | | | | | | | |
Class A | | | 84,594 | | | $ | 844,305 | | | | 1,248,056 | | | $ | 12,480,560 | |
Class C | | | 28,129 | | | | 279,450 | | | | 1,001 | | | | 10,010 | |
Class R | | | — | | | | — | | | | 1,001 | | | | 10,010 | |
Class Y | | | 30,848 | | | | 310,481 | | | | 1,251,257 | | | | 12,512,610 | |
Class R5 | | | — | | | | — | | | | 1,001 | | | | 10,010 | |
Class R6 | | | — | | | | — | | | | 1,001 | | | | 10,010 | |
| | | | |
Issued as reinvestment of dividends: | | | | | | | | | | | | | | | | |
Class A | | | 575 | | | | 5,722 | | | | — | | | | — | |
Class C | | | 92 | | | | 914 | | | | — | | | | — | |
Class Y | | | 575 | | | | 5,738 | | | | — | | | | — | |
| | | | |
Reacquired: | | | | | | | | | | | | | | | | |
Class A | | | (16,737 | ) | | | (165,798 | ) | | | — | | | | — | |
Class C | | | (3,274 | ) | | | (32,469 | ) | | | — | | | | — | |
Class Y | | | (139 | ) | | | (1,391 | ) | | | — | | | | — | |
Net increase in share activity | | | 124,663 | | | $ | 1,246,952 | | | | 2,503,317 | | | $ | 25,033,210 | |
| (a) | 95% of the outstanding shares of the Fund are owned by the Adviser. |
32 Invesco Unconstrained Bond Fund
NOTE 12—Financial Highlights
The following schedule presents financial highlights for a share of the Fund outstanding throughout the periods indicated.
| | | | | | | | | | | | | | | | | | | | | | | | | | | | | | | | | | | | | | | | | | | | | | | | | | | | | | | | | | | | | | | | | | | | | | | | | | | | | | | | | | | | | | | | | | |
| | | Net
asset
value,
beginning
of
period | | Net
investment
income
(loss)(a) | | Net
gains
(losses)
on
securities
(both
realized
and
unrealized) | | Total
from
investment
operations | | Dividends
from
net
investment
income | | Distributions
from
net
realized
gains | | Return
of
capital | | Total
distributions | | Net
asset
value,
end
of
period | | Total
return(b) | | Net
assets,
end
of
period
(000’s
omitted) | | Ratio
of
expenses
to
average
net
assets
(including
interest
expense)
with
fee
waivers
and/or
expenses
absorbed | | Ratio
of
expenses
to
average
net
assets
(excluding
interest
expense)
with
fee
waivers
and/or
expenses
absorbed | | Ratio
of
expenses
to
average
Net
assets
(including
interest
expense)
without
fee
waivers
and/or
expenses
absorbed | | Ratio
of
expenses
to
average
net
assets
(excluding
interest
expense)
without
fee
waivers
and/or
expenses
absorbed | | Ratio
of
net
investment
income
(loss)
to
average
net
assets | | Ratio
of
interest
expense
to
average
net
assets | | Portfolio
turnover(c) |
Class A | | | | | | | | | | | | | | | | | | | | | | | | | | | | | | | | | | | | | | | | | | | | | | | | | | | | | | | | | | | | | | | | | | | | | | | | | | | | | | | | | | | | | | | | | | |
Year ended 10/31/15 | | | $ | 10.04 | | | | $ | 0.23 | | | | $ | (0.09 | ) | | | $ | 0.14 | | | | $ | (0.23 | ) | | | $ | (0.02 | ) | | | | (0.02 | ) | | | $ | (0.27 | ) | | | $ | 9.91 | | | | | 1.39 | % | | | $ | 13,042 | | | | | 1.00 | %(d) | | | | 0.97 | %(d) | | | | 2.23 | %(d) | | | | 2.20 | %(d) | | | | 2.29 | %(d) | | | | 0.03 | %(d) | | | | 151 | % |
Year ended 10/31/14(e) | | | | 10.00 | | | | | 0.00 | | | | | 0.04 | | | | | 0.04 | | | | | — | | | | | — | | | | | — | | | | | — | | | | | 10.04 | | | | | 0.40 | | | | | 12,532 | | | | | 0.87 | (f)(g) | | | | 0.87 | %(g) | | | | 5.89 | (g) | | | | 5.89 | %(g) | | | | 0.69 | (g) | | | | — | | | | | 0 | |
Class C | | | | | | | | | | | | | | | | | | | | | | | | | | | | | | | | | | | | | | | | | | | | | | | | | | | | | | | | | | | | | | | | | | | | | | | | | | | | | | | | | | | | | | | | | | |
Year ended 10/31/15 | | | | 10.04 | | | | | 0.15 | | | | | (0.09 | ) | | | | 0.06 | | | | | (0.17 | ) | | | | (0.02 | ) | | | | (0.01 | ) | | | | (0.20 | ) | | | | 9.90 | | | | | 0.59 | | | | | 257 | | | | | 1.75 | (d) | | | | 1.72 | (d) | | | | 2.98 | (d) | | | | 2.95 | (d) | | | | 1.54 | (d) | | | | 0.03 | (d) | | | | 151 | |
Year ended 10/31/14(e) | | | | 10.00 | | | | | (0.00 | ) | | | | 0.04 | | | | | 0.04 | | | | | — | | | | | — | | | | | — | | | | | — | | | | | 10.04 | | | | | 0.40 | | | | | 10 | | | | | 1.62 | (f)(g) | | | | 1.62 | (g) | | | | 6.64 | (g) | | | | 6.64 | (g) | | | | (0.06 | )(g) | | | | — | | | | | 0 | |
Class R | | | | | | | | | | | | | | | | | | | | | | | | | | | | | | | | | | | | | | | | | | | | | | | | | | | | | | | | | | | | | | | | | | | | | | | | | | | | | | | | | | | | | | | | | | |
Year ended 10/31/15 | | | | 10.04 | | | | | 0.20 | | | | | (0.10 | ) | | | | 0.10 | | | | | (0.21 | ) | | | | (0.02 | ) | | | | (0.01 | ) | | | | (0.24 | ) | | | | 9.90 | | | | | 1.05 | | | | | 10 | | | | | 1.25 | (d) | | | | 1.22 | (d) | | | | 2.48 | (d) | | | | 2.45 | (d) | | | | 2.04 | (d) | | | | 0.03 | (d) | | | | 151 | |
Year ended 10/31/14(e) | | | | 10.00 | | | | | 0.00 | | | | | 0.04 | | | | | 0.04 | | | | | — | | | | | — | | | | | — | | | | | — | | | | | 10.04 | | | | | 0.40 | | | | | 10 | | | | | 1.12 | (f)(g) | | | | 1.12 | (g) | | | | 6.14 | (g) | | | | 6.14 | (g) | | | | 0.44 | (g) | | | | — | | | | | 0 | |
Class Y | | | | | | | | | | | | | | | | | | | | | | | | | | | | | | | | | | | | | | | | | | | | | | | | | | | | | | | | | | | | | | | | | | | | | | | | | | | | | | | | | | | | | | | | | | |
Year ended 10/31/15 | | | | 10.04 | | | | | 0.25 | | | | | (0.08 | ) | | | | 0.17 | | | | | (0.26 | ) | | | | (0.02 | ) | | | | (0.02 | ) | | | | (0.30 | ) | | | | 9.91 | | | | | 1.62 | | | | | 12,710 | | | | | 0.75 | (d) | | | | 0.72 | (d) | | | | 1.98 | (d) | | | | 1.95 | (d) | | | | 2.54 | (d) | | | | 0.03 | (d) | | | | 151 | |
Year ended 10/31/14(e) | | | | 10.00 | | | | | 0.00 | | | | | 0.04 | | | | | 0.04 | | | | | — | | | | | — | | | | | — | | | | | — | | | | | 10.04 | | | | | 0.40 | | | | | 12,566 | | | | | 0.62 | (f)(g) | | | | 0.62 | (g) | | | | 5.64 | (g) | | | | 5.64 | (g) | | | | 0.94 | (g) | | | | — | | | | | 0 | |
Class R5 | | | | | | | | | | | | | | | | | | | | | | | | | | | | | | | | | | | | | | | | | | | | | | | | | | | | | | | | | | | | | | | | | | | | | | | | | | | | | | | | | | | | | | | | | | |
Year ended 10/31/15 | | | | 10.04 | | | | | 0.25 | | | | | (0.09 | ) | | | | 0.16 | | | | | (0.25 | ) | | | | (0.02 | ) | | | | (0.02 | ) | | | | (0.29 | ) | | | | 9.91 | | | | | 1.62 | | | | | 10 | | | | | 0.75 | (d) | | | | 0.72 | (d) | | | | 2.05 | (d) | | | | 2.02 | (d) | | | | 2.54 | (d) | | | | 0.03 | (d) | | | | 151 | |
Year ended 10/31/14(e) | | | | 10.00 | | | | | 0.00 | | | | | 0.04 | | | | | 0.04 | | | | | — | | | | | — | | | | | — | | | | | — | | | | | 10.04 | | | | | 0.40 | | | | | 10 | | | | | 0.62 | (f)(g) | | | | 0.62 | (g) | | | | 5.74 | (g) | | | | 5.74 | (g) | | | | 0.94 | (g) | | | | — | | | | | 0 | |
Class R6 | | | | | | | | | | | | | | | | | | | | | | | | | | | | | | | | | | | | | | | | | | | | | | | | | | | | | | | | | | | | | | | | | | | | | | | | | | | | | | | | | | | | | | | | | | |
Year ended 10/31/15 | | | | 10.04 | | | | | 0.25 | | | | | (0.08 | ) | | | | 0.17 | | | | | (0.26 | ) | | | | (0.02 | ) | | | | (0.02 | ) | | | | (0.30 | ) | | | | 9.91 | | | | | 1.62 | | | | | 10 | | | | | 0.75 | (d) | | | | 0.72 | (d) | | | | 2.05 | (d) | | | | 2.02 | (d) | | | | 2.54 | (d) | | | | 0.03 | (d) | | | | 151 | |
Year ended 10/31/14(e) | | | | 10.00 | | | | | 0.00 | | | | | 0.04 | | | | | 0.04 | | | | | — | | | | | — | | | | | — | | | | | — | | | | | 10.04 | | | | | 0.40 | | | | | 10 | | | | | 0.62 | (f)(g) | | | | 0.62 | (g) | | | | 5.74 | (g) | | | | 5.74 | (g) | | | | 0.94 | (g) | | | | — | | | | | 0 | |
| (a) | Calculated using average shares outstanding. |
| (b) | Includes adjustments in accordance with accounting principles generally accepted in the United States of America and as such, the net asset value for financial reporting purposes and the returns based upon those net asset values may differ from the net asset value and returns for shareholder transactions. Does not include sales charges and is not annualized for periods less than one year, if applicable. |
| (c) | Portfolio turnover is calculated at the fund level and is not annualized for periods less than one year, if applicable. |
| (d) | Ratios are based on average daily net assets (000’s omitted) of $12,785, $81, $10, $12,688, $10 and $10 for Class A, Class C, Class R, Class Y, Class R5 and Class R6 shares, respectively. |
| (e) | Commencement date of October 14, 2014. |
| (f) | In addition to the fees and expenses which the Fund bears directly, the Fund indirectly bears a pro rata share of the fees and expenses of the underlying funds in which the Fund invests. Because the underlying funds have varied expenses and fee levels and the Fund may own different proportions at different times, the amount of fees and expenses incurred indirectly by the Fund will vary. Estimated underlying fund expenses are not expenses that are incurred directly by the Fund. They are expenses that are incurred directly by the underlying funds and are deducted from the value of the funds the Fund invests in. The effect of the estimated underlying fund expenses that the Fund bears indirectly is included in the Fund’s total return. Estimated acquired fund fees from underlying funds were 0.10% for the period October 14 (commencement date) through October 31, 2014. |
33 Invesco Unconstrained Bond Fund
Report of Independent Registered Public Accounting Firm
To the Board of Trustees of AIM Investment Funds (Invesco Investment Funds)
and Shareholders of Invesco Unconstrained Bond Fund:
In our opinion, the accompanying statement of assets and liabilities, including the schedule of investments, and the related statements of operations and of changes in net assets and the financial highlights present fairly, in all material respects, the financial position of Invesco Unconstrained Bond Fund (one of the funds constituting AIM Investment Funds (Invesco Investment Funds), hereafter referred to as the “Fund”) at October 31, 2015, the results of its operations for the year then ended, the changes in its net assets and the financial highlights for the year then ended and for the period October 14, 2014 (commencement of operations) through October 31, 2014, in conformity with accounting principles generally accepted in the United States of America. These financial statements and financial highlights (hereafter referred to as “financial statements”) are the responsibility of the Fund’s management. Our responsibility is to express an opinion on these financial statements based on our audits. We conducted our audits of these financial statements in accordance with the standards of the Public Company Accounting Oversight Board (United States). Those standards require that we plan and perform the audit to obtain reasonable assurance about whether the financial statements are free of material misstatement. An audit includes examining, on a test basis, evidence supporting the amounts and disclosures in the financial statements, assessing the accounting principles used and significant estimates made by management, and evaluating the overall financial statement presentation. We believe that our audits, which included confirmation of securities at October 31, 2015 by correspondence with the custodian and brokers, and the application of alternative auditing procedures where confirmations of security purchases have not been received, provide a reasonable basis for our opinion.
PRICEWATERHOUSECOOPERS LLP
December 16, 2015
Houston, Texas
34 Invesco Unconstrained Bond Fund
Calculating your ongoing Fund expenses
Example
As a shareholder of the Fund, you incur two types of costs: (1) transaction costs, which may include sales charges (loads) on purchase payments or contingent deferred sales charges on redemptions, if any; and (2) ongoing costs, including management fees, distribution and/or service (12b-1) fees, and other Fund expenses. This example is intended to help you understand your ongoing costs (in dollars) of investing in the Fund and to compare these costs with ongoing costs of investing in other mutual funds. The example is based on an investment of $1,000 invested at the beginning of the period and held for the entire period May 1, 2015 through October 31, 2015.
Actual expenses
The table below provides information about actual account values and actual expenses. You may use the information in this table, together with the amount you invested, to estimate the expenses that you paid over the period. Simply divide your account value by $1,000 (for example, an $8,600 account value divided by $1,000 = 8.6), then multiply the result by the number in the table under the heading entitled “Actual Expenses Paid During Period” to estimate the expenses you paid on your account during this period.
Hypothetical example for comparison purposes
The table below also provides information about hypothetical account values and hypothetical expenses based on the Fund’s actual expense ratio and an assumed rate of return of 5% per year before expenses, which is not the Fund’s actual return.
The hypothetical account values and expenses may not be used to estimate the actual ending account balance or expenses you paid for the period. You may use this information to compare the ongoing costs of investing in the Fund and other funds. To do so, compare this 5% hypothetical example with the 5% hypothetical examples that appear in the shareholder reports of the other funds.
Please note that the expenses shown in the table are meant to highlight your ongoing costs only and do not reflect any transaction costs, such as sales charges (loads) on purchase payments or contingent deferred sales charges on redemptions, if any. Therefore, the hypothetical information is useful in comparing ongoing costs only, and will not help you determine the relative total costs of owning different funds. In addition, if these transaction costs were included, your costs would have been higher.
| | | | | | | | | | | | | | | | | | | | | | | | |
| Class | | Beginning
Account Value
(05/01/15) | | | ACTUAL | | | HYPOTHETICAL
(5% annual return before
expenses) | | | Annualized
Expense
Ratio | |
| | | Ending
Account Value
(10/31/15)1 | | | Expenses
Paid During
Period2 | | | Ending
Account Value
(10/31/15) | | | Expenses
Paid During
Period2 | | |
| A | | $ | 1,000.00 | | | $ | 998.20 | | | $ | 5.29 | | | $ | 1,019.91 | | | $ | 5.35 | | | | 1.05 | % |
| C | | | 1,000.00 | | | | 994.40 | | | | 9.05 | | | | 1,016.13 | | | | 9.15 | | | | 1.80 | |
| R | | | 1,000.00 | | | | 996.90 | | | | 6.54 | | | | 1,018.65 | | | | 6.61 | | | | 1.30 | |
| Y | | | 1,000.00 | | | | 998.50 | | | | 4.03 | | | | 1,021.17 | | | | 4.08 | | | | 0.80 | |
| R5 | | | 1,000.00 | | | | 998.50 | | | | 4.03 | | | | 1,021.17 | | | | 4.08 | | | | 0.80 | |
| R6 | | | 1,000.00 | | | | 998.50 | | | | 4.03 | | | | 1,021.17 | | | | 4.08 | | | | 0.80 | |
| 1 | The actual ending account value is based on the actual total return of the Fund for the period May 1, 2015 through October 31, 2015, after actual expenses and will differ from the hypothetical ending account value which is based on the Fund’s expense ratio and a hypothetical annual return of 5% before expenses. |
| 2 | Expenses are equal to the Fund’s annualized expense ratio as indicated above multiplied by the average account value over the period, multiplied by 184/365 to reflect the most recent fiscal half year. |
35 Invesco Unconstrained Bond Fund
Approval of Investment Advisory and Sub-Advisory Agreements
The Board of Trustees (the Board) of AIM Investment Funds (Invesco Investment Funds) (the Company) is required under the Investment Company Act of 1940, as amended, to approve annually the renewal of Invesco Unconstrained Bond Fund’s (the Fund) investment advisory agreements. During contract renewal meetings held on June 9-10, 2015, the Board as a whole, and the disinterested or “independent” Trustees, who comprise over 75% of the Board, voting separately, approved the continuance for the Fund of the Master Investment Advisory Agreement with Invesco Advisers, Inc. (Invesco Advisers and the investment advisory agreement) and the Master Intergroup Sub-Advisory Contract for Mutual Funds with Invesco Asset Management Deutschland GmbH, Invesco Asset Management Limited, Invesco Asset Management (Japan) Limited, Invesco Hong Kong Limited, Invesco Senior Secured Management, Inc. and Invesco Canada Ltd. and Invesco PowerShares Capital Management LLC (collectively, the Affiliated Sub-Advisers and the sub-advisory contracts) for another year, effective July 1, 2015.
In evaluating the fairness and reasonableness of compensation under the Fund’s investment advisory agreement and sub-advisory contracts, the Board considered, among other things, the factors discussed below. The Board determined that continuation of the Fund’s investment advisory agreement and the sub-advisory contracts is in the best interest of the Fund and its shareholders and that the compensation payable to Invesco Advisers and the Affiliated Sub-Advisers under the agreements is fair and reasonable.
The Board’s Fund Evaluation Process
The Board’s Investments Committee has established three Sub-Committees, each of which is primarily responsible for overseeing the performance and investment management services provided by Invesco Advisers and the Affiliated Sub-Advisers to a number of the funds advised by Invesco Advisers (the Invesco Funds). The Sub-Committees meet throughout the year to review the performance of their assigned Invesco Funds, including reviewing materials prepared under the direction of the independent Senior Officer, an officer of the Invesco Funds who reports directly to the independent Trustees. Over the course of each year, the Sub-Committees meet with portfolio managers for their assigned Invesco Funds and other members of management to review the performance, investment objective(s), policies, strategies, limitations and investment risks of these funds. The Board had the benefit of reports from the Sub-Committees and Investments Committee throughout the year in considering approval of the continuance of each
Invesco Fund’s investment advisory agreement and sub-advisory contracts for another year.
During the contract renewal process, the Board receives comparative performance and fee data regarding the Invesco Funds prepared by Invesco Advisers and Lipper Inc. (Lipper), an independent provider of investment company data. The Board also receives a report and this independent written evaluation from the Senior Officer. The Senior Officer’s evaluation is prepared as part of his responsibility to manage the process by which the Invesco Funds’ proposed management fees are negotiated during the annual contract renewal process to ensure they are negotiated in a manner that is at arms’ length and reasonable. In addition to meetings with Invesco Advisers and fund counsel, the independent Trustees also discuss the continuance of the investment advisory agreement and sub-advisory contracts in separate sessions with the Senior Officer and with independent legal counsel.
The Trustees recognized that the advisory fee rates for the Invesco Funds are, in many cases, the result of years of review and negotiation. The Trustees’ deliberations and conclusions in a particular year may be based in part on their deliberations and conclusions regarding these arrangements throughout the year and in prior years. The Trustees’ review and conclusions are based on the comprehensive consideration of all information presented to them and are not the result of any single determinative factor. Moreover, one Trustee may have weighed a particular piece of information or factor differently than another Trustee.
The discussion below is a summary of the Senior Officer’s independent written evaluation with respect to the Fund’s investment advisory agreement as well as a discussion of the material factors and related conclusions that formed the basis for the Board’s approval of the Fund’s investment advisory agreement and sub-advisory contracts. Unless otherwise stated, this information is current as of June 10, 2015, and does not reflect consideration of factors that became known to the Board after that date.
Factors and Conclusions and Summary of Independent Written Fee Evaluation
| A. | Nature, Extent and Quality of Services Provided by Invesco Advisers and the Affiliated Sub-Advisers |
The Board reviewed the advisory services provided to the Fund by Invesco Advisers under the Fund’s investment advisory agreement, the performance of Invesco Advisers in providing these services, and the credentials and experience of the officers and employees of Invesco Advisers who provide these services, including the Fund’s portfolio manager or managers. The Board’s review of the qualifications of Invesco Advisers to provide
advisory services included the Board’s consideration of Invesco Advisers’ investment process oversight, independent credit analysis and investment risk management. The Board also considered non-advisory services that Invesco Advisers and its affiliates provide to the Invesco Funds such as various back office support functions, equity and fixed income trading operations, internal audit, distribution, valuation and legal and compliance.
In determining whether to continue the Fund’s investment advisory agreement, the Board considered the benefits of reapproving an existing relationship and the greater uncertainty that may be associated with entering into a new relationship. The Board concluded that the nature, extent and quality of the services provided to the Fund by Invesco Advisers are appropriate and satisfactory and consistent with the terms of the Fund’s investment advisory agreement.
The Board reviewed the services that may be provided by the Affiliated Sub-Advisers under the sub-advisory contracts and the credentials and experience of the officers and employees of the Affiliated Sub-Advisers who provide these services. The Board noted that the Affiliated Sub-Advisers have offices and personnel that are located in financial centers around the world. As a result, the Affiliated Sub-Advisers can provide research and investment analysis on the markets and economies of various countries in which the Fund may invest, make recommendations regarding securities and assist with security trades. The Board concluded that the sub-advisory contracts benefit the Fund and its shareholders by permitting Invesco Advisers to use the resources and talents of the Affiliated Sub-Advisers in managing the Fund. The Board concluded that the nature, extent and quality of the services that may be provided by the Affiliated Sub-Advisers are appropriate and satisfactory and consistent with the terms of the Fund’s sub-advisory contracts.
The Board did not consider Fund performance as a relevant factor in considering whether to approve the investment advisory agreement as the Fund had less than one year of performance history.
| C. | Advisory and Sub-Advisory Fees and Fee Waivers |
The Board considered the advisory fee schedule of the Fund and the contractual fee waivers and/or expense limitations that will be in place for the Fund through February 29, 2016. The Board had no comparative Lipper fee data because the Fund was launched in October 2014.
The Board noted that Invesco Advisers and the Affiliated Sub-Advisers do not manage other mutual funds or client accounts with investment strategies comparable to those of the Fund.
The Board also considered the services that
36 Invesco Unconstrained Bond Fund
may be provided by the Affiliated Sub-Advisers pursuant to the sub-advisory contracts, as well as the fees payable by Invesco Advisers to the Affiliated Sub-Advisers pursuant to the sub-advisory contracts. The Board also noted that the sub-advisory fees are not paid directly by the Fund, but rather, are payable by Invesco Advisers to the Affiliated Sub-Advisers.
| D. | Economies of Scale and Breakpoints |
The Board considered the extent to which there are economies of scale in the provision of advisory services to the Fund. The Board also considered whether the Fund benefits from economies of scale through contractual breakpoints in the Fund’s advisory fee schedule. The Board also noted that the Fund shares directly in economies of scale through lower fees charged by third party service providers based on the combined size of the Invesco Funds and other clients advised by Invesco Advisers.
| E. | Profitability and Financial Resources |
The Board reviewed information from Invesco Advisers concerning the costs of the advisory and other services that Invesco Advisers and its affiliates provide to the Fund and the Invesco Funds and the profitability of Invesco Advisers and its affiliates in providing these services. The Board received information from Invesco Advisers about the methodology used to prepare the profitability information. The Board noted that Invesco Advisers continues to operate at a net profit from services Invesco Advisers and its affiliates provide to the Invesco Funds. The Board noted that the Fund had not been in operation long enough to become profitable and that Invesco Advisers was continuing to take entrepreneurial risk in operating the Fund. The Board received and accepted information from Invesco Advisers demonstrating that Invesco Advisers and each Affiliated Sub-Adviser are financially sound and have the resources necessary to perform their obligations under the investment advisory agreement and sub-advisory contracts.
| F. | Collateral Benefits to Invesco Advisers and its Affiliates |
The Board considered various other benefits received by Invesco Advisers and its affiliates from the relationship with the Fund, including the fees received for providing transfer agency and distribution services to the Fund. The Board considered comparative information regarding fees charged for these services, including information provided by Lipper and other independent sources. The Board considered the performance of Invesco Advisers and its affiliates in providing these services and the organizational structure employed to provide these services. The Board also considered that these services are provided to the Fund pursuant to written contracts that are reviewed and approved on an annual basis by the Board; and that the services are required for the operation of the Fund.
The Board considered the benefits realized by Invesco Advisers and the Affiliated Sub-Advisers as a result of portfolio brokerage transactions
executed through “soft dollar” arrangements. Invesco Advisers noted that the Fund does not execute brokerage transactions through “soft dollar” arrangements to any significant degree.
The Board considered that the Fund’s uninvested cash and cash collateral from any securities lending arrangements may be invested in money market funds advised by Invesco Advisers pursuant to procedures approved by the Board. The Board noted that Invesco Advisers receives advisory fees from these affiliated money market funds attributable to such investments, although Invesco Advisers has contractually agreed to waive through varying periods the advisory fees payable by the Invesco Funds with respect to investments in the affiliated money market funds. The waiver is in an amount equal to 100% of the net advisory fee Invesco Advisers receives from the affiliated money market funds with respect to the Fund’s investment in the affiliated money market funds of uninvested cash, but not cash collateral. The Board concluded that the amount of advisory fees received by Invesco Advisors from the Fund’s investment of cash collateral from any securities lending arrangements in the affiliated money market funds is fair and reasonable.
37 Invesco Unconstrained Bond Fund
Tax Information
Form 1099-DIV, Form 1042-S and other year-end tax information provide shareholders with actual calendar year amounts that should be included in their tax returns. Shareholders should consult their tax advisors.
The following distribution information is being provided as required by the Internal Revenue Code or to meet a specific state’s requirement.
The Fund designates the following amounts or, if subsequently determined to be different, the maximum amount allowable for its fiscal year ended October 31, 2015:
| | | | |
Federal and State Income Tax | |
Long-Term Capital Gain Distributions | | $ | 20,899 | |
Qualified Dividend Income* | | | 0.00 | % |
Corporate Dividends Received Deduction* | | | 0.00 | % |
U.S. Treasury Obligations* | | | 0.15 | % |
| | * | The above percentages are based on ordinary income dividends paid to shareholders during the Fund’s fiscal year. |
| | | | |
Non-Resident Alien Shareholders | |
Qualified Short-Term Gains | | $ | 13,933 | |
38 Invesco Unconstrained Bond Fund
Trustees and Officers
The address of each trustee and officer is AIM Investment Funds (Invesco Investment Funds) (the “Trust”), 11 Greenway Plaza, Suite 1000, Houston, Texas 77046-1173. The trustees serve for the life of the Trust, subject to their earlier death, incapacitation, resignation, retirement or removal as more specifically provided in the Trust’s organizational documents. Each officer serves for a one year term or until their successors are elected and qualified. Column two below includes length of time served with predecessor entities, if any.
| | | | | | | | |
Name, Year of Birth and
Position(s) Held with the Trust | �� | Trustee and/
or Officer Since | | Principal Occupation(s)
During Past 5 Years | | Number of Funds in Fund Complex Overseen by Trustee | | Other Directorship(s) Held by Trustee During Past 5 Years |
| Interested Persons | | | | | | | | |
| Martin L. Flanagan1 — 1960 Trustee | | 2007 | | Executive Director, Chief Executive Officer and President, Invesco Ltd. (ultimate parent of Invesco and a global investment management firm); Advisor to the Board, Invesco Advisers, Inc. (formerly known as Invesco Institutional (N.A.), Inc.); Trustee, The Invesco Funds; Vice Chair, Investment Company Institute; and Member of Executive Board, SMU Cox School of Business Formerly: Chairman and Chief Executive Officer, Invesco Advisers, Inc. (registered investment adviser); Director, Chairman, Chief Executive Officer and President, IVZ Inc. (holding company), INVESCO Group Services, Inc. (service provider) and Invesco North American Holdings, Inc. (holding company); Director, Chief Executive Officer and President, Invesco Holding Company Limited (parent of Invesco and a global investment management firm); Director, Invesco Ltd.; Chairman, Investment Company Institute and President, Co-Chief Executive Officer, Co-President, Chief Operating Officer and Chief Financial Officer, Franklin Resources, Inc. (global investment management organization). | | 145 | | None |
Philip A. Taylor2 — 1954
Trustee, President and Principal Executive Officer | | 2006 | | Head of North American Retail and Senior Managing Director, Invesco Ltd.; Director, Co-Chairman, Co-President and Co-Chief Executive Officer, Invesco Advisers, Inc. (formerly known as Invesco Institutional (N.A.), Inc.) (registered investment adviser); Director, Chairman, Chief Executive Officer and President, Invesco Management Group, Inc. (formerly known as Invesco Aim Management Group, Inc.) (financial services holding company); Director and President, INVESCO Funds Group, Inc. (registered investment adviser and registered transfer agent); Director and Chairman, Invesco Investment Services, Inc. (formerly known as Invesco Aim Investment Services, Inc.) (registered transfer agent) and IVZ Distributors, Inc. (formerly known as INVESCO Distributors, Inc.) (registered broker dealer); Chief Executive Officer, Invesco Corporate Class Inc. (corporate mutual fund company) Director, Chairman and Chief Executive Officer, Invesco Canada Ltd. (formerly known as Invesco Trimark Ltd./Invesco Trimark Ltèe) (registered investment adviser and registered transfer agent); Trustee, President and Principal Executive Officer, The Invesco Funds (other than AIM Treasurer’s Series Trust (Invesco Treasurer’s Series Trust), Short-Term Investments Trust and Invesco Management Trust); Trustee and Executive Vice President, The Invesco Funds (AIM Treasurer’s Series Trust (Invesco Treasurer’s Series Trust), Short-Term Investments Trust and Invesco Management Trust only); Director, Invesco Investment Advisers LLC (formerly known as Van Kampen Asset Management); Director, Chief Executive Officer and President, Van Kampen Exchange Corp. Formerly: Director, President and Chairman, Invesco Inc. (holding company), Invesco Canada Holdings Inc. (holding company), Trimark Investments Ltd./Placements Trimark Ltèe and Invesco Financial Services Ltd/Services Financiers Invesco Ltèe; Chief Executive Officer, Invesco Canada Fund Inc (corporate mutual fund company); Director and Chairman, Van Kampen Investor Services Inc.; Director, Chief Executive Officer and President, 1371 Preferred Inc. (holding company) and Van Kampen Investments Inc.; Director and President, AIM GP Canada Inc. (general partner for limited partnerships) and Van Kampen Advisors, Inc.; Director and Chief Executive Officer, Invesco Trimark Dealer Inc. (registered broker dealer); Director, Invesco Distributors, Inc. (formerly known as Invesco Aim Distributors, Inc.) (registered broker dealer); Manager, Invesco PowerShares Capital Management LLC; Director, Chief Executive Officer and President, Invesco Advisers, Inc.; Director, Chairman, Chief Executive Officer and President, Invesco Aim Capital Management, Inc.; President, Invesco Trimark Dealer Inc. and Invesco Trimark Ltd./Invesco Trimark Ltèe; Director and President, AIM Trimark Corporate Class Inc. and AIM Trimark Canada Fund Inc.; Senior Managing Director, Invesco Holding Company Limited; Director and Chairman, Fund Management Company (former registered broker dealer); President and Principal Executive Officer, The Invesco Funds (AIM Treasurer’s Series Trust (Invesco Treasurer’s Series Trust), and Short-Term Investments Trust only); President, AIM Trimark Global Fund Inc. and AIM Trimark Canada Fund Inc.. | | 145 | | None |
| 1 | Mr. Flanagan is considered an interested person (within the meaning of Section 2(a)(19) of the 1940 Act) of the Trust because he is an officer of the Adviser to the Trust, and an officer and a director of Invesco Ltd., ultimate parent of the Adviser. |
| 2 | Mr. Taylor is considered an interested person (within the meaning of Section 2(a)(19) of the 1940 Act) of the Trust because he is an officer and a director of the Adviser. |
T-1 Invesco Unconstrained Bond Fund
Trustees and Officers—(continued)
| | | | | | | | |
Name, Year of Birth and Position(s) Held with the Trust | | Trustee and/ or Officer Since | | Principal Occupation(s) During Past 5 Years | | Number of Funds in Fund Complex Overseen by Trustee | | Other Directorship(s) Held by Trustee During Past 5 Years |
| Independent Trustees | | | | | | | | |
Bruce L. Crockett — 1944 Trustee and Chair | | 2003 | | Chairman, Crockett Technologies Associates (technology consulting company) Formerly: Director, Captaris (unified messaging provider); Director, President and Chief Executive Officer, COMSAT Corporation; Chairman, Board of Governors of INTELSAT (international communications company); ACE Limited (insurance company); Independent Directors Council and Investment Company Institute | | 145 | | ALPS (Attorneys Liability Protection Society) (insurance company) and Globe Specialty Metals, Inc. (metallurgical company) |
David C. Arch — 1945 Trustee | | 2010 | | Chairman of Blistex Inc., a consumer health care products manufacturer | | 145 | | Board member of the Illinois Manufacturers’ Association; Member of the Board of Visitors, Institute for the Humanities, University of Michigan; Member of the Audit Committee of the Edward-Elmhurst Hospital |
James T. Bunch — 1942 Trustee | | 2000 | | Managing Member, Grumman Hill Group LLC (family office/private equity investments) Formerly: Founder, Green Manning & Bunch Ltd. (investment banking firm) (1988-2010); Executive Committee, United States Golf Association; and Chairman, Board of Governors, Western Golf Association | | 145 | | Chairman of the Board of Trustees, Evans Scholars Foundation; and Chairman of the Board, Denver Film Society |
Rodney F. Dammeyer — 1940 Trustee | | 2010 | | Chairman of CAC, LLC, (private company offering capital investment and management advisory services) Formerly: Prior to 2001, Managing Partner at Equity Group Corporate Investments; Prior to 1995, Chief Executive Officer of Itel Corporation (formerly Anixter International); Prior to 1985, experience includes Senior Vice President and Chief Financial Officer of Household International, Inc., Executive Vice President and Chief Financial Officer of Northwest Industries, Inc. and Partner of Arthur Andersen & Co.; From 1987 to 2010, Director/Trustee of investment companies in the Van Kampen Funds complex | | 145 | | Director of Quidel Corporation and Stericycle, Inc. |
Albert R. Dowden — 1941 Trustee | | 2003 | | Director of a number of public and private business corporations, including the Boss Group, Ltd. (private investment and management); Nature’s Sunshine Products, Inc. and Reich & Tang Funds (5 portfolios) (registered investment company) Formerly: Director, Homeowners of America Holding Corporation/Homeowners of America Insurance Company (property casualty company); Director, Continental Energy Services, LLC (oil and gas pipeline service); Director, CompuDyne Corporation (provider of product and services to the public security market) and Director, Annuity and Life Re (Holdings), Ltd. (reinsurance company); Director, President and Chief Executive Officer, Volvo Group North America, Inc.; Senior Vice President, AB Volvo; Director of various public and private corporations; Chairman, DHJ Media, Inc.; Director, Magellan Insurance Company; and Director, The Hertz Corporation, Genmar Corporation (boat manufacturer), National Media Corporation; Advisory Board of Rotary Power International (designer, manufacturer, and seller of rotary power engines); and Chairman, Cortland Trust, Inc. (registered investment company) | | 145 | | Director of: Nature’s Sunshine Products, Inc., Reich & Tang Funds, Homeowners of America Holding Corporation/ Homeowners of America Insurance Company, the Boss Group |
Jack M. Fields — 1952 Trustee | | 2003 | | Chief Executive Officer, Twenty First Century Group, Inc. (government affairs company); Owner and Chief Executive Officer, Dos Angeles Ranch, L.P. (cattle, hunting, corporate entertainment); and Discovery Global Education Fund (non-profit) Formerly: Chief Executive Officer, Texana Timber LP (sustainable forestry company); Director of Cross Timbers Quail Research Ranch (non-profit); and member of the U.S. House of Representatives | | 145 | | Insperity, Inc. (formerly known as Administaff) |
Prema Mathai-Davis — 1950 Trustee | | 2003 | | Retired. Formerly: Chief Executive Officer, YWCA of the U.S.A. | | 145 | | None |
Larry Soll — 1942 Trustee | | 1997 | | Retired. Formerly: Chairman, Chief Executive Officer and President, Synergen Corp. (a biotechnology company) | | 145 | | None |
Hugo F. Sonnenschein — 1940 Trustee | | 2010 | | President Emeritus and Honorary Trustee of the University of Chicago and the Adam Smith Distinguished Service Professor in the Department of Economics at the University of Chicago. Prior to 2000, President of the University of Chicago | | 145 | | Trustee of the University of Rochester and a member of its investment committee; Member of the National Academy of Sciences and the American Philosophical Society; Fellow of the American Academy of Arts and Sciences |
Raymond Stickel, Jr. — 1944 Trustee | | 2005 | | Retired. Formerly: Director, Mainstay VP Series Funds, Inc. (25 portfolios) and Partner, Deloitte & Touche | | 145 | | None |
T-2 Invesco Unconstrained Bond Fund
Trustees and Officers—(continued)
| | | | | | | | |
Name, Year of Birth and Position(s) Held with the Trust | | Trustee and/ or Officer Since | | Principal Occupation(s) During Past 5 Years | | Number of Funds in Fund Complex Overseen by Trustee | | Other Directorship(s) Held by Trustee During Past 5 Years |
| Independent Trustees—(continued) |
Suzanne H. Woolsey — 1941 Trustee | | 2014 | | Chief Executive Officer of Woolsey Partners LLC | | 145 | | Emeritus Chair of the Board of Trustees of the Institute for Defense Analyses; Trustee of Colorado College; Trustee of California Institute of Technology; Prior to 2014, Director of Fluor Corp.; Prior to 2010, Trustee of the German Marshall Fund of the United States; Prior to 2010 Trustee of the Rocky Mountain Institute |
| Other Officers | | | | | | | | |
Russell C. Burk — 1958
Senior Vice President and Senior Officer | | 2005 | | Senior Vice President and Senior Officer, The Invesco Funds | | N/A | | N/A |
John M. Zerr — 1962
Senior Vice President, Chief Legal Officer and Secretary | | 2006 | | Director, Senior Vice President, Secretary and General Counsel, Invesco Management Group, Inc. (formerly known as Invesco Aim Management Group, Inc.) and Van Kampen Exchange Corp.; Senior Vice President, Invesco Advisers, Inc. (formerly known as Invesco Institutional (N.A.), Inc.) (registered investment adviser); Senior Vice President and Secretary, Invesco Distributors, Inc. (formerly known as Invesco Aim Distributors, Inc.); Director, Vice President and Secretary, Invesco Investment Services, Inc. (formerly known as Invesco Aim Investment Services, Inc.) and IVZ Distributors, Inc. (formerly known as INVESCO Distributors, Inc.); Director and Vice President, INVESCO Funds Group, Inc.; Senior Vice President, Chief Legal Officer and Secretary, The Invesco Funds; Managing Director, Invesco PowerShares Capital Management LLC; Director, Secretary and General Counsel, Invesco Investment Advisers LLC (formerly known as Van Kampen Asset Management); Secretary and General Counsel, Invesco Capital Markets, Inc. (formerly known as Van Kampen Funds Inc.) and Chief Legal Officer, PowerShares Exchange-Traded Fund Trust, PowerShares Exchange-Traded Fund Trust II, PowerShares India Exchange-Traded Fund Trust, PowerShares Actively Managed Exchange-Traded Fund Trust, and PowerShares Actively Managed Exchange-Traded Commodity Fund Trust Formerly: Director and Vice President, Van Kampen Advisors Inc.; Director, Vice President, Secretary and General Counsel, Van Kampen Investor Services Inc.; Director, Invesco Distributors, Inc. (formerly known as Invesco Aim Distributors, Inc.); Director, Senior Vice President, General Counsel and Secretary, Invesco Aim Advisers, Inc. and Van Kampen Investments Inc.; Director, Vice President and Secretary, Fund Management Company; Director, Senior Vice President, Secretary, General Counsel and Vice President, Invesco Aim Capital Management, Inc.; Chief Operating Officer and General Counsel, Liberty Ridge Capital, Inc. (an investment adviser); Vice President and Secretary, PBHG Funds (an investment company) and PBHG Insurance Series Fund (an investment company); Chief Operating Officer, General Counsel and Secretary, Old Mutual Investment Partners (a broker-dealer); General Counsel and Secretary, Old Mutual Fund Services (an administrator) and Old Mutual Shareholder Services (a shareholder servicing center); Executive Vice President, General Counsel and Secretary, Old Mutual Capital, Inc. (an investment adviser); and Vice President and Secretary, Old Mutual Advisors Funds (an investment company) | | N/A | | N/A |
Sheri Morris — 1964
Vice President, Treasurer and Principal Financial Officer | | 2003 | | Vice President, Treasurer and Principal Financial Officer, The Invesco Funds; Vice President, Invesco Advisers, Inc. (formerly known as Invesco Institutional (N.A.), Inc.) (registered investment adviser); and Vice President, PowerShares Exchange-Traded Fund Trust, PowerShares Exchange-Traded Fund Trust II, PowerShares India Exchange-Traded Fund Trust, PowerShares Actively Managed Exchange-Traded Fund Trust, and PowerShares Actively Managed Exchange-Traded Commodity Fund Trust Formerly: Vice President, Invesco Aim Advisers, Inc., Invesco Aim Capital Management, Inc. and Invesco Aim Private Asset Management, Inc.; Assistant Vice President and Assistant Treasurer, The Invesco Funds and Assistant Vice President, Invesco Advisers, Inc., Invesco Aim Capital Management, Inc. and Invesco Aim Private Asset Management, Inc.; and Treasurer, PowerShares Exchange-Traded Fund Trust, PowerShares Exchange-Traded Fund Trust II, PowerShares India Exchange-Traded Fund Trust and PowerShares Actively Managed Exchange-Traded Fund Trust | | N/A | | N/A |
T-3 Invesco Unconstrained Bond Fund
Trustees and Officers—(continued)
| | | | | | | | |
Name, Year of Birth and
Position(s) Held with the Trust | | Trustee and/
or Officer Since | | Principal Occupation(s)
During Past 5 Years | | Number of Funds in Fund Complex Overseen by Trustee | | Other Directorship(s) Held by Trustee During Past 5 Years |
| Other Officers—(continued) | | | | | | | | |
Karen Dunn Kelley — 1960
Vice President | | 2003 | | Senior Managing Director, Investments, Invesco Ltd.; Director, Co-President, Co-Chief Executive Officer, and Co-Chairman, Invesco Advisers, Inc. (formerly known as Invesco Institutional (N.A.), Inc.) (registered investment adviser); Chairman, Invesco Senior Secured Management, Inc.; Senior Vice President, Invesco Management Group, Inc. (formerly known as Invesco Aim Management Group, Inc.); Executive Vice President, Invesco Distributors, Inc. (formerly known as Invesco Aim Distributors, Inc.); Director, Invesco Mortgage Capital Inc. and Invesco Management Company Limited; Vice President, The Invesco Funds (other than AIM Treasurer’s Series Trust (Invesco Treasurer’s Series Trust), Short-Term Investments Trust and Invesco Management Trust); and President and Principal Executive Officer, The Invesco Funds (AIM Treasurer’s Series Trust (Invesco Treasurer’s Series Trust), Short-Term Investments Trust and Invesco Management Trust only) Formerly: Director and President, INVESCO Asset Management (Bermuda) Ltd., Director, INVESCO Global Asset Management Limited and INVESCO Management S.A.; Senior Vice President, Van Kampen Investments Inc. and Invesco Advisers, Inc. (formerly known as Invesco Institutional (N.A.), Inc.) (registered investment adviser); Vice President, Invesco Advisers, Inc. (formerly known as Invesco Institutional (N.A.), Inc.); Director of Cash Management and Senior Vice President, Invesco Advisers, Inc. and Invesco Aim Capital Management, Inc.; Director and President, Fund Management Company; Chief Cash Management Officer, Director of Cash Management, Senior Vice President, and Managing Director, Invesco Aim Capital Management, Inc.; Director of Cash Management, Senior Vice President, and Vice President, Invesco Advisers, Inc. and The Invesco Funds (AIM Treasurer’s Series Trust (Invesco Treasurer’s Series Trust), and Short-Term Investments Trust only) | | N/A | | N/A |
Crissie M. Wisdom — 1969 Anti-Money Laundering Compliance Officer | | 2013 | | Anti-Money Laundering Compliance Officer, Invesco Advisers, Inc. (formerly known as Invesco Institutional (N.A.), Inc.) (registered investment adviser), Invesco Capital Markets, Inc. (formerly known as Van Kampen Funds Inc.), Invesco Distributors, Inc., Invesco Investment Services, Inc., Invesco Management Group, Inc., Van Kampen Exchange Corp., The Invesco Funds, and PowerShares Exchange-Traded Fund Trust, PowerShares Exchange-Traded Fund Trust II, PowerShares India Exchange-Traded Fund Trust, PowerShares Actively Managed Exchange-Traded Fund Trust and PowerShares Actively Managed Exchange-Traded Commodity Fund Trust; Anti-Money Laundering Compliance Officer and Bank Secrecy Act Officer, INVESCO National Trust Company and Invesco Trust Company; and Fraud Prevention Manager and Controls and Risk Analysis Manager for Invesco Investment Services, Inc.. | | N/A | | N/A |
Lisa O. Brinkley — 1959 Chief Compliance Officer | | 2015 | | Senior Vice President and Chief Compliance Officer, Invesco Advisers, Inc. (registered investment adviser) (formerly known as Invesco Institutional (N.A., Inc.); and Chief Compliance Officer, The Invesco Funds Formerly: Global Assurance Officer, Invesco Ltd. and Vice President, The Invesco Funds; Chief Compliance Officer, Invesco Distributors, Inc. (formerly known as Invesco Aim Distributors, Inc.), Invesco Investment Services, Inc.(formerly known as Invesco Aim Investment Services, Inc.) and Van Kampen Investor Services Inc.; Senior Vice President, Invesco Management Group, Inc.; Senior Vice President and Chief Compliance Officer, Invesco Advisers, Inc. and The Invesco Funds; Vice President and Chief Compliance Officer, Invesco Aim Capital Management, Inc. and Invesco Distributors, Inc.; Vice President, Invesco Investment Services, Inc. and Fund Management Company. | | N/A | | N/A |
The Statement of Additional Information of the Trust includes additional information about the Fund’s Trustees and is available upon request, without charge, by calling 1.800.959.4246. Please refer to the Fund’s prospectus for information on the Fund’s sub-advisers.
| | | | | | |
Office of the Fund 11 Greenway Plaza, Suite 1000 Houston, TX 77046-1173 | | Investment Adviser Invesco Advisers, Inc. 1555 Peachtree Street, N.E. Atlanta, GA 30309 | | Distributor
Invesco Distributors, Inc. 11 Greenway Plaza, Suite 1000 Houston, TX 77046-1173 | | Auditors PricewaterhouseCoopers LLP 1000 Louisiana Street, Suite 5800 Houston, TX 77002-5678 |
| | | |
| | | | | | |
Counsel to the Fund Stradley Ronon Stevens & Young, LLP 2005 Market Street, Suite 2600 Philadelphia, PA 19103-7018 | | Counsel to the Independent Trustees Goodwin Procter LLP 901 New York Avenue, N.W. Washington, D.C. 20001 | | Transfer Agent Invesco Investment Services, Inc. 11 Greenway Plaza, Suite 1000 Houston, TX 77046-1173 | | Custodian State Street Bank and Trust Company 225 Franklin Street Boston, MA 02110-2801 |
T-4 Invesco Unconstrained Bond Fund

Invesco mailing information
Send general correspondence to Invesco Investment Services, Inc., P.O. Box 219078, Kansas City, MO 64121-9078.
Important notice regarding delivery of security holder documents
To reduce Fund expenses, only one copy of most shareholder documents may be mailed to shareholders with multiple accounts at the same address (Householding). Mailing of your shareholder documents may be householded indefinitely unless you instruct us otherwise. If you do not want the mailing of these documents to be combined with those for other members of your household, please contact Invesco Investment Services, Inc. at 800 959 4246 or contact your financial institution. We will begin sending you individual copies for each account within 30 days after receiving your request.
Fund holdings and proxy voting information
The Fund provides a complete list of its holdings four times in each fiscal year, at the quarter ends. For the second and fourth quarters, the lists appear in the Fund’s semiannual and annual reports to shareholders. For the first and third quarters, the Fund files the lists with the Securities and Exchange Commission (SEC) on Form N-Q. The most recent list of portfolio holdings is available at invesco.com/completeqtrholdings. Shareholders can also look up the Fund’s Forms N-Q on the SEC website at sec.gov. Copies of the Fund’s Forms N-Q may be reviewed and copied at the SEC Public Reference Room in Washington, D.C. You can obtain information on the operation of the Public Reference Room, including information about duplicating fee charges, by calling 202 551 8090 or 800 732 0330, or by electronic request at the following email address: publicinfo@sec.gov. The SEC file numbers for the Fund are shown below.
A description of the policies and procedures that the Fund uses to determine how to vote proxies relating to portfolio securities is available without charge, upon request, from our Client Services department at 800 959 4246 or at invesco.com/proxyguidelines. The information is also available on the SEC website, sec.gov.
| | |
Information regarding how the Fund voted proxies related to its portfolio securities during the most recent 12-month period ended June 30 is available at invesco.com/proxysearch. The information is also available on the SEC website, sec.gov. | |  |
Invesco Advisers, Inc. is an investment adviser; it provides investment advisory services to individual and institutional clients and does not sell securities. Invesco Distributors, Inc. is the US distributor for Invesco Ltd.’s retail mutual funds, exchange-traded funds and institutional money market funds. Both are wholly owned, indirect subsidiaries of Invesco Ltd. | |
SEC file numbers: 811-05426 and 033-19338 UCB-AR-1 Invesco Distributors, Inc.
There were no amendments to the Code of Ethics (the “Code”) that applies to the Registrant’s Principal Executive Officer (“PEO”) and Principal Financial Officer (“PFO”) during the period covered by the report. The Registrant did not grant any waivers, including implicit waivers, from any provisions of the Code to the PEO or PFO during the period covered by this report.
| ITEM 3. | AUDIT COMMITTEE FINANCIAL EXPERT. |
The Board of Trustees has determined that the Registrant has at least one audit committee financial expert serving on its Audit Committee. The Audit Committee financial expert is Raymond Stickel, Jr. Mr. Stickel is “independent” within the meaning of that term as used in Form N-CSR.
| ITEM 4. | PRINCIPAL ACCOUNTANT FEES AND SERVICES. |
(a) to (d)
Fees Billed by PWC Related to the Registrant
PWC billed the Registrant aggregate fees for services rendered to the Registrant for the last two fiscal years as follows:
| | | | | | | | | | | | | | | | |
| | | Fees Billed for
Services Rendered to
the Registrant for
fiscal year end 2015 | | | (e)(2)
Percentage of Fees
Billed Applicable to
Non-Audit Services
Provided for fiscal
year end 2015
Pursuant to Waiver
of Pre-Approval
Requirement(1) | | | Fees Billed for
Services Rendered to
the Registrant for
fiscal year end 2014 | | | (e)(2)
Percentage of Fees
Billed Applicable to
Non-Audit Services
Provided for fiscal
year end 2014
Pursuant to Waiver
of Pre-Approval
Requirement(1) | |
Audit Fees | | $ | 931,700 | | | | N/A | | | $ | 892,000 | | | | N/A | |
Audit-Related Fees | | $ | 0 | | | | 0 | % | | $ | 0 | | | | 0 | % |
Tax Fees(2) | | $ | 376,200 | | | | 0 | % | | $ | 298,893 | | | | 0 | % |
All Other Fees | | $ | 0 | | | | 0 | % | | $ | 0 | | | | 0 | % |
| | | | | | | | | | | | | | | | |
Total Fees | | $ | 1,307,900 | | | | 0 | % | | $ | 1,190,893 | | | | 0 | % |
(g) PWC billed the Registrant aggregate non-audit fees of $376,200 for the fiscal year ended 2015, and $298,893
for the fiscal year ended 2014, for non-audit services rendered to the Registrant.
| (1) | With respect to the provision of non-audit services, the pre-approval requirement is waived pursuant to a de minimis exception if (i) such services were not recognized as non-audit services by the Registrant at the time of engagement, (ii) the aggregate amount of all such services provided is no more than 5% of the aggregate audit and non-audit fees paid by the Registrant to PWC during a fiscal year; and (iii) such services are promptly brought to the attention of the Registrant’s Audit Committee and approved by the Registrant’s Audit Committee prior to the completion of the audit. |
| (2) | Tax fees for the fiscal year end 2015 include fees billed for reviewing tax returns and consultation services. Tax fees for the fiscal year end 2014 includes fees billed for reviewing tax returns. |
Fees Billed by PWC Related to Invesco and Invesco Affiliates
PWC billed Invesco Advisers, Inc. (“Invesco”), the Registrant’s adviser, and any entity controlling, controlled by or under common control with Invesco that provides ongoing services to the Registrant (“Invesco Affiliates”) aggregate fees for pre-approved non-audit services rendered to Invesco and Invesco Affiliates for the last two fiscal years as follows:
| | | | | | | | | | | | | | | | |
| | | Fees Billed for Non-
Audit Services
Rendered to Invesco
and Invesco Affiliates
for fiscal year end
2015 That Were
Required
to be Pre-Approved
by the Registrant’s
Audit Committee | | | (e)(2)
Percentage of Fees
Billed Applicable to
Non-Audit Services
Provided for fiscal year
end 2015 Pursuant to
Waiver of Pre-
Approval
Requirement(1) | | | Fees Billed for Non-
Audit Services
Rendered to Invesco
and Invesco Affiliates
for fiscal year end
2014 That Were
Required
to be Pre-Approved
by the Registrant’s
Audit Committee | | | (e)(2)
Percentage of Fees
Billed Applicable to
Non-Audit Services
Provided for fiscal year
end 2014 Pursuant to
Waiver of Pre-
Approval
Requirement(1) | |
Audit-Related Fees | | $ | 574,000 | | | | 0 | % | | $ | 574,000 | | | | 0 | % |
Tax Fees | | $ | 0 | | | | 0 | % | | $ | 0 | | | | 0 | % |
All Other Fees | | $ | 3,750,000 | | | | 0 | % | | $ | 0 | | | | 0 | % |
| | | | | | | | | | | | | | | | |
Total Fees(2) | | $ | 4,324,000 | | | | 0 | % | | $ | 574,000 | | | | 0 | % |
| (1) | With respect to the provision of non-audit services, the pre-approval requirement is waived pursuant to a de minimis exception if (i) such services were not recognized as non-audit services by the Registrant at the time of engagement, (ii) the aggregate amount of all such services provided is no more than 5% of the aggregate audit and non-audit fees paid by the Registrant, Invesco and Invesco Affiliates to PWC during a fiscal year; and (iii) such services are promptly brought to the attention of the Registrant’s Audit Committee and approved by the Registrant’s Audit Committee prior to the completion of the audit. |
| (2) | Audit-Related fees for the year end 2015 include fees billed related to reviewing controls at a service organization. Audit-Related fees for the year end 2014 include fees billed related to reviewing controls at a service organization. |
(g) Including the fees for services not required to be pre-approved by the registrant’s audit committee, PWC billed Invesco and Invesco Affiliates aggregate non-audit fees of $9,083,022 for the fiscal year ended 2015, and $2,939,346 for the fiscal year ended 2014 for non-audit services rendered to Invesco and Invesco Affiliates.
(h) The Audit Committee also has considered whether the provision of non-audit services that were rendered to Invesco and Invesco Affiliates that were not required to be pre-approved pursuant to SEC regulations, if any, is compatible with maintaining PWC’s independence. To the extent that such services were provided, the Audit Committee determined that the provision of such services is compatible with PWC maintaining independence with respect to the Registrant.
(f) Not applicable.
(e)(1)
PRE-APPROVAL OF AUDIT AND NON-AUDIT SERVICES
POLICIES AND PROCEDURES
As adopted by the Audit Committees of
the Invesco Funds (the “Funds”)
Last Amended May 4, 2010
Statement of Principles
Under the Sarbanes-Oxley Act of 2002 and rules adopted by the Securities and Exchange Commission (“SEC”) (“Rules”), the Audit Committees of the Funds’ (the “Audit Committees”) Board of Trustees (the “Board”) are responsible for the appointment, compensation and oversight of the work of independent accountants (an “Auditor”). As part of this responsibility and to assure that the Auditor’s independence is not impaired, the Audit Committees pre-approve the audit and non-audit services provided to the Funds by each Auditor, as well as all non-audit services provided by the Auditor to the Funds’ investment adviser and to affiliates of the adviser that provide ongoing services to the Funds (“Service Affiliates”) if the services directly impact the Funds’ operations or financial reporting. The SEC Rules also specify the types of services that an Auditor may not provide to its audit client. The following policies and procedures comply with the requirements for pre-approval and provide a mechanism by which management of the Funds may request and secure pre-approval of audit and non-audit services in an orderly manner with minimal disruption to normal business operations.
Proposed services either may be pre-approved without consideration of specific case-by-case services by the Audit Committees (“general pre-approval”) or require the specific pre-approval of the Audit Committees (“specific pre-approval”). As set forth in these policies and procedures, unless a type of service has received general pre-approval, it will require specific pre-approval by the Audit Committees. Additionally, any fees exceeding 110% of estimated pre-approved fee levels provided at the time the service was pre-approved will also require specific approval by the Audit Committees before payment is made. The Audit Committees will also consider the impact of additional fees on the Auditor’s independence when determining whether to approve any additional fees for previously pre-approved services.
The Audit Committees will annually review and generally pre-approve the services that may be provided by each Auditor without obtaining specific pre-approval from the Audit Committee generally on an annual basis. The term of any general pre-approval runs from the date of such pre-approval through September 30th of the following year, unless the Audit Committees consider a different period and state otherwise. The Audit Committees will add to or subtract from the list of general pre-approved services from time to time, based on subsequent determinations.
The purpose of these policies and procedures is to set forth the guidelines to assist the Audit Committees in fulfilling their responsibilities.
Delegation
The Audit Committees may from time to time delegate pre-approval authority to one or more of its members who are Independent Trustees. All decisions to pre-approve a service by a delegated member shall be reported to the Audit Committees at the next quarterly meeting.
Audit Services
The annual audit services engagement terms will be subject to specific pre-approval of the Audit Committees. Audit services include the annual financial statement audit and other procedures such as tax provision work that is required to be performed by the independent auditor to be able to form an opinion on the Funds’ financial statements. The Audit Committees will obtain, review and consider sufficient information concerning the proposed Auditor to make a reasonable evaluation of the Auditor’s qualifications and independence.
In addition to the annual Audit services engagement, the Audit Committees may grant either general or specific pre-approval of other audit services, which are those services that only the independent auditor reasonably can provide. Other Audit services may include services such as issuing consents for the inclusion of audited financial statements with SEC registration statements, periodic reports and other documents filed with the SEC or other documents issued in connection with securities offerings.
Non-Audit Services
The Audit Committees may provide either general or specific pre-approval of any non-audit services to the Funds and its Service Affiliates if the Audit Committees believe that the provision of the service will not impair the independence of the Auditor, is consistent with the SEC’s Rules on auditor independence, and otherwise conforms to the Audit Committees’ general principles and policies as set forth herein.
Audit-Related Services
“Audit-related services” are assurance and related services that are reasonably related to the performance of the audit or review of the Fund’s financial statements or that are traditionally performed by the independent auditor. Audit-related services include, among others, accounting consultations related to accounting, financial reporting or disclosure matters not classified as “Audit services”; assistance with understanding and implementing new accounting and financial reporting guidance from rulemaking authorities; and agreed-upon procedures related to mergers, compliance with ratings agency requirements and interfund lending activities.
Tax Services
“Tax services” include, but are not limited to, the review and signing of the Funds’ federal tax returns, the review of required distributions by the Funds and consultations regarding tax matters such as the tax treatment of new investments or the impact of new regulations. The Audit Committees will scrutinize carefully the retention of the Auditor in connection with a transaction initially recommended by the Auditor, the major business purpose of which may be tax avoidance or the tax treatment of which may not be supported in the Internal Revenue Code and related regulations. The Audit Committees will consult with the Funds’ Treasurer (or his or her designee) and may consult with outside counsel or advisors as necessary to ensure the consistency of Tax services rendered by the Auditor with the foregoing policy.
No Auditor shall represent any Fund or any Service Affiliate before a tax court, district court or federal court of claims.
Under rules adopted by the Public Company Accounting Oversight Board and approved by the SEC, in connection with seeking Audit Committees’ pre-approval of permissible Tax services, the Auditor shall:
| | 1. | Describe in writing to the Audit Committees, which writing may be in the form of the proposed engagement letter: |
| | a. | The scope of the service, the fee structure for the engagement, and any side letter or amendment to the engagement letter, or any other agreement between the Auditor and the Fund, relating to the service; and |
| | b. | Any compensation arrangement or other agreement, such as a referral agreement, a referral fee or fee-sharing arrangement, between the Auditor and any person (other than the Fund) with respect to the promoting, marketing, or recommending of a transaction covered by the service; |
| | 2. | Discuss with the Audit Committees the potential effects of the services on the independence of the Auditor; and |
| | 3. | Document the substance of its discussion with the Audit Committees. |
All Other Auditor Services
The Audit Committees may pre-approve non-audit services classified as “All other services” that are not categorically prohibited by the SEC, as listed in Exhibit 1 to this policy.
Pre-Approval Fee Levels or Established Amounts
Pre-approval of estimated fees or established amounts for services to be provided by the Auditor under general or specific pre-approval policies will be set periodically by the Audit Committees. Any proposed fees exceeding 110% of the maximum estimated pre-approved fees or established amounts for pre-approved audit and non-audit services will be reported to the Audit Committees at the quarterly Audit Committees meeting and will require specific approval by the Audit Committees before payment is made. The Audit Committees will always factor in the overall relationship of fees for audit and non-audit services in determining whether to pre-approve any such services and in determining whether to approve any additional fees exceeding 110% of the maximum pre-approved fees or established amounts for previously pre-approved services.
Procedures
Generally on an annual basis, Invesco Advisers, Inc. (“Invesco”) will submit to the Audit Committees for general pre-approval, a list of non-audit services that the Funds or Service Affiliates of the Funds may request from the Auditor. The list will describe the non-audit services in reasonable detail and will include an estimated range of fees and such other information as the Audit Committee may request.
Each request for services to be provided by the Auditor under the general pre-approval of the Audit Committees will be submitted to the Funds’ Treasurer (or his or her designee) and must include a detailed description of the services to be rendered. The Treasurer or his or her designee will ensure that such services are included within the list of services that have received the general pre-approval of the Audit Committees. The Audit Committees will be informed at the next quarterly scheduled Audit Committees meeting of any such services for which the Auditor rendered an invoice and whether such services and fees had been pre-approved and if so, by what means.
Each request to provide services that require specific approval by the Audit Committees shall be submitted to the Audit Committees jointly by the Fund’s Treasurer or his or her designee and the Auditor, and must include a joint statement that, in their view, such request is consistent with the policies and procedures and the SEC Rules.
Each request to provide tax services under either the general or specific pre-approval of the Audit Committees will describe in writing: (i) the scope of the service, the fee structure for the engagement, and any side letter or amendment to the engagement letter, or any other agreement between the Auditor and the audit client, relating to the service; and (ii) any compensation arrangement or other agreement between the Auditor and any person (other than the audit client) with respect to the promoting, marketing, or recommending of a transaction covered by the service. The Auditor will discuss with the Audit Committees the potential effects of the services on the Auditor’s independence and will document the substance of the discussion.
Non-audit services pursuant to the de minimis exception provided by the SEC Rules will be promptly brought to the attention of the Audit Committees for approval, including documentation that each of the conditions for this exception, as set forth in the SEC Rules, has been satisfied.
On at least an annual basis, the Auditor will prepare a summary of all the services provided to any entity in the investment company complex as defined in section 2-01(f)(14) of Regulation S-X in sufficient detail as to the nature of the engagement and the fees associated with those services.
The Audit Committees have designated the Funds’ Treasurer to monitor the performance of all services provided by the Auditor and to ensure such services are in compliance with these policies and procedures. The Funds’ Treasurer will report to the Audit Committees on a periodic basis as to the results of such monitoring. Both the Funds’ Treasurer and management of Invesco will immediately report to the chairman of the Audit Committees any breach of these policies and procedures that comes to the attention of the Funds’ Treasurer or senior management of Invesco.
Exhibit 1 to Pre-Approval of Audit and Non-Audit Services Policies and Procedures
Conditionally Prohibited Non-Audit Services (not prohibited if the Fund can reasonably conclude that the results of the service would not be subject to audit procedures in connection with the audit of the Fund’s financial statements)
| | • | | Bookkeeping or other services related to the accounting records or financial statements of the audit client |
| | • | | Financial information systems design and implementation |
| | • | | Appraisal or valuation services, fairness opinions, or contribution-in-kind reports |
| | • | | Internal audit outsourcing services |
Categorically Prohibited Non-Audit Services
| | • | | Broker-dealer, investment adviser, or investment banking services |
| | • | | Expert services unrelated to the audit |
| | • | | Any service or product provided for a contingent fee or a commission |
| | • | | Services related to marketing, planning, or opining in favor of the tax treatment of confidential transactions or aggressive tax position transactions, a significant purpose of which is tax avoidance |
| | • | | Tax services for persons in financial reporting oversight roles at the Fund |
| | • | | Any other service that the Public Company Oversight Board determines by regulation is impermissible. |
| ITEM 5. | AUDIT COMMITTEE OF LISTED REGISTRANTS. |
Not applicable.
| ITEM 6. | SCHEDULE OF INVESTMENTS. |
Investments in securities of unaffiliated issuers is included as part of the reports to stockholders filed under Item 1 of this Form.
| ITEM 7. | DISCLOSURE OF PROXY VOTING POLICIES AND PROCEDURES FOR CLOSED-END MANAGEMENT INVESTMENT COMPANIES. |
Not applicable.
| ITEM 8. | PORTFOLIO MANAGERS OF CLOSED-END MANAGEMENT COMPANIES. |
Not applicable.
| ITEM 9. | PURCHASES OF EQUITY SECURITIES BY CLOSED-END MANAGEMENT INVESTMENT COMPANY AND AFFILIATED PURCHASERS. |
Not applicable.
| ITEM 10. | SUBMISSION OF MATTERS TO A VOTE OF SECURITY HOLDERS. |
None
| ITEM 11. | CONTROLS AND PROCEDURES. |
| (a) | As of November 20, 2015, an evaluation was performed under the supervision and with the participation of the officers of the Registrant, including the PEO and PFO, to assess the effectiveness of the Registrant’s disclosure controls and procedures, as that term is defined in Rule 30a-3(c) under the Investment Company Act of 1940 (the “Act”), as amended. Based on that evaluation, the Registrant’s officers, including the PEO and PFO, concluded that, as of November 20, 2015, the Registrant’s disclosure controls and procedures were reasonably designed to ensure: (1) that information required to be disclosed by the Registrant on Form N-CSR is recorded, processed, summarized and reported within the time periods specified by the rules and forms of the Securities and Exchange Commission; and (2) that material information relating to the Registrant is made known to the PEO and PFO as appropriate to allow timely decisions regarding required disclosure. |
| (b) | There have been no changes in the Registrant’s internal control over financial reporting (as defined in Rule 30a-3(d) under the Act) that occurred during the second fiscal quarter of the period covered by this report that have materially affected, or are reasonably likely to materially affect, the Registrant’s internal control over financial reporting. |
| | |
| 12(a) (1) | | Code of Ethics. |
| |
| 12(a) (2) | | Certifications of principal executive officer and principal financial officer as required by Rule 30a-2(a) under the Investment Company Act of 1940. |
| |
| 12(a) (3) | | Not applicable. |
| |
| 12(b) | | Certifications of principal executive officer and principal financial officer as required by Rule 30a-2(b) under the Investment Company Act of 1940. |
SIGNATURES
Pursuant to the requirements of the Securities Exchange Act of 1934 and the Investment Company Act of 1940, the Registrant has duly caused this report to be signed on its behalf by the undersigned, thereunto duly authorized.
Registrant: AIM Investment Funds (Invesco Investment Funds)
| | |
| By: | | /s/ Philip A. Taylor |
| | Philip A. Taylor |
| | Principal Executive Officer |
| |
| Date: | | December 18, 2015 |
Pursuant to the requirements of the Securities and Exchange Act of 1934 and the Investment Company Act of 1940, this report has been signed below by the following persons on behalf of the Registrant and in the capacities and on the dates indicated.
| | |
| By: | | /s/ Philip A. Taylor |
| | Philip A. Taylor |
| | Principal Executive Officer |
| |
| Date: | | December 18, 2015 |
| | |
| By: | | /s/ Sheri Morris |
| | Sheri Morris |
| | Principal Financial Officer |
| |
| Date: | | December 18, 2015 |
EXHIBIT INDEX
| | |
| 12(a) (1) | | Code of Ethics. |
| |
| 12(a) (2) | | Certifications of principal executive officer and principal financial officer as required by Rule 30a-2(a) under the Investment Company Act of 1940. |
| |
| 12(a) (3) | | Not applicable. |
| |
| 12(b) | | Certifications of principal executive officer and principal financial officer as required by Rule 30a-2(b) under the Investment Company Act of 1940. |