|
| OMB APPROVAL |
OMB Number: 3235-0570 Expires: January 31, 2017 Estimated average burden hours per response: 20.6 |
UNITED STATES
SECURITIES AND EXCHANGE COMMISSION
Washington, D.C. 20549
FORM N-CSR
CERTIFIED SHAREHOLDER REPORT OF REGISTERED
MANAGEMENT INVESTMENT COMPANIES
| | |
| Investment Company Act file number | | 811-05426 |
AIM Investment Funds (Invesco Investment Funds)
(Exact name of registrant as specified in charter)
11 Greenway Plaza, Suite 1000 Houston, Texas 77046
(Address of principal executive offices) (Zip code)
Sheri Morris 11 Greenway Plaza, Suite 1000 Houston, Texas 77046
(Name and address of agent for service)
Registrant’s telephone number, including area code: (713) 626-1919
Date of fiscal year end: 10/31
Date of reporting period: 10/31/16
Item 1. Report to Stockholders.
| | | | | | | | |
| | | | | |
 | | | | Annual Report to Shareholders | | | October 31, 2016 | |
| | | | |
| | | Invesco All Cap Market Neutral Fund | |
| | | | Nasdaq: | | | | |
| | | | A: CPNAX ∎ C: CPNCX ∎ R: CPNRX ∎ Y: CPNYX ∎ R5: CPNFX ∎ R6: CPNSX | |
 | |
Letters to Shareholders
| | |

Philip Taylor | | Dear Shareholders: This annual report includes information about your Fund, including performance data and a complete list of its investments as of the close of the reporting period. Inside is a discussion of how your Fund was managed and the factors that affected its performance during the reporting period. In December 2015, the US Federal Reserve raised short-term interest rates for the first time since 2006, signaling its belief that the economy was likely to continue strengthening. Indeed, throughout the reporting period, US economic data were generally positive and the economy expanded at a moderate rate – but there were some bumps along the road. Job growth in May 2016 was very weak, but it was followed by strong increases in nonfarm payrolls in June and July. Increased concerns about global economic weakness caused US stock market indexes to sink at the start of calendar year 2016, but they eventually recovered; they sank again following the UK’s decision to leave the European Union, but |
then quickly recovered and reached record highs later in the summer. Strong demand for income-producing investments, particularly those perceived to be lower risk, benefited bonds as well as dividend-paying stocks for much of the reporting period. While economic news in the US was generally positive, news overseas was less upbeat. The European Central Bank, and central banks in China and Japan – as well as other countries – maintained extraordinarily accommodative monetary policies in response to economic weakness. As the fiscal year drew to a close, uncertainty about the outcome of the US presidential election resulted in increased market volatility; the surprise outcome after the close of the reporting period suggested that market volatility may continue for some time to come.
Short-term market volatility can prompt some investors to abandon their investment plans – and can cause others to settle for average results. The investment professionals at Invesco, in contrast, invest with high conviction, take a long-term perspective and have a passion to exceed. Invesco’s pure focus on investment management eliminates possible distractions and means that there are no competing lines of business for us to support. Just as important, we embrace a variety of investment strategies, asset classes and geographies – because we know that no single investment approach meets the diverse needs of all of our clients. We manage all our investment approaches with a passion to exceed. All our investment teams have a highly disciplined, long-term investing style that eliminates short-term decision-making. Of course, investing with high conviction can’t guarantee a profit or ensure success; no investment strategy can. To learn more about how we invest with high conviction, visit invesco.com/HighConviction.
You, too, can invest with high conviction by maintaining a long-term investment perspective and by working with your financial adviser on a regular basis. During periods of short-term market volatility or uncertainty, your financial adviser can keep you focused on your long-term investment goals – a new home, a child’s college education or a secure retirement. He or she also can share research about the economy, the markets and individual investment options.
Visit our website for more information on your investments
Our website, invesco.com/us, offers a wide range of market insights and investment perspectives. On the website, you’ll find detailed information about our funds, including performance, holdings and portfolio manager commentaries. You can access information about your account by completing a simple, secure online registration. Click on the “Need to register” link in the “Account Access” box on our homepage to get started.
In addition to the resources accessible on our website and through our mobile app, you can obtain timely updates to help you stay informed about the markets, the economy and investing by connecting with Invesco on Twitter, LinkedIn or Facebook. You can access our blog at blog.invesco.us.com. Our goal is to provide you the information you want, when and where you want it.
Finally, I’m pleased to share with you Invesco’s commitment to both the Principles for Responsible Investment and to considering environmental, social and governance issues in our robust investment process. I invite you to learn more at invesco.com/esg.
Have questions?
For questions about your account, contact an Invesco client services representative at 800 959 4246. For Invesco-related questions or comments, please email me directly at phil@invesco.com.
All of us at Invesco look forward to serving your investment management needs. Thank you for investing with us.
Sincerely,

Philip Taylor
Senior Managing Director, Invesco Ltd.
2 Invesco All Cap Market Neutral Fund
| | | | | | |

Bruce Crockett | | | | Dear Fellow Shareholders: Among the many important lessons I’ve learned in more than 40 years in a variety of business endeavors is the value of a trusted advocate. As independent chair of the Invesco Funds Board, I can assure you that the members of the Board are strong advocates for the interests of investors in Invesco’s mutual funds. We work hard to represent your interests through oversight of the quality of the investment management services your funds receive and other matters important to your investment, including but not limited to: |
| | | | ∎ | | Ensuring that Invesco offers a diverse lineup of mutual funds that your financial adviser can use to strive to meet your financial needs as your investment goals change over time. |
| | | | ∎ | | Monitoring how the portfolio management teams of the Invesco funds are performing in light of changing economic and market conditions. |
| ∎ | | Assessing each portfolio management team’s investment performance within the context of the investment strategy described in the fund’s prospectus. |
| ∎ | | Monitoring for potential conflicts of interests that may impact the nature of the services that your funds receive. |
We believe one of the most important services we provide our fund shareholders is the annual review of the funds’ advisory and sub-advisory contracts with Invesco Advisers and its affiliates. This review is required by the Investment Company Act of 1940 and focuses on the nature and quality of the services Invesco provides as the adviser to the Invesco funds and the reasonableness of the fees that it charges for those services. Each year, we spend months carefully reviewing information received from Invesco and a variety of independent sources, such as performance and fee data prepared by Lipper Inc., an independent, third-party firm widely recognized as a leader in its field. We also meet with our independent legal counsel and other independent advisers to review and help us assess the information that we have received. Our goal is to assure that you receive quality investment management services for a reasonable fee.
I trust the measures outlined above provide assurance that you have a worthy advocate when it comes to choosing the Invesco Funds.
As always, please contact me at bruce@brucecrockett.com with any questions or concerns you may have. On behalf of the Board, we look forward to continuing to represent your interests and serving your needs.
Sincerely,

Bruce L. Crockett
Independent Chair
Invesco Funds Board of Trustees
3 Invesco All Cap Market Neutral Fund
Management’s Discussion of Fund Performance
| | | | | | |
Performance summary For the fiscal year ended October 31, 2016, Class A shares of Invesco All Cap Market Neutral Fund (the Fund), at net asset value (NAV), underperformed the Citigroup 90-Day Treasury Bill Index, the Fund’s broad market/style-specific benchmark. Your Fund’s long-term performance appears later in this report. | | | | |
Fund vs. Indexes Total returns, 10/31/15 to 10/31/16, at net asset value (NAV). Performance shown does not include applicable contingent deferred sales charges (CDSC) or front-end sales charges, which would have reduced performance. | | | | |
| | |
Class A Shares | | -7.42% | | | | |
Class C Shares | | -8.19 | | | | |
Class R Shares | | -7.66 | | | | |
Class Y Shares | | -7.24 | | | | |
Class R5 Shares | | -7.23 | | | | |
Class R6 Shares | | -7.24 | | | | |
Citigroup 90-Day Treasury Bill Indexq (Broad Market/Style-Specific Index) | | 0.22 | | | | |
Lipper Alternative Equity Market Neutral Funds Index∎ (Peer Group Index) | | 1.39 | | | | |
| |
Source(s): qFactSet Research Systems Inc; ∎Lipper Inc. | | | | |
Market conditions and your Fund
During the fiscal year, the US economy continued to expand. The initial estimate of US gross domestic product (GDP) showed the US economy grew by 2.9% in the third quarter, beating consensus estimates.1 However, annualized GDP is expected to be lower. Employment data were mixed, though the unemployment rate had a surprise uptick from 4.9% in August to 5.0% in September before ending the fiscal year at 4.9%.2 Oil prices traded in a range from the high $20s to the low $50s during the reporting period.3
The US Federal Reserve (the Fed) raised interest rates in December 2015 – its first increase since 2006 – but that was its only increase during the reporting period. Major US stock market indexes posted gains for the reporting period, but they were fairly volatile. Stocks began calendar year 2016 on a negative note, driven by investor concerns about economic weakness in China, falling oil prices and uncertainty over Fed policy, including rumors of possible negative interest rates in the US. Markets recovered in late February and posted gains until June when UK voters opted to leave the European
Union, sending markets sharply lower once again. Markets again recovered, and major US equity indexes hit record highs during the summer.4 In this environment, investors generally favored the perceived safety of government bonds and more defensive, dividend-paying equities often found in the telecommunication services, utilities and consumer staples sectors.
The Fund follows a market neutral strategy, which is designed to produce a portfolio that experiences minimal influence from the return patterns of the general US stock market. As part of the investment process, the Fund evaluates fundamental and behavioral factors to forecast individual securities’ returns and risks and ranks these securities based on their attractiveness relative to industry peers.
The Fund implements its strategy by purchasing highly-ranked stocks as long positions, and selling poorly-ranked stocks as short positions within their respective industries. Stock selection is the primary source of return for the Fund, which uses offsetting long and short positions to generate return and manage risk.
In a market neutral construct, a positive spread between the top- and bottom-ranked stocks (long and short candidates for the portfolio) is intended to result in the Fund’s outperformance relative to the Citigroup 90-Day Treasury Bill Index. During the fiscal year, the Fund benefited the most from a positive long/short spread in seven of 11 sectors, led by the materials,
| | | | | | | | | | | | | | | | |
| Portfolio Composition | |
| By sector, based on total net assets | |
| | | Equity Securities | | | Gross | | | Net | |
| | | Long1 | | | Short2 | | | Exposure3 | | | Exposure4 | |
Health Care | | | 25.1 | % | | | 24.9 | % | | | 50.0 | % | | | 0.2 | % |
Information Technology | | | 14.8 | | | | 12.6 | | | | 27.4 | | | | 2.2 | |
Consumer Discretionary | | | 12.7 | | | | 14.5 | | | | 27.2 | | | | -1.8 | |
Energy | | | 11.6 | | | | 10.8 | | | | 22.4 | | | | 0.8 | |
Materials | | | 9.2 | | | | 8.1 | | | | 17.3 | | | | 1.1 | |
Industrials | | | 6.4 | | | | 6.8 | | | | 13.2 | | | | -0.4 | |
Financials | | | 4.9 | | | | 5.0 | | | | 9.9 | | | | -0.1 | |
Consumer Staples | | | 2.1 | | | | 1.9 | | | | 4.0 | | | | 0.2 | |
Real Estate | | | 0.8 | | | | 1.7 | | | | 2.5 | | | | -0.9 | |
Telecommunication Services | | | 0.7 | | | | 0.5 | | | | 1.2 | | | | 0.2 | |
Money Market Funds Plus Other Assets Less Liabilities | | | 11.7 | | | | – | | | | 11.7 | | | | 11.7 | |
Total | | | 100.0 | | | | 86.8 | | | | 186.8 | | | | 13.2 | |
| 1 | Represents the value of the equity securities in the portfolio. |
| 2 | Represents the value of the equity securities underlying the Fund’s equity short portfolio swap. |
| 3 | Represents the cumulative exposure of the Fund’s long and short positions. |
| 4 | Represents the net exposure of the Fund’s long and short positions. |
| | | | |
Total Net Assets | | $ | 168.1 million | |
Data presented here are as of October 31, 2016.
4 Invesco All Cap Market Neutral Fund
consumer discretionary and industrials sectors. However, the long/short spread in the energy, health care and information technology sectors meaningfully detracted from the Fund’s returns during reporting period.
During the fiscal year, the strongest contributors to Fund performance were holdings in the materials sector – specifically, the long holdings in aluminum/ diversified metals and gold generated a positive spread. The Fund’s long positions outperformed its short positions in the industrials sector; notably, long positions in capital goods added to Fund returns.
The energy sector was the largest detractor from Fund performance as its long/short spread was negative mostly due to short positions in the oil and gas exploration industry. In the health care sector, both the long and short positions moved against us. Early in the calendar year, long biotechnology holdings in the sector sold off as investors sought to reduce risk given strong returns in 2015, and due to the threat of additional regulation regarding drug pricing. Later in the fiscal year, a few of the sector’s short positions rallied due to positive news regarding new drug development, FDA drug approvals and acquisition activity. We note that the positive sentiment was short lived for some of these stocks, which declined toward the end of the reporting period.
Please note that the Fund may utilize derivative instruments that include equity total return swaps and futures contracts. During the reporting period, the Fund utilized equity total return swaps to efficiently implement its strategy, but did not use future contracts. The implementation impact of using equity total return swaps is a component of transaction costs. Derivatives may amplify traditional investment risks through the creation of leverage and may be less liquid than traditional securities.
Thank you for your investment in Invesco All Cap Market Neutral Fund.
| 1 | Source: Bureau of Economic Analysis |
| 2 | Source: Bureau of Labor Statistics |
| 3 | Source: Thompson-Reuters |
The views and opinions expressed in management’s discussion of Fund performance are those of Invesco Advisers, Inc. These views and opinions are subject to change at any time based on factors such as market and economic conditions. These views and opinions may not be relied upon as investment advice or recommendations, or as an offer for a particular security. The information is not a complete analysis of every aspect of any market, country, industry, security or the Fund. Statements of fact are from sources considered reliable, but Invesco Advisers, Inc. makes no representation or warranty as to their completeness or accuracy. Although historical performance is no guarantee of future results, these insights may help you understand our investment management philosophy.
See important Fund and, if applicable, index disclosures later in this report.
| | |
 | | Michael Abata Chartered Financial Analyst, Portfolio Manager, is manager of Invesco All Cap Market Neutral Fund. |
| He joined Invesco in 2011. Mr. Abata earned a BA in economics from Binghamton University. |
| |
 | | Charles Ko Chartered Financial Analyst, Portfolio Manager, is manager of Invesco All Cap Market Neutral Fund. |
| He joined Invesco in 2012. Mr. Ko earned a BS from MIT and an MBA from Yale University. |
| |
 | | Anthony Munchak Chartered Financial Analyst, Portfolio Manager, is manager of Invesco All Cap Market Neutral Fund. |
| He joined Invesco in 2000. Mr. Munchak earned a BS and an MS in finance from Boston College and an MBA from Bentley College. |
| |

| | Glen Murphy Chartered Financial Analyst, Portfolio Manager, is manager of Invesco All Cap Market Neutral Fund. |
| He joined Invesco in 1995. Mr. Murphy earned a BA from the University of Massachusetts at Amherst and an MS in finance from Boston College. |
| | |
 | | Francis Orlando Chartered Financial Analyst, Portfolio Manager, is manager of Invesco All Cap Market Neutral Fund. |
| He joined Invesco in 1987. Mr. Orlando earned a BA in business administration from Merrimack College and an MBA from Boston University. |
| |
 | | Andrew Waisburd Portfolio Manager, is manager of Invesco All Cap Market Neutral Fund. He joined Invesco in 2008. |
| Dr. Waisburd earned a BS in statistics from Cornell University and an MS and a PhD in finance from Indiana University. |
| |
 | | Donna Chapman Wilson Portfolio Manager and Director of Portfolio Management, is manager of Invesco |
| All Cap Market Neutral Fund. She joined Invesco in 1997. Ms. Chapman Wilson earned a BA in economics from Hampton University and an MBA in finance from the Wharton School of the University of Pennsylvania. |
5 Invesco All Cap Market Neutral Fund
Your Fund’s Long-Term Performance
Results of a $10,000 Investment – Oldest Share Class(es) since Inception
Fund and index data from 12/17/13
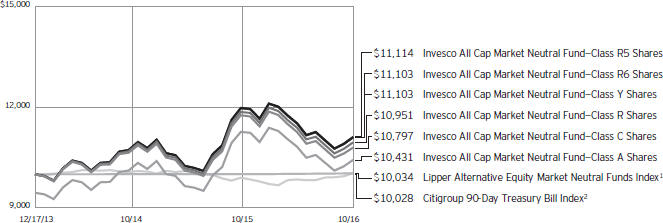
| 2 | Source: FactSet Research Systems Inc. |
Past performance cannot guarantee comparable future results.
The data shown in the chart include reinvested distributions, applicable sales charges and Fund expenses including management
fees. Index results include reinvested dividends, but they do not reflect sales charges. Performance of the peer group, if applicable, reflects fund expenses and management fees; performance of a market
index does not. Performance shown in the chart and table(s) does not reflect deduction of taxes a shareholder would pay on Fund distributions or sale of Fund shares.
continued from page 8
| ∎ | | Small- and mid-capitalization companies risks. Small- and mid-capitalization companies tend to be more vulnerable to changing market conditions, may have little or no operating history or track record of success, and may have more limited product lines and markets, less experienced management and fewer financial resources than larger companies. These companies’ securities may be more volatile and less liquid than those of more established companies, and their returns may vary, sometimes significantly, from the overall securities market. |
About indexes used in this report
| ∎ | | The Citigroup 90-Day Treasury Bill Index is an unmanaged index representative of three-month Treasury bills. |
| ∎ | | The Lipper Alternative Equity Market Neutral Funds Index is an unmanaged index considered representative of alternative equity market neutral funds tracked by Lipper. |
| ∎ | | The Fund is not managed to track the performance of any particular index, including the index(es) described here, and consequently, the performance of the Fund may deviate significantly from the performance of the index(es). |
| ∎ | | A direct investment cannot be made in an index. Unless otherwise indicated, index results include reinvested dividends, and they do not reflect sales charges. Performance of the peer group, if applicable, reflects fund expenses; performance of a market index does not. |
Other information
| ∎ | | The returns shown in management’s discussion of Fund performance are based on net asset values (NAVs) calculated for shareholder transactions. Generally accepted accounting principles require adjustments to be made to the net assets of the Fund at period end for financial reporting purposes, and as such, the NAVs for shareholder transactions and the returns based on those NAVs may differ from the NAVs and returns reported in the Financial Highlights. |
| ∎ | | Industry classifications used in this report are generally according to the Global Industry Classification Standard, which was developed by and is the exclusive property and a service mark of MSCI Inc. and Standard & Poor’s. |
6 Invesco All Cap Market Neutral Fund
| | | | |
| Average Annual Total Returns | |
| As of 10/31/16, including maximum applicable sales charges | |
| |
Class A Shares | | | | |
Inception (12/17/13) | | | 1.48 | % |
1 Year | | | -12.49 | |
| |
Class C Shares | | | | |
Inception (12/17/13) | | | 2.71 | % |
1 Year | | | -9.01 | |
| |
Class R Shares | | | | |
Inception (12/17/13) | | | 3.22 | % |
1 Year | | | -7.66 | |
| |
Class Y Shares | | | | |
Inception (12/17/13) | | | 3.71 | % |
1 Year | | | -7.24 | |
| |
Class R5 Shares | | | | |
Inception (12/17/13) | | | 3.75 | % |
1 Year | | | -7.23 | |
| |
Class R6 Shares | | | | |
Inception (12/17/13) | | | 3.71 | % |
1 Year | | | -7.24 | |
The performance data quoted represent past performance and cannot guarantee comparable future results; current performance may be lower or higher. Please visit invesco.com/performance for the most recent month-end performance. Performance figures reflect reinvested distributions, changes in net asset value and the effect of the maximum sales charge unless otherwise stated. Investment return and principal value will fluctuate so that you may have a gain or loss when you sell shares.
The net annual Fund operating expense ratio set forth in the most recent Fund prospectus as of the date of this report for Class A, Class C, Class R, Class Y, Class R5 and Class R6 shares was 1.62%, 2.37%, 1.87%, 1.37%, 1.37% and 1.37%, respectively.1,2 The total annual Fund operating expense ratio set forth in the most recent Fund prospectus as of the date of this report for Class A, Class C, Class R, Class Y, Class R5 and Class R6 shares was 2.56%, 3.31%, 2.81%, 2.31%, 2.21% and 2.21%, respectively. The expense ratios presented above may vary from the expense ratios presented in other sections of this report that are based on expenses incurred during the period covered by this report.
| | | | |
| Average Annual Total Returns | |
| As of 9/30/16, the most recent calendar quarter end, including maximum applicable sales charges | |
| |
Class A Shares | | | | |
Inception (12/17/13) | | | 0.85 | % |
1 Year | | | -11.50 | |
| |
Class C Shares | | | | |
Inception (12/17/13) | | | 2.17 | % |
1 Year | | | -7.86 | |
| |
Class R Shares | | | | |
Inception (12/17/13) | | | 2.66 | % |
1 Year | | | -6.60 | |
| |
Class Y Shares | | | | |
Inception (12/17/13) | | | 3.14 | % |
1 Year | | | -6.20 | |
| |
Class R5 Shares | | | | |
Inception (12/17/13) | | | 3.18 | % |
1 Year | | | -6.10 | |
| |
Class R6 Shares | | | | |
Inception (12/17/13) | | | 3.14 | % |
1 Year | | | -6.20 | |
Class A share performance reflects the maximum 5.50% sales charge, and Class C share performance reflects the applicable contingent deferred sales charge (CDSC) for the period involved. The CDSC on Class C shares is 1% for the first year after purchase. Class R, Class Y, Class R5 and Class R6 class shares do not have a front-end sales charge or a CDSC; therefore, performance is at net asset value.
The performance of the Fund’s share classes will differ primarily due to different sales charge structures and class expenses.
Fund performance reflects any applicable fee waivers and/or expense reimbursements. Had the adviser not waived fees and/or reimbursed expenses currently or in the past, returns would have been lower. See current prospectus for more information.
| 1 | Total annual Fund operating expenses after any contractual fee waivers and/or expense reimbursements by the adviser in effect through at least June 30, 2018. See current prospectus for more information. |
| 2 | Total annual Fund operating expenses after any contractual fee waivers and/or expense reimbursements by the adviser in effect through at least February 28, 2017. See current prospectus for more information. |
7 Invesco All Cap Market Neutral Fund
Invesco All Cap Market Neutral Fund’s investment objective is to seek to provide a positive return over a full market cycle from a broadly diversified portfolio of stocks while seeking to limit exposure to the general risks associated with stock market investing.
| ∎ | | Unless otherwise stated, information presented in this report is as of October 31, 2016, and is based on total net assets. |
| ∎ | | Unless otherwise noted, all data provided by Invesco. |
| ∎ | | To access your Fund’s reports/prospectus, visit invesco.com/fundreports. |
About share classes
| ∎ | | Class R shares are generally available only to employer sponsored retirement and benefit plans. Please see the prospectus for more information. |
| ∎ | | Class Y shares are available only to certain investors. Please see the prospectus for more information. |
| ∎ | | Class R5 shares and Class R6 shares are primarily intended for employer sponsored retirement and benefit plans that meet certain standards and for institutional investors. Please see the prospectus for more information. |
Principal risks of investing in the Fund
| ∎ | | Active trading risk. Active trading of portfolio securities may result in added expenses, a lower return and increased tax liability. |
| ∎ | | Derivatives risk. The value of a derivative instrument depends largely on (and is derived from) the value of an underlying security, currency, commodity, interest rate, index or other asset (each referred to as an underlying asset). In addition to risks relating to the underlying assets, the use of derivatives may include other, possibly greater, risks, including counterparty, leverage and liquidity risks. Counter-party risk is the risk that the counter-party to the derivative contract will default on its obligation to pay the Fund the amount owed or otherwise perform under the derivative contract. Derivatives create leverage risk because they do not require payment up front equal to the economic exposure created by owning the derivative. As a result, an adverse change in the value of the underlying asset could result in the Fund sustaining a loss that is substantially greater than the amount invested in the derivative, which may make the Fund’s returns more volatile and increase the risk of loss. Derivative instruments may also be less liquid than |
more traditional investments and the Fund may be unable to sell or close out its derivative positions at a desirable time or price. This risk may be more acute under adverse market conditions, during which the Fund may be most in need of liquidating its derivative positions. Derivatives may also be harder to value, less tax efficient and subject to changing government regulation that could impact the Fund’s ability to use certain derivatives or their cost. Also, derivatives used for hedging or to gain or limit exposure to a particular market segment may not provide the expected benefits, particularly during adverse market conditions. These risks are greater for the Fund than most other mutual funds because the Fund will implement its investment strategy primarily through derivative instruments rather than direct investments in stocks/bonds.
| ∎ | | Management risk. The Fund is actively managed and depends heavily on the Adviser’s judgment about markets, interest rates or the attractiveness, relative values, liquidity, or potential appreciation of particular investments made for the Fund’s portfolio. The Fund could experience losses if these judgments prove to be incorrect. Additionally, legislative, regulatory, or tax developments may adversely affect management of the Fund and, therefore, the ability of the Fund to achieve its investment objective. In particular, there is no guarantee that the portfolio manager’s stock selection process will produce a market neutral portfolio that reduces or eliminates the Fund’s exposure to general US stock market risk, sector or industry-specific risk or market capitalization risk. In addition, the Fund’s market neutral investment strategy will likely cause the Fund to underperform the broader US equity market during market rallies. Such underperformance could be significant during sudden or significant market rallies. |
| ∎ | | Market risk. The market values of the Fund’s investments, and therefore the value of the Fund’s shares, will go up and down, sometimes rapidly or unpredictably. Market risk may affect a single issuer, industry or section of the economy, or it may affect the market as a whole. Individual stock prices tend to go up and down more dramatically than those of certain other types of investments, such as bonds. During a general downturn in the financial markets, multiple asset classes may decline in value. When markets perform well, there can be no assurance that specific investments held by the Fund will rise in value. |
| ∎ | | Sector focus risk. The Fund may from time to time invest a significant amount of its assets (i.e. over 25%) in one market sector or group of related industries. In this event, the Fund’s performance will depend to a greater extent on the overall condition of the sector or group of industries and there is increased risk that the Fund will lose significant value if conditions adversely affect that sector or group of industries. |
| ∎ | | Short position risk. Because the Fund’s potential loss on a short position arises from increases in the value of the asset sold short, the Fund will incur a loss on a short position, which is theoretically unlimited, if the price of the asset sold short increases from the short sale price. The counterparty to a short position or other market factors may prevent the Fund from closing out a short position at a desirable time or price and may reduce or eliminate any gain or result in a loss. In a rising market, the Fund’s short positions will cause the Fund to underperform the overall market and its peers that do not engage in shorting. If the Fund holds both long and short positions, and both positions decline simultaneously, the short positions will not provide any buffer (hedge) from declines in value of the Fund’s long positions. Certain types of short positions involve leverage, which may exaggerate any losses, potentially more than the actual cost of the investment, and will increase the volatility of the Fund’s returns. |
| | |
This report must be accompanied or preceded by a currently effective Fund prospectus, which contains more complete information, including sales charges and expenses. Investors should read it carefully before investing. | | continued on page 6 |
NOT FDIC INSURED | MAY LOSE VALUE | NO BANK GUARANTEE | | |
8 Invesco All Cap Market Neutral Fund
Schedule of Investments(a)
October 31, 2016
| | | | | | | | |
| | | Shares | | | Value | |
Common Stocks & Other Equity Interests–88.29% | |
| Airlines–1.02% | | | | | | | | |
Hawaiian Holdings, Inc.(b) | | | 38,000 | | | $ | 1,710,950 | |
|
| Apparel Retail–1.72% | |
Abercrombie & Fitch Co.–Class A | | | 54,300 | | | | 793,323 | |
Urban Outfitters, Inc.(b) | | | 62,650 | | | | 2,095,642 | |
| | | | | | | | 2,888,965 | |
|
| Apparel, Accessories & Luxury Goods–0.62% | |
Delta Apparel, Inc.(b) | | | 12,600 | | | | 207,900 | |
PVH Corp. | | | 7,850 | | | | 839,793 | |
| | | | | | | | 1,047,693 | |
|
| Application Software–2.64% | |
Citrix Systems, Inc.(b) | | | 27,250 | | | | 2,310,800 | |
Nuance Communications, Inc.(b) | | | 151,200 | | | | 2,119,824 | |
| | | | | | | | 4,430,624 | |
|
| Auto Parts & Equipment–1.13% | |
American Axle & Manufacturing Holdings, Inc.(b) | | | 94,500 | | | | 1,693,440 | |
Stoneridge, Inc.(b) | | | 14,150 | | | | 209,703 | |
| | | | | | | | 1,903,143 | |
|
| Biotechnology–11.75% | |
Aptevo Therapeutics Inc.(b) | | | 40,775 | | | | 90,113 | |
BioSpecifics Technologies Corp.(b) | | | 18,300 | | | | 794,037 | |
ChemoCentryx, Inc.(b) | | | 47,300 | | | | 282,854 | |
Concert Pharmaceuticals, Inc.(b) | | | 59,100 | | | | 456,252 | |
Emergent Biosolutions, Inc.(b) | | | 81,550 | | | | 2,179,016 | |
Exelixis, Inc.(b) | | | 202,850 | | | | 2,148,182 | |
FibroGen, Inc.(b) | | | 134,250 | | | | 2,221,837 | |
Five Prime Therapeutics, Inc.(b) | | | 55,750 | | | | 2,705,547 | |
Gilead Sciences, Inc. | | | 30,100 | | | | 2,216,263 | |
GlycoMimetics, Inc.(b) | | | 36,950 | | | | 222,809 | |
Lexicon Pharmaceuticals, Inc.(b) | | | 32,200 | | | | 477,526 | |
PDL BioPharma Inc. | | | 127,250 | | | | 409,745 | |
Repligen Corp.(b) | | | 86,800 | | | | 2,479,876 | |
Spectrum Pharmaceuticals, Inc.(b) | | | 172,000 | | | | 608,880 | |
Vanda Pharmaceuticals Inc.(b) | | | 9,800 | | | | 145,530 | |
Xencor, Inc.(b) | | | 108,450 | | | | 2,308,900 | |
| | | | | | | | 19,747,367 | |
|
| Casinos & Gaming–0.36% | |
Boyd Gaming Corp.(b) | | | 15,750 | | | | 281,295 | |
International Game Technology PLC | | | 11,300 | | | | 324,536 | |
| | | | | | | | 605,831 | |
|
| Coal & Consumable Fuels–2.50% | |
Cloud Peak Energy Inc.(b) | | | 155,250 | | | | 956,340 | |
CONSOL Energy Inc. | | | 138,450 | | | | 2,346,727 | |
Hallador Energy Co. | | | 51,900 | | | | 458,796 | |
| | | | | | | | |
| | | Shares | | | Value | |
| Coal & Consumable Fuels–(continued) | | | | | |
Westmoreland Coal Co.(b) | | | 48,800 | | | $ | 433,344 | |
| | | | | | | | 4,195,207 | |
|
| Commercial Printing–1.77% | |
Ennis Inc. | | | 28,150 | | | | 412,397 | |
Quad/Graphics, Inc. | | | 107,850 | | | | 2,562,516 | |
| | | | | | | | 2,974,913 | |
|
| Commodity Chemicals–2.07% | |
Cabot Corp. | | | 41,950 | | | | 2,187,273 | |
Trinseo S.A. | | | 24,600 | | | | 1,290,270 | |
| | | | | | | | 3,477,543 | |
|
| Communications Equipment–1.44% | |
Black Box Corp. | | | 40,800 | | | | 469,200 | |
Digi International Inc.(b) | | | 19,500 | | | | 178,425 | |
Extreme Networks, Inc.(b) | | | 94,250 | | | | 396,793 | |
NETGEAR, Inc.(b) | | | 13,900 | | | | 701,950 | |
Sonus Networks, Inc.(b) | | | 116,550 | | | | 674,824 | |
| | | | | | | | 2,421,192 | |
|
| Computer & Electronics Retail–1.69% | |
Best Buy Co., Inc. | | | 62,050 | | | | 2,414,365 | |
Rent-A-Center, Inc. | | | 42,650 | | | | 430,339 | |
| | | | | | | | 2,844,704 | |
|
| Construction Machinery & Heavy Trucks–0.21% | |
Commercial Vehicle Group, Inc.(b) | | | 78,100 | | | | 354,574 | |
|
| Consumer Electronics–0.26% | |
Garmin Ltd. | | | 9,150 | | | | 442,494 | |
|
| Consumer Finance–1.97% | |
Navient Corp. | | | 176,750 | | | | 2,258,865 | |
Nelnet, Inc.–Class A | | | 4,900 | | | | 191,982 | |
Santander Consumer USA Holdings Inc.(b) | | | 69,900 | | | | 852,780 | |
| | | | | | | | 3,303,627 | |
|
| Data Processing & Outsourced Services–0.19% | |
Xerox Corp. | | | 33,050 | | | | 322,899 | |
|
| Department Stores–1.91% | |
J. C. Penney Co., Inc.(b) | | | 109,250 | | | | 938,458 | |
Kohl’s Corp. | | | 51,850 | | | | 2,268,437 | |
| | | | | | | | 3,206,895 | |
|
| Diversified Banks–0.38% | |
Citigroup Inc. | | | 12,850 | | | | 631,578 | |
|
| Diversified Metals & Mining–1.37% | |
Teck Resources Ltd.–Class B (Canada) | | | 106,650 | | | | 2,301,507 | |
|
| Education Services–0.81% | |
Cambium Learning Group Inc.(b) | | | 27,450 | | | | 142,191 | |
See accompanying Notes to Financial Statements which are an integral part of the financial statements.
9 Invesco All Cap Market Neutral Fund
| | | | | | | | |
| | | Shares | | | Value | |
| Education Services–(continued) | | | | | |
K12 Inc.(b) | | | 111,950 | | | $ | 1,213,538 | |
| | | | | 1,355,729 | |
|
| Electrical Components & Equipment–0.27% | |
General Cable Corp. | | | 31,900 | | | | 446,600 | |
|
| Electronic Manufacturing Services–0.32% | |
TTM Technologies, Inc.(b) | | | 40,850 | | | | 537,178 | |
|
| Food Retail–0.34% | |
SUPERVALU Inc.(b) | | | 135,250 | | | | 580,223 | |
|
| General Merchandise Stores–0.21% | |
Big Lots, Inc. | | | 7,950 | | | | 345,030 | |
|
| Gold–2.98% | |
Barrick Gold Corp. (Canada) | | | 149,050 | | | | 2,621,789 | |
Kinross Gold Corp. (Canada)(b) | | | 618,150 | | | | 2,386,059 | |
| | | | | | | | 5,007,848 | |
|
| Health Care Equipment–1.67% | |
AngioDynamics, Inc.(b) | | | 41,050 | | | | 654,337 | |
Baxter International Inc. | | | 23,100 | | | | 1,099,329 | |
Fonar Corp.(b) | | | 8,150 | | | | 147,923 | |
LeMaitre Vascular, Inc. | | | 43,150 | | | | 903,561 | |
| | | | | | | | 2,805,150 | |
|
| Health Care Facilities–0.05% | |
Quorum Health Corp.(b) | | | 20,550 | | | | 83,022 | |
|
| Health Care Services–0.43% | |
BioTelemetry, Inc.(b) | | | 40,450 | | | | 715,965 | |
|
| Health Care Supplies–1.20% | |
Halyard Health Inc.(b) | | | 5,550 | | | | 179,543 | |
Lantheus Holdings, Inc.(b) | | | 87,700 | | | | 758,605 | |
OraSure Technologies, Inc.(b) | | | 143,150 | | | | 1,075,056 | |
| | | | | | | | 2,013,204 | |
|
| Health Care Technology–2.29% | |
HMS Holdings Corp.(b) | | | 107,300 | | | | 2,260,811 | |
Veeva Systems Inc.–Class A(b) | | | 40,900 | | | | 1,588,965 | |
| | | | | | | | 3,849,776 | |
|
| Hotels, Resorts & Cruise Lines–0.14% | |
Hyatt Hotels Corp.–Class A(b) | | | 4,650 | | | | 236,174 | |
|
| Housewares & Specialties–0.07% | |
Tupperware Brands Corp. | | | 2,000 | | | | 119,040 | |
|
| Hypermarkets & Super Centers–0.19% | |
Wal-Mart Stores, Inc. | | | 4,500 | | | | 315,090 | |
|
| Industrial Machinery–0.43% | |
Kennametal Inc. | | | 17,050 | | | | 482,686 | |
SPX Corp.(b) | | | 12,800 | | | | 243,328 | |
| | | | | | | | 726,014 | |
| | | | | | | | |
| | | Shares | | | Value | |
| Integrated Telecommunication Services–0.67% | |
Verizon Communications Inc. | | | 23,450 | | | $ | 1,127,945 | |
|
| Internet Software & Services–2.85% | |
Care.com, Inc.(b) | | | 50,150 | | | | 455,362 | |
CommerceHub, Inc.–Series C(b) | | | 14,350 | | | | 215,967 | |
DHI Group, Inc.(b) | | | 58,050 | | | | 330,885 | |
Earthlink Holdings Corp. | | | 270,850 | | | | 1,549,262 | |
eBay Inc.(b) | | | 78,700 | | | | 2,243,737 | |
| | | | | | | | 4,795,213 | |
|
| IT Consulting & Other Services–1.84% | |
Hackett Group, Inc. (The) | | | 10,650 | | | | 171,678 | |
International Business Machines Corp. | | | 5,950 | | | | 914,455 | |
Teradata Corp.(b) | | | 74,400 | | | | 2,005,824 | |
| | | | | | | | 3,091,957 | |
|
| Leisure Products–0.86% | |
Brunswick Corp. | | | 31,050 | | | | 1,350,675 | |
Johnson Outdoors Inc.–Class A | | | 2,800 | | | | 100,744 | |
| | | | | | | | 1,451,419 | |
|
| Life Sciences Tools & Services–1.41% | |
Cambrex Corp.(b) | | | 49,700 | | | | 2,002,910 | |
Enzo Biochem, Inc.(b) | | | 45,750 | | | | 279,075 | |
Waters Corp.(b) | | | 650 | | | | 90,441 | |
| | | | | | | | 2,372,426 | |
|
| Managed Health Care–2.06% | |
Triple-S Management Corp.–Class B (Puerto Rico)(b) | | | 67,350 | | | | 1,392,798 | |
WellCare Health Plans Inc.(b) | | | 18,250 | | | | 2,071,557 | |
| | | | | | | | 3,464,355 | |
|
| Metal & Glass Containers–0.05% | |
Greif Inc.–Class A | | | 1,850 | | | | 86,691 | |
|
| Movies & Entertainment–0.38% | |
Liberty Braves Group–Class A(b) | | | 16,350 | | | | 277,133 | |
Liberty Media Group–Class A(b) | | | 13,250 | | | | 368,747 | |
| | | | | | | | 645,880 | |
|
| Oil & Gas Drilling–3.67% | |
Atwood Oceanics, Inc. | | | 46,350 | | | | 353,651 | |
Ensco PLC–Class A | | | 252,700 | | | | 1,976,114 | |
Noble Corp. PLC (United Kingdom) | | | 200,300 | | | | 989,482 | |
Rowan Cos. PLC–Class A | | | 105,000 | | | | 1,393,350 | |
Seadrill Ltd. (United Kingdom)(b) | | | 369,350 | | | | 786,715 | |
Unit Corp.(b) | | | 39,150 | | | | 670,639 | |
| | | | | | | | 6,169,951 | |
|
| Oil & Gas Exploration & Production–5.40% | |
Bill Barrett Corp.(b) | | | 108,900 | | | | 565,191 | |
Continental Resources, Inc.(b) | | | 19,500 | | | | 953,745 | |
Denbury Resources Inc.(b) | | | 274,500 | | | | 656,055 | |
Encana Corp. (Canada) | | | 85,700 | | | | 817,578 | |
Enerplus Corp. (Canada) | | | 147,850 | | | | 993,552 | |
See accompanying Notes to Financial Statements which are an integral part of the financial statements.
10 Invesco All Cap Market Neutral Fund
| | | | | | | | |
| | | Shares | | | Value | |
| Oil & Gas Exploration & Production–(continued) | |
Evolution Petroleum Corp. | | | 79,000 | | | $ | 608,300 | |
Jones Energy, Inc.–Class A(b) | | | 91,250 | | | | 374,125 | |
Oasis Petroleum Inc.(b) | | | 264,300 | | | | 2,772,507 | |
Panhandle Oil & Gas, Inc.–Class A | | | 17,793 | | | | 320,274 | |
Resolute Energy Corp.(b) | | | 39,400 | | | | 1,020,460 | |
| | | | | | | | 9,081,787 | |
| |
| Packaged Foods & Meats–0.76% | | | | | |
Omega Protein Corp.(b) | | | 56,950 | | | | 1,269,985 | |
| | |
| Personal Products–0.56% | | | | | | | | |
LifeVantage Corp.(b) | | | 6,750 | | | | 55,350 | |
Natural Health Trends Corp. | | | 9,550 | | | | 222,802 | |
Nu Skin Enterprises, Inc.–Class A | | | 10,900 | | | | 671,985 | |
| | | | | | | | 950,137 | |
| | |
| Pharmaceuticals–4.27% | | | | | | | | |
Corcept Therapeutics Inc.(b) | | | 83,850 | | | | 581,919 | |
Heska Corp.(b) | | | 10,000 | | | | 494,000 | |
Innoviva, Inc.(b) | | | 110,500 | | | | 1,138,150 | |
Merck & Co., Inc. | | | 22,050 | | | | 1,294,776 | |
SciClone Pharmaceuticals, Inc.(b) | | | 104,650 | | | | 936,617 | |
Sucampo Pharmaceuticals, Inc.–Class A(b) | | | 42,300 | | | | 482,220 | |
Supernus Pharmaceuticals Inc.(b) | | | 113,450 | | | | 2,246,310 | |
| | | | | | | | 7,173,992 | |
|
| Property & Casualty Insurance–1.84% | |
Ambac Financial Group, Inc.(b) | | | 119,900 | | | | 2,212,155 | |
Assured Guaranty Ltd. | | | 29,750 | | | | 889,227 | |
| | | | | | | | 3,101,382 | |
| | |
| Publishing–0.19% | | | | | | | | |
McClatchy Co. (The)–Class A(b) | | | 22,350 | | | | 315,135 | |
| | |
| Real Estate Services–0.76% | | | | | | | | |
Altisource Portfolio Solutions S.A.(b) | | | 49,550 | | | | 1,275,913 | |
| | |
| Regional Banks–0.30% | | | | | | | | |
Central Valley Community Bancorp | | | 24,053 | | | | 344,439 | |
Citizens Financial Group, Inc. | | | 6,200 | | | | 163,308 | |
| | | | | | | | 507,747 | |
|
| Research & Consulting Services–0.43% | |
Acacia Research Corp. | | | 123,750 | | | | 723,938 | |
| | |
| Restaurants–1.42% | | | | | | | | |
Darden Restaurants, Inc. | | | 36,750 | | | | 2,381,033 | |
| | |
| Semiconductor Equipment–1.32% | | | | | | | | |
Applied Materials, Inc. | | | 76,300 | | | | 2,218,804 | |
| | |
| Semiconductors–1.74% | | | | | | | | |
Advanced Micro Devices, Inc.(b) | | | 405,500 | | | | 2,931,765 | |
| | | | | | | | |
| | | Shares | | | Value | |
| Specialty Chemicals–0.62% | | | | | | | | |
Ingevity Corp.(b) | | | 7,600 | | | $ | 314,640 | |
Rayonier Advanced Materials Inc. | | | 56,650 | | | | 732,485 | |
| | | | | | | | 1,047,125 | |
| | |
| Specialty Stores–0.97% | | | | | | | | |
Staples, Inc. | | | 220,950 | | | | 1,635,030 | |
| | |
| Steel–2.09% | | | | | | | | |
Cliffs Natural Resources Inc.(b) | | | 404,300 | | | | 2,231,736 | |
Commercial Metals Co. | | | 81,450 | | | | 1,279,579 | |
| | | | | | | | 3,511,315 | |
| |
| Technology Distributors–0.39% | | | | | |
PC Mall, Inc.(b) | | | 30,700 | | | | 650,840 | |
|
| Technology Hardware, Storage & Peripherals–2.11% | |
HP Inc. | | | 195,750 | | | | 2,836,417 | |
NetApp, Inc. | | | 20,800 | | | | 705,952 | |
| | | | | | | | 3,542,369 | |
|
| Thrifts & Mortgage Finance–0.41% | |
Walker & Dunlop, Inc.(b) | | | 28,700 | | | | 690,809 | |
| | |
| Tobacco–0.22% | | | | | | | | |
Alliance One International, Inc.(b) | | | 25,100 | | | | 372,735 | |
|
| Trading Companies & Distributors–1.52% | |
Herc Holdings, Inc.(b) | | | 7,100 | | | | 213,639 | |
MRC Global Inc.(b) | | | 140,800 | | | | 2,075,392 | |
Neff Corp.–Class A(b) | | | 8,450 | | | | 76,473 | |
Titan Machinery, Inc.(b) | | | 20,650 | | | | 191,838 | |
| | | | | | | | 2,557,342 | |
| | |
| Trucking–0.78% | | | | | | | | |
Swift Transportation Co.(b) | | | 58,300 | | | | 1,304,754 | |
Total Common Stocks & Other Equity Interests
(Cost $139,517,156) | | | | 148,397,523 | |
|
Money Market Funds–10.75% | |
Government & Agency Portfolio–Institutional Class, 0.29%(c) | | | 10,841,804 | | | | 10,841,804 | |
Treasury Portfolio–Institutional Class, 0.22%(c) | | | 7,227,869 | | | | 7,227,869 | |
Total Money Market Funds
(Cost $18,069,673) | | | | 18,069,673 | |
TOTAL INVESTMENTS–99.04%
(Cost $157,586,829) | | | | 166,467,196 | |
OTHER ASSETS LESS LIABILITIES–0.96% | | | | 1,615,066 | |
NET ASSETS–100.00% | | | | | | $ | 168,082,262 | |
Investment Abbreviations:
| | |
| REIT | | – Real Estate Investment Trust |
See accompanying Notes to Financial Statements which are an integral part of the financial statements.
11 Invesco All Cap Market Neutral Fund
Notes to Schedule of Investments:
| (a) | Industry and/or sector classifications used in this report are generally according to the Global Industry Classification Standard, which was developed by and is the exclusive property and a service mark of MSCI Inc. and Standard & Poor’s. |
| (b) | Non-income producing security. |
| (c) | The money market fund and the Fund are affiliated by having the same investment adviser. The rate shown is the 7-day SEC standardized yield as of October 31, 2016. |
| | | | | | | | | | | | | | | | | | | | | | | | |
| Open Over-The-Counter Total Return Swap Agreements | |
| Reference Entity | | Counterparty | | | Expiration Date | | | Floating Rate
Index(1) | | | Notional
Value | | | Unrealized Appreciation | | | Net Value of
Reference
Entities | |
Equity Securities — Short | | | Morgan Stanley & Co. LLC | | | | 04/24/2017 | | | | Federal Funds floating rate | | | $ | (153,805,420 | ) | | $ | 7,923,557 | (2) | | $ | (145,828,981 | ) |
| (1) | The Fund receives or pays the total return on the short positions underlying the total return swap and pays or receives a specific Federal Funds floating rate. |
| (2) | Amount includes $(52,882) of dividends payable long and financing fees payable by the Fund to the Counterparty. |
The following table represents the individual short positions and related values of equity securities underlying the total return swap with Morgan Stanley & Co. LLC as of October 31, 2016.
| | | | | | | | |
| | | Shares | | | Value | |
Equity Securities — Short | | | | | | | | |
| Airlines | | | | | | | | |
Allegiant Travel Co. | | | (800 | ) | | $ | (110,320 | ) |
Spirit Airlines, Inc. | | | (47,150 | ) | | | (2,259,899 | ) |
| | | | | (2,370,219 | ) |
| |
| Alternative Carriers | | | | | |
pdvWireless, Inc. | | | (34,650 | ) | | | (817,740 | ) |
| | |
| Aluminum | | | | | | | | |
Real Industry, Inc. | | | (47,000 | ) | | | (251,450 | ) |
| | |
| Apparel Retail | | | | | | | | |
Ascena Retail Group, Inc. | | | (136,850 | ) | | | (669,196 | ) |
Boot Barn Holdings, Inc. | | | (64,150 | ) | | | (821,120 | ) |
Guess?, Inc. | | | (35,700 | ) | | | (481,950 | ) |
| | | | | (1,972,266 | ) |
| |
| Apparel, Accessories & Luxury Goods | | | | | |
Fossil Group, Inc. | | | (31,200 | ) | | | (850,824 | ) |
Sequential Brands Group, Inc. | | | (60,650 | ) | | | (436,680 | ) |
Under Armour, Inc.–Class A | | | (55,350 | ) | | | (1,721,385 | ) |
| | | | | (3,008,889 | ) |
| |
| Application Software | | | | | |
Digimarc Corp. | | | (25,250 | ) | | | (797,900 | ) |
EnerNOC, Inc. | | | (56,100 | ) | | | (291,720 | ) |
MobileIron, Inc. | | | (31,350 | ) | | | (114,428 | ) |
Park City Group, Inc | | | (8,350 | ) | | | (109,803 | ) |
Tyler Technologies, Inc. | | | (4,650 | ) | | | (745,860 | ) |
| | | | | (2,059,711 | ) |
| |
| Asset Management & Custody Banks | | | | | |
Brookfield Asset Management Inc.–Class A (Canada) | | | (11,450 | ) | | | (400,979 | ) |
Financial Engines, Inc. | | | (14,050 | ) | | | (388,483 | ) |
WisdomTree Investments, Inc. | | | (95,350 | ) | | | (818,103 | ) |
| | | | | (1,607,565 | ) |
| | |
| Auto Parts & Equipment | | | | | | | | |
Kandi Technologies Group Inc. | | | (48,150 | ) | | | (240,750 | ) |
| | | | | | | | |
| | | Shares | | | Value | |
| Auto Parts & Equipment–(continued) | | | | | |
Workhorse Group Inc. | | | (61,550 | ) | | $ | (408,692 | ) |
| | | | | (649,442 | ) |
| |
| Automobile Manufacturers | | | | | |
General Motors Co. | | | (2,300 | ) | | | (72,680 | ) |
Tesla Motors, Inc. | | | (2,800 | ) | | | (553,644 | ) |
| | | | | (626,324 | ) |
| |
| Automotive Retail | | | | | |
Advance Auto Parts, Inc. | | | (9,500 | ) | | | (1,330,760 | ) |
CarMax, Inc. | | | (39,700 | ) | | | (1,982,618 | ) |
Monro Muffler Brake, Inc. | | | (4,850 | ) | | | (266,750 | ) |
| | | | | (3,580,128 | ) |
| |
| Biotechnology | | | | | |
ACADIA Pharmaceuticals Inc. | | | (88,950 | ) | | | (2,073,424 | ) |
Advaxis, Inc. | | | (48,950 | ) | | | (396,006 | ) |
Alnylam Pharmaceuticals, Inc. | | | (61,100 | ) | | | (2,175,160 | ) |
Amicus Therapeutics, Inc. | | | (107,150 | ) | | | (739,335 | ) |
Anthera Pharmaceuticals, Inc. | | | (81,300 | ) | | | (178,860 | ) |
Argos Therapeutics, Inc. | | | (95,050 | ) | | | (399,210 | ) |
Arrowhead Pharmaceuticals, Inc. | | | (60,700 | ) | | | (352,060 | ) |
bluebird bio, Inc. | | | (27,400 | ) | | | (1,308,350 | ) |
Corbus Pharmaceuticals Holdings, Inc. | | | (107,450 | ) | | | (601,720 | ) |
Dicerna Pharmaceuticals, Inc. | | | (19,500 | ) | | | (60,645 | ) |
Genocea Biosciences, Inc. | | | (63,250 | ) | | | (217,580 | ) |
Heron Therapeutics, Inc. | | | (95,100 | ) | | | (1,412,235 | ) |
Inotek Pharmaceuticals Corp. | | | (18,150 | ) | | | (127,050 | ) |
Invitae Corp. | | | (65,500 | ) | | | (503,040 | ) |
Keryx Biopharmaceuticals, Inc. | | | (77,500 | ) | | | (349,525 | ) |
Kite Pharma, Inc. | | | (35,550 | ) | | | (1,574,509 | ) |
Kura Oncology, Inc. | | | (9,163 | ) | | | (37,110 | ) |
La Jolla Pharmaceutical Co. | | | (22,700 | ) | | | (397,250 | ) |
Medgenics Inc. (Israel) | | | (57,581 | ) | | | (277,540 | ) |
Mirati Therapeutics, Inc. | | | (43,850 | ) | | | (221,443 | ) |
Novavax, Inc. | | | (187,750 | ) | | | (285,380 | ) |
OvaScience, Inc. | | | (86,300 | ) | | | (434,952 | ) |
See accompanying Notes to Financial Statements which are an integral part of the financial statements.
12 Invesco All Cap Market Neutral Fund
| | | | | | | | |
| | | Shares | | | Value | |
| Biotechnology–(continued) | | | | | | | | |
PTC Therapeutics, Inc. | | | (26,250 | ) | | $ | (163,013 | ) |
Sarepta Therapeutics, Inc. | | | (23,550 | ) | | | (924,102 | ) |
T2 Biosystems, Inc. | | | (58,450 | ) | | | (369,404 | ) |
Ultragenyx Pharmaceutical Inc. | | | (28,350 | ) | | | (1,672,366 | ) |
Vital Therapies, Inc. | | | (30,300 | ) | | | (162,105 | ) |
| | | | | (17,413,374 | ) |
| | |
| Cable & Satellite | | | | | | | | |
Liberty Broadband Corp.–Class C | | | (4,350 | ) | | | (289,928 | ) |
Loral Space & Communications Inc. | | | (3,300 | ) | | | (128,040 | ) |
| | | | | (417,968 | ) |
| | |
| Casinos & Gaming | | | | | | | | |
Wynn Resorts Ltd. | | | (17,200 | ) | | | (1,626,260 | ) |
| | |
| Commodity Chemicals | | | | | | | | |
BioAmber Inc. (Canada) | | | (44,500 | ) | | | (207,370 | ) |
Methanex Corp. (Canada) | | | (9,650 | ) | | | (350,778 | ) |
| | | | | (558,148 | ) |
| | |
| Communications Equipment | | | | | | | | |
NetScout Systems, Inc. | | | (39,800 | ) | | | (1,092,510 | ) |
ViaSat, Inc. | | | (12,250 | ) | | | (865,585 | ) |
| | | | | (1,958,095 | ) |
| | |
| Construction Materials | | | | | | | | |
U.S. Concrete, Inc. | | | (24,900 | ) | | | (1,242,510 | ) |
| | |
| Consumer Finance | | | | | | | | |
OneMain Holdings Inc. | | | (2,900 | ) | | | (82,186 | ) |
| |
| Data Processing & Outsourced Services | | | | | |
MAXIMUS, Inc. | | | (17,650 | ) | | | (918,859 | ) |
| | |
| Diversified Chemicals | | | | | | | | |
LSB Industries, Inc. | | | (64,950 | ) | | | (343,586 | ) |
| | |
| Diversified Metals & Mining | | | | | | | | |
Compass Minerals International, Inc. | | | (7,000 | ) | | | (502,950 | ) |
| | |
| Diversified Support Services | | | | | | | | |
Ritchie Bros. Auctioneers Inc. | | | (5,100 | ) | | | (176,409 | ) |
| |
| Electrical Components & Equipment | | | | | |
American Superconductor Corp. | | | (30,400 | ) | | | (194,864 | ) |
Revolution Lighting Technologies, Inc. | | | (30,500 | ) | | | (209,230 | ) |
Sunrun Inc. | | | (203,150 | ) | | | (1,058,411 | ) |
| | | | | (1,462,505 | ) |
| |
| Electronic Equipment & Instruments | | | | | |
CUI Global, Inc. | | | (10,950 | ) | | | (51,903 | ) |
Zebra Technologies Corp.–Class A | | | (28,600 | ) | | | (1,883,024 | ) |
| | | | | (1,934,927 | ) |
| |
| Environmental & Facilities Services | | | | | |
Covanta Holding Corp. | | | (38,600 | ) | | | (579,000 | ) |
Stericycle, Inc. | | | (28,150 | ) | | | (2,254,533 | ) |
Waste Connections, Inc. (Canada) | | | (17,900 | ) | | | (1,346,259 | ) |
| | | | | (4,179,792 | ) |
| | | | | | | | |
| | | Shares | | | Value | |
| Fertilizers & Agricultural Chemicals | | | | | |
AgroFresh Solutions, Inc. | | | (54,700 | ) | | $ | (257,090 | ) |
CF Industries Holdings, Inc. | | | (88,750 | ) | | | (2,130,887 | ) |
| | | | | (2,387,977 | ) |
| | |
| Food Retail | | | | | | | | |
Natural Grocers by Vitamin Cottage, Inc. | | | (48,300 | ) | | | (573,804 | ) |
| | |
| General Merchandise Stores | | | | | | | | |
Tuesday Morning Corp. | | | (105,150 | ) | | | (520,492 | ) |
| | |
| Gold | | | | | | | | |
Franco-Nevada Corp. (Canada) | | | (35,650 | ) | | | (2,333,649 | ) |
| | |
| Health Care Equipment | | | | | | | | |
AtriCure, Inc. | | | (42,800 | ) | | | (780,672 | ) |
Avinger, Inc. | | | (53,900 | ) | | | (188,650 | ) |
ConforMIS Inc. | | | (99,500 | ) | | | (759,185 | ) |
CytoSorbents Corp. | | | (57,250 | ) | | | (337,775 | ) |
DexCom, Inc. | | | (24,100 | ) | | | (1,885,584 | ) |
GenMark Diagnostics Inc. | | | (41,400 | ) | | | (441,738 | ) |
InVivo Therapeutics Holdings Corp. | | | (71,850 | ) | | | (312,548 | ) |
Invuity, Inc. | | | (40,400 | ) | | | (410,060 | ) |
Rockwell Medical, Inc. | | | (11,750 | ) | | | (68,268 | ) |
Tandem Diabetes Care, Inc. | | | (79,200 | ) | | | (479,160 | ) |
Veracyte, Inc. | | | (47,050 | ) | | | (341,583 | ) |
| | | | | (6,005,223 | ) |
| | |
| Health Care Facilities | | | | | | | | |
Acadia Healthcare Co., Inc. | | | (60,150 | ) | | | (2,162,994 | ) |
Tenet Healthcare Corp. | | | (55,650 | ) | | | (1,096,861 | ) |
| | | | | (3,259,855 | ) |
| | |
| Health Care Services | | | | | | | | |
Addus HomeCare Corp. | | | (13,300 | ) | | | (336,490 | ) |
Diplomat Pharmacy, Inc. | | | (7,850 | ) | | | (181,885 | ) |
Teladoc, Inc. | | | (4,400 | ) | | | (71,500 | ) |
| | | | | (589,875 | ) |
| | |
| Health Care Supplies | | | | | | | | |
Cerus Corp. | | | (260,150 | ) | | | (1,253,923 | ) |
Endologix, Inc. | | | (168,550 | ) | | | (1,763,033 | ) |
Sientra, Inc. | | | (40,050 | ) | | | (314,393 | ) |
VolitionRx Ltd. | | | (29,319 | ) | | | (129,883 | ) |
| | | | | (3,461,232 | ) |
| | |
| Health Care Technology | | | | | | | | |
Castlight Health, Inc.–Class B | | | (30,750 | ) | | | (133,763 | ) |
| | |
| Homebuilding | | | | | | | | |
New Home Co. Inc. (The) | | | (48,850 | ) | | | (489,477 | ) |
| | |
| Homefurnishing Retail | | | | | | | | |
Restoration Hardware Holdings, Inc. | | | (28,450 | ) | | | (824,196 | ) |
| | |
| Hotels, Resorts & Cruise Lines | | | | | | | | |
Norwegian Cruise Line Holdings Ltd. | | | (58,850 | ) | | | (2,287,499 | ) |
Royal Caribbean Cruises Ltd. | | | (21,000 | ) | | | (1,614,270 | ) |
| | | | | (3,901,769 | ) |
See accompanying Notes to Financial Statements which are an integral part of the financial statements.
13 Invesco All Cap Market Neutral Fund
| | | | | | | | |
| | | Shares | | | Value | |
| Household Products | | | | | | | | |
Orchids Paper Products Co. | | | (8,550 | ) | | $ | (219,393 | ) |
| | |
| Industrial Conglomerates | | | | | | | | |
Roper Technologies, Inc. | | | (500 | ) | | | (86,655 | ) |
| | |
| Industrial Machinery | | | | | | | | |
Middleby Corp. (The) | | | (17,400 | ) | | | (1,950,714 | ) |
Proto Labs, Inc. | | | (17,800 | ) | | | (795,660 | ) |
| | | | | (2,746,374 | ) |
| | |
| Integrated Oil & Gas | | | | | | | | |
Chevron Corp. | | | (22,050 | ) | | | (2,309,737 | ) |
Exxon Mobil Corp. | | | (25,800 | ) | | | (2,149,656 | ) |
| | | | | (4,459,393 | ) |
| | |
| Internet & Direct Marketing Retail | | | | | | | | |
Netflix, Inc. | | | (13,500 | ) | | | (1,685,745 | ) |
| | |
| Internet Software & Services | | | | | | | | |
Hortonworks, Inc. | | | (139,200 | ) | | | (1,063,488 | ) |
Pandora Media, Inc. | | | (174,350 | ) | | | (1,975,385 | ) |
| | | | | (3,038,873 | ) |
| | |
| Investment Banking & Brokerage | | | | | | | | |
Investment Technology Group, Inc. | | | (36,100 | ) | | | (552,691 | ) |
| | |
| IT Consulting & Other Services | | | | | | | | |
EPAM Systems, Inc. | | | (3,700 | ) | | | (238,169 | ) |
Mattersight Corp. | | | (20,950 | ) | | | (85,895 | ) |
Virtusa Corp. | | | (74,150 | ) | | | (1,404,401 | ) |
| | | | | (1,728,465 | ) |
| | |
| Leisure Products | | | | | | | | |
Arctic Cat Inc. | | | (30,900 | ) | | | (463,191 | ) |
Polaris Industries Inc. | | | (7,800 | ) | | | (597,558 | ) |
| | | | | (1,060,749 | ) |
| | |
| Life & Health Insurance | | | | | | | | |
Trupanion, Inc. | | | (39,700 | ) | | | (642,743 | ) |
| | |
| Life Sciences Tools & Services | | | | | | | | |
Accelerate Diagnostics, Inc. | | | (105,700 | ) | | | (2,246,125 | ) |
Pacific Biosciences of California, Inc. | | | (191,450 | ) | | | (1,627,325 | ) |
| | | | | (3,873,450 | ) |
| | |
| Multi-Line Insurance | | | | | | | | |
Kemper Corp. | | | (8,000 | ) | | | (300,400 | ) |
| | |
| Oil & Gas Equipment & Services | | | | | | | | |
Bristow Group, Inc. | | | (25,300 | ) | | | (253,253 | ) |
CARBO Ceramics Inc. | | | (15,450 | ) | | | (94,245 | ) |
Halliburton Co. | | | (6,750 | ) | | | (310,500 | ) |
Schlumberger Ltd. | | | (28,300 | ) | | | (2,213,909 | ) |
Weatherford International PLC | | | (395,100 | ) | | | (1,904,382 | ) |
| | | | | (4,776,289 | ) |
| |
| Oil & Gas Exploration & Production | | | | | |
Gulfport Energy Corp. | | | (2,550 | ) | | | (61,481 | ) |
| | | | | | | | |
| | | Shares | | | Value | |
| Oil & Gas Exploration & Production–(continued) | |
Kosmos Energy Ltd. | | | (42,150 | ) | | $ | (219,602 | ) |
Synergy Resources Corp. | | | (300,150 | ) | | | (2,053,026 | ) |
Whiting Petroleum Corp. | | | (200,850 | ) | | | (1,655,004 | ) |
| | | | | (3,989,113 | ) |
| | |
| Oil & Gas Refining & Marketing | | | | | | | | |
CVR Energy, Inc. | | | (64,400 | ) | | | (853,944 | ) |
Pacific Ethanol, Inc. | | | (35,450 | ) | | | (264,103 | ) |
| | | | | (1,118,047 | ) |
|
| Oil & Gas Storage & Transportation | |
Cheniere Energy, Inc. | | | (44,000 | ) | | | (1,658,800 | ) |
Dorian LPG Ltd. | | | (58,800 | ) | | | (331,044 | ) |
Golar LNG Ltd. (Bermuda) | | | (68,600 | ) | | | (1,501,654 | ) |
Pembina Pipeline Corp. (Canada) | | | (9,500 | ) | | | (292,220 | ) |
| | | | | (3,783,718 | ) |
| | |
| Packaged Foods & Meats | | | | | | | | |
Freshpet, Inc. | | | (44,250 | ) | | | (376,125 | ) |
Inventure Foods, Inc. | | | (18,850 | ) | | | (159,471 | ) |
| | | | | (535,596 | ) |
| | |
| Personal Products | | | | | | | | |
Coty, Inc.–Class A | | | (83,700 | ) | | | (1,924,263 | ) |
| | |
| Pharmaceuticals | | | | | | | | |
Achaogen Inc | | | (64,850 | ) | | | (297,662 | ) |
Aerie Pharmaceuticals, Inc. | | | (24,550 | ) | | | (816,287 | ) |
Allergan PLC | | | (8,850 | ) | | | (1,849,119 | ) |
Collegium Pharmaceutical, Inc. | | | (61,900 | ) | | | (926,643 | ) |
Corium International, Inc. | | | (28,000 | ) | | | (133,000 | ) |
Egalet Corp. | | | (65,700 | ) | | | (368,577 | ) |
Endo International PLC | | | (109,100 | ) | | | (2,045,625 | ) |
Flex Pharma Inc. | | | (14,350 | ) | | | (69,741 | ) |
Neos Therapeutics, Inc. | | | (34,600 | ) | | | (204,140 | ) |
Ocular Therapeutix, Inc. | | | (58,700 | ) | | | (332,242 | ) |
Omeros Corp. | | | (14,950 | ) | | | (122,590 | ) |
| | | | | (7,165,626 | ) |
| | |
| Property & Casualty Insurance | | | | | | | | |
Allied World Assurance Company Holdings, AG | | | (20,050 | ) | | | (861,749 | ) |
RLI Corp. | | | (1,350 | ) | | | (75,249 | ) |
White Mountains Insurance Group, Ltd. | | | (730 | ) | | | (605,695 | ) |
| | | | | (1,542,693 | ) |
| | |
| Real Estate Development | | | | | | | | |
Howard Hughes Corp. (The) | | | (7,300 | ) | | | (801,759 | ) |
| |
| Real Estate Operating Companies | | | | | |
Kennedy-Wilson Holdings Inc. | | | (22,650 | ) | | | (466,590 | ) |
| | |
| Real Estate Services | | | | | | | | |
Jones Lang LaSalle Inc. | | | (10,550 | ) | | | (1,021,767 | ) |
See accompanying Notes to Financial Statements which are an integral part of the financial statements.
14 Invesco All Cap Market Neutral Fund
| | | | | | | | |
| | | Shares | | | Value | |
| Regional Banks | | | | | | | | |
Pacific Mercantile Bancorp | | | (45,200 | ) | | $ | (253,120 | ) |
United Bankshares, Inc. | | | (13,800 | ) | | | (520,260 | ) |
| | | | | (773,380 | ) |
| | |
| Reinsurance | | | | | | | | |
Greenlight Capital Re, Ltd.–Class A | | | (43,350 | ) | | | (862,665 | ) |
| | |
| Residential REIT’s | | | | | | | | |
Bluerock Residential Growth REIT, Inc. | | | (11,100 | ) | | | (137,640 | ) |
| | |
| Restaurants | | | | | | | | |
Habit Restaurants, Inc. (The) | | | (26,150 | ) | | | (370,023 | ) |
Kona Grill, Inc. | | | (24,050 | ) | | | (258,538 | ) |
Noodles & Co. | | | (15,900 | ) | | | (74,730 | ) |
| | | | | (703,291 | ) |
| | |
| Semiconductors | | | | | | | | |
First Solar Inc. | | | (55,150 | ) | | | (2,233,023 | ) |
Microsemi Corp. | | | (1,800 | ) | | | (75,834 | ) |
SunPower Corp. | | | (27,700 | ) | | | (200,548 | ) |
Synaptics Inc. | | | (16,400 | ) | | | (854,768 | ) |
| | | | | (3,364,173 | ) |
| | |
| Silver–1.19% | | | | | | | | |
Silver Wheaton Corp. (Canada) | | | (83,000 | ) | | | (2,001,130 | ) |
| | |
| Specialized Finance | | | | | | | | |
On Deck Capital, Inc. | | | (164,800 | ) | | | (805,872 | ) |
| | |
| Specialized REIT’s | | | | | | | | |
Life Storage, Inc. | | | (4,400 | ) | | | (354,860 | ) |
| | |
| Specialty Chemicals | | | | | | | | |
Platform Specialty Products Corp. | | | (184,150 | ) | | | (1,342,453 | ) |
Senomyx, Inc. | | | (93,850 | ) | | | (109,805 | ) |
| | | | | (1,452,258 | ) |
| | |
| Specialty Stores | | | | | | | | |
Signet Jewelers Ltd. | | | (27,500 | ) | | | (2,234,650 | ) |
Tractor Supply Co. | | | (14,500 | ) | | | (908,135 | ) |
| | | | | (3,142,785 | ) |
| | |
| Steel | | | | | | | | |
Allegheny Technologies, Inc. | | | (84,150 | ) | | | (1,147,806 | ) |
United States Steel Corp. | | | (72,350 | ) | | | (1,399,249 | ) |
| | | | | (2,547,055 | ) |
| | |
| Systems Software | | | | | | | | |
FireEye, Inc. | | | (125,050 | ) | | | (1,453,081 | ) |
Tableau Software, Inc.–Class A | | | (47,100 | ) | | | (2,263,155 | ) |
TubeMogul Inc. | | | (40,050 | ) | | | (292,365 | ) |
| | | | | (4,008,601 | ) |
|
| Technology Hardware, Storage & Peripherals | |
Immersion Corp. | | | (69,000 | ) | | | (563,040 | ) |
Nimble Storage, Inc. | | | (206,900 | ) | | | (1,578,647 | ) |
| | | | | (2,141,687 | ) |
| | | | | | | | |
| | | Shares | | | Value | |
| Thrifts & Mortgage Finance | | | | | | | | |
LendingTree, Inc. | | | (16,150 | ) | | $ | (1,289,577 | ) |
| | |
| Trucking | | | | | | | | |
Werner Enterprises Inc. | | | (20,000 | ) | | | (481,000 | ) |
Total Equity Securities — Short | | | $ | (145,828,981 | ) |
See accompanying Notes to Financial Statements which are an integral part of the financial statements.
15 Invesco All Cap Market Neutral Fund
Statement of Assets and Liabilities
October 31, 2016
| | | | |
Assets: | |
Investments, at value (Cost $139,517,156) | | $ | 148,397,523 | |
Investments in affiliated money market funds, at value and cost | | | 18,069,673 | |
Total investments, at value (Cost $157,586,829) | | | 166,467,196 | |
Foreign currencies, at value (Cost $52) | | | 51 | |
Receivable for: | | | | |
Deposits with brokers for swap agreements | | | 50,000 | |
Investments sold | | | 7,095,750 | |
Fund shares sold | | | 111,133 | |
Dividends | | | 44,136 | |
Fund expenses absorbed | | | 25,223 | |
Swaps receivables | | | 378,693 | |
Investment for trustee deferred compensation and retirement plans | | | 6,260 | |
Unrealized appreciation on swap agreements — OTC | | | 7,923,557 | |
Other assets | | | 54,417 | |
Total assets | | | 182,156,416 | |
|
Liabilities: | |
Payable for: | | | | |
Investments purchased | | | 13,737,956 | |
Fund shares reacquired | | | 189,560 | |
Accrued fees to affiliates | | | 77,601 | |
Accrued trustees’ and officers’ fees and benefits | | | 1,553 | |
Accrued other operating expenses | | | 61,224 | |
Trustee deferred compensation and retirement plans | | | 6,260 | |
Total liabilities | | | 14,074,154 | |
Net assets applicable to shares outstanding | | $ | 168,082,262 | |
|
Net assets consist of: | |
Shares of beneficial interest | | $ | 159,726,344 | |
Undistributed net investment income (loss) | | | (7,969,348 | ) |
Undistributed net realized gain (loss) | | | (478,658 | ) |
Net unrealized appreciation | | | 16,803,924 | |
| | | $ | 168,082,262 | |
| | | | |
Net Assets: | |
Class A | | $ | 42,539,401 | |
Class C | | $ | 10,135,527 | |
Class R | | $ | 103,526 | |
Class Y | | $ | 41,368,962 | |
Class R5 | | $ | 492,869 | |
Class R6 | | $ | 73,441,977 | |
|
Shares outstanding, $0.01 par value per share,
with an unlimited number of shares authorized: | |
Class A | | | 4,341,481 | |
Class C | | | 1,055,275 | |
Class R | | | 10,638 | |
Class Y | | | 4,197,956 | |
Class R5 | | | 50,001 | |
Class R6 | | | 7,456,411 | |
Class A: | | | | |
Net asset value per share | | $ | 9.80 | |
Maximum offering price per share | | | | |
(Net asset value of $9.80 ¸ 94.50%) | | $ | 10.37 | |
Class C: | | | | |
Net asset value and offering price per share | | $ | 9.60 | |
Class R: | | | | |
Net asset value and offering price per share | | $ | 9.73 | |
Class Y: | | | | |
Net asset value and offering price per share | | $ | 9.85 | |
Class R5: | | | | |
Net asset value and offering price per share | | $ | 9.86 | |
Class R6: | | | | |
Net asset value and offering price per share | | $ | 9.85 | |
See accompanying Notes to Financial Statements which are an integral part of the financial statements.
16 Invesco All Cap Market Neutral Fund
Statement of Operations
For the year ended October 31, 2016
| | | | |
Investment income: | |
Dividends (net of foreign withholding taxes of $14,870) | | $ | 1,955,898 | |
Dividends from affiliated money market funds | | | 64,155 | |
Total investment income | | | 2,020,053 | |
| |
Expenses: | | | | |
Advisory fees | | | 1,866,749 | |
Administrative services fees | | | 50,000 | |
Custodian fees | | | 19,884 | |
Distribution fees: | | | | |
Class A | | | 119,858 | |
Class C | | | 97,430 | |
Class R | | | 742 | |
Transfer agent fees — A , C, R and Y | | | 152,576 | |
Transfer agent fees — R5 | | | 20 | |
Transfer agent fees — R6 | | | 245 | |
Trustees’ and officers’ fees and benefits | | | 20,227 | |
Registration and filing fees | | | 95,432 | |
Reports to shareholders | | | 23,110 | |
Professional services fees | | | 59,145 | |
Other | | | 18,997 | |
Total expenses | | | 2,524,415 | |
Less: Fees waived, expenses reimbursed and expense offset arrangement(s) | | | (279,358 | ) |
Net expenses | | | 2,245,057 | |
Net investment income (loss) | | | (225,004 | ) |
| |
Realized and unrealized gain (loss) from: | | | | |
Net realized gain (loss) from: | | | | |
Investment securities | | | 11,754,648 | |
Foreign currencies | | | 418 | |
Swap agreements | | | (43,228,000 | ) |
| | | | (31,472,934 | ) |
Change in net unrealized appreciation of: | | | | |
Investment securities | | | 7,869,064 | |
Swap agreements | | | 7,570,082 | |
| | | | 15,439,146 | |
Net realized and unrealized gain (loss) | | | (16,033,788 | ) |
Net increase (decrease) in net assets resulting from operations | | $ | (16,258,792 | ) |
See accompanying Notes to Financial Statements which are an integral part of the financial statements.
17 Invesco All Cap Market Neutral Fund
Statement of Changes in Net Assets
For the years ended October 31, 2016 and 2015
| | | | | | | | |
| | | 2016 | | | 2015 | |
Operations: | | | | | |
Net investment income (loss) | | $ | (225,004 | ) | | $ | (478,489 | ) |
Net realized gain (loss) | | | (31,472,934 | ) | | | 2,942,975 | |
Change in net unrealized appreciation (depreciation) | | | 15,439,146 | | | | (223,209 | ) |
Net increase (decrease) in net assets resulting from operations | | | (16,258,792 | ) | | | 2,241,277 | |
| | |
Distributions to shareholders from net investment income: | | | | | | | | |
Class A | | | (1,996,674 | ) | | | — | |
Class C | | | (342,508 | ) | | | — | |
Class R | | | (5,987 | ) | | | — | |
Class Y | | | (2,153,585 | ) | | | — | |
Class R5 | | | (67,476 | ) | | | — | |
Class R6 | | | (84,398 | ) | | | — | |
Total distributions from net investment income | | | (4,650,628 | ) | | | — | |
| | |
Share transactions–net: | | | | | | | | |
Class A | | | 37,820,319 | | | | 2,123,323 | |
Class C | | | 9,875,981 | | | | 837,576 | |
Class R | | | 106,118 | | | | (19,669 | ) |
Class Y | | | 30,769,232 | | | | 1,182,147 | |
Class R5 | | | — | | | | (112,330 | ) |
Class R6 | | | 77,562,633 | | | | 83,572 | |
Net increase in net assets resulting from share transactions | | | 156,134,283 | | | | 4,094,619 | |
Net increase in net assets | | | 135,224,863 | | | | 6,335,896 | |
| | |
Net assets: | | | | | | | | |
Beginning of year | | | 32,857,399 | | | | 26,521,503 | |
End of year (includes undistributed net investment income (loss) of $(7,969,348) and $4,240,112, respectively) | | $ | 168,082,262 | | | $ | 32,857,399 | |
See accompanying Notes to Financial Statements which are an integral part of the financial statements.
18 Invesco All Cap Market Neutral Fund
Statement of Cash Flows
For the year ended October 31, 2016
| | | | |
Cash provided by (used in) operating activities: | | | | |
Net increase (decrease) in net assets resulting from operations | | $ | (16,258,792 | ) |
|
Adjustments to reconcile the change in net assets from operations to net cash provided by (used in) operating activities: | |
Purchases of investments | | | (308,061,401 | ) |
Net change in unrealized appreciation on swap agreements | | | (7,570,082 | ) |
Proceeds from sales of investments | | | 214,087,901 | |
Increase in receivables and other assets | | | (496,740 | ) |
Increase in accrued expenses and other payables | | | 25,549 | |
Net realized gain from investment securities | | | (11,754,648 | ) |
Net change in unrealized appreciation on investment securities | | | (7,869,064 | ) |
Net cash provided by (used in) operating activities | | | (137,897,277 | ) |
| |
Cash provided by financing activities: | | | | |
Dividends paid to shareholders from net investment income | | | (1,344,801 | ) |
Proceeds from shares of beneficial interest sold | | | 264,815,707 | |
Disbursements from shares of beneficial interest reacquired | | | (111,455,884 | ) |
Net cash provided by financing activities | | | 152,015,022 | |
Net increase in cash and cash equivalents | | | 14,117,745 | |
Cash at beginning of year | | | 3,951,979 | |
Cash at end of year | | $ | 18,069,724 | |
Notes to Financial Statements
October 31, 2016
NOTE 1—Significant Accounting Policies
Invesco All Cap Market Neutral Fund (the “Fund”) is a series portfolio of AIM Investment Funds (Invesco Investment Funds) (the “Trust”). The Trust is organized as a Delaware statutory trust and is registered under the Investment Company Act of 1940, as amended (the “1940 Act”), as an open-end series management investment company consisting of twenty-two separate series portfolios, each authorized to issue an unlimited number of shares of beneficial interest. The assets, liabilities and operations of each portfolio are accounted for separately. Information presented in these financial statements pertains only to the Fund. Matters affecting each portfolio or class will be voted on exclusively by the shareholders of such portfolio or class.
The Fund’s investment objective is to provide a positive return over a full market cycle from a broadly diversified portfolio of stocks while seeking to limit exposure to the general risks associated with stock market investing.
The Fund currently consists of six different classes of shares: Class A, Class C, Class R, Class Y, Class R5 and Class R6. Class Y shares are available only to certain investors. Class A shares are sold with a front-end sales charge unless certain waiver criteria are met and under certain circumstances load waived shares may be subject to contingent deferred sales charges (“CDSC”). Class C shares are sold with a CDSC. Class R, Class Y, Class R5 and Class R6 shares are sold at net asset value.
The following is a summary of the significant accounting policies followed by the Fund in the preparation of its financial statements.
| A. | Security Valuations — Securities, including restricted securities, are valued according to the following policy. |
A security listed or traded on an exchange (except convertible securities) is valued at its last sales price or official closing price as of the close of the customary trading session on the exchange where the security is principally traded, or lacking any sales or official closing price on a particular day, the security may be valued at the closing bid price on that day. Securities traded in the over-the-counter market are valued based on prices furnished by independent pricing services or market makers. When such securities are valued by an independent pricing service they may be considered fair valued. Futures contracts are valued at the final settlement price set by an exchange on which they are principally traded. Listed options are valued at the mean between the last bid and asked prices from the exchange on which they are principally traded. Options not listed on an exchange are valued by an independent source at the mean between the last bid and asked prices. For purposes of determining net asset value (“NAV”) per share, futures and option contracts generally are valued 15 minutes after the close of the customary trading session of the New York Stock Exchange (“NYSE”).
Investments in open-end and closed-end registered investment companies that do not trade on an exchange are valued at the end-of-day net asset value per share. Investments in open-end and closed-end registered investment companies that trade on an exchange are valued at the last sales price or official closing price as of the close of the customary trading session on the exchange where the security is principally traded.
Debt obligations (including convertible securities) and unlisted equities are fair valued using an evaluated quote provided by an independent pricing service. Evaluated quotes provided by the pricing service may be determined without exclusive reliance on quoted prices, and may reflect appropriate factors such as institution-size trading in similar groups of securities, developments related to specific securities, dividend rate (for unlisted equities), yield (for debt obligations), quality, type of issue, coupon rate (for debt obligations), maturity (for debt obligations), individual
19 Invesco All Cap Market Neutral Fund
trading characteristics and other market data. Debt obligations are subject to interest rate and credit risks. In addition, all debt obligations involve some risk of default with respect to interest and/or principal payments.
Foreign securities’ (including foreign exchange contracts) prices are converted into U.S. dollar amounts using the applicable exchange rates as of the close of the NYSE. If market quotations are available and reliable for foreign exchange-traded equity securities, the securities will be valued at the market quotations. Because trading hours for certain foreign securities end before the close of the NYSE, closing market quotations may become unreliable. If between the time trading ends on a particular security and the close of the customary trading session on the NYSE, events occur that the Adviser determines are significant and make the closing price unreliable, the Fund may fair value the security. If the event is likely to have affected the closing price of the security, the security will be valued at fair value in good faith using procedures approved by the Board of Trustees. Adjustments to closing prices to reflect fair value may also be based on a screening process of an independent pricing service to indicate the degree of certainty, based on historical data, that the closing price in the principal market where a foreign security trades is not the current value as of the close of the NYSE. Foreign securities’ prices meeting the approved degree of certainty that the price is not reflective of current value will be priced at the indication of fair value from the independent pricing service. Multiple factors may be considered by the independent pricing service in determining adjustments to reflect fair value and may include information relating to sector indices, American Depositary Receipts and domestic and foreign index futures. Foreign securities may have additional risks including exchange rate changes, potential for sharply devalued currencies and high inflation, political and economic upheaval, the relative lack of issuer information, relatively low market liquidity and the potential lack of strict financial and accounting controls and standards.
Securities for which market prices are not provided by any of the above methods may be valued based upon quotes furnished by independent sources. The last bid price may be used to value equity securities. The mean between the last bid and asked prices is used to value debt obligations, including corporate loans.
Securities for which market quotations are not readily available or became unreliable are valued at fair value as determined in good faith by or under the supervision of the Trust’s officers following procedures approved by the Board of Trustees. Issuer specific events, market trends, bid/asked quotes of brokers and information providers and other market data may be reviewed in the course of making a good faith determination of a security’s fair value.
The Fund may invest in securities that are subject to interest rate risk, meaning the risk that the prices will generally fall as interest rates rise and, conversely, the prices will generally rise as interest rates fall. Specific securities differ in their sensitivity to changes in interest rates depending on their individual characteristics. Changes in interest rates may result in increased market volatility, which may affect the value and/or liquidity of certain Fund investments.
Valuations change in response to many factors including the historical and prospective earnings of the issuer, the value of the issuer’s assets, general economic conditions, interest rates, investor perceptions and market liquidity. Because of the inherent uncertainties of valuation, the values reflected in the financial statements may materially differ from the value received upon actual sale of those investments.
| B. | Securities Transactions and Investment Income — Securities transactions are accounted for on a trade date basis. Realized gains or losses on sales are computed on the basis of specific identification of the securities sold. Interest income and short stock rebate income are recorded on the accrual basis. Dividend income and dividend expense on short sales are recorded on the ex-dividend date. Premiums and discounts are amortized and/or accreted for financial reporting purposes. |
The Fund may periodically participate in litigation related to Fund investments. As such, the Fund may receive proceeds from litigation settlements. Any proceeds received are included in the Statement of Operations as realized gain (loss) for investments no longer held and as unrealized gain (loss) for investments still held.
Brokerage commissions and mark ups are considered transaction costs and are recorded as an increase to the cost basis of securities purchased and/or a reduction of proceeds on a sale of securities. Such transaction costs are included in the determination of net realized and unrealized gain (loss) from investment securities reported in the Statement of Operations and the Statement of Changes in Net Assets and the net realized and unrealized gains (losses) on securities per share in the Financial Highlights. Transaction costs are included in the calculation of the Fund’s net asset value and, accordingly, they reduce the Fund’s total returns. These transaction costs are not considered operating expenses and are not reflected in net investment income reported in the Statement of Operations and the Statement of Changes in Net Assets, or the net investment income per share and the ratios of expenses and net investment income reported in the Financial Highlights, nor are they limited by any expense limitation arrangements between the Fund and the investment adviser.
The Fund allocates income and realized and unrealized capital gains and losses to a class based on the relative net assets of each class.
| C. | Country Determination — For the purposes of making investment selection decisions and presentation in the Schedule of Investments, the investment adviser may determine the country in which an issuer is located and/or credit risk exposure based on various factors. These factors include the laws of the country under which the issuer is organized, where the issuer maintains a principal office, the country in which the issuer derives 50% or more of its total revenues and the country that has the primary market for the issuer’s securities, as well as other criteria. Among the other criteria that may be evaluated for making this determination are the country in which the issuer maintains 50% or more of its assets, the type of security, financial guarantees and enhancements, the nature of the collateral and the sponsor organization. Country of issuer and/or credit risk exposure has been determined to be the United States of America, unless otherwise noted. |
| D. | Distributions — Distributions from net investment income and net realized capital gain, if any, are generally declared and paid annually and recorded on the ex-dividend date. The Fund may elect to treat a portion of the proceeds from redemptions as distributions for federal income tax purposes. |
| E. | Federal Income Taxes — The Fund intends to comply with the requirements of Subchapter M of the Internal Revenue Code of 1986, as amended (the “Internal Revenue Code”), necessary to qualify as a regulated investment company and to distribute substantially all of the Fund’s taxable earnings to shareholders. As such, the Fund will not be subject to federal income taxes on otherwise taxable income (including net realized capital gain) that is distributed to shareholders. Therefore, no provision for federal income taxes is recorded in the financial statements. |
The Fund recognizes the tax benefits of uncertain tax positions only when the position is more likely than not to be sustained. Management has analyzed the Fund’s uncertain tax positions and concluded that no liability for unrecognized tax benefits should be recorded related to uncertain tax positions. Management is not aware of any tax positions for which it is reasonably possible that the total amounts of unrecognized tax benefits will change materially in the next 12 months.
20 Invesco All Cap Market Neutral Fund
The Fund files tax returns in the U.S. Federal jurisdiction and certain other jurisdictions. Generally, the Fund is subject to examinations by such taxing authorities for up to three years after the filing of the return for the tax period.
| F. | Expenses — Fees provided for under the Rule 12b-1 plan of a particular class of the Fund are charged to the operations of such class. Transfer agency fees and expenses and other shareholder recordkeeping fees and expenses attributable to Class R5 and Class R6 are allocated to each share class based on relative net assets. Sub-accounting fees attributable to Class R5 are charged to the operations of the class. Transfer agency fees and expenses and other shareholder recordkeeping fees and expenses relating to all other classes are allocated among those classes based on relative net assets. All other expenses are allocated among the classes based on relative net assets. |
| G. | Accounting Estimates — The preparation of financial statements in conformity with accounting principles generally accepted in the United States of America (“GAAP”) requires management to make estimates and assumptions that affect the reported amounts of assets and liabilities at the date of the financial statements and the reported amounts of revenues and expenses during the reporting period including estimates and assumptions related to taxation. Actual results could differ from those estimates by a significant amount. In addition, the Fund monitors for material events or transactions that may occur or become known after the period-end date and before the date the financial statements are released to print. |
| H. | Indemnifications — Under the Trust’s organizational documents, each Trustee, officer, employee or other agent of the Trust is indemnified against certain liabilities that may arise out of the performance of their duties to the Fund. Additionally, in the normal course of business, the Fund enters into contracts, including the Fund’s servicing agreements, that contain a variety of indemnification clauses. The Fund’s maximum exposure under these arrangements is unknown as this would involve future claims that may be made against the Fund that have not yet occurred. The risk of material loss as a result of such indemnification claims is considered remote. |
| I. | Cash and Cash Equivalents — For the purposes of the Statement of Cash Flows, the Fund defines Cash and Cash Equivalents as cash (including foreign currency), money market funds and other investments held in lieu of cash and excludes investments made with cash collateral received. |
| J. | Foreign Currency Translations — Foreign currency is valued at the close of the NYSE based on quotations posted by banks and major currency dealers. Portfolio securities and other assets and liabilities denominated in foreign currencies are translated into U.S. dollar amounts at date of valuation. Purchases and sales of portfolio securities (net of foreign taxes withheld on disposition) and income items denominated in foreign currencies are translated into U.S. dollar amounts on the respective dates of such transactions. The Fund does not separately account for the portion of the results of operations resulting from changes in foreign exchange rates on investments and the fluctuations arising from changes in market prices of securities held. The combined results of changes in foreign exchange rates and the fluctuation of market prices on investments (net of estimated foreign tax withholding) are included with the net realized and unrealized gain or loss from investments in the Statement of Operations. Reported net realized foreign currency gains or losses arise from (1) sales of foreign currencies, (2) currency gains or losses realized between the trade and settlement dates on securities transactions, and (3) the difference between the amounts of dividends, interest, and foreign withholding taxes recorded on the Fund’s books and the U.S. dollar equivalent of the amounts actually received or paid. Net unrealized foreign currency gains and losses arise from changes in the fair values of assets and liabilities, other than investments in securities at fiscal period end, resulting from changes in exchange rates. |
The Fund may invest in foreign securities, which may be subject to foreign taxes on income, gains on investments or currency repatriation, a portion of which may be recoverable. Foreign taxes, if any, are recorded based on the tax regulations and rates that exist in the foreign markets in which the Fund invests and are shown in the Statement of Operations.
| K. | Forward Foreign Currency Contracts — The Fund may engage in foreign currency transactions either on a spot (i.e. for prompt delivery and settlement) basis, or through forward foreign currency contracts, to manage or minimize currency or exchange rate risk. |
The Fund may also enter into forward foreign currency contracts for the purchase or sale of a security denominated in a foreign currency in order to “lock in” the U.S. dollar price of that security, or the Fund may also enter into forward foreign currency contracts that do not provide for physical settlement of the two currencies, but instead are settled by a single cash payment calculated as the difference between the agreed upon exchange rate and the spot rate at settlement based upon an agreed upon notional amount (non-deliverable forwards). The Fund will set aside liquid assets in an amount equal to the daily mark-to-market obligation for forward foreign currency contracts.
A forward foreign currency contract is an obligation between two parties (“Counterparties”) to purchase or sell a specific currency for an agreed-upon price at a future date. The use of forward foreign currency contracts does not eliminate fluctuations in the price of the underlying securities the Fund owns or intends to acquire but establishes a rate of exchange in advance. Fluctuations in the value of these contracts are measured by the difference in the contract date and reporting date exchange rates and are recorded as unrealized appreciation (depreciation) until the contracts are closed. When the contracts are closed, realized gains (losses) are recorded. Realized and unrealized gains (losses) on the contracts are included in the Statement of Operations. The primary risks associated with forward foreign currency contracts include failure of the Counterparty to meet the terms of the contract and the value of the foreign currency changing unfavorably. These risks may be in excess of the amounts reflected in the Statement of Assets and Liabilities.
| L. | Swap Agreements — The Fund may enter into various swap transactions, including interest rate, total return, volatility, variance, index, currency and credit default swap contracts (“CDS”) for investment purposes or to manage interest rate, equity, currency or credit risk. Such transactions are agreements between Counterparties. These agreements may contain among other conditions, events of default and termination events, and various covenants and representations such as provisions that require the Fund to maintain a pre-determined level of net assets, and/or provide limits regarding the decline of the Fund’s NAV over specific periods of time. If the Fund were to trigger such provisions and have open derivative positions at that time, the Counterparty may be able to terminate such agreement and request immediate payment in an amount equal to the net liability positions, if any. |
Interest rate, total return, volatility, variance, index, and currency swap agreements are two-party contracts entered into primarily to exchange the returns (or differentials in rates of returns) earned or realized on particular predetermined investments or instruments. The gross returns to be exchanged or “swapped” between the parties are calculated with respect to a notional amount, i.e., the return on or increase in value of a particular dollar amount invested at a particular interest rate or return of an underlying asset, in a particular foreign currency, or in a “basket” of securities representing a particular index.
21 Invesco All Cap Market Neutral Fund
A total return swap is an agreement in which one party makes payments based on a set rate, either fixed or variable, while the other party makes payments based on the return of an underlying asset, which includes both the income generated and capital gains, if any. The unrealized appreciation (depreciation) on total return swaps includes dividends on the underlying equity securities and financing rate payable from the Counterparty. At the maturity date, a net cash flow is exchanged where the total return is equivalent to the return of the underlying reference less a financing rate, if any. As a receiver, the Fund would receive payments based on any positive total return and would owe payments in the event of a negative total return. As the payer, the Fund would owe payments on any net positive total return, and would receive payment in the event of a negative total return.
Changes in the value of swap agreements are recognized as unrealized gains (losses) in the Statement of Operations by “marking to market” on a daily basis to reflect the value of the swap agreement at the end of each trading day. Payments received or paid at the beginning of the agreement are reflected as such on the Statement of Assets and Liabilities and may be referred to as upfront payments. The Fund accrues for the fixed payment stream and amortizes upfront payments, if any, on swap agreements on a daily basis with the net amount, recorded as a component of realized gain (loss) on the Statement of Operations. A liquidation payment received or made at the termination of a swap agreement is recorded as realized gain (loss) on the Statement of Operations. The Fund segregates cash or liquid securities having a value at least equal to the amount of the potential obligation of a Fund under any swap transaction. Cash held as collateral is recorded as deposits with brokers on the Statement of Assets and Liabilities. Entering into these agreements involves, to varying degrees, lack of liquidity and elements of credit, market, and Counterparty risk in excess of amounts recognized on the Statement of Assets and Liabilities. Such risks involve the possibility that a swap is difficult to sell or liquidate; the Counterparty does not honor its obligations under the agreement and unfavorable interest rates and market fluctuations. It is possible that developments in the swaps market, including potential government regulation, could adversely affect the Fund’s ability to terminate existing swap agreements or to realize amounts to be received under such agreements. A short position in a security poses more risk than holding the same security long. As there is no limit on how much the price of the security can increase, the Fund’s exposure is unlimited.
| M. | Leverage Risk — Leverage exists when the Fund can lose more than it originally invests because it purchases or sells an instrument or enters into a transaction without investing an amount equal to the full economic exposure of the instrument or transaction. |
| N. | Collateral — To the extent the Fund has designated or segregated a security as collateral and that security is subsequently sold, it is the Fund’s practice to replace such collateral no later than the next business day. |
NOTE 2—Advisory Fees and Other Fees Paid to Affiliates
The Trust has entered into a master investment advisory agreement with Invesco Advisers, Inc. (the “Adviser” or “Invesco”). Under the terms of the investment advisory agreement, the Fund pays an advisory fee to the Adviser based on the annual rate of the Fund’s average daily net assets as follows:
| | | | |
| Average Daily Net Assets | | Rate | |
First $10 billion | | | 1.25% | |
Over $10 billion | | | 1.15% | |
For the year ended October 31, 2016, the effective advisory fees incurred by the Fund was 1.25%.
Under the terms of a master sub-advisory agreement between the Adviser and each of Invesco Asset Management Deutschland GmbH, Invesco Asset Management Limited, Invesco Asset Management (Japan) Limited, Invesco Hong Kong Limited, Invesco Senior Secured Management, Inc., Invesco Canada Ltd. and Invesco PowerShares Capital Management LLC (collectively, the “Affiliated Sub-Advisers”) the Adviser, not the Fund, will pay 40% of the fees paid to the Adviser to any such Affiliated Sub-Adviser(s) that provide(s) discretionary investment management services to the Fund based on the percentage of assets allocated to such Affiliated Sub-Adviser(s).
The Adviser has contractually agreed, through at least February 28, 2017, to waive advisory fees and/or reimburse expenses to the extent necessary to limit total annual fund operating expenses after fee waiver and/or expense reimbursement (excluding certain items discussed below) of Class A, Class C, Class R, Class Y, Class R5 and Class R6 shares to 1.62%, 2.37%, 1.87%, 1.37%, 1.37% and 1.37%, respectively, of the Fund’s average daily net assets (the “expense limits”). In determining the Adviser’s obligation to waive advisory fees and/or reimburse expenses, the following expenses are not taken into account, and could cause the total annual fund operating expenses after fee waiver and/or expense reimbursement to exceed the numbers reflected above: (1) interest; (2) taxes; (3) dividend expense on short sales; (4) extraordinary or non-routine items, including litigation expenses; and (5) expenses that the Fund has incurred but did not actually pay because of an expense offset arrangement. Unless Invesco continues the fee waiver agreement, it will terminate on February 28, 2017. During its term, the fee waiver agreement cannot be terminated or amended to increase the expense limits without approval of the Board of Trustees.
Further, the Adviser has contractually agreed, through at least June 30, 2018, to waive the advisory fee payable by the Fund in an amount equal to 100% of the net advisory fees the Adviser receives from the affiliated money market funds on investments by the Fund of uninvested cash in such affiliated money market funds.
For the year ended October 31, 2016, the Adviser waived advisory fees of $126,518 and reimbursed class level expenses of $74,650, $15,170, $231, $62,143, $20 and $245 of Class A, Class C, Class R, Class Y, Class R5 and Class R6 shares, respectively.
The Trust has entered into a master administrative services agreement with Invesco pursuant to which the Fund has agreed to pay Invesco for certain administrative costs incurred in providing accounting services to the Fund. For the year ended October 31, 2016, expenses incurred under the agreement are shown in the Statement of Operations as Administrative services fees.
The Trust has entered into a transfer agency and service agreement with Invesco Investment Services, Inc. (“IIS”) pursuant to which the Fund has agreed to pay IIS a fee for providing transfer agency and shareholder services to the Fund and reimburse IIS for certain expenses incurred by IIS in the course of providing such services. IIS may make payments to intermediaries that provide omnibus account services, sub-accounting services and/or networking services. All fees payable by IIS to intermediaries that provide omnibus account services or sub-accounting are charged back to the Fund, subject to certain limitations approved by the Trust’s Board of Trustees. For the year ended October 31, 2016, expenses incurred under the agreement are shown in the Statement of Operations as Transfer agent fees.
22 Invesco All Cap Market Neutral Fund
The Trust has entered into master distribution agreements with Invesco Distributors, Inc. (“IDI”) to serve as the distributor for the Class A, Class C, Class R, Class Y, Class R5 and Class R6 shares of the Fund. The Trust has adopted plans pursuant to Rule 12b-1 under the 1940 Act with respect to the Fund’s Class A, Class C and Class R shares (collectively the “Plans”). The Fund, pursuant to the Plans, pays IDI compensation at the annual rate of 0.25% of the Fund’s average daily net assets of Class A shares, 1.00% of the average daily net assets of Class C shares and 0.50% of the average daily net assets of Class R shares. Of the Plan payments, up to 0.25% of the average daily net assets of each class of shares may be paid to furnish continuing personal shareholder services to customers who purchase and own shares of such classes. Any amounts not paid as a service fee under the Plans would constitute an asset-based sales charge. Rules of the Financial Industry Regulatory Authority (“FINRA”) impose a cap on the total sales charges, including asset-based sales charges, that may be paid by any class of shares of the Fund. For the year ended October 31, 2016, expenses incurred under the Plans are shown in the Statement of Operations as Distribution fees.
Front-end sales commissions and CDSC (collectively, the “sales charges”) are not recorded as expenses of the Fund. Front-end sales commissions are deducted from proceeds from the sales of Fund shares prior to investment in Class A shares of the Fund. CDSC are deducted from redemption proceeds prior to remittance to the shareholder. During the year ended October 31, 2016, IDI advised the Fund that IDI retained $26,343 in front-end sales commissions from the sale of Class A shares and $898 and $4,625 from Class A and Class C shares, respectively, for CDSC imposed upon redemptions by shareholders.
Certain officers and trustees of the Trust are officers and directors of the Adviser, IIS and/or IDI.
NOTE 3—Additional Valuation Information
GAAP defines fair value as the price that would be received to sell an asset or paid to transfer a liability in an orderly transaction between market participants at the measurement date, under current market conditions. GAAP establishes a hierarchy that prioritizes the inputs to valuation methods, giving the highest priority to readily available unadjusted quoted prices in an active market for identical assets (Level 1) and the lowest priority to significant unobservable inputs (Level 3), generally when market prices are not readily available or are unreliable. Based on the valuation inputs, the securities or other investments are tiered into one of three levels. Changes in valuation methods may result in transfers in or out of an investment’s assigned level:
| | Level 1 — | Prices are determined using quoted prices in an active market for identical assets. |
| | Level 2 — | Prices are determined using other significant observable inputs. Observable inputs are inputs that other market participants may use in pricing a security. These may include quoted prices for similar securities, interest rates, prepayment speeds, credit risk, yield curves, loss severities, default rates, discount rates, volatilities and others. |
| | Level 3 — | Prices are determined using significant unobservable inputs. In situations where quoted prices or observable inputs are unavailable (for example, when there is little or no market activity for an investment at the end of the period), unobservable inputs may be used. Unobservable inputs reflect the Fund’s own assumptions about the factors market participants would use in determining fair value of the securities or instruments and would be based on the best available information. |
The following is a summary of the tiered valuation input levels, as of October 31, 2016. The level assigned to the securities valuations may not be an indication of the risk or liquidity associated with investing in those securities. Because of the inherent uncertainties of valuation, the values reflected in the financial statements may materially differ from the value received upon actual sale of those investments.
| | | | | | | | | | | | | | | | |
| | | Level 1 | | | Level 2 | | | Level 3 | | | Total | |
Common Stocks & Other Equity Interests | | $ | 148,397,523 | | | $ | — | | | $ | — | | | $ | 148,397,523 | |
Money Market Funds | | | 18,069,673 | | | | — | | | | — | | | | 18,069,673 | |
| | | | 166,467,196 | | | | — | | | | — | | | | 166,467,196 | |
Swap Agreements* | | | — | | | | 7,923,557 | | | | — | | | | 7,923,557 | |
Total Investments | | $ | 166,467,196 | | | $ | 7,923,557 | | | $ | — | | | $ | 174,390,753 | |
| * | Unrealized appreciation. |
NOTE 4—Derivative Investments
The Fund may enter into an International Swaps and Derivatives Association Master Agreement (“ISDA Master Agreement”) under which a Fund may trade OTC derivatives. An OTC transaction entered into under an ISDA Master Agreement typically involves a collateral posting arrangement, payment netting provisions and close-out netting provisions. These netting provisions allow for reduction of credit risk through netting of contractual obligations. The enforceability of the netting provisions of the ISDA Master Agreement depends on the governing law of the ISDA Master Agreement, among other factors.
For financial reporting purposes, the Fund does not offset OTC derivative assets or liabilities that are subject to ISDA Master Agreements in the Statement of Assets and Liabilities.
Value of Derivative Investments at Period-End
The table below summarizes the value of the Fund’s derivative investments, detailed by primary risk exposure, held as of October 31, 2016:
| | | | |
| | | Value | |
| Derivative Assets | | Equity
Risk | |
Unrealized appreciation on swap agreements — OTC | | $ | 7,923,557 | |
Derivatives not subject to master netting agreements | | | — | |
Total Derivative Assets subject to master netting agreements | | $ | 7,923,557 | |
23 Invesco All Cap Market Neutral Fund
Offsetting Assets and Liabilities
The table below reflects the Fund’s exposure to Counterparties subject to either an ISDA Master Agreement or other agreement for OTC derivative transactions as of October 31, 2016.
| | | | | | | | | | | | | | | | |
| | | Financial
Derivative
Assets | | | Collateral (Received)/
Pledged | | | | |
| Counterparty | | Swap
agreements | | | Non-Cash | | | Cash | | | Net
amount | |
Morgan Stanley & Co. LLC | | $ | 8,302,250 | | | $ | — | | | $ | (50,000 | ) | | $ | 8,252,250 | |
Effect of Derivative Investments for the year ended October 31, 2016
The table below summarizes the gains (losses) on derivative investments, detailed by primary risk exposure, recognized in earnings during the period:
| | | | |
| | | Location of Gain (Loss) on
Statement of Operations | |
| | | Equity
Risk | |
Realized Gain (Loss): | | | | |
Swap agreements | | $ | (43,228,000 | ) |
Change in Net Unrealized Appreciation: | | | | |
Swap agreements | | | 7,570,082 | |
Total | | $ | (35,657,918 | ) |
The table below summarizes the average notional value of swap agreements outstanding during the period.
| | | | |
| | | Swap Agreements | |
Average notional value | | $ | 139,104,057 | |
NOTE 5—Expense Offset Arrangement(s)
The expense offset arrangement is comprised of transfer agency credits which result from balances in demand deposit accounts used by the transfer agent for clearing shareholder transactions. For the year ended October 31, 2016, the Fund received credits from this arrangement, which resulted in the reduction of the Fund’s total expenses of $381.
NOTE 6—Trustees’ and Officers’ Fees and Benefits
Trustees’ and Officers’ Fees and Benefits include amounts accrued by the Fund to pay remuneration to certain Trustees and Officers of the Fund. Trustees have the option to defer compensation payable by the Fund, and Trustees’ and Officers’ Fees and Benefits also include amounts accrued by the Fund to fund such deferred compensation amounts. Those Trustees who defer compensation have the option to select various Invesco Funds in which their deferral accounts shall be deemed to be invested. Obligations under the deferred compensation plan represent unsecured claims against the general assets of the Fund.
NOTE 7—Cash Balances
The Fund is permitted to temporarily carry a negative or overdrawn balance in its account with State Street Bank and Trust Company, the custodian bank. Such balances, if any at period-end, are shown in the Statement of Assets and Liabilities under the payable caption Amount due custodian. To compensate the custodian bank for such overdrafts, the overdrawn Fund may either (1) leave funds as a compensating balance in the account so the custodian bank can be compensated by earning the additional interest; or (2) compensate by paying the custodian bank at a rate agreed upon by the custodian bank and Invesco, not to exceed the contractually agreed upon rate.
24 Invesco All Cap Market Neutral Fund
NOTE 8—Distributions to Shareholders and Tax Components of Net Assets
Tax Character of Distributions to Shareholders Paid During the Fiscal Years Ended October 31, 2016 and 2015:
| | | | | | | | |
| | | 2016 | | | 2015 | |
Ordinary income | | $ | 4,597,598 | | | $ | — | |
Long-term capital gain | | | 53,030 | | | | — | |
Total distributions | | $ | 4,650,628 | | | $ | — | |
Tax Components of Net Assets at Period-End:
| | | | |
| | | 2016 | |
Undistributed long-term gain | | $ | 61,992 | |
Net unrealized appreciation — investments | | | 8,339,718 | |
Temporary book/tax differences | | | (6,059 | ) |
Late-Year ordinary loss deferrals | | | (39,733 | ) |
Shares of beneficial interest | | | 159,726,344 | |
Total net assets | | $ | 168,082,262 | |
The difference between book-basis and tax-basis unrealized appreciation (depreciation) is due to differences in the timing of recognition of gains and losses on investments for tax and book purposes. The Fund’s net unrealized appreciation difference is attributable primarily to wash sales.
The temporary book/tax differences are a result of timing differences between book and tax recognition of income and/or expenses. The Fund’s temporary book/tax differences are the result of the trustee deferral of compensation and retirement plan benefits.
Capital loss carryforward is calculated and reported as of a specific date. Results of transactions and other activity after that date may affect the amount of capital loss carryforward actually available for the Fund to utilize. The ability to utilize capital loss carryforward in the future may be limited under the Internal Revenue Code and related regulations based on the results of future transactions.
The Fund does not have a capital loss carryforward as of October 31, 2016.
NOTE 9—Investment Securities
The aggregate amount of investment securities (other than short-term securities, U.S. Treasury obligations and money market funds, if any) purchased and sold by the Fund during the year ended October 31, 2016 was $320,063,626 and $219,206,454, respectively. Cost of investments on a tax basis includes the adjustments for financial reporting purposes as of the most recently completed federal income tax reporting period-end.
| | | | |
| Unrealized Appreciation (Depreciation) of Investment Securities on a Tax Basis | |
Aggregate unrealized appreciation of investment securities | | $ | 17,127,720 | |
Aggregate unrealized (depreciation) of investment securities | | | (8,788,002 | ) |
Net unrealized appreciation of investment securities | | $ | 8,339,718 | |
Cost of investments for tax purposes is $158,127,478.
NOTE 10—Reclassification of Permanent Differences
Primarily as a result of differing book/tax treatment of swap agreement income and net operating losses, on October 31, 2016, undistributed net investment income (loss) was decreased by $7,333,828, undistributed net realized gain (loss) was increased by $33,161,220 and shares of beneficial interest was decreased by $25,827,392. This reclassification had no effect on the net assets of the Fund.
25 Invesco All Cap Market Neutral Fund
NOTE 11—Share Information
| | | | | | | | | | | | | | | | |
| | | Summary of Share Activity | |
| | | Years ended October 31, | |
| | | 2016(a) | | | 2015 | |
| | | Shares | | | Amount | | | Shares | | | Amount | |
Sold: | | | | | | | | | | | | | | | | |
Class A | | | 9,254,725 | | | $ | 98,705,258 | | | | 1,145,421 | | | $ | 12,745,791 | |
Class C | | | 1,785,156 | | | | 18,630,806 | | | | 193,382 | | | | 2,124,532 | |
Class R | | | 25,401 | | | | 266,205 | | | | 23,122 | | | | 252,070 | |
Class Y | | | 5,966,976 | | | | 62,854,381 | | | | 1,461,895 | | | | 16,219,741 | |
Class R6(b) | | | 8,048,947 | | | | 84,017,175 | | | | 12,424 | | | | 134,891 | |
| | | | |
Issued as reinvestment of dividends: | | | | | | | | | | | | | | | | |
Class A | | | 132,014 | | | | 1,395,381 | | | | — | | | | — | |
Class C | | | 32,714 | | | | 341,201 | | | | — | | | | — | |
Class R | | | 444 | | | | 4,665 | | | | — | | | | — | |
Class Y | | | 145,868 | | | | 1,547,659 | | | | — | | | | — | |
Class R6 | | | 1,595 | | | | 16,921 | | | | — | | | | — | |
| | | | |
Reacquired: | | | | | | | | | | | | | | | | |
Class A | | | (6,120,260 | ) | | | (62,280,320 | ) | | | (980,822 | ) | | | (10,622,468 | ) |
Class C | | | (913,301 | ) | | | (9,096,026 | ) | | | (123,275 | ) | | | (1,286,956 | ) |
Class R | | | (17,120 | ) | | | (164,752 | ) | | | (24,922 | ) | | | (271,739 | ) |
Class Y | | | (3,326,932 | ) | | | (33,632,808 | ) | | | (1,416,243 | ) | | | (15,037,594 | ) |
Class R5 | | | — | | | | — | | | | (10,386 | ) | | | (112,330 | ) |
Class R6 | | | (656,366 | ) | | | (6,471,463 | ) | | | (4,685 | ) | | | (51,319 | ) |
Net increase in share activity | | | 14,359,861 | | | $ | 156,134,283 | | | | 275,911 | | | $ | 4,094,619 | |
| (a) | There are entities that are record owners of more than 5% of the outstanding shares of the Fund and in the aggregate own 29% of the outstanding shares of the Fund. IDI has an agreement with these entities to sell Fund shares. The Fund, Invesco and/or Invesco affiliates may make payments to these entities, which are considered to be related to the Fund, for providing services to the Fund, Invesco and/or Invesco affiliates including but not limited to services such as securities brokerage, distribution, third party record keeping and account servicing. The Fund has no knowledge as to whether all or any portion of the shares owned of record by these entities are also owned beneficially. |
| | In addition, 47% of the outstanding shares of the Fund are owned by the Adviser or an affiliate of the Adviser. |
| (b) | On February 18, 2016, 6,524,352 Class R6 shares valued at $68,766,670 were sold to affiliated mutual funds. |
26 Invesco All Cap Market Neutral Fund
NOTE 12—Financial Highlights
The following schedule presents financial highlights for a share of the Fund outstanding throughout the periods indicated.
| | | | | | | | | | | | | | | | | | | | | | | | | | | | | | | | | | | | | | | | | | | | | | | | | | | | | | | | | | | | |
| | | Net asset
value,
beginning
of period | | | Net
investment
income
(loss)(a) | | | Net gains
(losses)
on securities
(both
realized and
unrealized) | | | Total from
investment
operations | | | Dividends
from net
investment
income | | | Net asset
value, end
of period | | | Total
return(b) | | | Net assets,
end of period
(000’s omitted) | | | Ratio of
expenses
to average
net assets
(including
interest
expense and
dividends on
short sales
expense)
with fee waivers
and/or expenses
absorbed | | | Ratio of
expenses
to average
net assets
(including
interest
expense and
dividends on
short sales
expense)
without fee waivers
and/or expenses
absorbed | | | Ratio of
expenses
to average
net assets
(excluding
interest
expense and
dividends on
short sales
expense)
with fee waivers
and/or expenses
absorbed | | | Ratio of
expenses
to average
net assets
(excluding
interest
expense and
dividends on
short sales
expense)
without fee waivers
and/or expenses
absorbed | | | Ratio of net
investment
income (loss)
to average
net assets | | | Ratio of
interest
expense and
dividends on
short sales
to average
net assets | | | Portfolio
turnover(c) | |
Class A | | | | | | | | | | | | | | | | | | | | | | | | | | | | | | | | | | | | | | | | | | | | | | | | | | | | | | | | | | | | |
Year ended 10/31/16 | | $ | 11.92 | | | $ | (0.03 | ) | | $ | (0.76 | ) | | $ | (0.79 | ) | | $ | (1.33 | ) | | $ | 9.80 | | | | (7.42 | )% | | $ | 42,539 | | | | 1.61 | %(d) | | | 1.85 | %(d) | | | 1.61 | %(d) | | | 1.85 | %(d) | | | (0.26 | )%(d) | | | — | | | | 168 | % |
Year ended 10/31/15 | | | 10.70 | | | | (0.20 | ) | | | 1.42 | | | | 1.22 | | | | — | | | | 11.92 | | | | 11.40 | | | | 12,812 | | | | 3.69 | | | | 4.62 | | | | 1.60 | | | | 2.53 | | | | (1.85 | ) | | | 2.09 | | | | 175 | |
Year ended 10/31/14(e) | | | 10.00 | | | | (0.27 | ) | | | 0.97 | | | | 0.70 | | | | — | | | | 10.70 | | | | 7.00 | | | | 9,742 | | | | 4.53 | (f) | | | 7.28 | (f) | | | 1.60 | (f) | | | 4.35 | (f) | | | (3.03 | )(f) | | | 2.93 | (f) | | | 105 | |
Class C | | | | | | | | | | | | | | | | | | | | | | | | | | | | | | | | | | | | | | | | | | | | | | | | | | | | | | | | | | | | |
Year ended 10/31/16 | | | 11.76 | | | | (0.10 | ) | | | (0.76 | ) | | | (0.86 | ) | | | (1.30 | ) | | | 9.60 | | | | (8.19 | ) | | | 10,136 | | | | 2.36 | (d) | | | 2.60 | (d) | | | 2.36 | (d) | | | 2.60 | (d) | | | (1.01 | )(d) | | | — | | | | 168 | |
Year ended 10/31/15 | | | 10.63 | | | | (0.28 | ) | | | 1.41 | | | | 1.13 | | | | — | | | | 11.76 | | | | 10.63 | | | | 1,772 | | | | 4.44 | | | | 5.37 | | | | 2.35 | | | | 3.28 | | | | (2.60 | ) | | | 2.09 | | | | 175 | |
Year ended 10/31/14(e) | | | 10.00 | | | | (0.34 | ) | | | 0.97 | | | | 0.63 | | | | — | | | | 10.63 | | | | 6.30 | | | | 857 | | | | 5.28 | (f) | | | 8.03 | (f) | | | 2.35 | (f) | | | 5.10 | (f) | | | (3.78 | )(f) | | | 2.93 | (f) | | | 105 | |
Class R | | | | | | | | | | | | | | | | | | | | | | | | | | | | | | | | | | | | | | | | | | | | | | | | | | | | | | | | | | | | |
Year ended 10/31/16 | | | 11.86 | | | | (0.05 | ) | | | (0.76 | ) | | | (0.81 | ) | | | (1.32 | ) | | | 9.73 | | | | (7.66 | ) | | | 104 | | | | 1.86 | (d) | | | 2.10 | (d) | | | 1.86 | (d) | | | 2.10 | (d) | | | (0.51 | )(d) | | | — | | | | 168 | |
Year ended 10/31/15 | | | 10.68 | | | | (0.22 | ) | | | 1.40 | | | | 1.18 | | | | — | | | | 11.86 | | | | 11.05 | | | | 23 | | | | 3.94 | | | | 4.87 | | | | 1.85 | | | | 2.78 | | | | (2.10 | ) | | | 2.09 | | | | 175 | |
Year ended 10/31/14(e) | | | 10.00 | | | | (0.29 | ) | | | 0.97 | | | | 0.68 | | | | — | | | | 10.68 | | | | 6.80 | | | | 40 | | | | 4.78 | (f) | | | 7.53 | (f) | | | 1.85 | (f) | | | 4.60 | (f) | | | (3.28 | )(f) | | | 2.93 | (f) | | | 105 | |
Class Y | | | | | | | | | | | | | | | | | | | | | | | | | | | | | | | | | | | | | | | | | | | | | | | | | | | | | | | | | | | | |
Year ended 10/31/16 | | | 11.97 | | | | (0.00 | ) | | | (0.77 | ) | | | (0.77 | ) | | | (1.35 | ) | | | 9.85 | | | | (7.24 | ) | | | 41,369 | | | | 1.36 | (d) | | | 1.60 | (d) | | | 1.36 | (d) | | | 1.60 | (d) | | | (0.01 | )(d) | | | — | | | | 168 | |
Year ended 10/31/15 | | | 10.72 | | | | (0.17 | ) | | | 1.42 | | | | 1.25 | | | | — | | | | 11.97 | | | | 11.66 | | | | 16,907 | | | | 3.44 | | | | 4.37 | | | | 1.35 | | | | 2.28 | | | | (1.60 | ) | | | 2.09 | | | | 175 | |
Year ended 10/31/14(e) | | | 10.00 | | | | (0.25 | ) | | | 0.97 | | | | 0.72 | | | | — | | | | 10.72 | | | | 7.20 | | | | 14,651 | | | | 4.28 | (f) | | | 7.03 | (f) | | | 1.35 | (f) | | | 4.10 | (f) | | | (2.78 | )(f) | | | 2.93 | (f) | | | 105 | |
Class R5 | | | | | | | | | | | | | | | | | | | | | | | | | | | | | | | | | | | | | | | | | | | | | | | | | | | | | | | | | | | | |
Year ended 10/31/16 | | | 11.97 | | | | (0.00 | ) | | | (0.76 | ) | | | (0.76 | ) | | | (1.35 | ) | | | 9.86 | | | | (7.15 | ) | | | 493 | | | | 1.36 | (d) | | | 1.45 | (d) | | | 1.36 | (d) | | | 1.45 | (d) | | | (0.01 | )(d) | | | — | | | | 168 | |
Year ended 10/31/15 | | | 10.72 | | | | (0.17 | ) | | | 1.42 | | | | 1.25 | | | | — | | | | 11.97 | | | | 11.66 | | | | 599 | | | | 3.44 | | | | 4.28 | | | | 1.35 | | | | 2.19 | | | | (1.60 | ) | | | 2.09 | | | | 175 | |
Year ended 10/31/14(e) | | | 10.00 | | | | (0.25 | ) | | | 0.97 | | | | 0.72 | | | | — | | | | 10.72 | | | | 7.20 | | | | 648 | | | | 4.28 | (f) | | | 7.00 | (f) | | | 1.35 | (f) | | | 4.07 | (f) | | | (2.78 | )(f) | | | 2.93 | (f) | | | 105 | |
Class R6 | | | | | | | | | | | | | | | | | | | | | | | | | | | | | | | | | | | | | | | | | | | | | | | | | | | | | | | | | | | | |
Year ended 10/31/16 | | | 11.97 | | | | (0.00 | ) | | | (0.77 | ) | | | (0.77 | ) | | | (1.35 | ) | | | 9.85 | | | | (7.24 | ) | | | 73,442 | | | | 1.36 | (d) | | | 1.44 | (d) | | | 1.36 | (d) | | | 1.44 | (d) | | | (0.01 | )(d) | | | — | | | | 168 | |
Year ended 10/31/15 | | | 10.72 | | | | (0.17 | ) | | | 1.42 | | | | 1.25 | | | | — | | | | 11.97 | | | | 11.66 | | | | 745 | | | | 3.44 | | | | 4.28 | | | | 1.35 | | | | 2.19 | | | | (1.60 | ) | | | 2.09 | | | | 175 | |
Year ended 10/31/14(e) | | | 10.00 | | | | (0.25 | ) | | | 0.97 | | | | 0.72 | | | | — | | | | 10.72 | | | | 7.20 | | | | 584 | | | | 4.28 | (f) | | | 6.99 | (f) | | | 1.35 | (f) | | | 4.06 | (f) | | | (2.78 | )(f) | | | 2.93 | (f) | | | 105 | |
| (a) | Calculated using average shares outstanding. |
| (b) | Includes adjustments in accordance with accounting principles generally accepted in the United States of America and as such, the net asset value for financial reporting purposes and the returns based upon those net asset values may differ from the net asset value and returns for shareholder transactions. Does not include sales charges and is not annualized for periods less than one year, if applicable. |
| (c) | Portfolio turnover is calculated at the fund level and is not annualized for periods less than one year, if applicable. |
| (d) | Ratios are based on average daily net assets (000’s omitted) of $47,943, $9,743, $148, $39,911, $518 and $51,076 for Class A, Class C, Class R, Class Y, Class R5 and Class R6 shares, respectively. |
| (e) | Commencement date of December 17, 2013. |
NOTE 13—Subsequent Event
Effective January 1, 2017, the Fund will pay an advisory fee to the Adviser based on the annual rate of the Fund’s average daily net assets as follows:
| | | | |
| Average Daily Net Assets | | Rate | |
First $250 million | | | 0.85% | |
Next $250 million | | | 0.82% | |
Next $500 million | | | 0.80% | |
Next $1.5 billion | | | 0.77% | |
Next $2.5 billion | | | 0.75% | |
Next $2.5 billion | | | 0.72% | |
Next $2.5 billion | | | 0.70% | |
Over $10 billion | | | 0.67% | |
In addition, effective January 1, 2017, the Adviser has contractually agreed, through at least February 28, 2018, to waive advisory fees and/or reimburse expenses to the extent necessary to limit total annual fund operating expenses after fee waiver and/or expense reimbursement (excluding certain items discussed in Note 2) of Class A, Class C, Class R, Class Y, Class R5 and Class R6 shares to 1.50%, 2.25%, 1.75%, 1.25%, 1.25% and 1.25%, respectively, of the Fund’s average daily net assets.
27 Invesco All Cap Market Neutral Fund
Report of Independent Registered Public Accounting Firm
To the Board of Trustees and Shareholders of the Invesco All Cap Market Neutral Fund:
In our opinion, the accompanying statement of assets and liabilities, including the schedule of investments, and the related statements of operations and of changes in net assets, and of cash flows and the financial highlights present fairly, in all material respects, the financial position of the Invesco All Cap Market Neutral Fund (the “Fund”) as of October 31, 2016, the results of its operations and its cash flows for the year then ended, the changes in its net assets for each of the two years in the period then ended and the financial highlights for each of the two years in the period then ended and for the period December 17, 2013 (commencement of operations) through October 31, 2014, in conformity with accounting principles generally accepted in the United States of America. These financial statements and financial highlights (hereafter referred to as “financial statements”) are the responsibility of the Fund’s management. Our responsibility is to express an opinion on these financial statements based on our audits. We conducted our audits of these financial statements in accordance with the standards of the Public Company Accounting Oversight Board (United States). Those standards require that we plan and perform the audit to obtain reasonable assurance about whether the financial statements are free of material misstatement. An audit includes examining, on a test basis, evidence supporting the amounts and disclosures in the financial statements, assessing the accounting principles used and significant estimates made by management, and evaluating the overall financial statement presentation. We believe that our audits, which included confirmation of securities as of October 31, 2016 by correspondence with the custodian and brokers, and the application of alternative auditing procedures where confirmations of security purchases have not been received, provide a reasonable basis for our opinion.
PRICEWATERHOUSECOOPERS LLP
Houston, Texas
December 21, 2016
28 Invesco All Cap Market Neutral Fund
Calculating your ongoing Fund expenses
Example
As a shareholder of the Fund, you incur two types of costs: (1) transaction costs, which may include sales charges (loads) on purchase payments or contingent deferred sales charges on redemptions, if any; and (2) ongoing costs, including management fees, distribution and/or service (12b-1) fees, and other Fund expenses. This example is intended to help you understand your ongoing costs (in dollars) of investing in the Fund and to compare these costs with ongoing costs of investing in other mutual funds. The example is based on an investment of $1,000 invested at the beginning of the period and held for the entire period May 1, 2016 through October 31, 2016.
Actual expenses
The table below provides information about actual account values and actual expenses. You may use the information in this table, together with the amount you invested, to estimate the expenses that you paid over the period. Simply divide your account value by $1,000 (for example, an $8,600 account value divided by $1,000 = 8.6), then multiply the result by the number in the table under the heading entitled “Actual Expenses Paid During Period” to estimate the expenses you paid on your account during this period.
Hypothetical example for comparison purposes
The table below also provides information about hypothetical account values and hypothetical expenses based on the Fund’s actual expense ratio and an assumed rate of return of 5% per year before expenses, which is not the Fund’s actual return.
The hypothetical account values and expenses may not be used to estimate the actual ending account balance or expenses you paid for the period. You may use this information to compare the ongoing costs of investing in the Fund and other funds. To do so, compare this 5% hypothetical example with the 5% hypothetical examples that appear in the shareholder reports of the other funds.
Please note that the expenses shown in the table are meant to highlight your ongoing costs only and do not reflect any transaction costs, such as sales charges (loads) on purchase payments or contingent deferred sales charges on redemptions, if any. Therefore, the hypothetical information is useful in comparing ongoing costs only, and will not help you determine the relative total costs of owning different funds. In addition, if these transaction costs were included, your costs would have been higher.
| | | | | | | | | | | | | | | | | | | | | | | | |
| Class | | Beginning
Account Value
(05/01/16) | | | ACTUAL | | | HYPOTHETICAL
(5% annual return before
expenses) | | | Annualized
Expense
Ratio2 | |
| | | Ending
Account Value
(10/31/16)1 | | | Expenses
Paid During
Period2,3 | | | Ending
Account Value
(10/31/16) | | | Expenses
Paid During
Period2,4 | | |
| A | | $ | 1,000.00 | | | $ | 963.60 | | | $ | 7.95 | | | $ | 1,017.04 | | | $ | 8.16 | | | | 1.61 | % |
| C | | | 1,000.00 | | | | 959.00 | | | | 11.62 | | | | 1,013.27 | | | | 11.94 | | | | 2.36 | |
| R | | | 1,000.00 | | | | 961.50 | | | | 9.17 | | | | 1,015.79 | | | | 9.42 | | | | 1.86 | |
| Y | | | 1,000.00 | | | | 963.80 | | | | 6.71 | | | | 1,018.30 | | | | 6.90 | | | | 1.36 | |
| R5 | | | 1,000.00 | | | | 964.80 | | | | 6.72 | | | | 1,018.30 | | | | 6.90 | | | | 1.36 | |
| R6 | | | 1,000.00 | | | | 963.80 | | | | 6.71 | | | | 1,018.30 | | | | 6.90 | | | | 1.36 | |
| 1 | The actual ending account value is based on the actual total return of the Fund for the period May 1, 2016 through October 31, 2016, after actual expenses and will differ from the hypothetical ending account value which is based on the Fund’s expense ratio and a hypothetical annual return of 5% before expenses. |
| 2 | Expenses are equal to the Fund’s annualized expense ratio as indicated above multiplied by the average account value over the period, multiplied by 184/366 to reflect the most recent fiscal half year. Effective January 1, 2017, the Fund’s Adviser has contractually agreed to waive advisory fees and/or reimburse expenses to the extent necessary to limit total annual fund operating expenses of Class A, Class C, Class R, Class Y Class R5 and Class R6 shares to 1.50%, 2.25%, 1.75%, 1.25%, 1.25% and 1.25% of average daily net assets, respectively. The annualized expense ratios restated as if these agreements had been in effect throughout the entire most recent fiscal half year are 1.49%, 2.24%, 1.74%, 1.24%, 1.24% and 1.24% for Class A, Class C, Class R, Class Y Class R5 and Class R6 shares, respectively. |
| 3 | The actual expenses paid restated as if the changes discussed above had been in effect throughout the entire most recent fiscal half year are $7.35, $11.03, $8.58, $6.12, $6.12 and $6.12 for Class A, Class C, Class R, Class Y Class R5 and Class R6 shares, respectively. |
| 4 | The hypothetical expenses paid restated as if the changes discussed above had been in effect throughout the entire most recent fiscal half year are $7.56, $11.34, $8.82, $6.29, $6.29 and $6.29 for Class A, Class C, Class R, Class Y Class R5 and Class R6 shares, respectively. |
29 Invesco All Cap Market Neutral Fund
Approval of Investment Advisory and Sub-Advisory Contracts
The Board of Trustees (the Board) of AIM Investment Funds (Invesco Investment Funds) is required under the Investment Company Act of 1940, as amended, to approve annually the renewal of Invesco All Cap Market Neutral Fund’s (the Fund) investment advisory agreements. During contract renewal meetings held on June 7-8, 2016, the Board as a whole, and the disinterested or “independent” Trustees, who comprise over 75% of the Board, voting separately, approved the continuance for the Fund of the Master Investment Advisory Agreement with Invesco Advisers, Inc. (Invesco Advisers and the investment advisory agreement) and the Master Intergroup Sub-Advisory Contract for Mutual Funds with Invesco Asset Management Deutschland GmbH, Invesco Asset Management Limited, Invesco Asset Management (Japan) Limited, Invesco Hong Kong Limited, Invesco Senior Secured Management, Inc., Invesco Canada Ltd. and Invesco PowerShares Capital Management LLC (collectively, the Affiliated Sub-Advisers and the sub-advisory contracts) for another year, effective July 1, 2016.
In evaluating the fairness and reasonableness of compensation under the Fund’s investment advisory agreement and sub-advisory contracts, the Board considered, among other things, the factors discussed below. The Board determined that continuation of the Fund’s investment advisory agreement and the sub-advisory contracts is in the best interest of the Fund and its shareholders and that the compensation payable to Invesco Advisers and the Affiliated Sub-Advisers under the agreements is fair and reasonable.
The Board’s Fund Evaluation Process
The Board’s Investments Committee has established three Sub-Committees, which meet throughout the year to review the performance of funds advised by Invesco Advisers (the Invesco Funds). Over the course of each year, the Sub-Committees meet with portfolio managers for their assigned Invesco Funds and other members of management to review the performance, investment objective(s), policies, strategies, limitations and investment risks of these funds. The Board had the benefit of reports from the Sub-Committees and Investments Committee throughout the year in considering approval of the continuance of each Invesco Fund’s investment advisory agreement and sub-advisory contracts for another year.
During the contract renewal process, the Board receives comparative performance and fee data regarding the Invesco Funds prepared by Invesco Advisers and Broadridge Financial Solutions, Inc. (Broadridge), an independent provider of investment company data. The Board also receives an independent written evaluation from the Senior Officer, an officer of the Invesco Funds who reports directly to the
independent Trustees. The Senior Officer’s evaluation is prepared as part of his responsibility to manage the process by which the Invesco Funds’ proposed management fees are negotiated during the annual contract renewal process to ensure they are negotiated in a manner that is at arms’ length and reasonable. In addition to meetings with Invesco Advisers and fund counsel, the independent Trustees also discuss the continuance of the investment advisory agreement and sub-advisory contracts in separate sessions with the Senior Officer and with independent legal counsel.
The Trustees recognized that the advisory fee rates for the Invesco Funds are, in many cases, the result of years of review and negotiation. The Trustees’ deliberations and conclusions in a particular year may be based in part on their deliberations and conclusions regarding these arrangements throughout the year and in prior years. The Trustees’ review and conclusions are based on the comprehensive consideration of all information presented to them and are not the result of any single determinative factor. Moreover, one Trustee may have weighed a particular piece of information or factor differently than another Trustee.
The discussion below is a summary of the Senior Officer’s independent written evaluation with respect to the Fund’s investment advisory agreement as well as a discussion of the material factors and related conclusions that formed the basis for the Board’s approval of the Fund’s investment advisory agreement and sub-advisory contracts. Unless otherwise stated, this information is current as of June 8, 2016, and does not reflect consideration of factors that became known to the Board after that date.
Factors and Conclusions and Summary of Independent Written Fee Evaluation
| A. | Nature, Extent and Quality of Services Provided by Invesco Advisers and the Affiliated Sub-Advisers |
The Board reviewed the advisory services provided to the Fund by Invesco Advisers under the Fund’s investment advisory agreement, the performance of Invesco Advisers in providing these services, and the credentials and experience of the officers and employees of Invesco Advisers who provide these services, including the Fund’s portfolio manager or managers. The Board’s review of the qualifications of Invesco Advisers to provide advisory services included the Board’s consideration of Invesco Advisers’ investment process oversight, independent credit analysis and investment risk management. The Board also considered non-advisory services that Invesco Advisers and its affiliates provide to the Invesco Funds such as various back office support functions, trading operations, internal audit, valuation and legal and compliance.
In determining whether to continue the Fund’s investment advisory agreement, the Board considered the benefits of reapproving an existing relationship and the greater uncertainty that may be associated with entering into a new relationship. The Board concluded that the nature, extent and quality of the services provided to the Fund by Invesco Advisers are appropriate and satisfactory and consistent with the terms of the Fund’s investment advisory agreement.
The Board reviewed the services that may be provided by the Affiliated Sub-Advisers under the sub-advisory contracts and the credentials and experience of the officers and employees of the Affiliated Sub-Advisers who provide these services. The Board noted that the Affiliated Sub-Advisers have offices and personnel that are located in financial centers around the world. As a result, the Board noted that Affiliated Sub-Advisers can provide research and investment analysis on the markets and economies of various countries in which the Fund may invest, make recommendations regarding securities and assist with security trades. The Board concluded that the sub-advisory contracts may benefit the Fund and its shareholders by permitting Invesco Advisers to use the resources and talents of the Affiliated Sub-Advisers in managing the Fund. The Board concluded that the nature, extent and quality of the services that may be provided by the Affiliated Sub-Advisers are appropriate and satisfactory and consistent with the terms of the Fund’s sub-advisory contracts.
The Board considered Fund performance as a relevant factor in considering whether to approve the investment advisory agreement. The Board did not view Fund performance as a relevant factor in considering whether to approve the sub-advisory contracts for the Fund, as no Affiliated Sub-Adviser currently manages assets of the Fund.
The Board compared the Fund’s performance during the past one and two calendar years to the performance of funds in the Broadridge performance universe and against the Lipper Alternative Equity Market Neutral Funds Index. The Board noted that performance of Class A shares of the Fund was in the first quintile of its performance universe for the one and two year periods (the first quintile being the best performing funds and the fifth quintile being the worst performing funds). The Board noted that performance of Class A shares of the Fund was above the performance of the Index for the one and two year periods. The Trustees also reviewed more recent Fund performance and this review did not change their conclusions.
| C. | Advisory and Sub-Advisory Fees |
The Board compared the Fund’s contractual management fee rate to the contractual management fee rates of funds in the Fund’s
30 Invesco All Cap Market Neutral Fund
Broadridge expense group at a common asset level. The Board noted that the contractual management fee rate for Class A shares of the Fund was below the median contractual management fee rate of funds in its expense group. The Board noted that the term “contractual management fee” for funds in the expense group may include both advisory and certain administrative services fees, but that Broadridge does not provide information on a fund by fund basis as to what is included. The Board noted that Invesco does not separately charge the Invesco Funds for the administrative services included in the term as defined by Broadridge. The Board also reviewed the methodology used by Broadridge in providing expense group information, which includes using each fund’s contractual fee schedule (including any applicable breakpoints) as reported in the most recent prospectus or statement of information for each fund in the expense group.
The Board noted that Invesco Advisers has contractually agreed to waive fees and/or limit expenses of the Fund through at least February 28, 2017 in an amount necessary to limit total annual operating expenses to a specified percentage of average daily net assets for each class of the Fund.
The Board also compared the Fund’s effective advisory fee rate (the advisory fee rate after advisory fee waivers and before other expense limitations/waivers) to the effective advisory fee rates of other funds advised by Invesco Advisers and its affiliates with investment strategies comparable to those of the Fund, based on asset balances as of December 31, 2015. The Board noted how the Fund’s rate compared to the effective sub-adviser fee rate of one fund sub-advised by Invesco Advisers.
The Board also considered the fees charged by Invesco Advisers and the Affiliated Sub-Advisers to other client accounts with investment strategies comparable to those of the Fund. The Board noted that Invesco Advisers or the Affiliated Sub-Advisers may charge lower fees to large institutional clients. Invesco Advisers reviewed with the Board the significantly greater scope of services it provides to the Invesco Funds relative to certain other types of client accounts. These additional services include provision of administrative services, officers and office space, oversight of service providers, preparation of annual registration statement updates and financial information and regulatory compliance under the Investment Company Act of 1940, as amended.
Invesco Advisers also reviewed generally the higher frequency of shareholder purchases and redemptions in the Invesco Funds relative to the flow of assets for other client accounts. Invesco Advisers advised the Board that advance notice of redemptions is often provided to Invesco Advisers by institutional clients. The Board did note that sub-advisory fee rates charged by the Affiliated Sub-Advisers to manage the Invesco Funds and to manage other client accounts
tended to be more comparable, reflecting a similar scope of services.
The Board also considered the services that may be provided by the Affiliated Sub-Advisers pursuant to the sub-advisory contracts, as well as the fees payable by Invesco Advisers to the Affiliated Sub-Advisers pursuant to the sub-advisory contracts. The Board also noted that the sub-advisory fees are not paid directly by the Fund, but rather, are payable by Invesco Advisers to the Affiliated Sub-Advisers.
| D. | Economies of Scale and Breakpoints |
The Board considered the extent to which there are economies of scale in the provision of advisory services to the Fund. The Board also considered whether the Fund benefits from economies of scale through contractual breakpoints in the Fund’s advisory fee schedule. The Board also noted that the Fund shares directly in economies of scale through lower fees charged by third party service providers based on the combined size of the Invesco Funds and other clients advised by Invesco Advisers.
| E. | Profitability and Financial Resources |
The Board reviewed information from Invesco Advisers concerning the costs of the advisory and other services that Invesco Advisers and its affiliates provide to the Fund and the Invesco Funds and the profitability of Invesco Advisers and its affiliates in providing these services. The Board received information from Invesco Advisers and a report from an independent consultant engaged by the Senior Officer about the methodology used to prepare the profitability information. The Board noted that Invesco Advisers continues to operate at a net profit from services Invesco Advisers and its affiliates provide to the Invesco Funds . The Board noted that the Fund had not been in operation long enough to become profitable and that Invesco Advisers was continuing to take entrepreneurial risk in operating the Fund. The Board received and accepted information from Invesco Advisers demonstrating that Invesco Advisers and each Affiliated Sub-Adviser are financially sound and have the resources necessary to perform their obligations under the investment advisory agreement and sub-advisory contracts.
| F. | Collateral Benefits to Invesco Advisers and its Affiliates |
The Board considered various other benefits received by Invesco Advisers and its affiliates from the relationship with the Fund, including the fees received for providing transfer agency and distribution services to the Fund. The Board considered comparative information regarding fees charged for these services, including information provided by Broadridge and other independent sources. The Board considered the performance of Invesco Advisers and its affiliates in providing these services and the organizational structure employed to provide these services. The Board also considered that these services are provided to the Fund pursuant to written contracts that are reviewed and approved on an annual basis by the Board;
and that the services are required for the operation of the Fund.
The Board considered the benefits realized by Invesco Advisers and the Affiliated Sub-Advisers as a result of portfolio brokerage transactions executed through “soft dollar” arrangements. The Board noted that soft dollar arrangements shift the payment obligation for research services from Invesco Advisers and the Affiliated Sub-Advisers to the Invesco Funds and that the research received may be used with other clients of Invesco Advisers and may reduce Invesco Advisers’ and the Affiliated Sub-Advisers’ expenses. The Board also considered that it receives periodic reports from the Chief Compliance Officer of the Invesco Funds demonstrating that these arrangements are consistent with regulatory requirements. The Board did not deem the soft dollar arrangements to be inappropriate.
The Board considered that the Fund’s uninvested cash and cash collateral from any securities lending arrangements may be invested in money market funds advised by Invesco Advisers pursuant to procedures approved by the Board. The Board noted that Invesco Advisers receives advisory fees from these affiliated money market funds attributable to such investments, although Invesco Advisers has contractually agreed to waive through varying periods the advisory fees payable by the Invesco Funds with respect to certain investments in the affiliated money market funds. The waiver is in an amount equal to 100% of the net advisory fee Invesco Advisers receives from the affiliated money market funds with respect to the Fund’s investment in the affiliated money market funds of uninvested cash, but not cash collateral. The Board concluded that the amount of advisory fees received by Invesco Advisors from the Fund’s investment of cash collateral from any securities lending arrangements in the affiliated money market funds is fair and reasonable.
The Board also considered the Fund may use an affiliated broker to execute certain trades for the Fund to, among other things, control information leakage, and were advised that such trades would be executed in compliance with rules under the Investment Company Act of 1940, as amended, and consistent with best execution obligations.
31 Invesco All Cap Market Neutral Fund
Tax Information
Form 1099-DIV, Form 1042-S and other year-end tax information provide shareholders with actual calendar year amounts that should be included in their tax returns. Shareholders should consult their tax advisors.
The following distribution information is being provided as required by the Internal Revenue Code or to meet a specific state’s requirement.
The Fund designates the following amounts or, if subsequently determined to be different, the maximum amount allowable for its fiscal year ended October 31, 2016:
| | | | |
Federal and State Income Tax | |
Long-Term Capital Gain Distributions | | $ | 53,030 | |
Qualified Dividend Income* | | | 7.07 | % |
Corporate Dividends Received Deduction* | | | 5.89 | % |
U.S. Treasury Obligations* | | | 0.00 | % |
| | * | The above percentages are based on ordinary income dividends paid to shareholders during the Fund’s fiscal year. |
32 Invesco All Cap Market Neutral Fund
Trustees and Officers
The address of each trustee and officer is AIM Investment Funds (Invesco Investment Funds) (the “Trust”), 11 Greenway Plaza, Suite 1000, Houston, Texas 77046-1173. The trustees serve for the life of the Trust, subject to their earlier death, incapacitation, resignation, retirement or removal as more specifically provided in the Trust’s organizational documents. Each officer serves for a one year term or until their successors are elected and qualified. Column two below includes length of time served with predecessor entities, if any.
| | | | | | | | |
Name, Year of Birth and
Position(s) Held with the Trust | | Trustee and/
or Officer Since | | Principal Occupation(s)
During Past 5 Years | | Number of
Funds in Fund
Complex
Overseen by
Trustee | | Other Directorship(s)
Held by Trustee During
Past 5 Years |
| Interested Persons | | | | | | | | |
| Martin L. Flanagan1 — 1960 Trustee | | 2007 | | Executive Director, Chief Executive Officer and President, Invesco Ltd. (ultimate parent of Invesco and a global investment management firm); Advisor to the Board, Invesco Advisers, Inc. (formerly known as Invesco Institutional (N.A.), Inc.); Trustee, The Invesco Funds; Vice Chair, Investment Company Institute; and Member of Executive Board, SMU Cox School of Business Formerly: Chairman and Chief Executive Officer, Invesco Advisers, Inc. (registered investment adviser); Director, Chairman, Chief Executive Officer and President, Invesco Holding Company (US) Inc. (formerly IVZ Inc.) (holding company), Invesco Group Services, Inc. (service provider) and Invesco North American Holdings, Inc. (holding company); Director, Chief Executive Officer and President, Invesco Holding Company Limited (parent of Invesco and a global investment management firm); Director, Invesco Ltd.; Chairman, Investment Company Institute and President, Co-Chief Executive Officer, Co-President, Chief Operating Officer and Chief Financial Officer, Franklin Resources, Inc. (global investment management organization) | | 146 | | None |
| Philip A. Taylor2 — 1954 Trustee and Senior Vice President | | 2006 | | Head of the Americas and Senior Managing Director, Invesco Ltd.; Director, Co-Chairman, Co-President and Co-Chief Executive Officer, Invesco Advisers, Inc. (formerly known as Invesco Institutional (N.A.), Inc.) (registered investment adviser); Director, Chairman, Chief Executive Officer and President, Invesco Management Group, Inc. (formerly known as Invesco AIM Management Group, Inc.) (financial services holding company); Director and Chairman, Invesco Investment Services, Inc. (formerly known as Invesco AIM Investment Services, Inc.) (registered transfer agent) Chief Executive Officer, Invesco Corporate Class Inc. (corporate mutual fund company) Director, Chairman and Chief Executive Officer, Invesco Canada Ltd. (formerly known as Invesco Trimark Ltd./Invesco Trimark Ltèe) (registered investment adviser and registered transfer agent); Trustee and Senior Vice President, The Invesco Funds; Director, Invesco Investment Advisers LLC (formerly known as Van Kampen Asset Management). Formerly: Director, Chief Executive Officer and President, Van Kampen Exchange Corp.; President and Principal Executive Officer, The Invesco Funds (other than AIM Treasurer’s Series Trust (Invesco Treasurer’s Series Trust), Short-Term Investments Trust and Invesco Management Trust); Executive Vice President, The Invesco Funds (AIM Treasurer’s Series Trust (Invesco Treasurer’s Series Trust), Short-Term Investments Trust and Invesco Management Trust only); Director and President, INVESCO Funds Group, Inc. (registered investment adviser and registered transfer agent); Director and Chairman, IVZ Distributors, Inc. (formerly known as INVESCO Distributors, Inc.) (registered broker dealer); Director, President and Chairman, Invesco Inc. (holding company), Invesco Canada Holdings Inc. (holding company), Trimark Investments Ltd./Placements Trimark Ltèe and Invesco Financial Services Ltd/Services Financiers Invesco Ltèe; Chief Executive Officer, Invesco Canada Fund Inc. (corporate mutual fund company); Director and Chairman, Van Kampen Investor Services Inc.; Director, Chief Executive Officer and President, 1371 Preferred Inc. (holding company) and Van Kampen Investments Inc.; Director and President, AIM GP Canada Inc. (general partner for limited partnerships) and Van Kampen Advisors, Inc.; Director and Chief Executive Officer, Invesco Trimark Dealer Inc. (registered broker dealer); Director, Invesco Distributors, Inc. (formerly known as Invesco AIM Distributors, Inc.) (registered broker dealer); Manager, Invesco PowerShares Capital Management LLC; Director, Chief Executive Officer and President, Invesco Advisers, Inc.; Director, Chairman, Chief Executive Officer and President, Invesco AIM Capital Management, Inc.; President, Invesco Trimark Dealer Inc. and Invesco Trimark Ltd./Invesco Trimark Ltèe; Director and President, AIM Trimark Corporate Class Inc. and AIM Trimark Canada Fund Inc.; Senior Managing Director, Invesco Holding Company Limited; Director and Chairman, Fund Management Company (former registered broker dealer); President and Principal Executive Officer, The Invesco Funds (AIM Treasurer’s Series Trust (Invesco Treasurer’s Series Trust), and Short-Term Investments Trust only); President, AIM Trimark Global Fund Inc. and AIM Trimark Canada Fund Inc. | | 146 | | None |
| 1 | Mr. Flanagan is considered an interested person (within the meaning of Section 2(a)(19) of the 1940 Act) of the Trust because he is an officer of the Adviser to the Trust, and an officer and a director of Invesco Ltd., ultimate parent of the Adviser. |
| 2 | Mr. Taylor is considered an interested person (within the meaning of Section 2(a)(19) of the 1940 Act) of the Trust because he is an officer and a director of the Adviser. |
T-1 Invesco All Cap Market Neutral Fund
Trustees and Officers—(continued)
| | | | | | | | |
Name, Year of Birth and
Position(s) Held with the Trust | | Trustee and/
or Officer Since | | Principal Occupation(s) During Past 5 Years | | Number of
Funds in Fund
Complex
Overseen by
Trustee | | Other Directorship(s)
Held by Trustee During
Past 5 Years |
| Independent Trustees | | | | | | | | |
Bruce L. Crockett — 1944 Trustee and Chair | | 2001 | | Chairman, Crockett Technologies Associates (technology consulting company) Formerly: Director, Captaris (unified messaging provider); Director, President and Chief Executive Officer, COMSAT Corporation; Chairman, Board of Governors of INTELSAT (international communications company); ACE Limited (insurance company); Independent Directors Council and Investment Company Institute | | 146 | | ALPS (Attorneys Liability Protection Society) (insurance company) and Globe Specialty Metals, Inc. (metallurgical company); Member of the Audit Committee, Ferroglobe PLC and Investment Company Institute; Member of the Executive Committee and Chair of the Governance Committee, Independent Directors Council |
David C. Arch — 1945 Trustee | | 2010 | | Chairman of Blistex Inc., a consumer health care products manufacturer | | 146 | | Board member of the Illinois Manufacturers’ Association; Member of the Board of Visitors, Institute for the Humanities, University of Michigan |
James T. Bunch — 1942 Trustee | | 2003 | | Managing Member, Grumman Hill Group LLC (family office/private equity investments) Formerly: Chairman of the Board, Denver Film Society, Chairman of the Board of Trustees, Evans Scholarship Foundation; Chairman, Board of Governors, Western Golf Association | | 146 | | Trustee, Evans Scholarship Foundation |
Albert R. Dowden — 1941 Trustee | | 2001 | | Director of a number of public and private business corporations, including Nature’s Sunshine Products, Inc. Formerly: Director, The Boss Group, Ltd. and Reich & Tang Funds (5 portfolios) (registered investment company); Director, Homeowners of America Holding Corporation/Homeowners of America Insurance Company (property casualty company); Director, Continental Energy Services, LLC (oil and gas pipeline service); Director, CompuDyne Corporation (provider of product and services to the public security market) and Director, Annuity and Life Re (Holdings), Ltd. (reinsurance company); Director, President and Chief Executive Officer, Volvo Group North America, Inc.; Senior Vice President, AB Volvo; Director of various public and private corporations; Chairman, DHJ Media, Inc.; Director, Magellan Insurance Company; and Director, The Hertz Corporation, Genmar Corporation (boat manufacturer), National Media Corporation; Advisory Board of Rotary Power International (designer, manufacturer, and seller of rotary power engines); and Chairman, Cortland Trust, Inc. (registered investment company) | | 146 | | Director of Nature’s Sunshine Products, Inc. |
Jack M. Fields — 1952 Trustee | | 2001 | | Chief Executive Officer, Twenty First Century Group, Inc. (government affairs company); and Discovery Learning Alliance (non-profit) Formerly: Owner and Chief Executive Officer, Dos Angeles Ranch L.P. (cattle, hunting, corporate entertainment); Director, Insperity, Inc. (formerly known as Administaff); Chief Executive Officer, Texana Timber LP (sustainable forestry company); Director of Cross Timbers Quail Research Ranch (non-profit); and member of the U.S. House of Representatives | | 146 | | None |
Eli Jones — 1961 Trustee | | 2016 | | Professor and Dean, Mays Business School — Texas A&M University Formerly: Professor and Dean, Walton College of Business, University of Arkansas and E.J. Ourso College of Business, Louisiana State University and Director, Arvest Bank | | 146 | | Director of Insperity, Inc. (formerly known as Administaff) |
Prema Mathai-Davis — 1950 Trustee | | 2001 | | Retired. Formerly: Chief Executive Officer, YWCA of the U.S.A. | | 146 | | None |
Larry Soll — 1942 Trustee | | 2003 | | Retired. Formerly: Chairman, Chief Executive Officer and President, Synergen Corp. (a biotechnology company) | | 146 | | None |
Raymond Stickel, Jr. — 1944 Trustee | | 2005 | | Retired. Formerly: Director, Mainstay VP Series Funds, Inc. (25 portfolios) and Partner, Deloitte & Touche | | 146 | | None |
Robert C. Troccoli — 1949 Trustee | | 2016 | | Adjunct Professor, University of Denver — Daniels College of Business Formerly: Senior Partner, KPMG LLP | | 146 | | None |
T-2 Invesco All Cap Market Neutral Fund
Trustees and Officers—(continued)
| | | | | | | | |
Name, Year of Birth and
Position(s) Held with the Trust | | Trustee and/
or Officer Since | | Principal Occupation(s) During Past 5 Years | | Number of
Funds in Fund
Complex
Overseen by
Trustee | | Other Directorship(s)
Held by Trustee During
Past 5 Years |
| Independent Trustees—(continued) |
Suzanne H. Woolsey — 1941 Trustee | | 2014 | | Retired. Formerly: Chief Executive Officer of Woolsey Partners LLC | | 146 | | Director, SunShare LLC; Trustee, Ocean Conservancy; Emeritus Chair of the Board of Trustees of the Institute for Defense Analyses and of Colorado College; Trustee, Chair, Business and Finance Committee of California Institute of Technology; Prior to 2014, Director of Fluor Corp.; Prior to 2010, Trustee of the German Marshall Fund of the United States; Prior to 2010, Trustee of the Rocky Mountain Institute |
| Other Officers | | | | | | | | |
Sheri Morris — 1964 President, Principal Executive Officer and Treasurer | | 1999 | | President, Principal Executive Officer and Treasurer, The Invesco Funds; Vice President, Invesco Advisers, Inc. (formerly known as Invesco Institutional (N.A.), Inc.) (registered investment adviser); and Vice President, PowerShares Exchange-Traded Fund Trust, PowerShares Exchange-Traded Fund Trust II, PowerShares India Exchange-Traded Fund Trust, PowerShares Actively Managed Exchange-Traded Fund Trust, and PowerShares Actively Managed Exchange-Traded Commodity Fund Trust Formerly: Vice President and Principal Financial Officer, The Invesco Funds; Vice President, Invesco AIM Advisers, Inc., Invesco AIM Capital Management, Inc. and Invesco AIM Private Asset Management, Inc.; Assistant Vice President and Assistant Treasurer, The Invesco Funds and Assistant Vice President, Invesco Advisers, Inc., Invesco AIM Capital Management, Inc. and Invesco AIM Private Asset Management, Inc.; and Treasurer, PowerShares Exchange-Traded Fund Trust, PowerShares Exchange-Traded Fund Trust II, PowerShares India Exchange-Traded Fund Trust and PowerShares Actively Managed Exchange-Traded Fund Trust | | N/A | | N/A |
Russell C. Burk — 1958 Senior Vice President and Senior Officer | | 2005 | | Senior Vice President and Senior Officer, The Invesco Funds | | N/A | | N/A |
John M. Zerr — 1962 Senior Vice President, Chief Legal Officer and Secretary | | 2006 | | Director, Senior Vice President, Secretary and General Counsel, Invesco Management Group, Inc. (formerly known as Invesco AIM Management Group, Inc.; Senior Vice President, Invesco Advisers, Inc. (formerly known as Invesco Institutional (N.A.), Inc.) (registered investment adviser); Senior Vice President and Secretary, Invesco Distributors, Inc. (formerly known as Invesco AIM Distributors, Inc.); Director, Vice President and Secretary, Invesco Investment Services, Inc. (formerly known as Invesco AIM Investment Services, Inc.) Senior Vice President, Chief Legal Officer and Secretary, The Invesco Funds; Managing Director, Invesco PowerShares Capital Management LLC; Director, Secretary and General Counsel, Invesco Investment Advisers LLC (formerly known as Van Kampen Asset Management); Secretary and General Counsel, Invesco Capital Markets, Inc. (formerly known as Van Kampen Funds Inc.) and Chief Legal Officer, PowerShares Exchange-Traded Fund Trust, PowerShares Exchange-Traded Fund Trust II, PowerShares India Exchange-Traded Fund Trust, PowerShares Actively Managed Exchange-Traded Fund Trust, and PowerShares Actively Managed Exchange-Traded Commodity Fund Trust Formerly: Director, Secretary, General Counsel and Senior Vice President, Van Kampen Exchange Corp.; Director, Vice President and Secretary, IVZ Distributors, Inc. (formerly known as INVESCO Distributors, Inc.); Director and Vice President, INVESCO Funds Group, Inc.; Director and Vice President, Van Kampen Advisors Inc.; Director, Vice President, Secretary and General Counsel, Van Kampen Investor Services Inc.; Director, Invesco Distributors, Inc. (formerly known as Invesco AIM Distributors, Inc.); Director, Senior Vice President, General Counsel and Secretary, Invesco AIM Advisers, Inc. and Van Kampen Investments Inc.; Director, Vice President and Secretary, Fund Management Company; Director, Senior Vice President, Secretary, General Counsel and Vice President, Invesco AIM Capital Management, Inc.; Chief Operating Officer and General Counsel, Liberty Ridge Capital, Inc. (an investment adviser); Vice President and Secretary, PBHG Funds (an investment company) and PBHG Insurance Series Fund (an investment company); Chief Operating Officer, General Counsel and Secretary, Old Mutual Investment Partners (a broker-dealer); General Counsel and Secretary, Old Mutual Fund Services (an administrator) and Old Mutual Shareholder Services (a shareholder servicing center); Executive Vice President, General Counsel and Secretary, Old Mutual Capital, Inc. (an investment adviser); and Vice President and Secretary, Old Mutual Advisors Funds (an investment company) | | N/A | | N/A |
T-3 Invesco All Cap Market Neutral Fund
Trustees and Officers—(continued)
| | | | | | | | |
Name, Year of Birth and
Position(s) Held with the Trust | | Trustee and/
or Officer Since | | Principal Occupation(s) During Past 5 Years | | Number of
Funds in Fund
Complex
Overseen by
Trustee | | Other Directorship(s)
Held by Trustee During
Past 5 Years |
| Other Officers—(continued) | | | | | | | | |
| Karen Dunn Kelley — 1960 Senior Vice President | | 2004 | | Senior Managing Director, Investments, Invesco Ltd.; Director, Co-President, Co-Chief Executive Officer, and Co-Chairman, Invesco Advisers, Inc. (formerly known as Invesco Institutional (N.A.), Inc.) (registered investment adviser); Chairman and Director, Invesco Senior Secured Management, Inc.; Senior Vice President, Invesco Management Group, Inc. (formerly known as Invesco AIM Management Group, Inc.); Executive Vice President, Invesco Distributors, Inc. (formerly known as Invesco AIM Distributors, Inc.); Director, Invesco Mortgage Capital Inc. and Invesco Management Company Limited; Senior Vice President, The Invesco Funds Formerly: Vice President, The Invesco Funds (other than AIM Treasurer’s Series Trust (Invesco Treasurer’s Series Trust), Short-Term Investments Trust and Invesco Management Trust); and President and Principal Executive Officer, The Invesco Funds (AIM Treasurer’s Series Trust (Invesco Treasurer’s Series Trust), Short-Term Investments Trust and Invesco Management Trust only); Director and President, INVESCO Asset Management (Bermuda) Ltd., Director, INVESCO Global Asset Management DAC (formerly known as INVESCO Global Asset Management Limited) and INVESCO Management S.A.; Senior Vice President, Van Kampen Investments Inc. and Invesco Advisers, Inc. (formerly known as Invesco Institutional (N.A.), Inc.) (registered investment adviser); Director and President, Fund Management Company; Chief Cash Management Officer, Director of Cash Management, Senior Vice President, and Managing Director, Invesco AIM Capital Management, Inc.; Director of Cash Management, Senior Vice President, and Vice President, Invesco Advisers, Inc. and Vice President, The Invesco Funds (AIM Treasurer’s Series Trust (Invesco Treasurer’s Series Trust), and Short-Term Investments Trust only) | | N/A | | N/A |
Kelli Gallegos — 1970 Vice President, Principal Financial Officer and Assistant Treasurer | | 2008 | | Vice President, Principal Financial Officer and Assistant Treasurer, The Invesco Funds; Assistant Treasurer, Invesco PowerShares Capital Management LLC, PowerShares Exchange-Traded Fund Trust, PowerShares Exchange-Traded Fund Trust II, PowerShares India Exchange-Traded Fund Trust, PowerShares Actively Managed Exchange-Traded Fund Trust, and PowerShares Actively Managed Exchange-Traded Commodity Fund Trust Formerly: Assistant Vice President, The Invesco Funds | | N/A | | N/A |
Tracy Sullivan — 1962 Vice President, Chief Tax Officer and Assistant Treasurer | | 2008 | | Vice President, Chief Tax Officer and Assistant Treasurer, The Invesco Funds; Assistant Treasurer, Invesco PowerShares Capital Management LLC, PowerShares Exchange-Traded Fund Trust, PowerShares Exchange-Traded Fund Trust II, PowerShares India Exchange-Traded Fund Trust, PowerShares Actively Managed Exchange-Traded Fund Trust, and PowerShares Actively Managed Exchange-Traded Commodity Fund Trust Formerly: Assistant Vice President, The Invesco Funds | | N/A | | N/A |
Crissie M. Wisdom — 1969 Anti-Money Laundering Compliance Officer | | 2013 | | Anti-Money Laundering Compliance Officer, Invesco Advisers, Inc. (formerly known as Invesco Institutional (N.A.), Inc.) (registered investment adviser), Invesco Capital Markets, Inc. (formerly known as Van Kampen Funds Inc.), Invesco Distributors, Inc., Invesco Investment Services, Inc., Invesco Management Group, Inc., The Invesco Funds, and PowerShares Exchange-Traded Fund Trust, PowerShares Exchange-Traded Fund Trust II, PowerShares India Exchange-Traded Fund Trust, PowerShares Actively Managed Exchange-Traded Fund Trust and PowerShares Actively Managed Exchange-Traded Commodity Fund Trust; Anti-Money Laundering Compliance Officer and Bank Secrecy Act Officer, INVESCO National Trust Company and Invesco Trust Company; and Fraud Prevention Manager and Controls and Risk Analysis Manager for Invesco Investment Services, Inc. Formerly: Anti-Money Laundering Compliance Officer, Van Kampen Exchange Corp. | | N/A | | N/A |
Robert R. Leveille — 1969 Chief Compliance Officer | | 2016 | | Chief Compliance Officer, Invesco Advisers, Inc. (registered investment adviser); and Chief Compliance Officer, The Invesco Funds Formerly: Chief Compliance Officer, Putnam Investments and the Putnam Funds | | N/A | | N/A |
The Statement of Additional Information of the Trust includes additional information about the Fund’s Trustees and is available upon request, without charge, by calling 1.800.959.4246. Please refer to the Fund’s Statement of Additional Information for information on the Fund’s sub-advisers.
| | | | | | |
Office of the Fund 11 Greenway Plaza, Suite 1000 Houston, TX 77046-1173 | | Investment Adviser Invesco Advisers, Inc. 1555 Peachtree Street, N.E. Atlanta, GA 30309 | | Distributor Invesco Distributors, Inc. 11 Greenway Plaza, Suite 1000 Houston, TX 77046-1173 | | Auditors PricewaterhouseCoopers LLP 1000 Louisiana Street, Suite 5800 Houston, TX 77002-5678 |
| | | |
| | | | | | |
Counsel to the Fund Stradley Ronon Stevens & Young, LLP 2005 Market Street, Suite 2600 Philadelphia, PA 19103-7018 | | Counsel to the Independent Trustees Goodwin Procter LLP 901 New York Avenue, N.W. Washington, D.C. 20001 | | Transfer Agent Invesco Investment Services, Inc. 11 Greenway Plaza, Suite 1000 Houston, TX 77046-1173 | | Custodian State Street Bank and Trust Company 225 Franklin Street Boston, MA 02110-2801 |
T-4 Invesco All Cap Market Neutral Fund
Explore High-Conviction Investing with Invesco

Invesco mailing information
Send general correspondence to Invesco Investment Services, Inc., P.O. Box 219078, Kansas City, MO 64121-9078.
Important notice regarding delivery of security holder documents
To reduce Fund expenses, only one copy of most shareholder documents may be mailed to shareholders with multiple accounts at the same address (Householding). Mailing of your shareholder documents may be householded indefinitely unless you instruct us otherwise. If you do not want the mailing of these documents to be combined with those for other members of your household, please contact Invesco Investment Services, Inc. at 800 959 4246 or contact your financial institution. We will begin sending you individual copies for each account within 30 days after receiving your request.
Fund holdings and proxy voting information
The Fund provides a complete list of its holdings four times in each fiscal year, at the quarter ends. For the second and fourth quarters, the lists appear in the Fund’s semiannual and annual reports to shareholders. For the first and third quarters, the Fund files the lists with the Securities and Exchange Commission (SEC) on Form N-Q. The most recent list of portfolio holdings is available at invesco.com/completeqtrholdings. Shareholders can also look up the Fund’s Forms N-Q on the SEC website at sec.gov. Copies of the Fund’s Forms N-Q may be reviewed and copied at the SEC Public Reference Room in Washington, D.C. You can obtain information on the operation of the Public Reference Room, including information about duplicating fee charges, by calling 202 551 8090 or 800 732 0330, or by electronic request at the following email address: publicinfo@sec.gov.
The SEC file numbers for the Fund are shown below.
A description of the policies and procedures that the Fund uses to determine how to vote proxies relating to portfolio securities is available without charge, upon request, from our Client Services department at 800 959 4246 or at invesco.com/proxyguidelines. The information is also available on the SEC website, sec.gov.
| | |
Information regarding how the Fund voted proxies related to its portfolio securities during the most recent 12-month period ended June 30 is available at invesco.com/proxysearch. The information is also available on the SEC website, sec.gov. Invesco Advisers, Inc. is an investment adviser; it provides investment advisory services to individual and institutional clients and does not sell securities. Invesco Distributors, Inc. is the US distributor for Invesco Ltd.’s retail mutual funds, exchange-traded funds and institutional money market funds. Both are wholly owned, indirect subsidiaries of Invesco Ltd. | |  |
| | | | |
| SEC file numbers: 811-05426 and 033-19338 | | ACMN-AR-1 | | Invesco Distributors, Inc. |
| | | | |
| | |
 | | Annual Report to Shareholders | | October 31, 2016 |
| | |
| | Invesco Balanced-Risk Allocation Fund Nasdaq: A: ABRZX ∎ B: ABRBX ∎ C: ABRCX ∎ R: ABRRX ∎ Y: ABRYX ∎ R5: ABRIX ∎ R6: ALLFX |

Letters to Shareholders
| | |

Philip Taylor | | Dear Shareholders: This annual report includes information about your Fund, including performance data and a complete list of its investments as of the close of the reporting period. Inside is a discussion of how your Fund was managed and the factors that affected its performance during the reporting period. In December 2015, the US Federal Reserve raised short-term interest rates for the first time since 2006, signaling its belief that the economy was likely to continue strengthening. Indeed, throughout the reporting period, US economic data were generally positive and the economy expanded at a moderate rate – but there were some bumps along the road. Job growth in May 2016 was very weak, but it was followed by strong increases in nonfarm payrolls in June and July. Increased concerns about global economic weakness caused US stock market indexes to sink at the start of calendar year 2016, but they eventually recovered; they sank again following the UK’s decision to leave the European Union, |
but then quickly recovered and reached record highs later in the summer. Strong demand for income-producing investments, particularly those perceived to be lower risk, benefited bonds as well as dividend-paying stocks for much of the reporting period. While economic news in the US was generally positive, news overseas was less upbeat. The European Central Bank, and central banks in China and Japan – as well as other countries – maintained extraordinarily accommodative monetary policies in response to economic weakness. As the fiscal year drew to a close, uncertainty about the outcome of the US presidential election resulted in increased market volatility; the surprise outcome after the close of the reporting period suggested that market volatility may continue for some time to come.
Short-term market volatility can prompt some investors to abandon their investment plans – and can cause others to settle for average results. The investment professionals at Invesco, in contrast, invest with high conviction, take a long-term perspective and have a passion to exceed. Invesco’s pure focus on investment management eliminates possible distractions and means that there are no competing lines of business for us to support. Just as important, we embrace a variety of investment strategies, asset classes and geographies – because we know that no single investment approach meets the diverse needs of all of our clients. We manage all our investment approaches with a passion to exceed. All our investment teams have a highly disciplined, long-term investing style that eliminates short-term decision-making. Of course, investing with high conviction can’t guarantee a profit or ensure success; no investment strategy can. To learn more about how we invest with high conviction, visit invesco.com/HighConviction.
You, too, can invest with high conviction by maintaining a long-term investment perspective and by working with your financial adviser on a regular basis. During periods of short-term market volatility or uncertainty, your financial adviser can keep you focused on your long-term investment goals – a new home, a child’s college education or a secure retirement. He or she also can share research about the economy, the markets and individual investment options.
Visit our website for more information on your investments
Our website, invesco.com/us, offers a wide range of market insights and investment perspectives. On the website, you’ll find detailed information about our funds, including performance, holdings and portfolio manager commentaries. You can access information about your account by completing a simple, secure online registration. Click on the “Need to register” link in the “Account Access” box on our homepage to get started.
In addition to the resources accessible on our website and through our mobile app, you can obtain timely updates to help you stay informed about the markets, the economy and investing by connecting with Invesco on Twitter, LinkedIn or Facebook. You can access our blog at blog.invesco.us.com. Our goal is to provide you the information you want, when and where you want it.
Finally, I’m pleased to share with you Invesco’s commitment to both the Principles for Responsible Investment and to considering environmental, social and governance issues in our robust investment process. I invite you to learn more at invesco.com/esg.
Have questions?
For questions about your account, contact an Invesco client services representative at 800 959 4246. For Invesco-related questions or comments, please email me directly at phil@invesco.com.
All of us at Invesco look forward to serving your investment management needs. Thank you for investing with us.
Sincerely,

Philip Taylor
Senior Managing Director, Invesco Ltd.
2 Invesco Balanced-Risk Allocation Fund
| | |

Bruce Crockett | | Dear Fellow Shareholders: Among the many important lessons I’ve learned in more than 40 years in a variety of business endeavors is the value of a trusted advocate. As independent chair of the Invesco Funds Board, I can assure you that the members of the Board are strong advocates for the interests of investors in Invesco’s mutual funds. We work hard to represent your interests through oversight of the quality of the investment management services your funds receive and other matters important to your investment, including but not limited to: ∎ Ensuring that Invesco offers a diverse lineup of mutual funds that your financial adviser can use to strive to meet your financial needs as your investment goals change over time. ∎ Monitoring how the portfolio management teams of the Invesco funds are performing in light of changing economic and market conditions. |
∎ Assessing each portfolio management team’s investment performance within the context of the investment strategy described in the fund’s prospectus.
∎ Monitoring for potential conflicts of interests that may impact the nature of the services that your funds receive.
We believe one of the most important services we provide our fund shareholders is the annual review of the funds’ advisory and sub-advisory contracts with Invesco Advisers and its affiliates. This review is required by the Investment Company Act of 1940 and focuses on the nature and quality of the services Invesco provides as the adviser to the Invesco funds and the reasonableness of the fees that it charges for those services. Each year, we spend months carefully reviewing information received from Invesco and a variety of independent sources, such as performance and fee data prepared by Lipper Inc., an independent, third-party firm widely recognized as a leader in its field. We also meet with our independent legal counsel and other independent advisers to review and help us assess the information that we have received. Our goal is to assure that you receive quality investment management services for a reasonable fee.
I trust the measures outlined above provide assurance that you have a worthy advocate when it comes to choosing the Invesco Funds.
As always, please contact me at bruce@brucecrockett.com with any questions or concerns you may have. On behalf of the Board, we look forward to continuing to represent your interests and serving your needs.
Sincerely,

Bruce L. Crockett
Independent Chair
Invesco Funds Board of Trustees
3 Invesco Balanced-Risk Allocation Fund
Management’s Discussion of Fund Performance
Performance summary
| | | | |
For the fiscal year ended October 31, 2016, Class A shares of Invesco Balanced-Risk Allocation Fund (the Fund), at net asset value (NAV), outperformed the Fund’s custom style-specific benchmarks, the Custom Invesco Balanced-Risk Allocation Broad Index and the Custom Invesco Balanced-Risk Allocation Style Index. Your Fund’s long-term performance appears later in this report. | |
Fund vs. Indexes Total returns, 10/31/15 to 10/31/16, at net asset value (NAV). Performance shown does not include applicable contingent deferred sales charges (CDSC) or front-end sales charges, which would have reduced performance. | |
Class A Shares | | | 7.59 | % |
Class B Shares | | | 6.67 | |
Class C Shares | | | 6.67 | |
Class R Shares | | | 7.26 | |
Class Y Shares | | | 7.75 | |
Class R5 Shares | | | 7.88 | |
Class R6 Shares | | | 7.93 | |
S&P 500 Indexq (Broad Market Index) | | | 4.51 | |
Custom Invesco Balanced-Risk Allocation Broad Index∎ (Style-Specific Index) | | | 4.74 | |
Custom Invesco Balanced-Risk Allocation Style Index∎ (Style-Specific Index) | | | 2.71 | |
Lipper Alternative Global Macro Funds Index◆ (Peer Group Index) | | | 2.16 | |
| |
Source (s): qFactSet Research Systems Inc.; ∎Invesco, FactSet Research Systems Inc.; ◆Lipper Inc. | |
Market conditions and your Fund
During the fiscal year ended October 31, 2016, each of the asset classes in which the Fund invests provided positive contributions to Fund performance, and the Fund at NAV ended the reporting period in positive territory. The Fund invests in derivatives, such as swaps and futures, which are expected to correspond to the performance of US and international fixed income, equity and commodity markets. The strategic portion of the investment process involves first selecting representative assets for each asset class from a universe of more than 50 assets. Next, we seek to construct the portfolio so that an approximately equal amount of risk comes from our equity, fixed income and commodity allocations. Tactical adjustments to the Fund’s portfolio are then made on a monthly basis to try and take advantage of short-term market dynamics.
The Fund’s exposure to global government bonds, obtained through the use of swaps and futures, led results for the reporting period. A combination of equity market volatility early in the reporting period, concerns over the fallout of the Brexit vote (the UK referendum on whether to remain a part of, or leave, the European Union) in early summer and generally tepid economic data throughout the reporting period created demand for perceived safe haven assets.1 Within the government bond asset class, UK gilts were the top performers on Brexit fears and the resulting accommodative policy response from central banks. German bunds also benefited from these events, although these events also drove their yields into negative territory. The price of Canadian government bonds rallied as the Canadian central bank cut interest rates twice to combat the economic slowdown complicated by weak
energy prices. US Treasury prices rallied on market volatility early in the reporting period and “flight to safety” demand in the wake of Brexit, but they surrendered some of those gains late in the reporting period on the incessant jawboning from the US Federal Reserve on the likelihood of a rate increase. Despite engaging in a policy of negative interest rates, Japanese government bonds also posted modest gains for the reporting period. Tactical positioning in government bonds bolstered Fund results due to general overweight exposure to the asset class for the fiscal year.
Exposure to commodities, obtained through the use of swaps, futures and commodity-linked notes, also provided positive returns for the Fund for the fiscal year as gains in agriculture, precious metals and energy outweighed losses in industrial metals. Agriculture was the Fund’s leading performer during the fiscal year due to gains in sugar, soybeans, soymeal, cotton and coffee. Generally speaking, supply shortages due to inclement weather and reduced plantings was the primary catalyst for higher prices. Strategic positioning in precious metals was also favorable as gains in silver outpaced gold. Precious metals prices benefited from a combination of volatility in equity prices in the reporting period as well as the inability of central banks to implement interest rate increases. Tactical exposure to precious metals detracted from Fund performance. Energy prices struggled with high levels of oversupply for much of the reporting period, leading to marked volatility in crude oil and distillates. The Fund’s ability to tactically adjust exposures helped to offset weak performance across the energy complex; the Fund had underweight exposure to energy for most of the fiscal year. The result was a gain from the combined exposure to energy. Industrial metals prices detracted from Fund results as
| | | | | | |
| Target Risk Allocation and Notional Asset Weights as of 10/31/16 | |
| By asset class | | | | | |
| Asset Class | | Target Risk Allocation* | | Notional Asset Weights** | |
| | |
Equities | | 45.03% | | | 41.41 | % |
Fixed Income | | 19.06 | | | 58.55 | |
Commodities | | 35.91 | | | 34.53 | |
Total | | 100.00 | | | 134.49 | |
| * | Reflects the risk that each asset class is expected to contribute to the overall risk of the Fund as measured by standard deviation and estimates of risk based on historical data. Standard deviation measures the annualized fluctuations (volatility) of monthly returns. |
| ** | Proprietary models determine the Notional Asset Weights necessary to achieve the Target Risk Allocations. Total Notional Asset Weight greater than 100% is achieved through derivatives and other instruments that create leverage. |
| | |
| | |
Total Net Assets | | $5.4 billion |
4 Invesco Balanced-Risk Allocation Fund
copper prices declined more than aluminum prices rose. Tactical industrial metals exposure detracted from Fund results due to underweight exposure to aluminum.
Performance across developed equity markets was bifurcated though a contributor to Fund results. Perhaps surprisingly, given the angst leading up to and after the Brexit vote, UK equities led results in the asset class; US small caps and large caps and Hong Kong equities made lesser contributions to Fund performance. European and Japanese equities detracted from Fund performance as a combination of weak economic data and concerns over whether the exceptionally accommodative policy response from the European Central Bank and the Bank of Japan was having any of the intended effects on growth and inflation pressured share prices. Tactical exposure to equities helped boost the Fund’s return owing to a combination of underweight exposure during the volatility of the first quarter of 2016 and general overweight exposure when equities recovered in subsequent quarters.
Please note that our strategy is principally implemented with derivative instruments that include futures, commodity-linked notes and total return swaps. Therefore, all or most of the performance of the strategy, both positive and negative, can be attributed to these instruments. Derivatives can be a cost-effective way to gain exposure to asset classes. However, derivatives may amplify traditional investment risks through the creation of leverage and may be less liquid than traditional securities.
Thank you for your continued investment in Invesco Balanced-Risk Allocation Fund.
| 1 | So-called “safe haven” assets do not imply risk-free investing. |
The views and opinions expressed in management’s discussion of Fund performance are those of Invesco Advisers, Inc. These views and opinions are subject to change at any time based on factors such as market and economic conditions. These views and opinions may not be relied upon as investment advice or recommendations, or as an offer for a particular security. The information is not a complete analysis of every aspect of any market, country, industry, security or the Fund. Statements of fact are from sources considered reliable, but Invesco Advisers, Inc. makes no representation or warranty as to their completeness or accuracy. Although historical performance is no guarantee of future results, these insights may help you understand our investment management philosophy.
See important Fund and, if applicable, index disclosures later in this report.
| | |
 | | Mark Ahnrud Chartered Financial Analyst, Portfolio Manager, is manager of Invesco Balanced-Risk Allocation Fund. |
| He joined Invesco in 2000. Mr. Ahnrud earned a BS in finance and investments from Babson College and an MBA from Duke University Fuqua School of Business. |
| | |
 | | Chris Devine Chartered Financial Analyst, Portfolio Manager, is manager of Invesco Balanced-Risk Allocation Fund. |
| He joined Invesco in 1998. Mr. Devine earned a BA in economics from Wake Forest University and an MBA from the University of Georgia. |
| | |
 | | Scott Hixon Chartered Financial Analyst, Portfolio Manager, is manager of Invesco Balanced-Risk Allocation Fund. |
| He joined Invesco in 1994. Mr. Hixon earned a BBA in finance from Georgia Southern University and an MBA in finance from Georgia State University. |
| | |
 | | Christian Ulrich Chartered Financial Analyst, Portfolio Manager, is manager of Invesco Balanced-Risk Allocation Fund. |
| He joined Invesco in 2000. Mr. Ulrich earned the equivalent of a BBA from the KV Zurich Business School in Zurich, Switzerland. |
| | |
 | | Scott Wolle Chartered Financial Analyst, Portfolio Manager, is manager of Invesco Balanced-Risk Allocation Fund. |
| He joined Invesco in 1999. Mr. Wolle earned a BS in finance from Virginia Polytechnic Institute and State University and an MBA from Duke University Fuqua School of Business. |
Assisted by the Invesco Global Asset Allocation Team
5 Invesco Balanced-Risk Allocation Fund
Your Fund’s Long-Term Performance
Results of a $10,000 Investment – Oldest Share Class(es) since Inception
Fund and index data from 6/2/09
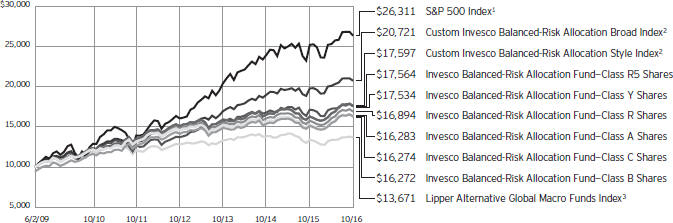
| 1 | Source: FactSet Research Systems Inc. |
| 2 | Source(s): Invesco, FactSet Research Systems Inc. |
Past performance cannot guarantee comparable future results.
The data shown in the chart include reinvested distributions, applicable sales charges and Fund expenses including management fees. Results for Class B shares are calculated as if a hypothetical shareholder had liquidated his entire investment in the Fund at the close of the reporting period and paid the contingent deferred sales charges, if applicable.
Index results include reinvested dividends, but they do not reflect sales charges. Performance of the peer group, if applicable, reflects fund expenses and management fees; performance of a market index does not. Performance shown in the chart and table(s) does not reflect deduction of taxes a shareholder would pay on Fund distributions or sale of Fund shares.
6 Invesco Balanced-Risk Allocation Fund
| | | | |
Average Annual Total Returns As of 10/31/16, including maximum applicable sales charges | |
| |
Class A Shares | | | | |
Inception (6/2/09) | | | 6.80 | % |
5 Years | | | 3.93 | |
1 Year | | | 1.64 | |
| |
Class B Shares | | | | |
Inception (6/2/09) | | | 6.79 | % |
5 Years | | | 3.99 | |
1 Year | | | 1.67 | |
| |
Class C Shares | | | | |
Inception (6/2/09) | | | 6.79 | % |
5 Years | | | 4.32 | |
1 Year | | | 5.67 | |
| |
Class R Shares | | | | |
Inception (6/2/09) | | | 7.33 | % |
5 Years | | | 4.85 | |
1 Year | | | 7.26 | |
| |
Class Y Shares | | | | |
Inception (6/2/09) | | | 7.87 | % |
5 Years | | | 5.36 | |
1 Year | | | 7.75 | |
| |
Class R5 Shares | | | | |
Inception (6/2/09) | | | 7.89 | % |
5 Years | | | 5.40 | |
1 Year | | | 7.88 | |
| |
Class R6 Shares | | | | |
Inception | | | 7.82 | % |
5 Years | | | 5.42 | |
1 Year | | | 7.93 | |
| | | | |
Average Annual Total Returns As of 9/30/16, the most recent calendar quarter end, including maximum applicable sales charges | |
| |
Class A Shares | | | | |
Inception (6/2/09) | | | 7.12 | % |
5 Years | | | 4.91 | |
1 Year | | | 6.01 | |
| |
Class B Shares | | | | |
Inception (6/2/09) | | | 7.13 | % |
5 Years | | | 5.00 | |
1 Year | | | 6.40 | |
| |
Class C Shares | | | | |
Inception (6/2/09) | | | 7.14 | % |
5 Years | | | 5.32 | |
1 Year | | | 10.40 | |
| |
Class R Shares | | | | |
Inception (6/2/09) | | | 7.66 | % |
5 Years | | | 5.84 | |
1 Year | | | 11.90 | |
| |
Class Y Shares | | | | |
Inception (6/2/09) | | | 8.22 | % |
5 Years | | | 6.37 | |
1 Year | | | 12.48 | |
| |
Class R5 Shares | | | | |
Inception (6/2/09) | | | 8.24 | % |
5 Years | | | 6.41 | |
1 Year | | | 12.52 | |
| |
Class R6 Shares | | | | |
Inception | | | 8.16 | % |
5 Years | | | 6.41 | |
1 Year | | | 12.57 | |
Class R6 shares incepted on September 24, 2012. Performance shown prior to that date is that of Class A shares and includes the 12b-1 fees applicable to Class A shares.
The performance data quoted represent past performance and cannot guarantee comparable future results; current performance may be lower or higher. Please visit invesco.com/performance for the most recent month-end performance. Performance figures reflect reinvested distributions, changes in net asset value and the effect of the maximum sales charge unless otherwise stated. Investment return and principal value will fluctuate so that you may have a gain or loss when you sell shares.
The net annual Fund operating expense ratio set forth in the most recent Fund prospectus as of the date of this report for Class A, Class B, Class C, Class R, Class Y, Class R5 and Class R6 shares was 1.27%, 2.02%, 2.02%,
1.52%, 1.02%, 0.99% and 0.89%, respectively.1 The total annual Fund operating expense ratio set forth in the most recent Fund prospectus as of the date of this report for Class A, Class B, Class C, Class R, Class Y, Class R5 and Class R6 shares was 1.32%, 2.07%, 2.07%, 1.57%, 1.07%, 1.04% and 0.94%, respectively. The expense ratios presented above may vary from the expense ratios presented in other sections of this report that are based on expenses incurred during the period covered by this report.
Class A share performance reflects the maximum 5.50% sales charge, and Class B and Class C share performance reflects the applicable contingent deferred sales charge (CDSC) for the period involved. The CDSC on Class B shares declines from 5% beginning at the time of purchase to 0% at the beginning of the seventh year. The CDSC on Class C shares is 1% for the first year after purchase. Class R, Class Y,
Class R5 and Class R6 shares do not have a front-end sales charge or a CDSC; therefore, performance is at net asset value.
The performance of the Fund’s share classes will differ primarily due to different sales charge structures and class expenses.
Fund performance reflects any applicable fee waivers and/or expense reimbursements. Had the adviser not waived fees and/or reimbursed expenses currently or in the past, returns would have been lower. See current prospectus for more information.
| 1 | Total annual Fund operating expenses after any contractual fee waivers and/or expense reimbursements by the adviser in effect through at least June 30, 2018. See current prospectus for more information. |
|
| 7 Invesco Balanced-Risk Allocation Fund |
Invesco Balanced-Risk Allocation Fund’s investment objective is to provide total return with a low to moderate correlation to traditional financial market indices.
| ∎ | | Unless otherwise stated, information presented in this report is as of October 31, 2016, and is based on total net assets. |
| ∎ | | Unless otherwise noted, all data provided by Invesco. |
| ∎ | | To access your Fund’s reports/prospectus, visit invesco.com/fundreports. |
About share classes
| ∎ | | Class B shares may not be purchased for new or additional investments. Please see the prospectus for more information. |
| ∎ | | Class R shares are generally available only to employer sponsored retirement and benefit plans. Please see the prospectus for more information. |
| ∎ | | Class Y shares are available only to certain investors. Please see the prospectus for more information. |
| ∎ | | Class R5 shares and Class R6 shares are primarily intended for employer sponsored retirement and benefit plans that meet certain standards and for institutional investors. Please see the prospectus for more information. |
Principal risks of investing in the Fund
| ∎ | | Changing fixed income market conditions risk. The current low interest rate environment was created in part by the Federal Reserve Board (FRB) and certain foreign central banks keeping the federal funds and equivalent foreign rates near, at or below zero. Increases in the federal funds and equivalent foreign rates may expose fixed income markets to heightened volatility and reduced liquidity for certain fixed income investments, particularly those with longer maturities. In addition, decreases in fixed income dealer market-making capacity may also potentially lead to heightened volatility and reduced liquidity in the fixed income markets. As a result, the value of the Fund’s investments and share price may decline. Changes in central bank policies could also result in higher than normal shareholder redemptions, which could potentially increase portfolio turnover and the Fund’s transaction costs. |
| ∎ | | Commodities tax risk. The tax treatment of commodity-linked derivative instruments may be adversely affected by changes in legislation, regulations or other legally binding authority. If, as a result of any such adverse action, the income of |
| | | the Fund from certain commodity-linked derivatives was treated as non-qualifying income, the Fund might fail to qualify as a regulated investment company and be subject to federal income tax at the Fund level. Should the Internal Revenue Service issue guidance, or Congress enact legislation, that adversely affects the tax treatment of the Fund’s use of commodity-linked notes or the Subsidiary (which guidance might be applied to the Fund retroactively), it could, among other consequences, limit the Fund’s ability to pursue its investment strategy. |
| ∎ | | Commodity-linked notes risk. In addition to risks associated with the underlying commodities, investments in commodity-linked notes may be subject to additional risks, such as non-payment of interest and loss of principal, counterparty risk, lack of a secondary market and risk of greater volatility than traditional equity and debt securities. The value of the commodity-linked notes the Fund buys may fluctuate significantly because the values of the underlying investments to which they are linked are themselves volatile. Additionally, certain commodity-linked notes employ “economic” leverage by requiring payment by the issuer of an amount that is a multiple of the price increase or decrease of the underlying commodity, commodity index, or other economic variable. Such economic leverage will increase the volatility of the value of these commodity-linked notes and the Fund to the extent it invests in such notes. |
| ∎ | | Commodity risk. The Fund may have investment exposure to the commodities markets and/or a particular sector of the commodities markets, which may subject the Fund to greater volatility than investments in traditional securities, such as stocks and bonds. Volatility in the commodities markets may be caused by changes in overall market movements, domestic and foreign political and economic events and policies, |
| | | war, acts of terrorism, changes in domestic or foreign interest rates and/ or investor expectations concerning interest rates, domestic and foreign inflation rates, investment and trading activities of mutual funds, hedge funds and commodities funds, and factors such as drought, floods, weather, livestock disease, embargoes, tariffs and other regulatory developments or supply and demand disruptions. Because the Fund’s performance may be linked to the performance of volatile commodities, investors should be willing to assume the risks of potentially significant fluctuations in the value of the Fund’s shares. |
| ∎ | | Correlation risk. Because the Fund’s investment strategy seeks to balance risk across three asset classes and, within each asset class, across different countries and investments, to the extent either the asset classes or the selected countries and investments become correlated in a way not anticipated by the Adviser, the Fund’s risk allocation process may result in magnified risks and loss instead of balancing (reducing) the risk of loss. |
| ∎ | | Debt securities risk. The prices of debt securities held by the Fund will be affected by changes in interest rates, the creditworthiness of the issuer and other factors. An increase in prevailing interest rates typically causes the value of existing debt securities to fall and often has a greater impact on longer-duration debt securities and higher quality debt securities. Falling interest rates will cause the Fund to reinvest the proceeds of debt securities that have been repaid by the issuer at lower interest rates. Falling interest rates may also reduce the Fund’s distributable income because interest payments on floating rate debt instruments held by the Fund will decline. The Fund could lose money on investments in debt securities if the issuer or borrower fails to meet its obligations to make interest payments and/or to repay principal in a timely manner. Changes in an issuer’s financial strength, the market’s perception of such strength or in the credit rating of the issuer or the security may affect the value of debt securities. The Adviser’s credit analysis may fail to anticipate such changes, which could result in buying a debt security at |
| | |
This report must be accompanied or preceded by a currently effective Fund prospectus, which contains more complete information, including sales charges and expenses. Investors should read it carefully before investing. | | |
| | |
| NOT FDIC INSURED | MAY LOSE VALUE | NO BANK GUARANTEE | | |
8 Invesco Balanced-Risk Allocation Fund
| | an inopportune time or failing to sell a debt security in advance of a price decline or other credit event. |
| ∎ | | Derivatives risk. The value of a derivative instrument depends largely on (and is derived from) the value of an underlying security, currency, commodity, interest rate, index or other asset (each referred to as an underlying asset). In addition to risks relating to the underlying assets, the use of derivatives may include other, possibly greater, risks, including counterparty, leverage and liquidity risks. Counterparty risk is the risk that the counterparty to the derivative contract will default on its obligation to pay the Fund the amount owed or otherwise perform under the derivative contract. Derivatives create leverage risk because they do not require payment up front equal to the economic exposure created by owning the derivative. As a result, an adverse change in the value of the underlying asset could result in the Fund sustaining a loss that is substantially greater than the amount invested in the derivative, which may make the Fund’s returns more volatile and increase the risk of loss. Derivative instruments may also be less liquid than more traditional investments and the Fund may be unable to sell or close out its derivative positions at a desirable time or price. This risk may be more acute under adverse market conditions, during which the Fund may be most in need of liquidating its derivative positions. Derivatives may also be harder to value, less tax efficient and subject to changing government regulation that could impact the Fund’s ability to use certain derivatives or their cost. Also, derivatives used for hedging or to gain or limit exposure to a particular market segment may not provide the expected benefits, particularly during adverse market conditions. These risks are greater for the Fund than most other mutual funds because the Fund will implement its investment strategy primarily through derivative instruments rather than direct investments in stocks/bonds. |
| ∎ | | Emerging markets securities risk. Emerging markets (also referred to as developing markets) are generally subject to greater market volatility, political, |
| | social and economic instability, uncertain trading markets and more governmental limitations on foreign investment than more developed markets. In addition, emerging markets may be subject to lower trading volume and greater price fluctuations than companies in more developed markets. Securities law and the enforcement of systems of taxation in many emerging market countries may change quickly and unpredictably. In addition, investments in emerging markets securities may also be subject to additional transaction costs, delays in settlement procedures, and lack of timely information. |
| ∎ | | Exchange-traded funds risk. In addition to the risks associated with the underlying assets held by the exchange-traded fund, investments in exchange-traded funds are subject to the following additional risks: (1) an exchange-traded fund’s shares may trade above or below its net asset value; (2) an active trading market for the exchange-traded fund’s shares may not develop or be maintained; (3) trading an exchange- traded fund’s shares may be halted by the listing exchange; (4) a passively managed exchange-traded fund may not track the performance of the reference asset; and (5) a passively managed exchange-traded fund may hold troubled securities. Investment in exchange-traded funds may involve duplication of management fees and certain other expenses, as the Fund indirectly bears its proportionate share of any expenses paid by the exchange-traded funds in which it invests. Further, certain exchange-traded funds in which the Fund may invest are leveraged, which may result in economic leverage, permitting the Fund to gain exposure that is greater than would be the case in an unlevered instrument and potentially resulting in greater volatility. |
| ∎ | | Exchange-traded notes risk. Exchange-traded notes are subject to credit risk, counterparty risk, and the risk that the value of the exchange-traded note may drop due to a downgrade in the issuer’s credit rating. The value of an exchange-traded note may also be influenced by time to maturity, level of supply and demand for the exchange-traded note, volatility and lack of liquidity in the underlying |
| | | market, changes in the applicable interest rates, and economic, legal, political, or geographic events that affect the referenced underlying market or assets. The Fund will bear its proportionate share of any fees and expenses borne by an exchange-traded note in which it invests. For certain exchange-traded notes, there may be restrictions on the Fund’s right to redeem its investment, which is meant to be held until maturity. |
| ∎ | | Foreign government debt risk. Investments in foreign government debt securities (sometimes referred to as sovereign debt securities) involve certain risks in addition to those relating to foreign securities or debt securities generally. The issuer of the debt or the governmental authorities that control the repayment of the debt may be unable or unwilling to repay principal or interest when due in accordance with the terms of such debt, and the Fund may have limited recourse in the event of a default against the defaulting government. Without the approval of debt holders, some governmental debtors have in the past been able to reschedule or restructure their debt payments or declare moratoria on payments. |
| ∎ | | Foreign securities risk. The Fund’s foreign investments may be adversely affected by political and social instability, changes in economic or taxation policies, difficulty in enforcing obligations, decreased liquidity or increased volatility. Foreign investments also involve the risk of the possible seizure, nationalization or expropriation of the issuer or foreign deposits (in which the Fund could lose its entire investments in a certain market) and the possible adoption of foreign governmental restrictions such as exchange controls. Unless the Fund has hedged its foreign securities risk, foreign securities risk also involves the risk of negative foreign currency rate fluctuations, which may cause the value of securities denominated in such foreign currency (or other instruments through which the Fund has exposure to foreign currencies) to decline in value. Currency exchange rates may fluctuate significantly over short periods of time. Currency hedging strategies, if used, are not always successful. |
continued on page 10
9 Invesco Balanced-Risk Allocation Fund
continued from page 9
| ∎ | | Management risk. The Fund is actively managed and depends heavily on the Adviser’s judgment about markets, interest rates or the attractiveness, relative values, liquidity, or potential appreciation of particular investments made for the Fund’s portfolio. The Fund could experience losses if these judgments prove to be incorrect. Because the Fund’s investment process relies heavily on its asset allocation process, market movements that are counter to the portfolio managers’ expectations may have a significant adverse effect on the Fund’s net asset value. Additionally, legislative, regulatory, or tax developments may adversely affect management of the Fund and, therefore, the ability of the Fund to achieve its investment objective. |
| ∎ | | Market risk. The market values of the Fund’s investments, and therefore the value of the Fund’s shares, will go up and down, sometimes rapidly or unpredictably. Market risk may affect a single issuer, industry or section of the economy, or it may affect the market as a whole. Individual stock prices tend to go up and down more dramatically than those of certain other types of investments, such as bonds. During a general downturn in the financial markets, multiple asset classes may decline in value. When markets perform well, there can be no assurance that specific investments held by the Fund will rise in value. |
| ∎ | | Short position risk. Because the Fund’s potential loss on a short position arises from increases in the value of the asset sold short, the Fund will incur a loss on a short position, which is theoretically unlimited, if the price of the asset sold short increases from the short sale price. The counterparty to a short position or other market factors may prevent the Fund from closing out a short position at a desirable time or price and may reduce or eliminate any gain or result in a loss. In a rising market, the Fund’s short positions will cause the Fund to underperform the overall market and its peers that do not engage in shorting. If the Fund holds both long and short positions, and both positions decline simultaneously, the short positions will not provide any buffer (hedge) from declines in value of the Fund’s long positions. Certain types of short positions involve leverage, which |
| | | may exaggerate any losses, potentially more than the actual cost of the investment, and will increase the volatility of the Fund’s returns. |
| ∎ | | Subsidiary risk. By investing in the Subsidiary, the Fund is indirectly exposed to risks associated with the Subsidiary’s investments. The Subsidiary is not registered under the Investment Company Act of 1940, as amended (1940 Act), and, except as otherwise noted in the prospectus, is not subject to the investor protections of the 1940 Act. Changes in the laws of the United States and/or the Cayman Islands, under which the Fund and the Subsidiary, respectively, are organized, could result in the inability of the Fund and/or the Subsidiary to operate as described in the prospectus and the SAI, and could negatively affect the Fund and its shareholders. |
| ∎ | | US government obligations risk. Obligations of US government agencies and authorities receive varying levels of support and may not be backed by the full faith and credit of the US government, which could affect the Fund’s ability to recover should they default. No assurance can be given that the US government will provide financial support to its agencies and authorities if it is not obligated by law to do so. |
| ∎ | | Volatility risk. Although the Fund’s investment strategy targets a specific volatility level, certain of the Fund’s investments may appreciate or decrease significantly in value over short periods of time. This may cause the Fund’s net asset value per share to experience significant increases or declines in value over short periods of time. |
About indexes used in this report
| ∎ | | The S&P 500® Index is an unmanaged index considered representative of the US stock market. |
| ∎ | | The Custom Invesco Balanced-Risk Allocation Broad Index consists of 60% S&P 500 Index and 40% Bloomberg Barclays U.S. Aggregate Index. |
| ∎ | | The Custom Invesco Balanced-Risk Allocation Style Index consists of 60% MSCI World Index and 40% Bloomberg Barclays U.S. Aggregate Index. Effective December 1, 2009, the fixed income component of the Custom Invesco Balanced-Risk Allocation Style |
| | | Index changed from the JP Morgan GBI Global (Traded) Index to the Bloomberg Barclays U.S. Aggregate Index. |
| ∎ | | The Lipper Alternative Global Macro Funds Index is an unmanaged index considered representative of alternative global macro funds tracked by Lipper. |
| ∎ | | The MSCI World IndexSM is an unmanaged index considered representative of stocks of developed countries. The index return is computed using the net return, which withholds applicable taxes for non-resident investors. |
| ∎ | | The Bloomberg Barclays U.S. Aggregate Index is an unmanaged index considered representative of the US investment-grade, fixed-rate bond market. |
| ∎ | | The JP Morgan GBI (Traded) Index is a total return, market capitalization-weighted index, rebalanced monthly, consisting of the following countries: Australia, Germany, Spain, Belgium, Italy, Sweden, Canada, Japan, the United Kingdom, Denmark, the Netherlands and the United States. |
| ∎ | | The Fund is not managed to track the performance of any particular index, including the index(es) described here, and consequently, the performance of the Fund may deviate significantly from the performance of the index(es). |
| ∎ | | A direct investment cannot be made in an index. Unless otherwise indicated, index results include reinvested dividends, and they do not reflect sales charges. Performance of the peer group, if applicable, reflects fund expenses; performance of a market index does not. |
Other information
| ∎ | | The returns shown in management’s discussion of Fund performance are based on net asset values (NAVs) calculated for shareholder transactions. Generally accepted accounting principles require adjustments to be made to the net assets of the Fund at period end for financial reporting purposes, and as such, the NAVs for shareholder transactions and the returns based on those NAVs may differ from the NAVs and returns reported in the Financial Highlights. |
10 Invesco Balanced-Risk Allocation Fund
Consolidated Schedule of Investments
October 31, 2016
| | | | | | | | | | | | | | | | |
| | | Interest
Rate | | | Maturity
Date | | | Principal
Amount | | | Value | |
U.S. Treasury Securities–41.99% | | | | | | | | | | | | | | | | |
| U.S. Treasury Bills–17.30%(a) | | | | | | | | | | | | | | | | |
U.S. Treasury Bills | | | 0.35 | % | | | 11/03/2016 | | | $ | 119,000,000 | | | $ | 118,999,272 | |
U.S. Treasury Bills(b) | | | 0.33 | % | | | 12/08/2016 | | | | 35,150,000 | | | | 35,144,036 | |
U.S. Treasury Bills(b) | | | 0.34 | % | | | 12/15/2016 | | | | 65,830,000 | | | | 65,815,914 | |
U.S. Treasury Bills(b) | | | 0.34 | % | | | 01/05/2017 | | | | 37,600,000 | | | | 37,582,343 | |
U.S. Treasury Bills(b) | | | 0.40 | % | | | 01/26/2017 | | | | 64,900,000 | | | | 64,853,477 | |
U.S. Treasury Bills | | | 0.40 | % | | | 01/26/2017 | | | | 168,280,000 | | | | 168,159,369 | |
U.S. Treasury Bills(b) | | | 0.47 | % | | | 06/22/2017 | | | | 64,000,000 | | | | 63,790,779 | |
U.S. Treasury Bills | | | 0.47 | % | | | 06/22/2017 | | | | 275,000,000 | | | | 274,101,002 | |
U.S. Treasury Bills(b) | | | 0.57 | % | | | 08/17/2017 | | | | 100,000,000 | | | | 99,550,363 | |
| | | | | | | | | | | | | | | | 927,996,555 | |
|
| U.S. Treasury Notes–24.69% | |
U.S. Treasury Floating Rate Notes(b)(c) | | | 0.61 | % | | | 01/31/2018 | | | | 128,630,000 | | | | 128,951,832 | |
U.S. Treasury Floating Rate Notes(c) | | | 0.61 | % | | | 01/31/2018 | | | | 413,350,000 | | | | 414,384,202 | |
U.S. Treasury Floating Rate Notes(b)(c) | | | 0.53 | % | | | 04/30/2018 | | | | 133,026,000 | | | | 133,196,273 | |
U.S. Treasury Floating Rate Notes(c) | | | 0.53 | % | | | 04/30/2018 | | | | 346,240,000 | | | | 346,683,187 | |
U.S. Treasury Floating Rate Notes(b)(c) | | | 0.51 | % | | | 07/31/2018 | | | | 63,900,000 | | | | 63,926,993 | |
U.S. Treasury Floating Rate Notes(c) | | | 0.51 | % | | | 07/31/2018 | | | | 237,520,000 | | | | 237,620,336 | |
| | | | | | | | | | | | | | | | 1,324,762,823 | |
Total U.S. Treasury Securities (Cost $2,250,658,432) | | | | | | | | | | | | | | | 2,252,759,378 | |
| | | | |
| | | | | | Expiration
Date | | | | | | | |
Commodity-Linked Securities–4.74% | | | | | | | | | | | | | | | | |
Canadian Imperial Bank of Commerce Commodity-Linked EMTN, U.S. Federal Funds Effective Rate minus 0.02% (linked to the Canadian Imperial Bank of Commerce Custom 5 Agriculture Commodity Index, multiplied by 2)(b)(d) | | | | | | | 08/22/2017 | | | | 83,500,000 | | | | 76,245,558 | |
Cargill, Inc. Commodity-Linked Notes, one month LIBOR minus 0.10% (linked to the Monthly Rebalance Commodity Excess Return Index, multiplied by 2)(b)(d) | | | | | | | 08/07/2017 | | | | 74,940,000 | | | | 72,704,060 | |
RBC Capital Markets, LLC Commodity-Linked Notes, U.S. Federal Funds Effective Rate minus 0.04% (linked to the RBC Enhanced Agricultural Basket 04 Excess Return
Index)(b)(d) | | | | | | | 08/15/2017 | | | | 107,350,000 | | | | 105,468,782 | |
Total Commodity-Linked Securities (Cost $265,790,000) | | | | | | | | | | | | | | | 254,418,400 | |
| | | | |
| | | | | | | | | Shares | | | | |
Money Market Funds–47.51% | | | | | | | | | | | | | | | | |
Government & Agency Portfolio–Institutional Class, 0.29%(e) | | | | | | | | | | | 871,347,694 | | | | 871,347,694 | |
Government TaxAdvantage Portfolio–Institutional Class, 0.12%(e) | | | | | | | | | | | 1,000,000,000 | | | | 1,000,000,000 | |
STIC (Global Series) PLC–U.S. Dollar Liquidity Portfolio (Ireland)–Institutional
Class, 0.62%(b)(e) | | | | | | | | | | | 97,048,363 | | | | 97,048,363 | |
Treasury Portfolio–Institutional Class, 0.22%(e) | | | | | | | | | | | 580,898,463 | | | | 580,898,463 | |
Total Money Market Funds (Cost $2,549,294,520) | | | | | | | | | | | | | | | 2,549,294,520 | |
TOTAL INVESTMENTS–94.24% (Cost $5,065,742,952) | | | | | | | | | | | | | | | 5,056,472,298 | |
OTHER ASSETS LESS LIABILITIES–5.76% | | | | | | | | | | | | | | | 309,027,044 | |
NET ASSETS–100.00% | | | | | | | | | | | | | | $ | 5,365,499,342 | |
See accompanying Notes to Consolidated Financial Statements which are an integral part of the financial statements.
11 Invesco Balanced-Risk Allocation Fund
| | | | | | | | | | | | | | | | | | | | | | | | | | | | |
| Open Futures Contracts(f) | |
| Futures Contracts | | Type of
Contract | | | | | | | | | Number of
Contracts | | | Expiration Month | | | Notional
Value | | | Unrealized Appreciation (Depreciation) | |
Brent Crude(b) | | | Long | | | | | | | | | | | | 1,760 | | | | May-2017 | | | $ | 89,654,400 | | | $ | (3,373,591 | ) |
Gasoline Reformulated Blendstock Oxygenate Blending(b) | | | Long | | | | | | | | | | | | 1,925 | | | | December-2016 | | | | 114,766,575 | | | | (5,882,538 | ) |
Heating Oil(b) | | | Long | | | | | | | | | | | | 715 | | | | April-2017 | | | | 46,405,359 | | | | (1,187,966 | ) |
Silver(b) | | | Long | | | | | | | | | | | | 1,805 | | | | December-2016 | | | | 160,608,900 | | | | (10,227,070 | ) |
WTI Crude(b) | | | Long | | | | | | | | | | | | 1,470 | | | | April-2017 | | | | 72,221,100 | | | | (3,087,210 | ) |
Subtotal — Commodity Risk | | | | | | | | | | | | | | | | | | | | | | | | | | | (23,758,375 | ) |
| | | | | | | |
| | | | | | | | | | | | | | | | | | | | | | | | | | | | |
Dow Jones EURO STOXX 50 Index | | | Long | | | | | | | | | | | | 12,630 | | | | December-2016 | | | | 423,285,704 | | | | 7,871,864 | |
E-Mini S&P 500 Index | | | Long | | | | | | | | | | | | 3,120 | | | | December-2016 | | | | 330,735,600 | | | | (6,068,343 | ) |
FTSE 100 Index | | | Long | | | | | | | | | | | | 4,510 | | | | December-2016 | | | | 382,434,930 | | | | 15,931,114 | |
Hang Seng Index | | | Long | | | | | | | | | | | | 2,170 | | | | November-2016 | | | | 320,444,655 | | | | (7,432,872 | ) |
Russell 2000 Index Mini | | | Long | | | | | | | | | | | | 2,310 | | | | December-2016 | | | | 275,190,300 | | | | (11,053,610 | ) |
Tokyo Stock Price Index | | | Long | | | | | | | | | | | | 3,210 | | | | December-2016 | | | | 427,020,455 | | | | 18,585,704 | |
Subtotal — Equity Risk | | | | | | | | | | | | | | | | | | | | | | | | | | | 17,833,857 | |
| | | | | | | |
| | | | | | | | | | | | | | | | | | | | | | | | | | | | |
Australian 10 Year Bonds | | | Long | | | | | | | | | | | | 10,390 | | | | December-2016 | | | | 1,048,135,264 | | | | (29,139,572 | ) |
Canadian 10 Year Bonds | | | Long | | | | | | | | | | | | 9,240 | | | | December-2016 | | | | 996,301,062 | | | | (13,598,531 | ) |
Long Gilt | | | Long | | | | | | | | | | | | 3,380 | | | | December-2016 | | | | 518,461,891 | | | | (24,916,359 | ) |
U.S. Treasury Long Bonds | | | Long | | | | | | | | | | | �� | 2,840 | | | | December-2016 | | | | 462,121,250 | | | | (21,520,555 | ) |
Subtotal — Interest Rate Risk | | | | | | | | | | | | | | | | | | | | | | | | | | | (89,175,017 | ) |
Total Future Contracts | | | | | | | | | | | | | | | | | | | | | | | | | | $ | (95,099,535 | ) |
| | | | | | | |
| | | | | | | | | | | | | | | | | | | | | | | | | | | | |
| Open Over-The-Counter Total Return Swap Agreements | |
| Counterparty | | Pay/
Receive | | | Reference Entity | | | Fixed
Rate | | | Number of
Contracts | | | Termination Date | | | Notional Value(g) | | | Unrealized
Appreciation
(Depreciation) | |
Barclays Bank PLC(b) | | | Receive | | |
| Barclays Commodity Strategy
1452 Excess Return Index |
| | | 0.33 | % | | | 195,500 | | | | October-2017 | | | $ | 74,287,693 | | | $ | 3,388,386 | |
Barclays Bank PLC(b) | | | Receive | | |
| Barclays Commodity Strategy
1719 Excess Return Index |
| | | 0.45 | | | | 15,000 | | | | July-2017 | | | | 4,362,723 | | | | (22,527 | ) |
Canadian Imperial Bank of
Commerce(b) | | | Receive | | |
| Canadian Imperial Bank of
Commerce Dynamic Roll LME
Copper Excess Return Index 2 |
| | | 0.30 | | | | 1,785,000 | | | | April-2017 | | | | 108,905,349 | | | | 685,440 | |
Cargill, Inc.(b) | | | Receive | | |
| Monthly Rebalance Commodity
Excess Return Index |
| | | 0.47 | | | | 108,200 | | | | July-2017 | | | | 99,076,500 | | | | 0 | |
Cargill, Inc.(b) | | | Receive | | |
| Single Commodity Index Excess
Return |
| | | 0.12 | | | | 77,200 | | | | January-2017 | | | | 69,501,269 | | | | 0 | |
Goldman Sachs International(b) | | | Receive | | |
| Goldman Sachs Alpha Basket
B823 Excess Return Strategy |
| | | 0.40 | | | | 1,092,000 | | | | July-2017 | | | | 96,929,414 | | | | 2,210,492 | |
J.P. Morgan Chase Bank, N.A.(b) | | | Receive | | |
| J.P. Morgan Contag Beta Gas Oil
Excess Return Index |
| | | 0.25 | | | | 277,000 | | | | April-2017 | | | | 58,610,236 | | | | (3,023,427 | ) |
J.P. Morgan Chase Bank, N.A.(b) | | | Receive | | | | S&P GSCI Gold Index Excess
Return | | | | 0.09 | | | | 707,000 | | | | October-2017 | | | | 73,983,732 | | | | 550,258 | |
Merrill Lynch International(b) | | | Receive | | |
| Merrill Lynch Gold Excess Return
Index |
| | | 0.14 | | | | 553,000 | | | | June-2017 | | | | 91,366,771 | | | | 0 | |
Merrill Lynch International(b) | | | Receive | | |
| MLCX Aluminum Annual Excess
Return Index |
| | | 0.28 | | | | 327,000 | | | | September-2017 | | | | 32,140,447 | | | | 0 | |
Merrill Lynch International(b) | | | Receive | | |
| MLCX Natural Gas Annual Excess
Return Index |
| | | 0.25 | | | | 1,165,000 | | | | August-2017 | | | | 56,239,163 | | | | 0 | |
Morgan Stanley Capital Services
LLC(b) | | | Receive | | |
| S&P GSCI Aluminum Dynamic Roll
Index Excess Return |
| | | 0.38 | | | | 1,185,000 | | | | October-2017 | | | | 108,536,473 | | | | 4,885,933 | |
Subtotal — Commodity Risk | | | | | | | | | | | | | | | | | | | | | | | | | | | 8,674,555 | |
Goldman Sachs International | | | Receive | | | | Hang Seng Index Futures | | | | — | | | | 480 | | | | November-2016 | | | | 70,881,767 | | | | (1,663,329 | ) |
Subtotal — Equity Risk | | | | | | | | | | | | | | | | | | | | | | | | | | | (1,663,329 | ) |
Macquarie Bank Ltd. | | | Receive | | | | Macquarie CGB 10 Year Index | | | | 0.34 | | | | 310,000 | | | | June-2017 | | | | CAD 58,433,698 | | | | (269,449 | ) |
Subtotal — Interest Rate Risk | | | | | | | | | | | | | | | | | | | | | | | | | | | (269,449 | ) |
Total Swap Agreements | | | | | | | | | | | | | | | $ | 6,741,777 | |
See accompanying Notes to Consolidated Financial Statements which are an integral part of the financial statements.
12 Invesco Balanced-Risk Allocation Fund
Investment Abbreviations:
| | |
| CAD | | – Canadian Dollar |
| CGB | | – Canadian Government Bonds |
| EMTN | | – Euro Medium Term Notes |
| LIBOR | | – London Interbank Offered Rate |
Index Information:
| | |
| Canadian Imperial Bank of Commerce Custom 5 Agriculture Commodity Index | | – a basket of indices that provide exposure to various components of the agriculture markets. The underlying commodities comprising the indices are: Cocoa, Coffee, Corn, Cotton, Lean Hogs, Live Cattle, Soybean Meal, Soybean Oil, Soybeans, Sugar and Wheat. |
| Monthly Rebalance Commodity Excess Return Index | | – a commodity index composed of futures contracts on Cocoa, Coffee ‘C’, Corn, Cotton No.2, Lean Hogs, Live Cattle, Soybean Meal, Soybean Oil, Soybeans, Sugar No.11 and Wheat. |
| RBC Enhanced Agricultural Basket 04 Excess Return Index | | – a commodity index composed of futures contracts on Cocoa, Coffee, Corn, Cotton, Lean Hogs, Live Cattle, Soybean Meal, Soybean Oil, Soybeans, Sugar and Wheat. |
| Barclays Commodity Strategy 1452 Excess Return Index | | – a commodity index that provides exposure to futures contracts on Copper. |
| Barclays Commodity Strategy 1719 Excess Return Index | | – a commodity index that provides exposure to futures contracts on Cocoa, Coffee, Corn, Cotton, Lean Hogs, Live Cattle, Soybean Meal, Soybean Oil, Soybeans, Sugar and Wheat. |
| Single Commodity Index Excess Return | | – a commodity index that provides exposure to futures contracts on Gold. |
| Goldman Sachs Alpha Basket B823 Excess Return Strategy | | – a basket of indices that provide exposure to various components of the agriculture markets. The underlying commodities comprising the indices are: Cocoa, Coffee, Corn, Cotton, Lean Hogs, Live Cattle, Soybeans, Soybean Oil, Soybean Meal, Sugar and Wheat. |
Notes to Schedule of Investments:
| (a) | Security traded on a discount basis. The interest rate shown represents the discount rate at the time of purchase by the Fund. |
| (b) | The investment is owned by the subsidiary. See Note 5. |
| (c) | Interest or dividend rate is redetermined periodically. Rate shown is the rate in effect on October 31, 2016. |
| (d) | Security purchased or received in a transaction exempt from registration under the Securities Act of 1933, as amended (the “1933 Act”). The security may be resold pursuant to an exemption from registration under the 1933 Act, typically to qualified institutional buyers. The aggregate value of these securities at October 31, 2016 was $254,418,400, which represented 4.75% of the Fund’s Net Assets. |
| (e) | The money market fund and the Fund are affiliated by having the same investment adviser. The rate shown is the 7-day SEC standardized yield as of October 31, 2016. |
| (f) | Futures contracts collateralized by $273,220,000 cash held by Bank of America Merrill Lynch, the futures commission merchant. |
| (g) | Notional Value is denominated in U.S. Dollars unless otherwise noted. |
See accompanying Notes to Consolidated Financial Statements which are an integral part of the financial statements.
13 Invesco Balanced-Risk Allocation Fund
Consolidated Statement of Assets and Liabilities
October 31, 2016
| | | | |
Assets: | |
Investments, at value (Cost $2,516,448,432) | | $ | 2,507,177,778 | |
Investments in affiliated money market funds, at value and cost | | | 2,549,294,520 | |
Total investments, at value (Cost $5,065,742,952) | | | 5,056,472,298 | |
Receivable for: | | | | |
Deposits with brokers for open futures contracts and swap agreements | | | 314,651,293 | |
Fund shares sold | | | 6,326,895 | |
Dividends and interest | | | 968,981 | |
Fund expenses absorbed | | | 11,931 | |
Swaps receivables | | | 5,993,298 | |
Investment for trustee deferred compensation and retirement plans | | | 544,546 | |
Unrealized appreciation on swap agreements — OTC | | | 11,720,509 | |
Other assets | | | 80,094 | |
Total assets | | | 5,396,769,845 | |
|
Liabilities: | |
Payable for: | | | | |
Fund shares reacquired | | | 8,460,983 | |
Swaps payable | | | 5,772,431 | |
Variation margin — futures | | | 8,005,435 | |
Accrued fees to affiliates | | | 2,967,540 | |
Accrued trustees’ and officers’ fees and benefits | | | 8,584 | |
Accrued other operating expenses | | | 425,568 | |
Trustee deferred compensation and retirement plans | | | 651,230 | |
Unrealized depreciation on swap agreements — OTC | | | 4,978,732 | |
Total liabilities | | | 31,270,503 | |
Net assets applicable to shares outstanding | | $ | 5,365,499,342 | |
|
Net assets consist of: | |
Shares of beneficial interest | | $ | 5,003,987,990 | |
Undistributed net investment income (loss) | | | 179,178,674 | |
Undistributed net realized gain | | | 279,961,090 | |
Net unrealized appreciation (depreciation) | | | (97,628,412 | ) |
| | | $ | 5,365,499,342 | |
| | | | |
Net Assets: | |
Class A | | $ | 1,864,270,914 | |
Class B | | $ | 8,490,559 | |
Class C | | $ | 1,278,217,737 | |
Class R | | $ | 27,358,654 | |
Class Y | | $ | 1,755,256,585 | |
Class R5 | | $ | 144,960,427 | |
Class R6 | | $ | 286,944,466 | |
|
Shares outstanding, $0.01 par value per share,
with an unlimited number of shares authorized: | |
Class A | | | 164,476,857 | |
Class B | | | 778,773 | |
Class C | | | 117,238,450 | |
Class R | | | 2,448,196 | |
Class Y | | | 152,993,131 | |
Class R5 | | | 12,627,670 | |
Class R6 | | | 24,975,970 | |
Class A: | | | | |
Net asset value per share | | $ | 11.34 | |
Maximum offering price per share | | | | |
(Net asset value of $11.34 ¸ 94.50%) | | $ | 12.00 | |
Class B: | | | | |
Net asset value and offering price per share | | $ | 10.90 | |
Class C: | | | | |
Net asset value and offering price per share | | $ | 10.90 | |
Class R: | | | | |
Net asset value and offering price per share | | $ | 11.18 | |
Class Y: | | | | |
Net asset value and offering price per share | | $ | 11.47 | |
Class R5: | | | | |
Net asset value and offering price per share | | $ | 11.48 | |
Class R6: | | | | |
Net asset value and offering price per share | | $ | 11.49 | |
See accompanying Notes to Consolidated Financial Statements which are an integral part of the financial statements.
14 Invesco Balanced-Risk Allocation Fund
Consolidated Statement of Operations
For the year ended October 31, 2016
| | | | |
Investment income: | |
Interest | | $ | 9,860,546 | |
Dividends from affiliated money market funds | | | 7,825,351 | |
Total investment income | | | 17,685,897 | |
| |
Expenses: | | | | |
Advisory fees | | | 49,482,652 | |
Administrative services fees | | | 651,528 | |
Custodian fees | | | 7,948 | |
Distribution fees: | | | | |
Class A | | | 4,950,270 | |
Class B | | | 106,088 | |
Class C | | | 13,584,102 | |
Class R | | | 122,481 | |
Transfer agent fees — A, B, C, R and Y | | | 6,550,290 | |
Transfer agent fees — R5 | | | 103,818 | |
Transfer agent fees — R6 | | | 6,415 | |
Trustees’ and officers’ fees and benefits | | | 152,997 | |
Registration and filing fees | | | 249,580 | |
Reports to shareholders | | | 299,196 | |
Professional services fees | | | 53,757 | |
Other | | | 113,794 | |
Total expenses | | | 76,434,916 | |
Less: Fees waived and expense offset arrangement(s) | | | (3,957,896 | ) |
Net expenses | | | 72,477,020 | |
Net investment income (loss) | | | (54,791,123 | ) |
| |
Realized and unrealized gain (loss) from: | | | | |
Net realized gain (loss) from: | | | | |
Investment securities | | | 63,834,042 | |
Foreign currencies | | | (4,478,068 | ) |
Futures contracts | | | 486,277,803 | |
Swap agreements | | | 46,169,644 | |
| | | | 591,803,421 | |
Change in net unrealized appreciation (depreciation) of: | | | | |
Investment securities | | | (3,854,875 | ) |
Futures contracts | | | (207,858,080 | ) |
Swap agreements | | | 22,985,298 | |
| | | | (188,727,657 | ) |
Net realized and unrealized gain | | | 403,075,764 | |
Net increase in net assets resulting from operations | | $ | 348,284,641 | |
See accompanying Notes to Consolidated Financial Statements which are an integral part of the financial statements.
15 Invesco Balanced-Risk Allocation Fund
Consolidated Statement of Changes in Net Assets
For the years ended October 31, 2016 and 2015
| | | | | | | | |
| | | 2016 | | | 2015 | |
Operations: | |
Net investment income (loss) | | $ | (54,791,123 | ) | | $ | (102,432,841 | ) |
Net realized gain (loss) | | | 591,803,421 | | | | (80,757,544 | ) |
Change in net unrealized appreciation (depreciation) | | | (188,727,657 | ) | | | 42,119,499 | |
Net increase (decrease) in net assets resulting from operations | | | 348,284,641 | | | | (141,070,886 | ) |
| | |
Distributions to shareholders from net investment income: | | | | | | | | |
Class A | | | (57,902,283 | ) | | | (56,654,014 | ) |
Class B | | | (224,978 | ) | | | (243,139 | ) |
Class C | | | (26,864,376 | ) | | | (22,928,504 | ) |
Class R | | | (541,614 | ) | | | (492,454 | ) |
Class Y | | | (65,220,904 | ) | | | (81,503,225 | ) |
Class R5 | | | (4,519,268 | ) | | | (4,180,439 | ) |
Class R6 | | | (12,605,397 | ) | | | (11,328,824 | ) |
Total distributions from net investment income | | | (167,878,820 | ) | | | (177,330,599 | ) |
| | |
Distributions to shareholders from net realized gains: | | | | | | | | |
Class A | | | (83,448,580 | ) | | | (152,016,609 | ) |
Class B | | | (487,027 | ) | | | (1,108,269 | ) |
Class C | | | (58,155,269 | ) | | | (104,512,062 | ) |
Class R | | | (878,445 | ) | | | (1,529,651 | ) |
Class Y | | | (84,286,403 | ) | | | (191,523,927 | ) |
Class R5 | | | (5,762,170 | ) | | | (9,729,719 | ) |
Class R6 | | | (15,388,645 | ) | | | (25,148,843 | ) |
Total distributions from net realized gains | | | (248,406,539 | ) | | | (485,569,080 | ) |
| | |
Share transactions–net: | | | | | | | | |
Class A | | | (494,455,959 | ) | | | (315,179,338 | ) |
Class B | | | (4,653,827 | ) | | | (5,990,731 | ) |
Class C | | | (302,047,491 | ) | | | (176,875,307 | ) |
Class R | | | 1,391,792 | | | | 83,322 | |
Class Y | | | (804,827,082 | ) | | | (777,963,492 | ) |
Class R5 | | | (13,958,529 | ) | | | (12,008,689 | ) |
Class R6 | | | (120,976,238 | ) | | | (20,668,805 | ) |
Net increase (decrease) in net assets resulting from share transactions | | | (1,739,527,334 | ) | | | (1,308,603,040 | ) |
Net increase (decrease) in net assets | | | (1,807,528,052 | ) | | | (2,112,573,605 | ) |
| | |
Net assets: | | | | | | | | |
Beginning of year | | | 7,173,027,394 | | | | 9,285,600,999 | |
End of year (includes undistributed net investment income (loss) of $179,178,674 and $183,388,056, respectively) | | $ | 5,365,499,342 | | | $ | 7,173,027,394 | |
Notes to Consolidated Financial Statements
October 31, 2016
NOTE 1—Significant Accounting Policies
Invesco Balanced-Risk Allocation Fund (the “Fund”) is a series portfolio of AIM Investment Funds (Invesco Investment Funds) (the “Trust”). The Trust is organized as a Delaware statutory trust and is registered under the Investment Company Act of 1940, as amended (the “1940 Act”), as an open-end series management investment company consisting of twenty-two separate series portfolios, each authorized to issue an unlimited number of shares of beneficial interest. The assets, liabilities and operations of each portfolio are accounted for separately. Information presented in these consolidated financial statements pertains only to the Fund. Matters affecting each portfolio or class will be voted on exclusively by the shareholders of such portfolio or class.
16 Invesco Balanced-Risk Allocation Fund
The Fund will seek to gain exposure to the commodity markets primarily through investments in the Invesco Cayman Commodity Fund I Ltd. (the “Subsidiary”), a wholly-owned subsidiary of the Fund organized under the laws of the Cayman Islands. The Subsidiary was organized by the Fund to invest in commodity-linked derivatives and other securities that may provide leveraged and non-leveraged exposure to commodities. The Fund may invest up to 25% of its total assets in the Subsidiary.
The Fund’s investment objective is to provide total return with a low to moderate correlation to traditional financial market indices.
The Fund currently consists of seven different classes of shares: Class A, Class B, Class C, Class R, Class Y, Class R5 and Class R6. Class Y shares are available only to certain investors. Class A shares are sold with a front-end sales charge unless certain waiver criteria are met and under certain circumstances load waived shares may be subject to contingent deferred sales charges (“CDSC”). Class C shares are sold with a CDSC. Class R, Class Y, Class R5 and Class R6 shares are sold at net asset value. Effective November 30, 2010, new or additional investments in Class B shares are no longer permitted. Existing shareholders of Class B shares may continue to reinvest dividends and capital gains distributions in Class B shares until they convert to Class A shares. Also, shareholders in Class B shares will be able to exchange those shares for Class B shares of other Invesco Funds offering such shares until they convert to Class A shares. Generally, Class B shares will automatically convert to Class A shares on or about the month-end, which is at least eight years after the date of purchase. Redemption of Class B shares prior to the conversion date will be subject to a CDSC.
The following is a summary of the significant accounting policies followed by the Fund in the preparation of its consolidated financial statements.
| A. | Security Valuations — Securities, including restricted securities, are valued according to the following policy. |
Debt obligations (including convertible securities) and unlisted equities are fair valued using an evaluated quote provided by an independent pricing service. Evaluated quotes provided by the pricing service may be determined without exclusive reliance on quoted prices, and may reflect appropriate factors such as institution-size trading in similar groups of securities, developments related to specific securities, dividend rate (for unlisted equities), yield (for debt obligations), quality, type of issue, coupon rate (for debt obligations), maturity (for debt obligations), individual trading characteristics and other market data. Debt obligations are subject to interest rate and credit risks. In addition, all debt obligations involve some risk of default with respect to interest and/or principal payments.
A security listed or traded on an exchange (except convertible securities) is valued at its last sales price or official closing price as of the close of the customary trading session on the exchange where the security is principally traded, or lacking any sales or official closing price on a particular day, the security may be valued at the closing bid price on that day. Securities traded in the over-the-counter market are valued based on prices furnished by independent pricing services or market makers. When such securities are valued by an independent pricing service they may be considered fair valued. Futures contracts are valued at the final settlement price set by an exchange on which they are principally traded. Listed options are valued at the mean between the last bid and asked prices from the exchange on which they are principally traded. Options not listed on an exchange are valued by an independent source at the mean between the last bid and asked prices. For purposes of determining net asset value (“NAV”) per share, futures and option contracts generally are valued 15 minutes after the close of the customary trading session of the New York Stock Exchange (“NYSE”).
Investments in open-end and closed-end registered investment companies that do not trade on an exchange are valued at the end-of-day net asset value per share. Investments in open-end and closed-end registered investment companies that trade on an exchange are valued at the last sales price or official closing price as of the close of the customary trading session on the exchange where the security is principally traded.
Swap agreements are fair valued using an evaluated quote, if available, provided by an independent pricing service. Evaluated quotes provided by the pricing service are valued based on a model which may include end-of-day net present values, spreads, ratings, industry, company performance and returns of referenced assets.
Foreign securities’ (including foreign exchange contracts) prices are converted into U.S. dollar amounts using the applicable exchange rates as of the close of the NYSE. If market quotations are available and reliable for foreign exchange-traded equity securities, the securities will be valued at the market quotations. Because trading hours for certain foreign securities end before the close of the NYSE, closing market quotations may become unreliable. If between the time trading ends on a particular security and the close of the customary trading session on the NYSE, events occur that the Adviser determines are significant and make the closing price unreliable, the Fund may fair value the security. If the event is likely to have affected the closing price of the security, the security will be valued at fair value in good faith using procedures approved by the Board of Trustees. Adjustments to closing prices to reflect fair value may also be based on a screening process of an independent pricing service to indicate the degree of certainty, based on historical data, that the closing price in the principal market where a foreign security trades is not the current value as of the close of the NYSE. Foreign securities’ prices meeting the approved degree of certainty that the price is not reflective of current value will be priced at the indication of fair value from the independent pricing service. Multiple factors may be considered by the independent pricing service in determining adjustments to reflect fair value and may include information relating to sector indices, American Depositary Receipts and domestic and foreign index futures. Foreign securities may have additional risks including exchange rate changes, potential for sharply devalued currencies and high inflation, political and economic upheaval, the relative lack of issuer information, relatively low market liquidity and the potential lack of strict financial and accounting controls and standards.
Securities for which market prices are not provided by any of the above methods may be valued based upon quotes furnished by independent sources. The last bid price may be used to value equity securities. The mean between the last bid and asked prices is used to value debt obligations, including corporate loans.
Securities for which market quotations are not readily available or became unreliable are valued at fair value as determined in good faith by or under the supervision of the Trust’s officers following procedures approved by the Board of Trustees. Issuer specific events, market trends, bid/asked quotes of brokers and information providers and other market data may be reviewed in the course of making a good faith determination of a security’s fair value.
The Fund may invest in securities that are subject to interest rate risk, meaning the risk that the prices will generally fall as interest rates rise and, conversely, the prices will generally rise as interest rates fall. Specific securities differ in their sensitivity to changes in interest rates depending on their individual characteristics. Changes in interest rates may result in increased market volatility, which may affect the value and/or liquidity of certain Fund investments.
Valuations change in response to many factors including the historical and prospective earnings of the issuer, the value of the issuer’s assets, general economic conditions, interest rates, investor perceptions and market liquidity. Because of the inherent uncertainties of valuation, the values reflected in the consolidated financial statements may materially differ from the value received upon actual sale of those investments.
17 Invesco Balanced-Risk Allocation Fund
| B. | Securities Transactions and Investment Income — Securities transactions are accounted for on a trade date basis. Realized gains or losses on sales are computed on the basis of specific identification of the securities sold. Interest income (net of withholding tax, if any) is recorded on the accrual basis from settlement date. Dividend income (net of withholding tax, if any) is recorded on the ex-dividend date. Bond premiums and discounts are amortized and/or accreted for financial reporting purposes. |
The Fund may periodically participate in litigation related to Fund investments. As such, the Fund may receive proceeds from litigation settlements. Any proceeds received are included in the Consolidated Statement of Operations as realized gain (loss) for investments no longer held and as unrealized gain (loss) for investments still held.
Brokerage commissions and mark ups are considered transaction costs and are recorded as an increase to the cost basis of securities purchased and/or a reduction of proceeds on a sale of securities. Such transaction costs are included in the determination of net realized and unrealized gain (loss) from investment securities reported in the Consolidated Statement of Operations and the Consolidated Statement of Changes in Net Assets and the net realized and unrealized gains (losses) on securities per share in the Financial Highlights. Transaction costs are included in the calculation of the Fund’s net asset value and, accordingly, they reduce the Fund’s total returns. These transaction costs are not considered operating expenses and are not reflected in net investment income reported in the Consolidated Statement of Operations and the Consolidated Statement of Changes in Net Assets, or the net investment income per share and the ratios of expenses and net investment income reported in the Financial Highlights, nor are they limited by any expense limitation arrangements between the Fund and the investment adviser.
The Fund allocates income and realized and unrealized capital gains and losses to a class based on the relative net assets of each class.
| C. | Country Determination — For the purposes of making investment selection decisions and presentation in the Consolidated Schedule of Investments, the investment adviser may determine the country in which an issuer is located and/or credit risk exposure based on various factors. These factors include the laws of the country under which the issuer is organized, where the issuer maintains a principal office, the country in which the issuer derives 50% or more of its total revenues and the country that has the primary market for the issuer’s securities, as well as other criteria. Among the other criteria that may be evaluated for making this determination are the country in which the issuer maintains 50% or more of its assets, the type of security, financial guarantees and enhancements, the nature of the collateral and the sponsor organization. Country of issuer and/or credit risk exposure has been determined to be the United States of America, unless otherwise noted. |
| D. | Distributions — Distributions from net investment income and net realized capital gain, if any, are generally declared and paid annually and recorded on the ex-dividend date. The Fund may elect to treat a portion of the proceeds from redemptions as distributions for federal income tax purposes. |
| E. | Federal Income Taxes — The Fund intends to comply with the requirements of Subchapter M of the Internal Revenue Code of 1986, as amended (the “Internal Revenue Code”), necessary to qualify as a regulated investment company and to distribute substantially all of the Fund’s taxable earnings to shareholders. As such, the Fund will not be subject to federal income taxes on otherwise taxable income (including net realized capital gain) that is distributed to shareholders. Therefore, no provision for federal income taxes is recorded in the consolidated financial statements. |
The Fund recognizes the tax benefits of uncertain tax positions only when the position is more likely than not to be sustained. Management has analyzed the Fund’s uncertain tax positions and concluded that no liability for unrecognized tax benefits should be recorded related to uncertain tax positions. Management is not aware of any tax positions for which it is reasonably possible that the total amounts of unrecognized tax benefits will change materially in the next 12 months.
The Subsidiary is classified as a controlled foreign corporation under Subchapter N of the Internal Revenue Code. Therefore, the Fund is required to increase its taxable income by its share of the Subsidiary’s income. Net investment losses of the Subsidiary cannot be deducted by the Fund in the current period nor carried forward to offset taxable income in future periods.
The Fund files tax returns in the U.S. Federal jurisdiction and certain other jurisdictions. Generally the Fund is subject to examinations by such taxing authorities for up to three years after the filing of the return for the tax period.
| F. | Expenses — Fees provided for under the Rule 12b-1 plan of a particular class of the Fund are charged to the operations of such class. Transfer agency fees and expenses and other shareholder recordkeeping fees and expenses attributable to Class R5 and Class R6 are allocated to each share class based on relative net assets. Sub-accounting fees attributable to Class R5 are charged to the operations of the class. Transfer agency fees and expenses and other shareholder recordkeeping fees and expenses relating to all other classes are allocated among those classes based on relative net assets. All other expenses are allocated among the classes based on relative net assets. |
| G. | Accounting Estimates — The financial statements are prepared on a consolidated basis in conformity with accounting principles generally accepted in the United States of America (“GAAP”), which requires management to make estimates and assumptions that affect the reported amounts of assets and liabilities at the date of the financial statements and the reported amounts of revenues and expenses during the reporting period including estimates and assumptions related to taxation. Actual results could differ from those estimates by a significant amount. The accompanying financial statements reflect the financial position of the Fund and its Subsidiary and the results of operations on a consolidated basis. All inter-company accounts and transactions have been eliminated in consolidation. |
In addition, the Fund monitors for material events or transactions that may occur or become known after the period-end date and before the date the consolidated financial statements are released to print.
| H. | Indemnifications — Under the Trust’s organizational documents, each Trustee, officer, employee or other agent of the Trust, and under the Subsidiary’s organizational documents, the directors and officers of the Subsidiary, are indemnified against certain liabilities that may arise out of the performance of their duties to the Fund and/or the Subsidiary, respectively. Additionally, in the normal course of business, the Fund enters into contracts, including the Fund’s servicing agreements, that contain a variety of indemnification clauses. The Fund’s maximum exposure under these arrangements is unknown as this would involve future claims that may be made against the Fund that have not yet occurred. The risk of material loss as a result of such indemnification claims is considered remote. |
| I. | Structured Securities — The Fund may invest in structured securities. Structured securities are a type of derivative security whose value is determined by reference to changes in the value of underlying securities, currencies, interest rates, commodities, indices or other financial indicators (“reference instruments”). Most structured securities are fixed-income securities that have maturities of three years or less. Structured securities may be positively or negatively indexed (i.e., their principal value or interest rates may increase or decrease if the underlying reference instrument appreciates) and may have return characteristics similar to direct investments in the underlying reference instrument. |
18 Invesco Balanced-Risk Allocation Fund
Structured securities may entail a greater degree of market risk than other types of debt securities because the investor bears the risk of the reference instruments. In addition to the credit risk of structured securities and the normal risks of price changes in response to changes in interest rates, the principal amount of structured notes or indexed securities may decrease as a result of changes in the value of the underlying reference instruments. Changes in the daily value of structured securities are recorded as unrealized gains (losses) in the Consolidated Statement of Operations. When the structured securities mature or are sold, the Fund recognizes a realized gain (loss) on the Consolidated Statement of Operations.
| J. | Foreign Currency Translations — Foreign currency is valued at the close of the NYSE based on quotations posted by banks and major currency dealers. Portfolio securities and other assets and liabilities denominated in foreign currencies are translated into U.S. dollar amounts at date of valuation. Purchases and sales of portfolio securities (net of foreign taxes withheld on disposition) and income items denominated in foreign currencies are translated into U.S. dollar amounts on the respective dates of such transactions. The Fund does not separately account for the portion of the results of operations resulting from changes in foreign exchange rates on investments and the fluctuations arising from changes in market prices of securities held. The combined results of changes in foreign exchange rates and the fluctuation of market prices on investments (net of estimated foreign tax withholding) are included with the net realized and unrealized gain or loss from investments in the Consolidated Statement of Operations. Reported net realized foreign currency gains or losses arise from (1) sales of foreign currencies, (2) currency gains or losses realized between the trade and settlement dates on securities transactions, and (3) the difference between the amounts of dividends, interest, and foreign withholding taxes recorded on the Fund’s books and the U.S. dollar equivalent of the amounts actually received or paid. Net unrealized foreign currency gains and losses arise from changes in the fair values of assets and liabilities, other than investments in securities at fiscal period end, resulting from changes in exchange rates. |
The Fund may invest in foreign securities, which may be subject to foreign taxes on income, gains on investments or currency repatriation, a portion of which may be recoverable. Foreign taxes, if any, are recorded based on the tax regulations and rates that exist in the foreign markets in which the Fund invests and are shown in the Consolidated Statement of Operations.
| K. | Forward Foreign Currency Contracts — The Fund may engage in foreign currency transactions either on a spot (i.e. for prompt delivery and settlement) basis, or through forward foreign currency contracts, to manage or minimize currency or exchange rate risk. |
The Fund may also enter into forward foreign currency contracts for the purchase or sale of a security denominated in a foreign currency in order to “lock in” the U.S. dollar price of that security, or the Fund may also enter into forward foreign currency contracts that do not provide for physical settlement of the two currencies, but instead are settled by a single cash payment calculated as the difference between the agreed upon exchange rate and the spot rate at settlement based upon an agreed upon notional amount (non-deliverable forwards). The Fund will set aside liquid assets in an amount equal to the daily mark-to-market obligation for forward foreign currency contracts.
A forward foreign currency contract is an obligation between two parties (“Counterparties”) to purchase or sell a specific currency for an agreed-upon price at a future date. The use of forward foreign currency contracts does not eliminate fluctuations in the price of the underlying securities the Fund owns or intends to acquire but establishes a rate of exchange in advance. Fluctuations in the value of these contracts are measured by the difference in the contract date and reporting date exchange rates and are recorded as unrealized appreciation (depreciation) until the contracts are closed. When the contracts are closed, realized gains (losses) are recorded. Realized and unrealized gains (losses) on the contracts are included in the Statement of Operations. The primary risks associated with forward foreign currency contracts include failure of the Counterparty to meet the terms of the contract and the value of the foreign currency changing unfavorably. These risks may be in excess of the amounts reflected in the Statement of Assets and Liabilities.
| L. | Futures Contracts — The Fund may enter into futures contracts to manage exposure to interest rate, equity and market price movements and/or currency risks. A futures contract is an agreement between two parties (“Counterparties”) to purchase or sell a specified underlying security, currency or commodity (or delivery of a cash settlement price, in the case of an index future) for a fixed price at a future date. The Fund currently invests only in exchange-traded futures and they are standardized as to maturity date and underlying financial instrument. Initial margin deposits required upon entering into futures contracts are satisfied by the segregation of specific securities or cash as collateral at the futures commission merchant (broker). During the period the futures contracts are open, changes in the value of the contracts are recognized as unrealized gains or losses by recalculating the value of the contracts on a daily basis. Subsequent or variation margin payments are received or made depending upon whether unrealized gains or losses are incurred. These amounts are reflected as receivables or payables on the Consolidated Statement of Assets and Liabilities. When the contracts are closed or expire, the Fund recognizes a realized gain or loss equal to the difference between the proceeds from, or cost of, the closing transaction and the Fund’s basis in the contract. The net realized gain (loss) and the change in unrealized gain (loss) on futures contracts held during the period is included on the Consolidated Statement of Operations. The primary risks associated with futures contracts are market risk and the absence of a liquid secondary market. If the Fund were unable to liquidate a futures contract and/or enter into an offsetting closing transaction, the Fund would continue to be subject to market risk with respect to the value of the contracts and continue to be required to maintain the margin deposits on the futures contracts. Futures contracts have minimal Counterparty risk since the exchange’s clearinghouse, as Counterparty to all exchange-traded futures, guarantees the futures against default. Risks may exceed amounts recognized in the Consolidated Statement of Assets and Liabilities. |
| M. | Swap Agreements — The Fund may enter into various swap transactions, including interest rate, total return, index, currency and credit default swap contracts (“CDS”) for investment purposes or to manage interest rate, currency or credit risk. Such transactions are agreements between Counterparties. These agreements may contain among other conditions, events of default and termination events, and various covenants and representations such as provisions that require the Fund to maintain a pre-determined level of net assets, and/or provide limits regarding the decline of the Fund’s NAV over specific periods of time. If the Fund were to trigger such provisions and have open derivative positions at that time, the Counterparty may be able to terminate such agreement and request immediate payment in an amount equal to the net liability positions, if any. |
Interest rate, total return, index, and currency swap agreements are two-party contracts entered into primarily to exchange the returns (or differentials in rates of returns) earned or realized on particular predetermined investments or instruments. The gross returns to be exchanged or “swapped” between the parties are calculated with respect to a notional amount, i.e., the return on or increase in value of a particular dollar amount invested at a particular interest rate or return of an underlying asset, in a particular foreign currency, or in a “basket” of securities representing a particular index. At the maturity date, a net cash flow is exchanged where the total return is equivalent to the return of the underlying reference less a financing rate, if any. As a receiver, the Fund would receive payments based on any positive total return and would
19 Invesco Balanced-Risk Allocation Fund
owe payments in the event of a negative total return. As the payer, the Fund would owe payments on any net positive total return, and would receive payment in the event of a negative total return.
Changes in the value of swap agreements are recognized as unrealized gains (losses) in the Consolidated Statement of Operations by “marking to market” on a daily basis to reflect the value of the swap agreement at the end of each trading day. Payments received or paid at the beginning of the agreement are reflected as such on the Consolidated Statement of Assets and Liabilities and may be referred to as upfront payments. The Fund accrues for the fixed payment stream and amortizes upfront payments, if any, on swap agreements on a daily basis with the net amount, recorded as a component of realized gain (loss) on the Consolidated Statement of Operations. A liquidation payment received or made at the termination of a swap agreement is recorded as realized gain (loss) on the Consolidated Statement of Operations. The Fund segregates cash or liquid securities having a value at least equal to the amount of the potential obligation of a Fund under any swap transaction. Cash held as collateral is recorded as deposits with brokers on the Consolidated Statement of Assets and Liabilities. Entering into these agreements involves, to varying degrees, lack of liquidity and elements of credit, market, and Counterparty risk in excess of amounts recognized on the Consolidated Statement of Assets and Liabilities. Such risks involve the possibility that a swap is difficult to sell or liquidate; the Counterparty does not honor its obligations under the agreement and unfavorable interest rates and market fluctuations. It is possible that developments in the swaps market, including potential government regulation, could adversely affect the Fund’s ability to terminate existing swap agreements or to realize amounts to be received under such agreements. A short position in a security poses more risk than holding the same security long. As there is no limit on how much the price of the security can increase, the Fund’s exposure is unlimited.
| N. | Other Risks — The Fund will seek to gain exposure to commodity markets primarily through an investment in the Subsidiary and through investments in exchange-traded funds and commodity-linked derivatives. The Subsidiary, unlike the Fund, may invest without limitation in commodities, commodity-linked derivatives and other securities, such as exchange-traded notes, that may provide leveraged and non-leveraged exposure to commodity markets. The Fund is indirectly exposed to the risks associated with the Subsidiary’s investments. |
| O. | Leverage Risk — Leverage exists when the Fund can lose more than it originally invests because it purchases or sells an instrument or enters into a transaction without investing an amount equal to the full economic exposure of the instrument or transaction. |
| P. | Collateral — To the extent the Fund has designated or segregated a security as collateral and that security is subsequently sold, it is the Fund’s practice to replace such collateral no later than the next business day. |
NOTE 2—Advisory Fees and Other Fees Paid to Affiliates
The Trust has entered into a master investment advisory agreement with Invesco Advisers, Inc. (the “Adviser” or “Invesco”). Under the terms of the investment advisory agreement, the Fund pays an advisory fee to the Adviser less the amount paid by the Subsidiary to the Adviser based on the annual rate of the Fund’s average daily net assets as follows:
| | | | | | | | |
| Average Daily Net Assets | | Rate | |
First $250 million | | | 0 | .95% | | | | |
Next $250 million | | | 0 | .925% | | | | |
Next $500 million | | | 0 | .90% | | | | |
Next $1.5 billion | | | 0 | .875% | | | | |
Next $2.5 billion | | | 0 | .85% | | | | |
Next $2.5 billion | | | 0 | .825% | | | | |
Next $2.5 billion | | | 0 | .80% | | | | |
Over $10 billion | | | 0 | .775% | | | | |
For the year ended October 31, 2016, the effective advisory fees incurred by the Fund was 0.87%.
The Subsidiary has entered into a separate contract with the Adviser whereby the Adviser provides investment advisory and other services to the Subsidiary. In consideration of these services, the Subsidiary pays an advisory fee to the Adviser based on the annual rate of the Subsidiary’s average daily net assets as set forth in the table above.
Under the terms of a master sub-advisory agreement between the Adviser and each of Invesco Asset Management Deutschland GmbH, Invesco Asset Management Limited, Invesco Asset Management (Japan) Limited, Invesco Hong Kong Limited, Invesco Senior Secured Management, Inc. and Invesco Canada Ltd. (collectively, the “Affiliated Sub-Advisers”) the Adviser, not the Fund, will pay 40% of the fees paid to the Adviser to any such Affiliated Sub-Adviser(s) that provide(s) discretionary investment management services to the Fund based on the percentage of assets allocated to such Affiliated Sub-Adviser(s).
The Adviser has contractually agreed, through at least June 30, 2017, to waive advisory fees and/or reimburse expenses to the extent necessary to limit total annual fund operating expenses after fee waiver and/or expense reimbursement (excluding certain items discussed below) of Class A, Class B, Class C, Class R, Class Y, Class R5 and Class R6 shares to 2.00%, 2.75%, 2.75%, 2.25%, 1.75%, 1.75% and 1.75%, respectively, of the Fund’s average daily net assets (the “expense limits”). In determining the Adviser’s obligation to waive advisory fees and/or reimburse expenses, the following expenses are not taken into account, and could cause the total annual fund operating expenses after fee waiver and/or expense reimbursement to exceed the numbers reflected above: (1) interest; (2) taxes; (3) dividend expense on short sales; (4) extraordinary or non-routine items, including litigation expenses; and (5) expenses that the Fund has incurred but did not actually pay because of an expense offset arrangement. Acquired Fund Fees and Expenses are not operating expenses of the Fund directly, but are fees and expenses, including management fees of the investment companies in which the Fund invests. As a result, the total annual fund operating expenses after expense reimbursement may exceed the expense limits above. Unless Invesco continues the fee waiver agreement, it will terminate on June 30, 2017. During its term, the fee waiver agreement cannot be terminated or amended to increase the expense limits without approval of the Board of Trustees. The Adviser did not waive fees and/or reimburse expenses during the period under these expense limits.
20 Invesco Balanced-Risk Allocation Fund
Further, the Adviser has contractually agreed, through at least June 30, 2018, to waive the advisory fee payable by the Fund in an amount equal to 100% of the net advisory fees the Adviser receives from the affiliated money market funds on investments by the Fund of uninvested cash in such affiliated money market funds.
For the year ended October 31, 2016, the Adviser waived advisory fees of $3,941,809.
The Trust has entered into a master administrative services agreement with Invesco pursuant to which the Fund has agreed to pay Invesco for certain administrative costs incurred in providing accounting services to the Fund. For the year ended October 31, 2016, expenses incurred under the agreement are shown in the Consolidated Statement of Operations as Administrative services fees.
The Trust has entered into a transfer agency and service agreement with Invesco Investment Services, Inc. (“IIS”) pursuant to which the Fund has agreed to pay IIS a fee for providing transfer agency and shareholder services to the Fund and reimburse IIS for certain expenses incurred by IIS in the course of providing such services. IIS may make payments to intermediaries that provide omnibus account services, sub-accounting services and/or networking services. All fees payable by IIS to intermediaries that provide omnibus account services or sub-accounting are charged back to the Fund, subject to certain limitations approved by the Trust’s Board of Trustees. For the year ended October 31, 2016, expenses incurred under the agreement are shown in the Consolidated Statement of Operations as Transfer agent fees.
The Trust has entered into master distribution agreements with Invesco Distributors, Inc. (“IDI”) to serve as the distributor for the Class A, Class B, Class C, Class R, Class Y, Class R5 and Class R6 shares of the Fund. The Trust has adopted plans pursuant to Rule 12b-1 under the 1940 Act with respect to the Fund’s Class A, Class B, Class C and Class R shares (collectively, the “Plans”). The Fund, pursuant to the Plans, pays IDI compensation at the annual rate of 0.25% of the Fund’s average daily net assets of Class A shares, 1.00% of the average daily net assets of Class B and Class C shares and 0.50% of the average daily net assets of Class R shares. Of the Plan payments, up to 0.25% of the average daily net assets of each class of shares may be paid to furnish continuing personal shareholder services to customers who purchase and own shares of such classes. Any amounts not paid as a service fee under the Plans would constitute an asset-based sales charge. Rules of the Financial Industry Regulatory Authority (“FINRA”) impose a cap on the total sales charges, including asset-based sales charges, that may be paid by any class of shares of the Fund. For the year ended October 31, 2016, expenses incurred under the Plans are shown in the Consolidated Statement of Operations as Distribution fees.
Front-end sales commissions and CDSC (collectively, the “sales charges”) are not recorded as expenses of the Fund. Front-end sales commissions are deducted from proceeds from the sales of Fund shares prior to investment in Class A shares of the Fund. CDSC are deducted from redemption proceeds prior to remittance to the shareholder. During the year ended October 31, 2016, IDI advised the Fund that IDI retained $324,434 in front-end sales commissions from the sale of Class A shares and $47,646, $3,299 and $107,538 from Class A, Class B and Class C shares, respectively, for CDSC imposed on redemptions by shareholders.
Certain officers and trustees of the Trust are officers and directors of the Adviser, IIS and/or IDI.
NOTE 3—Additional Valuation Information
GAAP defines fair value as the price that would be received to sell an asset or paid to transfer a liability in an orderly transaction between market participants at the measurement date, under current market conditions. GAAP establishes a hierarchy that prioritizes the inputs to valuation methods, giving the highest priority to readily available unadjusted quoted prices in an active market for identical assets (Level 1) and the lowest priority to significant unobservable inputs (Level 3), generally when market prices are not readily available or are unreliable. Based on the valuation inputs, the securities or other investments are tiered into one of three levels. Changes in valuation methods may result in transfers in or out of an investment’s assigned level:
| | Level 1 — | Prices are determined using quoted prices in an active market for identical assets. |
| | Level 2 — | Prices are determined using other significant observable inputs. Observable inputs are inputs that other market participants may use in pricing a security. These may include quoted prices for similar securities, interest rates, prepayment speeds, credit risk, yield curves, loss severities, default rates, discount rates, volatilities and others. |
| | Level 3 — | Prices are determined using significant unobservable inputs. In situations where quoted prices or observable inputs are unavailable (for example, when there is little or no market activity for an investment at the end of the period), unobservable inputs may be used. Unobservable inputs reflect the Fund’s own assumptions about the factors market participants would use in determining fair value of the securities or instruments and would be based on the best available information. |
The following is a summary of the tiered valuation input levels, as of October 31, 2016. The level assigned to the securities valuations may not be an indication of the risk or liquidity associated with investing in those securities. Because of the inherent uncertainties of valuation, the values reflected in the financial statements may materially differ from the value received upon actual sale of those investments.
| | | | | | | | | | | | | | | | |
| | | Level 1 | | | Level 2 | | | Level 3 | | | Total | |
U.S. Treasury Securities | | $ | — | | | $ | 2,252,759,378 | | | $ | — | | | $ | 2,252,759,378 | |
Commodity-Linked Securities | | | — | | | | 254,418,400 | | | | — | | | | 254,418,400 | |
Money Market Funds | | | 2,549,294,520 | | | | — | | | | — | | | | 2,549,294,520 | |
| | | $ | 2,549,294,520 | | | $ | 2,507,177,778 | | | $ | — | | | $ | 5,056,472,298 | |
Futures Contracts* | | | (95,099,535 | ) | | | — | | | | — | | | | (95,099,535 | ) |
Swap Agreements* | | | — | | | | 6,741,777 | | | | — | | | | 6,741,777 | |
Total Investments | | $ | 2,454,194,985 | | | $ | 2,513,919,555 | | | $ | — | | | $ | 4,968,114,540 | |
| * | Unrealized appreciation (depreciation). |
21 Invesco Balanced-Risk Allocation Fund
NOTE 4—Derivative Investments
The Fund may enter into an International Swaps and Derivatives Association Master Agreement (“ISDA Master Agreement”) under which a Fund may trade OTC derivatives. An OTC transaction entered into under an ISDA Master Agreement typically involves a collateral posting arrangement, payment netting provisions and close-out netting provisions. These netting provisions allow for reduction of credit risk through netting of contractual obligations. The enforceability of the netting provisions of the ISDA Master Agreement depends on the governing law of the ISDA Master Agreement, among other factors.
For financial reporting purposes, the Fund does not offset OTC derivative assets or liabilities that are subject to ISDA Master Agreements in the Consolidated Statement of Assets and Liabilities.
Value of Derivative Investments at Period-End
The table below summarizes the value of the Fund’s derivative investments, detailed by primary risk exposure, held as of October 31, 2016:
| | | | | | | | | | | | | | | | |
| | | Value | |
| Derivative Assets | | Commodity
Risk | | | Equity
Risk | | | Interest Rate
Risk | | | Total | |
Unrealized appreciation on futures contracts — Exchange-Traded(a) | | $ | — | | | $ | 42,388,682 | | | $ | — | | | $ | 42,388,682 | |
Unrealized appreciation on swap agreements — OTC | | | 11,720,509 | | | | — | | | | — | | | | 11,720,509 | |
Total Derivative Assets | | $ | 11,720,509 | | | $ | 42,388,682 | | | $ | — | | | $ | 54,109,191 | |
Derivatives not subject to master netting agreements | | | — | | | | (42,388,682 | ) | | | — | | | | (42,388,682 | ) |
Total Derivative Assets subject to master netting agreements | | $ | 11,720,509 | | | $ | — | | | $ | — | | | $ | 11,720,509 | |
| | | | | | | | | | | | | | | | |
| | | Value | |
| Derivative Liabilities | | Commodity
Risk | | | Equity
Risk | | | Interest Rate
Risk | | | Total | |
Unrealized depreciation on futures contracts — Exchange-Traded(a) | | $ | (23,758,375 | ) | | $ | (24,554,825 | ) | | $ | (89,175,017 | ) | | $ | (137,488,217 | ) |
Unrealized depreciation on swap agreements — OTC | | | (3,045,954 | ) | | | (1,663,329 | ) | | | (269,449 | ) | | | (4,978,732 | ) |
Total Derivative Liabilities | | $ | (26,804,329 | ) | | $ | (26,218,154 | ) | | $ | (89,444,466 | ) | | $ | (142,466,949 | ) |
Derivatives not subject to master netting agreements | | | 23,758,375 | | | | 24,554,825 | | | | 89,175,017 | | | | 137,488,217 | |
Total Derivative Liabilities subject to master netting agreements | | $ | (3,045,954 | ) | | $ | (1,663,329 | ) | | $ | (269,449 | ) | | $ | (4,978,732 | ) |
| (a) | Includes cumulative appreciation (depreciation) on futures contracts. Only current day’s variation margin receivable (payable) is reported within the Consolidated Statement of Assets and Liabilities. |
Offsetting Assets and Liabilities
The table below reflects the Fund’s exposure to Counterparties subject to either an ISDA Master Agreement or other agreement for OTC derivative transactions as of October 31, 2016.
| | | | | | | | | | | | | | | | | | | | | | | | |
| | | Financial
Derivative
Assets | | | Financial
Derivative
Liabilities | | | Net value of
derivatives | | | Collateral
(Received)/Pledged | | | Net
amount (a) | |
| Counterparty | | Swap
agreements | | | Swap
agreements | | | | Non-Cash | | | Cash | | |
Parent | | | | | | | | | | | | | | | | | | | | | | | | |
Goldman Sachs International | | $ | — | | | $ | (1,663,329 | ) | | $ | (1,663,329 | ) | | $ | — | | | $ | — | | | $ | (1,663,329 | ) |
Macquarie Bank | | | — | | | | (272,297 | ) | | | (272,297 | ) | | | — | | | | 272,297 | | | | — | |
Subtotal — Parent | | | — | | | | (1,935,626 | ) | | | (1,935,626 | ) | | | — | | | | 272,297 | | | | (1,663,329 | ) |
| | | | | | |
| | | | | | | | | | | | | | | | | | | | | | | | |
| Subsidiary | | | | | | | | | | | | | | | | | | |
Barclays Bank PLC | | | 3,388,386 | | | | (30,722 | ) | | | 3,357,664 | | | | — | | | | — | | | | 3,357,664 | |
Canadian Imperial Bank of Commerce | | | 711,480 | | | | (48,557 | ) | | | 662,923 | | | | — | | | | — | | | | 662,923 | |
Cargill, Inc. | | | 2,261,218 | | | | (2,449,569 | ) | | | (188,351 | ) | | | — | | | | — | | | | (188,351 | ) |
Goldman Sachs International | | | 2,217,447 | | | | (48,879 | ) | | | 2,168,568 | | | | — | | | | — | | | | 2,168,568 | |
J.P. Morgan Chase Bank, N.A. | | | 550,898 | | | | (3,028,833 | ) | | | (2,477,935 | ) | | | — | | | | 2,477,935 | | | | — | |
Merrill Lynch International | | | 3,695,752 | | | | (3,189,142 | ) | | | 506,610 | | | | — | | | | — | | | | 506,610 | |
Morgan Stanley Capital Services LLC | | | 4,888,626 | | | | (19,835 | ) | | | 4,868,791 | | | | — | | | | (4,868,791 | ) | | | — | |
Subtotal — Subsidiary | | | 17,713,807 | | | | (8,815,537 | ) | | | 8,898,270 | | | | — | | | | (2,390,856 | ) | | | 6,507,414 | |
Total | | $ | 17,713,807 | | | $ | (10,751,163 | ) | | $ | 6,962,644 | | | $ | — | | | $ | (2,118,559 | ) | | $ | 4,844,085 | |
| (a) | The Fund and the Subsidiary are recognized as separate legal entities and as such are subject to separate netting arrangements with the Counterparty. |
22 Invesco Balanced-Risk Allocation Fund
Effect of Derivative Investments for the year ended October 31, 2016
The table below summarizes the gains (losses) on derivative investments, detailed by primary risk exposure, recognized in earnings during the period:
| | | | | | | | | | | | | | | | |
| | | Location of Gain (Loss) on
Consolidated Statement of Operations | |
| | Commodity
Risk | | | Equity
Risk | | | Interest Rate
Risk | | | Total | |
Realized Gain: | | | | | | | | | | | | | | | | |
Futures contracts | | $ | 49,371,971 | | | $ | 80,879,049 | | | $ | 356,026,783 | | | $ | 486,277,803 | |
Swap agreements | | | 41,225,864 | | | | 4,515,687 | | | | 428,093 | | | | 46,169,644 | |
Change in Net Unrealized Appreciation (Depreciation): | | | | | | | | | | | | | | | | |
Futures contracts | | $ | (29,715,372 | ) | | $ | (76,460,779 | ) | | $ | (101,681,929 | ) | | $ | (207,858,080 | ) |
Swap agreements | | | 24,918,076 | | | | (1,663,329 | ) | | | (269,449 | ) | | | 22,985,298 | |
Total | | $ | 85,800,539 | | | $ | 7,270,628 | | | $ | 254,503,498 | | | $ | 347,574,665 | |
The table below summarizes the average notional value of futures contracts and swap agreements outstanding during the period.
| | | | | | | | |
| | | Futures
Contracts | | | Swap
Agreements | |
Average notional value | | $ | 6,707,336,439 | | | $ | 838,885,693 | |
NOTE 5—Subsidiary Information
The Fund’s Consolidated Schedule of Investments includes the holdings, including any investments in derivatives, of both the Fund and the Subsidiary. The Fund’s Consolidated Statement of Assets and Liabilities, Consolidated Statement of Operations and Consolidated Statement of Changes in Net Assets include the account balances of both the Fund and the Subsidiary and all interfund transactions have been eliminated.
The table below summarizes the financial information of the Subsidiary recognized in the consolidated financial statements referred to above.
| | | | |
| Selected Financial Information | | Invesco Cayman
Commodity Fund I Ltd.
(the “Subsidiary”) | |
Total assets | | $ | 1,144,624,888 | |
Total liabilities | | | (22,225,389 | ) |
Net assets | | | 1,122,399,499 | |
Total investment income | | | 5,218,279 | |
Net investment income (loss) | | | (7,157,970 | ) |
Net realized gain from: | | | | |
Investment securities | | | 63,783,264 | |
Futures contracts | | | 49,371,971 | |
Swap agreements | | | 41,225,864 | |
Change in net unrealized appreciation (depreciation) of: | | | | |
Investment securities | | | (5,314,836 | ) |
Futures contracts | | | (29,715,374 | ) |
Swap agreements | | | 24,918,077 | |
Increase in net assets resulting from operations | | $ | 137,110,996 | |
NOTE 6—Expense Offset Arrangement(s)
The expense offset arrangement is comprised of transfer agency credits which result from balances in demand deposit accounts used by the transfer agent for clearing shareholder transactions. For the year ended October 31, 2016, the Fund received credits from this arrangement, which resulted in the reduction of the Fund’s total expenses of $16,087.
NOTE 7—Trustees’ and Officers’ Fees and Benefits
Trustees’ and Officers’ Fees and Benefits include amounts accrued by the Fund to pay remuneration to certain Trustees and Officers of the Fund. Trustees have the option to defer compensation payable by the Fund, and Trustees’ and Officers’ Fees and Benefits also include amounts accrued by the Fund to fund such deferred compensation amounts. Those Trustees who defer compensation have the option to select various Invesco Funds in which their deferral accounts shall be deemed to be invested. Finally, certain current Trustees were eligible to participate in a retirement plan that provided for benefits to be paid upon retirement to Trustees over a period of time based on the number of years of service. The Fund may have certain former Trustees who also participate in a retirement plan and receive benefits under such plan. Trustees’ and Officers’ Fees and Benefits include amounts accrued by the Fund to fund such retirement benefits. Obligations under the deferred compensation and retirement plans represent unsecured claims against the general assets of the Fund.
23 Invesco Balanced-Risk Allocation Fund
NOTE 8—Cash Balances
The Fund is permitted to temporarily carry a negative or overdrawn balance in its account with State Street Bank and Trust Company, the custodian bank. Such balances, if any at period-end, are shown in the Consolidated Statement of Assets and Liabilities under the payable caption Amount due custodian. To compensate the custodian bank for such overdrafts, the overdrawn Fund may either (1) leave funds as a compensating balance in the account so the custodian bank can be compensated by earning the additional interest; or (2) compensate by paying the custodian bank at a rate agreed upon by the custodian bank and Invesco, not to exceed the contractually agreed upon rate.
NOTE 9—Distributions to Shareholders and Tax Components of Net Assets
Tax Character of Distributions to Shareholders Paid During the Fiscal Years Ended October 31, 2016 and 2015:
| | | | | | | | |
| | | 2016 | | | 2015 | |
Ordinary income | | $ | 304,855,039 | | | $ | 424,395,963 | |
Long-term capital gain | | | 111,430,320 | | | | 238,503,716 | |
Total distributions | | $ | 416,285,359 | | | $ | 662,899,679 | |
Tax Components of Net Assets at Period-End:
| | | | |
| | | 2016 | |
Undistributed ordinary income | | $ | 276,797,250 | |
Undistributed long-term gain | | | 128,434,909 | |
Net unrealized appreciation (depreciation) — investments | | | (9,328,928 | ) |
Net unrealized appreciation (depreciation) — other investments | | | (33,710,007 | ) |
Temporary book/tax differences | | | (681,872 | ) |
Shares of beneficial interest | | | 5,003,987,990 | |
Total net assets | | $ | 5,365,499,342 | |
The difference between book-basis and tax-basis unrealized appreciation (depreciation) is due to differences in the timing of recognition of gains and losses on investments for tax and book purposes. The Fund’s net unrealized appreciation (depreciation) difference is attributable primarily to wash sales.
The temporary book/tax differences are a result of timing differences between book and tax recognition of income and/or expenses. The Fund’s temporary book/tax differences are the result of the trustee deferral of compensation and retirement plan benefits.
Capital loss carryforward is calculated and reported as of a specific date. Results of transactions and other activity after that date may affect the amount of capital loss carryforward actually available for the Fund to utilize. Capital losses generated in years beginning after December 22, 2010 can be carried forward for an unlimited period, whereas previous losses expire in eight tax years. Capital losses with an expiration period may not be used to offset capital gains until all net capital losses without an expiration date have been utilized. Capital loss carryforwards with no expiration date will retain their character as either short-term or long-term capital losses instead of as short-term capital losses as under prior law. The ability to utilize capital loss carryforwards in the future may be limited under the Internal Revenue Code and related regulations based on the results of future transactions.
The Fund does not have a capital loss carryforward as of October 31, 2016.
NOTE 10—Investment Securities
The aggregate amount of investment securities (other than short-term securities, U.S. Treasury obligations and money market funds, if any) purchased and sold by the Fund during the year ended October 31, 2016 was $787,675,050 and $541,935,146, respectively. During the same period, purchases and sales of U.S. Treasury obligations were $1,021,245,969 and $1,789,366,250, respectively. Cost of investments on a tax basis includes the adjustments for financial reporting purposes as of the most recently completed federal income tax reporting period-end.
| | | | |
| Unrealized Appreciation (Depreciation) of Investment Securities on a Tax Basis | |
Aggregate unrealized appreciation of investment securities | | $ | 2,183,431 | |
Aggregate unrealized (depreciation) of investment securities | | | (11,512,359 | ) |
Net unrealized appreciation (depreciation) of investment securities | | $ | (9,328,928 | ) |
Cost of investments for tax purposes is $5,065,801,226.
NOTE 11—Reclassification of Permanent Differences
Primarily as a result of differing book/tax treatment of income and distributions from the Subsidiary, futures contracts, swap agreements and return of capital distributions, on October 31, 2016, undistributed net investment income (loss) was increased by $218,460,561 and undistributed net realized gain was decreased by 218,460,561. This reclassification had no effect on the net assets of the Fund.
24 Invesco Balanced-Risk Allocation Fund
NOTE 12—Share Information
| | | | | | | | | | | | | | | | |
| | | Summary of Share Activity | |
| | | Years ended October 31, | |
| | | 2016(a) | | | 2015 | |
| | | Shares | | | Amount | | | Shares | | | Amount | |
Sold: | | | | | | | | | | | | | | | | |
Class A | | | 22,578,985 | | | $ | 245,970,130 | | | | 43,654,078 | | | $ | 512,090,070 | |
Class B | | | 23,520 | | | | 246,424 | | | | 64,824 | | | | 734,775 | |
Class C | | | 9,157,449 | | | | 95,744,113 | | | | 20,321,786 | | | | 230,708,386 | |
Class R | | | 854,075 | | | | 9,171,029 | | | | 641,261 | | | | 7,394,690 | |
Class Y | | | 45,959,002 | | | | 505,120,404 | | | | 84,612,580 | | | | 1,001,576,661 | |
Class R5 | | | 713,325 | | | | 7,891,295 | | | | 1,701,447 | | | | 20,065,413 | |
Class R6 | | | 1,685,506 | | | | 18,696,169 | | | | 3,580,174 | | | | 42,622,159 | |
| | | | |
Issued as reinvestment of dividends: | | | | | | | | | | | | | | | | |
Class A | | | 12,003,891 | | | | 123,039,883 | | | | 16,242,163 | | | | 186,297,618 | |
Class B | | | 68,184 | | | | 676,382 | | | | 115,320 | | | | 1,281,199 | |
Class C | | | 6,816,812 | | | | 67,622,773 | | | | 10,454,377 | | | | 116,148,130 | |
Class R | | | 117,113 | | | | 1,186,352 | | | | 176,446 | | | | 2,000,904 | |
Class Y | | | 8,632,272 | | | | 89,344,012 | | | | 15,160,636 | | | | 175,560,162 | |
Class R5 | | | 972,969 | | | | 10,070,231 | | | | 1,161,565 | | | | 13,462,539 | |
Class R6 | | | 2,695,857 | | | | 27,902,119 | | | | 3,133,557 | | | | 36,317,925 | |
| | | | |
Automatic conversion of Class B shares to Class A shares: | | | | | | | | | | | | | | | | |
Class A | | | 285,285 | | | | 3,100,212 | | | | 371,264 | | | | 4,348,290 | |
Class B | | | (295,706 | ) | | | (3,100,212 | ) | | | (384,362 | ) | | | (4,348,290 | ) |
| | | | |
Reacquired: | | | | | | | | | | | | | | | | |
Class A | | | (80,825,479 | ) | | | (866,566,184 | ) | | | (87,559,656 | ) | | | (1,017,915,316 | ) |
Class B | | | (238,135 | ) | | | (2,476,421 | ) | | | (325,008 | ) | | | (3,658,415 | ) |
Class C | | | (44,870,865 | ) | | | (465,414,377 | ) | | | (46,655,632 | ) | | | (523,731,823 | ) |
Class R | | | (833,996 | ) | | | (8,965,589 | ) | | | (815,247 | ) | | | (9,312,272 | ) |
Class Y | | | (129,540,888 | ) | | | (1,399,291,498 | ) | | | (167,648,057 | ) | | | (1,955,100,315 | ) |
Class R5 | | | (2,976,458 | ) | | | (31,920,055 | ) | | | (3,887,143 | ) | | | (45,536,641 | ) |
Class R6 | | | (16,039,347 | ) | | | (167,574,526 | ) | | | (8,438,929 | ) | | | (99,608,889 | ) |
Net increase (decrease) in share activity | | | (163,056,629 | ) | | $ | (1,739,527,334 | ) | | | (114,322,556 | ) | | $ | (1,308,603,040 | ) |
| (a) | There are entities that are record owners of more than 5% of the outstanding shares of the Fund and in the aggregate own 35% of the outstanding shares of the Fund. IDI has an agreement with these entities to sell Fund shares. The Fund, Invesco and/or Invesco affiliates may make payments to these entities, which are considered to be related to the Fund, for providing services to the Fund, Invesco and/or Invesco affiliates including but not limited to services such as securities brokerage, distribution, third party record keeping and account servicing. The Fund has no knowledge as to whether all or any portion of the shares owned of record by these entities are also owned beneficially. |
25 Invesco Balanced-Risk Allocation Fund
NOTE 13—Financial Highlights
The following schedule presents financial highlights for a share of the Fund outstanding throughout the periods indicated.
| | | | | | | | | | | | | | | | | | | | | | | | | | | | | | | | | | | | | | | | | | | | | | | | | | | | | | | | |
| | | Net asset
value,
beginning
of period | | | Net
investment
income
(loss)(a) | | | Net gains
(losses)
on securities
(both
realized and
unrealized) | | | Total from
investment
operations | | | Dividends
from net
investment
income | | | Distributions
from net
realized
gains | | | Total
distributions | | | Net asset
value, end
of period | | | Total
return(b) | | | Net assets,
end of period
(000’s omitted) | | | Ratio of
expenses
to average
net assets
with fee waivers
and/or expenses
absorbed | | | Ratio of
expenses
to average net
assets without
fee waivers
and/or expenses
absorbed | | | Ratio of net
investment
income (loss)
to average
net assets | | | Portfolio
turnover(c) | |
Class A | |
Year ended 10/31/16 | | $ | 11.27 | | | $ | (0.10 | ) | | $ | 0.88 | | | $ | 0.78 | | | $ | (0.29 | ) | | $ | (0.42 | ) | | $ | (0.71 | ) | | $ | 11.34 | | | | 7.59 | % | | $ | 1,864,271 | | | | 1.20 | %(d) | | | 1.27 | %(d) | | | (0.89 | )%(d) | | | 96 | % |
Year ended 10/31/15 | | | 12.36 | | | | (0.14 | ) | | | (0.05 | ) | | | (0.19 | ) | | | (0.24 | ) | | | (0.66 | ) | | | (0.90 | ) | | | 11.27 | | | | (1.64 | ) | | | 2,371,657 | | | | 1.21 | | | | 1.26 | | | | (1.16 | ) | | | 10 | |
Year ended 10/31/14 | | | 12.88 | | | | (0.14 | ) | | | 0.53 | | | | 0.39 | | | | — | | | | (0.91 | ) | | | (0.91 | ) | | | 12.36 | | | | 3.52 | | | | 2,938,957 | | | | 1.20 | | | | 1.24 | | | | (1.16 | ) | | | 72 | |
Year ended 10/31/13 | | | 12.88 | | | | (0.14 | ) | | | 0.78 | | | | 0.64 | | | | (0.29 | ) | | | (0.35 | ) | | | (0.64 | ) | | | 12.88 | | | | 5.15 | | | | 4,229,859 | | | | 1.14 | | | | 1.21 | | | | (1.07 | ) | | | 0 | |
Year ended 10/31/12 | | | 12.01 | | | | (0.13 | ) | | | 1.46 | | | | 1.33 | | | | (0.34 | ) | | | (0.12 | ) | | | (0.46 | ) | | | 12.88 | | | | 11.39 | | | | 3,600,577 | | | �� | 1.10 | | | | 1.22 | | | | (1.00 | ) | | | 282 | |
Class B | |
Year ended 10/31/16 | | | 10.85 | | | | (0.17 | ) | | | 0.83 | | | | 0.66 | | | | (0.19 | ) | | | (0.42 | ) | | | (0.61 | ) | | | 10.90 | | | | 6.67 | | | | 8,491 | | | | 1.95 | (d) | | | 2.02 | (d) | | | (1.64 | )(d) | | | 96 | |
Year ended 10/31/15 | | | 11.92 | | | | (0.22 | ) | | | (0.05 | ) | | | (0.27 | ) | | | (0.14 | ) | | | (0.66 | ) | | | (0.80 | ) | | | 10.85 | | | | (2.40 | ) | | | 13,242 | | | | 1.96 | | | | 2.01 | | | | (1.91 | ) | | | 10 | |
Year ended 10/31/14 | | | 12.53 | | | | (0.23 | ) | | | 0.53 | | | | 0.30 | | | | — | | | | (0.91 | ) | | | (0.91 | ) | | | 11.92 | | | | 2.85 | | | | 20,853 | | | | 1.95 | | | | 1.99 | | | | (1.91 | ) | | | 72 | |
Year ended 10/31/13 | | | 12.59 | | | | (0.22 | ) | | | 0.75 | | | | 0.53 | | | | (0.24 | ) | | | (0.35 | ) | | | (0.59 | ) | | | 12.53 | | | | 4.34 | | | | 31,381 | | | | 1.89 | | | | 1.96 | | | | (1.82 | ) | | | 0 | |
Year ended 10/31/12 | | | 11.81 | | | | (0.21 | ) | | | 1.42 | | | | 1.21 | | | | (0.31 | ) | | | (0.12 | ) | | | (0.43 | ) | | | 12.59 | | | | 10.52 | | | | 32,246 | | | | 1.85 | | | | 1.97 | | | | (1.75 | ) | | | 282 | |
Class C | |
Year ended 10/31/16 | | | 10.85 | | | | (0.17 | ) | | | 0.83 | | | | 0.66 | | | | (0.19 | ) | | | (0.42 | ) | | | (0.61 | ) | | | 10.90 | | | | 6.67 | | | | 1,278,218 | | | | 1.95 | (d) | | | 2.02 | (d) | | | (1.64 | )(d) | | | 96 | |
Year ended 10/31/15 | | | 11.91 | | | | (0.22 | ) | | | (0.04 | ) | | | (0.26 | ) | | | (0.14 | ) | | | (0.66 | ) | | | (0.80 | ) | | | 10.85 | | | | (2.32 | ) | | | 1,584,982 | | | | 1.96 | | | | 2.01 | | | | (1.91 | ) | | | 10 | |
Year ended 10/31/14 | | | 12.53 | | | | (0.23 | ) | | | 0.52 | | | | 0.29 | | | | — | | | | (0.91 | ) | | | (0.91 | ) | | | 11.91 | | | | 2.77 | | | | 1,930,318 | | | | 1.95 | | | | 1.99 | | | | (1.91 | ) | | | 72 | |
Year ended 10/31/13 | | | 12.59 | | | | (0.22 | ) | | | 0.75 | | | | 0.53 | | | | (0.24 | ) | | | (0.35 | ) | | | (0.59 | ) | | | 12.53 | | | | 4.34 | | | | 2,550,094 | | | | 1.89 | | | | 1.96 | | | | (1.82 | ) | | | 0 | |
Year ended 10/31/12 | | | 11.80 | | | | (0.21 | ) | | | 1.43 | | | | 1.22 | | | | (0.31 | ) | | | (0.12 | ) | | | (0.43 | ) | | | 12.59 | | | | 10.61 | | | | 1,898,066 | | | | 1.85 | | | | 1.97 | | | | (1.75 | ) | | | 282 | |
Class R | |
Year ended 10/31/16 | | | 11.12 | | | | (0.12 | ) | | | 0.86 | | | | 0.74 | | | | (0.26 | ) | | | (0.42 | ) | | | (0.68 | ) | | | 11.18 | | | | 7.26 | | | | 27,359 | | | | 1.45 | (d) | | | 1.52 | (d) | | | (1.14 | )(d) | | | 96 | |
Year ended 10/31/15 | | | 12.20 | | | | (0.16 | ) | | | (0.05 | ) | | | (0.21 | ) | | | (0.21 | ) | | | (0.66 | ) | | | (0.87 | ) | | | 11.12 | | | | (1.86 | ) | | | 25,690 | | | | 1.46 | | | | 1.51 | | | | (1.41 | ) | | | 10 | |
Year ended 10/31/14 | | | 12.75 | | | | (0.17 | ) | | | 0.53 | | | | 0.36 | | | | — | | | | (0.91 | ) | | | (0.91 | ) | | | 12.20 | | | | 3.30 | | | | 28,166 | | | | 1.45 | | | | 1.49 | | | | (1.41 | ) | | | 72 | |
Year ended 10/31/13 | | | 12.77 | | | | (0.17 | ) | | | 0.77 | | | | 0.60 | | | | (0.27 | ) | | | (0.35 | ) | | | (0.62 | ) | | | 12.75 | | | | 4.89 | | | | 29,964 | | | | 1.39 | | | | 1.46 | | | | (1.32 | ) | | | 0 | |
Year ended 10/31/12 | | | 11.93 | | | | (0.15 | ) | | | 1.44 | | | | 1.29 | | | | (0.33 | ) | | | (0.12 | ) | | | (0.45 | ) | | | 12.77 | | | | 11.12 | | | | 15,605 | | | | 1.35 | | | | 1.47 | | | | (1.25 | ) | | | 282 | |
Class Y | |
Year ended 10/31/16 | | | 11.41 | | | | (0.07 | ) | | | 0.87 | | | | 0.80 | | | | (0.32 | ) | | | (0.42 | ) | | | (0.74 | ) | | | 11.47 | | | | 7.75 | | | | 1,755,257 | | | | 0.95 | (d) | | | 1.02 | (d) | | | (0.64 | )(d) | | | 96 | |
Year ended 10/31/15 | | | 12.51 | | | | (0.11 | ) | | | (0.05 | ) | | | (0.16 | ) | | | (0.28 | ) | | | (0.66 | ) | | | (0.94 | ) | | | 11.41 | | | | (1.40 | ) | | | 2,600,015 | | | | 0.96 | | | | 1.01 | | | | (0.91 | ) | | | 10 | |
Year ended 10/31/14 | | | 12.99 | | | | (0.11 | ) | | | 0.54 | | | | 0.43 | | | | — | | | | (0.91 | ) | | | (0.91 | ) | | | 12.51 | | | | 3.81 | | | | 3,699,738 | | | | 0.95 | | | | 0.99 | | | | (0.91 | ) | | | 72 | |
Year ended 10/31/13 | | | 12.97 | | | | (0.10 | ) | | | 0.78 | | | | 0.68 | | | | (0.31 | ) | | | (0.35 | ) | | | (0.66 | ) | | | 12.99 | | | | 5.42 | | | | 4,846,950 | | | | 0.89 | | | | 0.96 | | | | (0.82 | ) | | | 0 | |
Year ended 10/31/12 | | | 12.07 | | | | (0.10 | ) | | | 1.47 | | | | 1.37 | | | | (0.35 | ) | | | (0.12 | ) | | | (0.47 | ) | | | 12.97 | | | | 11.69 | | | | 3,901,165 | | | | 0.85 | | | | 0.97 | | | | (0.75 | ) | | | 282 | |
Class R5 | |
Year ended 10/31/16 | | | 11.41 | | | | (0.06 | ) | | | 0.88 | | | | 0.82 | | | | (0.33 | ) | | | (0.42 | ) | | | (0.75 | ) | | | 11.48 | | | | 7.88 | | | | 144,960 | | | | 0.89 | (d) | | | 0.96 | (d) | | | (0.58 | )(d) | | | 96 | |
Year ended 10/31/15 | | | 12.51 | | | | (0.10 | ) | | | (0.06 | ) | | | (0.16 | ) | | | (0.28 | ) | | | (0.66 | ) | | | (0.94 | ) | | | 11.41 | | | | (1.39 | ) | | | 158,826 | | | | 0.93 | | | | 0.98 | | | | (0.88 | ) | | | 10 | |
Year ended 10/31/14 | | | 12.99 | | | | (0.11 | ) | | | 0.54 | | | | 0.43 | | | | — | | | | (0.91 | ) | | | (0.91 | ) | | | 12.51 | | | | 3.81 | | | | 186,943 | | | | 0.93 | | | | 0.97 | | | | (0.89 | ) | | | 72 | |
Year ended 10/31/13 | | | 12.97 | | | | (0.10 | ) | | | 0.78 | | | | 0.68 | | | | (0.31 | ) | | | (0.35 | ) | | | (0.66 | ) | | | 12.99 | | | | 5.45 | | | | 206,573 | | | | 0.86 | | | | 0.93 | | | | (0.79 | ) | | | 0 | |
Year ended 10/31/12 | | | 12.07 | | | | (0.08 | ) | | | 1.45 | | | | 1.37 | | | | (0.35 | ) | | | (0.12 | ) | | | (0.47 | ) | | | 12.97 | | | | 11.69 | | | | 164,371 | | | | 0.79 | | | | 0.90 | | | | (0.69 | ) | | | 282 | |
Class R6 | |
Year ended 10/31/16 | | | 11.43 | | | | (0.06 | ) | | | 0.88 | | | | 0.82 | | | | (0.34 | ) | | | (0.42 | ) | | | (0.76 | ) | | | 11.49 | | | | 7.93 | | | | 286,944 | | | | 0.82 | (d) | | | 0.89 | (d) | | | (0.51 | )(d) | | | 96 | |
Year ended 10/31/15 | | | 12.53 | | | | (0.09 | ) | | | (0.05 | ) | | | (0.14 | ) | | | (0.30 | ) | | | (0.66 | ) | | | (0.96 | ) | | | 11.43 | | | | (1.27 | ) | | | 418,615 | | | | 0.83 | | | | 0.88 | | | | (0.78 | ) | | | 10 | |
Year ended 10/31/14 | | | 12.99 | | | | (0.10 | ) | | | 0.55 | | | | 0.45 | | | | — | | | | (0.91 | ) | | | (0.91 | ) | | | 12.53 | | | | 3.97 | | | | 480,626 | | | | 0.83 | | | | 0.87 | | | | (0.79 | ) | | | 72 | |
Year ended 10/31/13 | | | 12.97 | | | | (0.09 | ) | | | 0.77 | | | | 0.68 | | | | (0.31 | ) | | | (0.35 | ) | | | (0.66 | ) | | | 12.99 | | | | 5.48 | | | | 521,099 | | | | 0.79 | | | | 0.86 | | | | (0.72 | ) | | | 0 | |
Year ended 10/31/12(e) | | | 13.13 | | | | (0.01 | ) | | | (0.15 | ) | | | (0.16 | ) | | | — | | | | — | | | | — | | | | 12.97 | | | | (3.14 | ) | | | 554,557 | | | | 0.76 | (f) | | | 0.85 | (f) | | | (0.66 | )(f) | | | 282 | |
| (a) | Calculated using average shares outstanding. |
| (b) | Includes adjustments in accordance with accounting principles generally accepted in the United States of America and as such, the net asset value for financial reporting purposes and the returns based upon those net asset values may differ from the net asset value and returns for shareholder transactions. Does not include sales charges and is not annualized for periods less than one year, if applicable. |
| (c) | Portfolio turnover is calculated at the fund level and is not annualized for periods less than one year, if applicable. |
| (d) | Ratios are based on average daily net assets (000’s omitted) of $1,980,108, $10,609, $1,358,410, $24,496, $1,874,274, $146,260 and $323,437 for Class A, Class B, Class C, Class R, Class Y, Class R5 and Class R6 shares, respectively. |
| (e) | Commencement date of September 24, 2012. |
26 Invesco Balanced-Risk Allocation Fund
Report of Independent Registered Public Accounting Firm
To the Board of Trustees
and Shareholders of the Invesco Balanced-Risk Allocation Fund:
In our opinion, the accompanying consolidated statement of assets and liabilities, including the consolidated schedule of investments, and the related consolidated statements of operations and of changes in net assets and the financial highlights present fairly, in all material respects, the consolidated financial position of the Invesco Balanced-Risk Allocation Fund and its subsidiary (the “Fund”) as of October 31, 2016, the results of their operations for the year then ended, the changes in their net assets for each of the two years in the period then ended and the financial highlights for each of the five years in the period then ended, in conformity with accounting principles generally accepted in the United States of America. These consolidated financial statements and financial highlights (hereafter referred to as “financial statements”) are the responsibility of the Fund’s management. Our responsibility is to express an opinion on these financial statements based on our audits. We conducted our audits of these financial statements in accordance with the standards of the Public Company Accounting Oversight Board (United States). Those standards require that we plan and perform the audit to obtain reasonable assurance about whether the financial statements are free of material misstatement. An audit includes examining, on a test basis, evidence supporting the amounts and disclosures in the financial statements, assessing the accounting principles used and significant estimates made by management, and evaluating the overall financial statement presentation. We believe that our audits, which included confirmation of securities as of October 31, 2016 by correspondence with the custodian and brokers, provide a reasonable basis for our opinion.
PRICEWATERHOUSECOOPERS LLP
Houston, Texas
December 21, 2016
27 Invesco Balanced-Risk Allocation Fund
Calculating your ongoing Fund expenses
Example
As a shareholder of the Fund, you incur two types of costs: (1) transaction costs, which may include sales charges (loads) on purchase payments or contingent deferred sales charges on redemptions, if any; and (2) ongoing costs, including distribution and/or service (12b-1) fees, and other Fund expenses. This example is intended to help you understand your ongoing costs (in dollars) of investing in the Fund and to compare these costs with ongoing costs of investing in other mutual funds. The example is based on an investment of $1,000 invested at the beginning of the period and held for the entire period May 1, 2016, through October 31, 2016.
In addition to the fees and expenses which the Fund bears directly, the Fund indirectly bears a pro rata share of the fees and expenses of the underlying funds in which the Fund invests. The amount of fees and expenses incurred indirectly by the Fund will vary because the underlying funds have varied expenses and fee levels and the Fund may own different proportions of the underlying funds at different times. Estimated underlying fund expenses are not expenses that are incurred directly by the Fund. They are expenses that are incurred directly by the underlying funds and are deducted from the value of the underlying funds the Fund invests in. The effect of the estimated underlying fund expenses that the Fund bears indirectly are included in the Fund’s total return.
Actual expenses
The table below provides information about actual account values and actual expenses. You may use the information in this table, together with the amount you invested, to estimate the expenses that you paid over the period. Simply divide your account value by $1,000 (for example, an $8,600 account value divided by $1,000 = 8.6), then multiply the result by the number in the table under the heading entitled “Actual Expenses Paid During Period” to estimate the expenses you paid on your account during this period.
Hypothetical example for comparison purposes
The table below also provides information about hypothetical account values and hypothetical expenses based on the Fund’s actual expense ratio and an assumed rate of return of 5% per year before expenses, which is not the Fund’s actual return.
The hypothetical account values and expenses may not be used to estimate the actual ending account balance or expenses you paid for the period. You may use this information to compare the ongoing costs of investing in the Fund and other funds. To do so, compare this 5% hypothetical example with the 5% hypothetical examples that appear in the shareholder reports of the other funds.
Please note that the expenses shown in the table are meant to highlight your ongoing costs only and do not reflect any transaction costs, such as sales charges (loads) on purchase payments or contingent deferred sales charges on redemptions, if any. Therefore, the hypothetical information is useful in comparing ongoing costs only, and will not help you determine the relative total costs of owning different funds. In addition, expenses shown in the table do not include the expenses of the underlying funds, which are borne indirectly by the Fund. If transaction costs and indirect expenses were included, your costs would have been higher.
| | | | | | | | | | | | | | | | | | | | | | | | |
| Class | | Beginning
Account Value
(05/01/16) | | | ACTUAL | | | HYPOTHETICAL
(5% annual return before
expenses) | | | Annualized
Expense Ratio | |
| | | Ending
Account Value
(10/31/16)1 | | | Expenses
Paid During
Period2 | | | Ending
Account Value
(10/31/16) | | | Expenses
Paid During
Period2 | | |
| A | | $ | 1,000.00 | | | $ | 1,051.90 | | | $ | 6.19 | | | $ | 1,019.10 | | | $ | 6.09 | | | | 1.20 | % |
| B | | | 1,000.00 | | | | 1,047.10 | | | | 10.03 | | | | 1,015.33 | | | | 9.88 | | | | 1.95 | |
| C | | | 1,000.00 | | | | 1,047.10 | | | | 10.03 | | | | 1,015.33 | | | | 9.88 | | | | 1.95 | |
| R | | | 1,000.00 | | | | 1,050.80 | | | | 7.47 | | | | 1,017.85 | | | | 7.35 | | | | 1.45 | |
| Y | | | 1,000.00 | | | | 1,052.30 | | | | 4.90 | | | | 1,020.36 | | | | 4.82 | | | | 0.95 | |
| R5 | | | 1,000.00 | | | | 1,053.20 | | | | 4.64 | | | | 1,020.61 | | | | 4.57 | | | | 0.90 | |
| R6 | | | 1,000.00 | | | | 1,053.20 | | | | 4.34 | | | | 1,020.91 | | | | 4.27 | | | | 0.84 | |
| 1 | The actual ending account value is based on the actual total return of the Fund for the period May 1, 2016 through October 31, 2016, after actual expenses and will differ from the hypothetical ending account value which is based on the Fund’s expense ratio and a hypothetical annual return of 5% before expenses. |
| 2 | Expenses are equal to the Fund’s annualized expense ratio as indicated above multiplied by the average account value over the period, multiplied by 184/366 to reflect the most recent fiscal half year. |
28 Invesco Balanced-Risk Allocation Fund
Approval of Investment Advisory and Sub-Advisory Contracts
The Board of Trustees (the Board) of AIM Investment Funds (Invesco Investment Funds) Series is required under the Investment Company Act of 1940, as amended, to approve annually the renewal of Invesco Balanced-Risk Allocation Fund’s (the Fund) investment advisory agreements. During contract renewal meetings held on June 7-8, 2016, the Board as a whole, and the disinterested or “independent” Trustees, who comprise over 75% of the Board, voting separately, approved the continuance for the Fund of the Master Investment Advisory Agreement with Invesco Advisers, Inc. (Invesco Advisers and the investment advisory agreement) and the Master Intergroup Sub-Advisory Contract for Mutual Funds with Invesco Asset Management Deutschland GmbH, Invesco Asset Management Limited, Invesco Asset Management (Japan) Limited, Invesco Hong Kong Limited, Invesco Senior Secured Management, Inc. and Invesco Canada Ltd. (collectively, the Affiliated Sub-Advisers and the sub-advisory contracts) for another year, effective July 1, 2016.
In evaluating the fairness and reasonableness of compensation under the Fund’s investment advisory agreement and sub-advisory contracts, the Board considered, among other things, the factors discussed below. The Board determined that continuation of the Fund’s investment advisory agreement and the sub-advisory contracts is in the best interest of the Fund and its shareholders and that the compensation payable to Invesco Advisers and the Affiliated Sub-Advisers under the agreements is fair and reasonable.
The Board’s Fund Evaluation Process
The Board’s Investments Committee has established three Sub-Committees, which meet throughout the year to review the performance of funds advised by Invesco Advisers (the Invesco Funds). Over the course of each year, the Sub-Committees meet with portfolio managers for their assigned Invesco Funds and other members of management to review the performance, investment objective(s), policies, strategies, limitations and investment risks of these funds. The Board had the benefit of reports from the Sub-Committees and Investments Committee throughout the year in considering approval of the continuance of each Invesco Fund’s investment advisory agreement and sub-advisory contracts for another year.
During the contract renewal process, the Board receives comparative performance and fee data regarding the Invesco Funds prepared by Invesco Advisers and Broadridge Financial Solutions, Inc. (Broadridge), an independent provider of investment company data. The Board also receives an independent written evaluation from the Senior Officer, an officer of the Invesco Funds who reports directly to the independent Trustees. The Senior Officer’s
evaluation is prepared as part of his responsibility to manage the process by which the Invesco Funds’ proposed management fees are negotiated during the annual contract renewal process to ensure they are negotiated in a manner that is at arms’ length and reasonable. In addition to meetings with Invesco Advisers and fund counsel, the independent Trustees also discuss the continuance of the investment advisory agreement and sub-advisory contracts in separate sessions with the Senior Officer and with independent legal counsel.
The Trustees recognized that the advisory fee rates for the Invesco Funds are, in many cases, the result of years of review and negotiation. The Trustees’ deliberations and conclusions in a particular year may be based in part on their deliberations and conclusions regarding these same arrangements throughout the year and in prior years. The Trustees’ review and conclusions are based on the comprehensive consideration of all information presented to them and are not the result of any single determinative factor. Moreover, one Trustee may have weighed a particular piece of information or factor differently than another Trustee.
The discussion below is a summary of the Senior Officer’s independent written evaluation with respect to the Fund’s investment advisory agreement as well as a discussion of the material factors and related conclusions that formed the basis for the Board’s approval of the Fund’s investment advisory agreement and sub-advisory contracts. Unless otherwise stated, this information is current as of June 8, 2016, and does not reflect consideration of factors that became known to the Board after that date.
Factors and Conclusions and Summary of Independent Written Fee Evaluation
| A. | Nature, Extent and Quality of Services Provided by Invesco Advisers and the Affiliated Sub-Advisers |
The Board reviewed the advisory services provided to the Fund by Invesco Advisers under the Fund’s investment advisory agreement, the performance of Invesco Advisers in providing these services, and the credentials and experience of the officers and employees of Invesco Advisers who provide these services, including the Fund’s portfolio manager or managers. The Board’s review of the qualifications of Invesco Advisers to provide advisory services included the Board’s consideration of Invesco Advisers’ investment process oversight, independent credit analysis and investment risk management. The Board also considered non-advisory services that Invesco Advisers and its affiliates provide to the Invesco Funds such as various back office
support functions, trading operations, internal audit, valuation and legal and compliance.
In determining whether to continue the Fund’s investment advisory agreement, the Board considered the benefits of reapproving an existing relationship and the greater uncertainty that may be associated with entering into a new relationship. The Board concluded that the nature, extent and quality of the services provided to the Fund by Invesco Advisers are appropriate and satisfactory and consistent with the terms of the Fund’s investment advisory agreement.
The Board reviewed the services that may be provided by the Affiliated Sub-Advisers under the sub-advisory contracts and the credentials and experience of the officers and employees of the Affiliated Sub-Advisers who provide these services. The Board noted that the Affiliated Sub-Advisers have offices and personnel that are located in financial centers around the world. As a result, the Board noted that the Affiliated Sub-Advisers can provide research and investment analysis on the markets and economies of various countries in which the Fund may invest, make recommendations regarding securities and assist with security trades. The Board concluded that the sub-advisory contracts may benefit the Fund and its shareholders by permitting Invesco Advisers to use the resources and talents of the Affiliated Sub-Advisers in managing the Fund. The Board concluded that the nature, extent and quality of the services that may be provided by the Affiliated Sub-Advisers are appropriate and satisfactory and consistent with the terms of the Fund’s sub-advisory contracts.
The Board considered Fund performance as a relevant factor in considering whether to approve the investment advisory agreement. The Board did not view Fund performance as a relevant factor in considering whether to approve the sub-advisory contracts for the Fund, as no Affiliated Sub-Adviser currently manages assets of the Fund.
The Board compared the Fund’s performance during the past one, three and five calendar years to the performance of funds in the Broadridge performance universe and against the Lipper Alternative Global Macro Funds Index. The Board noted that performance of Class A shares of the Fund was in the third quintile of its performance universe for the one year period , the second quintile for the three year period and the first quintile for the five year period (the first quintile being the best performing funds and the fifth quintile being the worst performing funds). The Board noted that performance of Class A shares of the Fund was below the performance of the Index for the one year period and above the performance of the Index for the three and five year periods. Invesco Advisers noted that recent
29 Invesco Balanced-Risk Allocation Fund
underperformance was a result of strategic commodity allocations. The Trustees also reviewed more recent Fund performance and this review did not change their conclusions.
| C. | Advisory and Sub-Advisory Fees |
The Board compared the Fund’s contractual management fee rate to the contractual management fee rates of funds in the Fund’s Broadridge expense group at a common asset level. The Board noted that the contractual management fee rate for Class A shares of the Fund was above the median contractual management fee rate of funds in its expense group. The Board noted that the term “contractual management fee” for funds in the expense group may include both advisory and certain administrative services fees, but that Broadridge does not provide information on a fund by fund basis as to what is included. The Board noted that Invesco Advisers does not separately charge the Invesco Funds for the administrative services included in the term as defined by Broadridge. The Board also reviewed the methodology used by Broadridge in providing expense group information, which includes using each fund’s contractual management fee schedule (including any applicable breakpoints) as reported in the most recent prospectus or statement of additional information for each fund in the expense group.
The Board compared the Fund’s effective advisory fee rate (the advisory fee rate after advisory fee waivers and before other expense limitations/waivers) to the effective advisory fee rates of other funds advised by Invesco Advisers and its affiliates with investment strategies comparable to those of the Fund, based on asset balances as of December 31, 2015. The Board noted that the Fund’s rate was below the rate of one mutual fund. The Board also noted how the Fund’s rate compared to the effective sub-adviser fee rate of three funds sub-advised by Invesco Advisers.
The Board also considered the fees charged by Invesco Advisers and the Affiliated Sub-Advisers to other client accounts with investment strategies comparable to those of the Fund. The Board noted that Invesco Advisers or the Affiliated Sub-Advisers may charge lower fees to large institutional clients. Invesco Advisers reviewed with the Board the significantly greater scope of services it provides to the Invesco Funds relative to certain other types of client accounts. These additional services include provision of administrative services, officers and office space, oversight of service providers, preparation of annual registration statement updates and financial information and regulatory compliance under the Investment Company Act of 1940, as amended.
Invesco Advisers also reviewed generally the higher frequency of shareholder purchases and redemptions in the Invesco Funds relative to the flow of assets for other client accounts. Invesco Advisers advised the Board that advance notice of redemptions is often provided to Invesco Advisers by institutional clients. The Board did
note that sub-advisory fee rates charged by the Affiliated Sub-Advisers to manage the Invesco Funds and to manage other client accounts tended to be more comparable, reflecting a similar scope of services.
The Board also considered the services that may be provided by the Affiliated Sub-Advisers pursuant to the sub-advisory contracts, as well as the fees payable by Invesco Advisers to the Affiliated Sub-Advisers pursuant to the sub-advisory contracts. The Board also noted that the sub-advisory fees are not paid directly by the Fund, but rather, are payable by Invesco Advisers to the Affiliated Sub-Advisers.
| D. | Economies of Scale and Breakpoints |
The Board considered the extent to which there are economies of scale in the provision of advisory services to the Fund. The Board also considered whether the Fund benefits from economies of scale through contractual breakpoints in the Fund’s advisory fee schedule. The Board also noted that the Fund shares directly in economies of scale through lower fees charged by third party service providers based on the combined size of the Invesco Funds and other clients advised by Invesco Advisers.
| E. | Profitability and Financial Resources |
The Board reviewed information from Invesco Advisers concerning the costs of the advisory and other services that Invesco Advisers and its affiliates provide to the Fund and the Invesco Funds and the profitability of Invesco Advisers and its affiliates in providing these services. The Board received information from Invesco Advisers and a report from an independent consultant engaged by the Senior Officer about the methodology used to prepare the profitability information. The Board noted that Invesco Advisers continues to operate at a net profit from services Invesco Advisers and its affiliates provide to the Invesco Funds and the Fund. The Board did not deem the level of profits realized by Invesco Advisers and its affiliates from providing services to the Fund to be excessive given the nature, quality and extent of the services provided. The Board received and accepted information from Invesco Advisers demonstrating that Invesco Advisers and each Affiliated Sub-Adviser are financially sound and have the resources necessary to perform their obligations under the investment advisory agreement and sub-advisory contracts.
| F. | Collateral Benefits to Invesco Advisers and its Affiliates |
The Board considered various other benefits received by Invesco Advisers and its affiliates from the relationship with the Fund, including the fees received for providing transfer agency and distribution services to the Fund. The Board considered comparative information regarding fees charged for these services, including information provided by Broadridge and other independent sources. The Board considered the performance of Invesco Advisers and its affiliates in providing these services and the organizational structure employed to provide these services. The Board also considered that
these services are provided to the Fund pursuant to written contracts that are reviewed and approved on an annual basis by the Board; and that the services are required for the operation of the Fund.
30 Invesco Balanced-Risk Allocation Fund
Tax Information
Form 1099-DIV, Form 1042-S and other year-end tax information provide shareholders with actual calendar year amounts that should be included in their tax returns. Shareholders should consult their tax advisors.
The following distribution information is being provided as required by the Internal Revenue Code or to meet a specific state’s requirement.
The Fund designates the following amounts or, if subsequently determined to be different, the maximum amount allowable for its fiscal year ended October 31, 2016:
| | | | |
Federal and State Income Tax | |
Long-Term Capital Gain Distributions | | $ | 111,430,320 | |
Qualified Dividend Income* | | | 0.00 | % |
Corporate Dividends Received Deduction* | | | 0.00 | % |
U.S. Treasury Obligations* | | | 3.32 | % |
| | * | The above percentages are based on ordinary income dividends paid to shareholders during the Fund’s fiscal year. |
| | | | |
Non-Resident Alien Shareholders | |
Qualified Short-Term Gains | | $ | 136,976,219 | |
31 Invesco Balanced-Risk Allocation Fund
Trustees and Officers
The address of each trustee and officer is AIM Investment Funds (Invesco Investment Funds) (the “Trust”), 11 Greenway Plaza, Suite 1000, Houston, Texas 77046-1173. The trustees serve for the life of the Trust, subject to their earlier death, incapacitation, resignation, retirement or removal as more specifically provided in the Trust’s organizational documents. Each officer serves for a one year term or until their successors are elected and qualified. Column two below includes length of time served with predecessor entities, if any.
| | | | | | | | |
Name, Year of Birth and
Position(s) Held with the Trust | | Trustee and/
or Officer Since | | Principal Occupation(s)
During Past 5 Years | | Number of
Funds in Fund
Complex
Overseen by
Trustee | | Other Directorship(s)
Held by Trustee During
Past 5 Years |
| Interested Persons | | | | | | | | |
| Martin L. Flanagan1 — 1960 Trustee | | 2007 | | Executive Director, Chief Executive Officer and President, Invesco Ltd. (ultimate parent of Invesco and a global investment management firm); Advisor to the Board, Invesco Advisers, Inc. (formerly known as Invesco Institutional (N.A.), Inc.); Trustee, The Invesco Funds; Vice Chair, Investment Company Institute; and Member of Executive Board, SMU Cox School of Business Formerly: Chairman and Chief Executive Officer, Invesco Advisers, Inc. (registered investment adviser); Director, Chairman, Chief Executive Officer and President, Invesco Holding Company (US) Inc. (formerly IVZ Inc.) (holding company), Invesco Group Services, Inc. (service provider) and Invesco North American Holdings, Inc. (holding company); Director, Chief Executive Officer and President, Invesco Holding Company Limited (parent of Invesco and a global investment management firm); Director, Invesco Ltd.; Chairman, Investment Company Institute and President, Co-Chief Executive Officer, Co-President, Chief Operating Officer and Chief Financial Officer, Franklin Resources, Inc. (global investment management organization) | | 146 | | None |
| Philip A. Taylor2 — 1954 Trustee and Senior Vice President | | 2006 | | Head of the Americas and Senior Managing Director, Invesco Ltd.; Director, Co-Chairman, Co-President and Co-Chief Executive Officer, Invesco Advisers, Inc. (formerly known as Invesco Institutional (N.A.), Inc.) (registered investment adviser); Director, Chairman, Chief Executive Officer and President, Invesco Management Group, Inc. (formerly known as Invesco AIM Management Group, Inc.) (financial services holding company); Director and Chairman, Invesco Investment Services, Inc. (formerly known as Invesco AIM Investment Services, Inc.) (registered transfer agent) Chief Executive Officer, Invesco Corporate Class Inc. (corporate mutual fund company) Director, Chairman and Chief Executive Officer, Invesco Canada Ltd. (formerly known as Invesco Trimark Ltd./Invesco Trimark Ltèe) (registered investment adviser and registered transfer agent); Trustee and Senior Vice President, The Invesco Funds; Director, Invesco Investment Advisers LLC (formerly known as Van Kampen Asset Management). Formerly: Director, Chief Executive Officer and President, Van Kampen Exchange Corp.; President and Principal Executive Officer, The Invesco Funds (other than AIM Treasurer’s Series Trust (Invesco Treasurer’s Series Trust), Short-Term Investments Trust and Invesco Management Trust); Executive Vice President, The Invesco Funds (AIM Treasurer’s Series Trust (Invesco Treasurer’s Series Trust), Short-Term Investments Trust and Invesco Management Trust only); Director and President, INVESCO Funds Group, Inc. (registered investment adviser and registered transfer agent); Director and Chairman, IVZ Distributors, Inc. (formerly known as INVESCO Distributors, Inc.) (registered broker dealer); Director, President and Chairman, Invesco Inc. (holding company), Invesco Canada Holdings Inc. (holding company), Trimark Investments Ltd./Placements Trimark Ltèe and Invesco Financial Services Ltd/Services Financiers Invesco Ltèe; Chief Executive Officer, Invesco Canada Fund Inc. (corporate mutual fund company); Director and Chairman, Van Kampen Investor Services Inc.; Director, Chief Executive Officer and President, 1371 Preferred Inc. (holding company) and Van Kampen Investments Inc.; Director and President, AIM GP Canada Inc. (general partner for limited partnerships) and Van Kampen Advisors, Inc.; Director and Chief Executive Officer, Invesco Trimark Dealer Inc. (registered broker dealer); Director, Invesco Distributors, Inc. (formerly known as Invesco AIM Distributors, Inc.) (registered broker dealer); Manager, Invesco PowerShares Capital Management LLC; Director, Chief Executive Officer and President, Invesco Advisers, Inc.; Director, Chairman, Chief Executive Officer and President, Invesco AIM Capital Management, Inc.; President, Invesco Trimark Dealer Inc. and Invesco Trimark Ltd./Invesco Trimark Ltèe; Director and President, AIM Trimark Corporate Class Inc. and AIM Trimark Canada Fund Inc.; Senior Managing Director, Invesco Holding Company Limited; Director and Chairman, Fund Management Company (former registered broker dealer); President and Principal Executive Officer, The Invesco Funds (AIM Treasurer’s Series Trust (Invesco Treasurer’s Series Trust), and Short-Term Investments Trust only); President, AIM Trimark Global Fund Inc. and AIM Trimark Canada Fund Inc. | | 146 | | None |
| 1 | Mr. Flanagan is considered an interested person (within the meaning of Section 2(a)(19) of the 1940 Act) of the Trust because he is an officer of the Adviser to the Trust, and an officer and a director of Invesco Ltd., ultimate parent of the Adviser. |
| 2 | Mr. Taylor is considered an interested person (within the meaning of Section 2(a)(19) of the 1940 Act) of the Trust because he is an officer and a director of the Adviser. |
T-1 Invesco Balanced-Risk Allocation Fund
Trustees and Officers—(continued)
| | | | | | | | |
Name, Year of Birth and
Position(s) Held with the Trust | | Trustee and/
or Officer Since | | Principal Occupation(s) During Past 5 Years | | Number of
Funds in Fund
Complex
Overseen by
Trustee | | Other Directorship(s)
Held by Trustee During
Past 5 Years |
| Independent Trustees | | | | | | | | |
Bruce L. Crockett — 1944 Trustee and Chair | | 2001 | | Chairman, Crockett Technologies Associates (technology consulting company) Formerly: Director, Captaris (unified messaging provider); Director, President and Chief Executive Officer, COMSAT Corporation; Chairman, Board of Governors of INTELSAT (international communications company); ACE Limited (insurance company); Independent Directors Council and Investment Company Institute | | 146 | | ALPS (Attorneys Liability Protection Society) (insurance company) and Globe Specialty Metals, Inc. (metallurgical company); Member of the Audit Committee, Ferroglobe PLC and Investment Company Institute; Member of the Executive Committee and Chair of the Governance Committee, Independent Directors Council |
David C. Arch — 1945 Trustee | | 2010 | | Chairman of Blistex Inc., a consumer health care products manufacturer | | 146 | | Board member of the Illinois Manufacturers’ Association; Member of the Board of Visitors, Institute for the Humanities, University of Michigan |
James T. Bunch — 1942 Trustee | | 2003 | | Managing Member, Grumman Hill Group LLC (family office/private equity investments) Formerly: Chairman of the Board, Denver Film Society, Chairman of the Board of Trustees, Evans Scholarship Foundation; Chairman, Board of Governors, Western Golf Association | | 146 | | Trustee, Evans Scholarship Foundation |
Albert R. Dowden — 1941 Trustee | | 2001 | | Director of a number of public and private business corporations, including Nature’s Sunshine Products, Inc. Formerly: Director, The Boss Group, Ltd. and Reich & Tang Funds (5 portfolios) (registered investment company); Director, Homeowners of America Holding Corporation/Homeowners of America Insurance Company (property casualty company); Director, Continental Energy Services, LLC (oil and gas pipeline service); Director, CompuDyne Corporation (provider of product and services to the public security market) and Director, Annuity and Life Re (Holdings), Ltd. (reinsurance company); Director, President and Chief Executive Officer, Volvo Group North America, Inc.; Senior Vice President, AB Volvo; Director of various public and private corporations; Chairman, DHJ Media, Inc.; Director, Magellan Insurance Company; and Director, The Hertz Corporation, Genmar Corporation (boat manufacturer), National Media Corporation; Advisory Board of Rotary Power International (designer, manufacturer, and seller of rotary power engines); and Chairman, Cortland Trust, Inc. (registered investment company) | | 146 | | Director of Nature’s Sunshine Products, Inc. |
Jack M. Fields — 1952 Trustee | | 2001 | | Chief Executive Officer, Twenty First Century Group, Inc. (government affairs company); and Discovery Learning Alliance (non-profit) Formerly: Owner and Chief Executive Officer, Dos Angeles Ranch L.P. (cattle, hunting, corporate entertainment); Director, Insperity, Inc. (formerly known as Administaff); Chief Executive Officer, Texana Timber LP (sustainable forestry company); Director of Cross Timbers Quail Research Ranch (non-profit); and member of the U.S. House of Representatives | | 146 | | None |
Eli Jones — 1961 Trustee | | 2016 | | Professor and Dean, Mays Business School — Texas A&M University Formerly: Professor and Dean, Walton College of Business, University of Arkansas and E.J. Ourso College of Business, Louisiana State University and Director, Arvest Bank | | 146 | | Director of Insperity, Inc. (formerly known as Administaff) |
Prema Mathai-Davis — 1950 Trustee | | 2001 | | Retired. Formerly: Chief Executive Officer, YWCA of the U.S.A. | | 146 | | None |
Larry Soll — 1942 Trustee | | 2003 | | Retired. Formerly: Chairman, Chief Executive Officer and President, Synergen Corp. (a biotechnology company) | | 146 | | None |
Raymond Stickel, Jr. — 1944 Trustee | | 2005 | | Retired. Formerly: Director, Mainstay VP Series Funds, Inc. (25 portfolios) and Partner, Deloitte & Touche | | 146 | | None |
Robert C. Troccoli — 1949 Trustee | | 2016 | | Adjunct Professor, University of Denver — Daniels College of Business Formerly: Senior Partner, KPMG LLP | | 146 | | None |
T-2 Invesco Balanced-Risk Allocation Fund
Trustees and Officers—(continued)
| | | | | | | | |
Name, Year of Birth and
Position(s) Held with the Trust | | Trustee and/
or Officer Since | | Principal Occupation(s) During Past 5 Years | | Number of
Funds in Fund
Complex
Overseen by
Trustee | | Other Directorship(s)
Held by Trustee During
Past 5 Years |
| Independent Trustees—(continued) |
Suzanne H. Woolsey — 1941 Trustee | | 2014 | | Retired. Formerly: Chief Executive Officer of Woolsey Partners LLC | | 146 | | Director, SunShare LLC; Trustee, Ocean Conservancy; Emeritus Chair of the Board of Trustees of the Institute for Defense Analyses and of Colorado College; Trustee, Chair, Business and Finance Committee of California Institute of Technology; Prior to 2014, Director of Fluor Corp.; Prior to 2010, Trustee of the German Marshall Fund of the United States; Prior to 2010, Trustee of the Rocky Mountain Institute |
| Other Officers | | | | | | | | |
Sheri Morris — 1964 President, Principal Executive Officer and Treasurer | | 1999 | | President, Principal Executive Officer and Treasurer, The Invesco Funds; Vice President, Invesco Advisers, Inc. (formerly known as Invesco Institutional (N.A.), Inc.) (registered investment adviser); and Vice President, PowerShares Exchange-Traded Fund Trust, PowerShares Exchange-Traded Fund Trust II, PowerShares India Exchange-Traded Fund Trust, PowerShares Actively Managed Exchange-Traded Fund Trust, and PowerShares Actively Managed Exchange-Traded Commodity Fund Trust Formerly: Vice President and Principal Financial Officer, The Invesco Funds; Vice President, Invesco AIM Advisers, Inc., Invesco AIM Capital Management, Inc. and Invesco AIM Private Asset Management, Inc.; Assistant Vice President and Assistant Treasurer, The Invesco Funds and Assistant Vice President, Invesco Advisers, Inc., Invesco AIM Capital Management, Inc. and Invesco AIM Private Asset Management, Inc.; and Treasurer, PowerShares Exchange-Traded Fund Trust, PowerShares Exchange-Traded Fund Trust II, PowerShares India Exchange-Traded Fund Trust and PowerShares Actively Managed Exchange-Traded Fund Trust | | N/A | | N/A |
Russell C. Burk — 1958 Senior Vice President and Senior Officer | | 2005 | | Senior Vice President and Senior Officer, The Invesco Funds | | N/A | | N/A |
John M. Zerr — 1962 Senior Vice President, Chief Legal Officer and Secretary | | 2006 | | Director, Senior Vice President, Secretary and General Counsel, Invesco Management Group, Inc. (formerly known as Invesco AIM Management Group, Inc.; Senior Vice President, Invesco Advisers, Inc. (formerly known as Invesco Institutional (N.A.), Inc.) (registered investment adviser); Senior Vice President and Secretary, Invesco Distributors, Inc. (formerly known as Invesco AIM Distributors, Inc.); Director, Vice President and Secretary, Invesco Investment Services, Inc. (formerly known as Invesco AIM Investment Services, Inc.) Senior Vice President, Chief Legal Officer and Secretary, The Invesco Funds; Managing Director, Invesco PowerShares Capital Management LLC; Director, Secretary and General Counsel, Invesco Investment Advisers LLC (formerly known as Van Kampen Asset Management); Secretary and General Counsel, Invesco Capital Markets, Inc. (formerly known as Van Kampen Funds Inc.) and Chief Legal Officer, PowerShares Exchange-Traded Fund Trust, PowerShares Exchange-Traded Fund Trust II, PowerShares India Exchange-Traded Fund Trust, PowerShares Actively Managed Exchange-Traded Fund Trust, and PowerShares Actively Managed Exchange-Traded Commodity Fund Trust Formerly: Director, Secretary, General Counsel and Senior Vice President, Van Kampen Exchange Corp.; Director, Vice President and Secretary, IVZ Distributors, Inc. (formerly known as INVESCO Distributors, Inc.); Director and Vice President, INVESCO Funds Group, Inc.; Director and Vice President, Van Kampen Advisors Inc.; Director, Vice President, Secretary and General Counsel, Van Kampen Investor Services Inc.; Director, Invesco Distributors, Inc. (formerly known as Invesco AIM Distributors, Inc.); Director, Senior Vice President, General Counsel and Secretary, Invesco AIM Advisers, Inc. and Van Kampen Investments Inc.; Director, Vice President and Secretary, Fund Management Company; Director, Senior Vice President, Secretary, General Counsel and Vice President, Invesco AIM Capital Management, Inc.; Chief Operating Officer and General Counsel, Liberty Ridge Capital, Inc. (an investment adviser); Vice President and Secretary, PBHG Funds (an investment company) and PBHG Insurance Series Fund (an investment company); Chief Operating Officer, General Counsel and Secretary, Old Mutual Investment Partners (a broker-dealer); General Counsel and Secretary, Old Mutual Fund Services (an administrator) and Old Mutual Shareholder Services (a shareholder servicing center); Executive Vice President, General Counsel and Secretary, Old Mutual Capital, Inc. (an investment adviser); and Vice President and Secretary, Old Mutual Advisors Funds (an investment company) | | N/A | | N/A |
T-3 Invesco Balanced-Risk Allocation Fund
Trustees and Officers—(continued)
| | | | | | | | |
Name, Year of Birth and
Position(s) Held with the Trust | | Trustee and/
or Officer Since | | Principal Occupation(s) During Past 5 Years | | Number of
Funds in Fund
Complex
Overseen by
Trustee | | Other Directorship(s)
Held by Trustee During
Past 5 Years |
| Other Officers—(continued) | | | | | | | | |
| Karen Dunn Kelley — 1960 Senior Vice President | | 2004 | | Senior Managing Director, Investments, Invesco Ltd.; Director, Co-President, Co-Chief Executive Officer, and Co-Chairman, Invesco Advisers, Inc. (formerly known as Invesco Institutional (N.A.), Inc.) (registered investment adviser); Chairman and Director, Invesco Senior Secured Management, Inc.; Senior Vice President, Invesco Management Group, Inc. (formerly known as Invesco AIM Management Group, Inc.); Executive Vice President, Invesco Distributors, Inc. (formerly known as Invesco AIM Distributors, Inc.); Director, Invesco Mortgage Capital Inc. and Invesco Management Company Limited; Senior Vice President, The Invesco Funds Formerly: Vice President, The Invesco Funds (other than AIM Treasurer’s Series Trust (Invesco Treasurer’s Series Trust), Short-Term Investments Trust and Invesco Management Trust); and President and Principal Executive Officer, The Invesco Funds (AIM Treasurer’s Series Trust (Invesco Treasurer’s Series Trust), Short-Term Investments Trust and Invesco Management Trust only); Director and President, INVESCO Asset Management (Bermuda) Ltd., Director, INVESCO Global Asset Management DAC (formerly known as INVESCO Global Asset Management Limited) and INVESCO Management S.A.; Senior Vice President, Van Kampen Investments Inc. and Invesco Advisers, Inc. (formerly known as Invesco Institutional (N.A.), Inc.) (registered investment adviser); Director and President, Fund Management Company; Chief Cash Management Officer, Director of Cash Management, Senior Vice President, and Managing Director, Invesco AIM Capital Management, Inc.; Director of Cash Management, Senior Vice President, and Vice President, Invesco Advisers, Inc. and Vice President, The Invesco Funds (AIM Treasurer’s Series Trust (Invesco Treasurer’s Series Trust), and Short-Term Investments Trust only) | | N/A | | N/A |
Kelli Gallegos — 1970 Vice President, Principal Financial Officer and Assistant Treasurer | | 2008 | | Vice President, Principal Financial Officer and Assistant Treasurer, The Invesco Funds; Assistant Treasurer, Invesco PowerShares Capital Management LLC, PowerShares Exchange-Traded Fund Trust, PowerShares Exchange-Traded Fund Trust II, PowerShares India Exchange-Traded Fund Trust, PowerShares Actively Managed Exchange-Traded Fund Trust, and PowerShares Actively Managed Exchange-Traded Commodity Fund Trust Formerly: Assistant Vice President, The Invesco Funds | | N/A | | N/A |
Tracy Sullivan — 1962 Vice President, Chief Tax Officer and Assistant Treasurer | | 2008 | | Vice President, Chief Tax Officer and Assistant Treasurer, The Invesco Funds; Assistant Treasurer, Invesco PowerShares Capital Management LLC, PowerShares Exchange-Traded Fund Trust, PowerShares Exchange-Traded Fund Trust II, PowerShares India Exchange-Traded Fund Trust, PowerShares Actively Managed Exchange-Traded Fund Trust, and PowerShares Actively Managed Exchange-Traded Commodity Fund Trust Formerly: Assistant Vice President, The Invesco Funds | | N/A | | N/A |
Crissie M. Wisdom — 1969 Anti-Money Laundering Compliance Officer | | 2013 | | Anti-Money Laundering Compliance Officer, Invesco Advisers, Inc. (formerly known as Invesco Institutional (N.A.), Inc.) (registered investment adviser), Invesco Capital Markets, Inc. (formerly known as Van Kampen Funds Inc.), Invesco Distributors, Inc., Invesco Investment Services, Inc., Invesco Management Group, Inc., The Invesco Funds, and PowerShares Exchange-Traded Fund Trust, PowerShares Exchange-Traded Fund Trust II, PowerShares India Exchange-Traded Fund Trust, PowerShares Actively Managed Exchange-Traded Fund Trust and PowerShares Actively Managed Exchange-Traded Commodity Fund Trust; Anti-Money Laundering Compliance Officer and Bank Secrecy Act Officer, INVESCO National Trust Company and Invesco Trust Company; and Fraud Prevention Manager and Controls and Risk Analysis Manager for Invesco Investment Services, Inc. Formerly: Anti-Money Laundering Compliance Officer, Van Kampen Exchange Corp. | | N/A | | N/A |
Robert R. Leveille — 1969 Chief Compliance Officer | | 2016 | | Chief Compliance Officer, Invesco Advisers, Inc. (registered investment adviser); and Chief Compliance Officer, The Invesco Funds Formerly: Chief Compliance Officer, Putnam Investments and the Putnam Funds | | N/A | | N/A |
The Statement of Additional Information of the Trust includes additional information about the Fund’s Trustees and is available upon request, without charge, by calling 1.800.959.4246. Please refer to the Fund’s Statement of Additional Information for information on the Fund’s sub-advisers.
| | | | | | |
Office of the Fund 11 Greenway Plaza, Suite 1000 Houston, TX 77046-1173 | | Investment Adviser Invesco Advisers, Inc. 1555 Peachtree Street, N.E. Atlanta, GA 30309 | | Distributor Invesco Distributors, Inc. 11 Greenway Plaza, Suite 1000 Houston, TX 77046-1173 | | Auditors PricewaterhouseCoopers LLP 1000 Louisiana Street, Suite 5800 Houston, TX 77002-5678 |
| | | |
| | | | | | |
Counsel to the Fund Stradley Ronon Stevens & Young, LLP 2005 Market Street, Suite 2600 Philadelphia, PA 19103-7018 | | Counsel to the Independent Trustees Goodwin Procter LLP 901 New York Avenue, N.W. Washington, D.C. 20001 | | Transfer Agent Invesco Investment Services, Inc. 11 Greenway Plaza, Suite 1000 Houston, TX 77046-1173 | | Custodian State Street Bank and Trust Company 225 Franklin Street Boston, MA 02110-2801 |
T-4 Invesco Balanced-Risk Allocation Fund
Explore High-Conviction Investing with Invesco

Invesco mailing information
Send general correspondence to Invesco Investment Services, Inc., P.O. Box 219078, Kansas City, MO 64121-9078.
Important notice regarding delivery of security holder documents
To reduce Fund expenses, only one copy of most shareholder documents may be mailed to shareholders with multiple accounts at the same address (Householding). Mailing of your shareholder documents may be householded indefinitely unless you instruct us otherwise. If you do not want the mailing of these documents to be combined with those for other members of your household, please contact Invesco Investment Services, Inc. at 800 959 4246 or contact your financial institution. We will begin sending you individual copies for each account within 30 days after receiving your request.
Fund holdings and proxy voting information
The Fund provides a complete list of its holdings four times in each fiscal year, at the quarter ends. For the second and fourth quarters, the lists appear in the Fund’s semiannual and annual reports to shareholders. For the first and third quarters, the Fund files the lists with the Securities and Exchange Commission (SEC) on Form N-Q. The most recent list of portfolio holdings is available at invesco.com/completeqtrholdings. Shareholders can also look up the Fund’s Forms N-Q on the SEC website at sec.gov. Copies of the Fund’s Forms N-Q may be reviewed and copied at the SEC Public Reference Room in Washington, D.C. You can obtain information on the operation of the Public Reference Room, including information about duplicating fee charges, by calling 202 551 8090 or 800 732 0330, or by electronic request at the following email address: publicinfo@sec.gov.
The SEC file numbers for the Fund are shown below.
A description of the policies and procedures that the Fund uses to determine how to vote proxies relating to portfolio securities is available without charge, upon request, from our Client Services department at 800 959 4246 or at invesco.com/proxyguidelines. The information is also available on the SEC website, sec.gov.
| | |
Information regarding how the Fund voted proxies related to its portfolio securities during the most recent 12-month period ended June 30 is available at invesco.com/proxysearch. The information is also available on the SEC website, sec.gov. Invesco Advisers, Inc. is an investment adviser; it provides investment advisory services to individual and institutional clients and does not sell securities. Invesco Distributors, Inc. is the US distributor for Invesco Ltd.’s retail mutual funds, exchange-traded funds and institutional money market funds. Both are wholly owned, indirect subsidiaries of Invesco Ltd. | |  |
SEC file numbers: 811-05426 and 033-19338 IBRA-AR-1 Invesco Distributors, Inc.
| | | | |
| | |
 | | Annual Report to Shareholders | | October 31, 2016 |
| | |
| | Invesco Balanced-Risk Commodity Strategy Fund Nasdaq: A: BRCAX ∎ B: BRCBX ∎ C: BRCCX ∎ R: BRCRX ∎ Y: BRCYX ∎ R5: BRCNX ∎ R6: IBRFX |

Letters to Shareholders
| | |

Philip Taylor | | Dear Shareholders: This annual report includes information about your Fund, including performance data and a complete list of its investments as of the close of the reporting period. Inside is a discussion of how your Fund was managed and the factors that affected its performance during the reporting period. In December 2015, the US Federal Reserve raised short-term interest rates for the first time since 2006, signaling its belief that the economy was likely to continue strengthening. Indeed, throughout the reporting period, US economic data were generally positive and the economy expanded at a moderate rate – but there were some bumps along the road. Job growth in May 2016 was very weak, but it was followed by strong increases in nonfarm payrolls in June and July. Increased concerns about global economic weakness caused US stock market |
| indexes to sink at the start of calendar year 2016, but they eventually recovered; they sank again following the UK’s decision to leave the European Union, but then quickly recovered and reached record highs later in the summer. |
Strong demand for income-producing investments, particularly those perceived to be lower risk, benefited bonds as well as dividend-paying stocks for much of the reporting period. While economic news in the US was generally positive, news overseas was less upbeat. The European Central Bank, and central banks in China and Japan – as well as other countries – maintained extraordinarily accommodative monetary policies in response to economic weakness. As the fiscal year drew to a close, uncertainty about the outcome of the US presidential election resulted in increased market volatility; the surprise outcome after the close of the reporting period suggested that market volatility may continue for some time to come.
Short-term market volatility can prompt some investors to abandon their investment plans – and can cause others to settle for average results. The investment professionals at Invesco, in contrast, invest with high conviction, take a long-term perspective and have a passion to exceed. Invesco’s pure focus on investment management eliminates possible distractions and means that there are no competing lines of business for us to support. Just as important, we embrace a variety of investment strategies, asset classes and geographies – because we know that no single investment approach meets the diverse needs of all of our clients. We manage all our investment approaches with a passion to exceed. All our investment teams have a highly disciplined, long-term investing style that eliminates short-term decision-making. Of course, investing with high conviction can’t guarantee a profit or ensure success; no investment strategy can. To learn more about how we invest with high conviction, visit invesco.com/HighConviction.
You, too, can invest with high conviction by maintaining a long-term investment perspective and by working with your financial adviser on a regular basis. During periods of short-term market volatility or uncertainty, your financial adviser can keep you focused on your long-term investment goals – a new home, a child’s college education or a secure retirement. He or she also can share research about the economy, the markets and individual investment options.
Visit our website for more information on your investments
Our website, invesco.com/us, offers a wide range of market insights and investment perspectives. On the website, you’ll find detailed information about our funds, including performance, holdings and portfolio manager commentaries. You can access information about your account by completing a simple, secure online registration. Click on the “Need to register” link in the “Account Access” box on our homepage to get started.
In addition to the resources accessible on our website and through our mobile app, you can obtain timely updates to help you stay informed about the markets, the economy and investing by connecting with Invesco on Twitter, LinkedIn or Facebook. You can access our blog at blog.invesco.us.com. Our goal is to provide you the information you want, when and where you want it.
Finally, I’m pleased to share with you Invesco’s commitment to both the Principles for Responsible Investment and to considering environmental, social and governance issues in our robust investment process. I invite you to learn more at invesco.com/esg.
Have questions?
For questions about your account, contact an Invesco client services representative at 800 959 4246. For Invesco-related questions or comments, please email me directly at phil@invesco.com.
All of us at Invesco look forward to serving your investment management needs. Thank you for investing with us.
Sincerely,

Philip Taylor
Senior Managing Director, Invesco Ltd.
2 Invesco Balanced-Risk Commodity Strategy Fund
| | | | | | |

Bruce Crockett | | | | Dear Fellow Shareholders: Among the many important lessons I’ve learned in more than 40 years in a variety of business endeavors is the value of a trusted advocate. As independent chair of the Invesco Funds Board, I can assure you that the members of the Board are strong advocates for the interests of investors in Invesco’s mutual funds. We work hard to represent your interests through oversight of the quality of the investment management services your funds receive and other matters important to your investment, including but not limited to: |
| | | | ∎ | | Ensuring that Invesco offers a diverse lineup of mutual funds that your financial adviser can use to strive to meet your financial needs as your investment goals change over time. |
| | | | ∎ | | Monitoring how the portfolio management teams of the Invesco funds are performing in light of changing economic and market conditions. |
| ∎ | | Assessing each portfolio management team’s investment performance within the context of the investment strategy described in the fund’s prospectus. |
| ∎ | | Monitoring for potential conflicts of interests that may impact the nature of the services that your funds receive. |
We believe one of the most important services we provide our fund shareholders is the annual review of the funds’ advisory and sub-advisory contracts with Invesco Advisers and its affiliates. This review is required by the Investment Company Act of 1940 and focuses on the nature and quality of the services Invesco provides as the adviser to the Invesco funds and the reasonableness of the fees that it charges for those services. Each year, we spend months carefully reviewing information received from Invesco and a variety of independent sources, such as performance and fee data prepared by Lipper Inc., an independent, third-party firm widely recognized as a leader in its field. We also meet with our independent legal counsel and other independent advisers to review and help us assess the information that we have received. Our goal is to assure that you receive quality investment management services for a reasonable fee.
I trust the measures outlined above provide assurance that you have a worthy advocate when it comes to choosing the Invesco Funds.
As always, please contact me at bruce@brucecrockett.com with any questions or concerns you may have. On behalf of the Board, we look forward to continuing to represent your interests and serving your needs.
Sincerely,

Bruce L. Crockett
Independent Chair
Invesco Funds Board of Trustees
3 Invesco Balanced-Risk Commodity Strategy Fund
Management’s Discussion of Fund Performance
| | | | |
Performance summary For the fiscal year ended October 31, 2016, Class A shares of Invesco Balanced-Risk Commodity Strategy Fund (the Fund), at net asset value (NAV), outperformed the Bloomberg Commodity Index, the Fund’s broad market/style-specific benchmark. Your Fund’s long-term performance appears later in this report. | |
Fund vs. Indexes Total returns, 10/31/15 to 10/31/16, at net asset value (NAV). Performance shown does not include applicable contingent deferred sales charges (CDSC) or front-end sales charges, which would have reduced performance. | |
Class A Shares | | | 4.59 | % |
Class B Shares | | | 3.79 | |
Class C Shares | | | 3.79 | |
Class R Shares | | | 4.32 | |
Class Y Shares | | | 4.83 | |
Class R5 Shares | | | 4.97 | |
Class R6 Shares | | | 4.96 | |
Bloomberg Commodity Indexq (Broad Market/Style-Specific Index) | | | -2.62 | |
Source(s): qBloomberg L.P. | | | | |
Market conditions and your Fund
The fiscal year ended October 31, 2016, was a strong period for commodities, as gains in agriculture and precious metals outweighed losses in energy and industrial metals. The Fund’s ability to tactically adjust exposure to assets helped Fund performance with gains in agriculture and energy offsetting losses in industrial metals and precious metals. The Fund’s performance, at NAV, was positive for the reporting period. The Fund invests with a long bias in four commodity complexes – agriculture, energy, industrial metals and precious metals – and makes tactical adjustments on a monthly basis to try and take advantage of short-term market dynamics. Tactical positioning within energy, industrial metals and precious metals obtained through the use of swaps and futures contributed to Fund performance for the reporting period.
Agriculture was the Fund’s leading performer during the fiscal year due to gains in sugar, soybeans, soymeal, cotton and
coffee. Sugar was the top performer within the agriculture complex as a decline in Brazilian production was further reduced by bad weather, resulting in supply shortages. Soybeans and soymeal prices spiked during the middle of the fiscal year due to heavy rains in Argentina and expectations for a dry growing season in the US. Coffee prices rose as drought conditions across key growing regions in South America and Asia raised concerns over shortages, while cotton prices rose as years of depressed prices caused farmers to reduce plantings. Tactical agriculture exposure, obtained through the use of swaps, futures and commodity-linked notes, was favorable due to an overweight position in sugar.
Strategic positioning in precious metals was also favorable for Fund performance as gains in silver outpaced gold. Precious metals prices began to rise in 2016 as stock market volatility spiked after the US Federal Reserve (the Fed) increased interest rates despite a sluggish global economy
and as interest rates in Japan and Europe crossed into negative territory. Then in June, the United Kingdom’s vote to leave the European Union led to further price increases as uncertainty roiled global financial markets. Precious metals prices were also supported as the Fed slowed the expected pace of interest rate increases. The Fund’s tactical exposure to precious metals, obtained through the use of swaps, futures and commodity-linked notes, detracted from results due to losses in both gold and silver.
Strategic positioning in energy was the largest detractor from Fund performance, led by declines in West Texas Intermediate (WTI) crude, unleaded gasoline and Brent crude. Oil prices continued to be pressured by a strong US dollar and rising supplies. Restrictions on supply output were constrained by overleveraged producers in the US and OPEC’s efforts to maintain market share. Further compounding the oversupply issue was Russia, whose production hit a post-Soviet high in September 2016.1 The Fund’s tactical energy exposure, obtained through the use of swaps, futures and commodity-linked notes, was a contributor to Fund performance due to our complex-wide underweight positions relative to the strategic allocation that were most beneficial in WTI, natural gas and Brent crude.
Industrial metals prices detracted from Fund results as copper prices declined while aluminum gained. Declines in copper prices were attributable to a strong US dollar, excess supplies and slowing global economic growth, especially in China. Despite choppy price action, aluminum gained as producers continued to curtail production, resulting in tighter supplies. Tactical industrial metals exposure, obtained through the use of swaps, futures and commodity-linked notes, detracted from Fund results due to our underweight exposure relative to the strategic allocation to aluminum.
| | | | | | | | |
| Target Risk Allocation and Notional Asset Weights as of 10/31/16 | |
By asset class | | | | | | | | |
| | | | |
| | |
| Asset Class | | Target Risk
Allocation* | | Notional Asset
Weights** |
| | | | | | | | |
Agriculture | | | 29.66 | % | | | 38.69 | % |
Energy | | | 26.80 | | | | 26.03 | |
Industrial Metals | | | 18.73 | | | | 23.68 | |
Precious Metals | | | 24.81 | | | | 29.36 | |
Total | | | 100.00 | | | | 117.76 | |
| * | Reflects the risk that each asset class is expected to contribute to the overall risk of the Fund as measured by standard deviation and estimates of risk based on historical data. Standard deviation measures the annualized fluctuations (volatility) of monthly returns. |
| ** | Proprietary models determine the Notional Asset Weights necessary to achieve the Target Risk Allocations. Total Notional Asset Weight greater than 100% is achieved through derivatives and other instruments that create leverage. |
| | | | |
Total Net Assets | | | $820.3 million | |
4 Invesco Balanced-Risk Commodity Strategy Fund
Please note that our strategy is principally implemented with derivative instruments that include futures, total return swaps and commodity linked-notes. Therefore, all or most of the performance of the strategy, both positive and negative, can be attributed to these instruments. Derivatives can be a cost-effective way to gain exposure to asset classes. However, derivatives may amplify traditional investment risks through the creation of leverage and may be less liquid than traditional securities.
Thank you for your continued investment in Invesco Balanced-Risk Commodity Strategy Fund.
The views and opinions expressed in management’s discussion of Fund performance are those of Invesco Advisers, Inc. These views and opinions are subject to change at any time based on factors such as market and economic conditions. These views and opinions may not be relied upon as investment advice or recommendations, or as an offer for a particular security. The information is not a complete analysis of every aspect of any market, country, industry, security or the Fund. Statements of fact are from sources considered reliable, but Invesco Advisers, Inc. makes no representation or warranty as to their completeness or accuracy. Although historical performance is no guarantee of future results, these insights may help you understand our investment management philosophy.
See important Fund and, if applicable, index disclosures later in this report.
| | |
 | | Mark Ahnrud Chartered Financial Analyst, Portfolio Manager, is manager of Invesco Balanced-Risk Commodity |
| Strategy Fund. He joined Invesco in 2000. Mr. Ahnrud earned a BS in finance and investments from Babson College and an MBA from Duke University Fuqua School of Business. |
| |
 | | Chris Devine Chartered Financial Analyst, Portfolio Manager, is manager of Invesco Balanced-Risk Commodity |
| Strategy Fund. He joined Invesco in 1998. Mr. Devine earned a BA in economics from Wake Forest University and an MBA from the University of Georgia. |
| | |
 | | Scott Hixon Chartered Financial Analyst, Portfolio Manager, is manager of Invesco Balanced-Risk Commodity |
| Strategy Fund. He joined Invesco in 1994. Mr. Hixon earned a BBA in finance from Georgia Southern University and an MBA in finance from Georgia State University. |
| |
 | | Christian Ulrich Chartered Financial Analyst, Portfolio Manager, is manager of Invesco Balanced-Risk Commodity |
| Strategy Fund. He joined Invesco in 2000. Mr. Ulrich earned the equivalent of a BBA from the KV Zurich Business School in Zurich, Switzerland. |
| |
 | | Scott Wolle Chartered Financial Analyst, Portfolio Manager, is manager of Invesco Balanced-Risk Commodity |
| Strategy Fund. He joined Invesco in 1999. Mr. Wolle earned a BS in finance from Virginia Polytechnic Institute and State University and an MBA from Duke University Fuqua School of Business. |
Assisted by the Invesco Global Asset Allocation Team
5 Invesco Balanced-Risk Commodity Strategy Fund
Your Fund’s Long-Term Performance
Results of a $10,000 Investment – Oldest Share Class(es) since Inception
Fund and Index data from 11/30/10
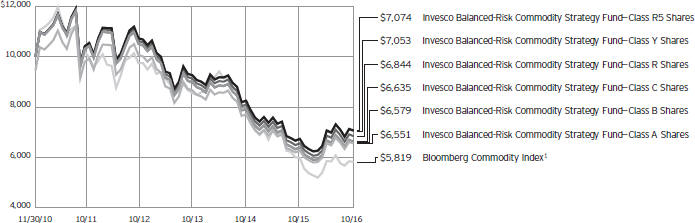
Past performance cannot guarantee comparable future results.
The data shown in the chart include reinvested distributions, applicable sales charges and Fund expenses including management fees. Results for Class B shares are calculated as if a hypothetical
shareholder had liquidated his entire investment in the Fund at the close of the reporting period and paid the contingent deferred sales charges, if applicable. Index results include reinvested dividends, but they do not reflect sales charges. Performance of the peer group,
if applicable, reflects fund expenses and management fees; performance of a market index does not. Performance shown in the chart and table(s) does not reflect deduction of taxes a shareholder would pay on Fund distributions or sale of Fund shares.
continued from page 8
About indexes used in this report
| ∎ | | The Bloomberg Commodity Index is an unmanaged index designed to be a highly liquid and diversified benchmark for the commodity futures market. |
| ∎ | | The Fund is not managed to track the performance of any particular index, including the index(es) described here, and consequently, the performance of the Fund may deviate significantly from the performance of the index(es). |
| ∎ | | A direct investment cannot be made in an index. Unless otherwise indicated, index results include reinvested dividends, and they do not reflect sales charges. Performance of the peer group, if applicable, reflects fund expenses; performance of a market index does not. |
Other information
| ∎ | | The returns shown in management’s discussion of Fund performance are based on net asset values (NAVs) calculated for shareholder transactions. Generally accepted accounting principles require adjustments to be made to the net assets of the Fund at period end for financial reporting purposes, and as such, the NAVs for shareholder transactions and the returns based on those NAVs may differ from the NAVs and returns reported in the Financial Highlights. |
6 Invesco Balanced-Risk Commodity Strategy Fund
| | | | |
| Average Annual Total Returns | |
| As of 10/31/16, including maximum applicable sales charges | |
| |
Class A Shares | | | | |
Inception (11/30/10) | | | -6.90 | % |
5 Years | | | -8.77 | |
1 Year | | | -1.16 | |
| |
Class B Shares | | | | |
Inception (11/30/10) | | | -6.83 | % |
5 Years | | | -8.77 | |
1 Year | | | -1.21 | |
| |
Class C Shares | | | | |
Inception (11/30/10) | | | -6.70 | % |
5 Years | | | -8.42 | |
1 Year | | | 2.79 | |
| |
Class R Shares | | | | |
Inception (11/30/10) | | | -6.21 | % |
5 Years | | | -7.97 | |
1 Year | | | 4.32 | |
| |
Class Y Shares | | | | |
Inception (11/30/10) | | | -5.73 | % |
5 Years | | | -7.50 | |
1 Year | | | 4.83 | |
| |
Class R5 Shares | | | | |
Inception (11/30/10) | | | -5.68 | % |
5 Years | | | -7.45 | |
1 Year | | | 4.97 | |
| |
Class R6 Shares | | | | |
Inception | | | -5.77 | % |
5 Years | | | -7.47 | |
1 Year | | | 4.96 | |
| | | | |
| Average Annual Total Returns | |
| As of 9/30/16, the most recent calendar quarter end, including maximum applicable sales charges | |
| |
Class A Shares | | | | |
Inception (11/30/10) | | | -6.86 | % |
5 Years | | | -7.33 | |
1 Year | | | 0.73 | |
| |
Class B Shares | | | | |
Inception (11/30/10) | | | -6.78 | % |
5 Years | | | -7.32 | |
1 Year | | | 0.90 | |
| |
Class C Shares | | | | |
Inception (11/30/10) | | | -6.65 | % |
5 Years | | | -6.98 | |
1 Year | | | 4.91 | |
| |
Class R Shares | | | | |
Inception (11/30/10) | | | -6.13 | % |
5 Years | | | -6.47 | |
1 Year | | | 6.55 | |
| |
Class Y Shares | | | | |
Inception (11/30/10) | | | -5.67 | % |
5 Years | | | -6.02 | |
1 Year | | | 6.86 | |
| |
Class R5 Shares | | | | |
Inception (11/30/10) | | | -5.62 | % |
5 Years | | | -5.94 | |
1 Year | | | 7.00 | |
| |
Class R6 Shares | | | | |
Inception | | | -5.72 | % |
5 Years | | | -6.01 | |
1 Year | | | 7.15 | |
Class R6 shares incepted on September 24, 2012. Performance shown prior to that date is that of Class A shares and includes the 12b-1 fees applicable to Class A shares.
The performance data quoted represent past performance and cannot guarantee comparable future results; current performance may be lower or higher. Please visit invesco.com/performance for the most recent month-end performance. Performance figures reflect reinvested distributions, changes in net asset value and the effect of the maximum sales charge unless otherwise stated. Investment return and principal value will fluctuate so that you may have a gain or loss when you sell shares.
The net annual Fund operating expense ratio set forth in the most recent Fund prospectus as of the date of this report for Class A, Class B, Class C, Class R, Class Y, Class R5 and Class R6
shares was 1.60%, 2.35%, 2.35%, 1.85%, 1.35%, 1.20% and 1.10%, respectively.1 The total annual Fund operating expense ratio set forth in the most recent Fund prospectus as of the date of this report for Class A, Class B, Class C, Class R, Class Y, Class R5 and Class R6 shares was 1.64%, 2.39%, 2.39%, 1.89%, 1.39%, 1.24% and 1.14%, respectively. The expense ratios presented above may vary from the expense ratios presented in other sections of this report that are based on expenses incurred during the period covered by this report.
Class A share performance reflects the maximum 5.50% sales charge, and Class B and Class C share performance reflects the applicable contingent deferred sales charge (CDSC) for the period involved. The CDSC on Class B shares declines from 5% beginning at the time of purchase to 0% at the beginning of the seventh year. The CDSC
on Class C shares is 1% for the first year after purchase. Class R, Class Y, Class R5 and Class R6 shares do not have a front-end sales charge or a CDSC; therefore, performance is at net asset value.
The performance of the Fund’s share classes will differ primarily due to different sales charge structures and class expenses.
Fund performance reflects any applicable fee waivers and/or expense reimbursements. Had the adviser not waived fees and/or reimbursed expenses currently or in the past, returns would have been lower. See current prospectus for more information.
| 1 | Total annual Fund operating expenses after any contractual fee waivers and/or expense reimbursements by the adviser in effect through at least June 30, 2018. See current prospectus for more information. |
7 Invesco Balanced-Risk Commodity Strategy Fund
Invesco Balanced-Risk Commodity Strategy Fund’s investment objective is to provide total return.
| ∎ | | Unless otherwise stated, information presented in this report is as of October 31, 2016, and is based on total net assets. |
| ∎ | | Unless otherwise noted, all data provided by Invesco. |
| ∎ | | To access your Fund’s reports/prospectus, visit invesco.com/fundreports. |
About share classes
| ∎ | | Class B shares may not be purchased for new or additional investments. Please see the prospectus for more information. |
| ∎ | | Class R shares are generally available only to employer sponsored retirement and benefit plans. Please see the prospectus for more information. |
| ∎ | | Class Y shares are available only to certain investors. Please see the prospectus for more information. |
| ∎ | | Class R5 shares and Class R6 shares are primarily intended for employer sponsored retirement and benefit plans that meet certain standards and for institutional investors. Please see the prospectus for more information. |
Principal risks of investing in the Fund
| ∎ | | Commodities tax risk. The tax treatment of commodity-linked derivative instruments may be adversely affected by changes in legislation, regulations or other legally binding authority. If, as a result of any such adverse action, the income of the Fund from certain commodity-linked derivatives was treated as non-qualifying income, the Fund might fail to qualify as a regulated investment company and be subject to federal income tax at the Fund level. Should the Internal Revenue Service issue guidance, or Congress enact legislation, that adversely affects the tax treatment of the Fund’s use of commodity-linked notes or the Subsidiary (which guidance might be applied to the Fund retroactively), it could, among other consequences, limit the Fund’s ability to pursue its investment strategy. |
| ∎ | | Commodity-linked notes risk. In addition to risks associated with the underlying commodities, investments in commodity-linked notes may be subject to additional risks, such as non-payment of interest and loss of principal, counterparty risk, lack of a secondary market and risk of greater volatility than traditional equity and debt securities. The value of the commodity-linked notes the Fund buys may fluctuate significantly because the values of |
| | | the underlying investments to which they are linked are themselves volatile. Additionally, certain commodity-linked notes employ “economic” leverage by requiring payment by the issuer of an amount that is a multiple of the price increase or decrease of the underlying commodity, commodity index, or other economic variable. Such economic leverage will increase the volatility of the value of these commodity-linked notes and the Fund to the extent it invests in such notes. |
| ∎ | | Commodity risk. The Fund will concentrate its investments in commodities markets and will therefore have investment exposure to the commodities markets and one or more sectors of the commodities markets, which may subject the Fund to greater volatility than investments in traditional securities, such as stocks and bonds. Volatility in the commodities markets may be caused by changes in overall market movements, domestic and foreign political and economic events and policies, war, acts of terrorism, changes in domestic or foreign interest rates and/or investor expectations concerning interest rates, domestic and foreign inflation rates, investment and trading activities of mutual funds, hedge funds and commodities funds, and factors such as drought, floods, weather, livestock disease, embargoes, tariffs and other regulatory developments, or supply and demand disruptions. Because the Fund’s performance is linked to the performance of volatile commodities, investors should be willing to assume the risks of potentially significant fluctuations in the value of the Fund’s shares. |
| ∎ | | Correlation risk. Because the Fund’s investment strategy seeks to balance risk across the four sectors of the commodities market and, within each commodity sector, across different commodities, to the extent either the sectors of the commodities markets or the selected commodities become correlated in a way not anticipated by the Adviser the Fund’s risk allocation process may result in magnified risks and loss instead of balancing (reducing) the risk of loss. |
| ∎ | | Debt securities risk. The prices of debt securities held by the Fund will be affected by changes in interest rates, the creditworthiness of the issuer and other factors. An increase in prevailing interest rates typically causes the value of existing debt securities to fall and often has a greater impact on longer-duration debt securities and higher quality debt securities. Falling interest rates will cause the Fund to reinvest the proceeds of debt securities that have been repaid by the issuer at lower interest rates. Falling interest rates may also reduce the Fund’s distributable income because interest payments on floating rate debt instruments held by the Fund will decline. The Fund could lose money on investments in debt securities if the issuer or borrower fails to meet its obligations to make interest payments and/or to repay principal in a timely manner. Changes in an issuer’s financial strength, the market’s perception of such strength or in the credit rating of the issuer or the security may affect the value of debt securities. The Adviser’s credit analysis may fail to anticipate such changes, which could result in buying a debt security at an inopportune time or failing to sell a debt security in advance of a price decline or other credit event. |
| ∎ | | Derivatives risk. The value of a derivative instrument depends largely on (and is derived from) the value of an underlying security, currency, commodity, interest rate, index or other asset (each referred to as an underlying asset). In addition to risks relating to the underlying assets, the use of derivatives may include other, possibly greater, risks, including counterparty, leverage and liquidity risks. Counterparty risk is the risk that the counterparty to the derivative contract will default on its obligation to pay the Fund the amount owed or otherwise perform under the derivative contract. Derivatives create leverage risk because they do not require payment up front equal to the economic exposure created by owning the derivative. As a result, an adverse change in the value |
|
This report must be accompanied or preceded by a currently effective Fund prospectus, which contains more complete information, including sales charges and expenses. Investors should read it carefully before investing. |
|
NOT FDIC INSURED | MAY LOSE VALUE | NO BANK GUARANTEE |
8 Invesco Balanced-Risk Commodity Strategy Fund
of the underlying asset could result in the Fund sustaining a loss that is substantially greater than the amount invested in the derivative, which may make the Fund’s returns more volatile and increase the risk of loss. Derivative instruments may also be less liquid than more traditional investments and the Fund may be unable to sell or close out its derivative positions at a desirable time or price. This risk may be more acute under adverse market conditions, during which the Fund may be most in need of liquidating its derivative positions. Derivatives may also be harder to value, less tax efficient and subject to changing government regulation that could impact the Fund’s ability to use certain derivatives or their cost. Also, derivatives used for hedging or to gain or limit exposure to a particular market segment may not provide the expected benefits, particularly during adverse market conditions. These risks are greater for the Fund than most other mutual funds because the Fund will implement its investment strategy primarily through derivative instruments rather than direct investments in stocks/bonds.
| ∎ | | Exchange-traded funds risk. In addition to the risks associated with the underlying assets held by the exchange-traded fund, investments in exchange-traded funds are subject to the following additional risks: (1) an exchange-traded fund’s shares may trade above or below its net asset value; (2) an active trading market for the exchange-traded fund’s shares may not develop or be maintained; (3) trading an exchange-traded fund’s shares may be halted by the listing exchange; (4) a passively managed exchange-traded fund may not track the performance of the reference asset; and (5) a passively managed exchange-traded fund may hold troubled securities. Investment in exchange-traded funds may involve duplication of management fees and certain other expenses, as the Fund indirectly bears its proportionate share of any expenses paid by the exchange-traded funds in which it invests. Further, certain exchange-traded funds in which the Fund may invest are leveraged, which may result in economic leverage, permitting the Fund to gain exposure |
that is greater than would be the case in an unlevered instrument and potentially resulting in greater volatility.
| ∎ | | Exchange-traded notes risk. Exchange-traded notes are subject to credit risk, counterparty risk, and the risk that the value of the exchange-traded note may drop due to a downgrade in the issuer’s credit rating. The value of an exchange-traded note may also be influenced by time to maturity, level of supply and demand for the exchange-traded note, volatility and lack of liquidity in the underlying market, changes in the applicable interest rates, and economic, legal, political, or geographic events that affect the referenced underlying market or assets. The Fund will bear its proportionate share of any fees and expenses borne by an exchange-traded note in which it invests. For certain exchange-traded notes, there may be restrictions on the Fund’s right to redeem its investment, which is meant to be held until maturity. |
| ∎ | | Management risk. The Fund is actively managed and depends heavily on the Adviser’s judgment about markets, interest rates or the attractiveness, relative values, liquidity, or potential appreciation of particular investments made for the Fund’s portfolio. The Fund could experience losses if these judgments prove to be incorrect. Because the Fund’s investment process relies heavily on its asset allocation process, market movements that are counter to the portfolio managers’ expectations may have a significant adverse effect on the Fund’s net asset value. Additionally, legislative, regulatory, or tax developments may adversely affect management of the Fund and, therefore, the ability of the Fund to achieve its investment objective. |
| ∎ | | Market risk. The market values of the Fund’s investments, and therefore the value of the Fund’s shares, will go up and down, sometimes rapidly or unpredictably. Market risk may affect a single issuer, industry or section of the economy, or it may affect the market as a whole. Individual stock prices tend to go up and down more dramatically than those of certain other types of investments, such as bonds. During a general downturn in the financial markets, multiple asset classes may decline in value. When markets perform well, there can |
be no assurance that specific investments held by the Fund will rise in value.
| ∎ | | Short position risk. Because the Fund’s potential loss on a short position arises from increases in the value of the asset sold short, the Fund will incur a loss on a short position, which is theoretically unlimited, if the price of the asset sold short increases from the short sale price. The counterparty to a short position or other market factors may prevent the Fund from closing out a short position at a desirable time or price and may reduce or eliminate any gain or result in a loss. In a rising market, the Fund’s short positions will cause the Fund to underperform the overall market and its peers that do not engage in shorting. If the Fund holds both long and short positions, and both positions decline simultaneously, the short positions will not provide any buffer (hedge) from declines in value of the Fund’s long positions. Certain types of short positions involve leverage, which may exaggerate any losses, potentially more than the actual cost of the investment, and will increase the volatility of the Fund’s returns. |
| ∎ | | Subsidiary risk. By investing in the Subsidiary, the Fund is indirectly exposed to risks associated with the Subsidiary’s investments. The Subsidiary is not registered under the Investment Company Act of 1940, as amended (1940 Act), and, except as otherwise noted in the prospectus, is not subject to the investor protections of the 1940 Act. Changes in the laws of the United States and/or the Cayman Islands, under which the Fund and the Subsidiary, respectively, are organized, could result in the inability of the Fund and/or the Subsidiary to operate as described in the prospectus and the SAI, and could negatively affect the Fund and its shareholders. |
| ∎ | | US government obligations risk. Obligations of US government agencies and authorities receive varying levels of support and may not be backed by the full faith and credit of the US government, which could affect the Fund’s ability to recover should they default. No assurance can be given that the US government will provide financial support to its agencies and authorities if it is not obligated by law to do so. |
continued on page 6
9 Invesco Balanced-Risk Commodity Strategy Fund
Consolidated Schedule of Investments
October 31, 2016
| | | | | | | | | | | | | | | | |
| | | Interest
Rate | | | Maturity
Date | | | Principal
Amount | | | Value | |
U.S. Treasury Securities–55.82% | | | | | | | | | | | | | | | | |
| U.S. Treasury Bills–33.74%(a) | | | | | | | | | | | | | | | | |
U.S. Treasury Bills | | | 0.27 | % | | | 11/03/2016 | | | $ | 68,600,000 | | | $ | 68,599,580 | |
U.S. Treasury Bills(b)(c) | | | 0.33 | % | | | 12/08/2016 | | | | 11,960,000 | | | | 11,957,971 | |
U.S. Treasury Bills(b) | | | 0.34 | % | | | 12/15/2016 | | | | 12,190,000 | | | | 12,187,392 | |
U.S. Treasury Bills | | | 0.34 | % | | | 12/15/2016 | | | | 14,680,000 | | | | 14,676,859 | |
U.S. Treasury Bills(b) | | | 0.34 | % | | | 01/05/2017 | | | | 5,400,000 | | | | 5,397,464 | |
U.S. Treasury Bills(b)(c) | | | 0.40 | % | | | 01/26/2017 | | | | 10,550,000 | | | | 10,542,437 | |
U.S. Treasury Bills | | | 0.40 | % | | | 01/26/2017 | | | | 43,060,000 | | | | 43,029,133 | |
U.S. Treasury Bills(b) | | | 0.46 | % | | | 04/06/2017 | | | | 13,360,000 | | | | 13,335,680 | |
U.S. Treasury Bills | | | 0.47 | % | | | 06/22/2017 | | | | 29,000,000 | | | | 28,905,196 | |
U.S. Treasury Bills(b)(c) | | | 0.57 | % | | | 08/17/2017 | | | | 6,440,000 | | | | 6,411,043 | |
U.S. Treasury Bills | | | 0.57 | % | | | 08/17/2017 | | | | 62,000,000 | | | | 61,721,225 | |
| | | | | | | | | | | | | | | | 276,763,980 | |
| | | | |
| U.S. Treasury Notes–22.08%(d) | | | | | | | | | | | | | | | | |
U.S. Treasury Floating Rate Notes(b) | | | 0.61 | % | | | 01/31/2018 | | | | 8,410,000 | | | | 8,431,042 | |
U.S. Treasury Floating Rate Notes | | | 0.61 | % | | | 01/31/2018 | | | | 62,880,000 | | | | 63,037,326 | |
U.S. Treasury Floating Rate Notes(b) | | | 0.53 | % | | | 04/30/2018 | | | | 6,180,000 | | | | 6,187,910 | |
U.S. Treasury Floating Rate Notes | | | 0.53 | % | | | 04/30/2018 | | | | 53,010,000 | | | | 53,077,853 | |
U.S. Treasury Floating Rate Notes(b) | | | 0.51 | % | | | 07/31/2018 | | | | 6,450,000 | | | | 6,452,725 | |
U.S. Treasury Floating Rate Notes | | | 0.51 | % | | | 07/31/2018 | | | | 43,910,000 | | | | 43,928,549 | |
| | | | | 181,115,405 | |
Total U.S. Treasury Securities (Cost $457,583,851) | | | | | | | 457,879,385 | |
| | | |
| | | | Expiration
Date | | | | | | | |
Commodity-Linked Securities–5.18% | | | | | | | | | | | | | | | | |
Barclays PLC (United Kingdom), U.S. Federal Funds (Effective) rate minus 0.06% (linked to the Barclays Diversified Energy-Metals TR Index Total Return, multiplied by 3)(e) | | | | | | | 06/12/2017 | | | | 20,250,000 | | | | 23,146,021 | |
International Bank for Reconstruction and Development, U.S. Federal Funds (Effective) rate minus 0.60% (linked to the Barclays Diversified Energy-Metals TR Index Total Return, multiplied by 3)(e) | | | | | | | 04/26/2018 | | | | 20,000,000 | | | | 19,345,241 | |
Total Commodity-Linked Securities (Cost $40,250,000) | | | | | | | 42,491,262 | |
| | |
| | | | Shares | | | | |
Exchange Traded Fund–1.94% | | | | | | | | | | | | | | | | |
PowerShares DB Gold Fund (Cost $20,864,052)(f) | | | | 385,000 | | | | 15,900,500 | |
| | |
Money Market Funds–31.33% | | | | | | | | | |
Government & Agency Portfolio–Institutional Class, 0.29%(g) | | | | 141,868,735 | | | | 141,868,735 | |
STIC (Global Series) PLC–U.S. Dollar Liquidity Portfolio (Ireland)–Institutional Class, 0.62%(b)(g) | | | | 20,611,791 | | | | 20,611,791 | |
Treasury Portfolio–Institutional Class, 0.22%(g) | | | | 94,579,156 | | | | 94,579,156 | |
Total Money Market Funds (Cost $257,059,682) | | | | | | | 257,059,682 | |
TOTAL INVESTMENTS–94.27% (Cost $775,757,585) | | | | 773,330,829 | |
OTHER ASSETS LESS LIABILITIES–5.73% | | | | 46,986,779 | |
NET ASSETS–100.00% | | | | | | | | | | | | | | $ | 820,317,608 | |
See accompanying Notes to Consolidated Financial Statements which are an integral part of the financial statements.
10 Invesco Balanced-Risk Commodity Strategy Fund
| | | | | | | | | | | | | | | | | | | | | | | | | | | | |
| Open Futures Contracts | |
| Futures Contracts | | | | | | | | Type of
Contract | | | Number of
Contracts | | | Expiration Month | | | Notional Value | | | Unrealized
Appreciation
(Depreciation) | |
Cocoa(b) | | | | | | | | | | | Long | | | | 86 | | | | March-2017 | | | $ | 2,272,980 | | | $ | (579 | ) |
Coffee C(b) | | | | | | | | | | | Long | | | | 392 | | | | December-2016 | | | | 24,130,050 | | | | 3,345,819 | |
Corn(b) | | | | | | | | | | | Long | | | | 1,415 | | | | December-2016 | | | | 25,098,563 | | | | (2,820,936 | ) |
Cotton No. 2(b) | | | | | | | | | | | Long | | | | 686 | | | | December-2016 | | | | 23,618,980 | | | | 292,061 | |
Lean Hogs(b) | | | | | | | | | | | Short | | | | 153 | | | | December-2016 | | | | (2,934,540 | ) | | | 495,461 | |
LME Nickel(b) | | | | | | | | | | | Long | | | | 162 | | | | December-2016 | | | | 10,162,746 | | | | 151,616 | |
LME Zinc(b) | | | | | | | | | | | Long | | | | 259 | | | | January-2017 | | | | 15,938,213 | | | | 890,805 | |
NYH RBOB Gasoline (Globex)(b) | | | | | | | | | | | Long | | | | 660 | | | | December-2016 | | | | 39,348,540 | | | | (1,859,788 | ) |
Soybeans(b) | | | | | | | | | | | Long | | | | 427 | | | | July-2017 | | | | 21,958,475 | | | | 1,000,879 | |
Wheat(b) | | | | | | | | | | | Long | | | | 582 | | | | December-2016 | | | | 12,112,875 | | | | (669,931 | ) |
Total Futures Contracts — Commodity Risk | | | | | | | | | | | | | | | | | | | | | | | $ | 825,407 | |
| | | | | | | |
| | | | | | | | | | | | | | | | | | | | | | | | | | | | |
| Open Over-The-Counter Total Return Swap Agreements | |
| Counterparty | | Pay/
Receive | | | Reference Entity | | | Fixed
Rate | | | Number of
Contracts | | | Termination Date | | | Notional Value | | | Unrealized
Appreciation
(Depreciation) | |
Barclays Bank PLC | | | Receive | | |
| Barclays Brent Crude Roll
Yield Excess Return Index(b) |
| | | 0.35 | % | | | 106,100 | | | | March–2017 | | | $ | 29,162,614 | | | $ | (1,501,527 | ) |
Barclays Bank PLC | | | Receive | | |
| Barclays Live Cattle Roll Yield
Excess Return Index(b) |
| | | 0.47 | | | | 43,700 | | | | February–2017 | | | | 4,692,480 | | | | 132,411 | |
Barclays Bank PLC | | | Receive | | |
| Barclays Soybeans
Seasonal Excess Return Index(b) |
| | | 0.30 | | | | 103,300 | | | | June–2017 | | | | 30,651,248 | | | | 740,144 | |
Barclays Bank PLC | | | Receive | | |
| Barclays WTI Crude Roll Yield
Excess Return Index(b) |
| | | 0.35 | | | | 82,900 | | | | March–2017 | | | | 20,478,124 | | | | (1,137,463 | ) |
Barclays Bank PLC | | | Receive | | |
| Optimum GSCI Heating Oil
Roll Yield 9m Excess Return Index(b) |
| | | 0.37 | | | | 91,300 | | | | February–2017 | | | | 20,961,138 | | | | (970,236 | ) |
Canadian Imperial Bank of Commerce | | | Receive | | | | CIBC Silver Index(b) | | | | 0.11 | | | | 164,000 | | | | February–2017 | | | | 16,787,844 | | | | 275,176 | |
Goldman Sachs International | | | Receive | | |
| Enhanced Strategy AB31 on the
S&P GSCI Cotton Excess Return
Index(b) |
| | | 0.45 | | | | 928,000 | | | | October–2017 | | | | 34,316,855 | | | | 888,124 | |
Goldman Sachs International | | | Receive | | |
| Enhanced Strategy Sugar A141
on the S&P GSCI Sugar Excess
Return Index(b) |
| | | 0.37 | | | | 117,200 | | | | March–2017 | | | | 38,470,877 | | | | (3,038,926 | ) |
Goldman Sachs International | | | Receive | | |
| S&P GSCI Soybean Meal Excess
Return Index(b) |
| | | 0.30 | | | | 46,050 | | | | February–2017 | | | | 50,589,287 | | | | 2,679,424 | |
JPMorgan Chase Bank, N.A. | | | Receive | | |
| J.P. Morgan Contag Beta
Gas Oil Excess Return Index(b) |
| | | 0.25 | | | | 48,300 | | | | April–2017 | | | | 10,219,763 | | | | (527,190 | ) |
JPMorgan Chase Bank, N.A. | | | Receive | | |
| S&P GSCI Gold Index Excess
Return(b) |
| | | 0.09 | | | | 587,000 | | | | October–2017 | | | | 61,426,380 | | | | 456,862 | |
Macquarie Bank Ltd. | | | Receive | | |
| Macquarie Single Commodity
Silver type A Excess Return Index(b) |
| | | 0.16 | | | | 288,700 | | | | May–2017 | | | | 61,180,669 | | | | 55,055 | |
Macquarie Bank Ltd. | | | Receive | | |
| Modified Macquarie Single
Commodity Sugar type A Excess
Return Index(b) |
| | | 0.34 | | | | 82,100 | | | | January–2017 | | | | 23,739,905 | | | | (1,408,031 | ) |
Merrill Lynch International | | | Receive | | |
| Merrill Lynch Gold Excess Return
Index(b) |
| | | 0.14 | | | | 202,900 | | | | June–2017 | | | | 33,523,179 | | | | 0 | |
Merrill Lynch International | | | Receive | | |
| MLCX Aluminum Annual Excess
Return Index(b) |
| | | 0.28 | | | | 714,000 | | | | September–2017 | | | | 70,178,225 | | | | 0 | |
Merrill Lynch International | | | Receive | | |
| MLCX Dynamic Enhanced Copper
Excess Return Index(b) |
| | | 0.25 | | | | 158,250 | | | | May–2017 | | | | 74,817,688 | | | | 0 | |
Merrill Lynch International | | | Receive | | |
| MLCX Natural Gas Annual Excess
Return Index(b) |
| | | 0.25 | | | | 522,500 | | | | August–2017 | | | | 25,223,144 | | | | 0 | |
Morgan Stanley Capital Services LLC | | | Receive | | |
| MS Soybean Oil Dynamic
Roll Index(b) |
| | | 0.30 | | | | 113,200 | | | | April–2017 | | | | 18,567,041 | | | | (204,824 | ) |
Total Swap Agreements — Commodity Risk | | | | | | | | | | | | | | | | | | | | | | | $ | (3,561,001 | ) |
See accompanying Notes to Consolidated Financial Statements which are an integral part of the financial statements.
11 Invesco Balanced-Risk Commodity Strategy Fund
Index Information:
| | |
| Barclays Diversified Energy-Metals Total Return Index | | – a basket of indices that provide exposure to various components of the energy and metals markets. The underlying commodities comprising the indices are: Brent Crude Oil, Copper, Gasoil, Gold, Silver, Unleaded Gasoline and WTI Crude Oil. |
Notes to Consolidated Schedule of Investments:
| (a) | Security traded on a discount basis. The interest rate shown represents the discount rate at the time of purchase by the Fund. |
| (b) | The investment is owned by the Subsidiary. See Note 5. |
| (c) | All or a portion of the value was pledged as collateral to cover margin requirements for open futures contracts. See Note 1J and Note 4. |
| (d) | Interest or dividend rate is redetermined periodically. Rate shown is the rate in effect on October 31, 2016. |
| (e) | Security purchased or received in a transaction exempt from registration under the Securities Act of 1933, as amended (the “1933 Act”). The security may be resold pursuant to an exemption from registration under the 1933 Act, typically to qualified institutional buyers. The aggregate value of these securities at October 31, 2016 was $42,491,262, which represented 5.18% of the Fund’s Net Assets. |
| (f) | Affiliated company during the period. The Investment Company Act of 1940 defines an “affiliated person” as an issuance in which a fund holds 5% or more of the outstanding voting securities. The Fund has not owned enough of the outstanding voting securities of the issuer to have control (as defined in the Investment Company Act of 1940) of that issuer. The value of this security as of October 31, 2016 represented 1.94% of the Fund’s Net Assets. See Note 6. |
| (g) | The money market fund and the Fund are affiliated by having the same investment adviser. The rate shown is the 7-day SEC standardized yield as of October 31, 2016. |
See accompanying Notes to Consolidated Financial Statements which are an integral part of the financial statements.
12 Invesco Balanced-Risk Commodity Strategy Fund
Consolidated Statement of Assets and Liabilities
October 31, 2016
| | | | |
Assets: | |
Investments, at value (Cost $497,833,851) | | $ | 500,370,647 | |
Investments in affiliates, at value (Cost $ 277,923,734) | | | 272,960,182 | |
Total investments, at value (Cost $775,757,585) | | | 773,330,829 | |
Receivable for: | | | | |
Deposits with brokers for open swap agreements | | | 43,903,500 | |
Fund shares sold | | | 6,072,008 | |
Dividends and interest | | | 101,559 | |
Swaps receivables | | | 3,257,987 | |
Investment for trustee deferred compensation and retirement plans | | | 65,679 | |
Unrealized appreciation on swap agreements — OTC | | | 5,227,196 | |
Other assets | | | 71,343 | |
Total assets | | | 832,030,101 | |
|
Liabilities: | |
Payable for: | | | | |
Fund shares reacquired | | | 627,711 | |
Swaps payable | | | 1,461,353 | |
Variation margin — futures | | | 382,817 | |
Accrued fees to affiliates | | | 249,937 | |
Accrued trustees’ and officers’ fees and benefits | | | 2,193 | |
Accrued other operating expenses | | | 69,303 | |
Trustee deferred compensation and retirement plans | | | 130,982 | |
Unrealized depreciation on swap agreements — OTC | | | 8,788,197 | |
Total liabilities | | | 11,712,493 | |
Net assets applicable to shares outstanding | | $ | 820,317,608 | |
|
Net assets consist of: | |
Shares of beneficial interest | | $ | 840,838,755 | |
Undistributed net investment income | | | 33,321,004 | |
Undistributed net realized gain (loss) | | | (48,679,801 | ) |
Net unrealized appreciation (depreciation) | | | (5,162,350 | ) |
| | | $ | 820,317,608 | |
| | | | |
Net Assets: | |
Class A | | $ | 40,843,674 | |
Class B | | $ | 152,128 | |
Class C | | $ | 5,914,701 | |
Class R | | $ | 781,826 | |
Class Y | | $ | 574,877,764 | |
Class R5 | | $ | 195,776,586 | |
Class R6 | | $ | 1,970,929 | |
|
Shares outstanding, $0.01 par value per share,
with an unlimited number of shares authorized: | |
Class A | | | 5,975,306 | |
Class B | | | 23,132 | |
Class C | | | 900,898 | |
Class R | | | 115,616 | |
Class Y | | | 82,726,342 | |
Class R5 | | | 28,097,892 | |
Class R6 | | | 282,197 | |
Class A: | | | | |
Net asset value per share | | $ | 6.84 | |
Maximum offering price per share | | | | |
(Net asset value of $6.84 ¸ 94.50%) | | $ | 7.24 | |
Class B: | | | | |
Net asset value and offering price per share | | $ | 6.58 | |
Class C: | | | | |
Net asset value and offering price per share | | $ | 6.57 | |
Class R: | | | | |
Net asset value and offering price per share | | $ | 6.76 | |
Class Y: | | | | |
Net asset value and offering price per share | | $ | 6.95 | |
Class R5: | | | | |
Net asset value and offering price per share | | $ | 6.97 | |
Class R6: | | | | |
Net asset value and offering price per share | | $ | 6.98 | |
See accompanying Notes to Consolidated Financial Statements which are an integral part of the financial statements.
13 Invesco Balanced-Risk Commodity Strategy Fund
Consolidated Statement of Operations
For the year ended October 31, 2016
| | | | |
Investment income: | |
Dividends from affiliates | | $ | 835,592 | |
Interest | | | 1,599,129 | |
Total investment income | | | 2,434,721 | |
| |
Expenses: | | | | |
Advisory fees | | | 6,877,980 | |
Administrative services fees | | | 183,881 | |
Custodian fees | | | 28,831 | |
Distribution fees: | | | | |
Class A | | | 92,043 | |
Class B | | | 1,945 | |
Class C | | | 32,326 | |
Class R | | | 2,488 | |
Transfer agent fees — A, B, C, R and Y | | | 751,196 | |
Transfer agent fees — R5 | | | 242,313 | |
Transfer agent fees — R6 | | | 338 | |
Trustees’ and officers’ fees and benefits | | | 34,381 | |
Registration and filing fees | | | 117,004 | |
Reports to shareholders | | | 97,386 | |
Professional services fees | | | 89,884 | |
Other | | | 34,454 | |
Total expenses | | | 8,586,450 | |
Less: Fees waived and expense offset arrangement(s) | | | (580,336 | ) |
Net expenses | | | 8,006,114 | |
Net investment income (loss) | | | (5,571,393 | ) |
| |
Realized and unrealized gain (loss) from: | | | | |
Net realized gain (loss) from: | | | | |
Investment securities | | | (6,807,388 | ) |
Futures contracts | | | (5,662,324 | ) |
Swap agreements | | | 38,588,109 | |
| | | | 26,118,397 | |
Change in net unrealized appreciation (depreciation) of: | | | | |
Investment securities | | | 7,540,512 | |
Futures contracts | | | 3,578,020 | |
Swap agreements | | | (1,823,328 | ) |
| | | | 9,295,204 | |
Net realized and unrealized gain | | | 35,413,601 | |
Net increase in net assets resulting from operations | | $ | 29,842,208 | |
See accompanying Notes to Consolidated Financial Statements which are an integral part of the financial statements.
14 Invesco Balanced-Risk Commodity Strategy Fund
Consolidated Statement of Changes in Net Assets
For the years ended October 31, 2016 and 2015
| | | | | | | | |
| | | 2016 | | | 2015 | |
Operations: | | | | | |
Net investment income (loss) | | $ | (5,571,393 | ) | | $ | (7,756,931 | ) |
Net realized gain (loss) | | | 26,118,397 | | | | (134,498,509 | ) |
Change in net unrealized appreciation | | | 9,295,204 | | | | 2,450,038 | |
Net increase (decrease) in net assets resulting from operations | | | 29,842,208 | | | | (139,805,402 | ) |
| | |
Share transactions–net: | | | | | | | | |
Class A | | | 3,941,729 | | | | (4,063,412 | ) |
Class B | | | (109,926 | ) | | | (174,641 | ) |
Class C | | | 3,261,855 | | | | (420,247 | ) |
Class R | | | 395,187 | | | | 70,412 | |
Class Y | | | 334,368,542 | | | | 302,605 | |
Class R5 | | | (77,810,884 | ) | | | 44,452,063 | |
Class R6 | | | (106,334,147 | ) | | | 11,895,316 | |
Net increase (decrease) in net assets resulting from share transactions | | | 157,712,356 | | | | (52,062,096 | ) |
Net increase (decrease) in net assets | | | 187,554,564 | | | | (87,743,306 | ) |
| | |
Net assets: | | | | | | | | |
Beginning of year | | | 632,763,044 | | | | 720,506,350 | |
End of year (includes undistributed net investment income of $33,321,004 and $4,027,493, respectively) | | $ | 820,317,608 | | | $ | 632,763,044 | |
Notes to Consolidated Financial Statements
October 31, 2016
NOTE 1—Significant Accounting Policies
Invesco Balanced-Risk Commodity Strategy Fund (the “Fund”) is a series portfolio of AIM Investment Funds (Invesco Investment Funds) (the “Trust”). The Trust is organized as a Delaware statutory trust and is registered under the Investment Company Act of 1940, as amended (the “1940 Act”), as an open-end series management investment company consisting of twenty-two separate series portfolios, each authorized to issue an unlimited number of shares of beneficial interest. The assets, liabilities and operations of each portfolio are accounted for separately. Information presented in these consolidated financial statements pertains only to the Fund. Matters affecting each portfolio or class will be voted on exclusively by the shareholders of such portfolio or class.
The Fund will seek to gain exposure to the commodity markets primarily through investments in the Invesco Cayman Commodity Fund III Ltd. (the “Subsidiary”), a wholly-owned subsidiary of the Fund organized under the laws of the Cayman Islands. The Subsidiary was organized by the Fund to invest in commodity-linked derivatives and other securities that may provide leveraged and non-leveraged exposure to commodities. The Fund may invest up to 25% of its total assets in the Subsidiary.
The Fund’s investment objective is to provide total return.
The Fund currently consists of seven different classes of shares: Class A, Class B, Class C, Class R, Class Y, Class R5 and Class R6. Class Y shares are available only to certain investors. Class A shares are sold with a front-end sales charge unless certain waiver criteria are met and under certain circumstances load waived shares may be subject to contingent deferred sales charges (“CDSC”). Class C shares are sold with a CDSC. Class R, Class Y, Class R5 and Class R6 shares are sold at net asset value. Effective November 30, 2010, new or additional investments in Class B shares are no longer permitted. Existing shareholders of Class B shares may continue to reinvest dividends and capital gains distributions in Class B shares until they convert to Class A shares. Also, shareholders in Class B shares will be able to exchange those shares for Class B shares of other Invesco Funds offering such shares until they convert to Class A shares. Generally, Class B shares will automatically convert to Class A shares on or about the month-end, which is at least eight years after the date of purchase. Redemption of Class B shares prior to the conversion date will be subject to a CDSC.
The following is a summary of the significant accounting policies followed by the Fund in the preparation of its consolidated financial statements.
| A. | Security Valuations — Securities, including restricted securities, are valued according to the following policy. |
Debt obligations (including convertible securities) and unlisted equities are fair valued using an evaluated quote provided by an independent pricing service. Evaluated quotes provided by the pricing service may be determined without exclusive reliance on quoted prices, and may reflect appropriate factors such as institution-size trading in similar groups of securities, developments related to specific securities, dividend rate (for unlisted equities), yield (for debt obligations), quality, type of issue, coupon rate (for debt obligations), maturity (for debt obligations), individual trading characteristics and other market data. Debt obligations are subject to interest rate and credit risks. In addition, all debt obligations involve some risk of default with respect to interest and/or principal payments.
A security listed or traded on an exchange (except convertible securities) is valued at its last sales price or official closing price as of the close of the customary trading session on the exchange where the security is principally traded, or lacking any sales or official closing price on a particular day, the security may be valued at the closing bid price on that day. Securities traded in the over-the-counter market are valued based on prices furnished by independent pricing services or market makers. When such securities are valued by an independent pricing service they
15 Invesco Balanced-Risk Commodity Strategy Fund
may be considered fair valued. Futures contracts are valued at the final settlement price set by an exchange on which they are principally traded. Listed options are valued at the mean between the last bid and asked prices from the exchange on which they are principally traded. Options not listed on an exchange are valued by an independent source at the mean between the last bid and asked prices. For purposes of determining net asset value (“NAV”) per share, futures and option contracts generally are valued 15 minutes after the close of the customary trading session of the New York Stock Exchange (“NYSE”).
Investments in open-end and closed-end registered investment companies that do not trade on an exchange are valued at the end-of-day net asset value per share. Investments in open-end and closed-end registered investment companies that trade on an exchange are valued at the last sales price or official closing price as of the close of the customary trading session on the exchange where the security is principally traded.
Swap agreements are fair valued using an evaluated quote, if available, provided by an independent pricing service. Evaluated quotes provided by the pricing service are valued based on a model which may include end-of-day net present values, spreads, ratings, industry, company performance and returns of referenced assets.
Foreign securities’ (including foreign exchange contracts) prices are converted into U.S. dollar amounts using the applicable exchange rates as of the close of the NYSE. If market quotations are available and reliable for foreign exchange-traded equity securities, the securities will be valued at the market quotations. Because trading hours for certain foreign securities end before the close of the NYSE, closing market quotations may become unreliable. If between the time trading ends on a particular security and the close of the customary trading session on the NYSE, events occur that the Adviser determines are significant and make the closing price unreliable, the Fund may fair value the security. If the event is likely to have affected the closing price of the security, the security will be valued at fair value in good faith using procedures approved by the Board of Trustees. Adjustments to closing prices to reflect fair value may also be based on a screening process of an independent pricing service to indicate the degree of certainty, based on historical data, that the closing price in the principal market where a foreign security trades is not the current value as of the close of the NYSE. Foreign securities’ prices meeting the approved degree of certainty that the price is not reflective of current value will be priced at the indication of fair value from the independent pricing service. Multiple factors may be considered by the independent pricing service in determining adjustments to reflect fair value and may include information relating to sector indices, American Depositary Receipts and domestic and foreign index futures. Foreign securities may have additional risks including exchange rate changes, potential for sharply devalued currencies and high inflation, political and economic upheaval, the relative lack of issuer information, relatively low market liquidity and the potential lack of strict financial and accounting controls and standards.
Securities for which market prices are not provided by any of the above methods may be valued based upon quotes furnished by independent sources. The last bid price may be used to value equity securities. The mean between the last bid and asked prices is used to value debt obligations, including corporate loans.
Securities for which market quotations are not readily available or became unreliable are valued at fair value as determined in good faith by or under the supervision of the Trust’s officers following procedures approved by the Board of Trustees. Issuer specific events, market trends, bid/asked quotes of brokers and information providers and other market data may be reviewed in the course of making a good faith determination of a security’s fair value.
The Fund may invest in securities that are subject to interest rate risk, meaning the risk that the prices will generally fall as interest rates rise and, conversely, the prices will generally rise as interest rates fall. Specific securities differ in their sensitivity to changes in interest rates depending on their individual characteristics. Changes in interest rates may result in increased market volatility, which may affect the value and/or liquidity of certain Fund investments.
Valuations change in response to many factors including the historical and prospective earnings of the issuer, the value of the issuer’s assets, general economic conditions, interest rates, investor perceptions and market liquidity. Because of the inherent uncertainties of valuation, the values reflected in the consolidated financial statements may materially differ from the value received upon actual sale of those investments.
| B. | Securities Transactions and Investment Income — Securities transactions are accounted for on a trade date basis. Realized gains or losses on sales are computed on the basis of specific identification of the securities sold. Interest income (net of withholding tax, if any) is recorded on the accrual basis from settlement date. Dividend income (net of withholding tax, if any) is recorded on the ex-dividend date. Bond premiums and discounts are amortized and/or accreted for financial reporting purposes. |
The Fund may periodically participate in litigation related to Fund investments. As such, the Fund may receive proceeds from litigation settlements. Any proceeds received are included in the Consolidated Statement of Operations as realized gain (loss) for investments no longer held and as unrealized gain (loss) for investments still held.
Brokerage commissions and mark ups are considered transaction costs and are recorded as an increase to the cost basis of securities purchased and/or a reduction of proceeds on a sale of securities. Such transaction costs are included in the determination of net realized and unrealized gain (loss) from investment securities reported in the Consolidated Statement of Operations and the Consolidated Statement of Changes in Net Assets and the net realized and unrealized gains (losses) on securities per share in the Financial Highlights. Transaction costs are included in the calculation of the Fund’s net asset value and, accordingly, they reduce the Fund’s total returns. These transaction costs are not considered operating expenses and are not reflected in net investment income reported in the Consolidated Statement of Operations and the Consolidated Statement of Changes in Net Assets, or the net investment income per share and the ratios of expenses and net investment income reported in the Financial Highlights, nor are they limited by any expense limitation arrangements between the Fund and the investment adviser.
The Fund allocates income and realized and unrealized capital gains and losses to a class based on the relative net assets of each class.
| C. | Country Determination — For the purposes of making investment selection decisions and presentation in the Consolidated Schedule of Investments, the investment adviser may determine the country in which an issuer is located and/or credit risk exposure based on various factors. These factors include the laws of the country under which the issuer is organized, where the issuer maintains a principal office, the country in which the issuer derives 50% or more of its total revenues and the country that has the primary market for the issuer’s securities, as well as other criteria. Among the other criteria that may be evaluated for making this determination are the country in which the issuer maintains 50% or more of its assets, the type of security, financial guarantees and enhancements, the nature of the collateral and the sponsor organization. Country of issuer and/or credit risk exposure has been determined to be the United States of America, unless otherwise noted. |
16 Invesco Balanced-Risk Commodity Strategy Fund
| D. | Distributions — Distributions from net investment income and net realized capital gain, if any, are generally declared and paid annually and recorded on the ex-dividend date. The Fund may elect to treat a portion of the proceeds from redemptions as distributions for federal income tax purposes. |
| E. | Federal Income Taxes — The Fund intends to comply with the requirements of Subchapter M of the Internal Revenue Code of 1986, as amended (the “Internal Revenue Code”), necessary to qualify as a regulated investment company and to distribute substantially all of the Fund’s taxable earnings to shareholders. As such, the Fund will not be subject to federal income taxes on otherwise taxable income (including net realized capital gain) that is distributed to shareholders. Therefore, no provision for federal income taxes is recorded in the consolidated financial statements. |
The Fund recognizes the tax benefits of uncertain tax positions only when the position is more likely than not to be sustained. Management has analyzed the Fund’s uncertain tax positions and concluded that no liability for unrecognized tax benefits should be recorded related to uncertain tax positions. Management is not aware of any tax positions for which it is reasonably possible that the total amounts of unrecognized tax benefits will change materially in the next 12 months.
The Subsidiary is classified as a controlled foreign corporation under Subchapter N of the Internal Revenue Code. Therefore, the Fund is required to increase its taxable income by its share of the Subsidiary’s income. Net investment losses of the Subsidiary cannot be deducted by the Fund in the current period nor carried forward to offset taxable income in future periods.
The Fund files tax returns in the U.S. Federal jurisdiction and certain other jurisdictions. Generally the Fund is subject to examinations by such taxing authorities for up to three years after the filing of the return for the tax period.
| F. | Expenses — Fees provided for under the Rule 12b-1 plan of a particular class of the Fund are charged to the operations of such class. Transfer agency fees and expenses and other shareholder recordkeeping fees and expenses attributable to Class R5 and Class R6 are allocated to each share class based on relative net assets. Sub-accounting fees attributable to Class R5 are charged to the operations of the class. Transfer agency fees and expenses and other shareholder recordkeeping fees and expenses relating to all other classes are allocated among those classes based on relative net assets. All other expenses are allocated among the classes based on relative net assets. |
| G. | Accounting Estimates — The financial statements are prepared on a consolidated basis in conformity with accounting principles generally accepted in the United States of America (“GAAP”), which requires management to make estimates and assumptions that affect the reported amounts of assets and liabilities at the date of the financial statements and the reported amounts of revenues and expenses during the reporting period including estimates and assumptions related to taxation. Actual results could differ from those estimates by a significant amount. The accompanying financial statements reflect the financial position of the Fund and its Subsidiary and the results of operations on a consolidated basis. All inter-company accounts and transactions have been eliminated in consolidation. |
In addition, the Fund monitors for material events or transactions that may occur or become known after the period-end date and before the date the consolidated financial statements are released to print.
| H. | Indemnifications — Under the Trust’s organizational documents, each Trustee, officer, employee or other agent of the Trust, and under the Subsidiary’s organizational documents, the directors and officers of the Subsidiary, are indemnified against certain liabilities that may arise out of the performance of their duties to the Fund and/or the Subsidiary, respectively. Additionally, in the normal course of business, the Fund enters into contracts, including the Fund’s servicing agreements, that contain a variety of indemnification clauses. The Fund’s maximum exposure under these arrangements is unknown as this would involve future claims that may be made against the Fund that have not yet occurred. The risk of material loss as a result of such indemnification claims is considered remote. |
| I. | Structured Securities — The Fund may invest in structured securities. Structured securities are a type of derivative security whose value is determined by reference to changes in the value of underlying securities, currencies, interest rates, commodities, indices or other financial indicators (“reference instruments”). Most structured securities are fixed-income securities that have maturities of three years or less. Structured securities may be positively or negatively indexed (i.e., their principal value or interest rates may increase or decrease if the underlying reference instrument appreciates) and may have return characteristics similar to direct investments in the underlying reference instrument. |
Structured securities may entail a greater degree of market risk than other types of debt securities because the investor bears the risk of the reference instruments. In addition to the credit risk of structured securities and the normal risks of price changes in response to changes in interest rates, the principal amount of structured notes or indexed securities may decrease as a result of changes in the value of the underlying reference instruments. Changes in the daily value of structured securities are recorded as unrealized gains (losses) in the Consolidated Statement of Operations. When the structured securities mature or are sold, the Fund recognizes a realized gain (loss) on the Consolidated Statement of Operations.
| J. | Futures Contracts — The Fund may enter into futures contracts to manage exposure to interest rate, equity and market price movements and/or currency risks. A futures contract is an agreement between two parties (“Counterparties”) to purchase or sell a specified underlying security, currency or commodity (or delivery of a cash settlement price, in the case of an index future) for a fixed price at a future date. The Fund currently invests only in exchange-traded futures and they are standardized as to maturity date and underlying financial instrument. Initial margin deposits required upon entering into futures contracts are satisfied by the segregation of specific securities or cash as collateral at the futures commission merchant (broker). During the period the futures contracts are open, changes in the value of the contracts are recognized as unrealized gains or losses by recalculating the value of the contracts on a daily basis. Subsequent or variation margin payments are received or made depending upon whether unrealized gains or losses are incurred. These amounts are reflected as receivables or payables on the Consolidated Statement of Assets and Liabilities. When the contracts are closed or expire, the Fund recognizes a realized gain or loss equal to the difference between the proceeds from, or cost of, the closing transaction and the Fund’s basis in the contract. The net realized gain (loss) and the change in unrealized gain (loss) on futures contracts held during the period is included on the Consolidated Statement of Operations. The primary risks associated with futures contracts are market risk and the absence of a liquid secondary market. If the Fund were unable to liquidate a futures contract and/or enter into an offsetting closing transaction, the Fund would continue to be subject to market risk with respect to the value of the contracts and continue to be required to maintain the margin deposits on the futures contracts. Futures contracts have minimal Counterparty risk since the exchange’s clearinghouse, as Counterparty to all exchange-traded futures, guarantees the futures against default. Risks may exceed amounts recognized in the Consolidated Statement of Assets and Liabilities. |
17 Invesco Balanced-Risk Commodity Strategy Fund
| K. | Swap Agreements — The Fund may enter into various swap transactions, including interest rate, total return, index, currency and credit default swap contracts (“CDS”) for investment purposes or to manage interest rate, currency or credit risk. Such transactions are agreements between Counterparties. These agreements may contain among other conditions, events of default and termination events, and various covenants and representations such as provisions that require the Fund to maintain a pre-determined level of net assets, and/or provide limits regarding the decline of the Fund’s NAV over specific periods of time. If the Fund were to trigger such provisions and have open derivative positions at that time, the Counterparty may be able to terminate such agreement and request immediate payment in an amount equal to the net liability positions, if any. |
Interest rate, total return, index, and currency swap agreements are two-party contracts entered into primarily to exchange the returns (or differentials in rates of returns) earned or realized on particular predetermined investments or instruments. The gross returns to be exchanged or “swapped” between the parties are calculated with respect to a notional amount, i.e., the return on or increase in value of a particular dollar amount invested at a particular interest rate or return of an underlying asset, in a particular foreign currency, or in a “basket” of securities representing a particular index. At the maturity date, a net cash flow is exchanged where the total return is equivalent to the return of the underlying reference less a financing rate, if any. As a receiver, the Fund would receive payments based on any positive total return and would owe payments in the event of a negative total return. As the payer, the Fund would owe payments on any net positive total return, and would receive payment in the event of a negative total return.
Changes in the value of swap agreements are recognized as unrealized gains (losses) in the Consolidated Statement of Operations by “marking to market” on a daily basis to reflect the value of the swap agreement at the end of each trading day. Payments received or paid at the beginning of the agreement are reflected as such on the Consolidated Statement of Assets and Liabilities and may be referred to as upfront payments. The Fund accrues for the fixed payment stream and amortizes upfront payments, if any, on swap agreements on a daily basis with the net amount, recorded as a component of realized gain (loss) on the Consolidated Statement of Operations. A liquidation payment received or made at the termination of a swap agreement is recorded as realized gain (loss) on the Consolidated Statement of Operations. The Fund segregates cash or liquid securities having a value at least equal to the amount of the potential obligation of a Fund under any swap transaction. Cash held as collateral is recorded as deposits with brokers on the Consolidated Statement of Assets and Liabilities. Entering into these agreements involves, to varying degrees, lack of liquidity and elements of credit, market, and Counterparty risk in excess of amounts recognized on the Consolidated Statement of Assets and Liabilities. Such risks involve the possibility that a swap is difficult to sell or liquidate; the Counterparty does not honor its obligations under the agreement and unfavorable interest rates and market fluctuations. It is possible that developments in the swaps market, including potential government regulation, could adversely affect the Fund’s ability to terminate existing swap agreements or to realize amounts to be received under such agreements. A short position in a security poses more risk than holding the same security long. As there is no limit on how much the price of the security can increase, the Fund’s exposure is unlimited.
| L. | Other Risks — The Fund will seek to gain exposure to commodity markets primarily through an investment in the Subsidiary and through investments in exchange-traded funds and commodity-linked derivatives. The Subsidiary, unlike the Fund, may invest without limitation in commodities, commodity-linked derivatives and other securities, such as exchange-traded notes, that may provide leveraged and non-leveraged exposure to commodity markets. The Fund is indirectly exposed to the risks associated with the Subsidiary’s investments. |
| M. | Leverage Risk — Leverage exists when the Fund can lose more than it originally invests because it purchases or sells an instrument or enters into a transaction without investing an amount equal to the full economic exposure of the instrument or transaction. |
| N. | Collateral — To the extent the Fund has designated or segregated a security as collateral and that security is subsequently sold, it is the Fund’s practice to replace such collateral no later than the next business day. |
NOTE 2—Advisory Fees and Other Fees Paid to Affiliates
The Trust has entered into a master investment advisory agreement with Invesco Advisers, Inc. (the “Adviser” or “Invesco”). Under the terms of the investment advisory agreement, the Fund pays an advisory fee to the Adviser less the amount paid by the Subsidiary to the Adviser based on the annual rate of the Fund’s average daily net assets as follows:
| | | | | | | | |
| Average Daily Net Assets | | Rate | |
First $250 million | | | 1 | .05% | | | | |
Next $250 million | | | 1 | .025% | | | | |
Next $500 million | | | 1 | .00% | | | | |
Next $1.5 billion | | | 0 | .975% | | | | |
Next $2.5 billion | | | 0 | .95% | | | | |
Next $2.5 billion | | | 0 | .925% | | | | |
Next $2.5 billion | | | 0 | .90% | | | | |
Over $10 billion | | | 0 | .875% | | | | |
For the year ended October 31, 2016, the effective advisory fees incurred by the Fund was 1.03%.
The Subsidiary has entered into a separate contract with the Adviser whereby the Adviser provides investment advisory and other services to the Subsidiary. In consideration of these services, the Subsidiary pays an advisory fee to the Adviser based on the annual rate of the Subsidiary’s average daily net assets as set forth in the table above.
Under the terms of a master sub-advisory agreement between the Adviser and each of Invesco Asset Management Deutschland GmbH, Invesco Asset Management Limited, Invesco Asset Management (Japan) Limited, Invesco Hong Kong Limited, Invesco Senior Secured Management, Inc. and Invesco Canada Ltd. (collectively, the “Affiliated Sub-Advisers”) the Adviser, not the Fund, will pay 40% of the fees paid to the Adviser to any such Affiliated Sub-Adviser(s) that provide(s) discretionary investment management services to the Fund based on the percentage of assets allocated to such Affiliated Sub-Adviser(s).
18 Invesco Balanced-Risk Commodity Strategy Fund
The Adviser has contractually agreed, through at least June 30, 2017, to waive advisory fees and/or reimburse expenses to the extent necessary to limit total annual fund operating expenses after fee waivers and/or reimbursements (excluding certain items discussed below) of Class A, Class B, Class C, Class R, Class Y, Class R5 and Class R6 shares to 2.00%, 2.75%, 2.75%, 2.25%, 1.75%, 1.75% and 1.75%, respectively, of the Fund’s average daily net assets (the “expense limits”). In determining the Adviser’s obligation to waive advisory fees and/or reimburse expenses, the following expenses are not taken into account, and could cause the total annual fund operating expenses after fee waiver and/or expense reimbursement to exceed the numbers reflected above: (1) interest; (2) taxes; (3) dividend expense on short sales; (4) extraordinary or non-routine items, including litigation expenses; and (5) expenses that the Fund has incurred but did not actually pay because of an expense offset arrangement. Acquired Fund Fees and Expenses are not operating expenses of the Fund directly, but are fees and expenses, including management fees, of the investment companies in which the Fund invests. As a result, the total annual fund operating expenses after expense reimbursement may exceed the expense limits above. Unless Invesco continues the fee waiver agreement, it will terminate on June 30, 2017. During its term, the fee waiver agreement cannot be terminated or amended to increase the expense limits without approval of the Board of Trustees. The Adviser did not waive fees and/or reimburse expenses during the period under these expense limits.
Further, the Adviser has contractually agreed, through at least June 30, 2018, to waive the advisory fee payable by the Fund in an amount equal to 100% of the net advisory fees the Adviser receives from the affiliated money market funds on investments by the Fund of uninvested cash in such affiliated money market funds.
For the year ended October 31, 2016, the Adviser waived advisory fees of $579,737.
The Trust has entered into a master administrative services agreement with Invesco pursuant to which the Fund has agreed to pay Invesco for certain administrative costs incurred in providing accounting services to the Fund. For the year ended October 31, 2016, expenses incurred under the agreement are shown in the Consolidated Statement of Operations as Administrative services fees.
The Trust has entered into a transfer agency and service agreement with Invesco Investment Services, Inc. (“IIS”) pursuant to which the Fund has agreed to pay IIS a fee for providing transfer agency and shareholder services to the Fund and reimburse IIS for certain expenses incurred by IIS in the course of providing such services. IIS may make payments to intermediaries that provide omnibus account services, sub-accounting services and/or networking services. All fees payable by IIS to intermediaries that provide omnibus account services or sub-accounting are charged back to the Fund, subject to certain limitations approved by the Trust’s Board of Trustees. For the year ended October 31, 2016, expenses incurred under the agreement are shown in the Consolidated Statement of Operations as Transfer agent fees.
The Trust has entered into master distribution agreements with Invesco Distributors, Inc. (“IDI”) to serve as the distributor for the Class A, Class B, Class C, Class R, Class Y, Class R5 and Class R6 shares of the Fund. The Trust has adopted plans pursuant to Rule 12b-1 under the 1940 Act with respect to the Fund’s Class A, Class B, Class C and Class R shares (collectively, the “Plans”). The Fund, pursuant to the Plans, pays IDI compensation at the annual rate of 0.25% of the Fund’s average daily net assets of Class A shares, 1.00% of the average daily net assets of Class B and Class C shares and 0.50% of the average daily net assets of Class R shares. Of the Plan payments, up to 0.25% of the average daily net assets of each class of shares may be paid to furnish continuing personal shareholder services to customers who purchase and own shares of such classes. Any amounts not paid as a service fee under the Plans would constitute an asset-based sales charge. Rules of the Financial Industry Regulatory Authority (“FINRA”) impose a cap on the total sales charges, including asset-based sales charges, that may be paid by any class of shares of the Fund. For the year ended October 31, 2016, expenses incurred under the Plans are shown in the Consolidated Statement of Operations as Distribution fees.
Front-end sales commissions and CDSC (collectively, the “sales charges”) are not recorded as expenses of the Fund. Front-end sales commissions are deducted from proceeds from the sales of Fund shares prior to investment in Class A shares of the Fund. CDSC are deducted from redemption proceeds prior to remittance to the shareholder. During the year ended October 31, 2016, IDI advised the Fund that IDI retained $12,606 in front-end sales commissions from the sale of Class A shares and $5,046, $126 and $201 from Class A, Class B and Class C shares, respectively, for CDSC imposed on redemptions by shareholders.
Certain officers and trustees of the Trust are officers and directors of the Adviser, IIS and/or IDI.
NOTE 3—Additional Valuation Information
GAAP defines fair value as the price that would be received to sell an asset or paid to transfer a liability in an orderly transaction between market participants at the measurement date, under current market conditions. GAAP establishes a hierarchy that prioritizes the inputs to valuation methods, giving the highest priority to readily available unadjusted quoted prices in an active market for identical assets (Level 1) and the lowest priority to significant unobservable inputs (Level 3), generally when market prices are not readily available or are unreliable. Based on the valuation inputs, the securities or other investments are tiered into one of three levels. Changes in valuation methods may result in transfers in or out of an investment’s assigned level:
| | Level 1 — | Prices are determined using quoted prices in an active market for identical assets. |
| | Level 2 — | Prices are determined using other significant observable inputs. Observable inputs are inputs that other market participants may use in pricing a security. These may include quoted prices for similar securities, interest rates, prepayment speeds, credit risk, yield curves, loss severities, default rates, discount rates, volatilities and others. |
| | Level 3 — | Prices are determined using significant unobservable inputs. In situations where quoted prices or observable inputs are unavailable (for example, when there is little or no market activity for an investment at the end of the period), unobservable inputs may be used. Unobservable inputs reflect the Fund’s own assumptions about the factors market participants would use in determining fair value of the securities or instruments and would be based on the best available information. |
19 Invesco Balanced-Risk Commodity Strategy Fund
The following is a summary of the tiered valuation input levels, as of October 31, 2016. The level assigned to the securities valuations may not be an indication of the risk or liquidity associated with investing in those securities. Because of the inherent uncertainties of valuation, the values reflected in the financial statements may materially differ from the value received upon actual sale of those investments.
| | | | | | | | | | | | | | | | |
| | | Level 1 | | | Level 2 | | | Level 3 | | | Total | |
Commodity-Linked Securities | | $ | — | | | $ | 42,491,262 | | | $ | — | | | $ | 42,491,262 | |
Exchange Traded Funds | | | 15,900,500 | | | | — | | | | — | | | | 15,900,500 | |
U.S. Treasury Securities | | | — | | | | 457,879,385 | | | | — | | | | 457,879,385 | |
Money Market Funds | | | 257,059,682 | | | | — | | | | — | | | | 257,059,682 | |
| | | | 272,960,182 | | | | 500,370,647 | | | | — | | | | 773,330,829 | |
Futures Contracts* | | | 825,407 | | | | — | | | | — | | | | 825,407 | |
Swap Agreements* | | | — | | | | (3,561,001 | ) | | | — | | | | (3,561,001 | ) |
Total Investments | | $ | 273,785,589 | | | $ | 496,809,646 | | | $ | — | | | $ | 770,595,235 | |
| * | Unrealized appreciation (depreciation). |
NOTE 4—Derivative Investments
The Fund may enter into an International Swaps and Derivatives Association Master Agreement (“ISDA Master Agreement”) under which a Fund may trade OTC derivatives. An OTC transaction entered into under an ISDA Master Agreement typically involves a collateral posting arrangement, payment netting provisions and close-out netting provisions. These netting provisions allow for reduction of credit risk through netting of contractual obligations. The enforceability of the netting provisions of the ISDA Master Agreement depends on the governing law of the ISDA Master Agreement, among other factors.
For financial reporting purposes, the Fund does not offset OTC derivative assets or liabilities that are subject to ISDA Master Agreements in the Consolidated Statement of Assets and Liabilities.
Value of Derivative Investments at Period-End
The table below summarizes the value of the Fund’s derivative investments, detailed by primary risk exposure, held as of October 31, 2016:
| | | | |
| | | Value | |
| Derivative Assets | | Commodity Risk | |
Unrealized appreciation on futures contracts — Exchange-Traded(a) | | $ | 6,176,641 | |
Unrealized appreciation on swap agreements — OTC | | | 5,227,196 | |
Total Derivative Assets | | | 11,403,837 | |
Derivatives not subject to master netting agreements | | | (6,176,641 | ) |
Total Derivative Assets subject to master netting agreements | | $ | 5,227,196 | |
| |
| | | Value | |
| Derivative Liabilities | | Commodity Risk | |
Unrealized depreciation on futures contracts — Exchange-Traded(a) | | $ | (5,351,234 | ) |
Unrealized depreciation on swap agreements — OTC | | | (8,788,197 | ) |
Total Derivative Liabilities | | | (14,139,431 | ) |
Derivatives not subject to master netting agreements | | | 5,351,234 | |
Total Derivative Liabilities subject to master netting agreements | | $ | (8,788,197 | ) |
| (a) | Includes cumulative appreciation (depreciation) on futures contracts. Only current day’s variation margin receivable (payable) is reported within the Consolidated Statement of Assets and Liabilities. |
20 Invesco Balanced-Risk Commodity Strategy Fund
Offsetting Assets and Liabilities
The table below reflects the Fund’s exposure to Counterparties subject to either an ISDA Master Agreement or other agreement for OTC derivative transactions as of October 31, 2016.
| | | | | | | | | | | | | | | | | | | | | | | | |
| | | Financial
Derivative
Assets | | | Financial
Derivative
Liabilities | | | | | | Collateral
(Received)/Pledged | | | | |
| Counterparty | | Swap
agreements | | | Swap
agreements | | | Net value of
derivatives | | | Non-Cash | | | Cash | | | Net amount | |
Subsidiary | | | | | | | | | | | | | | | | | | | | | | | | |
Barclays Bank PLC | | $ | 872,968 | | | $ | (3,624,239 | ) | | $ | (2,751,271 | ) | | $ | — | | | $ | 2,751,271 | | | $ | — | |
Canadian Imperial Bank of Commerce | | | 275,176 | | | | (1,062 | ) | | | 274,114 | | | | — | | | | — | | | | 274,114 | |
Goldman Sachs International | | | 3,591,008 | | | | (3,097,965 | ) | | | 493,043 | | | | — | | | | — | | | | 493,043 | |
JPMorgan Chase Bank, N.A. | | | 457,602 | | | | (529,784 | ) | | | (72,182 | ) | | | — | | | | 72,182 | | | | — | |
Macquarie Bank Ltd. | | | 56,404 | | | | (1,412,944 | ) | | | (1,356,540 | ) | | | — | | | | 1,356,540 | | | | — | |
Merrill Lynch International | | | 3,232,025 | | | | (1,376,443 | ) | | | 1,855,582 | | | | — | | | | — | | | | 1,855,582 | |
Morgan Stanley Capital Services LLC | | | — | | | | (207,113 | ) | | | (207,113 | ) | | | — | | | | 207,113 | | | | — | |
Total | | $ | 8,485,183 | | | $ | (10,249,550 | ) | | $ | (1,764,367 | ) | | $ | — | | | $ | 4,387,106 | | | $ | 2,622,739 | |
Effect of Derivative Investments for the year ended October 31, 2016
The table below summarizes the gains (losses) on derivative investments, detailed by primary risk exposure, recognized in earnings during the period:
| | | | |
| | | Location of Gain (Loss) on
Consolidated Statement of Operations | |
| | Commodity Risk | |
Realized Gain (Loss): | | | | |
Futures contracts | | $ | (5,662,324 | ) |
Swap agreements | | | 38,588,109 | |
Change in Net Unrealized Appreciation (Depreciation): | | | | |
Futures contracts | | | 3,578,020 | |
Swap agreements | | | (1,823,328 | ) |
Total | | $ | (34,680,477 | ) |
The table below summarizes the average notional value of futures contracts and swap agreements outstanding during the period.
| | | | | | | | |
| | | Futures Contracts | | | Swap Agreements | |
Average notional value | | $ | 144,426,345 | | | $ | 448,597,809 | |
NOTE 5—Subsidiary Information
The Fund’s Consolidated Schedule of Investments includes the holdings, including any investments in derivatives, of both the Fund and the Subsidiary. The Fund’s Consolidated Statement of Assets and Liabilities, Consolidated Statement of Operations and Consolidated Statement of Changes in Net Assets include the account balances of both the Fund and the Subsidiary and all interfund transactions have been eliminated.
The table below summarizes the financial information of the Subsidiary recognized in the consolidated financial statements referred to above.
| | | | |
| Selected Financial Information | | Invesco Cayman
Commodity Fund III Ltd.
(the “Subsidiary”) | |
Total assets | | $ | 153,936,359 | |
Total liabilities | | | (10,631,310 | ) |
Net assets | | | 143,305,049 | |
Total investment income | | | 474,970 | |
Net investment income (loss) | | | (1,165,203 | ) |
Net realized gain (loss) from: | | | | |
Futures contracts | | | (5,662,324 | ) |
Swap agreements | | | 38,588,109 | |
Change in net unrealized appreciation (depreciation) of: | | | | |
Investment securities | | | 26,585 | |
Futures contracts | | | 3,578,020 | |
Swap agreements | | | (1,823,328 | ) |
Increase in net assets resulting from operations | | $ | 33,541,859 | |
21 Invesco Balanced-Risk Commodity Strategy Fund
NOTE 6—Investments in Other Affiliates
The 1940 Act defines an “affiliated person” as an issuance in which a fund holds 5% or more of the outstanding voting securities. The Fund has not owned enough of the outstanding voting securities of the issuer to have control (as defined in the 1940 Act) of that issuer. The following is a summary of the investments in other affiliates for the year ended October 31, 2016.
| | | | | | | | | | | | | | | | | | | | | | | | | | | | |
| | | Value
10/31/15 | | | Purchases
at Cost | | | Proceeds
from Sales | | | Change in
Unrealized
Appreciation | | | Realized
Gain (Loss) | | | Value
10/31/16 | | | Dividend
Income | |
Invesco PowerShares DB Gold Fund | | $ | 20,009,000 | | | $ | 4,147,376 | | | $ | (9,820,954 | ) | | $ | 3,411,550 | | | $ | (1,846,472 | ) | | $ | 15,900,200 | | | $ | — | |
NOTE 7—Expense Offset Arrangement(s)
The expense offset arrangement is comprised of transfer agency credits which result from balances in demand deposit accounts used by the transfer agent for clearing shareholder transactions. For the year ended October 31, 2016, the Fund received credits from this arrangement, which resulted in the reduction of the Fund’s total expenses of $599.
NOTE 8—Trustees’ and Officers’ Fees and Benefits
Trustees’ and Officers’ Fees and Benefits include amounts accrued by the Fund to pay remuneration to certain Trustees and Officers of the Fund. Trustees have the option to defer compensation payable by the Fund, and Trustees’ and Officers’ Fees and Benefits also include amounts accrued by the Fund to fund such deferred compensation amounts. Those Trustees who defer compensation have the option to select various Invesco Funds in which their deferral accounts shall be deemed to be invested. Finally, certain current Trustees were eligible to participate in a retirement plan that provided for benefits to be paid upon retirement to Trustees over a period of time based on the number of years of service. The Fund may have certain former Trustees who also participate in a retirement plan and receive benefits under such plan. Trustees’ and Officers’ Fees and Benefits include amounts accrued by the Fund to fund such retirement benefits. Obligations under the deferred compensation and retirement plans represent unsecured claims against the general assets of the Fund.
NOTE 9—Cash Balances
The Fund is permitted to temporarily carry a negative or overdrawn balance in its account with State Street Bank and Trust Company, the custodian bank. Such balances, if any at period-end, are shown in the Consolidated Statement of Assets and Liabilities under the payable caption Amount due custodian. To compensate the custodian bank for such overdrafts, the overdrawn Fund may either (1) leave funds as a compensating balance in the account so the custodian bank can be compensated by earning the additional interest; or (2) compensate by paying the custodian bank at a rate agreed upon by the custodian bank and Invesco, not to exceed the contractually agreed upon rate.
NOTE 10—Distributions to Shareholders and Tax Components of Net Assets
Tax Character of Distributions to Shareholders Paid During the Fiscal Years Ended October 31, 2016 and 2015:
There were no ordinary income and long-term gain distributions paid for the years ended October 31, 2015 and October 31, 2016.
Tax Components of Net Assets at Period-End:
| | | | |
| | | 2016 | |
Undistributed ordinary income | | $ | 22,996,145 | |
Net unrealized appreciation — investments | | | 4,239,023 | |
Net unrealized appreciation — other investments | | | 1,042,423 | |
Temporary book/tax differences | | | (132,362 | ) |
Capital loss carryforward | | | (48,666,376 | ) |
Shares of beneficial interest | | | 840,838,755 | |
Total net assets | | $ | 820,317,608 | |
The difference between book-basis and tax-basis unrealized appreciation (depreciation) is due to differences in the timing of recognition of gains and losses on investments for tax and book purposes. The Fund’s net unrealized appreciation difference is attributable primarily to wash sales and partnerships adjustments.
The temporary book/tax differences are a result of timing differences between book and tax recognition of income and/or expenses. The Fund’s temporary book/tax differences are the result of the trustee deferral of compensation and retirement plan benefits.
Capital loss carryforward is calculated and reported as of a specific date. Results of transactions and other activity after that date may affect the amount of capital loss carryforward actually available for the Fund to utilize. Capital losses generated in years beginning after December 22, 2010 can be carried forward for an unlimited period, whereas previous losses expire in eight tax years. Capital losses with an expiration period may not be used to offset capital gains until all net capital losses without an expiration date have been utilized. Capital loss carryforwards with no expiration date will retain their character as either short-term or long-term capital losses instead of as short-term capital losses as under prior law. The ability to utilize capital loss carryforwards in the future may be limited under the Internal Revenue Code and related regulations based on the results of future transactions.
22 Invesco Balanced-Risk Commodity Strategy Fund
The Fund has a capital loss carryforward as of October 31, 2016, as follows:
| | | | | | | | | | | | |
| Capital Loss Carryforward* | |
| Expiration | | Short-Term | | | Long-Term | | | Total | |
Not subject to expiration | | $ | 40,438,997 | | | $ | 8,227,379 | | | $ | 48,666,376 | |
| * | Capital loss carryforward as of the date listed above is reduced for limitations, if any, to the extent required by the Internal Revenue Code and may be further limited depending upon a variety of factors, including the realization of net unrealized gains or losses as of the date of any reorganization. |
NOTE 11—Investment Securities
The aggregate amount of investment securities (other than short-term securities, U.S. Treasury obligations and money market funds, if any) purchased and sold by the Fund during the year ended October 31, 2016 was $127,563,340 and $54,453,017, respectively. During the same period, purchases and sales of U.S. Treasury obligations were $137,828,396 and $293,309,704, respectively. Cost of investments on a tax basis includes the adjustments for financial reporting purposes as of the most recently completed federal income tax reporting period-end.
| | | | |
| Unrealized Appreciation (Depreciation) of Investment Securities on a Tax Basis | |
Aggregate unrealized appreciation of investment securities | | $ | 8,631,887 | |
Aggregate unrealized (depreciation) of investment securities | | | (4,392,864 | ) |
Net unrealized appreciation of investment securities | | $ | 4,239,023 | |
Cost of investments for tax purposes is $769,091,806.
NOTE 12—Reclassification of Permanent Differences
Primarily as a result of differing book/tax treatment of distributions from subsidiary, swap agreement income and return of capital distributions, on October 31, 2016, undistributed net investment income was increased by $34,864,904, undistributed net realized gain (loss) was decreased by $34,588,400 and shares of beneficial interest was decreased by $276,504. This reclassification had no effect on the net assets of the Fund.
23 Invesco Balanced-Risk Commodity Strategy Fund
NOTE 13—Share Information
| | | | | | | | | | | | | | | | |
| | | Summary of Share Activity | |
| | | Year ended October 31, | |
| | | 2016(a) | | | 2015 | |
| | | Shares | | | Amount | | | Shares | | | Amount | |
Sold: | | | | | | | | | | | | | | | | |
Class A | | | 3,954,842 | | | $ | 26,314,513 | | | | 1,108,280 | | | $ | 7,837,926 | |
Class B | | | 544 | | | | 3,483 | | | | 1,605 | | | | 10,000 | |
Class C | | | 626,084 | | | | 4,046,670 | | | | 75,087 | | | | 523,510 | |
Class R | | | 69,351 | | | | 459,130 | | | | 11,649 | | | | 84,240 | |
Class Y | | | 86,924,324 | | | | 575,119,186 | | | | 37,995,426 | | | | 284,276,655 | |
Class R5 | | | 1,680,206 | | | | 10,775,399 | | | | 9,523,280 | | | | 69,940,562 | |
Class R6 | | | 1,497,079 | | | | 9,823,548 | | | | 4,086,457 | | | | 29,552,374 | |
| | | | |
Automatic conversion of Class B shares to Class A shares: | | | | | | | | | | | | | | | | |
Class A | | | 11,168 | | | | 72,498 | | | | 9,717 | | | | 68,576 | |
Class B | | | (11,562 | ) | | | (72,498 | ) | | | (9,992 | ) | | | (68,576 | ) |
| | | | |
Reacquired: | | | | | | | | | | | | | | | | |
Class A | | | (3,328,683 | ) | | | (22,445,282 | ) | | | (1,670,209 | ) | | | (11,969,914 | ) |
Class B | | | (6,604 | ) | | | (40,911 | ) | | | (16,316 | ) | | | (116,065 | ) |
Class C | | | (127,332 | ) | | | (784,815 | ) | | | (133,757 | ) | | | (943,757 | ) |
Class R | | | (9,717 | ) | | | (63,943 | ) | | | (2,039 | ) | | | (13,828 | ) |
Class Y | | | (37,010,378 | ) | | | (240,750,644 | ) | | | (38,158,873 | ) | | | (283,974,050 | ) |
Class R5 | | | (12,695,346 | ) | | | (88,586,283 | ) | | | (3,555,024 | ) | | | (25,488,499 | ) |
Class R6(b) | | | (18,888,038 | ) | | | (116,157,695 | ) | | | (2,526,951 | ) | | | (17,657,058 | ) |
Net increase in share activity | | | 22,685,938 | | | $ | 157,712,356 | | | | 6,738,340 | | | $ | 52,062,096 | |
| (a) | There are entities that are record owners of more than 5% of the outstanding shares of the Fund and in the aggregate own 78% of the outstanding shares of the Fund. IDI has an agreement with these entities to sell Fund shares. The Fund, Invesco and/or Invesco affiliates may make payments to these entities, which are considered to be related to the Fund, for providing services to the Fund, Invesco and/or Invesco affiliates including but not limited to services such as securities brokerage, distribution, third party record keeping and account servicing. The Trust has no knowledge as to whether all or any portion of the shares owned of record by these entities are also owned beneficially. |
| (b) | On February 18, 2016, 18,209,594 Class R6 shares valued at $111,989,004 were redeemed by affiliated mutual funds. |
24 Invesco Balanced-Risk Commodity Strategy Fund
NOTE 14—Financial Highlights
The following schedule presents financial highlights for a share of the Fund outstanding throughout the periods indicated.
| | | | | | | | | | | | | | | | | | | | | | | | | | | | | | | | | | | | | | | | | | | | | | | | |
| | | Net asset
value,
beginning
of period | | | Net
investment
income
(loss)(a) | | | Net gains
(losses)
on securities
(both
realized and
unrealized) | | | Total from
investment
operations | | | Dividends
from net
investment
income | | | Net asset
value, end
of period | | | Total
return(b) | | | Net assets,
end of period
(000’s omitted) | | | Ratio of
expenses
to average
net assets
with fee waivers
and/or expenses
absorbed | | | Ratio of
expenses
to average net
assets without
fee waivers
and/or expenses
absorbed | | | Ratio of net
investment
income (loss)
to average
net assets | | | Portfolio
turnover(c) | |
Class A | | | | | | | | | | | | | |
Year ended 10/31/16 | | $ | 6.54 | | | $ | (0.07 | ) | | $ | 0.37 | | | $ | 0.30 | | | $ | — | | | $ | 6.84 | | | | 4.59 | % | | $ | 40,844 | | | | 1.47 | %(d) | | | 1.56 | %(d) | | | (1.11 | )%(d) | | | 98 | % |
Year ended 10/31/15 | | | 8.04 | | | | (0.10 | ) | | | (1.40 | ) | | | (1.50 | ) | | | — | | | | 6.54 | | | | (18.66 | ) | | | 34,892 | | | | 1.55 | | | | 1.59 | | | | (1.47 | ) | | | 17 | |
Year ended 10/31/14 | | | 9.05 | | | | (0.11 | ) | | | (0.90 | ) | | | (1.01 | ) | | | — | | | | 8.04 | | | | (11.16 | ) | | | 47,339 | | | | 1.30 | | | | 1.57 | | | | (1.25 | ) | | | 21 | |
Year ended 10/31/13 | | | 10.73 | | | | (0.11 | ) | | | (1.35 | ) | | | (1.46 | ) | | | (0.22 | ) | | | 9.05 | | | | (13.89 | ) | | | 69,350 | | | | 1.22 | | | | 1.47 | | | | (1.14 | ) | | | 47 | |
Year ended 10/31/12 | | | 10.42 | | | | (0.12 | ) | | | 0.43 | | | | 0.31 | | | | — | | | | 10.73 | | | | 2.97 | | | | 99,577 | | | | 1.22 | | | | 1.46 | | | | (1.13 | ) | | | 152 | |
Class B | |
Year ended 10/31/16 | | | 6.34 | | | | (0.12 | ) | | | 0.36 | | | | 0.24 | | | | — | | | | 6.58 | | | | 3.79 | | | | 152 | | | | 2.22 | (d) | | | 2.31 | (d) | | | (1.86 | )(d) | | | 98 | |
Year ended 10/31/15 | | | 7.85 | | | | (0.16 | ) | | | (1.35 | ) | | | (1.51 | ) | | | — | | | | 6.34 | | | | (19.24 | ) | | | 258 | | | | 2.30 | | | | 2.34 | | | | (2.22 | ) | | | 17 | |
Year ended 10/31/14 | | | 8.91 | | | | (0.17 | ) | | | (0.89 | ) | | | (1.06 | ) | | | — | | | | 7.85 | | | | (11.90 | ) | | | 514 | | | | 2.05 | | | | 2.32 | | | | (2.00 | ) | | | 21 | |
Year ended 10/31/13 | | | 10.59 | | | | (0.18 | ) | | | (1.33 | ) | | | (1.51 | ) | | | (0.17 | ) | | | 8.91 | | | | (14.44 | ) | | | 1,096 | | | | 1.97 | | | | 2.22 | | | | (1.89 | ) | | | 47 | |
Year ended 10/31/12 | | | 10.36 | | | | (0.20 | ) | | | 0.43 | | | | 0.23 | | | | — | | | | 10.59 | | | | 2.22 | | | | 3,773 | | | | 1.97 | | | | 2.21 | | | | (1.88 | ) | | | 152 | |
Class C | |
Year ended 10/31/16 | | | 6.33 | | | | (0.12 | ) | | | 0.36 | | | | 0.24 | | | | — | | | | 6.57 | | | | 3.79 | | | | 5,915 | | | | 2.22 | (d) | | | 2.31 | (d) | | | (1.86 | )(d) | | | 98 | |
Year ended 10/31/15 | | | 7.84 | | | | (0.15 | ) | | | (1.36 | ) | | | (1.51 | ) | | | — | | | | 6.33 | | | | (19.26 | ) | | | 2,544 | | | | 2.30 | | | | 2.34 | | | | (2.22 | ) | | | 17 | |
Year ended 10/31/14 | | | 8.89 | | | | (0.17 | ) | | | (0.88 | ) | | | (1.05 | ) | | | — | | | | 7.84 | | | | (11.81 | ) | | | 3,612 | | | | 2.05 | | | | 2.32 | | | | (2.00 | ) | | | 21 | |
Year ended 10/31/13 | | | 10.58 | | | | (0.18 | ) | | | (1.34 | ) | | | (1.52 | ) | | | (0.17 | ) | | | 8.89 | | | | (14.55 | ) | | | 4,948 | | | | 1.97 | | | | 2.22 | | | | (1.89 | ) | | | 47 | |
Year ended 10/31/12 | | | 10.35 | | | | (0.20 | ) | | | 0.43 | | | | 0.23 | | | | — | | | | 10.58 | | | | 2.22 | | | | 8,585 | | | | 1.97 | | | | 2.21 | | | | (1.88 | ) | | | 152 | |
Class R | |
Year ended 10/31/16 | | | 6.48 | | | | (0.09 | ) | | | 0.37 | | | | 0.28 | | | | — | | | | 6.76 | | | | 4.32 | | | | 782 | | | | 1.72 | (d) | | | 1.81 | (d) | | | (1.36 | )(d) | | | 98 | |
Year ended 10/31/15 | | | 7.99 | | | | (0.12 | ) | | | (1.39 | ) | | | (1.51 | ) | | | — | | | | 6.48 | | | | (18.90 | ) | | | 363 | | | | 1.80 | | | | 1.84 | | | | (1.72 | ) | | | 17 | |
Year ended 10/31/14 | | | 9.02 | | | | (0.13 | ) | | | (0.90 | ) | | | (1.03 | ) | | | — | | | | 7.99 | | | | (11.42 | ) | | | 371 | | | | 1.55 | | | | 1.82 | | | | (1.50 | ) | | | 21 | |
Year ended 10/31/13 | | | 10.71 | | | | (0.13 | ) | | | (1.36 | ) | | | (1.49 | ) | | | (0.20 | ) | | | 9.02 | | | | (14.13 | ) | | | 504 | | | | 1.47 | | | | 1.72 | | | | (1.39 | ) | | | 47 | |
Year ended 10/31/12 | | | 10.42 | | | | (0.15 | ) | | | 0.44 | | | | 0.29 | | | | — | | | | 10.71 | | | | 2.78 | | | | 386 | | | | 1.47 | | | | 1.71 | | | | (1.38 | ) | | | 152 | |
Class Y | |
Year ended 10/31/16 | | | 6.63 | | | | (0.06 | ) | | | 0.38 | | | | 0.32 | | | | — | | | | 6.95 | | | | 4.83 | | | | 574,878 | | | | 1.22 | (d) | | | 1.31 | (d) | | | (0.86 | )(d) | | | 98 | |
Year ended 10/31/15 | | | 8.13 | | | | (0.09 | ) | | | (1.41 | ) | | | (1.50 | ) | | | — | | | | 6.63 | | | | (18.45 | ) | | | 217,528 | | | | 1.30 | | | | 1.34 | | | | (1.22 | ) | | | 17 | |
Year ended 10/31/14 | | | 9.13 | | | | (0.09 | ) | | | (0.91 | ) | | | (1.00 | ) | | | — | | | | 8.13 | | | | (10.95 | ) | | | 268,106 | | | | 1.05 | | | | 1.32 | | | | (1.00 | ) | | | 21 | |
Year ended 10/31/13 | | | 10.81 | | | | (0.09 | ) | | | (1.36 | ) | | | (1.45 | ) | | | (0.23 | ) | | | 9.13 | | | | (13.69 | ) | | | 250,463 | | | | 0.97 | | | | 1.22 | | | | (0.89 | ) | | | 47 | |
Year ended 10/31/12 | | | 10.47 | | | | (0.09 | ) | | | 0.43 | | | | 0.34 | | | | — | | | | 10.81 | | | | 3.25 | | | | 240,404 | | | | 0.97 | | | | 1.21 | | | | (0.88 | ) | | | 152 | |
Class R5 | |
Year ended 10/31/16 | | | 6.64 | | | | (0.05 | ) | | | 0.38 | | | | 0.33 | | | | — | | | | 6.97 | | | | 4.97 | | | | 195,777 | | | | 1.13 | (d) | | | 1.22 | (d) | | | (0.77 | )(d) | | | 98 | |
Year ended 10/31/15 | | | 8.13 | | | | (0.08 | ) | | | (1.41 | ) | | | (1.49 | ) | | | — | | | | 6.64 | | | | (18.33 | ) | | | 259,674 | | | | 1.15 | | | | 1.19 | | | | (1.07 | ) | | | 17 | |
Year ended 10/31/14 | | | 9.13 | | | | (0.09 | ) | | | (0.91 | ) | | | (1.00 | ) | | | — | | | | 8.13 | | | | (10.95 | ) | | | 269,490 | | | | 1.02 | | | | 1.19 | | | | (0.97 | ) | | | 21 | |
Year ended 10/31/13 | | | 10.80 | | | | (0.09 | ) | | | (1.35 | ) | | | (1.44 | ) | | | (0.23 | ) | | | 9.13 | | | | (13.61 | ) | | | 266,031 | | | | 0.97 | | | | 1.20 | | | | (0.89 | ) | | | 47 | |
Year ended 10/31/12 | | | 10.47 | | | | (0.09 | ) | | | 0.42 | | | | 0.33 | | | | — | | | | 10.80 | | | | 3.15 | | | | 238,710 | | | | 0.97 | | | | 1.14 | | | | (0.88 | ) | | | 152 | |
Class R6 | |
Year ended 10/31/16 | | | 6.65 | | | | (0.04 | ) | | | 0.37 | | | | 0.33 | | | | — | | | | 6.98 | | | | 4.96 | | | | 1,971 | | | | 1.03 | (d) | | | 1.12 | (d) | | | (0.67 | )(d) | | | 98 | |
Year ended 10/31/15 | | | 8.13 | | | | (0.07 | ) | | | (1.41 | ) | | | (1.48 | ) | | | — | | | | 6.65 | | | | (18.20 | ) | | | 117,504 | | | | 1.05 | | | | 1.09 | | | | (0.97 | ) | | | 17 | |
Year ended 10/31/14 | | | 9.13 | | | | (0.08 | ) | | | (0.92 | ) | | | (1.00 | ) | | | — | | | | 8.13 | | | | (10.95 | ) | | | 131,076 | | | | 0.99 | | | | 1.10 | | | | (0.94 | ) | | | 21 | |
Year ended 10/31/13 | | | 10.80 | | | | (0.08 | ) | | | (1.36 | ) | | | (1.44 | ) | | | (0.23 | ) | | | 9.13 | | | | (13.61 | ) | | | 124,497 | | | | 0.97 | | | | 1.12 | | | | (0.89 | ) | | | 47 | |
Year ended 10/31/12(e) | | | 11.15 | | | | (0.01 | ) | | | (0.34 | ) | | | (0.35 | ) | | | — | | | | 10.80 | | | | (3.14 | ) | | | 101,349 | | | | 0.97 | (f) | | | 1.15 | (f) | | | (0.88 | )(f) | | | 152 | |
| (a) | Calculated using average shares outstanding. |
| (b) | Includes adjustments in accordance with accounting principles generally accepted in the United States of America and as such, the net asset value for financial reporting purposes and the returns based upon those net asset values may differ from the net asset value and returns for shareholder transactions. Does not include sales charges and is not annualized for periods less than one year, if applicable. |
| (c) | Portfolio turnover is calculated at the fund level and is not annualized for periods less than one year, if applicable. For the period ended October 31, 2012, the portfolio turnover calculation excludes the value of securities purchased of $32,276,528 and sold of $14,234,590 in the effort to realign the Fund’s portfolio holdings after the reorganization of Invesco Commodities Strategy Fund into the Fund. |
| (d) | Ratios are based on average daily net assets (000’s omitted) of $36,817, $195, $3,233, $498, $350,698, $242,334 and $35,274 for Class A, Class B, Class C, Class R, Class Y, Class R5 and Class R6 shares, respectively. |
| (e) | Commencement date of September 24, 2012. |
25 Invesco Balanced-Risk Commodity Strategy Fund
Report of Independent Registered Public Accounting Firm
To the Board of Trustees and Shareholders of the Invesco Balanced-Risk Commodity Strategy Fund:
In our opinion, the accompanying consolidated statement of assets and liabilities, including the consolidated schedule of investments, and the related consolidated statements of operations and of changes in net assets and the financial highlights present fairly, in all material respects, the consolidated financial position of the Invesco Balanced-Risk Commodity Strategy Fund and its subsidiary (the “Fund”) as of October 31, 2016, the results of their operations for the year then ended, the changes in their net assets for each of the two years in the period then ended and the financial highlights for each of the five years in the period then ended, in conformity with accounting principles generally accepted in the United States of America. These consolidated financial statements and financial highlights (hereafter referred to as “financial statements”) are the responsibility of the Fund’s management. Our responsibility is to express an opinion on these financial statements based on our audits. We conducted our audits of these financial statements in accordance with the standards of the Public Company Accounting Oversight Board (United States). Those standards require that we plan and perform the audit to obtain reasonable assurance about whether the financial statements are free of material misstatement. An audit includes examining, on a test basis, evidence supporting the amounts and disclosures in the financial statements, assessing the accounting principles used and significant estimates made by management, and evaluating the overall financial statement presentation. We believe that our audits, which included confirmation of securities as of October 31, 2016 by correspondence with the custodian and brokers, provide a reasonable basis for our opinion.
PRICEWATERHOUSECOOPERS LLP
Houston, Texas
December 21, 2016
26 Invesco Balanced-Risk Commodity Strategy Fund
Calculating your ongoing Fund expenses
Example
As a shareholder of the Fund, you incur two types of costs: (1) transaction costs, which may include sales charges (loads) on purchase payments or contingent deferred sales charges on redemptions, if any; and (2) ongoing costs, including distribution and/or service (12b-1) fees, and other Fund expenses. This example is intended to help you understand your ongoing costs (in dollars) of investing in the Fund and to compare these costs with ongoing costs of investing in other mutual funds. The example is based on an investment of $1,000 invested at the beginning of the period and held for the entire period May 1, 2016, through October 31, 2016.
In addition to the fees and expenses which the Fund bears directly, the Fund indirectly bears a pro rata share of the fees and expenses of the underlying funds in which the Fund invests. The amount of fees and expenses incurred indirectly by the Fund will vary because the underlying funds have varied expenses and fee levels and the Fund may own different proportions of the underlying funds at different times. Estimated underlying fund expenses are not expenses that are incurred directly by the Fund. They are expenses that are incurred directly by the underlying funds and are deducted from the value of the underlying funds the Fund invests in. The effect of the estimated underlying fund expenses that the Fund bears indirectly are included in the Fund’s total return.
Actual expenses
The table below provides information about actual account values and actual expenses. You may use the information in this table, together with the amount you invested, to estimate the expenses that you paid over the period. Simply divide your account value by $1,000 (for example, an $8,600 account value divided by $1,000 = 8.6), then multiply the result by the number in the table under the heading entitled “Actual Expenses Paid During Period” to estimate the expenses you paid on your account during this period.
Hypothetical example for comparison purposes
The table below also provides information about hypothetical account values and hypothetical expenses based on the Fund’s actual expense ratio and an assumed rate of return of 5% per year before expenses, which is not the Fund’s actual return.
The hypothetical account values and expenses may not be used to estimate the actual ending account balance or expenses you paid for the period. You may use this information to compare the ongoing costs of investing in the Fund and other funds. To do so, compare this 5% hypothetical example with the 5% hypothetical examples that appear in the shareholder reports of the other funds.
Please note that the expenses shown in the table are meant to highlight your ongoing costs only and do not reflect any transaction costs, such as sales charges (loads) on purchase payments or contingent deferred sales charges on redemptions, if any. Therefore, the hypothetical information is useful in comparing ongoing costs only, and will not help you determine the relative total costs of owning different funds. In addition, expenses shown in the table do not include the expenses of the underlying funds, which are borne indirectly by the Fund. If transaction costs and indirect expenses were included, your costs would have been higher.
| | | | | | | | | | | | | | | | | | | | | | | | |
| Class | | Beginning
Account Value
(05/01/16) | | | ACTUAL | | | HYPOTHETICAL
(5% annual return before
expenses) | | | Annualized
Expense Ratio | |
| | | Ending
Account Value
(10/31/16)1 | | | Expenses
Paid During
Period2 | | | Ending
Account Value
(10/31/16) | | | Expenses
Paid During
Period2 | | |
| A | | $ | 1,000.00 | | | $ | 998.50 | | | $ | 7.08 | | | $ | 1,018.05 | | | $ | 7.15 | | | | 1.41 | % |
| B | | | 1,000.00 | | | | 995.50 | | | | 10.83 | | | | 1,014.28 | | | | 10.94 | | | | 2.16 | |
| C | | | 1,000.00 | | | | 995.50 | | | | 10.83 | | | | 1,014.28 | | | | 10.94 | | | | 2.16 | |
| R | | | 1,000.00 | | | | 997.10 | | | | 8.33 | | | | 1,016.79 | | | | 8.42 | | | | 1.66 | |
| Y | | | 1,000.00 | | | | 1,000.00 | | | | 5.83 | | | | 1,019.30 | | | | 5.89 | | | | 1.16 | |
| R5 | | | 1,000.00 | | | | 1,000.00 | | | | 5.73 | | | | 1,019.41 | | | | 5.79 | | | | 1.14
| |
| R6 | | | 1,000.00 | | | | 1,000.00 | | | | 5.23 | | | | 1,019.91 | | | | 5.28 | | | | 1.04 | |
| 1 | The actual ending account value is based on the actual total return of the Fund for the period May 1, 2016 through October 31, 2016, after actual expenses and will differ from the hypothetical ending account value which is based on the Fund’s expense ratio and a hypothetical annual return of 5% before expenses. |
| 2 | Expenses are equal to the Fund’s annualized expense ratio as indicated above multiplied by the average account value over the period, multiplied by 184/366 to reflect the most recent fiscal half year. |
27 Invesco Balanced-Risk Commodity Strategy Fund
Approval of Investment Advisory and Sub-Advisory Contracts
The Board of Trustees (the Board) of AIM Investment Funds (Invesco Investment Funds) is required under the Investment Company Act of 1940, as amended, to approve annually the renewal of Invesco Balanced-Risk Commodity Strategy Fund’s (the Fund) investment advisory agreements. During contract renewal meetings held on June 7-8, 2016, the Board as a whole, and the disinterested or “independent” Trustees, who comprise over 75% of the Board, voting separately, approved the continuance for the Fund of the Master Investment Advisory Agreement with Invesco Advisers, Inc. (Invesco Advisers and the investment advisory agreement) and the Master Intergroup Sub-Advisory Contract for Mutual Funds with Invesco Asset Management Deutschland GmbH, Invesco Asset Management Limited, Invesco Asset Management (Japan) Limited, Invesco Hong Kong Limited, Invesco Senior Secured Management, Inc. and Invesco Canada Ltd. (collectively, the Affiliated Sub-Advisers and the sub-advisory contracts) for another year, effective July 1, 2016.
In evaluating the fairness and reasonableness of compensation under the Fund’s investment advisory agreement and sub-advisory contracts, the Board considered, among other things, the factors discussed below. The Board determined that continuation of the Fund’s investment advisory agreement and the sub-advisory contracts is in the best interest of the Fund and its shareholders and that the compensation payable to Invesco Advisers and the Affiliated Sub-Advisers under the agreements is fair and reasonable.
The Board’s Fund Evaluation Process
The Board’s Investments Committee has established three Sub-Committees, which meet throughout the year to review the performance of funds advised by Invesco Advisers (the Invesco Funds). Over the course of each year, the Sub-Committees meet with portfolio managers for their assigned Invesco Funds and other members of management to review the performance, investment objective(s), policies, strategies, limitations and investment risks of these funds. The Board had the benefit of reports from the Sub-Committees and Investments Committee throughout the year in considering approval of the continuance of each Invesco Fund’s investment advisory agreement and sub-advisory contracts for another year.
During the contract renewal process, the Board receives comparative performance and fee data regarding the Invesco Funds prepared by Invesco Advisers and Broadridge Financial Solutions, Inc. (Broadridge), an independent provider of investment company data. The Board also receives an independent written evaluation from the Senior Officer, an officer of the Invesco Funds who reports directly to the independent Trustees. The Senior Officer’s
evaluation is prepared as part of his responsibility to manage the process by which the Invesco Funds’ proposed management fees are negotiated during the annual contract renewal process to ensure they are negotiated in a manner that is at arms’ length and reasonable. In addition to meetings with Invesco Advisers and fund counsel, the independent Trustees also discuss the continuance of the investment advisory agreement and sub-advisory contracts in separate sessions with the Senior Officer and with independent legal counsel.
The Trustees recognized that the advisory fee rates for the Invesco Funds are, in many cases, the result of years of review and negotiation. The Trustees’ deliberations and conclusions in a particular year may be based in part on their deliberations and conclusions regarding these same arrangements throughout the year and in prior years. The Trustees’ review and conclusions are based on the comprehensive consideration of all information presented to them and are not the result of any single determinative factor. Moreover, one Trustee may have weighed a particular piece of information or factor differently than another Trustee.
The discussion below is a summary of the Senior Officer’s independent written evaluation with respect to the Fund’s investment advisory agreement as well as a discussion of the material factors and related conclusions that formed the basis for the Board’s approval of the Fund’s investment advisory agreement and sub-advisory contracts. Unless otherwise stated, this information is current as of June 8, 2016, and does not reflect consideration of factors that became known to the Board after that date.
Factors and Conclusions and Summary of Independent Written Fee Evaluation
| A. | Nature, Extent and Quality of Services Provided by Invesco Advisers and the Affiliated Sub-Advisers |
The Board reviewed the advisory services provided to the Fund by Invesco Advisers under the Fund’s investment advisory agreement, the performance of Invesco Advisers in providing these services, and the credentials and experience of the officers and employees of Invesco Advisers who provide these services, including the Fund’s portfolio manager or managers. The Board’s review of the qualifications of Invesco Advisers to provide advisory services included the Board’s consideration of Invesco Advisers’ investment process oversight, independent credit analysis and investment risk management. The Board also considered non-advisory services that Invesco Advisers and its affiliates provide to the Invesco Funds such as various back office
support functions, trading operations, internal audit, valuation and legal and compliance.
In determining whether to continue the Fund’s investment advisory agreement, the Board considered the benefits of reapproving an existing relationship and the greater uncertainty that may be associated with entering into a new relationship. The Board concluded that the nature, extent and quality of the services provided to the Fund by Invesco Advisers are appropriate and satisfactory and consistent with the terms of the Fund’s investment advisory agreement.
The Board reviewed the services that may be provided by the Affiliated Sub-Advisers under the sub-advisory contracts and the credentials and experience of the officers and employees of the Affiliated Sub-Advisers who provide these services. The Board noted that the Affiliated Sub-Advisers have offices and personnel that are located in financial centers around the world. As a result, the Board noted that the Affiliated Sub-Advisers can provide research and investment analysis on the markets and economies of various countries in which the Fund may invest, make recommendations regarding securities and assist with security trades. The Board concluded that the sub-advisory contracts may benefit the Fund and its shareholders by permitting Invesco Advisers to use the resources and talents of the Affiliated Sub-Advisers in managing the Fund. The Board concluded that the nature, extent and quality of the services that may be provided by the Affiliated Sub-Advisers are appropriate and satisfactory and consistent with the terms of the Fund’s sub-advisory contracts.
The Board considered Fund performance as a relevant factor in considering whether to approve the investment advisory agreement. The Board did not view Fund performance as a relevant factor in considering whether to approve the sub-advisory contracts for the Fund, as no Affiliated Sub-Adviser currently manages assets of the Fund.
The Board compared the Fund’s performance during the past one, three and five calendar years to the performance of funds in the Broadridge performance universe and against the Lipper Commodities General Funds Index. The Board noted that performance of Class A shares of the Fund was in the first quintile of its performance universe for the one and five year periods and the second quintile for the three year period (the first quintile being the best performing funds and the fifth quintile being the worst performing funds). The Board noted that performance of Class A shares of the Fund was above the performance of the Index for the one, three and five year periods. The Trustees also reviewed more recent Fund performance and this review did not change their conclusions.
28 Invesco Balanced-Risk Commodity Strategy Fund
| C. | Advisory and Sub-Advisory Fees |
The Board compared the Fund’s contractual management fee rate to the contractual management fee rates of funds in the Fund’s Broadridge expense group at a common asset level. The Board noted that the contractual management fee rate for Class A shares of the Fund was above the median contractual management fee rate of funds in its expense group. The Board noted that the term “contractual management fee” for funds in the expense group may include both advisory and certain administrative services fees, but that Broadridge does not provide information on a fund by fund basis as to what is included. The Board noted that Invesco Advisers does not separately charge the Invesco Funds for the administrative services included in the term as defined by Broadridge. The Board also reviewed the methodology used by Broadridge in providing expense group information, which includes using each fund’s contractual management fee schedule (including any applicable breakpoints) as reported in the most recent prospectus or statement of additional information for each fund in the expense group.
The Board noted that Invesco Advisers and its affiliates do not manage other mutual funds with investment strategies comparable to those of the Fund.
The Board did consider the fees charged by Invesco Advisers and the Affiliated Sub-Advisers to other client accounts that are managed using an investment process substantially similar to the investment process use for the Fund. The Board noted that Invesco Advisers or the Affiliated Sub-Advisers may charge lower fees to large institutional clients. Invesco Advisers reviewed with the Board the significantly greater scope of services it provides to the Invesco Funds relative to certain other types of client accounts. These additional services include provision of administrative services, officers and office space, oversight of service providers, preparation of annual registration statement updates and financial information and regulatory compliance under the Investment Company Act of 1940, as amended.
Invesco Advisers also reviewed generally the higher frequency of shareholder purchases and redemptions in the Invesco Funds relative to the flow of assets for other client accounts. Invesco Advisers advised the Board that advance notice of redemptions is often provided to Invesco Advisers by institutional clients. The Board did note that sub-advisory fee rates charged by the Affiliated Sub-Advisers to manage the Invesco Funds and to manage other client accounts tended to be more comparable, reflecting a similar scope of services.
The Board also considered the services that may be provided by the Affiliated Sub-Advisers pursuant to the sub-advisory contracts, as well as the fees payable by Invesco Advisers to the Affiliated Sub-Advisers pursuant to the sub-advisory contracts. The Board also noted that the sub-advisory fees are not paid directly
by the Fund, but rather, are payable by Invesco Advisers to the Affiliated Sub-Advisers.
| D. | Economies of Scale and Breakpoints |
The Board considered the extent to which there are economies of scale in the provision of advisory services to the Fund. The Board also considered whether the Fund benefits from economies of scale through contractual breakpoints in the Fund’s advisory fee schedule. The Board also noted that the Fund shares directly in economies of scale through lower fees charged by third party service providers based on the combined size of the Invesco Funds and other clients advised by Invesco Advisers.
| E. | Profitability and Financial Resources |
The Board reviewed information from Invesco Advisers concerning the costs of the advisory and other services that Invesco Advisers and its affiliates provide to the Fund and the Invesco Funds and the profitability of Invesco Advisers and its affiliates in providing these services. The Board received information from Invesco Advisers and a report from an independent consultant engaged by the Senior Officer about the methodology used to prepare the profitability information. The Board noted that Invesco Advisers continues to operate at a net profit from services Invesco Advisers and its affiliates provide to the Invesco Funds and the Fund. The Board did not deem the level of profits realized by Invesco Advisers and its affiliates from providing services to the Fund to be excessive given the nature, quality and extent of the services provided. The Board received and accepted information from Invesco Advisers demonstrating that Invesco Advisers and each Affiliated Sub-Adviser are financially sound and have the resources necessary to perform their obligations under the investment advisory agreement and sub-advisory contracts.
| F. | Collateral Benefits to Invesco Advisers and its Affiliates |
The Board considered various other benefits received by Invesco Advisers and its affiliates from the relationship with the Fund, including the fees received for providing transfer agency and distribution services to the Fund. The Board considered comparative information regarding fees charged for these services, including information provided by Broadridge and other independent sources. The Board considered the performance of Invesco Advisers and its affiliates in providing these services and the organizational structure employed to provide these services. The Board also considered that these services are provided to the Fund pursuant to written contracts that are reviewed and approved on an annual basis by the Board; and that the services are required for the operation of the Fund.
29 Invesco Balanced-Risk Commodity Strategy Fund
Trustees and Officers
The address of each trustee and officer is AIM Investment Funds (Invesco Investment Funds) (the “Trust”), 11 Greenway Plaza, Suite 1000, Houston, Texas 77046-1173. The trustees serve for the life of the Trust, subject to their earlier death, incapacitation, resignation, retirement or removal as more specifically provided in the Trust’s organizational documents. Each officer serves for a one year term or until their successors are elected and qualified. Column two below includes length of time served with predecessor entities, if any.
| | | | | | | | |
Name, Year of Birth and
Position(s) Held with the Trust | | Trustee and/
or Officer Since | | Principal Occupation(s)
During Past 5 Years | | Number of
Funds in Fund
Complex
Overseen by
Trustee | | Other Directorship(s)
Held by Trustee During
Past 5 Years |
| Interested Persons | | | | | | | | |
| Martin L. Flanagan1 — 1960 Trustee | | 2007 | | Executive Director, Chief Executive Officer and President, Invesco Ltd. (ultimate parent of Invesco and a global investment management firm); Advisor to the Board, Invesco Advisers, Inc. (formerly known as Invesco Institutional (N.A.), Inc.); Trustee, The Invesco Funds; Vice Chair, Investment Company Institute; and Member of Executive Board, SMU Cox School of Business Formerly: Chairman and Chief Executive Officer, Invesco Advisers, Inc. (registered investment adviser); Director, Chairman, Chief Executive Officer and President, Invesco Holding Company (US) Inc. (formerly IVZ Inc.) (holding company), Invesco Group Services, Inc. (service provider) and Invesco North American Holdings, Inc. (holding company); Director, Chief Executive Officer and President, Invesco Holding Company Limited (parent of Invesco and a global investment management firm); Director, Invesco Ltd.; Chairman, Investment Company Institute and President, Co-Chief Executive Officer, Co-President, Chief Operating Officer and Chief Financial Officer, Franklin Resources, Inc. (global investment management organization) | | 146 | | None |
| Philip A. Taylor2 — 1954 Trustee and Senior Vice President | | 2006 | | Head of the Americas and Senior Managing Director, Invesco Ltd.; Director, Co-Chairman, Co-President and Co-Chief Executive Officer, Invesco Advisers, Inc. (formerly known as Invesco Institutional (N.A.), Inc.) (registered investment adviser); Director, Chairman, Chief Executive Officer and President, Invesco Management Group, Inc. (formerly known as Invesco AIM Management Group, Inc.) (financial services holding company); Director and Chairman, Invesco Investment Services, Inc. (formerly known as Invesco AIM Investment Services, Inc.) (registered transfer agent) Chief Executive Officer, Invesco Corporate Class Inc. (corporate mutual fund company) Director, Chairman and Chief Executive Officer, Invesco Canada Ltd. (formerly known as Invesco Trimark Ltd./Invesco Trimark Ltèe) (registered investment adviser and registered transfer agent); Trustee and Senior Vice President, The Invesco Funds; Director, Invesco Investment Advisers LLC (formerly known as Van Kampen Asset Management). Formerly: Director, Chief Executive Officer and President, Van Kampen Exchange Corp.; President and Principal Executive Officer, The Invesco Funds (other than AIM Treasurer’s Series Trust (Invesco Treasurer’s Series Trust), Short-Term Investments Trust and Invesco Management Trust); Executive Vice President, The Invesco Funds (AIM Treasurer’s Series Trust (Invesco Treasurer’s Series Trust), Short-Term Investments Trust and Invesco Management Trust only); Director and President, INVESCO Funds Group, Inc. (registered investment adviser and registered transfer agent); Director and Chairman, IVZ Distributors, Inc. (formerly known as INVESCO Distributors, Inc.) (registered broker dealer); Director, President and Chairman, Invesco Inc. (holding company), Invesco Canada Holdings Inc. (holding company), Trimark Investments Ltd./Placements Trimark Ltèe and Invesco Financial Services Ltd/Services Financiers Invesco Ltèe; Chief Executive Officer, Invesco Canada Fund Inc. (corporate mutual fund company); Director and Chairman, Van Kampen Investor Services Inc.; Director, Chief Executive Officer and President, 1371 Preferred Inc. (holding company) and Van Kampen Investments Inc.; Director and President, AIM GP Canada Inc. (general partner for limited partnerships) and Van Kampen Advisors, Inc.; Director and Chief Executive Officer, Invesco Trimark Dealer Inc. (registered broker dealer); Director, Invesco Distributors, Inc. (formerly known as Invesco AIM Distributors, Inc.) (registered broker dealer); Manager, Invesco PowerShares Capital Management LLC; Director, Chief Executive Officer and President, Invesco Advisers, Inc.; Director, Chairman, Chief Executive Officer and President, Invesco AIM Capital Management, Inc.; President, Invesco Trimark Dealer Inc. and Invesco Trimark Ltd./Invesco Trimark Ltèe; Director and President, AIM Trimark Corporate Class Inc. and AIM Trimark Canada Fund Inc.; Senior Managing Director, Invesco Holding Company Limited; Director and Chairman, Fund Management Company (former registered broker dealer); President and Principal Executive Officer, The Invesco Funds (AIM Treasurer’s Series Trust (Invesco Treasurer’s Series Trust), and Short-Term Investments Trust only); President, AIM Trimark Global Fund Inc. and AIM Trimark Canada Fund Inc. | | 146 | | None |
| 1 | Mr. Flanagan is considered an interested person (within the meaning of Section 2(a)(19) of the 1940 Act) of the Trust because he is an officer of the Adviser to the Trust, and an officer and a director of Invesco Ltd., ultimate parent of the Adviser. |
| 2 | Mr. Taylor is considered an interested person (within the meaning of Section 2(a)(19) of the 1940 Act) of the Trust because he is an officer and a director of the Adviser. |
T-1 Invesco Balanced-Risk Commodity Strategy Fund
Trustees and Officers—(continued)
| | | | | | | | |
Name, Year of Birth and
Position(s) Held with the Trust | | Trustee and/
or Officer Since | | Principal Occupation(s) During Past 5 Years | | Number of
Funds in Fund
Complex
Overseen by
Trustee | | Other Directorship(s)
Held by Trustee During
Past 5 Years |
| Independent Trustees | | | | | | | | |
Bruce L. Crockett — 1944 Trustee and Chair | | 2001 | | Chairman, Crockett Technologies Associates (technology consulting company) Formerly: Director, Captaris (unified messaging provider); Director, President and Chief Executive Officer, COMSAT Corporation; Chairman, Board of Governors of INTELSAT (international communications company); ACE Limited (insurance company); Independent Directors Council and Investment Company Institute | | 146 | | ALPS (Attorneys Liability Protection Society) (insurance company) and Globe Specialty Metals, Inc. (metallurgical company); Member of the Audit Committee, Ferroglobe PLC and Investment Company Institute; Member of the Executive Committee and Chair of the Governance Committee, Independent Directors Council |
David C. Arch — 1945 Trustee | | 2010 | | Chairman of Blistex Inc., a consumer health care products manufacturer | | 146 | | Board member of the Illinois Manufacturers’ Association; Member of the Board of Visitors, Institute for the Humanities, University of Michigan |
James T. Bunch — 1942 Trustee | | 2003 | | Managing Member, Grumman Hill Group LLC (family office/private equity investments) Formerly: Chairman of the Board, Denver Film Society, Chairman of the Board of Trustees, Evans Scholarship Foundation; Chairman, Board of Governors, Western Golf Association | | 146 | | Trustee, Evans Scholarship Foundation |
Albert R. Dowden — 1941 Trustee | | 2001 | | Director of a number of public and private business corporations, including Nature’s Sunshine Products, Inc. Formerly: Director, The Boss Group, Ltd. and Reich & Tang Funds (5 portfolios) (registered investment company); Director, Homeowners of America Holding Corporation/Homeowners of America Insurance Company (property casualty company); Director, Continental Energy Services, LLC (oil and gas pipeline service); Director, CompuDyne Corporation (provider of product and services to the public security market) and Director, Annuity and Life Re (Holdings), Ltd. (reinsurance company); Director, President and Chief Executive Officer, Volvo Group North America, Inc.; Senior Vice President, AB Volvo; Director of various public and private corporations; Chairman, DHJ Media, Inc.; Director, Magellan Insurance Company; and Director, The Hertz Corporation, Genmar Corporation (boat manufacturer), National Media Corporation; Advisory Board of Rotary Power International (designer, manufacturer, and seller of rotary power engines); and Chairman, Cortland Trust, Inc. (registered investment company) | | 146 | | Director of Nature’s Sunshine Products, Inc. |
Jack M. Fields — 1952 Trustee | | 2001 | | Chief Executive Officer, Twenty First Century Group, Inc. (government affairs company); and Discovery Learning Alliance (non-profit) Formerly: Owner and Chief Executive Officer, Dos Angeles Ranch L.P. (cattle, hunting, corporate entertainment); Director, Insperity, Inc. (formerly known as Administaff); Chief Executive Officer, Texana Timber LP (sustainable forestry company); Director of Cross Timbers Quail Research Ranch (non-profit); and member of the U.S. House of Representatives | | 146 | | None |
Eli Jones — 1961 Trustee | | 2016 | | Professor and Dean, Mays Business School — Texas A&M University Formerly: Professor and Dean, Walton College of Business, University of Arkansas and E.J. Ourso College of Business, Louisiana State University and Director, Arvest Bank | | 146 | | Director of Insperity, Inc. (formerly known as Administaff) |
Prema Mathai-Davis — 1950 Trustee | | 2001 | | Retired. Formerly: Chief Executive Officer, YWCA of the U.S.A. | | 146 | | None |
Larry Soll — 1942 Trustee | | 2003 | | Retired. Formerly: Chairman, Chief Executive Officer and President, Synergen Corp. (a biotechnology company) | | 146 | | None |
Raymond Stickel, Jr. — 1944 Trustee | | 2005 | | Retired. Formerly: Director, Mainstay VP Series Funds, Inc. (25 portfolios) and Partner, Deloitte & Touche | | 146 | | None |
Robert C. Troccoli — 1949 Trustee | | 2016 | | Adjunct Professor, University of Denver — Daniels College of Business Formerly: Senior Partner, KPMG LLP | | 146 | | None |
T-2 Invesco Balanced-Risk Commodity Strategy Fund
Trustees and Officers—(continued)
| | | | | | | | |
Name, Year of Birth and
Position(s) Held with the Trust | | Trustee and/
or Officer Since | | Principal Occupation(s) During Past 5 Years | | Number of
Funds in Fund
Complex
Overseen by
Trustee | | Other Directorship(s)
Held by Trustee During
Past 5 Years |
| Independent Trustees—(continued) |
Suzanne H. Woolsey — 1941 Trustee | | 2014 | | Retired. Formerly: Chief Executive Officer of Woolsey Partners LLC | | 146 | | Director, SunShare LLC; Trustee, Ocean Conservancy; Emeritus Chair of the Board of Trustees of the Institute for Defense Analyses and of Colorado College; Trustee, Chair, Business and Finance Committee of California Institute of Technology; Prior to 2014, Director of Fluor Corp.; Prior to 2010, Trustee of the German Marshall Fund of the United States; Prior to 2010, Trustee of the Rocky Mountain Institute |
| Other Officers | | | | | | | | |
Sheri Morris — 1964 President, Principal Executive Officer and Treasurer | | 1999 | | President, Principal Executive Officer and Treasurer, The Invesco Funds; Vice President, Invesco Advisers, Inc. (formerly known as Invesco Institutional (N.A.), Inc.) (registered investment adviser); and Vice President, PowerShares Exchange-Traded Fund Trust, PowerShares Exchange-Traded Fund Trust II, PowerShares India Exchange-Traded Fund Trust, PowerShares Actively Managed Exchange-Traded Fund Trust, and PowerShares Actively Managed Exchange-Traded Commodity Fund Trust Formerly: Vice President and Principal Financial Officer, The Invesco Funds; Vice President, Invesco AIM Advisers, Inc., Invesco AIM Capital Management, Inc. and Invesco AIM Private Asset Management, Inc.; Assistant Vice President and Assistant Treasurer, The Invesco Funds and Assistant Vice President, Invesco Advisers, Inc., Invesco AIM Capital Management, Inc. and Invesco AIM Private Asset Management, Inc.; and Treasurer, PowerShares Exchange-Traded Fund Trust, PowerShares Exchange-Traded Fund Trust II, PowerShares India Exchange-Traded Fund Trust and PowerShares Actively Managed Exchange-Traded Fund Trust | | N/A | | N/A |
Russell C. Burk — 1958 Senior Vice President and Senior Officer | | 2005 | | Senior Vice President and Senior Officer, The Invesco Funds | | N/A | | N/A |
John M. Zerr — 1962 Senior Vice President, Chief Legal Officer and Secretary | | 2006 | | Director, Senior Vice President, Secretary and General Counsel, Invesco Management Group, Inc. (formerly known as Invesco AIM Management Group, Inc.; Senior Vice President, Invesco Advisers, Inc. (formerly known as Invesco Institutional (N.A.), Inc.) (registered investment adviser); Senior Vice President and Secretary, Invesco Distributors, Inc. (formerly known as Invesco AIM Distributors, Inc.); Director, Vice President and Secretary, Invesco Investment Services, Inc. (formerly known as Invesco AIM Investment Services, Inc.) Senior Vice President, Chief Legal Officer and Secretary, The Invesco Funds; Managing Director, Invesco PowerShares Capital Management LLC; Director, Secretary and General Counsel, Invesco Investment Advisers LLC (formerly known as Van Kampen Asset Management); Secretary and General Counsel, Invesco Capital Markets, Inc. (formerly known as Van Kampen Funds Inc.) and Chief Legal Officer, PowerShares Exchange-Traded Fund Trust, PowerShares Exchange-Traded Fund Trust II, PowerShares India Exchange-Traded Fund Trust, PowerShares Actively Managed Exchange-Traded Fund Trust, and PowerShares Actively Managed Exchange-Traded Commodity Fund Trust Formerly: Director, Secretary, General Counsel and Senior Vice President, Van Kampen Exchange Corp.; Director, Vice President and Secretary, IVZ Distributors, Inc. (formerly known as INVESCO Distributors, Inc.); Director and Vice President, INVESCO Funds Group, Inc.; Director and Vice President, Van Kampen Advisors Inc.; Director, Vice President, Secretary and General Counsel, Van Kampen Investor Services Inc.; Director, Invesco Distributors, Inc. (formerly known as Invesco AIM Distributors, Inc.); Director, Senior Vice President, General Counsel and Secretary, Invesco AIM Advisers, Inc. and Van Kampen Investments Inc.; Director, Vice President and Secretary, Fund Management Company; Director, Senior Vice President, Secretary, General Counsel and Vice President, Invesco AIM Capital Management, Inc.; Chief Operating Officer and General Counsel, Liberty Ridge Capital, Inc. (an investment adviser); Vice President and Secretary, PBHG Funds (an investment company) and PBHG Insurance Series Fund (an investment company); Chief Operating Officer, General Counsel and Secretary, Old Mutual Investment Partners (a broker-dealer); General Counsel and Secretary, Old Mutual Fund Services (an administrator) and Old Mutual Shareholder Services (a shareholder servicing center); Executive Vice President, General Counsel and Secretary, Old Mutual Capital, Inc. (an investment adviser); and Vice President and Secretary, Old Mutual Advisors Funds (an investment company) | | N/A | | N/A |
T-3 Invesco Balanced-Risk Commodity Strategy Fund
Trustees and Officers—(continued)
| | | | | | | | |
Name, Year of Birth and
Position(s) Held with the Trust | | Trustee and/
or Officer Since | | Principal Occupation(s) During Past 5 Years | | Number of
Funds in Fund
Complex
Overseen by
Trustee | | Other Directorship(s)
Held by Trustee During
Past 5 Years |
| Other Officers—(continued) | | | | | | | | |
| Karen Dunn Kelley — 1960 Senior Vice President | | 2004 | | Senior Managing Director, Investments, Invesco Ltd.; Director, Co-President, Co-Chief Executive Officer, and Co-Chairman, Invesco Advisers, Inc. (formerly known as Invesco Institutional (N.A.), Inc.) (registered investment adviser); Chairman and Director, Invesco Senior Secured Management, Inc.; Senior Vice President, Invesco Management Group, Inc. (formerly known as Invesco AIM Management Group, Inc.); Executive Vice President, Invesco Distributors, Inc. (formerly known as Invesco AIM Distributors, Inc.); Director, Invesco Mortgage Capital Inc. and Invesco Management Company Limited; Senior Vice President, The Invesco Funds Formerly: Vice President, The Invesco Funds (other than AIM Treasurer’s Series Trust (Invesco Treasurer’s Series Trust), Short-Term Investments Trust and Invesco Management Trust); and President and Principal Executive Officer, The Invesco Funds (AIM Treasurer’s Series Trust (Invesco Treasurer’s Series Trust), Short-Term Investments Trust and Invesco Management Trust only); Director and President, INVESCO Asset Management (Bermuda) Ltd., Director, INVESCO Global Asset Management DAC (formerly known as INVESCO Global Asset Management Limited) and INVESCO Management S.A.; Senior Vice President, Van Kampen Investments Inc. and Invesco Advisers, Inc. (formerly known as Invesco Institutional (N.A.), Inc.) (registered investment adviser); Director and President, Fund Management Company; Chief Cash Management Officer, Director of Cash Management, Senior Vice President, and Managing Director, Invesco AIM Capital Management, Inc.; Director of Cash Management, Senior Vice President, and Vice President, Invesco Advisers, Inc. and Vice President, The Invesco Funds (AIM Treasurer’s Series Trust (Invesco Treasurer’s Series Trust), and Short-Term Investments Trust only) | | N/A | | N/A |
Kelli Gallegos — 1970 Vice President, Principal Financial Officer and Assistant Treasurer | | 2008 | | Vice President, Principal Financial Officer and Assistant Treasurer, The Invesco Funds; Assistant Treasurer, Invesco PowerShares Capital Management LLC, PowerShares Exchange-Traded Fund Trust, PowerShares Exchange-Traded Fund Trust II, PowerShares India Exchange-Traded Fund Trust, PowerShares Actively Managed Exchange-Traded Fund Trust, and PowerShares Actively Managed Exchange-Traded Commodity Fund Trust Formerly: Assistant Vice President, The Invesco Funds | | N/A | | N/A |
Tracy Sullivan — 1962 Vice President, Chief Tax Officer and Assistant Treasurer | | 2008 | | Vice President, Chief Tax Officer and Assistant Treasurer, The Invesco Funds; Assistant Treasurer, Invesco PowerShares Capital Management LLC, PowerShares Exchange-Traded Fund Trust, PowerShares Exchange-Traded Fund Trust II, PowerShares India Exchange-Traded Fund Trust, PowerShares Actively Managed Exchange-Traded Fund Trust, and PowerShares Actively Managed Exchange-Traded Commodity Fund Trust Formerly: Assistant Vice President, The Invesco Funds | | N/A | | N/A |
Crissie M. Wisdom — 1969 Anti-Money Laundering Compliance Officer | | 2013 | | Anti-Money Laundering Compliance Officer, Invesco Advisers, Inc. (formerly known as Invesco Institutional (N.A.), Inc.) (registered investment adviser), Invesco Capital Markets, Inc. (formerly known as Van Kampen Funds Inc.), Invesco Distributors, Inc., Invesco Investment Services, Inc., Invesco Management Group, Inc., The Invesco Funds, and PowerShares Exchange-Traded Fund Trust, PowerShares Exchange-Traded Fund Trust II, PowerShares India Exchange-Traded Fund Trust, PowerShares Actively Managed Exchange-Traded Fund Trust and PowerShares Actively Managed Exchange-Traded Commodity Fund Trust; Anti-Money Laundering Compliance Officer and Bank Secrecy Act Officer, INVESCO National Trust Company and Invesco Trust Company; and Fraud Prevention Manager and Controls and Risk Analysis Manager for Invesco Investment Services, Inc. Formerly: Anti-Money Laundering Compliance Officer, Van Kampen Exchange Corp. | | N/A | | N/A |
Robert R. Leveille — 1969 Chief Compliance Officer | | 2016 | | Chief Compliance Officer, Invesco Advisers, Inc. (registered investment adviser); and Chief Compliance Officer, The Invesco Funds Formerly: Chief Compliance Officer, Putnam Investments and the Putnam Funds | | N/A | | N/A |
The Statement of Additional Information of the Trust includes additional information about the Fund’s Trustees and is available upon request, without charge, by calling 1.800.959.4246. Please refer to the Fund’s Statement of Additional Information for information on the Fund’s sub-advisers.
| | | | | | |
Office of the Fund 11 Greenway Plaza, Suite 1000 Houston, TX 77046-1173 | | Investment Adviser Invesco Advisers, Inc. 1555 Peachtree Street, N.E. Atlanta, GA 30309 | | Distributor Invesco Distributors, Inc. 11 Greenway Plaza, Suite 1000 Houston, TX 77046-1173 | | Auditors PricewaterhouseCoopers LLP 1000 Louisiana Street, Suite 5800 Houston, TX 77002-5678 |
| | | |
| | | | | | |
Counsel to the Fund Stradley Ronon Stevens & Young, LLP 2005 Market Street, Suite 2600 Philadelphia, PA 19103-7018 | | Counsel to the Independent Trustees Goodwin Procter LLP 901 New York Avenue, N.W. Washington, D.C. 20001 | | Transfer Agent Invesco Investment Services, Inc. 11 Greenway Plaza, Suite 1000 Houston, TX 77046-1173 | | Custodian State Street Bank and Trust Company 225 Franklin Street Boston, MA 02110-2801 |
T-4 Invesco Balanced-Risk Commodity Strategy Fund
Explore High-Conviction Investing with Invesco

Invesco mailing information
Send general correspondence to Invesco Investment Services, Inc., P.O. Box 219078, Kansas City, MO 64121-9078.
Important notice regarding delivery of security holder documents
To reduce Fund expenses, only one copy of most shareholder documents may be mailed to shareholders with multiple accounts at the same address (Householding). Mailing of your shareholder documents may be householded indefinitely unless you instruct us otherwise. If you do not want the mailing of these documents to be combined with those for other members of your household, please contact Invesco Investment Services, Inc. at 800 959 4246 or contact your financial institution. We will begin sending you individual copies for each account within 30 days after receiving your request.
Fund holdings and proxy voting information
The Fund provides a complete list of its holdings four times in each fiscal year, at the quarter ends. For the second and fourth quarters, the lists appear in the Fund’s semiannual and annual reports to shareholders. For the first and third quarters, the Fund files the lists with the Securities and Exchange Commission (SEC) on Form N-Q. The most recent list of portfolio holdings is available at invesco.com/completeqtrholdings. Shareholders can also look up the Fund’s Forms N-Q on the SEC website at sec.gov. Copies of the Fund’s Forms N-Q may be reviewed and copied at the SEC Public Reference Room in Washington, D.C. You can obtain information on the operation of the Public Reference Room, including information about duplicating fee charges, by calling 202 551 8090 or 800 732 0330, or by electronic request at the following email address: publicinfo@sec.gov.
The SEC file numbers for the Fund are shown below.
A description of the policies and procedures that the Fund uses to determine how to vote proxies relating to portfolio securities is available without charge, upon request, from our Client Services department at 800 959 4246 or at invesco.com/proxyguidelines. The information is also available on the SEC website, sec.gov.
| | |
Information regarding how the Fund voted proxies related to its portfolio securities during the most recent 12-month period ended June 30 is available at invesco.com/proxysearch. The information is also available on the SEC website, sec.gov. Invesco Advisers, Inc. is an investment adviser; it provides investment advisory services to individual and institutional clients and does not sell securities. Invesco Distributors, Inc. is the US distributor for Invesco Ltd.’s retail mutual funds, exchange-traded funds and institutional money market funds. Both are wholly owned, indirect subsidiaries of Invesco Ltd. | |  |
| | | | |
| SEC file numbers: 811-05426 and 033-19338 | | BRCS-AR-1 | | Invesco Distributors, Inc. |
| | | | |
| | |
 | | Annual Report to Shareholders | | October 31, 2016 |
| | |
| | Invesco Developing Markets Fund |
| | Nasdaq: |
| | A: GTDDX ∎ B: GTDBX ∎ C: GTDCX ∎ Y: GTDYX ∎ R5: GTDIX ∎ R6: GTDFX |

Letters to Shareholders
| | |

Philip Taylor | | Dear Shareholders: This annual report includes information about your Fund, including performance data and a complete list of its investments as of the close of the reporting period. Inside is a discussion of how your Fund was managed and the factors that affected its performance during the reporting period. In December 2015, the US Federal Reserve raised short-term interest rates for the first time since 2006, signaling its belief that the economy was likely to continue strengthening. Indeed, throughout the reporting period, US economic data were generally positive and the economy expanded at a moderate rate – but there were some bumps along the road. Job growth in May 2016 was very weak, but it was followed by strong increases in nonfarm payrolls in June and July. Increased concerns about global economic weakness caused US stock market indexes to |
| sink at the start of calendar year 2016, but they eventually recovered; they sank again following the UK’s decision to leave the European Union, but then quickly recovered and reached record highs later in the summer. Strong demand for income-producing investments, particularly those perceived to be lower risk, benefited bonds as well as dividend-paying stocks for much of the reporting period. While economic news in the US was generally positive, news overseas was less upbeat. The European Central Bank, and central banks in China and Japan – as well as other countries – maintained extraordinarily accommodative monetary policies in response to economic weakness. As the fiscal year drew to a close, uncertainty about the outcome of the US presidential election resulted in increased market volatility; the surprise outcome after the close of the reporting period suggested that market volatility may continue for some time to come. |
Short-term market volatility can prompt some investors to abandon their investment plans – and can cause others to settle for average results. The investment professionals at Invesco, in contrast, invest with high conviction, take a long-term perspective and have a passion to exceed. Invesco’s pure focus on investment management eliminates possible distractions and means that there are no competing lines of business for us to support. Just as important, we embrace a variety of investment strategies, asset classes and geographies – because we know that no single investment approach meets the diverse needs of all of our clients. We manage all our investment approaches with a passion to exceed. All our investment teams have a highly disciplined, long-term investing style that eliminates short-term decision-making. Of course, investing with high conviction can’t guarantee a profit or ensure success; no investment strategy can. To learn more about how we invest with high conviction, visit invesco.com/HighConviction.
You, too, can invest with high conviction by maintaining a long-term investment perspective and by working with your financial adviser on a regular basis. During periods of short-term market volatility or uncertainty, your financial adviser can keep you focused on your long-term investment goals – a new home, a child’s college education or a secure retirement. He or she also can share research about the economy, the markets and individual investment options.
Visit our website for more information on your investments
Our website, invesco.com/us, offers a wide range of market insights and investment perspectives. On the website, you’ll find detailed information about our funds, including performance, holdings and portfolio manager commentaries. You can access information about your account by completing a simple, secure online registration. Click on the “Need to register” link in the “Account Access” box on our homepage to get started.
In addition to the resources accessible on our website and through our mobile app, you can obtain timely updates to help you stay informed about the markets, the economy and investing by connecting with Invesco on Twitter, LinkedIn or Facebook. You can access our blog at blog.invesco.us.com. Our goal is to provide you the information you want, when and where you want it.
Finally, I’m pleased to share with you Invesco’s commitment to both the Principles for Responsible Investment and to considering environmental, social and governance issues in our robust investment process. I invite you to learn more at invesco.com/esg.
Have questions?
For questions about your account, contact an Invesco client services representative at 800 959 4246. For Invesco-related questions or comments, please email me directly at phil@invesco.com.
All of us at Invesco look forward to serving your investment management needs. Thank you for investing with us.
Sincerely,

Philip Taylor
Senior Managing Director, Invesco Ltd.
2 Invesco Developing Markets Fund
| | | | | | |

Bruce Crockett | | | | Dear Fellow Shareholders: Among the many important lessons I’ve learned in more than 40 years in a variety of business endeavors is the value of a trusted advocate. As independent chair of the Invesco Funds Board, I can assure you that the members of the Board are strong advocates for the interests of investors in Invesco’s mutual funds. We work hard to represent your interests through oversight of the quality of the investment management services your funds receive and other matters important to your investment, including but not limited to: |
| | | | ∎ | | Ensuring that Invesco offers a diverse lineup of mutual funds that your financial adviser can use to strive to meet your financial needs as your investment goals change over time. |
| | | | ∎ | | Monitoring how the portfolio management teams of the Invesco funds are performing in light of changing economic and market conditions. |
| ∎ | | Assessing each portfolio management team’s investment performance within the context of the investment strategy described in the fund’s prospectus. |
| ∎ | | Monitoring for potential conflicts of interests that may impact the nature of the services that your funds receive. |
We believe one of the most important services we provide our fund shareholders is the annual review of the funds’ advisory and sub-advisory contracts with Invesco Advisers and its affiliates. This review is required by the Investment Company Act of 1940 and focuses on the nature and quality of the services Invesco provides as the adviser to the Invesco funds and the reasonableness of the fees that it charges for those services. Each year, we spend months carefully reviewing information received from Invesco and a variety of independent sources, such as performance and fee data prepared by Lipper Inc., an independent, third-party firm widely recognized as a leader in its field. We also meet with our independent legal counsel and other independent advisers to review and help us assess the information that we have received. Our goal is to assure that you receive quality investment management services for a reasonable fee.
I trust the measures outlined above provide assurance that you have a worthy advocate when it comes to choosing the Invesco Funds.
As always, please contact me at bruce@brucecrockett.com with any questions or concerns you may have. On behalf of the Board, we look forward to continuing to represent your interests and serving your needs.
Sincerely,

Bruce L. Crockett
Independent Chair
Invesco Funds Board of Trustees
3 Invesco Developing Markets Fund
Management’s Discussion of Fund Performance
| | | | |
Performance summary For the fiscal year ended October 31, 2016, Class A shares of Invesco Developing Markets Fund (the Fund), at net asset value (NAV), outperformed the MSCI Emerging Markets Index, the Fund’s broad market/style-specific benchmark. Your Fund’s long-term performance appears later in this report. | |
Fund vs. Indexes Total returns, 10/31/15 to 10/31/16, at net asset value (NAV). Performance shown does not include applicable contingent deferred sales charges (CDSC) or front-end sales charges, which would have reduced performance. | |
Class A Shares | | | 19.83 | % |
Class B Shares | | | 18.95 | |
Class C Shares | | | 18.93 | |
Class Y Shares | | | 20.14 | |
Class R5 Shares | | | 20.29 | |
Class R6 Shares | | | 20.35 | |
MSCI Emerging Markets Indexq (Broad Market/Style-Specific Index) | | | 9.27 | |
Lipper Emerging Market Funds Index∎ (Peer Group Index) | | | 11.25 | |
Source(s): qFactSet Research Systems Inc.; ∎Lipper Inc. | | | | |
Market conditions and your Fund
The global economy continued to expand, albeit slowly, for the fiscal year ended October 31, 2016. However, that growth became increasingly uneven across developed and emerging economies, amid continued volatility in oil prices and as the policies of central banks globally began to diverge.
Stocks began calendar year 2016 on a negative note, driven by investor concerns about economic weakness in China and falling oil prices. Markets recovered in late February and posted gains amid concerted central bank commitments to very loose monetary policy. All major global stock indexes experienced steep declines again in June after UK voters opted to leave the European Union. After the initial shock of the UK vote, stocks made a strong recovery, regaining most of their losses as fears of a shock to consumer confidence never materialized.
Within this environment, emerging markets delivered strong performance in 2016, comfortably outperforming developed
markets. This strength was driven by improved economic conditions and stabilized corporate earnings. The macro-level strengthening included lower inflation, stable commodity prices, improved current account balances and a reversal in currency depreciation.
Regardless of the macroeconomic environment, we remain focused on our bottom-up investment approach of identifying attractive companies that fit our earnings, quality and valuation (EQV) process.
On a geographic basis, the Fund’s holdings in Brazil, Hong Kong, Russia, Indonesia and South Korea delivered double-digit gains, outperforming the MSCI Emerging Markets Index in each of these markets and contributing favorably to both absolute returns and returns versus the broad market/style-specific benchmark. In contrast, Fund holdings in Israel, Nigeria, Mexico and Turkey delivered negative returns and detracted from both absolute and relative Fund performance.
The Fund’s overweight exposure to Brazil, one of the reporting period’s strongest markets, contributed to performance relative to the Fund’s broad market/style-specific benchmark. Despite Brazil’s long, deep economic contraction, the Brazilian market rebounded strongly during the reporting period and the country saw renewed optimism on the strength of a change in government, a new economic team and signs of a shift in economic policy. Despite the political situation in Brazil, our strategy, as always, was to focus on underlying EQV company fundamentals. For example, Fund holdings BM&FBOVESPA, Fleury and CETIP, all reported strong earnings growth in 2015 despite Brazil’s deep recession and steep decline in Brazilian equity market earnings.
From a sector perspective, the Fund’s holdings in the financials, health care, telecommunication services, real estate and consumer staples sectors outperformed the sectors of the MSCI Emerging Markets Index and contributed favorably to both relative and absolute returns. The Fund’s holdings in the energy and utilities sectors, however, underperformed those of the MSCI Emerging Markets Index and were among the most significant detractors from the Fund’s performance versus the broad market/style-specific index.
The Fund’s cash exposure, in a rising-market environment, was a meaningful detractor from Fund performance versus the broad market/style-specific index. It is important to note that, similar to the Fund’s sector and regional allocations, cash is a residual of our bottom-up investment process and not the result of any “top-down” tactical asset allocation or risk-management allocation decision. During the reporting period, cash exposure rose for a couple of reasons. First, it was a function of us taking profits in some sharply rallying names. Second, in
| | | | | | |
| Portfolio Composition | |
By sector | | | % of total net assets | |
| | | | |
Financials | | | 31.2 | % |
Information Technology | | | 12.8 | |
| Consumer Staples | | | 10.4 | |
| Health Care | | | 7.4 | |
| Telecommunication Services | | | 6.4 | |
| Consumer Discretionary | | | 5.6 | |
| Materials | | | 4.1 | |
| Utilities | | | 1.9 | |
| Energy | | | 1.4 | |
| Industrials | | | 1.1 | |
| Money Market Funds Plus Other Assets Less Liabilities | | | 17.7 | |
| | | | |
| Top 10 Equity Holdings* |
| | % of total net assets |
| | | | | | |
1. | | BM&FBOVESPA S.A. | | | 3.6 | % |
2. | | Taiwan Semiconductor Manufacturing Co. Ltd. | | | 3.5 | |
3. | | Fleury S.A. | | | 3.4 | |
4. | | Kasikornbank PCL | | | 3.4 | |
5. | | WH Group Ltd. | | | 3.3 | |
6. | | PT Telekomunikasi Indonesia Persero Tbk | | | 3.3 | |
7. | | Haci Omer Sabanci Holding A.S. | | | 2.9 | |
8. | | Richter Gedeon Nyrt | | | 2.7 | |
9. | | Sberbank PAO-Preference Shares | | | 2.6 | |
10. | | China Mobile Ltd. | | | 2.5 | |
| | | | |
Total Net Assets | | | $2.5 billion | |
| |
| Total Number of Holdings* | | | 52 | |
The Fund’s holdings are subject to change, and there is no assurance that the Fund will continue to hold any particular security.
*Excluding money market fund holdings.
Data presented here are as of October 31, 2016.
4 Invesco Developing Markets Fund
a growth-starved market the highest quality names continued to trade at elevated valuations.
From an individual securities perspective, BM&FBOVESPA, one of the world’s largest stock exchanges, was the top contributor to Fund performance for the reporting period. BM&F’s stock was significantly depressed in 2015 due to Brazil’s political and economic turmoil, but the stock price rose after the ousting of Brazil’s President Rousseff and the expectation that this change could allow for reforms and a more orthodox economic policy. This high quality company enjoyed monopoly status in its key businesses and its process of acquiring Brazil’s largest security registration business is expected to add stability to BM&F’s earnings.
In contrast, Teva Pharmaceutical Industries was the largest detractor from Fund performance for the reporting period. Teva is an Israel-based company that manufactures and sells generic, proprietary and over-the-counter pharmaceuticals. Over the reporting period, Teva was affected by a revaluation of the pharmaceutical sector and a delay in the closing of its acquisition of Allergan’s (not a Fund holding) generics business.
In terms of activity over the reporting period, most of it was on the sell side. We trimmed several of our financials and information technology names, taking some profits. Weakening fundamentals led us to sell certain portfolio holdings including BRF SA and CNOOC. Only two new holdings were added to the Fund’s portfolio during the reporting period – South-Korean internet content service operator NAVER and China-based automotive glass manufacturer Fuyao Glass Industry Group.
As always, regardless of the macroeconomic environment, we remain focused on a bottom-up investment approach of identifying attractive companies that fit our EQV-focused investment process. We continue to look for high-quality companies that exhibit the following characteristics: strong organic growth; high returns on capital; pricing power; strong balance sheets; cash generation; and reasonable valuations. In addition, we continue to favor companies that are able to consistently generate cash during weak economic environments. We believe that this balanced EQV-focused approach may help deliver attractive returns over the long term.
We thank you for your continued investment in Invesco Developing Markets Fund.
The views and opinions expressed in management’s discussion of Fund performance are those of Invesco Advisers, Inc. These views and opinions are subject to change at any time based on factors such as market and economic conditions. These views and opinions may not be relied upon as investment advice or recommendations, or as an offer for a particular security. The information is not a complete analysis of every aspect of any market, country, industry, security or the Fund. Statements of fact are from sources considered reliable, but Invesco Advisers, Inc. makes no representation or warranty as to their completeness or accuracy. Although historical performance is no guarantee of future results, these insights may help you understand our investment management philosophy.
See important Fund and, if applicable, index disclosures later in this report.
| | |
 | | Shuxin (Steve) Cao Chartered Financial Analyst, Portfolio Manager, is lead manager of Invesco Developing Markets |
| Fund. He joined Invesco in 1997. Mr. Cao earned a BA in English from the Tianjin Foreign Language Institute and an MBA from Texas A&M University. He is also a Certified Public Accountant. |
| |
 | | Borge Endresen Chartered Financial Analyst, Portfolio Manager, is lead manager of Invesco Developing Markets |
| Fund. He joined Invesco in 1999. Mr. Endresen earned a BS in finance from the University of Oregon and an MBA from The University of Texas at Austin. |
| |
 | | Brent Bates Chartered Financial Analyst, Portfolio Manager, is manager of Invesco Developing Markets Fund. He |
| joined Invesco in 1996. Mr. Bates earned a BBA from Texas A&M University and is a Certified Public Accountant. |
| |
 | | Mark Jason Chartered Financial Analyst, Portfolio Manager, is manager of Invesco Developing Markets Fund. He |
| joined Invesco in 2001. Mr. Jason earned a BS in finance and a BS in real estate from California State University, Northridge. |
5 Invesco Developing Markets Fund
Your Fund’s Long-Term Performance
Results of a $10,000 Investment – Oldest Share Class(es)
Fund and index data from 10/31/06
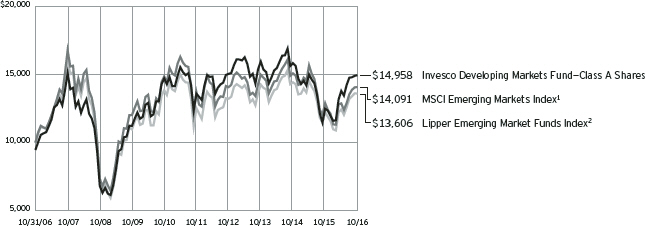
| 1 Source: | FactSet Research Systems Inc. |
Past performance cannot guarantee comparable future results.
The data shown in the chart include reinvested distributions, applicable sales charges and Fund expenses including
management fees. Index results include reinvested dividends, but they do not reflect sales charges. Performance of the peer group, if applicable, reflects fund expenses and management fees; performance
of a market index does not. Performance shown in the chart and table(s) does not reflect deduction of taxes a shareholder would pay on Fund distributions or sale of Fund shares.
6 Invesco Developing Markets Fund
| | | | |
| Average Annual Total Returns | |
| As of 10/31/16, including maximum applicable sales charges | |
| |
Class A Shares | | | | |
Inception (1/11/94) | | | 4.89 | % |
10 Years | | | 4.11 | |
5 Years | | | 0.79 | |
1 Year | | | 13.26 | |
| |
Class B Shares | | | | |
Inception (11/3/97) | | | 6.00 | % |
10 Years | | | 4.08 | |
5 Years | | | 0.80 | |
1 Year | | | 13.95 | |
| |
Class C Shares | | | | |
Inception (3/1/99) | | | 8.99 | % |
10 Years | | | 3.92 | |
5 Years | | | 1.18 | |
1 Year | | | 17.93 | |
| |
Class Y Shares | | | | |
10 Years | | | 4.91 | % |
5 Years | | | 2.19 | |
1 Year | | | 20.14 | |
| |
Class R5 Shares | | | | |
Inception (10/25/05) | | | 8.22 | % |
10 Years | | | 5.14 | |
5 Years | | | 2.34 | |
1 Year | | | 20.29 | |
| |
Class R6 Shares | | | | |
10 Years | | | 4.89 | % |
5 Years | | | 2.30 | |
1 Year | | | 20.35 | |
Class Y shares incepted on October 3, 2008. Performance shown prior to that date is that of Class A shares and includes the 12b-1 fees applicable to Class A shares.
Class R6 shares incepted on September 24, 2012. Performance shown prior to that date is that of Class A shares and includes the 12b-1 fees applicable to Class A shares.
The performance data quoted represent past performance and cannot guarantee comparable future results; current performance may be lower or higher. Please visit invesco.com/performance for the most recent month-end performance. Performance figures reflect reinvested distributions, changes in net asset value and the effect of the maximum sales charge unless otherwise stated. Investment return and principal value will fluctuate so that you may have a gain or loss when you sell shares.
| | |
| Average Annual Total Returns |
| As of 9/30/16, the most recent calendar quarter end, including maximum applicable sales charges |
| |
Class A Shares | | |
Inception (1/11/94) | | 4.89% |
10 Years | | 4.82 |
5 Years | | 2.60 |
1 Year | | 22.83 |
| |
Class B Shares | | |
Inception (11/3/97) | | 6.00% |
10 Years | | 4.79 |
5 Years | | 2.64 |
1 Year | | 23.99 |
| |
Class C Shares | | |
Inception (3/1/99) | | 9.02% |
10 Years | | 4.63 |
5 Years | | 2.99 |
1 Year | | 27.99 |
| |
Class Y Shares | | |
10 Years | | 5.63% |
5 Years | | 4.03 |
1 Year | | 30.27 |
| |
Class R5 Shares | | |
Inception (10/25/05) | | 8.25% |
10 Years | | 5.86 |
5 Years | | 4.17 |
1 Year | | 30.41 |
| |
Class R6 Shares | | |
10 Years | | 5.60% |
5 Years | | 4.13 |
1 Year | | 30.52 |
The net annual Fund operating expense ratio set forth in the most recent Fund prospectus as of the date of this report for Class A, Class B, Class C, Class Y, Class R5 and Class R6 shares was 1.44%, 2.19%, 2.19%, 1.19%, 1.04% and 1.01%, respectively.1 The total annual Fund operating expense ratio set forth in the most recent Fund prospectus as of the date of this report for Class A, Class B, Class C, Class Y, Class R5 and Class R6 shares was 1.45%, 2.20%, 2.20%, 1.20%, 1.05% and 1.02%, respectively. The expense ratios presented above may vary from the expense ratios presented in other sections of this report that are based on expenses incurred during the period covered by this report.
Class A share performance reflects the maximum 5.50% sales charge, and Class B and Class C share performance reflects the applicable contingent deferred
sales charge (CDSC) for the period involved. The CDSC on Class B shares declines from 5% beginning at the time of purchase to 0% at the beginning of the seventh year. The CDSC on Class C shares is 1% for the first year after purchase. Class Y, Class R5 and Class R6 shares do not have a front-end sales charge or a CDSC; therefore, performance is at net asset value.
The performance of the Fund’s share classes will differ primarily due to different sales charge structures and class expenses.
Fund performance reflects any applicable fee waivers and/or expense reimbursements. Had the adviser not waived fees and/or reimbursed expenses currently or in the past, returns would have been lower. See current prospectus for more information.
| 1 | Total annual Fund operating expenses after any contractual fee waivers and/or expense reimbursements by the adviser in effect through at least June 30, 2018. See current prospectus for more information. |
7 Invesco Developing Markets Fund
Invesco Developing Markets Fund’s investment objective is long-term growth of capital.
| ∎ | | Unless otherwise stated, information presented in this report is as of October 31, 2016, and is based on total net assets. |
| ∎ | | Unless otherwise noted, all data provided by Invesco. |
| ∎ | | To access your Fund’s reports/prospectus, visit invesco.com/fundreports. |
About share classes
| ∎ | | Class B shares may not be purchased for new or additional investments. Please see the prospectus for more information. |
| ∎ | | Class Y shares are available to only certain investors. Please see the prospectus for more information. |
| ∎ | | Class R5 shares and Class R6 shares are primarily intended for employer sponsored retirement and benefit plans that meet certain standards and for institutional investors. Please see the prospectus for more information. |
Principal risks of investing in the Fund
| ∎ | | Depositary receipts risk. Investing in depositary receipts involves the same risks as direct investments in foreign securities. In addition, the underlying issuers of certain depositary receipts are under no obligation to distribute shareholder communications or pass through any voting rights with respect to the deposited securities to the holders of such receipts. The Fund may therefore receive less timely information or have less control than if it invested directly in the foreign issuer. |
| ∎ | | Derivatives risk. The value of a derivative instrument depends largely on (and is derived from) the value of an underlying security, currency, commodity, interest rate, index or other asset (each referred to as an underlying asset). In addition to risks relating to the underlying assets, the use of derivatives may include other, possibly greater, risks, including counterparty, leverage and liquidity risks. Counterparty risk is the risk that the counterparty to the derivative contract will default on its obligation to pay the Fund the amount owed or otherwise perform under the derivative contract. Derivatives create leverage risk because they do not require payment up front equal to the economic exposure created by owning the derivative. As a result, an adverse change in the value of the underlying asset could result in the Fund |
| | | sustaining a loss that is substantially greater than the amount invested in the derivative, which may make the Fund’s returns more volatile and increase the risk of loss. Derivative instruments may also be less liquid than more traditional investments and the Fund may be unable to sell or close out its derivative positions at a desirable time or price. This risk may be more acute under adverse market conditions, during which the Fund may be most in need of liquidating its derivative positions. Derivatives may also be harder to value, less tax efficient and subject to changing government regulation that could impact the Fund’s ability to use certain derivatives or their cost. Also, derivatives used for hedging or to gain or limit exposure to a particular market segment may not provide the expected benefits, particularly during adverse market conditions. |
| ∎ | | Emerging markets securities risk. Emerging markets (also referred to as developing markets) are generally subject to greater market volatility, political, social and economic instability, uncertain trading markets and more governmental limitations on foreign investment than more developed markets. In addition, emerging markets may be subject to lower trading volume and greater price fluctuations than companies in more developed markets. Securities law and the enforcement of systems of taxation in many emerging market countries may change quickly and unpredictably. In addition, investments in emerging markets securities may also be subject to additional transaction costs, delays in settlement procedures, and lack of timely information. |
| ∎ | | Foreign securities risk. The Fund’s foreign investments may be adversely affected by political and social instability, changes in economic or taxation policies, difficulty in enforcing obligations, decreased liquidity or increased volatility. Foreign investments also involve the risk of the possible seizure, nationalization or expropriation of the issuer |
| | | or foreign deposits (in which the Fund could lose its entire investments in a certain market) and the possible adoption of foreign governmental restrictions such as exchange controls. Unless the Fund has hedged its foreign securities risk, foreign securities risk also involves the risk of negative foreign currency rate fluctuations, which may cause the value of securities denominated in such foreign currency (or other instruments through which the Fund has exposure to foreign currencies) to decline in value. Currency exchange rates may fluctuate significantly over short periods of time. Currency hedging strategies, if used, are not always successful. |
| ∎ | | Geographic focus risk. The Fund may from time to time invest a substantial amount of its assets in securities of issuers located in a single country or a limited number of countries. Adverse economic, political or social conditions in those countries may therefore have a significant negative impact on the Fund’s investment performance. |
| ∎ | | Growth investing risk. Growth stocks tend to be more expensive relative to the issuing company’s earnings or assets compared with other types of stock. As a result, they tend to be more sensitive to changes in, or investors’ expectations of, the issuing company’s earnings and can be more volatile. |
| ∎ | | Management risk. The Fund is actively managed and depends heavily on the Adviser’s judgment about markets, interest rates or the attractiveness, relative values, liquidity, or potential appreciation of particular investments made for the Fund’s portfolio. The Fund could experience losses if these judgments prove to be incorrect. Additionally, legislative, regulatory, or tax developments may adversely affect management of the Fund and, therefore, the ability of the Fund to achieve its investment objective. |
| ∎ | | Market risk. The market values of the Fund’s investments, and therefore the value of the Fund’s shares, will go up and down, sometimes rapidly or unpredictably. Market risk may affect a single issuer, industry or section of the economy, or it may affect the market as a whole. Individual stock prices tend to go up and down more dramatically than |
|
This report must be accompanied or preceded by a currently effective Fund prospectus, which contains more complete information, including sales charges and expenses. Investors should read it carefully before investing. |
|
NOT FDIC INSURED | MAY LOSE VALUE | NO BANK GUARANTEE |
8 Invesco Developing Markets Fund
| | those of certain other types of investments, such as bonds. During a general downturn in the financial markets, multiple asset classes may decline in value. When markets perform well, there can be no assurance that specific investments held by the Fund will rise in value. |
| ∎ | | Preferred securities risk. Preferred securities are subject to issuer-specific and market risks applicable generally to equity securities. Preferred securities also may be subordinated to bonds or other debt instruments, subjecting them to a greater risk of non-payment, may be less liquid than many other securities, such as common stocks, and generally offer no voting rights with respect to the issuer. |
| ∎ | | Sector focus risk. The Fund may from time to time invest a significant amount of its assets (i.e. over 25%) in one market sector or group of related industries. In this event, the Fund’s performance will depend to a greater extent on the overall condition of the sector or group of industries and there is increased risk that the Fund will lose significant value if conditions adversely affect that sector or group of industries. |
| ∎ | | Small- and mid-capitalization companies risks. Small- and mid-capitalization companies tend to be more vulnerable to changing market conditions, may have little or no operating history or track record of success, and may have more limited product lines and markets, less experienced management and fewer financial resources than larger companies. These companies’ securities may be more volatile and less liquid than those of more established companies, and their returns may vary, sometimes significantly, from the overall securities market. |
About indexes used in this report
| ∎ | | The MSCI Emerging Markets IndexSM is an unmanaged index considered representative of stocks of developing countries. The index is computed using the net return, which withholds applicable taxes for non-resident investors. |
| ∎ | | The Lipper Emerging Market Funds Index is an unmanaged index considered representative of emerging market funds tracked by Lipper. |
| ∎ | | The Fund is not managed to track the performance of any particular index, including the index(es) described here, and consequently, the performance of the Fund may deviate significantly from the performance of the index(es). |
| ∎ | | A direct investment cannot be made in an index. Unless otherwise indicated, index results include reinvested dividends, and they do not reflect sales charges. Performance of the peer group, if applicable, reflects fund expenses; performance of a market index does not. |
Other information
| ∎ | | CPA® and Certified Public Accountant® are trademarks owned by the American Institute of Certified Public Accountants. |
| ∎ | | The returns shown in management’s discussion of Fund performance are based on net asset values (NAVs) calculated for shareholder transactions. Generally accepted accounting principles require adjustments to be made to the net assets of the Fund at period end for financial reporting purposes, and as such, the NAVs for shareholder transactions and the returns based on those NAVs may differ from the NAVs and returns reported in the Financial Highlights. |
| ∎ | | Industry classifications used in this report are generally according to the Global Industry Classification Standard, which was developed by and is the exclusive property and a service mark of MSCI Inc. and Standard & Poor’s. |
9 Invesco Developing Markets Fund
Schedule of Investments
October 31, 2016
| | | | | | | | |
| | | Shares | | | Value | |
Common Stocks & Other Equity Interests–82.26% | |
| Brazil–19.07% | |
Arcos Dorados Holdings, Inc.–Class A(a) | | | 5,688,509 | | | $ | 34,984,330 | |
Banco Bradesco S.A.–ADR | | | 4,034,304 | | | | 41,997,105 | |
BM&FBOVESPA S.A. | | | 14,869,420 | | | | 87,597,367 | |
BR Malls Participacoes S.A.(a) | | | 12,605,580 | | | | 50,481,571 | |
CETIP S.A.–Mercados Organizados | | | 4,354,486 | | | | 61,225,472 | |
Cielo S.A. | | | 4,533,547 | | | | 46,028,021 | |
Duratex S.A. | | | 12,791,942 | | | | 34,552,774 | |
Fleury S.A. | | | 6,293,700 | | | | 83,324,348 | |
TOTVS S.A. | | | 2,092,600 | | | | 18,989,956 | |
Wilson Sons Ltd.–BDR | | | 962,600 | | | | 10,406,486 | |
| | | | | | | | 469,587,430 | |
|
| China–13.16% | |
Baidu, Inc.–ADR(a) | | | 98,098 | | | | 17,349,612 | |
China Mobile Ltd. | | | 5,451,500 | | | | 62,454,890 | |
Fuyao Glass Industry Group Co., Ltd.–Class A | | | 4,959,490 | | | | 12,952,144 | |
Industrial & Commercial Bank of China Ltd.–Class H | | | 58,050,000 | | | | 34,861,545 | |
Kweichow Moutai Co., Ltd.–Class A | | | 1,034,561 | | | | 48,546,101 | |
Lee & Man Paper Manufacturing Ltd. | | | 68,668,000 | | | | 51,510,994 | |
NetEase, Inc.–ADR | | | 241,880 | | | | 62,160,741 | |
Stella International Holdings Ltd. | | | 11,189,000 | | | | 19,419,110 | |
Want Want China Holdings Ltd. | | | 24,448,000 | | | | 14,910,681 | |
| | | | | | | | 324,165,818 | |
|
| Egypt–0.44% | |
Egyptian Financial Group-Hermes Holding Co.(a) | | | 6,185,376 | | | | 10,910,414 | |
|
| France–0.73% | |
Bollore S.A. | | | 5,436,306 | | | | 17,903,115 | |
|
| Hong Kong–4.38% | |
Galaxy Entertainment Group Ltd. | | | 6,518,000 | | | | 26,768,053 | |
WH Group Ltd.–REGS(b) | | | 99,909,000 | | | | 81,030,451 | |
| | | | | | | | 107,798,504 | |
|
| Hungary–2.71% | |
Richter Gedeon Nyrt | | | 3,104,462 | | | | 66,718,120 | |
|
| Indonesia–6.57% | |
PT Bank Central Asia Tbk | | | 32,068,500 | | | | 38,105,147 | |
PT Bank Mandiri Persero Tbk | | | 30,063,300 | | | | 26,390,910 | |
PT Perusahaan Gas Negara Persero Tbk | | | 87,008,300 | | | | 17,037,849 | |
PT Telekomunikasi Indonesia Persero Tbk | | | 248,402,100 | | | | 80,193,598 | |
| | | | | | | | 161,727,504 | |
|
| Israel–1.87% | |
Israel Chemicals Ltd. | | | 3,907,788 | | | | 13,914,730 | |
| | | | | | | | |
| | | Shares | | | Value | |
| Israel–(continued) | |
Teva Pharmaceutical Industries Ltd.–ADR | | | 755,127 | | | $ | 32,274,128 | |
| | | | | | | | 46,188,858 | |
|
| Malaysia–2.16% | |
Public Bank Bhd. | | | 11,209,800 | | | | 53,075,844 | |
|
| Mexico–4.94% | |
Fomento Economico Mexicano, S.A.B. de C.V.–ADR | | | 602,044 | | | | 57,597,549 | |
Grupo Televisa S.A.B.–ADR | | | 1,762,846 | | | | 43,242,612 | |
Kimberly-Clark de Mexico, S.A.B. de C.V.–Class A | | | 9,717,670 | | | | 20,939,454 | |
| | | | | | | | 121,779,615 | |
|
| Nigeria–0.85% | |
Zenith Bank PLC | | | 440,176,509 | | | | 20,814,471 | |
|
| Peru–1.32% | |
Credicorp Ltd. | | | 218,960 | | | | 32,554,973 | |
|
| Philippines–2.60% | |
Energy Development Corp. | | | 246,329,900 | | | | 29,996,830 | |
SM Prime Holdings Inc. | | | 61,407,100 | | | | 34,093,932 | |
| | | | | | | | 64,090,762 | |
|
| Russia–8.04% | |
Gazprom PAO–ADR | | | 3,731,713 | | | | 16,093,675 | |
Mobile TeleSystems PJSC–ADR | | | 1,836,494 | | | | 14,159,369 | |
Sberbank of Russia PJSC | | | 25,812,144 | | | | 60,003,529 | |
Sberbank of Russia PJSC–Preference Shares | | | 35,854,175 | | | | 63,098,687 | |
Yandex N.V.–Class A(a) | | | 2,272,126 | | | | 44,738,161 | |
| | | | | | | | 198,093,421 | |
|
| South Korea–1.57% | |
NAVER Corp. | | | 24,807 | | | | 18,587,221 | |
Samsung Electronics Co., Ltd. | | | 14,170 | | | | 20,215,576 | |
| | | | | | | | 38,802,797 | |
|
| Taiwan–3.53% | |
Taiwan Semiconductor Manufacturing Co. Ltd. | | | 14,556,000 | | | | 86,947,619 | |
|
| Thailand–3.36% | |
Kasikornbank PCL | | | 16,868,700 | | | | 82,687,054 | |
|
| Turkey–4.96% | |
Anadolu Efes Biracilik ve Malt Sanayii A.S. | | | 3,181,985 | | | | 19,446,178 | |
EIS Eczacibasi Ilaç, Sinai ve Finansal Yatirimlar Sanayi ve Ticaret A.S. | | | 10,359,196 | | | | 13,038,973 | |
Haci Omer Sabanci Holding A.S. | | | 23,428,223 | | | | 70,506,998 | |
Tupras-Turkiye Petrol Rafinerileri A.S. | | | 950,357 | | | | 19,312,010 | |
| | | | | | | | 122,304,159 | |
Total Common Stocks & Other Equity Interests
(Cost $1,792,937,191) | | | | 2,026,150,478 | |
See accompanying Notes to Financial Statements which are an integral part of the financial statements.
10 Invesco Developing Markets Fund
| | | | | | | | |
| | | Shares | | | Value | |
Money Market Funds–17.32% | |
Government & Agency Portfolio–Institutional Class, 0.29%(c) | | | 255,904,452 | | | $ | 255,904,452 | |
Treasury Portfolio–Institutional Class, 0.22%(c) | | | 170,602,968 | | | | 170,602,968 | |
Total Money Market Funds
(Cost $426,507,420) | | | | 426,507,420 | |
TOTAL INVESTMENTS–99.58%
(Cost $2,219,444,611) | | | | 2,452,657,898 | |
OTHER ASSETS LESS LIABILITIES–0.42% | | | | 10,432,359 | |
NET ASSETS–100.00% | | | $ | 2,463,090,257 | |
Investment Abbreviations:
| | |
| ADR | | – American Depositary Receipt |
| BDR | | – Brazilian Depositary Receipt |
| REGS | | – Regulation S |
Notes to Schedule of Investments:
| (a) | Non-income producing security. |
| (b) | Security purchased or received in transaction exempt from registration under the Securities Act of 1933, as amended (the “1933 Act”). The security may be resold pursuant to an exemption from registration under the 1933 Act, typically to qualified institutional buyers. The value of this security at October 31, 2016 represented 3.29% of the Fund’s Net Assets. |
| (c) | The money market fund and the Fund are affiliated by having the same investment adviser. The rate shown is the 7-day SEC standardized yield as of October 31, 2016. |
See accompanying Notes to Financial Statements which are an integral part of the financial statements.
11 Invesco Developing Markets Fund
Statement of Assets and Liabilities
October 31, 2016
| | | | |
Assets: | |
Investments, at value (Cost $1,792,937,191) | | $ | 2,026,150,478 | |
Investments in affiliated money market funds, at value and cost | | | 426,507,420 | |
Total investments, at value (Cost $2,219,444,611) | | | 2,452,657,898 | |
Foreign currencies, at value (Cost $2,025,528) | | | 1,721,896 | |
Receivable for: | | | | |
Investments sold | | | 6,071,150 | |
Fund shares sold | | | 10,956,937 | |
Dividends | | | 2,012,569 | |
Investment for trustee deferred compensation and retirement plans | | | 314,460 | |
Other assets | | | 72,826 | |
Total assets | | | 2,473,807,736 | |
|
Liabilities: | |
Payable for: | | | | |
Fund shares reacquired | | | 3,402,203 | |
Accrued foreign taxes | | | 5,272,124 | |
Accrued fees to affiliates | | | 1,043,457 | |
Accrued trustees’ and officers’ fees and benefits | | | 4,415 | |
Accrued other operating expenses | | | 629,322 | |
Trustee deferred compensation and retirement plans | | | 365,958 | |
Total liabilities | | | 10,717,479 | |
Net assets applicable to shares outstanding | | $ | 2,463,090,257 | |
|
Net assets consist of: | |
Shares of beneficial interest | | $ | 2,479,001,775 | |
Undistributed net investment income | | | 22,958,558 | |
Undistributed net realized gain (loss) | | | (271,756,793 | ) |
Net unrealized appreciation | | | 232,886,717 | |
| | | $ | 2,463,090,257 | |
| | | | |
Net Assets: | |
Class A | | $ | 824,702,225 | |
Class B | | $ | 8,847,774 | |
Class C | | $ | 82,513,121 | |
Class Y | | $ | 1,055,132,257 | |
Class R5 | | $ | 331,079,348 | |
Class R6 | | $ | 160,815,532 | |
|
Shares outstanding, $0.01 par value per share,
with an unlimited number of shares authorized: | |
Class A | | | 26,887,844 | |
Class B | | | 296,695 | |
Class C | | | 2,770,405 | |
Class Y | | | 34,328,474 | |
Class R5 | | | 10,789,483 | |
Class R6 | | | 5,241,071 | |
Class A: | | | | |
Net asset value per share | | $ | 30.67 | |
Maximum offering price per share | | | | |
(Net asset value of $30.67 ¸ 94.50%) | | $ | 32.46 | |
Class B: | | | | |
Net asset value and offering price per share | | $ | 29.82 | |
Class C: | | | | |
Net asset value and offering price per share | | $ | 29.78 | |
Class Y: | | | | |
Net asset value and offering price per share | | $ | 30.74 | |
Class R5: | | | | |
Net asset value and offering price per share | | $ | 30.69 | |
Class R6: | | | | |
Net asset value and offering price per share | | $ | 30.68 | |
See accompanying Notes to Financial Statements which are an integral part of the financial statements.
12 Invesco Developing Markets Fund
Statement of Operations
For the year ended October 31, 2016
| | | | |
Investment income: | |
Dividends (net of foreign withholding taxes of $5,998,022) | | $ | 52,435,978 | |
Dividends from affiliated money market funds | | | 819,791 | |
Total investment income | | | 53,255,769 | |
| |
Expenses: | | | | |
Advisory fees | | | 19,452,255 | |
Administrative services fees | | | 462,432 | |
Custodian fees | | | 1,130,481 | |
Distribution fees: | | | | |
Class A | | | 1,924,776 | |
Class B | | | 103,733 | |
Class C | | | 763,406 | |
Transfer agent fees — A, B, C and Y | | | 3,180,314 | |
Transfer agent fees — R5 | | | 174,903 | |
Transfer agent fees — R6 | | | 11,905 | |
Trustees’ and officers’ fees and benefits | | | 72,991 | |
Registration and filing fees | | | 154,404 | |
Reports to shareholders | | | 265,081 | |
Professional services fees | | | 77,070 | |
Other | | | 63,524 | |
Total expenses | | | 27,837,275 | |
Less: Fees waived and expense offset arrangement(s) | | | (299,602 | ) |
Net expenses | | | 27,537,673 | |
Net investment income | | | 25,718,096 | |
| |
Realized and unrealized gain (loss) from: | | | | |
Net realized gain (loss) from: | | | | |
Investment securities (net of foreign taxes of $1,139,064) | | | (138,259,587 | ) |
Foreign currencies | | | (1,101,983 | ) |
| | | | (139,361,570 | ) |
Change in net unrealized appreciation (depreciation) of: | | | | |
Investment securities (net of foreign taxes of $1,713,741) | | | 487,623,945 | |
Foreign currencies | | | (9,474 | ) |
| | | | 487,614,471 | |
Net realized and unrealized gain | | | 348,252,901 | |
Net increase in net assets resulting from operations | | $ | 373,970,997 | |
See accompanying Notes to Financial Statements which are an integral part of the financial statements.
13 Invesco Developing Markets Fund
Statement of Changes in Net Assets
For the years ended October 31, 2016 and 2015
| | | | | | | | |
| | | 2016 | | | 2015 | |
Operations: | | | | | |
Net investment income | | $ | 25,718,096 | | | $ | 35,501,710 | |
Net realized gain (loss) | | | (139,361,570 | ) | | | (91,322,225 | ) |
Change in net unrealized appreciation (depreciation) | | | 487,614,471 | | | | (689,222,179 | ) |
Net increase (decrease) in net assets resulting from operations | | | 373,970,997 | | | | (745,042,694 | ) |
| | |
Distributions to shareholders from net investment income: | | | | | | | | |
Class A | | | (7,250,678 | ) | | | (11,257,345 | ) |
Class B | | | — | | | | (46,124 | ) |
Class C | | | — | | | | (226,637 | ) |
Class Y | | | (12,161,332 | ) | | | (20,165,279 | ) |
Class R5 | | | (4,959,683 | ) | | | (9,883,834 | ) |
Class R6 | | | (2,633,867 | ) | | | (2,640,173 | ) |
Total distributions from net investment income | | | (27,005,560 | ) | | | (44,219,392 | ) |
| | |
Distributions to shareholders from net realized gains: | | | | | | | | |
Class A | | | — | | | | (18,963,500 | ) |
Class B | | | — | | | | (466,766 | ) |
Class C | | | — | | | | (2,293,467 | ) |
Class Y | | | — | | | | (26,008,645 | ) |
Class R5 | | | — | | | | (11,459,346 | ) |
Class R6 | | | — | | | | (3,014,719 | ) |
Total distributions from net realized gains | | | — | | | | (62,206,443 | ) |
| | |
Share transactions–net: | | | | | | | | |
Class A | | | (99,784,850 | ) | | | (191,882,572 | ) |
Class B | | | (5,494,664 | ) | | | (10,229,125 | ) |
Class C | | | (12,607,620 | ) | | | (26,078,129 | ) |
Class Y | | | (99,163,924 | ) | | | (72,994,311 | ) |
Class R5 | | | (69,725,261 | ) | | | (200,072,110 | ) |
Class R6 | | | (37,179,196 | ) | | | 46,374,190 | |
Net increase (decrease) in net assets resulting from share transactions | | | (323,955,515 | ) | | | (454,882,057 | ) |
Net increase (decrease) in net assets | | | 23,009,922 | | | | (1,306,350,586 | ) |
| | |
Net assets: | | | | | | | | |
Beginning of year | | | 2,440,080,335 | | | | 3,746,430,921 | |
End of year (includes undistributed net investment income of $22,958,558 and $26,487,068, respectively) | | $ | 2,463,090,257 | | | $ | 2,440,080,335 | |
Notes to Financial Statements
October 31, 2016
NOTE 1—Significant Accounting Policies
Invesco Developing Markets Fund (the “Fund”) is a series portfolio of AIM Investment Funds (Invesco Investment Funds) (the “Trust”). The Trust is organized as a Delaware statutory trust and is registered under the Investment Company Act of 1940, as amended (the “1940 Act”), as an open-end series management investment company consisting of twenty-two separate series portfolios, each authorized to issue an unlimited number of shares of beneficial interest. The assets, liabilities and operations of each portfolio are accounted for separately. Information presented in these financial statements pertains only to the Fund. Matters affecting each portfolio or class will be voted on exclusively by the shareholders of such portfolio or class.
The Fund’s investment objective is long-term growth of capital.
As of the open of business on February 26, 2016, the Fund has reopened public sales of its shares to all investors.
The Fund currently consists of six different classes of shares: Class A, Class B, Class C, Class Y, Class R5 and Class R6. Class Y shares are available only to certain investors. Class A shares are sold with a front-end sales charge unless certain waiver criteria are met and under certain circumstances load waived shares may be subject to contingent deferred sales charges (“CDSC”). Class C shares are sold with a CDSC. Class Y, Class R5 and Class R6 shares are sold at net asset value. Effective November 30, 2010, new or additional investments in Class B shares are no longer permitted. Existing shareholders of Class B shares may continue to reinvest dividends and capital gains distributions in Class B shares until they convert to Class A shares.
14 Invesco Developing Markets Fund
Also, shareholders in Class B shares will be able to exchange those shares for Class B shares of other Invesco Funds offering such shares until they convert to Class A shares. Generally, Class B shares will automatically convert to Class A shares on or about the month-end, which is at least eight years after the date of purchase. Redemption of Class B shares prior to the conversion date will be subject to a CDSC.
The following is a summary of the significant accounting policies followed by the Fund in the preparation of its financial statements.
| A. | Security Valuations — Securities, including restricted securities, are valued according to the following policy. |
A security listed or traded on an exchange (except convertible securities) is valued at its last sales price or official closing price as of the close of the customary trading session on the exchange where the security is principally traded, or lacking any sales or official closing price on a particular day, the security may be valued at the closing bid price on that day. Securities traded in the over-the-counter market are valued based on prices furnished by independent pricing services or market makers. When such securities are valued by an independent pricing service they may be considered fair valued. Futures contracts are valued at the final settlement price set by an exchange on which they are principally traded. Listed options are valued at the mean between the last bid and asked prices from the exchange on which they are principally traded. Options not listed on an exchange are valued by an independent source at the mean between the last bid and asked prices. For purposes of determining net asset value (“NAV”) per share, futures and option contracts generally are valued 15 minutes after the close of the customary trading session of the New York Stock Exchange (“NYSE”).
Investments in open-end and closed-end registered investment companies that do not trade on an exchange are valued at the end-of-day net asset value per share. Investments in open-end and closed-end registered investment companies that trade on an exchange are valued at the last sales price or official closing price as of the close of the customary trading session on the exchange where the security is principally traded.
Debt obligations (including convertible securities) and unlisted equities are fair valued using an evaluated quote provided by an independent pricing service. Evaluated quotes provided by the pricing service may be determined without exclusive reliance on quoted prices, and may reflect appropriate factors such as institution-size trading in similar groups of securities, developments related to specific securities, dividend rate (for unlisted equities), yield (for debt obligations), quality, type of issue, coupon rate (for debt obligations), maturity (for debt obligations), individual trading characteristics and other market data. Debt obligations are subject to interest rate and credit risks. In addition, all debt obligations involve some risk of default with respect to interest and/or principal payments.
Foreign securities’ (including foreign exchange contracts) prices are converted into U.S. dollar amounts using the applicable exchange rates as of the close of the NYSE. If market quotations are available and reliable for foreign exchange-traded equity securities, the securities will be valued at the market quotations. Because trading hours for certain foreign securities end before the close of the NYSE, closing market quotations may become unreliable. If between the time trading ends on a particular security and the close of the customary trading session on the NYSE, events occur that the Adviser determines are significant and make the closing price unreliable, the Fund may fair value the security. If the event is likely to have affected the closing price of the security, the security will be valued at fair value in good faith using procedures approved by the Board of Trustees. Adjustments to closing prices to reflect fair value may also be based on a screening process of an independent pricing service to indicate the degree of certainty, based on historical data, that the closing price in the principal market where a foreign security trades is not the current value as of the close of the NYSE. Foreign securities’ prices meeting the approved degree of certainty that the price is not reflective of current value will be priced at the indication of fair value from the independent pricing service. Multiple factors may be considered by the independent pricing service in determining adjustments to reflect fair value and may include information relating to sector indices, American Depositary Receipts and domestic and foreign index futures. Foreign securities may have additional risks including exchange rate changes, potential for sharply devalued currencies and high inflation, political and economic upheaval, the relative lack of issuer information, relatively low market liquidity and the potential lack of strict financial and accounting controls and standards.
Securities for which market prices are not provided by any of the above methods may be valued based upon quotes furnished by independent sources. The last bid price may be used to value equity securities. The mean between the last bid and asked prices is used to value debt obligations, including corporate loans.
Securities for which market quotations are not readily available or became unreliable are valued at fair value as determined in good faith by or under the supervision of the Trust’s officers following procedures approved by the Board of Trustees. Issuer specific events, market trends, bid/asked quotes of brokers and information providers and other market data may be reviewed in the course of making a good faith determination of a security’s fair value.
The Fund may invest in securities that are subject to interest rate risk, meaning the risk that the prices will generally fall as interest rates rise and, conversely, the prices will generally rise as interest rates fall. Specific securities differ in their sensitivity to changes in interest rates depending on their individual characteristics. Changes in interest rates may result in increased market volatility, which may affect the value and/or liquidity of certain Fund investments.
Valuations change in response to many factors including the historical and prospective earnings of the issuer, the value of the issuer’s assets, general economic conditions, interest rates, investor perceptions and market liquidity. Because of the inherent uncertainties of valuation, the values reflected in the financial statements may materially differ from the value received upon actual sale of those investments.
| B. | Securities Transactions and Investment Income — Securities transactions are accounted for on a trade date basis. Realized gains or losses on sales are computed on the basis of specific identification of the securities sold. Interest income (net of withholding tax, if any) is recorded on the accrual basis from settlement date. Dividend income (net of withholding tax, if any) is recorded on the ex-dividend date. |
The Fund may periodically participate in litigation related to Fund investments. As such, the Fund may receive proceeds from litigation settlements. Any proceeds received are included in the Statement of Operations as realized gain (loss) for investments no longer held and as unrealized gain (loss) for investments still held.
Brokerage commissions and mark ups are considered transaction costs and are recorded as an increase to the cost basis of securities purchased and/or a reduction of proceeds on a sale of securities. Such transaction costs are included in the determination of net realized and unrealized gain (loss) from investment securities reported in the Statement of Operations and the Statement of Changes in Net Assets and the net realized and unrealized gains (losses) on securities per share in the Financial Highlights. Transaction costs are included in the calculation of the Fund’s net asset value and, accordingly, they reduce the Fund’s total returns. These transaction costs are not considered operating expenses and are not reflected in net investment income reported in the Statement of Operations and the Statement of Changes in Net Assets, or the net investment income per share and the ratios of expenses and net investment income reported in the Financial Highlights, nor are they limited by any expense limitation arrangements between the Fund and the investment adviser.
15 Invesco Developing Markets Fund
The Fund allocates income and realized and unrealized capital gains and losses to a class based on the relative net assets of each class.
| C. | Country Determination — For the purposes of making investment selection decisions and presentation in the Schedule of Investments, the investment adviser may determine the country in which an issuer is located and/or credit risk exposure based on various factors. These factors include the laws of the country under which the issuer is organized, where the issuer maintains a principal office, the country in which the issuer derives 50% or more of its total revenues and the country that has the primary market for the issuer’s securities, as well as other criteria. Among the other criteria that may be evaluated for making this determination are the country in which the issuer maintains 50% or more of its assets, the type of security, financial guarantees and enhancements, the nature of the collateral and the sponsor organization. Country of issuer and/or credit risk exposure has been determined to be the United States of America, unless otherwise noted. |
| D. | Distributions — Distributions from net investment income and net realized capital gain, if any, are generally declared and paid annually and recorded on the ex-dividend date. The Fund may elect to treat a portion of the proceeds from redemptions as distributions for federal income tax purposes. |
| E. | Federal Income Taxes — The Fund intends to comply with the requirements of Subchapter M of the Internal Revenue Code of 1986, as amended (the “Internal Revenue Code”), necessary to qualify as a regulated investment company and to distribute substantially all of the Fund’s taxable earnings to shareholders. As such, the Fund will not be subject to federal income taxes on otherwise taxable income (including net realized capital gain) that is distributed to shareholders. Therefore, no provision for federal income taxes is recorded in the financial statements. |
The Fund recognizes the tax benefits of uncertain tax positions only when the position is more likely than not to be sustained. Management has analyzed the Fund’s uncertain tax positions and concluded that no liability for unrecognized tax benefits should be recorded related to uncertain tax positions. Management is not aware of any tax positions for which it is reasonably possible that the total amounts of unrecognized tax benefits will change materially in the next 12 months.
The Fund files tax returns in the U.S. Federal jurisdiction and certain other jurisdictions. Generally, the Fund is subject to examinations by such taxing authorities for up to three years after the filing of the return for the tax period.
| F. | Expenses — Fees provided for under the Rule 12b-1 plan of a particular class of the Fund are charged to the operations of such class. Transfer agency fees and expenses and other shareholder recordkeeping fees and expenses attributable to Class R5 and Class R6 are allocated to each share class based on relative net assets. Sub-accounting fees attributable to Class R5 are charged to the operations of the class. Transfer agency fees and expenses and other shareholder recordkeeping fees and expenses relating to all other classes are allocated among those classes based on relative net assets. All other expenses are allocated among the classes based on relative net assets. |
| G. | Accounting Estimates — The preparation of financial statements in conformity with accounting principles generally accepted in the United States of America (“GAAP”) requires management to make estimates and assumptions that affect the reported amounts of assets and liabilities at the date of the financial statements and the reported amounts of revenues and expenses during the reporting period including estimates and assumptions related to taxation. Actual results could differ from those estimates by a significant amount. In addition, the Fund monitors for material events or transactions that may occur or become known after the period-end date and before the date the financial statements are released to print. |
| H. | Indemnifications — Under the Trust’s organizational documents, each Trustee, officer, employee or other agent of the Trust is indemnified against certain liabilities that may arise out of the performance of their duties to the Fund. Additionally, in the normal course of business, the Fund enters into contracts, including the Fund’s servicing agreements, that contain a variety of indemnification clauses. The Fund’s maximum exposure under these arrangements is unknown as this would involve future claims that may be made against the Fund that have not yet occurred. The risk of material loss as a result of such indemnification claims is considered remote. |
| I. | Foreign Currency Translations — Foreign currency is valued at the close of the NYSE based on quotations posted by banks and major currency dealers. Portfolio securities and other assets and liabilities denominated in foreign currencies are translated into U.S. dollar amounts at date of valuation. Purchases and sales of portfolio securities (net of foreign taxes withheld on disposition) and income items denominated in foreign currencies are translated into U.S. dollar amounts on the respective dates of such transactions. The Fund does not separately account for the portion of the results of operations resulting from changes in foreign exchange rates on investments and the fluctuations arising from changes in market prices of securities held. The combined results of changes in foreign exchange rates and the fluctuation of market prices on investments (net of estimated foreign tax withholding) are included with the net realized and unrealized gain or loss from investments in the Statement of Operations. Reported net realized foreign currency gains or losses arise from (1) sales of foreign currencies, (2) currency gains or losses realized between the trade and settlement dates on securities transactions, and (3) the difference between the amounts of dividends, interest, and foreign withholding taxes recorded on the Fund’s books and the U.S. dollar equivalent of the amounts actually received or paid. Net unrealized foreign currency gains and losses arise from changes in the fair values of assets and liabilities, other than investments in securities at fiscal period end, resulting from changes in exchange rates. |
The Fund may invest in foreign securities, which may be subject to foreign taxes on income, gains on investments or currency repatriation, a portion of which may be recoverable. Foreign taxes, if any, are recorded based on the tax regulations and rates that exist in the foreign markets in which the Fund invests and are shown in the Statement of Operations.
| J. | Forward Foreign Currency Contracts — The Fund may engage in foreign currency transactions either on a spot (i.e. for prompt delivery and settlement) basis, or through forward foreign currency contracts, to manage or minimize currency or exchange rate risk. |
The Fund may also enter into forward foreign currency contracts for the purchase or sale of a security denominated in a foreign currency in order to “lock in” the U.S. dollar price of that security, or the Fund may also enter into forward foreign currency contracts that do not provide for physical settlement of the two currencies, but instead are settled by a single cash payment calculated as the difference between the agreed upon exchange rate and the spot rate at settlement based upon an agreed upon notional amount (non-deliverable forwards). The Fund will set aside liquid assets in an amount equal to the daily mark-to-market obligation for forward foreign currency contracts.
A forward foreign currency contract is an obligation between two parties (“Counterparties”) to purchase or sell a specific currency for an agreed-upon price at a future date. The use of forward foreign currency contracts does not eliminate fluctuations in the price of the underlying securities the Fund owns or intends to acquire but establishes a rate of exchange in advance. Fluctuations in the value of these contracts are measured by the difference in the contract date and reporting date exchange rates and are recorded as unrealized appreciation (depreciation) until the contracts are closed. When the contracts are closed, realized gains (losses) are recorded. Realized and unrealized gains (losses) on the
16 Invesco Developing Markets Fund
contracts are included in the Statement of Operations. The primary risks associated with forward foreign currency contracts include failure of the Counterparty to meet the terms of the contract and the value of the foreign currency changing unfavorably. These risks may be in excess of the amounts reflected in the Statement of Assets and Liabilities.
NOTE 2—Advisory Fees and Other Fees Paid to Affiliates
The Trust has entered into a master investment advisory agreement with Invesco Advisers, Inc. (the “Adviser” or “Invesco”). Under the terms of the investment advisory agreement, the Fund pays an advisory fee to the Adviser based on the annual rate of the Fund’s average daily net assets as follows:
| | | | | | | | |
| Average Daily Net Assets | | Rate | |
First $250 million | | | 0 | .935% | | | | |
Next $250 million | | | 0 | .91% | | | | |
Next $500 million | | | 0 | .885% | | | | |
Next $1.5 billion | | | 0 | .86% | | | | |
Next $2.5 billion | | | 0 | .835% | | | | |
Next $2.5 billion | | | 0 | .81% | | | | |
Next $2.5 billion | | | 0 | .785% | | | | |
Over $10 billion | | | 0 | .76% | | | | |
For the year ended October 31, 2016, the effective advisory fees incurred by the Fund was 0.88%.
Under the terms of a master sub-advisory agreement between the Adviser and each of Invesco Asset Management Deutschland GmbH, Invesco Asset Management Limited, Invesco Asset Management (Japan) Limited, Invesco Hong Kong Limited, Invesco Senior Secured Management, Inc. and Invesco Canada Ltd. (collectively, the “Affiliated Sub-Advisers”) the Adviser, not the Fund, will pay 40% of the fees paid to the Adviser to any such Affiliated Sub-Adviser(s) that provide(s) discretionary investment management services to the Fund based on the percentage of assets allocated to such Affiliated Sub-Adviser(s).
The Adviser has contractually agreed, through at least June 30, 2017, to waive advisory fees and/or reimburse expenses to the extent necessary to limit total annual fund operating expenses after fee waivers and/or reimbursements (excluding certain items discussed below) of Class A, Class B, Class C, Class Y, Class R5 and Class R6 shares to 2.25%, 3.00%, 3.00%, 2.00%, 2.00% and 2.00%, respectively, of the Fund’s average daily net assets (the “expense limits”). In determining the Adviser’s obligation to waive advisory fees and/or reimburse expenses, the following expenses are not taken into account, and could cause the total annual fund operating expenses after fee waiver and/or expense reimbursement to exceed the numbers reflected above: (1) interest; (2) taxes; (3) dividend expense on short sales; (4) extraordinary or non-routine items, including litigation expenses; and (5) expenses that the Fund has incurred but did not actually pay because of an expense offset arrangement. Unless Invesco continues the fee waiver agreement, it will terminate on June 30, 2017. During its term, the fee waiver agreement cannot be terminated or amended to increase the expense limits without approval of the Board of Trustees. The Adviser did not waive fees and/or reimburse expenses during the period under these expense limits.
Further, the Adviser has contractually agreed, through at least June 30, 2018, to waive the advisory fee payable by the Fund in an amount equal to 100% of the net advisory fees the Adviser receives from the affiliated money market funds on investments by the Fund of uninvested cash in such affiliated money market funds.
For the year ended October 31, 2016, the Adviser waived advisory fees of $291,636.
The Trust has entered into a master administrative services agreement with Invesco pursuant to which the Fund has agreed to pay Invesco for certain administrative costs incurred in providing accounting services to the Fund. For the year ended October 31, 2016, expenses incurred under the agreement are shown in the Statement of Operations as Administrative services fees.
The Trust has entered into a transfer agency and service agreement with Invesco Investment Services, Inc. (“IIS”) pursuant to which the Fund has agreed to pay IIS a fee for providing transfer agency and shareholder services to the Fund and reimburse IIS for certain expenses incurred by IIS in the course of providing such services. IIS may make payments to intermediaries that provide omnibus account services, sub-accounting services and/or networking services. All fees payable by IIS to intermediaries that provide omnibus account services or sub-accounting are charged back to the Fund, subject to certain limitations approved by the Trust’s Board of Trustees. For the year ended October 31, 2016, expenses incurred under the agreement are shown in the Statement of Operations as Transfer agent fees.
The Trust has entered into master distribution agreements with Invesco Distributors, Inc. (“IDI”) to serve as the distributor for the Class A, Class B, Class C, Class Y, Class R5 and Class R6 shares of the Fund. The Trust has adopted plans pursuant to Rule 12b-1 under the 1940 Act with respect to the Fund’s Class A, Class B and Class C shares (collectively, the “Plans”). The Fund, pursuant to the Plans, pays IDI compensation at the annual rate of 0.25% of the Fund’s average daily net assets of Class A shares and 1.00% of the average daily net assets of Class B and Class C shares. Of the Plan payments, up to 0.25% of the average daily net assets of each class of shares may be paid to furnish continuing personal shareholder services to customers who purchase and own shares of such classes. Any amounts not paid as a service fee under the Plans would constitute an asset-based sales charge. Rules of the Financial Industry Regulatory Authority (“FINRA”) impose a cap on the total sales charges, including asset-based sales charges, that may be paid by any class of shares of the Fund. For the year ended October 31, 2016, expenses incurred under the Plans are shown in the Statement of Operations as Distribution fees.
Front-end sales commissions and CDSC (collectively, the “sales charges”) are not recorded as expenses of the Fund. Front-end sales commissions are deducted from proceeds from the sales of Fund shares prior to investment in Class A shares of the Fund. CDSC are deducted from redemption proceeds prior to remittance to the shareholder. During the year ended October 31, 2016, IDI advised the Fund that IDI retained $111,793 in front-end sales commissions from the sale of Class A shares and $2,346, $3,574 and $2,512 from Class A, Class B and Class C shares, respectively, for CDSC imposed on redemptions by shareholders.
Certain officers and trustees of the Trust are officers and directors of the Adviser, IIS and/or IDI.
17 Invesco Developing Markets Fund
NOTE 3—Additional Valuation Information
GAAP defines fair value as the price that would be received to sell an asset or paid to transfer a liability in an orderly transaction between market participants at the measurement date, under current market conditions. GAAP establishes a hierarchy that prioritizes the inputs to valuation methods, giving the highest priority to readily available unadjusted quoted prices in an active market for identical assets (Level 1) and the lowest priority to significant unobservable inputs (Level 3), generally when market prices are not readily available or are unreliable. Based on the valuation inputs, the securities or other investments are tiered into one of three levels. Changes in valuation methods may result in transfers in or out of an investment’s assigned level:
| | Level 1 — | Prices are determined using quoted prices in an active market for identical assets. |
| | Level 2 — | Prices are determined using other significant observable inputs. Observable inputs are inputs that other market participants may use in pricing a security. These may include quoted prices for similar securities, interest rates, prepayment speeds, credit risk, yield curves, loss severities, default rates, discount rates, volatilities and others. |
| | Level 3 — | Prices are determined using significant unobservable inputs. In situations where quoted prices or observable inputs are unavailable (for example, when there is little or no market activity for an investment at the end of the period), unobservable inputs may be used. Unobservable inputs reflect the Fund’s own assumptions about the factors market participants would use in determining fair value of the securities or instruments and would be based on the best available information. |
The following is a summary of the tiered valuation input levels, as of October 31, 2016. The level assigned to the securities valuations may not be an indication of the risk or liquidity associated with investing in those securities. Because of the inherent uncertainties of valuation, the values reflected in the financial statements may materially differ from the value received upon actual sale of those investments.
During the year ended October 31, 2016, there were transfers from Level 1 to Level 2 of $131,131,712 and from Level 2 to Level 1 of $457,243,511, due to foreign fair value adjustments.
| | | | | | | | | | | | | | | | |
| | | Level 1 | | | Level 2 | | | Level 3 | | | Total | |
Brazil | | $ | 469,587,430 | | | $ | — | | | $ | — | | | $ | 469,587,430 | |
China | | | 224,841,135 | | | | 99,324,683 | | | | — | | | | 324,165,818 | |
Egypt | | | 10,910,414 | | | | — | | | | — | | | | 10,910,414 | |
France | | | 17,903,115 | | | | — | | | | — | | | | 17,903,115 | |
Hong Kong | | | 107,798,504 | | | | — | | | | — | | | | 107,798,504 | |
Hungary | | | 66,718,120 | | | | — | | | | — | | | | 66,718,120 | |
Indonesia | | | — | | | | 161,727,504 | | | | — | | | | 161,727,504 | |
Israel | | | 46,188,858 | | | | — | | | | — | | | | 46,188,858 | |
Malaysia | | | 53,075,844 | | | | — | | | | — | | | | 53,075,844 | |
Mexico | | | 121,779,615 | | | | — | | | | — | | | | 121,779,615 | |
Nigeria | | | 20,814,471 | | | | — | | | | — | | | | 20,814,471 | |
Peru | | | 32,554,973 | | | | — | | | | — | | | | 32,554,973 | |
Philippines | | | 64,090,762 | | | | — | | | | — | | | | 64,090,762 | |
Russia | | | 58,897,530 | | | | 139,195,891 | | | | — | | | | 198,093,421 | |
South Korea | | | 18,587,221 | | | | 20,215,576 | | | | — | | | | 38,802,797 | |
Taiwan | | | 86,947,619 | | | | — | | | | — | | | | 86,947,619 | |
Thailand | | | — | | | | 82,687,054 | | | | — | | | | 82,687,054 | |
Turkey | | | 19,446,178 | | | | 102,857,981 | | | | — | | | | 122,304,159 | |
Money Market Funds | | | 426,507,420 | | | | — | | | | — | | | | 426,507,420 | |
Total Investments | | $ | 1,846,649,209 | | | $ | 606,008,689 | | | $ | — | | | $ | 2,452,657,898 | |
NOTE 4—Expense Offset Arrangement(s)
The expense offset arrangement is comprised of transfer agency credits which result from balances in demand deposit accounts used by the transfer agent for clearing shareholder transactions. For the year ended October 31, 2016, the Fund received credits from this arrangement, which resulted in the reduction of the Fund’s total expenses of $7,966.
NOTE 5—Trustees’ and Officers’ Fees and Benefits
Trustees’ and Officers’ Fees and Benefits include amounts accrued by the Fund to pay remuneration to certain Trustees and Officers of the Fund. Trustees have the option to defer compensation payable by the Fund, and Trustees’ and Officers’ Fees and Benefits also include amounts accrued by the Fund to fund such deferred compensation amounts. Those Trustees who defer compensation have the option to select various Invesco Funds in which their deferral accounts shall be deemed to be invested. Finally, certain current Trustees were eligible to participate in a retirement plan that provided for benefits to be paid upon retirement to Trustees over a period of time based on the number of years of service. The Fund may have certain former Trustees who also participate in a retirement plan and receive benefits under such plan. Trustees’ and Officers’ Fees and Benefits include amounts accrued by the Fund to fund such retirement benefits. Obligations under the deferred compensation and retirement plans represent unsecured claims against the general assets of the Fund.
18 Invesco Developing Markets Fund
NOTE 6—Cash Balances
The Fund is permitted to temporarily carry a negative or overdrawn balance in its account with State Street Bank and Trust Company, the custodian bank. Such balances, if any at period-end, are shown in the Statement of Assets and Liabilities under the payable caption Amount due custodian. To compensate the custodian bank for such overdrafts, the overdrawn Fund may either (1) leave funds as a compensating balance in the account so the custodian bank can be compensated by earning the additional interest; or (2) compensate by paying the custodian bank at a rate agreed upon by the custodian bank and Invesco, not to exceed the contractually agreed upon rate.
NOTE 7—Distributions to Shareholders and Tax Components of Net Assets
Tax Character of Distributions to Shareholders Paid During the Fiscal Years Ended October 31, 2016 and 2015:
| | | | | | | | |
| | | 2016 | | | 2015 | |
Ordinary income | | $ | 27,005,560 | | | $ | 44,260,569 | |
Long-term capital gain | | | — | | | | 62,165,266 | |
Total distributions | | $ | 27,005,560 | | | $ | 106,425,835 | |
Tax Components of Net Assets at Period-End:
| | | | |
| | | 2016 | |
Undistributed ordinary income | | $ | 23,853,646 | |
Net unrealized appreciation — investments | | | 228,932,422 | |
Net unrealized appreciation (depreciation) — other investments | | | (323,981 | ) |
Temporary book/tax differences | | | (380,793 | ) |
Capital loss carryforward | | | (267,992,812 | ) |
Shares of beneficial interest | | | 2,479,001,775 | |
Total net assets | | $ | 2,463,090,257 | |
The difference between book-basis and tax-basis unrealized appreciation (depreciation) is due to differences in the timing of recognition of gains and losses on investments for tax and book purposes. The Fund’s net unrealized appreciation difference is attributable primarily to wash sales and passive foreign investment companies.
The temporary book/tax differences are a result of timing differences between book and tax recognition of income and/or expenses. The Fund’s temporary book/tax differences are the result of the trustee deferral of compensation and retirement plan benefits.
Capital loss carryforward is calculated and reported as of a specific date. Results of transactions and other activity after that date may affect the amount of capital loss carryforward actually available for the Fund to utilize. Capital losses generated in years beginning after December 22, 2010 can be carried forward for an unlimited period, whereas previous losses expire in eight tax years. Capital losses with an expiration period may not be used to offset capital gains until all net capital losses without an expiration date have been utilized. Capital loss carryforwards with no expiration date will retain their character as either short-term or long-term capital losses instead of as short-term capital losses as under prior law. The ability to utilize capital loss carryforwards in the future may be limited under the Internal Revenue Code and related regulations based on the results of future transactions.
The Fund has a capital loss carryforward as of October 31, 2016, which expires as follows:
| | | | | | | | | | | | |
| Capital Loss Carryforward* | |
| Expiration | | Short-Term | | | Long-Term | | | Total | |
October 31, 2017 | | $ | 47,338,828 | | | $ | — | | | $ | 47,338,828 | |
Not subject to expiration | | | 11,714,863 | | | | 208,939,121 | | | | 220,653,984 | |
| | | $ | 59,053,691 | | | $ | 208,939,121 | | | $ | 267,992,812 | |
| * | Capital loss carryforward as of the date listed above is reduced for limitations, if any, to the extent required by the Internal Revenue Code and may be further limited depending upon a variety of factors, including the realization of net unrealized gains or losses as of the date of any reorganization. |
19 Invesco Developing Markets Fund
NOTE 8—Investment Securities
The aggregate amount of investment securities (other than short-term securities, U.S. Treasury obligations and money market funds, if any) purchased and sold by the Fund during the year ended October 31, 2016 was $61,477,640 and $697,722,622, respectively. Cost of investments on a tax basis includes the adjustments for financial reporting purposes as of the most recently completed federal income tax reporting period-end.
| | | | |
| Unrealized Appreciation (Depreciation) of Investment Securities on a Tax Basis | |
Aggregate unrealized appreciation of investment securities | | $ | 492,440,504 | |
Aggregate unrealized (depreciation) of investment securities | | | (263,508,082 | ) |
Net unrealized appreciation of investment securities | | $ | 228,932,422 | |
Cost of investments for tax purposes is $2,223,725,476.
NOTE 9—Reclassification of Permanent Differences
Primarily as a result of differing book/tax treatment of expired capital loss carryforward, foreign currency transactions and foreign capital gain taxes, on October 31, 2016, undistributed net investment income was decreased by $2,241,046, undistributed net realized gain (loss) was increased by $24,062,513 and shares of beneficial interest was decreased by $21,821,467. This reclassification had no effect on the net assets of the Fund.
NOTE 10—Share Information
| | | | | | | | | | | | | | | | |
| | | Summary of Share Activity | |
| | | Years ended October 31, | |
| | | 2016(a) | | | 2015 | |
| | | Shares | | | Amount | | | Shares | | | Amount | |
Sold: | | | | | | | | | | | | | | | | |
Class A | | | 6,223,706 | | | $ | 172,445,345 | | | | 5,164,688 | | | $ | 150,282,799 | |
Class B | | | 3,413 | | | | 93,276 | | | | 5,133 | | | | 146,970 | |
Class C | | | 434,158 | | | | 12,231,991 | | | | 125,838 | | | | 3,571,339 | |
Class Y | | | 16,687,212 | | | | 462,805,113 | | | | 22,922,032 | | | | 689,193,614 | |
Class R5 | | | 2,612,537 | | | | 71,219,411 | | | | 4,254,113 | | | | 125,236,418 | |
Class R6 | | | 4,221,542 | | | | 115,075,056 | | | | 2,249,248 | | | | 63,230,870 | |
| | | | |
Issued as reinvestment of dividends: | | | | | | | | | | | | | | | | |
Class A | | | 263,221 | | | | 6,388,370 | | | | 895,102 | | | | 26,763,551 | |
Class B | | | — | | | | — | | | | 15,823 | | | | 462,034 | |
Class C | | | — | | | | — | | | | 78,547 | | | | 2,290,442 | |
Class Y | | | 256,399 | | | | 6,222,812 | | | | 935,688 | | | | 28,005,135 | |
Class R5 | | | 176,828 | | | | 4,281,012 | | | | 510,501 | | | | 15,243,554 | |
Class R6 | | | 108,882 | | | | 2,633,867 | | | | 189,444 | | | | 5,654,891 | |
| | | | |
Automatic conversion of Class B shares to Class A shares: | | | | | | | | | | | | | | | | |
Class A | | | 121,188 | | | | 3,279,616 | | | | 209,759 | | | | 6,203,277 | |
Class B | | | (124,281 | ) | | | (3,279,616 | ) | | | (215,577 | ) | | | (6,203,277 | ) |
| | | | |
Reacquired: | | | | | | | | | | | | | | | | |
Class A | | | (10,482,846 | ) | | | (281,898,181 | ) | | | (12,551,420 | ) | | | (375,132,199 | ) |
Class B | | | (89,538 | ) | | | (2,308,324 | ) | | | (163,634 | ) | | | (4,634,852 | ) |
Class C | | | (955,039 | ) | | | (24,839,611 | ) | | | (1,131,871 | ) | | | (31,939,910 | ) |
Class Y | | | (21,827,088 | ) | | | (568,191,849 | ) | | | (27,825,234 | ) | | | (790,193,060 | ) |
Class R5 | | | (5,620,816 | ) | | | (145,225,684 | ) | | | (11,400,501 | ) | | | (340,552,082 | ) |
Class R6 | | | (6,069,981 | ) | | | (154,888,119 | ) | | | (757,305 | ) | | | (22,511,571 | ) |
Net increase (decrease) in share activity | | | (14,060,503 | ) | | $ | (323,955,515 | ) | | | (16,489,626 | ) | | $ | (454,882,057 | ) |
| (a) | There are entities that are record owners of more than 5% of the outstanding shares of the Fund and in the aggregate own 40% of the outstanding shares of the Fund. IDI has an agreement with these entities to sell Fund shares. The Fund, Invesco and/or Invesco affiliates may make payments to these entities, which are considered to be related to the Fund, for providing services to the Fund, Invesco and/or Invesco affiliates including but not limited to services such as securities brokerage, distribution, third party record keeping and account servicing. The Fund has no knowledge as to whether all or any portion of the shares owned of record by these entities are also owned beneficially. |
20 Invesco Developing Markets Fund
NOTE 11—Financial Highlights
The following schedule presents financial highlights for a share of the Fund outstanding throughout the periods indicated.
| | | | | | | | | | | | | | | | | | | | | | | | | | | | | | | | | | | | | | | | | | | | | | | | | | | | | | | | |
| | | Net asset
value,
beginning
of period | | | Net
investment
income(a) | | | Net gains
(losses)
on securities
(both
realized and
unrealized) | | | Total from
investment
operations | | | Dividends
from net
investment
income | | | Distributions
from net
realized
gains | | | Total
distributions | | | Net asset
value, end
of period(b) | | | Total
return(c) | | | Net assets,
end of period
(000’s omitted) | | | Ratio of
expenses
to average
net assets
with fee waivers
and/or expenses
absorbed | | | Ratio of
expenses
to average net
assets without
fee waivers
and/or expenses
absorbed | | | Ratio of net
investment
income
to average
net assets | | | Portfolio
turnover(d) | |
Class A | |
Year ended 10/31/16 | | $ | 25.84 | | | $ | 0.27 | | | $ | 4.80 | | | $ | 5.07 | | | $ | (0.24 | ) | | $ | — | | | $ | (0.24 | ) | | $ | 30.67 | | | | 19.88 | % | | $ | 824,702 | | | | 1.40 | %(e) | | | 1.41 | %(e) | | | 1.01 | %(e) | | | 3 | % |
Year ended 10/31/15 | | | 33.77 | | | | 0.28 | | | | (7.32 | ) | | | (7.04 | ) | | | (0.33 | ) | | | (0.56 | ) | | | (0.89 | ) | | | 25.84 | | | | (21.20 | ) | | | 795,042 | | | | 1.43 | | | | 1.44 | | | | 0.96 | | | | 9 | |
Year ended 10/31/14 | | | 34.42 | | | | 0.38 | | | | (0.65 | ) | | | (0.27 | ) | | | (0.28 | ) | | | (0.10 | ) | | | (0.38 | ) | | | 33.77 | | | | (0.73 | ) | | | 1,251,018 | | | | 1.39 | | | | 1.41 | | | | 1.13 | | | | 13 | |
Year ended 10/31/13 | | | 32.70 | | | | 0.30 | | | | 1.66 | | | | 1.96 | | | | (0.24 | ) | | | — | | | | (0.24 | ) | | | 34.42 | | | | 6.03 | | | | 1,494,412 | | | | 1.38 | | | | 1.40 | | | | 0.89 | | | | 14 | |
Year ended 10/31/12 | | | 30.38 | | | | 0.29 | | | | 2.86 | | | | 3.15 | | | | (0.23 | ) | | | (0.60 | ) | | | (0.83 | ) | | | 32.70 | | | | 10.72 | | | | 1,371,476 | | | | 1.44 | | | | 1.45 | | | | 0.93 | | | | 19 | |
Class B | | | | | | | | | | | | | | | | | | | | | | | | | | | | | | | | | | | | | | | | | | | | | | | | | | | | | | | | |
Year ended 10/31/16 | | | 25.06 | | | | 0.07 | | | | 4.69 | | | | 4.76 | | | | — | | | | — | | | | — | | | | 29.82 | | | | 18.99 | | | | 8,848 | | | | 2.15 | (e) | | | 2.16 | (e) | | | 0.26 | (e) | | | 3 | |
Year ended 10/31/15 | | | 32.72 | | | | 0.06 | | | | (7.11 | ) | | | (7.05 | ) | | | (0.05 | ) | | | (0.56 | ) | | | (0.61 | ) | | | 25.06 | | | | (21.80 | ) | | | 12,710 | | | | 2.18 | | | | 2.19 | | | | 0.21 | | | | 9 | |
Year ended 10/31/14 | | | 33.31 | | | | 0.12 | | | | (0.61 | ) | | | (0.49 | ) | | | (0.00 | ) | | | (0.10 | ) | | | (0.10 | ) | | | 32.72 | | | | (1.46 | ) | | | 28,314 | | | | 2.14 | | | | 2.16 | | | | 0.38 | | | | 13 | |
Year ended 10/31/13 | | | 31.66 | | | | 0.04 | | | | 1.61 | | | | 1.65 | | | | — | | | | — | | | | — | | | | 33.31 | | | | 5.21 | | | | 44,403 | | | | 2.13 | | | | 2.15 | | | | 0.14 | | | | 14 | |
Year ended 10/31/12 | | | 29.42 | | | | 0.06 | | | | 2.78 | | | | 2.84 | | | | — | | | | (0.60 | ) | | | (0.60 | ) | | | 31.66 | | | | 9.89 | | | | 59,539 | | | | 2.19 | | | | 2.20 | | | | 0.18 | | | | 19 | |
Class C | | | | | | | | | | | | | | | | | | | | | | | | | | | | | | | | | | | | | | | | | | | | | | | | | | | | | | | | |
Year ended 10/31/16 | | | 25.03 | | | | 0.07 | | | | 4.68 | | | | 4.75 | | | | — | | | | — | | | | — | | | | 29.78 | | | | 18.98 | | | | 82,513 | | | | 2.15 | (e) | | | 2.16 | (e) | | | 0.26 | (e) | | | 3 | |
Year ended 10/31/15 | | | 32.68 | | | | 0.06 | | | | (7.10 | ) | | | (7.04 | ) | | | (0.05 | ) | | | (0.56 | ) | | | (0.61 | ) | | | 25.03 | | | | (21.80 | ) | | | 82,395 | | | | 2.18 | | | | 2.19 | | | | 0.21 | | | | 9 | |
Year ended 10/31/14 | | | 33.27 | | | | 0.12 | | | | (0.61 | ) | | | (0.49 | ) | | | (0.00 | ) | | | (0.10 | ) | | | (0.10 | ) | | | 32.68 | | | | (1.47 | ) | | | 137,867 | | | | 2.14 | | | | 2.16 | | | | 0.38 | | | | 13 | |
Year ended 10/31/13 | | | 31.62 | | | | 0.04 | | | | 1.61 | | | | 1.65 | | | | — | | | | — | | | | — | | | | 33.27 | | | | 5.22 | | | | 168,313 | | | | 2.13 | | | | 2.15 | | | | 0.14 | | | | 14 | |
Year ended 10/31/12 | | | 29.38 | | | | 0.06 | | | | 2.78 | | | | 2.84 | | | | — | | | | (0.60 | ) | | | (0.60 | ) | | | 31.62 | | | | 9.90 | | | | 189,142 | | | | 2.19 | | | | 2.20 | | | | 0.18 | | | | 19 | |
Class Y | | | | | | | | | | | | | | | | | | | | | | | | | | | | | | | | | | | | | | | | | | | | | | | | | | | | | | | | |
Year ended 10/31/16 | | | 25.92 | | | | 0.35 | | | | 4.79 | | | | 5.14 | | | | (0.32 | ) | | | — | | | | (0.32 | ) | | | 30.74 | | | | 20.18 | | | | 1,055,132 | | | | 1.15 | (e) | | | 1.16 | (e) | | | 1.26 | (e) | | | 3 | |
Year ended 10/31/15 | | | 33.90 | | | | 0.36 | | | | (7.35 | ) | | | (6.99 | ) | | | (0.43 | ) | | | (0.56 | ) | | | (0.99 | ) | | | 25.92 | | | | (21.00 | ) | | | 1,016,382 | | | | 1.18 | | | | 1.19 | | | | 1.21 | | | | 9 | |
Year ended 10/31/14 | | | 34.55 | | | | 0.46 | | | | (0.64 | ) | | | (0.18 | ) | | | (0.37 | ) | | | (0.10 | ) | | | (0.47 | ) | | | 33.90 | | | | (0.47 | ) | | | 1,463,586 | | | | 1.14 | | | | 1.16 | | | | 1.38 | | | | 13 | |
Year ended 10/31/13 | | | 32.83 | | | | 0.38 | | | | 1.66 | | | | 2.04 | | | | (0.32 | ) | | | — | | | | (0.32 | ) | | | 34.55 | | | | 6.27 | | | | 1,175,003 | | | | 1.13 | | | | 1.15 | | | | 1.14 | | | | 14 | |
Year ended 10/31/12 | | | 30.50 | | | | 0.37 | | | | 2.87 | | | | 3.24 | | | | (0.31 | ) | | | (0.60 | ) | | | (0.91 | ) | | | 32.83 | | | | 11.01 | | | | 729,007 | | | | 1.19 | | | | 1.20 | | | | 1.18 | | | | 19 | |
Class R5 | | | | | | | | | | | | | | | | | | | | | | | | | | | | | | | | | | | | | | | | | | | | | | | | | | | | | | | | |
Year ended 10/31/16 | | | 25.90 | | | | 0.38 | | | | 4.79 | | | | 5.17 | | | | (0.38 | ) | | | — | | | | (0.38 | ) | | | 30.69 | | | | 20.33 | | | | 331,079 | | | | 1.03 | (e) | | | 1.04 | (e) | | | 1.38 | (e) | | | 3 | |
Year ended 10/31/15 | | | 33.87 | | | | 0.40 | | | | (7.33 | ) | | | (6.93 | ) | | | (0.48 | ) | | | (0.56 | ) | | | (1.04 | ) | | | 25.90 | | | | (20.87 | ) | | | 352,779 | | | | 1.03 | | | | 1.04 | | | | 1.36 | | | | 9 | |
Year ended 10/31/14 | | | 34.52 | | | | 0.51 | | | | (0.66 | ) | | | (0.15 | ) | | | (0.40 | ) | | | (0.10 | ) | | | (0.50 | ) | | | 33.87 | | | | (0.35 | ) | | | 686,180 | | | | 0.99 | | | | 1.01 | | | | 1.53 | | | | 13 | |
Year ended 10/31/13 | | | 32.80 | | | | 0.42 | | | | 1.67 | | | | 2.09 | | | | (0.37 | ) | | | — | | | | (0.37 | ) | | | 34.52 | | | | 6.43 | | | | 666,769 | | | | 1.01 | | | | 1.03 | | | | 1.26 | | | | 14 | |
Year ended 10/31/12 | | | 30.48 | | | | 0.42 | | | | 2.86 | | | | 3.28 | | | | (0.36 | ) | | | (0.60 | ) | | | (0.96 | ) | | | 32.80 | | | | 11.19 | | | | 513,884 | | | | 1.03 | | | | 1.04 | | | | 1.34 | | | | 19 | |
Class R6 | | | | | | | | | | | | | | | | | | | | | | | | | | | | | | | | | | | | | | | | | | | | | | | | | | | | | | | | |
Year ended 10/31/16 | | | 25.90 | | | | 0.39 | | | | 4.78 | | | | 5.17 | | | | (0.39 | ) | | | — | | | | (0.39 | ) | | | 30.68 | | | | 20.35 | | | | 160,816 | | | | 0.98 | (e) | | | 0.99 | (e) | | | 1.43 | (e) | | | 3 | |
Year ended 10/31/15 | | | 33.87 | | | | 0.41 | | | | (7.33 | ) | | | (6.92 | ) | | | (0.49 | ) | | | (0.56 | ) | | | (1.05 | ) | | | 25.90 | | | | (20.84 | ) | | | 180,773 | | | | 1.00 | | | | 1.01 | | | | 1.39 | | | | 9 | |
Year ended 10/31/14 | | | 34.52 | | | | 0.52 | | | | (0.65 | ) | | | (0.13 | ) | | | (0.42 | ) | | | (0.10 | ) | | | (0.52 | ) | | | 33.87 | | | | (0.31 | ) | | | 179,467 | | | | 0.97 | | | | 0.99 | | | | 1.55 | | | | 13 | |
Year ended 10/31/13 | | | 32.81 | | | | 0.44 | | | | 1.66 | | | | 2.10 | | | | (0.39 | ) | | | — | | | | (0.39 | ) | | | 34.52 | | | | 6.46 | | | | 154,375 | | | | 0.97 | | | | 0.99 | | | | 1.30 | | | | 14 | |
Year ended 10/31/12(f) | | | 32.73 | | | | 0.05 | | | | 0.03 | | | | 0.08 | | | | — | | | | — | | | | — | | | | 32.81 | | | | 0.24 | | | | 122,749 | | | | 0.96 | (g) | | | 0.98 | (g) | | | 1.41 | (g) | | | 19 | |
| (a) | Calculated using average shares outstanding. |
| (b) | Includes redemption fees added to shares of beneficial interest for Class A, Class B, Class C, Class Y and Class R5 which were less than $0.005 per share, for the fiscal year ended October 31,2012. |
| (c) | Includes adjustments in accordance with accounting principles generally accepted in the United States of America and as such, the net asset value for financial reporting purposes and the returns based upon those net asset values may differ from the net asset value and returns for shareholder transactions. Does not include sales charges and is not annualized for periods less than one year, if applicable. |
| (d) | Portfolio turnover is calculated at the fund level and is not annualized for periods less than one year, if applicable. |
| (e) | Ratios are based on average daily net assets (000’s omitted) of $769,910, $10,373, $76,341, $895,075, $313,324 and $145,996 for Class A, Class B, Class C, Class Y, Class R5 and Class R6 shares, respectively. |
| (f) | Commencement date of September 24, 2012. |
21 Invesco Developing Markets Fund
Report of Independent Registered Public Accounting Firm
To the Board of Trustees
and Shareholders of the Invesco Developing Markets Fund:
In our opinion, the accompanying statement of assets and liabilities, including the schedule of investments, and the related statements of operations and of changes in net assets and the financial highlights present fairly, in all material respects, the financial position of the Invesco Developing Markets Fund (the “Fund”) as of October 31, 2016, the results of its operations for the year then ended, the changes in its net assets for each of the two years in the period then ended and the financial highlights for each of the five years in the period then ended, in conformity with accounting principles generally accepted in the United States of America. These financial statements and financial highlights (hereafter referred to as “financial statements”) are the responsibility of the Fund’s management. Our responsibility is to express an opinion on these financial statements based on our audits. We conducted our audits of these financial statements in accordance with the standards of the Public Company Accounting Oversight Board (United States). Those standards require that we plan and perform the audit to obtain reasonable assurance about whether the financial statements are free of material misstatement. An audit includes examining, on a test basis, evidence supporting the amounts and disclosures in the financial statements, assessing the accounting principles used and significant estimates made by management, and evaluating the overall financial statement presentation. We believe that our audits, which included confirmation of securities as of October 31, 2016 by correspondence with the custodian, provide a reasonable basis for our opinion.
PRICEWATERHOUSECOOPERS LLP
Houston, Texas
December 21, 2016
22 Invesco Developing Markets Fund
Calculating your ongoing Fund expenses
Example
As a shareholder of the Fund, you incur two types of costs: (1) transaction costs, which may include sales charges (loads) on purchase payments or contingent deferred sales charges on redemptions, if any; and (2) ongoing costs, including management fees, distribution and/or service (12b-1) fees, and other Fund expenses. This example is intended to help you understand your ongoing costs (in dollars) of investing in the Fund and to compare these costs with ongoing costs of investing in other mutual funds. The example is based on an investment of $1,000 invested at the beginning of the period and held for the entire period May 1, 2016 through October 31, 2016.
Actual expenses
The table below provides information about actual account values and actual expenses. You may use the information in this table, together with the amount you invested, to estimate the expenses that you paid over the period. Simply divide your account value by $1,000 (for example, an $8,600 account value divided by $1,000 = 8.6), then multiply the result by the number in the table under the heading entitled “Actual Expenses Paid During Period” to estimate the expenses you paid on your account during this period.
Hypothetical example for comparison purposes
The table below also provides information about hypothetical account values and hypothetical expenses based on the Fund’s actual expense ratio and an assumed rate of return of 5% per year before expenses, which is not the Fund’s actual return.
The hypothetical account values and expenses may not be used to estimate the actual ending account balance or expenses you paid for the period. You may use this information to compare the ongoing costs of investing in the Fund and other funds. To do so, compare this 5% hypothetical example with the 5% hypothetical examples that appear in the shareholder reports of the other funds.
Please note that the expenses shown in the table are meant to highlight your ongoing costs only and do not reflect any transaction costs, such as sales charges (loads) on purchase payments or contingent deferred sales charges on redemptions, if any. Therefore, the hypothetical information is useful in comparing ongoing costs only, and will not help you determine the relative total costs of owning different funds. In addition, if these transaction costs were included, your costs would have been higher.
| | | | | | | | | | | | | | | | | | | | | | | | |
| Class | | Beginning
Account Value
(05/01/16) | | | ACTUAL | | | HYPOTHETICAL (5% annual return before expenses) | | | Annualized
Expense
Ratio | |
| | | Ending
Account Value
(10/31/16)1 | | | Expenses
Paid During
Period2 | | | Ending
Account Value
(10/31/16) | | | Expenses
Paid During
Period2 | | |
| A | | $ | 1,000.00 | | | $ | 1,084.90 | | | $ | 7.07 | | | $ | 1,018.35 | | | $ | 6.85 | | | | 1.35 | % |
| B | | | 1,000.00 | | | | 1,080.80 | | | | 10.98 | | | | 1,014.58 | | | | 10.63 | | | | 2.10 | |
| C | | | 1,000.00 | | | | 1,080.50 | | | | 10.98 | | | | 1,014.58 | | | | 10.63 | | | | 2.10 | |
| Y | | | 1,000.00 | | | | 1,085.90 | | | | 5.77 | | | | 1,019.61 | | | | 5.58 | | | | 1.10 | |
| R5 | | | 1,000.00 | | | | 1,086.80 | | | | 5.09 | | | | 1,020.26 | | | | 4.93 | | | | 0.97 | |
| R6 | | | 1,000.00 | | | | 1,087.20 | | | | 4.88 | | | | 1,020.46 | | | | 4.72 | | | | 0.93 | |
| 1 | The actual ending account value is based on the actual total return of the Fund for the period May 1, 2016 through October 31, 2016, after actual expenses and will differ from the hypothetical ending account value which is based on the Fund’s expense ratio and a hypothetical annual return of 5% before expenses. |
| 2 | Expenses are equal to the Fund’s annualized expense ratio as indicated above multiplied by the average account value over the period, multiplied by 184/366 to reflect the most recent fiscal half year. |
23 Invesco Developing Markets Fund
Approval of Investment Advisory and Sub-Advisory Contracts
The Board of Trustees (the Board) of AIM Investment Funds (Invesco Investment Funds) is required under the Investment Company Act of 1940, as amended, to approve annually the renewal of Invesco Developing Markets Fund’s (the Fund) investment advisory agreements. During contract renewal meetings held on June 7-8, 2016, the Board as a whole, and the disinterested or “independent” Trustees, who comprise over 75% of the Board, voting separately, approved the continuance for the Fund of the Master Investment Advisory Agreement with Invesco Advisers, Inc. (Invesco Advisers and the investment advisory agreement) and the Master Intergroup Sub-Advisory Contract for Mutual Funds with Invesco Asset Management Deutschland GmbH, Invesco Asset Management Limited, Invesco Asset Management (Japan) Limited, Invesco Hong Kong Limited, Invesco Senior Secured Management, Inc. and Invesco Canada Ltd. (collectively, the Affiliated Sub-Advisers and the sub-advisory contracts) for another year, effective July 1, 2016.
In evaluating the fairness and reasonableness of compensation under the Fund’s investment advisory agreement and sub-advisory contracts, the Board considered, among other things, the factors discussed below. The Board determined that continuation of the Fund’s investment advisory agreement and the sub-advisory contracts is in the best interest of the Fund and its shareholders and that the compensation payable to Invesco Advisers and the Affiliated Sub-Advisers under the agreements is fair and reasonable.
The Board’s Fund Evaluation Process
The Board’s Investments Committee has established three Sub-Committees, which meet throughout the year to review the performance of funds advised by Invesco Advisers (the Invesco Funds). Over the course of each year, the Sub-Committees meet with portfolio managers for their assigned Invesco Funds and other members of management to review the performance, investment objective(s), policies, strategies, limitations and investment risks of these funds. The Board had the benefit of reports from the Sub-Committees and Investments Committee throughout the year in considering approval of the continuance of each Invesco Fund’s investment advisory agreement and sub-advisory contracts for another year.
During the contract renewal process, the Board receives comparative performance and fee data regarding the Invesco Funds prepared by Invesco Advisers and Broadridge Financial Solutions, Inc. (Broadridge), an independent provider of investment company data. The Board also receives an independent written evaluation from the Senior Officer, an officer of the Invesco Funds who reports directly to the independent Trustees. The Senior Officer’s
evaluation is prepared as part of his responsibility to manage the process by which the Invesco Funds’ proposed management fees are negotiated during the annual contract renewal process to ensure they are negotiated in a manner that is at arms’ length and reasonable. In addition to meetings with Invesco Advisers and fund counsel, the independent Trustees also discuss the continuance of the investment advisory agreement and sub-advisory contracts in separate sessions with the Senior Officer and with independent legal counsel.
The Trustees recognized that the advisory fee rates for the Invesco Funds are, in many cases, the result of years of review and negotiation. The Trustees’ deliberations and conclusions in a particular year may be based in part on their deliberations and conclusions regarding these arrangements throughout the year and in prior years. The Trustees’ review and conclusions are based on the comprehensive consideration of all information presented to them and are not the result of any single determinative factor. Moreover, one Trustee may have weighed a particular piece of information or factor differently than another Trustee.
The discussion below is a summary of the Senior Officer’s independent written evaluation with respect to the Fund’s investment advisory agreement as well as a discussion of the material factors and related conclusions that formed the basis for the Board’s approval of the Fund’s investment advisory agreement and sub-advisory contracts. Unless otherwise stated, this information is current as of June 8, 2016, and does not reflect consideration of factors that became known to the Board after that date.
Factors and Conclusions and Summary of Independent Written Fee Evaluation
| A. | Nature, Extent and Quality of Services Provided by Invesco Advisers and the Affiliated Sub-Advisers |
The Board reviewed the advisory services provided to the Fund by Invesco Advisers under the Fund’s investment advisory agreement, the performance of Invesco Advisers in providing these services, and the credentials and experience of the officers and employees of Invesco Advisers who provide these services, including the Fund’s portfolio manager or managers. The Board’s review of the qualifications of Invesco Advisers to provide advisory services included the Board’s consideration of Invesco Advisers’ investment process oversight, independent credit analysis and investment risk management. The Board also considered non-advisory services that Invesco Advisers and its affiliates provide to the Invesco Funds such as various back office support functions, trading operations, internal audit, valuation and legal and compliance.
In determining whether to continue the Fund’s investment advisory agreement, the Board considered the benefits of reapproving an existing relationship and the greater uncertainty that may be associated with entering into a new relationship. The Board concluded that the nature, extent and quality of the services provided to the Fund by Invesco Advisers are appropriate and satisfactory and consistent with the terms of the Fund’s investment advisory agreement.
The Board reviewed the services that may be provided by the Affiliated Sub-Advisers under the sub-advisory contracts and the credentials and experience of the officers and employees of the Affiliated Sub-Advisers who provide these services. The Board noted that the Affiliated Sub-Advisers have offices and personnel that are located in financial centers around the world. As a result, the Board noted that Affiliated Sub-Advisers can provide research and investment analysis on the markets and economies of various countries in which the Fund may invest, make recommendations regarding securities and assist with security trades. The Board concluded that the sub-advisory contracts may benefit the Fund and its shareholders by permitting Invesco Advisers to use the resources and talents of the Affiliated Sub-Advisers in managing the Fund. The Board concluded that the nature, extent and quality of the services that may be provided by the Affiliated Sub-Advisers are appropriate and satisfactory and consistent with the terms of the Fund’s sub-advisory contracts.
The Board considered Fund performance as a relevant factor in considering whether to approve the investment advisory agreement. The Board did not view Fund performance as a relevant factor in considering whether to approve the sub-advisory contracts for the Fund, as no Affiliated Sub-Adviser currently manages assets of the Fund.
The Board compared the Fund’s performance during the past one, three and five calendar years to the performance of funds in the Broadridge performance universe and against the Lipper Emerging Markets Funds Index. The Board noted that performance of Class A shares of the Fund was in the fifth quintile of its performance universe for the one year period, the fourth quintile for the three year period and the third quintile for the five year period (the first quintile being the best performing funds and the fifth quintile being the worst performing funds). The Board noted that performance of Class A shares of the Fund was below the performance of the Index for the one and three year periods and above the performance of the Index for the five year period. Invesco Advisers noted that weak performance since the third quarter of 2014 is expected to be a drag on medium term performance. The Trustees also
24 Invesco Developing Markets Fund
reviewed more recent Fund performance and this review did not change their conclusions.
| C. | Advisory and Sub-Advisory Fees |
The Board compared the Fund’s contractual management fee rate to the contractual management fee rates of funds in the Fund’s Broadridge expense group at a common asset level. The Board noted that the contractual management fee rate for Class A shares of the Fund was below the median contractual management fee rate of funds in its expense group. The Board noted that the term “contractual management fee” for funds in the expense group may include both advisory and certain administrative services fees, but that Broadridge does not provide information on a fund by fund basis as to what is included. The Board noted that Invesco Advisers does not separately charge the Invesco Funds for the administrative services included in the term as defined by Broadridge. The Board also reviewed the methodology used by Broadridge in providing expense group information, which includes using each fund’s contractual management fee schedule (including any applicable breakpoints) as reported in the most recent prospectus or statement of additional information for each fund in the expense group.
The Board also compared the Fund’s effective advisory fee rate (the advisory fee rate after advisory fee waivers and before other expense limitations/waivers) to the effective advisory fee rates of other mutual funds advised by Invesco Advisers and its affiliates with investment strategies comparable to those of the Fund, based on asset balances as of December 31, 2015. The Board noted that the Fund’s rate was below the rate of one such mutual fund.
The Board noted that Invesco Advisers and the Affiliated Sub-Advisers do not manage other client accounts with investment strategies comparable to those of the Fund.
The Board also considered the services that may be provided by the Affiliated Sub-Advisers pursuant to the sub-advisory contracts, as well as the fees payable by Invesco Advisers to the Affiliated Sub-Advisers pursuant to the sub-advisory contracts. The Board also noted that the sub-advisory fees are not paid directly by the Fund, but rather, are payable by Invesco Advisers to the Affiliated Sub-Advisers.
| D. | Economies of Scale and Breakpoints |
The Board considered the extent to which there are economies of scale in the provision of advisory services to the Fund. The Board also considered whether the Fund benefits from economies of scale through contractual breakpoints in the Fund’s advisory fee schedule. The Board also noted that the Fund shares directly in economies of scale through lower fees charged by third party service providers based on the combined size of the Invesco Funds and other clients advised by Invesco Advisers.
| E. | Profitability and Financial Resources |
The Board reviewed information from Invesco Advisers concerning the costs of the advisory
and other services that Invesco Advisers and its affiliates provide to the Fund and the Invesco Funds and the profitability of Invesco Advisers and its affiliates in providing these services. The Board received information from Invesco Advisers and a report from an independent consultant engaged by the Senior Officer about the methodology used to prepare the profitability information. The Board noted that Invesco Advisers continues to operate at a net profit from services Invesco Advisers and its affiliates provide to the Invesco Funds and the Fund. The Board did not deem the level of profits realized by Invesco Advisers and its affiliates from providing services to the Fund to be excessive given the nature, quality and extent of the services provided. The Board received and accepted information from Invesco Advisers demonstrating that Invesco Advisers and each Affiliated Sub-Adviser are financially sound and have the resources necessary to perform their obligations under the investment advisory agreement and sub-advisory contracts.
| F. | Collateral Benefits to Invesco Advisers and its Affiliates |
The Board considered various other benefits received by Invesco Advisers and its affiliates from the relationship with the Fund, including the fees received for providing transfer agency and distribution services to the Fund. The Board considered comparative information regarding fees charged for these services, including information provided by Broadridge and other independent sources. The Board considered the performance of Invesco Advisers and its affiliates in providing these services and the organizational structure employed to provide these services. The Board also considered that these services are provided to the Fund pursuant to written contracts that are reviewed and approved on an annual basis by the Board; and that the services are required for the operation of the Fund.
The Board considered the benefits realized by Invesco Advisers and the Affiliated Sub-Advisers as a result of portfolio brokerage transactions executed through “soft dollar” arrangements. The Board noted that soft dollar arrangements shift the payment obligation for research services from Invesco Advisers and the Affiliated Sub-Advisers to the Invesco Funds and that the research received may be used with other clients of Invesco Advisers and may reduce Invesco Advisers’ and the Affiliated Sub-Advisers’ expenses. The Board also considered that it receives periodic reports from the Chief Compliance Officer of the Invesco Funds demonstrating that these arrangements are consistent with regulatory requirements. The Board did not deem the soft dollar arrangements to be inappropriate.
The Board considered that the Fund’s uninvested cash and cash collateral from any securities lending arrangements may be invested in money market funds advised by Invesco Advisers pursuant to procedures approved by the Board. The Board noted that Invesco Advisers receives advisory fees from
these affiliated money market funds attributable to such investments, although Invesco Advisers has contractually agreed to waive through varying periods the advisory fees payable by the Invesco Funds with respect to certain investments in the affiliated money market funds. The waiver is in an amount equal to 100% of the net advisory fee Invesco Advisers receives from the affiliated money market funds with respect to the Fund’s investment in the affiliated money market funds of uninvested cash, but not cash collateral. The Board concluded that the amount of advisory fees received by Invesco Advisors from the Fund’s investment of cash collateral from any securities lending arrangements in the affiliated money market funds is fair and reasonable.
The Board also considered the Fund may use an affiliated broker to execute certain trades for the Fund to, among other things, control information leakage, and were advised that such trades would be executed in compliance with rules under the Investment Company Act of 1940, as amended, and consistent with best execution obligations.
25 Invesco Developing Markets Fund
Tax Information
Form 1099-DIV, Form 1042-S and other year–end tax information provide shareholders with actual calendar year amounts that should be included in their tax returns. Shareholders should consult their tax advisors.
The following distribution information is being provided as required by the Internal Revenue Code or to meet a specific state’s requirement.
The Fund designates the following amounts or, if subsequently determined to be different, the maximum amount allowable for its fiscal year ended October 31, 2016:
| | | | |
Federal and State Income Tax | |
Qualified Dividend Income* | | | 99.96 | % |
Corporate Dividends Received Deduction* | | | 0.00 | % |
U.S. Treasury Obligations* | | | 0.00 | % |
Foreign Taxes | | $ | 0.0736 | per share |
Foreign Source Income | | $ | 0.3038 | per share |
| | * | The above percentages are based on ordinary income dividends paid to shareholders during the Fund’s fiscal year. |
26 Invesco Developing Markets Fund
Trustees and Officers
The address of each trustee and officer is AIM Investment Funds (Invesco Investment Funds) (the “Trust”), 11 Greenway Plaza, Suite 1000, Houston, Texas 77046-1173. The trustees serve for the life of the Trust, subject to their earlier death, incapacitation, resignation, retirement or removal as more specifically provided in the Trust’s organizational documents. Each officer serves for a one year term or until their successors are elected and qualified. Column two below includes length of time served with predecessor entities, if any.
| | | | | | | | |
Name, Year of Birth and
Position(s) Held with the Trust | | Trustee and/
or Officer Since | | Principal Occupation(s)
During Past 5 Years | | Number of
Funds in Fund
Complex
Overseen by
Trustee | | Other Directorship(s)
Held by Trustee During
Past 5 Years |
| Interested Persons | | | | | | | | |
| Martin L. Flanagan1 — 1960 Trustee | | 2007 | | Executive Director, Chief Executive Officer and President, Invesco Ltd. (ultimate parent of Invesco and a global investment management firm); Advisor to the Board, Invesco Advisers, Inc. (formerly known as Invesco Institutional (N.A.), Inc.); Trustee, The Invesco Funds; Vice Chair, Investment Company Institute; and Member of Executive Board, SMU Cox School of Business Formerly: Chairman and Chief Executive Officer, Invesco Advisers, Inc. (registered investment adviser); Director, Chairman, Chief Executive Officer and President, Invesco Holding Company (US) Inc. (formerly IVZ Inc.) (holding company), Invesco Group Services, Inc. (service provider) and Invesco North American Holdings, Inc. (holding company); Director, Chief Executive Officer and President, Invesco Holding Company Limited (parent of Invesco and a global investment management firm); Director, Invesco Ltd.; Chairman, Investment Company Institute and President, Co-Chief Executive Officer, Co-President, Chief Operating Officer and Chief Financial Officer, Franklin Resources, Inc. (global investment management organization) | | 146 | | None |
| Philip A. Taylor2 — 1954 Trustee and Senior Vice President | | 2006 | | Head of the Americas and Senior Managing Director, Invesco Ltd.; Director, Co-Chairman, Co-President and Co-Chief Executive Officer, Invesco Advisers, Inc. (formerly known as Invesco Institutional (N.A.), Inc.) (registered investment adviser); Director, Chairman, Chief Executive Officer and President, Invesco Management Group, Inc. (formerly known as Invesco AIM Management Group, Inc.) (financial services holding company); Director and Chairman, Invesco Investment Services, Inc. (formerly known as Invesco AIM Investment Services, Inc.) (registered transfer agent) Chief Executive Officer, Invesco Corporate Class Inc. (corporate mutual fund company) Director, Chairman and Chief Executive Officer, Invesco Canada Ltd. (formerly known as Invesco Trimark Ltd./Invesco Trimark Ltèe) (registered investment adviser and registered transfer agent); Trustee and Senior Vice President, The Invesco Funds; Director, Invesco Investment Advisers LLC (formerly known as Van Kampen Asset Management). Formerly: Director, Chief Executive Officer and President, Van Kampen Exchange Corp.; President and Principal Executive Officer, The Invesco Funds (other than AIM Treasurer’s Series Trust (Invesco Treasurer’s Series Trust), Short-Term Investments Trust and Invesco Management Trust); Executive Vice President, The Invesco Funds (AIM Treasurer’s Series Trust (Invesco Treasurer’s Series Trust), Short-Term Investments Trust and Invesco Management Trust only); Director and President, INVESCO Funds Group, Inc. (registered investment adviser and registered transfer agent); Director and Chairman, IVZ Distributors, Inc. (formerly known as INVESCO Distributors, Inc.) (registered broker dealer); Director, President and Chairman, Invesco Inc. (holding company), Invesco Canada Holdings Inc. (holding company), Trimark Investments Ltd./Placements Trimark Ltèe and Invesco Financial Services Ltd/Services Financiers Invesco Ltèe; Chief Executive Officer, Invesco Canada Fund Inc. (corporate mutual fund company); Director and Chairman, Van Kampen Investor Services Inc.; Director, Chief Executive Officer and President, 1371 Preferred Inc. (holding company) and Van Kampen Investments Inc.; Director and President, AIM GP Canada Inc. (general partner for limited partnerships) and Van Kampen Advisors, Inc.; Director and Chief Executive Officer, Invesco Trimark Dealer Inc. (registered broker dealer); Director, Invesco Distributors, Inc. (formerly known as Invesco AIM Distributors, Inc.) (registered broker dealer); Manager, Invesco PowerShares Capital Management LLC; Director, Chief Executive Officer and President, Invesco Advisers, Inc.; Director, Chairman, Chief Executive Officer and President, Invesco AIM Capital Management, Inc.; President, Invesco Trimark Dealer Inc. and Invesco Trimark Ltd./Invesco Trimark Ltèe; Director and President, AIM Trimark Corporate Class Inc. and AIM Trimark Canada Fund Inc.; Senior Managing Director, Invesco Holding Company Limited; Director and Chairman, Fund Management Company (former registered broker dealer); President and Principal Executive Officer, The Invesco Funds (AIM Treasurer’s Series Trust (Invesco Treasurer’s Series Trust), and Short-Term Investments Trust only); President, AIM Trimark Global Fund Inc. and AIM Trimark Canada Fund Inc. | | 146 | | None |
| 1 | Mr. Flanagan is considered an interested person (within the meaning of Section 2(a)(19) of the 1940 Act) of the Trust because he is an officer of the Adviser to the Trust, and an officer and a director of Invesco Ltd., ultimate parent of the Adviser. |
| 2 | Mr. Taylor is considered an interested person (within the meaning of Section 2(a)(19) of the 1940 Act) of the Trust because he is an officer and a director of the Adviser. |
T-1 Invesco Developing Markets Fund
Trustees and Officers—(continued)
| | | | | | | | |
Name, Year of Birth and
Position(s) Held with the Trust | | Trustee and/
or Officer Since | | Principal Occupation(s) During Past 5 Years | | Number of
Funds in Fund
Complex
Overseen by
Trustee | | Other Directorship(s)
Held by Trustee During
Past 5 Years |
| Independent Trustees | | | | | | | | |
Bruce L. Crockett — 1944 Trustee and Chair | | 2001 | | Chairman, Crockett Technologies Associates (technology consulting company) Formerly: Director, Captaris (unified messaging provider); Director, President and Chief Executive Officer, COMSAT Corporation; Chairman, Board of Governors of INTELSAT (international communications company); ACE Limited (insurance company); Independent Directors Council and Investment Company Institute | | 146 | | ALPS (Attorneys Liability Protection Society) (insurance company) and Globe Specialty Metals, Inc. (metallurgical company); Member of the Audit Committee, Ferroglobe PLC and Investment Company Institute; Member of the Executive Committee and Chair of the Governance Committee, Independent Directors Council |
David C. Arch — 1945 Trustee | | 2010 | | Chairman of Blistex Inc., a consumer health care products manufacturer | | 146 | | Board member of the Illinois Manufacturers’ Association; Member of the Board of Visitors, Institute for the Humanities, University of Michigan |
James T. Bunch — 1942 Trustee | | 2003 | | Managing Member, Grumman Hill Group LLC (family office/private equity investments) Formerly: Chairman of the Board, Denver Film Society, Chairman of the Board of Trustees, Evans Scholarship Foundation; Chairman, Board of Governors, Western Golf Association | | 146 | | Trustee, Evans Scholarship Foundation |
Albert R. Dowden — 1941 Trustee | | 2001 | | Director of a number of public and private business corporations, including Nature’s Sunshine Products, Inc. Formerly: Director, The Boss Group, Ltd. and Reich & Tang Funds (5 portfolios) (registered investment company); Director, Homeowners of America Holding Corporation/Homeowners of America Insurance Company (property casualty company); Director, Continental Energy Services, LLC (oil and gas pipeline service); Director, CompuDyne Corporation (provider of product and services to the public security market) and Director, Annuity and Life Re (Holdings), Ltd. (reinsurance company); Director, President and Chief Executive Officer, Volvo Group North America, Inc.; Senior Vice President, AB Volvo; Director of various public and private corporations; Chairman, DHJ Media, Inc.; Director, Magellan Insurance Company; and Director, The Hertz Corporation, Genmar Corporation (boat manufacturer), National Media Corporation; Advisory Board of Rotary Power International (designer, manufacturer, and seller of rotary power engines); and Chairman, Cortland Trust, Inc. (registered investment company) | | 146 | | Director of Nature’s Sunshine Products, Inc. |
Jack M. Fields — 1952 Trustee | | 2001 | | Chief Executive Officer, Twenty First Century Group, Inc. (government affairs company); and Discovery Learning Alliance (non-profit) Formerly: Owner and Chief Executive Officer, Dos Angeles Ranch L.P. (cattle, hunting, corporate entertainment); Director, Insperity, Inc. (formerly known as Administaff); Chief Executive Officer, Texana Timber LP (sustainable forestry company); Director of Cross Timbers Quail Research Ranch (non-profit); and member of the U.S. House of Representatives | | 146 | | None |
Eli Jones — 1961 Trustee | | 2016 | | Professor and Dean, Mays Business School — Texas A&M University Formerly: Professor and Dean, Walton College of Business, University of Arkansas and E.J. Ourso College of Business, Louisiana State University and Director, Arvest Bank | | 146 | | Director of Insperity, Inc. (formerly known as Administaff) |
Prema Mathai-Davis — 1950 Trustee | | 2001 | | Retired. Formerly: Chief Executive Officer, YWCA of the U.S.A. | | 146 | | None |
Larry Soll — 1942 Trustee | | 2003 | | Retired. Formerly: Chairman, Chief Executive Officer and President, Synergen Corp. (a biotechnology company) | | 146 | | None |
Raymond Stickel, Jr. — 1944 Trustee | | 2005 | | Retired. Formerly: Director, Mainstay VP Series Funds, Inc. (25 portfolios) and Partner, Deloitte & Touche | | 146 | | None |
Robert C. Troccoli — 1949 Trustee | | 2016 | | Adjunct Professor, University of Denver — Daniels College of Business Formerly: Senior Partner, KPMG LLP | | 146 | | None |
T-2 Invesco Developing Markets Fund
Trustees and Officers—(continued)
| | | | | | | | |
Name, Year of Birth and
Position(s) Held with the Trust | | Trustee and/
or Officer Since | | Principal Occupation(s) During Past 5 Years | | Number of
Funds in Fund
Complex
Overseen by
Trustee | | Other Directorship(s)
Held by Trustee During
Past 5 Years |
| Independent Trustees—(continued) |
Suzanne H. Woolsey — 1941 Trustee | | 2014 | | Retired. Formerly: Chief Executive Officer of Woolsey Partners LLC | | 146 | | Director, SunShare LLC; Trustee, Ocean Conservancy; Emeritus Chair of the Board of Trustees of the Institute for Defense Analyses and of Colorado College; Trustee, Chair, Business and Finance Committee of California Institute of Technology; Prior to 2014, Director of Fluor Corp.; Prior to 2010, Trustee of the German Marshall Fund of the United States; Prior to 2010, Trustee of the Rocky Mountain Institute |
| Other Officers | | | | | | | | |
Sheri Morris — 1964 President, Principal Executive Officer and Treasurer | | 1999 | | President, Principal Executive Officer and Treasurer, The Invesco Funds; Vice President, Invesco Advisers, Inc. (formerly known as Invesco Institutional (N.A.), Inc.) (registered investment adviser); and Vice President, PowerShares Exchange-Traded Fund Trust, PowerShares Exchange-Traded Fund Trust II, PowerShares India Exchange-Traded Fund Trust, PowerShares Actively Managed Exchange-Traded Fund Trust, and PowerShares Actively Managed Exchange-Traded Commodity Fund Trust Formerly: Vice President and Principal Financial Officer, The Invesco Funds; Vice President, Invesco AIM Advisers, Inc., Invesco AIM Capital Management, Inc. and Invesco AIM Private Asset Management, Inc.; Assistant Vice President and Assistant Treasurer, The Invesco Funds and Assistant Vice President, Invesco Advisers, Inc., Invesco AIM Capital Management, Inc. and Invesco AIM Private Asset Management, Inc.; and Treasurer, PowerShares Exchange-Traded Fund Trust, PowerShares Exchange-Traded Fund Trust II, PowerShares India Exchange-Traded Fund Trust and PowerShares Actively Managed Exchange-Traded Fund Trust | | N/A | | N/A |
Russell C. Burk — 1958 Senior Vice President and Senior Officer | | 2005 | | Senior Vice President and Senior Officer, The Invesco Funds | | N/A | | N/A |
John M. Zerr — 1962 Senior Vice President, Chief Legal Officer and Secretary | | 2006 | | Director, Senior Vice President, Secretary and General Counsel, Invesco Management Group, Inc. (formerly known as Invesco AIM Management Group, Inc.; Senior Vice President, Invesco Advisers, Inc. (formerly known as Invesco Institutional (N.A.), Inc.) (registered investment adviser); Senior Vice President and Secretary, Invesco Distributors, Inc. (formerly known as Invesco AIM Distributors, Inc.); Director, Vice President and Secretary, Invesco Investment Services, Inc. (formerly known as Invesco AIM Investment Services, Inc.) Senior Vice President, Chief Legal Officer and Secretary, The Invesco Funds; Managing Director, Invesco PowerShares Capital Management LLC; Director, Secretary and General Counsel, Invesco Investment Advisers LLC (formerly known as Van Kampen Asset Management); Secretary and General Counsel, Invesco Capital Markets, Inc. (formerly known as Van Kampen Funds Inc.) and Chief Legal Officer, PowerShares Exchange-Traded Fund Trust, PowerShares Exchange-Traded Fund Trust II, PowerShares India Exchange-Traded Fund Trust, PowerShares Actively Managed Exchange-Traded Fund Trust, and PowerShares Actively Managed Exchange-Traded Commodity Fund Trust Formerly: Director, Secretary, General Counsel and Senior Vice President, Van Kampen Exchange Corp.; Director, Vice President and Secretary, IVZ Distributors, Inc. (formerly known as INVESCO Distributors, Inc.); Director and Vice President, INVESCO Funds Group, Inc.; Director and Vice President, Van Kampen Advisors Inc.; Director, Vice President, Secretary and General Counsel, Van Kampen Investor Services Inc.; Director, Invesco Distributors, Inc. (formerly known as Invesco AIM Distributors, Inc.); Director, Senior Vice President, General Counsel and Secretary, Invesco AIM Advisers, Inc. and Van Kampen Investments Inc.; Director, Vice President and Secretary, Fund Management Company; Director, Senior Vice President, Secretary, General Counsel and Vice President, Invesco AIM Capital Management, Inc.; Chief Operating Officer and General Counsel, Liberty Ridge Capital, Inc. (an investment adviser); Vice President and Secretary, PBHG Funds (an investment company) and PBHG Insurance Series Fund (an investment company); Chief Operating Officer, General Counsel and Secretary, Old Mutual Investment Partners (a broker-dealer); General Counsel and Secretary, Old Mutual Fund Services (an administrator) and Old Mutual Shareholder Services (a shareholder servicing center); Executive Vice President, General Counsel and Secretary, Old Mutual Capital, Inc. (an investment adviser); and Vice President and Secretary, Old Mutual Advisors Funds (an investment company) | | N/A | | N/A |
T-3 Invesco Developing Markets Fund
Trustees and Officers—(continued)
| | | | | | | | |
Name, Year of Birth and
Position(s) Held with the Trust | | Trustee and/
or Officer Since | | Principal Occupation(s) During Past 5 Years | | Number of
Funds in Fund
Complex
Overseen by
Trustee | | Other Directorship(s)
Held by Trustee During
Past 5 Years |
| Other Officers—(continued) | | | | | | | | |
| Karen Dunn Kelley — 1960 Senior Vice President | | 2004 | | Senior Managing Director, Investments, Invesco Ltd.; Director, Co-President, Co-Chief Executive Officer, and Co-Chairman, Invesco Advisers, Inc. (formerly known as Invesco Institutional (N.A.), Inc.) (registered investment adviser); Chairman and Director, Invesco Senior Secured Management, Inc.; Senior Vice President, Invesco Management Group, Inc. (formerly known as Invesco AIM Management Group, Inc.); Executive Vice President, Invesco Distributors, Inc. (formerly known as Invesco AIM Distributors, Inc.); Director, Invesco Mortgage Capital Inc. and Invesco Management Company Limited; Senior Vice President, The Invesco Funds Formerly: Vice President, The Invesco Funds (other than AIM Treasurer’s Series Trust (Invesco Treasurer’s Series Trust), Short-Term Investments Trust and Invesco Management Trust); and President and Principal Executive Officer, The Invesco Funds (AIM Treasurer’s Series Trust (Invesco Treasurer’s Series Trust), Short-Term Investments Trust and Invesco Management Trust only); Director and President, INVESCO Asset Management (Bermuda) Ltd., Director, INVESCO Global Asset Management DAC (formerly known as INVESCO Global Asset Management Limited) and INVESCO Management S.A.; Senior Vice President, Van Kampen Investments Inc. and Invesco Advisers, Inc. (formerly known as Invesco Institutional (N.A.), Inc.) (registered investment adviser); Director and President, Fund Management Company; Chief Cash Management Officer, Director of Cash Management, Senior Vice President, and Managing Director, Invesco AIM Capital Management, Inc.; Director of Cash Management, Senior Vice President, and Vice President, Invesco Advisers, Inc. and Vice President, The Invesco Funds (AIM Treasurer’s Series Trust (Invesco Treasurer’s Series Trust), and Short-Term Investments Trust only) | | N/A | | N/A |
Kelli Gallegos — 1970 Vice President, Principal Financial Officer and Assistant Treasurer | | 2008 | | Vice President, Principal Financial Officer and Assistant Treasurer, The Invesco Funds; Assistant Treasurer, Invesco PowerShares Capital Management LLC, PowerShares Exchange-Traded Fund Trust, PowerShares Exchange-Traded Fund Trust II, PowerShares India Exchange-Traded Fund Trust, PowerShares Actively Managed Exchange-Traded Fund Trust, and PowerShares Actively Managed Exchange-Traded Commodity Fund Trust Formerly: Assistant Vice President, The Invesco Funds | | N/A | | N/A |
Tracy Sullivan — 1962 Vice President, Chief Tax Officer and Assistant Treasurer | | 2008 | | Vice President, Chief Tax Officer and Assistant Treasurer, The Invesco Funds; Assistant Treasurer, Invesco PowerShares Capital Management LLC, PowerShares Exchange-Traded Fund Trust, PowerShares Exchange-Traded Fund Trust II, PowerShares India Exchange-Traded Fund Trust, PowerShares Actively Managed Exchange-Traded Fund Trust, and PowerShares Actively Managed Exchange-Traded Commodity Fund Trust Formerly: Assistant Vice President, The Invesco Funds | | N/A | | N/A |
Crissie M. Wisdom — 1969 Anti-Money Laundering Compliance Officer | | 2013 | | Anti-Money Laundering Compliance Officer, Invesco Advisers, Inc. (formerly known as Invesco Institutional (N.A.), Inc.) (registered investment adviser), Invesco Capital Markets, Inc. (formerly known as Van Kampen Funds Inc.), Invesco Distributors, Inc., Invesco Investment Services, Inc., Invesco Management Group, Inc., The Invesco Funds, and PowerShares Exchange-Traded Fund Trust, PowerShares Exchange-Traded Fund Trust II, PowerShares India Exchange-Traded Fund Trust, PowerShares Actively Managed Exchange-Traded Fund Trust and PowerShares Actively Managed Exchange-Traded Commodity Fund Trust; Anti-Money Laundering Compliance Officer and Bank Secrecy Act Officer, INVESCO National Trust Company and Invesco Trust Company; and Fraud Prevention Manager and Controls and Risk Analysis Manager for Invesco Investment Services, Inc. Formerly: Anti-Money Laundering Compliance Officer, Van Kampen Exchange Corp. | | N/A | | N/A |
Robert R. Leveille — 1969 Chief Compliance Officer | | 2016 | | Chief Compliance Officer, Invesco Advisers, Inc. (registered investment adviser); and Chief Compliance Officer, The Invesco Funds Formerly: Chief Compliance Officer, Putnam Investments and the Putnam Funds | | N/A | | N/A |
The Statement of Additional Information of the Trust includes additional information about the Fund’s Trustees and is available upon request, without charge, by calling 1.800.959.4246. Please refer to the Fund’s Statement of Additional Information for information on the Fund’s sub-advisers.
| | | | | | |
Office of the Fund 11 Greenway Plaza, Suite 1000 Houston, TX 77046-1173 | | Investment Adviser Invesco Advisers, Inc. 1555 Peachtree Street, N.E. Atlanta, GA 30309 | | Distributor Invesco Distributors, Inc. 11 Greenway Plaza, Suite 1000 Houston, TX 77046-1173 | | Auditors PricewaterhouseCoopers LLP 1000 Louisiana Street, Suite 5800 Houston, TX 77002-5678 |
| | | |
| | | | | | |
Counsel to the Fund Stradley Ronon Stevens & Young, LLP 2005 Market Street, Suite 2600 Philadelphia, PA 19103-7018 | | Counsel to the Independent Trustees Goodwin Procter LLP 901 New York Avenue, N.W. Washington, D.C. 20001 | | Transfer Agent Invesco Investment Services, Inc. 11 Greenway Plaza, Suite 1000 Houston, TX 77046-1173 | | Custodian State Street Bank and Trust Company 225 Franklin Street Boston, MA 02110-2801 |
T-4 Invesco Developing Markets Fund
Explore High-Conviction Investing with Invesco

Invesco mailing information
Send general correspondence to Invesco Investment Services, Inc., P.O. Box 219078, Kansas City, MO 64121-9078.
Important notice regarding delivery of security holder documents
To reduce Fund expenses, only one copy of most shareholder documents may be mailed to shareholders with multiple accounts at the same address (Householding). Mailing of your shareholder documents may be householded indefinitely unless you instruct us otherwise. If you do not want the mailing of these documents to be combined with those for other members of your household, please contact Invesco Investment Services, Inc. at 800 959 4246 or contact your financial institution. We will begin sending you individual copies for each account within 30 days after receiving your request.
Fund holdings and proxy voting information
The Fund provides a complete list of its holdings four times in each fiscal year, at the quarter ends. For the second and fourth quarters, the lists appear in the Fund’s semiannual and annual reports to shareholders. For the first and third quarters, the Fund files the lists with the Securities and Exchange Commission (SEC) on Form N-Q. The most recent list of portfolio holdings is available at invesco.com/completeqtrholdings. Shareholders can also look up the Fund’s Forms N-Q on the SEC website at sec.gov. Copies of the Fund’s Forms N-Q may be reviewed and copied at the SEC Public Reference Room in Washington, D.C. You can obtain information on the operation of the Public Reference Room, including information about duplicating fee charges, by calling 202 551 8090 or 800 732 0330, or by electronic request at the following email address: publicinfo@sec.gov.
The SEC file numbers for the Fund are shown below.
A description of the policies and procedures that the Fund uses to determine how to vote proxies relating to portfolio securities is available without charge, upon request, from our Client Services department at 800 959 4246 or at invesco.com/proxyguidelines. The information is also available on the SEC website, sec.gov.
| | |
Information regarding how the Fund voted proxies related to its portfolio securities during the most recent 12-month period ended June 30 is available at invesco.com/proxysearch. The information is also available on the SEC website, sec.gov. Invesco Advisers, Inc. is an investment adviser; it provides investment advisory services to individual and institutional clients and does not sell securities. Invesco Distributors, Inc. is the US distributor for Invesco Ltd.’s retail mutual funds, exchange-traded funds and institutional money market funds. Both are wholly owned, indirect subsidiaries of Invesco Ltd. | |  |
| | | | |
| SEC file numbers: 811-05426 and 033-19338 | | DVM-AR-1 | | Invesco Distributors, Inc. |
| | | | |
| | |
 | | Annual Report to Shareholders | | October 31, 2016 |
| | |
| | Invesco Emerging Markets Flexible Bond Fund |
| | Nasdaq: |
| | A: IAEMX ∎ B: IBEMX ∎ C: ICEMX ∎ R: IREMX ∎ Y: IYEMX ∎ R5: IIEMX ∎ R6: IFEMX |

Letters to Shareholders
| | |

Philip Taylor | | Dear Shareholders: This annual report includes information about your Fund, including performance data and a complete list of its investments as of the close of the reporting period. Inside is a discussion of how your Fund was managed and the factors that affected its performance during the reporting period. In December 2015, the US Federal Reserve raised short-term interest rates for the first time since 2006, signaling its belief that the economy was likely to continue strengthening. Indeed, throughout the reporting period, US economic data were generally positive and the economy expanded at a moderate rate – but there were some bumps along the road. Job growth in May 2016 was very weak, but it was followed by strong increases in nonfarm payrolls in June and July. Increased concerns about global economic weakness caused US stock market indexes to sink at the start of calendar year 2016, but they eventually recovered; they sank again following the UK’s decision to leave the European Union, but then quickly |
recovered and reached record highs later in the summer. Strong demand for income-producing investments, particularly those perceived to be lower risk, benefited bonds as well as dividend-paying stocks for much of the reporting period. While economic news in the US was generally positive, news overseas was less upbeat. The European Central Bank, and central banks in China and Japan – as well as other countries – maintained extraordinarily accommodative monetary policies in response to economic weakness. As the fiscal year drew to a close, uncertainty about the outcome of the US presidential election resulted in increased market volatility; the surprise outcome after the close of the reporting period suggested that market volatility may continue for some time to come.
Short-term market volatility can prompt some investors to abandon their investment plans – and can cause others to settle for average results. The investment professionals at Invesco, in contrast, invest with high conviction, take a long-term perspective and have a passion to exceed. Invesco’s pure focus on investment management eliminates possible distractions and means that there are no competing lines of business for us to support. Just as important, we embrace a variety of investment strategies, asset classes and geographies – because we know that no single investment approach meets the diverse needs of all of our clients. We manage all our investment approaches with a passion to exceed. All our investment teams have a highly disciplined, long-term investing style that eliminates short-term decision-making. Of course, investing with high conviction can’t guarantee a profit or ensure success; no investment strategy can. To learn more about how we invest with high conviction, visit invesco.com/HighConviction.
You, too, can invest with high conviction by maintaining a long-term investment perspective and by working with your financial adviser on a regular basis. During periods of short-term market volatility or uncertainty, your financial adviser can keep you focused on your long-term investment goals – a new home, a child’s college education or a secure retirement. He or she also can share research about the economy, the markets and individual investment options.
Visit our website for more information on your investments
Our website, invesco.com/us, offers a wide range of market insights and investment perspectives. On the website, you’ll find detailed information about our funds, including performance, holdings and portfolio manager commentaries. You can access information about your account by completing a simple, secure online registration. Click on the “Need to register” link in the “Account Access” box on our homepage to get started.
In addition to the resources accessible on our website and through our mobile app, you can obtain timely updates to help you stay informed about the markets, the economy and investing by connecting with Invesco on Twitter, LinkedIn or Facebook. You can access our blog at blog.invesco.us.com. Our goal is to provide you the information you want, when and where you want it.
Finally, I’m pleased to share with you Invesco’s commitment to both the Principles for Responsible Investment and to considering environmental, social and governance issues in our robust investment process. I invite you to learn more at invesco.com/esg.
Have questions?
For questions about your account, contact an Invesco client services representative at 800 959 4246. For Invesco-related questions or comments, please email me directly at phil@invesco.com.
All of us at Invesco look forward to serving your investment management needs. Thank you for investing with us.
Sincerely,

Philip Taylor
Senior Managing Director, Invesco Ltd.
2 Invesco Emerging Markets Flexible Bond Fund
| | | | | | |

Bruce Crockett | | | | Dear Fellow Shareholders: Among the many important lessons I’ve learned in more than 40 years in a variety of business endeavors is the value of a trusted advocate. As independent chair of the Invesco Funds Board, I can assure you that the members of the Board are strong advocates for the interests of investors in Invesco’s mutual funds. We work hard to represent your interests through oversight of the quality of the investment management services your funds receive and other matters important to your investment, including but not limited to: |
| | | | ∎ | | Ensuring that Invesco offers a diverse lineup of mutual funds that your financial adviser can use to strive to meet your financial needs as your investment goals change over time. |
| | | | ∎ | | Monitoring how the portfolio management teams of the Invesco funds are performing in light of changing economic and market conditions. |
| ∎ | | Assessing each portfolio management team’s investment performance within the context of the investment strategy described in the fund’s prospectus. |
| ∎ | | Monitoring for potential conflicts of interests that may impact the nature of the services that your funds receive. |
We believe one of the most important services we provide our fund shareholders is the annual review of the funds’ advisory and sub-advisory contracts with Invesco Advisers and its affiliates. This review is required by the Investment Company Act of 1940 and focuses on the nature and quality of the services Invesco provides as the adviser to the Invesco funds and the reasonableness of the fees that it charges for those services. Each year, we spend months carefully reviewing information received from Invesco and a variety of independent sources, such as performance and fee data prepared by Lipper Inc., an independent, third-party firm widely recognized as a leader in its field. We also meet with our independent legal counsel and other independent advisers to review and help us assess the information that we have received. Our goal is to assure that you receive quality investment management services for a reasonable fee.
I trust the measures outlined above provide assurance that you have a worthy advocate when it comes to choosing the Invesco Funds.
As always, please contact me at bruce@brucecrockett.com with any questions or concerns you may have. On behalf of the Board, we look forward to continuing to represent your interests and serving your needs.
Sincerely,

Bruce L. Crockett
Independent Chair
Invesco Funds Board of Trustees
3 Invesco Emerging Markets Flexible Bond Fund
Management’s Discussion of Fund Performance
| | | | |
Performance summary For the fiscal year ended October 31, 2016, Class A shares of Invesco Emerging Markets Flexible Bond Fund (the Fund), at net asset value (NAV), underperformed the 3-Month USD Libor Index, the Fund’s style-specific index. Your Fund’s long-term performance appears later in this report. | |
Fund vs. Indexes Total returns, 10/31/15 to 10/31/16, at net asset value (NAV). Performance shown does not include applicable contingent deferred sales charges (CDSC) or front-end sales charges, which would have reduced performance. | |
Class A Shares | | | 0.45 | % |
Class B Shares | | | -0.37 | |
Class C Shares | | | -0.21 | |
Class R Shares | | | 0.33 | |
Class Y Shares | | | 0.72 | |
Class R5 Shares | | | 0.72 | |
Class R6 Shares | | | 0.73 | |
JP Morgan EMBI Global Diversified Indexq (Broad Market Index)* | | | 11.70 | |
| JP Morgan Government Bond Index - Emerging Markets (GBI-EM) Global Diversified Indexq (Former Broad Market/Style-Specific Index)* | | | 11.04 | |
| 3-Month USD Libor Index∎ (Style-Specific Index)* | | | 0.62 | |
| Lipper Emerging Markets Hard Currency Debt Funds Index◆ (Peer Group Index) | | | 12.11 | |
Source(s): qFactSet Research Systems Inc.; ∎Bloomberg L.P.; ◆Lipper Inc. | | | | |
| | |
*The Fund has elected to use the JP Morgan EMBI Global Diversified Index and the 3-Month USD Libor Index as its broad market index and its style-specific index, respectively, rather than the JP Morgan Government Bond Index - Emerging Markets (GBI-EM) Global Diversified Index because the JP Morgan EMBI Global Diversified Index and the 3-Month USD Libor Index more closely reflect the performance of the types of securities in which the Fund invests. |
Market conditions and your Fund
Effective February 26, 2016 the Fund changed its name from Invesco Emerging Markets Local Currency Debt Fund to Invesco Emerging Markets Flexible Bond Fund. The change reflects the Fund’s
change in strategy, which seeks to provide attractive risk-adjusted returns over a full market cycle through investments in emerging market hard and local currency denominated sovereign and corporate debt securities.
| | |
Portfolio Composition |
By industry | | % of total net assets |
| | | | |
| Sovereign Debt | | | 37.6 | % |
Diversified Banks | | | 9.9 | |
Integrated Oil & Gas | | | 6.2 | |
Packaged Foods & Meats | | | 5.5 | |
Integrated Telecommunication Services | | | 2.4 | |
Oil & Gas Exploration & Production | | | 2.0 | |
Oil & Gas Refining & Marketing | | | 1.8 | |
Electric Utilities | | | 1.8 | |
Construction & Engineering | | | 1.7 | |
Wireless Telecommunication Services | | | 1.5 | |
| Independent Power Producers & Energy Traders | | | 1.5 | |
| Diversified Capital Markets | | | 1.5 | |
| Airlines | | | 1.5 | |
| Oil & Gas Storage & Transportation | | | 1.2 | |
| Construction Materials | | | 1.1 | |
| Gold | | | 1.0 | |
| Consumer Finance | | | 1.0 | |
Industry Type Each Less Than 1% of Portfolio | | | 3.5 | |
Money Market Funds Plus Other Assets Less Liabilities | | | 17.3 | |
| | | | | | |
| Top Five Debt Issuers* |
| | | | | | % of total net assets |
| | | | | | | | |
| | 1. | | | Mexican Bonos | | | 7.6 | % |
| | 2. | | | Hungary Government Bond | | | 6.3 | |
| | 3. | | | Standard Chartered Bank | | | 5.5 | |
| | 4. | | | Russian Federal Bond-OFZ | | | 3.0 | |
| | 5. | | | Petrobras Global Finance B.V. | | | 3.0 | |
| | | | | | |
Total Net Assets | | $ | 67.8 million | |
| |
Total Number of Holdings* | | | 64 | |
The Fund’s holdings are subject to change, and there is no assurance that the Fund will continue to hold any particular security.
*Excluding money market fund holdings.
Data presented here are as of October 31, 2016.
Emerging market debt securities posted strong returns during the reporting period. Hard currency sovereign debt securities returned 11.7%, corporate debt securities returned 9.2% and local currency debt securities returned 11.0%.1 Price appreciation for dollar-denominated debt securities was driven by a combination of a rally in US Treasuries and credit spread tightening. US 10-year Treasuries ended the fiscal year yielding 1.84%, 32 basis points lower than a year prior.2 (A basis point is one one-hundredth of a percentage point.) Emerging market sovereign spreads tightened 53 basis points during the reporting period to end at 3.40%, despite a lower overall credit rating for the hard currency index.1 Corporate spreads also tightened by 90 basis points, while corporate credit saw an overall improvement in ratings.1 The rally in US Treasuries reflected expectations for lower US growth and inflation going forward, while the tightening in emerging market spreads was largely the result of sustained flows into the asset class, driven by a global hunt for yield in a low yield environment. For local currency debt securities, returns were driven primarily by high local carry, while both price appreciation in local terms and currency appreciation versus the US dollar and euro contributed to Fund performance during the fiscal year.
Emerging market bonds had a difficult first couple of months of the fiscal year, due to weakness in oil and soft economic data in the US and China, which drove commodity prices lower. However, the asset class rebounded strongly starting in February, posting positive returns in seven of the following eight months. In March, reflationary policies led by major central banks, further supported by fiscal stimulus measures in China, supercharged local emerging markets, which posted a 9.1% return for the month.1 During the reporting period, emerging markets debt benefited tremendously from dovish global central bank policies, macroeconomic improvements, a recovery in oil prices and improved emerging market funds inflows. The asset class performed well during the reporting period despite global volatility resulting from events such as Brexit, the June 2016 referendum in which UK voters opted to leave the European Union. Inflows for hard currency alone from the beginning of 2016 to the end of the reporting period
|
| 4 Invesco Emerging Markets Flexible Bond Fund |
were nearly $38 billion.3 October 2016 saw a sell-off in emerging market debt securities driven by higher global yields and a fall in oil prices.
For both corporate and sovereign debt securities, high yield bonds outperformed investment grade bonds for the reporting period.1 All regions had positive returns, led by Latin America and Africa, while the Middle East lagged. The top-performing sovereigns for the reporting period included Venezuela, Ecuador, Zambia and Argentina, while Mozambique, Belize and Turkey were the worst performers. For corporate debt securities, transport and metals and mining were the top-performing sectors for the reporting period, while the diversified and financial sectors lagged. For local currency denominated debt securities, the top-performing countries during the reporting period were Brazil and Indonesia, while Mexico and Poland were the only two countries to post negative returns.
The Fund generated its return during the reporting period with significantly less volatility than the underlying emerging markets themselves. The Fund’s returns were generated from exposure to US dollar-denominated sovereign and corporate debt securities, in addition to local market interest rate exposures. Currency exposures, led by the negative carry from short emerging market foreign exchange positions, detracted from Fund performance.
From a regional and sector perspective, contributors to Fund performance were diversified and broad based. Key investment themes included meaningful exposure to Latin American assets that benefited from rising commodity prices. Brazilian and Mexican corporate and local currency debt were significant contributors to the Fund’s performance. Russian corporate credit exposure was an outsized contributor to Fund performance, benefiting from rising oil prices and the paying down of external debt. Central American sovereign credit exposure benefited from the US duration rally and interest from market participants given the bonds’ attractive relative valuations.
Our key emerging market foreign currency investment theme centered on the rich valuations in Asian currency markets most impacted by an anticipated depreciation of the Chinese renminbi. This has proven slower to develop than anticipated. In southern Asia, the Fund benefited significantly from its exposure to Indian and Indonesian local bond markets, on an unhedged basis.
At the close of the reporting period, medium-term emerging market fundamentals remained challenged as debt levels continued to rise, although near-term economic activity stabilized. In our view, the potential for increased growth in China in 2017 could support commodity-exporting emerging markets, with Latin America a more likely beneficiary. We see prospective tightening in financial conditions as a threat to these outcomes. Valuations remained fair to slightly rich at the close of the reporting period, yet we believe continued portfolio flows may provide ongoing price support as institutional investors increasingly allocate to the asset class.
Please note that the Fund’s strategy is partly implemented with derivative instruments that include futures, forwards, options and swaps. Therefore, some of the performance of the strategy, both positive and negative, can be attributed to these instruments. Derivatives can be a cost-effective way to gain exposure to asset classes. However, derivatives may amplify traditional investment risks through the creation of leverage and may be less liquid than traditional securities.
Thank you for your investment in Invesco Emerging Markets Flexible Bond Fund.
1 Source: J.P. Morgan
2 Source: US Department of the Treasury
3 Source: EPFR Global
The views and opinions expressed in management’s discussion of Fund performance are those of Invesco Advisers, Inc. These views and opinions are subject to change at any time based on factors such as market and economic conditions. These views and opinions may not be relied upon as investment advice or recommendations, or as an offer for a particular security. The information is not a complete analysis of every aspect of any market, country, industry, security or the Fund. Statements of fact are from sources considered reliable, but Invesco Advisers, Inc. makes no representation or warranty as to their completeness or accuracy. Although historical performance is no guarantee of future results, these insights may help you understand our investment management philosophy.
See important Fund and, if applicable, index disclosures later in this report.

Avi Hooper
Chartered Financial Analyst, Portfolio Manager, is lead manager of Invesco Emerging Markets Flexible Bond Fund. He joined Invesco in 2010. Mr. Hooper earned a BAS with a focus in accounting and finance from York University.

Rashique Rahman
Portfolio Manager, is lead manager of Invesco Emerging Markets Flexible Bond Fund. Mr. Rahman is the Head of Emerging Markets for Invesco Fixed Income. He joined Invesco in 2014. Mr. Rahman did undergraduate work at the University of California, Los Angeles, and earned an MA and an MBA from Columbia University.

Michael Hyman
Portfolio Manager, is manager of Invesco Emerging Markets Flexible Bond Fund. He joined Invesco in 2013. Mr. Hyman earned a BSE in finance from Pennsylvania State University and an MBA from the Stern School of Business at New York University.

Jorge Ordonez
Portfolio Manager, is manager of Invesco Emerging Markets Flexible Bond Fund. He joined Invesco in 2015. Mr. Ordonez earned a BA in economics from Haverford College and an MBA from the Tuck School of Business at Dartmouth.
|
| 5 Invesco Emerging Markets Flexible Bond Fund |
Your Fund’s Long-Term Performance
Results of a $10,000 Investment – Oldest Share Class(es) since Inception
Fund and index data from 6/16/10
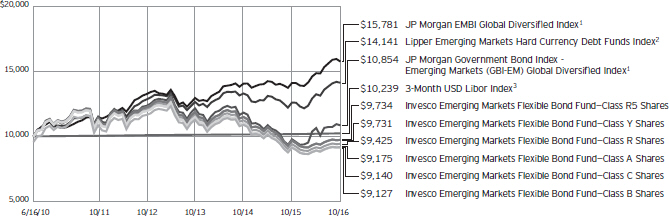
| 1 Source: | Factset Research Systems Inc. |
Past performance cannot guarantee comparable future results.
During the reporting period, the Fund has elected to use the JP Morgan EMBI Global Diversified Index and the 3-Month USD Libor Index as its broad market index and its style-specific index, respectively, rather than the JP Morgan Government Bond Index - Emerging Markets (GBI-EM) Global Diversified Index because the JP Morgan EMBI Global Diversified Index and the 3-Month USD Libor Index more closely reflect the performance of
the types of securities in which the Fund invests. Because this is the first reporting period since we have adopted the new index, SEC guidelines require that we compare performance to both the old and new indexes.
The data shown in the chart include reinvested distributions, applicable sales charges and Fund expenses including management fees. Results for Class B shares are calculated as if a hypothetical shareholder had liquidated his entire investment in the Fund at the close of the
reporting period and paid the contingent deferred sales charges, if applicable. Index results include reinvested dividends, but they do not reflect sales charges. Performance of the peer group, if applicable, reflects fund expenses and management fees; performance of a market index does not. Performance shown in the chart and table(s) does not reflect deduction of taxes a shareholder would pay on Fund distributions or sale of Fund shares.
continued from page 9
| | a short position, which is theoretically unlimited, if the price of the asset sold short increases from the short sale price. The counterparty to a short position or other market factors may prevent the Fund from closing out a short position at a desirable time or price and may reduce or eliminate any gain or result in a loss. In a rising market, the Fund’s short positions will cause the Fund to underperform the overall market and its peers that do not engage in shorting. If the Fund holds both long and short positions, and both positions decline simultaneously, the short positions will not provide any buffer (hedge) from declines in value of the Fund’s long positions. Certain types of short positions involve leverage, which may exaggerate any losses, potentially more than the actual cost of the investment, and will increase the volatility of the Fund’s returns. |
| ∎ | | Subsidiary risk. By investing in the Subsidiary, the Fund is indirectly exposed to risks associated with the Subsidiary’s investments. The Subsidiary is not registered under the Investment Company Act of 1940, as amended (1940 Act), and, except as otherwise noted in this prospectus, is not subject to the investor protections of the 1940 Act. Changes in the laws of the United States and/or the Cayman Islands, under which the Fund and the Subsidiary, respectively, are organized, could result in the inability of the Fund and/or the Subsidiary to operate as described in the Fund’s prospectus and the SAI, and could negatively affect the Fund and its shareholders. |
About indexes used in this report
| ∎ | | The JP Morgan EMBI Global Diversified Index is an unmanaged index that tracks the traded market for US-dollar-denominated Brady bonds, eurobonds, |
| | traded loans and local market debt instruments issued by sovereign and quasi-sovereign entities. |
| ∎ | | The JP Morgan Government Bond Index - Emerging Markets (GBI-EM) Global Diversified Index is a comprehensive global local emerging markets index comprising liquid, fixed-rate, domestic currency government bonds. |
| ∎ | | The 3-Month USD Libor Index is unmanaged index considered representative of the average interest rate at which a selection of banks in London are prepared to lend to one another in American dollars with a maturity of three months. |
| ∎ | | The Lipper Emerging Markets Hard Currency Debt Funds Index is an unmanaged index considered representative of emerging market debt funds tracked by Lipper. |
| ∎ | | The Fund is not managed to track the performance of any particular index, |
continued on page 7
6 Invesco Emerging Markets Flexible Bond Fund
| | | | |
| Average Annual Total Returns | |
| As of 10/31/16, including maximum applicable sales charges | |
| |
Class A Shares | | | | |
Inception (6/16/10) | | | -1.34 | % |
5 Years | | | -4.16 | |
1 Year | | | -3.81 | |
| |
Class B Shares | | | | |
Inception (6/16/10) | | | -1.42 | % |
5 Years | | | -4.34 | |
1 Year | | | -5.19 | |
| |
Class C Shares | | | | |
Inception (6/16/10) | | | -1.40 | % |
5 Years | | | -4.01 | |
1 Year | | | -1.18 | |
| |
Class R Shares | | | | |
Inception (6/16/10) | | | -0.92 | % |
5 Years | | | -3.55 | |
1 Year | | | 0.33 | |
| |
Class Y Shares | | | | |
Inception (6/16/10) | | | -0.43 | % |
5 Years | | | -3.08 | |
1 Year | | | 0.72 | |
| |
Class R5 Shares | | | | |
Inception (6/16/10) | | | -0.42 | % |
5 Years | | | -3.05 | |
1 Year | | | 0.72 | |
| |
Class R6 Shares | | | | |
Inception | | | -0.51 | % |
5 Years | | | -3.12 | |
1 Year | | | 0.73 | |
Class R6 shares incepted on September 24, 2012. Performance shown prior to that date is that of Class A shares and includes the 12b-1 fees applicable to Class A shares.
The performance data quoted represent past performance and cannot guarantee comparable future results; current performance may be lower or higher. Please visit invesco.com/performance for the most recent month-end performance. Performance figures
| | |
Average Annual Total Returns |
| As of 9/30/16, the most recent calendar quarter end, including maximum applicable sales charges |
| | | | |
| |
Class A Shares | | | | |
Inception (6/16/10) | | | -1.38 | % |
5 Years | | | -3.13 | |
1 Year | | | 0.01 | |
| |
Class B Shares | | | | |
Inception (6/16/10) | | | -1.47 | % |
5 Years | | | -3.34 | |
1 Year | | | -1.30 | |
| |
Class C Shares | | | | |
Inception (6/16/10) | | | -1.44 | % |
5 Years | | | -3.01 | |
1 Year | | | 2.70 | |
| |
Class R Shares | | | | |
Inception (6/16/10) | | | -0.98 | % |
5 Years | | | -2.57 | |
1 Year | | | 4.15 | |
| |
Class Y Shares | | | | |
Inception (6/16/10) | | | -0.48 | % |
5 Years | | | -2.08 | |
1 Year | | | 4.59 | |
| |
Class R5 Shares | | | | |
Inception (6/16/10) | | | -0.48 | % |
5 Years | | | -2.06 | |
1 Year | | | 4.59 | |
| |
Class R6 Shares | | | | |
Inception | | | -0.57 | % |
5 Years | | | -2.11 | |
1 Year | | | 4.76 | |
reflect reinvested distributions, changes in net asset value and the effect of the maximum sales charge unless otherwise stated. Investment return and principal value will fluctuate so that you may have a gain or loss when you sell shares.
The net annual Fund operating expense ratio set forth in the most recent Fund prospectus as of the date of this report for Class A, Class B, Class C, Class R, Class Y, Class R5 and Class R6
shares was 1.24%, 1.99%, 1.99%, 1.49%, 0.99%, 0.99% and 0.99%, respectively.1 The total annual Fund operating expense ratio set forth in the most recent Fund prospectus as of the date of this report for Class A, Class B, Class C, Class R, Class Y, Class R5 and Class R6 shares was 1.89%, 2.64%, 2.64%, 2.14%, 1.64%, 1.34% and 1.33%, respectively. The expense ratios presented above may vary from the expense ratios presented in other sections of this report that are based on expenses incurred during the period covered by this report.
Class A share performance reflects the maximum 4.25% sales charge, and Class B and Class C share performance reflects the applicable contingent deferred sales charge (CDSC) for the period involved. The CDSC on Class B shares declines from 5% beginning at the time of purchase to 0% at the beginning of the seventh year. The CDSC on Class C shares is 1% for the first year after purchase. Class R, Class Y, Class R5 and Class R6 shares do not have a front-end sales charge or a CDSC; therefore, performance is at net asset value.
The performance of the Fund’s share classes will differ primarily due to different sales charge structures and class expenses.
Fund performance reflects any applicable fee waivers and/or expense reimbursements. Had the adviser not waived fees and/or reimbursed expenses currently or in the past, returns would have been lower. See current prospectus for more information.
| 1 | Total annual Fund operating expenses after any contractual fee waivers and/or expense reimbursements by the adviser in effect through at least February 28, 2018. See current prospectus for more information. |
continued from page 6
| | including the index(es) described here, and consequently, the performance of the Fund may deviate significantly from the performance of the index(es). |
| ∎ | | A direct investment cannot be made in an index. Unless otherwise indicated, index results include reinvested dividends, and they do not reflect sales charges. Performance of the peer group, if applicable, reflects fund expenses; performance of a market index does not. |
Other information
| ∎ | | The returns shown in management’s discussion of Fund performance are based on net asset values (NAVs) calculated for shareholder transactions. Generally accepted accounting principles require adjustments to be made to the net assets of the Fund at period end for financial reporting purposes, and as such, the NAVs for shareholder transactions and the |
| | | returns based on those NAVs may differ from the NAVs and returns reported in the Financial Highlights. |
| ∎ | | Industry classifications used in this report are generally according to the Global Industry Classification Standard, which was developed by and is the exclusive property and a service mark of MSCI Inc. and Standard & Poor’s. |
7 Invesco Emerging Markets Flexible Bond Fund
Invesco Emerging Markets Flexible Bond Fund’s investment objective is total return through growth of capital and current income.
| ∎ | | Unless otherwise stated, information presented in this report is as of October 31, 2016, and is based on total net assets. |
| ∎ | | Unless otherwise noted, all data provided by Invesco. |
| ∎ | | To access your Fund’s reports/prospectus, visit invesco.com/fundreports. |
About share classes
| ∎ | | Class B shares may not be purchased for new or additional investments. Please see the prospectus for more information. |
| ∎ | | Class R shares are generally available only to employer sponsored retirement and benefit plans. Please see the prospectus for more information. |
| ∎ | | Class Y shares are available only to certain investors. Please see the prospectus for more information. |
| ∎ | | Class R5 shares and Class R6 shares are primarily intended for employer sponsored retirement and benefit plans that meet certain standards and for institutional investors. Please see the prospectus for more information. |
Principal risks of investing in the Fund
| ∎ | | Active trading risk. Active trading of portfolio securities may result in added expenses, a lower return and increased tax liability. |
| ∎ | | Changing fixed income market conditions risk. The current low interest rate environment was created in part by the Federal Reserve Board (FRB) and certain foreign central banks keeping the federal funds and equivalent foreign rates near, at or below zero. Increases in the federal funds and equivalent foreign rates may expose fixed income markets to heightened volatility and reduced liquidity for certain fixed income investments, particularly those with longer maturities. In addition, decreases in fixed income dealer market-making capacity may also potentially lead to heightened volatility and reduced liquidity in the fixed income markets. As a result, the value of the Fund’s investments and share price may decline. Changes in central bank policies could also result in higher than normal shareholder redemptions, which could potentially increase portfolio turnover and the Fund’s transaction costs. |
| ∎ | | Commodities tax risk. The tax treatment of commodity-linked derivative instruments may be adversely affected |
| | by changes in legislation, regulations or other legally binding authority. If, as a result of any such adverse action, the income of the Fund from certain commodity-linked derivatives was treated as non-qualifying income, the Fund might fail to qualify as a regulated investment company and be subject to federal income tax at the Fund level. Should the Internal Revenue Service issue guidance, or Congress enact legislation, that adversely affects the tax treatment of the Fund’s use of the Subsidiary (which guidance might be applied to the Fund retroactively), it could, among other consequences, limit the Fund’s ability to pursue its investment strategy. |
| ∎ | | Commodity risk. The Fund may have investment exposure to the commodities markets and/or a particular sector of the commodities markets, which may subject the Fund to greater volatility than investments in traditional securities, such as stocks and bonds. Volatility in the commodities markets may be caused by changes in overall market movements, domestic and foreign political and economic events and policies, war, acts of terrorism, changes in domestic or foreign interest rates and/ or investor expectations concerning interest rates, domestic and foreign inflation rates, investment and trading activities of mutual funds, hedge funds and commodities funds, and factors such as drought, floods, weather, livestock disease, embargoes, tariffs and other regulatory developments or supply and demand disruptions. Because the Fund’s performance may be linked to the performance of volatile commodities, investors should be willing to assume the risks of potentially significant fluctuations in the value of the Fund’s shares. |
| ∎ | | Credit linked notes risk. Risks of credit linked notes include those risks associated with the underlying reference obligation including but not limited to market risk, interest rate risk, credit risk, default risk and, in some cases, foreign currency risk. An investor in a credit |
| | linked note bears counterparty risk or the risk that the issuer of the credit linked note will default or become bankrupt and not make timely payment of principal and interest of the structured security. Credit linked notes may be less liquid than other investments and therefore harder to dispose of at the desired time and price. In addition, credit linked notes may be leveraged and, as a result, small changes in the value of the underlying reference obligation may produce disproportionate losses to the Fund. |
| ∎ | | Debt securities risk. The prices of debt securities held by the Fund will be affected by changes in interest rates, the creditworthiness of the issuer and other factors. An increase in prevailing interest rates typically causes the value of existing debt securities to fall and often has a greater impact on longer-duration debt securities and higher quality debt securities. Falling interest rates will cause the Fund to reinvest the proceeds of debt securities that have been repaid by the issuer at lower interest rates. Falling interest rates may also reduce the Fund’s distributable income because interest payments on floating rate debt instruments held by the Fund will decline. The Fund could lose money on investments in debt securities if the issuer or borrower fails to meet its obligations to make interest payments and/or to repay principal in a timely manner. Changes in an issuer’s financial strength, the market’s perception of such strength or in the credit rating of the issuer or the security may affect the value of debt securities. The Adviser’s credit analysis may fail to anticipate such changes, which could result in buying a debt security at an inopportune time or failing to sell a debt security in advance of a price decline or other credit event. |
| ∎ | | Derivatives risk. The value of a derivative instrument depends largely on (and is derived from) the value of an underlying security, currency, commodity, interest rate, index or other asset (each referred to as an underlying asset). In addition to risks relating to the underlying assets, the use of derivatives may include other, possibly greater, risks, including counterparty, leverage and liquidity risks. Counterparty risk is the risk that the counterparty to the derivative contract will default on its obligation |
|
This report must be accompanied or preceded by a currently effective Fund prospectus, which contains more complete information, including sales charges and expenses. Investors should read it carefully before investing. |
|
NOT FDIC INSURED | MAY LOSE VALUE | NO BANK GUARANTEE |
8 Invesco Emerging Markets Flexible Bond Fund
| | to pay the Fund the amount owed or otherwise perform under the derivative contract. Derivatives create leverage risk because they do not require payment up front equal to the economic exposure created by owning the derivative. As a result, an adverse change in the value of the underlying asset could result in the Fund sustaining a loss that is substantially greater than the amount invested in the derivative, which may make the Fund’s returns more volatile and increase the risk of loss. Derivative instruments may also be less liquid than more traditional investments and the Fund may be unable to sell or close out its derivative positions at a desirable time or price. This risk may be more acute under adverse market conditions, during which the Fund may be most in need of liquidating its derivative positions. Derivatives may also be harder to value, less tax efficient and subject to changing government regulation that could impact the Fund’s ability to use certain derivatives or their cost. Also, derivatives used for hedging or to gain or limit exposure to a particular market segment may not provide the expected benefits, particularly during adverse market conditions. These risks are greater for the Fund than mutual funds that do not use derivative instruments or that use derivative instruments to a lesser extent than the Fund to implement their investment strategies. |
| ∎ | | Emerging markets securities risk. Emerging markets (also referred to as developing markets) are generally subject to greater market volatility, political, social and economic instability, uncertain trading markets and more governmental limitations on foreign investment than more developed markets. In addition, emerging markets may be subject to lower trading volume and greater price fluctuations than companies in more developed markets. Securities law and the enforcement of systems of taxation in many emerging market countries may change quickly and unpredictably. In addition, investments in emerging markets securities may also be subject to additional transaction costs, delays in settlement procedures, and lack of timely information. |
| ∎ | | Foreign currency tax risk. If the US Treasury Department were to exercise its authority to issue regulations that |
| | exclude from the definition of “qualifying income” foreign currency gains not directly related to the Fund’s business of investing in securities, the Fund may be unable to qualify as a regulated investment company for one or more years. In this event, the Fund’s Board of Trustees may authorize a significant change in investment strategy or other action. |
| ∎ | | Foreign government debt risk. Investments in foreign government debt securities (sometimes referred to as sovereign debt securities) involve certain risks in addition to those relating to foreign securities or debt securities generally. The issuer of the debt or the governmental authorities that control the repayment of the debt may be unable or unwilling to repay principal or interest when due in accordance with the terms of such debt, and the Fund may have limited recourse in the event of a default against the defaulting government. Without the approval of debt holders, some governmental debtors have in the past been able to reschedule or restructure their debt payments or declare moratoria on payments. |
| ∎ | | Foreign securities risk. The Fund’s foreign investments may be adversely affected by political and social instability, changes in economic or taxation policies, difficulty in enforcing obligations, decreased liquidity or increased volatility. Foreign investments also involve the risk of the possible seizure, nationalization or expropriation of the issuer or foreign deposits (in which the Fund could lose its entire investments in a certain market) and the possible adoption of foreign governmental restrictions such as exchange controls. Unless the Fund has hedged its foreign securities risk, foreign securities risk also involves the risk of negative foreign currency rate fluctuations, which may cause the value of securities denominated in such foreign currency (or other instruments through which the Fund has exposure to foreign currencies) to decline in value. Currency exchange rates may fluctuate significantly over short periods of time. Currency hedging strategies, if used, are not always successful. |
| ∎ | | Geographic focus risk. The Fund may from time to time invest a substantial amount of its assets in securities of issuers located in a single country or a limited number of countries. Adverse |
| | | economic, political or social conditions in those countries may therefore have a significant negative impact on the Fund’s investment performance. |
| ∎ | | High yield debt securities (junk bond) risk. Investments in high yield debt securities (“junk bonds”) and other lower-rated securities will subject the Fund to substantial risk of loss. These securities are considered to be speculative with respect to the issuer’s ability to pay interest and principal when due, are more susceptible to default or decline in market value and are less liquid than investment grade debt securities. Prices of high yield debt securities tend to be very volatile. |
| ∎ | | Management risk. The Fund is actively managed and depends heavily on the Adviser’s judgment about markets, interest rates or the attractiveness, relative values, liquidity, or potential appreciation of particular investments made for the Fund’s portfolio. The Fund could experience losses if these judgments prove to be incorrect. Additionally, legislative, regulatory, or tax developments may adversely affect management of the Fund and, therefore, the ability of the Fund to achieve its investment objective. |
| ∎ | | Market risk. The market values of the Fund’s investments, and therefore the value of the Fund’s shares, will go up and down, sometimes rapidly or unpredictably. Market risk may affect a single issuer, industry or section of the economy, or it may affect the market as a whole. Individual stock prices tend to go up and down more dramatically than those of certain other types of investments, such as bonds. During a general downturn in the financial markets, multiple asset classes may decline in value. When markets perform well, there can be no assurance that specific investments held by the Fund will rise in value. |
| ∎ | | Non-diversification risk. The Fund is non-diversified and can invest a greater portion of its assets in the obligations or securities of a small number of issuers or any single issuer than a diversified fund can. A change in the value of one or a few issuers’ securities will therefore affect the value of the Fund more than if it was a diversified fund. |
| ∎ | | Short position risk. Because the Fund’s potential loss on a short position arises from increases in the value of the asset sold short, the Fund will incur a loss on |
continued on page 6
9 Invesco Emerging Markets Flexible Bond Fund
Consolidated Schedule of Investments
October 31, 2016
| | | | | | | | |
| | | Principal
Amount | | | Value | |
U.S. Dollar Denominated Bonds & Notes–56.55% | |
| Angola–1.00% | |
Republic of Angola Via Northern Lights III B.V., REGS, Sr. Sec. Euro Notes, 7.00%, 08/16/2019(a) | | $ | 675,000 | | | $ | 677,265 | |
|
| Argentina–4.89% | |
Banco Hipotecario S.A., REGS, Sr. Unsec. Euro Notes, 9.75%, 11/30/2020(a) | | | 861,000 | | | | 975,083 | |
Generación Mediterránea S.A./Generación Frías S.A./Central Térmica Roca S.A., REGS, Sr. Unsec. Gtd. Euro Notes, 9.63%, 07/27/2023(a) | | | 600,000 | | | | 642,900 | |
Provincia de Buenos Aires Sr. Unsec. Notes,
5.75%, 06/15/2019(a) | | | 520,000 | | | | 533,650 | |
7.88%, 06/15/2027(a) | | | 600,000 | | | | 618,000 | |
YPF S.A., REGS, Sr. Unsec. Euro Notes, 8.50%, 07/28/2025(a) | | | 500,000 | | | | 546,250 | |
| | | | | 3,315,883 | |
|
| Azerbaijan–1.17% | |
Southern Gas Corridor CJSC, Sr. Unsec. Government Gtd. Notes, 6.88%, 03/24/2026(a) | | | 700,000 | | | | 791,119 | |
|
| Bahrain–1.34% | |
Bahrain Government International Bond, Sr. Unsec. Bonds, 7.00%, 10/12/2028(a) | | | 880,000 | | | | 908,600 | |
|
| Brazil–10.86% | |
BRF GmbH, Sr. Unsec. Gtd. Notes, 4.35%, 09/29/2026(a) | | | 321,000 | | | | 312,173 | |
BTG Investments L.P., REGS, Sr. Unsec. Gtd. Euro Notes, 4.50%, 04/17/2018(a) | | | 1,050,000 | | | | 992,250 | |
Cosan Luxembourg S.A., Sr. Unsec. Gtd. Notes,
7.00%, 01/20/2027(a) | | | 495,000 | | | | 516,656 | |
Cosan Overseas Ltd., REGS, Sr. Unsec. Gtd. Euro Notes, 8.25%, 12/31/2049(a) | | | 700,000 | | | | 704,375 | |
Marfrig Holdings Europe B.V., Sr. Unsec. Gtd. Notes,
8.00%, 06/08/2023(a) | | | 900,000 | | | | 933,750 | |
Minerva Luxembourg S.A., Sr. Unsec. Gtd. Notes,
6.50%, 09/20/2026(a) | | | 1,006,000 | | | | 992,138 | |
Odebrecht Finance Ltd., REGS, Sr. Unsec. Gtd. Euro Notes, 5.25%, 06/27/2029(a) | | | 200,000 | | | | 98,000 | |
Petrobras Global Finance B.V., Sr. Unsec. Gtd. Global Notes, 8.75%, 05/23/2026 | | | 1,800,000 | | | | 2,031,750 | |
| | | | | | | | |
| | | Principal
Amount | | | Value | |
| Brazil–(continued) | |
Votorantim Cimentos S.A., REGS, Sr. Unsec. Gtd. Euro Notes, 7.25%, 04/05/2041(a) | | $ | 800,000 | | | $ | 782,000 | |
| | | | | | | | 7,363,092 | |
|
| Canada–0.51% | |
First Quantum Minerals Ltd., Sr. Unsec. Gtd. Notes,
7.25%, 10/15/2019(a) | | | 349,000 | | | | 345,946 | |
|
| Colombia–1.76% | |
Avianca Holdings S.A./ Avianca Leasing LLC/ Grupo Taca Holdings, REGS, Sr. Unsec. Gtd. Euro Notes,
8.38%, 05/10/2020(a) | | | 1,000,000 | | | | 990,000 | |
Banco de Bogotá S.A., Unsec. Sub. Notes, 6.25%, 05/12/2026(a) | | | 200,000 | | | | 206,489 | |
| | | | | 1,196,489 | |
|
| Costa Rica–1.54% | |
Banco Nacional de Costa Rica, REGS, Sr. Unsec. Euro Notes, 6.25%, 11/01/2023(a) | | | 1,000,000 | | | | 1,044,640 | |
|
| Dominican Republic–0.54% | |
Dominican Republic International Bond, Sr. Unsec. Notes, 6.88%, 01/29/2026(a) | | | 333,000 | | | | 369,630 | |
|
| Ecuador–1.25% | |
Ecuador Government International Bond, REGS, Sr. Unsec. Euro Bonds,
10.75%, 03/28/2022(a) | | | 800,000 | | | | 848,000 | |
|
| El Salvador–0.83% | |
AES El Salvador Trust II, REGS, Sr. Unsec. Gtd. Euro Notes, 6.75%, 03/28/2023(a) | | | 600,000 | | | | 565,500 | |
|
| Georgia–0.72% | |
BGEO Group JSC, Sr. Unsec. Bonds, 6.00%, 07/26/2023(a) | | | 475,000 | | | | 490,076 | |
|
| Ghana–1.20% | |
Ghana Government International Bond, REGS, Sr. Unsec. Euro Notes, 7.88%, 08/07/2023(a) | | | 850,000 | | | | 816,939 | |
|
| Honduras–1.65% | |
Honduras Government International Bond, REGS, Sr. Unsec. Euro Notes,
7.50%, 03/15/2024(a) | | | 1,000,000 | | | | 1,120,000 | |
See accompanying Notes to Consolidated Financial Statements which are an integral part of the financial statements.
10 Invesco Emerging Markets Flexible Bond Fund
| | | | | | | | |
| | | Principal
Amount | | | Value | |
| Hungary–1.13% | |
Hungary Government International Bond, Sr. Unsec. Global Notes,
7.63%, 03/29/2041 | | $ | 500,000 | | | $ | 763,875 | |
|
| India–2.30% | |
Delhi International Airport (Pvt.) Ltd., Sr. Sec. First Lien Bonds, 6.13%, 10/31/2026(a) | | | 1,000,000 | | | | 1,028,847 | |
Vedanta Resources PLC, REGS, Sr. Unsec. Euro Notes,
7.13%, 05/31/2023(a) | | | 550,000 | | | | 532,125 | |
| | | | | 1,560,972 | |
|
| Indonesia–0.65% | |
Listrindo Capital B.V., Sr. Unsec. Gtd. Notes,
4.95%, 09/14/2026(a) | | | 439,000 | | | | 444,262 | |
|
| Ivory Coast–0.62% | |
Ivory Coast Government International Bond, REGS, Sr. Unsec. Euro Notes,
6.38%, 03/03/2028(a) | | | 400,000 | | | | 418,850 | |
|
| Jamaica–1.19% | |
Digicel Group Ltd., REGS, Sr. Unsec. Euro Notes,
7.13%, 04/01/2022(a) | | | 300,000 | | | | 239,160 | |
Jamaica Government International Bond, Sr. Unsec. Global Notes,
6.75%, 04/28/2028 | | | 500,000 | | | | 566,250 | |
| | | | | | | | 805,410 | |
|
| Jordan–0.29% | |
Jordan Government International Bond, Sr. Unsec. Notes, 5.75%, 01/31/2027(a) | | | 200,000 | | | | 199,260 | |
|
| Kazakhstan–1.37% | |
Zhaikmunai LLP, REGS, Sr. Unsec. Gtd. Euro Notes,
6.38%, 02/14/2019(a) | | | 1,000,000 | | | | 930,000 | |
|
| Kenya–1.03% | |
Kenya Government International Bond, REGS, Sr. Unsec. Euro Notes, 6.88%, 06/24/2024(a) | | | 700,000 | | | | 700,875 | |
|
| Kuwait–0.40% | |
Equate Petrochemical B.V., Sr. Unsec. Gtd. Notes,
4.25%, 11/03/2026(a) | | | 270,000 | | | | 268,175 | |
|
| Mexico–2.95% | |
Petróleos Mexicanos, Sr. Unsec. Gtd. Global Bonds, 6.63%, 06/15/2035 | | | 800,000 | | | | 811,680 | |
SixSigma Networks México, S.A. de C.V., REGS, Sr. Unsec. Gtd. Euro Notes,
8.25%, 11/07/2021(a) | | | 500,000 | | | | 491,250 | |
| | | | | | | | |
| | | Principal
Amount | | | Value | |
| Mexico–(continued) | |
Unifin Financiera, S.A.B. de C.V., SOFOM, E.N.R., Sr. Unsec. Gtd. Bonds,
7.25%, 09/27/2023(a) | | $ | 700,000 | | | $ | 699,261 | |
| | | | | | | | 2,002,191 | |
|
| Netherlands–1.36% | |
GTH Finance B.V., Sr. Unsec. Gtd. Notes, 7.25%, 04/26/2023(a) | | | 857,000 | | | | 920,204 | |
|
| Pakistan–1.51% | |
Third Pakistan International Sukuk Co. Ltd. (The), Sr. Unsec. Bonds, 5.50%, 10/13/2021(a) | | | 1,000,000 | | | | 1,021,316 | |
|
| Paraguay–0.63% | |
Paraguay Government International Bond, Sr. Unsec. Bonds, 5.00%, 04/15/2026(a) | | | 400,000 | | | | 426,000 | |
|
| Peru–0.81% | |
Banco Internacional del Perú S.A.A. Interbank, REGS, Unsec. Sub. Euro Notes,
6.63%, 03/19/2029(a) | | | 500,000 | | | | 551,100 | |
|
| Russia–3.64% | |
Credit Bank of Moscow Via CBOM Finance PLC, Sr. Unsec. Notes, 5.88%, 11/07/2021(a) | | | 300,000 | | | | 300,000 | |
Evraz Group S.A., REGS, Sr. Unsec. Euro Bonds,
8.25%, 01/28/2021(a) | | | 600,000 | | | | 654,600 | |
Gazprom OAO Via Gaz Capital S.A., REGS, Sr. Unsec. Medium-Term Euro Notes,
8.63%, 04/28/2034(a) | | | 630,000 | | | | 811,066 | |
Polyus Gold International Ltd., Sr. Unsec. Gtd. Bonds,
4.70%, 03/28/2022(a) | | | 700,000 | | | | 700,000 | |
| | | | | | | | 2,465,666 | |
|
| South Africa–2.35% | |
Eskom Holdings SOC Ltd., REGS, Sr. Unsec. Euro Notes,
7.13%, 02/11/2025(a) | | | 550,000 | | | | 570,509 | |
MTN (Mauritius) Investments Ltd., Sr. Unsec. Gtd. Notes,
6.50%, 10/13/2026(a) | | | 1,006,000 | | | | 1,024,863 | |
| | | | | | | | 1,595,372 | |
|
| Sri Lanka–1.46% | |
Sri Lanka Government International Bond, Sr. Unsec. Bonds, 6.83%, 07/18/2026(a) | | | 938,000 | | | | 993,200 | |
|
| Turkey–0.74% | |
Export Credit Bank of Turkey, Sr. Unsec. Notes,
5.38%, 10/24/2023(a) | | | 500,000 | | | | 498,728 | |
See accompanying Notes to Consolidated Financial Statements which are an integral part of the financial statements.
11 Invesco Emerging Markets Flexible Bond Fund
| | | | | | | | |
| | | Principal
Amount | | | Value | |
| Ukraine–2.18% | |
MHP S.A., REGS, Sr. Unsec. Gtd. Euro Notes,
8.25%, 04/02/2020(a) | | $ | 1,500,000 | | | $ | 1,476,135 | |
|
| United Kingdom–0.68% | |
Tullow Oil PLC, REGS, Sr. Unsec. Gtd. Euro Notes,
6.25%, 04/15/2022(a) | | | 500,000 | | | | 461,250 | |
Total U.S. Dollar Denominated Bonds & Notes
(Cost $37,271,060) | | | | 38,356,020 | |
|
Non U.S. Dollar Denominated Bonds &
Notes–20.65%(b) | |
| Canada–1.04% | |
Province of British Columbia, Sr. Unsec. Bonds,
6.60%, 01/9/2020(a) | | INR | 47,000,000 | | | | 702,706 | |
|
| Hungary–6.32% | |
Hungary Government Bond, Unsec. Bonds,
5.50%, 06/24/2025 | | HUF | 1,000,000,000 | | | | 4,286,832 | |
|
| Indonesia–2.60% | |
Indonesia Treasury Bond, Sr. Unsec. Bonds,
9.50%, 07/15/2031 | | IDR | 20,000,000,000 | | | | 1,764,706 | |
|
| Mexico–7.64% | |
Mexican Bonos, Sr. Unsec. Bonds, 5.00%, 12/11/2019 | | MXN | 100,000,000 | | | | 5,180,860 | |
|
| Russia–3.05% | |
Russian Federal Bond — OFZ, Series 6214, Unsec. Bonds,
6.40%, 05/27/2020 | | RUB | 140,000,000 | | | | 2,067,719 | |
Total Non U.S. Dollar Denominated Bonds & Notes
(Cost $13,993,204) | | | | 14,002,823 | |
| | | | | | | | |
| | | Principal
Amount | | | Value | |
Credit-Linked Securities–5.49%(b) | | | | | |
| Standard Chartered Bank | | | | | | | | |
REGS, Sr. Unsec. Medium-Term Euro Notes (Credit-Linked to India Government Bonds,
7.80%, 05/03/2020), | | | | | | | | |
7.80%, 05/05/2020(a) | | INR | 33,600,000 | | | $ | 521,361 | |
REGS, Sr. Unsec. Medium-Term Euro Notes (Credit-Linked to India Government Bonds,
8.12%, 12/10/2020), | | | | | | | | |
8.12%, 12/14/2020(a) | | INR | 40,000,000 | | | | 630,105 | |
REGS, Sr. Unsec. Medium-Term Euro Notes (Credit-Linked to India Government Bonds,
8.28%, 09/21/2027), | | | | | | | | |
8.28%, 09/23/2027(a) | | INR | 58,000,000 | | | | 945,974 | |
Sr. Unsec. Medium-Term Euro Notes (Credit-Linked to India Government Bonds,
8.40%, 07/28/2024), | | | | | | | | |
8.40%, 07/30/2024(a) | | INR | 100,000,000 | | | | 1,623,757 | |
Total Credit-Linked Securities
(Cost $3,781,038) | | | | 3,721,197 | |
| | |
| | | Shares | | | | |
Money Market Funds–15.43% | |
Government & Agency Portfolio–Institutional Class, 0.29%(c) | | | 6,279,958 | | | | 6,279,958 | |
Treasury Portfolio–Institutional
Class, 0.22%(c) | | | 4,186,639 | | | | 4,186,639 | |
Total Money Market Funds
(Cost $10,466,597) | | | | 10,466,597 | |
TOTAL INVESTMENTS–98.12%
(Cost $65,511,899) | | | | 66,546,637 | |
OTHER ASSETS LESS LIABILITIES–1.88% | | | | 1,278,249 | |
NET ASSETS–100.00% | | | $ | 67,824,886 | |
Investment Abbreviations:
| | |
| Gtd. | | – Guaranteed |
| HUF | | – Hungary Forint |
| IDR | | – Indonesian Rupiah |
| INR | | – Indian Rupee |
| | |
| MXN | | – Mexican Peso |
| REGS | | – Regulation S |
| RUB | | – Russian Ruble |
| Sec. | | – Secured |
| | |
| Sr. | | – Senior |
| Sub. | | – Subordinated |
| Unsec. | | – Unsecured |
Notes to Consolidated Schedule of Investments:
| (a) | Security purchased or received in a transaction exempt from registration under the Securities Act of 1933, as amended (the “1933 Act”). The security may be resold pursuant to an exemption from registration under the 1933 Act, typically to qualified institutional buyers. The aggregate value of these securities at October 31, 2016 was $38,606,368, which represented 56.92% of the Fund’s Net Assets. |
| (b) | Foreign denominated security. Principal amount is denominated in the currency indicated. |
| (c) | The money market fund and the Fund are affiliated by having the same investment adviser. The rate shown is the 7-day SEC standardized yield as of October 31, 2016. |
See accompanying Notes to Consolidated Financial Statements which are an integral part of the financial statements.
12 Invesco Emerging Markets Flexible Bond Fund
Consolidated Statement of Assets and Liabilities
October 31, 2016
| | | | |
Assets: | |
Investments, at value (Cost $55,045,302) | | $ | 56,080,040 | |
Investments in affiliated money market funds, at value and cost | | | 10,466,597 | |
Total investments, at value (Cost $65,511,899) | | | 66,546,637 | |
Cash | | | 262,749 | |
Receivable for: | | | | |
Deposits with brokers | | | 426,768 | |
Investments sold | | | 2,473,881 | |
Variation margin — futures | | | 35,739 | |
Variation margin — centrally cleared swap agreements | | | 3,476 | |
Fund shares sold | | | 32,166 | |
Dividends and interest | | | 920,970 | |
Fund expenses absorbed | | | 23,870 | |
Swaps receivables | | | 3,472 | |
Premiums paid on swap agreements | | | 1,032,376 | |
Investment for trustee deferred compensation and retirement plans | | | 24,025 | |
Unrealized appreciation on forward foreign currency contracts outstanding | | | 1,245,550 | |
Other assets | | | 28,583 | |
Total assets | | | 73,060,262 | |
|
Liabilities: | |
Payable for: | | | | |
Investments purchased | | | 3,112,295 | |
Fund shares reacquired | | | 21,770 | |
Amount due custodian — foreign currency (cost $96,076) | | | 94,604 | |
Swaps payable | | | 12,367 | |
Accrued fees to affiliates | | | 7,767 | |
Accrued trustees’ and officers’ fees and benefits | | | 1,789 | |
Accrued other operating expenses | | | 66,031 | |
Trustee deferred compensation and retirement plans | | | 25,151 | |
Unrealized depreciation on forward foreign currency contracts outstanding | | | 1,479,821 | |
Unrealized depreciation on swap agreements — OTC | | | 413,781 | |
Total liabilities | | | 5,235,376 | |
Net assets applicable to shares outstanding | | $ | 67,824,886 | |
|
Net assets consist of: | |
Shares of beneficial interest | | $ | 69,318,856 | |
Undistributed net investment income | | | 9,583 | |
Undistributed net realized gain (loss) | | | (1,993,790 | ) |
Net unrealized appreciation | | | 490,237 | |
| | | $ | 67,824,886 | |
| | | | |
Net Assets: | |
Class A | | $ | 5,181,649 | |
Class B | | $ | 121,239 | |
Class C | | $ | 1,195,011 | |
Class R | | $ | 264,422 | |
Class Y | | $ | 354,133 | |
Class R5 | | $ | 6,678 | |
Class R6 | | $ | 60,701,754 | |
|
Shares outstanding, $0.01 par value per share,
with an unlimited number of shares authorized: | |
Class A | | | 792,980 | |
Class B | | | 18,563 | |
Class C | | | 182,780 | |
Class R | | | 40,517 | |
Class Y | | | 54,208 | |
Class R5 | | | 1,023 | |
Class R6 | | | 9,299,165 | |
Class A: | | | | |
Net asset value per share | | $ | 6.53 | |
Maximum offering price per share | | | | |
(Net asset value of $6.53 ¸ 95.75%) | | $ | 6.82 | |
Class B: | | | | |
Net asset value and offering price per share | | $ | 6.53 | |
Class C: | | | | |
Net asset value and offering price per share | | $ | 6.54 | |
Class R: | | | | |
Net asset value and offering price per share | | $ | 6.53 | |
Class Y: | | | | |
Net asset value and offering price per share | | $ | 6.53 | |
Class R5: | | | | |
Net asset value and offering price per share | | $ | 6.53 | |
Class R6: | | | | |
Net asset value and offering price per share | | $ | 6.53 | |
See accompanying Notes to Consolidated Financial Statements which are an integral part of the financial statements.
13 Invesco Emerging Markets Flexible Bond Fund
Consolidated Statement of Operations
For the year ended October 31, 2016
| | | | |
Investment income: | | | | |
Interest (net of foreign withholding taxes of $71,807) | | $ | 3,268,980 | |
Dividends from affiliated money market funds | | | 25,674 | |
Total investment income | | | 3,294,654 | |
| |
Expenses: | | | | |
Advisory fees | | | 458,292 | |
Administrative services fees | | | 50,000 | |
Custodian fees | | | 47,172 | |
Distribution fees: | | | | |
Class A | | | 13,865 | |
Class B | | | 2,003 | |
Class C | | | 11,535 | |
Class R | | | 1,453 | |
Transfer agent fees — A, B, C, R, and Y | | | 28,459 | |
Transfer agent fees — R6 | | | 185 | |
Trustees’ and officers’ fees and benefits | | | 19,971 | |
Registration and filing fees | | | 86,323 | |
Reports to shareholders | | | 22,937 | |
Professional services fees | | | 61,239 | |
Other | | | 39,054 | |
Total expenses | | | 842,488 | |
Less: Fees waived, expenses reimbursed and expense offset arrangement(s) | | | (217,524 | ) |
Net expenses | | | 624,964 | |
Net investment income | | | 2,669,690 | |
| |
Realized and unrealized gain (loss) from: | | | | |
Net realized gain (loss) from: | | | | |
Investment securities | | | (8,760,828 | ) |
Foreign currencies | | | (475,018 | ) |
Forward foreign currency contracts | | | (2,290,836 | ) |
Futures contracts | | | (117,318 | ) |
Option contracts written | | | 27,625 | |
Swap agreements | | | (496,302 | ) |
| | | | (12,112,677 | ) |
Change in net unrealized appreciation (depreciation) of: | | | | |
Investment securities | | | 11,522,957 | |
Foreign currencies | | | 23,834 | |
Forward foreign currency contracts | | | (296,786 | ) |
Futures contracts | | | 127,328 | |
Swap agreements | | | (437,044 | ) |
| | | | 10,940,289 | |
Net realized and unrealized gain (loss) | | | (1,172,388 | ) |
Net increase in net assets resulting from operations | | $ | 1,497,302 | |
See accompanying Notes to Consolidated Financial Statements which are an integral part of the financial statements.
14 Invesco Emerging Markets Flexible Bond Fund
Consolidated Statement of Changes in Net Assets
For the years ended October 31, 2016 and 2015
| | | | | | | | |
| | | 2016 | | | 2015 | |
Operations: | | | | | | | | |
Net investment income | | $ | 2,669,690 | | | $ | 2,788,125 | |
Net realized gain (loss) | | | (12,112,677 | ) | | | (4,854,316 | ) |
Change in net unrealized appreciation (depreciation) | | | 10,940,289 | | | | (6,674,360 | ) |
Net increase (decrease) in net assets resulting from operations | | | 1,497,302 | | | | (8,740,551 | ) |
| | |
Return of capital: | | | | | | | | |
Class A | | | (225,952 | ) | | | (368,524 | ) |
Class B | | | (6,797 | ) | | | (14,244 | ) |
Class C | | | (37,979 | ) | | | (68,983 | ) |
Class R | | | (10,957 | ) | | | (19,363 | ) |
Class Y | | | (12,799 | ) | | | (39,924 | ) |
Class R5 | | | (284 | ) | | | (2,106 | ) |
Class R6 | | | (2,118,421 | ) | | | (2,025,139 | ) |
Total return of capital | | | (2,413,189 | ) | | | (2,538,283 | ) |
| | |
Share transactions–net: | | | | | | | | |
Class A | | | (865,850 | ) | | | (1,355,045 | ) |
Class B | | | (161,303 | ) | | | 26,014 | |
Class C | | | (141,744 | ) | | | (469,716 | ) |
Class R | | | (82,056 | ) | | | (2,139 | ) |
Class Y | | | 59,060 | | | | (2,338,926 | ) |
Class R5 | | | — | | | | (163,230 | ) |
Class R6 | | | 23,922,971 | | | | 6,445,058 | |
Net increase in net assets resulting from share transactions | | | 22,731,078 | | | | 2,142,016 | |
Net increase (decrease) in net assets | | | 21,815,191 | | | | (9,136,818 | ) |
| | |
Net assets: | | | | | | | | |
Beginning of year | | | 46,009,695 | | | | 55,146,513 | |
End of year (includes undistributed net investment income of $9,583 and $(261,153), respectively) | | $ | 67,824,886 | | | $ | 46,009,695 | |
Notes to Consolidated Financial Statements
October 31, 2016
NOTE 1—Significant Accounting Policies
Invesco Emerging Markets Flexible Bond Fund (the “Fund”), formerly Invesco Emerging Market Local Currency Debt Fund, is a series portfolio of AIM Investment Funds (Invesco Investment Funds) (the “Trust”). The Trust is organized as a Delaware statutory trust and is registered under the Investment Company Act of 1940, as amended (the “1940 Act”), as an open-end series management investment company consisting of twenty-two separate series portfolios, each authorized to issue an unlimited number of shares of beneficial interest. The assets, liabilities and operations of each portfolio are accounted for separately. Information presented in these consolidated financial statements pertains only to the Fund. Matters affecting each portfolio or class will be voted on exclusively by the shareholders of such portfolio or class.
The Fund will seek to gain exposure to the commodity markets primarily through investments in the Invesco Emerging Markets Flexible Bond Cayman Ltd. (the “Subsidiary”), a wholly-owned subsidiary of the Fund organized under the laws of the Cayman Islands. The Subsidiary was organized by the Fund to invest in commodity-linked derivatives. The Fund may invest up to 25% of its total assets in the Subsidiary.
The Fund’s investment objective is total return through growth of capital and current income.
The Fund currently consists of seven different classes of shares: Class A, Class B, Class C, Class R, Class Y, Class R5 and Class R6. Class Y shares are available only to certain investors. Class A shares are sold with a front-end sales charge unless certain waiver criteria are met and under certain circumstances load waived shares may be subject to contingent deferred sales charges (“CDSC”). Class C shares are sold with a CDSC. Class R, Class Y, Class R5 and Class R6 shares are sold at net asset value. Effective November 30, 2010, new or additional investments in Class B shares are no longer permitted. Existing shareholders of Class B shares may continue to reinvest dividends and capital gains distributions in Class B shares until they convert to Class A shares. Also, shareholders in Class B shares will be able to exchange those shares for Class B shares of other Invesco Funds offering such shares until they convert to Class A shares. Generally, Class B shares will automatically convert to Class A shares on or about the month-end, which is at least eight years after the date of purchase. Redemption of Class B shares prior to the conversion date will be subject to a CDSC.
The following is a summary of the significant accounting policies followed by the Fund in the preparation of its consolidated financial statements.
15 Invesco Emerging Markets Flexible Bond Fund
| A. | Security Valuations — Securities, including restricted securities, are valued according to the following policy. |
Debt obligations (including convertible securities) and unlisted equities are fair valued using an evaluated quote provided by an independent pricing service. Evaluated quotes provided by the pricing service may be determined without exclusive reliance on quoted prices, and may reflect appropriate factors such as institution-size trading in similar groups of securities, developments related to specific securities, dividend rate (for unlisted equities), yield (for debt obligations), quality, type of issue, coupon rate (for debt obligations), maturity (for debt obligations), individual trading characteristics and other market data. Debt obligations are subject to interest rate and credit risks. In addition, all debt obligations involve some risk of default with respect to interest and/or principal payments.
A security listed or traded on an exchange (except convertible securities) is valued at its last sales price or official closing price as of the close of the customary trading session on the exchange where the security is principally traded, or lacking any sales or official closing price on a particular day, the security may be valued at the closing bid price on that day. Securities traded in the over-the-counter market are valued based on prices furnished by independent pricing services or market makers. When such securities are valued by an independent pricing service they may be considered fair valued. Futures contracts are valued at the final settlement price set by an exchange on which they are principally traded. Listed options are valued at the mean between the last bid and asked prices from the exchange on which they are principally traded. Options not listed on an exchange are valued by an independent source at the mean between the last bid and asked prices. For purposes of determining net asset value (“NAV”) per share, futures and option contracts generally are valued 15 minutes after the close of the customary trading session of the New York Stock Exchange (“NYSE”).
Investments in open-end and closed-end registered investment companies that do not trade on an exchange are valued at the end-of-day net asset value per share. Investments in open-end and closed-end registered investment companies that trade on an exchange are valued at the last sales price or official closing price as of the close of the customary trading session on the exchange where the security is principally traded.
Swap agreements are fair valued using an evaluated quote, if available, provided by an independent pricing service. Evaluated quotes provided by the pricing service are valued based on a model which may include end-of-day net present values, spreads, ratings, industry, company performance and returns of referenced assets.
Foreign securities’ (including foreign exchange contracts) prices are converted into U.S. dollar amounts using the applicable exchange rates as of the close of the NYSE. If market quotations are available and reliable for foreign exchange-traded equity securities, the securities will be valued at the market quotations. Because trading hours for certain foreign securities end before the close of the NYSE, closing market quotations may become unreliable. If between the time trading ends on a particular security and the close of the customary trading session on the NYSE, events occur that the Adviser determines are significant and make the closing price unreliable, the Fund may fair value the security. If the event is likely to have affected the closing price of the security, the security will be valued at fair value in good faith using procedures approved by the Board of Trustees. Adjustments to closing prices to reflect fair value may also be based on a screening process of an independent pricing service to indicate the degree of certainty, based on historical data, that the closing price in the principal market where a foreign security trades is not the current value as of the close of the NYSE. Foreign securities’ prices meeting the approved degree of certainty that the price is not reflective of current value will be priced at the indication of fair value from the independent pricing service. Multiple factors may be considered by the independent pricing service in determining adjustments to reflect fair value and may include information relating to sector indices, American Depositary Receipts and domestic and foreign index futures. Foreign securities may have additional risks including exchange rate changes, potential for sharply devalued currencies and high inflation, political and economic upheaval, the relative lack of issuer information, relatively low market liquidity and the potential lack of strict financial and accounting controls and standards.
Securities for which market prices are not provided by any of the above methods may be valued based upon quotes furnished by independent sources. The last bid price may be used to value equity securities. The mean between the last bid and asked prices is used to value debt obligations, including corporate loans.
Securities for which market quotations are not readily available or became unreliable are valued at fair value as determined in good faith by or under the supervision of the Trust’s officers following procedures approved by the Board of Trustees. Issuer specific events, market trends, bid/asked quotes of brokers and information providers and other market data may be reviewed in the course of making a good faith determination of a security’s fair value.
The Fund may invest in securities that are subject to interest rate risk, meaning the risk that the prices will generally fall as interest rates rise and, conversely, the prices will generally rise as interest rates fall. Specific securities differ in their sensitivity to changes in interest rates depending on their individual characteristics. Changes in interest rates may result in increased market volatility, which may affect the value and/or liquidity of certain Fund investments.
Valuations change in response to many factors including the historical and prospective earnings of the issuer, the value of the issuer’s assets, general economic conditions, interest rates, investor perceptions and market liquidity. Because of the inherent uncertainties of valuation, the values reflected in the consolidated financial statements may materially differ from the value received upon actual sale of those investments.
| B. | Securities Transactions and Investment Income — Securities transactions are accounted for on a trade date basis. Realized gains or losses on sales are computed on the basis of specific identification of the securities sold. Interest income (net of withholding tax, if any) is recorded on the accrual basis from settlement date. Dividend income (net of withholding tax, if any) is recorded on the ex-dividend date. Bond premiums and discounts are amortized and/or accreted for financial reporting purposes. |
The Fund may periodically participate in litigation related to Fund investments. As such, the Fund may receive proceeds from litigation settlements. Any proceeds received are included in the Consolidated Statement of Operations as realized gain (loss) for investments no longer held and as unrealized gain (loss) for investments still held.
Brokerage commissions and mark ups are considered transaction costs and are recorded as an increase to the cost basis of securities purchased and/or a reduction of proceeds on a sale of securities. Such transaction costs are included in the determination of net realized and unrealized gain (loss) from investment securities reported in the Consolidated Statement of Operations and the Consolidated Statement of Changes in Net Assets and the net realized and unrealized gains (losses) on securities per share in the Financial Highlights. Transaction costs are included in the calculation of the Fund’s net asset value and, accordingly, they reduce the Fund’s total returns. These transaction costs are not considered operating expenses and are not reflected in net investment income reported in the Consolidated Statement of Operations and the Consolidated Statement of Changes in Net Assets, or the net investment income per share and the ratios of expenses and net investment income reported in the Financial Highlights, nor are they limited by any expense limitation arrangements between the Fund and the investment adviser.
16 Invesco Emerging Markets Flexible Bond Fund
The Fund allocates income and realized and unrealized capital gains and losses to a class based on the relative net assets of each class.
| C. | Country Determination — For the purposes of making investment selection decisions and presentation in the Consolidated Schedule of Investments, the investment adviser may determine the country in which an issuer is located and/or credit risk exposure based on various factors. These factors include the laws of the country under which the issuer is organized, where the issuer maintains a principal office, the country in which the issuer derives 50% or more of its total revenues and the country that has the primary market for the issuer’s securities, as well as other criteria. Among the other criteria that may be evaluated for making this determination are the country in which the issuer maintains 50% or more of its assets, the type of security, financial guarantees and enhancements, the nature of the collateral and the sponsor organization. Country of issuer and/or credit risk exposure has been determined to be the United States of America, unless otherwise noted. |
| D. | Distributions — Distributions from net investment income, if any, are declared and paid quarterly and are recorded on the ex-dividend date. Distributions from net realized capital gain, if any, are generally declared and paid annually and recorded on the ex-dividend date. |
| E. | Federal Income Taxes — The Fund intends to comply with the requirements of Subchapter M of the Internal Revenue Code of 1986, as amended (the “Internal Revenue Code”), necessary to qualify as a regulated investment company and to distribute substantially all of the Fund’s taxable earnings to shareholders. As such, the Fund will not be subject to federal income taxes on otherwise taxable income (including net realized capital gain) that is distributed to shareholders. Therefore, no provision for federal income taxes is recorded in the consolidated financial statements. |
The Fund recognizes the tax benefits of uncertain tax positions only when the position is more likely than not to be sustained. Management has analyzed the Fund’s uncertain tax positions and concluded that no liability for unrecognized tax benefits should be recorded related to uncertain tax positions. Management is not aware of any tax positions for which it is reasonably possible that the total amounts of unrecognized tax benefits will change materially in the next 12 months.
The Subsidiary is classified as a controlled foreign corporation under Subchapter N of the Internal Revenue Code. Therefore, the Fund is required to increase its taxable income by its share of the Subsidiary’s income. Net investment losses of the Subsidiary cannot be deducted by the Fund in the current period nor carried forward to offset taxable income in future periods.
The Fund files tax returns in the U.S. Federal jurisdiction and certain other jurisdictions. Generally the Fund is subject to examinations by such taxing authorities for up to three years after the filing of the return for the tax period.
| F. | Expenses — Fees provided for under the Rule 12b-1 plan of a particular class of the Fund are charged to the operations of such class. Transfer agency fees and expenses and other shareholder recordkeeping fees and expenses attributable to Class R5 and Class R6 are allocated to each share class based on relative net assets. Sub-accounting fees attributable to Class R5 are charged to the operations of the class. Transfer agency fees and expenses and other shareholder recordkeeping fees and expenses relating to all other classes are allocated among those classes based on relative net assets. All other expenses are allocated among the classes based on relative net assets. |
| G. | Accounting Estimates — The financial statements are prepared on a consolidated basis in conformity with accounting principles generally accepted in the United States of America (“GAAP”), which requires management to make estimates and assumptions that affect the reported amounts of assets and liabilities at the date of the financial statements and the reported amounts of revenues and expenses during the reporting period including estimates and assumptions related to taxation. Actual results could differ from those estimates by a significant amount. The accompanying financial statements reflect the financial position of the Fund and its Subsidiary and the results of operations on a consolidated basis. All inter-company accounts and transactions have been eliminated in consolidation. |
In addition, the Fund monitors for material events or transactions that may occur or become known after the period-end date and before the date the consolidated financial statements are released to print.
| H. | Indemnifications — Under the Trust’s organizational documents, each Trustee, officer, employee or other agent of the Trust, and under the Subsidiary’s organizational documents, the directors and officers of the Subsidiary, are indemnified against certain liabilities that may arise out of the performance of their duties to the Fund and/or the Subsidiary, respectively. Additionally, in the normal course of business, the Fund enters into contracts, including the Fund’s servicing agreements, that contain a variety of indemnification clauses. The Fund’s maximum exposure under these arrangements is unknown as this would involve future claims that may be made against the Fund that have not yet occurred. The risk of material loss as a result of such indemnification claims is considered remote. |
| I. | Structured Securities — The Fund may invest in structured securities. Structured securities are a type of derivative security whose value is determined by reference to changes in the value of underlying securities, currencies, interest rates, commodities, indices or other financial indicators (“reference instruments”). Most structured securities are fixed-income securities that have maturities of three years or less. Structured securities may be positively or negatively indexed (i.e., their principal value or interest rates may increase or decrease if the underlying reference instrument appreciates) and may have return characteristics similar to direct investments in the underlying reference instrument. |
Structured securities may entail a greater degree of market risk than other types of debt securities because the investor bears the risk of the reference instruments. In addition to the credit risk of structured securities and the normal risks of price changes in response to changes in interest rates, the principal amount of structured notes or indexed securities may decrease as a result of changes in the value of the underlying reference instruments. Changes in the daily value of structured securities are recorded as unrealized gains (losses) in the Consolidated Statement of Operations. When the structured securities mature or are sold, the Fund recognizes a realized gain (loss) on the Consolidated Statement of Operations.
| J. | Foreign Currency Translations — Foreign currency is valued at the close of the NYSE based on quotations posted by banks and major currency dealers. Portfolio securities and other assets and liabilities denominated in foreign currencies are translated into U.S. dollar amounts at date of valuation. Purchases and sales of portfolio securities (net of foreign taxes withheld on disposition) and income items denominated in foreign currencies are translated into U.S. dollar amounts on the respective dates of such transactions. The Fund does not separately account for the portion of the results of operations resulting from changes in foreign exchange rates on investments and the fluctuations arising from changes in market prices of securities held. The combined results of changes in foreign exchange rates and the fluctuation of market prices on investments (net of estimated foreign tax withholding) are included with the net realized and unrealized gain or loss from investments in the Consolidated Statement of Operations. Reported net realized foreign currency gains or losses arise from (1) sales of foreign currencies, (2) currency gains or losses realized between the trade and settlement dates on securities transactions, and (3) the difference between the amounts of dividends, interest, and foreign withholding taxes recorded on the Fund’s books and the U.S. dollar equivalent of the amounts actually received or paid. Net unrealized foreign currency gains and losses arise from changes in the fair values of assets and liabilities, other than investments in securities at fiscal period end, resulting from changes in exchange rates. |
17 Invesco Emerging Markets Flexible Bond Fund
The Fund may invest in foreign securities, which may be subject to foreign taxes on income, gains on investments or currency repatriation, a portion of which may be recoverable. Foreign taxes, if any, are recorded based on the tax regulations and rates that exist in the foreign markets in which the Fund invests and are shown in the Consolidated Statement of Operations.
| K. | Forward Foreign Currency Contracts — The Fund may engage in foreign currency transactions either on a spot (i.e. for prompt delivery and settlement) basis, or through forward foreign currency contracts, to manage or minimize currency or exchange rate risk. |
The Fund may also enter into forward foreign currency contracts for the purchase or sale of a security denominated in a foreign currency in order to “lock in” the U.S. dollar price of that security, or the Fund may also enter into forward foreign currency contracts that do not provide for physical settlement of the two currencies, but instead are settled by a single cash payment calculated as the difference between the agreed upon exchange rate and the spot rate at settlement based upon an agreed upon notional amount (non-deliverable forwards). The Fund will set aside liquid assets in an amount equal to the daily mark-to-market obligation for forward foreign currency contracts.
A forward foreign currency contract is an obligation between two parties (“Counterparties”) to purchase or sell a specific currency for an agreed-upon price at a future date. The use of forward foreign currency contracts does not eliminate fluctuations in the price of the underlying securities the Fund owns or intends to acquire but establishes a rate of exchange in advance. Fluctuations in the value of these contracts are measured by the difference in the contract date and reporting date exchange rates and are recorded as unrealized appreciation (depreciation) until the contracts are closed. When the contracts are closed, realized gains (losses) are recorded. Realized and unrealized gains (losses) on the contracts are included in the Consolidated Statement of Operations. The primary risks associated with forward foreign currency contracts include failure of the Counterparty to meet the terms of the contract and the value of the foreign currency changing unfavorably. These risks may be in excess of the amounts reflected in the Consolidated Statement of Assets and Liabilities.
| L. | Futures Contracts — The Fund may enter into futures contracts to manage exposure to interest rate, equity and market price movements and/or currency risks. A futures contract is an agreement between Counterparties to purchase or sell a specified underlying security, currency or commodity (or delivery of a cash settlement price, in the case of an index future) for a fixed price at a future date. The Fund currently invests only in exchange-traded futures and they are standardized as to maturity date and underlying financial instrument. Initial margin deposits required upon entering into futures contracts are satisfied by the segregation of specific securities or cash as collateral at the futures commission merchant (broker). During the period the futures contracts are open, changes in the value of the contracts are recognized as unrealized gains or losses by recalculating the value of the contracts on a daily basis. Subsequent or variation margin payments are received or made depending upon whether unrealized gains or losses are incurred. These amounts are reflected as receivables or payables on the Consolidated Statement of Assets and Liabilities. When the contracts are closed or expire, the Fund recognizes a realized gain or loss equal to the difference between the proceeds from, or cost of, the closing transaction and the Fund’s basis in the contract. The net realized gain (loss) and the change in unrealized gain (loss) on futures contracts held during the period is included on the Consolidated Statement of Operations. The primary risks associated with futures contracts are market risk and the absence of a liquid secondary market. If the Fund were unable to liquidate a futures contract and/or enter into an offsetting closing transaction, the Fund would continue to be subject to market risk with respect to the value of the contracts and continue to be required to maintain the margin deposits on the futures contracts. Futures contracts have minimal Counterparty risk since the exchange’s clearinghouse, as Counterparty to all exchange-traded futures, guarantees the futures against default. Risks may exceed amounts recognized in the Consolidated Statement of Assets and Liabilities. |
| M. | Call Options Written — The Fund may write call options. A covered call option gives the purchaser of such option the right to buy, and the writer (the Fund) the obligation to sell, the underlying security or foreign currency at the stated exercise price during the option period. An uncovered call option exists without the ownership of the underlying security. Written call options are recorded as a liability in the Consolidated Statement of Assets and Liabilities. The amount of the liability is subsequently “marked-to-market” to reflect the current market value of the option written. If a written covered call option expires on the stipulated expiration date, or if the Fund enters into a closing purchase transaction, the Fund realizes a gain (or a loss if the closing purchase transaction exceeds the premium received when the option was written) without regard to any unrealized gain or loss on the underlying security, and the liability related to such option is extinguished. If a written covered call option is exercised, the Fund realizes a gain or a loss from the sale of the underlying security and the proceeds of the sale are increased by the premium originally received. Realized gains and losses on these contracts are included in the Consolidated Statement of Operations. A risk in writing a covered call option is that the Fund gives up the opportunity for profit if the market price of the security increases and the option is exercised. The risk in writing an uncovered call option is that the Fund may incur significant losses if the value of the written security exceeds the exercise price of the option. |
| N. | Put Options Purchased and Written — The Fund may purchase and write put options including options on securities indexes, or foreign currency and/or futures contracts. By purchasing a put option, the Fund obtains the right (but not the obligation) to sell the option’s underlying instrument at a fixed strike price. In return for this right, the Fund pays an option premium. The option’s underlying instrument may be a security, securities index, or a futures contract. Put options may be used by the Fund to hedge securities it owns by locking in a minimum price at which the Fund can sell. If security prices fall, the put option could be exercised to offset all or a portion of the Fund’s resulting losses. At the same time, because the maximum the Fund has at risk is the cost of the option, purchasing put options does not eliminate the potential for the Fund to profit from an increase in the value of the underlying portfolio securities. The Fund may write put options to earn additional income in the form of option premiums if it expects the price of the underlying instrument to remain stable or rise during the option period so that the option will not be exercised. The risk in this strategy is that the price of the underlying securities may decline by an amount greater than the premium received. Put options written are reported as a liability in the Consolidated Statement of Assets and Liabilities. Realized and unrealized gains and losses on put options purchased and put options written are included in the Consolidated Statement of Operations as Net realized gain (loss) from and Change in net unrealized appreciation (depreciation) of Investment securities and Option contracts written, respectively. A risk in buying an option is that the Fund pays a premium whether or not the option is exercised. In addition, there can be no assurance that a liquid secondary market will exist for any option purchased. |
| O. | Swap Agreements — The Fund may enter into various swap transactions, including interest rate, total return, index, currency and credit default swap contracts (“CDS”) for investment purposes or to manage interest rate, currency or credit risk. Such transactions are agreements between Counterparties. A swap agreement may be negotiated bilaterally and traded over-the-counter (“OTC”) between two parties (“uncleared/OTC”) or, in some instances, must be transacted through a future commission merchant (“FCM”) and cleared through a clearinghouse that serves as a central Counterparty (“centrally cleared swap”). These agreements may contain among other conditions, events of default and termination events, and various covenants and representations such as provisions that require the Fund to maintain a pre-determined level of net assets, and/or provide limits |
18 Invesco Emerging Markets Flexible Bond Fund
| | regarding the decline of the Fund’s NAV over specific periods of time. If the Fund were to trigger such provisions and have open derivative positions at that time, the Counterparty may be able to terminate such agreement and request immediate payment in an amount equal to the net liability positions, if any. |
Interest rate, total return, index, and currency swap agreements are two-party contracts entered into primarily to exchange the returns (or differentials in rates of returns) earned or realized on particular predetermined investments or instruments. The gross returns to be exchanged or “swapped” between the parties are calculated with respect to a notional amount, i.e., the return on or increase in value of a particular dollar amount invested at a particular interest rate or return of an underlying asset, in a particular foreign currency, or in a “basket” of securities representing a particular index.
In a centrally cleared swap, the Fund’s ultimate Counterparty is a central clearinghouse. The Fund initially will enter into centrally cleared swaps through an executing broker. When a fund enters into a centrally cleared swap, it must deliver to the central Counterparty (via the FCM) an amount referred to as “initial margin.” Initial margin requirements are determined by the central Counterparty, but an FCM may require additional initial margin above the amount required by the central Counterparty. Initial margin deposits required upon entering into centrally cleared swaps are satisfied by cash or securities as collateral at the FCM. Securities deposited as initial margin are designated on the Schedule of Investments and cash deposited is recorded on the Consolidated Statement of Assets and Liabilities. During the term of a cleared swap agreement, a “variation margin” amount may be required to be paid by the Fund or may be received by the Fund, based on the daily change in price of the underlying reference instrument subject to the swap agreement and is recorded as a receivable or payable for variation margin in the Consolidated Statement of Assets and Liabilities until the centrally cleared swap is terminated at which time a realized gain or loss is recorded.
A CDS is an agreement between Counterparties to exchange the credit risk of an issuer. A buyer of a CDS is said to buy protection by paying a fixed payment over the life of the agreement and in some situations an upfront payment to the seller of the CDS. If a defined credit event occurs (such as payment default or bankruptcy), the Fund as a protection buyer would cease paying its fixed payment, the Fund would deliver eligible bonds issued by the reference entity to the seller, and the seller would pay the full notional value, or the “par value”, of the referenced obligation to the Fund. A seller of a CDS is said to sell protection and thus would receive a fixed payment over the life of the agreement and an upfront payment, if applicable. If a credit event occurs, the Fund as a protection seller would cease to receive the fixed payment stream, the Fund would pay the buyer “par value” or the full notional value of the referenced obligation, and the Fund would receive the eligible bonds issued by the reference entity. In turn, these bonds may be sold in order to realize a recovery value. Alternatively, the seller of the CDS and its Counterparty may agree to net the notional amount and the market value of the bonds and make a cash payment equal to the difference to the buyer of protection. If no credit event occurs, the Fund receives the fixed payment over the life of the agreement. As the seller, the Fund would effectively add leverage to its portfolio because, in addition to its total net assets, the Fund would be subject to investment exposure on the notional amount of the CDS. In connection with these agreements, cash and securities may be identified as collateral in accordance with the terms of the respective swap agreements to provide assets of value and recourse in the event of default under the swap agreement or bankruptcy/insolvency of a party to the swap agreement. If a Counterparty becomes bankrupt or otherwise fails to perform its obligations due to financial difficulties, the Fund may experience significant delays in obtaining any recovery in a bankruptcy or other reorganization proceeding. The Fund may obtain only limited recovery or may obtain no recovery in such circumstances. The Fund’s maximum risk of loss from Counterparty risk, either as the protection seller or as the protection buyer, is the value of the contract. The risk may be mitigated by having a master netting arrangement between the Fund and the Counterparty and by the designation of collateral by the Counterparty to cover the Fund’s exposure to the Counterparty.
Implied credit spreads represent the current level at which protection could be bought or sold given the terms of the existing CDS contract and serve as an indicator of the current status of the payment/performance risk of the CDS. An implied spread that has widened or increased since entry into the initial contract may indicate a deteriorating credit profile and increased risk of default for the reference entity. A declining or narrowing spread may indicate an improving credit profile or decreased risk of default for the reference entity. Alternatively, credit spreads may increase or decrease reflecting the general tolerance for risk in the credit markets.
An interest rate swap is an agreement between Counterparties pursuant to which the parties exchange a floating rate payment for a fixed rate payment based on a specified notional amount.
A total return swap is an agreement in which one party makes payments based on a set rate, either fixed or variable, while the other party makes payments based on the return of an underlying asset, which includes both the income generated and capital gains, if any. The unrealized appreciation (depreciation) on total return swaps includes dividends on the underlying securities and financing rate payable from the Counterparty. At the maturity date, a net cash flow is exchanged where the total return is equivalent to the return of the underlying reference less a financing rate, if any. As a receiver, the Fund would receive payments based on any positive total return and would owe payments in the event of a negative total return. As the payer, the Fund would owe payments on any net positive total return, and would receive payment in the event of a negative total return.
Changes in the value of centrally cleared and OTC swap agreements are recognized as unrealized gains (losses) in the Consolidated Statement of Operations by “marking to market” on a daily basis to reflect the value of the swap agreement at the end of each trading day. Payments received or paid at the beginning of the agreement are reflected as such on the Consolidated Statement of Assets and Liabilities and may be referred to as upfront payments. The Fund accrues for the fixed payment stream and amortizes upfront payments, if any, on swap agreements on a daily basis with the net amount, recorded as a component of realized gain (loss) on the Consolidated Statement of Operations. A liquidation payment received or made at the termination of a swap agreement is recorded as realized gain (loss) on the Consolidated Statement of Operations. The Fund segregates cash or liquid securities having a value at least equal to the amount of the potential obligation of a Fund under any swap transaction. Cash held as collateral is recorded as deposits with brokers on the Consolidated Statement of Assets and Liabilities. Entering into these agreements involves, to varying degrees, lack of liquidity and elements of credit, market, and Counterparty risk in excess of amounts recognized on the Consolidated Statement of Assets and Liabilities. Such risks involve the possibility that a swap is difficult to sell or liquidate; the Counterparty does not honor its obligations under the agreement and unfavorable interest rates and market fluctuations. It is possible that developments in the swaps market, including potential government regulation, could adversely affect the Fund’s ability to terminate existing swap agreements or to realize amounts to be received under such agreements. A short position in a security poses more risk than holding the same security long. As there is no limit on how much the price of the security can increase, the Fund’s exposure is unlimited.
19 Invesco Emerging Markets Flexible Bond Fund
| P. | Other Risks — The Fund will seek to gain exposure to commodity markets primarily through an investment in the Subsidiary and through investments in exchange-traded funds and commodity-linked derivatives. The Subsidiary, unlike the Fund, may invest without limitation in commodities, commodity-linked derivatives and other securities, such as exchange-traded notes, that may provide leveraged and non-leveraged exposure to commodity markets. The Fund is indirectly exposed to the risks associated with the Subsidiary’s investments. |
The Fund is non-diversified and may invest in securities of fewer issuers than if it were diversified. Thus, the value of the Fund’s shares may vary more widely and the Fund may be subject to greater market and credit risk than if the Fund invested more broadly.
| Q. | Leverage Risk — Leverage exists when the Fund can lose more than it originally invests because it purchases or sells an instrument or enters into a transaction without investing an amount equal to the full economic exposure of the instrument or transaction. |
| R. | Collateral — To the extent the Fund has designated or segregated a security as collateral and that security is subsequently sold, it is the Fund’s practice to replace such collateral no later than the next business day. |
NOTE 2—Advisory Fees and Other Fees Paid to Affiliates
The Trust has entered into a master investment advisory agreement with Invesco Advisers, Inc. (the “Adviser” or “Invesco”). Under the terms of the investment advisory agreement, the Fund pays an advisory fee to the Adviser based on the annual rate of the Fund’s average daily net assets as follows:
| | | | |
| Average Daily Net Assets | | Rate | |
First $500 million | | | 0.75% | |
Next $500 million | | | 0.70% | |
Next $500 million | | | 0.67% | |
Over $1.5 billion | | | 0.65% | |
For the year ended October 31, 2016, the effective advisory fees incurred by the Fund was 0.75%.
The Subsidiary has entered into a separate contract with the Adviser whereby the Adviser provides investment advisory and other services to the Subsidiary. In consideration of these services, the Subsidiary pays an advisory fee to the Adviser based on the annual rate of the Subsidiary’s average daily net assets as set forth in the table above.
Under the terms of a master sub-advisory agreement between the Adviser and each of Invesco Asset Management Deutschland GmbH, Invesco Asset Management Limited, Invesco Asset Management (Japan) Limited, Invesco Hong Kong Limited, Invesco Senior Secured Management, Inc. and Invesco Canada Ltd. (collectively, the “Affiliated Sub-Advisers”) the Adviser, not the Fund, will pay 40% of the fees paid to the Adviser to any such Affiliated Sub-Adviser(s) that provide(s) discretionary investment management services to the Fund based on the percentage of assets allocated to such Affiliated Sub-Adviser(s).
The Adviser has contractually agreed, through at least February 28, 2018, to waive advisory fees and/or reimburse expenses to the extent necessary to limit total annual fund operating expenses after fee waiver and/or expense reimbursement (excluding certain items discussed below) of Class A, Class B, Class C, Class R, Class Y, Class R5 and Class R6 shares to 1.24%, 1.99%, 1.99%, 1.49%, 0.99%, 0.99% and 0.99%, respectively, of the Fund’s average daily net assets (the “expense limits”). In determining the Adviser’s obligation to waive advisory fees and/or reimburse expenses, the following expenses are not taken into account, and could cause the total annual fund operating expenses after fee waiver and/or expense reimbursement to exceed the numbers reflected above: (1) interest; (2) taxes; (3) dividend expense on short sales; (4) extraordinary or non-routine items, including litigation expenses; and (5) expenses that the Fund has incurred but did not actually pay because of an expense offset arrangement. Unless Invesco continues the fee waiver agreement, it will terminate on February 28, 2018. During its term, the fee waiver agreement cannot be terminated or amended to increase the expense limits without approval of the Board of Trustees.
Further, the Adviser has contractually agreed, through at least June 30, 2018, to waive the advisory fee payable by the Fund in an amount equal to 100% of the net advisory fees the Adviser receives from the affiliated money market funds on investments by the Fund of uninvested cash in such affiliated money market funds.
For the year ended October 31, 2016, the Adviser waived advisory fees of $188,879 and reimbursed class level expenses of $20,881, $754, $4,343, $1,094, $1,182 and $186 of Class A, Class B, Class C, Class R, Class Y and Class R6 shares, respectively.
The Trust has entered into a master administrative services agreement with Invesco pursuant to which the Fund has agreed to pay Invesco for certain administrative costs incurred in providing accounting services to the Fund. For the year ended October 31, 2016, expenses incurred under the agreement are shown in the Consolidated Statement of Operations as Administrative services fees.
The Trust has entered into a transfer agency and service agreement with Invesco Investment Services, Inc. (“IIS”) pursuant to which the Fund has agreed to pay IIS a fee for providing transfer agency and shareholder services to the Fund and reimburse IIS for certain expenses incurred by IIS in the course of providing such services. IIS may make payments to intermediaries that provide omnibus account services, sub-accounting services and/or networking services. All fees payable by IIS to intermediaries that provide omnibus account services or sub-accounting are charged back to the Fund, subject to certain limitations approved by the Trust’s Board of Trustees. For the year ended October 31, 2016, expenses incurred under the agreement are shown in the Consolidated Statement of Operations as Transfer agent fees.
The Trust has entered into master distribution agreements with Invesco Distributors, Inc. (“IDI”) to serve as the distributor for the Class A, Class B, Class C, Class R, Class Y, Class R5 and Class R6 shares of the Fund. The Trust has adopted plans pursuant to Rule 12b-1 under the 1940 Act with respect to the Fund’s Class A, Class B, Class C and Class R shares (collectively, the “Plans”). The Fund, pursuant to the Plans, pays IDI compensation at the annual rate of 0.25% of the Fund’s average daily net assets of Class A shares, 1.00% of the average daily net assets of Class B and Class C shares and 0.50% of the average daily net assets of Class R shares. Of the Plan payments, up to 0.25% of the average daily net assets of each class of shares may be paid to furnish continuing personal shareholder services to customers who purchase and own shares of such classes. Any amounts not paid as a service fee under the Plans would constitute an asset-based sales charge. Rules of the Financial Industry Regulatory Authority (“FINRA”) impose a cap on the total sales charges, including asset-based sales charges, that may be paid by any class of shares of the Fund. For the year ended October 31, 2016, expenses incurred under the Plans are shown in the Consolidated Statement of Operations as Distribution fees.
20 Invesco Emerging Markets Flexible Bond Fund
Front-end sales commissions and CDSC (collectively, the “sales charges”) are not recorded as expenses of the Fund. Front-end sales commissions are deducted from proceeds from the sales of Fund shares prior to investment in Class A shares of the Fund. CDSC are deducted from redemption proceeds prior to remittance to the shareholder. During the year ended October 31, 2016, IDI advised the Fund that IDI retained $790 in front-end sales commissions from the sale of Class A shares and $7 and $93 from Class B and Class C shares, respectively, for CDSC imposed on redemptions by shareholders.
Certain officers and trustees of the Trust are officers and directors of the Adviser, IIS and/or IDI.
NOTE 3—Additional Valuation Information
GAAP defines fair value as the price that would be received to sell an asset or paid to transfer a liability in an orderly transaction between market participants at the measurement date, under current market conditions. GAAP establishes a hierarchy that prioritizes the inputs to valuation methods, giving the highest priority to readily available unadjusted quoted prices in an active market for identical assets (Level 1) and the lowest priority to significant unobservable inputs (Level 3), generally when market prices are not readily available or are unreliable. Based on the valuation inputs, the securities or other investments are tiered into one of three levels. Changes in valuation methods may result in transfers in or out of an investment’s assigned level:
| | Level 1 — | Prices are determined using quoted prices in an active market for identical assets. |
| | Level 2 — | Prices are determined using other significant observable inputs. Observable inputs are inputs that other market participants may use in pricing a security. These may include quoted prices for similar securities, interest rates, prepayment speeds, credit risk, yield curves, loss severities, default rates, discount rates, volatilities and others. |
| | Level 3 — | Prices are determined using significant unobservable inputs. In situations where quoted prices or observable inputs are unavailable (for example, when there is little or no market activity for an investment at the end of the period), unobservable inputs may be used. Unobservable inputs reflect the Fund’s own assumptions about the factors market participants would use in determining fair value of the securities or instruments and would be based on the best available information. |
The following is a summary of the tiered valuation input levels, as of October 31, 2016. The level assigned to the securities valuations may not be an indication of the risk or liquidity associated with investing in those securities. Because of the inherent uncertainties of valuation, the values reflected in the consolidated financial statements may materially differ from the value received upon actual sale of those investments.
| | | | | | | | | | | | | | | | |
| | | Level 1 | | | Level 2 | | | Level 3 | | | Total | |
U.S. Dollar Denominated Bonds & Notes | | $ | — | | | $ | 38,356,020 | | | $ | — | | | $ | 38,356,020 | |
Non U.S. Dollar Denominated Bonds & Notes | | | — | | | | 14,002,823 | | | | — | | | | 14,002,823 | |
Credit-Linked Securities | | | — | | | | 3,721,197 | | | | — | | | | 3,721,197 | |
Money Market Funds | | | 10,466,597 | | | | — | | | | — | | | | 10,466,597 | |
| | | | 10,466,597 | | | | 56,080,040 | | | | — | | | | 66,546,637 | |
Forward Foreign Currency Contracts* | | | — | | | | (234,271 | ) | | | — | | | | (234,271 | ) |
Futures Contracts* | | | 127,328 | | | | — | | | | — | | | | 127,328 | |
Swap Agreements* | | | — | | | | (437,044 | ) | | | — | | | | (437,044 | ) |
Total Investments | | $ | 10,593,925 | | | $ | 55,408,725 | | | $ | — | | | $ | 66,002,650 | |
| * | Unrealized appreciation (depreciation). |
NOTE 4—Derivative Investments
The Fund may enter into an International Swaps and Derivatives Association Master Agreement (“ISDA Master Agreement”) under which a Fund may trade OTC derivatives. An OTC transaction entered into under an ISDA Master Agreement typically involves a collateral posting arrangement, payment netting provisions and close-out netting provisions. These netting provisions allow for reduction of credit risk through netting of contractual obligations. The enforceability of the netting provisions of the ISDA Master Agreement depends on the governing law of the ISDA Master Agreement, among other factors.
For financial reporting purposes, the Fund does not offset OTC derivative assets or liabilities that are subject to ISDA Master Agreements in the Consolidated Statement of Assets and Liabilities.
Value of Derivative Investments at Period-End
The table below summarizes the value of the Fund’s derivative investments, detailed by primary risk exposure, held as of October 31, 2016:
| | | | | | | | | | | | | | | | | | | | | | | | |
| | | Value | |
| Derivative Assets | | Commodity
Risk | | | Credit Risk | | | Currency Risk | | | Equity
Risk | | | Interest Rate
Risk | | | Total | |
Unrealized appreciation on futures contracts — Exchange-Traded(a) | | $ | 39,825 | | | $ | — | | | $ | — | | | $ | 28,629 | | | $ | 58,874 | | | $ | 127,328 | |
Unrealized appreciation on forward foreign currency contracts outstanding | | | — | | | | — | | | | 1,245,550 | | | | — | | | | — | | | | 1,245,550 | |
Total Derivative Assets | | $ | 39,825 | | | $ | — | | | $ | 1,245,550 | | | $ | 28,629 | | | $ | 58,874 | | | $ | 1,372,878 | |
Derivatives not subject to master netting agreements | | | (39,825 | ) | | | — | | | | — | | | | (28,629 | ) | | | (58,874 | ) | | | (127,328 | ) |
Total Derivative Assets subject to master netting agreements | | $ | — | | | $ | — | | | $ | 1,245,550 | | | $ | — | | | $ | — | | | $ | 1,245,550 | |
| | | | | | |
| | | | | | | | | | | | | | | | | | | | | | | | |
21 Invesco Emerging Markets Flexible Bond Fund
| | | | | | | | | | | | | | | | | | | | | | | | |
| | | Value | |
| Derivative Liabilities | | Commodity
Risk | | | Credit Risk | | | Currency Risk | | | Equity
Risk | | | Interest Rate
Risk | | | Total | |
Unrealized depreciation on swap agreements — Centrally Cleared(a) | | $ | — | | | $ | (23,263 | ) | | $ | — | | | $ | — | | | $ | — | | | $ | (23,263 | ) |
Unrealized depreciation on swap agreements — OTC | | | — | | | | (379,437 | ) | | | — | | | | (34,344 | ) | | | — | | | | (413,781 | ) |
Unrealized depreciation forward foreign currency contracts outstanding | | | — | | | | — | | | | (1,479,821 | ) | | | — | | | | — | | | | (1,479,821 | ) |
Total Derivative Liabilities | | $ | — | | | $ | (402,700 | ) | | $ | (1,479,821 | ) | | $ | (34,344 | ) | | $ | — | | | $ | (1,916,865 | ) |
Derivatives not subject to master netting agreements | | | — | | | | 23,263 | | | | — | | | | — | | | | — | | | | 23,263 | |
Total Derivative Liabilities subject to master netting agreements | | $ | — | | | $ | (379,437 | ) | | $ | (1,479,821 | ) | | $ | (34,344 | ) | | $ | — | | | $ | (1,893,602 | ) |
| (a) | Includes cumulative appreciation (depreciation) on futures contracts and centrally cleared swap agreements. Only current day’s variation margin receivable is reported within the Consolidated Statement of Assets and Liabilities. |
Offsetting Assets and Liabilities
The table below reflects the Fund’s exposure to Counterparties subject to either an ISDA Master Agreement or other agreement for OTC derivative transactions as of October 31, 2016.
| | | | | | | | | | | | | | | | | | | | | | | | | | | | | | | | | | | | | | | | |
| | | Financial Derivative Assets | | | Financial Derivative Liabilities | | | | | | Collateral
(Received)/Pledged | | | | |
| Counterparty | | Forward
foreign
currency
contracts | | | Swap
agreements | | | Total
assets | | | Forward
foreign
currency
contracts | | | Swap
agreements | | | Total
liabilities | | | Net value of
derivatives | | | Non-Cash | | | Cash | | | Net
amount | |
| Fund | | | | | | | | | | | | | | | | | | | | | | | | | | | | | | | | | | | | | | | | |
Barclays Bank PLC | | $ | — | | | $ | 140,590 | | | $ | 140,590 | | | $ | — | | | $ | (31,101 | ) | | $ | (31,101 | ) | | $ | 109,489 | | | $ | — | | | $ | — | | | $ | 109,489 | |
Citigroup Global Markets Inc. | | | 27,041 | | | | — | | | | 27,041 | | | | (10,626 | ) | | | — | | | | (10,626 | ) | | | 16,415 | | | | — | | | | — | | | | 16,415 | |
Deutsche Bank Securities Inc. | | | 219,982 | | | | — | | | | 219,982 | | | | (423,004 | ) | | | — | | | | (423,004 | ) | | | (203,022 | ) | | | — | | | | — | | | | (203,022 | ) |
Goldman Sachs International | | | 803,370 | | | | 895,258 | | | | 1,698,628 | | | | (896,078 | ) | | | (395,047 | ) | | | (1,291,125 | ) | | | 407,503 | | | | (386,647 | ) | | | — | | | | 20,856 | |
JPMorgan Chase Bank, N.A. | | | 131,309 | | | | — | | | | 131,309 | | | | (78,114 | ) | | | — | | | | (78,114 | ) | | | 53,195 | | | | — | | | | — | | | | 53,195 | |
Merrill Lynch International | | | — | | | | — | | | | — | | | | (35,179 | ) | | | — | | | | (35,179 | ) | | | (35,179 | ) | | | — | | | | — | | | | (35,179 | ) |
Morgan Stanley Capital Services LLC | | | 21,301 | | | | — | | | | 21,301 | | | | (18,620 | ) | | | — | | | | (18,620 | ) | | | 2,681 | | | | — | | | | — | | | | 2,681 | |
Toronto-Dominion Bank (The) | | | 42,547 | | | | — | | | | 42,547 | | | | (18,200 | ) | | | — | | | | (18,200 | ) | | | 24,347 | | | | — | | | | — | | | | 24,347 | |
Total | | $ | 1,245,550 | | | $ | 1,035,848 | | | $ | 2,281,398 | | | $ | (1,479,821 | ) | | $ | (426,148 | ) | | $ | (1,905,969 | ) | | $ | 375,429 | | | $ | (386,647 | ) | | $ | — | | | $ | (11,218 | ) |
Effect of Derivative Investments for the year ended October 31, 2016
The table below summarizes the gains (losses) on derivative investments, detailed by primary risk exposure, recognized in earnings during the period:
| | | | | | | | | | | | | | | | | | | | | | | | |
| | | Location of Gain (Loss) on
Consolidated Statement of Operations | |
| | Commodity
Risk | | | Credit Risk | | | Currency
Risk | | | Equity Risk | | | Interest Rate
Risk | | | Total | |
Realized Gain (Loss): | | | | | | | | | | | | | | | | | | | | | | | | |
Forward foreign currency contracts | | $ | — | | | $ | — | | | $ | (2,290,836 | ) | | $ | — | | | $ | — | | | $ | (2,290,836 | ) |
Futures contracts | | | 82,791 | | | | — | | | | — | | | | (63,699 | ) | | | (136,410 | ) | | | (117,318 | ) |
Options purchased(a) | | | — | | | | (53,900 | ) | | | (3,181 | ) | | | — | | | | — | | | | (57,081 | ) |
Options written | | | — | | | | 12,950 | | | | 14,675 | | | | — | | | | — | | | | 27,625 | |
Swap agreements | | | — | | | | (249,048 | ) | | | 1,053 | | | | (177,265 | ) | | | (71,042 | ) | | | (496,302 | ) |
Change in Net Unrealized Appreciation (Depreciation): | | | | | | | | | | | | | | | | | | | | | | | | |
Forward foreign currency contracts | | | — | | | | — | | | | (296,786 | ) | | | — | | | | — | | | | (296,786 | ) |
Futures contracts | | | 39,825 | | | | — | | | | — | | | | 28,629 | | | | 58,874 | | | | 127,328 | |
Swap agreements | | | — | | | | (402,700 | ) | | | — | | | | (34,344 | ) | | | — | | | | (437,044 | ) |
Total | | $ | 122,616 | | | $ | (692,698 | ) | | $ | (2,575,075 | ) | | $ | (246,679 | ) | | $ | (148,578 | ) | | $ | (3,540,414 | ) |
| (a) | Options purchased are included in the net realized gain (loss) from investment securities and the change in net unrealized appreciation of investment securities. |
The table below summarizes the twelve-month average notional value of forward foreign currency contracts, the eight-month average notional value of futures contracts and swap agreements, the two-month average notional value of options purchased and the six-month notional value of options written outstanding during the period.
| | | | | | | | | | | | | | | | | | | | |
| | | Forward
Foreign Currency
Contracts | | | Futures
Contracts | | | Options
Purchased | | | Options
Written | | | Swap
Agreements | |
Average notional value | | $ | 73,794,705 | | | $ | 5,384,744 | | | $ | 3,872,704 | | | $ | 3,240,901 | | | $ | 10,950,000 | |
22 Invesco Emerging Markets Flexible Bond Fund
| | | | | | | | | | | | | | | | | | | | | | | | | | |
| Open Forward Foreign Currency Contracts | |
Settlement
Date | | Counterparty | | Contract to | | | Notional
Value | | | Unrealized
Appreciation
(Depreciation) | |
| | | Deliver | | | Receive | | | |
11/21/16 | | Goldman Sachs International | | | CNY | | | | 15,000,000 | | | | USD | | | | 2,270,265 | | | $ | 2,210,792 | | | $ | 59,473 | |
11/21/16 | | Toronto-Dominion Bank (The) | | | USD | | | | 2,228,992 | | | | CNY | | | | 15,000,000 | | | | 2,210,792 | | | | (18,200 | ) |
11/30/16 | | Citigroup Global Markets Inc. | | | HUF | | | | 400,000,000 | | | | USD | | | | 1,442,065 | | | | 1,422,121 | | | | 19,944 | |
11/30/16 | | Citigroup Global Markets Inc. | | | USD | | | | 757,046 | | | | PLN | | | | 3,000,000 | | | | 764,143 | | | | 7,097 | |
11/30/16 | | Citigroup Global Markets Inc. | | | ZAR | | | | 4,250,000 | | | | USD | | | | 302,708 | | | | 313,334 | | | | (10,626 | ) |
11/30/16 | | Deutsche Bank Securities Inc. | | | HUF | | | | 2,607,000,000 | | | | USD | | | | 9,186,720 | | | | 9,268,674 | | | | (81,954 | ) |
11/30/16 | | Deutsche Bank Securities Inc. | | | KRW | | | | 2,780,000,000 | | | | USD | | | | 2,451,447 | | | | 2,429,295 | | | | 22,152 | |
11/30/16 | | Deutsche Bank Securities Inc. | | | RUB | | | | 402,000,000 | | | | USD | | | | 6,030,729 | | | | 6,292,498 | | | | (261,769 | ) |
11/30/16 | | Deutsche Bank Securities Inc. | | | TWD | | | | 57,000,000 | | | | USD | | | | 1,785,323 | | | | 1,804,540 | | | | (19,217 | ) |
11/30/16 | | Deutsche Bank Securities Inc. | | | USD | | | | 793,512 | | | | HUF | | | | 220,000,000 | | | | 782,167 | | | | (11,345 | ) |
11/30/16 | | Deutsche Bank Securities Inc. | | | USD | | | | 1,419,331 | | | | KRW | | | | 1,580,000,000 | | | | 1,380,678 | | | | (38,653 | ) |
11/30/16 | | Deutsche Bank Securities Inc. | | | USD | | | | 768,437 | | | | PLN | | | | 3,000,000 | | | | 764,143 | | | | (4,294 | ) |
11/30/16 | | Deutsche Bank Securities Inc. | | | USD | | | | 4,021,993 | | | | RUB | | | | 267,000,000 | | | | 4,179,346 | | | | 157,353 | |
11/30/16 | | Deutsche Bank Securities Inc. | | | USD | | | | 1,789,077 | | | | WD | | | | 57,000,000 | | | | 1,804,540 | | | | 15,463 | |
11/30/16 | | Goldman Sachs International | | | AUD | | | | 1,000,000 | | | | USD | | | | 758,050 | | | | 760,050 | | | | (2,000 | ) |
11/30/16 | | Goldman Sachs International | | | CAD | | | | 6,800,000 | | | | USD | | | | 5,126,917 | | | | 5,070,888 | | | | 56,029 | |
11/30/16 | | Goldman Sachs International | | | CLP | | | | 700,000,000 | | | | USD | | | | 1,039,733 | | | | 1,069,160 | | | | (29,427 | ) |
11/30/16 | | Goldman Sachs International | | | COP | | | | 6,200,000,000 | | | | USD | | | | 2,039,352 | | | | 2,051,771 | | | | (12,419 | ) |
11/30/16 | | Goldman Sachs International | | | HUF | | | | 950,000,000 | | | | USD | | | | 3,429,618 | | | | 3,377,538 | | | | 52,080 | |
11/30/16 | | Goldman Sachs International | | | IDR | | | | 67,400,000,000 | | | | USD | | | | 5,050,237 | | | | 5,150,936 | | | | (100,699 | ) |
11/30/16 | | Goldman Sachs International | | | INR | | | | 75,000,000 | | | | USD | | | | 1,096,010 | | | | 1,119,737 | | | | (23,727 | ) |
11/30/16 | | Goldman Sachs International | | | MXN | | | | 190,734,901 | | | | USD | | | | 10,127,559 | | | | 10,054,475 | | | | 73,084 | |
11/30/16 | | Goldman Sachs International | | | MYR | | | | 8,700,000 | | | | USD | | | | 2,126,241 | | | | 2,070,233 | | | | 56,008 | |
11/30/16 | | Goldman Sachs International | | | PLN | | | | 17,300,000 | | | | USD | | | | 4,422,970 | | | | 4,406,559 | | | | 16,411 | |
11/30/16 | | Goldman Sachs International | | | RUB | | | | 317,000,000 | | | | USD | | | | 4,794,888 | | | | 4,961,995 | | | | (167,107 | ) |
11/30/16 | | Goldman Sachs International | | | SGD | | | | 2,000,000 | | | | USD | | | | 1,493,061 | | | | 1,437,995 | | | | 55,066 | |
11/30/16 | | Goldman Sachs International | | | TRY | | | | 15,800,000 | | | | USD | | | | 5,159,131 | | | | 5,073,860 | | | | 85,271 | |
11/30/16 | | Goldman Sachs International | | | USD | | | | 2,364,320 | | | | CAD | | | | 3,100,000 | | | | 2,311,728 | | | | (52,592 | ) |
11/30/16 | | Goldman Sachs International | | | USD | | | | 414,110 | | | | CLP | | | | 270,000,000 | | | | 412,390 | | | | (1,720 | ) |
11/30/16 | | Goldman Sachs International | | | USD | | | | 686,323 | | | | COP | | | | 2,050,000,000 | | | | 678,408 | | | | (7,915 | ) |
11/30/16 | | Goldman Sachs International | | | USD | | | | 9,110,252 | | | | HUF | | | | 2,520,000,000 | | | | 8,959,363 | | | | (150,889 | ) |
11/30/16 | | Goldman Sachs International | | | USD | | | | 3,192,812 | | | | IDR | | | | 41,720,000,000 | | | | 3,188,384 | | | | (4,428 | ) |
11/30/16 | | Goldman Sachs International | | | USD | | | | 379,542 | | | | JPY | | | | 40,000,000 | | | | 381,812 | | | | 2,270 | |
11/30/16 | | Goldman Sachs International | | | USD | | | | 3,474,370 | | | | MXN | | | | 65,000,000 | | | | 3,426,436 | | | | (47,934 | ) |
11/30/16 | | Goldman Sachs International | | | USD | | | | 2,906,751 | | | | PLN | | | | 11,300,000 | | | | 2,878,273 | | | | (28,478 | ) |
11/30/16 | | Goldman Sachs International | | | USD | | | | 6,048,588 | | | | RUB | | | | 402,000,000 | | | | 6,292,498 | | | | 243,910 | |
11/30/16 | | Goldman Sachs International | | | USD | | | | 1,471,854 | | | | SGD | | | | 2,000,000 | | | | 1,437,995 | | | | (33,859 | ) |
11/30/16 | | Goldman Sachs International | | | USD | | | | 3,099,621 | | | | TRY | | | | 9,400,000 | | | | 3,018,626 | | | | (80,995 | ) |
11/30/16 | | Goldman Sachs International | | | USD | | | | 3,002,785 | | | | ZAR | | | | 42,000,000 | | | | 3,096,477 | | | | 93,692 | |
11/30/16 | | Goldman Sachs International | | | ZAR | | | | 57,200,000 | | | | USD | | | | 4,070,623 | | | | 4,217,107 | | | | (146,484 | ) |
11/30/16 | | JPMorgan Chase Bank, N.A. | | | AUD | | | | 1,000,000 | | | | USD | | | | 758,266 | | | | 760,050 | | | | (1,784 | ) |
11/30/16 | | JPMorgan Chase Bank, N.A. | | | CAD | | | | 2,000,000 | | | | USD | | | | 1,532,425 | | | | 1,491,438 | | | | 40,987 | |
11/30/16 | | JPMorgan Chase Bank, N.A. | | | JPY | | | | 260,000,000 | | | | USD | | | | 2,556,977 | | | | 2,481,780 | | | | 75,197 | |
11/30/16 | | JPMorgan Chase Bank, N.A. | | | USD | | | | 1,532,474 | | | | AUD | | | | 2,000,000 | | | | 1,520,100 | | | | (12,374 | ) |
11/30/16 | | JPMorgan Chase Bank, N.A. | | | USD | | | | 848,837 | | | | CAD | | | | 1,100,000 | | | | 820,291 | | | | (28,546 | ) |
11/30/16 | | JPMorgan Chase Bank, N.A. | | | USD | | | | 1,456,354 | | | | JPY | | | | 150,000,000 | | | | 1,431,796 | | | | (24,558 | ) |
11/30/16 | | Merrill Lynch International | | | USD | | | | 703,351 | | | | JPY | | | | 70,000,000 | | | | 668,172 | | | | (35,179 | ) |
11/30/16 | | Toronto-Dominion Bank (The) | | | USD | | | | 721,533 | | | | ZAR | | | | 10,000,000 | | | | 737,257 | | | | 15,724 | |
12/02/16 | | JPMorgan Chase Bank, N.A. | | | BRL | | | | 3,000,000 | | | | USD | | | | 945,686 | | | | 930,561 | | | | 15,125 | |
12/02/16 | | JPMorgan Chase Bank, N.A. | | | USD | | | | 941,413 | | | | BRL | | | | 3,000,000 | | | | 930,561 | | | | (10,852 | ) |
01/20/17 | | Goldman Sachs International | | | USD | | | | 1,381,443 | | | | PHP | | | | 67,000,000 | | | | 1,376,038 | | | | (5,405 | ) |
01/23/17 | | Morgan Stanley Capital Services LLC | | | CNY | | | | 16,931,250 | | | | USD | | | | 2,500,000 | | | | 2,478,699 | | | | 21,301 | |
01/23/17 | | Morgan Stanley Capital Services LLC | | | USD | | | | 2,497,319 | | | | CNY | | | | 16,931,250 | | | | 2,478,699 | | | | (18,620 | ) |
23 Invesco Emerging Markets Flexible Bond Fund
| | | | | | | | | | | | | | | | | | | | | | | | | | |
| Open Forward Foreign Currency Contracts—(continued) | |
Settlement
Date | | Counterparty | | Contract to | | | Notional
Value | | | Unrealized
Appreciation
(Depreciation) | |
| | | Deliver | | | Receive | | | |
03/03/17 | | Goldman Sachs International | | | CNY | | | | 9,500,000 | | | | USD | | | | 1,396,809 | | | $ | 1,386,733 | | | $ | 10,076 | |
04/28/17 | | Deutsche Bank Securities Inc. | | | CNY | | | | 7,662,350 | | | | USD | | | | 1,139,050 | | | | 1,114,036 | | | | 25,014 | |
04/28/17 | | Deutsche Bank Securities Inc. | | | USD | | | | 700,000 | | | | CNY | | | | 4,774,910 | | | | 694,228 | | | | (5,772 | ) |
04/28/17 | | Toronto-Dominion Bank (The) | | | CNY | | | | 25,000,000 | | | | USD | | | | 3,661,594 | | | | 3,634,771 | | | | 26,823 | |
Total Forward Foreign Currency Contracts — Currency Risk | | | | | | | | | | | | | | | | | | | | | | $ | (234,271 | ) |
Currency Abbreviations:
| | |
| AUD | | – Australian Dollar |
| BRL | | – Brazilian Real |
| CAD | | – Canadian Dollar |
| CLP | | – Chilean Peso |
| CNY | | – Chinese Yuan |
| COP | | – Colombian Peso |
| | |
| HUF | | – Hungarian Forint |
| IDR | | – Indonesian Rupiah |
| INR | | – Indian Rupee |
| JPY | | – Japanese Yen |
| KRW | | – South Korean Won |
| MXN | | – Mexican Peso |
| | |
| MYR | | – Malaysian Ringgit |
| PHP | | – Philippine Paso |
| PLN | | – Poland Zloty |
| RUB | | – Russian Ruble |
| SGD | | – Singapore Dollar |
| TRY | | – Turkish Lira |
| | |
| TWD | | – Taiwan Dollar |
| USD | | – U.S. Dollar |
| ZAR | | – South African Rand |
| | | | | | | | | | | | | | | | | | | | |
| Open Futures Contracts(a) | | | | |
| Futures Contracts | | Type of
Contract | | | Number of
Contracts | | | Expiration Month | | | Notional
Value | | | Unrealized
Appreciation | |
Brent Crude(b) | | | Short | | | | 13 | | | | March-2017 | | | $ | (648,960 | ) | | $ | 39,825 | |
Subtotal — Commodity Risk | | | | | | | | | | | | | | | | | | | 39,825 | |
E-Mini S&P 500 Index | | | Short | | | | 18 | | | | December-2016 | | | | (1,908,090 | ) | | | 28,629 | |
Subtotal — Equity Risk | | | | | | | | | | | | | | | | | | | 28,629 | |
Euro-BTP Italian Government Bonds | | | Short | | | | 22 | | | | December-2016 | | | | (3,346,293 | ) | | | 58,874 | |
Subtotal — Interest Rate Risk | | | | | | | | | | | | | | | | | | | 58,874 | |
Total Futures Contracts | | | | | | | | | | | | | | | | | | $ | 127,328 | |
| (a) | Futures contracts collateralized by $246,155 cash held with Bank of America Merrill Lynch, the futures commission merchant. |
| (b) | The investment is owned by the Subsidiary. See Note 5. |
| | | | | | | | | | | | | | | | | | | | | | | | | | | | | | | | |
| Options Written Transactions | |
| | | Call Options | | | Put Options | |
| | | Notional Value | | | Premiums
Received | | | Notional Value | | | Notional Value | | | Premiums
Received | |
Beginning of period | | | USD | | | | — | | | $ | — | | | | EUR | | | | — | | | | USD | | | | — | | | $ | — | |
Written | | | USD | | | | 3,200,000 | | | | 21,136 | | | | EUR | | | | 670,000 | | | | USD | | | | 7,000,000 | | | | 13,831 | |
Closed | | | USD | | | | (3,200,000 | ) | | | (21,136 | ) | | | EUR | | | | (670,000 | ) | | | USD | | | | — | | | | (881 | ) |
Exercised | | | USD | | | | — | | | | — | | | | EUR | | | | — | | | | USD | | | | (7,000,000 | ) | | | (12,950 | ) |
End of period | | | USD | | | | — | | | $ | — | | | | EUR | | | | — | | | | USD | | | | — | | | $ | — | |
Abbreviations:
| | |
| EUR | | – Euro |
| USD | | – U.S. Dollar |
| | | | | | | | | | | | | | | | | | | | | | | | | | | | | | |
| Open Centrally Cleared Credit Default Swap Agreements — Credit Risk | |
| Counterparty | | Reference Entity | | Buy/Sell Protection | | | (Pay)/Receive Fixed Rate | | | Expiration Date | | | Implied Credit Spread(a) | | | Notional Value | | | Upfront
Payments | | | Unrealized Appreciation (Depreciation) | |
Credit Suisse Securities (USA) LLC/ICE | | Markit CDX North America Emerging Markets Index, Series 25, Version 1 | | | Buy | | | | (1.00 | )% | | | June-2021 | | | | 2.43 | % | | $ | 4,200,000 | | | $ | 286,124 | | | $ | (23,263 | ) |
| | | | | | | | | | | | | | | | | | | | | | | | | | | | | | |
| Open Over-The-Counter Credit Default Swap Agreements | |
| Counterparty | | Reference Entity | | Buy/Sell Protection | | | (Pay)/Receive
Fixed Rate | | | Expiration Date | | | Implied Credit Spread(a) | | | Notional Value | | | Upfront
Payments | | | Unrealized Appreciation (Depreciation) | |
Barclays Bank PLC | | Republic of South Africa | | | Buy | | | | (1.00 | )% | | | June-2021 | | | | 2.22 | % | | $ | 2,100,000 | | | $ | 140,590 | | | $ | (28,651 | ) |
Goldman Sachs International | | Federative Republic of Brazil | | | Buy | | | | (1.00 | ) | | | June-2021 | | | | 2.47 | | | | 8,500,000 | | | | 891,786 | | | | (350,786 | ) |
Total Credit Default Swap Agreements — Credit Risk | | | $ | 1,032,376 | | | $ | (379,437 | ) |
| (a) | Implied credit spreads represent the current level as of October 31, 2016 at which protection could be bought or sold given the terms of the existing credit default swap contract and serve as an indicator of the current status of the payment/performance risk of the credit default swap contract. An implied credit spread that has widened or increased since entry into the initial contract may indicate a deteriorating credit profile and increased risk of default for the reference entity. A declining or narrowing spread may indicate an improving credit profile or decreased risk of default for the reference entity. Alternatively, credit spreads may increase or decrease reflecting the general tolerance for risk in the credit markets generally. |
24 Invesco Emerging Markets Flexible Bond Fund
| | | | | | | | | | | | | | | | | | | | | | | | | | | | |
| Open Over-The-Counter Total Return Swap Agreements — Equity Risk | |
| Counterparty | | Pay/Receive | | | Reference Entity | | | Floating Rate | | | Number of
Contracts | | | Termination Date | | | Notional Value | | | Unrealized
Appreciation (Depreciation) | |
Goldman Sachs International | | | Pay | | | | iBoxx USD Liquid High Yield Index | | | | 3 Month USD LIBOR | | | | 35,000 | | | | December-2016 | | | $ | 3,500,000 | | | $ | (34,344 | ) |
Abbreviations:
| | |
| ICE | | – Intercontinental Exchange |
| LIBOR | | – London Interbank Offer Rate |
| USD | | – U.S. Dollar |
NOTE 5—Subsidiary Information
The Fund’s Consolidated Schedule of Investments and any investments in derivatives include the holdings of both the Fund and the Subsidiary. The Fund’s Consolidated Statement of Assets and Liabilities, Consolidated Statement of Operations and Consolidated Statement of Changes in Net Assets include the account balances of both the Fund and the Subsidiary and all interfund transactions have been eliminated.
The table below summarizes the financial information of the Subsidiary recognized in the consolidated financial statements referred to above.
| | | | |
| Selected Financial Information | | Invesco Emerging Markets
Flexible Bond Cayman Ltd.
(the “Subsidiary”) | |
Total assets | | $ | 338,215 | |
Total liabilities | | | (1,223 | ) |
Net assets | | | 336,992 | |
Total investment income | | | 1,671 | |
Net investment income (loss) | | | (13,393 | ) |
Net realized gain (loss) from: | | | | |
Investment securities | | | (67,211 | ) |
Futures contracts | | | 82,792 | |
Change in net unrealized appreciation of: | | | | |
Futures contracts | | | 39,825 | |
Increase in net assets resulting from operations | | $ | 42,013 | |
NOTE 6—Expense Offset Arrangement(s)
The expense offset arrangement is comprised of transfer agency credits which result from balances in demand deposit accounts used by the transfer agent for clearing shareholder transactions. For the year ended October 31, 2016, the Fund received credits from this arrangement, which resulted in the reduction of the Fund’s total expenses of $205.
NOTE 7—Trustees’ and Officers’ Fees and Benefits
Trustees’ and Officers’ Fees and Benefits include amounts accrued by the Fund to pay remuneration to certain Trustees and Officers of the Fund. Trustees have the option to defer compensation payable by the Fund, and Trustees’ and Officers’ Fees and Benefits also include amounts accrued by the Fund to fund such deferred compensation amounts. Those Trustees who defer compensation have the option to select various Invesco Funds in which their deferral accounts shall be deemed to be invested. Finally, certain current Trustees were eligible to participate in a retirement plan that provided for benefits to be paid upon retirement to Trustees over a period of time based on the number of years of service. The Fund may have certain former Trustees who also participate in a retirement plan and receive benefits under such plan. Trustees’ and Officers’ Fees and Benefits include amounts accrued by the Fund to fund such retirement benefits. Obligations under the deferred compensation and retirement plans represent unsecured claims against the general assets of the Fund.
NOTE 8—Cash Balances
The Fund is permitted to temporarily carry a negative or overdrawn balance in its account with State Street Bank and Trust Company, the custodian bank. Such balances, if any at period-end, are shown in the Consolidated Statement of Assets and Liabilities under the payable caption Amount due custodian. To compensate the custodian bank for such overdrafts, the overdrawn Fund may either (1) leave funds as a compensating balance in the account so the custodian bank can be compensated by earning the additional interest; or (2) compensate by paying the custodian bank at a rate agreed upon by the custodian bank and Invesco, not to exceed the contractually agreed upon rate.
NOTE 9—Distributions to Shareholders and Tax Components of Net Assets
Tax Character of Distributions to Shareholders Paid During the Fiscal Years Ended October 31, 2016 and 2015:
| | | | | | | | |
| | | 2016 | | | 2015 | |
Return of capital | | $ | 2,413,189 | | | $ | 2,538,283 | |
25 Invesco Emerging Markets Flexible Bond Fund
Tax Components of Net Assets at Period-End:
| | | | |
| | | 2016 | |
Net unrealized appreciation — investments | | $ | 1,034,738 | |
Net unrealized appreciation (depreciation) — other investments | | | (455,214 | ) |
Temporary book/tax differences | | | (24,761 | ) |
Capital loss carryforward | | | (2,048,733 | ) |
Shares of beneficial interest | | | 69,318,856 | |
Total net assets | | $ | 67,824,886 | |
The temporary book/tax differences are a result of timing differences between book and tax recognition of income and/or expenses. The Fund’s temporary book/tax differences are the result of the trustee deferral of compensation and retirement plan benefits.
Capital loss carryforward is calculated and reported as of a specific date. Results of transactions and other activity after that date may affect the amount of capital loss carryforward actually available for the Fund to utilize. Capital losses generated in years beginning after December 22, 2010 can be carried forward for an unlimited period, whereas previous losses expire in eight tax years. Capital losses with an expiration period may not be used to offset capital gains until all net capital losses without an expiration date have been utilized. Capital loss carryforwards with no expiration date will retain their character as either short-term or long-term capital losses instead of as short-term capital losses as under prior law. The ability to utilize capital loss carryforwards in the future may be limited under the Internal Revenue Code and related regulations based on the results of future transactions.
The Fund has a capital loss carryforward as of October 31, 2016, as follows:
| | | | | | | | | | | | |
| Capital Loss Carryforward* | |
| Expiration | | Short-Term | | | Long-Term | | | Total | |
Not subject to expiration | | $ | — | | | $ | 2,048,733 | | | $ | 2,048,733 | |
| * | Capital loss carryforward as of the date listed above is reduced for limitations, if any, to the extent required by the Internal Revenue Code and may be further limited depending upon a variety of factors, including the realization of net unrealized gains or losses as of the date of any reorganization. |
NOTE 10—Investment Securities
The aggregate amount of investment securities (other than short-term securities, U.S. Treasury obligations and money market funds, if any) purchased and sold by the Fund during the year ended October 31, 2016 was $147,393,161 and $137,181,622, respectively. Cost of investments on a tax basis includes the adjustments for financial reporting purposes as of the most recently completed federal income tax reporting period-end.
| | | | |
| Unrealized Appreciation (Depreciation) of Investment Securities on a Tax Basis | |
Aggregate unrealized appreciation of investment securities | | $ | 1,470,915 | |
Aggregate unrealized (depreciation) of investment securities | | | (436,177 | ) |
Net unrealized appreciation of investment securities | | $ | 1,034,738 | |
Cost of investments is the same for tax and financial reporting purposes.
NOTE 11—Reclassification of Permanent Differences
Primarily as a result of differing book/tax treatment of foreign currency transactions, net operating loss and return of capital distributions, on October 31, 2016, undistributed net investment income was increased by $14,235, undistributed net realized gain (loss) was increased by $10,947,677 and shares of beneficial interest was decreased by $10,961,912. This reclassification had no effect on the net assets of the Fund.
26 Invesco Emerging Markets Flexible Bond Fund
NOTE 12—Share Information
| | | | | | | | | | | | | | | | |
| | | Summary of Share Activity | |
| | | Years ended October 31, | |
| | | 2016(a) | | | 2015 | |
| | | Shares | | | Amount | | | Shares | | | Amount | |
Sold: | | | | | | | | | | | | | | | | |
Class A | | | 143,177 | | | $ | 928,190 | | | | 171,421 | | | $ | 1,323,790 | |
Class B | | | — | | | | — | | | | 23,303 | | | | 179,312 | |
Class C | | | 35,582 | | | | 232,573 | | | | 25,413 | | | | 192,441 | |
Class R | | | 2,927 | | | | 18,832 | | | | 3,719 | | | | 27,958 | |
Class Y | | | 58,493 | | | | 379,745 | | | | 48,034 | | | | 372,122 | |
Class R6(b) | | | 4,090,830 | | | | 25,979,109 | | | | 1,007,671 | | | | 7,589,645 | |
| | | | |
Issued as reinvestment of dividends: | | | | | | | | | | | | | | | | |
Class A | | | 28,963 | | | | 185,353 | | | | 38,573 | | | | 288,494 | |
Class B | | | 1,048 | | | | 6,690 | | | | 1,855 | | | | 13,761 | |
Class C | | | 4,497 | | | | 28,821 | | | | 6,510 | | | | 48,750 | |
Class R | | | 1,675 | | | | 10,710 | | | | 2,549 | | | | 19,004 | |
Class Y | | | 1,801 | | | | 11,513 | | | | 2,763 | | | | 20,882 | |
Class R5 | | | — | | | | — | | | | 213 | | | | 1,707 | |
Class R6 | | | 331,014 | | | | 2,118,421 | | | | 272,414 | | | | 2,025,139 | |
| | | | |
Automatic conversion of Class B shares to Class A shares: | | | | | | | | | | | | | | | | |
Class A | | | 20,241 | | | | 130,337 | | | | 12,487 | | | | 90,553 | |
Class B | | | (20,247 | ) | | | (130,337 | ) | | | (12,503 | ) | | | (90,553 | ) |
| | | | |
Reacquired: | | | | | | | | | | | | | | | | |
Class A | | | (326,629 | ) | | | (2,109,730 | ) | | | (399,796 | ) | | | (3,057,882 | ) |
Class B | | | (5,922 | ) | | | (37,656 | ) | | | (10,146 | ) | | | (76,506 | ) |
Class C | | | (61,797 | ) | | | (403,138 | ) | | | (91,702 | ) | | | (710,907 | ) |
Class R | | | (17,762 | ) | | | (111,598 | ) | | | (6,892 | ) | | | (49,101 | ) |
Class Y | | | (50,921 | ) | | | (332,198 | ) | | | (348,793 | ) | | | (2,731,930 | ) |
Class R5 | | | — | | | | — | | | | (21,098 | ) | | | (164,937 | ) |
Class R6 | | | (645,466 | ) | | | (4,174,559 | ) | | | (427,880 | ) | | | (3,169,726 | ) |
Net increase in share activity | | | 3,591,504 | | | $ | 22,731,078 | | | | 298,115 | | | $ | 2,142,016 | |
| (a) | 90% of the outstanding shares of the Fund are owned by the Adviser or an affiliate of the Adviser. |
| (b) | On February 18, 2016, 3,744,455 Class R6 shares valued at $23,739,847 were sold to affiliated mutual funds. |
27 Invesco Emerging Markets Flexible Bond Fund
NOTE 13—Financial Highlights
The following schedule presents financial highlights for a share of the Fund outstanding throughout the periods indicated.
| | | | | | | | | | | | | | | | | | | | | | | | | | | | | | | | | | | | | | | | | | | | | | | | | | | | | | | | | | | | | | | | | | | | | | | | | | | |
| | | Net asset
value,
beginning
of period | | Net
investment
income(a) | | Net gains
(losses)
on securities
(both
realized and
unrealized) | | Total from
investment
operations | | Dividends
from net
investment
income | | Distributions
from net
realized
gains | | Return of
capital | | Total
distributions | | Net asset
value, end
of period(b) | | Total
return(c) | | Net assets,
end of period
(000’s omitted) | | Ratio of
expenses
to average
net assets
with fee waivers
and/or expenses
absorbed | | Ratio of
expenses
to average net
assets without
fee waivers
and/or expenses
absorbed | | Ratio of net
investment
income
to average
net assets | | Portfolio
turnover(d) |
Class A | | | | | | | | | | | | | | | | | | | | | | | | | | | | | | | | | | | | | | | | | | | | | | | | | | | | | | | | | | | | | | | | | | | | | | | | | | | |
Year ended 10/31/16 | | | $ | 6.77 | | | | $ | 0.27 | | | | $ | (0.25 | ) | | | $ | 0.02 | | | | $ | — | | | | $ | — | | | | $ | (0.26 | ) | | | $ | (0.26 | ) | | | $ | 6.53 | | | | | 0.45 | % | | | $ | 5,182 | | | | | 1.23 | %(e) | | | | 1.91 | %(e) | | | | 4.16 | %(e) | | | | 266 | % |
Year ended 10/31/15 | | | | 8.49 | | | | | 0.41 | | | | | (1.76 | ) | | | | (1.35 | ) | | | | — | | | | | — | | | | | (0.37 | ) | | | | (0.37 | ) | | | | 6.77 | | | | | (16.20 | ) | | | | 6,282 | | | | | 1.24 | | | | | 1.89 | | | | | 5.46 | | | | | 50 | |
Year ended 10/31/14 | | | | 9.17 | | | | | 0.46 | | | | | (0.77 | ) | | | | (0.31 | ) | | | | (0.06 | ) | | | | — | | | | | (0.31 | ) | | | | (0.37 | ) | | | | 8.49 | | | | | (3.44 | ) | | | | 9,379 | | | | | 1.24 | | | | | 1.84 | | | | | 5.29 | | | | | 69 | |
Year ended 10/31/13 | | | | 9.88 | | | | | 0.48 | | | | | (0.79 | ) | | | | (0.31 | ) | | | | (0.29 | ) | | | | — | | | | | (0.11 | ) | | | | (0.40 | ) | | | | 9.17 | | | | | (3.25 | ) | | | | 12,998 | | | | | 1.24 | | | | | 1.77 | | | | | 4.96 | | | | | 31 | |
Year ended 10/31/12 | | | | 10.36 | | | | | 0.50 | | | | | 0.17 | | | | | 0.67 | | | | | (0.88 | ) | | | | (0.24 | ) | | | | (0.03 | ) | | | | (1.15 | ) | | | | 9.88 | | | | | 7.50 | | | | | 14,549 | | | | | 1.24 | | | | | 1.79 | | | | | 5.17 | | | | | 30 | |
Class B | | | | | | | | | | | | | | | | | | | | | | | | | | | | | | | | | | | | | | | | | | | | | | | | | | | | | | | | | | | | | | | | | | | | | | | | | | | |
Year ended 10/31/16 | | | | 6.77 | | | | | 0.22 | | | | | (0.25 | ) | | | | (0.03 | ) | | | | — | | | | | — | | | | | (0.21 | ) | | | | (0.21 | ) | | | | 6.53 | | | | | (0.37 | ) | | | | 121 | | | | | 1.98 | (e) | | | | 2.66 | (e) | | | | 3.41 | (e) | | | | 266 | |
Year ended 10/31/15 | | | | 8.48 | | | | | 0.35 | | | | | (1.75 | ) | | | | (1.40 | ) | | | | — | | | | | — | | | | | (0.31 | ) | | | | (0.31 | ) | | | | 6.77 | | | | | (16.72 | ) | | | | 296 | | | | | 1.99 | | | | | 2.64 | | | | | 4.71 | | | | | 50 | |
Year ended 10/31/14 | | | | 9.16 | | | | | 0.40 | | | | | (0.78 | ) | | | | (0.38 | ) | | | | (0.05 | ) | | | | — | | | | | (0.25 | ) | | | | (0.30 | ) | | | | 8.48 | | | | | (4.17 | ) | | | | 349 | | | | | 1.99 | | | | | 2.59 | | | | | 4.54 | | | | | 69 | |
Year ended 10/31/13 | | | | 9.87 | | | | | 0.41 | | | | | (0.79 | ) | | | | (0.38 | ) | | | | (0.22 | ) | | | | — | | | | | (0.11 | ) | | | | (0.33 | ) | | | | 9.16 | | | | | (3.98 | ) | | | | 570 | | | | | 1.99 | | | | | 2.52 | | | | | 4.21 | | | | | 31 | |
Year ended 10/31/12 | | | | 10.35 | | | | | 0.43 | | | | | 0.17 | | | | | 0.60 | | | | | (0.81 | ) | | | | (0.24 | ) | | | | (0.03 | ) | | | | (1.08 | ) | | | | 9.87 | | | | | 6.70 | | | | | 856 | | | | | 1.99 | | | | | 2.54 | | | | | 4.42 | | | | | 30 | |
Class C | | | | | | | | | | | | | | | | | | | | | | | | | | | | | | | | | | | | | | | | | | | | | | | | | | | | | | | | | | | | | | | | | | | | | | | | | | | |
Year ended 10/31/16 | | | | 6.77 | | | | | 0.22 | | | | | (0.24 | ) | | | | (0.02 | ) | | | | — | | | | | — | | | | | (0.21 | ) | | | | (0.21 | ) | | | | 6.54 | | | | | (0.21 | ) | | | | 1,195 | | | | | 1.98 | (e) | | | | 2.66 | (e) | | | | 3.41 | (e) | | | | 266 | |
Year ended 10/31/15 | | | | 8.49 | | | | | 0.35 | | | | | (1.75 | ) | | | | (1.40 | ) | | | | — | | | | | — | | | | | (0.32 | ) | | | | (0.32 | ) | | | | 6.77 | | | | | (16.82 | ) | | | | 1,385 | | | | | 1.99 | | | | | 2.64 | | | | | 4.71 | | | | | 50 | |
Year ended 10/31/14 | | | | 9.17 | | | | | 0.40 | | | | | (0.78 | ) | | | | (0.38 | ) | | | | (0.05 | ) | | | | — | | | | | (0.25 | ) | | | | (0.30 | ) | | | | 8.49 | | | | | (4.16 | ) | | | | 2,244 | | | | | 1.99 | | | | | 2.59 | | | | | 4.54 | | | | | 69 | |
Year ended 10/31/13 | | | | 9.88 | | | | | 0.41 | | | | | (0.79 | ) | | | | (0.38 | ) | | | | (0.22 | ) | | | | — | | | | | (0.11 | ) | | | | (0.33 | ) | | | | 9.17 | | | | | (3.97 | ) | | | | 3,532 | | | | | 1.99 | | | | | 2.52 | | | | | 4.21 | | | | | 31 | |
Year ended 10/31/12 | | | | 10.36 | | | | | 0.43 | | | | | 0.17 | | | | | 0.60 | | | | | (0.81 | ) | | | | (0.24 | ) | | | | (0.03 | ) | | | | (1.08 | ) | | | | 9.88 | | | | | 6.70 | | | | | 3,938 | | | | | 1.99 | | | | | 2.54 | | | | | 4.42 | | | | | 30 | |
Class R | | | | | | | | | | | | | | | | | | | | | | | | | | | | | | | | | | | | | | | | | | | | | | | | | | | | | | | | | | | | | | | | | | | | | | | | | | | |
Year ended 10/31/16 | | | | 6.76 | | | | | 0.25 | | | | | (0.24 | ) | | | | 0.01 | | | | | — | | | | | — | | | | | (0.24 | ) | | | | (0.24 | ) | | | | 6.53 | | | | | 0.33 | | | | | 264 | | | | | 1.48 | (e) | | | | 2.16 | (e) | | | | 3.91 | (e) | | | | 266 | |
Year ended 10/31/15 | | | | 8.48 | | | | | 0.39 | | | | | (1.76 | ) | | | | (1.37 | ) | | | | — | | | | | — | | | | | (0.35 | ) | | | | (0.35 | ) | | | | 6.76 | | | | | (16.43 | ) | | | | 363 | | | | | 1.49 | | | | | 2.14 | | | | | 5.21 | | | | | 50 | |
Year ended 10/31/14 | | | | 9.17 | | | | | 0.44 | | | | | (0.78 | ) | | | | (0.34 | ) | | | | (0.06 | ) | | | | — | | | | | (0.29 | ) | | | | (0.35 | ) | | | | 8.48 | | | | | (3.79 | ) | | | | 460 | | | | | 1.49 | | | | | 2.09 | | | | | 5.04 | | | | | 69 | |
Year ended 10/31/13 | | | | 9.87 | | | | | 0.46 | | | | | (0.78 | ) | | | | (0.32 | ) | | | | (0.27 | ) | | | | — | | | | | (0.11 | ) | | | | (0.38 | ) | | | | 9.17 | | | | | (3.39 | ) | | | | 776 | | | | | 1.49 | | | | | 2.02 | | | | | 4.71 | | | | | 31 | |
Year ended 10/31/12 | | | | 10.36 | | | | | 0.48 | | | | | 0.16 | | | | | 0.64 | | | | | (0.86 | ) | | | | (0.24 | ) | | | | (0.03 | ) | | | | (1.13 | ) | | | | 9.87 | | | | | 7.13 | | | | | 946 | | | | | 1.49 | | | | | 2.04 | | | | | 4.92 | | | | | 30 | |
Class Y | | | | | | | | | | | | | | | | | | | | | | | | | | | | | | | | | | | | | | | | | | | | | | | | | | | | | | | | | | | | | | | | | | | | | | | | | | | |
Year ended 10/31/16 | | | | 6.77 | | | | | 0.29 | | | | | (0.25 | ) | | | | 0.04 | | | | | — | | | | | — | | | | | (0.28 | ) | | | | (0.28 | ) | | | | 6.53 | | | | | 0.72 | | | | | 354 | | | | | 0.98 | (e) | | | | 1.66 | (e) | | | | 4.41 | (e) | | | | 266 | |
Year ended 10/31/15 | | | | 8.49 | | | | | 0.45 | | | | | (1.78 | ) | | | | (1.33 | ) | | | | — | | | | | — | | | | | (0.39 | ) | | | | (0.39 | ) | | | | 6.77 | | | | | (15.99 | ) | | | | 304 | | | | | 0.99 | | | | | 1.64 | | | | | 5.71 | | | | | 50 | |
Year ended 10/31/14 | | | | 9.17 | | | | | 0.49 | | | | | (0.78 | ) | | | | (0.29 | ) | | | | (0.06 | ) | | | | — | | | | | (0.33 | ) | | | | (0.39 | ) | | | | 8.49 | | | | | (3.20 | ) | | | | 2,911 | | | | | 0.99 | | | | | 1.59 | | | | | 5.54 | | | | | 69 | |
Year ended 10/31/13 | | | | 9.88 | | | | | 0.51 | | | | | (0.79 | ) | | | | (0.28 | ) | | | | (0.32 | ) | | | | — | | | | | (0.11 | ) | | | | (0.43 | ) | | | | 9.17 | | | | | (3.01 | ) | | | | 1,529 | | | | | 0.99 | | | | | 1.52 | | | | | 5.21 | | | | | 31 | |
Year ended 10/31/12 | | | | 10.37 | | | | | 0.52 | | | | | 0.17 | | | | | 0.69 | | | | | (0.91 | ) | | | | (0.24 | ) | | | | (0.03 | ) | | | | (1.18 | ) | | | | 9.88 | | | | | 7.67 | | | | | 1,867 | | | | | 0.99 | | | | | 1.54 | | | | | 5.42 | | | | | 30 | |
Class R5 | | | | | | | | | | | | | | | | | | | | | | | | | | | | | | | | | | | | | | | | | | | | | | | | | | | | | | | | | | | | | | | | | | | | | | | | | | | |
Year ended 10/31/16 | | | | 6.77 | | | | | 0.29 | | | | | (0.25 | ) | | | | 0.04 | | | | | — | | | | | — | | | | | (0.28 | ) | | | | (0.28 | ) | | | | 6.53 | | | | | 0.72 | | | | | 7 | | | | | 0.98 | (e) | | | | 1.28 | (e) | | | | 4.41 | (e) | | | | 266 | |
Year ended 10/31/15 | | | | 8.48 | | | | | 0.45 | | | | | (1.77 | ) | | | | (1.32 | ) | | | | — | | | | | — | | | | | (0.39 | ) | | | | (0.39 | ) | | | | 6.77 | | | | | (15.89 | ) | | | | 7 | | | | | 0.99 | | | | | 1.34 | | | | | 5.71 | | | | | 50 | |
Year ended 10/31/14 | | | | 9.16 | | | | | 0.49 | | | | | (0.78 | ) | | | | (0.29 | ) | | | | (0.06 | ) | | | | — | | | | | (0.33 | ) | | | | (0.39 | ) | | | | 8.48 | | | | | (3.20 | ) | | | | 186 | | | | | 0.99 | | | | | 1.31 | | | | | 5.54 | | | | | 69 | |
Year ended 10/31/13 | | | | 9.87 | | | | | 0.51 | | | | | (0.79 | ) | | | | (0.28 | ) | | | | (0.32 | ) | | | | — | | | | | (0.11 | ) | | | | (0.43 | ) | | | | 9.16 | | | | | (3.01 | ) | | | | 291 | | | | | 0.99 | | | | | 1.36 | | | | | 5.21 | | | | | 31 | |
Year ended 10/31/12 | | | | 10.35 | | | | | 0.52 | | | | | 0.18 | | | | | 0.70 | | | | | (0.91 | ) | | | | (0.24 | ) | | | | (0.03 | ) | | | | (1.18 | ) | | | | 9.87 | | | | | 7.78 | | | | | 457 | | | | | 0.99 | | | | | 1.28 | | | | | 5.42 | | | | | 30 | |
Class R6 | | | | | | | | | | | | | | | | | | | | | | | | | | | | | | | | | | | | | | | | | | | | | | | | | | | | | | | | | | | | | | | | | | | | | | | | | | | |
Year ended 10/31/16 | | | | 6.77 | | | | | 0.29 | | | | | (0.25 | ) | | | | 0.04 | | | | | — | | | | | — | | | | | (0.28 | ) | | | | (0.28 | ) | | | | 6.53 | | | | | 0.73 | | | | | 60,702 | | | | | 0.98 | (e) | | | | 1.28 | (e) | | | | 4.41 | (e) | | | | 266 | |
Year ended 10/31/15 | | | | 8.48 | | | | | 0.43 | | | | | (1.75 | ) | | | | (1.32 | ) | | | | — | | | | | — | | | | | (0.39 | ) | | | | (0.39 | ) | | | | 6.77 | | | | | (15.89 | ) | | | | 37,373 | | | | | 0.99 | | | | | 1.33 | | | | | 5.71 | | | | | 50 | |
Year ended 10/31/14 | | | | 9.16 | | | | | 0.49 | | | | | (0.78 | ) | | | | (0.29 | ) | | | | (0.06 | ) | | | | — | | | | | (0.33 | ) | | | | (0.39 | ) | | | | 8.48 | | | | | (3.21 | ) | | | | 39,617 | | | | | 0.99 | | | | | 1.30 | | | | | 5.54 | | | | | 69 | |
Year ended 10/31/13 | | | | 9.87 | | | | | 0.50 | | | | | (0.78 | ) | | | | (0.28 | ) | | | | (0.32 | ) | | | | — | | | | | (0.11 | ) | | | | (0.43 | ) | | | | 9.16 | | | | | (3.01 | ) | | | | 33,125 | | | | | 0.99 | | | | | 1.29 | | | | | 5.21 | | | | | 31 | |
Year ended 10/31/12(f) | | | | 9.83 | | | | | 0.06 | | | | | 0.01 | | | | | 0.07 | | | | | (0.00 | ) | | | | — | | | | | (0.03 | ) | | | | (0.03 | ) | | | | 9.87 | | | | | 0.66 | | | | | 30,375 | | | | | 0.99 | (g) | | | | 1.26 | (g) | | | | 5.42 | (g) | | | | 30 | |
| (a) | Calculated using average shares outstanding. |
| (b) | Includes redemption fees added to shares of beneficial interest for Class A, Class B, Class C, Class R, Class Y and Class R5 shares, which were less than $0.005 per share, for the fiscal year ended October 31, 2012. |
| (c) | Includes adjustments in accordance with accounting principles generally accepted in the United States of America and as such, the net asset value for financial reporting purposes and the returns based upon those net asset values may differ from the net asset value and returns for shareholder transactions. Does not include sales charges and is not annualized for periods less than one year, if applicable. |
| (d) | Portfolio turnover is calculated at the fund level and is not annualized for periods less than one year, if applicable. |
| (e) | Ratios are based on average daily net assets (000’s omitted) of $5,546, $200, $1,154, $291, $314, $7 and $53,595 for Class A, Class B, Class C, Class R, Class Y, Class R5 and Class R6 shares, respectively. |
| (f) | Commencement date of September 24, 2012 for Class R6 shares. |
28 Invesco Emerging Markets Flexible Bond Fund
Report of Independent Registered Public Accounting Firm
To the Board of Trustees and Shareholders of the Invesco Emerging Markets Flexible Bond Fund:
In our opinion, the accompanying consolidated statement of assets and liabilities, including the consolidated schedule of investments, and the related consolidated statements of operations and of changes in net assets and the financial highlights present fairly, in all material respects, the consolidated financial position of the Invesco Emerging Markets Flexible Bond Fund and its subsidiary (the “Fund”) as of October 31, 2016, the results of their operations for the year then ended, the changes in their net assets for each of the two years in the period then ended and the financial highlights for each of the five years in the period then ended, in conformity with accounting principles generally accepted in the United States of America. These financial statements and financial highlights (hereafter referred to as “financial statements”) are the responsibility of the Fund’s management. Our responsibility is to express an opinion on these financial statements based on our audits. We conducted our audits of these financial statements in accordance with the standards of the Public Company Accounting Oversight Board (United States). Those standards require that we plan and perform the audit to obtain reasonable assurance about whether the financial statements are free of material misstatement. An audit includes examining, on a test basis, evidence supporting the amounts and disclosures in the financial statements, assessing the accounting principles used and significant estimates made by management, and evaluating the overall financial statement presentation. We believe that our audits, which included confirmation of securities as of October 31, 2016 by correspondence with the custodian and brokers, and the application of alternative auditing procedures where confirmation of security purchases have not been received, provide a reasonable basis for our opinion.
PRICEWATERHOUSECOOPERS LLP
Houston, Texas
December 21, 2016
29 Invesco Emerging Markets Flexible Bond Fund
Calculating your ongoing Fund expenses
Example
As a shareholder of the Fund, you incur two types of costs: (1) transaction costs, which may include sales charges (loads) on purchase payments or contingent deferred sales charges on redemptions, if any; and (2) ongoing costs, including management fees, distribution and/or service (12b-1) fees, and other Fund expenses. This example is intended to help you understand your ongoing costs (in dollars) of investing in the Fund and to compare these costs with ongoing costs of investing in other mutual funds. The example is based on an investment of $1,000 invested at the beginning of the period and held for the entire period May 1, 2016 through October 31, 2016.
Actual expenses
The table below provides information about actual account values and actual expenses. You may use the information in this table, together with the amount you invested, to estimate the expenses that you paid over the period. Simply divide your account value by $1,000 (for example, an $8,600 account value divided by $1,000 = 8.6), then multiply the result by the number in the table under the heading entitled “Actual Expenses Paid During Period” to estimate the expenses you paid on your account during this period.
Hypothetical example for comparison purposes
The table below also provides information about hypothetical account values and hypothetical expenses based on the Fund’s actual expense ratio and an assumed rate of return of 5% per year before expenses, which is not the Fund’s actual return.
The hypothetical account values and expenses may not be used to estimate the actual ending account balance or expenses you paid for the period. You may use this information to compare the ongoing costs of investing in the Fund and other funds. To do so, compare this 5% hypothetical example with the 5% hypothetical examples that appear in the shareholder reports of the other funds.
Please note that the expenses shown in the table are meant to highlight your ongoing costs only and do not reflect any transaction costs, such as sales charges (loads) on purchase payments or contingent deferred sales charges on redemptions, if any. Therefore, the hypothetical information is useful in comparing ongoing costs only, and will not help you determine the relative total costs of owning different funds. In addition, if these transaction costs were included, your costs would have been higher.
| | | | | | | | | | | | | | | | | | | | | | | | |
| Class | | Beginning Account Value
(05/01/16) | | | ACTUAL | | | HYPOTHETICAL (5% annual return before
expenses) | | | Annualized
Expense
Ratio | |
| | | Ending Account Value
(10/31/16)1 | | | Expenses Paid During
Period2 | | | Ending Account Value
(10/31/16) | | | Expenses Paid During
Period2 | | |
| A | | $ | 1,000.00 | | | $ | 1,029.70 | | | $ | 6.28 | | | $ | 1,018.95 | | | $ | 6.24 | | | | 1.23 | % |
| B | | | 1,000.00 | | | | 1,025.90 | | | | 10.08 | | | | 1,015.18 | | | | 10.03 | | | | 1.98 | |
| C | | | 1,000.00 | | | | 1,025.80 | | | | 10.08 | | | | 1,015.18 | | | | 10.03 | | | | 1.98 | |
| R | | | 1,000.00 | | | | 1,030.00 | | | | 7.55 | | | | 1,017.70 | | | | 7.51 | | | | 1.48 | |
| Y | | | 1,000.00 | | | | 1,031.00 | | | | 5.00 | | | | 1,020.21 | | | | 4.98 | | | | 0.98 | |
| R5 | | | 1,000.00 | | | | 1,031.00 | | | | 5.00 | | | | 1,020.21 | | | | 4.98 | | | | 0.98 | |
| R6 | | | 1,000.00 | | | | 1,032.60 | | | | 5.01 | | | | 1,020.21 | | | | 4.98 | | | | 0.98 | |
| 1 | The actual ending account value is based on the actual total return of the Fund for the period May 1, 2016 through October 31, 2016, after actual expenses and will differ from the hypothetical ending account value which is based on the Fund’s expense ratio and a hypothetical annual return of 5% before expenses. |
| 2 | Expenses are equal to the Fund’s annualized expense ratio as indicated above multiplied by the average account value over the period, multiplied by 184/366 to reflect the most recent fiscal half year. |
30 Invesco Emerging Markets Flexible Bond Fund
Approval of Investment Advisory and Sub-Advisory Contracts
The Board of Trustees (the Board) of AIM Investment Funds (Invesco Investment Funds) is required under the Investment Company Act of 1940, as amended, to approve annually the renewal of Invesco Emerging Markets Flexible Bond Fund’s (the Fund) (formerly, Invesco Emerging Market Local Currency Debt Fund) investment advisory agreements. During contract renewal meetings held on June 7-8, 2016, the Board as a whole, and the disinterested or “independent” Trustees, who comprise over 75% of the Board, voting separately, approved the continuance for the Fund of the Master Investment Advisory Agreement with Invesco Advisers, Inc. (Invesco Advisers and the investment advisory agreement) and the Master Intergroup Sub-Advisory Contract for Mutual Funds with Invesco Asset Management Deutschland GmbH, Invesco Asset Management Limited, Invesco Asset Management (Japan) Limited, Invesco Hong Kong Limited, Invesco Senior Secured Management, Inc. and Invesco Canada Ltd. (collectively, the Affiliated Sub-Advisers and the sub-advisory contracts) for another year, effective July 1, 2016.
In evaluating the fairness and reasonableness of compensation under the Fund’s investment advisory agreement and sub-advisory contracts, the Board considered, among other things, the factors discussed below. The Board determined that continuation of the Fund’s investment advisory agreement and the sub-advisory contracts is in the best interest of the Fund and its shareholders and that the compensation payable to Invesco Advisers and the Affiliated Sub-Advisers under the agreements is fair and reasonable.
The Board’s Fund Evaluation Process
The Board’s Investments Committee has established three Sub-Committees, which meet throughout the year to review the performance of funds advised by Invesco Advisers (the Invesco Funds). Over the course of each year, the Sub-Committees meet with portfolio managers for their assigned Invesco Funds and other members of management to review the performance, investment objective(s), policies, strategies, limitations and investment risks of these funds. The Board had the benefit of reports from the Sub-Committees and Investments Committee throughout the year in considering approval of the continuance of each Invesco Fund’s investment advisory agreement and sub-advisory contracts for another year.
During the contract renewal process, the Board receives comparative performance and fee data regarding the Invesco Funds prepared by Invesco Advisers and Broadridge Financial Solutions, Inc. (Broadridge), an independent provider of investment company data. The Board also receives an independent written evaluation from the Senior Officer, an officer of
the Invesco Funds who reports directly to the independent Trustees. The Senior Officer’s evaluation is prepared as part of his responsibility to manage the process by which the Invesco Funds’ proposed management fees are negotiated during the annual contract renewal process to ensure they are negotiated in a manner that is at arms’ length and reasonable. In addition to meetings with Invesco Advisers and fund counsel, the independent Trustees also discuss the continuance of the investment advisory agreement and sub-advisory contracts in separate sessions with the Senior Officer and with independent legal counsel.
The Trustees recognized that the advisory fee rates for the Invesco Funds are, in many cases, the result of years of review and negotiation. The Trustees’ deliberations and conclusions in a particular year may be based in part on their deliberations and conclusions regarding these arrangements throughout the year and in prior years. The Trustees’ review and conclusions are based on the comprehensive consideration of all information presented to them and are not the result of any single determinative factor. Moreover, one Trustee may have weighed a particular piece of information or factor differently than another Trustee.
The discussion below is a summary of the Senior Officer’s independent written evaluation with respect to the Fund’s investment advisory agreement as well as a discussion of the material factors and related conclusions that formed the basis for the Board’s approval of the Fund’s investment advisory agreement and sub-advisory contracts. Unless otherwise stated, this information is current as of June 8, 2016, and does not reflect consideration of factors that became known to the Board after that date.
Factors and Conclusions and Summary of Independent Written Fee Evaluation
| A. | Nature, Extent and Quality of Services Provided by Invesco Advisers and the Affiliated Sub-Advisers |
The Board reviewed the advisory services provided to the Fund by Invesco Advisers under the Fund’s investment advisory agreement, the performance of Invesco Advisers in providing these services, and the credentials and experience of the officers and employees of Invesco Advisers who provide these services, including the Fund’s portfolio manager or managers. The Board’s review of the qualifications of Invesco Advisers to provide advisory services included the Board’s consideration of Invesco Advisers’ investment process oversight, independent credit analysis and investment risk management. The Board also considered non-advisory services that Invesco Advisers and its affiliates provide to the Invesco Funds such as various back office
support functions, trading operations, internal audit, valuation and legal and compliance.
In determining whether to continue the Fund’s investment advisory agreement, the Board considered the benefits of reapproving an existing relationship and the greater uncertainty that may be associated with entering into a new relationship. The Board concluded that the nature, extent and quality of the services provided to the Fund by Invesco Advisers are appropriate and satisfactory and consistent with the terms of the Fund’s investment advisory agreement.
The Board reviewed the services that may be provided by the Affiliated Sub-Advisers under the sub-advisory contracts and the credentials and experience of the officers and employees of the Affiliated Sub-Advisers who provide these services. The Board noted that the Affiliated Sub-Advisers have offices and personnel that are located in financial centers around the world. As a result, the Board noted that the Affiliated Sub-Advisers can provide research and investment analysis on the markets and economies of various countries in which the Fund may invest, make recommendations regarding securities and assist with security trades. The Board concluded that the sub-advisory contracts may benefit the Fund and its shareholders by permitting Invesco Advisers to use the resources and talents of the Affiliated Sub-Advisers in managing the Fund. The Board concluded that the nature, extent and quality of the services that may be provided by the Affiliated Sub-Advisers are appropriate and satisfactory and consistent with the terms of the Fund’s sub-advisory contracts.
The Board noted that the Fund had recently changed its name, investment strategy and index against which future performance will be compared. As a result, the Board did not consider past performance of the fund to be relevant. The Board did not view Fund performance as a relevant factor in considering whether to approve the sub-advisory contracts for the Fund, as no Affiliated Sub-Adviser currently manages assets of the Fund.
| C. | Advisory and Sub-Advisory Fees |
The Board also noted that comparative information with respect to the Fund’s contractual management fee rate was provided by Broadridge, but with respect to the Fund’s performance universe under its prior investment strategy. The Board did not consider such comparative information to be relevant.
The Board noted that Invesco Advisers has contractually agreed to waive fees and/or limit expenses of the Fund through at least February 28, 2018 in an amount necessary to limit total annual operating expenses to a specified percentage of average daily net assets for each class of the Fund.
31 Invesco Emerging Markets Flexible Bond Fund
The Board compared the Fund’s effective advisory fee rate (the advisory fee rate after advisory fee waivers and before other expense limitations/waivers) to the effective advisory fee rates of other funds advised by Invesco Advisers and its affiliates with investment strategies comparable to those of the Fund, based on asset balances as of December 31, 2015. The Board also noted how the Fund’s rate compared to the effective advisory fee of five off-shore funds advised by Invesco Advisers and its affiliates.
The Board also considered the fees charged by Invesco Advisers and the Affiliated Sub-Advisers to other client accounts with investment strategies comparable to those of the Fund. The Board noted that Invesco Advisers or the Affiliated Sub-Advisers may charge lower fees to large institutional clients. Invesco Advisers reviewed with the Board the significantly greater scope of services it provides to the Invesco Funds relative to certain other types of client accounts. These additional services include provision of administrative services, officers and office space, oversight of service providers, preparation of annual registration statement updates and financial information and regulatory compliance under the Investment Company Act of 1940, as amended.
Invesco Advisers also reviewed generally the higher frequency of shareholder purchases and redemptions in the Invesco Funds relative to the flow of assets for other client accounts. Invesco Advisers advised the Board that advance notice of redemptions is often provided to Invesco Advisers by institutional clients. The Board did note that sub-advisory fee rates charged by the Affiliated Sub-Advisers to manage the Invesco Funds and to manage other client accounts tended to be more comparable, reflecting a similar scope of services.
The Board also considered the services that may be provided by the Affiliated Sub-Advisers pursuant to the sub-advisory contracts, as well as the fees payable by Invesco Advisers to the Affiliated Sub-Advisers pursuant to the sub-advisory contracts. The Board also noted that the sub-advisory fees are not paid directly by the Fund, but rather, are payable by Invesco Advisers to the Affiliated Sub-Advisers.
| D. | Economies of Scale and Breakpoints |
The Board considered the extent to which there are economies of scale in the provision of advisory services to the Fund. The Board also considered whether the Fund benefits from economies of scale through contractual breakpoints in the Fund’s advisory fee schedule. The Board also noted that the Fund shares directly in economies of scale through lower fees charged by third party service providers based on the combined size of the Invesco Funds and other clients advised by Invesco Advisers.
| E. | Profitability and Financial Resources |
The Board reviewed information from Invesco Advisers concerning the costs of the advisory and other services that Invesco Advisers and its
affiliates provide to the Fund and the Invesco Funds and the profitability of Invesco Advisers and its affiliates in providing these services. The Board received information from Invesco Advisers and a report from an independent consultant engaged by the Senior Officer about the methodology used to prepare the profitability information. The Board noted that Invesco Advisers continues to operate at a net profit from services Invesco Advisers and its affiliates provide to the Invesco Funds. The Board noted that Invesco Advisers and its subsidiaries did not make a profit from managing the Fund as a result of expense limitations. The Board received and accepted information from Invesco Advisers demonstrating that Invesco Advisers and each Affiliated Sub-Adviser are financially sound and have the resources necessary to perform their obligations under the investment advisory agreement and sub-advisory contracts.
| F. | Collateral Benefits to Invesco Advisers and its Affiliates |
The Board considered various other benefits received by Invesco Advisers and its affiliates from the relationship with the Fund, including the fees received for providing transfer agency and distribution services to the Fund. The Board considered comparative information regarding fees charged for these services, including information provided by Broadridge and other independent sources. The Board considered the performance of Invesco Advisers and its affiliates in providing these services and the organizational structure employed to provide these services. The Board also considered that these services are provided to the Fund pursuant to written contracts that are reviewed and approved on an annual basis by the Board; and that the services are required for the operation of the Fund.
The Board considered the benefits realized by Invesco Advisers and the Affiliated Sub-Advisers as a result of portfolio brokerage transactions executed through “soft dollar” arrangements. Invesco Advisers noted that the Fund does not execute brokerage transactions through “soft dollar” arrangements to any significant degree.
The Board considered that the Fund’s uninvested cash and cash collateral from any securities lending arrangements may be invested in money market funds advised by Invesco Advisers pursuant to procedures approved by the Board. The Board noted that Invesco Advisers receives advisory fees from these affiliated money market funds attributable to such investments, although Invesco Advisers has contractually agreed to waive through varying periods the advisory fees payable by the Invesco Funds with respect to certain investments in the affiliated money market funds. The waiver is in an amount equal to 100% of the net advisory fee Invesco Advisers receives from the affiliated money market funds with respect to the Fund’s investment in the affiliated money market funds of uninvested cash, but not cash collateral. The Board concluded that the amount of advisory
fees received by Invesco Advisors from the Fund’s investment of cash collateral from any securities lending arrangements in the affiliated money market funds is fair and reasonable.
32 Invesco Emerging Markets Flexible Bond Fund
Tax Information
Form 1099-DIV, Form 1042-S and other year-end tax information provide shareholders with actual calendar year amounts that should be included in their tax returns. Shareholders should consult their tax advisors.
The following distribution information is being provided as required by the Internal Revenue Code or to meet a specific state’s requirement.
The Fund designates the following amounts or, if subsequently determined to be different, the maximum amount allowable for its fiscal year ended October 31, 2016:
| | | | |
Federal and State Income Tax | |
Qualified Dividend Income* | | | 0 | % |
Corporate Dividends Received Deduction* | | | 0 | % |
U.S. Treasury Obligations* | | | 0 | % |
| | * | The above percentages are based on ordinary income dividends paid to shareholders during the Fund’s fiscal year. |
33 Invesco Emerging Markets Flexible Bond Fund
Trustees and Officers
The address of each trustee and officer is AIM Investment Funds (Invesco Investment Funds) (the “Trust”), 11 Greenway Plaza, Suite 1000, Houston, Texas 77046-1173. The trustees serve for the life of the Trust, subject to their earlier death, incapacitation, resignation, retirement or removal as more specifically provided in the Trust’s organizational documents. Each officer serves for a one year term or until their successors are elected and qualified. Column two below includes length of time served with predecessor entities, if any.
| | | | | | | | |
Name, Year of Birth and
Position(s) Held with the Trust | | Trustee and/
or Officer Since | | Principal Occupation(s)
During Past 5 Years | | Number of
Funds in Fund
Complex
Overseen by
Trustee | | Other Directorship(s)
Held by Trustee During
Past 5 Years |
| Interested Persons | | | | | | | | |
| Martin L. Flanagan1 — 1960 Trustee | | 2007 | | Executive Director, Chief Executive Officer and President, Invesco Ltd. (ultimate parent of Invesco and a global investment management firm); Advisor to the Board, Invesco Advisers, Inc. (formerly known as Invesco Institutional (N.A.), Inc.); Trustee, The Invesco Funds; Vice Chair, Investment Company Institute; and Member of Executive Board, SMU Cox School of Business Formerly: Chairman and Chief Executive Officer, Invesco Advisers, Inc. (registered investment adviser); Director, Chairman, Chief Executive Officer and President, Invesco Holding Company (US) Inc. (formerly IVZ Inc.) (holding company), Invesco Group Services, Inc. (service provider) and Invesco North American Holdings, Inc. (holding company); Director, Chief Executive Officer and President, Invesco Holding Company Limited (parent of Invesco and a global investment management firm); Director, Invesco Ltd.; Chairman, Investment Company Institute and President, Co-Chief Executive Officer, Co-President, Chief Operating Officer and Chief Financial Officer, Franklin Resources, Inc. (global investment management organization) | | 146 | | None |
| Philip A. Taylor2 — 1954 Trustee and Senior Vice President | | 2006 | | Head of the Americas and Senior Managing Director, Invesco Ltd.; Director, Co-Chairman, Co-President and Co-Chief Executive Officer, Invesco Advisers, Inc. (formerly known as Invesco Institutional (N.A.), Inc.) (registered investment adviser); Director, Chairman, Chief Executive Officer and President, Invesco Management Group, Inc. (formerly known as Invesco AIM Management Group, Inc.) (financial services holding company); Director and Chairman, Invesco Investment Services, Inc. (formerly known as Invesco AIM Investment Services, Inc.) (registered transfer agent) Chief Executive Officer, Invesco Corporate Class Inc. (corporate mutual fund company) Director, Chairman and Chief Executive Officer, Invesco Canada Ltd. (formerly known as Invesco Trimark Ltd./Invesco Trimark Ltèe) (registered investment adviser and registered transfer agent); Trustee and Senior Vice President, The Invesco Funds; Director, Invesco Investment Advisers LLC (formerly known as Van Kampen Asset Management). Formerly: Director, Chief Executive Officer and President, Van Kampen Exchange Corp.; President and Principal Executive Officer, The Invesco Funds (other than AIM Treasurer’s Series Trust (Invesco Treasurer’s Series Trust), Short-Term Investments Trust and Invesco Management Trust); Executive Vice President, The Invesco Funds (AIM Treasurer’s Series Trust (Invesco Treasurer’s Series Trust), Short-Term Investments Trust and Invesco Management Trust only); Director and President, INVESCO Funds Group, Inc. (registered investment adviser and registered transfer agent); Director and Chairman, IVZ Distributors, Inc. (formerly known as INVESCO Distributors, Inc.) (registered broker dealer); Director, President and Chairman, Invesco Inc. (holding company), Invesco Canada Holdings Inc. (holding company), Trimark Investments Ltd./Placements Trimark Ltèe and Invesco Financial Services Ltd/Services Financiers Invesco Ltèe; Chief Executive Officer, Invesco Canada Fund Inc. (corporate mutual fund company); Director and Chairman, Van Kampen Investor Services Inc.; Director, Chief Executive Officer and President, 1371 Preferred Inc. (holding company) and Van Kampen Investments Inc.; Director and President, AIM GP Canada Inc. (general partner for limited partnerships) and Van Kampen Advisors, Inc.; Director and Chief Executive Officer, Invesco Trimark Dealer Inc. (registered broker dealer); Director, Invesco Distributors, Inc. (formerly known as Invesco AIM Distributors, Inc.) (registered broker dealer); Manager, Invesco PowerShares Capital Management LLC; Director, Chief Executive Officer and President, Invesco Advisers, Inc.; Director, Chairman, Chief Executive Officer and President, Invesco AIM Capital Management, Inc.; President, Invesco Trimark Dealer Inc. and Invesco Trimark Ltd./Invesco Trimark Ltèe; Director and President, AIM Trimark Corporate Class Inc. and AIM Trimark Canada Fund Inc.; Senior Managing Director, Invesco Holding Company Limited; Director and Chairman, Fund Management Company (former registered broker dealer); President and Principal Executive Officer, The Invesco Funds (AIM Treasurer’s Series Trust (Invesco Treasurer’s Series Trust), and Short-Term Investments Trust only); President, AIM Trimark Global Fund Inc. and AIM Trimark Canada Fund Inc. | | 146 | | None |
| 1 | Mr. Flanagan is considered an interested person (within the meaning of Section 2(a)(19) of the 1940 Act) of the Trust because he is an officer of the Adviser to the Trust, and an officer and a director of Invesco Ltd., ultimate parent of the Adviser. |
| 2 | Mr. Taylor is considered an interested person (within the meaning of Section 2(a)(19) of the 1940 Act) of the Trust because he is an officer and a director of the Adviser. |
T-1 Invesco Emerging Markets Flexible Bond Fund
Trustees and Officers—(continued)
| | | | | | | | |
Name, Year of Birth and
Position(s) Held with the Trust | | Trustee and/
or Officer Since | | Principal Occupation(s) During Past 5 Years | | Number of
Funds in Fund
Complex
Overseen by
Trustee | | Other Directorship(s)
Held by Trustee During
Past 5 Years |
| Independent Trustees | | | | | | | | |
Bruce L. Crockett — 1944 Trustee and Chair | | 2001 | | Chairman, Crockett Technologies Associates (technology consulting company) Formerly: Director, Captaris (unified messaging provider); Director, President and Chief Executive Officer, COMSAT Corporation; Chairman, Board of Governors of INTELSAT (international communications company); ACE Limited (insurance company); Independent Directors Council and Investment Company Institute | | 146 | | ALPS (Attorneys Liability Protection Society) (insurance company) and Globe Specialty Metals, Inc. (metallurgical company); Member of the Audit Committee, Ferroglobe PLC and Investment Company Institute; Member of the Executive Committee and Chair of the Governance Committee, Independent Directors Council |
David C. Arch — 1945 Trustee | | 2010 | | Chairman of Blistex Inc., a consumer health care products manufacturer | | 146 | | Board member of the Illinois Manufacturers’ Association; Member of the Board of Visitors, Institute for the Humanities, University of Michigan |
James T. Bunch — 1942 Trustee | | 2003 | | Managing Member, Grumman Hill Group LLC (family office/private equity investments) Formerly: Chairman of the Board, Denver Film Society, Chairman of the Board of Trustees, Evans Scholarship Foundation; Chairman, Board of Governors, Western Golf Association | | 146 | | Trustee, Evans Scholarship Foundation |
Albert R. Dowden — 1941 Trustee | | 2001 | | Director of a number of public and private business corporations, including Nature’s Sunshine Products, Inc. Formerly: Director, The Boss Group, Ltd. and Reich & Tang Funds (5 portfolios) (registered investment company); Director, Homeowners of America Holding Corporation/Homeowners of America Insurance Company (property casualty company); Director, Continental Energy Services, LLC (oil and gas pipeline service); Director, CompuDyne Corporation (provider of product and services to the public security market) and Director, Annuity and Life Re (Holdings), Ltd. (reinsurance company); Director, President and Chief Executive Officer, Volvo Group North America, Inc.; Senior Vice President, AB Volvo; Director of various public and private corporations; Chairman, DHJ Media, Inc.; Director, Magellan Insurance Company; and Director, The Hertz Corporation, Genmar Corporation (boat manufacturer), National Media Corporation; Advisory Board of Rotary Power International (designer, manufacturer, and seller of rotary power engines); and Chairman, Cortland Trust, Inc. (registered investment company) | | 146 | | Director of Nature’s Sunshine Products, Inc. |
Jack M. Fields — 1952 Trustee | | 2001 | | Chief Executive Officer, Twenty First Century Group, Inc. (government affairs company); and Discovery Learning Alliance (non-profit) Formerly: Owner and Chief Executive Officer, Dos Angeles Ranch L.P. (cattle, hunting, corporate entertainment); Director, Insperity, Inc. (formerly known as Administaff); Chief Executive Officer, Texana Timber LP (sustainable forestry company); Director of Cross Timbers Quail Research Ranch (non-profit); and member of the U.S. House of Representatives | | 146 | | None |
Eli Jones — 1961 Trustee | | 2016 | | Professor and Dean, Mays Business School — Texas A&M University Formerly: Professor and Dean, Walton College of Business, University of Arkansas and E.J. Ourso College of Business, Louisiana State University and Director, Arvest Bank | | 146 | | Director of Insperity, Inc. (formerly known as Administaff) |
Prema Mathai-Davis — 1950 Trustee | | 2001 | | Retired. Formerly: Chief Executive Officer, YWCA of the U.S.A. | | 146 | | None |
Larry Soll — 1942 Trustee | | 2003 | | Retired. Formerly: Chairman, Chief Executive Officer and President, Synergen Corp. (a biotechnology company) | | 146 | | None |
Raymond Stickel, Jr. — 1944 Trustee | | 2005 | | Retired. Formerly: Director, Mainstay VP Series Funds, Inc. (25 portfolios) and Partner, Deloitte & Touche | | 146 | | None |
Robert C. Troccoli — 1949 Trustee | | 2016 | | Adjunct Professor, University of Denver — Daniels College of Business Formerly: Senior Partner, KPMG LLP | | 146 | | None |
T-2 Invesco Emerging Markets Flexible Bond Fund
Trustees and Officers—(continued)
| | | | | | | | |
Name, Year of Birth and
Position(s) Held with the Trust | | Trustee and/
or Officer Since | | Principal Occupation(s) During Past 5 Years | | Number of
Funds in Fund
Complex
Overseen by
Trustee | | Other Directorship(s)
Held by Trustee During
Past 5 Years |
| Independent Trustees—(continued) |
Suzanne H. Woolsey — 1941 Trustee | | 2014 | | Retired. Formerly: Chief Executive Officer of Woolsey Partners LLC | | 146 | | Director, SunShare LLC; Trustee, Ocean Conservancy; Emeritus Chair of the Board of Trustees of the Institute for Defense Analyses and of Colorado College; Trustee, Chair, Business and Finance Committee of California Institute of Technology; Prior to 2014, Director of Fluor Corp.; Prior to 2010, Trustee of the German Marshall Fund of the United States; Prior to 2010, Trustee of the Rocky Mountain Institute |
| Other Officers | | | | | | | | |
Sheri Morris — 1964 President, Principal Executive Officer and Treasurer | | 1999 | | President, Principal Executive Officer and Treasurer, The Invesco Funds; Vice President, Invesco Advisers, Inc. (formerly known as Invesco Institutional (N.A.), Inc.) (registered investment adviser); and Vice President, PowerShares Exchange-Traded Fund Trust, PowerShares Exchange-Traded Fund Trust II, PowerShares India Exchange-Traded Fund Trust, PowerShares Actively Managed Exchange-Traded Fund Trust, and PowerShares Actively Managed Exchange-Traded Commodity Fund Trust Formerly: Vice President and Principal Financial Officer, The Invesco Funds; Vice President, Invesco AIM Advisers, Inc., Invesco AIM Capital Management, Inc. and Invesco AIM Private Asset Management, Inc.; Assistant Vice President and Assistant Treasurer, The Invesco Funds and Assistant Vice President, Invesco Advisers, Inc., Invesco AIM Capital Management, Inc. and Invesco AIM Private Asset Management, Inc.; and Treasurer, PowerShares Exchange-Traded Fund Trust, PowerShares Exchange-Traded Fund Trust II, PowerShares India Exchange-Traded Fund Trust and PowerShares Actively Managed Exchange-Traded Fund Trust | | N/A | | N/A |
Russell C. Burk — 1958 Senior Vice President and Senior Officer | | 2005 | | Senior Vice President and Senior Officer, The Invesco Funds | | N/A | | N/A |
John M. Zerr — 1962 Senior Vice President, Chief Legal Officer and Secretary | | 2006 | | Director, Senior Vice President, Secretary and General Counsel, Invesco Management Group, Inc. (formerly known as Invesco AIM Management Group, Inc.; Senior Vice President, Invesco Advisers, Inc. (formerly known as Invesco Institutional (N.A.), Inc.) (registered investment adviser); Senior Vice President and Secretary, Invesco Distributors, Inc. (formerly known as Invesco AIM Distributors, Inc.); Director, Vice President and Secretary, Invesco Investment Services, Inc. (formerly known as Invesco AIM Investment Services, Inc.) Senior Vice President, Chief Legal Officer and Secretary, The Invesco Funds; Managing Director, Invesco PowerShares Capital Management LLC; Director, Secretary and General Counsel, Invesco Investment Advisers LLC (formerly known as Van Kampen Asset Management); Secretary and General Counsel, Invesco Capital Markets, Inc. (formerly known as Van Kampen Funds Inc.) and Chief Legal Officer, PowerShares Exchange-Traded Fund Trust, PowerShares Exchange-Traded Fund Trust II, PowerShares India Exchange-Traded Fund Trust, PowerShares Actively Managed Exchange-Traded Fund Trust, and PowerShares Actively Managed Exchange-Traded Commodity Fund Trust Formerly: Director, Secretary, General Counsel and Senior Vice President, Van Kampen Exchange Corp.; Director, Vice President and Secretary, IVZ Distributors, Inc. (formerly known as INVESCO Distributors, Inc.); Director and Vice President, INVESCO Funds Group, Inc.; Director and Vice President, Van Kampen Advisors Inc.; Director, Vice President, Secretary and General Counsel, Van Kampen Investor Services Inc.; Director, Invesco Distributors, Inc. (formerly known as Invesco AIM Distributors, Inc.); Director, Senior Vice President, General Counsel and Secretary, Invesco AIM Advisers, Inc. and Van Kampen Investments Inc.; Director, Vice President and Secretary, Fund Management Company; Director, Senior Vice President, Secretary, General Counsel and Vice President, Invesco AIM Capital Management, Inc.; Chief Operating Officer and General Counsel, Liberty Ridge Capital, Inc. (an investment adviser); Vice President and Secretary, PBHG Funds (an investment company) and PBHG Insurance Series Fund (an investment company); Chief Operating Officer, General Counsel and Secretary, Old Mutual Investment Partners (a broker-dealer); General Counsel and Secretary, Old Mutual Fund Services (an administrator) and Old Mutual Shareholder Services (a shareholder servicing center); Executive Vice President, General Counsel and Secretary, Old Mutual Capital, Inc. (an investment adviser); and Vice President and Secretary, Old Mutual Advisors Funds (an investment company) | | N/A | | N/A |
T-3 Invesco Emerging Markets Flexible Bond Fund
Trustees and Officers—(continued)
| | | | | | | | |
Name, Year of Birth and
Position(s) Held with the Trust | | Trustee and/
or Officer Since | | Principal Occupation(s) During Past 5 Years | | Number of
Funds in Fund
Complex
Overseen by
Trustee | | Other Directorship(s)
Held by Trustee During
Past 5 Years |
| Other Officers—(continued) | | | | | | | | |
| Karen Dunn Kelley — 1960 Senior Vice President | | 2004 | | Senior Managing Director, Investments, Invesco Ltd.; Director, Co-President, Co-Chief Executive Officer, and Co-Chairman, Invesco Advisers, Inc. (formerly known as Invesco Institutional (N.A.), Inc.) (registered investment adviser); Chairman and Director, Invesco Senior Secured Management, Inc.; Senior Vice President, Invesco Management Group, Inc. (formerly known as Invesco AIM Management Group, Inc.); Executive Vice President, Invesco Distributors, Inc. (formerly known as Invesco AIM Distributors, Inc.); Director, Invesco Mortgage Capital Inc. and Invesco Management Company Limited; Senior Vice President, The Invesco Funds Formerly: Vice President, The Invesco Funds (other than AIM Treasurer’s Series Trust (Invesco Treasurer’s Series Trust), Short-Term Investments Trust and Invesco Management Trust); and President and Principal Executive Officer, The Invesco Funds (AIM Treasurer’s Series Trust (Invesco Treasurer’s Series Trust), Short-Term Investments Trust and Invesco Management Trust only); Director and President, INVESCO Asset Management (Bermuda) Ltd., Director, INVESCO Global Asset Management DAC (formerly known as INVESCO Global Asset Management Limited) and INVESCO Management S.A.; Senior Vice President, Van Kampen Investments Inc. and Invesco Advisers, Inc. (formerly known as Invesco Institutional (N.A.), Inc.) (registered investment adviser); Director and President, Fund Management Company; Chief Cash Management Officer, Director of Cash Management, Senior Vice President, and Managing Director, Invesco AIM Capital Management, Inc.; Director of Cash Management, Senior Vice President, and Vice President, Invesco Advisers, Inc. and Vice President, The Invesco Funds (AIM Treasurer’s Series Trust (Invesco Treasurer’s Series Trust), and Short-Term Investments Trust only) | | N/A | | N/A |
Kelli Gallegos — 1970 Vice President, Principal Financial Officer and Assistant Treasurer | | 2008 | | Vice President, Principal Financial Officer and Assistant Treasurer, The Invesco Funds; Assistant Treasurer, Invesco PowerShares Capital Management LLC, PowerShares Exchange-Traded Fund Trust, PowerShares Exchange-Traded Fund Trust II, PowerShares India Exchange-Traded Fund Trust, PowerShares Actively Managed Exchange-Traded Fund Trust, and PowerShares Actively Managed Exchange-Traded Commodity Fund Trust Formerly: Assistant Vice President, The Invesco Funds | | N/A | | N/A |
Tracy Sullivan — 1962 Vice President, Chief Tax Officer and Assistant Treasurer | | 2008 | | Vice President, Chief Tax Officer and Assistant Treasurer, The Invesco Funds; Assistant Treasurer, Invesco PowerShares Capital Management LLC, PowerShares Exchange-Traded Fund Trust, PowerShares Exchange-Traded Fund Trust II, PowerShares India Exchange-Traded Fund Trust, PowerShares Actively Managed Exchange-Traded Fund Trust, and PowerShares Actively Managed Exchange-Traded Commodity Fund Trust Formerly: Assistant Vice President, The Invesco Funds | | N/A | | N/A |
Crissie M. Wisdom — 1969 Anti-Money Laundering Compliance Officer | | 2013 | | Anti-Money Laundering Compliance Officer, Invesco Advisers, Inc. (formerly known as Invesco Institutional (N.A.), Inc.) (registered investment adviser), Invesco Capital Markets, Inc. (formerly known as Van Kampen Funds Inc.), Invesco Distributors, Inc., Invesco Investment Services, Inc., Invesco Management Group, Inc., The Invesco Funds, and PowerShares Exchange-Traded Fund Trust, PowerShares Exchange-Traded Fund Trust II, PowerShares India Exchange-Traded Fund Trust, PowerShares Actively Managed Exchange-Traded Fund Trust and PowerShares Actively Managed Exchange-Traded Commodity Fund Trust; Anti-Money Laundering Compliance Officer and Bank Secrecy Act Officer, INVESCO National Trust Company and Invesco Trust Company; and Fraud Prevention Manager and Controls and Risk Analysis Manager for Invesco Investment Services, Inc. Formerly: Anti-Money Laundering Compliance Officer, Van Kampen Exchange Corp. | | N/A | | N/A |
Robert R. Leveille — 1969 Chief Compliance Officer | | 2016 | | Chief Compliance Officer, Invesco Advisers, Inc. (registered investment adviser); and Chief Compliance Officer, The Invesco Funds Formerly: Chief Compliance Officer, Putnam Investments and the Putnam Funds | | N/A | | N/A |
The Statement of Additional Information of the Trust includes additional information about the Fund’s Trustees and is available upon request, without charge, by calling 1.800.959.4246. Please refer to the Fund’s Statement of Additional Information for information on the Fund’s sub-advisers.
| | | | | | |
Office of the Fund 11 Greenway Plaza, Suite 1000 Houston, TX 77046-1173 | | Investment Adviser Invesco Advisers, Inc. 1555 Peachtree Street, N.E. Atlanta, GA 30309 | | Distributor Invesco Distributors, Inc. 11 Greenway Plaza, Suite 1000 Houston, TX 77046-1173 | | Auditors PricewaterhouseCoopers LLP 1000 Louisiana Street, Suite 5800 Houston, TX 77002-5678 |
| | | |
| | | | | | |
Counsel to the Fund Stradley Ronon Stevens & Young, LLP 2005 Market Street, Suite 2600 Philadelphia, PA 19103-7018 | | Counsel to the Independent Trustees Goodwin Procter LLP 901 New York Avenue, N.W. Washington, D.C. 20001 | | Transfer Agent Invesco Investment Services, Inc. 11 Greenway Plaza, Suite 1000 Houston, TX 77046-1173 | | Custodian State Street Bank and Trust Company 225 Franklin Street Boston, MA 02110-2801 |
T-4 Invesco Emerging Markets Flexible Bond Fund
Explore High-Conviction Investing with Invesco

Invesco mailing information
Send general correspondence to Invesco Investment Services, Inc., P.O. Box 219078, Kansas City, MO 64121-9078.
Important notice regarding delivery of security holder documents
To reduce Fund expenses, only one copy of most shareholder documents may be mailed to shareholders with multiple accounts at the same address (Householding). Mailing of your shareholder documents may be householded indefinitely unless you instruct us otherwise. If you do not want the mailing of these documents to be combined with those for other members of your household, please contact Invesco Investment Services, Inc. at 800 959 4246 or contact your financial institution. We will begin sending you individual copies for each account within 30 days after receiving your request.
Fund holdings and proxy voting information
The Fund provides a complete list of its holdings four times in each fiscal year, at the quarter ends. For the second and fourth quarters, the lists appear in the Fund’s semiannual and annual reports to shareholders. For the first and third quarters, the Fund files the lists with the Securities and Exchange Commission (SEC) on Form N-Q. The most recent list of portfolio holdings is available at invesco.com/completeqtrholdings. Shareholders can also look up the Fund’s Forms N-Q on the SEC website at sec.gov. Copies of the Fund’s Forms N-Q may be reviewed and copied at the SEC Public Reference Room in Washington, D.C. You can obtain information on the operation of the Public Reference Room, including information about duplicating fee charges, by calling 202 551 8090 or 800 732 0330, or by electronic request at the following email address: publicinfo@sec.gov.
The SEC file numbers for the Fund are shown below.
A description of the policies and procedures that the Fund uses to determine how to vote proxies relating to portfolio securities is available without charge, upon request, from our Client Services department at 800 959 4246 or at invesco.com/proxyguidelines. The information is also available on the SEC website, sec.gov.
| | |
Information regarding how the Fund voted proxies related to its portfolio securities during the most recent 12-month period ended June 30 is available at invesco.com/proxysearch. The information is also available on the SEC website, sec.gov. Invesco Advisers, Inc. is an investment adviser; it provides investment advisory services to individual and institutional clients and does not sell securities. Invesco Distributors, Inc. is the US distributor for Invesco Ltd.’s retail mutual funds, exchange-traded funds and institutional money market funds. Both are wholly owned, indirect subsidiaries of Invesco Ltd. | |  |
| | | | |
| SEC file numbers: 811-05426 and 033-19338 | | EMFB-AR-1 | | Invesco Distributors, Inc. |
| | | | |
| | |
 | | Annual Report to Shareholders | | October 31, 2016 |
| | |
| | Invesco Emerging Markets Equity Fund |
| | Nasdaq: |
| | A: IEMAX ∎ C: IEMCX ∎ R: IEMRX ∎ Y: IEMYX ∎ R5: IEMIX ∎ R6: EMEFX |

Letters to Shareholders
| | |

Philip Taylor | | Dear Shareholders: This annual report includes information about your Fund, including performance data and a complete list of its investments as of the close of the reporting period. Inside is a discussion of how your Fund was managed and the factors that affected its performance during the reporting period. In December 2015, the US Federal Reserve raised short-term interest rates for the first time since 2006, signaling its belief that the economy was likely to continue strengthening. Indeed, throughout the reporting period, US economic data were generally positive and the economy expanded at a moderate rate – but there were some bumps along the road. Job growth in May 2016 was very weak, but it was followed by strong increases in nonfarm payrolls in June and July. Increased concerns about global economic weakness caused US stock market indexes to sink at the start of calendar year 2016, but they eventually recovered; they sank again following the UK’s decision to leave the European Union, but |
| then quickly recovered and reached record highs later in the summer. Strong demand for income-producing investments, particularly those perceived to be lower risk, benefited bonds as well as dividend-paying stocks for much of the reporting period. While economic news in the US was generally positive, news overseas was less upbeat. The European Central Bank, and central banks in China and Japan – as well as other countries – maintained extraordinarily accommodative monetary policies in response to economic weakness. As the fiscal year drew to a close, uncertainty about the outcome of the US presidential election resulted in increased market volatility; the surprise outcome after the close of the reporting period suggested that market volatility may continue for some time to come. |
Short-term market volatility can prompt some investors to abandon their investment plans – and can cause others to settle for average results. The investment professionals at Invesco, in contrast, invest with high conviction, take a long-term perspective and have a passion to exceed. Invesco’s pure focus on investment management eliminates possible distractions and means that there are no competing lines of business for us to support. Just as important, we embrace a variety of investment strategies, asset classes and geographies – because we know that no single investment approach meets the diverse needs of all of our clients. We manage all our investment approaches with a passion to exceed. All our investment teams have a highly disciplined, long-term investing style that eliminates short-term decision-making. Of course, investing with high conviction can’t guarantee a profit or ensure success; no investment strategy can. To learn more about how we invest with high conviction, visit invesco.com/HighConviction.
You, too, can invest with high conviction by maintaining a long-term investment perspective and by working with your financial adviser on a regular basis. During periods of short-term market volatility or uncertainty, your financial adviser can keep you focused on your long-term investment goals – a new home, a child’s college education or a secure retirement. He or she also can share research about the economy, the markets and individual investment options.
Visit our website for more information on your investments
Our website, invesco.com/us, offers a wide range of market insights and investment perspectives. On the website, you’ll find detailed information about our funds, including performance, holdings and portfolio manager commentaries. You can access information about your account by completing a simple, secure online registration. Click on the “Need to register” link in the “Account Access” box on our homepage to get started.
In addition to the resources accessible on our website and through our mobile app, you can obtain timely updates to help you stay informed about the markets, the economy and investing by connecting with Invesco on Twitter, LinkedIn or Facebook. You can access our blog at blog.invesco.us.com. Our goal is to provide you the information you want, when and where you want it.
Finally, I’m pleased to share with you Invesco’s commitment to both the Principles for Responsible Investment and to considering environmental, social and governance issues in our robust investment process. I invite you to learn more at invesco.com/esg.
Have questions?
For questions about your account, contact an Invesco client services representative at 800 959 4246. For Invesco-related questions or comments, please email me directly at phil@invesco.com.
All of us at Invesco look forward to serving your investment management needs. Thank you for investing with us.
Sincerely,

Philip Taylor
Senior Managing Director, Invesco Ltd.
2 Invesco Emerging Markets Equity Fund
| | | | | | |

Bruce Crockett | | | | Dear Fellow Shareholders: Among the many important lessons I’ve learned in more than 40 years in a variety of business endeavors is the value of a trusted advocate. As independent chair of the Invesco Funds Board, I can assure you that the members of the Board are strong advocates for the interests of investors in Invesco’s mutual funds. We work hard to represent your interests through oversight of the quality of the investment management services your funds receive and other matters important to your investment, including but not limited to: |
| | | ∎ | | Ensuring that Invesco offers a diverse lineup of mutual funds that your financial adviser can use to strive to meet your financial needs as your investment goals change over time. |
| | | | ∎ | | Monitoring how the portfolio management teams of the Invesco funds are performing in light of changing economic and market conditions. |
| ∎ | | Assessing each portfolio management team’s investment performance within the context of the investment strategy described in the fund’s prospectus. |
| ∎ | | Monitoring for potential conflicts of interests that may impact the nature of the services that your funds receive. |
We believe one of the most important services we provide our fund shareholders is the annual review of the funds’ advisory and sub-advisory contracts with Invesco Advisers and its affiliates. This review is required by the Investment Company Act of 1940 and focuses on the nature and quality of the services Invesco provides as the adviser to the Invesco funds and the reasonableness of the fees that it charges for those services. Each year, we spend months carefully reviewing information received from Invesco and a variety of independent sources, such as performance and fee data prepared by Lipper Inc., an independent, third-party firm widely recognized as a leader in its field. We also meet with our independent legal counsel and other independent advisers to review and help us assess the information that we have received. Our goal is to assure that you receive quality investment management services for a reasonable fee.
I trust the measures outlined above provide assurance that you have a worthy advocate when it comes to choosing the Invesco Funds.
As always, please contact me at bruce@brucecrockett.com with any questions or concerns you may have. On behalf of the Board, we look forward to continuing to represent your interests and serving your needs.
Sincerely,

Bruce L. Crockett
Independent Chair
Invesco Funds Board of Trustees
3 Invesco Emerging Markets Equity Fund
Management’s Discussion of Fund Performance
| | | | |
Performance summary For the fiscal year ended October 31, 2016, Class A shares of Invesco Emerging Markets Equity Fund (the Fund), at net asset value (NAV), underperformed the Fund’s style-specific benchmark, the MSCI Emerging Markets Index. Your Fund’s long-term performance appears later in this report. | |
Fund vs. Indexes Total returns, 10/31/15 to 10/31/16, at net asset value (NAV). Performance shown does not include applicable contingent deferred sales charges (CDSC) or front-end sales charges, which would have reduced performance. | |
Class A Shares | | | 9.19 | % |
Class C Shares | | | 8.40 | |
Class R Shares | | | 8.77 | |
Class Y Shares | | | 9.49 | |
Class R5 Shares | | | 9.49 | |
Class R6 Shares | | | 9.33 | |
MSCI EAFE Index q(Broad Market Index) | | | -3.23 | |
| MSCI Emerging Markets Indexq (Style-Specific Index) | | | 9.27 | |
Lipper Emerging Market Funds Index∎ (Peer Group Index) | | | 11.25 | |
Source(s): qFactSet Research Systems Inc.; ∎Lipper Inc. | | | | |
Market conditions and your Fund
The global economy continued to expand, albeit slowly, for the fiscal year. However, that growth became increasingly uneven across developed and emerging economies, amid continued volatility in oil prices and as the policies of central banks globally began to diverge.
An equity market rally in November 2015 was offset by negative performance in December, as a late-year crash in oil prices rattled the markets. Also in December, the US Federal Reserve (the Fed) followed through on its commitment to normalize monetary policy by raising interest rates – its first increase since 2006 – even as the European Central Bank extended its asset purchase program and Japan introduced additional quantitative easing and negative interest rates.
Stocks began calendar year 2016 on a negative note, driven by investor concerns about economic weakness in China
and falling oil prices. Markets recovered in late February and posted gains amid concerted central bank commitments to very loose monetary policy. As a result, the US dollar fell sharply against the euro and Japanese yen, a development that was largely supportive of oil and stock prices.
All major global stock indexes experienced steep declines again in June after UK voters opted to leave the European Union. Stocks in economically sensitive sectors, including energy and financials, were hardest hit, and investors flocked to the perceived safety of US Treasuries and more defensive, dividend-paying equities often found in the telecommunication services, utilities and consumer staples sectors.
After the initial shock of the UK vote, stocks made a strong recovery, regaining most of their losses as fears of a shock to consumer confidence never materialized. For the remainder of the reporting period,
emerging markets outperformed as the Fed left interest rates unchanged and expectations for an interest rate increase were delayed again.
The Fund stayed true to its process by emphasizing its quality orientation in stock selection. Our stock selection in the consumer discretionary, financials and information technology (IT) sectors made the largest contributions to the Fund’s results versus its style-specific benchmark. Holdings in the health care and industrials sectors detracted from Fund performance for the reporting period. In addition, the Fund’s lack of holdings in the energy sector hampered Fund performance.
From a geographic perspective, stock selection in India, Hong Kong, China and Taiwan were the greatest contributors to the Fund’s performance relative to its style-specific benchmark. Conversely, stock selection in South Korea detracted from relative performance.
The largest contributor to Fund performance was Taiwan Semiconductor Manufacturing Company. During the fiscal year, the company, a parts supplier to the iPhone 7, benefited from a broader rally in technology companies and record profits as demand for new iPhones fueled orders for its processor chips. Also within the Asia Pacific region was Tencent Holdings, which reported strong earnings and revenue growth contributing to Fund performance. In addition, Brazilian drugstore chain Raia Drogasil contributed to Fund performance due to better-than-expected earnings during the reporting period.
Conversely, Kepco Plant Service & Engineering, an integrated electric utility company, was the largest individual detractor from Fund performance. Kepco’s stock was hurt by poor earnings and analyst downgrades. Also detracting from
| | |
| Portfolio Composition |
| By sector | | % of total net assets |
| | | | |
| |
| Financials | | | 27.8 | % |
| Information Technology | | | 26.0 | |
| Consumer Discretionary | | | 21.2 | |
| Consumer Staples | | | 12.0 | |
| Industrials | | | 8.8 | |
| Health Care | | | 1.2 | |
| Utilities | | | 1.1 | |
| Materials | | | 0.5 | |
| Money Market Funds Plus Other Assets Less Liabilities | | | 1.4 | |
| | | | |
| Top 10 Equity Holdings* |
| | % of total net assets |
| | | | | | |
1. | | Taiwan Semiconductor Manufacturing Co. Ltd. | | | 5.8 | % |
2. | | Tencent Holdings Ltd. | | | 5.4 | |
3. | | Samsung Electronics Co., Ltd. | | | 4.7 | |
4. | | Baidu, Inc.-ADR | | | 3.3 | |
5. | | Sberbank of Russia PSJC-ADR | | | 2.5 | |
6. | | PT Bank Rakyat Indonesia (Persero) Tbk | | | 2.4 | |
7. | | BB Seguridade Participacoes S.A. | | | 2.3 | |
8. | | AIA Group Ltd. | | | 2.2 | |
9. | | Fomento Economico Mexicano, S.A.B. de C.V.-ADR | | | 2.2 | |
10. | | PT Bank Negara Indonesia (Persero) Tbk | | | 2.2 | |
| | | | |
Total Net Assets | | | $29.2 million | |
| |
| Total Number of Holdings* | | | 55 | |
The Fund’s holdings are subject to change, and there is no assurance that the Fund will continue to hold any particular security.
*Excluding money market fund holdings.
Data presented here are as of October 31, 2016.
4 Invesco Emerging Markets Equity Fund
Fund performance was Phoenix Healthcare Group, a Chinese private hospital company. The stock performed poorly after the announcement that a major shareholder was trimming his position and because investors worried about delays in the company’s acquisition of hospitals. We sold our position in Phoenix Healthcare during the reporting period. In addition, Korean food company Ottogi detracted from Fund performance as the company’s stock price declined due to disappointing earnings.
Relative to its style-specific benchmark, the Fund ended the reporting period with overweight positions in the consumer discretionary, consumer staples, financials, industrials and IT sectors, and underweight positions in the health care, materials and utilities sectors.
Geographically, the Fund maintained overweight positions in India, Indonesia, Mexico and Thailand throughout the reporting period. Conversely, the Fund maintained underweight positions in Malaysia and South Africa.
Following our mandate as a conservative cornerstone for our clients’ portfolios, our team continues to seek out attractive risk-return growth-value anomalies with a long-term perspective.
Thank you for your investment in Invesco Emerging Markets Equity Fund.
The views and opinions expressed in management’s discussion of Fund performance are those of Invesco Advisers, Inc. These views and opinions are subject to change at any time based on factors such as market and economic conditions. These views and opinions may not be relied upon as investment advice or recommendations, or as an offer for a particular security. The information is not a complete analysis of every aspect of any market, country, industry, security or the Fund. Statements of fact are from sources considered reliable, but Invesco Advisers, Inc. makes no representation or warranty as to their completeness or accuracy. Although historical performance is no guarantee of future results, these insights may help you understand our investment management philosophy.
See important Fund and, if applicable, index disclosures later in this report.
| | |
 | | Ingrid Baker Chartered Financial Analyst, Portfolio Manager, is manager of Invesco Emerging Markets |
Equity Fund. She joined Invesco in 1999. Ms. Baker earned a BA in international politics from Oberlin College and an MBA from the IESE Business School in Barcelona, Spain.
Assisted by Invesco’s Global Core Equity Team
5 Invesco Emerging Markets Equity Fund
Your Fund’s Long-Term Performance
Results of a $10,000 Investment – Oldest Share Class(es) since Inception
Fund and index data from 5/31/11
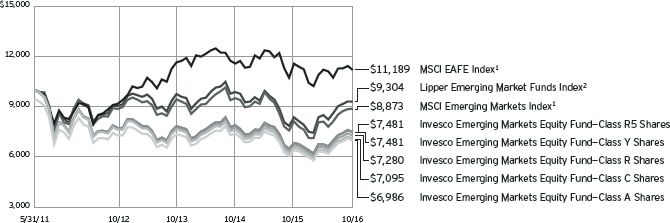
| 1 | Source: FactSet Research Systems Inc. |
Past performance cannot guarantee comparable future results.
The data shown in the chart include reinvested distributions, applicable sales charges and Fund expenses including
management fees. Index results include reinvested dividends, but they do not reflect sales charges. Performance of the peer group, if applicable, reflects fund expenses and management fees; perfor-
mance of a market index does not. Performance shown in the chart and table(s) does not reflect deduction of taxes a shareholder would pay on Fund distributions or sale of Fund shares.
continued from page 8
About indexes used in this report
| ∎ | | The MSCI EAFE® Index is an unmanaged index considered representative of stocks of Europe, Australasia and the Far East. The index is computed using the net return, which withholds applicable taxes for non-resident investors. |
| ∎ | | The MSCI Emerging Markets IndexSM is an unmanaged index considered representative of stocks of developing countries. The index is computed using the net return, which withholds applicable taxes for non-resident investors. |
| ∎ | | The Lipper Emerging Market Funds Index is an unmanaged index considered representative of emerging market funds tracked by Lipper. |
| ∎ | | The Fund is not managed to track the performance of any particular index, including the index(es) described here, and consequently, the performance of the Fund may deviate significantly from the performance of the index(es). |
| ∎ | | A direct investment cannot be made in an index. Unless otherwise indicated, index results include reinvested dividends, and they do not reflect sales |
charges. Performance of the peer group, if applicable, reflects fund expenses; performance of a market index does not.
Other information
| ∎ | | The returns shown in management’s discussion of Fund performance are based on net asset values (NAVs) calculated for shareholder transactions. Generally accepted accounting principles require adjustments to be made to the net assets of the Fund at period end for financial reporting purposes, and as such, the NAVs for shareholder transactions and the returns based on those NAVs may differ from the NAVs and returns reported in the Financial Highlights. |
| ∎ | | Industry classifications used in this report are generally according to the Global Industry Classification Standard, which was developed by and is the exclusive property and a service mark of MSCI Inc. and Standard & Poor’s. |
6 Invesco Emerging Markets Equity Fund
| | | | |
| Average Annual Total Returns | |
| As of 10/31/16, including maximum applicable sales charges | |
| |
Class A Shares | | | | |
Inception (5/31/11) | | | -6.40 | % |
5 Years | | | -2.85 | |
1 Year | | | 3.18 | |
| |
Class C Shares | | | | |
Inception (5/31/11) | | | -6.14 | % |
5 Years | | | -2.47 | |
1 Year | | | 7.40 | |
| |
Class R Shares | | | | |
Inception (5/31/11) | | | -5.69 | % |
5 Years | | | 2.01 | |
1 Year | | | 8.77 | |
| |
Class Y Shares | | | | |
Inception (5/31/11) | | | -5.21 | % |
5 Years | | | -1.50 | |
1 Year | | | 9.49 | |
| |
Class R5 Shares | | | | |
Inception (5/31/11) | | | -5.21 | % |
5 Years | | | -1.50 | |
1 Year | | | 9.49 | |
| |
Class R6 Shares | | | | |
Inception | | | -5.27 | % |
5 Years | | | -1.57 | |
1 Year | | | 9.33 | |
Class R6 shares incepted on September 24, 2012. Performance shown prior to that date is that of Class A shares and includes the 12b-1 fees applicable to Class A shares.
The performance data quoted represent past performance and cannot guarantee comparable future results; current performance may be lower or higher. Please visit invesco.com/performance for the most recent month-end performance. Performance figures reflect reinvested distributions, changes in net asset value and the effect of the maximum sales charge unless otherwise stated. Investment return and principal value will fluctuate so that you may have a gain or loss when you sell shares.
The net annual Fund operating expense ratio set forth in the most recent Fund prospectus as of the date of this report for Class A, Class C, Class R, Class Y, Class R5 and Class R6 shares was 1.55%, 2.30%, 1.80%, 1.30%, 1.30% and 1.30%, respectively.1,2 The total annual Fund operating expense ratio set forth in the most recent Fund prospectus as of the date of this report for Class A, Class C, Class R, Class Y, Class R5 and Class R6 shares was
| | | | |
| Average Annual Total Returns | |
| As of 9/30/16, the most recent calendar quarter end, including maximum applicable sales charges | |
| |
Class A Shares | | | | |
Inception (5/31/11) | | | -6.21 | % |
5 Years | | | -0.14 | |
1 Year | | | 10.69 | |
| |
Class C Shares | | | | |
Inception (5/31/11) | | | -5.93 | % |
5 Years | | | 0.22 | |
1 Year | | | 15.04 | |
| |
Class R Shares | | | | |
Inception (5/31/11) | | | -5.48 | % |
5 Years | | | 0.70 | |
1 Year | | | 16.53 | |
| |
Class Y Shares | | | | |
Inception (5/31/11) | | | -5.00 | % |
5 Years | | | 1.22 | |
1 Year | | | 17.45 | |
| |
Class R5 Shares | | | | |
Inception (5/31/11) | | | -5.00 | % |
5 Years | | | 1.22 | |
1 Year | | | 17.26 | |
| |
Class R6 Shares | | | | |
Inception | | | -5.03 | % |
5 Years | | | 1.21 | |
1 Year | | | 17.42 | |
2.59%, 3.34%, 2.84%, 2.34%, 1.99% and 1.99%, respectively. The expense ratios presented above may vary from the expense ratios presented in other sections of this report that are based on expenses incurred during the period covered by this report.
Class A share performance reflects the maximum 5.50% sales charge, and Class C share performance reflects the applicable contingent deferred sales charge (CDSC) for the period involved. The CDSC on Class C shares is 1% for the first year after purchase. Class R, Class Y, Class R5 and Class R6 shares do not have a front-end sales charge or a CDSC; therefore, performance is at net asset value.
The performance of the Fund’s share classes will differ primarily due to different sales charge structures and class expenses.
Fund performance reflects any applicable fee waivers and/or expense reimbursements. Had the adviser not waived fees and/or reimbursed expenses currently or in the past, returns would have been lower. See current prospectus for more information.
| 1 | Total annual Fund operating expenses after any contractual fee waivers and/or expense reimbursements by the adviser in effect through at least June 30, 2018. See current prospectus for more information. |
| 2 | Total annual Fund operating expenses after any contractual fee waivers and/or expense reimbursements by the adviser in effect through at least March 31, 2017. See current prospectus for more information. |
7 Invesco Emerging Markets Equity Fund
Invesco Emerging Markets Equity Fund’s investment objective is long-term growth of capital.
| ∎ | | Unless otherwise stated, information presented in this report is as of October 31, 2016, and is based on total net assets. |
| ∎ | | Unless otherwise noted, all data provided by Invesco. |
| ∎ | | To access your Fund’s reports/prospectus, visit invesco.com/fundreports. |
About share classes
| ∎ | | Class R shares are generally available only to employer sponsored retirement and benefit plans. Please see the prospectus for more information. |
| ∎ | | Class Y shares are available only to certain investors. Please see the prospectus for more information. |
| ∎ | | Class R5 shares and Class R6 shares are primarily intended for employer sponsored retirement and benefit plans that meet certain standards and for institutional investors. Please see the prospectus for more information. |
Principal risks of investing in the Fund
| ∎ | | Depositary receipts risk. Investing in depositary receipts involves the same risks as direct investments in foreign securities. In addition, the underlying issuers of certain depositary receipts are under no obligation to distribute shareholder communications or pass through any voting rights with respect to the deposited securities to the holders of such receipts. The Fund may therefore receive less timely information or have less control than if it invested directly in the foreign issuer. |
| ∎ | | Emerging markets securities risk. Emerging markets (also referred to as developing markets) are generally subject to greater market volatility, political, social and economic instability, uncertain trading markets and more governmental limitations on foreign investment than more developed markets. In addition, emerging markets may be subject to lower trading volume and greater price fluctuations than companies in more developed markets. Securities law and the enforcement of systems of taxation in many emerging market countries may change quickly and unpredictably. In addition, investments in emerging markets securities may also be subject to additional transaction costs, delays in settlement procedures, and lack of timely information. |
| ∎ | | Foreign securities risk. The Fund’s foreign investments may be adversely affected |
| | | by political and social instability, changes in economic or taxation policies, difficulty in enforcing obligations, decreased liquidity or increased volatility. Foreign investments also involve the risk of the possible seizure, nationalization or expropriation of the issuer or foreign deposits (in which the Fund could lose its entire investments in a certain market) and the possible adoption of foreign governmental restrictions such as exchange controls. Unless the Fund has hedged its foreign securities risk, foreign securities risk also involves the risk of negative foreign currency rate fluctuations, which may cause the value of securities denominated in such foreign currency (or other instruments through which the Fund has exposure to foreign currencies) to decline in value. Currency exchange rates may fluctuate significantly over short periods of time. Currency hedging strategies, if used, are not always successful. |
| ∎ | | Geographic focus risk. The Fund may from time to time invest a substantial amount of its assets in securities of issuers located in a single country or a limited number of countries. Adverse economic, political or social conditions in those countries may therefore have a significant negative impact on the Fund’s investment performance. |
| ∎ | | Management risk. The Fund is actively managed and depends heavily on the Adviser’s judgment about markets, interest rates or the attractiveness, relative values, liquidity, or potential appreciation of particular investments made for the Fund’s portfolio. The Fund could experience losses if these judgments prove to be incorrect. Additionally, legislative, regulatory, or tax developments may adversely affect management of the Fund and, therefore, the ability of the Fund to achieve its investment objective. |
| ∎ | | Market risk. The market values of the Fund’s investments, and therefore the value of the Fund’s shares, will go up and down, sometimes rapidly or unpredictably. |
| | | Market risk may affect a single issuer, industry or section of the economy, or it may affect the market as a whole. Individual stock prices tend to go up and down more dramatically than those of certain other types of investments, such as bonds. During a general downturn in the financial markets, multiple asset classes may decline in value. When markets perform well, there can be no assurance that specific investments held by the Fund will rise in value. |
| ∎ | | Preferred securities risk. Preferred securities are subject to issuer-specific and market risks applicable generally to equity securities. Preferred securities also may be subordinated to bonds or other debt instruments, subjecting them to a greater risk of non-payment, may be less liquid than many other securities, such as common stocks, and generally offer no voting rights with respect to the issuer. |
| ∎ | | Sector focus risk. The Fund may from time to time invest a significant amount of its assets (i.e. over 25%) in one market sector or group of related industries. In this event, the Fund’s performance will depend to a greater extent on the overall condition of the sector or group of industries and there is increased risk that the Fund will lose significant value if conditions adversely affect that sector or group of industries. |
| ∎ | | Small- and mid-capitalization companies risks. Small- and mid-capitalization companies tend to be more vulnerable to changing market conditions, may have little or no operating history or track record of success, and may have more limited product lines and markets, less experienced management and fewer financial resources than larger companies. These companies’ securities may be more volatile and less liquid than those of more established companies, and their returns may vary, sometimes significantly, from the overall securities market. |
| ∎ | | Value investing style risk. A value investing style subjects the Fund to the risk that the valuations never improve or that the returns on value equity securities are less than returns on other styles of investing or the overall stock market. |
| | |
This report must be accompanied or preceded by a currently effective Fund prospectus, which contains more complete information, including sales charges and expenses. Investors should read it carefully before investing. | | continued on page 6 |
NOT FDIC INSURED | MAY LOSE VALUE | NO BANK GUARANTEE | | |
8 Invesco Emerging Markets Equity Fund
Schedule of Investments
October 31, 2016
| | | | | | | | |
| | | Shares | | | Value | |
Common Stocks & Other Equity Interests–98.58% | |
| Argentina–1.76% | |
Banco Macro S.A.–ADR | | | 3,534 | | | $ | 269,397 | |
Grupo Financiero Galicia S.A.–ADR | | | 7,820 | | | | 243,515 | |
| | | | | | | | 512,912 | |
|
| Brazil–9.17% | |
BB Seguridade Participacoes S.A. | | | 67,400 | | | | 678,805 | |
Cia Energética de Minas Gerais–Preference Shares | | | 100,100 | | | | 305,828 | |
Grendene S.A. | | | 94,800 | | | | 582,836 | |
MAHLE Metal Leve S.A. | | | 67,100 | | | | 465,311 | |
Multiplus S.A. | | | 23,900 | | | | 324,134 | |
Raia Drogasil S.A. | | | 14,600 | | | | 324,185 | |
| | | | | | | | 2,681,099 | |
|
| China–20.10% | |
Baidu, Inc.–ADR(a) | | | 5,518 | | | | 975,914 | |
Bank of China Ltd.–Class H | | | 1,320,000 | | | | 590,675 | |
Industrial & Commercial Bank of China Ltd.–Class H | | | 501,000 | | | | 300,872 | |
Ping An Insurance (Group) Co. of China Ltd.–Class H | | | 114,500 | | | | 604,578 | |
Shenzhou International Group Holdings Ltd. | | | 84,000 | | | | 557,260 | |
TAL Education Group–ADR(a) | | | 7,847 | | | | 639,060 | |
Tencent Holdings Ltd. | | | 59,900 | | | | 1,586,157 | |
Zhuzhou CRRC Times Electric Co., Ltd.–Class H | | | 128,000 | | | | 619,588 | |
| | | | | | | | 5,874,104 | |
|
| Hong Kong–4.98% | |
AIA Group Ltd. | | | 103,400 | | | | 652,629 | |
Man Wah Holdings Ltd. | | | 563,200 | | | | 373,992 | |
Techtronic Industries Co. Ltd. | | | 113,500 | | | | 427,338 | |
| | | | | | | | 1,453,959 | |
|
| India–11.80% | |
Asian Paints Ltd. | | | 9,345 | | | | 150,537 | |
Axis Bank Ltd. | | | 38,753 | | | | 283,016 | |
Britannia Industries Ltd. | | | 6,132 | | | | 305,305 | |
Eicher Motors Ltd. | | | 1,021 | | | | 365,171 | |
Emami Ltd. | | | 14,837 | | | | 267,457 | |
HDFC Bank Ltd. | | | 27,940 | | | | 524,367 | |
InterGlobe Aviation Ltd.–REGS(b) | | | 31,721 | | | | 445,723 | |
Maruti Suzuki India Ltd. | | | 6,135 | | | | 541,672 | |
Tata Consultancy Services Ltd. | | | 15,770 | | | | 564,643 | |
| | | | | | | | 3,447,891 | |
|
| Indonesia–4.64% | |
PT Bank Negara Indonesia (Persero) Tbk | | | 1,511,100 | | | | 644,285 | |
PT Bank Rakyat Indonesia (Persero) Tbk | | | 764,300 | | | | 713,139 | |
| | | | | | | | 1,357,424 | |
| | | | | | | | |
| | | Shares | | | Value | |
| Malaysia–1.28% | |
My E.G. Services Bhd | | | 646,200 | | | $ | 375,352 | |
|
| Mexico–5.93% | |
Banregio Grupo Financiero, S.A.B. de C.V. | | | 59,700 | | | | 391,291 | |
Fomento Economico Mexicano, S.A.B. de C.V.–ADR | | | 6,797 | | | | 650,269 | |
Grupo Financiero Inbursa, S.A.B. de C.V.–Class O | | | 183,800 | | | | 299,492 | |
Wal-Mart de México, S.A.B. de C.V.–Series V | | | 185,800 | | | | 392,986 | |
| | | | | | | | 1,734,038 | |
|
| Peru–1.27% | |
Credicorp Ltd. | | | 2,496 | | | | 371,105 | |
|
| Russia–3.99% | |
Sberbank of Russia PJSC–ADR | | | 77,614 | | | | 734,822 | |
Yandex N.V.–Class A(a) | | | 21,880 | | | | 430,817 | |
| | | | | | | | 1,165,639 | |
|
| South Africa–3.86% | |
Clicks Group Ltd. | | | 32,342 | | | | 301,040 | |
Mr. Price Group Ltd. | | | 37,521 | | | | 427,778 | |
Naspers Ltd.–Class N | | | 2,376 | | | | 398,244 | |
| | | | | | | | 1,127,062 | |
|
| South Korea–13.99% | |
AMOREPACIFIC Group | | | 3,802 | | | | 491,964 | |
Hanssem Co., Ltd. | | | 4,117 | | | | 637,595 | |
KEPCO Plant Service & Engineering Co., Ltd. | | | 11,550 | | | | 554,388 | |
LOEN Entertainment, Inc.(a) | | | 4,859 | | | | 286,330 | |
Medy-Tox Inc. | | | 1,006 | | | | 357,798 | |
Ottogi Corp. | | | 676 | | | | 388,895 | |
Samsung Electronics Co., Ltd. | | | 962 | | | | 1,372,434 | |
| | | | | | | | 4,089,404 | |
|
| Taiwan–10.96% | |
Eclat Textile Co., Ltd. | | | 47,000 | | | | 534,683 | |
King Slide Works Co., Ltd. | | | 48,000 | | | | 587,993 | |
President Chain Store Corp. | | | 53,000 | | | | 396,362 | |
Taiwan Semiconductor Manufacturing Co. Ltd. | | | 282,000 | | | | 1,684,476 | |
| | | | | | | | 3,203,514 | |
|
| Thailand–4.85% | |
Delta Electronics (Thailand) PCL | | | 265,500 | | | | 594,969 | |
Kasikornbank PCL | | | 94,700 | | | | 464,201 | |
Thanachart Capital PCL | | | 316,800 | | | | 357,225 | |
| | | | | | | | 1,416,395 | |
Total Common Stocks & Other Equity Interests
(Cost $26,766,132) | | | | 28,809,898 | |
See accompanying Notes to Financial Statements which are an integral part of the financial statements.
9 Invesco Emerging Markets Equity Fund
| | | | | | | | |
| | | Shares | | | Value | |
Money Market Funds–1.46% | | | | | | | | |
Government & Agency Portfolio–Institutional Class, 0.29%(c) | | | 256,451 | | | $ | 256,451 | |
Treasury Portfolio–Institutional Class, 0.22%(c) | | | 170,968 | | | | 170,968 | |
Total Money Market Funds
(Cost $427,419) | | | | 427,419 | |
TOTAL INVESTMENTS–100.04%
(Cost $27,193,551) | | | | 29,237,317 | |
OTHER ASSETS LESS LIABILITIES–(0.04)% | | | | (11,365 | ) |
NET ASSETS–100.00% | | | $ | 29,225,952 | |
Investment Abbreviations:
| | |
| ADR | | – American Depositary Receipt |
| REGS | | – Regulation S |
Notes to Schedule of Investments:
| (a) | Non-income producing security. |
| (b) | Security purchased or received in transaction exempt from registration under the Securities Act of 1933, as amended (the “1933 Act”). The security may be resold pursuant to an exemption from registration under the 1933 Act, typically to qualified institutional buyers. The value of this security at October 31, 2016 represented 1.53% of the Fund’s Net Assets. |
| (c) | The money market fund and the Fund are affiliated by having the same investment adviser. The rate shown is the 7-day SEC standardized yield as of October 31, 2016. |
See accompanying Notes to Financial Statements which are an integral part of the financial statements.
10 Invesco Emerging Markets Equity Fund
Statement of Assets and Liabilities
October 31, 2016
| | | | |
Assets: | |
Investments, at value (Cost $26,766,132) | | $ | 28,809,898 | |
Investments in affiliated money market funds, at value and cost | | | 427,419 | |
Total investments, at value (Cost $27,193,551) | | | 29,237,317 | |
Foreign currencies, at value (Cost $19,680) | | | 19,736 | |
Receivable for: | | | | |
Fund shares sold | | | 86,546 | |
Dividends | | | 18,866 | |
Investment for trustee deferred compensation and retirement plans | | | 17,759 | |
Other assets | | | 20,180 | |
Total assets | | | 29,400,404 | |
|
Liabilities: | |
Payable for: | | | | |
Fund shares reacquired | | | 19,926 | |
Accrued foreign taxes | | | 57,380 | |
Accrued fees to affiliates | | | 19,295 | |
Accrued trustees’ and officers’ fees and benefits | | | 1,526 | |
Accrued other operating expenses | | | 57,753 | |
Trustee deferred compensation and retirement plans | | | 18,572 | |
Total liabilities | | | 174,452 | |
Net assets applicable to shares outstanding | | $ | 29,225,952 | |
|
Net assets consist of: | |
Shares of beneficial interest | | $ | 33,051,227 | |
Undistributed net investment income | | | 32,215 | |
Undistributed net realized gain (loss) | | | (5,901,049 | ) |
Net unrealized appreciation | | | 2,043,559 | |
| | | $ | 29,225,952 | |
| | | | |
Net Assets: | |
Class A | | $ | 11,855,269 | |
Class C | | $ | 3,149,030 | |
Class R | | $ | 1,263,083 | |
Class Y | | $ | 4,857,846 | |
Class R5 | | $ | 1,496,643 | |
Class R6 | | $ | 6,604,081 | |
|
Shares outstanding, $0.01 par value per share,
with an unlimited number of shares authorized: | |
Class A | | | 1,663,885 | |
Class C | | | 451,894 | |
Class R | | | 178,750 | |
Class Y | | | 679,661 | |
Class R5 | | | 209,350 | |
Class R6 | | | 923,084 | |
Class A: | | | | |
Net asset value per share | | $ | 7.13 | |
Maximum offering price per share | | | | |
(Net asset value of $7.13 ¸ 94.50%) | | $ | 7.54 | |
Class C: | | | | |
Net asset value and offering price per share | | $ | 6.97 | |
Class R: | | | | |
Net asset value and offering price per share | | $ | 7.07 | |
Class Y: | | | | |
Net asset value and offering price per share | | $ | 7.15 | |
Class R5: | | | | |
Net asset value and offering price per share | | $ | 7.15 | |
Class R6: | | | | |
Net asset value and offering price per share | | $ | 7.15 | |
See accompanying Notes to Financial Statements which are an integral part of the financial statements.
11 Invesco Emerging Markets Equity Fund
Statement of Operations
For the year ended October 31, 2016
| | | | |
Investment income: | |
Dividends (net of foreign withholding taxes of $54,125) | | $ | 533,382 | |
Dividends from affiliated money market funds | | | 1,102 | |
Total investment income | | | 534,484 | |
| |
Expenses: | | | | |
Advisory fees | | | 250,760 | |
Administrative services fees | | | 50,000 | |
Custodian fees | | | 41,474 | |
Distribution fees: | | | | |
Class A | | | 27,524 | |
Class C | | | 28,117 | |
Class R | | | 6,252 | |
Transfer agent fees — A, C, R and Y | | | 66,971 | |
Transfer agent fees — R5 | | | 20 | |
Transfer agent fees — R6 | | | 91 | |
Trustees’ and officers’ fees and benefits | | | 19,254 | |
Registration and filing fees | | | 71,129 | |
Reports to shareholders | | | 19,120 | |
Professional services fees | | | 63,541 | |
Other | | | 17,606 | |
Total expenses | | | 661,859 | |
Less: Fees waived, expenses reimbursed and expense offset arrangement(s) | | | (222,285 | ) |
Net expenses | | | 439,574 | |
Net investment income | | | 94,910 | |
| |
Realized and unrealized gain (loss) from: | | | | |
Net realized gain (loss) from: | | | | |
Investment securities (net of foreign taxes of $9,441) | | | (174,611 | ) |
Foreign currencies | | | (50,565 | ) |
| | | | (225,176 | ) |
Change in net unrealized appreciation of: | | | | |
Investment securities (net of foreign taxes of $57,864) | | | 2,613,749 | |
Foreign currencies | | | 2,953 | |
| | | | 2,616,702 | |
Net realized and unrealized gain | | | 2,391,526 | |
Net increase in net assets resulting from operations | | $ | 2,486,436 | |
See accompanying Notes to Financial Statements which are an integral part of the financial statements.
12 Invesco Emerging Markets Equity Fund
Statement of Changes in Net Assets
For the years ended October 31, 2016 and 2015
| | | | | | | | |
| | | 2016 | | | 2015 | |
Operations: | | | | | |
Net investment income | | $ | 94,910 | | | $ | 72,645 | |
Net realized gain (loss) | | | (225,176 | ) | | | (3,148,831 | ) |
Change in net unrealized appreciation (depreciation) | | | 2,616,702 | | | | (705,812 | ) |
Net increase (decrease) in net assets resulting from operations | | | 2,486,436 | | | | (3,781,998 | ) |
| | |
Distributions to shareholders from net investment income: | | | | | | | | |
Class A | | | — | | | | (44,461 | ) |
Class R | | | — | | | | (2,660 | ) |
Class Y | | | — | | | | (24,019 | ) |
Class R5 | | | — | | | | (6,406 | ) |
Class R6 | | | — | | | | (59,556 | ) |
Total distributions from net investment income | | | — | | | | (137,102 | ) |
| | |
Share transactions–net: | | | | | | | | |
Class A | | | 308,968 | | | | 1,351,218 | |
Class C | | | 325,234 | | | | 163,778 | |
Class R | | | (42,617 | ) | | | 35,294 | |
Class Y | | | 886,210 | | | | 854,056 | |
Class R5 | | | 477,784 | | | | 141,935 | |
Class R6 | | | (1,154,945 | ) | | | 183,789 | |
Net increase in net assets resulting from share transactions | | | 800,634 | | | | 2,730,070 | |
Net increase (decrease) in net assets | | | 3,287,070 | | | | (1,189,030 | ) |
| | |
Net assets: | | | | | | | | |
Beginning of year | | | 25,938,882 | | | | 27,127,912 | |
End of year (includes undistributed net investment income of $32,215 and $(16,270), respectively) | | $ | 29,225,952 | | | $ | 25,938,882 | |
Notes to Financial Statements
October 31, 2016
NOTE 1—Significant Accounting Policies
Invesco Emerging Markets Equity Fund (the “Fund”) is a series portfolio of AIM Investment Funds (Invesco Investment Funds) (the “Trust”). The Trust is organized as a Delaware statutory trust and is registered under the Investment Company Act of 1940, as amended (the “1940 Act”), as an open-end series management investment company consisting of twenty-two separate series portfolios, each authorized to issue an unlimited number of shares of beneficial interest. The assets, liabilities and operations of each portfolio are accounted for separately. Information presented in these financial statements pertains only to the Fund. Matters affecting each portfolio or class will be voted on exclusively by the shareholders of such portfolio or class.
The Fund’s investment objective is long-term growth of capital.
The Fund currently consists of six different classes of shares: Class A, Class C, Class R, Class Y, Class R5 and Class R6. Class Y shares are available only to certain investors. Class A shares are sold with a front-end sales charge unless certain waiver criteria are met and under certain circumstances load waived shares may be subject to contingent deferred sales charges (“CDSC”). Class C shares are sold with a CDSC. Class R, Class Y, Class R5 and Class R6 shares are sold at net asset value.
The following is a summary of the significant accounting policies followed by the Fund in the preparation of its financial statements.
| A. | Security Valuations — Securities, including restricted securities, are valued according to the following policy. |
A security listed or traded on an exchange (except convertible securities) is valued at its last sales price or official closing price as of the close of the customary trading session on the exchange where the security is principally traded, or lacking any sales or official closing price on a particular day, the security may be valued at the closing bid price on that day. Securities traded in the over-the-counter market are valued based on prices furnished by independent pricing services or market makers. When such securities are valued by an independent pricing service they may be considered fair valued. Futures contracts are valued at the final settlement price set by an exchange on which they are principally traded. Listed options are valued at the mean between the last bid and asked prices from the exchange on which they are principally traded. Options not listed on an exchange are valued by an independent source at the mean between the last bid and asked prices. For purposes of determining net asset value (“NAV”) per share, futures and option contracts generally are valued 15 minutes after the close of the customary trading session of the New York Stock Exchange (“NYSE”).
13 Invesco Emerging Markets Equity Fund
Investments in open-end and closed-end registered investment companies that do not trade on an exchange are valued at the end-of-day net asset value per share. Investments in open-end and closed-end registered investment companies that trade on an exchange are valued at the last sales price or official closing price as of the close of the customary trading session on the exchange where the security is principally traded.
Debt obligations (including convertible securities) and unlisted equities are fair valued using an evaluated quote provided by an independent pricing service. Evaluated quotes provided by the pricing service may be determined without exclusive reliance on quoted prices, and may reflect appropriate factors such as institution-size trading in similar groups of securities, developments related to specific securities, dividend rate (for unlisted equities), yield (for debt obligations), quality, type of issue, coupon rate (for debt obligations), maturity (for debt obligations), individual trading characteristics and other market data. Debt obligations are subject to interest rate and credit risks. In addition, all debt obligations involve some risk of default with respect to interest and/or principal payments.
Foreign securities’ (including foreign exchange contracts) prices are converted into U.S. dollar amounts using the applicable exchange rates as of the close of the NYSE. If market quotations are available and reliable for foreign exchange-traded equity securities, the securities will be valued at the market quotations. Because trading hours for certain foreign securities end before the close of the NYSE, closing market quotations may become unreliable. If between the time trading ends on a particular security and the close of the customary trading session on the NYSE, events occur that the Adviser determines are significant and make the closing price unreliable, the Fund may fair value the security. If the event is likely to have affected the closing price of the security, the security will be valued at fair value in good faith using procedures approved by the Board of Trustees. Adjustments to closing prices to reflect fair value may also be based on a screening process of an independent pricing service to indicate the degree of certainty, based on historical data, that the closing price in the principal market where a foreign security trades is not the current value as of the close of the NYSE. Foreign securities’ prices meeting the approved degree of certainty that the price is not reflective of current value will be priced at the indication of fair value from the independent pricing service. Multiple factors may be considered by the independent pricing service in determining adjustments to reflect fair value and may include information relating to sector indices, American Depositary Receipts and domestic and foreign index futures. Foreign securities may have additional risks including exchange rate changes, potential for sharply devalued currencies and high inflation, political and economic upheaval, the relative lack of issuer information, relatively low market liquidity and the potential lack of strict financial and accounting controls and standards.
Securities for which market prices are not provided by any of the above methods may be valued based upon quotes furnished by independent sources. The last bid price may be used to value equity securities. The mean between the last bid and asked prices is used to value debt obligations, including corporate loans.
Securities for which market quotations are not readily available or became unreliable are valued at fair value as determined in good faith by or under the supervision of the Trust’s officers following procedures approved by the Board of Trustees. Issuer specific events, market trends, bid/asked quotes of brokers and information providers and other market data may be reviewed in the course of making a good faith determination of a security’s fair value.
The Fund may invest in securities that are subject to interest rate risk, meaning the risk that the prices will generally fall as interest rates rise and, conversely, the prices will generally rise as interest rates fall. Specific securities differ in their sensitivity to changes in interest rates depending on their individual characteristics. Changes in interest rates may result in increased market volatility, which may affect the value and/or liquidity of certain Fund investments.
Valuations change in response to many factors including the historical and prospective earnings of the issuer, the value of the issuer’s assets, general economic conditions, interest rates, investor perceptions and market liquidity. Because of the inherent uncertainties of valuation, the values reflected in the financial statements may materially differ from the value received upon actual sale of those investments.
| B. | Securities Transactions and Investment Income — Securities transactions are accounted for on a trade date basis. Realized gains or losses on sales are computed on the basis of specific identification of the securities sold. Interest income (net of withholding tax, if any) is recorded on the accrual basis from settlement date. Dividend income (net of withholding tax, if any) is recorded on the ex-dividend date. |
The Fund may periodically participate in litigation related to Fund investments. As such, the Fund may receive proceeds from litigation settlements. Any proceeds received are included in the Statement of Operations as realized gain (loss) for investments no longer held and as unrealized gain (loss) for investments still held.
Brokerage commissions and mark ups are considered transaction costs and are recorded as an increase to the cost basis of securities purchased and/or a reduction of proceeds on a sale of securities. Such transaction costs are included in the determination of net realized and unrealized gain (loss) from investment securities reported in the Statement of Operations and the Statement of Changes in Net Assets and the net realized and unrealized gains (losses) on securities per share in the Financial Highlights. Transaction costs are included in the calculation of the Fund’s net asset value and, accordingly, they reduce the Fund’s total returns. These transaction costs are not considered operating expenses and are not reflected in net investment income reported in the Statement of Operations and the Statement of Changes in Net Assets, or the net investment income per share and the ratios of expenses and net investment income reported in the Financial Highlights, nor are they limited by any expense limitation arrangements between the Fund and the investment adviser.
The Fund allocates income and realized and unrealized capital gains and losses to a class based on the relative net assets of each class.
| C. | Country Determination — For the purposes of making investment selection decisions and presentation in the Schedule of Investments, the investment adviser may determine the country in which an issuer is located and/or credit risk exposure based on various factors. These factors include the laws of the country under which the issuer is organized, where the issuer maintains a principal office, the country in which the issuer derives 50% or more of its total revenues and the country that has the primary market for the issuer’s securities, as well as other criteria. Among the other criteria that may be evaluated for making this determination are the country in which the issuer maintains 50% or more of its assets, the type of security, financial guarantees and enhancements, the nature of the collateral and the sponsor organization. Country of issuer and/or credit risk exposure has been determined to be the United States of America, unless otherwise noted. |
| D. | Distributions — Distributions from net investment income and net realized capital gain, if any, are generally declared and paid annually and recorded on the ex-dividend date. The Fund may elect to treat a portion of the proceeds from redemptions as distributions for federal income tax purposes. |
| E. | Federal Income Taxes — The Fund intends to comply with the requirements of Subchapter M of the Internal Revenue Code of 1986, as amended (the “Internal Revenue Code”), necessary to qualify as a regulated investment company and to distribute substantially all of the Fund’s |
14 Invesco Emerging Markets Equity Fund
| | taxable earnings to shareholders. As such, the Fund will not be subject to federal income taxes on otherwise taxable income (including net realized capital gain) that is distributed to shareholders. Therefore, no provision for federal income taxes is recorded in the financial statements. |
The Fund recognizes the tax benefits of uncertain tax positions only when the position is more likely than not to be sustained. Management has analyzed the Fund’s uncertain tax positions and concluded that no liability for unrecognized tax benefits should be recorded related to uncertain tax positions. Management is not aware of any tax positions for which it is reasonably possible that the total amounts of unrecognized tax benefits will change materially in the next 12 months.
The Fund files tax returns in the U.S. Federal jurisdiction and certain other jurisdictions. Generally, the Fund is subject to examinations by such taxing authorities for up to three years after the filing of the return for the tax period.
| F. | Expenses — Fees provided for under the Rule 12b-1 plan of a particular class of the Fund are charged to the operations of such class. Transfer agency fees and expenses and other shareholder recordkeeping fees and expenses attributable to Class R5 and Class R6 are allocated to each share class based on relative net assets. Sub-accounting fees attributable to Class R5 are charged to the operations of the class. Transfer agency fees and expenses and other shareholder recordkeeping fees and expenses relating to all other classes are allocated among those classes based on relative net assets. All other expenses are allocated among the classes based on relative net assets. |
| G. | Accounting Estimates — The preparation of financial statements in conformity with accounting principles generally accepted in the United States of America (“GAAP”) requires management to make estimates and assumptions that affect the reported amounts of assets and liabilities at the date of the financial statements and the reported amounts of revenues and expenses during the reporting period including estimates and assumptions related to taxation. Actual results could differ from those estimates by a significant amount. In addition, the Fund monitors for material events or transactions that may occur or become known after the period-end date and before the date the financial statements are released to print. |
| H. | Indemnifications — Under the Trust’s organizational documents, each Trustee, officer, employee or other agent of the Trust is indemnified against certain liabilities that may arise out of the performance of their duties to the Fund. Additionally, in the normal course of business, the Fund enters into contracts, including the Fund’s servicing agreements, that contain a variety of indemnification clauses. The Fund’s maximum exposure under these arrangements is unknown as this would involve future claims that may be made against the Fund that have not yet occurred. The risk of material loss as a result of such indemnification claims is considered remote. |
| I. | Foreign Currency Translations — Foreign currency is valued at the close of the NYSE based on quotations posted by banks and major currency dealers. Portfolio securities and other assets and liabilities denominated in foreign currencies are translated into U.S. dollar amounts at date of valuation. Purchases and sales of portfolio securities (net of foreign taxes withheld on disposition) and income items denominated in foreign currencies are translated into U.S. dollar amounts on the respective dates of such transactions. The Fund does not separately account for the portion of the results of operations resulting from changes in foreign exchange rates on investments and the fluctuations arising from changes in market prices of securities held. The combined results of changes in foreign exchange rates and the fluctuation of market prices on investments (net of estimated foreign tax withholding) are included with the net realized and unrealized gain or loss from investments in the Statement of Operations. Reported net realized foreign currency gains or losses arise from (1) sales of foreign currencies, (2) currency gains or losses realized between the trade and settlement dates on securities transactions, and (3) the difference between the amounts of dividends, interest, and foreign withholding taxes recorded on the Fund’s books and the U.S. dollar equivalent of the amounts actually received or paid. Net unrealized foreign currency gains and losses arise from changes in the fair values of assets and liabilities, other than investments in securities at fiscal period end, resulting from changes in exchange rates. |
The Fund may invest in foreign securities, which may be subject to foreign taxes on income, gains on investments or currency repatriation, a portion of which may be recoverable. Foreign taxes, if any, are recorded based on the tax regulations and rates that exist in the foreign markets in which the Fund invests and are shown in the Statement of Operations.
| J. | Forward Foreign Currency Contracts — The Fund may engage in foreign currency transactions either on a spot (i.e. for prompt delivery and settlement) basis, or through forward foreign currency contracts, to manage or minimize currency or exchange rate risk. |
The Fund may also enter into forward foreign currency contracts for the purchase or sale of a security denominated in a foreign currency in order to “lock in” the U.S. dollar price of that security, or the Fund may also enter into forward foreign currency contracts that do not provide for physical settlement of the two currencies, but instead are settled by a single cash payment calculated as the difference between the agreed upon exchange rate and the spot rate at settlement based upon an agreed upon notional amount (non-deliverable forwards). The Fund will set aside liquid assets in an amount equal to the daily mark-to-market obligation for forward foreign currency contracts.
A forward foreign currency contract is an obligation between two parties (“Counterparties”) to purchase or sell a specific currency for an agreed-upon price at a future date. The use of forward foreign currency contracts does not eliminate fluctuations in the price of the underlying securities the Fund owns or intends to acquire but establishes a rate of exchange in advance. Fluctuations in the value of these contracts are measured by the difference in the contract date and reporting date exchange rates and are recorded as unrealized appreciation (depreciation) until the contracts are closed. When the contracts are closed, realized gains (losses) are recorded. Realized and unrealized gains (losses) on the contracts are included in the Statement of Operations. The primary risks associated with forward foreign currency contracts include failure of the Counterparty to meet the terms of the contract and the value of the foreign currency changing unfavorably. These risks may be in excess of the amounts reflected in the Statement of Assets and Liabilities.
15 Invesco Emerging Markets Equity Fund
NOTE 2—Advisory Fees and Other Fees Paid to Affiliates
The Trust has entered into a master investment advisory agreement with Invesco Advisers, Inc. (the “Adviser” or “Invesco”). Under the terms of the investment advisory agreement, the Fund pays an advisory fee to the Adviser based on the annual rate of the Fund’s average daily net assets as follows:
| | | | | | | | |
| Average Daily Net Assets | | Rate | |
First $250 million | | | 0 | .935% | | | | |
Next $250 million | | | 0 | .91% | | | | |
Next $500 million | | | 0 | .885% | | | | |
Next $1.5 billion | | | 0 | .86% | | | | |
Next $2.5 billion | | | 0 | .835% | | | | |
Next $2.5 billion | | | 0 | .81% | | | | |
Next $2.5 billion | | | 0 | .785 | | | | |
Over $10 billion | | | 0 | .76% | | | | |
For the year ended October 31, 2016, the effective advisory fees incurred by the Fund was 0.935%.
Under the terms of a master sub-advisory agreement between the Adviser and each of Invesco Asset Management Deutschland GmbH, Invesco Asset Management Limited, Invesco Asset Management (Japan) Limited, Invesco Hong Kong Limited, Invesco Senior Secured Management, Inc. and Invesco Canada Ltd. (collectively, the “Affiliated Sub-Advisers”) the Adviser, not the Fund, will pay 40% of the fees paid to the Adviser to any such Affiliated Sub-Adviser(s) that provide(s) discretionary investment management services to the Fund based on the percentage of assets allocated to such Affiliated Sub-Adviser(s).
Effective April 1, 2016, the Adviser has contractually agreed, through at least March 31, 2017, to waive advisory fees and/or reimburse expenses to the extent necessary to limit total annual fund operating expenses after fee waiver and/or expense reimbursement (excluding certain items discussed below) of Class A, Class C, Class R, Class Y, Class R5 and Class R6 shares to 1.54%, 2.29%, 1.79%, 1.29%, 1.29% and 1.29%, respectively, of the Fund’s average daily net assets (the “expense limits”). Prior to April 1, 2016, the Adviser had contractually agreed to waive advisory fees and/or reimburse expenses to the extent necessary to limit total annual fund operating expenses after fee waiver and/or expense reimbursement (excluding certain items discussed below) of Class A, Class C, Class R, Class Y, Class R5 and Class R6 shares to 1.85%, 2.60%, 2.10%, 1.60%, 1.60% and 1.60%, respectively, of the Fund’s average daily net assets. In determining the Adviser’s obligation to waive advisory fees and/or reimburse expenses, the following expenses are not taken into account, and could cause the total annual fund operating expenses after fee waiver and/or expense reimbursement to exceed the numbers reflected above: (1) interest; (2) taxes; (3) dividend expense on short sales; (4) extraordinary or non-routine items, including litigation expenses; and (5) expenses that the Fund has incurred but did not actually pay because of an expense offset arrangement. Unless Invesco continues the fee waiver agreement, it will terminate on March 31, 2017. During its term, the fee waiver agreement cannot be terminated or amended to increase the expense limits without approval of the Board of Trustees.
Further, the Adviser has contractually agreed, through at least June 30, 2018, to waive the advisory fee payable by the Fund in an amount equal to 100% of the net advisory fees the Adviser receives from the affiliated money market funds on investments by the Fund of uninvested cash in such affiliated money market funds.
For the year ended October 31, 2016, the Adviser waived advisory fees of $155,203 and reimbursed class level expenses of $38,504, $9,833, $4,373, $13,715, $20 and $91 of Class A, Class C, Class R, Class Y, Class R5 and Class R6 shares, respectively.
The Trust has entered into a master administrative services agreement with Invesco pursuant to which the Fund has agreed to pay Invesco for certain administrative costs incurred in providing accounting services to the Fund. For the year ended October 31, 2016, expenses incurred under the agreement are shown in the Statement of Operations as Administrative services fees.
The Trust has entered into a transfer agency and service agreement with Invesco Investment Services, Inc. (“IIS”) pursuant to which the Fund has agreed to pay IIS a fee for providing transfer agency and shareholder services to the Fund and reimburse IIS for certain expenses incurred by IIS in the course of providing such services. IIS may make payments to intermediaries that provide omnibus account services, sub-accounting services and/or networking services. All fees payable by IIS to intermediaries that provide omnibus account services or sub-accounting are charged back to the Fund, subject to certain limitations approved by the Trust’s Board of Trustees. For the year ended October 31, 2016, expenses incurred under the agreement are shown in the Statement of Operations as Transfer agent fees.
The Trust has entered into master distribution agreements with Invesco Distributors, Inc. (“IDI”) to serve as the distributor for the Class A, Class C, Class R, Class Y, Class R5 and Class R6 shares of the Fund. The Trust has adopted plans pursuant to Rule 12b-1 under the 1940 Act with respect to the Fund’s Class A, Class C and Class R shares (collectively the “Plans”). The Fund, pursuant to the Plans, pays IDI compensation at the annual rate of 0.25% of the Fund’s average daily net assets of Class A shares, 1.00% of the average daily net assets of Class C shares and 0.50% of the average daily net assets of Class R shares. Of the Plan payments, up to 0.25% of the average daily net assets of each class of shares may be paid to furnish continuing personal shareholder services to customers who purchase and own shares of such classes. Any amounts not paid as a service fee under the Plans would constitute an asset-based sales charge. Rules of the Financial Industry Regulatory Authority (“FINRA”) impose a cap on the total sales charges, including asset-based sales charges, that may be paid by any class of shares of the Fund. For the year ended October 31, 2016, expenses incurred under the Plans are shown in the Statement of Operations as Distribution fees.
Front-end sales commissions and CDSC (collectively, the “sales charges”) are not recorded as expenses of the Fund. Front-end sales commissions are deducted from proceeds from the sales of Fund shares prior to investment in Class A shares of the Fund. CDSC are deducted from redemption proceeds prior to remittance to the shareholder. During the year ended October 31, 2016, IDI advised the Fund that IDI retained $6,037 in front-end sales commissions from the sale of Class A shares and $1,274 and $392 from Class A and Class C shares, respectively, for CDSC imposed upon redemptions by shareholders.
Certain officers and trustees of the Trust are officers and directors of the Adviser, IIS and/or IDI.
16 Invesco Emerging Markets Equity Fund
NOTE 3—Additional Valuation Information
GAAP defines fair value as the price that would be received to sell an asset or paid to transfer a liability in an orderly transaction between market participants at the measurement date, under current market conditions. GAAP establishes a hierarchy that prioritizes the inputs to valuation methods, giving the highest priority to readily available unadjusted quoted prices in an active market for identical assets (Level 1) and the lowest priority to significant unobservable inputs (Level 3), generally when market prices are not readily available or are unreliable. Based on the valuation inputs, the securities or other investments are tiered into one of three levels. Changes in valuation methods may result in transfers in or out of an investment’s assigned level:
| | Level 1 — | Prices are determined using quoted prices in an active market for identical assets. |
| | Level 2 — | Prices are determined using other significant observable inputs. Observable inputs are inputs that other market participants may use in pricing a security. These may include quoted prices for similar securities, interest rates, prepayment speeds, credit risk, yield curves, loss severities, default rates, discount rates, volatilities and others. |
| | Level 3 — | Prices are determined using significant unobservable inputs. In situations where quoted prices or observable inputs are unavailable (for example, when there is little or no market activity for an investment at the end of the period), unobservable inputs may be used. Unobservable inputs reflect the Fund’s own assumptions about the factors market participants would use in determining fair value of the securities or instruments and would be based on the best available information. |
The following is a summary of the tiered valuation input levels, as of October 31, 2016. The level assigned to the securities valuations may not be an indication of the risk or liquidity associated with investing in those securities. Because of the inherent uncertainties of valuation, the values reflected in the financial statements may materially differ from the value received upon actual sale of those investments.
During the year ended October 31, 2016, there were transfers from Level 1 to Level 2 of $464,201 and from Level 2 to Level 1 of $7,584,483, due to foreign fair value adjustments.
| | | | | | | | | | | | | | | | |
| | | Level 1 | | | Level 2 | | | Level 3 | | | Total | |
Argentina | | $ | 512,912 | | | $ | — | | | $ | — | | | $ | 512,912 | |
Brazil | | | 2,681,099 | | | | — | | | | — | | | | 2,681,099 | |
China | | | 2,776,812 | | | | 3,097,292 | | | | — | | | | 5,874,104 | |
Hong Kong | | | 1,453,959 | | | | — | | | | — | | | | 1,453,959 | |
India | | | 2,777,415 | | | | 670,476 | | | | — | | | | 3,447,891 | |
Indonesia | | | — | | | | 1,357,424 | | | | — | | | | 1,357,424 | |
Malaysia | | | — | | | | 375,352 | | | | — | | | | 375,352 | |
Mexico | | | 1,734,038 | | | | — | | | | — | | | | 1,734,038 | |
Peru | | | 371,105 | | | | — | | | | — | | | | 371,105 | |
Russia | | | 430,817 | | | | 734,822 | | | | — | | | | 1,165,639 | |
South Africa | | | 1,127,062 | | | | — | | | | — | | | | 1,127,062 | |
South Korea | | | 2,079,375 | | | | 2,010,029 | | | | — | | | | 4,089,404 | |
Taiwan | | | 2,615,521 | | | | 587,993 | | | | — | | | | 3,203,514 | |
Thailand | | | 952,194 | | | | 464,201 | | | | — | | | | 1,416,395 | |
Money Market Funds | | | 427,419 | | | | — | | | | — | | | | 427,419 | |
Total Investments | | $ | 19,939,728 | | | $ | 9,297,589 | | | $ | — | | | $ | 29,237,317 | |
NOTE 4—Expense Offset Arrangement(s)
The expense offset arrangement is comprised of transfer agency credits which result from balances in demand deposit accounts used by the transfer agent for clearing shareholder transactions. For the year ended October 31, 2016, the Fund received credits from this arrangement, which resulted in the reduction of the Fund’s total expenses of $546.
NOTE 5—Trustees’ and Officers’ Fees and Benefits
Trustees’ and Officers’ Fees and Benefits include amounts accrued by the Fund to pay remuneration to certain Trustees and Officers of the Fund. Trustees have the option to defer compensation payable by the Fund, and Trustees’ and Officers’ Fees and Benefits also include amounts accrued by the Fund to fund such deferred compensation amounts. Those Trustees who defer compensation have the option to select various Invesco Funds in which their deferral accounts shall be deemed to be invested. Finally, certain current Trustees were eligible to participate in a retirement plan that provided for benefits to be paid upon retirement to Trustees over a period of time based on the number of years of service. The Fund may have certain former Trustees who also participate in a retirement plan and receive benefits under such plan. Trustees’ and Officers’ Fees and Benefits include amounts accrued by the Fund to fund such retirement benefits. Obligations under the deferred compensation and retirement plans represent unsecured claims against the general assets of the Fund.
17 Invesco Emerging Markets Equity Fund
NOTE 6—Cash Balances
The Fund is permitted to temporarily carry a negative or overdrawn balance in its account with State Street Bank and Trust Company, the custodian bank. Such balances, if any at period-end, are shown in the Statement of Assets and Liabilities under the payable caption Amount due custodian. To compensate the custodian bank for such overdrafts, the overdrawn Fund may either (1) leave funds as a compensating balance in the account so the custodian bank can be compensated by earning the additional interest; or (2) compensate by paying the custodian bank at a rate agreed upon by the custodian bank and Invesco, not to exceed the contractually agreed upon rate.
NOTE 7—Distributions to Shareholders and Tax Components of Net Assets
Tax Character of Distributions to Shareholders Paid During the Fiscal Years Ended October 31, 2016 and 2015:
| | | | | | | | |
| | | 2016 | | | 2015 | |
Ordinary income | | $ | — | | | $ | 137,102 | |
Tax Components of Net Assets at Period-End:
| | | | |
| | | 2016 | |
Undistributed ordinary income | | $ | 50,217 | |
Net unrealized appreciation — investments | | | 1,983,678 | |
Net unrealized appreciation (depreciation) — other investments | | | (208 | ) |
Temporary book/tax differences | | | (18,003 | ) |
Capital loss carryforward | | | (5,840,959 | ) |
Shares of beneficial interest | | | 33,051,227 | |
Total net assets | | $ | 29,225,952 | |
The difference between book-basis and tax-basis unrealized appreciation (depreciation) is due to differences in the timing of recognition of gains and losses on investments for tax and book purposes. The Fund’s net unrealized appreciation difference is attributable primarily to wash sales.
The temporary book/tax differences are a result of timing differences between book and tax recognition of income and/or expenses. The Fund’s temporary book/tax differences are the result of the trustee deferral of compensation and retirement plan benefits.
Capital loss carryforward is calculated and reported as of a specific date. Results of transactions and other activity after that date may affect the amount of capital loss carryforward actually available for the Fund to utilize. Capital losses generated in years beginning after December 22, 2010 can be carried forward for an unlimited period, whereas previous losses expire in eight tax years. Capital losses with an expiration period may not be used to offset capital gains until all net capital losses without an expiration date have been utilized. Capital loss carryforwards with no expiration date will retain their character as either short-term or long-term capital losses instead of as short-term capital losses as under prior law. The ability to utilize capital loss carryforwards in the future may be limited under the Internal Revenue Code and related regulations based on the results of future transactions.
The Fund has a capital loss carryforward as of October 31, 2016, which expires as follows:
| | | | | | | | | | | | |
| Capital Loss Carryforward* | |
| Expiration | | Short-Term | | | Long-Term | | | Total | |
Not subject to expiration | | $ | 4,287,273 | | | $ | 1,553,686 | | | $ | 5,840,959 | |
| * | Capital loss carryforward as of the date listed above is reduced for limitations, if any, to the extent required by the Internal Revenue Code and may be further limited depending upon a variety of factors, including the realization of net unrealized gains or losses as of the date of any reorganization. |
NOTE 8—Investment Securities
The aggregate amount of investment securities (other than short-term securities, U.S. Treasury obligations and money market funds, if any) purchased and sold by the Fund during the year ended October 31, 2016 was $13,507,221 and $12,546,752, respectively. Cost of investments on a tax basis includes the adjustments for financial reporting purposes as of the most recently completed federal income tax reporting period-end.
| | | | |
| Unrealized Appreciation (Depreciation) of Investment Securities on a Tax Basis | |
Aggregate unrealized appreciation of investment securities | | $ | 4,243,529 | |
Aggregate unrealized (depreciation) of investment securities | | | (2,259,851 | ) |
Net unrealized appreciation of investment securities | | $ | 1,983,678 | |
Cost of investments for tax purposes is $27,253,639.
NOTE 9—Reclassification of Permanent Differences
Primarily as a result of differing book/tax treatment of foreign currency transactions, on October 31, 2016, undistributed net investment income was decreased by $46,425, undistributed net realized gain (loss) was increased by $46,529 and shares of beneficial interest was decreased by $104. This reclassification had no effect on the net assets of the Fund.
18 Invesco Emerging Markets Equity Fund
NOTE 10—Share Information
| | | | | | | | | | | | | | | | |
| | | Summary of Share Activity | |
| | | Years ended October 31, | |
| | | 2016(a) | | | 2015 | |
| | | Shares | | | Amount | | | Shares | | | Amount | |
Sold: | | | | | | | | | | | | | | | | |
Class A | | | 568,397 | | | $ | 3,728,060 | | | | 1,104,682 | | | $ | 7,871,597 | |
Class C | | | 213,062 | | | | 1,353,474 | | | | 141,652 | | | | 995,838 | |
Class R | | | 52,852 | | | | 338,812 | | | | 69,316 | | | | 486,729 | |
Class Y | | | 176,392 | | | | 1,205,752 | | | | 134,043 | | | | 961,871 | |
Class R5 | | | 76,169 | | | | 491,379 | | | | 27,217 | | | | 210,117 | |
Class R6 | | | 98,907 | | | | 603,936 | | | | 115,002 | | | | 814,045 | |
| | | | |
Issued as reinvestment of dividends: | | | | | | | | | | | | | | | | |
Class A | | | — | | | | — | | | | 6,447 | | | | 44,096 | |
Class R | | | — | | | | — | | | | 387 | | | | 2,645 | |
Class Y | | | — | | | | — | | | | 3,508 | | | | 23,965 | |
Class R5 | | | — | | | | — | | | | 918 | | | | 6,282 | |
Class R6 | | | — | | | | — | | | | 8,707 | | | | 59,556 | |
| | | | |
Reacquired: | | | | | | | | | | | | | | | | |
Class A | | | (516,029 | ) | | | (3,419,092 | ) | | | (904,652 | ) | | | (6,564,475 | ) |
Class C | | | (161,069 | ) | | | (1,028,240 | ) | | | (118,737 | ) | | | (832,060 | ) |
Class R | | | (56,971 | ) | | | (381,429 | ) | | | (64,467 | ) | | | (454,080 | ) |
Class Y | | | (49,137 | ) | | | (319,542 | ) | | | (19,136 | ) | | | (131,780 | ) |
Class R5 | | | (2,300 | ) | | | (13,595 | ) | | | (10,622 | ) | | | (74,464 | ) |
Class R6 | | | (272,981 | ) | | | (1,758,881 | ) | | | (94,195 | ) | | | (689,812 | ) |
Net increase in share activity | | | 127,292 | | | $ | 800,634 | | | | 400,070 | | | $ | 2,730,070 | |
| (a) | There are entities that are record owners of more than 5% of the outstanding shares of the Fund and in the aggregate own 28% of the outstanding shares of the Fund. IDI has an agreement with these entities to sell Fund shares. The Fund, Invesco and/or Invesco affiliates may make payments to these entities, which are considered to be related to the Fund, for providing services to the Fund, Invesco and/or Invesco affiliates including but not limited to services such as securities brokerage, distribution, third party record keeping and account servicing. The Fund has no knowledge as to whether all or any portion of the shares owned of record by these entities are also owned beneficially. |
| | In addition, 29% of the outstanding shares of the Fund are owned by the Adviser or an affiliate of the Adviser. |
19 Invesco Emerging Markets Equity Fund
NOTE 11—Financial Highlights
The following schedule presents financial highlights for a share of the Fund outstanding throughout the periods indicated.
| | | | | | | | | | | | | | | | | | | | | | | | | | | | | | | | | | | | | | | | | | | | | | | | | | | | | | | | |
| | | Net asset
value,
beginning
of period | | | Net
investment
income
(loss)(a) | | | Net gains
(losses)
on securities
(both
realized and
unrealized) | | | Total from
investment
operations | | | Dividends
from net
investment
income | | | Distributions
from net
realized
gains | | | Total
distributions | | | Net asset
value, end
of period | | | Total
return(b) | | | Net assets,
end of period
(000’s omitted) | | | Ratio of
expenses
to average
net assets
with fee waivers
and/or expenses
absorbed | | | Ratio of
expenses
to average net
assets without
fee waivers
and/or expenses
absorbed | | | Ratio of net
investment
income (loss)
to average
net assets | | | Portfolio
turnover(c) | |
Class A | | | | | | | | | | | | | | | | | | | | | | | | | | | | | | | | | | | | | | | | | | | | | | | | | | | | | | | | |
Year ended 10/31/16 | | $ | 6.53 | | | $ | 0.02 | | | $ | 0.58 | | | $ | 0.60 | | | $ | — | | | $ | — | | | $ | — | | | $ | 7.13 | | | | 9.19 | % | | $ | 11,855 | | | | 1.66 | %(d) | | | 2.59 | %(d) | | | 0.33 | %(d) | | | 47 | % |
Year ended 10/31/15 | | | 7.58 | | | | 0.02 | | | | (1.04 | ) | | | (1.02 | ) | | | (0.03 | ) | | | — | | | | (0.03 | ) | | | 6.53 | | | | (13.45 | ) | | | 10,516 | | | | 1.85 | | | | 2.58 | | | | 0.23 | | | | 97 | |
Year ended 10/31/14 | | | 7.61 | | | | 0.06 | | | | (0.03 | ) | | | 0.03 | | | | (0.06 | ) | | | — | | | | (0.06 | ) | | | 7.58 | | | | 0.44 | | | | 10,654 | | | | 1.85 | | | | 2.57 | | | | 0.74 | | | | 94 | |
Year ended 10/31/13 | | | 7.61 | | | | 0.05 | | | | 0.03 | | | | 0.08 | | | | (0.08 | ) | | | — | | | | (0.08 | ) | | | 7.61 | | | | 1.06 | | | | 15,284 | | | | 1.85 | | | | 2.75 | | | | 0.68 | | | | 41 | |
Year ended 10/31/12 | | | 8.07 | | | | 0.11 | | | | (0.47 | ) | | | (0.36 | ) | | | (0.07 | ) | | | (0.03 | ) | | | (0.10 | ) | | | 7.61 | | | | (4.51 | ) | | | 10,187 | | | | 1.85 | | | | 3.44 | | | | 1.36 | | | | 34 | |
Class C | |
Year ended 10/31/16 | | | 6.43 | | | | (0.03 | ) | | | 0.57 | | | | 0.54 | | | | — | | | | — | | | | — | | | | 6.97 | | | | 8.40 | | | | 3,149 | | | | 2.41 | (d) | | | 3.34 | (d) | | | (0.42 | )(d) | | | 47 | |
Year ended 10/31/15 | | | 7.49 | | | | (0.04 | ) | | | (1.02 | ) | | | (1.06 | ) | | | — | | | | — | | | | — | | | | 6.43 | | | | (14.15 | ) | | | 2,572 | | | | 2.60 | | | | 3.33 | | | | (0.52 | ) | | | 97 | |
Year ended 10/31/14 | | | 7.55 | | | | — | | | | (0.03 | ) | | | (0.03 | ) | | | (0.03 | ) | | | — | | | | (0.03 | ) | | | 7.49 | | | | (0.40 | ) | | | 2,825 | | | | 2.60 | | | | 3.32 | | | | (0.01 | ) | | | 94 | |
Year ended 10/31/13 | | | 7.55 | | | | (0.01 | ) | | | 0.04 | | | | 0.03 | | | | (0.03 | ) | | | — | | | | (0.03 | ) | | | 7.55 | | | | 0.40 | | | | 2,191 | | | | 2.60 | | | | 3.50 | | | | (0.07 | ) | | | 41 | |
Year ended 10/31/12 | | | 8.05 | | | | 0.04 | | | | (0.47 | ) | | | (0.43 | ) | | | (0.04 | ) | | | (0.03 | ) | | | (0.07 | ) | | | 7.55 | | | | (5.28 | ) | | | 1,150 | | | | 2.60 | | | | 4.19 | | | | 0.61 | | | | 34 | |
Class R | |
Year ended 10/31/16 | | | 6.50 | | | | 0.01 | | | | 0.56 | | | | 0.57 | | | | — | | | | — | | | | — | | | | 7.07 | | | | 8.77 | | | | 1,263 | | | | 1.91 | (d) | | | 2.84 | (d) | | | 0.08 | (d) | | | 47 | |
Year ended 10/31/15 | | | 7.55 | | | | (0.00 | ) | | | (1.03 | ) | | | (1.03 | ) | | | (0.02 | ) | | | — | | | | (0.02 | ) | | | 6.50 | | | | (13.71 | ) | | | 1,188 | | | | 2.10 | | | | 2.83 | | | | (0.02 | ) | | | 97 | |
Year ended 10/31/14 | | | 7.59 | | | | 0.04 | | | | (0.03 | ) | | | 0.01 | | | | (0.05 | ) | | | — | | | | (0.05 | ) | | | 7.55 | | | | 0.17 | | | | 1,341 | | | | 2.10 | | | | 2.82 | | | | 0.49 | | | | 94 | |
Year ended 10/31/13 | | | 7.58 | | | | 0.03 | | | | 0.04 | | | | 0.07 | | | | (0.06 | ) | | | — | | | | (0.06 | ) | | | 7.59 | | | | 0.97 | | | | 739 | | | | 2.10 | | | | 3.00 | | | | 0.43 | | | | 41 | |
Year ended 10/31/12 | | | 8.06 | | | | 0.08 | | | | (0.47 | ) | | | (0.39 | ) | | | (0.06 | ) | | | (0.03 | ) | | | (0.09 | ) | | | 7.58 | | | | (4.86 | ) | | | 76 | | | | 2.10 | | | | 3.69 | | | | 1.11 | | | | 34 | |
Class Y | |
Year ended 10/31/16 | | | 6.53 | | | | 0.04 | | | | 0.58 | | | | 0.62 | | | | — | | | | — | | | | — | | | | 7.15 | | | | 9.49 | | | | 4,858 | | | | 1.41 | (d) | | | 2.34 | (d) | | | 0.58 | (d) | | | 47 | |
Year ended 10/31/15 | | | 7.59 | | | | 0.03 | | | | (1.04 | ) | | | (1.01 | ) | | | (0.05 | ) | | | — | | | | (0.05 | ) | | | 6.53 | | | | (13.28 | ) | | | 3,607 | | | | 1.60 | | | | 2.33 | | | | 0.48 | | | | 97 | |
Year ended 10/31/14 | | | 7.62 | | | | 0.08 | | | | (0.04 | ) | | | 0.04 | | | | (0.07 | ) | | | — | | | | (0.07 | ) | | | 7.59 | | | | 0.60 | | | | 3,295 | | | | 1.60 | | | | 2.32 | | | | 0.99 | | | | 94 | |
Year ended 10/31/13 | | | 7.61 | | | | 0.07 | | | | 0.04 | | | | 0.11 | | | | (0.10 | ) | | | — | | | | (0.10 | ) | | | 7.62 | | | | 1.42 | | | | 442 | | | | 1.60 | | | | 2.50 | | | | 0.93 | | | | 41 | |
Year ended 10/31/12 | | | 8.07 | | | | 0.12 | | | | (0.47 | ) | | | (0.35 | ) | | | (0.08 | ) | | | (0.03 | ) | | | (0.11 | ) | | | 7.61 | | | | (4.31 | ) | | | 281 | | | | 1.60 | | | | 3.19 | | | | 1.61 | | | | 34 | |
Class R5 | |
Year ended 10/31/16 | | | 6.53 | | | | 0.04 | | | | 0.58 | | | | 0.62 | | | | — | | | | — | | | | — | | | | 7.15 | | | | 9.49 | | | | 1,497 | | | | 1.41 | (d) | | | 1.99 | (d) | | | 0.58 | (d) | | | 47 | |
Year ended 10/31/15 | | | 7.60 | | | | 0.03 | | | | (1.05 | ) | | | (1.02 | ) | | | (0.05 | ) | | | — | | | | (0.05 | ) | | | 6.53 | | | | (13.40 | ) | | | 885 | | | | 1.60 | | | | 1.98 | | | | 0.48 | | | | 97 | |
Year ended 10/31/14 | | | 7.62 | | | | 0.07 | | | | (0.02 | ) | | | 0.05 | | | | (0.07 | ) | | | — | | | | (0.07 | ) | | | 7.60 | | | | 0.74 | | | | 896 | | | | 1.60 | | | | 2.02 | | | | 0.99 | | | | 94 | |
Year ended 10/31/13 | | | 7.61 | | | | 0.07 | | | | 0.04 | | | | 0.11 | | | | (0.10 | ) | | | — | | | | (0.10 | ) | | | 7.62 | | | | 1.42 | | | | 366 | | | | 1.60 | | | | 2.26 | | | | 0.93 | | | | 41 | |
Year ended 10/31/12 | | | 8.07 | | | | 0.12 | | | | (0.47 | ) | | | (0.35 | ) | | | (0.08 | ) | | | (0.03 | ) | | | (0.11 | ) | | | 7.61 | | | | (4.31 | ) | | | 118 | | | | 1.60 | | | | 2.90 | | | | 1.61 | | | | 34 | |
Class R6 | |
Year ended 10/31/16 | | | 6.54 | | | | 0.04 | | | | 0.57 | | | | 0.61 | | | | — | | | | — | | | | — | | | | 7.15 | | | | 9.33 | | | | 6,604 | | | | 1.41 | (d) | | | 1.99 | (d) | | | 0.58 | (d) | | | 47 | |
Year ended 10/31/15 | | | 7.60 | | | | 0.03 | | | | (1.04 | ) | | | (1.01 | ) | | | (0.05 | ) | | | — | | | | (0.05 | ) | | | 6.54 | | | | (13.26 | ) | | | 7,171 | | | | 1.60 | | | | 1.98 | | | | 0.48 | | | | 97 | |
Year ended 10/31/14 | | | 7.62 | | | | 0.07 | | | | (0.02 | ) | | | 0.05 | | | | (0.07 | ) | | | — | | | | (0.07 | ) | | | 7.60 | | | | 0.73 | | | | 8,116 | | | | 1.60 | | | | 2.00 | | | | 0.99 | | | | 94 | |
Year ended 10/31/13 | | | 7.62 | | | | 0.07 | | | | 0.03 | | | | 0.10 | | | | (0.10 | ) | | | — | | | | (0.10 | ) | | | 7.62 | | | | 1.28 | | | | 8,619 | | | | 1.60 | | | | 2.21 | | | | 0.93 | | | | 41 | |
Year ended 10/31/12(e) | | | 7.85 | | | | 0.01 | | | | (0.24 | ) | | | (0.23 | ) | | | — | | | | — | | | | — | | | | 7.62 | | | | (2.93 | ) | | | 7,488 | | | | 1.60 | (f) | | | 1.79 | (f) | | | 1.61 | (f) | | | 34 | |
| (a) | Calculated using average shares outstanding. |
| (b) | Includes adjustments in accordance with accounting principles generally accepted in the United States of America and as such, the net asset value for financial reporting purposes and the returns based upon those net asset values may differ from the net asset value and returns for shareholder transactions. Does not include sales charges and is not annualized for periods less than one year, if applicable. |
| (c) | Portfolio turnover is calculated at the fund level and is not annualized for periods less than one year, if applicable. |
| (d) | Ratios are based on average daily net assets (000’s omitted) of $11,010, $2,812, $1,250, $3,922, $1,142 and $6,685 for Class A, Class C, Class R, Class Y, Class R5 and Class R6 shares, respectively. |
| (e) | Commencement date of September 24, 2012 for Class R6 shares. |
NOTE 12—Subsequent Event
Effective January 1, 2017, the Adviser has contractually agreed, through at least February 28, 2018, to waive advisory fees and/or reimburse expenses to the extent necessary to limit total annual fund operating expenses after fee waiver and/or expense reimbursement (excluding certain items discussed in Note 2) of Class A, Class C, Class R, Class Y, Class R5 and Class R6 shares to 1.33%, 2.08%, 1.58%, 1.08%, 1.08% and 1.08%, respectively, of the Fund’s average daily net assets.
20 Invesco Emerging Markets Equity Fund
Report of Independent Registered Public Accounting Firm
To the Board of Trustees and Shareholders of the Invesco Emerging Markets Equity Fund:
In our opinion, the accompanying statement of assets and liabilities, including the schedule of investments, and the related statements of operations and of changes in net assets and the financial highlights present fairly, in all material respects, the financial position of the Invesco Emerging Markets Equity Fund (the “Fund”) as of October 31, 2016, the results of its operations for the year then ended, the changes in its net assets for each of the two years in the period then ended and the financial highlights for each of the five years in the period then ended, in conformity with accounting principles generally accepted in the United States of America. These financial statements and financial highlights (hereafter referred to as “financial statements”) are the responsibility of the Fund’s management. Our responsibility is to express an opinion on these financial statements based on our audits. We conducted our audits of these financial statements in accordance with the standards of the Public Company Accounting Oversight Board (United States). Those standards require that we plan and perform the audit to obtain reasonable assurance about whether the financial statements are free of material misstatement. An audit includes examining, on a test basis, evidence supporting the amounts and disclosures in the financial statements, assessing the accounting principles used and significant estimates made by management, and evaluating the overall financial statement presentation. We believe that our audits, which included confirmation of securities as of October 31, 2016 by correspondence with the custodian, provide a reasonable basis for our opinion.
PRICEWATERHOUSECOOPERS LLP
Houston, Texas
December 21, 2016
21 Invesco Emerging Markets Equity Fund
Calculating your ongoing Fund expenses
Example
As a shareholder of the Fund, you incur two types of costs: (1) transaction costs, which may include sales charges (loads) on purchase payments or contingent deferred sales charges on redemptions, if any; and (2) ongoing costs, including management fees, distribution and/or service (12b-1) fees, and other Fund expenses. This example is intended to help you understand your ongoing costs (in dollars) of investing in the Fund and to compare these costs with ongoing costs of investing in other mutual funds. The example is based on an investment of $1,000 invested at the beginning of the period and held for the entire period May 1, 2016 through October 31, 2016.
Actual expenses
The table below provides information about actual account values and actual expenses. You may use the information in this table, together with the amount you invested, to estimate the expenses that you paid over the period. Simply divide your account value by $1,000 (for example, an $8,600 account value divided by $1,000 = 8.6), then multiply the result by the number in the table under the heading entitled “Actual Expenses Paid During Period” to estimate the expenses you paid on your account during this period.
Hypothetical example for comparison purposes
The table below also provides information about hypothetical account values and hypothetical expenses based on the Fund’s actual expense ratio and an assumed rate of return of 5% per year before expenses, which is not the Fund’s actual return.
The hypothetical account values and expenses may not be used to estimate the actual ending account balance or expenses you paid for the period. You may use this information to compare the ongoing costs of investing in the Fund and other funds. To do so, compare this 5% hypothetical example with the 5% hypothetical examples that appear in the shareholder reports of the other funds.
Please note that the expenses shown in the table are meant to highlight your ongoing costs only and do not reflect any transaction costs, such as sales charges (loads) on purchase payments or contingent deferred sales charges on redemptions, if any. Therefore, the hypothetical information is useful in comparing ongoing costs only, and will not help you determine the relative total costs of owning different funds. In addition, if these transaction costs were included, your costs would have been higher.
| | | | | | | | | | | | | | | | | | | | | | | | |
| Class | | Beginning
Account Value
(05/01/16) | | | ACTUAL | | | HYPOTHETICAL (5% annual return before
expenses) | | | Annualized Expense Ratio2 | |
| | | Ending
Account Value
(10/31/16)1 | | | Expenses
Paid During
Period2,3 | | | Ending
Account Value
(10/31/16) | | | Expenses
Paid During
Period2,4 | | |
| Class A | | $ | 1,000.00 | | | $ | 1,107.10 | | | $ | 8.16 | | | $ | 1,017.39 | | | $ | 7.81 | | | | 1.54 | % |
| Class C | | | 1,000.00 | | | | 1,102.80 | | | | 12.10 | | | | 1,013.62 | | | | 11.59 | | | | 2.29 | |
| Class R | | | 1,000.00 | | | | 1,104.70 | | | | 9.47 | | | | 1,016.14 | | | | 9.07 | | | | 1.79 | |
| Class Y | | | 1,000.00 | | | | 1,108.50 | | | | 6.84 | | | | 1,018.65 | | | | 6.55 | | | | 1.29 | |
| Class R5 | | | 1,000.00 | | | | 1,108.50 | | | | 6.84 | | | | 1,018.65 | | | | 6.55 | | | | 1.29 | |
| Class R6 | | | 1,000.00 | | | | 1,106.80 | | | | 6.83 | | | | 1,018.65 | | | | 6.55 | | | | 1.29 | |
| 1 | The actual ending account value is based on the actual total return of the Fund for the period May 1, 2016 through October 31, 2016, after actual expenses and will differ from the hypothetical ending account value which is based on the Fund’s expense ratio and a hypothetical annual return of 5% before expenses. |
| 2 | Expenses are equal to the Fund’s annualized expense ratio as indicated above multiplied by the average account value over the period, multiplied by 184/366 to reflect the most recent fiscal half year. Effective January 1, 2017, the Fund’s adviser has contractually agreed to waive advisory fees and/or reimburse expenses to the extent necessary to limit total annual fund operating expenses of Class A, Class C, Class R, Class Y, Class R5 and Class R6 shares to 1.33%, 2.08%, 1.58%, 1.08%, 1.08%, and 1.08% of average daily net assets, respectively. The annualized ratios restated as if these agreements had been in effect throughout the entire most recent fiscal half year are 1.33%, 2.08%, 1.58%, 1.08%, 1.08% and 1.08%, for Class A, Class C, Class R, Class Y, Class R5 and Class R6 shares, respectively. |
| 3 | The actual expenses paid restated as if the changes discussed above had been in effect throughout the entire most recent fiscal half year are $7.04, $10.99, $8.36, $5.72, $5.72 and $5.72 for Class A, Class C, Class R, Class Y, Class R5 and Class R6 shares, respectively. |
| 4 | The hypothetical expenses paid restated as if the changes discussed above had been in effect throughout the entire most recent fiscal half year are $6.75, $10.53, $8.01, $5.48, $5.48 and $5.48 for Class A, Class C, Class R, Class Y, Class R5 and Class R6 shares, respectively. |
22 Invesco Emerging Markets Equity Fund
Approval of Investment Advisory and Sub-Advisory Contracts
The Board of Trustees (the Board) of AIM Investment Funds (Invesco Investment Funds) is required under the Investment Company Act of 1940, as amended, to approve annually the renewal of Invesco Emerging Markets Equity Fund’s (the Fund) investment advisory agreements. During contract renewal meetings held on June 7-8, 2016, the Board as a whole, and the disinterested or “independent” Trustees, who comprise over 75% of the Board, voting separately, approved the continuance for the Fund of the Master Investment Advisory Agreement with Invesco Advisers, Inc. (Invesco Advisers and the investment advisory agreement) and the Master Intergroup Sub-Advisory Contract for Mutual Funds with Invesco Asset Management Deutschland GmbH, Invesco Asset Management Limited, Invesco Asset Management (Japan) Limited, Invesco Hong Kong Limited, Invesco Senior Secured Management, Inc. and Invesco Canada Ltd. (collectively, the Affiliated Sub-Advisers and the sub-advisory contracts) for another year, effective July 1, 2016.
In evaluating the fairness and reasonableness of compensation under the Fund’s investment advisory agreement and sub-advisory contracts, the Board considered, among other things, the factors discussed below. The Board determined that continuation of the Fund’s investment advisory agreement and the sub-advisory contracts is in the best interest of the Fund and its shareholders and that the compensation payable to Invesco Advisers and the Affiliated Sub-Advisers under the agreements is fair and reasonable.
The Board’s Fund Evaluation Process
The Board’s Investments Committee has established three Sub-Committees, which meet throughout the year to review the performance of funds advised by Invesco Advisers (the Invesco Funds). Over the course of each year, the Sub-Committees meet with portfolio managers for their assigned Invesco Funds and other members of management to review the performance, investment objective(s), policies, strategies, limitations and investment risks of these funds. The Board had the benefit of reports from the Sub-Committees and Investments Committee throughout the year in considering approval of the continuance of each Invesco Fund’s investment advisory agreement and sub-advisory contracts for another year.
During the contract renewal process, the Board receives comparative performance and fee data regarding the Invesco Funds prepared by Invesco Advisers and Broadridge Financial Solutions, Inc. (Broadridge), an independent provider of investment company data. The Board also receives an independent written evaluation from the Senior Officer, an officer of the Invesco Funds who reports directly to the independent Trustees. The Senior Officer’s
evaluation is prepared as part of his responsibility to manage the process by which the Invesco Funds’ proposed management fees are negotiated during the annual contract renewal process to ensure they are negotiated in a manner that is at arms’ length and reasonable. In addition to meetings with Invesco Advisers and fund counsel, the independent Trustees also discuss the continuance of the investment advisory agreement and sub-advisory contracts in separate sessions with the Senior Officer and with independent legal counsel.
The Trustees recognized that the advisory fee rates for the Invesco Funds are, in many cases, the result of years of review and negotiation. The Trustees’ deliberations and conclusions in a particular year may be based in part on their deliberations and conclusions regarding these same arrangements throughout the year and in prior years. The Trustees’ review and conclusions are based on the comprehensive consideration of all information presented to them and are not the result of any single determinative factor. Moreover, one Trustee may have weighed a particular piece of information or factor differently than another Trustee.
The discussion below is a summary of the Senior Officer’s independent written evaluation with respect to the Fund’s investment advisory agreement as well as a discussion of the material factors and related conclusions that formed the basis for the Board’s approval of the Fund’s investment advisory agreement and sub-advisory contracts. Unless otherwise stated, this information is current as of June 8, 2016, and does not reflect consideration of factors that became known to the Board after that date.
Factors and Conclusions and Summary of Independent Written Fee Evaluation
| A. | Nature, Extent and Quality of Services Provided by Invesco Advisers and the Affiliated Sub-Advisers |
The Board reviewed the advisory services provided to the Fund by Invesco Advisers under the Fund’s investment advisory agreement, the performance of Invesco Advisers in providing these services, and the credentials and experience of the officers and employees of Invesco Advisers who provide these services, including the Fund’s portfolio manager or managers. The Board’s review of the qualifications of Invesco Advisers to provide advisory services included the Board’s consideration of Invesco Advisers’ investment process oversight, independent credit analysis and investment risk management. The Board also considered non-advisory services that Invesco Advisers and its affiliates provide to the Invesco Funds such as various back office
support functions, trading operations, internal audit, valuation and legal and compliance.
In determining whether to continue the Fund’s investment advisory agreement, the Board considered the benefits of reapproving an existing relationship and the greater uncertainty that may be associated with entering into a new relationship. The Board concluded that the nature, extent and quality of the services provided to the Fund by Invesco Advisers are appropriate and satisfactory and consistent with the terms of the Fund’s investment advisory agreement.
The Board reviewed the services that may be provided by the Affiliated Sub-Advisers under the sub-advisory contracts and the credentials and experience of the officers and employees of the Affiliated Sub-Advisers who provide these services. The Board noted that the Affiliated Sub-Advisers have offices and personnel that are located in financial centers around the world. As a result, the Board noted that the Affiliated Sub-Advisers can provide research and investment analysis on the markets and economies of various countries in which the Fund may invest, make recommendations regarding securities and assist with security trades. The Board concluded that the sub-advisory contracts may benefit the Fund and its shareholders by permitting Invesco Advisers to use the resources and talents of the Affiliated Sub-Advisers in managing the Fund. The Board concluded that the nature, extent and quality of the services that may be provided by the Affiliated Sub-Advisers are appropriate and satisfactory and consistent with the terms of the Fund’s sub-advisory contracts.
The Board considered Fund performance as a relevant factor in considering whether to approve the investment advisory agreement. The Board did not view Fund performance as a relevant factor in considering whether to approve the sub-advisory contracts for the Fund, as no Affiliated Sub-Adviser currently manages assets of the Fund.
The Board noted that the Fund recently began operations and that comparative performance data for only the past four calendar years was available. The Board compared the Fund’s performance during the past four calendar years to the performance of funds in the Broadridge performance universe and against the Lipper Emerging Markets Funds Index. The Board noted that the Fund’s performance of Class A shares of the Fund was in the second quintile of its performance universe for the one year period and in the fourth quintile for the three year period (the first quintile being the best performing funds and the fifth quintile being the worst performing funds). The Board noted that performance of Class A shares of the Fund was above the performance of the Index for the one year
23 Invesco Emerging Markets Equity Fund
period and below the performance of the Index for the three year period. Invesco Advisers noted that a new co-chief investment officer had been added to the portfolio management team. The Trustees also reviewed more recent Fund performance and this review did not change their conclusions.
| C. | Advisory and Sub-Advisory Fees |
The Board compared the Fund’s contractual management fee rate to the contractual management fee rates of funds in the Fund’s Broadridge expense group at a common asset level. The Board noted that the contractual management fee rate for Class A shares of the Fund was below the median contractual management fee rate of funds in its expense group. The Board noted that the term “contractual management fee” for funds in the expense group may include both advisory and certain administrative services fees, but that Broadridge does not provide information on a fund by fund basis as to what is included. The Board noted that Invesco Advisers does not separately charge the Invesco Funds for the administrative services included in the term as defined by Broadridge. The Board also reviewed the methodology used by Broadridge in providing expense group information, which includes using each fund’s contractual management fee schedule (including any applicable breakpoints) as reported in the most recent prospectus or statement of additional information for each fund in the expense group.
The Board noted that Invesco Advisers has contractually agreed to waive fees and/or limit expenses of the Fund through at least March 31, 2017 in an amount necessary to limit total annual operating expenses to a specified percentage of average daily net assets for each class of the Fund.
The Board also compared the Fund’s effective advisory fee rate (the advisory fee rate after advisory fee waivers and before other expense limitations/waivers) to the effective advisory fee rates of other mutual funds advised by Invesco Advisers and its affiliates with investment strategies comparable to those of the Fund, based on asset balances as of December 31, 2015. The Board noted that the Fund’s rate was above the rate of one mutual fund. The Board noted that Invesco Advisers and the Affiliated Sub-Advisers do not manage other client accounts with investment strategies comparable to those of the Fund.
The Board also considered the services that may be provided by the Affiliated Sub-Advisers pursuant to the sub-advisory contracts, as well as the fees payable by Invesco Advisers to the Affiliated Sub-Advisers pursuant to the sub-advisory contracts. The Board also noted that the sub-advisory fees are not paid directly by the Fund, but rather, are payable by Invesco Advisers to the Affiliated Sub-Advisers.
| D. | Economies of Scale and Breakpoints |
The Board considered the extent to which there are economies of scale in the provision of advisory services to the Fund. The Board also considered whether the Fund benefits from
economies of scale through contractual breakpoints in the Fund’s advisory fee schedule. The Board also noted that the Fund shares directly in economies of scale through lower fees charged by third party service providers based on the combined size of the Invesco Funds and other clients advised by Invesco Advisers.
| E. | Profitability and Financial Resources |
The Board reviewed information from Invesco Advisers concerning the costs of the advisory and other services that Invesco Advisers and its affiliates provide to the Fund and the Invesco Funds and the profitability of Invesco Advisers and its affiliates in providing these services. The Board received information from Invesco Advisers and a report from an independent consultant engaged by the Senior Officer about the methodology used to prepare the profitability information. The Board noted that Invesco Advisers continues to operate at a net profit from services Invesco Advisers and its affiliates provide to the Invesco Funds. The Board noted that Invesco Advisers and its affiliates did not make a profit from managing the Fund as a result of fee and expense waivers. The Board received and accepted information from Invesco Advisers demonstrating that Invesco Advisers and each Affiliated Sub-Adviser are financially sound and have the resources necessary to perform their obligations under the investment advisory agreement and sub-advisory contracts.
| F. | Collateral Benefits to Invesco Advisers and its Affiliates |
The Board considered various other benefits received by Invesco Advisers and its affiliates from the relationship with the Fund, including the fees received for providing transfer agency and distribution services to the Fund. The Board considered comparative information regarding fees charged for these services, including information provided by Broadridge and other independent sources. The Board considered the performance of Invesco Advisers and its affiliates in providing these services and the organizational structure employed to provide these services. The Board also considered that these services are provided to the Fund pursuant to written contracts that are reviewed and approved on an annual basis by the Board; and that the services are required for the operation of the Fund.
The Board considered the benefits realized by Invesco Advisers and the Affiliated Sub-Advisers as a result of portfolio brokerage transactions executed through “soft dollar” arrangements. The Board noted that soft dollar arrangements shift the payment obligation for research services from Invesco Advisers and the Affiliated Sub-Advisers to the Invesco Funds and that the research received may be used with other clients of Invesco Advisers and may reduce Invesco Advisers’ and the Affiliated Sub-Advisers’ expenses. The Board also considered that it receives periodic reports from the Chief Compliance Officer of the Invesco Funds demonstrating that these arrangements
are consistent with regulatory requirements. The Board did not deem the soft dollar arrangements to be inappropriate.
The Board considered that the Fund’s uninvested cash and cash collateral from any securities lending arrangements may be invested in money market funds advised by Invesco Advisers pursuant to procedures approved by the Board. The Board noted that Invesco Advisers receives advisory fees from these affiliated money market funds attributable to such investments, although Invesco Advisers has contractually agreed to waive through varying periods the advisory fees payable by the Invesco Funds with respect to certain investments in the affiliated money market funds. The waiver is in an amount equal to 100% of the net advisory fee Invesco Advisers receives from the affiliated money market funds with respect to the Fund’s investment in the affiliated money market funds of uninvested cash, but not cash collateral. The Board concluded that the amount of advisory fees received by Invesco Advisors from the Fund’s investment of cash collateral from any securities lending arrangements in the affiliated money market funds is fair and reasonable.
The Board also considered that the Fund may use an affiliated broker to execute certain trades for the Fund to, among other things, control information leakage, and was advised that such trades would be executed in compliance with rules under the Investment Company Act of 1940, as amended, and consistent with best execution obligations.
24 Invesco Emerging Markets Equity Fund
Trustees and Officers
The address of each trustee and officer is AIM Investment Funds (Invesco Investment Funds) (the “Trust”), 11 Greenway Plaza, Suite 1000, Houston, Texas 77046-1173. The trustees serve for the life of the Trust, subject to their earlier death, incapacitation, resignation, retirement or removal as more specifically provided in the Trust’s organizational documents. Each officer serves for a one year term or until their successors are elected and qualified. Column two below includes length of time served with predecessor entities, if any.
| | | | | | | | |
Name, Year of Birth and
Position(s) Held with the Trust | | Trustee and/
or Officer Since | | Principal Occupation(s)
During Past 5 Years | | Number of
Funds in Fund
Complex
Overseen by
Trustee | | Other Directorship(s)
Held by Trustee During
Past 5 Years |
| Interested Persons | | | | | | | | |
| Martin L. Flanagan1 — 1960 Trustee | | 2007 | | Executive Director, Chief Executive Officer and President, Invesco Ltd. (ultimate parent of Invesco and a global investment management firm); Advisor to the Board, Invesco Advisers, Inc. (formerly known as Invesco Institutional (N.A.), Inc.); Trustee, The Invesco Funds; Vice Chair, Investment Company Institute; and Member of Executive Board, SMU Cox School of Business Formerly: Chairman and Chief Executive Officer, Invesco Advisers, Inc. (registered investment adviser); Director, Chairman, Chief Executive Officer and President, Invesco Holding Company (US) Inc. (formerly IVZ Inc.) (holding company), Invesco Group Services, Inc. (service provider) and Invesco North American Holdings, Inc. (holding company); Director, Chief Executive Officer and President, Invesco Holding Company Limited (parent of Invesco and a global investment management firm); Director, Invesco Ltd.; Chairman, Investment Company Institute and President, Co-Chief Executive Officer, Co-President, Chief Operating Officer and Chief Financial Officer, Franklin Resources, Inc. (global investment management organization) | | 146 | | None |
| Philip A. Taylor2 — 1954 Trustee and Senior Vice President | | 2006 | | Head of the Americas and Senior Managing Director, Invesco Ltd.; Director, Co-Chairman, Co-President and Co-Chief Executive Officer, Invesco Advisers, Inc. (formerly known as Invesco Institutional (N.A.), Inc.) (registered investment adviser); Director, Chairman, Chief Executive Officer and President, Invesco Management Group, Inc. (formerly known as Invesco AIM Management Group, Inc.) (financial services holding company); Director and Chairman, Invesco Investment Services, Inc. (formerly known as Invesco AIM Investment Services, Inc.) (registered transfer agent) Chief Executive Officer, Invesco Corporate Class Inc. (corporate mutual fund company) Director, Chairman and Chief Executive Officer, Invesco Canada Ltd. (formerly known as Invesco Trimark Ltd./Invesco Trimark Ltèe) (registered investment adviser and registered transfer agent); Trustee and Senior Vice President, The Invesco Funds; Director, Invesco Investment Advisers LLC (formerly known as Van Kampen Asset Management). Formerly: Director, Chief Executive Officer and President, Van Kampen Exchange Corp.; President and Principal Executive Officer, The Invesco Funds (other than AIM Treasurer’s Series Trust (Invesco Treasurer’s Series Trust), Short-Term Investments Trust and Invesco Management Trust); Executive Vice President, The Invesco Funds (AIM Treasurer’s Series Trust (Invesco Treasurer’s Series Trust), Short-Term Investments Trust and Invesco Management Trust only); Director and President, INVESCO Funds Group, Inc. (registered investment adviser and registered transfer agent); Director and Chairman, IVZ Distributors, Inc. (formerly known as INVESCO Distributors, Inc.) (registered broker dealer); Director, President and Chairman, Invesco Inc. (holding company), Invesco Canada Holdings Inc. (holding company), Trimark Investments Ltd./Placements Trimark Ltèe and Invesco Financial Services Ltd/Services Financiers Invesco Ltèe; Chief Executive Officer, Invesco Canada Fund Inc. (corporate mutual fund company); Director and Chairman, Van Kampen Investor Services Inc.; Director, Chief Executive Officer and President, 1371 Preferred Inc. (holding company) and Van Kampen Investments Inc.; Director and President, AIM GP Canada Inc. (general partner for limited partnerships) and Van Kampen Advisors, Inc.; Director and Chief Executive Officer, Invesco Trimark Dealer Inc. (registered broker dealer); Director, Invesco Distributors, Inc. (formerly known as Invesco AIM Distributors, Inc.) (registered broker dealer); Manager, Invesco PowerShares Capital Management LLC; Director, Chief Executive Officer and President, Invesco Advisers, Inc.; Director, Chairman, Chief Executive Officer and President, Invesco AIM Capital Management, Inc.; President, Invesco Trimark Dealer Inc. and Invesco Trimark Ltd./Invesco Trimark Ltèe; Director and President, AIM Trimark Corporate Class Inc. and AIM Trimark Canada Fund Inc.; Senior Managing Director, Invesco Holding Company Limited; Director and Chairman, Fund Management Company (former registered broker dealer); President and Principal Executive Officer, The Invesco Funds (AIM Treasurer’s Series Trust (Invesco Treasurer’s Series Trust), and Short-Term Investments Trust only); President, AIM Trimark Global Fund Inc. and AIM Trimark Canada Fund Inc. | | 146 | | None |
| 1 | Mr. Flanagan is considered an interested person (within the meaning of Section 2(a)(19) of the 1940 Act) of the Trust because he is an officer of the Adviser to the Trust, and an officer and a director of Invesco Ltd., ultimate parent of the Adviser. |
| 2 | Mr. Taylor is considered an interested person (within the meaning of Section 2(a)(19) of the 1940 Act) of the Trust because he is an officer and a director of the Adviser. |
T-1 Invesco Emerging Markets Equity Fund
Trustees and Officers—(continued)
| | | | | | | | |
Name, Year of Birth and
Position(s) Held with the Trust | | Trustee and/
or Officer Since | | Principal Occupation(s) During Past 5 Years | | Number of
Funds in Fund
Complex
Overseen by
Trustee | | Other Directorship(s)
Held by Trustee During
Past 5 Years |
| Independent Trustees | | | | | | | | |
Bruce L. Crockett — 1944 Trustee and Chair | | 2001 | | Chairman, Crockett Technologies Associates (technology consulting company) Formerly: Director, Captaris (unified messaging provider); Director, President and Chief Executive Officer, COMSAT Corporation; Chairman, Board of Governors of INTELSAT (international communications company); ACE Limited (insurance company); Independent Directors Council and Investment Company Institute | | 146 | | ALPS (Attorneys Liability Protection Society) (insurance company) and Globe Specialty Metals, Inc. (metallurgical company); Member of the Audit Committee, Ferroglobe PLC and Investment Company Institute; Member of the Executive Committee and Chair of the Governance Committee, Independent Directors Council |
David C. Arch — 1945 Trustee | | 2010 | | Chairman of Blistex Inc., a consumer health care products manufacturer | | 146 | | Board member of the Illinois Manufacturers’ Association; Member of the Board of Visitors, Institute for the Humanities, University of Michigan |
James T. Bunch — 1942 Trustee | | 2003 | | Managing Member, Grumman Hill Group LLC (family office/private equity investments) Formerly: Chairman of the Board, Denver Film Society, Chairman of the Board of Trustees, Evans Scholarship Foundation; Chairman, Board of Governors, Western Golf Association | | 146 | | Trustee, Evans Scholarship Foundation |
Albert R. Dowden — 1941 Trustee | | 2001 | | Director of a number of public and private business corporations, including Nature’s Sunshine Products, Inc. Formerly: Director, The Boss Group, Ltd. and Reich & Tang Funds (5 portfolios) (registered investment company); Director, Homeowners of America Holding Corporation/Homeowners of America Insurance Company (property casualty company); Director, Continental Energy Services, LLC (oil and gas pipeline service); Director, CompuDyne Corporation (provider of product and services to the public security market) and Director, Annuity and Life Re (Holdings), Ltd. (reinsurance company); Director, President and Chief Executive Officer, Volvo Group North America, Inc.; Senior Vice President, AB Volvo; Director of various public and private corporations; Chairman, DHJ Media, Inc.; Director, Magellan Insurance Company; and Director, The Hertz Corporation, Genmar Corporation (boat manufacturer), National Media Corporation; Advisory Board of Rotary Power International (designer, manufacturer, and seller of rotary power engines); and Chairman, Cortland Trust, Inc. (registered investment company) | | 146 | | Director of Nature’s Sunshine Products, Inc. |
Jack M. Fields — 1952 Trustee | | 2001 | | Chief Executive Officer, Twenty First Century Group, Inc. (government affairs company); and Discovery Learning Alliance (non-profit) Formerly: Owner and Chief Executive Officer, Dos Angeles Ranch L.P. (cattle, hunting, corporate entertainment); Director, Insperity, Inc. (formerly known as Administaff); Chief Executive Officer, Texana Timber LP (sustainable forestry company); Director of Cross Timbers Quail Research Ranch (non-profit); and member of the U.S. House of Representatives | | 146 | | None |
Eli Jones — 1961 Trustee | | 2016 | | Professor and Dean, Mays Business School — Texas A&M University Formerly: Professor and Dean, Walton College of Business, University of Arkansas and E.J. Ourso College of Business, Louisiana State University and Director, Arvest Bank | | 146 | | Director of Insperity, Inc. (formerly known as Administaff) |
Prema Mathai-Davis — 1950 Trustee | | 2001 | | Retired. Formerly: Chief Executive Officer, YWCA of the U.S.A. | | 146 | | None |
Larry Soll — 1942 Trustee | | 2003 | | Retired. Formerly: Chairman, Chief Executive Officer and President, Synergen Corp. (a biotechnology company) | | 146 | | None |
Raymond Stickel, Jr. — 1944 Trustee | | 2005 | | Retired. Formerly: Director, Mainstay VP Series Funds, Inc. (25 portfolios) and Partner, Deloitte & Touche | | 146 | | None |
Robert C. Troccoli — 1949 Trustee | | 2016 | | Adjunct Professor, University of Denver — Daniels College of Business Formerly: Senior Partner, KPMG LLP | | 146 | | None |
T-2 Invesco Emerging Markets Equity Fund
Trustees and Officers—(continued)
| | | | | | | | |
Name, Year of Birth and
Position(s) Held with the Trust | | Trustee and/
or Officer Since | | Principal Occupation(s) During Past 5 Years | | Number of
Funds in Fund
Complex
Overseen by
Trustee | | Other Directorship(s)
Held by Trustee During
Past 5 Years |
| Independent Trustees—(continued) |
Suzanne H. Woolsey — 1941 Trustee | | 2014 | | Retired. Formerly: Chief Executive Officer of Woolsey Partners LLC | | 146 | | Director, SunShare LLC; Trustee, Ocean Conservancy; Emeritus Chair of the Board of Trustees of the Institute for Defense Analyses and of Colorado College; Trustee, Chair, Business and Finance Committee of California Institute of Technology; Prior to 2014, Director of Fluor Corp.; Prior to 2010, Trustee of the German Marshall Fund of the United States; Prior to 2010, Trustee of the Rocky Mountain Institute |
| Other Officers | | | | | | | | |
Sheri Morris — 1964 President, Principal Executive Officer and Treasurer | | 1999 | | President, Principal Executive Officer and Treasurer, The Invesco Funds; Vice President, Invesco Advisers, Inc. (formerly known as Invesco Institutional (N.A.), Inc.) (registered investment adviser); and Vice President, PowerShares Exchange-Traded Fund Trust, PowerShares Exchange-Traded Fund Trust II, PowerShares India Exchange-Traded Fund Trust, PowerShares Actively Managed Exchange-Traded Fund Trust, and PowerShares Actively Managed Exchange-Traded Commodity Fund Trust Formerly: Vice President and Principal Financial Officer, The Invesco Funds; Vice President, Invesco AIM Advisers, Inc., Invesco AIM Capital Management, Inc. and Invesco AIM Private Asset Management, Inc.; Assistant Vice President and Assistant Treasurer, The Invesco Funds and Assistant Vice President, Invesco Advisers, Inc., Invesco AIM Capital Management, Inc. and Invesco AIM Private Asset Management, Inc.; and Treasurer, PowerShares Exchange-Traded Fund Trust, PowerShares Exchange-Traded Fund Trust II, PowerShares India Exchange-Traded Fund Trust and PowerShares Actively Managed Exchange-Traded Fund Trust | | N/A | | N/A |
Russell C. Burk — 1958 Senior Vice President and Senior Officer | | 2005 | | Senior Vice President and Senior Officer, The Invesco Funds | | N/A | | N/A |
John M. Zerr — 1962 Senior Vice President, Chief Legal Officer and Secretary | | 2006 | | Director, Senior Vice President, Secretary and General Counsel, Invesco Management Group, Inc. (formerly known as Invesco AIM Management Group, Inc.; Senior Vice President, Invesco Advisers, Inc. (formerly known as Invesco Institutional (N.A.), Inc.) (registered investment adviser); Senior Vice President and Secretary, Invesco Distributors, Inc. (formerly known as Invesco AIM Distributors, Inc.); Director, Vice President and Secretary, Invesco Investment Services, Inc. (formerly known as Invesco AIM Investment Services, Inc.) Senior Vice President, Chief Legal Officer and Secretary, The Invesco Funds; Managing Director, Invesco PowerShares Capital Management LLC; Director, Secretary and General Counsel, Invesco Investment Advisers LLC (formerly known as Van Kampen Asset Management); Secretary and General Counsel, Invesco Capital Markets, Inc. (formerly known as Van Kampen Funds Inc.) and Chief Legal Officer, PowerShares Exchange-Traded Fund Trust, PowerShares Exchange-Traded Fund Trust II, PowerShares India Exchange-Traded Fund Trust, PowerShares Actively Managed Exchange-Traded Fund Trust, and PowerShares Actively Managed Exchange-Traded Commodity Fund Trust Formerly: Director, Secretary, General Counsel and Senior Vice President, Van Kampen Exchange Corp.; Director, Vice President and Secretary, IVZ Distributors, Inc. (formerly known as INVESCO Distributors, Inc.); Director and Vice President, INVESCO Funds Group, Inc.; Director and Vice President, Van Kampen Advisors Inc.; Director, Vice President, Secretary and General Counsel, Van Kampen Investor Services Inc.; Director, Invesco Distributors, Inc. (formerly known as Invesco AIM Distributors, Inc.); Director, Senior Vice President, General Counsel and Secretary, Invesco AIM Advisers, Inc. and Van Kampen Investments Inc.; Director, Vice President and Secretary, Fund Management Company; Director, Senior Vice President, Secretary, General Counsel and Vice President, Invesco AIM Capital Management, Inc.; Chief Operating Officer and General Counsel, Liberty Ridge Capital, Inc. (an investment adviser); Vice President and Secretary, PBHG Funds (an investment company) and PBHG Insurance Series Fund (an investment company); Chief Operating Officer, General Counsel and Secretary, Old Mutual Investment Partners (a broker-dealer); General Counsel and Secretary, Old Mutual Fund Services (an administrator) and Old Mutual Shareholder Services (a shareholder servicing center); Executive Vice President, General Counsel and Secretary, Old Mutual Capital, Inc. (an investment adviser); and Vice President and Secretary, Old Mutual Advisors Funds (an investment company) | | N/A | | N/A |
T-3 Invesco Emerging Markets Equity Fund
Trustees and Officers—(continued)
| | | | | | | | |
Name, Year of Birth and
Position(s) Held with the Trust | | Trustee and/
or Officer Since | | Principal Occupation(s) During Past 5 Years | | Number of
Funds in Fund
Complex
Overseen by
Trustee | | Other Directorship(s)
Held by Trustee During
Past 5 Years |
| Other Officers—(continued) | | | | | | | | |
| Karen Dunn Kelley — 1960 Senior Vice President | | 2004 | | Senior Managing Director, Investments, Invesco Ltd.; Director, Co-President, Co-Chief Executive Officer, and Co-Chairman, Invesco Advisers, Inc. (formerly known as Invesco Institutional (N.A.), Inc.) (registered investment adviser); Chairman and Director, Invesco Senior Secured Management, Inc.; Senior Vice President, Invesco Management Group, Inc. (formerly known as Invesco AIM Management Group, Inc.); Executive Vice President, Invesco Distributors, Inc. (formerly known as Invesco AIM Distributors, Inc.); Director, Invesco Mortgage Capital Inc. and Invesco Management Company Limited; Senior Vice President, The Invesco Funds Formerly: Vice President, The Invesco Funds (other than AIM Treasurer’s Series Trust (Invesco Treasurer’s Series Trust), Short-Term Investments Trust and Invesco Management Trust); and President and Principal Executive Officer, The Invesco Funds (AIM Treasurer’s Series Trust (Invesco Treasurer’s Series Trust), Short-Term Investments Trust and Invesco Management Trust only); Director and President, INVESCO Asset Management (Bermuda) Ltd., Director, INVESCO Global Asset Management DAC (formerly known as INVESCO Global Asset Management Limited) and INVESCO Management S.A.; Senior Vice President, Van Kampen Investments Inc. and Invesco Advisers, Inc. (formerly known as Invesco Institutional (N.A.), Inc.) (registered investment adviser); Director and President, Fund Management Company; Chief Cash Management Officer, Director of Cash Management, Senior Vice President, and Managing Director, Invesco AIM Capital Management, Inc.; Director of Cash Management, Senior Vice President, and Vice President, Invesco Advisers, Inc. and Vice President, The Invesco Funds (AIM Treasurer’s Series Trust (Invesco Treasurer’s Series Trust), and Short-Term Investments Trust only) | | N/A | | N/A |
Kelli Gallegos — 1970 Vice President, Principal Financial Officer and Assistant Treasurer | | 2008 | | Vice President, Principal Financial Officer and Assistant Treasurer, The Invesco Funds; Assistant Treasurer, Invesco PowerShares Capital Management LLC, PowerShares Exchange-Traded Fund Trust, PowerShares Exchange-Traded Fund Trust II, PowerShares India Exchange-Traded Fund Trust, PowerShares Actively Managed Exchange-Traded Fund Trust, and PowerShares Actively Managed Exchange-Traded Commodity Fund Trust Formerly: Assistant Vice President, The Invesco Funds | | N/A | | N/A |
Tracy Sullivan — 1962 Vice President, Chief Tax Officer and Assistant Treasurer | | 2008 | | Vice President, Chief Tax Officer and Assistant Treasurer, The Invesco Funds; Assistant Treasurer, Invesco PowerShares Capital Management LLC, PowerShares Exchange-Traded Fund Trust, PowerShares Exchange-Traded Fund Trust II, PowerShares India Exchange-Traded Fund Trust, PowerShares Actively Managed Exchange-Traded Fund Trust, and PowerShares Actively Managed Exchange-Traded Commodity Fund Trust Formerly: Assistant Vice President, The Invesco Funds | | N/A | | N/A |
Crissie M. Wisdom — 1969 Anti-Money Laundering Compliance Officer | | 2013 | | Anti-Money Laundering Compliance Officer, Invesco Advisers, Inc. (formerly known as Invesco Institutional (N.A.), Inc.) (registered investment adviser), Invesco Capital Markets, Inc. (formerly known as Van Kampen Funds Inc.), Invesco Distributors, Inc., Invesco Investment Services, Inc., Invesco Management Group, Inc., The Invesco Funds, and PowerShares Exchange-Traded Fund Trust, PowerShares Exchange-Traded Fund Trust II, PowerShares India Exchange-Traded Fund Trust, PowerShares Actively Managed Exchange-Traded Fund Trust and PowerShares Actively Managed Exchange-Traded Commodity Fund Trust; Anti-Money Laundering Compliance Officer and Bank Secrecy Act Officer, INVESCO National Trust Company and Invesco Trust Company; and Fraud Prevention Manager and Controls and Risk Analysis Manager for Invesco Investment Services, Inc. Formerly: Anti-Money Laundering Compliance Officer, Van Kampen Exchange Corp. | | N/A | | N/A |
Robert R. Leveille — 1969 Chief Compliance Officer | | 2016 | | Chief Compliance Officer, Invesco Advisers, Inc. (registered investment adviser); and Chief Compliance Officer, The Invesco Funds Formerly: Chief Compliance Officer, Putnam Investments and the Putnam Funds | | N/A | | N/A |
The Statement of Additional Information of the Trust includes additional information about the Fund’s Trustees and is available upon request, without charge, by calling 1.800.959.4246. Please refer to the Fund’s Statement of Additional Information for information on the Fund’s sub-advisers.
| | | | | | |
Office of the Fund 11 Greenway Plaza, Suite 1000 Houston, TX 77046-1173 | | Investment Adviser Invesco Advisers, Inc. 1555 Peachtree Street, N.E. Atlanta, GA 30309 | | Distributor Invesco Distributors, Inc. 11 Greenway Plaza, Suite 1000 Houston, TX 77046-1173 | | Auditors PricewaterhouseCoopers LLP 1000 Louisiana Street, Suite 5800 Houston, TX 77002-5678 |
| | | |
| | | | | | |
Counsel to the Fund Stradley Ronon Stevens & Young, LLP 2005 Market Street, Suite 2600 Philadelphia, PA 19103-7018 | | Counsel to the Independent Trustees Goodwin Procter LLP 901 New York Avenue, N.W. Washington, D.C. 20001 | | Transfer Agent Invesco Investment Services, Inc. 11 Greenway Plaza, Suite 1000 Houston, TX 77046-1173 | | Custodian State Street Bank and Trust Company 225 Franklin Street Boston, MA 02110-2801 |
T-4 Invesco Emerging Markets Equity Fund
Explore High-Conviction Investing with Invesco

Invesco mailing information
Send general correspondence to Invesco Investment Services, Inc., P.O. Box 219078, Kansas City, MO 64121-9078.
Important notice regarding delivery of security holder documents
To reduce Fund expenses, only one copy of most shareholder documents may be mailed to shareholders with multiple accounts at the same address (Householding). Mailing of your shareholder documents may be householded indefinitely unless you instruct us otherwise. If you do not want the mailing of these documents to be combined with those for other members of your household, please contact Invesco Investment Services, Inc. at 800 959 4246 or contact your financial institution. We will begin sending you individual copies for each account within 30 days after receiving your request.
Fund holdings and proxy voting information
The Fund provides a complete list of its holdings four times in each fiscal year, at the quarter ends. For the second and fourth quarters, the lists appear in the Fund’s semiannual and annual reports to shareholders. For the first and third quarters, the Fund files the lists with the Securities and Exchange Commission (SEC) on Form N-Q. The most recent list of portfolio holdings is available at invesco.com/completeqtrholdings. Shareholders can also look up the Fund’s Forms N-Q on the SEC website at sec.gov. Copies of the Fund’s Forms N-Q may be reviewed and copied at the SEC Public Reference Room in Washington, D.C. You can obtain information on the operation of the Public Reference Room, including information about duplicating fee charges, by calling 202 551 8090 or 800 732 0330, or by electronic request at the following email address: publicinfo@sec.gov.
The SEC file numbers for the Fund are shown below.
A description of the policies and procedures that the Fund uses to determine how to vote proxies relating to portfolio securities is available without charge, upon request, from our Client Services department at 800 959 4246 or at invesco.com/proxyguidelines. The information is also available on the SEC website, sec.gov.
| | | | |
Information regarding how the Fund voted proxies related to its portfolio securities during the most recent 12-month period ended June 30 is available at invesco.com/proxysearch. The information is also available on the SEC website, sec.gov. Invesco Advisers, Inc. is an investment adviser; it provides investment advisory services to individual and institutional clients and does not sell securities. Invesco Distributors, Inc. is the US distributor for Invesco Ltd.’s retail mutual funds, exchange-traded funds and institutional money market funds. Both are wholly owned, indirect subsidiaries of Invesco Ltd. | | |  | |
| | | | |
| SEC file numbers: 811-05426 and 033-19338 | | EME-AR-1 | | Invesco Distributors, Inc. |
| | | | |
| | |
 | | Annual Report to Shareholders | | October 31, 2016 |
| | |
| | Invesco Endeavor Fund |
| | Nasdaq: |
| | A: ATDAX ∎ B: ATDBX ∎ C: ATDCX ∎ R: ATDRX ∎ Y: ATDYX ∎ R5: ATDIX ∎ R6: ATDFX |

Letters to Shareholders
| | |

Philip Taylor | | Dear Shareholders: This annual report includes information about your Fund, including performance data and a complete list of its investments as of the close of the reporting period. Inside is a discussion of how your Fund was managed and the factors that affected its performance during the reporting period. In December 2015, the US Federal Reserve raised short-term interest rates for the first time since 2006, signaling its belief that the economy was likely to continue strengthening. Indeed, throughout the reporting period, US economic data were generally positive and the economy expanded at a moderate rate – but there were some bumps along the road. Job growth in May 2016 was very weak, but it was followed by strong increases in nonfarm payrolls in June and July. Increased concerns about global economic weakness caused US stock market indexes to sink at the start of calendar year 2016, but they eventually recovered; they sank again following the UK’s decision to leave the European Union, but then quickly recovered and |
reached record highs later in the summer. Strong demand for income-producing investments, particularly those perceived to be lower risk, benefited bonds as well as dividend-paying stocks for much of the reporting period. While economic news in the US was generally positive, news overseas was less upbeat. The European Central Bank, and central banks in China and Japan – as well as other countries – maintained extraordinarily accommodative monetary policies in response to economic weakness. As the fiscal year drew to a close, uncertainty about the outcome of the US presidential election resulted in increased market volatility; the surprise outcome after the close of the reporting period suggested that market volatility may continue for some time to come.
Short-term market volatility can prompt some investors to abandon their investment plans – and can cause others to settle for average results. The investment professionals at Invesco, in contrast, invest with high conviction, take a long-term perspective and have a passion to exceed. Invesco’s pure focus on investment management eliminates possible distractions and means that there are no competing lines of business for us to support. Just as important, we embrace a variety of investment strategies, asset classes and geographies – because we know that no single investment approach meets the diverse needs of all of our clients. We manage all our investment approaches with a passion to exceed. All our investment teams have a highly disciplined, long-term investing style that eliminates short-term decision-making. Of course, investing with high conviction can’t guarantee a profit or ensure success; no investment strategy can. To learn more about how we invest with high conviction, visit invesco.com/HighConviction.
You, too, can invest with high conviction by maintaining a long-term investment perspective and by working with your financial adviser on a regular basis. During periods of short-term market volatility or uncertainty, your financial adviser can keep you focused on your long-term investment goals – a new home, a child’s college education or a secure retirement. He or she also can share research about the economy, the markets and individual investment options.
Visit our website for more information on your investments
Our website, invesco.com/us, offers a wide range of market insights and investment perspectives. On the website, you’ll find detailed information about our funds, including performance, holdings and portfolio manager commentaries. You can access information about your account by completing a simple, secure online registration. Click on the “Need to register” link in the “Account Access” box on our homepage to get started.
In addition to the resources accessible on our website and through our mobile app, you can obtain timely updates to help you stay informed about the markets, the economy and investing by connecting with Invesco on Twitter, LinkedIn or Facebook. You can access our blog at blog.invesco.us.com. Our goal is to provide you the information you want, when and where you want it.
Finally, I’m pleased to share with you Invesco’s commitment to both the Principles for Responsible Investment and to considering environmental, social and governance issues in our robust investment process. I invite you to learn more at invesco.com/esg.
Have questions?
For questions about your account, contact an Invesco client services representative at 800 959 4246. For Invesco-related questions or comments, please email me directly at phil@invesco.com.
All of us at Invesco look forward to serving your investment management needs. Thank you for investing with us.
Sincerely,

Philip Taylor
Senior Managing Director, Invesco Ltd.
2 Invesco Endeavor Fund
| | |

Bruce Crockett | | Dear Fellow Shareholders: Among the many important lessons I’ve learned in more than 40 years in a variety of business endeavors is the value of a trusted advocate. As independent chair of the Invesco Funds Board, I can assure you that the members of the Board are strong advocates for the interests of investors in Invesco’s mutual funds. We work hard to represent your interests through oversight of the quality of the investment management services your funds receive and other matters important to your investment, including but not limited to: ∎ Ensuring that Invesco offers a diverse lineup of mutual funds that your financial adviser can use to strive to meet your financial needs as your investment goals change over time. ∎ Monitoring how the portfolio management teams of the Invesco funds are performing in light of changing economic and market conditions. |
| ∎ | | Assessing each portfolio management team’s investment performance within the context of the investment strategy described in the fund’s prospectus. |
| ∎ | | Monitoring for potential conflicts of interests that may impact the nature of the services that your funds receive. |
We believe one of the most important services we provide our fund shareholders is the annual review of the funds’ advisory and sub-advisory contracts with Invesco Advisers and its affiliates. This review is required by the Investment Company Act of 1940 and focuses on the nature and quality of the services Invesco provides as the adviser to the Invesco funds and the reasonableness of the fees that it charges for those services. Each year, we spend months carefully reviewing information received from Invesco and a variety of independent sources, such as performance and fee data prepared by Lipper Inc., an independent, third-party firm widely recognized as a leader in its field. We also meet with our independent legal counsel and other independent advisers to review and help us assess the information that we have received. Our goal is to assure that you receive quality investment management services for a reasonable fee.
I trust the measures outlined above provide assurance that you have a worthy advocate when it comes to choosing the Invesco Funds.
As always, please contact me at bruce@brucecrockett.com with any questions or concerns you may have. On behalf of the Board, we look forward to continuing to represent your interests and serving your needs.
Sincerely,

Bruce L. Crockett
Independent Chair
Invesco Funds Board of Trustees
3 Invesco Endeavor Fund
Management’s Discussion of Fund Performance
| | | | |
Performance summary For the fiscal year ended October 31, 2016, Class A shares of Invesco Endeavor Fund (the Fund), at net asset value (NAV), underperformed the Russell Midcap Index, the Fund’s style-specific benchmark. Your Fund’s long-term performance appears later in this report. | �� |
Fund vs. Indexes Total returns, 10/31/15 to 10/31/16, at net asset value (NAV). Performance shown does not include applicable contingent deferred sales charges (CDSC) or front-end sales charges, which would have reduced performance. | |
Class A Shares | | | 2.08 | % |
Class B Shares | | | 1.28 | |
Class C Shares | | | 1.27 | |
Class R Shares | | | 1.78 | |
Class Y Shares | | | 2.37 | |
Class R5 Shares | | | 2.49 | |
Class R6 Shares | | | 2.59 | |
S&P 500 Indexq (Broad Market Index) | | | 4.51 | |
Russell Midcap Indexq (Style-Specific Index) | | | 4.17 | |
Lipper Mid-Cap Core Funds Index∎ (Peer Group Index) | | | 3.91 | |
Source(s): qFactSet Research Systems Inc.; ∎Lipper Inc. | | | | |
Market conditions and your Fund
During the fiscal year ended October 31, 2016, the US economy continued to expand. The initial estimate of US gross domestic product (GDP) showed the US economy grew by 2.9% in the third quarter, beating consensus estimates.1 However, annualized GDP is expected to be lower. Employment data were mixed, though the unemployment rate had a surprise uptick from 4.9% in August to 5.0% in September before ending the fiscal year at 4.9%.2 Oil prices traded in a range from the high $20s to the low $50s during the reporting period.3
The US Federal Reserve (the Fed) raised interest rates in December 2015 – its first increase since 2006 – but that was its only increase during the reporting period. Major US stock market indexes posted gains for the reporting period, but they were fairly volatile. Stocks began calendar year 2016 on a negative note, driven by investor concerns about economic weakness in China, falling oil prices
and uncertainty over Fed policy, including rumors of possible negative interest rates in the US. Markets recovered in late February and posted gains until June when UK voters opted to leave the European Union, sending markets sharply lower once again. Markets again recovered, and major US equity indexes hit record highs during the summer.4 In this environment, investors generally favored the perceived safety of government bonds and more defensive, dividend-paying equities often found in the telecommunication services, utilities and consumer staples sectors.
Before we discuss the Fund’s results during the fiscal year, it is helpful to briefly explain how we manage the Fund for shareholders. We view ourselves as business people buying businesses, and we consider the purchase of a stock as an ownership interest in a business. We strive to develop a proprietary view of a business through in-depth, fundamental research that includes careful financial
statement analysis and meetings with company management. We then seek to purchase businesses whose stock prices are below what we have calculated to be the true value of the company based on its future free cash flows.
Our investment approach focuses on individual businesses rather than market sectors. Therefore, your Fund has little in common with sector weightings of the Fund’s indexes. Select industrials and consumer discretionary stocks were among the largest contributors to Fund performance for the reporting period. Select holdings in the financials and energy sectors were among the largest detractors. Our avoidance of holdings within the utilities and consumer staples sectors also hurt the Fund’s relative performance as these were the best-performing sectors in the Russell Midcap Index for the fiscal year.
Industrials sector holding Orion Group Holdings was the largest contributor to absolute Fund performance during the fiscal year. Orion Marine Group provides a broad range of construction and specialty services both on- and offshore in the continental US, Alaska, Canada and the Caribbean Basin through its heavy civil marine construction and its commercial concrete construction segments. Shares of the company rose after management reported better-than-expected financial results and the company’s business outlook improved.
Consumer discretionary holding Capella Education was also a large contributor to the Fund’s absolute performance. Capella Education is a for-profit education company targeting the online adult learning market. The company is well-positioned to compete in a highly competitive market due to its high-quality offerings and focus on the graduate degree niche. Capella Education’s competency-based education model (which aims to better prepare students for the
| | | | | | |
| Portfolio Composition | |
| By sector | | | % of total net assets | |
| | | | |
Financials | | | 20.8 | % |
Industrials | | | 20.6 | |
| Information Technology | | | 15.5 | |
| Consumer Discretionary | | | 8.9 | |
| Health Care | | | 7.7 | |
| Energy | | | 6.3 | |
| Real Estate | | | 5.6 | |
| Money Market Funds Plus Other Assets Less Liabilities | | | 14.6 | |
| | | | |
| Top 10 Equity Holdings* |
| | % of total net assets |
| | | | | | |
1. | | Brookfield Property Partners L.P. | | | 5.6 | % |
2. | | Encore Capital Group, Inc. | | | 5.3 | |
3. | | Orion Group Holdings, Inc. | | | 5.2 | |
4. | | Cognizant Technology Solutions Corp.–Class A | | | 4.8 | |
5. | | Oaktree Capital Group LLC | | | 4.2 | |
6. | | Bank of America Corp. | | | 3.6 | |
7. | | Ryanair Holdings PLC-ADR | | | 3.5 | |
8. | | Titan Machinery, Inc. | | | 3.4 | |
9. | | Deere & Co. | | | 3.4 | |
10. | | Echo Global Logistics, Inc. | | | 3.1 | |
| | | | |
Total Net Assets | | | $256.8 million | |
| |
| Total Number of Holdings* | | | 27 | |
The Fund’s holdings are subject to change, and there is no assurance that the Fund will continue to hold any particular security.
*Excluding money market fund holdings.
Data presented here are as of October 31, 2016.
4 Invesco Endeavor Fund
real world) and new Flexpath programs (which offers students flexibility and the potential to reduce overall costs) are meaningful differentiators. The company’s share price rose during the fiscal year due to strong financial results, and we sold some of our position before the close of the reporting period.
Financials sector holding Encore Capital Group was the largest detractor from Fund performance for the fiscal year. Encore Capital Group is a leading global provider of debt recovery services. The company purchases portfolios of defaulted credit and seeks repayment that amounts to multiple the amounts of its acquisition costs. As one of the largest companies in the space, Encore Capital Group has established the scale and infrastructure to meet heavy regulatory requirements, a key competitive advantage. The company’s share price declined during the fiscal year due to industry uncertainty and a changing regulatory environment.
Energy sector holding Ultra Petroleum was also a large detractor from the Fund’s absolute performance. Ultra Petroleum is a low-cost natural gas producer in the US. The company’s share price declined during the reporting period due to increased balance sheet risk that resulted from low commodity prices that occurred throughout 2015 and in early 2016. Ultra Petroleum filed for bankruptcy protection in May 2016 and we subsequently sold our position in the company.
During the fiscal year, we made some new investments and added to some of our existing holdings. We also sold several holdings based on valuations and other factors. The Fund’s cash position is a result of our disciplined approach, which compels us to trim and sell holdings when their stock prices reach or exceed our estimation of intrinsic value, as well as only buy new businesses when we can purchase shares at a meaningful discount to our estimation of intrinsic value. We believe any portfolio cash provides us with the opportunity to invest in attractive opportunities as they present themselves.
In a market often driven by short-term factors, we continued to focus on finding quality businesses trading at attractive values relative to what we believe are their long-term prospects. Market volatility during the reporting period allowed us to take advantage of investment opportunities we believe may benefit the Fund in the long term.
While we can never predict future Fund performance, we pledge that we will adhere to our discipline of being business
people who buy businesses – and we will continually strive to upgrade the quality of the Fund’s portfolio.
As always, we thank you for your investment in Invesco Endeavor Fund and for sharing our long-term investment perspective.
1 Source: Bureau of Economic Analysis
2 Source: Bureau of Labor Statistics
3 Source: Thompson-Reuters
4 Source: Reuters
The views and opinions expressed in management’s discussion of Fund performance are those of Invesco Advisers, Inc. These views and opinions are subject to change at any time based on factors such as market and economic conditions. These views and opinions may not be relied upon as investment advice or recommendations, or as an offer for a particular security. The information is not a complete analysis of every aspect of any market, country, industry, security or the Fund. Statements of fact are from sources considered reliable, but Invesco Advisers, Inc. makes no representation or warranty as to their completeness or accuracy. Although historical performance is no guarantee of future results, these insights may help you understand our investment management philosophy.
See important Fund and, if applicable, index disclosures later in this report.
| | |

| | Mark Uptigrove Chartered Financial Analyst, Portfolio Manager, is manager of Invesco Endeavor Fund. He joined |
| Invesco in 2005. Mr. Uptigrove earned a BA from the University of Western Ontario and an MBA from the Richard Ivey School of Business. |
| |

| | Clayton Zacharias Chartered Financial Analyst, Portfolio Manager, is manager of Invesco Endeavor Fund. He joined |
| Invesco in 2002. Mr. Zacharias earned a BBA from Simon Fraser University. |
5 Invesco Endeavor Fund
Your Fund’s Long-Term Performance
Results of a $10,000 Investment – Oldest Share Class(es)
Fund and index data from 10/31/06
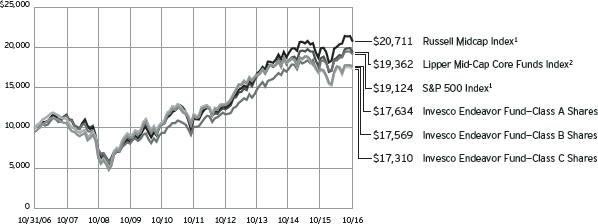
| 1 Source: | FactSet Research Systems Inc. |
Past performance cannot guarantee comparable future results.
The data shown in the chart include reinvested distributions, applicable sales charges and Fund expenses including management fees. Results for Class B shares are calculated as if a hypothetical
shareholder had liquidated his entire investment in the Fund at the close of the reporting period and paid the contingent deferred sales charges, if applicable. Index results include reinvested dividends, but they do not reflect sales charges. Performance of the peer group,
if applicable, reflects fund expenses and management fees; performance of a market index does not. Performance shown in the chart and table(s) does not reflect deduction of taxes a shareholder would pay on Fund distributions or sale of Fund shares.
continued from page 8
About indexes used in this report
| ∎ | | The S&P 500® Index is an unmanaged index considered representative of the US stock market. |
| ∎ | | The Russell Midcap® Index is an unmanaged index considered representative of mid-cap stocks. The Russell Midcap Index is a trademark/service mark of the Frank Russell Co. Russell® is a trademark of the Frank Russell Co. |
| ∎ | | The Lipper Mid-Cap Core Funds Index is an unmanaged index considered representative of mid-cap core funds tracked by Lipper. |
| ∎ | | The Fund is not managed to track the performance of any particular index, including the index(es) described here, and consequently, the performance of the Fund may deviate significantly from the performance of the index(es). |
| ∎ | | A direct investment cannot be made in an index. Unless otherwise indicated, index results include reinvested dividends, and they do not reflect sales charges. Performance of the peer |
| | group, if applicable, reflects fund expenses; performance of a market index does not. |
Other information
| ∎ | | The returns shown in management’s discussion of Fund performance are based on net asset values (NAVs) calculated for shareholder transactions. Generally accepted accounting principles require adjustments to be made to the net assets of the Fund at period end for financial reporting purposes, and as such, the NAVs for shareholder transactions and the returns based on those NAVs may differ from the NAVs and returns reported in the Financial Highlights. |
| ∎ | | Industry classifications used in this report are generally according to the Global Industry Classification Standard, which was developed by and is the exclusive property and a service mark of MSCI Inc. and Standard & Poor’s. |
6 Invesco Endeavor Fund
| | | | |
| Average Annual Total Returns | |
| As of 10/31/16, including maximum applicable sales charges | |
| |
Class A Shares | | | | |
Inception (11/4/03) | | | 8.15 | % |
10 Years | | | 5.84 | |
5 Years | | | 7.75 | |
1 Year | | | -3.52 | |
| |
Class B Shares | | | | |
Inception (11/4/03) | | | 8.14 | % |
10 Years | | | 5.80 | |
5 Years | | | 7.88 | |
1 Year | | | -3.08 | |
| |
Class C Shares | | | | |
Inception (11/4/03) | | | 7.83 | % |
10 Years | | | 5.64 | |
5 Years | | | 8.16 | |
1 Year | | | 0.40 | |
| |
Class R Shares | | | | |
Inception (4/30/04) | | | 7.98 | % |
10 Years | | | 6.17 | |
5 Years | | | 8.71 | |
1 Year | | | 1.78 | |
| |
Class Y Shares | | | | |
10 Years | | | 6.66 | % |
5 Years | | | 9.25 | |
1 Year | | | 2.37 | |
| |
Class R5 Shares | | | | |
Inception (4/30/04) | | | 8.75 | % |
10 Years | | | 6.94 | |
5 Years | | | 9.41 | |
1 Year | | | 2.49 | |
| |
Class R6 Shares | | | | |
10 Years | | | 6.64 | % |
5 Years | | | 9.40 | |
1 Year | | | 2.59 | |
Class Y shares incepted on October 3, 2008. Performance shown prior to that date is that of Class A shares and includes the 12b-1 fees applicable to Class A shares.
Class R6 shares incepted on September 24, 2012. Performance shown prior to that date is that of Class A shares and includes the 12b-1 fees applicable to Class A shares.
The performance data quoted represent past performance and cannot guarantee comparable future results; current performance may be lower or higher. Please visit invesco.com/performance for the most recent month-end performance. Performance figures reflect reinvested distributions, changes in net asset value and the effect of the maximum sales charge unless otherwise stated. Investment return and
| | | | |
| Average Annual Total Returns | |
| As of 9/30/16, the most recent calendar quarter end, including maximum applicable sales charges | |
| |
Class A Shares | | | | |
Inception (11/4/03) | | | 8.28 | % |
10 Years | | | 6.57 | |
5 Years | | | 10.20 | |
1 Year | | | -1.04 | |
| |
Class B Shares | | | | |
Inception (11/4/03) | | | 8.26 | % |
10 Years | | | 6.53 | |
5 Years | | | 10.35 | |
1 Year | | | -0.54 | |
| |
Class C Shares | | | | |
Inception (11/4/03) | | | 7.96 | % |
10 Years | | | 6.38 | |
5 Years | | | 10.63 | |
1 Year | | | 3.03 | |
| |
Class R Shares | | | | |
Inception (4/30/04) | | | 8.11 | % |
10 Years | | | 6.91 | |
5 Years | | | 11.17 | |
1 Year | | | 4.41 | |
| |
Class Y Shares | | | | |
10 Years | | | 7.40 | % |
5 Years | | | 11.74 | |
1 Year | | | 4.95 | |
| |
Class R5 Shares | | | | |
Inception (4/30/04) | | | 8.88 | % |
10 Years | | | 7.68 | |
5 Years | | | 11.89 | |
1 Year | | | 5.11 | |
| |
Class R6 Shares | | | | |
10 Years | | | 7.38 | % |
5 Years | | | 11.87 | |
1 Year | | | 5.21 | |
principal value will fluctuate so that you may have a gain or loss when you sell shares.
The net annual Fund operating expense ratio set forth in the most recent Fund prospectus as of the date of this report for Class A, Class B, Class C, Class R, Class Y, Class R5 and Class R6 shares was 1.29%, 2.04%, 2.04%,
1.54%, 1.04%, 0.92% and 0.83%, respectively.1 The total annual Fund operating expense ratio set forth in the most recent Fund prospectus as of the date of this report for Class A, Class B, Class C, Class R, Class Y, Class R5 and Class R6 shares was 1.32%, 2.07%, 2.07%, 1.57%, 1.07%, 0.95% and 0.86%, respectively. The expense ratios presented above may vary from the expense ratios presented in other sections of this report that are based
on expenses incurred during the period covered by this report.
Class A share performance reflects the maximum 5.50% sales charge, and Class B and Class C share performance reflects the applicable contingent deferred sales charge (CDSC) for the period involved. The CDSC on Class B shares declines from 5% beginning at the time of purchase to 0% at the beginning of the seventh year. The CDSC on Class C shares is 1% for the first year after purchase. Class R, Class Y, Class R5 and Class R6 shares do not have a front-end sales charge or a CDSC; therefore, performance is at net asset value.
The performance of the Fund’s share classes will differ primarily due to different sales charge structures and class expenses.
Fund performance reflects any applicable fee waivers and/or expense reimbursements. Had the adviser not waived fees and/or reimbursed expenses currently or in the past, returns would have been lower. See current prospectus for more information.
| 1 | Total annual Fund operating expenses after any contractual fee waivers and/or expense reimbursements by the adviser in effect through at least June 30, 2018. See current prospectus for more information. |
7 Invesco Endeavor Fund
Invesco Endeavor Fund’s investment objective is long-term growth of capital.
| ∎ | | Unless otherwise stated, information presented in this report is as of October 31, 2016, and is based on total net assets. |
| ∎ | | Unless otherwise noted, all data provided by Invesco. |
| ∎ | | To access your Fund’s reports/prospectus, visit invesco.com/fundreports. |
About share classes
| ∎ | | Class B shares may not be purchased for new or additional investments. Please see the prospectus for more information. |
| ∎ | | Class R shares are generally available only to employer sponsored retirement and benefit plans. Please see the prospectus for more information. |
| ∎ | | Class Y shares are available only to certain investors. Please see the prospectus for more information. |
| ∎ | | Class R5 shares and Class R6 shares are primarily intended for employer sponsored retirement and benefit plans that meet certain standards and for institutional investors. Please see the prospectus for more information. |
Principal risks of investing in the Fund
| ∎ | | Cash/cash equivalents risk. In rising markets, holding cash or cash equivalents will negatively affect the Fund’s performance relative to its benchmark. |
| ∎ | | Debt securities risk. The prices of debt securities held by the Fund will be affected by changes in interest rates, the creditworthiness of the issuer and other factors. An increase in prevailing interest rates typically causes the value of existing debt securities to fall and often has a greater impact on longer-duration debt securities and higher quality debt securities. Falling interest rates will cause the Fund to reinvest the proceeds of debt securities that have been repaid by the issuer at lower interest rates. Falling interest rates may also reduce the Fund’s distributable income because interest payments on floating rate debt instruments held by the Fund will decline. The Fund could lose money on investments in debt securities if the issuer or borrower fails to meet its obligations to make interest payments and/or to repay principal in a timely manner. Changes in an issuer’s financial strength, the market’s perception of such strength or in the credit rating of the issuer or the security may affect the value of debt securities. The |
| | Adviser’s credit analysis may fail to anticipate such changes, which could result in buying a debt security at an inopportune time or failing to sell a debt security in advance of a price decline or other credit event. |
| ∎ | | Foreign securities risk. The Fund’s foreign investments may be adversely affected by political and social instability, changes in economic or taxation policies, difficulty in enforcing obligations, decreased liquidity or increased volatility. Foreign investments also involve the risk of the possible seizure, nationalization or expropriation of the issuer or foreign deposits (in which the Fund could lose its entire investments in a certain market) and the possible adoption of foreign governmental restrictions such as exchange controls. Unless the Fund has hedged its foreign securities risk, foreign securities risk also involves the risk of negative foreign currency rate fluctuations, which may cause the value of securities denominated in such foreign currency (or other instruments through which the Fund has exposure to foreign currencies) to decline in value. Currency exchange rates may fluctuate significantly over short periods of time. Currency hedging strategies, if used, are not always successful. |
| ∎ | | Management risk. The Fund is actively managed and depends heavily on the Adviser’s judgment about markets, interest rates or the attractiveness, relative values, liquidity, or potential appreciation of particular investments made for the Fund’s portfolio. The Fund could experience losses if these judgments prove to be incorrect. Additionally, legislative, regulatory, or tax developments may adversely affect management of the Fund and, therefore, the ability of the Fund to achieve its investment objective. |
| ∎ | | Market risk. The market values of the Fund’s investments, and therefore the value of the Fund’s shares, will go up and down, sometimes rapidly or unpredictably. Market risk may affect a single |
| | | issuer, industry or section of the economy, or it may affect the market as a whole. Individual stock prices tend to go up and down more dramatically than those of certain other types of investments, such as bonds. During a general downturn in the financial markets, multiple asset classes may decline in value. When markets perform well, there can be no assurance that specific investments held by the Fund will rise in value. |
| ∎ | | Small- and mid-capitalization companies risks. Small- and mid-capitalization companies tend to be more vulnerable to changing market conditions, may have little or no operating history or track record of success, and may have more limited product lines and markets, less experienced management and fewer financial resources than larger companies. These companies’ securities may be more volatile and less liquid than those of more established companies, and their returns may vary, sometimes significantly, from the overall securities market. |
| ∎ | | US government obligations risk. Obligations of US government agencies and authorities receive varying levels of support and may not be backed by the full faith and credit of the US government, which could affect the Fund’s ability to recover should they default. No assurance can be given that the US government will provide financial support to its agencies and authorities if it is not obligated by law to do so. |
| ∎ | | Value investing style risk. A value investing style subjects the Fund to the risk that the valuations never improve or that the returns on value equity securities are less than returns on other styles of investing or the overall stock market. |
continued on page 6
|
This report must be accompanied or preceded by a currently effective Fund prospectus, which contains more complete information, including sales charges and expenses. Investors should read it carefully before investing. |
|
NOT FDIC INSURED | MAY LOSE VALUE | NO BANK GUARANTEE |
8 Invesco Endeavor Fund
Schedule of Investments(a)
October 31, 2016
| | | | | | | | |
| | | Shares | | | Value | |
Common Stocks & Other Equity Interests–85.39% | |
| Agricultural & Farm Machinery–3.38% | |
Deere & Co. | | | 98,359 | | | $ | 8,685,100 | |
|
| Air Freight & Logistics–3.08% | |
Echo Global Logistics, Inc.(b) | | | 373,296 | | | | 7,913,875 | |
|
| Airlines–3.46% | |
Ryanair Holdings PLC–ADR (Ireland)(b) | | | 118,205 | | | | 8,876,013 | |
|
| Apparel Retail–2.86% | |
Ross Stores, Inc. | | | 117,258 | | | | 7,333,315 | |
|
| Asset Management & Custody Banks–7.29% | |
Affiliated Managers Group, Inc.(b) | | | 59,494 | | | | 7,892,474 | |
Oaktree Capital Group LLC | | | 260,639 | | | | 10,842,582 | |
| | | | | | | | 18,735,056 | |
|
| Automotive Retail–3.01% | |
CarMax, Inc.(b) | | | 154,626 | | | | 7,722,022 | |
|
| Communications Equipment–2.83% | |
Plantronics, Inc. | | | 140,664 | | | | 7,273,735 | |
|
| Construction & Engineering–5.17% | |
Orion Group Holdings, Inc.(b)(c) | | | 1,644,823 | | | | 13,290,170 | |
|
| Consumer Finance–5.28% | |
Encore Capital Group, Inc.(b) | | | 682,722 | | | | 13,552,032 | |
|
| Data Processing & Outsourced Services–2.57% | |
Alliance Data Systems Corp.(b) | | | 32,253 | | | | 6,594,771 | |
|
| Diversified Banks–3.57% | |
Bank of America Corp. | | | 555,902 | | | | 9,172,383 | |
|
| Education Services–2.99% | |
Capella Education Co. | | | 105,075 | | | | 7,680,983 | |
|
| Health Care Distributors–2.07% | |
McKesson Corp. | | | 41,851 | | | | 5,322,192 | |
|
| Health Care Equipment–2.54% | |
Zimmer Biomet Holdings, Inc. | | | 61,893 | | | | 6,523,522 | |
|
| Integrated Oil & Gas–2.96% | |
Cenovus Energy Inc. (Canada) | | | 527,548 | | | | 7,610,851 | |
| | | | | | | | |
| | | Shares | | | Value | |
| IT Consulting & Other Services–4.84% | |
Cognizant Technology Solutions Corp.–Class A(b) | | | 242,213 | | | $ | 12,437,638 | |
|
| Life & Health Insurance–2.92% | |
Unum Group | | | 211,579 | | | | 7,489,897 | |
|
| Managed Health Care–3.06% | |
UnitedHealth Group Inc. | | | 55,522 | | | | 7,846,924 | |
|
| Multi-Line Insurance–1.74% | |
Vienna Insurance Group AG Wiener Versicherung Gruppe (Austria) | | | 226,500 | | | | 4,468,068 | |
|
| Oil & Gas Equipment & Services–0.75% | |
Newalta Corp. (Canada) | | | 1,135,958 | | | | 1,922,553 | |
|
| Oil & Gas Exploration & Production–2.63% | |
Devon Energy Corp. | | | 178,152 | | | | 6,750,179 | |
|
| Real Estate Operating Companies–5.60% | |
Brookfield Property Partners L.P. | | | 647,836 | | | | 14,369,003 | |
|
| Systems Software–2.98% | |
Check Point Software Technologies Ltd. (Israel)(b) | | | 90,586 | | | | 7,659,952 | |
|
| Technology Distributors–2.28% | |
CDW Corp. | | | 130,528 | | | | 5,862,012 | |
|
| Trading Companies & Distributors–5.53% | |
Grafton Group PLC (United Kingdom)(d) | | | 900,893 | | | | 5,482,797 | |
Titan Machinery, Inc.(b) | | | 938,725 | | | | 8,720,755 | |
| | | | | 14,203,552 | |
Total Common Stocks & Other Equity Interests
(Cost $210,507,401) | | | | 219,295,798 | |
|
Money Market Funds–16.36% | |
Government & Agency Portfolio–Institutional Class, 0.29%(e) | | | 25,203,204 | | | | 25,203,204 | |
Treasury Portfolio–Institutional Class, 0.22%(e) | | | 16,802,136 | | | | 16,802,136 | |
Total Money Market Funds
(Cost $42,005,340) | | | | 42,005,340 | |
TOTAL INVESTMENTS–101.75%
(Cost $252,512,741) | | | | 261,301,138 | |
OTHER ASSETS LESS LIABILITIES–(1.75)% | | | | (4,485,202 | ) |
NET ASSETS–100.00% | | | $ | 256,815,936 | |
Investment Abbreviations:
| | |
| ADR | | – American Depositary Receipt |
Notes to Schedule of Investments:
| (a) | Industry and/or sector classifications used in this report are generally according to the Global Industry Classification Standard, which was developed by and is the exclusive property and a service mark of MSCI Inc. and Standard & Poor’s. |
| (b) | Non-income producing security. |
| (c) | Affiliated company during the period. The Investment Company Act of 1940 defines an “affiliated person” as an issuance in which a fund holds 5% or more of the outstanding voting securities. The Fund has not owned enough of the outstanding voting securities of the issuer to have control (as defined in the Investment Company Act of 1940) of that issuer. The value of this security as of October 31, 2016 represented 5.17% of the Fund’s Net Assets. See Note 4. |
| (d) | Each unit represents one ordinary share, seventeen Class A shares and one Class C share. |
| (e) | The money market fund and the Fund are affiliated by having the same investment adviser. The rate shown is the 7-day SEC standardized yield as of October 31, 2016. |
See accompanying Notes to Financial Statements which are an integral part of the financial statements.
9 Invesco Endeavor Fund
Statement of Assets and Liabilities
October 31, 2016
| | | | |
Assets: | |
Investments, at value (Cost $199,640,809) | | $ | 206,005,628 | |
Investments in affiliates, at value (Cost $52,871,932) | | | 55,295,510 | |
Total investments, at value (Cost $252,512,741) | | | 261,301,138 | |
Foreign currencies, at value (Cost $180) | | | 182 | |
Receivable for: | | | | |
Investments sold | | | 1,797,028 | |
Fund shares sold | | | 148,666 | |
Dividends | | | 248,193 | |
Investment for trustee deferred compensation and retirement plans | | | 61,783 | |
Other assets | | | 43,310 | |
Total assets | | | 263,600,300 | |
|
Liabilities: | |
Payable for: | | | | |
Investments purchased | | | 5,075,562 | |
Fund shares reacquired | | | 1,401,773 | |
Accrued fees to affiliates | | | 180,026 | |
Accrued trustees’ and officers’ fees and benefits | | | 1,706 | |
Accrued other operating expenses | | | 54,355 | |
Trustee deferred compensation and retirement plans | | | 70,942 | |
Total liabilities | | | 6,784,364 | |
Net assets applicable to shares outstanding | | $ | 256,815,936 | |
|
Net assets consist of: | |
Shares of beneficial interest | | $ | 240,664,410 | |
Undistributed net investment income (loss) | | | (173,954 | ) |
Undistributed net realized gain | | | 7,554,510 | |
Net unrealized appreciation | | | 8,770,970 | |
| | | $ | 256,815,936 | |
| | | | |
Net Assets: | |
Class A | | $ | 115,588,100 | |
Class B | | $ | 1,126,530 | |
Class C | | $ | 30,857,470 | |
Class R | | $ | 17,468,874 | |
Class Y | | $ | 19,937,945 | |
Class R5 | | $ | 21,192,494 | |
Class R6 | | $ | 50,644,523 | |
|
Shares outstanding, $0.01 par value per share,
with an unlimited number of shares authorized: | |
Class A | | | 6,725,864 | |
Class B | | | 73,869 | |
Class C | | | 2,021,766 | |
Class R | | | 1,051,007 | |
Class Y | | | 1,132,445 | |
Class R5 | | | 1,173,623 | |
Class R6 | | | 2,794,016 | |
Class A: | | | | |
Net asset value per share | | $ | 17.19 | |
Maximum offering price per share | | | | |
(Net asset value of $17.19 ¸ 94.50%) | | $ | 18.19 | |
Class B: | | | | |
Net asset value and offering price per share | | $ | 15.25 | |
Class C: | | | | |
Net asset value and offering price per share | | $ | 15.26 | |
Class R: | | | | |
Net asset value and offering price per share | | $ | 16.62 | |
Class Y: | | | | |
Net asset value and offering price per share | | $ | 17.61 | |
Class R5: | | | | |
Net asset value and offering price per share | | $ | 18.06 | |
Class R6: | | | | |
Net asset value and offering price per share | | $ | 18.13 | |
See accompanying Notes to Financial Statements which are an integral part of the financial statements.
10 Invesco Endeavor Fund
Statement of Operations
For the year ended October 31, 2016
| | | | |
Investment income: | |
Dividends (net of foreign withholding taxes of $56,039) | | $ | 3,473,161 | |
Dividends from affiliates | | | 123,881 | |
Total investment income | | | 3,597,042 | |
| |
Expenses: | | | | |
Advisory fees | | | 2,196,320 | |
Administrative services fees | | | 98,018 | |
Custodian fees | | | 15,049 | |
Distribution fees: | | | | |
Class A | | | 311,502 | |
Class B | | | 15,446 | |
Class C | | | 351,329 | |
Class R | | | 104,692 | |
Transfer agent fees — A, B, C, R and Y | | | 515,191 | |
Transfer agent fees — R5 | | | 25,742 | |
Transfer agent fees — R6 | | | 4,331 | |
Trustees’ and officers’ fees and benefits | | | 25,842 | |
Registration and filing fees | | | 90,536 | |
Reports to shareholders | | | 43,310 | |
Professional services fees | | | 57,490 | |
Other | | | 23,844 | |
Total expenses | | | 3,878,642 | |
Less: Fees waived and expense offset arrangement(s) | | | (58,914 | ) |
Net expenses | | | 3,819,728 | |
Net investment income (loss) | | | (222,686 | ) |
| |
Realized and unrealized gain (loss) from: | | | | |
Net realized gain (loss) from: | | | | |
Investment securities | | | 7,963,342 | |
Foreign currencies | | | (12,086 | ) |
| | | | 7,951,256 | |
Change in net unrealized appreciation (depreciation) of: | | | | |
Investment securities | | | (9,949,963 | ) |
Foreign currencies | | | 2,034 | |
| | | | (9,947,929 | ) |
Net realized and unrealized gain (loss) | | | (1,996,673 | ) |
Net increase (decrease) in net assets resulting from operations | | $ | (2,219,359 | ) |
See accompanying Notes to Financial Statements which are an integral part of the financial statements.
11 Invesco Endeavor Fund
Statement of Changes in Net Assets
For the years ended October 31, 2016 and 2015
| | | | | | | | |
| | | 2016 | | | 2015 | |
Operations: | | | | | |
Net investment income (loss) | | $ | (222,686 | ) | | $ | 79,190 | |
Net realized gain | | | 7,951,256 | | | | 44,320,413 | |
Change in net unrealized appreciation (depreciation) | | | (9,947,929 | ) | | | (68,639,695 | ) |
Net increase (decrease) in net assets resulting from operations | | | (2,219,359 | ) | | | (24,240,092 | ) |
| | |
Distributions to shareholders from net realized gains: | | | | | | | | |
Class A | | | (16,953,146 | ) | | | (16,971,372 | ) |
Class B | | | (267,843 | ) | | | (453,713 | ) |
Class C | | | (5,458,567 | ) | | | (5,169,171 | ) |
Class R | | | (3,009,806 | ) | | | (3,063,577 | ) |
Class Y | | | (4,208,147 | ) | | | (6,396,326 | ) |
Class R5 | | | (3,853,359 | ) | | | (4,210,075 | ) |
Class R6 | | | (10,628,285 | ) | | | (8,572,104 | ) |
Total distributions from net realized gains | | | (44,379,153 | ) | | | (44,836,338 | ) |
| | |
Share transactions–net: | | | | | | | | |
Class A | | | (16,330,124 | ) | | | (18,245,220 | ) |
Class B | | | (752,329 | ) | | | (2,074,219 | ) |
Class C | | | (6,649,697 | ) | | | (2,285,842 | ) |
Class R | | | (4,522,551 | ) | | | (5,006,283 | ) |
Class Y | | | (15,501,361 | ) | | | (22,528,058 | ) |
Class R5 | | | (9,049,506 | ) | | | (9,336,329 | ) |
Class R6 | | | (26,818,592 | ) | | | 4,570,049 | |
Net increase (decrease) in net assets resulting from share transactions | | | (79,624,160 | ) | | | (54,905,902 | ) |
Net increase (decrease) in net assets | | | (126,222,672 | ) | | | (123,982,332 | ) |
| | |
Net assets: | | | | | | | | |
Beginning of year | | | 383,038,608 | | | | 507,020,940 | |
End of year (includes undistributed net investment income (loss) of $(173,954) and $12,384, respectively) | | $ | 256,815,936 | | | $ | 383,038,608 | |
Notes to Financial Statements
October 31, 2016
NOTE 1—Significant Accounting Policies
Invesco Endeavor Fund (the “Fund”) is a series portfolio of AIM Investment Funds (Invesco Investment Funds) (the “Trust”). The Trust is organized as a Delaware statutory trust and is registered under the Investment Company Act of 1940, as amended (the “1940 Act”), as an open-end series management investment company consisting of twenty-two separate series portfolios, each authorized to issue an unlimited number of shares of beneficial interest. The assets, liabilities and operations of each portfolio are accounted for separately. Information presented in these financial statements pertains only to the Fund. Matters affecting each portfolio or class will be voted on exclusively by the shareholders of such portfolio or class.
The Fund’s investment objective is long-term growth of capital.
The Fund currently consists of seven different classes of shares: Class A, Class B, Class C, Class R, Class Y, Class R5 and Class R6. Class Y shares are available only to certain investors. Class A shares are sold with a front-end sales charge unless certain waiver criteria are met and under certain circumstances load waived shares may be subject to contingent deferred sales charges (“CDSC”). Class C shares are sold with a CDSC. Class R, Class Y, Class R5 and Class R6 shares are sold at net asset value. Effective November 30, 2010, new or additional investments in Class B shares are no longer permitted. Existing shareholders of Class B shares may continue to reinvest dividends and capital gains distributions in Class B shares until they convert to Class A shares. Also, shareholders in Class B shares will be able to exchange those shares for Class B shares of other Invesco Funds offering such shares until they convert to Class A shares. Generally, Class B shares will automatically convert to Class A shares on or about the month-end, which is at least eight years after the date of purchase. Redemption of Class B shares prior to the conversion date will be subject to a CDSC.
The following is a summary of the significant accounting policies followed by the Fund in the preparation of its financial statements.
| A. | Security Valuations — Securities, including restricted securities, are valued according to the following policy. |
A security listed or traded on an exchange (except convertible securities) is valued at its last sales price or official closing price as of the close of the customary trading session on the exchange where the security is principally traded, or lacking any sales or official closing price on a
12 Invesco Endeavor Fund
particular day, the security may be valued at the closing bid price on that day. Securities traded in the over-the-counter market are valued based on prices furnished by independent pricing services or market makers. When such securities are valued by an independent pricing service they may be considered fair valued. Futures contracts are valued at the final settlement price set by an exchange on which they are principally traded. Listed options are valued at the mean between the last bid and asked prices from the exchange on which they are principally traded. Options not listed on an exchange are valued by an independent source at the mean between the last bid and asked prices. For purposes of determining net asset value (“NAV”) per share, futures and option contracts generally are valued 15 minutes after the close of the customary trading session of the New York Stock Exchange (“NYSE”).
Investments in open-end and closed-end registered investment companies that do not trade on an exchange are valued at the end-of-day net asset value per share. Investments in open-end and closed-end registered investment companies that trade on an exchange are valued at the last sales price or official closing price as of the close of the customary trading session on the exchange where the security is principally traded.
Debt obligations (including convertible securities) and unlisted equities are fair valued using an evaluated quote provided by an independent pricing service. Evaluated quotes provided by the pricing service may be determined without exclusive reliance on quoted prices, and may reflect appropriate factors such as institution-size trading in similar groups of securities, developments related to specific securities, dividend rate (for unlisted equities), yield (for debt obligations), quality, type of issue, coupon rate (for debt obligations), maturity (for debt obligations), individual trading characteristics and other market data. Debt obligations are subject to interest rate and credit risks. In addition, all debt obligations involve some risk of default with respect to interest and/or principal payments.
Foreign securities’ (including foreign exchange contracts) prices are converted into U.S. dollar amounts using the applicable exchange rates as of the close of the NYSE. If market quotations are available and reliable for foreign exchange-traded equity securities, the securities will be valued at the market quotations. Because trading hours for certain foreign securities end before the close of the NYSE, closing market quotations may become unreliable. If between the time trading ends on a particular security and the close of the customary trading session on the NYSE, events occur that the Adviser determines are significant and make the closing price unreliable, the Fund may fair value the security. If the event is likely to have affected the closing price of the security, the security will be valued at fair value in good faith using procedures approved by the Board of Trustees. Adjustments to closing prices to reflect fair value may also be based on a screening process of an independent pricing service to indicate the degree of certainty, based on historical data, that the closing price in the principal market where a foreign security trades is not the current value as of the close of the NYSE. Foreign securities’ prices meeting the approved degree of certainty that the price is not reflective of current value will be priced at the indication of fair value from the independent pricing service. Multiple factors may be considered by the independent pricing service in determining adjustments to reflect fair value and may include information relating to sector indices, American Depositary Receipts and domestic and foreign index futures. Foreign securities may have additional risks including exchange rate changes, potential for sharply devalued currencies and high inflation, political and economic upheaval, the relative lack of issuer information, relatively low market liquidity and the potential lack of strict financial and accounting controls and standards.
Securities for which market prices are not provided by any of the above methods may be valued based upon quotes furnished by independent sources. The last bid price may be used to value equity securities. The mean between the last bid and asked prices is used to value debt obligations, including corporate loans.
Securities for which market quotations are not readily available or became unreliable are valued at fair value as determined in good faith by or under the supervision of the Trust’s officers following procedures approved by the Board of Trustees. Issuer specific events, market trends, bid/asked quotes of brokers and information providers and other market data may be reviewed in the course of making a good faith determination of a security’s fair value.
The Fund may invest in securities that are subject to interest rate risk, meaning the risk that the prices will generally fall as interest rates rise and, conversely, the prices will generally rise as interest rates fall. Specific securities differ in their sensitivity to changes in interest rates depending on their individual characteristics. Changes in interest rates may result in increased market volatility, which may affect the value and/or liquidity of certain Fund investments.
Valuations change in response to many factors including the historical and prospective earnings of the issuer, the value of the issuer’s assets, general economic conditions, interest rates, investor perceptions and market liquidity. Because of the inherent uncertainties of valuation, the values reflected in the financial statements may materially differ from the value received upon actual sale of those investments.
| B. | Securities Transactions and Investment Income — Securities transactions are accounted for on a trade date basis. Realized gains or losses on sales are computed on the basis of specific identification of the securities sold. Interest income (net of withholding tax, if any) is recorded on the accrual basis from settlement date. Dividend income (net of withholding tax, if any) is recorded on the ex-dividend date. |
The Fund may periodically participate in litigation related to Fund investments. As such, the Fund may receive proceeds from litigation settlements. Any proceeds received are included in the Statement of Operations as realized gain (loss) for investments no longer held and as unrealized gain (loss) for investments still held.
Brokerage commissions and mark ups are considered transaction costs and are recorded as an increase to the cost basis of securities purchased and/or a reduction of proceeds on a sale of securities. Such transaction costs are included in the determination of net realized and unrealized gain (loss) from investment securities reported in the Statement of Operations and the Statement of Changes in Net Assets and the net realized and unrealized gains (losses) on securities per share in the Financial Highlights. Transaction costs are included in the calculation of the Fund’s net asset value and, accordingly, they reduce the Fund’s total returns. These transaction costs are not considered operating expenses and are not reflected in net investment income reported in the Statement of Operations and the Statement of Changes in Net Assets, or the net investment income per share and the ratios of expenses and net investment income reported in the Financial Highlights, nor are they limited by any expense limitation arrangements between the Fund and the investment adviser.
The Fund allocates income and realized and unrealized capital gains and losses to a class based on the relative net assets of each class.
| C. | Country Determination — For the purposes of making investment selection decisions and presentation in the Schedule of Investments, the investment adviser may determine the country in which an issuer is located and/or credit risk exposure based on various factors. These factors include the laws of the country under which the issuer is organized, where the issuer maintains a principal office, the country in which the issuer derives 50% or more of its total revenues and the country that has the primary market for the issuer’s securities, as well as other criteria. Among the other criteria that may be evaluated for making this determination are the country in which the issuer maintains 50% or more of its assets, |
13 Invesco Endeavor Fund
| | the type of security, financial guarantees and enhancements, the nature of the collateral and the sponsor organization. Country of issuer and/or credit risk exposure has been determined to be the United States of America, unless otherwise noted. |
| D. | Distributions — Distributions from net investment income and net realized capital gain, if any, are generally declared and paid annually and recorded on the ex-dividend date. The Fund may elect to treat a portion of the proceeds from redemptions as distributions for federal income tax purposes. |
| E. | Federal Income Taxes — The Fund intends to comply with the requirements of Subchapter M of the Internal Revenue Code of 1986, as amended (the “Internal Revenue Code”), necessary to qualify as a regulated investment company and to distribute substantially all of the Fund’s taxable earnings to shareholders. As such, the Fund will not be subject to federal income taxes on otherwise taxable income (including net realized capital gain) that is distributed to shareholders. Therefore, no provision for federal income taxes is recorded in the financial statements. |
The Fund recognizes the tax benefits of uncertain tax positions only when the position is more likely than not to be sustained. Management has analyzed the Fund’s uncertain tax positions and concluded that no liability for unrecognized tax benefits should be recorded related to uncertain tax positions. Management is not aware of any tax positions for which it is reasonably possible that the total amounts of unrecognized tax benefits will change materially in the next 12 months.
The Fund files tax returns in the U.S. Federal jurisdiction and certain other jurisdictions. Generally, the Fund is subject to examinations by such taxing authorities for up to three years after the filing of the return for the tax period.
| F. | Expenses — Fees provided for under the Rule 12b-1 plan of a particular class of the Fund are charged to the operations of such class. Transfer agency fees and expenses and other shareholder recordkeeping fees and expenses attributable to Class R5 and Class R6 are allocated to each share class based on relative net assets. Sub-accounting fees attributable to Class R5 are charged to the operations of the class. Transfer agency fees and expenses and other shareholder recordkeeping fees and expenses relating to all other classes are allocated among those classes based on relative net assets. All other expenses are allocated among the classes based on relative net assets. |
| G. | Accounting Estimates — The preparation of financial statements in conformity with accounting principles generally accepted in the United States of America (“GAAP”) requires management to make estimates and assumptions that affect the reported amounts of assets and liabilities at the date of the financial statements and the reported amounts of revenues and expenses during the reporting period including estimates and assumptions related to taxation. Actual results could differ from those estimates by a significant amount. In addition, the Fund monitors for material events or transactions that may occur or become known after the period-end date and before the date the financial statements are released to print. |
| H. | Indemnifications — Under the Trust’s organizational documents, each Trustee, officer, employee or other agent of the Trust is indemnified against certain liabilities that may arise out of the performance of their duties to the Fund. Additionally, in the normal course of business, the Fund enters into contracts, including the Fund’s servicing agreements, that contain a variety of indemnification clauses. The Fund’s maximum exposure under these arrangements is unknown as this would involve future claims that may be made against the Fund that have not yet occurred. The risk of material loss as a result of such indemnification claims is considered remote. |
| I. | Foreign Currency Translations — Foreign currency is valued at the close of the NYSE based on quotations posted by banks and major currency dealers. Portfolio securities and other assets and liabilities denominated in foreign currencies are translated into U.S. dollar amounts at date of valuation. Purchases and sales of portfolio securities (net of foreign taxes withheld on disposition) and income items denominated in foreign currencies are translated into U.S. dollar amounts on the respective dates of such transactions. The Fund does not separately account for the portion of the results of operations resulting from changes in foreign exchange rates on investments and the fluctuations arising from changes in market prices of securities held. The combined results of changes in foreign exchange rates and the fluctuation of market prices on investments (net of estimated foreign tax withholding) are included with the net realized and unrealized gain or loss from investments in the Statement of Operations. Reported net realized foreign currency gains or losses arise from (1) sales of foreign currencies, (2) currency gains or losses realized between the trade and settlement dates on securities transactions, and (3) the difference between the amounts of dividends, interest, and foreign withholding taxes recorded on the Fund’s books and the U.S. dollar equivalent of the amounts actually received or paid. Net unrealized foreign currency gains and losses arise from changes in the fair values of assets and liabilities, other than investments in securities at fiscal period end, resulting from changes in exchange rates. |
The Fund may invest in foreign securities, which may be subject to foreign taxes on income, gains on investments or currency repatriation, a portion of which may be recoverable. Foreign taxes, if any, are recorded based on the tax regulations and rates that exist in the foreign markets in which the Fund invests and are shown in the Statement of Operations.
| J. | Forward Foreign Currency Contracts — The Fund may engage in foreign currency transactions either on a spot (i.e. for prompt delivery and settlement) basis, or through forward foreign currency contracts, to manage or minimize currency or exchange rate risk. |
The Fund may also enter into forward foreign currency contracts for the purchase or sale of a security denominated in a foreign currency in order to “lock in” the U.S. dollar price of that security, or the Fund may also enter into forward foreign currency contracts that do not provide for physical settlement of the two currencies, but instead are settled by a single cash payment calculated as the difference between the agreed upon exchange rate and the spot rate at settlement based upon an agreed upon notional amount (non-deliverable forwards). The Fund will set aside liquid assets in an amount equal to the daily mark-to-market obligation for forward foreign currency contracts.
A forward foreign currency contract is an obligation between two parties (“Counterparties”) to purchase or sell a specific currency for an agreed-upon price at a future date. The use of forward foreign currency contracts does not eliminate fluctuations in the price of the underlying securities the Fund owns or intends to acquire but establishes a rate of exchange in advance. Fluctuations in the value of these contracts are measured by the difference in the contract date and reporting date exchange rates and are recorded as unrealized appreciation (depreciation) until the contracts are closed. When the contracts are closed, realized gains (losses) are recorded. Realized and unrealized gains (losses) on the contracts are included in the Statement of Operations. The primary risks associated with forward foreign currency contracts include failure of the Counterparty to meet the terms of the contract and the value of the foreign currency changing unfavorably. These risks may be in excess of the amounts reflected in the Statement of Assets and Liabilities.
14 Invesco Endeavor Fund
NOTE 2—Advisory Fees and Other Fees Paid to Affiliates
The Trust has entered into a master investment advisory agreement with Invesco Advisers, Inc. (the “Adviser” or “Invesco”). Under the terms of the investment advisory agreement, the Fund pays an advisory fee to the Adviser based on the annual rate of the Fund’s average daily net assets as follows:
| | | | | | | | |
| Average Daily Net Assets | | Rate | |
First $250 million | | | 0 | .745% | | | | |
Next $250 million | | | 0 | .73% | | | | |
Next $500 million | | | 0 | .715% | | | | |
Next $1.5 billion | | | 0 | .70% | | | | |
Next $2.5 billion | | | 0 | .685% | | | | |
Next $2.5 billion | | | 0 | .67% | | | | |
Next $2.5 billion | | | 0 | .655% | | | | |
Over $10 billion | | | 0 | .64% | | | | |
For the year ended October 31, 2016, the effective advisory fees incurred by the Fund was 0.74%.
Under the terms of a master sub-advisory agreement between the Adviser and each of Invesco Asset Management Deutschland GmbH, Invesco Asset Management Limited, Invesco Asset Management (Japan) Limited, Invesco Hong Kong Limited, Invesco Senior Secured Management, Inc. and Invesco Canada Ltd. (collectively, the “Affiliated Sub-Advisers”) the Adviser, not the Fund, will pay 40% of the fees paid to the Adviser to any such Affiliated Sub-Adviser(s) that provide(s) discretionary investment management services to the Fund based on the percentage of assets allocated to such Affiliated Sub-Adviser(s).
The Adviser has contractually agreed, through at least June 30, 2017, to waive advisory fees and/or reimburse expenses to the extent necessary to limit total annual fund operating expenses after fee waiver and/or expense reimbursement (excluding certain items discussed below) of Class A, Class B, Class C, Class R, Class Y, Class R5 and Class R6 shares to 2.00%, 2.75%, 2.75%, 2.25%, 1.75%, 1.75% and 1.75%, respectively, of the Fund’s average daily net assets (the “expense limits”). In determining the Adviser’s obligation to waive advisory fees and/or reimburse expenses, the following expenses are not taken into account, and could cause the total annual fund operating expenses after fee waiver and/or expense reimbursement to exceed the numbers reflected above: (1) interest; (2) taxes; (3) dividend expense on short sales; (4) extraordinary or non-routine items, including litigation expenses; and (5) expenses that the Fund has incurred but did not actually pay because of an expense offset arrangement. Unless Invesco continues the fee waiver agreement, it will terminate on June 30, 2017. During its term, the fee waiver agreement cannot be terminated or amended to increase the expense limits without approval of the Board of Trustees. The Adviser did not waive fees and/or reimburse expenses during the period under these expense limits.
Further, the Adviser has contractually agreed, through at least June 30, 2018, to waive the advisory fee payable by the Fund in an amount equal to 100% of the net advisory fees the Adviser receives from the affiliated money market funds on investments by the Fund of uninvested cash in such affiliated money market funds.
For the year ended October 31, 2016, the Adviser waived advisory fees of $56,643.
The Trust has entered into a master administrative services agreement with Invesco pursuant to which the Fund has agreed to pay Invesco for certain administrative costs incurred in providing accounting services to the Fund. For the year ended October 31, 2016, expenses incurred under the agreement are shown in the Statement of Operations as Administrative services fees.
The Trust has entered into a transfer agency and service agreement with Invesco Investment Services, Inc. (“IIS”) pursuant to which the Fund has agreed to pay IIS a fee for providing transfer agency and shareholder services to the Fund and reimburse IIS for certain expenses incurred by IIS in the course of providing such services. IIS may make payments to intermediaries that provide omnibus account services, sub-accounting services and/or networking services. All fees payable by IIS to intermediaries that provide omnibus account services or sub-accounting are charged back to the Fund, subject to certain limitations approved by the Trust’s Board of Trustees. For the year ended October 31, 2016, expenses incurred under the agreement are shown in the Statement of Operations as Transfer agent fees.
The Trust has entered into master distribution agreements with Invesco Distributors, Inc. (“IDI”) to serve as the distributor for the Class A, Class B, Class C, Class R, Class Y, Class R5 and Class R6 shares of the Fund. The Trust has adopted plans pursuant to Rule 12b-1 under the 1940 Act with respect to the Fund’s Class A, Class B, Class C and Class R shares (collectively, the “Plans”). The Fund, pursuant to the Plans, pays IDI compensation at the annual rate of 0.25% of the Fund’s average daily net assets of Class A shares, 1.00% of the average daily net assets of Class B and Class C shares and 0.50% of the average daily net assets of Class R shares. Of the Plan payments, up to 0.25% of the average daily net assets of each class of shares may be paid to furnish continuing personal shareholder services to customers who purchase and own shares of such classes. Any amounts not paid as a service fee under the Plans would constitute an asset-based sales charge. Rules of the Financial Industry Regulatory Authority (“FINRA”) impose a cap on the total sales charges, including asset-based sales charges, that may be paid by any class of shares of the Fund. For the year ended October 31, 2016, expenses incurred under the Plans are shown in the Statement of Operations as Distribution fees.
Front-end sales commissions and CDSC (collectively, the “sales charges”) are not recorded as expenses of the Fund. Front-end sales commissions are deducted from proceeds from the sales of Fund shares prior to investment in Class A shares of the Fund. CDSC are deducted from redemption proceeds prior to remittance to the shareholder. During the year ended October 31, 2016, IDI advised the Fund that IDI retained $25,526 in front-end sales commissions from the sale of Class A shares and $622, $573 and $2,503 from Class A, Class B and Class C shares, respectively, for CDSC imposed on redemptions by shareholders.
Certain officers and trustees of the Trust are officers and directors of the Adviser, IIS and/or IDI.
15 Invesco Endeavor Fund
NOTE 3—Additional Valuation Information
GAAP defines fair value as the price that would be received to sell an asset or paid to transfer a liability in an orderly transaction between market participants at the measurement date, under current market conditions. GAAP establishes a hierarchy that prioritizes the inputs to valuation methods, giving the highest priority to readily available unadjusted quoted prices in an active market for identical assets (Level 1) and the lowest priority to significant unobservable inputs (Level 3), generally when market prices are not readily available or are unreliable. Based on the valuation inputs, the securities or other investments are tiered into one of three levels. Changes in valuation methods may result in transfers in or out of an investment’s assigned level:
| | Level 1 — | Prices are determined using quoted prices in an active market for identical assets. |
| | Level 2 — | Prices are determined using other significant observable inputs. Observable inputs are inputs that other market participants may use in pricing a security. These may include quoted prices for similar securities, interest rates, prepayment speeds, credit risk, yield curves, loss severities, default rates, discount rates, volatilities and others. |
| | Level 3 — | Prices are determined using significant unobservable inputs. In situations where quoted prices or observable inputs are unavailable (for example, when there is little or no market activity for an investment at the end of the period), unobservable inputs may be used. Unobservable inputs reflect the Fund’s own assumptions about the factors market participants would use in determining fair value of the securities or instruments and would be based on the best available information. |
As of October 31, 2016, all of the securities in this Fund were valued based on Level 1 inputs (see the Schedule of Investments for security categories). The level assigned to the securities valuations may not be an indication of the risk or liquidity associated with investing in those securities. Because of the inherent uncertainties of valuation, the values reflected in the financial statements may materially differ from the value received upon actual sale of those investments.
NOTE 4—Investments in Other Affiliates
The 1940 Act defines an “affiliated person” as an issuance in which a fund holds 5% or more of the outstanding voting securities. The Fund has not owned enough of the outstanding voting securities of the issuer to have control (as defined in the 1940 Act) of that issuer. The following is a summary of the investments in other affiliates for the year ended October 31, 2016.
| | | | | | | | | | | | | | | | | | | | | | | | | | | | |
| | | Value 10/31/2015 | | | Purchases
at Cost | | | Proceeds
from Sales | | | Change in
Unrealized
Appreciation | | | Realized
Gain (Loss) | | | Value 10/31/2016 | | | Dividend
Income | |
Orion Group Holdings, Inc. | | $ | 10,999,464 | | | $ | 604,141 | | | $ | (9,253,740 | ) | | $ | 15,102,077 | | | $ | (4,161,772 | ) | | $ | 13,290,170 | | | $ | — | |
NOTE 5—Expense Offset Arrangement(s)
The expense offset arrangement is comprised of transfer agency credits which result from balances in demand deposit accounts used by the transfer agent for clearing shareholder transactions. For the year ended October 31, 2016, the Fund received credits from this arrangement, which resulted in the reduction of the Fund’s total expenses of $2,271.
NOTE 6—Trustees’ and Officers’ Fees and Benefits
Trustees’ and Officers’ Fees and Benefits include amounts accrued by the Fund to pay remuneration to certain Trustees and Officers of the Fund. Trustees have the option to defer compensation payable by the Fund, and Trustees’ and Officers’ Fees and Benefits also include amounts accrued by the Fund to fund such deferred compensation amounts. Those Trustees who defer compensation have the option to select various Invesco Funds in which their deferral accounts shall be deemed to be invested. Finally, certain current Trustees were eligible to participate in a retirement plan that provided for benefits to be paid upon retirement to Trustees over a period of time based on the number of years of service. The Fund may have certain former Trustees who also participate in a retirement plan and receive benefits under such plan. Trustees’ and Officers’ Fees and Benefits include amounts accrued by the Fund to fund such retirement benefits. Obligations under the deferred compensation and retirement plans represent unsecured claims against the general assets of the Fund.
NOTE 7—Cash Balances
The Fund is permitted to temporarily carry a negative or overdrawn balance in its account with State Street Bank and Trust Company, the custodian bank. Such balances, if any at period-end, are shown in the Statement of Assets and Liabilities under the payable caption Amount due custodian. To compensate the custodian bank for such overdrafts, the overdrawn Fund may either (1) leave funds as a compensating balance in the account so the custodian bank can be compensated by earning the additional interest; or (2) compensate by paying the custodian bank at a rate agreed upon by the custodian bank and Invesco, not to exceed the contractually agreed upon rate.
16 Invesco Endeavor Fund
NOTE 8—Distributions to Shareholders and Tax Components of Net Assets
Tax Character of Distributions to Shareholders Paid During the Fiscal Years Ended October 31, 2016 and 2015:
| | | | | | | | |
| | | 2016 | | | 2015 | |
Ordinary income | | $ | 8,302,567 | | | $ | 3,648,252 | |
Long-term capital gain | | | 36,076,586 | | | | 41,188,086 | |
Total distributions | | $ | 44,379,153 | | | $ | 44,836,338 | |
Tax Components of Net Assets at Period-End:
| | | | |
| | | 2016 | |
Undistributed long-term gain | | $ | 8,944,569 | |
Net unrealized appreciation — investments | | | 7,818,841 | |
Net unrealized appreciation (depreciation) — other investments | | | (17,427 | ) |
Temporary book/tax differences | | | (594,457 | ) |
Shares of beneficial interest | | | 240,664,410 | |
Total net assets | | $ | 256,815,936 | |
The difference between book-basis and tax-basis unrealized appreciation (depreciation) is due to differences in the timing of recognition of gains and losses on investments for tax and book purposes. The Fund’s net unrealized appreciation difference is attributable primarily to wash sales and partnership adjustments.
The temporary book/tax differences are a result of timing differences between book and tax recognition of income and/or expenses. The Fund’s temporary book/tax differences are the result of the trustee deferral of compensation and retirement plan benefits.
Capital loss carryforward is calculated and reported as of a specific date. Results of transactions and other activity after that date may affect the amount of capital loss carryforward actually available for the Fund to utilize. Capital losses generated in years beginning after December 22, 2010 can be carried forward for an unlimited period, whereas previous losses expire in eight tax years. Capital losses with an expiration period may not be used to offset capital gains until all net capital losses without an expiration date have been utilized. Capital loss carryforwards with no expiration date will retain their character as either short-term or long-term capital losses instead of as short-term capital losses as under prior law. The ability to utilize capital loss carryforwards in the future may be limited under the Internal Revenue Code and related regulations based on the results of future transactions.
The Fund does not have a capital loss carryforward as of October 31, 2016.
NOTE 9—Investment Securities
The aggregate amount of investment securities (other than short-term securities, U.S. Treasury obligations and money market funds, if any) purchased and sold by the Fund during the year ended October 31, 2016 was $72,084,690 and $184,183,052, respectively. Cost of investments on a tax basis includes the adjustments for financial reporting purposes as of the most recently completed federal income tax reporting period-end.
| | | | |
| Unrealized Appreciation (Depreciation) of Investment Securities on a Tax Basis | |
Aggregate unrealized appreciation of investment securities | | $ | 46,131,109 | |
Aggregate unrealized (depreciation) of investment securities | | | (38,312,268 | ) |
Net unrealized appreciation of investment securities | | $ | 7,818,841 | |
Cost of investments for tax purposes is $253,482,297.
NOTE 10—Reclassification of Permanent Differences
Primarily as a result of differing book/tax treatment of partnerships and foreign currency transactions, on October 31, 2016, undistributed net investment income (loss) was increased by $36,348 and undistributed net realized gain was decreased by $36,348. This reclassification had no effect on the net assets of the Fund.
17 Invesco Endeavor Fund
NOTE 11—Share Information
| | | | | | | | | | | | | | | | |
| | | Summary of Share Activity | |
| | | Years ended October 31, | |
| | | 2016(a) | | | 2015 | |
| | | Shares | | | Amount | | | Shares | | | Amount | |
Sold: | | | | | | | | | | | | | | | | |
Class A | | | 860,186 | | | $ | 14,340,623 | | | | 1,272,962 | | | $ | 26,412,566 | |
Class B | | | 2,418 | | | | 36,076 | | | | 9,544 | | | | 186,297 | |
Class C | | | 178,482 | | | | 2,641,468 | | | | 314,817 | | | | 5,940,578 | |
Class R | | | 207,312 | | | | 3,306,725 | | | | 373,372 | | | | 7,499,961 | |
Class Y | | | 343,957 | | | | 5,943,184 | | | | 845,439 | | | | 17,788,622 | |
Class R5 | | | 202,044 | | | | 3,521,471 | | | | 447,301 | | | | 9,680,718 | |
Class R6 | | | 336,427 | | | | 6,002,904 | | | | 466,434 | | | | 9,759,478 | |
| | | | |
Issued as reinvestment of dividends: | | | | | | | | | | | | | | | | |
Class A | | | 1,016,193 | | | | 16,015,191 | | | | 804,187 | | | | 15,947,033 | |
Class B | | | 18,509 | | | | 260,602 | | | | 23,396 | | | | 423,933 | |
Class C | | | 365,900 | | | | 5,155,537 | | | | 269,529 | | | | 4,886,566 | |
Class R | | | 196,832 | | | | 3,007,596 | | | | 158,224 | | | | 3,061,643 | |
Class Y | | | 197,663 | | | | 3,184,354 | | | | 248,068 | | | | 5,001,049 | |
Class R5 | | | 229,868 | | | | 3,792,828 | | | | 177,190 | | | | 3,644,799 | |
Class R6 | | | 642,192 | | | | 10,628,285 | | | | 416,122 | | | | 8,572,104 | |
| | | | |
Automatic conversion of Class B shares to Class A shares: | | | | | | | | | | | | | | | | |
Class A | | | 41,420 | | | | 690,224 | | | | 86,498 | | | | 1,786,311 | |
Class B | | | (46,444 | ) | | | (690,224 | ) | | | (94,907 | ) | | | (1,786,311 | ) |
| | | | |
Reacquired: | | | | | | | | | | | | | | | | |
Class A | | | (2,835,913 | ) | | | (47,376,162 | ) | | | (3,041,053 | ) | | | (62,391,130 | ) |
Class B | | | (23,972 | ) | | | (358,783 | ) | | | (47,852 | ) | | | (898,138 | ) |
Class C | | | (973,922 | ) | | | (14,446,702 | ) | | | (703,371 | ) | | | (13,112,986 | ) |
Class R | | | (676,277 | ) | | | (10,836,872 | ) | | | (777,312 | ) | | | (15,567,887 | ) |
Class Y | | | (1,464,934 | ) | | | (24,628,899 | ) | | | (2,176,314 | ) | | | (45,317,729 | ) |
Class R5 | | | (944,280 | ) | | | (16,363,805 | ) | | | (1,054,881 | ) | | | (22,661,846 | ) |
Class R6(b) | | | (2,719,196 | ) | | | (43,449,781 | ) | | | (647,593 | ) | | | (13,761,533 | ) |
Net increase (decrease) in share activity | | | (4,845,535 | ) | | $ | (79,624,160 | ) | | | (2,630,200 | ) | | $ | (54,905,902 | ) |
| (a) | There are entities that are record owners of more than 5% of the outstanding shares of the Fund and in the aggregate own 12% of the outstanding shares of the Fund. IDI has an agreement with these entities to sell Fund shares. The Fund, Invesco and/or Invesco affiliates may make payments to these entities, which are considered to be related to the Fund, for providing services to the Fund, Invesco and/or Invesco affiliates including but not limited to services such as securities brokerage, distribution, third party record keeping and account servicing. The Fund has no knowledge as to whether all or any portion of the shares owned of record by these entities are also owned beneficially. |
| | In addition, 17% of the outstanding shares of the Fund are owned by the Adviser or an affiliate of the Adviser. |
| (b) | On February 18, 2016, 2,004,623 Class R6 shares valued at $30,931,333 were redeemed by affiliated mutual funds. |
18 Invesco Endeavor Fund
NOTE 12—Financial Highlights
The following schedule presents financial highlights for a share of the Fund outstanding throughout the periods indicated.
| | | | | | | | | | | | | | | | | | | | | | | | | | | | | | | | | | | | | | | | | | | | | | | | | | | | | | | | |
| | | Net asset
value,
beginning
of period | | | Net
investment
income
(loss)(a) | | | Net gains
(losses)
on securities
(both
realized and
unrealized) | | | Total from
investment
operations | | | Dividends
from net
investment
income | | | Distributions
from net
realized
gains | | | Total
distributions | | | Net asset
value, end
of period | | | Total
return(b) | | | Net assets,
end of period
(000’s omitted) | | | Ratio of
expenses
to average
net assets
with fee waivers
and/or expenses
absorbed | | | Ratio of
expenses
to average net
assets without
fee waivers
and/or expenses
absorbed | | | Ratio of net
investment
income (loss)
to average
net assets | | | Portfolio
turnover(c) | |
Class A | |
Year ended 10/31/16 | | $ | 19.30 | | | $ | (0.02 | ) | | $ | 0.21 | | | $ | 0.19 | | | $ | — | | | $ | (2.30 | ) | | $ | (2.30 | ) | | $ | 17.19 | | | | 2.08 | % | | $ | 115,588 | | | | 1.34 | %(d) | | | 1.36 | %(d) | | | (0.12 | )%(d) | | | 28 | % |
Year ended 10/31/15 | | | 22.57 | | | | (0.01 | ) | | | (1.25 | ) | | | (1.26 | ) | | | — | | | | (2.01 | ) | | | (2.01 | ) | | | 19.30 | | | | (5.80 | ) | | | 147,504 | | | | 1.26 | | | | 1.29 | | | | (0.04 | ) | | | 27 | |
Year ended 10/31/14 | | | 21.18 | | | | (0.09 | ) | | | 2.35 | | | | 2.26 | | | | (0.01 | ) | | | (0.86 | ) | | | (0.87 | ) | | | 22.57 | | | | 11.13 | | | | 192,326 | | | | 1.26 | | | | 1.29 | | | | (0.43 | ) | | | 27 | |
Year ended 10/31/13 | | | 18.19 | | | | (0.00 | ) | | | 4.78 | | | | 4.78 | | | | (0.06 | ) | | | (1.73 | ) | | | (1.79 | ) | | | 21.18 | | | | 28.78 | | | | 180,568 | | | | 1.26 | | | | 1.30 | | | | (0.02 | ) | | | 20 | |
Year ended 10/31/12 | | | 16.36 | | | | (0.08 | ) | | | 1.98 | | | | 1.90 | | | | — | | | | (0.07 | ) | | | (0.07 | ) | | | 18.19 | | | | 11.70 | | | | 102,508 | | | | 1.34 | | | | 1.37 | | | | (0.41 | ) | | | 37 | |
Class B | | | | | | | | | | | | | | | | | | | | | | | | | | | | | | | | | | | | | | | | | | | | | | | | | | | | | | | | |
Year ended 10/31/16 | | | 17.52 | | | | (0.13 | ) | | | 0.16 | | | | 0.03 | | | | — | | | | (2.30 | ) | | | (2.30 | ) | | | 15.25 | | | | 1.28 | | | | 1,127 | | | | 2.09 | (d) | | | 2.11 | (d) | | | (0.87 | )(d) | | | 28 | |
Year ended 10/31/15 | | | 20.82 | | | | (0.15 | ) | | | (1.14 | ) | | | (1.29 | ) | | | — | | | | (2.01 | ) | | | (2.01 | ) | | | 17.52 | | | | (6.50 | ) | | | 2,161 | | | | 2.01 | | | | 2.04 | | | | (0.79 | ) | | | 27 | |
Year ended 10/31/14 | | | 19.74 | | | | (0.24 | ) | | | 2.18 | | | | 1.94 | | | | — | | | | (0.86 | ) | | | (0.86 | ) | | | 20.82 | | | | 10.27 | | | | 4,855 | | | | 2.01 | | | | 2.04 | | | | (1.18 | ) | | | 27 | |
Year ended 10/31/13 | | | 17.16 | | | | (0.14 | ) | | | 4.49 | | | | 4.35 | | | | (0.04 | ) | | | (1.73 | ) | | | (1.77 | ) | | | 19.74 | | | | 27.89 | | | | 5,921 | | | | 2.01 | | | | 2.05 | | | | (0.77 | ) | | | 20 | |
Year ended 10/31/12 | | | 15.55 | | | | (0.19 | ) | | | 1.87 | | | | 1.68 | | | | — | | | | (0.07 | ) | | | (0.07 | ) | | | 17.16 | | | | 10.89 | | | | 6,195 | | | | 2.09 | | | | 2.12 | | | | (1.16 | ) | | | 37 | |
Class C | | | | | | | | | | | | | | | | | | | | | | | | | | | | | | | | | | | | | | | | | | | | | | | | | | | | | | | | |
Year ended 10/31/16 | | | 17.53 | | | | (0.13 | ) | | | 0.16 | | | | 0.03 | | | | — | | | | (2.30 | ) | | | (2.30 | ) | | | 15.26 | | | | 1.27 | | | | 30,857 | | | | 2.09 | (d) | | | 2.11 | (d) | | | (0.87 | )(d) | | | 28 | |
Year ended 10/31/15 | | | 20.83 | | | | (0.15 | ) | | | (1.14 | ) | | | (1.29 | ) | | | — | | | | (2.01 | ) | | | (2.01 | ) | | | 17.53 | | | | (6.49 | ) | | | 42,965 | | | | 2.01 | | | | 2.04 | | | | (0.79 | ) | | | 27 | |
Year ended 10/31/14 | | | 19.75 | | | | (0.24 | ) | | | 2.18 | | | | 1.94 | | | | — | | | | (0.86 | ) | | | (0.86 | ) | | | 20.83 | | | | 10.27 | | | | 53,542 | | | | 2.01 | | | | 2.04 | | | | (1.18 | ) | | | 27 | |
Year ended 10/31/13 | | | 17.17 | | | | (0.14 | ) | | | 4.49 | | | | 4.35 | | | | (0.04 | ) | | | (1.73 | ) | | | (1.77 | ) | | | 19.75 | | | | 27.87 | | | | 49,344 | | | | 2.01 | | | | 2.05 | | | | (0.77 | ) | | | 20 | |
Year ended 10/31/12 | | | 15.56 | | | | (0.19 | ) | | | 1.87 | | | | 1.68 | | | | — | | | | (0.07 | ) | | | (0.07 | ) | | | 17.17 | | | | 10.88 | | | | 26,513 | | | | 2.09 | | | | 2.12 | | | | (1.16 | ) | | | 37 | |
Class R | | | | | | | | | | | | | | | | | | | | | | | | | | | | | | | | | | | | | | | | | | | | | | | | | | | | | | | | |
Year ended 10/31/16 | | | 18.78 | | | | (0.06 | ) | | | 0.20 | | | | 0.14 | | | | — | | | | (2.30 | ) | | | (2.30 | ) | | | 16.62 | | | | 1.83 | | | | 17,469 | | | | 1.59 | (d) | | | 1.61 | (d) | | | (0.37 | )(d) | | | 28 | |
Year ended 10/31/15 | | | 22.08 | | | | (0.06 | ) | | | (1.23 | ) | | | (1.29 | ) | | | — | | | | (2.01 | ) | | | (2.01 | ) | | | 18.78 | | | | (6.09 | ) | | | 24,855 | | | | 1.51 | | | | 1.54 | | | | (0.29 | ) | | | 27 | |
Year ended 10/31/14 | | | 20.77 | | | | (0.14 | ) | | | 2.31 | | | | 2.17 | | | | — | | | | (0.86 | ) | | | (0.86 | ) | | | 22.08 | | | | 10.89 | | | | 34,634 | | | | 1.51 | | | | 1.54 | | | | (0.68 | ) | | | 27 | |
Year ended 10/31/13 | | | 17.91 | | | | (0.05 | ) | | | 4.69 | | | | 4.64 | | | | (0.05 | ) | | | (1.73 | ) | | | (1.78 | ) | | | 20.77 | | | | 28.43 | | | | 34,556 | | | | 1.51 | | | | 1.55 | | | | (0.27 | ) | | | 20 | |
Year ended 10/31/12 | | | 16.14 | | | | (0.11 | ) | | | 1.95 | | | | 1.84 | | | | — | | | | (0.07 | ) | | | (0.07 | ) | | | 17.91 | | | | 11.49 | | | | 23,412 | | | | 1.59 | | | | 1.62 | | | | (0.66 | ) | | | 37 | |
Class Y | | | | | | | | | | | | | | | | | | | | | | | | | | | | | | | | | | | | | | | | | | | | | | | | | | | | | | | | |
Year ended 10/31/16 | | | 19.66 | | | | 0.02 | | | | 0.23 | | | | 0.25 | | | | — | | | | (2.30 | ) | | | (2.30 | ) | | | 17.61 | | | | 2.37 | | | | 19,938 | | | | 1.09 | (d) | | | 1.11 | (d) | | | 0.13 | (d) | | | 28 | |
Year ended 10/31/15 | | | 22.91 | | | | 0.04 | | | | (1.28 | ) | | | (1.24 | ) | | | — | | | | (2.01 | ) | | | (2.01 | ) | | | 19.66 | | | | (5.61 | ) | | | 40,425 | | | | 1.01 | | | | 1.04 | | | | 0.21 | | | | 27 | |
Year ended 10/31/14 | | | 21.48 | | | | (0.04 | ) | | | 2.38 | | | | 2.34 | | | | (0.05 | ) | | | (0.86 | ) | | | (0.91 | ) | | | 22.91 | | | | 11.39 | | | | 71,898 | | | | 1.01 | | | | 1.04 | | | | (0.18 | ) | | | 27 | |
Year ended 10/31/13 | | | 18.38 | | | | 0.05 | | | | 4.84 | | | | 4.89 | | | | (0.06 | ) | | | (1.73 | ) | | | (1.79 | ) | | | 21.48 | | | | 29.15 | | | | 92,483 | | | | 1.01 | | | | 1.05 | | | | 0.23 | | | | 20 | |
Year ended 10/31/12 | | | 16.49 | | | | (0.03 | ) | | | 1.99 | | | | 1.96 | | | | — | | | | (0.07 | ) | | | (0.07 | ) | | | 18.38 | | | | 11.97 | | | | 22,529 | | | | 1.09 | | | | 1.12 | | | | (0.16 | ) | | | 37 | |
Class R5 | | | | | | | | | | | | | | | | | | | | | | | | | | | | | | | | | | | | | | | | | | | | | | | | | | | | | | | | |
Year ended 10/31/16 | | | 20.08 | | | | 0.05 | | | | 0.23 | | | | 0.28 | | | | — | | | | (2.30 | ) | | | (2.30 | ) | | | 18.06 | | | | 2.49 | | | | 21,192 | | | | 0.94 | (d) | | | 0.96 | (d) | | | 0.28 | (d) | | | 28 | |
Year ended 10/31/15 | | | 23.32 | | | | 0.07 | | | | (1.30 | ) | | | (1.23 | ) | | | — | | | | (2.01 | ) | | | (2.01 | ) | | | 20.08 | | | | (5.46 | ) | | | 33,854 | | | | 0.89 | | | | 0.92 | | | | 0.33 | | | | 27 | |
Year ended 10/31/14 | | | 21.84 | | | | (0.02 | ) | | | 2.43 | | | | 2.41 | | | | (0.07 | ) | | | (0.86 | ) | | | (0.93 | ) | | | 23.32 | | | | 11.51 | | | | 49,356 | | | | 0.90 | | | | 0.93 | | | | (0.07 | ) | | | 27 | |
Year ended 10/31/13 | | | 18.65 | | | | 0.07 | | | | 4.92 | | | | 4.99 | | | | (0.07 | ) | | | (1.73 | ) | | | (1.80 | ) | | | 21.84 | | | | 29.24 | | | | 31,593 | | | | 0.91 | | | | 0.95 | | | | 0.33 | | | | 20 | |
Year ended 10/31/12 | | | 16.69 | | | | 0.01 | | | | 2.02 | | | | 2.03 | | | | — | | | | (0.07 | ) | | | (0.07 | ) | | | 18.65 | | | | 12.25 | | | | 16,677 | | | | 0.87 | | | | 0.90 | | | | 0.06 | | | | 37 | |
Class R6 | | | | | | | | | | | | | | | | | | | | | | | | | | | | | | | | | | | | | | | | | | | | | | | | | | | | | | | | |
Year ended 10/31/16 | | | 20.13 | | | | 0.06 | | | | 0.24 | | | | 0.30 | | | | — | | | | (2.30 | ) | | | (2.30 | ) | | | 18.13 | | | | 2.59 | | | | 50,645 | | | | 0.85 | (d) | | | 0.87 | (d) | | | 0.37 | (d) | | | 28 | |
Year ended 10/31/15 | | | 23.35 | | | | 0.09 | | | | (1.30 | ) | | | (1.21 | ) | | | — | | | | (2.01 | ) | | | (2.01 | ) | | | 20.13 | | | | (5.36 | ) | | | 91,275 | | | | 0.80 | | | | 0.83 | | | | 0.42 | | | | 27 | |
Year ended 10/31/14 | | | 21.86 | | | | 0.01 | | | | 2.42 | | | | 2.43 | | | | (0.08 | ) | | | (0.86 | ) | | | (0.94 | ) | | | 23.35 | | | | 11.62 | | | | 100,410 | | | | 0.81 | | | | 0.84 | | | | 0.02 | | | | 27 | |
Year ended 10/31/13 | | | 18.65 | | | | 0.08 | | | | 4.93 | | | | 5.01 | | | | (0.07 | ) | | | (1.73 | ) | | | (1.80 | ) | | | 21.86 | | | | 29.37 | | | | 90,291 | | | | 0.82 | | | | 0.86 | | | | 0.42 | | | | 20 | |
Year ended 10/31/12(e) | | | 18.97 | | | | 0.00 | | | | (0.32 | ) | | | (0.32 | ) | | | — | | | | — | | | | — | | | | 18.65 | | | | (1.69 | ) | | | 74,513 | | | | 0.83 | (f) | | | 0.86 | (f) | | | 0.10 | (f) | | | 37 | |
| (a) | Calculated using average shares outstanding. |
| (b) | Includes adjustments in accordance with accounting principles generally accepted in the United States of America and as such, the net asset value for financial reporting purposes and the returns based upon those net asset values may differ from the net asset value and returns for shareholder transactions. Does not include sales charges and is not annualized for periods less than one year, if applicable. |
| (c) | Portfolio turnover is calculated at the fund level and is not annualized for periods less than one year, if applicable. |
| (d) | Ratios are based on average daily net assets (000’s omitted) of $124,601, $1,545, $35,133, $20,938, $24,372, $25,759 and $63,382 for Class A, Class B, Class C, Class R, Class Y, Class R5 and Class R6 shares, respectively. |
| (e) | Commencement date of September 24, 2012. |
19 Invesco Endeavor Fund
Report of Independent Registered Public Accounting Firm
To the Board of Trustees
and Shareholders of the Invesco Endeavor Fund:
In our opinion, the accompanying statement of assets and liabilities, including the schedule of investments, and the related statements of operations and of changes in net assets and the financial highlights present fairly, in all material respects, the financial position of the Invesco Endeavor Fund (the “Fund”) as of October 31, 2016, the results of its operations for the year then ended, the changes in its net assets for each of the two years in the period then ended and the financial highlights for each of the five years in the period then ended, in conformity with accounting principles generally accepted in the United States of America. These financial statements and financial highlights (hereafter referred to as “financial statements”) are the responsibility of the Fund’s management. Our responsibility is to express an opinion on these financial statements based on our audits. We conducted our audits of these financial statements in accordance with the standards of the Public Company Accounting Oversight Board (United States). Those standards require that we plan and perform the audit to obtain reasonable assurance about whether the financial statements are free of material misstatement. An audit includes examining, on a test basis, evidence supporting the amounts and disclosures in the financial statements, assessing the accounting principles used and significant estimates made by management, and evaluating the overall financial statement presentation. We believe that our audits, which included confirmation of securities as of October 31, 2016 by correspondence with the custodian and brokers, and the application of alternative auditing procedures where confirmations of security purchases have not been received, provide a reasonable basis for our opinion.
PRICEWATERHOUSECOOPERS LLP
Houston, Texas
December 21, 2016
20 Invesco Endeavor Fund
Calculating your ongoing Fund expenses
Example
As a shareholder of the Fund, you incur two types of costs: (1) transaction costs, which may include sales charges (loads) on purchase payments or contingent deferred sales charges on redemptions, if any; and (2) ongoing costs, including management fees, distribution and/or service (12b-1) fees, and other Fund expenses. This example is intended to help you understand your ongoing costs (in dollars) of investing in the Fund and to compare these costs with ongoing costs of investing in other mutual funds. The example is based on an investment of $1,000 invested at the beginning of the period and held for the entire period May 1, 2016 through October 31, 2016.
Actual expenses
The table below provides information about actual account values and actual expenses. You may use the information in this table, together with the amount you invested, to estimate the expenses that you paid over the period. Simply divide your account value by $1,000 (for example, an $8,600 account value divided by $1,000 = 8.6), then multiply the result by the number in the table under the heading entitled “Actual Expenses Paid During Period” to estimate the expenses you paid on your account during this period.
Hypothetical example for comparison purposes
The table below also provides information about hypothetical account values and hypothetical expenses based on the Fund’s actual expense ratio and an assumed rate of return of 5% per year before expenses, which is not the Fund’s actual return.
The hypothetical account values and expenses may not be used to estimate the actual ending account balance or expenses you paid for the period. You may use this information to compare the ongoing costs of investing in the Fund and other funds. To do so, compare this 5% hypothetical example with the 5% hypothetical examples that appear in the shareholder reports of the other funds.
Please note that the expenses shown in the table are meant to highlight your ongoing costs only and do not reflect any transaction costs, such as sales charges (loads) on purchase payments or contingent deferred sales charges on redemptions, if any. Therefore, the hypothetical information is useful in comparing ongoing costs only, and will not help you determine the relative total costs of owning different funds. In addition, if these transaction costs were included, your costs would have been higher.
| | | | | | | | | | | | | | | | | | | | | | | | |
| Class | | Beginning
Account Value
(05/01/16) | | | ACTUAL | | | HYPOTHETICAL
(5% annual return before
expenses) | | | Annualized
Expense
Ratio | |
| | | Ending
Account Value
(10/31/16)1 | | | Expenses
Paid During
Period2 | | | Ending
Account Value
(10/31/16) | | | Expenses
Paid During
Period2 | | |
| A | | $ | 1,000.00 | | | $ | 1,000.00 | | | $ | 6.69 | | | $ | 1,018.45 | | | $ | 6.75 | | | | 1.33 | % |
| B | | | 1,000.00 | | | | 996.10 | | | | 10.44 | | | | 1,014.68 | | | | 10.53 | | | | 2.08 | |
| C | | | 1,000.00 | | | | 996.10 | | | | 10.44 | | | | 1,014.68 | | | | 10.53 | | | | 2.08 | |
| R | | | 1,000.00 | | | | 998.80 | | | | 7.94 | | | | 1,017.19 | | | | 8.01 | | | | 1.58 | |
| Y | | | 1,000.00 | | | | 1,001.70 | | | | 5.43 | | | | 1,019.71 | | | | 5.48 | | | | 1.08 | |
| R5 | | | 1,000.00 | | | | 1,002.20 | | | | 4.78 | | | | 1,020.36 | | | | 4.82 | | | | 0.95 | |
| R6 | | | 1,000.00 | | | | 1,002.80 | | | | 4.33 | | | | 1,020.81 | | | | 4.37 | | | | 0.86 | |
| 1 | The actual ending account value is based on the actual total return of the Fund for the period May 1, 2016 through October 31, 2016, after actual expenses and will differ from the hypothetical ending account value which is based on the Fund’s expense ratio and a hypothetical annual return of 5% before expenses. |
| 2 | Expenses are equal to the Fund’s annualized expense ratio as indicated above multiplied by the average account value over the period, multiplied by 184/366 to reflect the most recent fiscal half year. |
21 Invesco Endeavor Fund
Approval of Investment Advisory and Sub-Advisory Contracts
The Board of Trustees (the Board) of AIM Investment Funds (Invesco Investment Funds) is required under the Investment Company Act of 1940, as amended, to approve annually the renewal of Invesco Endeavor Fund’s (the Fund) investment advisory agreements. During contract renewal meetings held on June 7-8, 2016, the Board as a whole, and the disinterested or “independent” Trustees, who comprise over 75% of the Board, voting separately, approved the continuance for the Fund of the Master Investment Advisory Agreement with Invesco Advisers, Inc. (Invesco Advisers and the investment advisory agreement) and the Master Intergroup Sub-Advisory Contract for Mutual Funds with Invesco Asset Management Deutschland GmbH, Invesco Asset Management Limited, Invesco Asset Management (Japan) Limited, Invesco Hong Kong Limited, Invesco Senior Secured Management, Inc. and Invesco Canada Ltd. (collectively, the Affiliated Sub-Advisers and the sub-advisory contracts) for another year, effective July 1, 2016.
In evaluating the fairness and reasonableness of compensation under the Fund’s investment advisory agreement and sub-advisory contracts, the Board considered, among other things, the factors discussed below. The Board determined that continuation of the Fund’s investment advisory agreement and the sub-advisory contracts is in the best interest of the Fund and its shareholders and that the compensation payable to Invesco Advisers and the Affiliated Sub-Advisers under the agreements is fair and reasonable.
The Board’s Fund Evaluation Process
The Board’s Investments Committee has established three Sub-Committees, which meet throughout the year to review the performance of funds advised by Invesco Advisers (the Invesco Funds). Over the course of each year, the Sub-Committees meet with portfolio managers for their assigned Invesco Funds and other members of management to review the performance, investment objective(s), policies, strategies, limitations and investment risks of these funds. The Board had the benefit of reports from the Sub-Committees and Investments Committee throughout the year in considering approval of the continuance of each Invesco Fund’s investment advisory agreement and sub-advisory contracts for another year.
During the contract renewal process, the Board receives comparative performance and fee data regarding the Invesco Funds prepared by Invesco Advisers and Broadridge Financial Solutions, Inc. (Broadridge), an independent provider of investment company data. The Board also receives a report and this independent written evaluation from the Senior Officer, an officer of the Invesco Funds who reports directly to the independent Trustees.
The Senior Officer’s evaluation is prepared as part of his responsibility to manage the process by which the Invesco Funds’ proposed management fees are negotiated during the annual contract renewal process to ensure they are negotiated in a manner that is at arms’ length and reasonable. In addition to meetings with Invesco Advisers and fund counsel, the independent Trustees also discuss the continuance of the investment advisory agreement and sub-advisory contracts in separate sessions with the Senior Officer and with independent legal counsel.
The Trustees recognized that the advisory fee rates for the Invesco Funds are, in many cases, the result of years of review and negotiation. The Trustees’ deliberations and conclusions in a particular year may be based in part on their deliberations and conclusions regarding these same arrangements throughout the year and in prior years. The Trustees’ review and conclusions are based on the comprehensive consideration of all information presented to them and are not the result of any single determinative factor. Moreover, one Trustee may have weighed a particular piece of information or factor differently than another Trustee.
The discussion below is a summary of the Senior Officer’s independent written evaluation with respect to the Fund’s investment advisory agreement as well as a discussion of the material factors and related conclusions that formed the basis for the Board’s approval of the Fund’s investment advisory agreement and sub-advisory contracts. Unless otherwise stated, this information is current as of June 8, 2016, and does not reflect consideration of factors that became known to the Board after that date.
Factors and Conclusions and Summary of Independent Written Fee Evaluation
| A. | Nature, Extent and Quality of Services Provided by Invesco Advisers and the Affiliated Sub-Advisers |
The Board reviewed the advisory services provided to the Fund by Invesco Advisers under the Fund’s investment advisory agreement, the performance of Invesco Advisers in providing these services, and the credentials and experience of the officers and employees of Invesco Advisers who provide these services, including the Fund’s portfolio manager or managers. The Board’s review of the qualifications of Invesco Advisers to provide advisory services included the Board’s consideration of Invesco Advisers’ investment process oversight, independent credit analysis and investment risk management. The Board also considered non-advisory services that Invesco Advisers and its affiliates provide to the Invesco Funds such as various back office
support functions, trading operations, internal audit, valuation and legal and compliance.
In determining whether to continue the Fund’s investment advisory agreement, the Board considered the benefits of reapproving an existing relationship and the greater uncertainty that may be associated with entering into a new relationship. The Board concluded that the nature, extent and quality of the services provided to the Fund by Invesco Advisers are appropriate and satisfactory and consistent with the terms of the Fund’s investment advisory agreement.
The Board reviewed the services that may be provided by the Affiliated Sub-Advisers under the sub-advisory contracts and the credentials and experience of the officers and employees of the Affiliated Sub-Advisers who provide these services. The Board noted that the Affiliated Sub-Advisers have offices and personnel that are located in financial centers around the world. As a result, the Board noted that the Affiliated Sub-Advisers can provide research and investment analysis on the markets and economies of various countries in which the Fund may invest, make recommendations regarding securities and assist with security trades. The Board concluded that the sub-advisory contracts may benefit the Fund and its shareholders by permitting Invesco Advisers to use the resources and talents of the Affiliated Sub-Advisers in managing the Fund. The Board concluded that the nature, extent and quality of the services that may be provided by the Affiliated Sub-Advisers are appropriate and satisfactory and consistent with the terms of the Fund’s sub-advisory contracts.
The Board considered Fund performance as a relevant factor in considering whether to approve the investment advisory agreement as well as the sub-advisory contracts for the Fund, as Invesco Canada Ltd. currently manages assets of the Fund.
The Board compared the Fund’s performance during the past one, three and five calendar years to the performance of funds in the Broadridge performance universe and against the Lipper Mid-Cap Core Funds Index. The Board noted that performance of Class A shares of the Fund was in the fifth quintile of its performance universe for the one, three and five year periods (the first quintile being the best performing funds and the fifth quintile being the worst performing funds). The Board noted that performance of Class A shares of the Fund was below the performance of the Index for the one, three and five year periods. The Trustees also reviewed more recent Fund performance and this review did not change their conclusions.
| C. | Advisory and Sub-Advisory Fees |
The Board compared the Fund’s contractual management fee rate to the contractual management fee rates of funds in the Fund’s
22 Invesco Endeavor Fund
Broadridge expense group at a common asset level. The Board noted that the contractual management fee rate for Class A shares of the Fund was below the median contractual management fee rate of funds in its expense group. The Board noted that the term “contractual management fee” for funds in the expense group may include both advisory and certain administrative services fees, but that Broadridge does not provide information on a fund by fund basis as to what is included. The Board noted that Invesco Advisers does not separately charge the Invesco Funds for the administrative services included in the term as defined by Broadridge. The Board also reviewed the methodology used by Broadridge in providing expense group information, which includes using each fund’s contractual management fee schedule (including any applicable breakpoints) as reported in the most recent prospectus or statement of additional information for each fund in the expense group.
The Board also compared the Fund’s effective advisory fee rate (the advisory fee rate after advisory fee waivers and before other expense limitations/waivers) to the effective advisory fee rates of other funds advised by Invesco Advisers and its affiliates with investment strategies comparable to those of the Fund, based on asset balances as of December 31, 2015. The Board noted that the Fund’s rate was below the rate of one off-shore fund advised by Invesco Advisers.
The Board noted that Invesco Advisers and the Affiliated Sub-Advisers do not manage other client accounts with investment strategies comparable to those of the Fund.
The Board also considered the services provided by the Affiliated Sub-Advisers pursuant to the sub-advisory contracts, as well as the fees payable by Invesco Advisers to the Affiliated Sub-Advisers pursuant to the sub-advisory contracts. The Board noted that Invesco Advisers retains overall responsibility for, and provides services to, sub-advised Invesco Funds, including oversight of the Affiliated Sub-Advisers as well as the additional services described herein other than day-to-day portfolio management other than day-to-day portfolio management. The Board also noted that the sub-advisory fees are not paid directly by the Fund, but rather, are payable by Invesco Advisers to the Affiliated Sub-Advisers.
| D. | Economies of Scale and Breakpoints |
The Board considered the extent to which there are economies of scale in the provision of advisory services to the Fund. The Board also considered whether the Fund benefits from economies of scale through contractual breakpoints in the Fund’s advisory fee schedule. The Board also noted that the Fund shares directly in economies of scale through lower fees charged by third party service providers based on the combined size of the Invesco Funds and other clients advised by Invesco Advisers.
| E. | Profitability and Financial Resources |
The Board reviewed information from Invesco Advisers concerning the costs of the advisory and other services that Invesco Advisers and its affiliates provide to the Fund and the Invesco Funds and the profitability of Invesco Advisers and its affiliates in providing these services. The Board received information from Invesco Advisers and a report from an independent consultant engaged by the Senior Officer about the methodology used to prepare the profitability information. The Board noted that Invesco Advisers continues to operate at a net profit from services Invesco Advisers and its affiliates provide to the Invesco Funds and the Fund. The Board received and accepted information from Invesco Advisers demonstrating that Invesco Advisers and each Affiliated Sub-Adviser are financially sound and have the resources necessary to perform their obligations under the investment advisory agreement and sub-advisory contracts.
| F. | Collateral Benefits to Invesco Advisers and its Affiliates |
The Board considered various other benefits received by Invesco Advisers and its affiliates from the relationship with the Fund, including the fees received for providing transfer agency and distribution services to the Fund. The Board considered comparative information regarding fees charged for these services, including information provided by Broadridge and other independent sources. The Board considered the performance of Invesco Advisers and its affiliates in providing these services and the organizational structure employed to provide these services. The Board also considered that these services are provided to the Fund pursuant to written contracts that are reviewed and approved on an annual basis by the Board; and that the services are required for the operation of the Fund.
The Board considered the benefits realized by Invesco Advisers and the Affiliated Sub-Advisers as a result of portfolio brokerage transactions executed through “soft dollar” arrangements. The Board noted that soft dollar arrangements shift the payment obligation for research services from Invesco Advisers and the Affiliated Sub-Advisers to the Invesco Funds and that the research received may be used with other clients of Invesco Advisers and may reduce Invesco Advisers’ and the Affiliated Sub-Advisers’ expenses. The Board also considered that it receives periodic reports from the Chief Compliance Officer of the Invesco Funds demonstrating that these arrangements are consistent with regulatory requirements. The Board did not deem the soft dollar arrangements to be inappropriate.
The Board considered that the Fund’s uninvested cash and cash collateral from any securities lending arrangements may be invested in money market funds advised by Invesco Advisers pursuant to procedures approved by the Board. The Board noted that Invesco Advisers receives advisory fees from these affiliated money market funds
attributable to such investments, although Invesco Advisers has contractually agreed to waive through varying periods the advisory fees payable by the Invesco Funds with respect to certain investments in the affiliated money market funds. The waiver is in an amount equal to 100% of the net advisory fee Invesco Advisers receives from the affiliated money market funds with respect to the Fund’s investment in the affiliated money market funds of uninvested cash, but not cash collateral. The Board concluded that the amount of advisory fees received by Invesco Advisors from the Fund’s investment of cash collateral from any securities lending arrangements in the affiliated money market funds is fair and reasonable.
The Board also considered that the Fund may use an affiliated broker to execute certain trades for the Fund to, among other things, control information leakage, and was advised that such trades would be executed in compliance with rules under the Investment Company Act of 1940, as amended, and consistent with best execution obligations.
23 Invesco Endeavor Fund
Tax Information
Form 1099-DIV, Form 1042-S and other year–end tax information provide shareholders with actual calendar year amounts that should be included in their tax returns. Shareholders should consult their tax advisors.
The following distribution information is being provided as required by the Internal Revenue Code or to meet a specific state’s requirement.
The Fund designates the following amounts or, if subsequently determined to be different, the maximum amount allowable for its fiscal year ended October 31, 2016:
| | | | |
Federal and State Income Tax | |
Long-Term Capital Gain Distributions | | $ | 36,076,586 | |
Qualified Dividend Income* | | | 65.86 | % |
Corporate Dividends Received Deduction* | | | 39.56 | % |
U.S. Treasury Obligations* | | | 0 | % |
| | * | The above percentages are based on ordinary income dividends paid to shareholders during the Fund’s fiscal year. |
| | | | |
Non-Resident Alien Shareholders | |
Qualified Short-Term Gains | | $ | 8,302,567 | |
24 Invesco Endeavor Fund
Trustees and Officers
The address of each trustee and officer is AIM Investment Funds (Invesco Investment Funds) (the “Trust”), 11 Greenway Plaza, Suite 1000, Houston, Texas 77046-1173. The trustees serve for the life of the Trust, subject to their earlier death, incapacitation, resignation, retirement or removal as more specifically provided in the Trust’s organizational documents. Each officer serves for a one year term or until their successors are elected and qualified. Column two below includes length of time served with predecessor entities, if any.
| | | | | | | | |
Name, Year of Birth and
Position(s) Held with the Trust | | Trustee and/
or Officer Since | | Principal Occupation(s)
During Past 5 Years | | Number of
Funds in Fund
Complex
Overseen by
Trustee | | Other Directorship(s)
Held by Trustee During
Past 5 Years |
| Interested Persons | | | | | | | | |
| Martin L. Flanagan1 — 1960 Trustee | | 2007 | | Executive Director, Chief Executive Officer and President, Invesco Ltd. (ultimate parent of Invesco and a global investment management firm); Advisor to the Board, Invesco Advisers, Inc. (formerly known as Invesco Institutional (N.A.), Inc.); Trustee, The Invesco Funds; Vice Chair, Investment Company Institute; and Member of Executive Board, SMU Cox School of Business Formerly: Chairman and Chief Executive Officer, Invesco Advisers, Inc. (registered investment adviser); Director, Chairman, Chief Executive Officer and President, Invesco Holding Company (US) Inc. (formerly IVZ Inc.) (holding company), Invesco Group Services, Inc. (service provider) and Invesco North American Holdings, Inc. (holding company); Director, Chief Executive Officer and President, Invesco Holding Company Limited (parent of Invesco and a global investment management firm); Director, Invesco Ltd.; Chairman, Investment Company Institute and President, Co-Chief Executive Officer, Co-President, Chief Operating Officer and Chief Financial Officer, Franklin Resources, Inc. (global investment management organization) | | 146 | | None |
| Philip A. Taylor2 — 1954 Trustee and Senior Vice President | | 2006 | | Head of the Americas and Senior Managing Director, Invesco Ltd.; Director, Co-Chairman, Co-President and Co-Chief Executive Officer, Invesco Advisers, Inc. (formerly known as Invesco Institutional (N.A.), Inc.) (registered investment adviser); Director, Chairman, Chief Executive Officer and President, Invesco Management Group, Inc. (formerly known as Invesco AIM Management Group, Inc.) (financial services holding company); Director and Chairman, Invesco Investment Services, Inc. (formerly known as Invesco AIM Investment Services, Inc.) (registered transfer agent) Chief Executive Officer, Invesco Corporate Class Inc. (corporate mutual fund company) Director, Chairman and Chief Executive Officer, Invesco Canada Ltd. (formerly known as Invesco Trimark Ltd./Invesco Trimark Ltèe) (registered investment adviser and registered transfer agent); Trustee and Senior Vice President, The Invesco Funds; Director, Invesco Investment Advisers LLC (formerly known as Van Kampen Asset Management). Formerly: Director, Chief Executive Officer and President, Van Kampen Exchange Corp.; President and Principal Executive Officer, The Invesco Funds (other than AIM Treasurer’s Series Trust (Invesco Treasurer’s Series Trust), Short-Term Investments Trust and Invesco Management Trust); Executive Vice President, The Invesco Funds (AIM Treasurer’s Series Trust (Invesco Treasurer’s Series Trust), Short-Term Investments Trust and Invesco Management Trust only); Director and President, INVESCO Funds Group, Inc. (registered investment adviser and registered transfer agent); Director and Chairman, IVZ Distributors, Inc. (formerly known as INVESCO Distributors, Inc.) (registered broker dealer); Director, President and Chairman, Invesco Inc. (holding company), Invesco Canada Holdings Inc. (holding company), Trimark Investments Ltd./Placements Trimark Ltèe and Invesco Financial Services Ltd/Services Financiers Invesco Ltèe; Chief Executive Officer, Invesco Canada Fund Inc. (corporate mutual fund company); Director and Chairman, Van Kampen Investor Services Inc.; Director, Chief Executive Officer and President, 1371 Preferred Inc. (holding company) and Van Kampen Investments Inc.; Director and President, AIM GP Canada Inc. (general partner for limited partnerships) and Van Kampen Advisors, Inc.; Director and Chief Executive Officer, Invesco Trimark Dealer Inc. (registered broker dealer); Director, Invesco Distributors, Inc. (formerly known as Invesco AIM Distributors, Inc.) (registered broker dealer); Manager, Invesco PowerShares Capital Management LLC; Director, Chief Executive Officer and President, Invesco Advisers, Inc.; Director, Chairman, Chief Executive Officer and President, Invesco AIM Capital Management, Inc.; President, Invesco Trimark Dealer Inc. and Invesco Trimark Ltd./Invesco Trimark Ltèe; Director and President, AIM Trimark Corporate Class Inc. and AIM Trimark Canada Fund Inc.; Senior Managing Director, Invesco Holding Company Limited; Director and Chairman, Fund Management Company (former registered broker dealer); President and Principal Executive Officer, The Invesco Funds (AIM Treasurer’s Series Trust (Invesco Treasurer’s Series Trust), and Short-Term Investments Trust only); President, AIM Trimark Global Fund Inc. and AIM Trimark Canada Fund Inc. | | 146 | | None |
| 1 | Mr. Flanagan is considered an interested person (within the meaning of Section 2(a)(19) of the 1940 Act) of the Trust because he is an officer of the Adviser to the Trust, and an officer and a director of Invesco Ltd., ultimate parent of the Adviser. |
| 2 | Mr. Taylor is considered an interested person (within the meaning of Section 2(a)(19) of the 1940 Act) of the Trust because he is an officer and a director of the Adviser. |
T-1 Invesco Endeavor Fund
Trustees and Officers—(continued)
| | | | | | | | |
Name, Year of Birth and
Position(s) Held with the Trust | | Trustee and/
or Officer Since | | Principal Occupation(s) During Past 5 Years | | Number of
Funds in Fund
Complex
Overseen by
Trustee | | Other Directorship(s)
Held by Trustee During
Past 5 Years |
| Independent Trustees | | | | | | | | |
Bruce L. Crockett — 1944 Trustee and Chair | | 2001 | | Chairman, Crockett Technologies Associates (technology consulting company) Formerly: Director, Captaris (unified messaging provider); Director, President and Chief Executive Officer, COMSAT Corporation; Chairman, Board of Governors of INTELSAT (international communications company); ACE Limited (insurance company); Independent Directors Council and Investment Company Institute | | 146 | | ALPS (Attorneys Liability Protection Society) (insurance company) and Globe Specialty Metals, Inc. (metallurgical company); Member of the Audit Committee, Ferroglobe PLC and Investment Company Institute; Member of the Executive Committee and Chair of the Governance Committee, Independent Directors Council |
David C. Arch — 1945 Trustee | | 2010 | | Chairman of Blistex Inc., a consumer health care products manufacturer | | 146 | | Board member of the Illinois Manufacturers’ Association; Member of the Board of Visitors, Institute for the Humanities, University of Michigan |
James T. Bunch — 1942 Trustee | | 2003 | | Managing Member, Grumman Hill Group LLC (family office/private equity investments) Formerly: Chairman of the Board, Denver Film Society, Chairman of the Board of Trustees, Evans Scholarship Foundation; Chairman, Board of Governors, Western Golf Association | | 146 | | Trustee, Evans Scholarship Foundation |
Albert R. Dowden — 1941 Trustee | | 2001 | | Director of a number of public and private business corporations, including Nature’s Sunshine Products, Inc. Formerly: Director, The Boss Group, Ltd. and Reich & Tang Funds (5 portfolios) (registered investment company); Director, Homeowners of America Holding Corporation/Homeowners of America Insurance Company (property casualty company); Director, Continental Energy Services, LLC (oil and gas pipeline service); Director, CompuDyne Corporation (provider of product and services to the public security market) and Director, Annuity and Life Re (Holdings), Ltd. (reinsurance company); Director, President and Chief Executive Officer, Volvo Group North America, Inc.; Senior Vice President, AB Volvo; Director of various public and private corporations; Chairman, DHJ Media, Inc.; Director, Magellan Insurance Company; and Director, The Hertz Corporation, Genmar Corporation (boat manufacturer), National Media Corporation; Advisory Board of Rotary Power International (designer, manufacturer, and seller of rotary power engines); and Chairman, Cortland Trust, Inc. (registered investment company) | | 146 | | Director of Nature’s Sunshine Products, Inc. |
Jack M. Fields — 1952 Trustee | | 2001 | | Chief Executive Officer, Twenty First Century Group, Inc. (government affairs company); and Discovery Learning Alliance (non-profit) Formerly: Owner and Chief Executive Officer, Dos Angeles Ranch L.P. (cattle, hunting, corporate entertainment); Director, Insperity, Inc. (formerly known as Administaff); Chief Executive Officer, Texana Timber LP (sustainable forestry company); Director of Cross Timbers Quail Research Ranch (non-profit); and member of the U.S. House of Representatives | | 146 | | None |
Eli Jones — 1961 Trustee | | 2016 | | Professor and Dean, Mays Business School — Texas A&M University Formerly: Professor and Dean, Walton College of Business, University of Arkansas and E.J. Ourso College of Business, Louisiana State University and Director, Arvest Bank | | 146 | | Director of Insperity, Inc. (formerly known as Administaff) |
Prema Mathai-Davis — 1950 Trustee | | 2001 | | Retired. Formerly: Chief Executive Officer, YWCA of the U.S.A. | | 146 | | None |
Larry Soll — 1942 Trustee | | 2003 | | Retired. Formerly: Chairman, Chief Executive Officer and President, Synergen Corp. (a biotechnology company) | | 146 | | None |
Raymond Stickel, Jr. — 1944 Trustee | | 2005 | | Retired. Formerly: Director, Mainstay VP Series Funds, Inc. (25 portfolios) and Partner, Deloitte & Touche | | 146 | | None |
Robert C. Troccoli — 1949 Trustee | | 2016 | | Adjunct Professor, University of Denver — Daniels College of Business Formerly: Senior Partner, KPMG LLP | | 146 | | None |
T-2 Invesco Endeavor Fund
Trustees and Officers—(continued)
| | | | | | | | |
Name, Year of Birth and
Position(s) Held with the Trust | | Trustee and/
or Officer Since | | Principal Occupation(s) During Past 5 Years | | Number of
Funds in Fund
Complex
Overseen by
Trustee | | Other Directorship(s)
Held by Trustee During
Past 5 Years |
| Independent Trustees—(continued) |
Suzanne H. Woolsey — 1941 Trustee | | 2014 | | Retired. Formerly: Chief Executive Officer of Woolsey Partners LLC | | 146 | | Director, SunShare LLC; Trustee, Ocean Conservancy; Emeritus Chair of the Board of Trustees of the Institute for Defense Analyses and of Colorado College; Trustee, Chair, Business and Finance Committee of California Institute of Technology; Prior to 2014, Director of Fluor Corp.; Prior to 2010, Trustee of the German Marshall Fund of the United States; Prior to 2010, Trustee of the Rocky Mountain Institute |
| Other Officers | | | | | | | | |
Sheri Morris — 1964 President, Principal Executive Officer and Treasurer | | 1999 | | President, Principal Executive Officer and Treasurer, The Invesco Funds; Vice President, Invesco Advisers, Inc. (formerly known as Invesco Institutional (N.A.), Inc.) (registered investment adviser); and Vice President, PowerShares Exchange-Traded Fund Trust, PowerShares Exchange-Traded Fund Trust II, PowerShares India Exchange-Traded Fund Trust, PowerShares Actively Managed Exchange-Traded Fund Trust, and PowerShares Actively Managed Exchange-Traded Commodity Fund Trust Formerly: Vice President and Principal Financial Officer, The Invesco Funds; Vice President, Invesco AIM Advisers, Inc., Invesco AIM Capital Management, Inc. and Invesco AIM Private Asset Management, Inc.; Assistant Vice President and Assistant Treasurer, The Invesco Funds and Assistant Vice President, Invesco Advisers, Inc., Invesco AIM Capital Management, Inc. and Invesco AIM Private Asset Management, Inc.; and Treasurer, PowerShares Exchange-Traded Fund Trust, PowerShares Exchange-Traded Fund Trust II, PowerShares India Exchange-Traded Fund Trust and PowerShares Actively Managed Exchange-Traded Fund Trust | | N/A | | N/A |
Russell C. Burk — 1958 Senior Vice President and Senior Officer | | 2005 | | Senior Vice President and Senior Officer, The Invesco Funds | | N/A | | N/A |
John M. Zerr — 1962 Senior Vice President, Chief Legal Officer and Secretary | | 2006 | | Director, Senior Vice President, Secretary and General Counsel, Invesco Management Group, Inc. (formerly known as Invesco AIM Management Group, Inc.; Senior Vice President, Invesco Advisers, Inc. (formerly known as Invesco Institutional (N.A.), Inc.) (registered investment adviser); Senior Vice President and Secretary, Invesco Distributors, Inc. (formerly known as Invesco AIM Distributors, Inc.); Director, Vice President and Secretary, Invesco Investment Services, Inc. (formerly known as Invesco AIM Investment Services, Inc.) Senior Vice President, Chief Legal Officer and Secretary, The Invesco Funds; Managing Director, Invesco PowerShares Capital Management LLC; Director, Secretary and General Counsel, Invesco Investment Advisers LLC (formerly known as Van Kampen Asset Management); Secretary and General Counsel, Invesco Capital Markets, Inc. (formerly known as Van Kampen Funds Inc.) and Chief Legal Officer, PowerShares Exchange-Traded Fund Trust, PowerShares Exchange-Traded Fund Trust II, PowerShares India Exchange-Traded Fund Trust, PowerShares Actively Managed Exchange-Traded Fund Trust, and PowerShares Actively Managed Exchange-Traded Commodity Fund Trust Formerly: Director, Secretary, General Counsel and Senior Vice President, Van Kampen Exchange Corp.; Director, Vice President and Secretary, IVZ Distributors, Inc. (formerly known as INVESCO Distributors, Inc.); Director and Vice President, INVESCO Funds Group, Inc.; Director and Vice President, Van Kampen Advisors Inc.; Director, Vice President, Secretary and General Counsel, Van Kampen Investor Services Inc.; Director, Invesco Distributors, Inc. (formerly known as Invesco AIM Distributors, Inc.); Director, Senior Vice President, General Counsel and Secretary, Invesco AIM Advisers, Inc. and Van Kampen Investments Inc.; Director, Vice President and Secretary, Fund Management Company; Director, Senior Vice President, Secretary, General Counsel and Vice President, Invesco AIM Capital Management, Inc.; Chief Operating Officer and General Counsel, Liberty Ridge Capital, Inc. (an investment adviser); Vice President and Secretary, PBHG Funds (an investment company) and PBHG Insurance Series Fund (an investment company); Chief Operating Officer, General Counsel and Secretary, Old Mutual Investment Partners (a broker-dealer); General Counsel and Secretary, Old Mutual Fund Services (an administrator) and Old Mutual Shareholder Services (a shareholder servicing center); Executive Vice President, General Counsel and Secretary, Old Mutual Capital, Inc. (an investment adviser); and Vice President and Secretary, Old Mutual Advisors Funds (an investment company) | | N/A | | N/A |
T-3 Invesco Endeavor Fund
Trustees and Officers—(continued)
| | | | | | | | |
Name, Year of Birth and
Position(s) Held with the Trust | | Trustee and/
or Officer Since | | Principal Occupation(s) During Past 5 Years | | Number of
Funds in Fund
Complex
Overseen by
Trustee | | Other Directorship(s)
Held by Trustee During
Past 5 Years |
| Other Officers—(continued) | | | | | | | | |
| Karen Dunn Kelley — 1960 Senior Vice President | | 2004 | | Senior Managing Director, Investments, Invesco Ltd.; Director, Co-President, Co-Chief Executive Officer, and Co-Chairman, Invesco Advisers, Inc. (formerly known as Invesco Institutional (N.A.), Inc.) (registered investment adviser); Chairman and Director, Invesco Senior Secured Management, Inc.; Senior Vice President, Invesco Management Group, Inc. (formerly known as Invesco AIM Management Group, Inc.); Executive Vice President, Invesco Distributors, Inc. (formerly known as Invesco AIM Distributors, Inc.); Director, Invesco Mortgage Capital Inc. and Invesco Management Company Limited; Senior Vice President, The Invesco Funds Formerly: Vice President, The Invesco Funds (other than AIM Treasurer’s Series Trust (Invesco Treasurer’s Series Trust), Short-Term Investments Trust and Invesco Management Trust); and President and Principal Executive Officer, The Invesco Funds (AIM Treasurer’s Series Trust (Invesco Treasurer’s Series Trust), Short-Term Investments Trust and Invesco Management Trust only); Director and President, INVESCO Asset Management (Bermuda) Ltd., Director, INVESCO Global Asset Management DAC (formerly known as INVESCO Global Asset Management Limited) and INVESCO Management S.A.; Senior Vice President, Van Kampen Investments Inc. and Invesco Advisers, Inc. (formerly known as Invesco Institutional (N.A.), Inc.) (registered investment adviser); Director and President, Fund Management Company; Chief Cash Management Officer, Director of Cash Management, Senior Vice President, and Managing Director, Invesco AIM Capital Management, Inc.; Director of Cash Management, Senior Vice President, and Vice President, Invesco Advisers, Inc. and Vice President, The Invesco Funds (AIM Treasurer’s Series Trust (Invesco Treasurer’s Series Trust), and Short-Term Investments Trust only) | | N/A | | N/A |
Kelli Gallegos — 1970 Vice President, Principal Financial Officer and Assistant Treasurer | | 2008 | | Vice President, Principal Financial Officer and Assistant Treasurer, The Invesco Funds; Assistant Treasurer, Invesco PowerShares Capital Management LLC, PowerShares Exchange-Traded Fund Trust, PowerShares Exchange-Traded Fund Trust II, PowerShares India Exchange-Traded Fund Trust, PowerShares Actively Managed Exchange-Traded Fund Trust, and PowerShares Actively Managed Exchange-Traded Commodity Fund Trust Formerly: Assistant Vice President, The Invesco Funds | | N/A | | N/A |
Tracy Sullivan — 1962 Vice President, Chief Tax Officer and Assistant Treasurer | | 2008 | | Vice President, Chief Tax Officer and Assistant Treasurer, The Invesco Funds; Assistant Treasurer, Invesco PowerShares Capital Management LLC, PowerShares Exchange-Traded Fund Trust, PowerShares Exchange-Traded Fund Trust II, PowerShares India Exchange-Traded Fund Trust, PowerShares Actively Managed Exchange-Traded Fund Trust, and PowerShares Actively Managed Exchange-Traded Commodity Fund Trust Formerly: Assistant Vice President, The Invesco Funds | | N/A | | N/A |
Crissie M. Wisdom — 1969 Anti-Money Laundering Compliance Officer | | 2013 | | Anti-Money Laundering Compliance Officer, Invesco Advisers, Inc. (formerly known as Invesco Institutional (N.A.), Inc.) (registered investment adviser), Invesco Capital Markets, Inc. (formerly known as Van Kampen Funds Inc.), Invesco Distributors, Inc., Invesco Investment Services, Inc., Invesco Management Group, Inc., The Invesco Funds, and PowerShares Exchange-Traded Fund Trust, PowerShares Exchange-Traded Fund Trust II, PowerShares India Exchange-Traded Fund Trust, PowerShares Actively Managed Exchange-Traded Fund Trust and PowerShares Actively Managed Exchange-Traded Commodity Fund Trust; Anti-Money Laundering Compliance Officer and Bank Secrecy Act Officer, INVESCO National Trust Company and Invesco Trust Company; and Fraud Prevention Manager and Controls and Risk Analysis Manager for Invesco Investment Services, Inc. Formerly: Anti-Money Laundering Compliance Officer, Van Kampen Exchange Corp. | | N/A | | N/A |
Robert R. Leveille — 1969 Chief Compliance Officer | | 2016 | | Chief Compliance Officer, Invesco Advisers, Inc. (registered investment adviser); and Chief Compliance Officer, The Invesco Funds Formerly: Chief Compliance Officer, Putnam Investments and the Putnam Funds | | N/A | | N/A |
The Statement of Additional Information of the Trust includes additional information about the Fund’s Trustees and is available upon request, without charge, by calling 1.800.959.4246. Please refer to the Fund’s Statement of Additional Information for information on the Fund’s sub-advisers.
| | | | | | |
Office of the Fund 11 Greenway Plaza, Suite 1000 Houston, TX 77046-1173 | | Investment Adviser Invesco Advisers, Inc. 1555 Peachtree Street, N.E. Atlanta, GA 30309 | | Distributor Invesco Distributors, Inc. 11 Greenway Plaza, Suite 1000 Houston, TX 77046-1173 | | Auditors PricewaterhouseCoopers LLP 1000 Louisiana Street, Suite 5800 Houston, TX 77002-5678 |
| | | |
| | | | | | |
Counsel to the Fund Stradley Ronon Stevens & Young, LLP 2005 Market Street, Suite 2600 Philadelphia, PA 19103-7018 | | Counsel to the Independent Trustees Goodwin Procter LLP 901 New York Avenue, N.W. Washington, D.C. 20001 | | Transfer Agent Invesco Investment Services, Inc. 11 Greenway Plaza, Suite 1000 Houston, TX 77046-1173 | | Custodian State Street Bank and Trust Company 225 Franklin Street Boston, MA 02110-2801 |
T-4 Invesco Endeavor Fund
Explore High-Conviction Investing with Invesco

Invesco mailing information
Send general correspondence to Invesco Investment Services, Inc., P.O. Box 219078, Kansas City, MO 64121-9078.
Important notice regarding delivery of security holder documents
To reduce Fund expenses, only one copy of most shareholder documents may be mailed to shareholders with multiple accounts at the same address (Householding). Mailing of your shareholder documents may be householded indefinitely unless you instruct us otherwise. If you do not want the mailing of these documents to be combined with those for other members of your household, please contact Invesco Investment Services, Inc. at 800 959 4246 or contact your financial institution. We will begin sending you individual copies for each account within 30 days after receiving your request.
Fund holdings and proxy voting information
The Fund provides a complete list of its holdings four times in each fiscal year, at the quarter ends. For the second and fourth quarters, the lists appear in the Fund’s semiannual and annual reports to shareholders. For the first and third quarters, the Fund files the lists with the Securities and Exchange Commission (SEC) on Form N-Q. The most recent list of portfolio holdings is available at invesco.com/completeqtrholdings. Shareholders can also look up the Fund’s Forms N-Q on the SEC website at sec.gov. Copies of the Fund’s Forms N-Q may be reviewed and copied at the SEC Public Reference Room in Washington, D.C. You can obtain information on the operation of the Public Reference Room, including information about duplicating fee charges, by calling 202 551 8090 or 800 732 0330, or by electronic request at the following email address: publicinfo@sec.gov.
The SEC file numbers for the Fund are shown below.
A description of the policies and procedures that the Fund uses to determine how to vote proxies relating to portfolio securities is available without charge, upon request, from our Client Services department at 800 959 4246 or at invesco.com/proxyguidelines. The information is also available on the SEC website, sec.gov.
| | |
Information regarding how the Fund voted proxies related to its portfolio securities during the most recent 12-month period ended June 30 is available at invesco.com/proxysearch. The information is also available on the SEC website, sec.gov. Invesco Advisers, Inc. is an investment adviser; it provides investment advisory services to individual and institutional clients and does not sell securities. Invesco Distributors, Inc. is the US distributor for Invesco Ltd.’s retail mutual funds, exchange-traded funds and institutional money market funds. Both are wholly owned, indirect subsidiaries of Invesco Ltd. | |  |
| | | | |
| SEC file numbers: 811-05426 and 033-19338 | | END-AR-1 | | Invesco Distributors, Inc. |
| | | | |
| | |
 | | Annual Report to Shareholders | | October 31, 2016 |
| | |
| | Invesco Global Health Care Fund |
| | Nasdaq: |
| | A: GGHCX ∎ B: GTHBX ∎ C: GTHCX ∎ Y: GGHYX ∎ Investor: GTHIX |

Letters to Shareholders
| | | | |

Philip Taylor | | | | Dear Shareholders: This annual report includes information about your Fund, including performance data and a complete list of its investments as of the close of the reporting period. Inside is a discussion of how your Fund was managed and the factors that affected its performance during the reporting period. In December 2015, the US Federal Reserve raised short-term interest rates for the first time since 2006, signaling its belief that the economy was likely to continue strengthening. Indeed, throughout the reporting period, US economic data were generally positive and the economy expanded at a moderate rate – but there were some bumps along the road. Job growth in May 2016 was very weak, but it was followed by strong increases in nonfarm payrolls in June and July. Increased concerns about global economic weakness caused US stock market indexes to |
sink at the start of calendar year 2016, but they eventually recovered; they sank again following the UK’s decision to leave the European Union, but then quickly recovered and reached record highs later in the summer. Strong demand for income-producing investments, particularly those perceived to be lower risk, benefited bonds as well as dividend-paying stocks for much of the reporting period. While economic news in the US was generally positive, news overseas was less upbeat. The European Central Bank, and central banks in China and Japan – as well as other countries – maintained extraordinarily accommodative monetary policies in response to economic weakness. As the fiscal year drew to a close, uncertainty about the outcome of the US presidential election resulted in increased market volatility; the surprise outcome after the close of the reporting period suggested that market volatility may continue for some time to come.
Short-term market volatility can prompt some investors to abandon their investment plans – and can cause others to settle for average results. The investment professionals at Invesco, in contrast, invest with high conviction, take a long-term perspective and have a passion to exceed. Invesco’s pure focus on investment management eliminates possible distractions and means that there are no competing lines of business for us to support. Just as important, we embrace a variety of investment strategies, asset classes and geographies – because we know that no single investment approach meets the diverse needs of all of our clients. We manage all our investment approaches with a passion to exceed. All our investment teams have a highly disciplined, long-term investing style that eliminates short-term decision-making. Of course, investing with high conviction can’t guarantee a profit or ensure success; no investment strategy can. To learn more about how we invest with high conviction, visit invesco.com/HighConviction.
You, too, can invest with high conviction by maintaining a long-term investment perspective and by working with your financial adviser on a regular basis. During periods of short-term market volatility or uncertainty, your financial adviser can keep you focused on your long-term investment goals – a new home, a child’s college education or a secure retirement. He or she also can share research about the economy, the markets and individual investment options.
Visit our website for more information on your investments
Our website, invesco.com/us, offers a wide range of market insights and investment perspectives. On the website, you’ll find detailed information about our funds, including performance, holdings and portfolio manager commentaries. You can access information about your account by completing a simple, secure online registration. Click on the “Need to register” link in the “Account Access” box on our homepage to get started.
In addition to the resources accessible on our website and through our mobile app, you can obtain timely updates to help you stay informed about the markets, the economy and investing by connecting with Invesco on Twitter, LinkedIn or Facebook. You can access our blog at blog.invesco.us.com. Our goal is to provide you the information you want, when and where you want it.
Finally, I’m pleased to share with you Invesco’s commitment to both the Principles for Responsible Investment and to considering environmental, social and governance issues in our robust investment process. I invite you to learn more at invesco.com/esg.
Have questions?
For questions about your account, contact an Invesco client services representative at 800 959 4246. For Invesco-related questions or comments, please email me directly at phil@invesco.com.
All of us at Invesco look forward to serving your investment management needs. Thank you for investing with us.
Sincerely,

Philip Taylor
Senior Managing Director, Invesco Ltd.
2 Invesco Global Health Care Fund
| | | | | | |

Bruce Crockett | | | | Dear Fellow Shareholders: Among the many important lessons I’ve learned in more than 40 years in a variety of business endeavors is the value of a trusted advocate. As independent chair of the Invesco Funds Board, I can assure you that the members of the Board are strong advocates for the interests of investors in Invesco’s mutual funds. We work hard to represent your interests through oversight of the quality of the investment management services your funds receive and other matters important to your investment, including but not limited to: |
| | | | ∎ | | Ensuring that Invesco offers a diverse lineup of mutual funds that your financial adviser can use to strive to meet your financial needs as your investment goals change over time. |
| | | | ∎ | | Monitoring how the portfolio management teams of the Invesco funds are performing in light of changing economic and market conditions. |
| ∎ | | Assessing each portfolio management team’s investment performance within the context of the investment strategy described in the fund’s prospectus. |
| ∎ | | Monitoring for potential conflicts of interests that may impact the nature of the services that your funds receive. |
We believe one of the most important services we provide our fund shareholders is the annual review of the funds’ advisory and sub-advisory contracts with Invesco Advisers and its affiliates. This review is required by the Investment Company Act of 1940 and focuses on the nature and quality of the services Invesco provides as the adviser to the Invesco funds and the reasonableness of the fees that it charges for those services. Each year, we spend months carefully reviewing information received from Invesco and a variety of independent sources, such as performance and fee data prepared by Lipper Inc., an independent, third-party firm widely recognized as a leader in its field. We also meet with our independent legal counsel and other independent advisers to review and help us assess the information that we have received. Our goal is to assure that you receive quality investment management services for a reasonable fee.
I trust the measures outlined above provide assurance that you have a worthy advocate when it comes to choosing the Invesco Funds.
As always, please contact me at bruce@brucecrockett.com with any questions or concerns you may have. On behalf of the Board, we look forward to continuing to represent your interests and serving your needs.
Sincerely,

Bruce L. Crockett
Independent Chair
Invesco Funds Board of Trustees
3 Invesco Global Health Care Fund
Management’s Discussion of Fund Performance
| | | | | |
Performance summary For the fiscal year ended October 31, 2016, Class A shares of Invesco Global Health Care Fund (the Fund), at net asset value (NAV), underperformed the MSCI World Health Care Index, the Fund’s style-specific benchmark. Your Fund’s long-term performance appears later in this report. |
| | | | | |
Fund vs. Indexes Total returns, 10/31/15 to 10/31/16, at net asset value (NAV). Performance shown does not include applicable contingent deferred sales charges (CDSC) or front-end sales charges, which would have reduced performance. |
| | | | | |
| |
| Class A Shares | | | | -12.89 | % |
| Class B Shares | | | | -13.54 | |
| Class C Shares | | | | -13.53 | |
| Class Y Shares | | | | -12.67 | |
| Investor Class Shares | | | | -12.89 | |
| MSCI World Index▼ (Broad Market Index) | | | | 1.18 | |
| MSCI World Health Care Index▼ (Style-Specific Index) | | | | -7.56 | |
| Lipper Global Health/Biotechnology Funds Index∎ (Peer Group Index) | | | | -11.48 | |
| |
Source(s): ▼FactSet Research Systems Inc.; ∎Lipper Inc. | | | | | |
Market conditions and your Fund
The global economy continued to expand, albeit slowly, for the fiscal year ended October 31, 2016. However, that growth became increasingly uneven across developed and emerging economies, amid continued volatility in oil prices and as the policies of central banks globally began to diverge.
An equity market rally in November was offset by negative performance in December, as a late-year crash in oil prices rattled the markets. Also in December, the US Federal Reserve (the Fed) followed through on its commitment to normalize monetary policy by raising interest rates – its first increase since 2006 – even as the European Central Bank extended its asset purchase program and Japan introduced additional quantitative easing and negative interest rates.
Stocks began calendar year 2016 on a negative note, driven by investor concerns about economic weakness in China and falling oil prices. Markets recovered in late February and posted gains amid concerted central bank commitments to
very loose monetary policy. As a result, the US dollar fell sharply against the euro and Japanese yen, a development that was largely supportive of oil and stock prices.
All major global stock indexes experienced steep declines again in June after UK voters opted to leave the European Union. Stocks in economically sensitive sectors, including energy and financials, were hardest hit, and investors flocked to the perceived safety of US Treasuries and more defensive, dividend-paying equities often found in the telecommunication services, utilities and consumer staples sectors.
After the initial shock of the UK vote, stocks made a strong recovery, regaining most of their losses as fears of a shock to consumer confidence never materialized. For the remainder of the reporting period, emerging markets outperformed as the Fed left interest rates unchanged and expectations for an interest rate increase were delayed again.
During the fiscal year, the health care sector experienced significant pressure as US presidential candidates and a series
of press reports focused attention on drug pricing and price increases. This caused a selloff during the fiscal year, particularly in the biotechnology and specialty pharmaceuticals industries.
Overweight exposure to the life science tools and services industry was the largest contributor to the Fund’s relative and absolute return during the fiscal year. Thermo Fisher Scientific, a company that markets scientific instruments and lab equipment, was a strong contributor. Following a number of acquisitions, the company reported increasing margins and strong earnings growth during the reporting period.
The Fund’s drug retail exposure also contributed to relative and absolute performance. Raia Drogasil, a leading Brazilian drugstore chain, was a key contributor during the fiscal year. The company benefited from the rebounding local market as investors welcomed an evolving political backdrop and the potential for leadership change in the government. Raia Drogasil also reported strong revenues and same-store sales growth, which boosted its shares.
Stock selection in the managed health care industry also contributed to the Fund’s relative and absolute performance. During the fiscal year, UnitedHealth Group increased its dividend and reported better-than-expected earnings and an improved outlook for 2017.
Stock selection in and overweight exposure to the biotechnology industry was the largest detractor from Fund performance relative to its style-specific benchmark for the fiscal year; a number of holdings within the industry were key detractors including Vertex Pharmaceuticals and Shire. Both companies declined amid a particularly sharp selloff in biotechnology stocks in the first quarter of 2016.
The Fund’s underweight exposure to and stock selection in the pharmaceuticals industry also detracted from relative
| | |
Portfolio Composition | | |
By sector | | % of total net assets |
| | | | | |
| |
| Health Care | | | | 97.5 | % |
| Consumer Staples | | | | 0.7 | |
Money Market Funds Plus Other Assets Less Liabilities | | | | 1.8 | |
| | | | | | |
Top 10 Equity Holdings* |
| | | | % of total net assets | | |
| | | | | | | | | | | | |
| 1. | | Celgene Corp. | | | | 5.5 | % |
| 2. | | Thermo Fisher Scientific, Inc. | | | | 4.3 | |
| 3. | | Merck & Co., Inc. | | | | 4.2 | |
| 4. | | Roche Holding AG | | | | 4.1 | |
| 5. | | Biogen Inc. | | | | 4.1 | |
| 6. | | Shire PLC-ADR | | | | 3.9 | |
| 7. | | Eli Lilly and Co. | | | | 3.4 | |
| 8. | | Sanofi-ADR | | | | 3.2 | |
| 9. | | UnitedHealth Group Inc. | | | | 2.9 | |
| 10. | | Amgen Inc. | | | | 2.8 | |
| | | | | |
Total Net Assets | | | | $1.4 billion | |
| | | | | |
| |
| Total Number of Holdings* | | | | 70 | |
The Fund’s holdings are subject to change, and there is no assurance that the Fund will continue to hold any particular security.
*Excluding money market fund holdings.
Data presented here are as of October 31, 2016.
4 Invesco Global Health Care Fund
returns. Within the industry, Endo International, Allergan and Teva Pharmaceuticals were the largest detractors.
Specialty pharmaceutical company Endo International was the largest individual detractor from Fund performance. During the reporting period, the company reported weaker-than-anticipated financial results and revised its full-year earnings estimates down significantly from its initial forecast. We reduced our exposure to the company during the reporting period.
Shares of Allergan dropped significantly after Pfizer (also a Fund holding) terminated its proposed merger with the company following a US Treasury Department tax inversion rule change that effectively killed the deal. We maintained our position in Allergan, as our thesis was based on the stand-alone company and was not predicated on the merger.
During the fiscal year, we used currency forward contracts to hedge currency exposure of non-US-based companies held in the Fund. Derivatives were used solely for hedging and not for speculative purposes or leverage. The use of currency forward contracts had a marginally positive impact on the Fund’s performance relative to the style-specific benchmark.
During the reporting period, we trimmed positions in areas that performed relatively well and reached full valuations, such as large-cap pharmaceuticals, medical devices and health care services. Geographically, we increased our weighting in the United States, as US companies appeared more mispriced than their European counterparts, in our view. At the close of the reporting period, our largest underweight exposure was to Europe. We also maintained substantial overweight exposure to small-cap stocks, and underweight exposure to large-cap companies relative to the style-specific index.
We maintained an underweight position in large-cap pharmaceuticals relative to the style-specific benchmark during the fiscal year; however, the pharmaceuticals industry was the Fund’s largest absolute industry exposure during the reporting period. Our largest industry overweight was biotechnology, an industry in which we believe valuations are attractive, growth is robust, pipelines are strong, and there is pipeline and takeout optionality not priced into the stocks.
We continue to emphasize specialty pharmaceuticals and biotechnology stocks based on their generally robust product portfolios, strong pipelines, and the possibility that many could be targets for acquisition.
As always, thank you for your continued investment in Invesco Global Health Care Fund.
The views and opinions expressed in management’s discussion of Fund performance are those of Invesco Advisers, Inc. These views and opinions are subject to change at any time based on factors such as market and economic conditions. These views and opinions may not be relied upon as investment advice or recommendations, or as an offer for a particular security. The information is not a complete analysis of every aspect of any market, country, industry, security or the Fund. Statements of fact are from sources considered reliable, but Invesco Advisers, Inc. makes no representation or warranty as to their completeness or accuracy. Although historical performance is no guarantee of future results, these insights may help you understand our investment management philosophy.
See important Fund and, if applicable, index disclosures later in this report.
| | |
 | | Derek Taner Chartered Financial Analyst, Portfolio Manager, is manager of Invesco Global Health Care Fund. He joined Invesco in 2005. |
| Mr. Taner earned a BS in business administration with an emphasis in accounting and finance and an MBA from the University of California, Berkeley Haas School of Business. |
5 Invesco Global Health Care Fund
Your Fund’s Long-Term Performance
Results of a $10,000 Investment – Oldest Share Class(es)
Fund and index data from 10/31/06
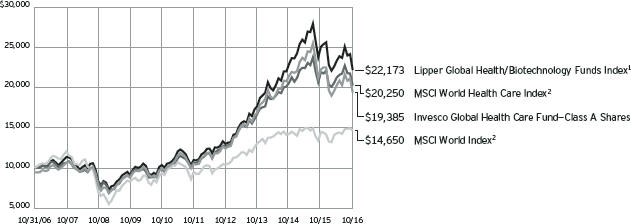
1 Source: Lipper Inc.
2 Source: FactSet Research Systems Inc.
Past performance cannot guarantee comparable future results.
The data shown in the chart include reinvested distributions, applicable sales charges and Fund expenses including
management fees. Index returns include reinvested dividends, but they do not reflect sales charges. Performance of the peer group, if applicable, reflects fund expenses and management fees; performance
of a market index does not. Performance shown in the chart and table(s) does not reflect deduction of taxes a shareholder would pay on Fund distributions or sale of Fund shares.
6 Invesco Global Health Care Fund
| | | | | |
| Average Annual Total Returns |
| As of 10/31/16, including maximum applicable sales charges |
| | | | | |
| |
Class A Shares | | | | | |
| Inception (8/7/89) | | | | 10.21 | % |
| 10 Years | | | | 6.84 | |
| 5 Years | | | | 11.75 | |
| 1 Year | | | | -17.68 | |
| |
| Class B Shares | | | | | |
| Inception (4/1/93) | | | | 10.34 | % |
| 10 Years | | | | 6.81 | |
| 5 Years | | | | 11.93 | |
| 1 Year | | | | -17.10 | |
| |
| Class C Shares | | | | | |
| Inception (3/1/99) | | | | 7.45 | % |
| 10 Years | | | | 6.65 | |
| 5 Years | | | | 12.18 | |
| 1 Year | | | | -14.24 | |
| |
| Class Y Shares | | | | | |
| 10 Years | | | | 7.66 | % |
| 5 Years | | | | 13.30 | |
| 1 Year | | | | -12.67 | |
| |
| Investor Class Shares | | | | | |
| Inception (7/15/05) | | | | 7.55 | % |
| 10 Years | | | | 7.45 | |
| 5 Years | | | | 13.02 | |
| 1 Year | | | | -12.89 | |
Class Y shares incepted on October 3, 2008. Performance shown prior to that date is that of Class A shares and includes the 12b-1 fees applicable to Class A shares.
The performance data quoted represent past performance and cannot guarantee comparable future results; current performance may be lower or higher. Please visit invesco.com/performance for the most recent month-end performance. Performance figures reflect reinvested distributions, changes in net asset value and the effect of the maximum sales charge unless otherwise stated. Investment return and principal value will fluctuate so that you may have a gain or loss when you sell shares.
The net annual Fund operating expense ratio set forth in the most recent Fund prospectus as of the date of this report for Class A, Class B, Class C, Class Y and Investor Class shares was 1.05%, 1.80%, 1.80%, 0.80% and 1.05%, respectively.1 The total annual Fund operating expense ratio set forth in the most recent Fund prospectus as of the date of this report for Class A,
| | | | | |
| Average Annual Total Returns |
| As of 9/30/16, the most recent calendar quarter end, including maximum applicable sales charges |
| | | | | |
| |
| Class A Shares | | | | | |
| Inception (8/7/89) | | | | 10.59 | % |
| 10 Years | | | | 7.89 | |
| 5 Years | | | | 14.90 | |
| 1 Year | | | | -5.99 | |
| |
| Class B Shares | | | | | |
| Inception (4/1/93) | | | | 10.77 | % |
| 10 Years | | | | 7.85 | |
| 5 Years | | | | 15.11 | |
| 1 Year | | | | -5.33 | |
| |
| Class C Shares | | | | | |
| Inception (3/1/99) | | | | 8.01 | % |
| 10 Years | | | | 7.69 | |
| 5 Years | | | | 15.34 | |
| 1 Year | | | | -2.08 | |
| |
| Class Y Shares | | | | | |
| 10 Years | | | | 8.71 | % |
| 5 Years | | | | 16.49 | |
| 1 Year | | | | -0.29 | |
| |
| Investor Class Shares | | | | | |
| Inception (7/15/05) | | | | 8.43 | % |
| 10 Years | | | | 8.50 | |
| 5 Years | | | | 16.21 | |
| 1 Year | | | | -0.53 | |
Class B, Class C, Class Y and Investor Class shares was 1.06%, 1.81%, 1.81%, 0.81% and 1.06%, respectively. The expense ratios presented above may vary from the expense ratios presented in other sections of this report that are based on expenses incurred during the period covered by this report.
Class A share performance reflects the maximum 5.50% sales charge, and Class B and Class C share performance reflects the applicable contingent deferred sales charge (CDSC) for the period involved. The CDSC on Class B shares declines from 5% beginning at the time of purchase to 0% at the beginning of the seventh year. The CDSC on Class C shares is 1% for the first year after purchase. Class Y shares and Investor Class shares do not have a front-end sales charge or a CDSC; therefore, performance is at net asset value.
The performance of the Fund’s share classes will differ primarily due to different sales charge structures and class expenses.
Fund performance reflects any applicable fee waivers and/or expense reimbursements. Had the adviser not waived fees and/or reimbursed expenses currently or in the past, returns would have been lower. See current prospectus for more information.
| 1 | Total annual Fund operating expenses after any contractual fee waivers and/or expense reimbursements by the adviser in effect through at least June 30, 2018. See current prospectus for more information. |
7 Invesco Global Health Care Fund
Invesco Global Health Care Fund’s investment objective is long-term growth of capital.
| ∎ | | Unless otherwise stated, information presented in this report is as of October 31, 2016, and is based on total net assets. |
| ∎ | | Unless otherwise noted, all data provided by Invesco. |
| ∎ | | To access your Fund’s reports/prospectus, visit invesco.com/fundreports. |
About share classes
| ∎ | | Class B shares may not be purchased for new or additional investments. Please see the prospectus for more information. |
| ∎ | | Class Y shares and Investor Class shares are available only to certain investors. Please see the prospectus for more information. |
Principal risks of investing in the Fund
| ∎ | | Convertible securities risk. The market values of convertible securities are affected by market interest rates, the risk of actual issuer default on interest or principal payments and the value of the underlying common stock into which the convertible security may be converted. Additionally, a convertible security is subject to the same types of market and issuer risks as apply to the underlying common stock. In addition, certain convertible securities are subject to involuntary conversions and may undergo principal write-downs upon the occurrence of certain triggering events, and, as a result, are subject to an increased risk of loss. |
| ∎ | | Depositary receipts risk. Investing in depositary receipts involves the same risks as direct investments in foreign securities. In addition, the underlying issuers of certain depositary receipts are under no obligation to distribute shareholder communications or pass through any voting rights with respect to the deposited securities to the holders of such receipts. The Fund may therefore receive less timely information or have less control than if it invested directly in the foreign issuer. |
| ∎ | | Derivatives risk. The value of a derivative instrument depends largely on (and is derived from) the value of an underlying security, currency, commodity, interest rate, index or other asset (each referred to as an underlying asset). In addition to risks relating to the underlying assets, the use of derivatives may include other, possibly greater, risks, including counterparty, |
| | | leverage and liquidity risks. Counterparty risk is the risk that the counterparty to the derivative contract will default on its obligation to pay the Fund the amount owed or otherwise perform under the derivative contract. Derivatives create leverage risk because they do not require payment up front equal to the economic exposure created by owning the derivative. As a result, an adverse change in the value of the underlying asset could result in the Fund sustaining a loss that is substantially greater than the amount invested in the derivative, which may make the Fund’s returns more volatile and increase the risk of loss. Derivative instruments may also be less liquid than more traditional investments and the Fund may be unable to sell or close out its derivative positions at a desirable time or price. This risk may be more acute under adverse market conditions, during which the Fund may be most in need of liquidating its derivative positions. Derivatives may also be harder to value, less tax efficient and subject to changing government regulation that could impact the Fund’s ability to use certain derivatives or their cost. Also, derivatives used for hedging or to gain or limit exposure to a particular market segment may not provide the expected benefits, particularly during adverse market conditions. |
| ∎ | | Emerging markets securities risk. Emerging markets (also referred to as developing markets) are generally subject to greater market volatility, political, social and economic instability, uncertain trading markets and more governmental limitations on foreign investment than more developed markets. In addition, emerging markets may be subject to lower trading volume and greater price fluctuations than companies in more developed markets. Securities law and the enforcement of systems of taxation in many emerging market countries may change quickly and unpredictably. In addition, investments in emerging markets securities |
| | | may also be subject to additional transaction costs, delays in settlement procedures, and lack of timely information. |
| ∎ | | Foreign securities risk. The Fund’s foreign investments may be adversely affected by political and social instability, changes in economic or taxation policies, difficulty in enforcing obligations, decreased liquidity or increased volatility. Foreign investments also involve the risk of the possible seizure, nationalization or expropriation of the issuer or foreign deposits (in which the Fund could lose its entire investments in a certain market) and the possible adoption of foreign governmental restrictions such as exchange controls. Unless the Fund has hedged its foreign securities risk, foreign securities risk also involves the risk of negative foreign currency rate fluctuations, which may cause the value of securities denominated in such foreign currency (or other instruments through which the Fund has exposure to foreign currencies) to decline in value. Currency exchange rates may fluctuate significantly over short periods of time. Currency hedging strategies, if used, are not always successful. |
| ∎ | | Geographic focus risk. The Fund may from time to time invest a substantial amount of its assets in securities of issuers located in a single country or a limited number of countries. Adverse economic, political or social conditions in those countries may therefore have a significant negative impact on the Fund’s investment performance. |
| ∎ | | Health care sector risk. The Fund will concentrate its investments in the securities of domestic and foreign issuers in the health care sector. The health care sector is subject to significant government regulations, increases or decreases in the cost of medical products and services, and competitive forces that could negatively impact a health care company’s profitability. The health care sector may also be affected by government health care programs. |
| ∎ | | Management risk. The Fund is actively managed and depends heavily on the Adviser’s judgment about markets, interest rates or the attractiveness, relative values, liquidity, or potential appreciation of particular investments made for the Fund’s portfolio. The Fund could experience losses if these judgments |
|
| This report must be accompanied or preceded by a currently effective Fund prospectus, which contains more complete information, including sales charges and expenses. Investors should read it carefully before investing. |
NOT FDIC INSURED | MAY LOSE VALUE | NO BANK GUARANTEE
8 Invesco Global Health Care Fund
| | prove to be incorrect. Additionally, legislative, regulatory, or tax developments may adversely affect management of the Fund and, therefore, the ability of the Fund to achieve its investment objective. |
| ∎ | | Market risk. The market values of the Fund’s investments, and therefore the value of the Fund’s shares, will go up and down, sometimes rapidly or unpredictably. Market risk may affect a single issuer, industry or section of the economy, or it may affect the market as a whole. Individual stock prices tend to go up and down more dramatically than those of certain other types of investments, such as bonds. During a general downturn in the financial markets, multiple asset classes may decline in value. When markets perform well, there can be no assurance that specific investments held by the Fund will rise in value. |
| ∎ | | Preferred securities risk. Preferred securities are subject to issuer-specific and market risks applicable generally to equity securities. Preferred securities also may be subordinated to bonds or other debt instruments, subjecting them to a greater risk of non-payment, may be less liquid than many other securities, such as common stocks, and generally offer no voting rights with respect to the issuer. |
| ∎ | | Small- and mid-capitalization companies risks. Small- and mid-capitalization companies tend to be more vulnerable to changing market conditions, may have little or no operating history or track record of success, and may have more limited product lines and markets, less experienced management and fewer financial resources than larger companies. These companies’ securities may be more volatile and less liquid than those of more established companies, and their returns may vary, sometimes significantly, from the overall securities market. |
About indexes used in this report
| ∎ | | The MSCI World IndexSM is an unmanaged index considered representative of stocks of developed countries. The index is computed using the net return, which withholds applicable taxes for non-resident investors. |
| ∎ | | The MSCI World Health Care Index is an unmanaged index considered representative of health care stocks of developed countries. The index is computed using the net return, which withholds applicable taxes for non-resident investors. |
| ∎ | | The Lipper Global Health/Biotechnology Funds Index is an unmanaged index considered representative of global health/biotechnology funds tracked by Lipper. |
| ∎ | | The Fund is not managed to track the performance of any particular index, including the index(es) described here, and consequently, the performance of the Fund may deviate significantly from the performance of the index(es). |
| ∎ | | A direct investment cannot be made in an index. Unless otherwise indicated, index results include reinvested dividends, and they do not reflect sales charges. Performance of the peer group, if applicable, reflects fund expenses; performance of a market index does not. |
Other information
| ∎ | | The returns shown in management’s discussion of Fund performance are based on net asset values (NAVs) calculated for shareholder transactions. Generally accepted accounting principles require adjustments to be made to the net assets of the Fund at period end for financial reporting purposes, and as such, the NAVs for shareholder transactions and the returns based on those NAVs may differ from the NAVs and returns reported in the Financial Highlights. |
| ∎ | | Industry classifications used in this report are generally according to the Global Industry Classification Standard, which was developed by and is the exclusive property and a service mark of MSCI Inc. and Standard & Poor’s. |
9 Invesco Global Health Care Fund
Schedule of Investments(a)
October 31, 2016
| | | | | | | | |
| | | Shares | | | Value | |
Common Stocks & Other Equity Interests–98.20% | |
| Biotechnology–36.14% | |
AbbVie Inc. | | | 593,102 | | | $ | 33,083,230 | |
ACADIA Pharmaceuticals Inc.(b) | | | 225,371 | | | | 5,253,398 | |
Alder Biopharmaceuticals, Inc.(b) | | | 256,668 | | | | 6,224,199 | |
Alexion Pharmaceuticals, Inc.(b) | | | 147,641 | | | | 19,267,150 | |
Amgen Inc. | | | 271,425 | | | | 38,314,353 | |
Array BioPharma Inc.(b) | | | 1,286,896 | | | | 7,335,307 | |
BioCryst Pharmaceuticals, Inc.(b) | | | 646,052 | | | | 2,616,511 | |
Biogen Inc.(b) | | | 201,323 | | | | 56,406,678 | |
BioMarin Pharmaceutical Inc.(b) | | | 432,095 | | | | 34,792,289 | |
bluebird bio, Inc.(b) | | | 149,755 | | | | 7,150,801 | |
Celgene Corp.(b) | | | 740,917 | | | | 75,706,899 | |
DBV Technologies S.A.–ADR (France)(b) | | | 357,551 | | | | 12,274,726 | |
Evolutionary Genomics, Inc.(b) | | | 9,944 | | | | 31,324 | |
Exact Sciences Corp.(b) | | | 396,463 | | | | 6,176,894 | |
Gilead Sciences, Inc. | | | 275,056 | | | | 20,252,373 | |
Heron Therapeutics, Inc.(b) | | | 391,502 | | | | 5,813,805 | |
Incyte Corp.(b) | | | 333,014 | | | | 28,962,228 | |
Neurocrine Biosciences, Inc.(b) | | | 179,752 | | | | 7,867,745 | |
Prothena Corp. PLC (Ireland)(b) | | | 170,935 | | | | 8,174,112 | |
REGENXBIO Inc.(b) | | | 201,684 | | | | 3,176,523 | |
Sarepta Therapeutics, Inc.(b) | | | 236,989 | | | | 9,299,448 | |
Shire PLC–ADR | | | 321,322 | | | | 54,187,742 | |
Spark Therapeutics, Inc.(b) | | | 162,444 | | | | 7,636,492 | |
TESARO, Inc.(b) | | | 64,934 | | | | 7,849,222 | |
Ultragenyx Pharmaceutical Inc.(b) | | | 104,950 | | | | 6,191,000 | |
United Therapeutics Corp.(b) | | | 71,093 | | | | 8,536,137 | |
Vertex Pharmaceuticals Inc.(b) | | | 356,194 | | | | 27,020,877 | |
| | | | | | | | 499,601,463 | |
|
| Drug Retail–0.67% | |
Raia Drogasil S.A. (Brazil) | | | 419,678 | | | | 9,318,726 | |
|
| Health Care Distributors–2.77% | |
Cardinal Health, Inc. | | | 145,630 | | | | 10,003,325 | |
McKesson Corp. | | | 222,019 | | | | 28,234,156 | |
| | | | | | | | 38,237,481 | |
|
| Health Care Equipment–4.48% | |
Olympus Corp. (Japan) | | | 644,600 | | | | 23,051,066 | |
ResMed Inc. | | | 231,803 | | | | 13,854,865 | |
Wright Medical Group N.V.(b) | | | 1,140,738 | | | | 24,993,570 | |
| | | | | | | | 61,899,501 | |
|
| Health Care Facilities–5.42% | |
AmSurg Corp.(b) | | | 219,285 | | | | 13,102,279 | |
Brookdale Senior Living Inc.(b) | | | 472,738 | | | | 6,821,609 | |
HCA Holdings, Inc.(b) | | | 295,343 | | | | 22,602,600 | |
Tenet Healthcare Corp.(b) | | | 617,007 | | | | 12,161,208 | |
Universal Health Services, Inc.–Class B | | | 167,720 | | | | 20,245,481 | |
| | | | | | | | 74,933,177 | |
| | | | | | | | |
| | | Shares | | | Value | |
| Health Care Services–0.38% | |
Air Methods Corp.(b) | | | 197,101 | | | $ | 5,213,321 | |
|
| Life Sciences Tools & Services–5.36% | |
Agilent Technologies, Inc. | | | 292,823 | | | | 12,758,298 | |
Medpace Holdings, Inc.(b) | | | 67,573 | | | | 1,960,968 | |
Thermo Fisher Scientific, Inc. | | | 403,752 | | | | 59,363,657 | |
| | | | | | | | 74,082,923 | |
|
| Managed Health Care–6.89% | |
Aetna Inc. | | | 276,897 | | | | 29,724,893 | |
Humana Inc. | | | 125,708 | | | | 21,562,693 | |
Qualicorp S.A. (Brazil) | | | 674,900 | | | | 4,343,892 | |
UnitedHealth Group Inc. | | | 280,733 | | | | 39,675,995 | |
| | | | | | | | 95,307,473 | |
|
| Pharmaceuticals–36.09% | |
Agile Therapeutics, Inc.(b) | | | 841,843 | | | | 6,398,007 | |
Allergan PLC(b) | | | 97,410 | | | | 20,352,845 | |
Bayer AG (Germany) | | | 219,881 | | | | 21,793,692 | |
Bristol-Myers Squibb Co. | | | 730,584 | | | | 37,194,031 | |
Cempra, Inc.(b) | | | 281,479 | | | | 5,101,807 | |
Dermira, Inc.(b) | | | 358,756 | | | | 11,247,001 | |
Eli Lilly and Co. | | | 642,238 | | | | 47,422,854 | |
Endo International PLC(b) | | | 858,702 | | | | 16,100,662 | |
GlaxoSmithKline PLC–ADR (United Kingdom) | | | 351,258 | | | | 14,053,833 | |
Hikma Pharmaceuticals PLC (Jordan) | | | 351,148 | | | | 7,537,551 | |
Jazz Pharmaceuticals PLC(b) | | | 172,512 | | | | 18,884,889 | |
Johnson & Johnson | | | 127,181 | | | | 14,751,724 | |
Lipocine Inc.(b) | | | 722,936 | | | | 2,320,625 | |
Medicines Co. (The)(b) | | | 124,830 | | | | 4,113,148 | |
Merck & Co., Inc. | | | 994,061 | | | | 58,371,262 | |
Nippon Shinyaku Co., Ltd. (Japan) | | | 307,600 | | | | 15,634,463 | |
Novartis AG–ADR (Switzerland) | | | 496,245 | | | | 35,243,320 | |
Pfizer Inc. | | | 447,046 | | | | 14,175,829 | |
Roche Holding AG (Switzerland) | | | 246,918 | | | | 56,660,679 | |
Sanofi–ADR (France) | | | 1,134,568 | | | | 44,123,349 | |
Supernus Pharmaceuticals Inc.(b) | | | 352,296 | | | | 6,975,461 | |
Teva Pharmaceutical Industries Ltd.–ADR (Israel) | | | 840,661 | | | | 35,929,851 | |
Zogenix, Inc.(b) | | | 547,363 | | | | 4,461,008 | |
| | | | | | | | 498,847,891 | |
Total Common Stocks & Other Equity Interests
(Cost $1,092,012,566) | | | | 1,357,441,956 | |
|
Preferred Stock–0.00% | |
| Health Care Equipment–0.00% | |
Intact Medical Corp., Series C, Pfd. (Acquired 03/26/2001; Cost $2,000,000)(c)(d) | | | 2,439,026 | | | | 0 | |
See accompanying Notes to Financial Statements which are an integral part of the financial statements.
10 Invesco Global Health Care Fund
| | | | | | | | |
| | | Shares | | | Value | |
Money Market Funds–3.04% | | | | | |
Government & Agency Portfolio– Institutional Class, 0.29%(e) | | | 25,196,492 | | | $ | 25,196,492 | |
Treasury Portfolio–Institutional Class, 0.22%(e) | | | 16,797,661 | | | | 16,797,661 | |
Total Money Market Funds
(Cost $41,994,153) | | | | 41,994,153 | |
TOTAL INVESTMENTS–101.24%
(Cost $1,136,006,719) | | | | 1,399,436,109 | |
OTHER ASSETS LESS LIABILITIES–(1.24)% | | | | (17,076,024 | ) |
NET ASSETS–100.00% | | | $ | 1,382,360,085 | |
Investment Abbreviations:
| | |
| ADR | | – American Depositary Receipt |
| Pfd. | | – Preferred |
Notes to Schedule of Investments:
| (a) | Industry and/or sector classifications used in this report are generally according to the Global Industry Classification Standard, which was developed by and is the exclusive property and a service mark of MSCI Inc. and Standard & Poor’s. |
| (b) | Non-income producing security. |
| (c) | Security is considered venture capital. See Note 1K. |
| (d) | Security purchased or received in transaction exempt from registration under the Securities Act of 1933, as amended (the “1933 Act”). The security may be resold pursuant to an exemption from registration under the 1933 Act, typically to qualified institutional buyers. The value of this security at October 31, 2016 represented less than 1% of the Fund’s Net Assets. |
| (e) | The money market fund and the Fund are affiliated by having the same investment adviser. The rate shown is the 7-day SEC standardized yield as of October 31, 2016. |
See accompanying Notes to Financial Statements which are an integral part of the financial statements.
11 Invesco Global Health Care Fund
Statement of Assets and Liabilities
October 31, 2016
| | | | |
Assets: | |
Investments, at value (Cost $1,094,012,566) | | $ | 1,357,441,956 | |
Investments in affiliated money market funds, at value and cost | | | 41,994,153 | |
Total investments, at value (Cost $1,136,006,719) | | | 1,399,436,109 | |
Foreign currencies, at value (Cost $717,442) | | | 742,896 | |
Receivable for: | | | | |
Fund shares sold | | | 239,233 | |
Dividends | | | 2,012,461 | |
Investment for trustee deferred compensation and retirement plans | | | 252,871 | |
Other assets | | | 287,418 | |
Total assets | | | 1,402,970,988 | |
|
Liabilities: | |
Payable for: | | | | |
Investments purchased | | | 17,231,479 | |
Fund shares reacquired | | | 2,013,732 | |
Accrued fees to affiliates | | | 897,712 | |
Accrued trustees’ and officers’ fees and benefits | | | 3,130 | |
Accrued other operating expenses | | | 117,255 | |
Trustee deferred compensation and retirement plans | | | 347,595 | |
Total liabilities | | | 20,610,903 | |
Net assets applicable to shares outstanding | | $ | 1,382,360,085 | |
|
Net assets consist of: | |
Shares of beneficial interest | | $ | 1,085,954,238 | |
Undistributed net investment income | | | 2,597,623 | |
Undistributed net realized gain | | | 30,400,940 | |
Net unrealized appreciation | | | 263,407,284 | |
| | | $ | 1,382,360,085 | |
| | | | |
Net Assets: | |
Class A | | $ | 725,052,586 | |
Class B | | $ | 4,648,655 | |
Class C | | $ | 66,699,137 | |
Class Y | | $ | 22,548,266 | |
Investor Class | | $ | 563,411,441 | |
|
Shares outstanding, $0.01 par value per share,
with an unlimited number of shares authorized: | |
Class A | | | 22,020,745 | |
Class B | | | 194,754 | |
Class C | | | 2,789,922 | |
Class Y | | | 673,502 | |
Investor Class | | | 17,106,270 | |
Class A: | | | | |
Net asset value per share | | $ | 32.93 | |
Maximum offering price per share | | | | |
(Net asset value of $32.93 ¸ 94.50%) | | $ | 34.85 | |
Class B: | | | | |
Net asset value and offering price per share | | $ | 23.87 | |
Class C: | | | | |
Net asset value and offering price per share | | $ | 23.91 | |
Class Y: | | | | |
Net asset value and offering price per share | | $ | 33.48 | |
Investor Class: | | | | |
Net asset value and offering price per share | | $ | 32.94 | |
See accompanying Notes to Financial Statements which are an integral part of the financial statements.
12 Invesco Global Health Care Fund
Statement of Operations
For the year ended October 31, 2016
| | | | |
Investment income: | |
Dividends (net of foreign withholding taxes of $1,147,281) | | $ | 20,954,771 | |
Dividends from affiliated money market funds | | | 132,811 | |
Total investment income | | | 21,087,582 | |
| |
Expenses: | | | | |
Advisory fees | | | 9,871,757 | |
Administrative services fees | | | 378,514 | |
Custodian fees | | | 60,859 | |
Distribution fees: | | | | |
Class A | | | 2,117,864 | |
Class B | | | 77,868 | |
Class C | | | 855,349 | |
Investor Class | | | 1,584,786 | |
Transfer agent fees | | | 2,755,393 | |
Trustees’ and officers’ fees and benefits | | | 67,666 | |
Registration and filing fees | | | 120,786 | |
Reports to shareholders | | | 129,603 | |
Professional services fees | | | 76,348 | |
Other | | | 38,595 | |
Total expenses | | | 18,135,388 | |
Less: Fees waived and expense offset arrangement(s) | | | (64,675 | ) |
Net expenses | | | 18,070,713 | |
Net investment income | | | 3,016,869 | |
| |
Realized and unrealized gain (loss) from: | | | | |
Net realized gain (loss) from: | | | | |
Investment securities | | | 30,370,125 | |
Foreign currencies | | | (56,538 | ) |
Forward foreign currency contracts | | | 1,178,024 | |
| | | | 31,491,611 | |
Change in net unrealized appreciation (depreciation) of: | | | | |
Investment securities | | | (257,736,760 | ) |
Foreign currencies | | | 76,420 | |
Forward foreign currency contracts | | | (1,130,867 | ) |
| | | | (258,791,207 | ) |
Net realized and unrealized gain (loss) | | | (227,299,596 | ) |
Net increase (decrease) in net assets resulting from operations | | $ | (224,282,727 | ) |
See accompanying Notes to Financial Statements which are an integral part of the financial statements.
13 Invesco Global Health Care Fund
Statement of Changes in Net Assets
For the years ended October 31, 2016 and 2015
| | | | | | | | |
| | | 2016 | | | 2015 | |
Operations: | |
Net investment income | | $ | 3,016,869 | | | $ | 26,356 | |
Net realized gain | | | 31,491,611 | | | | 247,325,702 | |
Change in net unrealized appreciation (depreciation) | | | (258,791,207 | ) | | | (191,192,065 | ) |
Net increase (decrease) in net assets resulting from operations | | | (224,282,727 | ) | | | 56,159,993 | |
Distributions to shareholders from net investment income — Class Y | | | — | | | | (10,150 | ) |
| | |
Distributions to shareholders from net realized gains: | | | | | | | | |
Class A | | | (127,967,635 | ) | | | (96,831,067 | ) |
Class B | | | (1,855,636 | ) | | | (1,886,195 | ) |
Class C | | | (18,225,035 | ) | | | (11,181,210 | ) |
Class Y | | | (5,234,942 | ) | | | (3,429,565 | ) |
Investor Class | | | (93,924,558 | ) | | | (76,198,284 | ) |
Total distributions from net realized gains | | | (247,207,806 | ) | | | (189,526,321 | ) |
| | |
Share transactions–net: | | | | | | | | |
Class A | | | (11,048,725 | ) | | | 145,018,935 | |
Class B | | | (3,591,164 | ) | | | (1,629,291 | ) |
Class C | | | (9,986,290 | ) | | | 37,253,754 | |
Class Y | | | (7,490,433 | ) | | | 10,969,883 | |
Investor Class | | | 30,971,871 | | | | 32,925,819 | |
Net increase (decrease) in net assets resulting from share transactions | | | (1,144,741 | ) | | | 224,539,100 | |
Net increase (decrease) in net assets | | | (472,635,274 | ) | | | 91,162,622 | |
| | |
Net assets: | | | | | | | | |
Beginning of year | | | 1,854,995,359 | | | | 1,763,832,737 | |
End of year (includes undistributed net investment income of $2,597,623 and $(351,837), respectively) | | $ | 1,382,360,085 | | | $ | 1,854,995,359 | |
Notes to Financial Statements
October 31, 2016
NOTE 1—Significant Accounting Policies
Invesco Global Health Care Fund (the “Fund”) is a series portfolio of AIM Investment Funds (Invesco Investment Funds) (the “Trust”). The Trust is organized as a Delaware statutory trust and is registered under the Investment Company Act of 1940, as amended (the “1940 Act”), as an open-end series management investment company consisting of twenty-two separate series portfolios, each authorized to issue an unlimited number of shares of beneficial interest. The assets, liabilities and operations of each portfolio are accounted for separately. Information presented in these financial statements pertains only to the Fund. Matters affecting each portfolio or class will be voted on exclusively by the shareholders of such portfolio or class.
The Fund’s investment objective is long-term growth of capital.
The Fund currently consists of five different classes of shares: Class A, Class B, Class C, Class Y and Investor Class. Class Y and Investor Class shares are available only to certain investors. Class A shares are sold with a front-end sales charge unless certain waiver criteria are met and under certain circumstances load waived shares may be subject to contingent deferred sales charges (“CDSC”). Class C shares are sold with a CDSC. Class Y and Investor Class shares are sold at net asset value. Effective November 30, 2010, new or additional investments in Class B shares are no longer permitted. Existing shareholders of Class B shares may continue to reinvest dividends and capital gains distributions in Class B shares until they convert to Class A shares. Also, shareholders in Class B shares will be able to exchange those shares for Class B shares of other Invesco Funds offering such shares until they convert to Class A shares. Generally, Class B shares will automatically convert to Class A shares on or about the month-end, which is at least eight years after the date of purchase. Redemption of Class B shares prior to the conversion date will be subject to a CDSC.
The following is a summary of the significant accounting policies followed by the Fund in the preparation of its financial statements.
| A. | Security Valuations — Securities, including restricted securities, are valued according to the following policy. |
A security listed or traded on an exchange (except convertible securities) is valued at its last sales price or official closing price as of the close of the customary trading session on the exchange where the security is principally traded, or lacking any sales or official closing price on a particular day, the security may be valued at the closing bid price on that day. Securities traded in the over-the-counter market are valued based on prices furnished by independent pricing services or market makers. When such securities are valued by an independent pricing service they may be considered fair valued. Futures contracts are valued at the final settlement price set by an exchange on which they are principally traded. Listed options are valued at the mean between the last bid and asked prices from the exchange on which they are principally traded. Options not
14 Invesco Global Health Care Fund
listed on an exchange are valued by an independent source at the mean between the last bid and asked prices. For purposes of determining net asset value (“NAV”) per share, futures and option contracts generally are valued 15 minutes after the close of the customary trading session of the New York Stock Exchange (“NYSE”).
Investments in open-end and closed-end registered investment companies that do not trade on an exchange are valued at the end-of-day net asset value per share. Investments in open-end and closed-end registered investment companies that trade on an exchange are valued at the last sales price or official closing price as of the close of the customary trading session on the exchange where the security is principally traded.
Debt obligations (including convertible securities) and unlisted equities are fair valued using an evaluated quote provided by an independent pricing service. Evaluated quotes provided by the pricing service may be determined without exclusive reliance on quoted prices, and may reflect appropriate factors such as institution-size trading in similar groups of securities, developments related to specific securities, dividend rate (for unlisted equities), yield (for debt obligations), quality, type of issue, coupon rate (for debt obligations), maturity (for debt obligations), individual trading characteristics and other market data. Debt obligations are subject to interest rate and credit risks. In addition, all debt obligations involve some risk of default with respect to interest and/or principal payments.
Foreign securities’ (including foreign exchange contracts) prices are converted into U.S. dollar amounts using the applicable exchange rates as of the close of the NYSE. If market quotations are available and reliable for foreign exchange-traded equity securities, the securities will be valued at the market quotations. Because trading hours for certain foreign securities end before the close of the NYSE, closing market quotations may become unreliable. If between the time trading ends on a particular security and the close of the customary trading session on the NYSE, events occur that the Adviser determines are significant and make the closing price unreliable, the Fund may fair value the security. If the event is likely to have affected the closing price of the security, the security will be valued at fair value in good faith using procedures approved by the Board of Trustees. Adjustments to closing prices to reflect fair value may also be based on a screening process of an independent pricing service to indicate the degree of certainty, based on historical data, that the closing price in the principal market where a foreign security trades is not the current value as of the close of the NYSE. Foreign securities’ prices meeting the approved degree of certainty that the price is not reflective of current value will be priced at the indication of fair value from the independent pricing service. Multiple factors may be considered by the independent pricing service in determining adjustments to reflect fair value and may include information relating to sector indices, American Depositary Receipts and domestic and foreign index futures. Foreign securities may have additional risks including exchange rate changes, potential for sharply devalued currencies and high inflation, political and economic upheaval, the relative lack of issuer information, relatively low market liquidity and the potential lack of strict financial and accounting controls and standards.
Securities for which market prices are not provided by any of the above methods may be valued based upon quotes furnished by independent sources. The last bid price may be used to value equity securities. The mean between the last bid and asked prices is used to value debt obligations, including corporate loans.
Securities for which market quotations are not readily available or became unreliable are valued at fair value as determined in good faith by or under the supervision of the Trust’s officers following procedures approved by the Board of Trustees. Issuer specific events, market trends, bid/asked quotes of brokers and information providers and other market data may be reviewed in the course of making a good faith determination of a security’s fair value.
The Fund may invest in securities that are subject to interest rate risk, meaning the risk that the prices will generally fall as interest rates rise and, conversely, the prices will generally rise as interest rates fall. Specific securities differ in their sensitivity to changes in interest rates depending on their individual characteristics. Changes in interest rates may result in increased market volatility, which may affect the value and/or liquidity of certain Fund investments.
Valuations change in response to many factors including the historical and prospective earnings of the issuer, the value of the issuer’s assets, general economic conditions, interest rates, investor perceptions and market liquidity. Because of the inherent uncertainties of valuation, the values reflected in the financial statements may materially differ from the value received upon actual sale of those investments.
| B. | Securities Transactions and Investment Income — Securities transactions are accounted for on a trade date basis. Realized gains or losses on sales are computed on the basis of specific identification of the securities sold. Interest income (net of withholding tax, if any) is recorded on the accrual basis from settlement date. Dividend income (net of withholding tax, if any) is recorded on the ex-dividend date. |
The Fund may periodically participate in litigation related to Fund investments. As such, the Fund may receive proceeds from litigation settlements. Any proceeds received are included in the Statement of Operations as realized gain (loss) for investments no longer held and as unrealized gain (loss) for investments still held.
Brokerage commissions and mark ups are considered transaction costs and are recorded as an increase to the cost basis of securities purchased and/or a reduction of proceeds on a sale of securities. Such transaction costs are included in the determination of net realized and unrealized gain (loss) from investment securities reported in the Statement of Operations and the Statement of Changes in Net Assets and the net realized and unrealized gains (losses) on securities per share in the Financial Highlights. Transaction costs are included in the calculation of the Fund’s net asset value and, accordingly, they reduce the Fund’s total returns. These transaction costs are not considered operating expenses and are not reflected in net investment income reported in the Statement of Operations and the Statement of Changes in Net Assets, or the net investment income per share and the ratios of expenses and net investment income reported in the Financial Highlights, nor are they limited by any expense limitation arrangements between the Fund and the investment adviser.
The Fund allocates income and realized and unrealized capital gains and losses to a class based on the relative net assets of each class.
| C. | Country Determination — For the purposes of making investment selection decisions and presentation in the Schedule of Investments, the investment adviser may determine the country in which an issuer is located and/or credit risk exposure based on various factors. These factors include the laws of the country under which the issuer is organized, where the issuer maintains a principal office, the country in which the issuer derives 50% or more of its total revenues and the country that has the primary market for the issuer’s securities, as well as other criteria. Among the other criteria that may be evaluated for making this determination are the country in which the issuer maintains 50% or more of its assets, the type of security, financial guarantees and enhancements, the nature of the collateral and the sponsor organization. Country of issuer and/or credit risk exposure has been determined to be the United States of America, unless otherwise noted. |
15 Invesco Global Health Care Fund
| D. | Distributions — Distributions from net investment income and net realized capital gain, if any, are generally declared and paid annually and recorded on the ex-dividend date. The Fund may elect to treat a portion of the proceeds from redemptions as distributions for federal income tax purposes. |
| E. | Federal Income Taxes — The Fund intends to comply with the requirements of Subchapter M of the Internal Revenue Code of 1986, as amended (the “Internal Revenue Code”), necessary to qualify as a regulated investment company and to distribute substantially all of the Fund’s taxable earnings to shareholders. As such, the Fund will not be subject to federal income taxes on otherwise taxable income (including net realized capital gain) that is distributed to shareholders. Therefore, no provision for federal income taxes is recorded in the financial statements. |
The Fund recognizes the tax benefits of uncertain tax positions only when the position is more likely than not to be sustained. Management has analyzed the Fund’s uncertain tax positions and concluded that no liability for unrecognized tax benefits should be recorded related to uncertain tax positions. Management is not aware of any tax positions for which it is reasonably possible that the total amounts of unrecognized tax benefits will change materially in the next 12 months.
The Fund files tax returns in the U.S. Federal jurisdiction and certain other jurisdictions. Generally, the Fund is subject to examinations by such taxing authorities for up to three years after the filing of the return for the tax period.
| F. | Expenses — Fees provided for under the Rule 12b-1 plan of a particular class of the Fund and which are directly attributable to that class are charged to the operations of such class. All other expenses are allocated among the classes based on relative net assets. |
| G. | Accounting Estimates — The preparation of financial statements in conformity with accounting principles generally accepted in the United States of America (“GAAP”) requires management to make estimates and assumptions that affect the reported amounts of assets and liabilities at the date of the financial statements and the reported amounts of revenues and expenses during the reporting period including estimates and assumptions related to taxation. Actual results could differ from those estimates by a significant amount. In addition, the Fund monitors for material events or transactions that may occur or become known after the period-end date and before the date the financial statements are released to print. |
| H. | Indemnifications — Under the Trust’s organizational documents, each Trustee, officer, employee or other agent of the Trust is indemnified against certain liabilities that may arise out of the performance of their duties to the Fund. Additionally, in the normal course of business, the Fund enters into contracts, including the Fund’s servicing agreements, that contain a variety of indemnification clauses. The Fund’s maximum exposure under these arrangements is unknown as this would involve future claims that may be made against the Fund that have not yet occurred. The risk of material loss as a result of such indemnification claims is considered remote. |
| I. | Foreign Currency Translations — Foreign currency is valued at the close of the NYSE based on quotations posted by banks and major currency dealers. Portfolio securities and other assets and liabilities denominated in foreign currencies are translated into U.S. dollar amounts at date of valuation. Purchases and sales of portfolio securities (net of foreign taxes withheld on disposition) and income items denominated in foreign currencies are translated into U.S. dollar amounts on the respective dates of such transactions. The Fund does not separately account for the portion of the results of operations resulting from changes in foreign exchange rates on investments and the fluctuations arising from changes in market prices of securities held. The combined results of changes in foreign exchange rates and the fluctuation of market prices on investments (net of estimated foreign tax withholding) are included with the net realized and unrealized gain or loss from investments in the Statement of Operations. Reported net realized foreign currency gains or losses arise from (1) sales of foreign currencies, (2) currency gains or losses realized between the trade and settlement dates on securities transactions, and (3) the difference between the amounts of dividends, interest, and foreign withholding taxes recorded on the Fund’s books and the U.S. dollar equivalent of the amounts actually received or paid. Net unrealized foreign currency gains and losses arise from changes in the fair values of assets and liabilities, other than investments in securities at fiscal period end, resulting from changes in exchange rates. |
The Fund may invest in foreign securities, which may be subject to foreign taxes on income, gains on investments or currency repatriation, a portion of which may be recoverable. Foreign taxes, if any, are recorded based on the tax regulations and rates that exist in the foreign markets in which the Fund invests and are shown in the Statement of Operations.
| J. | Forward Foreign Currency Contracts — The Fund may engage in foreign currency transactions either on a spot (i.e. for prompt delivery and settlement) basis, or through forward foreign currency contracts, to manage or minimize currency or exchange rate risk. |
The Fund may also enter into forward foreign currency contracts for the purchase or sale of a security denominated in a foreign currency in order to “lock in” the U.S. dollar price of that security, or the Fund may also enter into forward foreign currency contracts that do not provide for physical settlement of the two currencies, but instead are settled by a single cash payment calculated as the difference between the agreed upon exchange rate and the spot rate at settlement based upon an agreed upon notional amount (non-deliverable forwards). The Fund will set aside liquid assets in an amount equal to the daily mark-to-market obligation for forward foreign currency contracts.
A forward foreign currency contract is an obligation between two parties (“Counterparties”) to purchase or sell a specific currency for an agreed-upon price at a future date. The use of forward foreign currency contracts does not eliminate fluctuations in the price of the underlying securities the Fund owns or intends to acquire but establishes a rate of exchange in advance. Fluctuations in the value of these contracts are measured by the difference in the contract date and reporting date exchange rates and are recorded as unrealized appreciation (depreciation) until the contracts are closed. When the contracts are closed, realized gains (losses) are recorded. Realized and unrealized gains (losses) on the contracts are included in the Statement of Operations. The primary risks associated with forward foreign currency contracts include failure of the Counterparty to meet the terms of the contract and the value of the foreign currency changing unfavorably. These risks may be in excess of the amounts reflected in the Statement of Assets and Liabilities.
| K. | Other Risks — The Fund’s performance is vulnerable to factors affecting the health care industry, including government regulation, obsolescence caused by scientific advances and technological innovations. |
The Fund has invested in non-publicly traded companies, some of which are in the startup or development stages. These investments are inherently risky, as the market for the technologies or products these companies are developing are typically in the early stages and may never materialize. The Fund could lose its entire investment in these companies. These investments are valued at fair value as determined in good faith in accordance with procedures approved by the Board of Trustees. Investments in privately held venture capital securities are illiquid.
16 Invesco Global Health Care Fund
NOTE 2—Advisory Fees and Other Fees Paid to Affiliates
The Trust has entered into a master investment advisory agreement with Invesco Advisers, Inc. (the “Adviser” or “Invesco”). Under the terms of the investment advisory agreement, the Fund pays an advisory fee to the Adviser based on the annual rate of the Fund’s average daily net assets as follows:
| | | | | | | | |
| Average Daily Net Assets | | Rate | |
First $350 million | | | 0 | .75% | | | | |
Next $350 million | | | 0 | .65% | | | | |
Next $1.3 billion | | | 0 | .55% | | | | |
Next $2 billion | | | 0 | .45% | | | | |
Next $2 billion | | | 0 | .40% | | | | |
Next $2 billion | | | 0 | .375% | | | | |
Over $8 billion | | | 0 | .35% | | | | |
For the year ended October 31, 2016, the effective advisory fees incurred by the Fund was 0.62%.
Under the terms of a master sub-advisory agreement between the Adviser and each of Invesco Asset Management Deutschland GmbH, Invesco Asset Management Limited, Invesco Asset Management (Japan) Limited, Invesco Hong Kong Limited, Invesco Senior Secured Management, Inc. and Invesco Canada Ltd. (collectively, the “Affiliated Sub-Advisers”) the Adviser, not the Fund, will pay 40% of the fees paid to the Adviser to any such Affiliated Sub-Adviser(s) that provide(s) discretionary investment management services to the Fund based on the percentage of assets allocated to such Affiliated Sub-Adviser(s).
The Adviser has contractually agreed, through at least June 30, 2017, to waive advisory fees and/or reimburse expenses to the extent necessary to limit total annual fund operating expenses after fee waiver and/or expense reimbursement (excluding certain items discussed below) of Class A, Class B, Class C, Class Y and Investor Class shares to 2.00%, 2.75%, 2.75%, 1.75% and 2.00% of average daily net assets (the “expense limits”), respectively. In determining the Adviser’s obligation to waive advisory fees and/or reimburse expenses, the following expenses are not taken into account, and could cause total annual fund operating expenses after fee waiver and/or expense reimbursement to exceed the numbers reflected above: (1) interest; (2) taxes; (3) dividend expense on short sales; (4) extraordinary or non-routine items, including litigation expenses; and (5) expenses that the Fund has incurred but did not actually pay because of an expense offset arrangement. Unless Invesco continues the fee waiver agreement, it will terminate on June 30, 2017. During its term, the fee waiver agreement cannot be terminated or amended to increase the expense limits without approval of the Board of Trustees. The Adviser did not waive fees and/or reimburse expenses during the period under these expense limits.
Further, the Adviser has contractually agreed, through at least June 30, 2018, to waive the advisory fee payable by the Fund in an amount equal to 100% of the net advisory fees the Adviser receives from the affiliated money market funds on investments by the Fund of uninvested cash in such affiliated money market funds.
For the year ended October 31, 2016, the Adviser waived advisory fees of $48,683.
The Trust has entered into a master administrative services agreement with Invesco pursuant to which the Fund has agreed to pay Invesco for certain administrative costs incurred in providing accounting services to the Fund. For the year ended October 31, 2016, expenses incurred under the agreement are shown in the Statement of Operations as Administrative services fees.
The Trust has entered into a transfer agency and service agreement with Invesco Investment Services, Inc. (“IIS”) pursuant to which the Fund has agreed to pay IIS a fee for providing transfer agency and shareholder services to the Fund and reimburse IIS for certain expenses incurred by IIS in the course of providing such services. IIS may make payments to intermediaries that provide omnibus account services, sub-accounting services and/or networking services. All fees payable by IIS to intermediaries that provide omnibus account services or sub-accounting are charged back to the Fund, subject to certain limitations approved by the Trust’s Board of Trustees. For the year ended October 31, 2016, the expenses incurred under the agreement are shown in the Statement of Operations as Transfer agent fees.
The Trust has entered into master distribution agreements with Invesco Distributors, Inc. (“IDI”) to serve as the distributor for the Class A, Class B, Class C, Class Y and Investor Class shares of the Fund. The Trust has adopted plans pursuant to Rule 12b-1 under the 1940 Act with respect to the Fund’s Class A, Class B, Class C and Investor Class shares (collectively, the “Plans”). The Fund, pursuant to the Plans, pays IDI compensation at the annual rate of 0.25% of the Fund’s average daily net assets of Class A shares, 1.00% of the average daily net assets of Class B and Class C shares and 0.25% of the average daily net assets of Investor Class shares. Of the Plan payments, up to 0.25% of the average daily net assets of each class of shares may be paid to furnish continuing personal shareholder services to customers who purchase and own shares of such classes. Any amounts not paid as a service fee under the Plans would constitute an asset-based sales charge. Rules of the Financial Industry Regulatory Authority (“FINRA”) impose a cap on the total sales charges, including asset-based sales charges, that may be paid by any class of shares of the Fund. For the year ended October 31, 2016, expenses incurred under the Plans are shown in the Statement of Operations as Distribution fees.
Front-end sales commissions and CDSC (collectively, the “sales charges”) are not recorded as expenses of the Fund. Front-end sales commissions are deducted from proceeds from the sales of Fund shares prior to investment in Class A shares of the Fund. CDSC are deducted from redemption proceeds prior to remittance to the shareholder. During the year ended October 31, 2016, IDI advised the Fund that IDI retained $154,369 in front-end sales commissions from the sale of Class A shares and $6,575, $1,121 and $9,455 from Class A, Class B and Class C shares, respectively, for CDSC imposed on redemptions by shareholders.
For the year ended October 31, 2016, the Fund incurred $51 in brokerage commissions with Invesco Capital Markets, Inc., an affiliate of the Adviser and IDI, for portfolio transactions executed on behalf of the Fund.
Certain officers and trustees of the Trust are officers and directors of the Adviser, IIS and/or IDI.
17 Invesco Global Health Care Fund
NOTE 3—Additional Valuation Information
GAAP defines fair value as the price that would be received to sell an asset or paid to transfer a liability in an orderly transaction between market participants at the measurement date, under current market conditions. GAAP establishes a hierarchy that prioritizes the inputs to valuation methods, giving the highest priority to readily available unadjusted quoted prices in an active market for identical assets (Level 1) and the lowest priority to significant unobservable inputs (Level 3), generally when market prices are not readily available or are unreliable. Based on the valuation inputs, the securities or other investments are tiered into one of three levels. Changes in valuation methods may result in transfers in or out of an investment’s assigned level:
| | Level 1 — | Prices are determined using quoted prices in an active market for identical assets. |
| | Level 2 — | Prices are determined using other significant observable inputs. Observable inputs are inputs that other market participants may use in pricing a security. These may include quoted prices for similar securities, interest rates, prepayment speeds, credit risk, yield curves, loss severities, default rates, discount rates, volatilities and others. |
| | Level 3 — | Prices are determined using significant unobservable inputs. In situations where quoted prices or observable inputs are unavailable (for example, when there is little or no market activity for an investment at the end of the period), unobservable inputs may be used. Unobservable inputs reflect the Fund’s own assumptions about the factors market participants would use in determining fair value of the securities or instruments and would be based on the best available information. |
The following is a summary of the tiered valuation input levels, as of October 31, 2016. The level assigned to the securities valuations may not be an indication of the risk or liquidity associated with investing in those securities. Because of the inherent uncertainties of valuation, the values reflected in the financial statements may materially differ from the value received upon actual sale of those investments.
| | | | | | | | | | | | | | | | |
| | | Level 1 | | | Level 2 | | | Level 3 | | | Total | |
Common Stocks & Other Equity Interests | | $ | 1,300,749,953 | | | $ | 56,660,679 | | | $ | 31,324 | | | $ | 1,357,441,956 | |
Preferred Stock | | | — | | | | — | | | | 0 | | | | 0 | |
Money Market Funds | | | 41,994,153 | | | | — | | | | — | | | | 41,994,153 | |
Total Investments | | $ | 1,342,744,106 | | | $ | 56,660,679 | | | $ | 31,324 | | | $ | 1,399,436,109 | |
NOTE 4—Investments in Other Affiliates
The 1940 Act defines an “affiliated person” as an issuance in which a fund holds 5% or more of the outstanding voting securities. The Fund has not owned enough of the outstanding voting securities of the issuer to have control (as defined in the 1940 Act) of that issuer. The following is a summary of the investments in other affiliates for the year ended October 31, 2016.
| | | | | | | | | | | | | | | | | | | | | | | | | | | | |
| | | Value
10/31/15 | | | Purchases
at Cost | | | Proceeds
from Sales | | | Change in Unrealized
Appreciation | | | Realized
Gain (Loss) | | | Value
10/31/16 | | | Dividend
Income | |
Evolutionary Genomics, Inc.(a) | | $ | 29,060 | | | $ | — | | | $ | — | | | $ | 2,264 | | | $ | — | | | $ | 31,324 | | | $ | — | |
| (a) | As of October 31, 2016, this security is no longer considered as an affiliate of the fund. |
NOTE 5—Derivative Investments
The Fund may enter into an International Swaps and Derivatives Association Master Agreement (“ISDA Master Agreement”) under which a Fund may trade OTC derivatives. An OTC transaction entered into under an ISDA Master Agreement typically involves a collateral posting arrangement, payment netting provisions and close-out netting provisions. These netting provisions allow for reduction of credit risk through netting of contractual obligations. The enforceability of the netting provisions of the ISDA Master Agreement depends on the governing law of the ISDA Master Agreement, among other factors.
For financial reporting purposes, the Fund does not offset OTC derivative assets or liabilities that are subject to ISDA Master Agreements in the Statement of Assets and Liabilities.
Effect of Derivative Investments for the year ended October 31, 2016
The table below summarizes the gains (losses) on derivative investments, detailed by primary risk exposure, recognized in earnings during the period:
| | | | |
| | | Location of Gain (Loss) on
Statement of Operations | |
| | | Currency Risk | |
Realized Gain: | | | | |
Forward foreign currency contracts | | $ | 1,178,024 | |
Change in Net Unrealized Appreciation (Depreciation): | | | | |
Forward foreign currency contracts | | | (1,130,867 | ) |
Total | | $ | 47,157 | |
The table below summarizes the one month average notional value of forward foreign currency contracts outstanding during the period.
| | | | |
| | | Forward
Foreign Currency
Contracts | |
Average notional value | | $ | 30,322,275 | |
18 Invesco Global Health Care Fund
NOTE 6—Security Transactions with Affiliated Funds
The Fund is permitted to purchase or sell securities from or to certain other Invesco Funds under specified conditions outlined in procedures adopted by the Board of Trustees of the Trust. The procedures have been designed to ensure that any purchase or sale of securities by the Fund from or to another fund or portfolio that is or could be considered an affiliate by virtue of having a common investment adviser (or affiliated investment advisers), common Trustees and/or common officers complies with Rule 17a-7 of the 1940 Act. Further, as defined under the procedures, each transaction is effected at the current market price. Pursuant to these procedures, for the year ended October 31, 2016, the Fund engaged in securities purchases of $1,082,357.
NOTE 7—Expense Offset Arrangement(s)
The expense offset arrangement is comprised of transfer agency credits which result from balances in demand deposit accounts used by the transfer agent for clearing shareholder transactions. For the year ended October 31, 2016, the Fund received credits from this arrangement, which resulted in the reduction of the Fund’s total expenses of $15,992.
NOTE 8—Trustees’ and Officers’ Fees and Benefits
Trustees’ and Officers’ Fees and Benefits include amounts accrued by the Fund to pay remuneration to certain Trustees and Officers of the Fund. Trustees have the option to defer compensation payable by the Fund, and Trustees’ and Officers’ Fees and Benefits also include amounts accrued by the Fund to fund such deferred compensation amounts. Those Trustees who defer compensation have the option to select various Invesco Funds in which their deferral accounts shall be deemed to be invested. Finally, certain current Trustees were eligible to participate in a retirement plan that provided for benefits to be paid upon retirement to Trustees over a period of time based on the number of years of service. The Fund may have certain former Trustees who also participate in a retirement plan and receive benefits under such plan. Trustees’ and Officers’ Fees and Benefits include amounts accrued by the Fund to fund such retirement benefits. Obligations under the deferred compensation and retirement plans represent unsecured claims against the general assets of the Fund.
NOTE 9—Cash Balances
The Fund is permitted to temporarily carry a negative or overdrawn balance in its account with State Street Bank and Trust Company, the custodian bank. Such balances, if any at period-end, are shown in the Statement of Assets and Liabilities under the payable caption Amount due custodian. To compensate the custodian bank for such overdrafts, the overdrawn Fund may either (1) leave funds as a compensating balance in the account so the custodian bank can be compensated by earning the additional interest; or (2) compensate by paying the custodian bank at a rate agreed upon by the custodian bank and Invesco, not to exceed the contractually agreed upon rate.
NOTE 10—Distributions to Shareholders and Tax Components of Net Assets
Tax Character of Distributions to Shareholders Paid During the Fiscal Years Ended October 31, 2016 and 2015:
| | | | | | | | |
| | | 2016 | | | 2015 | |
Ordinary income | | $ | 15,102,427 | | | $ | 279,221 | |
Long-term capital gain | | | 232,105,379 | | | | 189,257,250 | |
Total distributions | | $ | 247,207,806 | | | $ | 189,536,471 | |
Tax Components of Net Assets at Period-End:
| | | | |
| | | 2016 | |
Undistributed ordinary income | | $ | 2,952,596 | |
Undistributed long-term gain | | | 30,731,864 | |
Net unrealized appreciation — investments | | | 263,098,466 | |
Net unrealized appreciation (depreciation) — other investments | | | (22,107 | ) |
Temporary book/tax differences | | | (354,972 | ) |
Shares of beneficial interest | | | 1,085,954,238 | |
Total net assets | | $ | 1,382,360,085 | |
The difference between book-basis and tax-basis unrealized appreciation (depreciation) is due to differences in the timing of recognition of gains and losses on investments for tax and book purposes. The Fund’s net unrealized appreciation difference is attributable primarily to wash sales.
The temporary book/tax differences are a result of timing differences between book and tax recognition of income and/or expenses. The Fund’s temporary book/tax differences are the result of the trustee deferral of compensation and retirement plan benefits.
Capital loss carryforward is calculated and reported as of a specific date. Results of transactions and other activity after that date may affect the amount of capital loss carryforward actually available for the Fund to utilize. Capital losses generated in years beginning after December 22, 2010 can be carried forward for an unlimited period, whereas previous losses expire in eight tax years. Capital losses with an expiration period may not be used to offset capital gains until all net capital losses without an expiration date have been utilized. Capital loss carryforwards with no expiration date will retain their character as either short-term or long-term capital losses instead of as short-term capital losses as under prior law. The ability to utilize capital loss carryforwards in the future may be limited under the Internal Revenue Code and related regulations based on the results of future transactions.
The Fund does not have a capital loss carryforward as of October 31, 2016.
19 Invesco Global Health Care Fund
NOTE 11—Investment Securities
The aggregate amount of investment securities (other than short-term securities, U.S. Treasury obligations and money market funds, if any) purchased and sold by the Fund during the year ended October 31, 2016 was $334,684,494 and $578,026,610, respectively. Cost of investments on a tax basis includes the adjustments for financial reporting purposes as of the most recently completed federal income tax reporting period-end.
| | | | |
| Unrealized Appreciation (Depreciation) of Investment Securities on a Tax Basis | |
Aggregate unrealized appreciation of investment securities | | $ | 356,571,986 | |
Aggregate unrealized (depreciation) of investment securities | | | (93,473,520 | ) |
Net unrealized appreciation of investment securities | | $ | 263,098,466 | |
Cost of investments for tax purposes is $1,136,337,643.
NOTE 12—Reclassification of Permanent Differences
Primarily as a result of differing book/tax treatment of foreign currency transactions, on October 31, 2016, undistributed net investment income was decreased by $67,409 and undistributed net realized gain was increased by $67,409. This reclassification had no effect on the net assets of the Fund.
NOTE 13—Share Information
| | | | | | | | | | | | | | | | |
| | | Summary of Share Activity | |
| | | Years ended October 31, | |
| | | 2016(a) | | | 2015 | |
| | | Shares | | | Amount | | | Shares | | | Amount | |
Sold: | | | | | | | | | | | | | | | | |
Class A | | | 1,843,602 | | | $ | 67,167,477 | | | | 4,820,008 | | | $ | 224,680,172 | |
Class B | | | 11,075 | | | | 289,683 | | | | 72,539 | | | | 2,629,513 | |
Class C | | | 404,498 | | | | 10,787,866 | | | | 1,215,711 | | | | 43,961,950 | |
Class Y | | | 341,967 | | | | 12,813,669 | | | | 391,782 | | | | 18,343,412 | |
Investor Class | | | 389,082 | | | | 14,740,822 | | | | 676,871 | | | | 31,570,967 | |
| | | | |
Issued as reinvestment of dividends: | | | | | | | | | | | | | | | | |
Class A | | | 3,396,181 | | | | 125,115,293 | | | | 2,356,009 | | | | 100,342,466 | |
Class B | | | 68,337 | | | | 1,836,894 | | | | 57,678 | | | | 1,896,452 | |
Class C | | | 668,972 | | | | 18,015,422 | | | | 348,383 | | | | 11,472,253 | |
Class Y | | | 131,892 | | | | 4,930,137 | | | | 79,354 | | | | 3,413,789 | |
Investor Class | | | 2,469,246 | | | | 90,991,726 | | | | 1,757,199 | | | | 74,856,681 | |
| | | | |
Automatic conversion of Class B shares to Class A shares: | | | | | | | | | | | | | | | | |
Class A | | | 94,832 | | | | 3,351,350 | | | | 93,858 | | | | 4,317,788 | |
Class B | | | (129,996 | ) | | | (3,351,350 | ) | | | (121,735 | ) | | | (4,317,788 | ) |
| | | | |
Reacquired: | | | | | | | | | | | | | | | | |
Class A | | | (5,783,954 | ) | | | (206,682,845 | ) | | | (4,060,530 | ) | | | (184,321,491 | ) |
Class B | | | (90,684 | ) | | | (2,366,391 | ) | | | (52,195 | ) | | | (1,837,468 | ) |
Class C | | | (1,500,972 | ) | | | (38,789,578 | ) | | | (516,160 | ) | | | (18,180,449 | ) |
Class Y | | | (691,953 | ) | | | (25,234,239 | ) | | | (232,396 | ) | | | (10,787,318 | ) |
Investor Class | | | (2,094,161 | ) | | | (74,760,677 | ) | | | (1,598,601 | ) | | | (73,501,829 | ) |
Net increase (decrease) in share activity | | | (472,036 | ) | | $ | (1,144,741 | ) | | | 5,287,775 | | | $ | 224,539,100 | |
| (a) | There are entities that are record owners of more than 5% of the outstanding shares of the Fund and in the aggregate own 14% of the outstanding shares of the Fund. IDI has an agreement with these entities to sell Fund shares. The Fund, Invesco and/or Invesco affiliates may make payments to these entities, which are considered to be related to the Fund, for providing services to the Fund, Invesco and/or Invesco affiliates including but not limited to services such as securities brokerage, distribution, third party record keeping and account servicing. The Fund has no knowledge as to whether all or any portion of the shares owned of record by these entities are also owned beneficially. |
20 Invesco Global Health Care Fund
NOTE 14—Financial Highlights
The following schedule presents financial highlights for a share of the Fund outstanding throughout the periods indicated.
| | | | | | | | | | | | | | | | | | | | | | | | | | | | | | | | | | | | | | | | | | | | | | | | | | | | | | | | |
| | | Net asset
value,
beginning
of period | | | Net
investment
income
(loss)(a) | | | Net gains
(losses)
on securities
(both
realized and
unrealized) | | | Total from
investment
operations | | | Dividends
from net
investment
income | | | Distributions
from net
realized
gains | | | Total
distributions | | | Net asset
value, end
of period(b) | | | Total
return(c) | | | Net assets,
end of period
(000’s omitted) | | | Ratio of
expenses
to average
net assets
with fee waivers
and/or expenses
absorbed | | | Ratio of
expenses
to average net
assets without
fee waivers
and/or expenses
absorbed | | | Ratio of net
investment
income (loss)
to average
net assets | | | Portfolio
turnover(d) | |
Class A | | | | | | | | | | | | | | | | | | | | | | | | | | | | | | | | | | | | | | | | | | | | | | | | | | | | | | | | |
Year ended 10/31/16 | | $ | 43.70 | | | $ | 0.08 | | | $ | (5.09 | ) | | $ | (5.01 | ) | | $ | — | | | $ | (5.76 | ) | | $ | (5.76 | ) | | $ | 32.93 | | | | (12.87 | )% | | $ | 725,053 | | | | 1.09 | %(e) | | | 1.09 | %(e) | | | 0.23 | %(e) | | | 21 | % |
Year ended 10/31/15 | | | 47.08 | | | | 0.02 | | | | 1.53 | | | | 1.55 | | | | — | | | | (4.93 | ) | | | (4.93 | ) | | | 43.70 | | | | 3.56 | | | | 981,963 | | | | 1.04 | | | | 1.05 | | | | 0.04 | | | | 47 | |
Year ended 10/31/14 | | | 40.38 | | | | 0.01 | | | | 10.15 | | | | 10.16 | | | | (0.01 | ) | | | (3.45 | ) | | | (3.46 | ) | | | 47.08 | | | | 27.20 | | | | 906,858 | | | | 1.07 | | | | 1.08 | | | | 0.04 | | | | 24 | |
Year ended 10/31/13 | | | 32.09 | | | | 0.07 | | | | 10.63 | | | | 10.70 | | | | (0.17 | ) | | | (2.24 | ) | | | (2.41 | ) | | | 40.38 | | | | 35.79 | | | | 737,071 | | | | 1.10 | | | | 1.11 | | | | 0.21 | | | | 37 | |
Year ended 10/31/12 | | | 27.75 | | | | 0.12 | | | | 4.84 | | | | 4.96 | | | | (0.14 | ) | | | (0.48 | ) | | | (0.62 | ) | | | 32.09 | | | | 18.34 | | | | 563,802 | | | | 1.17 | | | | 1.18 | | | | 0.40 | | | | 39 | |
Class B | | | | | | | | | | | | | | | | | | | | | | | | | | | | | | | | | | | | | | | | | | | | | | | | | | | | | | | | |
Year ended 10/31/16 | | | 33.51 | | | | (0.14 | ) | | | (3.74 | ) | | | (3.88 | ) | | | — | | | | (5.76 | ) | | | (5.76 | ) | | | 23.87 | | | | (13.52 | ) | | | 4,649 | | | | 1.84 | (e) | | | 1.84 | (e) | | | (0.52 | )(e) | | | 21 | |
Year ended 10/31/15 | | | 37.50 | | | | (0.25 | ) | | | 1.19 | | | | 0.94 | | | | — | | | | (4.93 | ) | | | (4.93 | ) | | | 33.51 | | | | 2.76 | | | | 11,262 | | | | 1.79 | | | | 1.80 | | | | (0.71 | ) | | | 47 | |
Year ended 10/31/14 | | | 33.06 | | | | (0.24 | ) | | | 8.13 | | | | 7.89 | | | | — | | | | (3.45 | ) | | | (3.45 | ) | | | 37.50 | | | | 26.26 | | | | 14,239 | | | | 1.82 | | | | 1.83 | | | | (0.71 | ) | | | 24 | |
Year ended 10/31/13 | | | 26.72 | | | | (0.16 | ) | | | 8.74 | | | | 8.58 | | | | — | | | | (2.24 | ) | | | (2.24 | ) | | | 33.06 | | | | 34.81 | | | | 17,101 | | | | 1.85 | | | | 1.86 | | | | (0.54 | ) | | | 37 | |
Year ended 10/31/12 | | | 23.24 | | | | (0.09 | ) | | | 4.05 | | | | 3.96 | | | | — | | | | (0.48 | ) | | | (0.48 | ) | | | 26.72 | | | | 17.45 | | | | 19,765 | | | | 1.92 | | | | 1.93 | | | | (0.35 | ) | | | 39 | |
Class C | | | | | | | | | | | | | | | | | | | | | | | | | | | | | | | | | | | | | | | | | | | | | | | | | | | | | | | | |
Year ended 10/31/16 | | | 33.56 | | | | (0.14 | ) | | | (3.75 | ) | | | (3.89 | ) | | | — | | | | (5.76 | ) | | | (5.76 | ) | | | 23.91 | | | | (13.53 | ) | | | 66,699 | | | | 1.84 | (e) | | | 1.84 | (e) | | | (0.52 | )(e) | | | 21 | |
Year ended 10/31/15 | | | 37.54 | | | | (0.25 | ) | | | 1.20 | | | | 0.95 | | | | — | | | | (4.93 | ) | | | (4.93 | ) | | | 33.56 | | | | 2.78 | | | | 107,976 | | | | 1.79 | | | | 1.80 | | | | (0.71 | ) | | | 47 | |
Year ended 10/31/14 | | | 33.09 | | | | (0.24 | ) | | | 8.14 | | | | 7.90 | | | | — | | | | (3.45 | ) | | | (3.45 | ) | | | 37.54 | | | | 26.26 | | | | 81,439 | | | | 1.82 | | | | 1.83 | | | | (0.71 | ) | | | 24 | |
Year ended 10/31/13 | | | 26.75 | | | | (0.16 | ) | | | 8.74 | | | | 8.58 | | | | — | | | | (2.24 | ) | | | (2.24 | ) | | | 33.09 | | | | 34.76 | | | | 57,536 | | | | 1.85 | | | | 1.86 | | | | (0.54 | ) | | | 37 | |
Year ended 10/31/12 | | | 23.26 | | | | (0.09 | ) | | | 4.06 | | | | 3.97 | | | | — | | | | (0.48 | ) | | | (0.48 | ) | | | 26.75 | | | | 17.48 | | | | 35,388 | | | | 1.92 | | | | 1.93 | | | | (0.35 | ) | | | 39 | |
Class Y | | | | | | | | | | | | | | | | | | | | | | | | | | | | | | | | | | | | | | | | | | | | | | | | | | | | | | | | |
Year ended 10/31/16 | | | 44.24 | | | | 0.17 | | | | (5.17 | ) | | | (5.00 | ) | | | — | | | | (5.76 | ) | | | (5.76 | ) | | | 33.48 | | | | (12.67 | ) | | | 22,548 | | | | 0.84 | (e) | | | 0.84 | (e) | | | 0.48 | (e) | | | 21 | |
Year ended 10/31/15 | | | 47.51 | | | | 0.14 | | | | 1.53 | | | | 1.67 | | | | (0.01 | ) | | | (4.93 | ) | | | (4.94 | ) | | | 44.24 | | | | 3.82 | | | | 39,443 | | | | 0.79 | | | | 0.80 | | | | 0.29 | | | | 47 | |
Year ended 10/31/14 | | | 40.71 | | | | 0.13 | | | | 10.22 | | | | 10.35 | | | | (0.10 | ) | | | (3.45 | ) | | | (3.55 | ) | | | 47.51 | | | | 27.52 | | | | 31,016 | | | | 0.82 | | | | 0.83 | | | | 0.29 | | | | 24 | |
Year ended 10/31/13 | | | 32.34 | | | | 0.16 | | | | 10.70 | | | | 10.86 | | | | (0.25 | ) | | | (2.24 | ) | | | (2.49 | ) | | | 40.71 | | | | 36.10 | | | | 15,502 | | | | 0.85 | | | | 0.86 | | | | 0.46 | | | | 37 | |
Year ended 10/31/12 | | | 27.96 | | | | 0.20 | | | | 4.87 | | | | 5.07 | | | | (0.21 | ) | | | (0.48 | ) | | | (0.69 | ) | | | 32.34 | | | | 18.66 | | | | 6,769 | | | | 0.92 | | | | 0.93 | | | | 0.65 | | | | 39 | |
Investor Class | | | | | | | | | | | | | | | | | | | | | | | | | | | | | | | | | | | | | | | | | | | | | | | | | | | | | | | | |
Year ended 10/31/16 | | | 43.71 | | | | 0.08 | | | | (5.09 | ) | | | (5.01 | ) | | | — | | | | (5.76 | ) | | | (5.76 | ) | | | 32.94 | | | | (12.87 | ) | | | 563,411 | | | | 1.09 | (e) | | | 1.09 | (e) | | | 0.23 | (e) | | | 21 | |
Year ended 10/31/15 | | | 47.09 | | | | 0.02 | | | | 1.53 | | | | 1.55 | | | | — | | | | (4.93 | ) | | | (4.93 | ) | | | 43.71 | | | | 3.57 | | | | 714,351 | | | | 1.04 | | | | 1.05 | | | | 0.04 | | | | 47 | |
Year ended 10/31/14 | | | 40.39 | | | | 0.01 | | | | 10.15 | | | | 10.16 | | | | (0.01 | ) | | | (3.45 | ) | | | (3.46 | ) | | | 47.09 | | | | 27.19 | | | | 730,280 | | | | 1.07 | | | | 1.08 | | | | 0.04 | | | | 24 | |
Year ended 10/31/13 | | | 32.10 | | | | 0.07 | | | | 10.63 | | | | 10.70 | | | | (0.17 | ) | | | (2.24 | ) | | | (2.41 | ) | | | 40.39 | | | | 35.78 | | | | 607,408 | | | | 1.10 | | | | 1.11 | | | | 0.21 | | | | 37 | |
Year ended 10/31/12 | | | 27.76 | | | | 0.12 | | | | 4.84 | | | | 4.96 | | | | (0.14 | ) | | | (0.48 | ) | | | (0.62 | ) | | | 32.10 | | | | 18.34 | | | | 481,385 | | | | 1.17 | | | | 1.18 | | | | 0.40 | | | | 39 | |
| (a) | Calculated using average shares outstanding. |
| (b) | Includes redemption fees added to shares of beneficial interest for Class A, Class B, Class C, Class Y and Investor Class which were less than $0.005 per share, for fiscal year ended October 31, 2012. |
| (c) | Includes adjustments in accordance with accounting principles generally accepted in the United States of America and as such, the net asset value for financial reporting purposes and the returns based upon those net asset values may differ from the net asset value and returns for shareholder transactions. Does not include sales charges and is not annualized for periods less than one year, if applicable. |
| (d) | Portfolio turnover is calculated at the fund level and is not annualized for periods less than one year, if applicable. |
| (e) | Ratios are based on average daily net assets (000’s omitted) of $847,145, $7,787, $85,535, $29,574 and $633,914 for Class A, Class B, Class C, Class Y and Investor Class shares, respectively. |
21 Invesco Global Health Care Fund
Report of Independent Registered Public Accounting Firm
To the Board of Trustees
and Shareholders of the Invesco Global Health Care Fund:
In our opinion, the accompanying statement of assets and liabilities, including the schedule of investments, and the related statements of operations and of changes in net assets and the financial highlights present fairly, in all material respects, the financial position of the Invesco Global Health Care Fund (the “Fund”) as of October 31, 2016, the results of its operations for the year then ended, the changes in its net assets for each of the two years in the period then ended and the financial highlights for each of the five years in the period then ended, in conformity with accounting principles generally accepted in the United States of America. These financial statements and financial highlights (hereafter referred to as “financial statements”) are the responsibility of the Fund’s management. Our responsibility is to express an opinion on these financial statements based on our audits. We conducted our audits of these financial statements in accordance with the standards of the Public Company Accounting Oversight Board (United States). Those standards require that we plan and perform the audit to obtain reasonable assurance about whether the financial statements are free of material misstatement. An audit includes examining, on a test basis, evidence supporting the amounts and disclosures in the financial statements, assessing the accounting principles used and significant estimates made by management, and evaluating the overall financial statement presentation. We believe that our audits, which included confirmation of securities as of October 31, 2016 by correspondence with the custodian and brokers, and the application of alternative auditing procedures where confirmations of security purchases have not been received, provide a reasonable basis for our opinion.
PRICEWATERHOUSECOOPERS LLP
Houston, Texas
December 21, 2016
22 Invesco Global Health Care Fund
Calculating your ongoing Fund expenses
Example
As a shareholder of the Fund, you incur two types of costs: (1) transaction costs, which may include sales charges (loads) on purchase payments or contingent deferred sales charges on redemptions, if any; and (2) ongoing costs, including management fees, distribution and/or service (12b-1) fees, and other Fund expenses. This example is intended to help you understand your ongoing costs (in dollars) of investing in the Fund and to compare these costs with ongoing costs of investing in other mutual funds. The example is based on an investment of $1,000 invested at the beginning of the period and held for the entire period May 1, 2016 through October 31, 2016.
Actual expenses
The table below provides information about actual account values and actual expenses. You may use the information in this table, together with the amount you invested, to estimate the expenses that you paid over the period. Simply divide your account value by $1,000 (for example, an $8,600 account value divided by $1,000 = 8.6), then multiply the result by the number in the table under the heading entitled “Actual Expenses Paid During Period” to estimate the expenses you paid on your account during this period.
Hypothetical example for comparison purposes
The table below also provides information about hypothetical account values and hypothetical expenses based on the Fund’s actual expense ratio and an assumed rate of return of 5% per year before expenses, which is not the Fund’s actual return.
The hypothetical account values and expenses may not be used to estimate the actual ending account balance or expenses you paid for the period. You may use this information to compare the ongoing costs of investing in the Fund and other funds. To do so, compare this 5% hypothetical example with the 5% hypothetical examples that appear in the shareholder reports of the other funds.
Please note that the expenses shown in the table are meant to highlight your ongoing costs only and do not reflect any transaction costs, such as sales charges (loads) on purchase payments or contingent deferred sales charges on redemptions, if any. Therefore, the hypothetical information is useful in comparing ongoing costs only, and will not help you determine the relative total costs of owning different funds. In addition, if these transaction costs were included, your costs would have been higher.
| | | | | | | | | | | | | | | | | | | | | | | | |
| Class | | Beginning
Account Value
(05/01/16) | | | ACTUAL | | | HYPOTHETICAL (5% annual return before expenses) | | | Annualized
Expense
Ratio | |
| | | Ending
Account Value
(10/31/16)1 | | | Expenses
Paid During
Period2 | | | Ending
Account Value
(10/31/16) | | | Expenses
Paid During
Period2 | | |
A | | $ | 1,000.00 | | | $ | 954.80 | | | $ | 5.41 | | | $ | 1,019.61 | | | $ | 5.58 | | | | 1.10 | % |
B | | | 1,000.00 | | | | 951.00 | | | | 9.07 | | | | 1,015.84 | | | | 9.37 | | | | 1.85 | |
C | | | 1,000.00 | | | | 951.10 | | | | 9.07 | | | | 1,015.84 | | | | 9.37 | | | | 1.85 | |
Y | | | 1,000.00 | | | | 956.00 | | | | 4.18 | | | | 1,020.86 | | | | 4.32 | | | | 0.85 | |
Investor | | | 1,000.00 | | | | 954.80 | | | | 5.41 | | | | 1,019.61 | | | | 5.58 | | | | 1.10 | |
| 1 | The actual ending account value is based on the actual total return of the Fund for the period May 1, 2016 through October 31, 2016, after actual expenses and will differ from the hypothetical ending account value which is based on the Fund’s expense ratio and a hypothetical annual return of 5% before expenses. |
| 2 | Expenses are equal to the Fund’s annualized expense ratio as indicated above multiplied by the average account value over the period, multiplied by 184/366 to reflect the most recent fiscal half year. |
23 Invesco Global Health Care Fund
Approval of Investment Advisory and Sub-Advisory Contracts
The Board of Trustees (the Board) of AIM Investment Funds (Invesco Investment Funds) is required under the Investment Company Act of 1940, as amended, to approve annually the renewal of Invesco Global Health Care Fund’s (the Fund) investment advisory agreements. During contract renewal meetings held on June 7-8, 2016, the Board as a whole, and the disinterested or “independent” Trustees, who comprise over 75% of the Board, voting separately, approved the continuance for the Fund of the Master Investment Advisory Agreement with Invesco Advisers, Inc. (Invesco Advisers and the investment advisory agreement) and the Master Intergroup Sub-Advisory Contract for Mutual Funds with Invesco Asset Management Deutschland GmbH, Invesco Asset Management Limited, Invesco Asset Management (Japan) Limited, Invesco Hong Kong Limited, Invesco Senior Secured Management, Inc. and Invesco Canada Ltd. (collectively, the Affiliated Sub-Advisers and the sub-advisory contracts) for another year, effective July 1, 2016.
In evaluating the fairness and reasonableness of compensation under the Fund’s investment advisory agreement and sub-advisory contracts, the Board considered, among other things, the factors discussed below. The Board determined that continuation of the Fund’s investment advisory agreement and the sub-advisory contracts is in the best interest of the Fund and its shareholders and that the compensation payable to Invesco Advisers and the Affiliated Sub-Advisers under the agreements is fair and reasonable.
The Board’s Fund Evaluation Process
The Board’s Investments Committee has established three Sub-Committees, which meet throughout the year to review the performance of funds advised by Invesco Advisers (the Invesco Funds). Over the course of each year, the Sub-Committees meet with portfolio managers for their assigned Invesco Funds and other members of management to review the performance, investment objective(s), policies, strategies, limitations and investment risks of these funds. The Board had the benefit of reports from the Sub-Committees and Investments Committee throughout the year in considering approval of the continuance of each Invesco Fund’s investment advisory agreement and sub-advisory contracts for another year.
During the contract renewal process, the Board receives comparative performance and fee data regarding the Invesco Funds prepared by Invesco Advisers and Broadridge Financial Solutions, Inc. (Broadridge), an independent provider of investment company data. The Board also receives an independent written evaluation from the Senior Officer, an officer of the Invesco Funds who reports directly to the independent Trustees. The Senior Officer’s
evaluation is prepared as part of his responsibility to manage the process by which the Invesco Funds’ proposed management fees are negotiated during the annual contract renewal process to ensure they are negotiated in a manner that is at arms’ length and reasonable. In addition to meetings with Invesco Advisers and fund counsel, the independent Trustees also discuss the continuance of the investment advisory agreement and sub-advisory contracts in separate sessions with the Senior Officer and with independent legal counsel.
The Trustees recognized that the advisory fee rates for the Invesco Funds are, in many cases, the result of years of review and negotiation. The Trustees’ deliberations and conclusions in a particular year may be based in part on their deliberations and conclusions regarding these same arrangements throughout the year and in prior years. The Trustees’ review and conclusions are based on the comprehensive consideration of all information presented to them and are not the result of any single determinative factor. Moreover, one Trustee may have weighed a particular piece of information or factor differently than another Trustee.
The discussion below is a summary of the Senior Officer’s independent written evaluation with respect to the Fund’s investment advisory agreement as well as a discussion of the material factors and related conclusions that formed the basis for the Board’s approval of the Fund’s investment advisory agreement and sub-advisory contracts. Unless otherwise stated, this information is current as of June 8, 2016, and does not reflect consideration of factors that became known to the Board after that date.
Factors and Conclusions and Summary of Independent Written Fee Evaluation
| A. | Nature, Extent and Quality of Services Provided by Invesco Advisers and the Affiliated Sub-Advisers |
The Board reviewed the advisory services provided to the Fund by Invesco Advisers under the Fund’s investment advisory agreement, the performance of Invesco Advisers in providing these services, and the credentials and experience of the officers and employees of Invesco Advisers who provide these services, including the Fund’s portfolio manager or managers. The Board’s review of the qualifications of Invesco Advisers to provide advisory services included the Board’s consideration of Invesco Advisers’ investment process oversight, independent credit analysis and investment risk management. The Board also considered non-advisory services that Invesco Advisers and its affiliates provide to the Invesco Funds such as various back office
support functions, trading operations, internal audit, valuation and legal and compliance.
In determining whether to continue the Fund’s investment advisory agreement, the Board considered the benefits of reapproving an existing relationship and the greater uncertainty that may be associated with entering into a new relationship. The Board concluded that the nature, extent and quality of the services provided to the Fund by Invesco Advisers are appropriate and satisfactory and consistent with the terms of the Fund’s investment advisory agreement.
The Board reviewed the services that may be provided by the Affiliated Sub-Advisers under the sub-advisory contracts and the credentials and experience of the officers and employees of the Affiliated Sub-Advisers who provide these services. The Board noted that the Affiliated Sub-Advisers have offices and personnel that are located in financial centers around the world. As a result, the Board noted that the Affiliated Sub-Advisers can provide research and investment analysis on the markets and economies of various countries in which the Fund may invest, make recommendations regarding securities and assist with security trades. The Board concluded that the sub-advisory contracts may benefit the Fund and its shareholders by permitting Invesco Advisers to use the resources and talents of the Affiliated Sub-Advisers in managing the Fund. The Board concluded that the nature, extent and quality of the services that may be provided by the Affiliated Sub-Advisers are appropriate and satisfactory and consistent with the terms of the Fund’s sub-advisory contracts.
The Board considered Fund performance as a relevant factor in considering whether to approve the investment advisory agreement. The Board did not view Fund performance as a relevant factor in considering whether to approve the sub-advisory contracts for the Fund, as no Affiliated Sub-Adviser currently manages assets of the Fund.
The Board compared the Fund’s performance during the past one, three and five calendar years to the performance of funds in the Broadridge performance universe and against the Lipper Global Health/Biotechnology Funds Index. The Board noted that performance of Class A shares of the Fund was in the fifth quintile of its performance universe for the one, three and five year periods (the first quintile being the best performing funds and the fifth quintile being the worst performing funds). The Board noted that performance of Class A shares of the Fund was below the performance of the Index for the one, three and five year periods. Invesco Advisers noted that a new co-chief investment officer had been named to the portfolio management team. The Trustees also
24 Invesco Global Health Care Fund
reviewed more recent Fund performance and this review did not change their conclusions.
| C. | Advisory and Sub-Advisory Fees |
The Board compared the Fund’s contractual management fee rate to the contractual management fee rates of funds in the Fund’s Broadridge expense group at a common asset level. The Board noted that the contractual management fee rate for Class A shares of the Fund was below the median contractual management fee rate of funds in its expense group. The Board noted that the term “contractual management fee” for funds in the expense group may include both advisory and certain administrative services fees, but that Broadridge does not provide information on a fund by fund basis as to what is included. The Board noted that Invesco Advisers does not separately charge the Invesco Funds for the administrative services included in the term as defined by Broadridge. The Board also reviewed the methodology used by Broadridge in providing expense group information, which includes using each fund’s contractual management fee schedule (including any applicable breakpoints) as reported in the most recent prospectus or statement of additional information for each fund in the expense group.
The Board also compared the Fund’s effective advisory fee rate (the advisory fee rate after advisory fee waivers and before other expense limitations/waivers) to the effective advisory fee rates of other funds advised by Invesco Advisers and its affiliates with investment strategies comparable to those of the Fund, based on asset balances as of December 31, 2015. The Board noted that the Fund’s rate was below the effective advisory fee rate of one off-shore fund advised by Invesco Advisers. The Board noted that Invesco Advisers and the Affiliated Sub-Advisers do not manage other client accounts with investment strategies comparable to those of the Fund.
The Board also considered the services that may be provided by the Affiliated Sub-Advisers pursuant to the sub-advisory contracts, as well as the fees payable by Invesco Advisers to the Affiliated Sub-Advisers pursuant to the sub-advisory contracts. The Board also noted that the sub-advisory fees are not paid directly by the Fund, but rather, are payable by Invesco Advisers to the Affiliated Sub-Advisers.
| D. | Economies of Scale and Breakpoints |
The Board considered the extent to which there are economies of scale in the provision of advisory services to the Fund. The Board also considered whether the Fund benefits from economies of scale through contractual breakpoints in the Fund’s advisory fee schedule. The Board also noted that the Fund shares directly in economies of scale through lower fees charged by third party service providers based on the combined size of the Invesco Funds and other clients advised by Invesco Advisers.
| E. | Profitability and Financial Resources |
The Board reviewed information from Invesco Advisers concerning the costs of the advisory
and other services that Invesco Advisers and its affiliates provide to the Fund and the Invesco Funds and the profitability of Invesco Advisers and its affiliates in providing these services. The Board received information from Invesco Advisers and a report from an independent consultant engaged by the Senior Officer about the methodology used to prepare the profitability information. The Board noted that Invesco Advisers continues to operate at a net profit from services Invesco Advisers and its affiliates provide to the Invesco Funds and the Fund. The Board did not deem the level of profits realized by Invesco Advisers and its affiliates from providing services to the Fund to be excessive given the nature, quality and extent of the services provided. The Board received and accepted information from Invesco Advisers demonstrating that Invesco Advisers and each Affiliated Sub-Adviser are financially sound and have the resources necessary to perform their obligations under the investment advisory agreement and sub-advisory contracts.
| F. | Collateral Benefits to Invesco Advisers and its Affiliates |
The Board considered various other benefits received by Invesco Advisers and its affiliates from the relationship with the Fund, including the fees received for providing transfer agency and distribution services to the Fund. The Board considered comparative information regarding fees charged for these services, including information provided by Broadridge and other independent sources. The Board considered the performance of Invesco Advisers and its affiliates in providing these services and the organizational structure employed to provide these services. The Board also considered that these services are provided to the Fund pursuant to written contracts that are reviewed and approved on an annual basis by the Board; and that the services are required for the operation of the Fund.
The Board considered the benefits realized by Invesco Advisers and the Affiliated Sub-Advisers as a result of portfolio brokerage transactions executed through “soft dollar” arrangements. The Board noted that soft dollar arrangements shift the payment obligation for research services from Invesco Advisers and the Affiliated Sub-Advisers to the Invesco Funds and that the research received may be used with other clients of Invesco Advisers and may reduce Invesco Advisers’ and the Affiliated Sub-Advisers’ expenses. The Board also considered that it receives periodic reports from the Chief Compliance Officer of the Invesco Funds demonstrating that these arrangements are consistent with regulatory requirements. The Board did not deem the soft dollar arrangements to be inappropriate.
The Board considered that the Fund’s uninvested cash and cash collateral from any securities lending arrangements may be invested in money market funds advised by Invesco Advisers pursuant to procedures approved by the Board. The Board noted that Invesco Advisers receives advisory fees from
these affiliated money market funds attributable to such investments, although Invesco Advisers has contractually agreed to waive through varying periods the advisory fees payable by the Invesco Funds with respect to certain investments in the affiliated money market funds. The waiver is in an amount equal to 100% of the net advisory fee Invesco Advisers receives from the affiliated money market funds with respect to the Fund’s investment in the affiliated money market funds of uninvested cash, but not cash collateral. The Board concluded that the amount of advisory fees received by Invesco Advisors from the Fund’s investment of cash collateral from any securities lending arrangements in the affiliated money market funds is fair and reasonable.
The Board also considered that the Fund may use an affiliated broker to execute certain trades for the Fund to, among other things, control information leakage, and was advised that such trades would be executed in compliance with rules under the Investment Company Act of 1940, as amended, and consistent with best execution obligations.
25 Invesco Global Health Care Fund
Tax Information
Form 1099-DIV, Form 1042-S and other year-end tax information provide shareholders with actual calendar year amounts that should be included in their tax returns. Shareholders should consult their tax advisors.
The following distribution information is being provided as required by the Internal Revenue Code or to meet a specific state’s requirement.
The Fund designates the following amounts or, if subsequently determined to be different, the maximum amount allowable for its fiscal year ended October 31, 2016:
| | | | |
Federal and State Income Tax | |
Long-Term Capital Gain Distributions | | $ | 232,105,379 | |
Qualified Dividend Income* | | | 100 | % |
Corporate Dividends Received Deduction* | | | 68.31 | % |
U.S. Treasury Obligations* | | | 0 | % |
| | * | The above percentages are based on ordinary income dividends paid to shareholders during the Fund’s fiscal year. |
| | | | |
Non-Resident Alien Shareholders | |
Qualified Short-Term Gains | | $ | 15,091,375 | |
26 Invesco Global Health Care Fund
Trustees and Officers
The address of each trustee and officer is AIM Investment Funds (Invesco Investment Funds) (the “Trust”), 11 Greenway Plaza, Suite 1000, Houston, Texas 77046-1173. The trustees serve for the life of the Trust, subject to their earlier death, incapacitation, resignation, retirement or removal as more specifically provided in the Trust’s organizational documents. Each officer serves for a one year term or until their successors are elected and qualified. Column two below includes length of time served with predecessor entities, if any.
| | | | | | | | |
Name, Year of Birth and
Position(s) Held with the Trust | | Trustee and/
or Officer Since | | Principal Occupation(s)
During Past 5 Years | | Number of
Funds in Fund
Complex
Overseen by
Trustee | | Other Directorship(s)
Held by Trustee During
Past 5 Years |
| Interested Persons | | | | | | | | |
| Martin L. Flanagan1 — 1960 Trustee | | 2007 | | Executive Director, Chief Executive Officer and President, Invesco Ltd. (ultimate parent of Invesco and a global investment management firm); Advisor to the Board, Invesco Advisers, Inc. (formerly known as Invesco Institutional (N.A.), Inc.); Trustee, The Invesco Funds; Vice Chair, Investment Company Institute; and Member of Executive Board, SMU Cox School of Business Formerly: Chairman and Chief Executive Officer, Invesco Advisers, Inc. (registered investment adviser); Director, Chairman, Chief Executive Officer and President, Invesco Holding Company (US) Inc. (formerly IVZ Inc.) (holding company), Invesco Group Services, Inc. (service provider) and Invesco North American Holdings, Inc. (holding company); Director, Chief Executive Officer and President, Invesco Holding Company Limited (parent of Invesco and a global investment management firm); Director, Invesco Ltd.; Chairman, Investment Company Institute and President, Co-Chief Executive Officer, Co-President, Chief Operating Officer and Chief Financial Officer, Franklin Resources, Inc. (global investment management organization) | | 146 | | None |
| Philip A. Taylor2 — 1954 Trustee and Senior Vice President | | 2006 | | Head of the Americas and Senior Managing Director, Invesco Ltd.; Director, Co-Chairman, Co-President and Co-Chief Executive Officer, Invesco Advisers, Inc. (formerly known as Invesco Institutional (N.A.), Inc.) (registered investment adviser); Director, Chairman, Chief Executive Officer and President, Invesco Management Group, Inc. (formerly known as Invesco AIM Management Group, Inc.) (financial services holding company); Director and Chairman, Invesco Investment Services, Inc. (formerly known as Invesco AIM Investment Services, Inc.) (registered transfer agent) Chief Executive Officer, Invesco Corporate Class Inc. (corporate mutual fund company) Director, Chairman and Chief Executive Officer, Invesco Canada Ltd. (formerly known as Invesco Trimark Ltd./Invesco Trimark Ltèe) (registered investment adviser and registered transfer agent); Trustee and Senior Vice President, The Invesco Funds; Director, Invesco Investment Advisers LLC (formerly known as Van Kampen Asset Management). Formerly: Director, Chief Executive Officer and President, Van Kampen Exchange Corp.; President and Principal Executive Officer, The Invesco Funds (other than AIM Treasurer’s Series Trust (Invesco Treasurer’s Series Trust), Short-Term Investments Trust and Invesco Management Trust); Executive Vice President, The Invesco Funds (AIM Treasurer’s Series Trust (Invesco Treasurer’s Series Trust), Short-Term Investments Trust and Invesco Management Trust only); Director and President, INVESCO Funds Group, Inc. (registered investment adviser and registered transfer agent); Director and Chairman, IVZ Distributors, Inc. (formerly known as INVESCO Distributors, Inc.) (registered broker dealer); Director, President and Chairman, Invesco Inc. (holding company), Invesco Canada Holdings Inc. (holding company), Trimark Investments Ltd./Placements Trimark Ltèe and Invesco Financial Services Ltd/Services Financiers Invesco Ltèe; Chief Executive Officer, Invesco Canada Fund Inc. (corporate mutual fund company); Director and Chairman, Van Kampen Investor Services Inc.; Director, Chief Executive Officer and President, 1371 Preferred Inc. (holding company) and Van Kampen Investments Inc.; Director and President, AIM GP Canada Inc. (general partner for limited partnerships) and Van Kampen Advisors, Inc.; Director and Chief Executive Officer, Invesco Trimark Dealer Inc. (registered broker dealer); Director, Invesco Distributors, Inc. (formerly known as Invesco AIM Distributors, Inc.) (registered broker dealer); Manager, Invesco PowerShares Capital Management LLC; Director, Chief Executive Officer and President, Invesco Advisers, Inc.; Director, Chairman, Chief Executive Officer and President, Invesco AIM Capital Management, Inc.; President, Invesco Trimark Dealer Inc. and Invesco Trimark Ltd./Invesco Trimark Ltèe; Director and President, AIM Trimark Corporate Class Inc. and AIM Trimark Canada Fund Inc.; Senior Managing Director, Invesco Holding Company Limited; Director and Chairman, Fund Management Company (former registered broker dealer); President and Principal Executive Officer, The Invesco Funds (AIM Treasurer’s Series Trust (Invesco Treasurer’s Series Trust), and Short-Term Investments Trust only); President, AIM Trimark Global Fund Inc. and AIM Trimark Canada Fund Inc. | | 146 | | None |
| 1 | Mr. Flanagan is considered an interested person (within the meaning of Section 2(a)(19) of the 1940 Act) of the Trust because he is an officer of the Adviser to the Trust, and an officer and a director of Invesco Ltd., ultimate parent of the Adviser. |
| 2 | Mr. Taylor is considered an interested person (within the meaning of Section 2(a)(19) of the 1940 Act) of the Trust because he is an officer and a director of the Adviser. |
T-1 Invesco Global Health Care Fund
Trustees and Officers—(continued)
| | | | | | | | |
Name, Year of Birth and
Position(s) Held with the Trust | | Trustee and/
or Officer Since | | Principal Occupation(s) During Past 5 Years | | Number of
Funds in Fund
Complex
Overseen by
Trustee | | Other Directorship(s)
Held by Trustee During
Past 5 Years |
| Independent Trustees | | | | | | | | |
Bruce L. Crockett — 1944 Trustee and Chair | | 2001 | | Chairman, Crockett Technologies Associates (technology consulting company) Formerly: Director, Captaris (unified messaging provider); Director, President and Chief Executive Officer, COMSAT Corporation; Chairman, Board of Governors of INTELSAT (international communications company); ACE Limited (insurance company); Independent Directors Council and Investment Company Institute | | 146 | | ALPS (Attorneys Liability Protection Society) (insurance company) and Globe Specialty Metals, Inc. (metallurgical company); Member of the Audit Committee, Ferroglobe PLC and Investment Company Institute; Member of the Executive Committee and Chair of the Governance Committee, Independent Directors Council |
David C. Arch — 1945 Trustee | | 2010 | | Chairman of Blistex Inc., a consumer health care products manufacturer | | 146 | | Board member of the Illinois Manufacturers’ Association; Member of the Board of Visitors, Institute for the Humanities, University of Michigan |
James T. Bunch — 1942 Trustee | | 2003 | | Managing Member, Grumman Hill Group LLC (family office/private equity investments) Formerly: Chairman of the Board, Denver Film Society, Chairman of the Board of Trustees, Evans Scholarship Foundation; Chairman, Board of Governors, Western Golf Association | | 146 | | Trustee, Evans Scholarship Foundation |
Albert R. Dowden — 1941 Trustee | | 2001 | | Director of a number of public and private business corporations, including Nature’s Sunshine Products, Inc. Formerly: Director, The Boss Group, Ltd. and Reich & Tang Funds (5 portfolios) (registered investment company); Director, Homeowners of America Holding Corporation/Homeowners of America Insurance Company (property casualty company); Director, Continental Energy Services, LLC (oil and gas pipeline service); Director, CompuDyne Corporation (provider of product and services to the public security market) and Director, Annuity and Life Re (Holdings), Ltd. (reinsurance company); Director, President and Chief Executive Officer, Volvo Group North America, Inc.; Senior Vice President, AB Volvo; Director of various public and private corporations; Chairman, DHJ Media, Inc.; Director, Magellan Insurance Company; and Director, The Hertz Corporation, Genmar Corporation (boat manufacturer), National Media Corporation; Advisory Board of Rotary Power International (designer, manufacturer, and seller of rotary power engines); and Chairman, Cortland Trust, Inc. (registered investment company) | | 146 | | Director of Nature’s Sunshine Products, Inc. |
Jack M. Fields — 1952 Trustee | | 2001 | | Chief Executive Officer, Twenty First Century Group, Inc. (government affairs company); and Discovery Learning Alliance (non-profit) Formerly: Owner and Chief Executive Officer, Dos Angeles Ranch L.P. (cattle, hunting, corporate entertainment); Director, Insperity, Inc. (formerly known as Administaff); Chief Executive Officer, Texana Timber LP (sustainable forestry company); Director of Cross Timbers Quail Research Ranch (non-profit); and member of the U.S. House of Representatives | | 146 | | None |
Eli Jones — 1961 Trustee | | 2016 | | Professor and Dean, Mays Business School — Texas A&M University Formerly: Professor and Dean, Walton College of Business, University of Arkansas and E.J. Ourso College of Business, Louisiana State University and Director, Arvest Bank | | 146 | | Director of Insperity, Inc. (formerly known as Administaff) |
Prema Mathai-Davis — 1950 Trustee | | 2001 | | Retired. Formerly: Chief Executive Officer, YWCA of the U.S.A. | | 146 | | None |
Larry Soll — 1942 Trustee | | 2003 | | Retired. Formerly: Chairman, Chief Executive Officer and President, Synergen Corp. (a biotechnology company) | | 146 | | None |
Raymond Stickel, Jr. — 1944 Trustee | | 2005 | | Retired. Formerly: Director, Mainstay VP Series Funds, Inc. (25 portfolios) and Partner, Deloitte & Touche | | 146 | | None |
Robert C. Troccoli — 1949 Trustee | | 2016 | | Adjunct Professor, University of Denver — Daniels College of Business Formerly: Senior Partner, KPMG LLP | | 146 | | None |
T-2 Invesco Global Health Care Fund
Trustees and Officers—(continued)
| | | | | | | | |
Name, Year of Birth and
Position(s) Held with the Trust | | Trustee and/
or Officer Since | | Principal Occupation(s) During Past 5 Years | | Number of
Funds in Fund
Complex
Overseen by
Trustee | | Other Directorship(s)
Held by Trustee During
Past 5 Years |
| Independent Trustees—(continued) |
Suzanne H. Woolsey — 1941 Trustee | | 2014 | | Retired. Formerly: Chief Executive Officer of Woolsey Partners LLC | | 146 | | Director, SunShare LLC; Trustee, Ocean Conservancy; Emeritus Chair of the Board of Trustees of the Institute for Defense Analyses and of Colorado College; Trustee, Chair, Business and Finance Committee of California Institute of Technology; Prior to 2014, Director of Fluor Corp.; Prior to 2010, Trustee of the German Marshall Fund of the United States; Prior to 2010, Trustee of the Rocky Mountain Institute |
| Other Officers | | | | | | | | |
Sheri Morris — 1964 President, Principal Executive Officer and Treasurer | | 1999 | | President, Principal Executive Officer and Treasurer, The Invesco Funds; Vice President, Invesco Advisers, Inc. (formerly known as Invesco Institutional (N.A.), Inc.) (registered investment adviser); and Vice President, PowerShares Exchange-Traded Fund Trust, PowerShares Exchange-Traded Fund Trust II, PowerShares India Exchange-Traded Fund Trust, PowerShares Actively Managed Exchange-Traded Fund Trust, and PowerShares Actively Managed Exchange-Traded Commodity Fund Trust Formerly: Vice President and Principal Financial Officer, The Invesco Funds; Vice President, Invesco AIM Advisers, Inc., Invesco AIM Capital Management, Inc. and Invesco AIM Private Asset Management, Inc.; Assistant Vice President and Assistant Treasurer, The Invesco Funds and Assistant Vice President, Invesco Advisers, Inc., Invesco AIM Capital Management, Inc. and Invesco AIM Private Asset Management, Inc.; and Treasurer, PowerShares Exchange-Traded Fund Trust, PowerShares Exchange-Traded Fund Trust II, PowerShares India Exchange-Traded Fund Trust and PowerShares Actively Managed Exchange-Traded Fund Trust | | N/A | | N/A |
Russell C. Burk — 1958 Senior Vice President and Senior Officer | | 2005 | | Senior Vice President and Senior Officer, The Invesco Funds | | N/A | | N/A |
John M. Zerr — 1962 Senior Vice President, Chief Legal Officer and Secretary | | 2006 | | Director, Senior Vice President, Secretary and General Counsel, Invesco Management Group, Inc. (formerly known as Invesco AIM Management Group, Inc.; Senior Vice President, Invesco Advisers, Inc. (formerly known as Invesco Institutional (N.A.), Inc.) (registered investment adviser); Senior Vice President and Secretary, Invesco Distributors, Inc. (formerly known as Invesco AIM Distributors, Inc.); Director, Vice President and Secretary, Invesco Investment Services, Inc. (formerly known as Invesco AIM Investment Services, Inc.) Senior Vice President, Chief Legal Officer and Secretary, The Invesco Funds; Managing Director, Invesco PowerShares Capital Management LLC; Director, Secretary and General Counsel, Invesco Investment Advisers LLC (formerly known as Van Kampen Asset Management); Secretary and General Counsel, Invesco Capital Markets, Inc. (formerly known as Van Kampen Funds Inc.) and Chief Legal Officer, PowerShares Exchange-Traded Fund Trust, PowerShares Exchange-Traded Fund Trust II, PowerShares India Exchange-Traded Fund Trust, PowerShares Actively Managed Exchange-Traded Fund Trust, and PowerShares Actively Managed Exchange-Traded Commodity Fund Trust Formerly: Director, Secretary, General Counsel and Senior Vice President, Van Kampen Exchange Corp.; Director, Vice President and Secretary, IVZ Distributors, Inc. (formerly known as INVESCO Distributors, Inc.); Director and Vice President, INVESCO Funds Group, Inc.; Director and Vice President, Van Kampen Advisors Inc.; Director, Vice President, Secretary and General Counsel, Van Kampen Investor Services Inc.; Director, Invesco Distributors, Inc. (formerly known as Invesco AIM Distributors, Inc.); Director, Senior Vice President, General Counsel and Secretary, Invesco AIM Advisers, Inc. and Van Kampen Investments Inc.; Director, Vice President and Secretary, Fund Management Company; Director, Senior Vice President, Secretary, General Counsel and Vice President, Invesco AIM Capital Management, Inc.; Chief Operating Officer and General Counsel, Liberty Ridge Capital, Inc. (an investment adviser); Vice President and Secretary, PBHG Funds (an investment company) and PBHG Insurance Series Fund (an investment company); Chief Operating Officer, General Counsel and Secretary, Old Mutual Investment Partners (a broker-dealer); General Counsel and Secretary, Old Mutual Fund Services (an administrator) and Old Mutual Shareholder Services (a shareholder servicing center); Executive Vice President, General Counsel and Secretary, Old Mutual Capital, Inc. (an investment adviser); and Vice President and Secretary, Old Mutual Advisors Funds (an investment company) | | N/A | | N/A |
T-3 Invesco Global Health Care Fund
Trustees and Officers—(continued)
| | | | | | | | |
Name, Year of Birth and
Position(s) Held with the Trust | | Trustee and/
or Officer Since | | Principal Occupation(s) During Past 5 Years | | Number of
Funds in Fund
Complex
Overseen by
Trustee | | Other Directorship(s)
Held by Trustee During
Past 5 Years |
| Other Officers—(continued) | | | | | | | | |
| Karen Dunn Kelley — 1960 Senior Vice President | | 2004 | | Senior Managing Director, Investments, Invesco Ltd.; Director, Co-President, Co-Chief Executive Officer, and Co-Chairman, Invesco Advisers, Inc. (formerly known as Invesco Institutional (N.A.), Inc.) (registered investment adviser); Chairman and Director, Invesco Senior Secured Management, Inc.; Senior Vice President, Invesco Management Group, Inc. (formerly known as Invesco AIM Management Group, Inc.); Executive Vice President, Invesco Distributors, Inc. (formerly known as Invesco AIM Distributors, Inc.); Director, Invesco Mortgage Capital Inc. and Invesco Management Company Limited; Senior Vice President, The Invesco Funds Formerly: Vice President, The Invesco Funds (other than AIM Treasurer’s Series Trust (Invesco Treasurer’s Series Trust), Short-Term Investments Trust and Invesco Management Trust); and President and Principal Executive Officer, The Invesco Funds (AIM Treasurer’s Series Trust (Invesco Treasurer’s Series Trust), Short-Term Investments Trust and Invesco Management Trust only); Director and President, INVESCO Asset Management (Bermuda) Ltd., Director, INVESCO Global Asset Management DAC (formerly known as INVESCO Global Asset Management Limited) and INVESCO Management S.A.; Senior Vice President, Van Kampen Investments Inc. and Invesco Advisers, Inc. (formerly known as Invesco Institutional (N.A.), Inc.) (registered investment adviser); Director and President, Fund Management Company; Chief Cash Management Officer, Director of Cash Management, Senior Vice President, and Managing Director, Invesco AIM Capital Management, Inc.; Director of Cash Management, Senior Vice President, and Vice President, Invesco Advisers, Inc. and Vice President, The Invesco Funds (AIM Treasurer’s Series Trust (Invesco Treasurer’s Series Trust), and Short-Term Investments Trust only) | | N/A | | N/A |
Kelli Gallegos — 1970 Vice President, Principal Financial Officer and Assistant Treasurer | | 2008 | | Vice President, Principal Financial Officer and Assistant Treasurer, The Invesco Funds; Assistant Treasurer, Invesco PowerShares Capital Management LLC, PowerShares Exchange-Traded Fund Trust, PowerShares Exchange-Traded Fund Trust II, PowerShares India Exchange-Traded Fund Trust, PowerShares Actively Managed Exchange-Traded Fund Trust, and PowerShares Actively Managed Exchange-Traded Commodity Fund Trust Formerly: Assistant Vice President, The Invesco Funds | | N/A | | N/A |
Tracy Sullivan — 1962 Vice President, Chief Tax Officer and Assistant Treasurer | | 2008 | | Vice President, Chief Tax Officer and Assistant Treasurer, The Invesco Funds; Assistant Treasurer, Invesco PowerShares Capital Management LLC, PowerShares Exchange-Traded Fund Trust, PowerShares Exchange-Traded Fund Trust II, PowerShares India Exchange-Traded Fund Trust, PowerShares Actively Managed Exchange-Traded Fund Trust, and PowerShares Actively Managed Exchange-Traded Commodity Fund Trust Formerly: Assistant Vice President, The Invesco Funds | | N/A | | N/A |
Crissie M. Wisdom — 1969 Anti-Money Laundering Compliance Officer | | 2013 | | Anti-Money Laundering Compliance Officer, Invesco Advisers, Inc. (formerly known as Invesco Institutional (N.A.), Inc.) (registered investment adviser), Invesco Capital Markets, Inc. (formerly known as Van Kampen Funds Inc.), Invesco Distributors, Inc., Invesco Investment Services, Inc., Invesco Management Group, Inc., The Invesco Funds, and PowerShares Exchange-Traded Fund Trust, PowerShares Exchange-Traded Fund Trust II, PowerShares India Exchange-Traded Fund Trust, PowerShares Actively Managed Exchange-Traded Fund Trust and PowerShares Actively Managed Exchange-Traded Commodity Fund Trust; Anti-Money Laundering Compliance Officer and Bank Secrecy Act Officer, INVESCO National Trust Company and Invesco Trust Company; and Fraud Prevention Manager and Controls and Risk Analysis Manager for Invesco Investment Services, Inc. Formerly: Anti-Money Laundering Compliance Officer, Van Kampen Exchange Corp. | | N/A | | N/A |
Robert R. Leveille — 1969 Chief Compliance Officer | | 2016 | | Chief Compliance Officer, Invesco Advisers, Inc. (registered investment adviser); and Chief Compliance Officer, The Invesco Funds Formerly: Chief Compliance Officer, Putnam Investments and the Putnam Funds | | N/A | | N/A |
The Statement of Additional Information of the Trust includes additional information about the Fund’s Trustees and is available upon request, without charge, by calling 1.800.959.4246. Please refer to the Fund’s Statement of Additional Information for information on the Fund’s sub-advisers.
| | | | | | |
Office of the Fund 11 Greenway Plaza, Suite 1000 Houston, TX 77046-1173 | | Investment Adviser Invesco Advisers, Inc. 1555 Peachtree Street, N.E. Atlanta, GA 30309 | | Distributor Invesco Distributors, Inc. 11 Greenway Plaza, Suite 1000 Houston, TX 77046-1173 | | Auditors PricewaterhouseCoopers LLP 1000 Louisiana Street, Suite 5800 Houston, TX 77002-5678 |
| | | |
| | | | | | |
Counsel to the Fund Stradley Ronon Stevens & Young, LLP 2005 Market Street, Suite 2600 Philadelphia, PA 19103-7018 | | Counsel to the Independent Trustees Goodwin Procter LLP 901 New York Avenue, N.W. Washington, D.C. 20001 | | Transfer Agent Invesco Investment Services, Inc. 11 Greenway Plaza, Suite 1000 Houston, TX 77046-1173 | | Custodian State Street Bank and Trust Company 225 Franklin Street Boston, MA 02110-2801 |
T-4 Invesco Global Health Care Fund
Explore High-Conviction Investing with Invesco

Invesco mailing information
Send general correspondence to Invesco Investment Services, Inc., P.O. Box 219078, Kansas City, MO 64121-9078.
Important notice regarding delivery of security holder documents
To reduce Fund expenses, only one copy of most shareholder documents may be mailed to shareholders with multiple accounts at the same address (Householding). Mailing of your shareholder documents may be householded indefinitely unless you instruct us otherwise. If you do not want the mailing of these documents to be combined with those for other members of your household, please contact Invesco Investment Services, Inc. at 800 959 4246 or contact your financial institution. We will begin sending you individual copies for each account within 30 days after receiving your request.
Fund holdings and proxy voting information
The Fund provides a complete list of its holdings four times in each fiscal year, at the quarter ends. For the second and fourth quarters, the lists appear in the Fund’s semiannual and annual reports to shareholders. For the first and third quarters, the Fund files the lists with the Securities and Exchange Commission (SEC) on Form N-Q. The most recent list of portfolio holdings is available at invesco.com/completeqtrholdings. Shareholders can also look up the Fund’s Forms N-Q on the SEC website at sec.gov. Copies of the Fund’s Forms N-Q may be reviewed and copied at the SEC Public Reference Room in Washington, D.C. You can obtain information on the operation of the Public Reference Room, including information about duplicating fee charges, by calling 202 551 8090 or 800 732 0330, or by electronic request at the following email address: publicinfo@sec.gov.
The SEC file numbers for the Fund are shown below.
A description of the policies and procedures that the Fund uses to determine how to vote proxies relating to portfolio securities is available without charge, upon request, from our Client Services department at 800 959 4246 or at invesco.com/proxyguidelines. The information is also available on the SEC website, sec.gov.
| | |
Information regarding how the Fund voted proxies related to its portfolio securities during the most recent 12-month period ended June 30 is available at invesco.com/proxysearch. The information is also available on the SEC website, sec.gov. Invesco Advisers, Inc. is an investment adviser; it provides investment advisory services to individual and institutional clients and does not sell securities. Invesco Distributors, Inc. is the US distributor for Invesco Ltd.’s retail mutual funds, exchange-traded funds and institutional money market funds. Both are wholly owned, indirect subsidiaries of Invesco Ltd. | |  |
| | | | |
| SEC file numbers: 811-05426 and 033-19338 | | GHC-AR-1 | | Invesco Distributors, Inc. |
| | | | |
| | |
 | | Annual Report to Shareholders | | October 31, 2016 |
| | |
| | Invesco Global Infrastructure Fund |
| | Nasdaq: |
| | A: GIZAX ∎ C: GIZCX ∎ R: GIZRX ∎ Y: GIZYX ∎ R5: GIZFX ∎ R6: GIZSX |

Letters to Shareholders
| | |

Philip Taylor | | Dear Shareholders: This annual report includes information about your Fund, including performance data and a complete list of its investments as of the close of the reporting period. Inside is a discussion of how your Fund was managed and the factors that affected its performance during the reporting period. In December 2015, the US Federal Reserve raised short-term interest rates for the first time since 2006, signaling its belief that the economy was likely to continue strengthening. Indeed, throughout the reporting period, US economic data were generally positive and the economy expanded at a moderate rate – but there were some bumps along the road. Job growth in May 2016 was very weak, but it was followed by strong increases in nonfarm payrolls in June and July. Increased concerns about global economic weakness caused US stock market indexes to sink at the start of calendar year 2016, but they eventually recovered; they sank |
again following the UK’s decision to leave the European Union, but then quickly recovered and reached record highs later in the summer. Strong demand for income-producing investments, particularly those perceived to be lower risk, benefited bonds as well as dividend-paying stocks for much of the reporting period. While economic news in the US was generally positive, news overseas was less upbeat. The European Central Bank, and central banks in China and Japan – as well as other countries – maintained extraordinarily accommodative monetary policies in response to economic weakness. As the fiscal year drew to a close, uncertainty about the outcome of the US presidential election resulted in increased market volatility; the surprise outcome after the close of the reporting period suggested that market volatility may continue for some time to come.
Short-term market volatility can prompt some investors to abandon their investment plans – and can cause others to settle for average results. The investment professionals at Invesco, in contrast, invest with high conviction, take a long-term perspective and have a passion to exceed. Invesco’s pure focus on investment management eliminates possible distractions and means that there are no competing lines of business for us to support. Just as important, we embrace a variety of investment strategies, asset classes and geographies – because we know that no single investment approach meets the diverse needs of all of our clients. We manage all our investment approaches with a passion to exceed. All our investment teams have a highly disciplined, long-term investing style that eliminates short-term decision-making. Of course, investing with high conviction can’t guarantee a profit or ensure success; no investment strategy can. To learn more about how we invest with high conviction, visit invesco.com/HighConviction.
You, too, can invest with high conviction by maintaining a long-term investment perspective and by working with your financial adviser on a regular basis. During periods of short-term market volatility or uncertainty, your financial adviser can keep you focused on your long-term investment goals – a new home, a child’s college education or a secure retirement. He or she also can share research about the economy, the markets and individual investment options.
Visit our website for more information on your investments
Our website, invesco.com/us, offers a wide range of market insights and investment perspectives. On the website, you’ll find detailed information about our funds, including performance, holdings and portfolio manager commentaries. You can access information about your account by completing a simple, secure online registration. Click on the “Need to register” link in the “Account Access” box on our homepage to get started.
In addition to the resources accessible on our website and through our mobile app, you can obtain timely updates to help you stay informed about the markets, the economy and investing by connecting with Invesco on Twitter, LinkedIn or Facebook. You can access our blog at blog.invesco.us.com. Our goal is to provide you the information you want, when and where you want it.
Finally, I’m pleased to share with you Invesco’s commitment to both the Principles for Responsible Investment and to considering environmental, social and governance issues in our robust investment process. I invite you to learn more at invesco.com/esg.
Have questions?
For questions about your account, contact an Invesco client services representative at 800 959 4246. For Invesco-related questions or comments, please email me directly at phil@invesco.com.
All of us at Invesco look forward to serving your investment management needs. Thank you for investing with us.
Sincerely,

Philip Taylor
Senior Managing Director, Invesco Ltd.
2 Invesco Global Infrastructure Fund
| | | | | | |

Bruce Crockett | | | | Dear Fellow Shareholders: Among the many important lessons I’ve learned in more than 40 years in a variety of business endeavors is the value of a trusted advocate. As independent chair of the Invesco Funds Board, I can assure you that the members of the Board are strong advocates for the interests of investors in Invesco’s mutual funds. We work hard to represent your interests through oversight of the quality of the investment management services your funds receive and other matters important to your investment, including but not limited to: |
| | | | ∎ | | Ensuring that Invesco offers a diverse lineup of mutual funds that your financial adviser can use to strive to meet your financial needs as your investment goals change over time. |
| | | | ∎ | | Monitoring how the portfolio management teams of the Invesco funds are performing in light of changing economic and market conditions. |
| ∎ | | Assessing each portfolio management team’s investment performance within the context of the investment strategy described in the fund’s prospectus. |
| ∎ | | Monitoring for potential conflicts of interests that may impact the nature of the services that your funds receive. |
We believe one of the most important services we provide our fund shareholders is the annual review of the funds’ advisory and sub-advisory contracts with Invesco Advisers and its affiliates. This review is required by the Investment Company Act of 1940 and focuses on the nature and quality of the services Invesco provides as the adviser to the Invesco funds and the reasonableness of the fees that it charges for those services. Each year, we spend months carefully reviewing information received from Invesco and a variety of independent sources, such as performance and fee data prepared by Lipper Inc., an independent, third-party firm widely recognized as a leader in its field. We also meet with our independent legal counsel and other independent advisers to review and help us assess the information that we have received. Our goal is to assure that you receive quality investment management services for a reasonable fee.
I trust the measures outlined above provide assurance that you have a worthy advocate when it comes to choosing the Invesco Funds.
As always, please contact me at bruce@brucecrockett.com with any questions or concerns you may have. On behalf of the Board, we look forward to continuing to represent your interests and serving your needs.
Sincerely,

Bruce L. Crockett
Independent Chair
Invesco Funds Board of Trustees
3 Invesco Global Infrastructure Fund
Management’s Discussion of Fund Performance
Performance summary
For the fiscal year ended October 31, 2016, Class A shares of Invesco Global Infrastructure Fund (the Fund), at net asset value (NAV), underperformed the Fund’s style-specific benchmark, the Dow Jones Brookfield Global Infrastructure Index.
Your Fund’s long-term performance appears later in this report.
Fund vs. Indexes
Total returns, 10/31/15 to 10/31/16, at net asset value (NAV). Performance shown does not include applicable contingent deferred sales charges (CDSC) or front-end sales charges, which would have reduced performance.
| | | | |
Class A Shares | | | 3.01 | % |
Class C Shares | | | 2.24 | |
Class R Shares | | | 2.76 | |
Class Y Shares | | | 3.27 | |
Class R5 Shares | | | 3.27 | |
Class R6 Shares | | | 3.27 | |
MSCI World Indexq (Broad Market Index) | | | 1.18 | |
| Dow Jones Brookfield Global Infrastructure Indexq (Style-Specific Index) | | | 4.98 | |
| Lipper Global Infrastructure Funds Classification Average∎ (Peer Group) | | | 4.49 | |
Source(s): qFactSet Research Systems Inc.; ∎Lipper Inc.
Market conditions and your Fund
The global economy continued to expand, albeit slowly, for the fiscal year ended October 31, 2016. However, that growth became increasingly uneven across developed and emerging economies, amid continued volatility in oil prices and as the policies of central banks globally began to diverge.
An equity market rally in November was offset by negative performance in December, as a late-year crash in oil prices rattled the markets. Also in December, the US Federal Reserve (the Fed) followed through on its commitment to normalize monetary policy by raising interest rates – its first increase since 2006 – even as the European Central Bank extended its asset purchase program and Japan introduced additional quantitative easing and negative interest rates.
Stocks began calendar year 2016 on a negative note, driven by investor concerns about economic weakness in China and
falling oil prices. Markets recovered in late February and posted gains amid concerted central bank commitments to very loose monetary policy. As a result, the US dollar fell sharply against the euro and Japanese yen, a development that was largely supportive of oil and stock prices.
All major global stock indexes experienced steep declines again in June after UK voters opted to leave the European Union. Stocks in economically sensitive sectors, including energy and financials, were hardest hit, and investors flocked to the perceived safety of US Treasuries and more defensive, dividend-paying equities often found in the telecommunication services, utilities and consumer staples sectors.
After the initial shock of the UK vote, stocks made a strong recovery, regaining most of their losses as fears of a shock to consumer confidence never materialized. For the remainder of the reporting period, emerging markets outperformed as the Fed left interest rates unchanged and expectations
for an interest rate increase were delayed again.
In general, global infrastructure stocks – which have a heavy emphasis within the energy and utilities sectors – produced positive returns and outperformed broad market equities during the reporting period. The Fund also produced positive returns, but underperformed its style-specific benchmark, the Dow Jones Brookfield Global Infrastructure Index, primarily as a result of market allocation.
Utilities stocks, particularly in the US, experienced strong performance as investors sought yield and perceived safety. A combination of high production levels and weakened demand led to further imbalances in crude oil and natural gas supply and demand, causing energy prices to plunge at the beginning of the fiscal year; crude oil fell from $49 to a low of $28 per barrel, and natural gas fell from $2.25 to a low $1.64 per thousand cubic feet.1 Toward the end of the reporting period, OPEC provided some respite by initiating a limit to production in an effort to stabilize crude prices. Additionally, continued declines in capital expenditures helped reduce natural gas production. Crude oil and natural gas prices ended the reporting period at $48 per barrel and $3.03 per thousand cubic feet, respectively, and energy equities ended the fiscal year in positive territory, in general.1
On an absolute basis, Fund holdings in the midstream services, gas distribution, electric utilities and wireless towers sectors were the largest contributors to Fund performance. Holdings in the ports and rail and the diversified infrastructure sectors were detractors from absolute Fund performance.
Relative to the style-specific benchmark, security selection in and overweight exposure to midstream services, as well as security selection in and an underweight allocation to airports, detracted from Fund performance. Additionally, underweight
| | | | |
| Portfolio Composition | |
By infrastructure sector | | | % of total net assets | |
| | | | |
| |
| Midstream Services | | | 29.9 | % |
| Gas Distribution | | | 21.2 | |
| Electric Utilities | | | 14.0 | |
| Towers | | | 12.6 | |
| Water | | | 5.0 | |
| Tolls | | | 4.5 | |
| Airports | | | 4.3 | |
| Diversified | | | 3.5 | |
| Satellites | | | 2.2 | |
| Rail, Ports & Renewables | | | 1.5 | |
| Money Market Funds | | | | |
| Plus Other Assets Less Liabilities | | | 1.3 | |
| | | | | | |
| Top 10 Equity Holdings* | | | | |
| | % of total net assets | |
| | | | |
| | |
| 1. | | National Grid PLC | | 6.8% |
| 2. | | American Tower Corp. -Class A | | 6.3 |
| 3. | | Kinder Morgan Inc. | | 5.9 |
| 4. | | PG&E Corp. | | 5.8 |
| 5. | | TransCanada Corp. | | 5.1 |
| 6. | | Enbridge Inc. | | 4.7 |
| 7. | | Sempra Energy | | 4.2 |
| 8. | | Crown Castle International Corp. | | 3.7 |
| 9. | | Spectra Energy Corp. | | 3.6 |
10. | | Williams Cos., Inc. (The) | | 3.0 |
| | | | |
Total Net Assets | | $ | 10.0 million | |
| |
| Total Number of Holdings* | | | 70 | |
The Fund’s holdings are subject to change, and there is no assurance that the Fund will continue to hold any particular security.
*Excluding money market fund holdings.
Data presented here are as of October 31, 2016.
4 Invesco Global Infrastructure Fund
exposure to the electric utilities sector and security selection in tolls hurt relative Fund performance. Conversely, security selection in and underweight exposure to the satellites and water sectors were relative performance contributors. Additionally, underweight exposure to ports and rail and security selection within towers added to relative Fund performance.
Top individual contributors to the Fund’s absolute performance included
TransCanada and American Tower. TransCanada is one of the leading energy infrastructure companies, with assets that span North America. During the fiscal year, TransCanada completed the acquisition of Columbia Pipeline Group (not a Fund holding) and entered into an agreement to connect its Houston terminal to Magellan’s (not a Fund holding) Texas delivery system. Also, TransCanada was awarded a contract to build a $500 million natural gas pipeline in Mexico and was awarded a $1.3 billion contract to expand a natural gas transmission system in Canada. TransCanada also reduced its workforce by approximately 10% in an effort to increase efficiencies.
American Tower is an owner/operator of wireless infrastructure and is structured as a real estate investment trust. During the fiscal year, American Tower announced it would acquire controlling interest in Viom Networks (not a Fund holding), India’s largest independent tower company. At the close of the reporting period, we believed tower companies were favorably positioned from a fundamental standpoint, with positive cash flow growth supported by strong demand driven by continued adoption of smartphones.
The top individual detractors from absolute Fund performance were midstream services companies, given volatility in the energy industry during the fiscal year.
Williams Companies received multiple merger proposals during the last two fiscal years. The first, from Energy Transfer Equity (not a Fund holding), was terminated during the current fiscal year; the second, from Enterprise Products Partners (not a Fund holding), was rejected by Williams and later withdrawn. While we do not select investments solely on the possibility of mergers, we believed these proposals to be a testament to the desirability of Williams’ assets and relative pricing.
Kinder Morgan, the largest energy infrastructure company in America, was among the top absolute detractors from Fund performance despite contributing to the Fund’s relative performance. During the fiscal year, Kinder Morgan announced it would cut its quarterly dividend by 75% in an effort to avoid issuing equity in a lower-stock-price environment. It did so to
fund future natural gas project development and to maintain its investment grade credit rating.
At the close of the reporting period, we believed the lifting of the US crude oil export ban would likely be a long-term positive for continued US midstream infrastructure build-out. Growth characteristics for midstream services were relatively attractive, in our view. We believed an anticipated increase in US energy production in 2017 and 2018 would likely be positive for midstream services companies, which tend to be influenced more by the volume, rather than the price, of energy.
At the close of the reporting period, the Fund had underweight exposure to the more regulated infrastructure industries – gas distribution, electric utilities and water – while the Fund had overweight allocations to more competitive and user-pay industries – towers, satellites and midstream services, where growth characteristics remain relatively attractive. In our view, diverging trends in the use of economic stimulus are shaping yield demand and leverage characteristics in individual countries. In general, the Fund remained focused on companies with above-average earnings growth characteristics, sound balance sheets and strategic infrastructure assets that provide a relatively more stable underlying earnings stream.
We thank you for your investment in Invesco Global Infrastructure Fund.
1 Source: Bloomberg
The views and opinions expressed in management’s discussion of Fund performance are those of Invesco Advisers, Inc. These views and opinions are subject to change at any time based on factors such as market and economic conditions. These views and opinions may not be relied upon as investment advice or recommendations, or as an offer for a particular security. The information is not a complete analysis of every aspect of any market, country, industry, security or the Fund. Statements of fact are from sources considered reliable, but Invesco Advisers, Inc. makes no representation or warranty as to their completeness or accuracy. Although historical performance is no guarantee of future results, these insights may help you understand our investment management philosophy.
See important Fund and, if applicable, index disclosures later in this report.
| | |
 | | Joe Rodriguez Jr. Portfolio Manager, is lead manager of Invesco Global Infrastructure Fund. He is Head of Global |
| Securities with Invesco Real Estate, where he oversees all phases of the unit, including securities research and administration. Mr. Rodriguez joined Invesco in 1990. He earned a BBA in economics and finance and an MBA in finance from Baylor University. |
| |
 | | Mark Blackburn Chartered Financial Analyst, Portfolio Manager, is manager of Invesco Global Infrastructure Fund. He |
| joined Invesco in 1998. Mr. Blackburn earned a BS in accounting from Louisiana State University and an MBA from Southern Methodist University. He is also a Certified Public Accountant. |
| |
 | | James Cowen Portfolio Manager, is manager of Invesco Global Infrastructure Fund. He joined Invesco in 2000. Mr. Cowen |
| earned a Master of Town and Country Planning degree from the University of Manchester and a Master of Philosophy degree in land economy from Cambridge University. |
| |
 | | Paul Curbo Chartered Financial Analyst, Portfolio Manager, is manager of Invesco Global Infrastructure Fund. He |
| joined Invesco in 1998. Mr. Curbo earned a BBA in finance from The University of Texas at Austin. |
| |
 | | Darin Turner Portfolio Manager, is manager of Invesco Global Infrastructure Fund. He joined Invesco in 2005. Mr. Turner |
| earned a BBA in finance from Baylor University, an MS in real estate from The University of Texas at Arlington and an MBA specializing in investments from Southern Methodist University. |
| |
 | | Ping Ying Wang Chartered Financial Analyst, Portfolio Manager, is manager of Invesco Global Infrastructure Fund. She |
| joined Invesco in 1998. Ms. Wang earned a BS in international finance from the People’s University of China and a PhD in finance from The University of Texas at Dallas. |
5 Invesco Global Infrastructure Fund
Your Fund’s Long-Term Performance
Results of a $10,000 Investment – Oldest Share Class(es) since inception
Fund and index data from 5/2/14

| 1 | Source: FactSet Research Systems Inc. |
Past performance cannot guarantee comparable future results.
The data shown in the chart include reinvested distributions, applicable sales charges and Fund expenses including
management fees. Index results include reinvested dividends, but they do not reflect sales charges. Performance of the peer group, if applicable, reflects fund expenses and management fees; performance
of a market index does not. Performance shown in the chart and table(s) does not reflect deduction of taxes a shareholder would pay on Fund distributions or sale of Fund shares.
continued from page 9
than those of more established companies, and their returns may vary, sometimes significantly, from the overall securities market.
About indexes used in this report
| ∎ | | The MSCI World IndexSM is an unmanaged index considered representative of stocks of developed countries. The index is computed using the net return, which withholds applicable taxes for non-resident investors. |
| ∎ | | The Dow Jones Brookfield Global Infrastructure Index is designed to measure the stock performance of infrastructure companies domiciled globally and covers all sectors of the infrastructure market. |
| ∎ | | The Lipper Global Infrastructure Funds Classification Average represents an average of all of the funds in the Lipper Global Infrastructure Funds classification. |
| ∎ | | The Fund is not managed to track the performance of any particular index, including the index(es) described here, and consequently, the performance of the Fund may deviate significantly from the performance of the index(es). |
| ∎ | | A direct investment cannot be made in an index. Unless otherwise indicated, index results include reinvested dividends, and they do not reflect sales charges. Performance of the peer group, if applicable, reflects fund expenses; performance of a market index does not. |
Other information
| ∎ | | CPA® and Certified Public Accountant® are trademarks owned by the American Institute of Certified Public Accountants. |
| ∎ | | The returns shown in management’s discussion of Fund performance are based on net asset values (NAVs) calculated for shareholder transactions. Generally accepted accounting principles require adjustments to be made to the net assets of the Fund at period end for financial reporting purposes, and as such, the NAVs for shareholder transactions and the returns based on those NAVs may differ from the NAVs and returns reported in the Financial Highlights. |
6 Invesco Global Infrastructure Fund
| | | | |
| Average Annual Total Returns | |
| As of 10/31/16, including maximum applicable sales charges | |
| |
Class A Shares | | | | |
Inception (5/2/14) | | | -2.00 | % |
1 Year | | | -2.62 | |
| |
Class C Shares | | | | |
Inception (5/2/14) | | | -0.53 | % |
1 Year | | | 1.24 | |
| |
Class R Shares | | | | |
Inception (5/2/14) | | | -0.04 | % |
1 Year | | | 2.76 | |
| |
Class Y Shares | | | | |
Inception (5/2/14) | | | 0.46 | % |
1 Year | | | 3.27 | |
| |
Class R5 Shares | | | | |
Inception (5/2/14) | | | 0.46 | % |
1 Year | | | 3.27 | |
| |
Class R6 Shares | | | | |
Inception (5/2/14) | | | 0.46 | % |
1 Year | | | 3.27 | |
The performance data quoted represent past performance and cannot guarantee comparable future results; current performance may be lower or higher. Please visit invesco.com/performance for the most recent month-end performance. Performance figures reflect reinvested distributions, changes in net asset value and the effect of the maximum sales charge unless otherwise stated. Investment return and principal value will fluctuate so that you may have a gain or loss when you sell shares.
The net annual Fund operating expense ratio set forth in the most recent Fund prospectus as of the date of this report for Class A, Class C, Class R, Class Y, Class R5 and Class R6 shares was 1.40%, 2.15%, 1.65%, 1.15%, 1.15% and 1.15%, respectively.1 The total annual Fund operating expense ratio set forth in the most recent Fund prospectus as of the date of this report for Class A, Class C, Class R, Class Y, Class R5 and Class R6 shares was 6.36%, 7.11%, 6.61%, 6.11%, 6.00% and 6.00%, respectively. The expense ratios presented above may vary from the expense ratios presented in other sections of this report that are based on expenses incurred during the period covered by this report.
Class A share performance reflects the maximum 5.50% sales charge, and Class C share performance reflects the applicable contingent deferred sales
| | | | |
| Average Annual Total Returns | |
| As of 9/30/16, the most recent calendar quarter end, including maximum applicable sales charges | |
| |
Class A Shares | | | | |
Inception (5/2/14) | | | -0.57 | % |
1 Year | | | 6.65 | |
| |
Class C Shares | | | | |
Inception (5/2/14) | | | 1.02 | % |
1 Year | | | 10.98 | |
| |
Class R Shares | | | | |
Inception (5/2/14) | | | 1.54 | % |
1 Year | | | 12.52 | |
| |
Class Y Shares | | | | |
Inception (5/2/14) | | | 2.02 | % |
1 Year | | | 13.09 | |
| |
Class R5 Shares | | | | |
Inception (5/2/14) | | | 2.02 | % |
1 Year | | | 13.09 | |
| |
Class R6 Shares | | | | |
Inception (5/2/14) | | | 2.02 | % |
1 Year | | | 13.09 | |
charge (CDSC) for the period involved. The CDSC on Class C shares is 1% for the first year after purchase. Class R, Class Y, Class R5 and Class R6 class shares do not have a front-end sales charge or a CDSC; therefore, performance is at net asset value.
The performance of the Fund’s share classes will differ primarily due to different sales charge structures and class expenses.
Fund performance reflects any applicable fee waivers and/or expense reimbursements. Had the adviser not waived fees and/or reimbursed expenses currently or in the past, returns would have been lower. See current prospectus for more information.
| 1 | Total annual Fund operating expenses after any contractual fee waivers and/or expense reimbursements by the adviser in effect through at least February 28, 2017. See current prospectus for more information. |
7 Invesco Global Infrastructure Fund
Invesco Global Infrastructure Fund’s investment objective is total return through growth of capital and current income.
| ∎ | | Unless otherwise stated, information presented in this report is as of October 31, 2016, and is based on total net assets. |
| ∎ | | Unless otherwise noted, all data provided by Invesco. |
| ∎ | | To access your Fund’s reports/prospectus, visit invesco.com/fundreports. |
About share classes
| ∎ | | Class R shares are generally available only to employer sponsored retirement and benefit plans. Please see the prospectus for more information. |
| ∎ | | Class Y shares are available only to certain investors. Please see the prospectus for more information. |
| ∎ | | Class R5 shares and Class R6 shares are primarily intended for employer sponsored retirement and benefit plans that meet certain standards and for institutional investors. Please see the prospectus for more information. |
Principal risks of investing
in the Fund
| ∎ | | Debt securities risk. The prices of debt securities held by the Fund will be affected by changes in interest rates, the creditworthiness of the issuer and other factors. An increase in prevailing interest rates typically causes the value of existing debt securities to fall and often has a greater impact on longer-duration debt securities and higher quality debt securities. Falling interest rates will cause the Fund to reinvest the proceeds of debt securities that have been repaid by the issuer at lower interest rates. Falling interest rates may also reduce the Fund’s distributable income because interest payments on floating rate debt instruments held by the Fund will decline. The Fund could lose money on investments in debt securities if the issuer or borrower fails to meet its obligations to make interest payments and/or to repay principal in a timely manner. Changes in an issuer’s financial strength, the market’s perception of such strength or in the credit rating of the issuer or the security may affect the value of debt securities. The Adviser’s credit analysis may fail to anticipate such changes, which could result in buying a debt security at an inopportune time or failing to sell a debt security in advance of a price decline or other credit event. |
| ∎ | | Depositary receipts risk. Investing in depositary receipts involves the same risks as direct investments in foreign securities. In addition, the underlying issuers of certain depositary receipts are under no obligation to distribute shareholder communications or pass through any voting rights with respect to the deposited securities to the holders of such receipts. The Fund may therefore receive less timely information or have less control than if it invested directly in the foreign issuer. |
| ∎ | | Derivatives risk. The value of a derivative instrument depends largely on (and is derived from) the value of an underlying security, currency, commodity, interest rate, index or other asset (each referred to as an underlying asset). In addition to risks relating to the underlying assets, the use of derivatives may include other, possibly greater, risks, including counterparty, leverage and liquidity risks. Counterparty risk is the risk that the counterparty to the derivative contract will default on its obligation to pay the Fund the amount owed or otherwise perform under the derivative contract. Derivatives create leverage risk because they do not require payment up front equal to the economic exposure created by owning the derivative. As a result, an adverse change in the value of the underlying asset could result in the Fund sustaining a loss that is substantially greater than the amount invested in the derivative, which may make the Fund’s returns more volatile and increase the risk of loss. Derivative instruments may also be less liquid than more traditional investments and the Fund may be unable to sell or close out its derivative positions at a desirable time or price. This risk may be more acute under adverse market conditions, during which the Fund may be most in need of liquidating its derivative positions. Derivatives may also be harder to value, less tax efficient and subject to changing government regulation |
| | | that could impact the Fund’s ability to use certain derivatives or their cost. Also, derivatives used for hedging or to gain or limit exposure to a particular market segment may not provide the expected benefits, particularly during adverse market conditions. |
| ∎ | | Emerging markets securities risk. Emerging markets (also referred to as developing markets) are generally subject to greater market volatility, political, social and economic instability, uncertain trading markets and more governmental limitations on foreign investment than more developed markets. In addition, emerging markets may be subject to lower trading volume and greater price fluctuations than companies in more developed markets. Securities law and the enforcement of systems of taxation in many emerging market countries may change quickly and unpredictably. In addition, investments in emerging markets securities may also be subject to additional transaction costs, delays in settlement procedures, and lack of timely information. |
| ∎ | | Foreign securities risk. The Fund’s foreign investments may be adversely affected by political and social instability, changes in economic or taxation policies, difficulty in enforcing obligations, decreased liquidity or increased volatility. Foreign investments also involve the risk of the possible seizure, nationalization or expropriation of the issuer or foreign deposits (in which the Fund could lose its entire investments in a certain market) and the possible adoption of foreign governmental restrictions such as exchange controls. Unless the Fund has hedged its foreign securities risk, foreign securities risk also involves the risk of negative foreign currency rate fluctuations, which may cause the value of securities denominated in such foreign currency (or other instruments through which the Fund has exposure to foreign currencies) to decline in value. Currency exchange rates may fluctuate significantly over short periods of time. Currency hedging strategies, if used, are not always successful. |
| ∎ | | Geographic focus risk. The Fund may from time to time invest a substantial amount of its assets in securities of issuers located in a single country or a |
|
This report must be accompanied or preceded by a currently effective Fund prospectus, which contains more complete information, including sales charges and expenses. Investors should read it carefully before investing. |
|
NOT FDIC INSURED | MAY LOSE VALUE | NO BANK GUARANTEE |
8 Invesco Global Infrastructure Fund
limited number of countries. Adverse economic, political or social conditions in those countries may therefore have a significant negative impact on the Fund’s investment performance.
| ∎ | | High yield debt securities (junk bond) risk. Investments in high yield debt securities (“junk bonds”) and other lower-rated securities will subject the Fund to substantial risk of loss. These securities are considered to be speculative with respect to the issuer’s ability to pay interest and principal when due, are more susceptible to default or decline in market value and are less liquid than investment grade debt securities. Prices of high yield debt securities tend to be very volatile. |
| ∎ | | Infrastructure-related companies risk. The Fund will concentrate its investments in the infrastructure industry. Infrastructure-related companies are subject to a variety of risk factors, including costs associated with environmental, governmental and other regulations, high interest costs for capital construction programs, high leverage, the effects of economic slowdowns, surplus capacity, increased competition, fluctuations of fuel prices, the effects of energy conservation policies, unfavorable tax laws or accounting policies, environmental damage, difficulty in raising capital, increased susceptibility to terrorist acts or political actions, and general changes in market sentiment towards infrastructure assets. |
| ∎ | | Management risk. The Fund is actively managed and depends heavily on the Adviser’s judgment about markets, interest rates or the attractiveness, relative values, liquidity, or potential appreciation of particular investments made for the Fund’s portfolio. The Fund could experience losses if these judgments prove to be incorrect. Additionally, legislative, regulatory, or tax developments may adversely affect management of the Fund and, therefore, the ability of the Fund to achieve its investment objective. |
| ∎ | | Market risk. The market values of the Fund’s investments, and therefore the value of the Fund’s shares, will go up and down, sometimes rapidly or unpredictably. Market risk may affect a single issuer, industry or section of the economy, or it may affect the market as a |
| | | whole. Individual stock prices tend to go up and down more dramatically than those of certain other types of investments, such as bonds. During a general downturn in the financial markets, multiple asset classes may decline in value. When markets perform well, there can be no assurance that specific investments held by the Fund will rise in value. |
| ∎ | | MLP Risk. The Fund invests in securities of MLPs, which are subject to the following risks: |
| | – | Limited partner risk. An MLP is a public limited partnership or limited liability company taxed as a partnership under the Code. Although the characteristics of MLPs closely resemble a traditional limited partnership, a major difference is that MLPs may trade on a public exchange or in the over-the-counter market. The risks of investing in an MLP are similar to those of investing in a partnership, including more flexible governance structures, which could result in less protection for investors than investments in a corporation. Investors in an MLP normally would not be liable for the debts of the MLP beyond the amount that the investor has contributed but investors may not be shielded to the same extent that a shareholder of a corporation would be. In certain circumstances, creditors of an MLP would have the right to seek return of capital distributed to a limited partner, which right would continue after an investor sold its investment in the MLP. |
| | – | Liquidity risk. The ability to trade on a public exchange or in the over-the-counter market provides a certain amount of liquidity not found in many limited partnership investments. However, MLP interests may be less liquid than conventional publicly traded securities and, therefore, more difflcult to trade at desirable times and/or prices. |
| | – | Interest rate risk. In addition, MLP distributions may be reduced by fees and other expenses incurred by the MLP. MLPs generally are considered interest-rate sensitive investments. During periods of interest rate volatility, these investments may not provide attractive returns. |
| | – | General partner risk. The holder of the general partner or managing member interest can be liable in certain circumstances for amounts greater than the amount of the holder’s investment in the general partner or managing member. |
Additionally, if the Fund were to invest more than 25% of its total assets in MLPs that are taxed as partnerships this could cause the Fund to lose its status as regulated investment company under Subchapter M of the Internal Revenue Code.
| ∎ | | MLP tax risk. MLPs taxed as partnerships do not pay US federal income tax at the partnership level. A change in current tax law, or a change in the underlying business mix of a given MLP, however, could result in an MLP being classified as a corporation for US federal income tax purposes, which would have the effect of reducing the amount of cash available for distribution by the MLP and, as a result, could cause a reduction of the value of the Fund’s investment, and consequently your investment in the Fund and lower income. Each year, the Fund will send you an annual tax statement (Form 1099) to assist you in completing your federal, state and local tax returns. If an MLP in which the Fund invests amends its partnership tax return, the Fund will, when necessary, send you a corrected Form 1099, which could, in turn, require you to amend your federal, state or local tax returns. |
| ∎ | | Non-diversification risk. The Fund is non-diversified and can invest a greater portion of its assets in the obligations or securities of a small number of issuers or any single issuer than a diversified fund can. A change in the value of one or a few issuers’ securities will therefore affect the value of the Fund more than if it was a diversified fund. |
| ∎ | | Small- and mid-capitalization companies risks. Small- and mid-capitalization companies tend to be more vulnerable to changing market conditions, may have little or no operating history or track record of success, and may have more limited product lines and markets, less experienced management and fewer financial resources than larger companies. These companies’ securities may be more volatile and less liquid |
continued on page 6
9 Invesco Global Infrastructure Fund
Schedule of Investments
October 31, 2016
| | | | | | | | |
| | | Shares | | | Value | |
Common Stocks & Other Equity Interests–98.74% | |
| Australia–5.16% | |
APA Group | | | 12,833 | | | $ | 77,546 | |
Macquarie Atlas Roads Group | | | 10,753 | | | | 38,538 | |
Spark Infrastructure Group | | | 80,264 | | | | 135,270 | |
Sydney Airport | | | 10,326 | | | | 49,042 | |
Transurban Group | | | 27,328 | | | | 215,529 | |
| | | | | | | | 515,925 | |
|
| Canada��14.98% | |
Enbridge Inc. | | | 10,891 | | | | 470,313 | |
Fortis, Inc. | | | 6,028 | | | | 198,435 | |
Keyera Corp. | | | 1,397 | | | | 41,933 | |
Pembina Pipeline Corp. | | | 8,111 | | | | 249,211 | |
TransCanada Corp. | | | 11,343 | | | | 513,511 | |
Veresen Inc. | | | 2,566 | | | | 23,245 | |
| | | | | | | | 1,496,648 | |
|
| China–2.96% | |
Beijing Capital International Airport Co. Ltd.–Class H | | | 34,000 | | | | 35,642 | |
Beijing Enterprises Holdings Ltd. | | | 4,500 | | | | 22,473 | |
Beijing Enterprises Water Group Ltd. | | | 48,000 | | | | 34,845 | |
China Merchants Port Holdings Co. Ltd. | | | 16,000 | | | | 41,414 | |
China Resources Gas Group Ltd. | | | 15,335 | | | | 48,148 | |
ENN Energy Holdings Ltd. | | | 14,000 | | | | 65,889 | |
Jiangsu Expressway Co. Ltd.–Class H | | | 14,000 | | | | 19,063 | |
Shenzhen Expressway Co. Ltd.–Class H | | | 28,000 | | | | 28,084 | |
| | | | | | | | 295,558 | |
|
| France–2.26% | |
Aéroports de Paris | | | 501 | | | | 50,603 | |
Eiffage S.A. | | | 618 | | | | 45,783 | |
Eutelsat Communications S.A. | | | 763 | | | | 15,998 | |
Groupe Eurotunnel SE | | | 6,812 | | | | 63,701 | |
Vinci S.A. | | | 694 | | | | 50,172 | |
| | | | | | | | 226,257 | |
|
| Hong Kong–1.27% | |
China Gas Holdings Ltd. | | | 12,000 | | | | 18,289 | |
Hong Kong & China Gas Co., Ltd. (The) | | | 55,320 | | | | 108,422 | |
| | | | | | | | 126,711 | |
|
| Italy–3.43% | |
Atlantia S.p.A. | | | 5,836 | | | | 143,099 | |
Infrastrutture Wireless Italiane S.p.A.–REGS(a) | | | 6,459 | | | | 30,560 | |
Snam S.p.A. | | | 31,954 | | | | 168,626 | |
| | | | | | | | 342,285 | |
|
| Japan–1.62% | |
Japan Airport Terminal Co., Ltd. | | | 800 | | | | 30,782 | |
Tokyo Gas Co., Ltd. | | | 29,000 | | | | 131,481 | |
| | | | | | | | 162,263 | |
| | | | | | | | |
| | | Shares | | | Value | |
| Luxembourg–1.99% | |
SES S.A. | | | 8,665 | | | $ | 199,276 | |
|
| Mexico–0.87% | |
Grupo Aeroportuario del Centro Norte, S.A.B. de C.V.–ADR | | | 1,252 | | | | 58,468 | |
Grupo Aeroportuario del Sureste S.A.B. de C.V.–ADR | | | 177 | | | | 28,143 | |
| | | | | | | | 86,611 | |
|
| New Zealand–0.53% | |
Auckland International Airport Ltd. | | | 11,267 | | | | 53,092 | |
|
| Spain–5.79% | |
Aena S.A.–REGS(a) | | | 539 | | | | 79,138 | |
Cellnex Telecom S.A.–REGS(a) | | | 3,458 | | | | 56,788 | |
Ferrovial S.A. | | | 12,756 | | | | 247,935 | |
Ferrovial, S.A.–Rts.(b) | | | 12,346 | | | | 5,286 | |
Red Eléctrica Corp. S.A. | | | 9,079 | | | | 189,172 | |
| | | | | | | | 578,319 | |
|
| Switzerland–0.47% | |
Flughafen Zürich AG | | | 253 | | | | 46,472 | |
|
| United Kingdom–9.07% | |
National Grid PLC | | | 52,362 | | | | 681,883 | |
Severn Trent PLC | | | 2,440 | | | | 69,433 | |
United Utilities Group PLC | | | 13,503 | | | | 155,114 | |
| | | | | | | | 906,430 | |
|
| United States–48.34% | |
American Tower Corp.–Class A | | | 5,370 | | | | 629,310 | |
American Water Works Co., Inc. | | | 1,941 | | | | 143,712 | |
Aqua America Inc. | | | 3,281 | | | | 100,727 | |
Atmos Energy Corp. | | | 2,598 | | | | 193,265 | |
Cheniere Energy, Inc.(b) | | | 2,549 | | | | 96,097 | |
Consolidated Edison, Inc. | | | 486 | | | | 36,717 | |
Crown Castle International Corp. | | | 4,018 | | | | 365,598 | |
Dominion Resources, Inc. | | | 342 | | | | 25,718 | |
Enbridge Energy Partners, L.P. | | | 1,866 | | | | 45,997 | |
Eversource Energy | | | 3,031 | | | | 166,887 | |
Kinder Morgan Inc. | | | 28,845 | | | | 589,303 | |
NextEra Energy, Inc. | | | 737 | | | | 94,336 | |
NiSource Inc. | | | 2,241 | | | | 52,126 | |
OGE Energy Corp. | | | 3,254 | | | | 101,004 | |
ONE Gas, Inc. | | | 651 | | | | 39,893 | |
ONEOK, Inc. | | | 1,655 | | | | 80,152 | |
Pattern Energy Group Inc. | | | 2,256 | | | | 50,422 | |
PG&E Corp. | | | 9,322 | | | | 579,083 | |
SBA Communications Corp.–Class A(b) | | | 1,579 | | | | 178,869 | |
SemGroup Corp.–Class A | | | 1,621 | | | | 52,277 | |
Sempra Energy | | | 3,920 | | | | 419,832 | |
Southwest Gas Corp. | | | 592 | | | | 42,896 | |
See accompanying Notes to Financial Statements which are an integral part of the financial statements.
10 Invesco Global Infrastructure Fund
| | | | | | | | |
| | | Shares | | | Value | |
| United States–(continued) | |
Spectra Energy Corp. | | | 8,495 | | | $ | 355,176 | |
Targa Resources Corp. | | | 2,184 | | | | 95,878 | |
Williams Cos., Inc. (The) | | | 10,088 | | | | 294,570 | |
| | | | | | | | 4,829,845 | |
Total Common Stocks & Other Equity Interests (Cost $9,320,571) | | | | 9,865,692 | |
| | |
Money Market Funds–4.96% | | | | | | | | |
Government & Agency Portfolio–Institutional Class, 0.29%(c) | | | 297,308 | | | | 297,308 | |
Treasury Portfolio–Institutional Class, 0.22%(c) | | | 198,206 | | | | 198,206 | |
Total Money Market Funds
(Cost $495,514) | | | | 495,514 | |
TOTAL INVESTMENTS–103.70%
(Cost $9,816,085) | | | | 10,361,206 | |
OTHER ASSETS LESS LIABILITIES–(3.70)% | | | | (369,781 | ) |
NET ASSETS–100.00% | | | $ | 9,991,425 | |
Investment Abbreviations:
| | |
| ADR | | – American Depositary Receipt |
| REGS | | – Regulation S |
| Rts. | | – Rights |
Notes to Schedule of Investments:
| (a) | Security purchased or received in a transaction exempt from registration under the Securities Act of 1933, as amended (the “1933 Act”). The security may be resold pursuant to an exemption from registration under the 1933 Act, typically to qualified institutional buyers. The aggregate value of these securities at October 31, 2016 was $166,486, which represented 1.67% of the Fund’s Net Assets. |
| (b) | Non-income producing security. |
| (c) | The money market fund and the Fund are affiliated by having the same investment adviser. The rate shown is the 7-day SEC standardized yield as of October 31, 2016. |
See accompanying Notes to Financial Statements which are an integral part of the financial statements.
11 Invesco Global Infrastructure Fund
Statement of Assets and Liabilities
October 31, 2016
| | | | |
Assets: | |
Investments, at value (Cost $9,320,571) | | $ | 9,865,692 | |
Investments in affiliated money market funds, at value and cost | | | 495,514 | |
Total investments, at value (Cost $9,816,085) | | | 10,361,206 | |
Foreign currencies, at value (Cost $42,707) | | | 42,541 | |
Receivable for: | | | | |
Investments sold | | | 137,414 | |
Fund shares sold | | | 33,654 | |
Dividends | | | 9,767 | |
Fund expenses absorbed | | | 42,750 | |
Investment for trustee deferred compensation and retirement plans | | | 5,148 | |
Other assets | | | 16,418 | |
Total assets | | | 10,648,898 | |
|
Liabilities: | |
Payable for: | | | | |
Investments purchased | | | 564,663 | |
Fund shares reacquired | | | 18,676 | |
Accrued fees to affiliates | | | 4,344 | |
Accrued trustees’ and officers’ fees and benefits | | | 1,752 | |
Accrued other operating expenses | | | 62,890 | |
Trustee deferred compensation and retirement plans | | | 5,148 | |
Total liabilities | | | 657,473 | |
Net assets applicable to shares outstanding | | $ | 9,991,425 | |
|
Net assets consist of: | |
Shares of beneficial interest | | $ | 10,423,395 | |
Undistributed net investment income | | | 13,008 | |
Undistributed net realized gain (loss) | | | (989,788 | ) |
Net unrealized appreciation | | | 544,810 | |
| | | $ | 9,991,425 | |
| | | | |
Net Assets: | |
Class A | | $ | 4,193,751 | |
Class C | | $ | 427,754 | |
Class R | | $ | 69,129 | |
Class Y | | $ | 5,176,900 | |
Class R5 | | $ | 9,630 | |
Class R6 | | $ | 114,261 | |
|
Shares outstanding, $0.01 par value per share,
with an unlimited number of shares authorized: | |
Class A | | | 436,132 | |
Class C | | | 44,578 | |
Class R | | | 7,193 | |
Class Y | | | 538,230 | |
Class R5 | | | 1,001 | |
Class R6 | | | 11,879 | |
Class A: | | | | |
Net asset value per share | | $ | 9.62 | |
Maximum offering price per share | | | | |
(Net asset value of $9.62 ¸ 94.50%) | | $ | 10.18 | |
Class C: | | | | |
Net asset value and offering price per share | | $ | 9.60 | |
Class R: | | | | |
Net asset value and offering price per share | | $ | 9.61 | |
Class Y: | | | | |
Net asset value and offering price per share | | $ | 9.62 | |
Class R5: | | | | |
Net asset value and offering price per share | | $ | 9.62 | |
Class R6: | | | | |
Net asset value and offering price per share | | $ | 9.62 | |
See accompanying Notes to Financial Statements which are an integral part of the financial statements.
12 Invesco Global Infrastructure Fund
Statement of Operations
For the year ended October 31, 2016
| | | | |
Investment income: | |
Dividends (net of foreign withholding taxes of $14,161) | | $ | 262,079 | |
Dividends from affiliated money market funds | | | 436 | |
Total investment income | | | 262,515 | |
| |
Expenses: | | | | |
Advisory fees | | | 69,795 | |
Administrative services fees | | | 50,000 | |
Custodian fees | | | 27,514 | |
Distribution fees: | | | | |
Class A | | | 8,757 | |
Class C | | | 3,263 | |
Class R | | | 212 | |
Transfer agent fees — A, C, R and Y | | | 14,517 | |
Transfer agent fees — R5 | | | 15 | |
Transfer agent fees — R6 | | | 129 | |
Trustees’ and officers’ fees and benefits | | | 19,096 | |
Registration and filing fees | | | 69,257 | |
Reports to shareholders | | | 16,293 | |
Professional services fees | | | 53,628 | |
Other | | | 15,695 | |
Total expenses | | | 348,171 | |
Less: Fees waived and expenses reimbursed | | | (240,545 | ) |
Net expenses | | | 107,626 | |
Net investment income | | | 154,889 | |
| |
Realized and unrealized gain (loss) from: | | | | |
Net realized gain (loss) from: | | | | |
Investment securities | | | (443,800 | ) |
Foreign currencies | | | (1,164 | ) |
| | | | (444,964 | ) |
Change in net unrealized appreciation (depreciation) of: | | | | |
Investment securities | | | 550,819 | |
Foreign currencies | | | (330 | ) |
| | | | 550,489 | |
Net realized and unrealized gain | | | 105,525 | |
Net increase in net assets resulting from operations | | $ | 260,414 | |
See accompanying Notes to Financial Statements which are an integral part of the financial statements.
13 Invesco Global Infrastructure Fund
Statement of Changes in Net Assets
For the years ended October 31, 2016 and 2015
| | | | | | | | |
| | | 2016 | | | 2015 | |
Operations: | | | | | | | | |
Net investment income | | $ | 154,889 | | | $ | 116,315 | |
Net realized gain (loss) | | | (444,964 | ) | | | (552,937 | ) |
Change in net unrealized appreciation (depreciation) | | | 550,489 | | | | (237,868 | ) |
Net increase (decrease) in net assets resulting from operations | | | 260,414 | | | | (674,490 | ) |
| | |
Distributions to shareholders from net investment income: | | | | | | | | |
Class A | | | (58,780 | ) | | | (60,858 | ) |
Class C | | | (3,050 | ) | | | (3,618 | ) |
Class R | | | (583 | ) | | | (312 | ) |
Class Y | | | (83,322 | ) | | | (67,818 | ) |
Class R5 | | | (179 | ) | | | (240 | ) |
Class R6 | | | (1,566 | ) | | | (1,238 | ) |
Total distributions from net investment income | | | (147,480 | ) | | | (134,084 | ) |
| | |
Distributions to shareholders from net realized gains: | | | | | | | | |
Class A | | | — | | | | (2,842 | ) |
Class C | | | — | | | | (250 | ) |
Class R | | | — | | | | (17 | ) |
Class Y | | | — | | | | (2,396 | ) |
Class R5 | | | — | | | | (11 | ) |
Class R6 | | | — | | | | (50 | ) |
Total distributions from net realized gains | | | — | | | | (5,566 | ) |
| | |
Share transactions–net: | | | | | | | | |
Class A | | | 896,696 | | | | 1,132,351 | |
Class C | | | 142,834 | | | | 135,558 | |
Class R | | | 40,880 | | | | 15,617 | |
Class Y | | | 885,878 | | | | 2,334,806 | |
Class R6 | | | 43,676 | | | | 36,561 | |
Net increase in net assets resulting from share transactions | | | 2,009,964 | | | | 3,654,893 | |
Net increase in net assets | | | 2,122,898 | | | | 2,840,753 | |
| | |
Net assets: | | | | | | | | |
Beginning of year | | | 7,868,527 | | | | 5,027,774 | |
End of year (includes undistributed net investment income of $13,008 and $1,429, respectively) | | $ | 9,991,425 | | | $ | 7,868,527 | |
Notes to Financial Statements
October 31, 2016
NOTE 1—Significant Accounting Policies
Invesco Global Infrastructure Fund (the “Fund”) is a series portfolio of AIM Investment Funds (Invesco Investment Funds) (the “Trust”). The Trust is organized as a Delaware statutory trust and is registered under the Investment Company Act of 1940, as amended (the “1940 Act”), as an open-end series management investment company consisting of twenty-two separate series portfolios, each authorized to issue an unlimited number of shares of beneficial interest. The assets, liabilities and operations of each portfolio are accounted for separately. Information presented in these financial statements pertains only to the Fund. Matters affecting each portfolio or class will be voted on exclusively by the shareholders of such portfolio or class.
The Fund’s investment objective is total return through growth of capital and current income.
The Fund currently consists of six different classes of shares: Class A, Class C, Class R, Class Y, Class R5 and Class R6. Class Y shares are available only to certain investors. Class A shares are sold with a front-end sales charge unless certain waiver criteria are met and under certain circumstances load waived shares may be subject to contingent deferred sales charges (“CDSC”). Class C shares are sold with a CDSC. Class R, Class Y, Class R5 and Class R6 shares are sold at net asset value.
The following is a summary of the significant accounting policies followed by the Fund in the preparation of its financial statements.
| A. | Security Valuations — Securities, including restricted securities, are valued according to the following policy. |
14 Invesco Global Infrastructure Fund
A security listed or traded on an exchange (except convertible securities) is valued at its last sales price or official closing price as of the close of the customary trading session on the exchange where the security is principally traded, or lacking any sales or official closing price on a particular day, the security may be valued at the closing bid price on that day. Securities traded in the over-the-counter market are valued based on prices furnished by independent pricing services or market makers. When such securities are valued by an independent pricing service they may be considered fair valued. Futures contracts are valued at the final settlement price set by an exchange on which they are principally traded. Listed options are valued at the mean between the last bid and asked prices from the exchange on which they are principally traded. Options not listed on an exchange are valued by an independent source at the mean between the last bid and asked prices. For purposes of determining net asset value (“NAV”) per share, futures and option contracts generally are valued 15 minutes after the close of the customary trading session of the New York Stock Exchange (“NYSE”).
Investments in open-end and closed-end registered investment companies that do not trade on an exchange are valued at the end-of-day net asset value per share. Investments in open-end and closed-end registered investment companies that trade on an exchange are valued at the last sales price or official closing price as of the close of the customary trading session on the exchange where the security is principally traded.
Debt obligations (including convertible securities) and unlisted equities are fair valued using an evaluated quote provided by an independent pricing service. Evaluated quotes provided by the pricing service may be determined without exclusive reliance on quoted prices, and may reflect appropriate factors such as institution-size trading in similar groups of securities, developments related to specific securities, dividend rate (for unlisted equities), yield (for debt obligations), quality, type of issue, coupon rate (for debt obligations), maturity (for debt obligations), individual trading characteristics and other market data. Debt obligations are subject to interest rate and credit risks. In addition, all debt obligations involve some risk of default with respect to interest and/or principal payments.
Foreign securities’ (including foreign exchange contracts) prices are converted into U.S. dollar amounts using the applicable exchange rates as of the close of the NYSE. If market quotations are available and reliable for foreign exchange-traded equity securities, the securities will be valued at the market quotations. Because trading hours for certain foreign securities end before the close of the NYSE, closing market quotations may become unreliable. If between the time trading ends on a particular security and the close of the customary trading session on the NYSE, events occur that the Adviser determines are significant and make the closing price unreliable, the Fund may fair value the security. If the event is likely to have affected the closing price of the security, the security will be valued at fair value in good faith using procedures approved by the Board of Trustees. Adjustments to closing prices to reflect fair value may also be based on a screening process of an independent pricing service to indicate the degree of certainty, based on historical data, that the closing price in the principal market where a foreign security trades is not the current value as of the close of the NYSE. Foreign securities’ prices meeting the approved degree of certainty that the price is not reflective of current value will be priced at the indication of fair value from the independent pricing service. Multiple factors may be considered by the independent pricing service in determining adjustments to reflect fair value and may include information relating to sector indices, American Depositary Receipts and domestic and foreign index futures. Foreign securities may have additional risks including exchange rate changes, potential for sharply devalued currencies and high inflation, political and economic upheaval, the relative lack of issuer information, relatively low market liquidity and the potential lack of strict financial and accounting controls and standards.
Securities for which market prices are not provided by any of the above methods may be valued based upon quotes furnished by independent sources. The last bid price may be used to value equity securities. The mean between the last bid and asked prices is used to value debt obligations, including corporate loans.
Securities for which market quotations are not readily available or became unreliable are valued at fair value as determined in good faith by or under the supervision of the Trust��s officers following procedures approved by the Board of Trustees. Issuer specific events, market trends, bid/asked quotes of brokers and information providers and other market data may be reviewed in the course of making a good faith determination of a security’s fair value.
The Fund may invest in securities that are subject to interest rate risk, meaning the risk that the prices will generally fall as interest rates rise and, conversely, the prices will generally rise as interest rates fall. Specific securities differ in their sensitivity to changes in interest rates depending on their individual characteristics. Changes in interest rates may result in increased market volatility, which may affect the value and/or liquidity of certain Fund investments.
Valuations change in response to many factors including the historical and prospective earnings of the issuer, the value of the issuer’s assets, general economic conditions, interest rates, investor perceptions and market liquidity. Because of the inherent uncertainties of valuation, the values reflected in the financial statements may materially differ from the value received upon actual sale of those investments.
| B. | Securities Transactions and Investment Income — Securities transactions are accounted for on a trade date basis. Realized gains or losses on sales are computed on the basis of specific identification of the securities sold. Interest income (net of withholding tax, if any) is recorded on the accrual basis from settlement date. Dividend income (net of withholding tax, if any) is recorded on the ex-dividend date. |
The Fund may periodically participate in litigation related to Fund investments. As such, the Fund may receive proceeds from litigation settlements. Any proceeds received are included in the Statement of Operations as realized gain (loss) for investments no longer held and as unrealized gain (loss) for investments still held.
Brokerage commissions and mark ups are considered transaction costs and are recorded as an increase to the cost basis of securities purchased and/or a reduction of proceeds on a sale of securities. Such transaction costs are included in the determination of net realized and unrealized gain (loss) from investment securities reported in the Statement of Operations and the Statement of Changes in Net Assets and the net realized and unrealized gains (losses) on securities per share in the Financial Highlights. Transaction costs are included in the calculation of the Fund’s net asset value and, accordingly, they reduce the Fund’s total returns. These transaction costs are not considered operating expenses and are not reflected in net investment income reported in the Statement of Operations and the Statement of Changes in Net Assets, or the net investment income per share and the ratios of expenses and net investment income reported in the Financial Highlights, nor are they limited by any expense limitation arrangements between the Fund and the investment adviser.
The Fund allocates income and realized and unrealized capital gains and losses to a class based on the relative net assets of each class.
| C. | Country Determination — For the purposes of making investment selection decisions and presentation in the Schedule of Investments, the investment adviser may determine the country in which an issuer is located and/or credit risk exposure based on various factors. These factors include the laws of the country under which the issuer is organized, where the issuer maintains a principal office, the country in which the issuer |
15 Invesco Global Infrastructure Fund
| | derives 50% or more of its total revenues and the country that has the primary market for the issuer’s securities, as well as other criteria. Among the other criteria that may be evaluated for making this determination are the country in which the issuer maintains 50% or more of its assets, the type of security, financial guarantees and enhancements, the nature of the collateral and the sponsor organization. Country of issuer and/or credit risk exposure has been determined to be the United States of America, unless otherwise noted. |
| D. | Distributions — Distributions from net investment income, if any, are declared and paid quarterly and are recorded on the ex-dividend date. Distributions from net realized capital gain, if any, are generally declared and paid annually and recorded on the ex-dividend date. The Fund may elect to treat a portion of the proceeds from redemptions as distributions for federal income tax purposes. |
| E. | Master Limited Partnerships - The Fund invests in Master Limited Partnerships (“MLPs”). MLPs are publicly traded partnerships and limited liability companies taxed as partnerships under the Internal Revenue Code of 1986, as amended (the “Internal Revenue Code”). The Fund invests in MLPs engaged in, among other things, the transportation, storage, processing, refining, marketing, exploration, production and mining of minerals and natural resources. The Fund is a partner in each MLP; accordingly, the Fund is required to take into account the Fund’s allocable share of income, gains, losses, deductions, expenses, and tax credits recognized by each MLP. |
MLP’s may be less liquid and subject to more abrupt or erratic price movements than conventional publicly traded securities.
The Fund is non-diversified and will invest in securities of fewer issues than if it were diversified.
| F. | Return of Capital — Distributions received from the Fund’s investments in MLPs generally are comprised of income and return of capital. The Fund records investment income and return of capital based on estimates made at the time such distributions are received. The return of capital portion of the distribution is a reduction to investment income that results in an equivalent reduction in the cost basis of the associated investments and increases net realized gains (losses) and change in unrealized appreciation (depreciation). Such estimates are based on historical information available from each MLP and other industry sources. These estimates will subsequently be revised and may materially differ primarily based on information received from the MLPs after their tax reporting periods are concluded. |
| G. | Federal Income Taxes — The Fund intends to comply with the requirements of Subchapter M of the Internal Revenue Code of 1986, as amended (the “Internal Revenue Code”), necessary to qualify as a regulated investment company and to distribute substantially all of the Fund’s taxable earnings to shareholders. As such, the Fund will not be subject to federal income taxes on otherwise taxable income (including net realized capital gain) that is distributed to shareholders. Therefore, no provision for federal income taxes is recorded in the financial statements. |
The Fund recognizes the tax benefits of uncertain tax positions only when the position is more likely than not to be sustained. Management has analyzed the Fund’s uncertain tax positions and concluded that no liability for unrecognized tax benefits should be recorded related to uncertain tax positions. Management is not aware of any tax positions for which it is reasonably possible that the total amounts of unrecognized tax benefits will change materially in the next 12 months.
The Fund files tax returns in the U.S. Federal jurisdiction and certain other jurisdictions. Generally, the Fund is subject to examinations by such taxing authorities for up to three years after the filing of the return for the tax period.
| H. | Expenses — Fees provided for under the Rule 12b-1 plan of a particular class of the Fund are charged to the operations of such class. Transfer agency fees and expenses and other shareholder recordkeeping fees and expenses attributable to Class R5 and Class R6 are allocated to each share class based on relative net assets. Sub-accounting fees attributable to Class R5 are charged to the operations of the class. Transfer agency fees and expenses and other shareholder recordkeeping fees and expenses relating to all other classes are allocated among those classes based on relative net assets. All other expenses are allocated among the classes based on relative net assets. |
| I. | Accounting Estimates — The preparation of financial statements in conformity with accounting principles generally accepted in the United States of America (“GAAP”) requires management to make estimates and assumptions that affect the reported amounts of assets and liabilities at the date of the financial statements and the reported amounts of revenues and expenses during the reporting period including estimates and assumptions related to taxation. Actual results could differ from those estimates by a significant amount. In addition, the Fund monitors for material events or transactions that may occur or become known after the period-end date and before the date the financial statements are released to print. |
| J. | Indemnifications — Under the Trust’s organizational documents, each Trustee, officer, employee or other agent of the Trust is indemnified against certain liabilities that may arise out of the performance of their duties to the Fund. Additionally, in the normal course of business, the Fund enters into contracts, including the Fund’s servicing agreements, that contain a variety of indemnification clauses. The Fund’s maximum exposure under these arrangements is unknown as this would involve future claims that may be made against the Fund that have not yet occurred. The risk of material loss as a result of such indemnification claims is considered remote. |
| K. | Foreign Currency Translations — Foreign currency is valued at the close of the NYSE based on quotations posted by banks and major currency dealers. Portfolio securities and other assets and liabilities denominated in foreign currencies are translated into U.S. dollar amounts at date of valuation. Purchases and sales of portfolio securities (net of foreign taxes withheld on disposition) and income items denominated in foreign currencies are translated into U.S. dollar amounts on the respective dates of such transactions. The Fund does not separately account for the portion of the results of operations resulting from changes in foreign exchange rates on investments and the fluctuations arising from changes in market prices of securities held. The combined results of changes in foreign exchange rates and the fluctuation of market prices on investments (net of estimated foreign tax withholding) are included with the net realized and unrealized gain or loss from investments in the Statement of Operations. Reported net realized foreign currency gains or losses arise from (1) sales of foreign currencies, (2) currency gains or losses realized between the trade and settlement dates on securities transactions, and (3) the difference between the amounts of dividends, interest, and foreign withholding taxes recorded on the Fund’s books and the U.S. dollar equivalent of the amounts actually received or paid. Net |
16 Invesco Global Infrastructure Fund
| | unrealized foreign currency gains and losses arise from changes in the fair values of assets and liabilities, other than investments in securities at fiscal period end, resulting from changes in exchange rates. |
The Fund may invest in foreign securities, which may be subject to foreign taxes on income, gains on investments or currency repatriation, a portion of which may be recoverable. Foreign taxes, if any, are recorded based on the tax regulations and rates that exist in the foreign markets in which the Fund invests and are shown in the Statement of Operations.
| L. | Forward Foreign Currency Contracts — The Fund may engage in foreign currency transactions either on a spot (i.e. for prompt delivery and settlement) basis, or through forward foreign currency contracts, to manage or minimize currency or exchange rate risk. |
The Fund may also enter into forward foreign currency contracts for the purchase or sale of a security denominated in a foreign currency in order to “lock in” the U.S. dollar price of that security, or the Fund may also enter into forward foreign currency contracts that do not provide for physical settlement of the two currencies, but instead are settled by a single cash payment calculated as the difference between the agreed upon exchange rate and the spot rate at settlement based upon an agreed upon notional amount (non-deliverable forwards). The Fund will set aside liquid assets in an amount equal to the daily mark-to-market obligation for forward foreign currency contracts.
A forward foreign currency contract is an obligation between two parties (“Counterparties”) to purchase or sell a specific currency for an agreed-upon price at a future date. The use of forward foreign currency contracts does not eliminate fluctuations in the price of the underlying securities the Fund owns or intends to acquire but establishes a rate of exchange in advance. Fluctuations in the value of these contracts are measured by the difference in the contract date and reporting date exchange rates and are recorded as unrealized appreciation (depreciation) until the contracts are closed. When the contracts are closed, realized gains (losses) are recorded. Realized and unrealized gains (losses) on the contracts are included in the Statement of Operations. The primary risks associated with forward foreign currency contracts include failure of the Counterparty to meet the terms of the contract and the value of the foreign currency changing unfavorably. These risks may be in excess of the amounts reflected in the Statement of Assets and Liabilities.
NOTE 2—Advisory Fees and Other Fees Paid to Affiliates
The Trust has entered into a master investment advisory agreement with Invesco Advisers, Inc. (the “Adviser” or “Invesco”). Under the terms of the investment advisory agreement, the Fund pays an advisory fee to the Adviser based on the annual rate of the Fund’s average daily net assets as follows:
| | | | | | | | |
| Average Daily Net Assets | | Rate | |
First $2.5 billion | | | 0 | .84% | | | | |
Next $2 billion | | | 0 | .80% | | | | |
Next $3.5 billion | | | 0 | .785% | | | | |
Over $8 billion | | | 0 | .77% | | | | |
For the year ended October 31, 2016, the effective advisory fees incurred by the Fund was 0.84%.
Under the terms of a master sub-advisory agreement between the Adviser and each of Invesco Asset Management Deutschland GmbH, Invesco Asset Management Limited, Invesco Asset Management (Japan) Limited, Invesco Hong Kong Limited, Invesco Senior Secured Management, Inc., Invesco Canada Ltd. and Invesco PowerShares Capital Management LLC (collectively, the “Affiliated Sub-Advisers”) the Adviser, not the Fund, will pay 40% of the fees paid to the Adviser to any such Affiliated Sub-Adviser(s) that provide(s) discretionary investment management services to the Fund based on the percentage of assets allocated to such Affiliated Sub-Adviser(s).
The Adviser has contractually agreed, through at least February 28, 2017, to waive advisory fees and/or reimburse expenses of all shares to the extent necessary to limit total annual fund operating expenses after fee waiver and/or expense reimbursement (excluding certain items discussed below) of Class A, Class C, Class R, Class Y, Class R5 and Class R6 shares to 1.40%, 2.15%, 1.65%, 1.15%, 1.15% and 1.15%, respectively, of average daily net assets (the “expense limits”). In determining the Adviser’s obligation to waive advisory fees and/or reimburse expenses, the following expenses are not taken into account, and could cause the total annual fund operating expenses after fee waiver and/or expense reimbursement to exceed the numbers reflected above: (1) interest; (2) taxes; (3) dividend expense on short sales; (4) extraordinary or non-routine items, litigation expenses; and (5) expenses that the Fund has incurred but did not actually pay because of an expense offset arrangement. Unless Invesco continues the fee waiver agreement, it will terminate on February 28, 2017. During its term, the fee waiver agreement cannot be terminated or amended to increase the expense limits without approval of the Board of Trustees.
Further, the Adviser has contractually agreed, through at least June 30, 2018, to waive the advisory fee payable by the Fund in an amount equal to 100% of the net advisory fees the Adviser receives from the affiliated money market funds on investments by the Fund of uninvested cash in such affiliated money market funds.
For the year ended October 31, 2016, the Adviser waived advisory fees and reimbursed fund level expenses of $225,884 and reimbursed class level expenses of $6,188, $576, $75, $7,678, $15 and $129 of Class A, Class C, Class R, Class Y, Class R5 and Class R6 shares, respectively.
The Trust has entered into a transfer agency and service agreement with Invesco Investment Services, Inc. (“IIS”) pursuant to which the Fund has agreed to pay IIS a fee for providing transfer agency and shareholder services to the Fund and reimburse IIS for certain expenses incurred by IIS in the course of providing such services. IIS may make payments to intermediaries that provide omnibus account services, sub-accounting services and/or networking services. All fees payable by IIS to intermediaries that provide omnibus account services or sub-accounting are charged back to the Fund, subject to certain limitations approved by the Trust’s Board of Trustees. For the year ended October 31, 2016, expenses incurred under the agreement are shown in the Statement of Operations as Transfer agent fees.
The Trust has entered into a master administrative services agreement with Invesco pursuant to which the Fund has agreed to pay Invesco for certain administrative costs incurred in providing accounting services to the Fund. For the year ended October 31, 2016, expenses incurred under the agreement are shown in the Statement of Operations as Administrative services fees.
The Trust has entered into master distribution agreements with Invesco Distributors, Inc. (“IDI”) to serve as the distributor for the Class A, Class C, Class R, Class Y, Class R5 and Class R6 shares of the Fund. The Trust has adopted plans pursuant to Rule 12b-1 under the 1940 Act with respect to the Fund’s Class A, Class C and Class R shares (collectively, the “Plans”). The Fund, pursuant to the Plans, pays IDI compensation at the annual rate of
17 Invesco Global Infrastructure Fund
0.25% of the Fund’s average daily net assets of Class A shares, 1.00% of the average daily net assets of Class C shares and 0.50% of the average daily net assets of Class R shares. Of the Plan payments, up to 0.25% of the average daily net assets of each class of shares may be paid to furnish continuing personal shareholder services to customers who purchase and own shares of such classes. Any amounts not paid as a service fee under the Plans would constitute an asset-based sales charge. Rules of the Financial Industry Regulatory Authority (“FINRA”) impose a cap on the total sales charges, including asset-based sales charges, that may be paid by any class of shares of the Fund. For the year ended October 31, 2016, expenses incurred under the Plans are shown in the Statement of Operations as Distribution fees.
Front-end sales commissions and CDSC (collectively, the “sales charges”) are not recorded as expenses of the Fund. Front-end sales commissions are deducted from proceeds from the sales of Fund shares prior to investment in Class A shares of the Fund. CDSC are deducted from redemption proceeds prior to remittance to the shareholder. During the year ended October 31, 2016, IDI advised the Fund that IDI retained $1,970 in front-end sales commissions from the sale of Class A shares and $101 from Class C for CDSC imposed upon redemptions by shareholders.
Certain officers and trustees of the Trust are officers and directors of the Adviser, IIS and/or IDI.
NOTE 3—Additional Valuation Information
GAAP defines fair value as the price that would be received to sell an asset or paid to transfer a liability in an orderly transaction between market participants at the measurement date, under current market conditions. GAAP establishes a hierarchy that prioritizes the inputs to valuation methods, giving the highest priority to readily available unadjusted quoted prices in an active market for identical assets (Level 1) and the lowest priority to significant unobservable inputs (Level 3), generally when market prices are not readily available or are unreliable. Based on the valuation inputs, the securities or other investments are tiered into one of three levels. Changes in valuation methods may result in transfers in or out of an investment’s assigned level:
| | Level 1 — | Prices are determined using quoted prices in an active market for identical assets. |
| | Level 2 — | Prices are determined using other significant observable inputs. Observable inputs are inputs that other market participants may use in pricing a security. These may include quoted prices for similar securities, interest rates, prepayment speeds, credit risk, yield curves, loss severities, default rates, discount rates, volatilities and others. |
| | Level 3 — | Prices are determined using significant unobservable inputs. In situations where quoted prices or observable inputs are unavailable (for example, when there is little or no market activity for an investment at the end of the period), unobservable inputs may be used. Unobservable inputs reflect the Fund’s own assumptions about the factors market participants would use in determining fair value of the securities or instruments and would be based on the best available information. |
The following is a summary of the tiered valuation input levels, as of October 31, 2016. The level assigned to the securities valuations may not be an indication of the risk or liquidity associated with investing in those securities. Because of the inherent uncertainties of valuation, the values reflected in the financial statements may materially differ from the value received upon actual sale of those investments.
During the year ended October 31, 2016, there were transfers from Level 1 to Level 2 of $829,106 and from Level 2 to Level 1 of $461,711, due to foreign fair value adjustments.
| | | | | | | | | | | | | | | | |
| | | Level 1 | | | Level 2 | | | Level 3 | | | Total | |
Australia | | $ | — | | | $ | 515,925 | | | $ | — | | | $ | 515,925 | |
Canada | | | 1,496,648 | | | | — | | | | — | | | | 1,496,648 | |
China | | | 203,587 | | | | 91,971 | | | | — | | | | 295,558 | |
France | | | 66,601 | | | | 159,656 | | | | — | | | | 226,257 | |
Hong Kong | | | 126,711 | | | | — | | | | — | | | | 126,711 | |
Italy | | | 30,560 | | | | 311,725 | | | | — | | | | 342,285 | |
Japan | | | 30,782 | | | | 131,481 | | | | — | | | | 162,263 | |
Luxembourg | | | 199,276 | | | | — | | | | — | | | | 199,276 | |
Mexico | | | 86,611 | | | | — | | | | — | | | | 86,611 | |
New Zealand | | | 53,092 | | | | — | | | | — | | | | 53,092 | |
Spain | | | 141,212 | | | | 437,107 | | | | — | | | | 578,319 | |
Switzerland | | | — | | | | 46,472 | | | | — | | | | 46,472 | |
United Kingdom | | | — | | | | 906,430 | | | | — | | | | 906,430 | |
United States | | | 4,829,845 | | | | — | | | | — | | | | 4,829,845 | |
Money Market Funds | | | 495,514 | | | | — | | | | — | | | | 495,514 | |
Total Investments | | $ | 7,760,439 | | | $ | 2,600,767 | | | $ | — | | | $ | 10,361,206 | |
NOTE 4—Trustees’ and Officers’ Fees and Benefits
Trustees’ and Officers’ Fees and Benefits include amounts accrued by the Fund to pay remuneration to certain Trustees and Officers of the Fund. Trustees have the option to defer compensation payable by the Fund, and Trustees’ and Officers’ Fees and Benefits also include amounts accrued by the Fund to fund such deferred compensation amounts. Those Trustees who defer compensation have the option to select various Invesco Funds in which their deferral accounts shall be deemed to be invested. Obligations under the deferred compensation plan represent unsecured claims against the general assets of the Fund.
18 Invesco Global Infrastructure Fund
NOTE 5—Cash Balances
The Fund is permitted to temporarily carry a negative or overdrawn balance in its account with State Street Bank and Trust Company, the custodian bank. Such balances, if any at period-end, are shown in the Statement of Assets and Liabilities under the payable caption Amount due custodian. To compensate the custodian bank for such overdrafts, the overdrawn Fund may either (1) leave funds as a compensating balance in the account so the custodian bank can be compensated by earning the additional interest; or (2) compensate by paying the custodian bank at a rate agreed upon by the custodian bank and Invesco, not to exceed the contractually agreed upon rate.
NOTE 6—Distributions to Shareholders and Tax Components of Net Assets
Tax Character of Distributions to Shareholders Paid During the Fiscal Years Ended October 31, 2016 and 2015:
| | | | | | | | |
| | | 2016 | | | 2015 | |
Ordinary income | | $ | 147,480 | | | $ | 139,650 | |
Tax Components of Net Assets at Period-End:
| | | | |
| | | 2016 | |
Undistributed ordinary income | | $ | 16,249 | |
Net unrealized appreciation — investments | | | 137,447 | |
Net unrealized appreciation (depreciation) — other investments | | | (311 | ) |
Temporary book/tax differences | | | (4,983 | ) |
Capital loss carryforward | | | (580,372 | ) |
Shares of beneficial interest | | | 10,423,395 | |
Total net assets | | $ | 9,991,425 | |
The difference between book-basis and tax-basis unrealized appreciation (depreciation) is due to differences in the timing of recognition of gains and losses on investments for tax and book purposes. The Fund’s net unrealized appreciation difference is attributable primarily to wash sales.
The temporary book/tax differences are a result of timing differences between book and tax recognition of income and/or expenses. The Fund’s temporary book/tax differences are the result of the trustee deferral of compensation and retirement plan benefits.
Capital loss carryforward is calculated and reported as of a specific date. Results of transactions and other activity after that date may affect the amount of capital loss carryforward actually available for the Fund to utilize. Capital losses generated in years beginning after December 22, 2010 can be carried forward for an unlimited period, whereas previous losses expire in eight tax years. Capital losses with an expiration period may not be used to offset capital gains until all net capital losses without an expiration date have been utilized. Capital loss carryforwards with no expiration date will retain their character as either short-term or long-term capital losses instead of as short-term capital losses as under prior law. The ability to utilize capital loss carryforwards in the future may be limited under the Internal Revenue Code and related regulations based on the results of future transactions.
The Fund has a capital loss carryforward as of October 31, 2016, as follows:
| | | | | | | | | | | | |
| Capital Loss Carryforward* | |
| Expiration | | Short-Term | | | Long-Term | | | Total | |
Not subject to expiration | | $ | 533,512 | | | $ | 46,860 | | | $ | 580,372 | |
| * | Capital loss carryforward as of the date listed above is reduced for limitations, if any, to the extent required by the Internal Revenue Code and may be further limited depending upon a variety of factors, including the realization of net unrealized gains or losses as of the date of any reorganization. |
NOTE 7—Investment Securities
The aggregate amount of investment securities (other than short-term securities, U.S. Treasury obligations and money market funds, if any) purchased and sold by the Fund during the year ended October 31, 2016 was $9,126,194 and $7,051,680, respectively. Cost of investments on a tax basis includes the adjustments for financial reporting purposes as of the most recently completed federal income tax reporting period-end.
| | | | |
| Unrealized Appreciation (Depreciation) of Investment Securities on a Tax Basis | |
Aggregate unrealized appreciation of investment securities | | $ | 329,636 | |
Aggregate unrealized (depreciation) of investment securities | | | (192,189 | ) |
Net unrealized appreciation of investment securities | | $ | 137,447 | |
Cost of investments for tax purposes is $10,223,759.
NOTE 8—Reclassification of Permanent Differences
Primarily as a result of differing book/tax treatment of partnership reclassifications and foreign currency transactions, on October 31, 2016, undistributed net investment income was increased by $4,170, undistributed net realized gain (loss) was decreased by $4,013 and shares of beneficial interest was decreased by $157. This reclassification had no effect on the net assets of the Fund.
19 Invesco Global Infrastructure Fund
NOTE 9—Share Information
| | | | | | | | | | | | | | | | |
| | | Summary of Share Activity | |
| | | Years ended October 31, | |
| | | 2016(a) | | | 2015 | |
| | | Shares | | | Amount | | | Shares | | | Amount | |
Sold: | | | | | | | | | | | | | | | | |
Class A | | | 150,770 | | | $ | 1,439,352 | | | | 143,984 | | | $ | 1,475,203 | |
Class C | | | 27,743 | | | | 259,588 | | | | 29,868 | | | | 308,833 | |
Class R | | | 5,110 | | | | 47,978 | | | | 1,695 | | | | 16,483 | |
Class Y | | | 199,905 | | | | 1,858,567 | | | | 240,411 | | | | 2,436,493 | |
Class R6 | | | 9,451 | | | | 87,462 | | | | 4,688 | | | | 46,838 | |
| | | | |
Issued as reinvestment of dividends: | | | | | | | | | | | | | | | | |
Class A | | | 3,637 | | | | 33,164 | | | | 2,847 | | | | 28,336 | |
Class C | | | 309 | | | | 2,803 | | | | 350 | | | | 3,495 | |
Class R | | | 48 | | | | 450 | | | | 13 | | | | 129 | |
Class Y | | | 5,820 | | | | 53,018 | | | | 3,117 | | | | 30,694 | |
Class R6 | | | 151 | | | | 1,386 | | | | 105 | | | | 1,036 | |
| | | | |
Reacquired: | | | | | | | | | | | | | | | | |
Class A | | | (61,640 | ) | | | (575,820 | ) | | | (37,680 | ) | | | (371,188 | ) |
Class C | | | (12,940 | ) | | | (119,557 | ) | | | (17,777 | ) | | | (176,770 | ) |
Class R | | | (812 | ) | | | (7,548 | ) | | | (93 | ) | | | (995 | ) |
Class Y | | | (111,869 | ) | | | (1,025,707 | ) | | | (13,557 | ) | | | (132,381 | ) |
Class R6 | | | (4,938 | ) | | | (45,172 | ) | | | (1,145 | ) | | | (11,313 | ) |
Net increase in share activity | | | 210,745 | | | $ | 2,009,964 | | | | 356,826 | | | $ | 3,654,893 | |
| (a) | There are entities that are record owners of more than 5% of the outstanding shares of the Fund and in the aggregate own 41% of the outstanding shares of the Fund. IDI has an agreement with these entities to sell Fund shares. The Fund, Invesco and/or Invesco affiliates may make payments to these entities, which are considered to be related to the Fund, for providing services to the Fund, Invesco and/or Invesco affiliates including but not limited to services such as securities brokerage, distribution, third party record keeping and account servicing. The Fund has no knowledge as to whether all or any portion of the shares owned of record by these entities are also owned beneficially. |
| | In addition, 30% of the outstanding shares of the Fund are owned by the Adviser or an affiliate of the Adviser. |
20 Invesco Global Infrastructure Fund
NOTE 10—Financial Highlights
The following schedule presents financial highlights for a share of the Fund outstanding throughout the periods indicated.
| | | | | | | | | | | | | | | | | | | | | | | | | | | | | | | | | | | | | | | | | | | | | | | | | | | | | | | | |
| | | Net asset
value,
beginning
of period | | | Net
investment
income(a) | | | Net gains
(losses)
on securities
(both
realized and
unrealized) | | | Total from
investment
operations | | | Dividends
from net
investment
income | | | Distributions
from net
realized
gains | | | Total
distributions | | | Net asset
value, end
of period | | | Total
return(b) | | | Net assets,
end of period
(000’s omitted) | | | Ratio of
expenses
to average
net assets
with fee waivers
and/or expenses
absorbed | | | Ratio of
expenses
to average net
assets without
fee waivers
and/or expenses
absorbed | | | Ratio of net
investment
income
to average
net assets | | | Portfolio
turnover(c) | |
Class A | | | | | | | | | | | | | | | | | | | | | | | | | | | | | | | | | | | | | | | | | | | | | | | | | | | | | | | | |
Year ended 10/31/16 | | $ | 9.50 | | | $ | 0.17 | | | $ | 0.11 | | | $ | 0.28 | | | $ | (0.16 | ) | | $ | — | | | $ | (0.16 | ) | | $ | 9.62 | | | | 3.01 | % | | $ | 4,194 | | | | 1.40 | %(d) | | | 4.29 | %(d) | | | 1.76 | %(d) | | | 85 | % |
Year ended 10/31/15 | | | 10.66 | | | | 0.17 | | | | (1.11 | ) | | | (0.94 | ) | | | (0.21 | ) | | | (0.01 | ) | | | (0.22 | ) | | | 9.50 | | | | (8.85 | ) | | | 3,262 | | | | 1.40 | | | | 6.36 | | | | 1.68 | | | | 84 | |
Year ended 10/31/14(e) | | | 10.00 | | | | 0.08 | | | | 0.63 | | | | 0.71 | | | | (0.05 | ) | | | — | | | | (0.05 | ) | | | 10.66 | | | | 7.12 | | | | 2,497 | | | | 1.39 | (f) | | | 8.60 | (f) | | | 1.51 | (f) | | | 19 | |
Class C | | | | | | | | | | | | | | | | | | | | | | | | | | | | | | | | | | | | | | | | | | | | | | | | | | | | | | | | |
Year ended 10/31/16 | | | 9.48 | | | | 0.10 | | | | 0.11 | | | | 0.21 | | | | (0.09 | ) | | | — | | | | (0.09 | ) | | | 9.60 | | | | 2.24 | | | | 428 | | | | 2.15 | (d) | | | 5.04 | (d) | | | 1.01 | (d) | | | 85 | |
Year ended 10/31/15 | | | 10.64 | | | | 0.09 | | | | (1.10 | ) | | | (1.01 | ) | | | (0.14 | ) | | | (0.01 | ) | | | (0.15 | ) | | | 9.48 | | | | (9.56 | ) | | | 279 | | | | 2.15 | | | | 7.11 | | | | 0.93 | | | | 84 | |
Year ended 10/31/14(e) | | | 10.00 | | | | 0.04 | | | | 0.63 | | | | 0.67 | | | | (0.03 | ) | | | — | | | | (0.03 | ) | | | 10.64 | | | | 6.71 | | | | 181 | | | | 2.14 | (f) | | | 9.35 | (f) | | | 0.76 | (f) | | | 19 | |
Class R | | | | | | | | | | | | | | | | | | | | | | | | | | | | | | | | | | | | | | | | | | | | | | | | | | | | | | | | |
Year ended 10/31/16 | | | 9.49 | | | | 0.14 | | | | 0.11 | | | | 0.25 | | | | (0.13 | ) | | | — | | | | (0.13 | ) | | | 9.61 | | | | 2.76 | | | | 69 | | | | 1.65 | (d) | | | 4.54 | (d) | | | 1.51 | (d) | | | 85 | |
Year ended 10/31/15 | | | 10.66 | | | | 0.14 | | | | (1.11 | ) | | | (0.97 | ) | | | (0.19 | ) | | | (0.01 | ) | | | (0.20 | ) | | | 9.49 | | | | (9.18 | ) | | | 27 | | | | 1.65 | | | | 6.61 | | | | 1.43 | | | | 84 | |
Year ended 10/31/14(e) | | | 10.00 | | | | 0.07 | | | | 0.64 | | | | 0.71 | | | | (0.05 | ) | | | — | | | | (0.05 | ) | | | 10.66 | | | | 7.05 | | | | 13 | | | | 1.64 | (f) | | | 8.85 | (f) | | | 1.26 | (f) | | | 19 | |
Class Y | | | | | | | | | | | | | | | | | | | | | | | | | | | | | | | | | | | | | | | | | | | | | | | | | | | | | | | | |
Year ended 10/31/16 | | | 9.50 | | | | 0.19 | | | | 0.11 | | | | 0.30 | | | | (0.18 | ) | | | — | | | | (0.18 | ) | | | 9.62 | | | | 3.27 | | | | 5,177 | | | | 1.15 | (d) | | | 4.04 | (d) | | | 2.01 | (d) | | | 85 | |
Year ended 10/31/15 | | | 10.67 | | | | 0.20 | | | | (1.12 | ) | | | (0.92 | ) | | | (0.24 | ) | | | (0.01 | ) | | | (0.25 | ) | | | 9.50 | | | | (8.70 | ) | | | 4,223 | | | | 1.15 | | | | 6.11 | | | | 1.93 | | | | 84 | |
Year ended 10/31/14(e) | | | 10.00 | | | | 0.09 | | | | 0.64 | | | | 0.73 | | | | (0.06 | ) | | | — | | | | (0.06 | ) | | | 10.67 | | | | 7.29 | | | | 2,287 | | | | 1.14 | (f) | | | 8.35 | (f) | | | 1.76 | (f) | | | 19 | |
Class R5 | | | | | | | | | | | | | | | | | | | | | | | | | | | | | | | | | | | | | | | | | | | | | | | | | | | | | | | | |
Year ended 10/31/16 | | | 9.50 | | | | 0.19 | | | | 0.11 | | | | 0.30 | | | | (0.18 | ) | | | — | | | | (0.18 | ) | | | 9.62 | | | | 3.27 | | | | 10 | | | | 1.15 | (d) | | | 4.02 | (d) | | | 2.01 | (d) | | | 85 | |
Year ended 10/31/15 | | | 10.67 | | | | 0.20 | | | | (1.12 | ) | | | (0.92 | ) | | | (0.24 | ) | | | (0.01 | ) | | | (0.25 | ) | | | 9.50 | | | | (8.70 | ) | | | 10 | | | | 1.15 | | | | 6.00 | | | | 1.93 | | | | 84 | |
Year ended 10/31/14(e) | | | 10.00 | | | | 0.09 | | | | 0.64 | | | | 0.73 | | | | (0.06 | ) | | | — | | | | (0.06 | ) | | | 10.67 | | | | 7.29 | | | | 11 | | | | 1.14 | (f) | | | 8.34 | (f) | | | 1.76 | (f) | | | 19 | |
Class R6 | | | | | | | | | | | | | | | | | | | | | | | | | | | | | | | | | | | | | | | | | | | | | | | | | | | | | | | | |
Year ended 10/31/16 | | | 9.50 | | | | 0.19 | | | | 0.11 | | | | 0.30 | | | | (0.18 | ) | | | — | | | | (0.18 | ) | | | 9.62 | | | | 3.27 | | | | 114 | | | | 1.15 | (d) | | | 4.02 | (d) | | | 2.01 | (d) | | | 85 | |
Year ended 10/31/15 | | | 10.67 | | | | 0.20 | | | | (1.12 | ) | | | (0.92 | ) | | | (0.24 | ) | | | (0.01 | ) | | | (0.25 | ) | | | 9.50 | | | | (8.70 | ) | | | 69 | | | | 1.15 | | | | 6.00 | | | | 1.93 | | | | 84 | |
Year ended 10/31/14(e) | | | 10.00 | | | | 0.09 | | | | 0.64 | | | | 0.73 | | | | (0.06 | ) | | | — | | | | (0.06 | ) | | | 10.67 | | | | 7.29 | | | | 38 | | | | 1.14 | (f) | | | 8.34 | (f) | | | 1.76 | (f) | | | 19 | |
| (a) | Calculated using average shares outstanding. |
| (b) | Includes adjustments in accordance with accounting principles generally accepted in the United States of America and as such, the net asset value for financial reporting purposes and the returns based upon those net asset values may differ from the net asset value and returns for shareholder transactions. Does not include sales charges and is not annualized for periods less than one year, if applicable. |
| (c) | Portfolio turnover is calculated at the fund level and is not annualized for periods less than one year, if applicable. |
| (d) | Ratios are based on average daily net assets (000’s omitted) of $3,503, $326, $42, $4,346, $9 and $82 for Class A, Class C, Class R, Class Y, Class R5 and Class R6 shares, respectively. |
| (e) | Commencement date of May 2, 2014. |
NOTE 11—Subsequent Event
Effective January 1, 2017, the Adviser has contractually agreed, through at least February 28, 2018, to waive advisory fees and/or reimburse expenses to the extent necessary to limit total annual fund operating expenses after fee waiver and/or expense reimbursement (excluding certain items discussed in Note 2) of Class A, Class C, Class R, Class Y, Class R5 and Class R6 shares to 1.28%, 2.03%, 1.53%, 1.03%, 1.03% and 1.03%, respectively, of the Fund’s average daily net assets.
21 Invesco Global Infrastructure Fund
Report of Independent Registered Public Accounting Firm
To the Board of Trustees
and Shareholders of the Invesco Global Infrastructure Fund:
In our opinion, the accompanying statement of assets and liabilities, including the schedule of investments, and the related statements of operations and of changes in net assets and the financial highlights present fairly, in all material respects, the financial position of the Invesco Global Infrastructure Fund (the “Fund”) as of October 31, 2016, the results of its operations for the year then ended, the changes in its net assets for each of the two years in the period then ended and the financial highlights for each of the two years in the period then ended and for the period May 2, 2014 (commencement of operations) through October 31, 2014, in conformity with accounting principles generally accepted in the United States of America. These financial statements and financial highlights (hereafter referred to as “financial statements”) are the responsibility of the Fund’s management. Our responsibility is to express an opinion on these financial statements based on our audits. We conducted our audits of these financial statements in accordance with the standards of the Public Company Accounting Oversight Board (United States). Those standards require that we plan and perform the audit to obtain reasonable assurance about whether the financial statements are free of material misstatement. An audit includes examining, on a test basis, evidence supporting the amounts and disclosures in the financial statements, assessing the accounting principles used and significant estimates made by management, and evaluating the overall financial statement presentation. We believe that our audits, which included confirmation of securities as of October 31, 2016 by correspondence with the custodian and brokers, and the application of alternative auditing procedures where confirmations of security purchases have not been received, provide a reasonable basis for our opinion.
PRICEWATERHOUSECOOPERS LLP
Houston, Texas
December 21, 2016
22 Invesco Global Infrastructure Fund
Calculating your ongoing Fund expenses
Example
As a shareholder of the Fund, you incur two types of costs: (1) transaction costs, which may include sales charges (loads) on purchase payments or contingent deferred sales charges on redemptions, if any; and (2) ongoing costs, including management fees, distribution and/or service (12b-1) fees, and other Fund expenses. This example is intended to help you understand your ongoing costs (in dollars) of investing in the Fund and to compare these costs with ongoing costs of investing in other mutual funds. The example is based on an investment of $1,000 invested at the beginning of the period and held for the entire period May 1, 2016 through October 31, 2016.
Actual expenses
The table below provides information about actual account values and actual expenses. You may use the information in this table, together with the amount you invested, to estimate the expenses that you paid over the period. Simply divide your account value by $1,000 (for example, an $8,600 account value divided by $1,000 = 8.6), then multiply the result by the number in the table under the heading entitled “Actual Expenses Paid During Period” to estimate the expenses you paid on your account during this period.
Hypothetical example for comparison purposes
The table below also provides information about hypothetical account values and hypothetical expenses based on the Fund’s actual expense ratio and an assumed rate of return of 5% per year before expenses, which is not the Fund’s actual return.
The hypothetical account values and expenses may not be used to estimate the actual ending account balance or expenses you paid for the period. You may use this information to compare the ongoing costs of investing in the Fund and other funds. To do so, compare this 5% hypothetical example with the 5% hypothetical examples that appear in the shareholder reports of the other funds.
Please note that the expenses shown in the table are meant to highlight your ongoing costs only and do not reflect any transaction costs, such as sales charges (loads) on purchase payments or contingent deferred sales charges on redemptions, if any. Therefore, the hypothetical information is useful in comparing ongoing costs only, and will not help you determine the relative total costs of owning different funds. In addition, if these transaction costs were included, your costs would have been higher.
| | | | | | | | | | | | | | | | | | | | | | | | |
| Class | | Beginning
Account Value
(05/01/16) | | | ACTUAL | | | HYPOTHETICAL (5% annual return before
expenses) | | | Annualized
Expense
Ratio | |
| | | Ending
Account Value
(10/31/16)1 | | | Expenses
Paid During
Period2,3 | | | Ending
Account Value
(10/31/16) | | | Expenses
Paid During
Period2,4 | | |
| A | | | 1,000.00 | | | $ | 1,034.70 | | | $ | 7.16 | | | $ | 1,018.10 | | | $ | 7.10 | | | | 1.40 | % |
| C | | | 1,000.00 | | | | 1,030.90 | | | | 10.98 | | | | 1,014.33 | | | | 10.89 | | | | 2.15 | |
| R | | | 1,000.00 | | | | 1,033.50 | | | | 8.43 | | | | 1,016.84 | | | | 8.36 | | | | 1.65 | |
| Y | | | 1,000.00 | | | | 1,036.00 | | | | 5.89 | | | | 1,019.36 | | | | 5.84 | | | | 1.15 | |
| R5 | | | 1,000.00 | | | | 1,036.00 | | | | 5.89 | | | | 1,019.36 | | | | 5.84 | | | | 1.15 | |
| R6 | | | 1,000.00 | | | | 1,036.00 | | | | 5.89 | | | | 1,019.36 | | | | 5.84 | | | | 1.15 | |
| 1 | The actual ending account value is based on the actual total return of the Fund for the period May 1, 2016 through October 31, 2016, after actual expenses and will differ from the hypothetical ending account value which is based on the Fund’s expense ratio and a hypothetical annual return of 5% before expenses. |
| 2 | Expenses are equal to the Fund’s annualized expense ratio as indicated above multiplied by the average account value over the period, multiplied by 184/366 to reflect the most recent fiscal half year. Effective January 1, 2017, the Fund’s Adviser has contractually agreed to waive advisory fees and/or reimburse expenses to the extent necessary to limit total annual fund operating expenses of Class A, Class C and Class R, Class Y, Class R5 and Class R6 shares to 1.28%, 2.03%, 1.53%, 1.03%, 1.03% and 1.03% of average daily net assets, respectively. The annualized expense ratios restated as if these agreements had been in effect throughout the entire most recent fiscal half year are 1.28%, 2.03%, 1.53%, 1.03%, 1.03% and 1.03% for Class A, Class C, Class R, Class Y, Class R5 and Class R6 shares, respectively. |
| 3 | The actual expenses paid restated as if the changes discussed above had been in effect throughout the entire most recent fiscal half year are $6.55, $10.36, $7.82, $5.27, $5.27 and $5.27 for Class A, Class C, Class R, Class Y, Class R5 and Class R6 shares, respectively. |
| 4 | The hypothetical expenses paid restated as if the changes discussed above had been in effect throughout the entire most recent fiscal half year are $6.50, $10.28, $7.76, $5.23, $5.23 and $5.23 for Class A, Class C, Class R, Class Y, Class R5 and Class R6 shares, respectively. |
23 Invesco Global Infrastructure Fund
Approval of Investment Advisory and Sub-Advisory Contracts
The Board of Trustees (the Board) of AIM Investment Funds (Invesco Investment Funds) is required under the Investment Company Act of 1940, as amended, to approve annually the renewal of Invesco Global Infrastructure Fund’s (the Fund) investment advisory agreements. During contract renewal meetings held on June 7-8, 2016, the Board as a whole, and the disinterested or “independent” Trustees, who comprise over 75% of the Board, voting separately, approved the continuance for the Fund of the Master Investment Advisory Agreement with Invesco Advisers, Inc. (Invesco Advisers and the investment advisory agreement) and the Master Intergroup Sub-Advisory Contract for Mutual Funds with Invesco Asset Management Deutschland GmbH, Invesco Asset Management Limited, Invesco Asset Management (Japan) Limited, Invesco Hong Kong Limited, Invesco Senior Secured Management, Inc., Invesco Canada Ltd. and Invesco PowerShares Capital Management LLC (collectively, the Affiliated Sub-Advisers and the sub-advisory contracts) for another year, effective July 1, 2016.
In evaluating the fairness and reasonableness of compensation under the Fund’s investment advisory agreement and sub-advisory contracts, the Board considered, among other things, the factors discussed below. The Board determined that continuation of the Fund’s investment advisory agreement and the sub-advisory contracts is in the best interest of the Fund and its shareholders and that the compensation payable to Invesco Advisers and the Affiliated Sub-Advisers under the agreements is fair and reasonable.
The Board’s Fund Evaluation Process
The Board’s Investments Committee has established three Sub-Committees, which meet throughout the year to review the performance of funds advised by Invesco Advisers (the Invesco Funds). Over the course of each year, the Sub-Committees meet with portfolio managers for their assigned Invesco Funds and other members of management to review the performance, investment objective(s), policies, strategies, limitations and investment risks of these funds. The Board had the benefit of reports from the Sub-Committees and Investments Committee throughout the year in considering approval of the continuance of each Invesco Fund’s investment advisory agreement and sub-advisory contracts for another year.
During the contract renewal process, the Board receives comparative performance and fee data regarding the Invesco Funds prepared by Invesco Advisers and Broadridge Financial Solutions, Inc. (Broadridge), an independent provider of investment company data. The Board also receives an independent written evaluation from the Senior Officer, an officer of the Invesco Funds who reports directly to the
independent Trustees. The Senior Officer’s evaluation is prepared as part of his responsibility to manage the process by which the Invesco Funds’ proposed management fees are negotiated during the annual contract renewal process to ensure they are negotiated in a manner that is at arms’ length and reasonable. In addition to meetings with Invesco Advisers and fund counsel, the independent Trustees also discuss the continuance of the investment advisory agreement and sub-advisory contracts in separate sessions with the Senior Officer and with independent legal counsel.
The Trustees recognized that the advisory fee rates for the Invesco Funds are, in many cases, the result of years of review and negotiation. The Trustees’ deliberations and conclusions in a particular year may be based in part on their deliberations and conclusions regarding these arrangements throughout the year and in prior years. The Trustees’ review and conclusions are based on the comprehensive consideration of all information presented to them and are not the result of any single determinative factor. Moreover, one Trustee may have weighed a particular piece of information or factor differently than another Trustee.
The discussion below is a summary of the Senior Officer’s independent written evaluation with respect to the Fund’s investment advisory agreement as well as a discussion of the material factors and related conclusions that formed the basis for the Board’s approval of the Fund’s investment advisory agreement and sub-advisory contracts. Unless otherwise stated, this information is current as of June 8, 2016, and does not reflect consideration of factors that became known to the Board after that date.
Factors and Conclusions and Summary of Evaluation of Investment Advisory and Sub-Advisory Agreements
| A. | Nature, Extent and Quality of Services Provided by Invesco Advisers and the Affiliated Sub-Advisers |
The Board reviewed the advisory services provided to the Fund by Invesco Advisers under the Fund’s investment advisory agreement, the performance of Invesco Advisers in providing these services, and the credentials and experience of the officers and employees of Invesco Advisers who provide these services, including the Fund’s portfolio manager or managers. The Board’s review of the qualifications of Invesco Advisers to provide advisory services included the Board’s consideration of Invesco Advisers’ investment process oversight, independent credit analysis and investment risk management. The Board also considered non-advisory services that Invesco Advisers and its affiliates provide to the Invesco Funds such as various back office
support functions, trading operations, internal audit, valuation and legal and compliance.
In determining whether to continue the Fund’s investment advisory agreement, the Board considered the benefits of reapproving an existing relationship and the greater uncertainty that may be associated with entering into a new relationship. The Board concluded that the nature, extent and quality of the services provided to the Fund by Invesco Advisers are appropriate and satisfactory and consistent with the terms of the Fund’s investment advisory agreement.
The Board reviewed the services that may be provided by the Affiliated Sub-Advisers under the sub-advisory contracts and the credentials and experience of the officers and employees of the Affiliated Sub-Advisers who provide these services. The Board noted that the Affiliated Sub-Advisers have offices and personnel that are located in financial centers around the world. As a result, the Board noted that Affiliated Sub-Advisers can provide research and investment analysis on the markets and economies of various countries in which the Fund may invest, make recommendations regarding securities and assist with security trades. The Board concluded that the sub-advisory contracts may benefit the Fund and its shareholders by permitting Invesco Advisers to use the resources and talents of the Affiliated Sub-Advisers in managing the Fund. The Board concluded that the nature, extent and quality of the services that may be provided by the Affiliated Sub-Advisers are appropriate and satisfactory and consistent with the terms of the Fund’s sub-advisory contracts.
The Board considered Fund performance as a relevant factor in considering whether to approve the investment advisory agreement. The Board did not view Fund performance as a relevant factor in considering whether to approve the sub-advisory contracts for the Fund, as no Affiliated Sub-Adviser currently manages assets of the Fund.
The Board compared the Fund’s performance during the past one calendar year to the performance of funds in the Broadridge performance universe and against the Lipper Global Infrastructure Funds Index. The Board noted that performance of Class A shares of the Fund was in the fifth quintile of its performance universe for the one year (the first quintile being the best performing funds and the fifth quintile being the worst performing funds). The Board noted that performance of Class A shares of the Fund was below the performance of the Index for the one year period. The Trustees also reviewed more recent Fund performance and this review did not change their conclusions.
| C. | Advisory and Sub-Advisory Fees |
The Board compared the Fund’s contractual management fee rate to the contractual
24 Invesco Global Infrastructure Fund
management fee rates of funds in the Fund’s Broadridge expense group at a common asset level. The Board noted that the contractual management fee rate for Class A shares of the Fund was below the median contractual management fee rate of funds in its expense group. The Board noted that the term “contractual management fee” for funds in the expense group may include both advisory and certain administrative services fees, but that Broadridge does not provide information on a fund by fund basis as to what is included. The Board noted that Invesco does not separately charge the Invesco Funds for the administrative services included in the term as defined by Broadridge. The Board also reviewed the methodology used by Broadridge in providing expense group information, which includes using each fund’s contractual fee schedule (including any applicable breakpoints) as reported in the most recent prospectus or statement of information for each fund in the expense group.
The Board noted that Invesco Advisers has contractually agreed to waive fees and/or limit expenses of the Fund through February 28, 2017 in an amount necessary to limit total annual operating expenses to a specified percentage of average daily net assets for each class of the Fund.
The Board noted that Invesco Advisers and the Affiliated Sub-Advisers do not manage other mutual funds or client accounts with investment strategies comparable to those of the Fund.
The Board also considered the services that may be provided by the Affiliated Sub-Advisers pursuant to the sub-advisory contracts, as well as the fees payable by Invesco Advisers to the Affiliated Sub-Advisers pursuant to the sub-advisory contracts. The Board also noted that the sub-advisory fees are not paid directly by the Fund, but rather, are payable by Invesco Advisers to the Affiliated Sub-Advisers.
| D. | Economies of Scale and Breakpoints |
The Board considered the extent to which there are economies of scale in the provision of advisory services to the Fund. The Board also considered whether the Fund benefits from economies of scale through contractual breakpoints in the Fund’s advisory fee schedule. The Board also noted that the Fund shares directly in economies of scale through lower fees charged by third party service providers based on the combined size of the Invesco Funds and other clients advised by Invesco Advisers.
| E. | Profitability and Financial Resources |
The Board reviewed information from Invesco Advisers concerning the costs of the advisory and other services that Invesco Advisers and its affiliates provide to the Fund and the Invesco Funds and the profitability of Invesco Advisers and its affiliates in providing these services. The Board received information from Invesco Advisers and a report from an independent consultant engaged by the Senior Officer about the methodology used to prepare the profitability information. The Board noted that
Invesco Advisers continues to operate at a net profit from services Invesco Advisers and its affiliates provide to the Invesco Funds. The Board noted that although Invesco Advisers received a minimal amount of revenues from advising the Fund, Invesco Advisers and its subsidiaries did not make a profit from managing the Fund. The Board received and accepted information from Invesco Advisers demonstrating that Invesco Advisers and each Affiliated Sub-Adviser are financially sound and have the resources necessary to perform their obligations under the investment advisory agreement and sub-advisory contracts.
| F. | Collateral Benefits to Invesco Advisers and its Affiliates |
The Board considered various other benefits received by Invesco Advisers and its affiliates from the relationship with the Fund, including the fees received for providing transfer agency and distribution services to the Fund. The Board considered comparative information regarding fees charged for these services, including information provided by Broadridge and other independent sources. The Board considered the performance of Invesco Advisers and its affiliates in providing these services and the organizational structure employed to provide these services. The Board also considered that these services are provided to the Fund pursuant to written contracts that are reviewed and approved on an annual basis by the Board; and that the services are required for the operation of the Fund.
The Board considered the benefits realized by Invesco Advisers and the Affiliated Sub-Advisers as a result of portfolio brokerage transactions executed through “soft dollar” arrangements. The Board noted that soft dollar arrangements shift the payment obligation for research services from Invesco Advisers and the Affiliated Sub-Advisers to the Invesco Funds and that the research received may be used with other clients of Invesco Advisers and may reduce Invesco Advisers’ and the Affiliated Sub-Advisers’ expenses. The Board also considered that it receives periodic reports from the Chief Compliance Officer of the Invesco Funds demonstrating that these arrangements are consistent with regulatory requirements. The Board did not deem the soft dollar arrangements to be inappropriate.
The Board considered that the Fund’s uninvested cash and cash collateral from any securities lending arrangements may be invested in money market funds advised by Invesco Advisers pursuant to procedures approved by the Board. The Board noted that Invesco Advisers receives advisory fees from these affiliated money market funds attributable to such investments, although Invesco Advisers has contractually agreed to waive through varying periods the advisory fees payable by the Invesco Funds with respect to certain investments in the affiliated money market funds. The waiver is in an amount equal to 100% of the net advisory fee Invesco Advisers receives from the affiliated money
market funds with respect to the Fund’s investment in the affiliated money market funds of uninvested cash, but not cash collateral. The Board concluded that the amount of advisory fees received by Invesco Advisors from the Fund’s investment of cash collateral from any securities lending arrangements in the affiliated money market funds is fair and reasonable.
The Board also considered the Fund may use an affiliated broker to execute certain trades for the Fund to, among other things, control information leakage, and were advised that such trades would be executed in compliance with rules under the Investment Company Act of 1940, as amended, and consistent with best execution obligations.
25 Invesco Global Infrastructure Fund
Tax Information
Form 1099-DIV, Form 1042-S and other year-end tax information provide shareholders with actual calendar year amounts that should be included in their tax returns. Shareholders should consult their tax advisors.
The following distribution information is being provided as required by the Internal Revenue Code or to meet a specific state’s requirement.
The Fund designates the following amounts or, if subsequently determined to be different, the maximum amount allowable for its fiscal year ended October 31, 2016:
| | | | |
Federal and State Income Tax | |
Qualified Dividend Income* | | | 93.72 | % |
Corporate Dividends Received Deduction* | | | 53.94 | % |
U.S. Treasury Obligations* | | | 0.00 | % |
| | * | The above percentages are based on ordinary income dividends paid to shareholders during the Fund’s fiscal year. |
26 Invesco Global Infrastructure Fund
Trustees and Officers
The address of each trustee and officer is AIM Investment Funds (Invesco Investment Funds) (the “Trust”), 11 Greenway Plaza, Suite 1000, Houston, Texas 77046-1173. The trustees serve for the life of the Trust, subject to their earlier death, incapacitation, resignation, retirement or removal as more specifically provided in the Trust’s organizational documents. Each officer serves for a one year term or until their successors are elected and qualified. Column two below includes length of time served with predecessor entities, if any.
| | | | | | | | |
Name, Year of Birth and
Position(s) Held with the Trust | | Trustee and/
or Officer Since | | Principal Occupation(s)
During Past 5 Years | | Number of
Funds in Fund
Complex
Overseen by
Trustee | | Other Directorship(s)
Held by Trustee During
Past 5 Years |
| Interested Persons | | | | | | | | |
| Martin L. Flanagan1 — 1960 Trustee | | 2007 | | Executive Director, Chief Executive Officer and President, Invesco Ltd. (ultimate parent of Invesco and a global investment management firm); Advisor to the Board, Invesco Advisers, Inc. (formerly known as Invesco Institutional (N.A.), Inc.); Trustee, The Invesco Funds; Vice Chair, Investment Company Institute; and Member of Executive Board, SMU Cox School of Business Formerly: Chairman and Chief Executive Officer, Invesco Advisers, Inc. (registered investment adviser); Director, Chairman, Chief Executive Officer and President, Invesco Holding Company (US) Inc. (formerly IVZ Inc.) (holding company), Invesco Group Services, Inc. (service provider) and Invesco North American Holdings, Inc. (holding company); Director, Chief Executive Officer and President, Invesco Holding Company Limited (parent of Invesco and a global investment management firm); Director, Invesco Ltd.; Chairman, Investment Company Institute and President, Co-Chief Executive Officer, Co-President, Chief Operating Officer and Chief Financial Officer, Franklin Resources, Inc. (global investment management organization) | | 146 | | None |
| Philip A. Taylor2 — 1954 Trustee and Senior Vice President | | 2006 | | Head of the Americas and Senior Managing Director, Invesco Ltd.; Director, Co-Chairman, Co-President and Co-Chief Executive Officer, Invesco Advisers, Inc. (formerly known as Invesco Institutional (N.A.), Inc.) (registered investment adviser); Director, Chairman, Chief Executive Officer and President, Invesco Management Group, Inc. (formerly known as Invesco AIM Management Group, Inc.) (financial services holding company); Director and Chairman, Invesco Investment Services, Inc. (formerly known as Invesco AIM Investment Services, Inc.) (registered transfer agent) Chief Executive Officer, Invesco Corporate Class Inc. (corporate mutual fund company) Director, Chairman and Chief Executive Officer, Invesco Canada Ltd. (formerly known as Invesco Trimark Ltd./Invesco Trimark Ltèe) (registered investment adviser and registered transfer agent); Trustee and Senior Vice President, The Invesco Funds; Director, Invesco Investment Advisers LLC (formerly known as Van Kampen Asset Management). Formerly: Director, Chief Executive Officer and President, Van Kampen Exchange Corp.; President and Principal Executive Officer, The Invesco Funds (other than AIM Treasurer’s Series Trust (Invesco Treasurer’s Series Trust), Short-Term Investments Trust and Invesco Management Trust); Executive Vice President, The Invesco Funds (AIM Treasurer’s Series Trust (Invesco Treasurer’s Series Trust), Short-Term Investments Trust and Invesco Management Trust only); Director and President, INVESCO Funds Group, Inc. (registered investment adviser and registered transfer agent); Director and Chairman, IVZ Distributors, Inc. (formerly known as INVESCO Distributors, Inc.) (registered broker dealer); Director, President and Chairman, Invesco Inc. (holding company), Invesco Canada Holdings Inc. (holding company), Trimark Investments Ltd./Placements Trimark Ltèe and Invesco Financial Services Ltd/Services Financiers Invesco Ltèe; Chief Executive Officer, Invesco Canada Fund Inc. (corporate mutual fund company); Director and Chairman, Van Kampen Investor Services Inc.; Director, Chief Executive Officer and President, 1371 Preferred Inc. (holding company) and Van Kampen Investments Inc.; Director and President, AIM GP Canada Inc. (general partner for limited partnerships) and Van Kampen Advisors, Inc.; Director and Chief Executive Officer, Invesco Trimark Dealer Inc. (registered broker dealer); Director, Invesco Distributors, Inc. (formerly known as Invesco AIM Distributors, Inc.) (registered broker dealer); Manager, Invesco PowerShares Capital Management LLC; Director, Chief Executive Officer and President, Invesco Advisers, Inc.; Director, Chairman, Chief Executive Officer and President, Invesco AIM Capital Management, Inc.; President, Invesco Trimark Dealer Inc. and Invesco Trimark Ltd./Invesco Trimark Ltèe; Director and President, AIM Trimark Corporate Class Inc. and AIM Trimark Canada Fund Inc.; Senior Managing Director, Invesco Holding Company Limited; Director and Chairman, Fund Management Company (former registered broker dealer); President and Principal Executive Officer, The Invesco Funds (AIM Treasurer’s Series Trust (Invesco Treasurer’s Series Trust), and Short-Term Investments Trust only); President, AIM Trimark Global Fund Inc. and AIM Trimark Canada Fund Inc. | | 146 | | None |
| 1 | Mr. Flanagan is considered an interested person (within the meaning of Section 2(a)(19) of the 1940 Act) of the Trust because he is an officer of the Adviser to the Trust, and an officer and a director of Invesco Ltd., ultimate parent of the Adviser. |
| 2 | Mr. Taylor is considered an interested person (within the meaning of Section 2(a)(19) of the 1940 Act) of the Trust because he is an officer and a director of the Adviser. |
T-1 Invesco Global Infrastructure Fund
Trustees and Officers—(continued)
| | | | | | | | |
Name, Year of Birth and
Position(s) Held with the Trust | | Trustee and/
or Officer Since | | Principal Occupation(s) During Past 5 Years | | Number of
Funds in Fund
Complex
Overseen by
Trustee | | Other Directorship(s)
Held by Trustee During
Past 5 Years |
| Independent Trustees | | | | | | | | |
Bruce L. Crockett — 1944 Trustee and Chair | | 2001 | | Chairman, Crockett Technologies Associates (technology consulting company) Formerly: Director, Captaris (unified messaging provider); Director, President and Chief Executive Officer, COMSAT Corporation; Chairman, Board of Governors of INTELSAT (international communications company); ACE Limited (insurance company); Independent Directors Council and Investment Company Institute | | 146 | | ALPS (Attorneys Liability Protection Society) (insurance company) and Globe Specialty Metals, Inc. (metallurgical company); Member of the Audit Committee, Ferroglobe PLC and Investment Company Institute; Member of the Executive Committee and Chair of the Governance Committee, Independent Directors Council |
David C. Arch — 1945 Trustee | | 2010 | | Chairman of Blistex Inc., a consumer health care products manufacturer | | 146 | | Board member of the Illinois Manufacturers’ Association; Member of the Board of Visitors, Institute for the Humanities, University of Michigan |
James T. Bunch — 1942 Trustee | | 2003 | | Managing Member, Grumman Hill Group LLC (family office/private equity investments) Formerly: Chairman of the Board, Denver Film Society, Chairman of the Board of Trustees, Evans Scholarship Foundation; Chairman, Board of Governors, Western Golf Association | | 146 | | Trustee, Evans Scholarship Foundation |
Albert R. Dowden — 1941 Trustee | | 2001 | | Director of a number of public and private business corporations, including Nature’s Sunshine Products, Inc. Formerly: Director, The Boss Group, Ltd. and Reich & Tang Funds (5 portfolios) (registered investment company); Director, Homeowners of America Holding Corporation/Homeowners of America Insurance Company (property casualty company); Director, Continental Energy Services, LLC (oil and gas pipeline service); Director, CompuDyne Corporation (provider of product and services to the public security market) and Director, Annuity and Life Re (Holdings), Ltd. (reinsurance company); Director, President and Chief Executive Officer, Volvo Group North America, Inc.; Senior Vice President, AB Volvo; Director of various public and private corporations; Chairman, DHJ Media, Inc.; Director, Magellan Insurance Company; and Director, The Hertz Corporation, Genmar Corporation (boat manufacturer), National Media Corporation; Advisory Board of Rotary Power International (designer, manufacturer, and seller of rotary power engines); and Chairman, Cortland Trust, Inc. (registered investment company) | | 146 | | Director of Nature’s Sunshine Products, Inc. |
Jack M. Fields — 1952 Trustee | | 2001 | | Chief Executive Officer, Twenty First Century Group, Inc. (government affairs company); and Discovery Learning Alliance (non-profit) Formerly: Owner and Chief Executive Officer, Dos Angeles Ranch L.P. (cattle, hunting, corporate entertainment); Director, Insperity, Inc. (formerly known as Administaff); Chief Executive Officer, Texana Timber LP (sustainable forestry company); Director of Cross Timbers Quail Research Ranch (non-profit); and member of the U.S. House of Representatives | | 146 | | None |
Eli Jones — 1961 Trustee | | 2016 | | Professor and Dean, Mays Business School — Texas A&M University Formerly: Professor and Dean, Walton College of Business, University of Arkansas and E.J. Ourso College of Business, Louisiana State University and Director, Arvest Bank | | 146 | | Director of Insperity, Inc. (formerly known as Administaff) |
Prema Mathai-Davis — 1950 Trustee | | 2001 | | Retired. Formerly: Chief Executive Officer, YWCA of the U.S.A. | | 146 | | None |
Larry Soll — 1942 Trustee | | 2003 | | Retired. Formerly: Chairman, Chief Executive Officer and President, Synergen Corp. (a biotechnology company) | | 146 | | None |
Raymond Stickel, Jr. — 1944 Trustee | | 2005 | | Retired. Formerly: Director, Mainstay VP Series Funds, Inc. (25 portfolios) and Partner, Deloitte & Touche | | 146 | | None |
Robert C. Troccoli — 1949 Trustee | | 2016 | | Adjunct Professor, University of Denver — Daniels College of Business Formerly: Senior Partner, KPMG LLP | | 146 | | None |
T-2 Invesco Global Infrastructure Fund
Trustees and Officers—(continued)
| | | | | | | | |
Name, Year of Birth and
Position(s) Held with the Trust | | Trustee and/
or Officer Since | | Principal Occupation(s) During Past 5 Years | | Number of
Funds in Fund
Complex
Overseen by
Trustee | | Other Directorship(s)
Held by Trustee During
Past 5 Years |
| Independent Trustees—(continued) |
Suzanne H. Woolsey — 1941 Trustee | | 2014 | | Retired. Formerly: Chief Executive Officer of Woolsey Partners LLC | | 146 | | Director, SunShare LLC; Trustee, Ocean Conservancy; Emeritus Chair of the Board of Trustees of the Institute for Defense Analyses and of Colorado College; Trustee, Chair, Business and Finance Committee of California Institute of Technology; Prior to 2014, Director of Fluor Corp.; Prior to 2010, Trustee of the German Marshall Fund of the United States; Prior to 2010, Trustee of the Rocky Mountain Institute |
| Other Officers | | | | | | | | |
Sheri Morris — 1964 President, Principal Executive Officer and Treasurer | | 1999 | | President, Principal Executive Officer and Treasurer, The Invesco Funds; Vice President, Invesco Advisers, Inc. (formerly known as Invesco Institutional (N.A.), Inc.) (registered investment adviser); and Vice President, PowerShares Exchange-Traded Fund Trust, PowerShares Exchange-Traded Fund Trust II, PowerShares India Exchange-Traded Fund Trust, PowerShares Actively Managed Exchange-Traded Fund Trust, and PowerShares Actively Managed Exchange-Traded Commodity Fund Trust Formerly: Vice President and Principal Financial Officer, The Invesco Funds; Vice President, Invesco AIM Advisers, Inc., Invesco AIM Capital Management, Inc. and Invesco AIM Private Asset Management, Inc.; Assistant Vice President and Assistant Treasurer, The Invesco Funds and Assistant Vice President, Invesco Advisers, Inc., Invesco AIM Capital Management, Inc. and Invesco AIM Private Asset Management, Inc.; and Treasurer, PowerShares Exchange-Traded Fund Trust, PowerShares Exchange-Traded Fund Trust II, PowerShares India Exchange-Traded Fund Trust and PowerShares Actively Managed Exchange-Traded Fund Trust | | N/A | | N/A |
Russell C. Burk — 1958 Senior Vice President and Senior Officer | | 2005 | | Senior Vice President and Senior Officer, The Invesco Funds | | N/A | | N/A |
John M. Zerr — 1962 Senior Vice President, Chief Legal Officer and Secretary | | 2006 | | Director, Senior Vice President, Secretary and General Counsel, Invesco Management Group, Inc. (formerly known as Invesco AIM Management Group, Inc.; Senior Vice President, Invesco Advisers, Inc. (formerly known as Invesco Institutional (N.A.), Inc.) (registered investment adviser); Senior Vice President and Secretary, Invesco Distributors, Inc. (formerly known as Invesco AIM Distributors, Inc.); Director, Vice President and Secretary, Invesco Investment Services, Inc. (formerly known as Invesco AIM Investment Services, Inc.) Senior Vice President, Chief Legal Officer and Secretary, The Invesco Funds; Managing Director, Invesco PowerShares Capital Management LLC; Director, Secretary and General Counsel, Invesco Investment Advisers LLC (formerly known as Van Kampen Asset Management); Secretary and General Counsel, Invesco Capital Markets, Inc. (formerly known as Van Kampen Funds Inc.) and Chief Legal Officer, PowerShares Exchange-Traded Fund Trust, PowerShares Exchange-Traded Fund Trust II, PowerShares India Exchange-Traded Fund Trust, PowerShares Actively Managed Exchange-Traded Fund Trust, and PowerShares Actively Managed Exchange-Traded Commodity Fund Trust Formerly: Director, Secretary, General Counsel and Senior Vice President, Van Kampen Exchange Corp.; Director, Vice President and Secretary, IVZ Distributors, Inc. (formerly known as INVESCO Distributors, Inc.); Director and Vice President, INVESCO Funds Group, Inc.; Director and Vice President, Van Kampen Advisors Inc.; Director, Vice President, Secretary and General Counsel, Van Kampen Investor Services Inc.; Director, Invesco Distributors, Inc. (formerly known as Invesco AIM Distributors, Inc.); Director, Senior Vice President, General Counsel and Secretary, Invesco AIM Advisers, Inc. and Van Kampen Investments Inc.; Director, Vice President and Secretary, Fund Management Company; Director, Senior Vice President, Secretary, General Counsel and Vice President, Invesco AIM Capital Management, Inc.; Chief Operating Officer and General Counsel, Liberty Ridge Capital, Inc. (an investment adviser); Vice President and Secretary, PBHG Funds (an investment company) and PBHG Insurance Series Fund (an investment company); Chief Operating Officer, General Counsel and Secretary, Old Mutual Investment Partners (a broker-dealer); General Counsel and Secretary, Old Mutual Fund Services (an administrator) and Old Mutual Shareholder Services (a shareholder servicing center); Executive Vice President, General Counsel and Secretary, Old Mutual Capital, Inc. (an investment adviser); and Vice President and Secretary, Old Mutual Advisors Funds (an investment company) | | N/A | | N/A |
T-3 Invesco Global Infrastructure Fund
Trustees and Officers—(continued)
| | | | | | | | |
Name, Year of Birth and
Position(s) Held with the Trust | | Trustee and/
or Officer Since | | Principal Occupation(s) During Past 5 Years | | Number of
Funds in Fund
Complex
Overseen by
Trustee | | Other Directorship(s)
Held by Trustee During
Past 5 Years |
| Other Officers—(continued) | | | | | | | | |
| Karen Dunn Kelley — 1960 Senior Vice President | | 2004 | | Senior Managing Director, Investments, Invesco Ltd.; Director, Co-President, Co-Chief Executive Officer, and Co-Chairman, Invesco Advisers, Inc. (formerly known as Invesco Institutional (N.A.), Inc.) (registered investment adviser); Chairman and Director, Invesco Senior Secured Management, Inc.; Senior Vice President, Invesco Management Group, Inc. (formerly known as Invesco AIM Management Group, Inc.); Executive Vice President, Invesco Distributors, Inc. (formerly known as Invesco AIM Distributors, Inc.); Director, Invesco Mortgage Capital Inc. and Invesco Management Company Limited; Senior Vice President, The Invesco Funds Formerly: Vice President, The Invesco Funds (other than AIM Treasurer’s Series Trust (Invesco Treasurer’s Series Trust), Short-Term Investments Trust and Invesco Management Trust); and President and Principal Executive Officer, The Invesco Funds (AIM Treasurer’s Series Trust (Invesco Treasurer’s Series Trust), Short-Term Investments Trust and Invesco Management Trust only); Director and President, INVESCO Asset Management (Bermuda) Ltd., Director, INVESCO Global Asset Management DAC (formerly known as INVESCO Global Asset Management Limited) and INVESCO Management S.A.; Senior Vice President, Van Kampen Investments Inc. and Invesco Advisers, Inc. (formerly known as Invesco Institutional (N.A.), Inc.) (registered investment adviser); Director and President, Fund Management Company; Chief Cash Management Officer, Director of Cash Management, Senior Vice President, and Managing Director, Invesco AIM Capital Management, Inc.; Director of Cash Management, Senior Vice President, and Vice President, Invesco Advisers, Inc. and Vice President, The Invesco Funds (AIM Treasurer’s Series Trust (Invesco Treasurer’s Series Trust), and Short-Term Investments Trust only) | | N/A | | N/A |
Kelli Gallegos — 1970 Vice President, Principal Financial Officer and Assistant Treasurer | | 2008 | | Vice President, Principal Financial Officer and Assistant Treasurer, The Invesco Funds; Assistant Treasurer, Invesco PowerShares Capital Management LLC, PowerShares Exchange-Traded Fund Trust, PowerShares Exchange-Traded Fund Trust II, PowerShares India Exchange-Traded Fund Trust, PowerShares Actively Managed Exchange-Traded Fund Trust, and PowerShares Actively Managed Exchange-Traded Commodity Fund Trust Formerly: Assistant Vice President, The Invesco Funds | | N/A | | N/A |
Tracy Sullivan — 1962 Vice President, Chief Tax Officer and Assistant Treasurer | | 2008 | | Vice President, Chief Tax Officer and Assistant Treasurer, The Invesco Funds; Assistant Treasurer, Invesco PowerShares Capital Management LLC, PowerShares Exchange-Traded Fund Trust, PowerShares Exchange-Traded Fund Trust II, PowerShares India Exchange-Traded Fund Trust, PowerShares Actively Managed Exchange-Traded Fund Trust, and PowerShares Actively Managed Exchange-Traded Commodity Fund Trust Formerly: Assistant Vice President, The Invesco Funds | | N/A | | N/A |
Crissie M. Wisdom — 1969 Anti-Money Laundering Compliance Officer | | 2013 | | Anti-Money Laundering Compliance Officer, Invesco Advisers, Inc. (formerly known as Invesco Institutional (N.A.), Inc.) (registered investment adviser), Invesco Capital Markets, Inc. (formerly known as Van Kampen Funds Inc.), Invesco Distributors, Inc., Invesco Investment Services, Inc., Invesco Management Group, Inc., The Invesco Funds, and PowerShares Exchange-Traded Fund Trust, PowerShares Exchange-Traded Fund Trust II, PowerShares India Exchange-Traded Fund Trust, PowerShares Actively Managed Exchange-Traded Fund Trust and PowerShares Actively Managed Exchange-Traded Commodity Fund Trust; Anti-Money Laundering Compliance Officer and Bank Secrecy Act Officer, INVESCO National Trust Company and Invesco Trust Company; and Fraud Prevention Manager and Controls and Risk Analysis Manager for Invesco Investment Services, Inc. Formerly: Anti-Money Laundering Compliance Officer, Van Kampen Exchange Corp. | | N/A | | N/A |
Robert R. Leveille — 1969 Chief Compliance Officer | | 2016 | | Chief Compliance Officer, Invesco Advisers, Inc. (registered investment adviser); and Chief Compliance Officer, The Invesco Funds Formerly: Chief Compliance Officer, Putnam Investments and the Putnam Funds | | N/A | | N/A |
The Statement of Additional Information of the Trust includes additional information about the Fund’s Trustees and is available upon request, without charge, by calling 1.800.959.4246. Please refer to the Fund’s Statement of Additional Information for information on the Fund’s sub-advisers.
| | | | | | |
Office of the Fund 11 Greenway Plaza, Suite 1000 Houston, TX 77046-1173 | | Investment Adviser Invesco Advisers, Inc. 1555 Peachtree Street, N.E. Atlanta, GA 30309 | | Distributor Invesco Distributors, Inc. 11 Greenway Plaza, Suite 1000 Houston, TX 77046-1173 | | Auditors PricewaterhouseCoopers LLP 1000 Louisiana Street, Suite 5800 Houston, TX 77002-5678 |
| | | |
| | | | | | |
Counsel to the Fund Stradley Ronon Stevens & Young, LLP 2005 Market Street, Suite 2600 Philadelphia, PA 19103-7018 | | Counsel to the Independent Trustees Goodwin Procter LLP 901 New York Avenue, N.W. Washington, D.C. 20001 | | Transfer Agent Invesco Investment Services, Inc. 11 Greenway Plaza, Suite 1000 Houston, TX 77046-1173 | | Custodian State Street Bank and Trust Company 225 Franklin Street Boston, MA 02110-2801 |
T-4 Invesco Global Infrastructure Fund
Explore High-Conviction Investing with Invesco

Invesco mailing information
Send general correspondence to Invesco Investment Services, Inc., P.O. Box 219078, Kansas City, MO 64121-9078.
Important notice regarding delivery of security holder documents
To reduce Fund expenses, only one copy of most shareholder documents may be mailed to shareholders with multiple accounts at the same address (Householding). Mailing of your shareholder documents may be householded indefinitely unless you instruct us otherwise. If you do not want the mailing of these documents to be combined with those for other members of your household, please contact Invesco Investment Services, Inc. at 800 959 4246 or contact your financial institution. We will begin sending you individual copies for each account within 30 days after receiving your request.
Fund holdings and proxy voting information
The Fund provides a complete list of its holdings four times in each fiscal year, at the quarter ends. For the second and fourth quarters, the lists appear in the Fund’s semiannual and annual reports to shareholders. For the first and third quarters, the Fund files the lists with the Securities and Exchange Commission (SEC) on Form N-Q. The most recent list of portfolio holdings is available at invesco.com/completeqtrholdings. Shareholders can also look up the Fund’s Forms N-Q on the SEC website at sec.gov. Copies of the Fund’s Forms N-Q may be reviewed and copied at the SEC Public Reference Room in Washington, D.C. You can obtain information on the operation of the Public Reference Room, including information about duplicating fee charges, by calling 202 551 8090 or 800 732 0330, or by electronic request at the following email address: publicinfo@sec.gov.
The SEC file numbers for the Fund are shown below.
A description of the policies and procedures that the Fund uses to determine how to vote proxies relating to portfolio securities is available without charge, upon request, from our Client Services department at 800 959 4246 or at invesco.com/proxyguidelines. The information is also available on the SEC website, sec.gov.
| | |
Information regarding how the Fund voted proxies related to its portfolio securities during the most recent 12-month period ended June 30 is available at invesco.com/proxysearch. The information is also available on the SEC website, sec.gov. Invesco Advisers, Inc. is an investment adviser; it provides investment advisory services to individual and institutional clients and does not sell securities. Invesco Distributors, Inc. is the US distributor for Invesco Ltd.’s retail mutual funds, exchange-traded funds and institutional money market funds. Both are wholly owned, indirect subsidiaries of Invesco Ltd. | |  |
| | | | |
| SEC file numbers: 811-05426 and 033-19338 | | GBLI-AR-1 | | Invesco Distributors, Inc. |
| | | | |
| | |

| | Annual Report to Shareholders | | October 31, 2016 |
| | |
| | Invesco Global Market Neutral Fund |
| | Nasdaq: |
| | A: MKNAX ∎ C: MKNCX ∎ R: MKNRX ∎ Y: MKNYX ∎ R5: MKNFX ∎ R6: MKNSX |

Letters to Shareholders
| | |

Philip Taylor | | Dear Shareholders: This annual report includes information about your Fund, including performance data and a complete list of its investments as of the close of the reporting period. Inside is a discussion of how your Fund was managed and the factors that affected its performance during the reporting period. In December 2015, the US Federal Reserve raised short-term interest rates for the first time since 2006, signaling its belief that the economy was likely to continue strengthening. Indeed, throughout the reporting period, US economic data were generally positive and the economy expanded at a moderate rate – but there were some bumps along the road. Job growth in May 2016 was very weak, but it was followed by strong increases in nonfarm payrolls in June and July. Increased concerns about global economic weakness caused US |
stock market indexes to sink at the start of calendar year 2016, but they eventually recovered; they sank again following the UK’s decision to leave the European Union, but then quickly recovered and reached record highs later in the summer. Strong demand for income-producing investments, particularly those perceived to be lower risk, benefited bonds as well as dividend-paying stocks for much of the reporting period. While economic news in the US was generally positive, news overseas was less upbeat. The European Central Bank, and central banks in China and Japan – as well as other countries – maintained extraordinarily accommodative monetary policies in response to economic weakness. As the fiscal year drew to a close, uncertainty about the outcome of the US presidential election resulted in increased market volatility; the surprise outcome after the close of the reporting period suggested that market volatility may continue for some time to come.
Short-term market volatility can prompt some investors to abandon their investment plans – and can cause others to settle for average results. The investment professionals at Invesco, in contrast, invest with high conviction, take a long-term perspective and have a passion to exceed. Invesco’s pure focus on investment management eliminates possible distractions and means that there are no competing lines of business for us to support. Just as important, we embrace a variety of investment strategies, asset classes and geographies – because we know that no single investment approach meets the diverse needs of all of our clients. We manage all our investment approaches with a passion to exceed. All our investment teams have a highly disciplined, long-term investing style that eliminates short-term decision-making. Of course, investing with high conviction can’t guarantee a profit or ensure success; no investment strategy can. To learn more about how we invest with high conviction, visit invesco.com/HighConviction.
You, too, can invest with high conviction by maintaining a long-term investment perspective and by working with your financial adviser on a regular basis. During periods of short-term market volatility or uncertainty, your financial adviser can keep you focused on your long-term investment goals – a new home, a child’s college education or a secure retirement. He or she also can share research about the economy, the markets and individual investment options.
Visit our website for more information on your investments
Our website, invesco.com/us, offers a wide range of market insights and investment perspectives. On the website, you’ll find detailed information about our funds, including performance, holdings and portfolio manager commentaries. You can access information about your account by completing a simple, secure online registration. Click on the “Need to register” link in the “Account Access” box on our homepage to get started.
In addition to the resources accessible on our website and through our mobile app, you can obtain timely updates to help you stay informed about the markets, the economy and investing by connecting with Invesco on Twitter, LinkedIn or Facebook. You can access our blog at blog.invesco.us.com. Our goal is to provide you the information you want, when and where you want it.
Finally, I’m pleased to share with you Invesco’s commitment to both the Principles for Responsible Investment and to considering environmental, social and governance issues in our robust investment process. I invite you to learn more at invesco.com/esg.
Have questions?
For questions about your account, contact an Invesco client services representative at 800 959 4246. For Invesco-related questions or comments, please email me directly at phil@invesco.com.
All of us at Invesco look forward to serving your investment management needs. Thank you for investing with us.
Sincerely,

Philip Taylor
Senior Managing Director, Invesco Ltd.
2 Invesco Global Market Neutral Fund
| | | | |
 | | Dear Fellow Shareholders: Among the many important lessons I’ve learned in more than 40 years in a variety of business endeavors is the value of a trusted advocate. As independent chair of the Invesco Funds Board, I can assure you that the members of the Board are strong advocates for the interests of investors in Invesco’s mutual funds. We work hard to represent your interests through oversight of the quality of the investment management services your funds receive and other matters important to your investment, including but not limited to: |
| Bruce Crockett | | ∎ | | Ensuring that Invesco offers a diverse lineup of mutual funds that your financial adviser can use to strive to meet your financial needs as your investment goals change over time. |
| | ∎ | | Monitoring how the portfolio management teams of the Invesco funds are performing in light of changing economic and market conditions. |
| ∎ | Assessing each portfolio management team’s investment performance within the context of the investment strategy described in the fund’s prospectus. |
∎ Monitoring for potential conflicts of interests that may impact the nature of the services that your funds receive.
We believe one of the most important services we provide our fund shareholders is the annual review of the funds’ advisory and sub-advisory contracts with Invesco Advisers and its affiliates. This review is required by the Investment Company Act of 1940 and focuses on the nature and quality of the services Invesco provides as the adviser to the Invesco funds and the reasonableness of the fees that it charges for those services. Each year, we spend months carefully reviewing information received from Invesco and a variety of independent sources, such as performance and fee data prepared by Lipper Inc., an independent, third-party firm widely recognized as a leader in its field. We also meet with our independent legal counsel and other independent advisers to review and help us assess the information that we have received. Our goal is to assure that you receive quality investment management services for a reasonable fee.
I trust the measures outlined above provide assurance that you have a worthy advocate when it comes to choosing the Invesco Funds.
As always, please contact me at bruce@brucecrockett.com with any questions or concerns you may have. On behalf of the Board, we look forward to continuing to represent your interests and serving your needs.
Sincerely,

Bruce L. Crockett
Independent Chair
Invesco Funds Board of Trustees
3 Invesco Global Market Neutral Fund
Management’s Discussion of Fund Performance
| | | | | |
Performance summary For the fiscal year ended October 31, 2016, Class A shares of Invesco Global Market Neutral Fund (the Fund), at net asset value (NAV), underperformed the Citigroup 90-Day Treasury Bill Index, the Fund’s broad market/style-specific benchmark. Your Fund’s long-term performance appears later in this report. |
| | | | | |
Fund vs. Indexes Total returns, 10/31/15 to 10/31/16, at net asset value (NAV). Performance shown does not include applicable contingent deferred sales charges (CDSC) or front-end sales charges, which would have reduced performance. |
| | | | |
| |
| Class A Shares | | | -3.64 | % |
| Class C Shares | | | -4.27 | |
| Class R Shares | | | -3.75 | |
| Class Y Shares | | | -3.43 | |
| Class R5 Shares | | | -3.43 | |
| Class R6 Shares | | | -3.33 | |
| Citigroup 90-Day Treasury Bill Indexq (Broad Market/Style-Specific Index) | | | 0.22 | |
| Lipper Alternative Equity Market Neutral Funds Index∎ (Peer Group Index) | | | 1.39 | |
| | | | |
Source(s): qFactSet Research Systems Inc.; ∎Lipper Inc. | | | | |
Market conditions and your Fund
The global economy continued to expand, albeit slowly, for the fiscal year. However, that growth became increasingly uneven across developed and emerging economies, amid continued volatility in oil prices and as the policies of central banks globally began to diverge.
An equity market rally in November 2015 was offset by negative performance in December, as a late-year crash in oil prices rattled the markets. Also in December, the US Federal Reserve (the Fed) followed
through on its commitment to normalize monetary policy by raising interest rates – its first increase since 2006 – even as the European Central Bank extended its asset purchase program and Japan introduced additional quantitative easing and negative interest rates.
Stocks began calendar year 2016 on a negative note, driven by investor concerns about economic weakness in China and falling oil prices. Markets recovered in late February and posted gains amid concerted central bank commitments to very loose monetary policy. As a result, the US
dollar fell sharply against the euro and Japanese yen, a development that was largely supportive of oil and stock prices.
All major global stock indexes experienced steep declines again in June after UK voters opted to leave the European Union. Stocks in economically sensitive sectors, including energy and financials, were hardest hit, and investors flocked to the perceived safety of US Treasuries and more defensive, dividend-paying equities often found in the telecommunication services, utilities and consumer staples sectors.
After the initial shock of the UK vote, stocks made a strong recovery, regaining most of their losses as fears of a shock to consumer confidence never materialized. For the remainder of the reporting period, emerging markets outperformed as the Fed left interest rates unchanged and expectations for an interest rate increase were delayed again.
The Fund follows a market neutral strategy, which is designed to produce a portfolio that experiences minimal influence from the return patterns of the general US stock market. As part of the investment process, the Fund evaluates fundamental and behavioral factors to forecast individual securities’ returns and risks and ranks these securities based on their attractiveness relative to industry peers. The Fund then implements its strategy by purchasing highly ranked stocks as long positions and establishing
| | | | | | | | | | |
Portfolio Composition | | | | | | | | | | |
By sector, based on total net assets | | | | | | | | | | |
| | | Equity Securities | | Gross | | Net | | |
| | | Long1 | | Short2 | | Exposure3 | | Exposure4 | | |
Industrials | | 21.0 | | 15.3 | | 36.3 | | 5.7 | | |
Information Technology | | 19.8 | | 19.5 | | 39.3 | | 0.3 | | |
Consumer Discretionary | | 13.6 | | 15.0 | | 28.6 | | -1.4 | | |
Materials | | 8.9 | | 8.1 | | 17.0 | | 0.8 | | |
Health Care | | 7.7 | | 7.0 | | 14.7 | | 0.7 | | |
Energy | | 6.9 | | 8.0 | | 14.9 | | -1.1 | | |
Consumer Staples | | 4.2 | | 3.4 | | 7.6 | | 0.8 | | |
Financials | | 3.9 | | 3.7 | | 7.6 | | 0.2 | | |
Telecommunication Services | | 2.5 | | 1.5 | | 4.0 | | 1.0 | | |
Utilities | | 1.9 | | 2.8 | | 4.7 | | -0.9 | | |
Real Estate | | 1.8 | | 6.6 | | 8.4 | | -4.8 | | |
Money Market Funds | | | | | | | | | | |
Plus Other Assets Less Liabilities | | 7.8 | | 0.0 | | 7.8 | | 7.8 | | |
Total | | 100.0 | | 90.9 | | 190.9 | | 9.1 | | |
| 1 | Represents the value of the equity securities in the portfolio. |
| 2 | Represents the value of the equity securities underlying the Fund’s equity short portfolio swap. |
| 3 | Represents the cumulative exposure of the Fund’s long and short positions. |
| 4 | Represents the net exposure of the Fund’s long and short positions. |
| | | | |
Total Net Assets | | $ | 21.9 million | |
Data presented here are as of October 31, 2016.
4 Invesco Global Market Neutral Fund
short positions in the poorly ranked stocks within their respective industries. Given minimal exposure to the market, the offsetting long and short positions generate return and manage risk.
In a market neutral construct, a positive spread between the top- and bottom-ranked stocks (long and short candidates for the portfolio) is intended to lead to outperformance relative to the Citigroup 90-Day Treasury Bill Index. During the fiscal year, the Fund was challenged by macroeconomic influences that likely hindered investor focus on individual stock fundamentals. One of the key catalysts for this behavior was the Fed’s decision to leave interest rates unchanged in mid-February which motivated investors to seek growth, focus less on quality and valuation, and assume higher risk to earn returns. Across most sectors, the Fund generated negative returns but the greatest impact was in the health care, information technology (IT) and energy sectors as these sectors represented the Fund’s highest gross exposure during the fiscal year. The best result was in the telecommunication services sector.
In the health care sector, both the long and short positions moved against us. Our long biotechnology holdings sold off early in the fiscal year as investors took profits and reduced risk given strong returns in 2015, and the potential threat of regulatory action due to skyrocketing drug prices. Later in the fiscal year, a few of the Fund’s short positions rallied off depressed levels due to positive drug development or FDA approval news, as well as acquisition activity in the industry.
In the IT sector, our short holdings outpaced the long holdings across most industries during the fiscal year. The worst results were in the computer electronics and communications equipment industries.
In the energy sector, lower-quality companies with burdensome balance sheets significantly outperformed higher-quality companies with stronger balance sheets during the fiscal year. Consequently, the Fund’s long energy holdings, particularly in the oil and gas exploration industry, failed to outperform the short holdings.
In the telecommunication services sector, both long and short holdings contributed to Fund performance during the fiscal year.
Please note that the Fund may utilize derivative instruments that include equity total return swaps and futures contracts. During the reporting period, the Fund utilized equity total return swaps to efficiently implement its strategy, but did not use futures contracts. The implementation impact of using equity total return swaps is a component of transaction costs. Derivatives may amplify traditional investment risks through the creation of leverage and may be less liquid than traditional securities.
Thank you for your investment in Invesco Global Market Neutral Fund.
The views and opinions expressed in management’s discussion of Fund performance are those of Invesco Advisers, Inc. These views and opinions are subject to change at any time based on factors such as market and economic conditions. These views and opinions may not be relied upon as investment advice or recommendations, or as an offer for a particular security. The information is not a complete analysis of every aspect of any market, country, industry, security or the Fund. Statements of fact are from sources considered reliable, but Invesco Advisers, Inc. makes no representation or warranty as to their completeness or accuracy. Although historical performance is no guarantee of future results, these insights may help you understand our investment management philosophy.
See important Fund and, if applicable, index disclosures later in this report.
| | |
 | | Michael Abata Chartered Financial Analyst, Portfolio Manager, is manager of Invesco Global Market Neutral Fund. |
| He joined Invesco in 2011. Mr. Abata earned a BA in economics from Binghamton University. |
| | |
 | | Uwe Draeger Portfolio Manager, is manager of Invesco Global Market Neutral Fund. He joined Invesco in |
| 2005. Mr. Draeger earned a Diplom-Ökonom degree from Hochschule für Ökonomie Berlin, an MA from City of London Polytechnic and an MBA from Anglia Business School (Cambridge). |
| | |
 | | Nils Huter Chartered Financial Analyst, Portfolio Manager, is manager of Invesco Global Market Neutral Fund. |
| He joined Invesco in 2007. Mr. Huter earned a business administration degree, Diplom Kaufmann (FH), the University of Applied Sciences and Arts in Hildesheim. |
| | |
 | | Charles Ko Chartered Financial Analyst, Portfolio Manager, is manager of Invesco Global Market Neutral Fund. |
| He joined Invesco in 2012. Mr. Ko earned a BS from MIT and an MBA from Yale University. |
| | |
 | | Jens Langewand Portfolio Manager, is manager of Invesco Global Market Neutral Fund. He joined Invesco in |
| 2007. Mr. Langewand earned a Diplom Kaufmann degree from the University of Münster and a PhD from the University of Augsburg. |
| | |
 | | Andrew Waisburd Portfolio Manager, is manager of Invesco Global Market Neutral Fund. He joined Invesco in |
| 2008. Dr. Waisburd earned a BS in statistics from Cornell University and an MS and a PhD in finance from Indiana University. |
| | |
 | | Donna Chapman Wilson Portfolio Manager and Director of Portfolio Management, is |
| manager of Invesco Global Market Neutral Fund. She joined Invesco in 1997. Ms. Chapman Wilson earned a BA in economics from Hampton University and an MBA in finance from the Wharton School of the University of Pennsylvania. |
5 Invesco Global Market Neutral Fund
Your Fund’s Long-Term Performance
Results of a $10,000 Investment – Oldest Share Class(es) since Inception
Fund and index data from 12/19/13
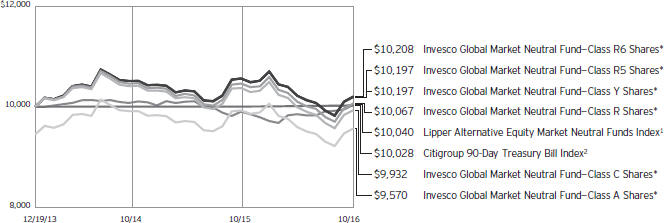
1 Source: Lipper Inc.
2 Source: FactSet Research Systems Inc.
*Includes the effect of the Adviser pay-in for an economic loss of $0.52 per share
Past performance cannot guarantee comparable future results.
The data shown in the chart include reinvested distributions, applicable sales charges and Fund expenses including
management fees. Index results include reinvested dividends, but they do not reflect sales charges. Performance of the peer group, if applicable, reflects fund expenses and management fees; performance
of a market index does not. Performance shown in the chart and table(s) does not reflect deduction of taxes a shareholder would pay on Fund distributions or sale of Fund shares.
tion or other market factors may prevent the Fund from closing out a short position at a desirable time or price and may reduce or eliminate any gain or result in a loss. In a rising market, the Fund’s short positions will cause the Fund to underperform the overall market and its peers that do not engage in shorting. If the Fund holds both long and short positions, and both positions decline simultaneously, the short positions will not provide any buffer (hedge) from declines in value of the Fund’s long positions. Certain types of short positions involve leverage, which may exaggerate any losses, potentially more than the actual cost of the investment, and will increase the volatility of the Fund’s returns.
| ∎ | | Small- and mid-capitalization companies risks. Small- and mid-capitalization companies tend to be more vulnerable to changing market conditions, may have little or no operating history or track record of success, and may have more limited product lines and markets, less experienced management and fewer financial resources than larger |
| | companies. These companies’ securities may be more volatile and less liquid than those of more established companies, and their returns may vary, sometimes significantly, from the overall securities market. |
About indexes used in this report
| ∎ | | The Citigroup 90-Day Treasury Bill Index is an unmanaged index representative of three-month Treasury bills. |
| ∎ | | The Lipper Alternative Equity Market Neutral Funds Index is an unmanaged index considered representative of funds that employ portfolio strategies generating consistent returns in both up and down markets by selecting positions with a total net market exposure of zero. |
| ∎ | | The Fund is not managed to track the performance of any particular index, including the index(es) described here, and consequently, the performance of the Fund may deviate significantly from the performance of the index(es). |
| ∎ | | A direct investment cannot be made in an index. Unless otherwise indicated, index results include reinvested dividends, |
| | and they do not reflect sales charges. Performance of the peer group, if applicable, reflects fund expenses; performance of a market index does not. |
Other information
| ∎ | | The returns shown in management’s discussion of Fund performance are based on net asset values (NAVs) calculated for shareholder transactions. Generally accepted accounting principles require adjustments to be made to the net assets of the Fund at period end for financial reporting purposes, and as such, the NAVs for shareholder transactions and the returns based on those NAVs may differ from the NAVs and returns reported in the Financial Highlights. |
| ∎ | | Industry classifications used in this report are generally according to the Global Industry Classification Standard, which was developed by and is the exclusive property and a service mark of MSCI Inc. and Standard & Poor’s. |
6 Invesco Global Market Neutral Fund
| | | | | | |
Average Annual Total Returns | | | |
| As of 10/31/16, including maximum applicable sales charges | | | |
| | | | |
| | |
Class A Shares | | | | | | |
Inception (12/19/13) | | | -1.52 | %* | | |
1 Year | | | -8.94 | | | |
| | |
Class C Shares | | | | | | |
Inception (12/19/13) | | | -0.24 | %* | | |
1 Year | | | -5.22 | | | |
| | |
Class R Shares | | | | | | |
Inception (12/19/13) | | | 0.23 | %* | | |
1 Year | | | -3.75 | | | |
| | |
Class Y Shares | | | | | | |
Inception (12/19/13) | | | 0.68 | %* | | |
1 Year | | | -3.43 | | | |
| | |
Class R5 Shares | | | | | | |
Inception (12/19/13) | | | 0.68 | %* | | |
1 Year | | | -3.43 | | | |
| | |
Class R6 Shares | | | | | | |
Inception (12/19/13) | | | 0.72 | %* | | |
1 Year | | | -3.33 | | | |
| * | Amount includes the effect of the Adviser pay-in for an economic loss of $0.41 per share for the fiscal period-end 2014 and $0.11 for fiscal period-end 2015. Had the pay-in not been made, average annual total returns were estimated at -3.36%, -2.13%, -1.64%, -1.18%, -1.18% and -1.15% for Class A, Class C, Class R, Class Y, Class R5 and Class R6 shares, respectively. |
The performance data quoted represent past performance and cannot guarantee comparable future results; current performance may be lower or higher. Please visit invesco.com/performance for the most recent month-end performance. Performance figures reflect reinvested distributions, changes in net asset value and the effect of the maximum sales charge unless otherwise stated. Investment return and principal value will fluctuate so that you may have a gain or loss when you sell shares.
The net annual Fund operating expense ratio set forth in the most recent Fund prospectus as of the date of this report for Class A, Class C, Class R, Class Y, Class R5 and Class R6 shares was 1.62%, 2.37%, 1.87%, 1.37%, 1.37% and 1.37%, respectively.1,2 The total annual Fund operating expense ratio set forth in the most recent Fund prospectus as of the date of this report for Class A, Class C, Class R, Class Y, Class R5 and Class R6 shares was 3.29%, 4.04%, 3.54%, 3.04%, 2.98% and 2.98%, respectively. The
| | | | |
Average Annual Total Returns | | |
| As of 9/30/16, the most recent calendar quarter end, including maximum applicable sales charges | | |
| | |
Class A Shares | | | | |
Inception (12/19/13) | | -1.93%** | | |
1 Year | | -9.69 | | |
| | |
Class C Shares | | | | |
Inception (12/19/13) | | -0.58%** | | |
1 Year | | -6.00 | | |
| | |
Class R Shares | | | | |
Inception (12/19/13) | | -0.13%** | | |
1 Year | | -4.54 | | |
| | |
Class Y Shares | | | | |
Inception (12/19/13) | | 0.34%** | | |
1 Year | | -4.12 | | |
| | |
Class R5 Shares | | | | |
Inception (12/19/13) | | 0.34%** | | |
1 Year | | -4.22 | | |
| | |
Class R6 Shares | | | | |
Inception (12/19/13) | | 0.38%** | | |
1 Year | | -4.12 | | |
| ** | Amount includes the effect of the Adviser pay-in for an economic loss of $0.41 per share for the fiscal period-end 2014 and $0.11 for fiscal period-end 2015. Had the pay-in not been made, average annual total returns were estimated at -3.83%, -2.54%, -2.08%, -1.60%, -1.60% and -1.56% for Class A, Class C, Class R, Class Y, Class R5 and Class R6 shares, respectively. |
expense ratios presented above may vary from the expense ratios presented in other sections of this report that are based on expenses incurred during the period covered by this report.
Class A share performance reflects the maximum 5.50% sales charge, and Class C share performance reflects the applicable contingent deferred sales charge (CDSC) for the period involved. The CDSC on Class C shares is 1% for the first year after purchase. Class R, Class Y, Class R5 and Class R6 class shares do not have a front-end sales charge or a CDSC; therefore, performance is at net asset value.
The performance of the Fund’s share classes will differ primarily due to different sales charge structures and class expenses.
Fund performance reflects any applicable fee waivers and/or expense reimbursements. Had the adviser not waived fees and/or reimbursed expenses currently or in the past, returns would have been lower. See current prospectus for more information.
| 1 | Total annual Fund operating expenses after any contractual fee waivers and/or expense reimbursements by the adviser in effect through at least June 30, 2018. See current prospectus for more information. |
| 2 | Total annual Fund operating expenses after any contractual fee waivers and/or expense reimbursements by the adviser in effect through at least February 28, 2017. See current prospectus for more information. |
7 Invesco Global Market Neutral Fund
Invesco Global Market Neutral Fund’s investment objective is to seek to provide a positive return over a full market cycle from a broadly diversified portfolio of stocks while seeking to limit exposure to the general risks associated with stock market investing.
| ∎ | Unless otherwise stated, information presented in this report is as of October 31, 2016, and is based on total net assets. |
| ∎ | Unless otherwise noted, all data provided by Invesco. |
| ∎ | To access your Fund’s reports/prospectus, visit invesco.com/fundreports. |
About share classes
| ∎ | Class R shares are generally available only to employer sponsored retirement and benefit plans. Please see the prospectus for more information. |
| ∎ | Class Y shares are available only to certain investors. Please see the prospectus for more information. |
| ∎ | Class R5 shares and Class R6 shares are primarily intended for employer sponsored retirement and benefit plans that meet certain standards and for institutional investors. Please see the prospectus for more information. |
Principal risks of investing in the Fund
| ∎ | Derivatives risk. The value of a derivative instrument depends largely on (and is derived from) the value of an underlying security, currency, commodity, interest rate, index or other asset (each referred to as an underlying asset). In addition to risks relating to the underlying assets, the use of derivatives may include other, possibly greater, risks, including counterparty, leverage and liquidity risks. Counterparty risk is the risk that the counterparty to the derivative contract will default on its obligation to pay the Fund the amount owed or otherwise perform under the derivative contract. Derivatives create leverage risk because they do not require payment up front equal to the economic exposure created by owning the derivative. As a result, an adverse change in the value of the underlying asset could result in the Fund sustaining a loss that is substantially greater than the amount invested in the derivative, which may make the Fund’s returns more volatile and increase the risk of loss. Derivative instruments may also be less liquid than more traditional investments and the Fund may be unable to sell or close out its derivative positions at a desirable time or price. This risk may be more acute under adverse market conditions, |
| | during which the Fund may be most in need of liquidating its derivative positions. Derivatives may also be harder to value, less tax efficient and subject to changing government regulation that could impact the Fund’s ability to use certain derivatives or their cost. Also, derivatives used for hedging or to gain or limit exposure to a particular market segment may not provide the expected benefits, particularly during adverse market conditions. These risks are greater for the Fund than most other mutual funds because the Fund will implement its investment strategy primarily through derivative instruments rather than direct investments in stocks/bonds. |
| ∎ | Foreign securities risk. The Fund’s foreign investments may be adversely affected by political and social instability, changes in economic or taxation policies, difficulty in enforcing obligations, decreased liquidity or increased volatility. Foreign investments also involve the risk of the possible seizure, nationalization or expropriation of the issuer or foreign deposits (in which the Fund could lose its entire investments in a certain market) and the possible adoption of foreign governmental restrictions such as exchange controls. Unless the Fund has hedged its foreign securities risk, foreign securities risk also involves the risk of negative foreign currency rate fluctuations, which may cause the value of securities denominated in such foreign currency (or other instruments through which the Fund has exposure to foreign currencies) to decline in value. Currency exchange rates may fluctuate significantly over short periods of time. Currency hedging strategies, if used, are not always successful. |
| ∎ | Management risk. The Fund is actively managed and depends heavily on the Adviser’s judgment about markets, interest rates or the attractiveness, relative values, liquidity, or potential appreciation |
| | of particular investments made for the Fund’s portfolio. The Fund could experience losses if these judgments prove to be incorrect. Additionally, legislative, regulatory, or tax developments may adversely affect management of the Fund and, therefore, the ability of the Fund to achieve its investment objective. In particular, there is no guarantee that the portfolio manager’s stock selection process will produce a market neutral portfolio that reduces or eliminates the Fund’s exposure to general US stock market risk, sector or industry-specific risk or market capitalization risk. In addition, the Fund’s market neutral investment strategy will likely cause the Fund to underperform the broader US equity market during market rallies. Such underperformance could be significant during sudden or significant market rallies. |
| ∎ | Market risk. The market values of the Fund’s investments, and therefore the value of the Fund’s shares, will go up and down, sometimes rapidly or unpredictably. Market risk may affect a single issuer, industry or section of the economy, or it may affect the market as a whole. Individual stock prices tend to go up and down more dramatically than those of certain other types of investments, such as bonds. During a general downturn in the financial markets, multiple asset classes may decline in value. When markets perform well, there can be no assurance that specific investments held by the Fund will rise in value. |
| ∎ | Preferred securities risk. Preferred securities are subject to issuer-specific and market risks applicable generally to equity securities. Preferred securities also may be subordinated to bonds or other debt instruments, subjecting them to a greater risk of non-payment, may be less liquid than many other securities, such as common stocks, and generally offer no voting rights with respect to the issuer. |
| ∎ | Short position risk. Because the Fund’s potential loss on a short position arises from increases in the value of the asset sold short, the Fund will incur a loss on a short position, which is theoretically unlimited, if the price of the asset sold short increases from the short sale price. The counterparty to a short posi- |
continued on page 6
|
This report must be accompanied or preceded by a currently effective Fund prospectus, which contains more complete information, including sales charges and expenses. Investors should read it carefully before investing. |
NOT FDIC INSURED | MAY LOSE VALUE | NO BANK GUARANTEE
8 Invesco Global Market Neutral Fund
Schedule of Investments
October 31, 2016
| | | | | | | | |
| | | Shares | | | Value | |
Common Stocks & Other Equity Interests–92.15% | |
| Australia–2.04% | |
BlueScope Steel Ltd. | | | 26,621 | | | $ | 157,944 | |
Cochlear Ltd. | | | 862 | | | | 83,752 | |
Medibank Private Ltd. | | | 25,396 | | | | 49,839 | |
Metcash Ltd.(a) | | | 40,564 | | | | 61,402 | |
Treasury Wine Estates Ltd. | | | 11,633 | | | | 95,034 | |
| | | | | | | | 447,971 | |
|
| Canada–5.81% | |
ARC Resources Ltd. | | | 10,600 | | | | 179,953 | |
Barrick Gold Corp. | | | 7,933 | | | | 139,585 | |
Canadian Tire Corp., Ltd.–Class A | | | 1,000 | | | | 97,208 | |
Crescent Point Energy Corp. | | | 6,800 | | | | 80,966 | |
Enerplus Corp. | | | 23,115 | | | | 155,622 | |
Kinross Gold Corp.(a) | | | 20,800 | | | | 80,796 | |
Metro Inc. | | | 4,500 | | | | 139,102 | |
Russel Metals, Inc. | | | 4,133 | | | | 65,789 | |
Teck Resources Ltd.–Class B | | | 15,511 | | | | 334,911 | |
| | | | | | | | 1,273,932 | |
|
| China–0.91% | |
Yangzijiang Shipbuilding Holdings Ltd. | | | 375,600 | | | | 200,679 | |
|
| Denmark–2.06% | |
Dfds A/S | | | 709 | | | | 34,268 | |
Pandora A/S | | | 380 | | | | 49,464 | |
Vestas Wind Systems A/S | | | 4,575 | | | | 366,967 | |
| | | | | | | | 450,699 | |
|
| Finland–0.56% | |
UPM-Kymmene Oyj | | | 5,261 | | | | 122,435 | |
|
| France–2.32% | |
Nexans S.A.(a) | | | 686 | | | | 38,993 | |
Nexity S.A. | | | 2,200 | | | | 110,543 | |
Peugeot S.A.(a) | | | 17,359 | | | | 260,017 | |
Valeo S.A. | | | 1,737 | | | | 100,107 | |
| | | | | | | | 509,660 | |
|
| Germany–3.84% | |
Aurubis AG | | | 2,106 | | | | 109,559 | |
Hochtief AG | | | 1,508 | | | | 205,850 | |
Osram Licht AG | | | 646 | | | | 36,627 | |
ProSiebenSat.1 Media SE | | | 4,950 | | | | 213,334 | |
Software AG | | | 5,317 | | | | 193,196 | |
Suedzucker AG | | | 3,302 | | | | 84,602 | |
| | | | | | | | 843,168 | |
|
| Hong Kong–0.53% | |
CLP Holdings Ltd. | | | 6,000 | | | | 60,975 | |
NWS Holdings Ltd. | | | 31,000 | | | | 54,921 | |
| | | | | | | | 115,896 | |
| | | | | | | | |
| | | Shares | | | Value | |
| Italy–0.22% | |
A2A S.p.A. | | | 35,738 | | | $ | 48,744 | |
|
| Japan–20.52% | |
Aeon Mall Co., Ltd. | | | 6,100 | | | | 90,745 | |
Asahi Glass Co., Ltd. | | | 5,000 | | | | 35,045 | |
Dai Nippon Printing Co., Ltd. | | | 27,000 | | | | 271,009 | |
Daiichi Sankyo Co., Ltd. | | | 5,600 | | | | 134,706 | |
Daiichikosho Co., Ltd. | | | 2,400 | | | | 104,477 | |
Daiwa House Industry Co., Ltd. | | | 2,500 | | | | 68,803 | |
Denka Co., Ltd. | | | 32,000 | | | | 145,559 | |
Fuji Heavy Industries Ltd. | | | 1,300 | | | | 50,617 | |
Fujikura Ltd. | | | 10,000 | | | | 58,933 | |
Fujitsu Ltd. | | | 52,000 | | | | 308,211 | |
Haseko Corp. | | | 6,300 | | | | 61,329 | |
Ibiden Co., Ltd. | | | 24,300 | | | | 352,611 | |
Iida Group Holdings Co., Ltd. | | | 18,400 | | | | 356,016 | |
JTEKT Corp. | | | 4,800 | | | | 70,983 | |
Konica Minolta Inc. | | | 11,000 | | | | 98,490 | |
LIXIL Group Corp. | | | 4,200 | | | | 96,480 | |
Marubeni Corp. | | | 17,400 | | | | 91,567 | |
Medipal Holdings Corp. | | | 8,400 | | | | 143,289 | |
Miraca Holdings Inc. | | | 2,000 | | | | 96,412 | |
Mitsubishi Corp. | | | 3,200 | | | | 69,911 | |
Mitsui & Co., Ltd. | | | 16,500 | | | | 229,047 | |
mixi, Inc. | | | 8,200 | | | | 302,227 | |
Nippon Telegraph & Telephone Corp. | | | 3,600 | | | | 159,977 | |
Panasonic Corp. | | | 6,300 | | | | 65,752 | |
Penta-Ocean Construction Co., Ltd. | | | 43,000 | | | | 256,692 | |
TDK Corp. | | | 600 | | | | 41,444 | |
Tokyo Gas Co., Ltd. | | | 56,000 | | | | 253,895 | |
Toppan Printing Co., Ltd. | | | 26,000 | | | | 244,637 | |
West Japan Railway Co. | | | 3,900 | | | | 240,698 | |
| | | | | | | | 4,499,562 | |
|
| Macau–0.33% | |
MGM China Holdings Ltd. | | | 43,600 | | | | 72,185 | |
| | |
| Netherlands–0.66% | | | | | | | | |
Corbion N.V. | | | 2,210 | | | | 50,995 | |
PostNL N.V.(a) | | | 10,140 | | | | 47,775 | |
Randstad Holding N.V. | | | 895 | | | | 46,033 | |
| | | | | | | | 144,803 | |
|
| New Zealand–0.37% | |
SKYCITY Entertainment Group Ltd. | | | 29,153 | | | | 81,299 | |
|
| Norway–0.98% | |
SalMar ASA | | | 6,614 | | | | 214,681 | |
|
| Singapore–0.76% | |
SATS Ltd. | | | 47,900 | | | | 166,651 | |
See accompanying Notes to Financial Statements which are an integral part of the financial statements.
9 Invesco Global Market Neutral Fund
| | | | | | | | |
| | | Shares | | | Value | |
| Spain–1.56% | |
Endesa, S.A. | | | 2,608 | | | $ | 55,440 | |
Mediaset Espana Comunicacion S.A. | | | 15,093 | | | | 168,583 | |
Prosegur Cia de Seguridad S.A. | | | 16,147 | | | | 117,342 | |
| | | | | | | | 341,365 | |
|
| Sweden–0.97% | |
Intrum Justitia AB | | | 6,916 | | | | 213,256 | |
|
| Switzerland–2.71% | |
Forbo Holding AG | | | 34 | | | | 43,361 | |
Georg Fischer AG | | | 232 | | | | 205,548 | |
Lonza Group AG | | | 1,267 | | | | 239,175 | |
Oriflame Golding AG(a) | | | 2,868 | | | | 105,455 | |
| | | | | | | | 593,539 | |
|
| United Kingdom–7.79% | |
Berendsen PLC | | | 11,940 | | | | 141,154 | |
Dechra Pharmaceuticals PLC | | | 4,478 | | | | 73,708 | |
Dominos Pizza Group PLC | | | 17,301 | | | | 72,009 | |
Fiat Chrysler Automobiles N.V. | | | 23,745 | | | | 173,861 | |
GlaxoSmithKline PLC | | | 10,088 | | | | 199,369 | |
Go-Ahead Group PLC | | | 1,979 | | | | 50,230 | |
Moneysupermarket.com Group PLC | | | 50,706 | | | | 162,305 | |
Noble Corp. PLC | | | 32,600 | | | | 161,044 | |
QinetiQ Group PLC | | | 85,987 | | | | 241,870 | |
Royal Dutch Shell PLC | | | 1,828 | | | | 47,179 | |
Subsea 7 S.A.(a) | | | 13,615 | | | | 152,250 | |
Synthomer PLC | | | 8,800 | | | | 38,490 | |
Vodafone Group PLC | | | 43,543 | | | | 119,537 | |
WH Smith PLC | | | 4,232 | | | | 76,160 | |
| | | | | | | | 1,709,166 | |
|
| United States–37.21% | |
Abercrombie & Fitch Co.–Class A | | | 7,500 | | | | 109,575 | |
Amgen Inc. | | | 800 | | | | 112,928 | |
Annaly Capital Management Inc. | | | 6,200 | | | | 64,232 | |
Apple Inc. | | | 1,752 | | | | 198,922 | |
AT&T Inc. | | | 1,027 | | | | 37,783 | |
Best Buy Co., Inc. | | | 4,500 | | | | 175,095 | |
Boeing Co. (The) | | | 1,722 | | | | 245,265 | |
Cabot Corp. | | | 7,286 | | | | 379,892 | |
Chemours Co. (The) | | | 3,058 | | | | 50,243 | |
Cisco Systems, Inc. | | | 12,793 | | | | 392,489 | |
Citigroup Inc. | | | 5,761 | | | | 283,153 | |
Comcast Corp. -Class A | | | 2,200 | | | | 136,004 | |
Commercial Metals Co. | | | 5,000 | | | | 78,550 | |
CONSOL Energy Inc. | | | 4,463 | | | | 75,648 | |
Continental Resources, Inc.(a) | | | 1,198 | | | | 58,594 | |
Darden Restaurants, Inc. | | | 2,200 | | | | 142,538 | |
Dean Foods Co. | | | 6,424 | | | | 117,302 | |
Delta Air Lines, Inc. | | | 3,500 | | | | 146,195 | |
| | | | | | | | |
| | | Shares | | | Value | |
| United States–(continued) | |
Denbury Resources Inc.(a) | | | 17,860 | | | $ | 42,686 | |
E*TRADE Financial Corp.(a) | | | 3,445 | | | | 97,011 | |
eBay Inc.(a) | | | 4,100 | | | | 116,891 | |
Ensco PLC–Class A | | | 20,162 | | | | 157,667 | |
Gilead Sciences, Inc. | | | 4,289 | | | | 315,799 | |
Hologic, Inc.(a) | | | 3,800 | | | | 136,838 | |
HP Inc. | | | 26,474 | | | | 383,608 | |
Huntington Ingalls Industries, Inc. | | | 600 | | | | 96,816 | |
Intel Corp. | | | 10,286 | | | | 358,673 | |
Lear Corp. | | | 1,135 | | | | 139,355 | |
Leidos Holdings, Inc. | | | 7,286 | | | | 302,879 | |
LyondellBasell Industries N.V.–Class A | | | 800 | | | | 63,640 | |
Michael Kors Holdings Ltd.(a) | | | 2,700 | | | | 137,106 | |
Navient Corp. | | | 8,176 | | | | 104,489 | |
NetApp, Inc. | | | 2,700 | | | | 91,638 | |
Newmont Mining Corp. | | | 5,507 | | | | 203,979 | |
Nuance Communications, Inc.(a) | | | 9,193 | | | | 128,886 | |
NVIDIA Corp. | | | 2,708 | | | | 192,701 | |
Pilgrim’s Pride Corp. | | | 2,900 | | | | 63,336 | |
Pitney Bowes Inc. | | | 3,700 | | | | 66,008 | |
Public Storage | | | 597 | | | | 127,591 | |
QUALCOMM, Inc. | | | 3,398 | | | | 233,511 | |
Range Resources Corp. | | | 1,322 | | | | 44,671 | |
RR Donnelley & Sons CoRR Donnelley & Sons Co. | | | 8,028 | | | | 142,497 | |
Teradata Corp.(a) | | | 2,146 | | | | 57,856 | |
Teradyne, Inc. | | | 11,100 | | | | 258,519 | |
Tesoro Corp. | | | 669 | | | | 56,845 | |
United Therapeutics Corp.(a) | | | 404 | | | | 48,508 | |
Urban Outfitters, Inc.(a) | | | 2,794 | | | | 93,459 | |
Valero Energy Corp. | | | 4,067 | | | | 240,929 | |
VeriSign, Inc.(a) | | | 1,900 | | | | 159,638 | |
Verizon Communications Inc. | | | 4,770 | | | | 229,437 | |
Voya Financial, Inc. | | | 8,700 | | | | 265,785 | |
Wal-Mart Stores, Inc. | | | 634 | | | | 44,393 | |
WellCare Health Plans Inc.(a) | | | 887 | | | | 100,684 | |
Western Refining, Inc. | | | 1,800 | | | | 51,930 | |
| | | | | | | | 8,160,667 | |
Total Common Stocks & Other Equity Interests
(Cost $18,684,532) | | | | 20,210,358 | |
| | |
Money Market Funds–4.26% | | | | | | | | |
Government & Agency Portfolio, 0.29%(b) | | | 560,789 | | | | 560,789 | |
Treasury Portfolio, 0.22%(b) | | | 373,859 | | | | 373,859 | |
Total Money Market Funds
(Cost $934,648) | | | | 934,648 | |
TOTAL INVESTMENTS–96.41%
(Cost $19,619,180) | | | | 21,145,006 | |
OTHER ASSETS LESS LIABILITIES–3.59% | | | | | | | 786,288 | |
NET ASSETS–100.00% | | | | | | $ | 21,931,294 | |
Notes to Schedule of Investments:
| (a) | Non-income producing security. |
| (b) | The money market fund and the Fund are affiliated by having the same investment adviser. The rate shown is the 7-day SEC standardized yield as of October 31, 2016. |
See accompanying Notes to Financial Statements which are an integral part of the financial statements.
10 Invesco Global Market Neutral Fund
| | | | | | | | | | | | | | | | | | | | |
| Open Over-The-Counter Total Return Swap Agreements | |
| Reference Entity | | Counterparty | | Expiration Date | | | Floating Rate Index(1) | | Notional
Value | | | Unrealized Appreciation
(Depreciation)(2) | | | Net Value of
Reference
Entities | |
Australia Equity Securities-Short | | Morgan Stanley & Co. LLC | | | 01/23/2017 | | | Federal Funds floating rate | | $ | (339,151 | ) | | $ | 678 | | | $ | (334,892 | ) |
Canada Equity Securities-Short | | Morgan Stanley & Co. LLC | | | 01/23/2017 | | | Federal Funds floating rate | | | (1,132,470 | ) | | | 14,690 | | | | (1,116,933 | ) |
Denmark Equity Securities-Short | | Morgan Stanley & Co. LLC | | | 01/23/2017 | | | Federal Funds floating rate | | | (271,694 | ) | | | 7,811 | | | | (263,878 | ) |
Hong Kong Equity Securities-Short | | Morgan Stanley & Co. LLC | | | 01/23/2017 | | | Federal Funds floating rate | | | (105,143 | ) | | | (1,576 | ) | | | (106,717 | ) |
Japan Equity Securities-Short | | Morgan Stanley & Co. LLC | | | 01/23/2017 | | | Federal Funds floating rate | | | (4,549,107 | ) | | | (53,644 | ) | | | (4,590,057 | ) |
Norway Equity Securities-Short | | Morgan Stanley & Co. LLC | | | 01/23/2017 | | | Federal Funds floating rate | | | (199,221 | ) | | | 4,656 | | | | (194,562 | ) |
Singapore Equity Securities-Short | | Morgan Stanley & Co. LLC | | | 01/23/2017 | | | Federal Funds floating rate | | | (566,637 | ) | | | 11,240 | | | | (555,381 | ) |
Spain Equity Securities-Short | | Morgan Stanley & Co. LLC | | | 02/23/2017 | | | Federal Funds floating rate | | | (288,727 | ) | | | 12,260 | | | | (276,462 | ) |
Supranational Equity Securities-Short | | Morgan Stanley & Co. LLC | | | 01/23/2017 | | | Federal Funds floating rate | | | (2,166,347 | ) | | | 4,315 | | | | (2,161,981 | ) |
Sweden Equity Securities-Short | | Morgan Stanley & Co. LLC | | | 01/23/2017 | | | Federal Funds floating rate | | | (208,571 | ) | | | 4,612 | | | | (203,955 | ) |
Switzerland Equity Securities-Short | | Morgan Stanley & Co. LLC | | | 01/23/2017 | | | Federal Funds floating rate | | | (687,958 | ) | | | 9,759 | | | | (678,200 | ) |
United Kingdom Equity Securities-Short | | Morgan Stanley & Co. LLC | | | 01/23/2017 | | | Federal Funds floating rate | | | (1,313,532 | ) | | | 16,517 | | | | (1,293,093 | ) |
United States Equity Securities-Short | | Morgan Stanley & Co. LLC | | | 01/22/2017 | | | Federal Funds floating rate | | | (8,301,587 | ) | | | 146,684 | | | | (8,153,323 | ) |
Total Return Swap Agreements — Equity Risk | | | $ | 178,002 | | | $ | (19,929,434 | ) |
| (1) | The Fund receives or pays the total return on the short positions underlying the total return swap, and receives a specific Federal Funds floating rate. The total return swaps are settled in U.S. Dollars. |
| (2) | Amount includes $(22,709) of dividends and financing fees. |
The following table represents the individual short positions and related values of equity securities underlying the total return swaps with Morgan Stanley & Co. LLC, as of October 31, 2016.
| | | | | | | | |
| | | Shares | | | Value | |
Equity Securities — Short | | | | | | | | |
| Australia | | | | | | | | |
Australia and New Zealand Banking Group Ltd. | | | (2,440 | ) | | $ | (51,689 | ) |
Bank of Queensland Ltd. | | | (12,361 | ) | | | (98,349 | ) |
Crown Resorts Ltd. | | | (22,316 | ) | | | (184,854 | ) |
| | | | | | | | (334,892 | ) |
| | |
| Canada | | | | | | | | |
AltaGas Ltd. | | | (4,300 | ) | | | (106,406 | ) |
Enbridge Inc. | | | (3,100 | ) | | | (133,869 | ) |
Gildan Activewear Inc. | | | (12,015 | ) | | | (308,605 | ) |
MacDonald, Dettwiler and Associates Ltd. | | | (1,200 | ) | | | (68,685 | ) |
PrairieSky Royalty Ltd. | | | (5,420 | ) | | | (117,876 | ) |
Pretium Resources Inc. | | | (8,477 | ) | | | (82,858 | ) |
Rogers Communications, Inc.–Class B | | | (2,200 | ) | | | (88,508 | ) |
Silver Wheaton Crop. | | | (6,100 | ) | | | (146,991 | ) |
Stella-Jones Inc. | | | (1,779 | ) | | | (63,135 | ) |
| | | | | | | | (1,116,933 | ) |
| | |
| Denmark | | | | | | | | |
Genmab A/S | | | (1,253 | ) | | | (206,742 | ) |
Jyske Bank A/S | | | (1,259 | ) | | | (57,136 | ) |
| | | | | | | | (263,878 | ) |
| | |
| Hong Kong | | | | | | | | |
Hong Kong & China Gas Co., Ltd. | | | (54,450 | ) | | | (106,717 | ) |
| | |
| Japan | | | | | | | | |
Asics Corp. | | | (5,600 | ) | | | (119,727 | ) |
Fast Retailing Co., Ltd. | | | (500 | ) | | | (169,075 | ) |
Hamamatsu Photonics K.K. | | | (12,300 | ) | | | (372,994 | ) |
| | | | | | | | |
| | | Shares | | | Value | |
| Japan-(continued) | |
JGC Corp. | | | (22,100 | ) | | $ | (391,779 | ) |
Kansai Paint Co., Ltd. | | | (12,100 | ) | | | (260,773 | ) |
Keihan Holdings Co., Ltd. | | | (33,000 | ) | | | (223,115 | ) |
Keyence Corp. | | | (500 | ) | | | (367,425 | ) |
Kikkoman Corp. | | | (2,000 | ) | | | (63,796 | ) |
Kintetsu Group Holdings Co., Ltd. | | | (8,000 | ) | | | (32,346 | ) |
Kobe Steel, Ltd. | | | (7,700 | ) | | | (63,735 | ) |
Kyushu Electric Power Co., Inc. | | | (11,100 | ) | | | (100,875 | ) |
M3 Inc. | | | (4,200 | ) | | | (128,165 | ) |
Maruichi Steel Tube Ltd. | | | (1,400 | ) | | | (45,191 | ) |
MISUMI Group Inc. | | | (12,200 | ) | | | (223,024 | ) |
MonotaRO Co., Ltd. | | | (7,400 | ) | | | (180,792 | ) |
NGK Spark Plug Co., Ltd. | | | (2,000 | ) | | | (39,594 | ) |
Nidec Corp. | | | (2,200 | ) | | | (213,360 | ) |
Nintendo Co., Ltd. | | | (500 | ) | | | (121,299 | ) |
Nippon Paint Holdings Co., Ltd. | | | (7,800 | ) | | | (266,285 | ) |
Shimadzu Corp. | | | (5,000 | ) | | | (72,903 | ) |
Shimano Inc. | | | (1,500 | ) | | | (256,902 | ) |
SoftBank Group Corp. | | | (1,300 | ) | | | (81,844 | ) |
Sumco Corp. | | | (8,400 | ) | | | (88,273 | ) |
Topcon Corp. | | | (13,400 | ) | | | (200,748 | ) |
Welcia Holdings Co., Ltd. | | | (3,200 | ) | | | (218,796 | ) |
Yamaha Motor Co., Ltd. | | | (12,900 | ) | | | (287,241 | ) |
| | | | | | | | (4,590,057 | ) |
| | |
| Norway | | | | | | | | |
Schibsted ASA–Class A | | | (5,829 | ) | | | (139,749 | ) |
Schibsted ASA–Class B | | | (2,435 | ) | | | (54,813 | ) |
| | | | | | | | (194,562 | ) |
See accompanying Notes to Financial Statements which are an integral part of the financial statements.
11 Invesco Global Market Neutral Fund
| | | | | | | | |
| | | Shares | | | Value | |
| Singapore | | | | | | | | |
City Developments Ltd. | | | (30,700 | ) | | $ | (187,358 | ) |
Noble Group Ltd. | | | (327,800 | ) | | | (39,115 | ) |
Sembcorp Industries Ltd. | | | (156,000 | ) | | | (283,708 | ) |
Singapore Post Ltd. | | | (39,300 | ) | | | (45,200 | ) |
| | | | | | | | (555,381 | ) |
| | |
| Spain | | | | | | | | |
Banco Popular Espanol S.A. | | | (29,998 | ) | | | (32,897 | ) |
Cellnex Telecom S.A. | | | (4,843 | ) | | | (79,533 | ) |
Inmobiliaria Colonial S.A. | | | (23,228 | ) | | | (164,032 | ) |
| | | | | | | | (276,462 | ) |
| | |
| Supranational | | | | | | | | |
Alstom S.A. | | | (5,672 | ) | | | (152,361 | ) |
Altice NV–Class A | | | (9,092 | ) | | | (167,676 | ) |
Banco Popolare SC | | | (25,730 | ) | | | (74,115 | ) |
Bayerische Motoren Werke AG | | | (1,992 | ) | | | (173,560 | ) |
Bilfinger Berger SE | | | (1,162 | ) | | | (40,940 | ) |
Celesio AG | | | (2,075 | ) | | | (58,187 | ) |
Daimler AG | | | (5,931 | ) | | | (422,613 | ) |
Luxottica Group S.p.A. | | | (1,561 | ) | | | (77,711 | ) |
MorphoSys AG | | | (5,675 | ) | | | (251,245 | ) |
Remy Cointreau S.A. | | | (691 | ) | | | (56,056 | ) |
SBM Offshore N.V. | | | (13,691 | ) | | | (196,658 | ) |
Vonovia SE | | | (3,970 | ) | | | (139,829 | ) |
Yoox Net-A-Porter Group S.p.A. | | | (3,673 | ) | | | (105,639 | ) |
Zodiac Aerospace | | | (10,083 | ) | | | (245,391 | ) |
| | | | | | | | (2,161,981 | ) |
| | |
| Sweden | | | | | | | | |
Fabege AB | | | (5,848 | ) | | | (98,806 | ) |
Lundin Petroleum AB | | | (2,469 | ) | | | (44,422 | ) |
Saab AB–Class B | | | (1,714 | ) | | | (60,727 | ) |
| | | | | | | | (203,955 | ) |
| | |
| Switzerland | | | | | | | | |
Barry Callebaut AG | | | (49 | ) | | | (61,006 | ) |
Chocoladefabriken Lindt & Spruengli AG | | | (20 | ) | | | (103,886 | ) |
Cie Financiere Richemont S.A. | | | (1,057 | ) | | | (67,989 | ) |
Credit Suisse Group AG | | | (11,223 | ) | | | (156,740 | ) |
LafargeHolcim Ltd. | | | (1,788 | ) | | | (95,494 | ) |
OC Oerlikon Corp. AG | | | (9,895 | ) | | | (93,095 | ) |
Panalpina Welttransport Holding AG | | | (770 | ) | | | (99,990 | ) |
| | | | | | | | (678,200 | ) |
| | |
| United Kingdom | | | | | | | | |
Amec Foster Wheeler PLC | | | (12,603 | ) | | | (68,974 | ) |
Antofagasta PLC | | | (19,552 | ) | | | (129,928 | ) |
BBA Aviation PLC | | | (107,257 | ) | | | (339,441 | ) |
BTG PLC | | | (6,662 | ) | | | (53,646 | ) |
Capital & Counties Properties PLC | | | (85,749 | ) | | | (302,541 | ) |
Dixons Carphone PLC | | | (28,932 | ) | | | (111,426 | ) |
Essentra PLC | | | (9,191 | ) | | | (57,365 | ) |
Fresnillo PLC | | | (6,116 | ) | | | (122,750 | ) |
| | | | | | | | |
| | | Shares | | | Value | |
| United Kingdom-(continued) | | | | | | | | |
Paysafe Group PLC | | | (9,474 | ) | | $ | (50,203 | ) |
Tesco PLC | | | (22,030 | ) | | | (56,819 | ) |
| | | | | | | | (1,293,093 | ) |
| | |
| United States | | | | | | | | |
Acadia Healthcare Co., Inc. | | | (4,600 | ) | | | (165,416 | ) |
Alphabet Inc.–Class A | | | (100 | ) | | | (80,990 | ) |
Alphabet Inc.–Class C | | | (423 | ) | | | (331,860 | ) |
American Airlines Group Inc. | | | (4,000 | ) | | | (162,400 | ) |
Ball Corp | | | (1,177 | ) | | | (90,711 | ) |
Bluebird Bio Inc | | | (2,754 | ) | | | (131,504 | ) |
Cavium Inc | | | (1,045 | ) | | | (58,990 | ) |
Celgene Corp. | | | (500 | ) | | | (51,090 | ) |
Centene Corp. | | | (1,309 | ) | | | (81,786 | ) |
CF Industries Holdings Inc. | | | (7,522 | ) | | | (180,603 | ) |
Charter Communications Inc.–Class A | | | (242 | ) | | | (60,473 | ) |
Cheniere Energy Inc. | | | (3,164 | ) | | | (119,283 | ) |
Chevron Corp. | | | (3,657 | ) | | | (383,071 | ) |
Chipotle Mexican Grill Inc. | | | (256 | ) | | | (92,355 | ) |
Colfax Corp. | | | (1,700 | ) | | | (54,043 | ) |
Compass Minerals International Inc. | | | (600 | ) | | | (43,110 | ) |
Cypress Semiconductor Corp. | | | (18,144 | ) | | | (180,896 | ) |
DexCom Inc | | | (1,655 | ) | | | (129,487 | ) |
Diebold Inc. | | | (3,500 | ) | | | (76,300 | ) |
Dominion Rsources Inc. | | | (3,100 | ) | | | (233,120 | ) |
Endo International PLC | | | (8,086 | ) | | | (151,613 | ) |
Equinix Inc. | | | (115 | ) | | | (41,087 | ) |
Exxon Mobil Corp. | | | (3,977 | ) | | | (331,364 | ) |
Fastenal Co. | | | (3,500 | ) | | | (136,430 | ) |
Financial Engines Inc. | | | (1,839 | ) | | | (50,848 | ) |
FireEye Inc | | | (3,073 | ) | | | (35,708 | ) |
First Solar Inc. | | | (1,311 | ) | | | (53,082 | ) |
Fortune Brands Home & Security Inc. | | | (3,200 | ) | | | (174,816 | ) |
Halliburton Co. | | | (4,215 | ) | | | (193,890 | ) |
Hexcel Corp. | | | (2,100 | ) | | | (95,529 | ) |
Howard Hughes Corp. (The) | | | (2,369 | ) | | | (260,187 | ) |
Kennedy-Wilson Holdings Inc. | | | (12,523 | ) | | | (257,974 | ) |
Mastercard Inc.–Class A | | | (1,624 | ) | | | (173,800 | ) |
MAXIMUS Inc. | | | (4,992 | ) | | | (259,884 | ) |
Micron Technology Inc. | | | (17,439 | ) | | | (299,253 | ) |
Microsemi Corp | | | (2,744 | ) | | | (115,605 | ) |
Monro Muffler Brake Inc. | | | (2,191 | ) | | | (120,505 | ) |
National Instruments Corp. | | | (7,500 | ) | | | (210,675 | ) |
NetScout Systems Inc | | | (7,186 | ) | | | (197,256 | ) |
Norwegian Cruise Line Holdings Ltd. | | | (5,078 | ) | | | (197,382 | ) |
Pandora Media Inc. | | | (4,600 | ) | | | (52,118 | ) |
Platform Specialty Products Corp | | | (16,773 | ) | | | (122,275 | ) |
Qorvo Inc. | | | (716 | ) | | | (39,845 | ) |
Reynolds American Inc. | | | (3,300 | ) | | | (181,764 | ) |
Royal Caribbean Cruises Ltd. | | | (1,109 | ) | | | (85,249 | ) |
Schlumberger Ltd. | | | (800 | ) | | | (62,584 | ) |
STERIS PLC | | | (604 | ) | | | (40,359 | ) |
See accompanying Notes to Financial Statements which are an integral part of the financial statements.
12 Invesco Global Market Neutral Fund
| | | | | | | | |
| | | Shares | | | Value | |
| United States-(continued) | | | | | | | | |
Team Health Holdings Inc. | | | (1,962 | ) | | $ | (84,072 | ) |
Tractor Supply Co. | | | (600 | ) | | | (37,578 | ) |
Ultimate Software Group, Inc. (The) | | | (400 | ) | | | (84,396 | ) |
United Bankshares Inc. | | | (6,000 | ) | | | (226,200 | ) |
ViaSat, Inc. | | | (4,654 | ) | | | (328,852 | ) |
Visa Inc.–Class A | | | (4,258 | ) | | | (351,328 | ) |
WEC Energy Group Inc. | | | (2,900 | ) | | | (173,188 | ) |
Western Alliance Bancorp | | | (1,700 | ) | | | (63,512 | ) |
Zayo Group Holdings Inc. | | | (2,739 | ) | | | (88,141 | ) |
Zebra Technologies Corp–Class A | | | (1,025 | ) | | | (67,486 | ) |
| | | | | | | | (8,153,323 | ) |
Total Equity Securities — Short | | | $ | (19,929,434 | ) |
See accompanying Notes to Financial Statements which are an integral part of the financial statements.
13 Invesco Global Market Neutral Fund
Statement of Assets and Liabilities
October 31, 2016
| | | | |
Assets: | |
Investments, at value (Cost $18,684,532) | | $ | 20,210,358 | |
Investments in affiliated money market funds, at value and cost | | | 934,648 | |
Total investments, at value (Cost $19,619,180) | | | 21,145,006 | |
Cash | | | 519,512 | |
Foreign currencies, at value (Cost $22,287) | | | 21,932 | |
Receivable for: | | | | |
Deposits with brokers | | | 50,000 | |
Fund shares sold | | | 562 | |
Dividends and interest | | | 60,809 | |
Investment for trustee deferred compensation and retirement plans | | | 6,138 | |
Unrealized appreciation on swap agreements — OTC | | | 233,222 | |
Other assets | | | 46,922 | |
Total assets | | | 22,084,103 | |
|
Liabilities: | |
Payable for: | | | | |
Fund shares reacquired | | | 800 | |
Accrued fees to affiliates | | | 4,663 | |
Accrued trustees’ and officers’ fees and benefits | | | 1,564 | |
Accrued other operating expenses | | | 84,424 | |
Trustee deferred compensation and retirement plans | | | 6,138 | |
Unrealized depreciation on swap agreements — OTC | | | 55,220 | |
Total liabilities | | | 152,809 | |
Net assets applicable to shares outstanding | | $ | 21,931,294 | |
|
Net assets consist of: | |
Shares of beneficial interest | | $ | 20,805,553 | |
Undistributed net investment income | | | (183,040 | ) |
Undistributed net realized gain (loss) | | | (392,454 | ) |
Net unrealized appreciation | | | 1,701,235 | |
| | | $ | 21,931,294 | |
| | | | |
Net Assets: | |
Class A | | $ | 7,728,521 | |
Class C | | $ | 633,581 | |
Class R | | $ | 23,341 | |
Class Y | | $ | 12,261,185 | |
Class R5 | | $ | 498,242 | |
Class R6 | | $ | 786,424 | |
|
Shares outstanding, $0.01 par value per share,
with an unlimited number of shares authorized: | |
Class A | | | 779,688 | |
Class C | | | 65,078 | |
Class R | | | 2,368 | |
Class Y | | | 1,230,858 | |
Class R5 | | | 50,001 | |
Class R6 | | | 78,908 | |
Class A: | | | | |
Net asset value per share | | $ | 9.91 | |
Maximum offering price per share | | | | |
(Net asset value of $9.91 ¸ 94.50%) | | $ | 10.49 | |
Class C: | | | | |
Net asset value and offering price per share | | $ | 9.74 | |
Class R: | | | | |
Net asset value and offering price per share | | $ | 9.86 | |
Class Y: | | | | |
Net asset value and offering price per share | | $ | 9.96 | |
Class R5: | | | | |
Net asset value and offering price per share | | $ | 9.96 | |
Class R6: | | | | |
Net asset value and offering price per share | | $ | 9.97 | |
See accompanying Notes to Financial Statements which are an integral part of the financial statements.
14 Invesco Global Market Neutral Fund
Statement of Operations
For the year ended October 31, 2016
| | | | |
Investment income: | |
Dividends (net of foreign withholding taxes of $24,627) | | $ | 563,101 | |
Dividends from affiliated money market funds | | | 5,909 | |
Total investment income | | | 569,010 | |
| |
Expenses: | | | | |
Advisory fees | | | 272,764 | |
Administrative services fees | | | 50,000 | |
Custodian fees | | | 12,509 | |
Distribution fees: | | | | |
Class A | | | 17,241 | |
Class C | | | 9,535 | |
Class R | | | 126 | |
Transfer agent fees — A, C, R and Y | | | 20,106 | |
Transfer agent fees — R5 | | | 74 | |
Transfer agent fees — R6 | | | 103 | |
Trustees’ and officers’ fees and benefits | | | 19,057 | |
Registration and filing fees | | | 78,313 | |
Reports to shareholders | | | 16,195 | |
Professional services fees | | | 83,999 | |
Other | | | 22,587 | |
Total expenses | | | 602,609 | |
Less: Fees waived and expenses reimbursed | | | (279,161 | ) |
Net expenses | | | 323,448 | |
Net investment income | | | 245,562 | |
| |
Realized and unrealized gain (loss) from: | | | | |
Net realized gain (loss) from: | | | | |
Investment securities | | | (329,978 | ) |
Foreign currencies | | | (1,957 | ) |
Swap agreements | | | (2,243,176 | ) |
| | | | (2,575,111 | ) |
Change in net unrealized appreciation (depreciation) of: | | | | |
Investment securities | | | 1,059,019 | |
Foreign currencies | | | (1,882 | ) |
Swap agreements | | | 388,185 | |
| | | | 1,445,322 | |
Net realized and unrealized gain (loss) | | | (1,129,789 | ) |
Net increase (decrease) in net assets resulting from operations | | $ | (884,227 | ) |
See accompanying Notes to Financial Statements which are an integral part of the financial statements.
15 Invesco Global Market Neutral Fund
Statement of Changes in Net Assets
For the years ended October 31, 2016 and 2015
| | | | | | | | |
| | | 2016 | | | 2015 | |
Operations: | | | | | |
Net investment income | | $ | 245,562 | | | $ | 139,690 | |
Net realized gain (loss) | | | (2,575,111 | ) | | | (860,689 | ) |
Change in net unrealized appreciation | | | 1,445,322 | | | | 859,344 | |
Net increase (decrease) in net assets resulting from operations | | | (884,227 | ) | | | 138,345 | |
| | |
Distributions to shareholders from net investment income: | | | | | | | | |
Class A | | | — | | | | (92,956 | ) |
Class C | | | — | | | | (1,945 | ) |
Class R | | | — | | | | (243 | ) |
Class Y | | | — | | | | (139,674 | ) |
Class R5 | | | — | | | | (13,133 | ) |
Class R6 | | | — | | | | (11,890 | ) |
Total distributions from net investment income | | | — | | | | (259,841 | ) |
| | |
Distributions to shareholders from net realized gains: | | | | | | | | |
Class A | | | (14,354 | ) | | | (5,778 | ) |
Class C | | | (1,226 | ) | | | (137 | ) |
Class R | | | (43 | ) | | | (16 | ) |
Class Y | | | (31,654 | ) | | | (7,752 | ) |
Class R5 | | | (1,295 | ) | | | (729 | ) |
Class R6 | | | (1,692 | ) | | | (660 | ) |
Total distributions from net realized gains | | | (50,264 | ) | | | (15,072 | ) |
| | |
Share transactions–net: | | | | | | | | |
Class A | | | 2,295,064 | | | | 569,256 | |
Class C | | | 115,558 | | | | 485,504 | |
Class R | | | 8,382 | | | | 2,696 | |
Class Y | | | 480,103 | | | | 5,054,439 | |
Class R5 | | | — | | | | (143,311 | ) |
Class R6 | | | 144,850 | | | | 100,158 | |
Net increase in net assets resulting from share transactions | | | 3,043,957 | | | | 6,068,742 | |
Net increase in net assets | | | 2,109,466 | | | | 5,932,174 | |
| | |
Net assets: | | | | | | | | |
Beginning of year | | | 19,821,828 | | | | 13,889,654 | |
End of year (includes undistributed net investment income of $(183,040) and $206,181, respectively) | | $ | 21,931,294 | | | $ | 19,821,828 | |
See accompanying Notes to Financial Statements which are an integral part of the financial statements.
16 Invesco Global Market Neutral Fund
Statement of Cash Flows
For the year ended October 31, 2016
| | | | |
Cash provided by (used in) operating activities: | | | | |
Net increase (decrease) in net assets resulting from operations | | $ | (884,227 | ) |
|
Adjustments to reconcile the change in net assets applicable from operations to net cash provided by (used in) operating activities: | |
Purchases of investments | | | (17,366,440 | ) |
Proceeds from sales of investments | | | 16,229,077 | |
Net change in unrealized appreciation swap agreements | | | (388,185 | ) |
Decrease in swap agreements payable, net | | | (2,314 | ) |
Decrease in deposits with broker for swaps | | | 10,477 | |
Increase in receivables and other assets | | | (53,276 | ) |
Increase in accrued expenses and other payables | | | 4,523 | |
Net change in unrealized appreciation on investment securities | | | (1,059,019 | ) |
Net realized loss from investment securities | | | 329,978 | |
Net cash provided by (used in) operating activities | | | (3,179,406 | ) |
| |
Cash provided by financing activities: | | | | |
Dividends paid to shareholders | | | (25,929 | ) |
Decrease in payable for amount due custodian | | | (414,466 | ) |
Proceeds from shares of beneficial interest sold | | | 10,049,602 | |
Disbursements from shares of beneficial interest reacquired | | | (7,029,714 | ) |
Net cash provided by financing activities | | | 2,579,493 | |
Net increase (decrease) in cash and cash equivalents | | | (599,913 | ) |
Cash and cash equivalents at beginning of period | | | 2,076,005 | |
Cash and cash equivalents at end of period | | $ | 1,476,092 | |
| |
Non-cash financing activities: | | | | |
Value of shares of beneficial interest issued in reinvestment of dividends paid to shareholders | | $ | 24,335 | |
Notes to Financial Statements
October 31, 2016
NOTE 1—Significant Accounting Policies
Invesco Global Market Neutral Fund (the “Fund”) is a series portfolio of AIM Investment Funds (Invesco Investment Funds) (the “Trust”). The Trust is organized as a Delaware statutory trust and is registered under the Investment Company Act of 1940, as amended (the “1940 Act”), as an open-end series management investment company consisting of twenty-two separate series portfolios, each authorized to issue an unlimited number of shares of beneficial interest. The assets, liabilities and operations of each portfolio are accounted for separately. Information presented in these financial statements pertains only to the Fund. Matters affecting each portfolio or class will be voted on exclusively by the shareholders of such portfolio or class.
The Fund’s investment objective is to seek to provide a positive return over a full market cycle from a broadly diversified portfolio of stocks while seeking to limit exposure to the general risks associated with stock market investing.
The Fund currently consists of six different classes of shares: Class A, Class C, Class R, Class Y, Class R5 and Class R6. Class Y shares are available only to certain investors. Class A shares are sold with a front-end sales charge unless certain waiver criteria are met and under certain circumstances load waived shares may be subject to contingent deferred sales charges (“CDSC”). Class C shares are sold with a CDSC. Class R, Class Y, Class R5 and Class R6 shares are sold at net asset value.
The following is a summary of the significant accounting policies followed by the Fund in the preparation of its financial statements.
| A. | Security Valuations — Securities, including restricted securities, are valued according to the following policy. |
A security listed or traded on an exchange (except convertible securities) is valued at its last sales price or official closing price as of the close of the customary trading session on the exchange where the security is principally traded, or lacking any sales or official closing price on a particular day, the security may be valued at the closing bid price on that day. Securities traded in the over-the-counter market are valued based on prices furnished by independent pricing services or market makers. When such securities are valued by an independent pricing service they may be considered fair valued. Futures contracts are valued at the final settlement price set by an exchange on which they are principally traded. Listed options are valued at the mean between the last bid and asked prices from the exchange on which they are principally traded. Options not listed on an exchange are valued by an independent source at the mean between the last bid and asked prices. For purposes of determining net asset value (“NAV”) per share, futures and option contracts generally are valued 15 minutes after the close of the customary trading session of the New York Stock Exchange (“NYSE”).
17 Invesco Global Market Neutral Fund
Investments in open-end and closed-end registered investment companies that do not trade on an exchange are valued at the end-of-day net asset value per share. Investments in open-end and closed-end registered investment companies that trade on an exchange are valued at the last sales price or official closing price as of the close of the customary trading session on the exchange where the security is principally traded.
Swap agreements are fair valued using an evaluated quote, if available, provided by an independent pricing service. Evaluated quotes provided by the pricing service are valued based on a model which may include end-of-day net present values, spreads, ratings, industry, company performance and returns of referenced assets.
Debt obligations (including convertible securities) and unlisted equities are fair valued using an evaluated quote provided by an independent pricing service. Evaluated quotes provided by the pricing service may be determined without exclusive reliance on quoted prices, and may reflect appropriate factors such as institution-size trading in similar groups of securities, developments related to specific securities, dividend rate (for unlisted equities), yield (for debt obligations), quality, type of issue, coupon rate (for debt obligations), maturity (for debt obligations), individual trading characteristics and other market data. Debt obligations are subject to interest rate and credit risks. In addition, all debt obligations involve some risk of default with respect to interest and/or principal payments.
Foreign securities’ (including foreign exchange contracts) prices are converted into U.S. dollar amounts using the applicable exchange rates as of the close of the NYSE. If market quotations are available and reliable for foreign exchange-traded equity securities, the securities will be valued at the market quotations. Because trading hours for certain foreign securities end before the close of the NYSE, closing market quotations may become unreliable. If between the time trading ends on a particular security and the close of the customary trading session on the NYSE, events occur that the Adviser determines are significant and make the closing price unreliable, the Fund may fair value the security. If the event is likely to have affected the closing price of the security, the security will be valued at fair value in good faith using procedures approved by the Board of Trustees. Adjustments to closing prices to reflect fair value may also be based on a screening process of an independent pricing service to indicate the degree of certainty, based on historical data, that the closing price in the principal market where a foreign security trades is not the current value as of the close of the NYSE. Foreign securities’ prices meeting the approved degree of certainty that the price is not reflective of current value will be priced at the indication of fair value from the independent pricing service. Multiple factors may be considered by the independent pricing service in determining adjustments to reflect fair value and may include information relating to sector indices, American Depositary Receipts and domestic and foreign index futures. Foreign securities may have additional risks including exchange rate changes, potential for sharply devalued currencies and high inflation, political and economic upheaval, the relative lack of issuer information, relatively low market liquidity and the potential lack of strict financial and accounting controls and standards.
Securities for which market prices are not provided by any of the above methods may be valued based upon quotes furnished by independent sources. The last bid price may be used to value equity securities. The mean between the last bid and asked prices is used to value debt obligations, including corporate loans.
Securities for which market quotations are not readily available or became unreliable are valued at fair value as determined in good faith by or under the supervision of the Trust’s officers following procedures approved by the Board of Trustees. Issuer specific events, market trends, bid/asked quotes of brokers and information providers and other market data may be reviewed in the course of making a good faith determination of a security’s fair value.
The Fund may invest in securities that are subject to interest rate risk, meaning the risk that the prices will generally fall as interest rates rise and, conversely, the prices will generally rise as interest rates fall. Specific securities differ in their sensitivity to changes in interest rates depending on their individual characteristics. Changes in interest rates may result in increased market volatility, which may affect the value and/or liquidity of certain Fund investments.
Valuations change in response to many factors including the historical and prospective earnings of the issuer, the value of the issuer’s assets, general economic conditions, interest rates, investor perceptions and market liquidity. Because of the inherent uncertainties of valuation, the values reflected in the financial statements may materially differ from the value received upon actual sale of those investments.
| B. | Securities Transactions and Investment Income — Securities transactions are accounted for on a trade date basis. Realized gains or losses on sales are computed on the basis of specific identification of the securities sold. Interest income (net of withholding tax, if any) is recorded on the accrual basis from settlement date. Dividend income (net of withholding tax, if any) is recorded on the ex-dividend date. |
The Fund may periodically participate in litigation related to Fund investments. As such, the Fund may receive proceeds from litigation settlements. Any proceeds received are included in the Statement of Operations as realized gain (loss) for investments no longer held and as unrealized gain (loss) for investments still held.
Brokerage commissions and mark ups are considered transaction costs and are recorded as an increase to the cost basis of securities purchased and/or a reduction of proceeds on a sale of securities. Such transaction costs are included in the determination of net realized and unrealized gain (loss) from investment securities reported in the Statement of Operations and the Statement of Changes in Net Assets and the net realized and unrealized gains (losses) on securities per share in the Financial Highlights. Transaction costs are included in the calculation of the Fund’s net asset value and, accordingly, they reduce the Fund’s total returns. These transaction costs are not considered operating expenses and are not reflected in net investment income reported in the Statement of Operations and the Statement of Changes in Net Assets, or the net investment income per share and the ratios of expenses and net investment income reported in the Financial Highlights, nor are they limited by any expense limitation arrangements between the Fund and the investment adviser.
The Fund allocates income and realized and unrealized capital gains and losses to a class based on the relative net assets of each class.
| C. | Country Determination — For the purposes of making investment selection decisions and presentation in the Schedule of Investments, the investment adviser may determine the country in which an issuer is located and/or credit risk exposure based on various factors. These factors include the laws of the country under which the issuer is organized, where the issuer maintains a principal office, the country in which the issuer derives 50% or more of its total revenues and the country that has the primary market for the issuer’s securities, as well as other criteria. Among the other criteria that may be evaluated for making this determination are the country in which the issuer maintains 50% or more of its assets, the type of security, financial guarantees and enhancements, the nature of the collateral and the sponsor organization. Country of issuer and/or credit risk exposure has been determined to be the United States of America, unless otherwise noted. |
18 Invesco Global Market Neutral Fund
| D. | Distributions — Distributions from net investment income and net realized capital gain, if any, are generally declared and paid annually and recorded on the ex-dividend date. The Fund may elect to treat a portion of the proceeds from redemptions as distributions for federal income tax purposes. |
| E. | Federal Income Taxes — The Fund intends to comply with the requirements of Subchapter M of the Internal Revenue Code of 1986, as amended (the “Internal Revenue Code”), necessary to qualify as a regulated investment company and to distribute substantially all of the Fund’s taxable earnings to shareholders. As such, the Fund will not be subject to federal income taxes on otherwise taxable income (including net realized capital gain) that is distributed to shareholders. Therefore, no provision for federal income taxes is recorded in the financial statements. |
The Fund recognizes the tax benefits of uncertain tax positions only when the position is more likely than not to be sustained. Management has analyzed the Fund’s uncertain tax positions and concluded that no liability for unrecognized tax benefits should be recorded related to uncertain tax positions. Management is not aware of any tax positions for which it is reasonably possible that the total amounts of unrecognized tax benefits will change materially in the next 12 months.
The Fund files tax returns in the U.S. Federal jurisdiction and certain other jurisdictions. Generally, the Fund is subject to examinations by such taxing authorities for up to three years after the filing of the return for the tax period.
| F. | Expenses — Fees provided for under the Rule 12b-1 plan of a particular class of the Fund are charged to the operations of such class. Transfer agency fees and expenses and other shareholder recordkeeping fees and expenses attributable to Class R5 and Class R6 are allocated to each share class based on relative net assets. Sub-accounting fees attributable to Class R5 are charged to the operations of the class. Transfer agency fees and expenses and other shareholder recordkeeping fees and expenses relating to all other classes are allocated among those classes based on relative net assets. All other expenses are allocated among the classes based on relative net assets. |
| G. | Accounting Estimates — The preparation of financial statements in conformity with accounting principles generally accepted in the United States of America (“GAAP”) requires management to make estimates and assumptions that affect the reported amounts of assets and liabilities at the date of the financial statements and the reported amounts of revenues and expenses during the reporting period including estimates and assumptions related to taxation. Actual results could differ from those estimates by a significant amount. In addition, the Fund monitors for material events or transactions that may occur or become known after the period-end date and before the date the financial statements are released to print. |
| H. | Indemnifications — Under the Trust’s organizational documents, each Trustee, officer, employee or other agent of the Trust is indemnified against certain liabilities that may arise out of the performance of their duties to the Fund. Additionally, in the normal course of business, the Fund enters into contracts, including the Fund’s servicing agreements, that contain a variety of indemnification clauses. The Fund’s maximum exposure under these arrangements is unknown as this would involve future claims that may be made against the Fund that have not yet occurred. The risk of material loss as a result of such indemnification claims is considered remote. |
| I. | Cash and Cash Equivalents — For the purposes of the Statement of Cash Flows, the Fund defines Cash and Cash Equivalents as cash (including foreign currency), money market funds and other investments held in lieu of cash and excludes investments made with cash collateral received. |
| J. | Foreign Currency Translations — Foreign currency is valued at the close of the NYSE based on quotations posted by banks and major currency dealers. Portfolio securities and other assets and liabilities denominated in foreign currencies are translated into U.S. dollar amounts at date of valuation. Purchases and sales of portfolio securities (net of foreign taxes withheld on disposition) and income items denominated in foreign currencies are translated into U.S. dollar amounts on the respective dates of such transactions. The Fund does not separately account for the portion of the results of operations resulting from changes in foreign exchange rates on investments and the fluctuations arising from changes in market prices of securities held. The combined results of changes in foreign exchange rates and the fluctuation of market prices on investments (net of estimated foreign tax withholding) are included with the net realized and unrealized gain or loss from investments in the Statement of Operations. Reported net realized foreign currency gains or losses arise from (1) sales of foreign currencies, (2) currency gains or losses realized between the trade and settlement dates on securities transactions, and (3) the difference between the amounts of dividends, interest, and foreign withholding taxes recorded on the Fund’s books and the U.S. dollar equivalent of the amounts actually received or paid. Net unrealized foreign currency gains and losses arise from changes in the fair values of assets and liabilities, other than investments in securities at fiscal period end, resulting from changes in exchange rates. |
The Fund may invest in foreign securities, which may be subject to foreign taxes on income, gains on investments or currency repatriation, a portion of which may be recoverable. Foreign taxes, if any, are recorded based on the tax regulations and rates that exist in the foreign markets in which the Fund invests and are shown in the Statement of Operations.
| K. | Forward Foreign Currency Contracts — The Fund may engage in foreign currency transactions either on a spot (i.e. for prompt delivery and settlement) basis, or through forward foreign currency contracts, to manage or minimize currency or exchange rate risk. |
The Fund may also enter into forward foreign currency contracts for the purchase or sale of a security denominated in a foreign currency in order to “lock in” the U.S. dollar price of that security, or the Fund may also enter into forward foreign currency contracts that do not provide for physical settlement of the two currencies, but instead are settled by a single cash payment calculated as the difference between the agreed upon exchange rate and the spot rate at settlement based upon an agreed upon notional amount (non-deliverable forwards). The Fund will set aside liquid assets in an amount equal to the daily mark-to-market obligation for forward foreign currency contracts.
A forward foreign currency contract is an obligation between two parties (“Counterparties”) to purchase or sell a specific currency for an agreed-upon price at a future date. The use of forward foreign currency contracts does not eliminate fluctuations in the price of the underlying securities the Fund owns or intends to acquire but establishes a rate of exchange in advance. Fluctuations in the value of these contracts are measured by the difference in the contract date and reporting date exchange rates and are recorded as unrealized appreciation (depreciation) until the contracts are closed. When the contracts are closed, realized gains (losses) are recorded. Realized and unrealized gains (losses) on the contracts are included in the Statement of Operations. The primary risks associated with forward foreign currency contracts include failure of the Counterparty to meet the terms of the contract and the value of the foreign currency changing unfavorably. These risks may be in excess of the amounts reflected in the Statement of Assets and Liabilities.
| L. | Swap Agreements — The Fund may enter into various swap transactions, including interest rate, total return, volatility, variance, index, currency and credit default swap contracts (“CDS”) for investment purposes or to manage interest rate, equity, currency or credit risk. Such |
19 Invesco Global Market Neutral Fund
| | transactions are agreements between Counterparties. These agreements may contain among other conditions, events of default and termination events, and various covenants and representations such as provisions that require the Fund to maintain a pre-determined level of net assets, and/or provide limits regarding the decline of the Fund’s NAV over specific periods of time. If the Fund were to trigger such provisions and have open derivative positions at that time, the Counterparty may be able to terminate such agreement and request immediate payment in an amount equal to the net liability positions, if any. |
Interest rate, total return, volatility, variance, index, and currency swap agreements are two-party contracts entered into primarily to exchange the returns (or differentials in rates of returns) earned or realized on particular predetermined investments or instruments. The gross returns to be exchanged or “swapped” between the parties are calculated with respect to a notional amount, i.e., the return on or increase in value of a particular dollar amount invested at a particular interest rate or return of an underlying asset, in a particular foreign currency, or in a “basket” of securities representing a particular index.
A total return swap is an agreement in which one party makes payments based on a set rate, either fixed or variable, while the other party makes payments based on the return of an underlying asset, which includes both the income generated and capital gains, if any. The unrealized appreciation (depreciation) on total return swaps includes dividends on the underlying equity securities and financing rate payable from the Counterparty. At the maturity date, a net cash flow is exchanged where the total return is equivalent to the return of the underlying reference less a financing rate, if any. As a receiver, the Fund would receive payments based on any positive total return and would owe payments in the event of a negative total return. As the payer, the Fund would owe payments on any net positive total return, and would receive payment in the event of a negative total return.
Changes in the value of swap agreements are recognized as unrealized gains (losses) in the Statement of Operations by “marking to market” on a daily basis to reflect the value of the swap agreement at the end of each trading day. Payments received or paid at the beginning of the agreement are reflected as such on the Statement of Assets and Liabilities and may be referred to as upfront payments. The Fund accrues for the fixed payment stream and amortizes upfront payments, if any, on swap agreements on a daily basis with the net amount, recorded as a component of realized gain (loss) on the Statement of Operations. A liquidation payment received or made at the termination of a swap agreement is recorded as realized gain (loss) on the Statement of Operations. The Fund segregates cash or liquid securities having a value at least equal to the amount of the potential obligation of a Fund under any swap transaction. Cash held as collateral is recorded as deposits with brokers on the Statement of Assets and Liabilities. Entering into these agreements involves, to varying degrees, lack of liquidity and elements of credit, market, and Counterparty risk in excess of amounts recognized on the Statement of Assets and Liabilities. Such risks involve the possibility that a swap is difficult to sell or liquidate; the Counterparty does not honor its obligations under the agreement and unfavorable interest rates and market fluctuations. It is possible that developments in the swaps market, including potential government regulation, could adversely affect the Fund’s ability to terminate existing swap agreements or to realize amounts to be received under such agreements. A short position in a security poses more risk than holding the same security long. As there is no limit on how much the price of the security can increase, the Fund’s exposure is unlimited.
| M. | Leverage Risk — Leverage exists when the Fund can lose more than it originally invests because it purchases or sells an instrument or enters into a transaction without investing an amount equal to the full economic exposure of the instrument or transaction. |
| N. | Collateral — To the extent the Fund has designated or segregated a security as collateral and that security is subsequently sold, it is the Fund’s practice to replace such collateral no later than the next business day. |
NOTE 2—Advisory Fees and Other Fees Paid to Affiliates
The Trust has entered into a master investment advisory agreement with Invesco Advisers, Inc. (the “Adviser” or “Invesco”). Under the terms of the investment advisory agreement, the Fund pays an advisory fee to the Adviser based on the annual rate of the Fund’s average daily net assets as follows:
| | | | |
| Average Daily Net Assets | | Rate | |
First $10 billion | | | 1.25% | |
Over $10 billion | | | 1.15% | |
For the year ended October 31, 2016, the effective advisory fees incurred by the Fund was 1.25%.
Under the terms of a master sub-advisory agreement between the Adviser and each of Invesco Asset Management Deutschland GmbH, Invesco Asset Management Limited, Invesco Asset Management (Japan) Limited, Invesco Hong Kong Limited, Invesco Senior Secured Management, Inc., Invesco Canada Ltd. and Invesco PowerShares Capital Management LLC (collectively, the “Affiliated Sub-Advisers”) the Adviser, not the Fund, will pay 40% of the fees paid to the Adviser to any such Affiliated Sub-Adviser(s) that provide(s) discretionary investment management services to the Fund based on the percentage of assets allocated to such Affiliated Sub-Adviser(s).
The Adviser has contractually agreed, through at least February 28, 2017, to waive advisory fees and/or reimburse expenses to the extent necessary to limit total annual fund operating expenses after fee waiver and/or expense reimbursement (excluding certain items discussed below) of Class A, Class C, Class R, Class Y, Class R5 and Class R6 shares to 1.62%, 2.37%, 1.87%, 1.37%, 1.37% and 1.37% of average daily net assets (the “expense limits”), respectively. In determining the Adviser’s obligation to waive advisory fees and/or reimburse expenses, the following expenses are not taken into account, and could cause total annual fund operating expenses after fee waiver and/or expense reimbursement to exceed the numbers reflected above: (1) interest; (2) taxes; (3) dividend expense on short sales; (4) extraordinary or non-routine items, including litigation expenses; and (5) expenses that the Fund has incurred but did not actually pay because of an expense offset arrangement. Unless Invesco continues the fee waiver agreement, it will terminate on February 28, 2017. During its term, the fee waiver agreement cannot be terminated or amended to increase the expense limits without approval of the Board of Trustees.
Further, the Adviser has contractually agreed, through at least June 30, 2018, to waive the advisory fee payable by the Fund in an amount equal to 100% of the net advisory fees the Adviser receives from the affiliated money market funds on investments by the Fund of uninvested cash in such affiliated money market funds.
20 Invesco Global Market Neutral Fund
For the year ended October 31, 2016, the Adviser waived advisory fees of $258,879 and reimbursed class level expenses of $6,724, $930, $25, $12,427, $74 and $102 of Class A, Class C, Class R, Class Y, Class R5 and Class R6 shares, respectively.
The Trust has entered into a master administrative services agreement with Invesco pursuant to which the Fund has agreed to pay Invesco for certain administrative costs incurred in providing accounting services to the Fund. For the year ended October 31, 2016, expenses incurred under the agreement are shown in the Statement of Operations as Administrative services fees.
The Trust has entered into a transfer agency and service agreement with Invesco Investment Services, Inc. (“IIS”) pursuant to which the Fund has agreed to pay IIS a fee for providing transfer agency and shareholder services to the Fund and reimburse IIS for certain expenses incurred by IIS in the course of providing such services. IIS may make payments to intermediaries that provide omnibus account services, sub-accounting services and/or networking services. All fees payable by IIS to intermediaries that provide omnibus account services or sub-accounting are charged back to the Fund, subject to certain limitations approved by the Trust’s Board of Trustees. For the year ended October 31, 2016, expenses incurred under the agreement are shown in the Statement of Operations as Transfer agent fees.
The Trust has entered into master distribution agreements with Invesco Distributors, Inc. (“IDI”) to serve as the distributor for the Class A, Class C, Class R, Class Y, Class R5 and Class R6 shares of the Fund. The Trust has adopted plans pursuant to Rule 12b-1 under the 1940 Act with respect to the Fund’s Class A, Class C and Class R shares (collectively the “Plans”). The Fund, pursuant to the Plans, pays IDI compensation at the annual rate of 0.25% of the Fund’s average daily net assets of Class A shares, 1.00% of the average daily net assets of Class C shares and 0.50% of the average daily net assets of Class R shares. Of the Plan payments, up to 0.25% of the average daily net assets of each class of shares may be paid to furnish continuing personal shareholder services to customers who purchase and own shares of such classes. Any amounts not paid as a service fee under the Plans would constitute an asset-based sales charge. Rules of the Financial Industry Regulatory Authority (“FINRA”) impose a cap on the total sales charges, including asset-based sales charges, that may be paid by any class of shares of the Fund. For the year ended October 31, 2016, expenses incurred under the Plans are shown in the Statement of Operations as Distribution fees.
Front-end sales commissions and CDSC (collectively, the “sales charges”) are not recorded as expenses of the Fund. Front-end sales commissions are deducted from proceeds from the sales of Fund shares prior to investment in Class A shares of the Fund. CDSC are deducted from redemption proceeds prior to remittance to the shareholder. During the year ended October 31, 2016, IDI advised the Fund that IDI retained $345 in front-end sales commissions from the sale of Class A shares and $7 from Class C for CDSC imposed upon redemptions by shareholders.
Certain officers and trustees of the Trust are officers and directors of the Adviser, IIS and/or IDI.
NOTE 3—Additional Valuation Information
GAAP defines fair value as the price that would be received to sell an asset or paid to transfer a liability in an orderly transaction between market participants at the measurement date, under current market conditions. GAAP establishes a hierarchy that prioritizes the inputs to valuation methods, giving the highest priority to readily available unadjusted quoted prices in an active market for identical assets (Level 1) and the lowest priority to significant unobservable inputs (Level 3), generally when market prices are not readily available or are unreliable. Based on the valuation inputs, the securities or other investments are tiered into one of three levels. Changes in valuation methods may result in transfers in or out of an investment’s assigned level:
| | Level 1 — | Prices are determined using quoted prices in an active market for identical assets. |
| | Level 2 — | Prices are determined using other significant observable inputs. Observable inputs are inputs that other market participants may use in pricing a security. These may include quoted prices for similar securities, interest rates, prepayment speeds, credit risk, yield curves, loss severities, default rates, discount rates, volatilities and others. |
| | Level 3 — | Prices are determined using significant unobservable inputs. In situations where quoted prices or observable inputs are unavailable (for example, when there is little or no market activity for an investment at the end of the period), unobservable inputs may be used. Unobservable inputs reflect the Fund’s own assumptions about the factors market participants would use in determining fair value of the securities or instruments and would be based on the best available information. |
The following is a summary of the tiered valuation input levels, as of October 31, 2016. The level assigned to the securities valuations may not be an indication of the risk or liquidity associated with investing in those securities. Because of the inherent uncertainties of valuation, the values reflected in the financial statements may materially differ from the value received upon actual sale of those investments.
During the year ended October 31, 2016, there were transfers from Level 1 to Level 2 of $162,305 and from Level 2 to Level 1 of $2,237,978, due to foreign fair value adjustments.
| | | | | | | | | | | | | | | | |
| | | Level 1 | | | Level 2 | | | Level 3 | | | Total | |
Australia | | $ | 364,219 | | | $ | 83,752 | | | $ | — | | | $ | 447,971 | |
Canada | | | 1,273,932 | | | | — | | | | — | | | | 1,273,932 | |
China | | | — | | | | 200,679 | | | | — | | | | 200,679 | |
Denmark | | | 450,699 | | | | — | | | | — | | | | 450,699 | |
Finland | | | 122,435 | | | | — | | | | — | | | | 122,435 | |
France | | | 399,117 | | | | 110,543 | | | | — | | | | 509,660 | |
Germany | | | 843,168 | | | | — | | | | — | | | | 843,168 | |
Hong Kong | | | 54,921 | | | | 60,975 | | | | — | | | | 115,896 | |
Italy | | | — | | | | 48,744 | | | | — | | | | 48,744 | |
Japan | | | 1,889,083 | | | | 2,610,479 | | | | — | | | | 4,499,562 | |
Macau | | | 72,185 | | | | — | | | | — | | | | 72,185 | |
Netherlands | | | 98,770 | | | | 46,033 | | | | — | | | | 144,803 | |
New Zealand | | | 81,299 | | | | — | | | | — | | | | 81,299 | |
21 Invesco Global Market Neutral Fund
| | | | | | | | | | | | | | | | |
| | | Level 1 | | | Level 2 | | | Level 3 | | | Total | |
Norway | | $ | 214,681 | | | $ | — | | | $ | — | | | $ | 214,681 | |
Singapore | | | 166,651 | | | | — | | | | — | | | | 166,651 | |
Spain | | | 341,365 | | | | — | | | | — | | | | 341,365 | |
Sweden | | | 213,256 | | | | — | | | | — | | | | 213,256 | |
Switzerland | | | 387,991 | | | | 205,548 | | | | — | | | | 593,539 | |
United Kingdom | | | 710,496 | | | | 998,670 | | | | — | | | | 1,709,166 | |
United States | | | 8,160,667 | | | | — | | | | — | | | | 8,160,667 | |
Money Market Funds | | | 934,648 | | | | — | | | | — | | | | 934,648 | |
| | | | 16,779,583 | | | | 4,365,423 | | | | — | | | | 21,145,006 | |
Swap Agreements* | | | — | | | | 178,002 | | | | — | | | | 178,002 | |
Total Investments | | $ | 16,779,583 | | | $ | 4,543,425 | | | $ | — | | | $ | 21,323,008 | |
| * | Net unrealized appreciation. |
NOTE 4—Derivative Investments
The Fund may enter into an International Swaps and Derivatives Association Master Agreement (“ISDA Master Agreement”) under which a Fund may trade OTC derivatives. An OTC transaction entered into under an ISDA Master Agreement typically involves a collateral posting arrangement, payment netting provisions and close-out netting provisions. These netting provisions allow for reduction of credit risk through netting of contractual obligations. The enforceability of the netting provisions of the ISDA Master Agreement depends on the governing law of the ISDA Master Agreement, among other factors.
For financial reporting purposes, the Fund does not offset OTC derivative assets or liabilities that are subject to ISDA Master Agreements in the Statement of Assets and Liabilities.
Value of Derivative Investments at Period-End
The table below summarizes the value of the Fund’s derivative investments, detailed by primary risk exposure, held as of October 31, 2016:
| | | | |
| | | Value | |
| Derivative Assets | | Equity Risk | |
Unrealized appreciation on swap agreements — OTC | | $ | 233,222 | |
Derivatives not subject to master netting agreements | | | — | |
Total Derivative Assets subject to master netting agreements | | $ | 233,222 | |
| |
| Derivative Liabilities | | | |
Unrealized depreciation on swap agreements — OTC | | $ | 55,220 | |
Derivatives not subject to master netting agreements | | | — | |
Total Derivative Liabilities subject to master netting agreements | | $ | 55,220 | |
Offsetting Assets and Liabilities
The table below reflects the Fund’s exposure to Counterparties subject to either an ISDA Master Agreement or other agreement for OTC derivative transactions as of October 31, 2016.
| | | | | | | | | | | | | | | | | | | | | | | | |
| | | Financial
Derivative
Assets | | | Financial
Derivative
Liabilities | | | Net value of
derivatives | | | Collateral | | | Net
amount | |
| | | Swap | | | Swap | | | | (Received)/Pledged | | |
| Counterparty | | agreements | | | agreements | | | | Non-Cash | | | Cash | | |
Morgan Stanley & Co. LLC | | $ | 233,222 | | | $ | 55,220 | | | $ | 178,002 | | | $ | — | | | $ | — | | | $ | 178,002 | |
Effect of Derivative Investments for the year ended October 31, 2016
The table below summarizes the gains (losses) on derivative investments, detailed by primary risk exposure, recognized in earnings during the period:
| | | | |
| | | Location of Gain (Loss) on
Statement of Operations | |
| | Equity Risk | |
Realized Gain (Loss): | | | | |
Swap Agreements | | $ | (2,243,176 | ) |
Change in Net Unrealized Appreciation: | | | | |
Swap Agreements | | | 388,185 | |
Total | | $ | (1,854,991 | ) |
22 Invesco Global Market Neutral Fund
The table below summarizes the average notional value of equity portfolio swap agreements outstanding during the period.
| | | | |
| | | Swap Agreements | |
Average notional value | | $ | 20,350,565 | |
NOTE 5—Trustees’ and Officers’ Fees and Benefits
Trustees’ and Officers’ Fees and Benefits include amounts accrued by the Fund to pay remuneration to certain Trustees and Officers of the Fund. Trustees have the option to defer compensation payable by the Fund, and Trustees’ and Officers’ Fees and Benefits also include amounts accrued by the Fund to fund such deferred compensation amounts. Those Trustees who defer compensation have the option to select various Invesco Funds in which their deferral accounts shall be deemed to be invested. Obligations under the deferred compensation plan represent unsecured claims against the general assets of the Fund.
NOTE 6—Cash Balances
The Fund is permitted to temporarily carry a negative or overdrawn balance in its account with State Street Bank and Trust Company, the custodian bank. Such balances, if any at period-end, are shown in the Statement of Assets and Liabilities under the payable caption Amount due custodian. To compensate the custodian bank for such overdrafts, the overdrawn Fund may either (1) leave funds as a compensating balance in the account so the custodian bank can be compensated by earning the additional interest; or (2) compensate by paying the custodian bank at a rate agreed upon by the custodian bank and Invesco, not to exceed the contractually agreed upon rate.
NOTE 7—Distributions to Shareholders and Tax Components of Net Assets
Tax Character of Distributions to Shareholders Paid During the Fiscal Years Ended October 31, 2016 and 2015:
| | | | | | | | |
| | | 2016 | | | 2015 | |
Ordinary income | | $ | — | | | $ | 264,268 | |
Long-term capital gain | | | 50,264 | | | | 10,645 | |
Total distributions | | $ | 50,264 | | | $ | 274,913 | |
Tax Components of Net Assets at Period-End:
| | | | |
| | | 2016 | |
Net unrealized appreciation — investments | | $ | 1,397,733 | |
Net unrealized appreciation (depreciation) — other investments | | | (1,690 | ) |
Temporary book/tax differences | | | (5,941 | ) |
Capital loss carryforward | | | (264,361 | ) |
Shares of beneficial interest | | | 20,805,553 | |
Total net assets | | $ | 21,931,294 | |
The difference between book-basis and tax-basis unrealized appreciation (depreciation) is due to differences in the timing of recognition of gains and losses on investments for tax and book purposes. The Fund’s net unrealized appreciation difference is attributable primarily to wash sales.
The temporary book/tax differences are a result of timing differences between book and tax recognition of income and/or expenses. The Fund’s temporary book/tax differences are the result of the trustee deferral of compensation and retirement plan benefits.
Capital loss carryforward is calculated and reported as of a specific date. Results of transactions and other activity after that date may affect the amount of capital loss carryforward actually available for the Fund to utilize. Capital losses generated in years beginning after December 22, 2010 can be carried forward for an unlimited period, whereas previous losses expire in eight tax years. Capital losses with an expiration period may not be used to offset capital gains until all net capital losses without an expiration date have been utilized. Capital loss carryforwards with no expiration date will retain their character as either short-term or long-term capital losses instead of as short-term capital losses as under prior law. The ability to utilize capital loss carryforwards in the future may be limited under the Internal Revenue Code and related regulations based on the results of future transactions.
The Fund has a capital loss carryforward as of October 31, 2016, as follows:
| | | | | | | | | | | | |
| Capital Loss Carryforward* | |
| Expiration | | Short-Term | | | Long-Term | | | Total | |
Not subject to expiration | | $ | 264,361 | | | $ | — | | | $ | 264,361 | |
| * | Capital loss carryforward as of the date listed above is reduced for limitations, if any, to the extent required by the Internal Revenue Code and may be further limited depending upon a variety of factors, including the realization of net unrealized gains or losses as of the date of any reorganization. |
NOTE 8—Investment Securities
The aggregate amount of investment securities (other than short-term securities, U.S. Treasury obligations and money market funds, if any) purchased and sold by the Fund during the year ended October 31, 2016 was $17,108,408 and $16,065,667, respectively. Cost of investments on a tax basis includes the adjustments for financial reporting purposes as of the most recently completed federal income tax reporting period-end.
23 Invesco Global Market Neutral Fund
| | | | |
| Unrealized Appreciation (Depreciation) of Investment Securities on a Tax Basis | |
Aggregate unrealized appreciation of investment securities | | $ | 2,658,883 | |
Aggregate unrealized (depreciation) of investment securities | | | (1,261,150 | ) |
Net unrealized appreciation of investment securities | | $ | 1,397,733 | |
Cost of investments for tax purposes is $19,747,273.
NOTE 9—Reclassification of Permanent Differences
Primarily as a result of differing book/tax treatment of net operating loss and excise tax, on October 31, 2016, undistributed net investment income was decreased by $634,783, undistributed net realized gain (loss) was increased by $2,204,675 and shares of beneficial interest was decreased by $1,569,892. This reclassification had no effect on the net assets of the Fund.
NOTE 10—Share Information
| | | | | | | | | | | | | | | | |
| | | Summary of Share Activity | |
| | | Years ended October 31, | |
| | | 2016(a) | | | 2015 | |
| | | Shares | | | Amount | | | Shares | | | Amount | |
Sold: | | | | | | | | | | | | | | | | |
Class A | | | 323,878 | | | $ | 3,282,254 | | | | 148,554 | | | $ | 1,522,177 | |
Class C | | | 197,014 | | | | 1,998,263 | | | | 63,575 | | | | 648,728 | |
Class R | | | 2,586 | | | | 26,252 | | | | 261 | | | | 2,625 | |
Class Y | | | 442,472 | | | | 4,518,995 | | | | 773,886 | | | | 7,905,867 | |
Class R6 | | | 22,473 | | | | 224,372 | | | | 13,855 | | | | 142,959 | |
| | | | |
Issued as reinvestment of dividends: | | | | | | | | | | | | | | | | |
Class A | | | 264 | | | | 2,697 | | | | 1,092 | | | | 11,137 | |
Class C | | | 119 | | | | 1,200 | | | | 188 | | | | 1,908 | |
Class R | | | 2 | | | | 16 | | | | 7 | | | | 71 | |
Class Y | | | 1,953 | | | | 20,025 | | | | 4,910 | | | | 50,083 | |
Class R5 | | | — | | | | — | | | | 296 | | | | 3,022 | |
Class R6 | | | 39 | | | | 397 | | | | 168 | | | | 1,710 | |
| | | | |
Reacquired: | | | | | | | | | | | | | | | | |
Class A | | | (98,828 | ) | | | (989,887 | ) | | | (90,600 | ) | | | (964,058 | ) |
Class C | | | (191,138 | ) | | | (1,883,905 | ) | | | (16,485 | ) | | | (165,132 | ) |
Class R | | | (1,854 | ) | | | (17,886 | ) | | | — | | | | — | |
Class Y | | | (404,130 | ) | | | (4,058,917 | ) | | | (283,495 | ) | | | (2,901,511 | ) |
Class R5 | | | — | | | | — | | | | (14,192 | ) | | | (146,333 | ) |
Class R6 | | | (7,869 | ) | | | (79,919 | ) | | | (4,315 | ) | | | (44,511 | ) |
Net increase in share activity | | | 286,981 | | | $ | 3,043,957 | | | | 597,705 | | | $ | 6,068,742 | |
| (a) | There are entities that are record owners of more than 5% of the outstanding shares of the Fund and in the aggregate own 45% of the outstanding shares of the Fund. IDI has an agreement with these entities to sell Fund shares. The Fund, Invesco and/or Invesco affiliates may make payments to these entities, which are considered to be related to the Fund, for providing services to the Fund, Invesco and/or Invesco affiliates including but not limited to services such as securities brokerage, distribution, third party record keeping and account servicing. The Fund has no knowledge as to whether all or any portion of the shares owned of record by these entities are also owned beneficially. |
| | In addition, 45% of the outstanding shares of the Fund are owned by the Adviser or an affiliate of the Adviser. |
24 Invesco Global Market Neutral Fund
NOTE 11—Financial Highlights
The following schedule presents financial highlights for a share of the Fund outstanding throughout the periods indicated.
| | | | | | | | | | | | | | | | | | | | | | | | | | | | | | | | | | | | | | | | | | | | | | | | | | | | | | | | |
| | | Net asset
value,
beginning
of period | | | Net
investment
income(a) | | | Net gains
(losses)
on securities
(both
realized and
unrealized) | | | Total from
investment
operations | | | Dividends
from net
investment
income | | | Distributions
from net
realized
gains | | | Total
distributions | | | Net asset
value, end
of period | | | Total
return(b) | | | Net assets,
end of period
(000’s omitted) | | | Ratio of
expenses
to average
net assets
with fee waivers
and/or expenses
absorbed | | | Ratio of
expenses
to average net
assets without
fee waivers
and/or expenses
absorbed | | | Ratio of net
investment
income (loss)
to average
net assets | | | Portfolio
turnover(c) | |
Class A | |
Year ended 10/31/16 | | $ | 10.31 | | | $ | 0.10 | | | $ | (0.47 | ) | | $ | (0.37 | ) | | $ | — | | | $ | (0.03 | ) | | $ | (0.03 | ) | | $ | 9.91 | | | | (3.64 | )% | | $ | 7,729 | | | | 1.61 | %(d) | | | 2.89 | %(d) | | | 1.00 | %(d) | | | 79 | % |
Year ended 10/31/15 | | | 10.49 | | | | 0.07 | | | | (0.06 | ) | | | 0.01 | | | | (0.18 | ) | | | (0.01 | ) | | | (0.19 | ) | | | 10.31 | | | | 0.16 | (e) | | | 5,716 | | | | 1.61 | | | | 3.28 | | | | 0.69 | | | | 77 | |
Year ended 10/31/14(f) | | | 10.00 | | | | 0.04 | | | | 0.45 | | | | 0.49 | | | | — | | | | — | | | | — | | | | 10.49 | | | | 4.90 | (g) | | | 5,197 | | | | 1.61 | (h) | | | 4.61 | (h) | | | 0.43 | (h) | | | 46 | |
Class C | | | | | | | | | | | | | | | | | | | | | | | | | | | | | | | | | | | | | | | | | | | | | | | | | | | | | | | | |
Year ended 10/31/16 | | | 10.20 | | | | 0.03 | | | | (0.46 | ) | | | (0.43 | ) | | | — | | | | (0.03 | ) | | | (0.03 | ) | | | 9.74 | | | | (4.27 | ) | | | 634 | | | | 2.36 | (d) | | | 3.64 | (d) | | | 0.25 | (d) | | | 79 | |
Year ended 10/31/15 | | | 10.41 | | | | (0.01 | ) | | | (0.03 | ) | | | (0.04 | ) | | | (0.16 | ) | | | (0.01 | ) | | | (0.17 | ) | | | 10.20 | | | | (0.35 | )(e) | | | 603 | | | | 2.36 | | | | 4.03 | | | | (0.06 | ) | | | 77 | |
Year ended 10/31/14(f) | | | 10.00 | | | | (0.03 | ) | | | 0.44 | | | | 0.41 | | | | — | | | | — | | | | — | | | | 10.41 | | | | 4.10 | (g) | | | 123 | | | | 2.36 | (h) | | | 5.36 | (h) | | | (0.32 | )(h) | | | 46 | |
Class R | | | | | | | | | | | | | | | | | | | | | | | | | | | | | | | | | | | | | | | | | | | | | | | | | | | | | | | | |
Year ended 10/31/16 | | | 10.27 | | | | 0.08 | | | | (0.46 | ) | | | (0.38 | ) | | | — | | | | (0.03 | ) | | | (0.03 | ) | | | 9.86 | | | | (3.75 | ) | | | 23 | | | | 1.86 | (d) | | | 3.14 | (d) | | | 0.75 | (d) | | | 79 | |
Year ended 10/31/15 | | | 10.46 | | | | 0.05 | | | | (0.05 | ) | | | (0.00 | ) | | | (0.18 | ) | | | (0.01 | ) | | | (0.19 | ) | | | 10.27 | | | | (0.01 | )(e) | | | 17 | | | | 1.86 | | | | 3.53 | | | | 0.44 | | | | 77 | |
Year ended 10/31/14(f) | | | 10.00 | | | | 0.02 | | | | 0.44 | | | | 0.46 | | | | — | | | | — | | | | — | | | | 10.46 | | | | 4.60 | (g) | | | 14 | | | | 1.86 | (h) | | | 4.86 | (h) | | | 0.18 | (h) | | | 46 | |
Class Y | | | | | | | | | | | | | | | | | | | | | | | | | | | | | | | | | | | | | | | | | | | | | | | | | | | | | | | | |
Year ended 10/31/16 | | | 10.34 | | | | 0.13 | | | | (0.48 | ) | | | (0.35 | ) | | | — | | | | (0.03 | ) | | | (0.03 | ) | | | 9.96 | | | | (3.43 | ) | | | 12,261 | | | | 1.36 | (d) | | | 2.64 | (d) | | | 1.25 | (d) | | | 79 | |
Year ended 10/31/15 | | | 10.52 | | | | 0.10 | | | | (0.06 | ) | | | 0.04 | | | | (0.21 | ) | | | (0.01 | ) | | | (0.22 | ) | | | 10.34 | | | | 0.38 | (e) | | | 12,305 | | | | 1.36 | | | | 3.03 | | | | 0.94 | | | | 77 | |
Year ended 10/31/14(f) | | | 10.00 | | | | 0.06 | | | | 0.46 | | | | 0.52 | | | | — | | | | — | | | | — | | | | 10.52 | | | | 5.20 | (g) | | | 7,311 | | | | 1.36 | (h) | | | 4.36 | (h) | | | 0.68 | (h) | | | 46 | |
Class R5 | | | | | | | | | | | | | | | | | | | | | | | | | | | | | | | | | | | | | | | | | | | | | | | | | | | | | | | | |
Year ended 10/31/16 | | | 10.34 | | | | 0.13 | | | | (0.48 | ) | | | (0.35 | ) | | | — | | | | (0.03 | ) | | | (0.03 | ) | | | 9.96 | | | | (3.43 | ) | | | 498 | | | | 1.36 | (d) | | | 2.56 | (d) | | | 1.25 | (d) | | | 79 | |
Year ended 10/31/15 | | | 10.51 | | | | 0.10 | | | | (0.05 | ) | | | 0.05 | | | | (0.21 | ) | | | (0.01 | ) | | | (0.22 | ) | | | 10.34 | | | | 0.47 | (e) | | | 517 | | | | 1.36 | | | | 2.97 | | | | 0.94 | | | | 77 | |
Year ended 10/31/14(f) | | | 10.00 | | | | 0.06 | | | | 0.45 | | | | 0.51 | | | | — | | | | — | | | | — | | | | 10.51 | | | | 5.10 | (g) | | | 671 | | | | 1.36 | (h) | | | 4.33 | (h) | | | 0.68 | (h) | | | 46 | |
Class R6 | | | | | | | | | | | | | | | | | | | | | | | | | | | | | | | | | | | | | | | | | | | | | | | | | | | | | | | | |
Year ended 10/31/16 | | | 10.34 | | | | 0.13 | | | | (0.47 | ) | | | (0.34 | ) | | | — | | | | (0.03 | ) | | | (0.03 | ) | | | 9.97 | | | | (3.33 | ) | | | 786 | | | | 1.36 | (d) | | | 2.56 | (d) | | | 1.25 | (d) | | | 79 | |
Year ended 10/31/15 | | | 10.51 | | | | 0.10 | | | | (0.05 | ) | | | 0.05 | | | | (0.21 | ) | | | (0.01 | ) | | | (0.22 | ) | | | 10.34 | | | | 0.47 | (e) | | | 664 | | | | 1.36 | | | | 2.97 | | | | 0.94 | | | | 77 | |
Year ended 10/31/14(f) | | | 10.00 | | | | 0.06 | | | | 0.45 | | | | 0.51 | | | | — | | | | — | | | | — | | | | 10.51 | | | | 5.10 | (g) | | | 573 | | | | 1.36 | (h) | | | 4.33 | (h) | | | 0.68 | (h) | | | 46 | |
| (a) | Calculated using average shares outstanding. |
| (b) | Includes adjustments in accordance with accounting principles generally accepted in the United States of America and as such, the net asset value for financial reporting purposes and the returns based upon those net asset values may differ from the net asset value and returns for shareholder transactions. Does not include sales charges and is not annualized for periods less than one year, if applicable. |
| (c) | Portfolio turnover is calculated at the fund level and is not annualized for periods less than one year, if applicable. |
| (d) | Ratios are based on average daily net assets (000’s omitted) of $6,897, $953, $25, $12,746, $503 and $697 for Class A, Class C, Class R, Class Y, Class R5 and Class R6 shares, respectively. |
| (e) | Amount includes the effect of the Adviser pay-in for an economic loss of $0.11 per share. Had the pay-in not been made, the total return would have been (0.91)%, (1.42)%, (1.09)%, (0.69)%, (0.60)% and (0.60)% for Class A, Class C, Class R, Class Y, Class R5 and Class R6 shares, respectively. |
| (f) | Commencement date of December 19, 2013. |
| (g) | Amount includes the effect of the Adviser pay-in for the economic loss of $0.41 per share. Had the pay-in not been made, the total return would have been 0.80%, 0.10%, 0.60%, 1.00%, 1.00% and 1.00% for Class A, Class C, Class R, Class Y, Class R5 and Class R6 shares, respectively. |
NOTE 12—Subsequent Event
Effective January 1, 2017, the Fund will pay an advisory fee to the Adviser based on the annual rate of the Fund’s average daily net assets as follows:
| | | | |
| Average Daily Net Assets | | Rate | |
First $250 million | | | 0.95% | |
Next $250 million | | | 0.93% | |
Next $500 million | | | 0.91% | |
Next $1.5 billion | | | 0.89% | |
Next $2.5 billion | | | 0.87% | |
Next $2.5 billion | | | 0.85% | |
Next $2.5 billion | | | 0.83% | |
Over $10 billion | | | 0.81% | |
In addition, effective January 1, 2017, the Adviser has contractually agreed, through at least February 28, 2018, to waive advisory fees and/or reimburse expenses to the extent necessary to limit total annual fund operating expenses after fee waiver and/or expense reimbursement (excluding certain items discussed in Note 2) of Class A, Class C, Class R, Class Y, Class R5 and Class R6 shares to 1.50%, 2.25%, 1.75%, 1.25%, 1.25% and 1.25%, respectively, of the Fund’s average daily net assets.
25 Invesco Global Market Neutral Fund
Report of Independent Registered Public Accounting Firm
To the Board of Trustees
and Shareholders of the Invesco Global Market Neutral Fund:
In our opinion, the accompanying statement of assets and liabilities, including the schedule of investments, and the related statements of operations, of changes in net assets, and of cash flows and the financial highlights present fairly, in all material respects, the financial position of the Invesco Global Market Neutral Fund (the “Fund”) as of October 31, 2016, the results of its operations and its cash flows for the year then ended, the changes in its net assets for each of the two years in the period then ended and the financial highlights for each of the two years in the period then ended and for the period December 19, 2013 (commencement of operations) through October 31, 2014, in conformity with accounting principles generally accepted in the United States of America. These financial statements and financial highlights (hereafter referred to as “financial statements”) are the responsibility of the Fund’s management. Our responsibility is to express an opinion on these financial statements based on our audits. We conducted our audits of these financial statements in accordance with the standards of the Public Company Accounting Oversight Board (United States). Those standards require that we plan and perform the audit to obtain reasonable assurance about whether the financial statements are free of material misstatement. An audit includes examining, on a test basis, evidence supporting the amounts and disclosures in the financial statements, assessing the accounting principles used and significant estimates made by management, and evaluating the overall financial statement presentation. We believe that our audits, which included confirmation of securities as of October 31, 2016 by correspondence with the custodian and brokers, provide a reasonable basis for our opinion.
PRICEWATERHOUSECOOPERS LLP
Houston, Texas
December 21, 2016
26 Invesco Global Market Neutral Fund
Calculating your ongoing Fund expenses
Example
As a shareholder of the Fund, you incur two types of costs: (1) transaction costs, which may include sales charges (loads) on purchase payments or contingent deferred sales charges on redemptions, if any; and (2) ongoing costs, including management fees, distribution and/or service (12b-1) fees, and other Fund expenses. This example is intended to help you understand your ongoing costs (in dollars) of investing in the Fund and to compare these costs with ongoing costs of investing in other mutual funds. The example is based on an investment of $1,000 invested at the beginning of the period and held for the entire period May 1, 2016 through October 31, 2016.
Actual expenses
The table below provides information about actual account values and actual expenses. You may use the information in this table, together with the amount you invested, to estimate the expenses that you paid over the period. Simply divide your account value by $1,000 (for example, an $8,600 account value divided by $1,000 = 8.6), then multiply the result by the number in the table under the heading entitled “Actual Expenses Paid During Period” to estimate the expenses you paid on your account during this period.
Hypothetical example for comparison purposes
The table below also provides information about hypothetical account values and hypothetical expenses based on the Fund’s actual expense ratio and an assumed rate of return of 5% per year before expenses, which is not the Fund’s actual return.
The hypothetical account values and expenses may not be used to estimate the actual ending account balance or expenses you paid for the period. You may use this information to compare the ongoing costs of investing in the Fund and other funds. To do so, compare this 5% hypothetical example with the 5% hypothetical examples that appear in the shareholder reports of the other funds.
Please note that the expenses shown in the table are meant to highlight your ongoing costs only and do not reflect any transaction costs, such as sales charges (loads) on purchase payments or contingent deferred sales charges on redemptions, if any. Therefore, the hypothetical information is useful in comparing ongoing costs only, and will not help you determine the relative total costs of owning different funds. In addition, if these transaction costs were included, your costs would have been higher.
| | | | | | | | | | | | | | | | | | | | | | | | |
| Class | | Beginning
Account Value
(05/01/16) | | | ACTUAL | | | HYPOTHETICAL (5% annual return before
expenses) | | | Annualized
Expense
Ratio | |
| | | Ending
Account Value
(10/31/16)1 | | | Expenses
Paid During
Period2,3 | | | Ending
Account Value
(10/31/16) | | | Expenses
Paid During
Period2,4 | | |
| A | | | 1,000.00 | | | $ | 997.00 | | | $ | 8.08 | | | $ | 1,017.04 | | | $ | 8.16 | | | | 1.61 | % |
| C | | | 1,000.00 | | | | 993.90 | | | | 11.83 | | | | 1,013.27 | | | | 11.94 | | | | 2.36 | |
| R | | | 1,000.00 | | | | 997.00 | | | | 9.34 | | | | 1,015.79 | | | | 9.42 | | | | 1.86 | |
| Y | | | 1,000.00 | | | | 998.00 | | | | 6.83 | | | | 1,018.30 | | | | 6.90 | | | | 1.36 | |
| R5 | | | 1,000.00 | | | | 998.00 | | | | 6.83 | | | | 1,018.30 | | | | 6.90 | | | | 1.36 | |
| R6 | | | 1,000.00 | | | | 999.00 | | | | 6.83 | | | | 1,018.30 | | | | 6.90 | | | | 1.36 | |
| 1 | The actual ending account value is based on the actual total return of the Fund for the period May 1, 2016 through October 31, 2016, after actual expenses and will differ from the hypothetical ending account value which is based on the Fund’s expense ratio and a hypothetical annual return of 5% before expenses. |
| 2 | Expenses are equal to the Fund’s annualized expense ratio as indicated above multiplied by the average account value over the period, multiplied by 184/366 to reflect the most recent fiscal half year. Effective January 1, 2017, the Fund’s adviser has contractually agreed to waive advisory fees and/or reimburse expenses to the extent necessary to limit total annual fund operating expense of Class A, Class C and Class R, Class Y, Class R5 and Class R6 shares to 1.50%, 2.25%, 1.75%, 1.25%, 1.25% and 1.25% of average daily net assets, respectively. The annualized expense ratios restated as if these agreements had been in effect throughout the entire most recent fiscal half year are 1.49%, 2.24%, 1.74%, 1.24%, 1.24% and 1.24% for Class A, Class C, Class R, Class Y, Class R5 and Class R6 shares, respectively. |
| 3 | The actual expenses paid restated as if the changes discussed above had been in effect throughout the entire most recent fiscal half year are $7.48, $11.23, $8.73, $6.23, $6.23 and $6.23 for Class A, Class C, Class R, Class Y, Class R5 and Class R6 shares, respectively. |
| 4 | The hypothetical expenses paid restated as if the changes discussed above had been in effect throughout the entire most recent fiscal half year are $7.56, $11.34, $8.82, $6.29, $6.29 and $6.29 for Class A, Class C, Class R, Class Y, Class R5 and Class R6 shares, respectively. |
27 Invesco Global Market Neutral Fund
Approval of Investment Advisory and Sub-Advisory Contracts
The Board of Trustees (the Board) of AIM Investment Funds (Invesco Investment Funds) is required under the Investment Company Act of 1940, as amended, to approve annually the renewal of Invesco Global Market Neutral Fund’s (the Fund) investment advisory agreements. During contract renewal meetings held on June 7-8, 2016, the Board as a whole, and the disinterested or “independent” Trustees, who comprise over 75% of the Board, voting separately, approved the continuance for the Fund of the Master Investment Advisory Agreement with Invesco Advisers, Inc. (Invesco Advisers and the investment advisory agreement) and the Master Intergroup Sub-Advisory Contract for Mutual Funds with Invesco Asset Management Deutschland GmbH, Invesco Asset Management Limited, Invesco Asset Management (Japan) Limited, Invesco Hong Kong Limited, Invesco Senior Secured Management, Inc., Invesco Canada Ltd. and Invesco PowerShares Capital Management LLC (collectively, the Affiliated Sub-Advisers and the sub-advisory contracts) for another year, effective July 1, 2016.
In evaluating the fairness and reasonableness of compensation under the Fund’s investment advisory agreement and sub-advisory contracts, the Board considered, among other things, the factors discussed below. The Board determined that continuation of the Fund’s investment advisory agreement and the sub-advisory contracts is in the best interest of the Fund and its shareholders and that the compensation payable to Invesco Advisers and the Affiliated Sub-Advisers under the agreements is fair and reasonable.
The Board’s Fund Evaluation Process
The Board’s Investments Committee has established three Sub-Committees, which meet throughout the year to review the performance of funds advised by Invesco Advisers (the Invesco Funds). Over the course of each year, the Sub-Committees meet with portfolio managers for their assigned Invesco Funds and other members of management to review the performance, investment objective(s), policies, strategies, limitations and investment risks of these funds. The Board had the benefit of reports from the Sub-Committees and Investments Committee throughout the year in considering approval of the continuance of each Invesco Fund’s investment advisory agreement and sub-advisory contracts for another year.
During the contract renewal process, the Board receives comparative performance and fee data regarding the Invesco Funds prepared by Invesco Advisers and Broadridge Financial Solutions, Inc. (Broadridge), an independent provider of investment company data. The Board also receives an independent written evaluation from the Senior Officer, an officer of the Invesco Funds who reports directly to the
independent Trustees. The Senior Officer’s evaluation is prepared as part of his responsibility to manage the process by which the Invesco Funds’ proposed management fees are negotiated during the annual contract renewal process to ensure they are negotiated in a manner that is at arms’ length and reasonable. In addition to meetings with Invesco Advisers and fund counsel, the independent Trustees also discuss the continuance of the investment advisory agreement and sub-advisory contracts in separate sessions with the Senior Officer and with independent legal counsel.
The Trustees recognized that the advisory fee rates for the Invesco Funds are, in many cases, the result of years of review and negotiation. The Trustees’ deliberations and conclusions in a particular year may be based in part on their deliberations and conclusions regarding these arrangements throughout the year and in prior years. The Trustees’ review and conclusions are based on the comprehensive consideration of all information presented to them and are not the result of any single determinative factor. Moreover, one Trustee may have weighed a particular piece of information or factor differently than another Trustee.
The discussion below is a summary of the Senior Officer’s independent written evaluation with respect to the Fund’s investment advisory agreement as well as a discussion of the material factors and related conclusions that formed the basis for the Board’s approval of the Fund’s investment advisory agreement and sub-advisory contracts. Unless otherwise stated, this information is current as of June 8, 2016, and does not reflect consideration of factors that became known to the Board after that date.
Factors and Conclusions and Summary of Independent Written Fee Evaluation
| A. | Nature, Extent and Quality of Services Provided by Invesco Advisers and the Affiliated Sub-Advisers |
The Board reviewed the advisory services provided to the Fund by Invesco Advisers under the Fund’s investment advisory agreement, the performance of Invesco Advisers in providing these services, and the credentials and experience of the officers and employees of Invesco Advisers who provide these services, including the Fund’s portfolio manager or managers. The Board’s review of the qualifications of Invesco Advisers to provide advisory services included the Board’s consideration of Invesco Advisers’ investment process oversight, independent credit analysis and investment risk management. The Board also considered non-advisory services that Invesco Advisers and its affiliates provide to the Invesco Funds such as various back office support functions, trading operations, internal audit, valuation and legal and compliance.
In determining whether to continue the Fund’s investment advisory agreement, the Board considered the benefits of reapproving an existing relationship and the greater uncertainty that may be associated with entering into a new relationship. The Board concluded that the nature, extent and quality of the services provided to the Fund by Invesco Advisers are appropriate and satisfactory and consistent with the terms of the Fund’s investment advisory agreement.
The Board reviewed the services that may be provided by the Affiliated Sub-Advisers under the sub-advisory contracts and the credentials and experience of the officers and employees of the Affiliated Sub-Advisers who provide these services. The Board noted that the Affiliated Sub-Advisers have offices and personnel that are located in financial centers around the world. As a result, the Board noted that Affiliated Sub-Advisers can provide research and investment analysis on the markets and economies of various countries in which the Fund may invest, make recommendations regarding securities and assist with security trades. The Board concluded that the sub-advisory contracts may benefit the Fund and its shareholders by permitting Invesco Advisers to use the resources and talents of the Affiliated Sub-Advisers in managing the Fund. The Board concluded that the nature, extent and quality of the services that may be provided by the Affiliated Sub-Advisers are appropriate and satisfactory and consistent with the terms of the Fund’s sub-advisory contracts.
The Board considered Fund performance as a relevant factor in considering whether to approve the investment advisory agreement as well as the sub-advisory contracts for the Fund, as Invesco Asset Management Deutschland GmbH currently manages assets of the Fund.
The Board compared the Fund’s performance during the past one and two calendar years to the performance of funds in the Broadridge performance universe and against the Lipper Alternative Equity Market Neutral Funds Index. The Board noted that performance of Class A shares of the Fund was in the third quintile of its performance universe for the one period and the second quintile for the two year period (the first quintile being the best performing funds and the fifth quintile being the worst performing funds). The Board noted that performance of Class A shares of the Fund was above the performance of the Index for the one and two year periods. The Trustees also reviewed more recent Fund performance and this review did not change their conclusions.
| C. | Advisory and Sub-Advisory Fees |
The Board compared the Fund’s contractual management fee rate to the contractual management fee rates of funds in the Fund’s Broadridge expense group at a common asset
28 Invesco Global Market Neutral Fund
level. The Board noted that the contractual management fee rate for Class A shares of the Fund was above the median contractual management fee rate of funds in its expense group. The Board noted that the term “contractual management fee” for funds in the expense group may include both advisory and certain administrative services fees, but that Broadridge does not provide information on a fund by fund basis as to what is included. The Board noted that Invesco does not separately charge the Invesco Funds for the administrative services included in the term as defined by Broadridge. The Board also reviewed the methodology used by Broadridge in providing expense group information, which includes using each fund’s contractual fee schedule (including any applicable breakpoints) as reported in the most recent prospectus or statement of information for each fund in the expense group.
The Board noted that Invesco Advisers has contractually agreed to waive fees and/or limit expenses of the Fund through at least February 28, 2017 in an amount necessary to limit total annual operating expenses to a specified percentage of average daily net assets for each class of the Fund.
The Board noted that Invesco Advisers and the Affiliated Sub-Advisers do not manage other mutual funds or client accounts with investment strategies comparable to those of the Fund.
The Board also considered the services that may be provided by the Affiliated Sub-Advisers pursuant to the sub-advisory contracts, as well as the fees payable by Invesco Advisers to the Affiliated Sub-Advisers pursuant to the sub-advisory contracts. The Board noted that Invesco Advisers retains overall responsibility for, and provides services to, sub-advised Invesco Funds, including oversight of the Affiliated Sub-Advisers as well as the additional services described herein other than day-to-day portfolio management. The Board also noted that the sub-advisory fees are not paid directly by the Fund, but rather, are payable by Invesco Advisers to the Affiliated Sub-Advisers.
| D. | Economies of Scale and Breakpoints |
The Board considered the extent to which there are economies of scale in the provision of advisory services to the Fund. The Board also considered whether the Fund benefits from economies of scale through contractual breakpoints in the Fund’s advisory fee schedule. The Board also noted that the Fund shares directly in economies of scale through lower fees charged by third party service providers based on the combined size of the Invesco Funds and other clients advised by Invesco Advisers.
| E. | Profitability and Financial Resources |
The Board reviewed information from Invesco Advisers concerning the costs of the advisory and other services that Invesco Advisers and its affiliates provide to the Fund and the Invesco Funds and the profitability of Invesco Advisers and its affiliates in providing these services. The Board received information from Invesco
Advisers and a report from an independent consultant engaged by the Senior Officer about the methodology used to prepare the profitability information. The Board noted that Invesco Advisers continues to operate at a net profit from services Invesco Advisers and its affiliates provide to the Invesco Funds. The Board noted that although Invesco Advisers received a minimal amount of revenues from advising the Fund, Invesco Advisers and its subsidiaries did not make a profit from managing the Fund. The Board received and accepted information from Invesco Advisers demonstrating that Invesco Advisers and each Affiliated Sub-Adviser are financially sound and have the resources necessary to perform their obligations under the investment advisory agreement and sub-advisory contracts.
| F. | Collateral Benefits to Invesco Advisers and its Affiliates |
The Board considered various other benefits received by Invesco Advisers and its affiliates from the relationship with the Fund, including the fees received for providing transfer agency and distribution services to the Fund. The Board considered comparative information regarding fees charged for these services, including information provided by Broadridge and other independent sources. The Board considered the performance of Invesco Advisers and its affiliates in providing these services and the organizational structure employed to provide these services. The Board also considered that these services are provided to the Fund pursuant to written contracts that are reviewed and approved on an annual basis by the Board; and that the services are required for the operation of the Fund.
The Board considered the benefits realized by Invesco Advisers and the Affiliated Sub-Advisers as a result of portfolio brokerage transactions executed through “soft dollar” arrangements. The Board noted that soft dollar arrangements shift the payment obligation for research services from Invesco Advisers and the Affiliated Sub-Advisers to the Invesco Funds and that the research received may be used with other clients of Invesco Advisers and may reduce Invesco Advisers’ and the Affiliated Sub-Advisers’ expenses. The Board also considered that it receives periodic reports from the Chief Compliance Officer of the Invesco Funds demonstrating that these arrangements are consistent with regulatory requirements. The Board did not deem the soft dollar arrangements to be inappropriate.
The Board considered that the Fund’s uninvested cash and cash collateral from any securities lending arrangements may be invested in money market funds advised by Invesco Advisers pursuant to procedures approved by the Board. The Board noted that Invesco Advisers receives advisory fees from these affiliated money market funds attributable to such investments, although Invesco Advisers has contractually agreed to waive through varying periods the advisory fees payable by the Invesco Funds with respect to
certain investments in the affiliated money market funds. The waiver is in an amount equal to 100% of the net advisory fee Invesco Advisers receives from the affiliated money market funds with respect to the Fund’s investment in the affiliated money market funds of uninvested cash, but not cash collateral. The Board concluded that the amount of advisory fees received by Invesco Advisors from the Fund’s investment of cash collateral from any securities lending arrangements in the affiliated money market funds is fair and reasonable.
The Board also considered the Fund may use an affiliated broker to execute certain trades for the Fund to, among other things, control information leakage, and were advised that such trades would be executed in compliance with rules under the Investment Company Act of 1940, as amended, and consistent with best execution obligations.
29 Invesco Global Market Neutral Fund
Tax Information
Form 1099-DIV, Form 1042-S and other year-end tax information provide shareholders with actual calendar year amounts that should be included in their tax returns. Shareholders should consult their tax advisors.
The following distribution information is being provided as required by the Internal Revenue Code or to meet a specific state’s requirement.
The Fund designates the following amounts or, if subsequently determined to be different, the maximum amount allowable for its fiscal year ended October 31, 2016:
| | | | |
Federal and State Income Tax | | | |
Long-Term Capital Gain Distributions | | $ | 50,264 | |
Qualified Dividend Income* | | | 0 | % |
Corporate Dividends Received Deduction* | | | 0 | % |
U.S. Treasury Obligations* | | | 0 | % |
| | * | The above percentages are based on ordinary income dividends paid to shareholders during the Fund’s fiscal year. |
30 Invesco Global Market Neutral Fund
Trustees and Officers
The address of each trustee and officer is AIM Investment Funds (Invesco Investment Funds) (the “Trust”), 11 Greenway Plaza, Suite 1000, Houston, Texas 77046-1173. The trustees serve for the life of the Trust, subject to their earlier death, incapacitation, resignation, retirement or removal as more specifically provided in the Trust’s organizational documents. Each officer serves for a one year term or until their successors are elected and qualified. Column two below includes length of time served with predecessor entities, if any.
| | | | | | | | |
Name, Year of Birth and
Position(s) Held with the Trust | | Trustee and/
or Officer Since | | Principal Occupation(s)
During Past 5 Years | | Number of
Funds in Fund
Complex
Overseen by
Trustee | | Other Directorship(s)
Held by Trustee During
Past 5 Years |
| Interested Persons | | | | | | | | |
| Martin L. Flanagan1 — 1960 Trustee | | 2007 | | Executive Director, Chief Executive Officer and President, Invesco Ltd. (ultimate parent of Invesco and a global investment management firm); Advisor to the Board, Invesco Advisers, Inc. (formerly known as Invesco Institutional (N.A.), Inc.); Trustee, The Invesco Funds; Vice Chair, Investment Company Institute; and Member of Executive Board, SMU Cox School of Business Formerly: Chairman and Chief Executive Officer, Invesco Advisers, Inc. (registered investment adviser); Director, Chairman, Chief Executive Officer and President, Invesco Holding Company (US) Inc. (formerly IVZ Inc.) (holding company), Invesco Group Services, Inc. (service provider) and Invesco North American Holdings, Inc. (holding company); Director, Chief Executive Officer and President, Invesco Holding Company Limited (parent of Invesco and a global investment management firm); Director, Invesco Ltd.; Chairman, Investment Company Institute and President, Co-Chief Executive Officer, Co-President, Chief Operating Officer and Chief Financial Officer, Franklin Resources, Inc. (global investment management organization) | | 146 | | None |
| Philip A. Taylor2 — 1954 Trustee and Senior Vice President | | 2006 | | Head of the Americas and Senior Managing Director, Invesco Ltd.; Director, Co-Chairman, Co-President and Co-Chief Executive Officer, Invesco Advisers, Inc. (formerly known as Invesco Institutional (N.A.), Inc.) (registered investment adviser); Director, Chairman, Chief Executive Officer and President, Invesco Management Group, Inc. (formerly known as Invesco AIM Management Group, Inc.) (financial services holding company); Director and Chairman, Invesco Investment Services, Inc. (formerly known as Invesco AIM Investment Services, Inc.) (registered transfer agent) Chief Executive Officer, Invesco Corporate Class Inc. (corporate mutual fund company) Director, Chairman and Chief Executive Officer, Invesco Canada Ltd. (formerly known as Invesco Trimark Ltd./Invesco Trimark Ltèe) (registered investment adviser and registered transfer agent); Trustee and Senior Vice President, The Invesco Funds; Director, Invesco Investment Advisers LLC (formerly known as Van Kampen Asset Management). Formerly: Director, Chief Executive Officer and President, Van Kampen Exchange Corp.; President and Principal Executive Officer, The Invesco Funds (other than AIM Treasurer’s Series Trust (Invesco Treasurer’s Series Trust), Short-Term Investments Trust and Invesco Management Trust); Executive Vice President, The Invesco Funds (AIM Treasurer’s Series Trust (Invesco Treasurer’s Series Trust), Short-Term Investments Trust and Invesco Management Trust only); Director and President, INVESCO Funds Group, Inc. (registered investment adviser and registered transfer agent); Director and Chairman, IVZ Distributors, Inc. (formerly known as INVESCO Distributors, Inc.) (registered broker dealer); Director, President and Chairman, Invesco Inc. (holding company), Invesco Canada Holdings Inc. (holding company), Trimark Investments Ltd./Placements Trimark Ltèe and Invesco Financial Services Ltd/Services Financiers Invesco Ltèe; Chief Executive Officer, Invesco Canada Fund Inc. (corporate mutual fund company); Director and Chairman, Van Kampen Investor Services Inc.; Director, Chief Executive Officer and President, 1371 Preferred Inc. (holding company) and Van Kampen Investments Inc.; Director and President, AIM GP Canada Inc. (general partner for limited partnerships) and Van Kampen Advisors, Inc.; Director and Chief Executive Officer, Invesco Trimark Dealer Inc. (registered broker dealer); Director, Invesco Distributors, Inc. (formerly known as Invesco AIM Distributors, Inc.) (registered broker dealer); Manager, Invesco PowerShares Capital Management LLC; Director, Chief Executive Officer and President, Invesco Advisers, Inc.; Director, Chairman, Chief Executive Officer and President, Invesco AIM Capital Management, Inc.; President, Invesco Trimark Dealer Inc. and Invesco Trimark Ltd./Invesco Trimark Ltèe; Director and President, AIM Trimark Corporate Class Inc. and AIM Trimark Canada Fund Inc.; Senior Managing Director, Invesco Holding Company Limited; Director and Chairman, Fund Management Company (former registered broker dealer); President and Principal Executive Officer, The Invesco Funds (AIM Treasurer’s Series Trust (Invesco Treasurer’s Series Trust), and Short-Term Investments Trust only); President, AIM Trimark Global Fund Inc. and AIM Trimark Canada Fund Inc. | | 146 | | None |
| 1 | Mr. Flanagan is considered an interested person (within the meaning of Section 2(a)(19) of the 1940 Act) of the Trust because he is an officer of the Adviser to the Trust, and an officer and a director of Invesco Ltd., ultimate parent of the Adviser. |
| 2 | Mr. Taylor is considered an interested person (within the meaning of Section 2(a)(19) of the 1940 Act) of the Trust because he is an officer and a director of the Adviser. |
T-1 Invesco Global Market Neutral Fund
Trustees and Officers—(continued)
| | | | | | | | |
Name, Year of Birth and
Position(s) Held with the Trust | | Trustee and/
or Officer Since | | Principal Occupation(s) During Past 5 Years | | Number of
Funds in Fund
Complex
Overseen by
Trustee | | Other Directorship(s)
Held by Trustee During
Past 5 Years |
| Independent Trustees | | | | | | | | |
Bruce L. Crockett — 1944 Trustee and Chair | | 2001 | | Chairman, Crockett Technologies Associates (technology consulting company) Formerly: Director, Captaris (unified messaging provider); Director, President and Chief Executive Officer, COMSAT Corporation; Chairman, Board of Governors of INTELSAT (international communications company); ACE Limited (insurance company); Independent Directors Council and Investment Company Institute | | 146 | | ALPS (Attorneys Liability Protection Society) (insurance company) and Globe Specialty Metals, Inc. (metallurgical company); Member of the Audit Committee, Ferroglobe PLC and Investment Company Institute; Member of the Executive Committee and Chair of the Governance Committee, Independent Directors Council |
David C. Arch — 1945 Trustee | | 2010 | | Chairman of Blistex Inc., a consumer health care products manufacturer | | 146 | | Board member of the Illinois Manufacturers’ Association; Member of the Board of Visitors, Institute for the Humanities, University of Michigan |
James T. Bunch — 1942 Trustee | | 2003 | | Managing Member, Grumman Hill Group LLC (family office/private equity investments) Formerly: Chairman of the Board, Denver Film Society, Chairman of the Board of Trustees, Evans Scholarship Foundation; Chairman, Board of Governors, Western Golf Association | | 146 | | Trustee, Evans Scholarship Foundation |
Albert R. Dowden — 1941 Trustee | | 2001 | | Director of a number of public and private business corporations, including Nature’s Sunshine Products, Inc. Formerly: Director, The Boss Group, Ltd. and Reich & Tang Funds (5 portfolios) (registered investment company); Director, Homeowners of America Holding Corporation/Homeowners of America Insurance Company (property casualty company); Director, Continental Energy Services, LLC (oil and gas pipeline service); Director, CompuDyne Corporation (provider of product and services to the public security market) and Director, Annuity and Life Re (Holdings), Ltd. (reinsurance company); Director, President and Chief Executive Officer, Volvo Group North America, Inc.; Senior Vice President, AB Volvo; Director of various public and private corporations; Chairman, DHJ Media, Inc.; Director, Magellan Insurance Company; and Director, The Hertz Corporation, Genmar Corporation (boat manufacturer), National Media Corporation; Advisory Board of Rotary Power International (designer, manufacturer, and seller of rotary power engines); and Chairman, Cortland Trust, Inc. (registered investment company) | | 146 | | Director of Nature’s Sunshine Products, Inc. |
Jack M. Fields — 1952 Trustee | | 2001 | | Chief Executive Officer, Twenty First Century Group, Inc. (government affairs company); and Discovery Learning Alliance (non-profit) Formerly: Owner and Chief Executive Officer, Dos Angeles Ranch L.P. (cattle, hunting, corporate entertainment); Director, Insperity, Inc. (formerly known as Administaff); Chief Executive Officer, Texana Timber LP (sustainable forestry company); Director of Cross Timbers Quail Research Ranch (non-profit); and member of the U.S. House of Representatives | | 146 | | None |
Eli Jones — 1961 Trustee | | 2016 | | Professor and Dean, Mays Business School — Texas A&M University Formerly: Professor and Dean, Walton College of Business, University of Arkansas and E.J. Ourso College of Business, Louisiana State University and Director, Arvest Bank | | 146 | | Director of Insperity, Inc. (formerly known as Administaff) |
Prema Mathai-Davis — 1950 Trustee | | 2001 | | Retired. Formerly: Chief Executive Officer, YWCA of the U.S.A. | | 146 | | None |
Larry Soll — 1942 Trustee | | 2003 | | Retired. Formerly: Chairman, Chief Executive Officer and President, Synergen Corp. (a biotechnology company) | | 146 | | None |
Raymond Stickel, Jr. — 1944 Trustee | | 2005 | | Retired. Formerly: Director, Mainstay VP Series Funds, Inc. (25 portfolios) and Partner, Deloitte & Touche | | 146 | | None |
Robert C. Troccoli — 1949 Trustee | | 2016 | | Adjunct Professor, University of Denver — Daniels College of Business Formerly: Senior Partner, KPMG LLP | | 146 | | None |
T-2 Invesco Global Market Neutral Fund
Trustees and Officers—(continued)
| | | | | | | | |
Name, Year of Birth and
Position(s) Held with the Trust | | Trustee and/
or Officer Since | | Principal Occupation(s) During Past 5 Years | | Number of
Funds in Fund
Complex
Overseen by
Trustee | | Other Directorship(s)
Held by Trustee During
Past 5 Years |
| Independent Trustees—(continued) |
Suzanne H. Woolsey — 1941 Trustee | | 2014 | | Retired. Formerly: Chief Executive Officer of Woolsey Partners LLC | | 146 | | Director, SunShare LLC; Trustee, Ocean Conservancy; Emeritus Chair of the Board of Trustees of the Institute for Defense Analyses and of Colorado College; Trustee, Chair, Business and Finance Committee of California Institute of Technology; Prior to 2014, Director of Fluor Corp.; Prior to 2010, Trustee of the German Marshall Fund of the United States; Prior to 2010, Trustee of the Rocky Mountain Institute |
| Other Officers | | | | | | | | |
Sheri Morris — 1964 President, Principal Executive Officer and Treasurer | | 1999 | | President, Principal Executive Officer and Treasurer, The Invesco Funds; Vice President, Invesco Advisers, Inc. (formerly known as Invesco Institutional (N.A.), Inc.) (registered investment adviser); and Vice President, PowerShares Exchange-Traded Fund Trust, PowerShares Exchange-Traded Fund Trust II, PowerShares India Exchange-Traded Fund Trust, PowerShares Actively Managed Exchange-Traded Fund Trust, and PowerShares Actively Managed Exchange-Traded Commodity Fund Trust Formerly: Vice President and Principal Financial Officer, The Invesco Funds; Vice President, Invesco AIM Advisers, Inc., Invesco AIM Capital Management, Inc. and Invesco AIM Private Asset Management, Inc.; Assistant Vice President and Assistant Treasurer, The Invesco Funds and Assistant Vice President, Invesco Advisers, Inc., Invesco AIM Capital Management, Inc. and Invesco AIM Private Asset Management, Inc.; and Treasurer, PowerShares Exchange-Traded Fund Trust, PowerShares Exchange-Traded Fund Trust II, PowerShares India Exchange-Traded Fund Trust and PowerShares Actively Managed Exchange-Traded Fund Trust | | N/A | | N/A |
Russell C. Burk — 1958 Senior Vice President and Senior Officer | | 2005 | | Senior Vice President and Senior Officer, The Invesco Funds | | N/A | | N/A |
John M. Zerr — 1962 Senior Vice President, Chief Legal Officer and Secretary | | 2006 | | Director, Senior Vice President, Secretary and General Counsel, Invesco Management Group, Inc. (formerly known as Invesco AIM Management Group, Inc.; Senior Vice President, Invesco Advisers, Inc. (formerly known as Invesco Institutional (N.A.), Inc.) (registered investment adviser); Senior Vice President and Secretary, Invesco Distributors, Inc. (formerly known as Invesco AIM Distributors, Inc.); Director, Vice President and Secretary, Invesco Investment Services, Inc. (formerly known as Invesco AIM Investment Services, Inc.) Senior Vice President, Chief Legal Officer and Secretary, The Invesco Funds; Managing Director, Invesco PowerShares Capital Management LLC; Director, Secretary and General Counsel, Invesco Investment Advisers LLC (formerly known as Van Kampen Asset Management); Secretary and General Counsel, Invesco Capital Markets, Inc. (formerly known as Van Kampen Funds Inc.) and Chief Legal Officer, PowerShares Exchange-Traded Fund Trust, PowerShares Exchange-Traded Fund Trust II, PowerShares India Exchange-Traded Fund Trust, PowerShares Actively Managed Exchange-Traded Fund Trust, and PowerShares Actively Managed Exchange-Traded Commodity Fund Trust Formerly: Director, Secretary, General Counsel and Senior Vice President, Van Kampen Exchange Corp.; Director, Vice President and Secretary, IVZ Distributors, Inc. (formerly known as INVESCO Distributors, Inc.); Director and Vice President, INVESCO Funds Group, Inc.; Director and Vice President, Van Kampen Advisors Inc.; Director, Vice President, Secretary and General Counsel, Van Kampen Investor Services Inc.; Director, Invesco Distributors, Inc. (formerly known as Invesco AIM Distributors, Inc.); Director, Senior Vice President, General Counsel and Secretary, Invesco AIM Advisers, Inc. and Van Kampen Investments Inc.; Director, Vice President and Secretary, Fund Management Company; Director, Senior Vice President, Secretary, General Counsel and Vice President, Invesco AIM Capital Management, Inc.; Chief Operating Officer and General Counsel, Liberty Ridge Capital, Inc. (an investment adviser); Vice President and Secretary, PBHG Funds (an investment company) and PBHG Insurance Series Fund (an investment company); Chief Operating Officer, General Counsel and Secretary, Old Mutual Investment Partners (a broker-dealer); General Counsel and Secretary, Old Mutual Fund Services (an administrator) and Old Mutual Shareholder Services (a shareholder servicing center); Executive Vice President, General Counsel and Secretary, Old Mutual Capital, Inc. (an investment adviser); and Vice President and Secretary, Old Mutual Advisors Funds (an investment company) | | N/A | | N/A |
T-3 Invesco Global Market Neutral Fund
Trustees and Officers—(continued)
| | | | | | | | |
Name, Year of Birth and
Position(s) Held with the Trust | | Trustee and/
or Officer Since | | Principal Occupation(s) During Past 5 Years | | Number of
Funds in Fund
Complex
Overseen by
Trustee | | Other Directorship(s)
Held by Trustee During
Past 5 Years |
| Other Officers—(continued) | | | | | | | | |
| Karen Dunn Kelley — 1960 Senior Vice President | | 2004 | | Senior Managing Director, Investments, Invesco Ltd.; Director, Co-President, Co-Chief Executive Officer, and Co-Chairman, Invesco Advisers, Inc. (formerly known as Invesco Institutional (N.A.), Inc.) (registered investment adviser); Chairman and Director, Invesco Senior Secured Management, Inc.; Senior Vice President, Invesco Management Group, Inc. (formerly known as Invesco AIM Management Group, Inc.); Executive Vice President, Invesco Distributors, Inc. (formerly known as Invesco AIM Distributors, Inc.); Director, Invesco Mortgage Capital Inc. and Invesco Management Company Limited; Senior Vice President, The Invesco Funds Formerly: Vice President, The Invesco Funds (other than AIM Treasurer’s Series Trust (Invesco Treasurer’s Series Trust), Short-Term Investments Trust and Invesco Management Trust); and President and Principal Executive Officer, The Invesco Funds (AIM Treasurer’s Series Trust (Invesco Treasurer’s Series Trust), Short-Term Investments Trust and Invesco Management Trust only); Director and President, INVESCO Asset Management (Bermuda) Ltd., Director, INVESCO Global Asset Management DAC (formerly known as INVESCO Global Asset Management Limited) and INVESCO Management S.A.; Senior Vice President, Van Kampen Investments Inc. and Invesco Advisers, Inc. (formerly known as Invesco Institutional (N.A.), Inc.) (registered investment adviser); Director and President, Fund Management Company; Chief Cash Management Officer, Director of Cash Management, Senior Vice President, and Managing Director, Invesco AIM Capital Management, Inc.; Director of Cash Management, Senior Vice President, and Vice President, Invesco Advisers, Inc. and Vice President, The Invesco Funds (AIM Treasurer’s Series Trust (Invesco Treasurer’s Series Trust), and Short-Term Investments Trust only) | | N/A | | N/A |
Kelli Gallegos — 1970 Vice President, Principal Financial Officer and Assistant Treasurer | | 2008 | | Vice President, Principal Financial Officer and Assistant Treasurer, The Invesco Funds; Assistant Treasurer, Invesco PowerShares Capital Management LLC, PowerShares Exchange-Traded Fund Trust, PowerShares Exchange-Traded Fund Trust II, PowerShares India Exchange-Traded Fund Trust, PowerShares Actively Managed Exchange-Traded Fund Trust, and PowerShares Actively Managed Exchange-Traded Commodity Fund Trust Formerly: Assistant Vice President, The Invesco Funds | | N/A | | N/A |
Tracy Sullivan — 1962 Vice President, Chief Tax Officer and Assistant Treasurer | | 2008 | | Vice President, Chief Tax Officer and Assistant Treasurer, The Invesco Funds; Assistant Treasurer, Invesco PowerShares Capital Management LLC, PowerShares Exchange-Traded Fund Trust, PowerShares Exchange-Traded Fund Trust II, PowerShares India Exchange-Traded Fund Trust, PowerShares Actively Managed Exchange-Traded Fund Trust, and PowerShares Actively Managed Exchange-Traded Commodity Fund Trust Formerly: Assistant Vice President, The Invesco Funds | | N/A | | N/A |
Crissie M. Wisdom — 1969 Anti-Money Laundering Compliance Officer | | 2013 | | Anti-Money Laundering Compliance Officer, Invesco Advisers, Inc. (formerly known as Invesco Institutional (N.A.), Inc.) (registered investment adviser), Invesco Capital Markets, Inc. (formerly known as Van Kampen Funds Inc.), Invesco Distributors, Inc., Invesco Investment Services, Inc., Invesco Management Group, Inc., The Invesco Funds, and PowerShares Exchange-Traded Fund Trust, PowerShares Exchange-Traded Fund Trust II, PowerShares India Exchange-Traded Fund Trust, PowerShares Actively Managed Exchange-Traded Fund Trust and PowerShares Actively Managed Exchange-Traded Commodity Fund Trust; Anti-Money Laundering Compliance Officer and Bank Secrecy Act Officer, INVESCO National Trust Company and Invesco Trust Company; and Fraud Prevention Manager and Controls and Risk Analysis Manager for Invesco Investment Services, Inc. Formerly: Anti-Money Laundering Compliance Officer, Van Kampen Exchange Corp. | | N/A | | N/A |
Robert R. Leveille — 1969 Chief Compliance Officer | | 2016 | | Chief Compliance Officer, Invesco Advisers, Inc. (registered investment adviser); and Chief Compliance Officer, The Invesco Funds Formerly: Chief Compliance Officer, Putnam Investments and the Putnam Funds | | N/A | | N/A |
The Statement of Additional Information of the Trust includes additional information about the Fund’s Trustees and is available upon request, without charge, by calling 1.800.959.4246. Please refer to the Fund’s Statement of Additional Information for information on the Fund’s sub-advisers.
| | | | | | |
Office of the Fund 11 Greenway Plaza, Suite 1000 Houston, TX 77046-1173 | | Investment Adviser Invesco Advisers, Inc. 1555 Peachtree Street, N.E. Atlanta, GA 30309 | | Distributor Invesco Distributors, Inc. 11 Greenway Plaza, Suite 1000 Houston, TX 77046-1173 | | Auditors PricewaterhouseCoopers LLP 1000 Louisiana Street, Suite 5800 Houston, TX 77002-5678 |
| | | |
| | | | | | |
Counsel to the Fund Stradley Ronon Stevens & Young, LLP 2005 Market Street, Suite 2600 Philadelphia, PA 19103-7018 | | Counsel to the Independent Trustees Goodwin Procter LLP 901 New York Avenue, N.W. Washington, D.C. 20001 | | Transfer Agent Invesco Investment Services, Inc. 11 Greenway Plaza, Suite 1000 Houston, TX 77046-1173 | | Custodian State Street Bank and Trust Company 225 Franklin Street Boston, MA 02110-2801 |
T-4 Invesco Global Market Neutral Fund
Explore High-Conviction Investing with Invesco

Invesco mailing information
Send general correspondence to Invesco Investment Services, Inc., P.O. Box 219078, Kansas City, MO 64121-9078.
Important notice regarding delivery of security holder documents
To reduce Fund expenses, only one copy of most shareholder documents may be mailed to shareholders with multiple accounts at the same address (Householding). Mailing of your shareholder documents may be householded indefinitely unless you instruct us otherwise. If you do not want the mailing of these documents to be combined with those for other members of your household, please contact Invesco Investment Services, Inc. at 800 959 4246 or contact your financial institution. We will begin sending you individual copies for each account within 30 days after receiving your request.
Fund holdings and proxy voting information
The Fund provides a complete list of its holdings four times in each fiscal year, at the quarter ends. For the second and fourth quarters, the lists appear in the Fund’s semiannual and annual reports to shareholders. For the first and third quarters, the Fund files the lists with the Securities and Exchange Commission (SEC) on Form N-Q. The most recent list of portfolio holdings is available at invesco.com/completeqtrholdings. Shareholders can also look up the Fund’s Forms N-Q on the SEC website at sec.gov. Copies of the Fund’s Forms N-Q may be reviewed and copied at the SEC Public Reference Room in Washington, D.C. You can obtain information on the operation of the Public Reference Room, including information about duplicating fee charges, by calling 202 551 8090 or 800 732 0330, or by electronic request at the following email address: publicinfo@sec.gov.
The SEC file numbers for the Fund are shown below.
A description of the policies and procedures that the Fund uses to determine how to vote proxies relating to portfolio securities is available without charge, upon request, from our Client Services department at 800 959 4246 or at invesco.com/proxyguidelines. The information is also available on the SEC website, sec.gov.
| | |
Information regarding how the Fund voted proxies related to its portfolio securities during the most recent 12-month period ended June 30 is available at invesco.com/proxysearch. The information is also available on the SEC website, sec.gov. Invesco Advisers, Inc. is an investment adviser; it provides investment advisory services to individual and institutional clients and does not sell securities. Invesco Distributors, Inc. is the US distributor for Invesco Ltd.’s retail mutual funds, exchange-traded funds and institutional money market funds. Both are wholly owned, indirect subsidiaries of Invesco Ltd. | |  |
| | | | |
| SEC file numbers: 811-05426 and 033-19338 | | GMN-AR-1 | | Invesco Distributors, Inc. |
| | | | | | |
| | | | |
 | | | | Annual Report to Shareholders | | October 31, 2016 |
| | | | |
| | | | Invesco Global Targeted Returns Fund |
| | | | Nasdaq: |
| | | | A: GLTAX ∎ C: GLTCX ∎ R: GLTRX ∎ Y: GLTYX ∎ R5: GLTFX ∎ R6: GLTSX |

|
Letters to Shareholders
| | |

Philip Taylor | | Dear Shareholders: This annual report includes information about your Fund, including performance data and a complete list of its investments as of the close of the reporting period. Inside is a discussion of how your Fund was managed and the factors that affected its performance during the reporting period. In December 2015, the US Federal Reserve raised short-term interest rates for the first time since 2006, signaling its belief that the economy was likely to continue strengthening. Indeed, throughout the reporting period, US economic data were generally positive and the economy expanded at a moderate rate – but there were some bumps along the road. Job growth in May 2016 was very weak, but it was followed by strong increases in nonfarm payrolls in June and July. Increased concerns about global economic weakness caused US stock market indexes to sink at the start of calendar year 2016, but they eventually recovered; they sank again following |
the UK’s decision to leave the European Union, but then quickly recovered and reached record highs later in the summer. Strong demand for income-producing investments, particularly those perceived to be lower risk, benefited bonds as well as dividend-paying stocks for much of the reporting period. While economic news in the US was generally positive, news overseas was less upbeat. The European Central Bank, and central banks in China and Japan – as well as other countries – maintained extraordinarily accommodative monetary policies in response to economic weakness. As the fiscal year drew to a close, uncertainty about the outcome of the US presidential election resulted in increased market volatility; the surprise outcome after the close of the reporting period suggested that market volatility may continue for some time to come.
Short-term market volatility can prompt some investors to abandon their investment plans – and can cause others to settle for average results. The investment professionals at Invesco, in contrast, invest with high conviction, take a long-term perspective and have a passion to exceed. Invesco’s pure focus on investment management eliminates possible distractions and means that there are no competing lines of business for us to support. Just as important, we embrace a variety of investment strategies, asset classes and geographies – because we know that no single investment approach meets the diverse needs of all of our clients. We manage all our investment approaches with a passion to exceed. All our investment teams have a highly disciplined, long-term investing style that eliminates short-term decision-making. Of course, investing with high conviction can’t guarantee a profit or ensure success; no investment strategy can. To learn more about how we invest with high conviction, visit invesco.com/HighConviction.
You, too, can invest with high conviction by maintaining a long-term investment perspective and by working with your financial adviser on a regular basis. During periods of short-term market volatility or uncertainty, your financial adviser can keep you focused on your long-term investment goals – a new home, a child’s college education or a secure retirement. He or she also can share research about the economy, the markets and individual investment options.
Visit our website for more information on your investments
Our website, invesco.com/us, offers a wide range of market insights and investment perspectives. On the website, you’ll find detailed information about our funds, including performance, holdings and portfolio manager commentaries. You can access information about your account by completing a simple, secure online registration. Click on the “Need to register” link in the “Account Access” box on our homepage to get started.
In addition to the resources accessible on our website and through our mobile app, you can obtain timely updates to help you stay informed about the markets, the economy and investing by connecting with Invesco on Twitter, LinkedIn or Facebook. You can access our blog at blog.invesco.us.com. Our goal is to provide you the information you want, when and where you want it.
Finally, I’m pleased to share with you Invesco’s commitment to both the Principles for Responsible Investment and to considering environmental, social and governance issues in our robust investment process. I invite you to learn more at invesco.com/esg.
Have questions?
For questions about your account, contact an Invesco client services representative at 800 959 4246. For Invesco-related questions or comments, please email me directly at phil@invesco.com.
All of us at Invesco look forward to serving your investment management needs. Thank you for investing with us.
Sincerely,

Philip Taylor
Senior Managing Director, Invesco Ltd.
2 Invesco Global Targeted Returns Fund
| | | | | | |

Bruce Crockett | | | | Dear Fellow Shareholders: Among the many important lessons I’ve learned in more than 40 years in a variety of business endeavors is the value of a trusted advocate. As independent chair of the Invesco Funds Board, I can assure you that the members of the Board are strong advocates for the interests of investors in Invesco’s mutual funds. We work hard to represent your interests through oversight of the quality of the investment management services your funds receive and other matters important to your investment, including but not limited to: |
| | | | ∎ | | Ensuring that Invesco offers a diverse lineup of mutual funds that your financial adviser can use to strive to meet your financial needs as your investment goals change over time. |
| | | | ∎ | | Monitoring how the portfolio management teams of the Invesco funds are performing in light of changing economic and market conditions. |
| ∎ | | Assessing each portfolio management team’s investment performance within the context of the investment strategy described in the fund’s prospectus. |
| ∎ | | Monitoring for potential conflicts of interests that may impact the nature of the services that your funds receive. |
We believe one of the most important services we provide our fund shareholders is the annual review of the funds’ advisory and sub-advisory contracts with Invesco Advisers and its affiliates. This review is required by the Investment Company Act of 1940 and focuses on the nature and quality of the services Invesco provides as the adviser to the Invesco funds and the reasonableness of the fees that it charges for those services. Each year, we spend months carefully reviewing information received from Invesco and a variety of independent sources, such as performance and fee data prepared by Lipper Inc., an independent, third-party firm widely recognized as a leader in its field. We also meet with our independent legal counsel and other independent advisers to review and help us assess the information that we have received. Our goal is to assure that you receive quality investment management services for a reasonable fee.
I trust the measures outlined above provide assurance that you have a worthy advocate when it comes to choosing the Invesco Funds.
As always, please contact me at bruce@brucecrockett.com with any questions or concerns you may have. On behalf of the Board, we look forward to continuing to represent your interests and serving your needs.
Sincerely,

Bruce L. Crockett
Independent Chair
Invesco Funds Board of Trustees
3 Invesco Global Targeted Returns Fund
Management’s Discussion of Fund Performance
| | | | |
| Performance summary | |
For the fiscal year ended October 31, 2016, Class A shares of Invesco Global Targeted Returns Fund (the Fund), at net asset value (NAV), outperformed the U.S. 3-Month Treasury Bill Index, the Fund’s broad market/style-specific benchmark. Your Fund’s long-term performance appears later in this report. | |
Fund vs. Indexes | |
| Total returns, 10/31/15 to 10/31/16, at net asset value (NAV). Performance shown does not include applicable contingent deferred sales charges (CDSC) or front-end sales charges, which would have reduced performance. | |
| |
Class A Shares | | | 1.90 | % |
Class C Shares | | | 1.17 | |
Class R Shares | | | 1.74 | |
Class Y Shares | | | 2.24 | |
Class R5 Shares | | | 2.15 | |
Class R6 Shares | | | 2.14 | |
| U.S. 3-Month Treasury Bill Indexq (Broad Market/Style-Specific Index) | | | 0.26 | |
|
Source(s): qLipper Inc. | |
Market conditions and your Fund
The Fund targets an annual gross return of 5% above three-month US Treasury bills and aims to achieve this with less than half the volatility of global equities (as represented by the MSCI World Index), over a rolling three-year period. The Fund seeks to achieve these targets by investing in good long-term investment ideas (typically 20-30) that are combined through a robust risk-managed
process in a single portfolio. There is no guarantee that the Fund will achieve a positive return or its target return, and an investor may lose money by investing in the Fund. Each idea reflects a fundamental macroeconomic view with regard to asset classes, geographies, currencies or sectors globally that have the potential to deliver a positive return over a two- to three-year time horizon. We then identify what we believe is the best way to implement these ideas. This can include investments
| | | | | | | | | | | | |
Portfolio Composition | |
By asset type | |
| | | | | | Notional Value as % of | | | Value as % of | |
| | | Risk Allocation1 | | | Total Net Assets2 | | | Total Net Assets3 | |
Commodity | | | 3.21 | % | | | 10.51 | % | | | 0.05 | % |
Credit | | | 7.76 | | | | 56.95 | | | | -0.06 | |
Equity | | | 30.62 | | | | 221.44 | | | | 49.21 | |
Currency | | | 23.45 | | | | 212.78 | | | | 2.73 | |
Inflation | | | 1.57 | | | | 88.57 | | | | -0.57 | |
Interest Rate | | | 27.46 | | | | 207.89 | | | | 12.04 | |
Volatility4 | | | 5.93 | | | | 1.69 | | | | -0.21 | |
| Money Market Funds Plus Other Assets Less Liabilities | | | – | | | | – | | | | 36.81 | |
in a wide range of asset types including derivative instruments and physical securities including underlying investment companies.
At the beginning of the fiscal year, global equities declined significantly amid concerns about global growth. Later on, global equity markets clawed back a large portion of this decline as US economic indicators proved stronger than expected, which suggested fiscal stimulus and monetary policy were beginning to be reflected in economic activity. Markets were boosted by a pick-up in sentiment toward China, particularly a focus on better-than-expected corporate earnings. This helped commodities, which in turn benefited Australian and emerging market equities. Battered commodity markets also took solace from the improving economic outlook and rallied from multiyear lows, with oil prices rising in spite of major oil-producing nations being unable to reach an output deal.
A number of events troubled European markets during the reporting period, including geopolitical developments in Syria and terrorist attacks. A number of central banks stepped in to soothe the frayed nerves of investors, re-invigorating global equity markets and riskier assets in general. However, markets were disappointed at the scale of the European Central Bank’s (ECB) much-anticipated quantitative easing program, as it took a more conservative approach to boosting its bond-buying program than previously hoped. During the summer of 2016, markets shifted focus toward Brexit, the UK referendum on whether to remain a part of, or leave, the European Union (EU). The market’s reaction to the surprise result was particularly dramatic as
| | |
| | |
Total Net Assets | | $221.1 million |
The Fund’s holdings are subject to change, and there is no assurance that the Fund will continue to hold any particular security.
Data presented here are as of October 31, 2016.
| 1 | The values in this column represent the Adviser’s proprietary measure of risk that each asset type contributes to the Fund. The risk associated with each asset type is calculated by aggregating the independent risk, as of the end of the fiscal period, of each of the Fund’s investment ideas that are included in that asset type. Independent risk is determined by measuring the historical price volatility of the assets or asset classes that comprise the investment idea using a statistical measurement called standard deviation. Standard deviation measures how much historical prices vary from their average over a certain period of time. The risk of each investment idea takes into account the Adviser’s evaluation of the risk dynamics and expected correlation of the components of the investment idea based on historical price movements. Historical price movements may not be representative of future price movements and, therefore, the actual risk of each asset type may be much greater or lower than the values shown. In addition, there are ways to measure risk other than standard deviation which, if used, may have resulted in a different risk allocation. |
| 2 | The values in this column represent the gross notional amount of the derivative instruments and other investments held by the Fund, including purchased and written options, futures, forwards, swaps and investment companies. The notional amount of a derivative is the nominal or face amount used to calculate payments made on the instrument. The gross notional amount does not reflect any offsetting or netting of long and short positions. The notional amounts of derivatives and other investments denominated in foreign currencies have been adjusted to the U.S. dollar equivalent using spot exchange rates. See the Consolidated Schedule of Investments for a complete list of derivative instruments held by the Fund as of October 31, 2016. |
| 3 | The percentages in this column were calculated by adding the market value of purchased options and sovereign debt securities, the net unrealized appreciation/depreciation of written options, futures, swaps and forwards, and the net asset value of investments in affiliated issuers held by the Fund. See the Consolidated Schedule of Investments for the complete list of derivative instruments held by the Fund as of October 31, 2016. |
| 4 | Includes the volatility and variance swaps held by the Fund, the gains and losses on which are driven by the volatility (i.e., the positive and negative changes in value over time) of a particular asset, such as stocks or currencies, and not by the asset itself. |
4 Invesco Global Targeted Returns Fund
participants had generally expected the UK to vote to remain a part of the EU. The “leave” result tapped into latent fears about the solidity and pace of the global economic recovery. Yields on 10-year US Treasuries, German bunds and UK gilts fell to historic lows.1 This “flight to quality” was helped by the immediate actions of the ECB and the UK central bank, which pledged to use monetary policy to counteract any short-term stress. While UK economic data were mixed, they were not as poor as some doomsayers had predicted, and the market’s focus soon shifted from the referendum to the actual implementation of Brexit.
The US Federal Reserve (Fed) finally followed through on its slightly hawkish stance and nudged its benchmark interest rate higher for the first time in almost 10 years.2 While this was interpreted as a vote of confidence in the US economy, the Fed went to great pains to stress that any further increases would be gradual. At the end of the reporting period, the US presidential election was the main focus of market participants.
The largest contributor to Fund performance during the reporting period was our Currency – Japanese Yen vs Korean Won idea, as the idea was a beneficiary of a rally in the yen. The yen’s appreciation was widely interpreted as investors seeking what they perceived as a “safe haven” from market turmoil.3 We favored the yen, a measurably cheap defensive currency, relative to the won, which remains expensive compared to the currencies of Korea’s trading partners.
Our Equity – European Divergence idea also contributed substantially to Fund performance during the reporting period. This idea reflected our belief favoring reasonably valued equities that benefited from a stable balance sheet, a gradual global economic pickup and potential tailwinds from the euro and low oil prices. While European equities declined significantly during the third quarter of 2015 and early in 2016, the hedging and protection strategies within the idea helped offset its market exposure and contributed to Fund performance. The Credit – US High Yield idea contributed during the reporting period as well, given the strength of the corporate bond sector. We implemented this idea through an underlying high yield fund managed by the Atlanta-based Invesco Fixed Income team and adjusted the Fund’s exposure by buying protection through derivatives. We believe this idea provided the Fund’s portfolio with more defensive and selective exposure to corporate debt.
The largest detractor from Fund performance for the reporting period was our Interest Rates – UK idea. The inflation leg of this idea detracted as UK inflation expectations rose to their highest levels
in more than a year after consumer prices exceeded forecasts. The continued weakening of the UK pound due to the outcome of the Brexit referendum also saw inflation expectations rise further.
Our Credit – Selective Credit idea detracted from Fund performance during the reporting period as high yield sold off sharply in the first few months of the reporting period on energy sector concerns. The idea was initially implemented to reflect our credit view broadly until we separated out the US high yield exposure into a stand-alone idea. The subsequent implementation isolated exposure to European investment grade credit through derivatives.
Another idea that detracted was Interest Rates – Yield Compression, which reflected our view that the differences between longer interest rates would narrow between the US, UK and, for part of the reporting period, Japan. This was, in our view, supported by reflationary actions in the UK and Japan versus a potential slowing in the US economy. However, during the reporting period, spreads widened, particularly between the US and UK.
While the Fund is focused on the return and risk attributes of each idea individually and its impact on the other ideas in the Fund, there were some shifts in positioning during the reporting period that can be identified more broadly. Given our expectation for a low growth, low yield environment, we increased the number of total investment ideas in the portfolio over the reporting period as performance expectations generally had to be reduced. We believed this would allow the portfolio to continue to deliver on its dual mandate. Additionally, because broader markets looked less attractive, we also looked to alternative sources of return and income. This included adding the first commodity idea to the portfolio, which was primarily driven by its carry contribution.
Since the Fund’s launch, we have described our central economic thesis as “cautious optimism.” Our central economic thesis, which outlines our two- to three-year view of the world, was reassessed following the Brexit vote and the indiscriminate decline in government bond yields. This has changed somewhat to ”muddling through” as we have recognized potential challenges to global economic growth, including subdued structural growth rates, consumption-led US growth succumbing to headwinds, and further political upheaval endangering the European recovery. We see select opportunities in risk assets but believe further equity and credit market gains rely upon continued policy support. We believe non-market forces, such as political uncertainty, will underpin higher levels of volatility in financial markets.
As indicated throughout this report, our investment ideas make significant use of derivative instruments. Therefore, the performance of the Fund, both positive and negative, can be attributed largely to these instruments. Derivatives can be a cost-effective way to gain exposure to asset classes. However, derivatives may amplify traditional investment risks through the creation of leverage and may be less liquid than traditional securities.
We thank you for your investment in Invesco Global Targeted Returns Fund.
| 2 | Source: US Federal Reserve |
| 3 | So-called “safe haven” assets do not imply risk-free investing. |
The views and opinions expressed in management’s discussion of Fund performance are those of Invesco Advisers, Inc. These views and opinions are subject to change at any time based on factors such as market and economic conditions. These views and opinions may not be relied upon as investment advice or recommendations, or as an offer for a particular security. The information is not a complete analysis of every aspect of any market, country, industry, security or the Fund. Statements of fact are from sources considered reliable, but Invesco Advisers, Inc. makes no representation or warranty as to their completeness or accuracy. Although historical performance is no guarantee of future results, these insights may help you understand our investment management philosophy.
See important Fund and, if applicable, index disclosures later in this report.
| | |

| | David Millar Portfolio Manager, is lead manager of Invesco Global Targeted Returns Fund. He joined Invesco in 2013. Mr. Millar |
| earned a BSc (Hons) degree in mathematical statistics from the University of Cape Town. He is a Fellow of the Institute and Faculty of Actuaries. |
| |
 | | Richard Batty Portfolio Manager, is manager of Invesco Global Targeted Returns Fund. He joined Invesco in 2013. Mr. Batty earned |
| a PhD in financial economics from Brunel University. |
| |
 | | Dave Jubb Portfolio Manager, is manager of Invesco Global Targeted Returns Fund. He joined Invesco in 2013. Mr. Jubb earned |
| a Bsc (Hons) in mathematics from St. Andrews University. He is a Fellow of the Institute and Faculty of Actuaries. |
5 Invesco Global Targeted Returns Fund
Your Fund’s Long-Term Performance
Results of a $10,000 Investment – Oldest Share Class(es) since Inception
Fund and index data from 12/19/13
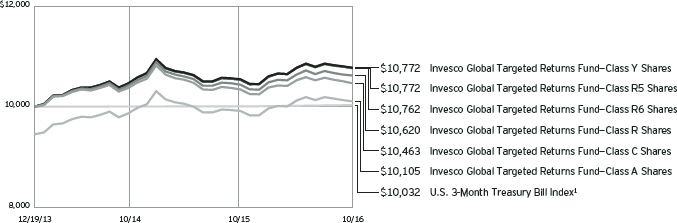
Past performance cannot guarantee comparable future results.
The data shown in the chart include reinvested distributions, applicable sales charges and Fund expenses including
management fees. Index results include reinvested dividends, but they do not reflect sales charges. Performance of the peer group, if applicable, reflects fund expenses and management fees; performance
of a market index does not. Performance shown in the chart and table(s) does not reflect deduction of taxes a shareholder would pay on Fund distributions or sale of Fund shares.
continued from page 10
About indexes used in this report
| ∎ | | The U.S. 3-Month Treasury Bill Index is tracked by Lipper to provide performance for the three-month US Treasury bill. |
| ∎ | | The MSCI World IndexSM is an unmanaged index considered representative of stocks of developed countries. The index is computed using the net return, which withholds applicable taxes for non-resident investors. |
| ∎ | | The Fund is not managed to track the performance of any particular index, including the index(es) described here, and consequently, the performance of the Fund may deviate significantly from the performance of the index(es). |
| ∎ | | A direct investment cannot be made in an index. Unless otherwise indicated, index results include reinvested dividends, and they do not reflect sales charges. Performance of the peer group, if applicable, reflects fund expenses; performance of a market index does not. |
Other information
| ∎ | | The returns shown in management’s discussion of Fund performance are based on net asset values (NAVs) calculated for shareholder transactions. Generally accepted accounting principles require adjustments to be made to the net assets of the Fund at period end for financial reporting purposes, and as such, the NAVs for shareholder transactions and the returns based on those NAVs may differ from the NAVs and returns reported in the Financial Highlights. |
6 Invesco Global Targeted Returns Fund
| | | | |
| Average Annual Total Returns | |
| As of 10/31/16, including maximum applicable sales charges | |
Class A Shares | | | | |
Inception (12/19/13) | | | 0.36 | % |
1 Year | | | -3.69 | |
Class C Shares | | | | |
Inception (12/19/13) | | | 1.59 | % |
1 Year | | | 0.17 | |
Class R Shares | | | | |
Inception (12/19/13) | | | 2.12 | % |
1 Year | | | 1.74 | |
Class Y Shares | | | | |
Inception (12/19/13) | | | 2.63 | % |
1 Year | | | 2.24 | |
Class R5 Shares | | | | |
Inception (12/19/13) | | | 2.63 | % |
1 Year | | | 2.15 | |
Class R6 Shares | | | | |
Inception (12/19/13) | | | 2.60 | % |
1 Year | | | 2.14 | |
The performance data quoted represent past performance and cannot guarantee comparable future results; current performance may be lower or higher. Please visit invesco.com/performance for the most recent month-end performance. Performance figures reflect reinvested distributions, changes in net asset value and the effect of the maximum sales charge unless otherwise stated. Investment return and principal value will fluctuate so that you may have a gain or loss when you sell shares.
The net annual Fund operating expense ratio set forth in the most recent Fund prospectus as of the date of this report for Class A, Class C, Class R, Class Y, Class R5 and Class R6 shares was 1.71%, 2.46%, 1.96%, 1.46%, 1.46% and 1.46%, respectively.1,2,3 The total annual Fund operating expense ratio set forth in the most recent Fund prospectus as of the date of this report for Class A, Class C, Class R, Class Y, Class R5 and Class R6 shares was 2.82%, 3.57%, 3.07%, 2.57%, 2.51% and 2.51%, respectively. The expense ratios presented above may vary from the expense ratios presented in other sections of this report that are based on expenses incurred during the period covered by this report.
Class A share performance reflects the maximum 5.50% sales charge, and Class C share performance reflects the applicable contingent deferred sales
| | | | |
| Average Annual Total Returns | |
| As of 9/30/16, the most recent calendar quarter end, including maximum applicable sales charges | |
Class A Shares | | | | |
Inception (12/19/13) | | | 0.48 | % |
1 Year | | | -3.59 | |
Class C Shares | | | | |
Inception (12/19/13) | | | 1.78 | % |
1 Year | | | 0.27 | |
Class R Shares | | | | |
Inception (12/19/13) | | | 2.26 | % |
1 Year | | | 1.64 | |
Class Y Shares | | | | |
Inception (12/19/13) | | | 2.78 | % |
1 Year | | | 2.24 | |
Class R5 Shares | | | | |
Inception (12/19/13) | | | 2.82 | % |
1 Year | | | 2.24 | |
Class R6 Shares | | | | |
Inception (12/19/13) | | | 2.78 | % |
1 Year | | | 2.24 | |
charge (CDSC) for the period involved. The CDSC on Class C shares is 1% for the first year after purchase. Class R, Class Y, Class R5 and Class R6 class shares do not have a front-end sales charge or a CDSC; therefore, performance is at net asset value.
The performance of the Fund’s share classes will differ primarily due to different sales charge structures and class expenses.
Fund performance reflects any applicable fee waivers and/or expense reimbursements. Had the adviser not waived fees and/or reimbursed expenses currently or in the past, returns would have been lower. See current prospectus for more information.
| 1 | Total annual Fund operating expenses after any contractual fee waivers and/or expense reimbursements by the adviser in effect through at least June 30, 2018. See current prospectus for more information. |
| 2 | Total annual Fund operating expenses after any contractual fee waivers and/or expense reimbursements by the adviser in effect through at least February 28, 2017. See current prospectus for more information. |
| 3 | The expense ratio includes acquired fund fees and expenses on the underlying funds in which the Fund invests of 0.44%. |
7 Invesco Global Targeted Returns Fund
Invesco Global Targeted Returns Fund’s investment objective is to seek a positive total return over the long term in all market environments.
| ∎ | | Unless otherwise stated, information presented in this report is as of October 31, 2016, and is based on total net assets. |
| ∎ | | Unless otherwise noted, all data provided by Invesco. |
| ∎ | | To access your Fund’s reports/prospectus, visit invesco.com/fundreports. |
About share classes
| ∎ | | Class R shares are generally available only to employer sponsored retirement and benefit plans. Please see the prospectus for more information. |
| ∎ | | Class Y shares are available only to certain investors. Please see the prospectus for more information. |
| ∎ | | Class R5 shares and Class R6 shares are primarily intended for employer sponsored retirement and benefit plans that meet certain standards and for institutional investors. Please see the prospectus for more information. |
Principal risks of investing in the Fund
| ∎ | | Allocation risk. The Fund’s investment performance depends, in part, on how its assets are allocated among the underlying funds or asset classes. The Adviser’s evaluations and assumptions regarding the asset classes or the underlying funds in which the Fund invests may be incorrect, causing the Fund to be invested (or not invested) in one or more asset classes or underlying funds at an inopportune time, which could negatively affect the Fund’s performance. |
| ∎ | | Changing fixed income market conditions risk. The current low interest rate environment was created in part by the Federal Reserve Board (FRB) and certain foreign central banks keeping the federal funds and equivalent foreign rates near, at or below zero. Increases in the federal funds and equivalent foreign rates may expose fixed income markets to heightened volatility and reduced liquidity for certain fixed income investments, particularly those with longer maturities. In addition, decreases in fixed income dealer market-making capacity may also potentially lead to heightened volatility and reduced liquidity in the fixed income markets. As a result, the value of the Fund’s investments and share price may decline. Changes in central bank policies could also result in higher than normal shareholder |
| | redemptions, which could potentially increase portfolio turnover and the Fund’s transaction costs. |
| ∎ | | Commodities tax risk. The tax treatment of commodity-linked derivative instruments may be adversely affected by changes in legislation, regulations or other legally binding authority. If, as a result of any such adverse action, the income of the Fund from certain commodity-linked derivatives was treated as non-qualifying income, the Fund might fail to qualify as a regulated investment company and be subject to federal income tax at the Fund level. Should the Internal Revenue Service issue guidance, or Congress enact legislation, that adversely affects the tax treatment of the Fund’s use of commodity-linked notes or the Subsidiary (which guidance might be applied to the Fund retroactively), it could, among other consequences, limit the Fund’s ability to pursue its investment strategy. |
| ∎ | | Commodity-linked notes risk. In addition to risks associated with the underlying commodities, investments in commodity-linked notes may be subject to additional risks, such as non-payment of interest and loss of principal, counterparty risk, lack of a secondary market and risk of greater volatility than traditional equity and debt securities. The value of the commodity-linked notes the Fund buys may fluctuate significantly because the values of the underlying investments to which they are linked are themselves volatile. Additionally, certain commodity-linked notes employ “economic” leverage by requiring payment by the issuer of an amount that is a multiple of the price increase or decrease of the underlying commodity, commodity index, or other economic variable. Such economic leverage will increase the volatility of the value of these commodity-linked notes and the Fund to the extent it invests in such notes. |
| ∎ | | Commodity risk. The Fund may have investment exposure to the commodities |
markets and/or a particular sector of the commodities markets, which may subject the Fund to greater volatility than investments in traditional securities, such as stocks and bonds. Volatility in the commodities markets may be caused by changes in overall market movements, domestic and foreign political and economic events and policies, war, acts of terrorism, changes in domestic or foreign interest rates and/ or investor expectations concerning interest rates, domestic and foreign inflation rates, investment and trading activities of mutual funds, hedge funds and commodities funds, and factors such as drought, floods, weather, livestock disease, embargoes, tariffs and other regulatory developments or supply and demand disruptions. Because the Fund’s performance may be linked to the performance of volatile commodities, investors should be willing to assume the risks of potentially significant fluctuations in the value of the Fund’s shares.
| ∎ | | Debt securities risk. The prices of debt securities held by the Fund will be affected by changes in interest rates, the creditworthiness of the issuer and other factors. An increase in prevailing interest rates typically causes the value of existing debt securities to fall and often has a greater impact on longer-duration debt securities and higher quality debt securities. Falling interest rates will cause the Fund to reinvest the proceeds of debt securities that have been repaid by the issuer at lower interest rates. Falling interest rates may also reduce the Fund’s distributable income because interest payments on floating rate debt instruments held by the Fund will decline. The Fund could lose money on investments in debt securities if the issuer or borrower fails to meet its obligations to make interest payments and/or to repay principal in a timely manner. Changes in an issuer’s financial strength, the market’s perception of such strength or in the credit rating of the issuer or the security may affect the value of debt securities. The Adviser’s credit analysis may fail to anticipate such changes, which could result in buying a debt security at an inopportune time or failing to sell a debt security in advance of a price decline or other credit event. |
| | |
This report must be accompanied or preceded by a currently effective Fund prospectus, which contains more complete information, including sales charges and expenses. Investors should read it carefully before investing. | | |
NOT FDIC INSURED | MAY LOSE VALUE | NO BANK GUARANTEE | | |
8 Invesco Global Targeted Returns Fund
| ∎ | | Derivatives risk. The value of a derivative instrument depends largely on (and is derived from) the value of an underlying security, currency, commodity, interest rate, index or other asset (each referred to as an underlying asset). In addition to risks relating to the underlying assets, the use of derivatives may include other, possibly greater, risks, including counterparty, leverage and liquidity risks. Counter-party risk is the risk that the counter-party to the derivative contract will default on its obligation to pay the Fund the amount owed or otherwise perform under the derivative contract. Derivatives create leverage risk because they do not require payment up front equal to the economic exposure created by owning the derivative. As a result, an adverse change in the value of the underlying asset could result in the Fund sustaining a loss that is substantially greater than the amount invested in the derivative, which may make the Fund’s returns more volatile and increase the risk of loss. Derivative instruments may also be less liquid than more traditional investments and the Fund may be unable to sell or close out its derivative positions at a desirable time or price. This risk may be more acute under adverse market conditions, during which the Fund may be most in need of liquidating its derivative positions. Derivatives may also be harder to value, less tax efficient and subject to changing government regulation that could impact the Fund’s ability to use certain derivatives or their cost. The SEC has proposed new regulations related to the use of derivatives and related instruments by registered investment companies. If adopted as proposed, these regulations would limit the Fund’s ability to engage in derivatives transactions and may result in increased costs or require the Fund to modify its investment strategies or to liquidate. Also, derivatives used for hedging or to gain or limit exposure to a particular market segment may not provide the expected benefits, particularly during adverse market conditions. These risks are greater for the Fund than most other mutual funds because the Fund will implement its investment strategy primarily through derivative instruments rather than direct investments in stocks/bonds. |
| ∎ | | Emerging markets securities risk. Emerging markets (also referred to as developing markets) are generally subject to greater market volatility, political, |
| | social and economic instability, uncertain trading markets and more governmental limitations on foreign investment than more developed markets. In addition, companies operating in emerging markets may be subject to lower trading volume and greater price fluctuations than companies in more developed markets. Securities law and the enforcement of systems of taxation in many emerging market countries may change quickly and unpredictably. In addition, investments in emerging markets securities may also be subject to additional transaction costs, delays in settlement procedures, and lack of timely information. |
| ∎ | | Exchange-traded funds risk. In addition to the risks associated with the underlying assets held by the exchange-traded fund, investments in exchange-traded funds are subject to the following additional risks: (1) an exchange-traded fund’s shares may trade above or below its net asset value; (2) an active trading market for the exchange-traded fund’s shares may not develop or be maintained; (3) trading an exchange-traded fund’s shares may be halted by the listing exchange; (4) a passively managed exchange-traded fund may not track the performance of the reference asset; and (5) a passively managed exchange-traded fund may hold troubled securities. Investment in exchange-traded funds may involve duplication of management fees and certain other expenses, as the Fund indirectly bears its proportionate share of any expenses paid by the exchange-traded funds in which it invests. Further, certain exchange-traded funds in which the Fund may invest are leveraged, which may result in economic leverage, permitting the Fund to gain exposure that is greater than would be the case in an unlevered instrument and potentially resulting in greater volatility. |
| ∎ | | Exchange-traded notes risk. Exchange-traded notes are subject to credit risk, counterparty risk, and the risk that the value of the exchange-traded note may drop due to a downgrade in the issuer’s credit rating. The value of an exchange-traded note may also be influenced by time to maturity, level of supply and demand for the exchange-traded note, volatility and lack of liquidity in the underlying market, changes in the applicable interest rates, and economic, legal, political, or geographic events that affect the referenced underlying market or assets. The Fund will bear its proportionate share of any fees and expenses |
| | borne by an exchange-traded note in which it invests. For certain exchange-traded notes, there may be restrictions on the Fund’s right to redeem its investment, which is meant to be held until maturity. |
| ∎ | | Foreign currency tax risk. If the US Treasury Department were to exercise its authority to issue regulations that exclude from the definition of “qualifying income” foreign currency gains not directly related to the Fund’s business of investing in securities, the Fund may be unable to qualify as a regulated investment company for one or more years. In this event, the Fund’s Board of Trustees may authorize a significant change in investment strategy or other action. |
| ∎ | | Foreign government debt risk. Investments in foreign government debt securities (sometimes referred to as sovereign debt securities) involve certain risks in addition to those relating to foreign securities or debt securities generally. The issuer of the debt or the governmental authorities that control the repayment of the debt may be unable or unwilling to repay principal or interest when due in accordance with the terms of such debt, and the Fund may have limited recourse in the event of a default against the defaulting government. Without the approval of debt holders, some governmental debtors have in the past been able to reschedule or restructure their debt payments or declare moratoria on payments. |
| ∎ | | Foreign securities risk. The Fund’s foreign investments may be adversely affected by political and social instability, changes in economic or taxation policies, difficulty in enforcing obligations, decreased liquidity or increased volatility. Foreign investments also involve the risk of the possible seizure, nationalization or expropriation of the issuer or foreign deposits (in which the Fund could lose its entire investments in a certain market) and the possible adoption of foreign governmental restrictions such as exchange controls. Unless the Fund has hedged its foreign securities risk, foreign securities risk also involves the risk of negative foreign currency rate fluctuations, which may cause the value of securities denominated in such foreign currency (or other instruments through which the Fund has exposure to foreign currencies) to decline in value. Currency exchange rates may fluctuate significantly over short periods of time. Currency hedging strategies, if used, are not always successful. |
9 Invesco Global Targeted Returns Fund
| ∎ | | Fund of funds risk. The Fund’s performance depends on that of the underlying funds in which it invests. Accordingly, the risks associated with an investment in the Fund include the risks associated with investments in the underlying funds. The Fund will indirectly pay a proportional share of the fees and expenses of the underlying funds in which it invests. There are risks that the Fund will vary from its target weightings (if any) in the underlying funds, that the underlying funds will not achieve their investment objectives, that the underlying funds’ performance may be lower than their represented asset classes, and that the Fund may withdraw its investments in an underlying fund at a disadvantageous time. |
| ∎ | | High yield debt securities (junk bond) risk. Investments in high yield debt securities (“junk bonds”) and other lower-rated securities will subject the Fund to substantial risk of loss. These securities are considered to be speculative with respect to the issuer’s ability to pay interest and principal when due, are more susceptible to default or decline in market value and are less liquid than investment grade debt securities. Prices of high yield debt securities tend to be very volatile. |
| ∎ | | Investing in the European Union risk. Investments in certain countries in the European Union are susceptible to high economic risks associated with high levels of debt, such as investments in sovereign debt of Greece, Italy and Spain. Separately, the European Union faces issues involving its membership, structure, procedures and policies. The exit of one or more member states from the European Union would place its currency and banking system in jeopardy. Efforts of the member states to further unify their economic and monetary policies may increase the potential for the downward movement of one member state’s market to cause a similar effect on other member states’ markets. |
| ∎ | | Management risk. The Fund is actively managed and depends heavily on the Adviser’s judgment about markets, interest rates or the attractiveness, relative values, liquidity, or potential appreciation of particular investments made for the Fund’s portfolio. The Fund could experience losses if these judgments prove to be incorrect. Because the Fund’s investment process relies heavily on its asset allocation process, market movements that are counter to the portfolio managers’ expectations may have a significant adverse effect on the |
| | | Fund’s net asset value. Additionally, legislative, regulatory, or tax developments may adversely affect management of the Fund and, therefore, the ability of the Fund to achieve its investment objective. |
| ∎ | | Market risk. The market values of the Fund’s investments, and therefore the value of the Fund’s shares, will go up and down, sometimes rapidly or unpredictably. Market risk may affect a single issuer, industry or section of the economy, or it may affect the market as a whole. Individual stock prices tend to go up and down more dramatically than those of certain other types of investments, such as bonds. During a general downturn in the financial markets, multiple asset classes may decline in value. When markets perform well, there can be no assurance that specific investments held by the Fund will rise in value. |
| ∎ | | Non-diversification risk. The Fund is non-diversified and can invest a greater portion of its assets in the obligations or securities of a small number of issuers or any single issuer than a diversified fund can. A change in the value of one or a few issuers’ securities will therefore affect the value of the Fund more than would occur in a diversified fund. The Fund can also invest a greater percentage of its assets in any one particular investment strategy than if it was diversified, thereby increasing the risk of loss. |
| ∎ | | Short position risk. Because the Fund’s potential loss on a short position arises from increases in the value of the asset sold short, the Fund will incur a loss on a short position, which is theoretically unlimited, if the price of the asset sold short increases from the short sale price. The counterparty to a short position or other market factors may prevent the Fund from closing out a short position at a desirable time or price and may reduce or eliminate any gain or result in a loss. In a rising market, the Fund’s short positions will cause the Fund to underperform the overall market and its peers that do not engage in shorting. If the Fund holds both long and short positions, and both positions decline simultaneously, the short positions will not provide any buffer (hedge) from declines in value of the Fund’s long positions. Certain types of short positions involve leverage, which may exaggerate any losses, potentially more than the actual cost of the investment, and will increase the volatility of the Fund’s returns. |
| ∎ | | Small- and mid-capitalization companies risks. Small- and mid-capitalization companies tend to be more vulnerable to changing market conditions, may have little or no operating history or track record of success, and may have more limited product lines and markets, less experienced management and fewer financial resources than larger companies. These companies’ securities may be more volatile and less liquid than those of more established companies, and their returns may vary, sometimes significantly, from the overall securities market. |
| ∎ | | Subsidiary risk. By investing in the Subsidiary, the Fund is indirectly exposed to risks associated with the Subsidiary’s investments. The Subsidiary is not registered under the Investment Company Act of 1940, as amended (1940 Act), and, except as otherwise noted in the prospectus, is not subject to the investor protections of the 1940 Act. Changes in the laws of the United States and/or the Cayman Islands, under which the Fund and the Subsidiary, respectively, are organized, could result in the inability of the Fund and/or the Subsidiary to operate as described in the prospectus and the SAI, and could negatively affect the Fund and its shareholders. |
| ∎ | | US government obligations risk. Obligations of US government agencies and authorities receive varying levels of support and may not be backed by the full faith and credit of the US government, which could affect the Fund’s ability to recover should they default. No assurance can be given that the US government will provide financial support to its agencies and authorities if it is not obligated by law to do so. |
| ∎ | | Volatility Risk. Although the Fund’s investment strategy targets a specific volatility level, certain of the Fund’s investments may appreciate or decrease significantly in value over short periods of time. This may cause the Fund’s net asset value per share to experience significant increases or declines in value over short periods of time. |
continued on page 6
10 Invesco Global Targeted Returns Fund
Consolidated Schedule of Investments
October 31, 2016
Investments in Affiliated Issuers–74.64%(a)
| | | | | | | | | | | | | | | | | | | | | | | | | | | | | | | | | | | | |
| | | % of
Net
Assets
10/31/16 | | | Value 10/31/15 | | | Purchases
at Cost | | | Proceeds
from Sales | | | Change in
Unrealized
Appreciation
(Depreciation) | | | Realized
Gain | | | Dividend
Income | | | Shares
10/31/16 | | | Value
10/31/16 | |
Domestic Equity Funds–6.05% | |
Invesco Diversified Dividend Fund–Class R6 | | | 6.05 | % | | $ | 8,243,871 | | | $ | 4,853,742 | | | $ | — | | | $ | 268,590 | | | $ | 345,338 | | | $ | 234,854 | | | | 709,836 | | | $ | 13,366,203 | |
|
Fixed-Income Funds–12.06% | |
Invesco High Yield Fund–Class R6 | | | 12.06 | % | | | 16,614,108 | | | | 9,721,747 | | | | — | | | | 321,176 | | | | — | | | | 1,346,589 | | | | 6,454,487 | | | | 26,657,031 | |
|
Foreign Equity Funds–26.88% | |
Invesco Asia Pacific Growth Fund–Class Y | | | 7.69 | % | | | 11,216,454 | | | | 4,297,229 | | | | — | | | | 1,497,935 | | | | — | | | | 402,350 | | | | 536,813 | | | | 17,011,618 | |
Invesco European Growth Fund–Class Y | | | 9.54 | % | | | 13,933,595 | | | | 8,826,352 | | | | — | | | | (1,660,231 | ) | | | 470,650 | | | | 243,892 | | | | 639,773 | | | | 21,099,716 | |
Invesco International Growth Fund–Class R6 | | | 9.65 | % | | | 14,241,160 | | | | 7,500,819 | | | | — | | | | (393,904 | ) | | | — | | | | 241,268 | | | | 680,308 | | | | 21,348,075 | |
Total Foreign Equity Funds | | | | | | | 39,391,209 | | | | 20,624,400 | | | | — | | | | (556,200 | ) | | | 470,650 | | | | 887,510 | | | | | | | | 59,459,409 | |
|
Money Market Funds–29.65% | |
Government & Agency Portfolio–Institutional Class, 0.44%(b) | | | 16.28 | % | | | — | | | | 42,904,040 | | | | (6,899,702 | ) | | | — | | | | — | | | | 14,161 | | | | 36,004,338 | | | | 36,004,338 | |
Liquid Assets Portfolio–Institutional Class | | | — | | | | 23,475,962 | | | | 71,330,903 | | | | (94,806,865 | ) | | | — | | | | — | | | | 79,193 | | | | — | | | | — | |
Premier Portfolio–Institutional Class | | | — | | | | 23,475,963 | | | | 71,330,903 | | | | (94,806,866 | ) | | | — | | | | — | | | | 60,516 | | | | — | | | | — | |
STIC (Global Series) PLC–U.S. Dollar Liquidity Portfolio (Ireland)–Institutional Class, 0.40%(b)(c) | | | 2.51 | % | | | 5,724,734 | | | | 3,549,155 | | | | (3,721,955 | ) | | | — | | | | — | | | | 23,046 | | | | 5,551,934 | | | | 5,551,934 | |
Treasury Portfolio–Institutional Class, 0.40%(b) | | | 10.86 | % | | | — | | | | 28,602,693 | | | | (4,599,801 | ) | | | — | | | | — | | | | 7,011 | | | | 24,002,892 | | | | 24,002,892 | |
Total Money Market Funds | | | | | | | 52,676,659 | | | | 217,717,694 | | | | (204,835,189 | ) | | | — | | | | — | | | | 183,927 | | | | | | | | 65,559,164 | |
TOTAL INVESTMENTS IN AFFILIATED ISSUERS (Cost $166,652,297) | | | 74.64 | % | | $ | 116,925,847 | | | $ | 252,917,583 | | | $ | (204,835,189 | ) | | $ | 33,566 | | | $ | 815,988 | (d) | | $ | 2,652,880 | | | | | | | $ | 165,041,807 | |
| | | | | | | | | | | | |
| | | | | | Principal
Amount | | | | |
Sovereign Debt–12.79%(e) | |
Hungary Government Bond (Hungary), Series 23, Class A, Unsec. Bonds, 6.00%, 11/24/2023 | | | HUF | | | | 88,330,000 | | | | 388,062 | |
Hungary Government Bond (Hungary), Series 25, Class B, Unsec. Bonds, 5.50%, 06/24/2025 | | | HUF | | | | 408,590,000 | | | | 1,751,556 | |
Mexico Government Bond (Mexico), Series M 20, Sr. Unsec. Bonds, 10.00%, 12/05/2024 | | | MXN | | | | 43,707,700 | | | | 2,879,823 | |
Mexico Government Bond (Mexico), Series M, Sr. Unsec. Bonds, 5.75%, 03/05/2026 | | | MXN | | | | 9,298,000 | | | | 475,311 | |
Poland Government Bond (Poland), Series 0726, Unsec. Bonds, 2.50%, 07/25/2026 | | | PLN | | | | 21,911,000 | | | | 5,310,193 | |
United Kingdom Government Bond (United Kingdom), REGS, Unsec. Bonds, 3.25%, 01/22/2044(f) | | | GBP | | | | 5,555,657 | | | | 8,790,947 | |
United Kingdom Government Bond (United Kingdom), REGS, Unsec. Bonds, 3.50%, 01/22/2045(f) | | | GBP | | | | 5,227,934 | | | | 8,678,826 | |
Total Sovereign Debt (Cost $30,105,086) | | | | | | | | | | | 28,274,718 | |
OPTIONS PURCHASED–4.79% (Cost $14,473,376) | | | | | | | | | | | 10,597,868 | |
TOTAL INVESTMENTS–92.22% (Cost $211,230,759) | | | | | | | | | | | 203,914,393 | |
OTHER ASSETS LESS LIABILITIES–7.78% | | | | | | | | | | | 17,196,927 | |
NET ASSETS–100.00% | | | | | | | | | | $ | 221,111,320 | |
Abbreviations:
| | |
| GBP | | – British Pound Sterling |
| HUF | | – Hungarian Forint |
| | |
| MXN | | – Mexican Peso |
| PLN | | – Polish Zloty |
| | |
| REGS | | – Regulation S |
| Sr. | | – Senior |
Notes to Consolidated Schedule of Investments:
| (a) | Each underlying fund and the Fund are affiliated by either having the same investment adviser or an investment adviser under common control with the Fund’s investment adviser. |
| (b) | The rate shown is the 7-day SEC standardized yield as of October 31, 2016. |
| (c) | The investment is owned by the Subsidiary. See Note 5. |
| (d) | Includes $345,338 and $470,650 of capital gains distributions from Invesco Diversified Dividend Fund and Invesco European Growth Fund, respectively. |
| (e) | Foreign denominated security. Principal amount is denominated in the currency indicated. |
| (f) | Security purchased or received in a transaction exempt from registration under the Securities Act of 1933, as amended (the “1933 Act”). The security may be resold pursuant to an exemption from registration under the 1933 Act, typically to qualified institutional buyers. The aggregate value of these securities at October 31, 2016 was $17,469,773, which represented 7.90% of the Fund’s Net Assets. |
See accompanying Notes to Consolidated Financial Statements which are an integral part of the financial statements.
11 Invesco Global Targeted Returns Fund
| | | | | | | | | | | | | | | | | | | | | | | | | | | | | | | | | | |
| Open Over-The-Counter Index Options Purchased | |
| Description | | Type of
Contract | | | Broker/Counterparty | | Expiration
Date | | | Number of
Contracts | | | Strike
Price | | | Notional
Value(g) | | | Value | |
S&P 500 Index | | | Call | | | Goldman Sachs International | | | 01/20/2017 | | | | 494 | | | | USD | | | | 2,250 | | | | USD | | | | 111,150,000 | | | $ | 290,617 | |
Subtotal — Over-The-Counter Index Call Options Purchased | | | | 494 | | | | | | | | | | | | | | | | | | | $ | 290,617 | |
M1EF Index | | | Put | | | Goldman Sachs International | | | 12/19/2016 | | | | 345 | | | | USD | | | | 310 | | | | USD | | | | 10,695,000 | | | $ | 14,990 | |
M1EF Index | | | Put | | | Goldman Sachs International | | | 12/19/2016 | | | | 7 | | | | USD | | | | 340 | | | | USD | | | | 238,000 | | | | 950 | |
M1EF Index | | | Put | | | Goldman Sachs International | | | 12/19/2016 | | | | 173 | | | | USD | | | | 350 | | | | USD | | | | 6,055,000 | | | | 34,426 | |
M1EF Index | | | Put | | | Goldman Sachs International | | | 12/19/2016 | | | | 328 | | | | USD | | | | 360 | | | | USD | | | | 11,808,000 | | | | 95,778 | |
M1EF Index | | | Put | | | Goldman Sachs International | | | 12/19/2016 | | | | 169 | | | | USD | | | | 380 | | | | USD | | | | 6,422,000 | | | | 105,961 | |
M1EF Index | | | Put | | | Goldman Sachs International | | | 09/18/2017 | | | | 332 | | | | USD | | | | 360 | | | | USD | | | | 11,592,000 | | | | 654,653 | |
M1EF Index | | | Put | | | Morgan Stanley Capital Services LLC | | | 12/19/2016 | | | | 10 | | | | USD | | | | 360 | | | | USD | | | | 360,000 | | | | 2,920 | |
M1EF Index | | | Put | | | UBS | | | 12/19/2016 | | | | 14 | | | | USD | | | | 300 | | | | USD | | | | 420,000 | | | | 417 | |
Russell 2000 Index | | | Put | | | Morgan Stanley Capital Services LLC | | | 06/16/2017 | | | | 88 | | | | USD | | | | 1,200 | | | | USD | | | | 1,056,000 | | | | 723,021 | |
Subtotal — Over-The-Counter Index Put Options Purchased | | | | 1,466 | | | | | | | | | | | | | | | | | | | $ | 1,633,116 | |
Total Over-The-Counter Index Options Purchased | | | | 1,960 | | | | | | | | | | | | | | | | | | | $ | 1,923,733 | |
|
| Open Exchange-Traded Index Options Purchased | |
Nikkei 225 Index | | | Call | | | Goldman Sachs International | | | 06/08/2018 | | | | 5 | | | | JPY | | | | 17,000 | | | | JPY | | | | 85,000,000 | | | $ | 83,441 | |
Nikkei 225 Index | | | Call | | | Goldman Sachs International | | | 06/08/2018 | | | | 3 | | | | JPY | | | | 18,500 | | | | JPY | | | | 55,500,000 | | | | 31,755 | |
Nikkei 225 Index | | | Call | | | UBS | | | 06/08/2018 | | | | 73 | | | | JPY | | | | 17,000 | | | | JPY | | | | 1,241,000,000 | | | | 1,218,233 | |
Nikkei 225 Index | | | Call | | | UBS | | | 06/08/2018 | | | | 43 | | | | JPY | | | | 18,500 | | | | JPY | | | | 795,500,000 | | | | 455,157 | |
S&P 500 Index | | | Call | | | Morgan Stanley Capital Services LLC | | | 12/16/2016 | | | | 3 | | | | USD | | | | 2,400 | | | | USD | | | | 720,000 | | | | 37 | |
S&P 500 Index | | | Call | | | Morgan Stanley Capital Services LLC | | | 12/16/2016 | | | | 18 | | | | USD | | | | 2,600 | | | | USD | | | | 4,680,000 | | | | 45 | |
S&P 500 Index | | | Call | | | Morgan Stanley Capital Services LLC | | | 06/16/2017 | | | | 5 | | | | USD | | | | 2,700 | | | | USD | | | | 1,350,000 | | | | 162 | |
S&P 500 Index | | | Call | | | UBS | | | 12/16/2016 | | | | 57 | | | | USD | | | | 2,600 | | | | USD | | | | 14,820,000 | | | | 142 | |
S&P 500 Index | | | Call | | | UBS | | | 06/16/2017 | | | | 77 | | | | USD | | | | 2,700 | | | | USD | | | | 20,790,000 | | | | 2,503 | |
Subtotal — Exchange-Traded Index Call Options Purchased | | | | 284 | | | | | | | | | | | | | | | | | | | $ | 1,791,475 | |
Nikkei 225 Index | | | Put | | | Goldman Sachs International | | | 03/10/2017 | | | | 2 | | | | JPY | | | | 12,250 | | | | JPY | | | | 24,500,000 | | | $ | 839 | |
Nikkei 225 Index | | | Put | | | UBS | | | 03/10/2017 | | | | 32 | | | | JPY | | | | 12,250 | | | | JPY | | | | 392,000,000 | | | | 13,427 | |
Russell 2000 Index | | | Put | | | Morgan Stanley Capital Services LLC | | | 06/16/2017 | | | | 3 | | | | USD | | | | 1,200 | | | | USD | | | | 36,000 | | | | 24,540 | |
SMI Index | | | Put | | | Bank of America Merrill Lynch | | | 06/16/2017 | | | | 26 | | | | CHF | | | | 7,200 | | | | CHF | | | | 936,000 | | | | 69,838 | |
SMI Index | | | Put | | | Bank of America Merrill Lynch | | | 06/16/2017 | | | | 24 | | | | CHF | | | | 7,400 | | | | CHF | | | | 888,000 | | | | 80,546 | |
SMI Index | | | Put | | | Bank of America Merrill Lynch | | | 06/16/2017 | | | | 23 | | | | CHF | | | | 7,700 | | | | CHF | | | | 885,500 | | | | 106,615 | |
SMI Index | | | Put | | | Goldman Sachs International | | | 06/16/2017 | | | | 101 | | | | CHF | | | | 7,200 | | | | CHF | | | | 3,636,000 | | | | 271,293 | |
SMI Index | | | Put | | | Goldman Sachs International | | | 06/16/2017 | | | | 95 | | | | CHF | | | | 7,400 | | | | CHF | | | | 3,515,000 | | | | 318,827 | |
SMI Index | | | Put | | | Goldman Sachs International | | | 06/16/2017 | | | | 90 | | | | CHF | | | | 7,700 | | | | CHF | | | | 3,465,000 | | | | 417,190 | |
SMI Index | | | Put | | | J.P. Morgan Chase Bank, N.A. | | | 06/16/2017 | | | | 28 | | | | CHF | | | | 7,200 | | | | CHF | | | | 1,008,000 | | | | 75,210 | |
SMI Index | | | Put | | | J.P. Morgan Chase Bank, N.A. | | | 06/16/2017 | | | | 28 | | | | CHF | | | | 7,400 | | | | CHF | | | | 1,036,000 | | | | 93,970 | |
SMI Index | | | Put | | | J.P. Morgan Chase Bank, N.A. | | | 06/16/2017 | | | | 27 | | | | CHF | | | | 7,700 | | | | CHF | | | | 1,039,500 | | | | 125,157 | |
SMI Index | | | Put | | | UBS | | | 06/16/2017 | | | | 46 | | | | CHF | | | | 7,200 | | | | CHF | | | | 1,656,000 | | | | 123,559 | |
SMI Index | | | Put | | | UBS | | | 06/16/2017 | | | | 44 | | | | CHF | | | | 7,400 | | | | CHF | | | | 1,628,000 | | | | 147,667 | |
SMI Index | | | Put | | | UBS | | | 06/16/2017 | | | | 42 | | | | CHF | | | | 7,700 | | | | CHF | | | | 1,617,000 | | | | 194,689 | |
SX7E Index | | | Put | | | Goldman Sachs International | | | 12/16/2016 | | | | 1,258 | | | | EUR | | | | 90 | | | | EUR | | | | 5,661,000 | | | | 58,691 | |
SX7E Index | | | Put | | | J.P. Morgan Chase Bank, N.A. | | | 12/16/2016 | | | | 93 | | | | EUR | | | | 90 | | | | EUR | | | | 418,500 | | | | 4,339 | |
SX7E Index | | | Put | | | UBS | | | 12/16/2016 | | | | 196 | | | | EUR | | | | 90 | | | | EUR | | | | 882,000 | | | | 9,144 | |
SX7E Index | | | Put | | | Bank of America Merrill Lynch | | | 06/16/2017 | | | | 63 | | | | EUR | | | | 80 | | | | EUR | | | | 252,000 | | | | 9,855 | |
SX7E Index | | | Put | | | Bank of America Merrill Lynch | | | 06/16/2017 | | | | 59 | | | | EUR | | | | 85 | | | | EUR | | | | 246,500 | | | | 12,468 | |
SX7E Index | | | Put | | | Bank of America Merrill Lynch | | | 06/16/2017 | | | | 58 | | | | EUR | | | | 90 | | | | EUR | | | | 261,000 | | | | 16,395 | |
SX7E Index | | | Put | | | Bank of America Merrill Lynch | | | 06/16/2017 | | | | 59 | | | | EUR | | | | 95 | | | | EUR | | | | 280,250 | | | | 22,183 | |
SX7E Index | | | Put | | | Bank of America Merrill Lynch | | | 06/16/2017 | | | | 64 | | | | EUR | | | | 100 | | | | EUR | | | | 320,000 | | | | 31,264 | |
SX7E Index | | | Put | | | Goldman Sachs International | | | 06/16/2017 | | | | 500 | | | | EUR | | | | 80 | | | | EUR | | | | 2,000,000 | | | | 78,215 | |
SX7E Index | | | Put | | | Goldman Sachs International | | | 06/16/2017 | | | | 482 | | | | EUR | | | | 85 | | | | EUR | | | | 2,048,500 | | | | 101,854 | |
SX7E Index | | | Put | | | Goldman Sachs International | | | 06/16/2017 | | | | 481 | | | | EUR | | | | 90 | | | | EUR | | | | 2,164,500 | | | | 135,964 | |
See accompanying Notes to Consolidated Financial Statements which are an integral part of the financial statements.
12 Invesco Global Targeted Returns Fund
| | | | | | | | | | | | | | | | | | | | | | | | | | | | | | | | | | |
| Open Exchange-Traded Index Options Purchased—(continued) | |
| Description | | Type of
Contract | | | Broker/Counterparty | | Expiration
Date | | | Number of
Contracts | | | Strike
Price | | | Notional
Value(g) | | | Value | |
SX7E Index | | | Put | | | Goldman Sachs International | | | 06/16/2017 | | | | 502 | | | | EUR | | | | 95 | | | | EUR | | | | 2,384,500 | | | $ | 188,739 | |
SX7E Index | | | Put | | | Goldman Sachs International | | | 06/16/2017 | | | | 549 | | | | EUR | | | | 100 | | | | EUR | | | | 2,745,000 | | | | 268,186 | |
SX7E Index | | | Put | | | J.P. Morgan Chase Bank, N.A. | | | 06/16/2017 | | | | 57 | | | | EUR | | | | 80 | | | | EUR | | | | 228,000 | | | | 8,916 | |
SX7E Index | | | Put | | | J.P. Morgan Chase Bank, N.A. | | | 06/16/2017 | | | | 48 | | | | EUR | | | | 85 | | | | EUR | | | | 204,000 | | | | 10,143 | |
SX7E Index | | | Put | | | J.P. Morgan Chase Bank, N.A. | | | 06/16/2017 | | | | 43 | | | | EUR | | | | 90 | | | | EUR | | | | 193,500 | | | | 12,155 | |
SX7E Index | | | Put | | | J.P. Morgan Chase Bank, N.A. | | | 06/16/2017 | | | | 39 | | | | EUR | | | | 95 | | | | EUR | | | | 185,250 | | | | 14,663 | |
SX7E Index | | | Put | | | J.P. Morgan Chase Bank, N.A. | | | 06/16/2017 | | | | 37 | | | | EUR | | | | 100 | | | | EUR | | | | 185,000 | | | | 18,074 | |
Subtotal — Exchange-Traded Index Put Options Purchased | | | | 5,199 | | | | | | | | | | | | | | | | | | | $ | 3,064,615 | |
Total Exchange-Traded Index Options Purchased | | | | 5,483 | | | | | | | | | | | | | | | | | | | $ | 4,856,090 | |
Total Index Options Purchased — Equity Risk | | | | 7,443 | | | | | | | | | | | | | | | | | | | $ | 6,779,823 | |
Abbreviations:
| | |
| CHF | | – Swiss Franc |
| EUR | | – Euro |
| JPY | | – Japanese Yen |
| USD | | – U.S. Dollar |
| (g) | Notional Value is calculated by multiplying the Number of Contracts by the Strike Price by the multiplier. |
| | | | | | | | | | | | | | | | | | | | | | | | | | | | | | |
| Open Over-The-Counter Foreign Currency Options Purchased | |
| Description | | Type of
Contract | | | Counterparty | | Expiration
Date | | | Strike
Price | | | Notional
Value | | | Value | |
EUR versus USD | | | Call | | | Goldman Sachs International | | | 08/25/2020 | | | | USD | | | | 1.200 | | | | EUR | | | | 1,348,907 | | | $ | 106,599 | |
GBP versus NOK | | | Call | | | Citigroup Global Markets Inc. | | | 08/24/2017 | | | | NOK | | | | 12.000 | | | | GBP | | | | 120,832 | | | | 603 | |
GBP versus NOK | | | Call | | | Goldman Sachs International | | | 08/24/2017 | | | | NOK | | | | 12.000 | | | | GBP | | | | 10,956,299 | | | | 54,678 | |
Subtotal — Over-The-Counter Foreign Currency Call Options Purchased | | | | | | | | | | | | | | | | | | | | | | $ | 161,880 | |
EUR versus USD | | | Put | | | Barclays Bank PLC | | | 01/13/2020 | | | | USD | | | | 1.270 | | | | EUR | | | | 338,440 | | | $ | 49,216 | |
EUR versus USD | | | Put | | | Barclays Bank PLC | | | 01/27/2020 | | | | USD | | | | 1.222 | | | | EUR | | | | 640,440 | | | | 72,471 | |
EUR versus USD | | | Put | | | Barclays Bank PLC | | | 03/12/2020 | | | | USD | | | | 1.170 | | | | EUR | | | | 132,118 | | | | 11,067 | |
EUR versus USD | | | Put | | | Barclays Bank PLC | | | 04/03/2020 | | | | USD | | | | 1.172 | | | | EUR | | | | 431,984 | | | | 36,784 | |
EUR versus USD | | | Put | | | Barclays Bank PLC | | | 04/22/2020 | | | | USD | | | | 1.172 | | | | EUR | | | | 351,372 | | | | 29,919 | |
EUR versus USD | | | Put | | | Barclays Bank PLC | | | 05/12/2020 | | | | USD | | | | 1.225 | | | | EUR | | | | 119,640 | | | | 13,805 | |
EUR versus USD | | | Put | | | Barclays Bank PLC | | | 06/03/2020 | | | | USD | | | | 1.218 | | | | EUR | | | | 509,824 | | | | 56,704 | |
EUR versus USD | | | Put | | | Barclays Bank PLC | | | 06/26/2020 | | | | USD | | | | 1.220 | | | | EUR | | | | 578,405 | | | | 65,037 | |
EUR versus USD | | | Put | | | Barclays Bank PLC | | | 07/10/2020 | | | | USD | | | | 1.213 | | | | EUR | | | | 477,259 | | | | 51,722 | |
EUR versus USD | | | Put | | | Barclays Bank PLC | | | 07/16/2020 | | | | USD | | | | 1.188 | | | | EUR | | | | 437,856 | | | | 41,347 | |
EUR versus USD | | | Put | | | Barclays Bank PLC | | | 08/25/2020 | | | | USD | | | | 1.177 | | | | EUR | | | | 754,643 | | | | 67,256 | |
EUR versus USD | | | Put | | | Citigroup Global Markets Inc. | | | 08/25/2020 | | | | USD | | | | 1.194 | | | | EUR | | | | 363,370 | | | | 35,537 | |
EUR versus USD | | | Put | | | Citigroup Global Markets Inc. | | | 08/25/2020 | | | | USD | | | | 1.228 | | | | EUR | | | | 353,889 | | | | 41,601 | |
EUR versus USD | | | Put | | | Deutsche Bank Securities Inc. | | | 07/01/2020 | | | | USD | | | | 1.210 | | | | EUR | | | | 358,640 | | | | 38,250 | |
EUR versus USD | | | Put | | | Deutsche Bank Securities Inc. | | | 08/25/2020 | | | | USD | | | | 1.205 | | | | EUR | | | | 320,544 | | | | 33,383 | |
EUR versus USD | | | Put | | | Goldman Sachs International | | | 12/12/2019 | | | | USD | | | | 1.350 | | | | EUR | | | | 2,792,791 | | | | 580,182 | |
EUR versus USD | | | Put | | | Goldman Sachs International | | | 01/21/2020 | | | | USD | | | | 1.253 | | | | EUR | | | | 310,284 | | | | 41,421 | |
EUR versus USD | | | Put | | | Goldman Sachs International | | | 02/06/2020 | | | | USD | | | | 1.234 | | | | EUR | | | | 238,027 | | | | 28,744 | |
EUR versus USD | | | Put | | | Goldman Sachs International | | | 04/15/2020 | | | | USD | | | | 1.159 | | | | EUR | | | | 618,354 | | | | 48,666 | |
EUR versus USD | | | Put | | | Goldman Sachs International | | | 07/29/2020 | | | | USD | | | | 1.204 | | | | EUR | | | | 200,000 | | | | 20,679 | |
EUR versus USD | | | Put | | | Goldman Sachs International | | | 08/25/2020 | | | | USD | | | | 1.171 | | | | EUR | | | | 565,767 | | | | 48,710 | |
EUR versus USD | | | Put | | | Goldman Sachs International | | | 08/25/2020 | | | | USD | | | | 1.181 | | | | EUR | | | | 840,208 | | | | 76,392 | |
EUR versus USD | | | Put | | | Goldman Sachs International | | | 08/25/2020 | | | | USD | | | | 1.182 | | | | EUR | | | | 940,625 | | | | 86,009 | |
EUR versus USD | | | Put | | | Goldman Sachs International | | | 08/25/2020 | | | | USD | | | | 1.192 | | | | EUR | | | | 1,446,909 | | | | 139,945 | |
EUR versus USD | | | Put | | | Goldman Sachs International | | | 08/25/2020 | | | | USD | | | | 1.199 | | | | EUR | | | | 949,393 | | | | 95,441 | |
EUR versus USD | | | Put | | | Goldman Sachs International | | | 08/25/2020 | | | | USD | | | | 1.203 | | | | EUR | | | | 1,678,227 | | | | 172,897 | |
EUR versus USD | | | Put | | | Goldman Sachs International | | | 08/25/2020 | | | | USD | | | | 1.210 | | | | EUR | | | | 422,926 | | | | 45,124 | |
See accompanying Notes to Consolidated Financial Statements which are an integral part of the financial statements.
13 Invesco Global Targeted Returns Fund
| | | | | | | | | | | | | | | | | | | | | | | | | | | | | | |
| Open Over-The-Counter Foreign Currency Options Purchased—(continued) | |
| Description | | Type of
Contract | | | Counterparty | | Expiration
Date | | | Strike
Price | | | Notional
Value | | | Value | |
EUR versus USD | | | Put | | | Goldman Sachs International | | | 06/17/2021 | | | | USD | | | | 1.202 | | | | EUR | | | | 948,543 | | | $ | 99,316 | |
EUR versus USD | | | Put | | | Goldman Sachs International | | | 06/17/2021 | | | | USD | | | | 1.205 | | | | EUR | | | | 599,775 | | | | 63,741 | |
EUR versus USD | | | Put | | | Goldman Sachs International | | | 06/17/2021 | | | | USD | | | | 1.208 | | | | EUR | | | | 842,323 | | | | 90,854 | |
EUR versus USD | | | Put | | | Bank of America Merrill Lynch | | | 08/25/2020 | | | | USD | | | | 1.217 | | | | EUR | | | | 798,120 | | | | 88,610 | |
NOK versus GBP | | | Put | | | Goldman Sachs International | | | 11/17/2016 | | | | NOK | | | | 10.650 | | | | GBP | | | | 1,217,367 | | | | 76,513 | |
NOK versus GBP | | | Put | | | Goldman Sachs International | | | 11/17/2016 | | | | NOK | | | | 10.700 | | | | GBP | | | | 1,217,367 | | | | 83,743 | |
NOK versus GBP | | | Put | | | Goldman Sachs International | | | 11/17/2016 | | | | NOK | | | | 10.750 | | | | GBP | | | | 1,217,367 | | | | 91,010 | |
NOK versus GBP | | | Put | | | Goldman Sachs International | | | 12/20/2016 | | | | NOK | | | | 10.350 | | | | GBP | | | | 1,293,924 | | | | 45,103 | |
NOK versus GBP | | | Put | | | Goldman Sachs International | | | 12/20/2016 | | | | NOK | | | | 10.400 | | | | GBP | | | | 1,414,756 | | | | 55,598 | |
NOK versus GBP | | | Put | | | Goldman Sachs International | | | 12/20/2016 | | | | NOK | | | | 10.450 | | | | GBP | | | | 1,293,924 | | | | 56,912 | |
USD versus JPY | | | Put | | | Citigroup Global Markets Inc. | | | 04/26/2017 | | | | JPY | | | | 100.000 | | | | USD | | | | 3,329,000 | | | | 51,679 | |
USD versus JPY | | | Put | | | Deutsche Bank Securities Inc. | | | 04/26/2017 | | | | JPY | | | | 100.000 | | | | USD | | | | 21,396,000 | | | | 332,150 | |
USD versus JPY | | | Put | | | Deutsche Bank Securities Inc. | | | 04/26/2017 | | | | JPY | | | | 105.000 | | | | USD | | | | 4,555,000 | | | | 156,208 | |
USD versus JPY | | | Put | | | Goldman Sachs International | | | 04/26/2017 | | | | JPY | | | | 100.000 | | | | USD | | | | 6,957,000 | | | | 108,000 | |
USD versus JPY | | | Put | | | Goldman Sachs International | | | 04/26/2017 | | | | JPY | | | | 109.000 | | | | USD | | | | 225,136 | | | | 13,243 | |
USD versus KRW | | | Put | | | Barclays Bank PLC | | | 04/26/2017 | | | | KRW | | | | 1,155.000 | | | | USD | | | | 1,379,000 | | | | 51,301 | |
USD versus KRW | | | Put | | | Deutsche Bank Securities Inc. | | | 04/26/2017 | | | | KRW | | | | 1,155.000 | | | | USD | | | | 4,405,000 | | | | 163,875 | |
Subtotal — Over-The-Counter Foreign Currency Put Options Purchased | | | | | | | $ | 3,656,165 | |
Total Over-The-Counter Foreign Currency Options Purchased — Currency Risk | | | | | | | $ | 3,818,045 | |
Total — Options Purchased (Cost $14,473,376) | | | | | | | $ | 10,597,868 | |
Abbreviations:
| | |
| EUR | | – Euro |
| GBP | | – British Pound Sterling |
| JPY | | – Japanese Yen |
| KRW | | – South Korean Won |
| NOK | | – Norwegian Krone |
| USD | | – U.S. Dollar |
| | | | | | | | | | | | | | | | | | | | | | | | | | | | | | | | | | | | | | | | | | |
| Open Over-The-Counter Index Options Written | |
| Description | | Type of
Contract | | | Counterparty | | Expiration
Date | | | Number of
Contracts | | | Strike
Price | | | Premiums
Received | | | Notional
Value(g) | | | Value | | | Unrealized
Appreciation
(Depreciation) | |
S&P 500 Index | | | Call | | | Goldman Sachs International | | | 01/20/2017 | | | | 103 | | | | USD | | | | 2,150 | | | $ | (466,268 | ) | | | USD | | | | 22,145,000 | | | $ | (430,507 | ) | | $ | 35,761 | |
Subtotal — Over-The-Counter Index Call Options Written | | | | 103 | | | | | | | | | | | $ | (466,268 | ) | | | | | | | | | | $ | (430,507 | ) | | $ | 35,761 | |
M1EF Index | | | Put | | | Goldman Sachs International | | | 12/19/2016 | | | | 14 | | | | USD | | | | 300 | | | | (10,682 | ) | | | USD | | | | 420,000 | | | | (417 | ) | | | 10,265 | |
M1EF Index | | | Put | | | Goldman Sachs International | | | 12/19/2016 | | | | 345 | | | | USD | | | | 310 | | | | (129,751 | ) | | | USD | | | | 10,695,000 | | | | (14,990 | ) | | | 114,761 | |
M1EF Index | | | Put | | | Goldman Sachs International | | | 12/19/2016 | | | | 173 | | | | USD | | | | 350 | | | | (366,406 | ) | | | USD | | | | 6,055,000 | | | | (34,426 | ) | | | 331,980 | |
M1EF Index | | | Put | | | Goldman Sachs International | | | 12/19/2016 | | | | 338 | | | | USD | | | | 360 | | | | (75,338 | ) | | | USD | | | | 12,168,000 | | | | (98,698 | ) | | | (23,360 | ) |
M1EF Index | | | Put | | | Goldman Sachs International | | | 12/19/2016 | | | | 164 | | | | USD | | | | 380 | | | | (301,142 | ) | | | USD | | | | 6,232,000 | | | | (102,826 | ) | | | 198,316 | |
M1EF Index | | | Put | | | Goldman Sachs International | | | 09/18/2017 | | | | 166 | | | | USD | | | | 400 | | | | (496,091 | ) | | | USD | | | | 6,640,000 | | | | (563,566 | ) | | | (67,475 | ) |
M1EF Index | | | Put | | | Morgan Stanley Capital Services LLC | | | 12/19/2016 | | | | 5 | | | | USD | | | | 380 | | | | (7,500 | ) | | | USD | | | | 190,000 | | | | (3,135 | ) | | | 4,365 | |
M1EF Index | | | Put | | | UBS | | | 12/19/2016 | | | | 7 | | | | USD | | | | 340 | | | | (14,700 | ) | | | USD | | | | 238,000 | | | | (950 | ) | | | 13,750 | |
S&P 500 Index | | | Put | | | Morgan Stanley Capital Services LLC | | | 06/16/2017 | | | | 51 | | | | USD | | | | 2,075 | | | | (483,480 | ) | | | USD | | | | 10,582,500 | | | | (490,061 | ) | | | (6,581 | ) |
Subtotal — Over-The-Counter Index Put Options Written | | | | 1,263 | | | | | | | | | | | $ | (1,885,090 | ) | | | | | | | | | | $ | (1,309,069 | ) | | $ | 576,021 | |
Total Over-The-Counter Index Options Written | | | | 1,366 | | | | | | | | | | | $ | (2,351,358 | ) | | | | | | | | | | $ | (1,739,576 | ) | | $ | 611,782 | |
See accompanying Notes to Consolidated Financial Statements which are an integral part of the financial statements.
14 Invesco Global Targeted Returns Fund
| | | | | | | | | | | | | | | | | | | | | | | | | | | | | | | | | | | | | | | | | | |
| Open Exchange-Traded Index Options Written(h) | |
| Description | | Type of
Contract | | | Counterparty | | Expiration
Date | | | Number of
Contracts | | | Strike
Price | | | Premiums
Received | | | Notional
Value(g) | | | Value | | | Unrealized
Appreciation
(Depreciation) | |
Nikkei 225 Index | | | Call | | | Goldman Sachs International | | | 12/09/2016 | | | | 4 | | | | JPY | | | | 17,750 | | | $ | (6,159 | ) | | | JPY | | | | 71,000,000 | | | $ | (8,773 | ) | | $ | (2,614 | ) |
Nikkei 225 Index | | | Call | | | UBS | | | 12/09/2016 | | | | 70 | | | | JPY | | | | 17,750 | | | | (269,214 | ) | | | JPY | | | | 1,242,500,000 | | | | (153,531 | ) | | | 115,683 | |
Subtotal — Exchange-Traded Index Call Options Written | | | | 74 | | | | | | | | | | | $ | (275,373 | ) | | | | | | | | | | $ | (162,304 | ) | | $ | 113,069 | |
Nikkei 225 Index | | | Put | | | Goldman Sachs International | | | 03/10/2017 | | | | 2 | | | | JPY | | | | 15,500 | | | $ | (27,518 | ) | | | JPY | | | | 31,000,000 | | | $ | (4,863 | ) | | $ | 22,655 | |
Nikkei 225 Index | | | Put | | | UBS | | | 03/10/2017 | | | | 25 | | | | JPY | | | | 15,500 | | | | (325,022 | ) | | | JPY | | | | 387,500,000 | | | | (60,793 | ) | | | 264,229 | |
S&P 500 Index | | | Put | | | Morgan Stanley Capital Services LLC | | | 06/16/2017 | | | | 1 | | | | USD | | | | 2,075 | | | | (8,935 | ) | | | USD | | | | 207,500 | | | | (9,620 | ) | | | (685 | ) |
SX7E Index | | | Put | | | Goldman Sachs International | | | 12/16/2016 | | | | 1,189 | | | | EUR | | | | 90 | | | | (420,297 | ) | | | EUR | | | | 5,350,500 | | | | (55,472 | ) | | | 364,825 | |
SX7E Index | | | Put | | | UBS | | | 12/16/2016 | | | | 358 | | | | EUR | | | | 90 | | | | (138,155 | ) | | | EUR | | | | 1,611,000 | | | | (16,702 | ) | | | 121,453 | |
Subtotal — Exchange-Traded Index Put Options Written | | | | 1,575 | | | | | | | | | | | $ | (919,927 | ) | | | | | | | | | | $ | (147,450 | ) | | $ | 772,477 | |
Total Exchange-Traded Index Options Written | | | | 1,649 | | | | | | | | | | | $ | (1,195,300 | ) | | | | | | | | | | $ | (309,754 | ) | | $ | 885,546 | |
Total Index Options Written — Equity Risk | | | | 3,015 | | | | | | | | | | | $ | (3,546,658 | ) | | | | | | | | | | $ | (2,049,330 | ) | | $ | 1,497,328 | |
Currency Abbreviations:
| | |
| EUR | | – Euro |
| JPY | | – Japanese Yen |
| USD | | – U.S. Dollar |
| (g) | Notional Value is calculated by multiplying the Number of Contracts by the Strike Price by the multiplier. |
| (h) | Index options written collateralized by $1,048,750 cash held with Bank of America Merrill Lynch. |
| | | | | | | | | | | | | | | | | | | | | | | | | | | | | | | | | | | | | | |
| Open Over-The-Counter Foreign Currency Options Written | |
| Description | | Type of
Contract | | | Counterparty | | Expiration
Date | | | Strike
Price | | | Premiums
Received | | | Notional
Value | | | Value | | | Unrealized
Appreciation
(Depreciation) | |
CAD versus USD | | | Call | | | Barclays Bank PLC | | | 11/09/2016 | | | | CAD | | | | 1.290 | | | $ | (5,697 | ) | | | USD | | | | 222,000 | | | $ | (8,637 | ) | | $ | (2,940 | ) |
CAD versus USD | | | Call | | | Barclays Bank PLC | | | 12/08/2016 | | | | CAD | | | | 1.320 | | | | (3,379 | ) | | | USD | | | | 222,000 | | | | (4,810 | ) | | | (1,431 | ) |
CAD versus USD | | | Call | | | Citigroup Global Markets Inc. | | | 11/09/2016 | | | | CAD | | | | 1.285 | | | | (50,635 | ) | | | USD | | | | 1,743,500 | | | | (74,297 | ) | | | (23,662 | ) |
CAD versus USD | | | Call | | | Citigroup Global Markets Inc. | | | 11/09/2016 | | | | CAD | | | | 1.290 | | | | (46,342 | ) | | | USD | | | | 1,743,500 | | | | (67,832 | ) | | | (21,490 | ) |
CAD versus USD | | | Call | | | Citigroup Global Markets Inc. | | | 11/09/2016 | | | | CAD | | | | 1.295 | | | | (42,276 | ) | | | USD | | | | 1,743,500 | | | | (61,392 | ) | | | (19,116 | ) |
CAD versus USD | | | Call | | | Citigroup Global Markets Inc. | | | 12/08/2016 | | | | CAD | | | | 1.315 | | | | (22,960 | ) | | | USD | | | | 1,766,967 | | | | (42,951 | ) | | | (19,991 | ) |
CAD versus USD | | | Call | | | Citigroup Global Markets Inc. | | | 12/08/2016 | | | | CAD | | | | 1.320 | | | | (20,594 | ) | | | USD | | | | 1,766,967 | | | | (38,281 | ) | | | (17,687 | ) |
CAD versus USD | | | Call | | | Citigroup Global Markets Inc. | | | 12/08/2016 | | | | CAD | | | | 1.325 | | | | (18,484 | ) | | | USD | | | | 1,766,967 | | | | (33,939 | ) | | | (15,455 | ) |
CAD versus USD | | | Call | | | Goldman Sachs International | | | 01/10/2017 | | | | CAD | | | | 1.340 | | | | (25,071 | ) | | | USD | | | | 1,844,967 | | | | (31,061 | ) | | | (5,990 | ) |
CAD versus USD | | | Call | | | Goldman Sachs International | | | 01/10/2017 | | | | CAD | | | | 1.350 | | | | (20,808 | ) | | | USD | | | | 1,844,967 | | | | (25,192 | ) | | | (4,384 | ) |
CAD versus USD | | | Call | | | Goldman Sachs International | | | 01/10/2017 | | | | CAD | | | | 1.360 | | | | (17,219 | ) | | | USD | | | | 1,844,967 | | | | (20,305 | ) | | | (3,086 | ) |
NOK versus GBP | | | Call | | | Goldman Sachs International | | | 08/24/2017 | | | | NOK | | | | 12.000 | | | | (43,691 | ) | | | GBP | | | | 11,077,131 | | | | (55,281 | ) | | | (11,590 | ) |
USD versus EUR | | | Call | | | Bank of America Merrill Lynch | | | 08/25/2020 | | | | USD | | | | 1.217 | | | | (85,895 | ) | | | EUR | | | | 798,120 | | | | (57,488 | ) | | | 28,407 | |
USD versus EUR | | | Call | | | Barclays Bank PLC | | | 01/13/2020 | | | | USD | | | | 1.270 | | | | (33,953 | ) | | | EUR | | | | 338,440 | | | | (13,760 | ) | | | 20,193 | |
USD versus EUR | | | Call | | | Barclays Bank PLC | | | 01/27/2020 | | | | USD | | | | 1.222 | | | | (66,630 | ) | | | EUR | | | | 640,440 | | | | (35,910 | ) | | | 30,720 | |
USD versus EUR | | | Call | | | Barclays Bank PLC | | | 03/12/2020 | | | | USD | | | | 1.170 | | | | (13,404 | ) | | | EUR | | | | 132,118 | | | | (10,602 | ) | | | 2,802 | |
USD versus EUR | | | Call | | | Barclays Bank PLC | | | 04/03/2020 | | | | USD | | | | 1.172 | | | | (44,779 | ) | | | EUR | | | | 431,984 | | | | (35,208 | ) | | | 9,571 | |
USD versus EUR | | | Call | | | Barclays Bank PLC | | | 04/22/2020 | | | | USD | | | | 1.172 | | | | (36,888 | ) | | | EUR | | | | 351,372 | | | | (28,638 | ) | | | 8,250 | |
USD versus EUR | | | Call | | | Barclays Bank PLC | | | 05/12/2020 | | | | USD | | | | 1.225 | | | | (12,182 | ) | | | EUR | | | | 119,640 | | | | (7,425 | ) | | | 4,757 | |
USD versus EUR | | | Call | | | Barclays Bank PLC | | | 06/03/2020 | | | | USD | | | | 1.218 | | | | (52,930 | ) | | | EUR | | | | 509,824 | | | | (33,684 | ) | | | 19,246 | |
USD versus EUR | | | Call | | | Barclays Bank PLC | | | 06/26/2020 | | | | USD | | | | 1.220 | | | | (57,422 | ) | | | EUR | | | | 578,405 | | | | (38,701 | ) | | | 18,721 | |
USD versus EUR | | | Call | | | Barclays Bank PLC | | | 07/10/2020 | | | | USD | | | | 1.213 | | | | (48,839 | ) | | | EUR | | | | 477,259 | | | | (33,648 | ) | | | 15,191 | |
USD versus EUR | | | Call | | | Barclays Bank PLC | | | 07/16/2020 | | | | USD | | | | 1.188 | | | | (42,457 | ) | | | EUR | | | | 437,856 | | | | (35,539 | ) | | | 6,918 | |
USD versus EUR | | | Call | | | Barclays Bank PLC | | | 08/25/2020 | | | | USD | | | | 1.177 | | | | (79,273 | ) | | | EUR | | | | 754,643 | | | | (67,052 | ) | | | 12,221 | |
USD versus EUR | | | Call | | | Citigroup Global Markets Inc. | | | 08/25/2020 | | | | USD | | | | 1.194 | | | | (36,552 | ) | | | EUR | | | | 363,370 | | | | (29,635 | ) | | | 6,917 | |
USD versus EUR | | | Call | | | Citigroup Global Markets Inc. | | | 08/25/2020 | | | | USD | | | | 1.228 | | | | (36,638 | ) | | | EUR | | | | 353,889 | | | | (24,033 | ) | | | 12,605 | |
USD versus EUR | | | Call | | | Deutsche Bank Securities Inc. | | | 07/01/2020 | | | | USD | | | | 1.210 | | | | (36,515 | ) | | | EUR | | | | 358,640 | | | | (25,465 | ) | | | 11,050 | |
USD versus EUR | | | Call | | | Deutsche Bank Securities Inc. | | | 08/25/2020 | | | | USD | | | | 1.205 | | | | (32,515 | ) | | | EUR | | | | 320,544 | | | | (24,607 | ) | | | 7,908 | |
See accompanying Notes to Consolidated Financial Statements which are an integral part of the financial statements.
15 Invesco Global Targeted Returns Fund
| | | | | | | | | | | | | | | | | | | | | | | | | | | | | | | | | | | | | | |
| Open Over-The-Counter Foreign Currency Options Written—(continued) | |
| Description | | Type of
Contract | | | Counterparty | | Expiration
Date | | | Strike
Price | | | Premiums
Received | | | Notional
Value | | | Value | | | Unrealized
Appreciation
(Depreciation) | |
USD versus EUR | | | Call | | | Goldman Sachs International | | | 12/12/2019 | | | | USD | | | | 1.350 | | | $ | (283,731 | ) | | | EUR | | | | 2,792,791 | | | $ | (64,214 | ) | | $ | 219,517 | |
USD versus EUR | | | Call | | | Goldman Sachs International | | | 01/21/2020 | | | | USD | | | | 1.253 | | | | (30,213 | ) | | | EUR | | | | 310,284 | | | | (14,215 | ) | | | 15,998 | |
USD versus EUR | | | Call | | | Goldman Sachs International | | | 02/06/2020 | | | | USD | | | | 1.234 | | | | (22,003 | ) | | | EUR | | | | 238,027 | | | | (12,553 | ) | | | 9,450 | |
USD versus EUR | | | Call | | | Goldman Sachs International | | | 04/15/2020 | | | | USD | | | | 1.159 | | | | (63,718 | ) | | | EUR | | | | 618,354 | | | | (54,316 | ) | | | 9,402 | |
USD versus EUR | | | Call | | | Goldman Sachs International | | | 07/29/2020 | | | | USD | | | | 1.204 | | | | (19,856 | ) | | | EUR | | | | 200,000 | | | | (15,061 | ) | | | 4,795 | |
USD versus EUR | | | Call | | | Goldman Sachs International | | | 08/25/2020 | | | | USD | | | | 1.171 | | | | (58,508 | ) | | | EUR | | | | 565,767 | | | | (51,844 | ) | | | 6,664 | |
USD versus EUR | | | Call | | | Goldman Sachs International | | | 08/25/2020 | | | | USD | | | | 1.181 | | | | (88,316 | ) | | | EUR | | | | 840,208 | | | | (73,318 | ) | | | 14,998 | |
USD versus EUR | | | Call | | | Goldman Sachs International | | | 08/25/2020 | | | | USD | | | | 1.182 | | | | (99,575 | ) | | | EUR | | | | 940,625 | | | | (81,657 | ) | | | 17,918 | |
USD versus EUR | | | Call | | | Goldman Sachs International | | | 08/25/2020 | | | | USD | | | | 1.192 | | | | (150,346 | ) | | | EUR | | | | 1,446,909 | | | | (119,243 | ) | | | 31,103 | |
USD versus EUR | | | Call | | | Goldman Sachs International | | | 08/25/2020 | | | | USD | | | | 1.199 | | | | (107,205 | ) | | | EUR | | | | 949,393 | | | | (75,423 | ) | | | 31,782 | |
USD versus EUR | | | Call | | | Goldman Sachs International | | | 08/25/2020 | | | | USD | | | | 1.203 | | | | (172,877 | ) | | | EUR | | | | 1,678,227 | | | | (130,201 | ) | | | 42,676 | |
USD versus EUR | | | Call | | | Goldman Sachs International | | | 08/25/2020 | | | | USD | | | | 1.210 | | | | (42,970 | ) | | | EUR | | | | 422,926 | | | | (31,702 | ) | | | 11,268 | |
USD versus EUR | | | Call | | | Goldman Sachs International | | | 06/17/2021 | | | | USD | | | | 1.202 | | | | (111,513 | ) | | | EUR | | | | 948,543 | | | | (93,793 | ) | | | 17,720 | |
USD versus EUR | | | Call | | | Goldman Sachs International | | | 06/17/2021 | | | | USD | | | | 1.205 | | | | (72,564 | ) | | | EUR | | | | 599,775 | | | | (58,525 | ) | | | 14,039 | |
USD versus EUR | | | Call | | | Goldman Sachs International | | | 06/17/2021 | | | | USD | | | | 1.208 | | | | (97,442 | ) | | | EUR | | | | 842,323 | | | | (81,107 | ) | | | 16,335 | |
Subtotal — Over-The-Counter Foreign Currency Call Options Written | | | | | | | $ | (2,454,865 | ) | | | | | | | | | | $ | (1,922,545 | ) | | $ | 532,320 | |
EUR versus USD | | | Put | | | Barclays Bank PLC | | | 01/20/2017 | | | | USD | | | | 1.066 | | | $ | (18,262 | ) | | | EUR | | | | 2,037,000 | | | $ | (11,465 | ) | | $ | 6,797 | |
EUR versus USD | | | Put | | | Barclays Bank PLC | | | 01/20/2017 | | | | USD | | | | 1.071 | | | | (21,032 | ) | | | EUR | | | | 2,037,000 | | | | (13,562 | ) | | | 7,470 | |
EUR versus USD | | | Put | | | Barclays Bank PLC | | | 01/20/2017 | | | | USD | | | | 1.076 | | | | (24,202 | ) | | | EUR | | | | 2,037,000 | | | | (16,005 | ) | | | 8,197 | |
EUR versus USD | | | Put | | | Citigroup Global Markets Inc. | | | 11/18/2016 | | | | USD | | | | 1.110 | | | | (16,281 | ) | | | EUR | | | | 1,834,436 | | | | (28,577 | ) | | | (12,296 | ) |
EUR versus USD | | | Put | | | Citigroup Global Markets Inc. | | | 11/18/2016 | | | | USD | | | | 1.115 | | | | (18,764 | ) | | | EUR | | | | 1,834,436 | | | | (35,931 | ) | | | (17,167 | ) |
EUR versus USD | | | Put | | | Goldman Sachs International | | | 11/18/2016 | | | | USD | | | | 1.115 | | | | (2,779 | ) | | | EUR | | | | 296,420 | | | | (5,806 | ) | | | (3,027 | ) |
EUR versus USD | | | Put | | | Goldman Sachs International | | | 11/18/2016 | | | | USD | | | | 1.120 | | | | (21,725 | ) | | | EUR | | | | 1,834,436 | | | | (43,851 | ) | | | (22,126 | ) |
EUR versus USD | | | Put | | | Goldman Sachs International | | | 12/16/2016 | | | | USD | | | | 1.095 | | | | (18,737 | ) | | | EUR | | | | 1,915,771 | | | | (19,910 | ) | | | (1,173 | ) |
EUR versus USD | | | Put | | | Goldman Sachs International | | | 12/16/2016 | | | | USD | | | | 1.100 | | | | (24,114 | ) | | | EUR | | | | 2,212,191 | | | | (28,253 | ) | | | (4,139 | ) |
EUR versus USD | | | Put | | | Goldman Sachs International | | | 12/16/2016 | | | | USD | | | | 1.105 | | | | (24,370 | ) | | | EUR | | | | 1,915,771 | | | | (29,700 | ) | | | (5,330 | ) |
EUR versus USD | | | Put | | | Goldman Sachs International | | | 08/25/2020 | | | | USD | | | | 1.200 | | | | (151,201 | ) | | | EUR | | | | 1,348,907 | | | | (136,347 | ) | | | 14,854 | |
GBP versus NOK | | | Put | | | Citigroup Global Markets Inc. | | | 12/20/2016 | | | | NOK | | | | 10.400 | | | | (4,572 | ) | | | GBP | | | | 120,832 | | | | (4,748 | ) | | | (176 | ) |
GBP versus NOK | | | Put | | | Goldman Sachs International | | | 11/17/2016 | | | | NOK | | | | 10.650 | | | | (19,248 | ) | | | GBP | | | | 1,217,367 | | | | (76,513 | ) | | | (57,265 | ) |
GBP versus NOK | | | Put | | | Goldman Sachs International | | | 11/17/2016 | | | | NOK | | | | 10.700 | | | | (5,755 | ) | | | GBP | | | | 1,217,367 | | | | (83,743 | ) | | | (77,988 | ) |
GBP versus NOK | | | Put | | | Goldman Sachs International | | | 11/17/2016 | | | | NOK | | | | 10.750 | | | | (22,189 | ) | | | GBP | | | | 1,217,367 | | | | (91,010 | ) | | | (68,821 | ) |
GBP versus NOK | | | Put | | | Goldman Sachs International | | | 12/20/2016 | | | | NOK | | | | 10.350 | | | | (13,366 | ) | | | GBP | | | | 1,293,924 | | | | (45,103 | ) | | | (31,737 | ) |
GBP versus NOK | | | Put | | | Goldman Sachs International | | | 12/20/2016 | | | | NOK | | | | 10.400 | | | | (15,688 | ) | | | GBP | | | | 1,293,924 | | | | (50,850 | ) | | | (35,162 | ) |
GBP versus NOK | | | Put | | | Goldman Sachs International | | | 12/20/2016 | | | | NOK | | | | 10.450 | | | | (18,306 | ) | | | GBP | | | | 1,293,924 | | | | (56,911 | ) | | | (38,605 | ) |
USD versus JPY | | | Put | | | Deutsche Bank Securities Inc. | | | 04/26/2017 | | | | JPY | | | | 109.000 | | | | (24,079 | ) | | | USD | | | | 225,136 | | | | (13,243 | ) | | | 10,836 | |
USD versus JPY | | | Put | | | Goldman Sachs International | | | 04/26/2017 | | | | JPY | | | | 105.000 | | | | (245,763 | ) | | | USD | | | | 4,564,000 | | | | (156,516 | ) | | | 89,247 | |
USD versus KRW | | | Put | | | Barclays Bank PLC | | | 04/26/2017 | | | | KRW | | | | 1,155.000 | | | | (849,420 | ) | | | USD | | | | 18,000,000 | | | | (669,635 | ) | | | 179,785 | |
USD versus KRW | | | Put | | | Citigroup Global Markets Inc. | | | 04/26/2017 | | | | KRW | | | | 1,155.010 | | | | (14,000 | ) | | | USD | | | | 280,000 | | | | (10,417 | ) | | | 3,583 | |
USD versus KRW | | | Put | | | Deutsche Bank Securities Inc. | | | 04/26/2017 | | | | KRW | | | | 1,155.020 | | | | (236,315 | ) | | | USD | | | | 5,182,342 | | | | (192,793 | ) | | | 43,522 | |
Subtotal — Over-The-Counter Foreign Currency Put Options Written | | | | | | | | | | | $ | (1,810,168 | ) | | | | | | | | | | $ | (1,820,889 | ) | | $ | (10,721 | ) |
Total Foreign Currency Options Written — Currency Risk | | | | | | | $ | (4,265,033 | ) | | | | | | | | | | $ | (3,743,434 | ) | | $ | 521,599 | |
Total — Options Written | | | | | | | $ | (7,811,691 | ) | | | | | | | | | | $ | (5,792,764 | ) | | $ | 2,018,927 | |
Currency Abbreviations:
| | |
| CAD | | – Canadian Dollar |
| EUR | | – Euro |
| GBP | | – British Pound Sterling |
| JPY | | – Japanese Yen |
| NOK | | – Norwegian Krone |
| KRW | | – South Korean Won |
| USD | | – U.S. Dollar |
See accompanying Notes to Consolidated Financial Statements which are an integral part of the financial statements.
16 Invesco Global Targeted Returns Fund
| | | | | | | | | | | | | | | | | | | | | | | | | | | | | | | | | | | | | | | | | | | | | | | | |
| Options Written Transactions | |
| | | Call Options | |
| | | Number of
Contracts* | | | | | | Notional
Value | | | | | | Notional
Value | | | | | | Notional
Value | | | | | | Notional
Value | | | | | | Notional
Value | | | Premiums
Received | |
Beginning of period | | | 149 | | | | EUR | | | | 9,996,163 | | | | GBP | | | | 6,707,747 | | | | HKD | | | | 105,700,000 | | | | JPY | | | | — | | | | USD | | | | 16,950,500 | | | $ | 1,941,208 | |
Written | | | 213 | | | | EUR | | | | 10,364,533 | | | | GBP | | | | 14,187,910 | | | | HKD | | | | 32,380,000 | | | | JPY | | | | 1,313,500,000 | | | | USD | | | | 88,149,374 | | | | 3,067,905 | |
Closed | | | (143 | ) | | | | | | | — | | | | | | | | — | | | | HKD | | | | (98,650,000 | ) | | | | | | | — | | | | USD | | | | (28,373,261 | ) | | | (941,164 | ) |
Exercised | | | — | | | | | | | | — | | | | | | | | — | | | | | | | | — | | | | | | | | — | | | | | | | | — | | | | — | |
Expired | | | (42 | ) | | | | | | | — | | | | GBP | | | | (9,818,526 | ) | | | HKD | | | | (39,430,000 | ) | | | | | | | — | | | | USD | | | | (38,071,311 | ) | | | (871,443 | ) |
End of period | | | 177 | | | | EUR | | | | 20,360,696 | | | | GBP | | | | 11,077,131 | | | | HKD | | | | — | | | | JPY | | | | 1,313,500,000 | | | | USD | | | | 38,655,302 | | | $ | 3,196,506 | |
| | | | | | | | | | | | | | | | | | | | | | | | | | | | | | | | | | | | | | | | |
| |
| | | Put Options | |
| | | Number of
Contracts* | | | | | | Notional
Value | | | | | | Notional
Value | | | | | | Notional
Value | | | | | | Notional
Value | | | Premiums
Received | |
Beginning of period | | | 1,210 | | | | EUR | | | | 49,756,823 | | | | GBP | | | | 22,879,187 | | | | JPY | | | | 2,751,000,000 | | | | USD | | | | 33,515,000 | | | $ | 6,521,659 | |
Written | | | 6,897 | | | | EUR | | | | 142,427,081 | | | | GBP | | | | 77,293,284 | | | | JPY | | | | 1,749,250,000 | | | | USD | | | | 272,885,270 | | | | 20,535,948 | |
Closed | | | (3,692 | ) | | | EUR | | | | (87,466,332 | ) | | | GBP | | | | (85,673,927 | ) | | | JPY | | | | (3,322,750,000 | ) | | | USD | | | | (210,024,792 | ) | | | (20,030,117 | ) |
Exercised | | | — | | | | | | | | — | | | | | | | | — | | | | | | | | — | | | | | | | | — | | | | — | |
Expired | | | (1,577 | ) | | | EUR | | | | (78,452,704 | ) | | | GBP | | | | (6,843,839 | ) | | | JPY | | | | (759,000,000 | ) | | | USD | | | | (14,696,000 | ) | | | (2,412,305 | ) |
End of period | | | 2,838 | | | | EUR | | | | 26,264,868 | | | | GBP | | | | 7,654,705 | | | | JPY | | | | 418,500,000 | | | | USD | | | | 81,679,478 | | | $ | 4,615,185 | |
| * | Does not include foreign currency options written. |
| | | | | | | | | | | | | | | | | | | | |
| Open Futures Contracts(i) | |
| Futures Contracts | | Type of
Contract | | | Number of
Contracts | | | Expiration
Month | | | Notional
Value | | | Unrealized
Appreciation
(Depreciation) | |
CAA Index | | | Long | | | | 833 | | | | December-2016 | | | $ | 4,777,875 | | | $ | 565,048 | |
CBOE VIX Index | | | Long | | | | 107 | | | | December-2016 | | | | 1,864,475 | | | | (122,591 | ) |
DAX Index | | | Long | | | | 41 | | | | December-2016 | | | | 12,013,694 | | | | 311,835 | |
E-Mini Consumer Staples Sector | | | Long | | | | 249 | | | | December-2016 | | | | 13,162,140 | | | | (86,596 | ) |
FTSE 100 Index | | | Long | | | | 2 | | | | December-2016 | | | | 169,594 | | | | 5,490 | |
Swiss Market Index | | | Long | | | | 253 | | | | December-2016 | | | | 20,016,543 | | | | (721,089 | ) |
E-Mini Consumer Discretionary Sector | | | Short | | | | 167 | | | | December-2016 | | | | (13,097,810 | ) | | | 159,591 | |
E-Mini S&P 500 Index | | | Short | | | | 75 | | | | December-2016 | | | | (7,950,375 | ) | | | 58,185 | |
MSCI AC Asia Index | | | Short | | | | 290 | | | | December-2016 | | | | (10,840,432 | ) | | | 385,629 | |
Nikkei 225 | | | Short | | | | 47 | | | | December-2016 | | | | (3,906,022 | ) | | | (124,996 | ) |
Russell 2000 Index Mini | | | Short | | | | 67 | | | | December-2016 | | | | (7,981,710 | ) | | | 264,472 | |
STOXX Europe 600 Index | | | Short | | | | 1,242 | | | | December-2016 | | | | (23,068,821 | ) | | | 346,306 | |
Subtotal — Equity Risk | | | | | | | | | | | | | | | | | | | 1,041,284 | |
U.S. Treasury 5 Year Notes | | | Long | | | | 128 | | | | December-2016 | | | | 15,462,000 | | | | 1,471 | |
U.S. Treasury Ultra Bonds | | | Long | | | | 129 | | | | December-2016 | | | | 22,695,938 | | | | (1,034,794 | ) |
U.S. Treasury 10 Year Ultra Bonds | | | Short | | | | 105 | | | | December-2016 | | | | (14,859,141 | ) | | | (3,905 | ) |
Subtotal — Interest Rate Risk | | | | | | | | | | | | | | | | | | | (1,037,228 | ) |
Total Futures Contracts | | | | | | | | | | | | | | | | | | $ | 4,056 | |
| (i) | Futures contracts collateralized by $3,933,439 cash held with Bank of America Merrill Lynch, the futures commission merchant. |
See accompanying Notes to Consolidated Financial Statements which are an integral part of the financial statements.
17 Invesco Global Targeted Returns Fund
| | | | | | | | | | | | | | | | | | | | | | | | | | | | | | | | | | |
| Open Centrally Cleared Credit Default Swap Agreements(j)(k) | |
| Counterparty/Clearinghouse | | Reference Entity | | Buy/Sell
Protection | | | (Pay)/
Receive
Fixed
Rate | | | Implied
Credit
Spread(j) | | | Expiration
Date | | | | | | Notional
Value | | | Upfront
Payments
Paid
(Received) | | | Unrealized
Appreciation
(Depreciation) | |
Credit Suisse First Boston/ICE | | Markit iTraxx Europe Index | | | Sell | | | | 1.00 | % | | | 0.67 | % | | | June-2021 | | | | EUR | | | | 9,808,000 | | | $ | 158,286 | | | $ | (6,737 | ) |
Credit Suisse First Boston/ICE | | Markit iTraxx Europe Index | | | Sell | | | | 1.00 | | | | 0.73 | | | | December-2021 | | | | EUR | | | | 11,053,000 | | | | 169,092 | | | | (4,075 | ) |
Credit Suisse First Boston/ICE | | Markit iTraxx Europe Index | | | Sell | | | | 1.00 | | | | 1.10 | | | | December-2026 | | | | EUR | | | | 40,000,000 | | | | (295,890 | ) | | | (112,404 | ) |
Credit Suisse First Boston/ICE | | Markit iTraxx Europe Index | | | Buy | | | | (1.00 | ) | | | 0.67 | | | | June-2021 | | | | EUR | | | | 9,808,000 | | | | (185,775 | ) | | | 22,806 | |
Credit Suisse First Boston/CME | | Markit CDX NA HY Index | | | Buy | | | | (1.00 | ) | | | 0.73 | | | | December-2021 | | | | EUR | | | | 6,330,000 | | | | (112,415 | ) | | | 18,165 | |
Credit Suisse First Boston/ICE | | Markit iTraxx Europe Index | | | Buy | | | | (1.00 | ) | | | 0.73 | | | | December-2021 | | | | EUR | | | | 33,670,000 | | | | (520,538 | ) | | | 17,938 | |
Credit Suisse First Boston/CME | | Markit CDX NA HY Index | | | Buy | | | | (5.00 | ) | | | 3.93 | | | | June-2021 | | | | USD | | | | 4,294,000 | | | | (110,660 | ) | | | (59,998 | ) |
Credit Suisse First Boston/CME | | Markit CDX NA HY Index | | | Buy | | | | (5.00 | ) | | | 4.21 | | | | December-2021 | | | | USD | | | | 133,000 | | | | (5,383 | ) | | | 978 | |
Total — Credit Default Swap Agreements — Credit Risk | | | | | | | | | | | | | | | $ | (903,283 | ) | | $ | (123,327 | ) |
Abbreviations:
| | |
| CME | | – Chicago Mercantile Exchange |
| EUR | | – Euro |
| | |
| ICE | | – Intercontinental Exchange |
| USD | | – U.S. Dollar |
| (j) | Implied credit spreads represent the current level as of October 31, 2016 at which protection could be bought or sold given the terms of the existing credit default swap contract and serve as an indicator of the current status of the payment/performance risk of the credit default swap contract. An implied credit spread that has widened or increased since entry into the initial contract may indicate a deteriorating credit profile and increased risk of default for the reference entity. A declining or narrowing spread may indicate an improving credit profile or decreased risk of default for the reference entity. Alternatively, credit spreads may increase or decrease reflecting the general tolerance for risk in the credit spread markets generally. |
| | | | | | | | | | | | | | | | | | | | | | | | | | |
| Open Centrally Cleared Interest Rate Swap Agreements(k) | |
| Counterparty/Clearinghouse | | Pay/Receive
Floating Rate | | Floating Rate Index | | | Fixed
Rate | | | Termination
Date | | | Notional
Value | | | Unrealized
Appreciation
(Depreciation) | |
Credit Suisse Securities (USA) LLC/CME | | Receive | | | 6 Month EUR LIBOR | | | | 1.298 | % | | | February-2030 | | | | EUR | | | | 3,181,000 | | | $ | (93,683 | ) |
Credit Suisse Securities (USA) LLC/CME | | Receive | | | 6 Month EUR LIBOR | | | | 1.819 | | | | July-2049 | | | | EUR | | | | 270,000 | | | | (55,172 | ) |
Credit Suisse Securities (USA) LLC/CME | | Receive | | | 6 Month EUR LIBOR | | | | 1.880 | | | | July-2049 | | | | EUR | | | | 5,156,000 | | | | (1,155,901 | ) |
Credit Suisse Securities (USA) LLC/CME | | Receive | | | 6 Month EUR LIBOR | | | | 2.014 | | | | July-2049 | | | | EUR | | | | 547,000 | | | | (142,294 | ) |
Credit Suisse Securities (USA) LLC/CME | | Receive | | | 6 Month EUR LIBOR | | | | 1.800 | | | | September-2049 | | | | EUR | | | | 446,000 | | | | (88,146 | ) |
Credit Suisse Securities (USA) LLC/CME | | Receive | | | 6 Month EUR LIBOR | | | | 1.702 | | | | October-2049 | | | | EUR | | | | 505,000 | | | | (84,741 | ) |
Credit Suisse Securities (USA) LLC/CME | | Receive | | | 6 Month EUR LIBOR | | | | 1.738 | | | | October-2049 | | | | EUR | | | | 506,000 | | | | (90,321 | ) |
Credit Suisse Securities (USA) LLC/CME | | Receive | | | 6 Month EUR LIBOR | | | | 1.740 | | | | October-2049 | | | | EUR | | | | 401,000 | | | | (72,009 | ) |
Credit Suisse Securities (USA) LLC/CME | | Receive | | | 6 Month EUR LIBOR | | | | 1.834 | | | | November-2049 | | | | EUR | | | | 884,000 | | | | (181,252 | ) |
Credit Suisse Securities (USA) LLC/CME | | Receive | | | 6 Month EUR LIBOR | | | | 1.812 | | | | December-2049 | | | | EUR | | | | 1,821,000 | | | | (361,318 | ) |
Credit Suisse Securities (USA) LLC/CME | | Receive | | | 6 Month EUR LIBOR | | | | 1.825 | | | | December-2049 | | | | EUR | | | | 2,098,000 | | | | (424,171 | ) |
Credit Suisse Securities (USA) LLC/CME | | Receive | | | 6 Month EUR LIBOR | | | | 1.733 | | | | January-2050 | | | | EUR | | | | 1,050,000 | | | | (184,016 | ) |
Credit Suisse Securities (USA) LLC/CME | | Receive | | | 6 Month EUR LIBOR | | | | 1.288 | | | | March-2050 | | | | EUR | | | | 1,187,000 | | | | (53,314 | ) |
Credit Suisse Securities (USA) LLC/CME | | Receive | | | 6 Month EUR LIBOR | | | | 1.340 | | | | June-2050 | | | | EUR | | | | 750,000 | | | | (42,161 | ) |
Credit Suisse Securities (USA) LLC/CME | | Receive | | | 6 Month EUR LIBOR | | | | 0.931 | | | | September-2050 | | | | EUR | | | | 790,000 | | | | 50,555 | |
Credit Suisse Securities (USA) LLC/CME | | Receive | | | 6 Month EUR LIBOR | | | | 0.984 | | | | September-2050 | | | | EUR | | | | 703,000 | | | | 34,612 | |
Credit Suisse Securities (USA) LLC/CME | | Receive | | | 6 Month GBP LIBOR | | | | 2.463 | | | | May-2025 | | | | GBP | | | | 8,364,000 | | | | (644,936 | ) |
Credit Suisse Securities (USA) LLC/CME | | Receive | | | 6 Month GBP LIBOR | | | | 2.680 | | | | June-2025 | | | | GBP | | | | 350,000 | | | | (32,474 | ) |
Credit Suisse Securities (USA) LLC/CME | | Receive | | | 6 Month GBP LIBOR | | | | 2.807 | | | | June-2025 | | | | GBP | | | | 772,000 | | | | (78,439 | ) |
Credit Suisse Securities (USA) LLC/CME | | Receive | | | 6 Month GBP LIBOR | | | | 2.550 | | | | July-2025 | | | | GBP | | | | 280,000 | | | | (22,769 | ) |
Credit Suisse Securities (USA) LLC/CME | | Receive | | | 6 Month GBP LIBOR | | | | 2.710 | | | | July-2025 | | | | GBP | | | | 427,000 | | | | (39,962 | ) |
Credit Suisse Securities (USA) LLC/CME | | Receive | | | 6 Month GBP LIBOR | | | | 2.761 | | | | July-2025 | | | | GBP | | | | 643,000 | | | | (62,763 | ) |
Credit Suisse Securities (USA) LLC/CME | | Receive | | | 6 Month GBP LIBOR | | | | 2.795 | | | | July-2025 | | | | GBP | | | | 477,000 | | | | (47,927 | ) |
Credit Suisse Securities (USA) LLC/CME | | Receive | | | 6 Month GBP LIBOR | | | | 2.300 | | | | September-2025 | | | | GBP | | | | 622,000 | | | | (38,020 | ) |
Credit Suisse Securities (USA) LLC/CME | | Receive | | | 6 Month GBP LIBOR | | | | 2.358 | | | | September-2025 | | | | GBP | | | | 821,000 | | | | (53,803 | ) |
Credit Suisse Securities (USA) LLC/CME | | Receive | | | 6 Month GBP LIBOR | | | | 2.283 | | | | October-2025 | | | | GBP | | | | 136,000 | | | | (8,028 | ) |
Credit Suisse Securities (USA) LLC/CME | | Receive | | | 6 Month GBP LIBOR | | | | 2.293 | | | | October-2025 | | | | GBP | | | | 639,000 | | | | (38,404 | ) |
Credit Suisse Securities (USA) LLC/CME | | Receive | | | 6 Month GBP LIBOR | | | | 2.264 | | | | November-2025 | | | | GBP | | | | 630,000 | | | | (35,919 | ) |
Credit Suisse Securities (USA) LLC/CME | | Receive | | | 6 Month GBP LIBOR | | | | 2.411 | | | | November-2025 | | | | GBP | | | | 718,000 | | | | (48,750 | ) |
See accompanying Notes to Consolidated Financial Statements which are an integral part of the financial statements.
18 Invesco Global Targeted Returns Fund
| | | | | | | | | | | | | | | | | | | | | | | | | | |
| Open Centrally Cleared Interest Rate Swap Agreements(k)—(continued) | |
| Counterparty/Clearinghouse | | Pay/Receive
Floating Rate | | Floating Rate Index | | | Fixed
Rate | | | Termination
Date | | | Notional
Value | | | Unrealized
Appreciation
(Depreciation) | |
Credit Suisse Securities (USA) LLC/CME | | Receive | | | 6 Month GBP LIBOR | | | | 2.392 | % | | | December-2025 | | | | GBP | | | | 1,723,000 | | | $ | (112,337 | ) |
Credit Suisse Securities (USA) LLC/CME | | Receive | | | 6 Month GBP LIBOR | | | | 2.205 | | | | January-2026 | | | | GBP | | | | 838,000 | | | | (43,412 | ) |
Credit Suisse Securities (USA) LLC/CME | | Receive | | | 6 Month GBP LIBOR | | | | 2.319 | | | | January-2026 | | | | GBP | | | | 641,000 | | | | (38,398 | ) |
Credit Suisse Securities (USA) LLC/CME | | Receive | | | 6 Month GBP LIBOR | | | | 1.859 | | | | March-2026 | | | | GBP | | | | 1,149,000 | | | | (30,888 | ) |
Credit Suisse Securities (USA) LLC/CME | | Receive | | | 6 Month GBP LIBOR | | | | 1.875 | | | | March-2026 | | | | GBP | | | | 583,000 | | | | (16,133 | ) |
Credit Suisse Securities (USA) LLC/CME | | Receive | | | 6 Month GBP LIBOR | | | | 1.195 | | | | June-2026 | | | | GBP | | | | 509,000 | | | | (14,358 | ) |
Credit Suisse Securities (USA) LLC/CME | | Receive | | | 6 Month GBP LIBOR | | | | 1.393 | | | | June-2026 | | | | GBP | | | | 1,996,000 | | | | 10,402 | |
Credit Suisse Securities (USA) LLC/CME | | Receive | | | 6 Month GBP LIBOR | | | | 1.015 | | | | September-2026 | | | | GBP | | | | 1,424,000 | | | | 42,671 | |
Credit Suisse Securities (USA) LLC/CME | | Receive | | | 6 Month GBP LIBOR | | | | 1.247 | | | | September-2026 | | | | GBP | | | | 1,277,000 | | | | 20,318 | |
Credit Suisse Securities (USA) LLC/CME | | Receive | | | 6 Month GBP LIBOR | | | | 1.274 | | | | September-2026 | | | | GBP | | | | 604,000 | | | | 8,405 | |
Credit Suisse Securities (USA) LLC/CME | | Receive | | | 6 Month GBP LIBOR | | | | 1.056 | | | | September-2036 | | | | GBP | | | | 4,384,000 | | | | 304,272 | |
Credit Suisse Securities (USA) LLC/CME | | Receive | | | 6 Month GBP LIBOR | | | | 1.080 | | | | September-2036 | | | | GBP | | | | 2,192,000 | | | | 146,319 | |
Credit Suisse Securities (USA) LLC/CME | | Receive | | | 6 Month GBP LIBOR | | | | 1.100 | | | | September-2036 | | | | GBP | | | | 4,384,000 | | | | 282,947 | |
Credit Suisse Securities (USA) LLC/CME | | Receive | | | 6 Month GBP LIBOR | | | | 1.253 | | | | September-2036 | | | | GBP | | | | 362,000 | | | | 17,010 | |
Credit Suisse Securities (USA) LLC/CME | | Receive | | | 6 Month GBP LIBOR | | | | 1.420 | | | | September-2036 | | | | GBP | | | | 338,000 | | | | 9,607 | |
Credit Suisse Securities (USA) LLC/CME | | Receive | | | 6 Month GBP LIBOR | | | | 1.709 | | | | September-2036 | | | | GBP | | | | 467,303 | | | | (454 | ) |
Credit Suisse Securities (USA) LLC/CME | | Receive | | | 6 Month GBP LIBOR | | | | 1.713 | | | | September-2036 | | | | GBP | | | | 1,813,234 | | | | (2,420 | ) |
Credit Suisse Securities (USA) LLC/CME | | Receive | | | 6 Month GBP LIBOR | | | | 1.727 | | | | September-2036 | | | | GBP | | | | 934,606 | | | | (2,651 | ) |
Credit Suisse Securities (USA) LLC/CME | | Receive | | | 6 Month GBP LIBOR | | | | 1.972 | | | | December-2045 | | | | GBP | | | | 737,000 | | | | (151,512 | ) |
Credit Suisse Securities (USA) LLC/CME | | Receive | | | 6 Month GBP LIBOR | | | | 1.985 | | | | December-2045 | | | | GBP | | | | 867,100 | | | | (182,555 | ) |
Credit Suisse Securities (USA) LLC/CME | | Receive | | | 6 Month GBP LIBOR | | | | 2.031 | | | | December-2045 | | | | GBP | | | | 1,388,000 | | | | (315,846 | ) |
Credit Suisse Securities (USA) LLC/CME | | Receive | | | 6 Month GBP LIBOR | | | | 2.042 | | | | December-2045 | | | | GBP | | | | 1,399,000 | | | | (324,054 | ) |
Credit Suisse Securities (USA) LLC/CME | | Receive | | | 6 Month GBP LIBOR | | | | 2.045 | | | | December-2045 | | | | GBP | | | | 1,090,000 | | | | (254,187 | ) |
Credit Suisse Securities (USA) LLC/CME | | Receive | | | 6 Month GBP LIBOR | | | | 2.100 | | | | December-2045 | | | | GBP | | | | 890,000 | | | | (225,744 | ) |
Credit Suisse Securities (USA) LLC/CME | | Receive | | | 6 Month GBP LIBOR | | | | 2.113 | | | | December-2045 | | | | GBP | | | | 553,000 | | | | (143,245 | ) |
Credit Suisse Securities (USA) LLC/CME | | Receive | | | 6 Month GBP LIBOR | | | | 2.116 | | | | December-2045 | | | | GBP | | | | 557,000 | | | | (144,896 | ) |
Credit Suisse Securities (USA) LLC/CME | | Receive | | | 6 Month GBP LIBOR | | | | 2.050 | | | | January-2046 | | | | GBP | | | | 301,000 | | | | (71,212 | ) |
Credit Suisse Securities (USA) LLC/CME | | Receive | | | 6 Month GBP LIBOR | | | | 1.636 | | | | March-2046 | | | | GBP | | | | 402,000 | | | | (36,144 | ) |
Credit Suisse Securities (USA) LLC/CME | | Receive | | | 6 Month GBP LIBOR | | | | 1.643 | | | | March-2046 | | | | GBP | | | | 243,000 | | | | (22,463 | ) |
Credit Suisse Securities (USA) LLC/CME | | Receive | | | 6 Month GBP LIBOR | | | | 1.850 | | | | April-2046 | | | | GBP | | | | 172,000 | | | | (28,879 | ) |
Credit Suisse Securities (USA) LLC/CME | | Receive | | | 6 Month GBP LIBOR | | | | 1.144 | | | | September-2046 | | | | GBP | | | | 234,000 | | | | 17,006 | |
Credit Suisse Securities (USA) LLC/CME | | Receive | | | 6 Month GBP LIBOR | | | | 1.004 | | | | December-2046 | | | | GBP | | | | 493,000 | | | | 59,571 | |
Credit Suisse Securities (USA) LLC/CME | | Receive | | | 6 Month GBP LIBOR | | | | 1.210 | | | | December-2046 | | | | GBP | | | | 758,000 | | | | 41,390 | |
Credit Suisse Securities (USA) LLC/CME | | Receive | | | 6 Month GBP LIBOR | | | | 1.294 | | | | December-2046 | | | | GBP | | | | 517,000 | | | | 14,821 | |
Credit Suisse Securities (USA) LLC/CME | | Receive | | | 6 Month JPY LIBOR | | | | 0.544 | | | | September-2036 | | | | JPY | | | | 313,651,428 | | | | 67,492 | |
Credit Suisse Securities (USA) LLC/CME | | Receive | | | 6 Month JPY LIBOR | | | | 0.614 | | | | September-2036 | | | | JPY | | | | 156,825,716 | | | | 23,486 | |
Credit Suisse Securities (USA) LLC/CME | | Receive | | | 6 Month JPY LIBOR | | | | 0.627 | | | | September-2036 | | | | JPY | | | | 627,302,856 | | | | 86,683 | |
Credit Suisse Securities (USA) LLC/CME | | Receive | | | 6 Month JPY LIBOR | | | | 0.590 | | | | May-2038 | | | | JPY | | | | 475,650,000 | | | | (75,450 | ) |
Credit Suisse Securities (USA) LLC/CME | | Receive | | | 6 Month JPY LIBOR | | | | 0.624 | | | | May-2038 | | | | JPY | | | | 200,400,000 | | | | (44,761 | ) |
Credit Suisse Securities (USA) LLC/CME | | Receive | | | 6 Month JPY LIBOR | | | | 0.637 | | | | May-2038 | | | | JPY | | | | 549,750,000 | | | | (135,213 | ) |
Credit Suisse Securities (USA) LLC/CME | | Receive | | | 6 Month JPY LIBOR | | | | 0.640 | | | | May-2038 | | | | JPY | | | | 22,541,000 | | | | (5,687 | ) |
Credit Suisse Securities (USA) LLC/CME | | Receive | | | 6 Month JPY LIBOR | | | | 0.159 | | | | June-2038 | | | | JPY | | | | 47,577,000 | | | | 31,385 | |
Credit Suisse Securities (USA) LLC/CME | | Receive | | | 6 Month JPY LIBOR | | | | 0.580 | | | | June-2038 | | | | JPY | | | | 65,686,000 | | | | (8,538 | ) |
Credit Suisse Securities (USA) LLC/CME | | Receive | | | 6 Month JPY LIBOR | | | | 0.367 | | | | September-2038 | | | | JPY | | | | 95,159,000 | | | | 27,625 | |
Credit Suisse Securities (USA) LLC/CME | | Receive | | | 3 Month SEK LIBOR | | | | 0.390 | | | | April-2021 | | | | SEK | | | | 111,635,138 | | | | (306,413 | ) |
Credit Suisse Securities (USA) LLC/CME | | Receive | | | 3 Month SEK LIBOR | | | | 0.385 | | | | May-2021 | | | | SEK | | | | 170,366,862 | | | | (462,267 | ) |
Credit Suisse Securities (USA) LLC/CME | | Receive | | | 3 Month SEK LIBOR | | | | 0.285 | | | | June-2021 | | | | SEK | | | | 9,593,000 | | | | (19,881 | ) |
Credit Suisse Securities (USA) LLC/CME | | Receive | | | 3 Month SEK LIBOR | | | | 0.304 | | | | June-2021 | | | | SEK | | | | 15,954,000 | | | | (34,800 | ) |
Credit Suisse Securities (USA) LLC/CME | | Receive | | | 3 Month SEK LIBOR | | | | (0.036 | ) | | | September-2021 | | | | SEK | | | | 10,167,000 | | | | (369 | ) |
Credit Suisse Securities (USA) LLC/CME | | Receive | | | 3 Month SEK LIBOR | | | | 0.020 | | | | September-2021 | | | | SEK | | | | 11,493,000 | | | | (4,209 | ) |
See accompanying Notes to Consolidated Financial Statements which are an integral part of the financial statements.
19 Invesco Global Targeted Returns Fund
| | | | | | | | | | | | | | | | | | | | | | | | | | |
| Open Centrally Cleared Interest Rate Swap Agreements(k)—(continued) | |
| Counterparty/Clearinghouse | | Pay/Receive
Floating Rate | | Floating Rate Index | | | Fixed
Rate | | | Termination
Date | | | Notional
Value | | | Unrealized
Appreciation
(Depreciation) | |
Credit Suisse Securities (USA) LLC/CME | | Receive | | | 3 Month SEK LIBOR | | | | (0.016 | ) % | | | December-2021 | | | | SEK | | | | 13,644,000 | | | $ | 2,567 | |
Credit Suisse Securities (USA) LLC/CME | | Receive | | | 3 Month USD LIBOR | | | | 0.970 | | | | September-2021 | | | | USD | | | | 201,000 | | | | 3,591 | |
Credit Suisse Securities (USA) LLC/CME | | Receive | | | 3 Month USD LIBOR | | | | 1.034 | | | | September-2021 | | | | USD | | | | 1,972,200 | | | | 29,239 | |
Credit Suisse Securities (USA) LLC/CME | | Receive | | | 3 Month USD LIBOR | | | | 1.036 | | | | September-2021 | | | | USD | | | | 986,100 | | | | 14,521 | |
Credit Suisse Securities (USA) LLC/CME | | Receive | | | 3 Month USD LIBOR | | | | 1.039 | | | | September-2021 | | | | USD | | | | 986,100 | | | | 14,384 | |
Credit Suisse Securities (USA) LLC/CME | | Receive | | | 3 Month USD LIBOR | | | | 1.055 | | | | September-2021 | | | | USD | | | | 1,479,100 | | | | 20,437 | |
Credit Suisse Securities (USA) LLC/CME | | Receive | | | 3 Month USD LIBOR | | | | 1.058 | | | | September-2021 | | | | USD | | | | 986,100 | | | | 13,474 | |
Credit Suisse Securities (USA) LLC/CME | | Receive | | | 3 Month USD LIBOR | | | | 1.060 | | | | September-2021 | | | | USD | | | | 986,100 | | | | 13,399 | |
Credit Suisse Securities (USA) LLC/CME | | Receive | | | 3 Month USD LIBOR | | | | 1.085 | | | | September-2021 | | | | USD | | | | 1,479,200 | | | | 18,354 | |
Credit Suisse Securities (USA) LLC/CME | | Receive | | | 3 Month USD LIBOR | | | | 1.098 | | | | September-2021 | | | | USD | | | | 986,100 | | | | 11,580 | |
Credit Suisse Securities (USA) LLC/CME | | Receive | | | 3 Month USD LIBOR | | | | 1.205 | | | | September-2021 | | | | USD | | | | 298,000 | | | | 1,987 | |
Credit Suisse Securities (USA) LLC/CME | | Receive | | | 3 Month USD LIBOR | | | | 1.245 | | | | September-2021 | | | | USD | | | | 375,000 | | | | 1,786 | |
Credit Suisse Securities (USA) LLC/CME | | Receive | | | 3 Month USD LIBOR | | | | 1.243 | | | | December-2021 | | | | USD | | | | 333,000 | | | | 2,234 | |
Credit Suisse Securities (USA) LLC/CME | | Receive | | | 3 Month USD LIBOR | | | | 1.860 | | | | November-2041 | | | | USD | | | | 382,000 | | | | 15,983 | |
Credit Suisse Securities (USA) LLC/CME | | Receive | | | 3 Month USD LIBOR | | | | 1.869 | | | | November-2041 | | | | USD | | | | 5,117,000 | | | | 204,905 | |
Credit Suisse Securities (USA) LLC/CME | | Receive | | | 3 Month USD LIBOR | | | | 1.874 | | | | November-2041 | | | | USD | | | | 3,307,000 | | | | 129,300 | |
Credit Suisse Securities (USA) LLC/CME | | Receive | | | 3 Month USD LIBOR | | | | 1.878 | | | | November-2041 | | | | USD | | | | 1,427,000 | | | | 54,531 | |
Credit Suisse Securities (USA) LLC/CME | | Receive | | | 3 Month USD LIBOR | | | | 1.958 | | | | November-2041 | | | | USD | | | | 651,200 | | | | 14,126 | |
Credit Suisse Securities (USA) LLC/CME | | Receive | | | 3 Month USD LIBOR | | | | 2.008 | | | | November-2041 | | | | USD | | | | 1,953,600 | | | | 21,956 | |
Credit Suisse Securities (USA) LLC/CME | | Receive | | | 3 Month USD LIBOR | | | | 2.036 | | | | November-2041 | | | | USD | | | | 651,200 | | | | 3,555 | |
Credit Suisse Securities (USA) LLC/CME | | Receive | | | 3 Month USD LIBOR | | | | 1.730 | | | | February-2042 | | | | USD | | | | 1,401,000 | | | | 99,730 | |
Credit Suisse Securities (USA) LLC/CME | | Receive | | | 3 Month USD LIBOR | | | | 1.732 | | | | February-2042 | | | | USD | | | | 5,768,200 | | | | 407,979 | |
Credit Suisse Securities (USA) LLC/CME | | Receive | | | 3 Month USD LIBOR | | | | 1.749 | | | | February-2042 | | | | USD | | | | 1,014,000 | | | | 68,065 | |
Credit Suisse Securities (USA) LLC/CME | | Receive | | | 3 Month USD LIBOR | | | | 1.760 | | | | February-2042 | | | | USD | | | | 6,293,800 | | | | 408,241 | |
Credit Suisse Securities (USA) LLC/CME | | Receive | | | 3 Month USD LIBOR | | | | 1.854 | | | | February-2042 | | | | USD | | | | 333,000 | | | | 15,093 | |
Credit Suisse Securities (USA) LLC/CME | | Receive | | | 3 Month USD LIBOR | | | | 1.912 | | | | February-2042 | | | | USD | | | | 2,343,000 | | | | 78,315 | |
Credit Suisse Securities (USA) LLC/CME | | Receive | | | 3 Month USD LIBOR | | | | 1.934 | | | | February-2042 | | | | USD | | | | 418,000 | | | | 12,068 | |
Credit Suisse Securities (USA) LLC/CME | | Receive | | | 3 Month USD LIBOR | | | | 2.318 | | | | September-2046 | | | | USD | | | | 554,000 | | | | (329 | ) |
Credit Suisse Securities (USA) LLC/CME | | Receive | | | 3 Month USD LIBOR | | | | 2.325 | | | | September-2046 | | | | USD | | | | 554,000 | | | | (755 | ) |
Credit Suisse Securities (USA) LLC/LCH | | Receive | | | 6 Month JPY LIBOR | | | | 0.698 | | | | September-2036 | | | | JPY | | | | 22,494,000 | | | | 1,562 | |
Credit Suisse Securities (USA) LLC/LCH | | Receive | | | 6 Month JPY LIBOR | | | | 0.465 | | | | September-2038 | | | | JPY | | | | 37,115,000 | | | | 3,756 | |
Credit Suisse Securities (USA) LLC/CME | | Pay | | | 6 Month AUD LIBOR | | | | 2.368 | | | | June-2026 | | | | AUD | | | | 4,470,111 | | | | (54,683 | ) |
Credit Suisse Securities (USA) LLC/CME | | Pay | | | 6 Month AUD LIBOR | | | | 2.397 | | | | June-2026 | | | | AUD | | | | 13,410,333 | | | | (151,091 | ) |
Credit Suisse Securities (USA) LLC/CME | | Pay | | | 6 Month AUD LIBOR | | | | 2.398 | | | | June-2026 | | | | AUD | | | | 22,350,556 | | | | (251,053 | ) |
Credit Suisse Securities (USA) LLC/CME | | Pay | | | 6 Month AUD LIBOR | | | | 2.361 | | | | September-2026 | | | | AUD | | | | 1,269,000 | | | | (16,644 | ) |
Credit Suisse Securities (USA) LLC/CME | | Pay | | | 6 Month AUD LIBOR | | | | 2.395 | | | | September-2026 | | | | AUD | | | | 868,000 | | | | (10,550 | ) |
Credit Suisse Securities (USA) LLC/CME | | Pay | | | 6 Month AUD LIBOR | | | | 2.533 | | | | September-2026 | | | | AUD | | | | 1,285,000 | | | | (9,742 | ) |
Credit Suisse Securities (USA) LLC/CME | | Pay | | | 6 Month EUR LIBOR | | | | 1.805 | | | | July-2029 | | | | EUR | | | | 700,000 | | | | 65,132 | |
Credit Suisse Securities (USA) LLC/CME | | Pay | | | 6 Month EUR LIBOR | | | | 1.881 | | | | July-2029 | | | | EUR | | | | 12,887,000 | | | | 1,307,847 | |
Credit Suisse Securities (USA) LLC/CME | | Pay | | | 6 Month EUR LIBOR | | | | 1.998 | | | | July-2029 | | | | EUR | | | | 1,368,000 | | | | 156,077 | |
Credit Suisse Securities (USA) LLC/CME | | Pay | | | 6 Month EUR LIBOR | | | | 1.770 | | | | September-2029 | | | | EUR | | | | 1,114,000 | | | | 97,007 | |
Credit Suisse Securities (USA) LLC/CME | | Pay | | | 6 Month EUR LIBOR | | | | 1.622 | | | | October-2029 | | | | EUR | | | | 1,262,000 | | | | 87,259 | |
Credit Suisse Securities (USA) LLC/CME | | Pay | | | 6 Month EUR LIBOR | | | | 1.693 | | | | October-2029 | | | | EUR | | | | 1,264,000 | | | | 97,850 | |
Credit Suisse Securities (USA) LLC/CME | | Pay | | | 6 Month EUR LIBOR | | | | 1.721 | | | | October-2029 | | | | EUR | | | | 1,002,000 | | | | 81,436 | |
Credit Suisse Securities (USA) LLC/CME | | Pay | | | 6 Month EUR LIBOR | | | | 1.760 | | | | November-2029 | | | | EUR | | | | 2,211,000 | | | | 183,800 | |
Credit Suisse Securities (USA) LLC/CME | | Pay | | | 6 Month EUR LIBOR | | | | 1.792 | | | | December-2029 | | | | EUR | | | | 4,531,000 | | | | 385,256 | |
Credit Suisse Securities (USA) LLC/CME | | Pay | | | 6 Month EUR LIBOR | | | | 1.808 | | | | December-2029 | | | | EUR | | | | 5,244,000 | | | | 457,193 | |
Credit Suisse Securities (USA) LLC/CME | | Pay | | | 6 Month EUR LIBOR | | | | 1.693 | | | | January-2030 | | | | EUR | | | | 2,626,000 | | | | 192,957 | |
Credit Suisse Securities (USA) LLC/CME | | Pay | | | 6 Month EUR LIBOR | | | | 1.265 | | | | March-2030 | | | | EUR | | | | 2,967,000 | | | | 74,275 | |
Credit Suisse Securities (USA) LLC/CME | | Pay | | | 6 Month EUR LIBOR | | | | 1.302 | | | | June-2030 | | | | EUR | | | | 1,875,000 | | | | 45,380 | |
See accompanying Notes to Consolidated Financial Statements which are an integral part of the financial statements.
20 Invesco Global Targeted Returns Fund
| | | | | | | | | | | | | | | | | | | | | | | | | | |
| Open Centrally Cleared Interest Rate Swap Agreements(k)—(continued) | |
| Counterparty/Clearinghouse | | Pay/Receive
Floating Rate | | Floating Rate Index | | | Fixed
Rate | | | Termination
Date | | | Notional
Value | | | Unrealized
Appreciation
(Depreciation) | |
Credit Suisse Securities (USA) LLC/CME | | Pay | | | 6 Month EUR LIBOR | | | | 0.874 | % | | | September-2030 | | | | EUR | | | | 1,976,000 | | | $ | (51,269 | ) |
Credit Suisse Securities (USA) LLC/CME | | Pay | | | 6 Month EUR LIBOR | | | | 0.973 | | | | September-2030 | | | | EUR | | | | 1,762,000 | | | | (26,948 | ) |
Credit Suisse Securities (USA) LLC/CME | | Pay | | | 6 Month EUR LIBOR | | | | 1.308 | | | | February-2050 | | | | EUR | | | | 1,272,000 | | | | 65,863 | |
Credit Suisse Securities (USA) LLC/CME | | Pay | | | 6 Month GBP LIBOR | | | | 1.219 | | | | September-2025 | | | | GBP | | | | 5,510,750 | | | | (58,275 | ) |
Credit Suisse Securities (USA) LLC/CME | | Pay | | | 6 Month GBP LIBOR | | | | 1.229 | | | | September-2025 | | | | GBP | | | | 2,755,375 | | | | (27,438 | ) |
Credit Suisse Securities (USA) LLC/CME | | Pay | | | 6 Month GBP LIBOR | | | | 1.248 | | | | September-2025 | | | | GBP | | | | 5,510,750 | | | | (48,566 | ) |
Credit Suisse Securities (USA) LLC/CME | | Pay | | | 6 Month GBP LIBOR | | | | 1.250 | | | | September-2025 | | | | GBP | | | | 1,663,874 | | | | (14,513 | ) |
Credit Suisse Securities (USA) LLC/CME | | Pay | | | 6 Month GBP LIBOR | | | | 1.327 | | | | September-2025 | | | | GBP | | | | 5,510,750 | | | | (23,182 | ) |
Credit Suisse Securities (USA) LLC/CME | | Pay | | | 6 Month GBP LIBOR | | | | 1.400 | | | | September-2025 | | | | GBP | | | | 3,169,764 | | | | 145 | |
Credit Suisse Securities (USA) LLC/CME | | Pay | | | 6 Month JPY LIBOR | | | | 0.265 | | | | May-2028 | | | | JPY | | | | 756,070,000 | | | | 65,597 | |
Credit Suisse Securities (USA) LLC/CME | | Pay | | | 6 Month JPY LIBOR | | | | 0.303 | | | | May-2028 | | | | JPY | | | | 391,950,000 | | | | 48,024 | |
Credit Suisse Securities (USA) LLC/CME | | Pay | | | 6 Month JPY LIBOR | | | | 0.310 | | | | May-2028 | | | | JPY | | | | 312,150,000 | | | | 40,465 | |
Credit Suisse Securities (USA) LLC/CME | | Pay | | | 6 Month JPY LIBOR | | | | 0.325 | | | | May-2028 | | | | JPY | | | | 1,085,400,000 | | | | 155,981 | |
Credit Suisse Securities (USA) LLC/CME | | Pay | | | 6 Month JPY LIBOR | | | | 0.000 | | | | June-2028 | | | | JPY | | | | 68,483,000 | | | | (11,842 | ) |
Credit Suisse Securities (USA) LLC/CME | | Pay | | | 6 Month JPY LIBOR | | | | 0.283 | | | | June-2028 | | | | JPY | | | | 128,087,000 | | | | 12,345 | |
Credit Suisse Securities (USA) LLC/CME | | Pay | | | 6 Month JPY LIBOR | | | | 0.100 | | | | September-2028 | | | | JPY | | | | 193,527,000 | | | | (18,046 | ) |
Credit Suisse Securities (USA) LLC/CME | | Pay | | | 3 Month SEK LIBOR | | | | 2.260 | | | | July-2025 | | | | SEK | | | | 17,000,000 | | | | 94,801 | |
Credit Suisse Securities (USA) LLC/CME | | Pay | | | 3 Month SEK LIBOR | | | | 2.305 | | | | July-2025 | | | | SEK | | | | 18,514,281 | | | | 108,812 | |
Credit Suisse Securities (USA) LLC/CME | | Pay | | | 3 Month SEK LIBOR | | | | 2.395 | | | | July-2025 | | | | SEK | | | | 16,680,000 | | | | 106,833 | |
Credit Suisse Securities (USA) LLC/CME | | Pay | | | 3 Month SEK LIBOR | | | | 2.476 | | | | July-2025 | | | | SEK | | | �� | 44,677,000 | | | | 307,021 | |
Credit Suisse Securities (USA) LLC/CME | | Pay | | | 3 Month SEK LIBOR | | | | 2.578 | | | | July-2025 | | | | SEK | | | | 14,724,719 | | | | 109,878 | |
Credit Suisse Securities (USA) LLC/CME | | Pay | | | 3 Month SEK LIBOR | | | | 2.236 | | | | September-2025 | | | | SEK | | | | 7,042,000 | | | | 36,412 | |
Credit Suisse Securities (USA) LLC/CME | | Pay | | | 3 Month SEK LIBOR | | | | 2.205 | | | | October-2025 | | | | SEK | | | | 8,526,000 | | | | 41,250 | |
Credit Suisse Securities (USA) LLC/CME | | Pay | | | 3 Month SEK LIBOR | | | | 2.265 | | | | October-2025 | | | | SEK | | | | 8,198,000 | | | | 42,880 | |
Credit Suisse Securities (USA) LLC/CME | | Pay | | | 3 Month SEK LIBOR | | | | 2.275 | | | | October-2025 | | | | SEK | | | | 10,606,000 | | | | 56,832 | |
Credit Suisse Securities (USA) LLC/CME | | Pay | | | 3 Month SEK LIBOR | | | | 2.373 | | | | November-2025 | | | | SEK | | | | 13,133,000 | | | | 74,359 | |
Credit Suisse Securities (USA) LLC/CME | | Pay | | | 3 Month SEK LIBOR | | | | 2.470 | | | | November-2025 | | | | SEK | | | | 14,717,000 | | | | 91,862 | |
Credit Suisse Securities (USA) LLC/CME | | Pay | | | 3 Month SEK LIBOR | | | | 2.534 | | | | December-2025 | | | | SEK | | | | 36,231,000 | | | | 234,626 | |
Credit Suisse Securities (USA) LLC/CME | | Pay | | | 3 Month SEK LIBOR | | | | 2.313 | | | | January-2026 | | | | SEK | | | | 21,817,000 | | | | 110,367 | |
Credit Suisse Securities (USA) LLC/CME | | Pay | | | 3 Month SEK LIBOR | | | | 2.655 | | | | January-2026 | | | | SEK | | | | 34,380,000 | | | | 243,562 | |
Credit Suisse Securities (USA) LLC/CME | | Pay | | | 3 Month SEK LIBOR | | | | 2.060 | | | | March-2026 | | | | SEK | | | | 11,083,000 | | | | 37,459 | |
Credit Suisse Securities (USA) LLC/CME | | Pay | | | 3 Month SEK LIBOR | | | | 1.327 | | | | June-2026 | | | | SEK | | | | 10,167,000 | | | | (12,998 | ) |
Credit Suisse Securities (USA) LLC/CME | | Pay | | | 3 Month SEK LIBOR | | | | 2.033 | | | | June-2026 | | | | SEK | | | | 15,348,000 | | | | 42,316 | |
Credit Suisse Securities (USA) LLC/CME | | Pay | | | 3 Month SEK LIBOR | | | | 2.053 | | | | June-2026 | | | | SEK | | | | 15,954,000 | | | | 45,839 | |
Credit Suisse Securities (USA) LLC/CME | | Pay | | | 3 Month SEK LIBOR | | | | 1.360 | | | | September-2026 | | | | SEK | | | | 15,350,000 | | | | (21,981 | ) |
Credit Suisse Securities (USA) LLC/CME | | Pay | | | 3 Month SEK LIBOR | | | | 1.560 | | | | September-2026 | | | | SEK | | | | 8,210,000 | | | | (2,543 | ) |
Credit Suisse Securities (USA) LLC/CME | | Pay | | | 3 Month USD LIBOR | | | | 1.710 | | | | November-2041 | | | | USD | | | | 989,000 | | | | (72,187 | ) |
Credit Suisse Securities (USA) LLC/CME | | Pay | | | 3 Month USD LIBOR | | | | 1.719 | | | | November-2041 | | | | USD | | | | 1,401,000 | | | | (99,655 | ) |
Credit Suisse Securities (USA) LLC/CME | | Pay | | | 3 Month USD LIBOR | | | | 1.720 | | | | November-2041 | | | | USD | | | | 5,768,200 | | | | (409,102 | ) |
Credit Suisse Securities (USA) LLC/CME | | Pay | | | 3 Month USD LIBOR | | | | 1.749 | | | | November-2041 | | | | USD | | | | 6,293,800 | | | | (409,205 | ) |
Credit Suisse Securities (USA) LLC/CME | | Pay | | | 3 Month USD LIBOR | | | | 2.446 | | | | March-2046 | | | | USD | | | | 9,708,571 | | | | 129,112 | |
Credit Suisse Securities (USA) LLC/CME | | Pay | | | 3 Month USD LIBOR | | | | 2.453 | | | | March-2046 | | | | USD | | | | 4,233,688 | | | | 59,055 | |
Credit Suisse Securities (USA) LLC/CME | | Pay | | | 3 Month USD LIBOR | | | | 2.474 | | | | March-2046 | | | | USD | | | | 4,590,741 | | | | 74,336 | |
Credit Suisse Securities (USA) LLC/CME | | Pay | | | 3 Month USD LIBOR | | | | 2.625 | | | | April-2046 | | | | USD | | | | 574,000 | | | | 18,294 | |
Credit Suisse Securities (USA) LLC/CME | | Pay | | | 3 Month USD LIBOR | | | | 2.510 | | | | June-2046 | | | | USD | | | | 491,000 | | | | 9,868 | |
Credit Suisse Securities (USA) LLC/CME | | Pay | | | 3 Month USD LIBOR | | | | 2.155 | | | | September-2046 | | | | USD | | | | 751,000 | | | | (12,068 | ) |
Credit Suisse Securities (USA) LLC/CME | | Pay | | | 3 Month USD LIBOR | | | | 2.163 | | | | September-2046 | | | | USD | | | | 1,123,000 | | | | (17,124 | ) |
Credit Suisse Securities (USA) LLC/LCH | | Pay | | | 6 Month JPY LIBOR | | | | 0.183 | | | | September-2028 | | | | JPY | | | | 74,792,000 | | | | (950 | ) |
Credit Suisse Securities (USA) LLC/LCH | | Pay | | | 6 Month JPY LIBOR | | | | 0.743 | | | | September-2036 | | | | JPY | | | | 217,955,000 | | | | (5,654 | ) |
Subtotal — Centrally Cleared Interest Rate Swap Agreements | | | $ | (599,504 | ) |
See accompanying Notes to Consolidated Financial Statements which are an integral part of the financial statements.
21 Invesco Global Targeted Returns Fund
Abbreviations:
| | |
| AUD | | – Australian Dollar |
| CME | | – Chicago Mercantile Exchange |
| EUR | | – Euro |
| | |
| GBP | | – British Pound Sterling |
| JPY | | – Japanese Yen |
| LCH | | – LCH Clearnet |
| | |
| LIBOR | | – London Interbank Offered Rate |
| SEK | | – Swedish Krona |
| USD | | – U.S. Dollar |
| (k) | Centrally cleared swap agreements collateralized by $4,862,974 cash held with Credit Suisse First Boston. |
| | | | | | | | | | | | | | | | | | | | | | | | |
| Open Over-The-Counter Inflation Swap Agreements(l) | |
| Counterparty | | Pay/Receive
Floating Rate | | Floating Rate Index | | Fixed
Rate | | | Termination
Date | | | Notional
Value | | | Unrealized
Appreciation
(Depreciation) | |
Barclays Bank PLC(c) | | Receive | | United Kingdom RPI | | | 3.032 | % | | | June-2021 | | | | GBP | | | | 1,294,000 | | | $ | 42,498 | |
Citigroup Global Markets Inc.(c) | | Receive | | United Kingdom RPI | | | 2.658 | | | | September-2020 | | | | GBP | | | | 840,423 | | | | 26,372 | |
Citigroup Global Markets Inc.(c) | | Receive | | United Kingdom RPI | | | 2.625 | | | | May-2021 | | | | GBP | | | | 1,018,000 | | | | 52,728 | |
Deutsche Bank Securities Inc.(c) | | Receive | | United Kingdom RPI | | | 2.720 | | | | January-2020 | | | | GBP | | | | 1,155,175 | | | | 3,604 | |
Deutsche Bank Securities Inc.(c) | | Receive | | United Kingdom RPI | | | 2.675 | | | | April-2020 | | | | GBP | | | | 1,817,000 | | | | 31,142 | |
Deutsche Bank Securities Inc.(c) | | Receive | | United Kingdom RPI | | | 2.740 | | | | April-2020 | | | | GBP | | | | 1,954,000 | | | | 24,942 | |
Deutsche Bank Securities Inc.(c) | | Receive | | United Kingdom RPI | | | 2.778 | | | | April-2020 | | | | GBP | | | | 1,105,000 | | | | 11,312 | |
Deutsche Bank Securities Inc.(c) | | Receive | | United Kingdom RPI | | | 2.612 | | | | October-2020 | | | | GBP | | | | 1,278,000 | | | | 42,714 | |
Deutsche Bank Securities Inc.(c) | | Receive | | United Kingdom RPI | | | 2.737 | | | | November-2020 | | | | GBP | | | | 1,261,000 | | | | 41,362 | |
Deutsche Bank Securities Inc.(c) | | Receive | | United Kingdom RPI | | | 2.745 | | | | January-2021 | | | | GBP | | | | 1,283,000 | | | | 46,124 | |
Deutsche Bank Securities Inc.(c) | | Receive | | United Kingdom RPI | | | 2.752 | | | | March-2021 | | | | GBP | | | | 1,166,000 | | | | 48,590 | |
Deutsche Bank Securities Inc.(c) | | Receive | | United Kingdom RPI | | | 2.978 | | | | July-2021 | | | | GBP | | | | 2,008,000 | | | | 76,974 | |
Goldman Sachs International(c) | | Receive | | United Kingdom RPI | | | 2.786 | | | | December-2020 | | | | GBP | | | | 3,450,000 | | | | 111,691 | |
Goldman Sachs International(c) | | Receive | | United Kingdom RPI | | | 2.708 | | | | March-2021 | | | | GBP | | | | 2,298,000 | | | | 102,599 | |
Morgan Stanley Capital Services LLC(c) | | Receive | | United Kingdom RPI | | | 2.690 | | | | February-2020 | | | | GBP | | | | 11,857,170 | | | | 98,898 | |
Morgan Stanley Capital Services LLC(c) | | Receive | | United Kingdom RPI | | | 3.015 | | | | July-2020 | | | | GBP | | | | 830,852 | | | | 5,115 | |
Morgan Stanley Capital Services LLC(c) | | Receive | | United Kingdom RPI | | | 2.720 | | | | September-2020 | | | | GBP | | | | 1,642,000 | | | | 44,642 | |
Morgan Stanley Capital Services LLC(c) | | Receive | | United Kingdom RPI | | | 2.790 | | | | November-2020 | | | | GBP | | | | 1,393,000 | | | | 40,738 | |
Morgan Stanley Capital Services LLC(c) | | Receive | | United Kingdom RPI | | | 2.628 | | | | January-2021 | | | | GBP | | | | 1,676,000 | | | | 73,363 | |
Morgan Stanley Capital Services LLC(c) | | Receive | | United Kingdom RPI | | | 3.050 | | | | September-2021 | | | | GBP | | | | 1,007,000 | | | | 28,145 | |
Morgan Stanley Capital Services LLC(c) | | Receive | | United Kingdom RPI | | | 3.200 | | | | October-2021 | | | | GBP | | | | 2,373,000 | | | | 43,059 | |
Morgan Stanley Capital Services LLC(c) | | Receive | | United Kingdom RPI | | | 3.245 | | | | September-2025 | | | | GBP | | | | 4,245,130 | | | | 71,994 | |
Morgan Stanley Capital Services LLC(c) | | Receive | | United Kingdom RPI | | | 3.271 | | | | September-2025 | | | | GBP | | | | 4,245,130 | | | | 55,206 | |
Morgan Stanley Capital Services LLC(c) | | Receive | | United Kingdom RPI | | | 3.285 | | | | September-2025 | | | | GBP | | | | 4,245,130 | | | | 45,989 | |
Morgan Stanley Capital Services LLC(c) | | Receive | | United Kingdom RPI | | | 3.294 | | | | September-2025 | | | | GBP | | | | 2,122,565 | | | | 20,081 | |
Morgan Stanley Capital Services LLC(c) | | Receive | | United Kingdom RPI | | | 3.319 | | | | September-2025 | | | | GBP | | | | 2,122,565 | | | | 11,976 | |
Morgan Stanley Capital Services LLC(c) | | Receive | | United Kingdom RPI | | | 3.364 | | | | September-2025 | | | | GBP | | | | 4,245,100 | | | | (5,316 | ) |
Barclays Bank PLC(c) | | Receive | | United States CPI Urban Consumers NSA | | | 1.955 | | | | October-2026 | | | | USD | | | | 1,314,000 | | | | 11,567 | |
Barclays Bank PLC(c) | | Receive | | United States CPI Urban Consumers NSA | | | 1.960 | | | | October-2026 | | | | USD | | | | 1,314,000 | | | | 10,882 | |
Barclays Bank PLC(c) | | Receive | | United States CPI Urban Consumers NSA | | | 1.993 | | | | October-2026 | | | | USD | | | | 1,288,000 | | | | 6,405 | |
Barclays Bank PLC(c) | | Receive | | United States CPI Urban Consumers NSA | | | 1.995 | | | | October-2026 | | | | USD | | | | 2,628,000 | | | | 12,414 | |
Barclays Bank PLC(c) | | Receive | | United States CPI Urban Consumers NSA | | | 2.000 | | | | October-2026 | | | | USD | | | | 1,288,000 | | | | 5,329 | |
Barclays Bank PLC(c) | | Receive | | United States CPI Urban Consumers NSA | | | 2.010 | | | | October-2026 | | | | USD | | | | 2,628,000 | | | | 8,230 | |
Goldman Sachs International(c) | | Receive | | United States CPI Urban Consumers NSA | | | 2.040 | | | | November-2026 | | | | USD | | | | 1,320,000 | | | | 394 | |
Morgan Stanley Capital Services LLC(c) | | Receive | | United States CPI Urban Consumers NSA | | | 2.048 | | | | November-2026 | | | | USD | | | | 1,299,000 | | | | (633 | ) |
Barclays Bank PLC(c) | | Pay | | United Kingdom RPI | | | 3.106 | | | | June-2026 | | | | GBP | | | | 1,294,000 | | | | (87,271 | ) |
Citigroup Global Markets Inc.(c) | | Pay | | United Kingdom RPI | | | 2.949 | | | | September-2025 | | | | GBP | | | | 840,423 | | | | (51,562 | ) |
Citigroup Global Markets Inc.(c) | | Pay | | United Kingdom RPI | | | 2.801 | | | | May-2026 | | | | GBP | | | | 1,018,000 | | | | (105,016 | ) |
Deutsche Bank Securities Inc.(c) | | Pay | | United Kingdom RPI | | | 2.932 | | | | January-2025 | | | | GBP | | | | 1,155,175 | | | | (43,540 | ) |
Deutsche Bank Securities Inc.(c) | | Pay | | United Kingdom RPI | | | 2.900 | | | | April-2025 | | | | GBP | | | | 1,817,000 | | | | (99,287 | ) |
Deutsche Bank Securities Inc.(c) | | Pay | | United Kingdom RPI | | | 2.965 | | | | April-2025 | | | | GBP | | | | 1,954,000 | | | | (87,824 | ) |
Deutsche Bank Securities Inc.(c) | | Pay | | United Kingdom RPI | | | 3.000 | | | | April-2025 | | | | GBP | | | | 1,105,000 | | | | (43,875 | ) |
Deutsche Bank Securities Inc.(c) | | Pay | | United Kingdom RPI | | | 2.926 | | | | October-2025 | | | | GBP | | | | 1,278,000 | | | | (81,117 | ) |
Deutsche Bank Securities Inc.(c) | | Pay | | United Kingdom RPI | | | 3.044 | | | | November-2025 | | | | GBP | | | | 1,261,000 | | | | (68,778 | ) |
See accompanying Notes to Consolidated Financial Statements which are an integral part of the financial statements.
22 Invesco Global Targeted Returns Fund
| | | | | | | | | | | | | | | | | | | | | | | | |
| Open Over-The-Counter Inflation Swap Agreements(l)—(continued) | |
| Counterparty | | Pay/Receive
Floating Rate | | Floating Rate Index | | Fixed
Rate | | | Termination
Date | | | Notional
Value | | | Unrealized
Appreciation
(Depreciation) | |
Deutsche Bank Securities Inc.(c) | | Pay | | United Kingdom RPI | | | 3.020 | % | | | January-2026 | | | | GBP | | | | 1,283,000 | | | $ | (79,838 | ) |
Deutsche Bank Securities Inc.(c) | | Pay | | United Kingdom RPI | | | 2.997 | | | | March-2026 | | | | GBP | | | | 1,166,000 | | | | (84,543 | ) |
Deutsche Bank Securities Inc.(c) | | Pay | | United Kingdom RPI | | | 2.993 | | | | July-2026 | | | | GBP | | | | 2,008,000 | | | | (172,821 | ) |
Goldman Sachs International(c) | | Pay | | United Kingdom RPI | | | 3.060 | | | | December-2025 | | | | GBP | | | | 3,450,000 | | | | (190,972 | ) |
Goldman Sachs International(c) | | Pay | | United Kingdom RPI | | | 2.964 | | | | March-2026 | | | | GBP | | | | 2,298,000 | | | | (177,876 | ) |
Morgan Stanley Capital Services LLC(c) | | Pay | | United Kingdom RPI | | | 3.021 | | | | September-2020 | | | | GBP | | | | 8,541,324 | | | | (58,951 | ) |
Morgan Stanley Capital Services LLC(c) | | Pay | | United Kingdom RPI | | | 3.028 | | | | September-2020 | | | | GBP | | | | 8,541,324 | | | | (54,601 | ) |
Morgan Stanley Capital Services LLC(c) | | Pay | | United Kingdom RPI | | | 3.054 | | | | September-2020 | | | | GBP | | | | 4,270,662 | | | | (19,754 | ) |
Morgan Stanley Capital Services LLC(c) | | Pay | | United Kingdom RPI | | | 3.058 | | | | September-2020 | | | | GBP | | | | 4,270,662 | | | | (18,592 | ) |
Morgan Stanley Capital Services LLC(c) | | Pay | | United Kingdom RPI | | | 3.066 | | | | September-2020 | | | | GBP | | | | 8,541,324 | | | | (32,828 | ) |
Morgan Stanley Capital Services LLC(c) | | Pay | | United Kingdom RPI | | | 3.113 | | | | September-2020 | | | | GBP | | | | 8,541,324 | | | | (5,204 | ) |
Morgan Stanley Capital Services LLC(c) | | Pay | | United Kingdom RPI | | | 2.923 | | | | February-2025 | | | | GBP | | | | 11,857,170 | | | | (504,682 | ) |
Morgan Stanley Capital Services LLC(c) | | Pay | | United Kingdom RPI | | | 3.250 | | | | July-2025 | | | | GBP | | | | 830,852 | | | | (12,412 | ) |
Morgan Stanley Capital Services LLC(c) | | Pay | | United Kingdom RPI | | | 3.010 | | | | September-2025 | | | | GBP | | | | 1,642,000 | | | | (85,787 | ) |
Morgan Stanley Capital Services LLC(c) | | Pay | | United Kingdom RPI | | | 3.095 | | | | November-2025 | | | | GBP | | | | 1,393,000 | | | | (65,398 | ) |
Morgan Stanley Capital Services LLC(c) | | Pay | | United Kingdom RPI | | | 2.920 | | | | January-2026 | | | | GBP | | | | 1,676,000 | | | | (129,024 | ) |
Morgan Stanley Capital Services LLC(c) | | Pay | | United Kingdom RPI | | | 3.145 | | | | September-2026 | | | | GBP | | | | 1,007,000 | | | | (57,936 | ) |
Morgan Stanley Capital Services LLC(c) | | Pay | | United Kingdom RPI | | | 3.303 | | | | October-2026 | | | | GBP | | | | 2,373,000 | | | | (81,631 | ) |
Subtotal — Over-The-Counter Inflation Swap Agreements | | | $ | (1,249,990 | ) |
Total Interest Rate and Inflation Swap Agreements — Interest Rate Risk | | | | | | | | | | | | | | | $ | (1,849,494 | ) |
Abbreviations:
| | |
| CPI | | – Consumer Price Index |
| GBP | | – British Pound Sterling |
| | |
| NSA | | – Non-Seasonally Adjusted |
| RPI | | – Retail Price Index |
| (c) | The investment is owned by the Subsidiary. See Note 5. |
| (l) | Inflation swap agreements collateralized by $1,060,000 cash held with Deutsche Bank Securities Inc., Goldman Sachs International and Morgan Stanley Capital Services, LLC. |
| | | | | | | | | | | | | | | | | | | | | | | | | | |
| Open Over-The-Counter Variance Swap Agreements | |
| Counterparty | | Reference Entity | | Pay/Receive
Variance | | | Volatility
Strike Rate | | | Expiration
Date | | | | | | Notional
Value | | | Unrealized
Appreciation
(Depreciation) | |
Goldman Sachs International | | Hang Seng China Enterprise Index | | | Pay | | | | 37.00 | % | | | December-2016 | | | | HKD | | | | 133,500 | | | $ | 183,094 | |
Goldman Sachs International | | Hang Seng China Enterprise Index | | | Pay | | | | 41.05 | | | | December-2016 | | | | HKD | | | | 72,277 | | | | 132,482 | |
Goldman Sachs International | | Hang Seng China Enterprise Index | | | Pay | | | | 45.00 | | | | December-2016 | | | | HKD | | | | 146,000 | | | | 300,211 | |
HSBC New York | | Hang Seng China Enterprise Index | | | Pay | | | | 42.75 | | | | December-2016 | | | | HKD | | | | 54,382 | | | | 102,148 | |
HSBC New York | | Hang Seng China Enterprise Index | | | Pay | | | | 43.00 | | | | December-2016 | | | | HKD | | | | 109,500 | | | | 208,001 | |
Morgan Stanley Capital Services LLC | | Hang Seng China Enterprise Index | | | Pay | | | | 38.10 | | | | December-2016 | | | | HKD | | | | 58,713 | | | | 89,966 | |
Morgan Stanley Capital Services LLC | | Hang Seng China Enterprise Index | | | Pay | | | | 39.25 | | | | December-2016 | | | | HKD | | | | 96,948 | | | | 162,311 | |
Societe Generale | | Hang Seng China Enterprise Index | | | Pay | | | | 35.50 | | | | December-2016 | | | | HKD | | | | 92,000 | | | | 113,659 | |
Societe Generale | | Hang Seng China Enterprise Index | | | Pay | | | | 35.60 | | | | December-2016 | | | | HKD | | | | 133,500 | | | | 165,730 | |
Societe Generale | | Hang Seng China Enterprise Index | | | Pay | | | | 36.30 | | | | December-2016 | | | | HKD | | | | 138,905 | | | | 202,820 | |
Societe Generale | | Hang Seng China Enterprise Index | | | Pay | | | | 37.20 | | | | December-2016 | | | | HKD | | | | 64,050 | | | | 92,998 | |
Societe Generale | | Hang Seng China Enterprise Index | | | Pay | | | | 39.25 | | | | December-2016 | | | | HKD | | | | 39,942 | | | | 66,871 | |
Societe Generale | | Hang Seng China Enterprise Index | | | Pay | | | | 40.00 | | | | December-2016 | | | | HKD | | | | 64,613 | | | | 112,684 | |
Societe Generale | | Hang Seng China Enterprise Index | | | Pay | | | | 41.40 | | | | December-2016 | | | | HKD | | | | 54,000 | | | | 94,565 | |
Goldman Sachs International | | Hang Seng Index | | | Pay | | | | 33.00 | | | | December-2016 | | | | HKD | | | | 146,000 | | | | 196,563 | |
Morgan Stanley Capital Services LLC | | Hang Seng Index | | | Pay | | | | 30.60 | | | | December-2016 | | | | HKD | | | | 42,700 | | | | 51,147 | |
Societe Generale | | Hang Seng Index | | | Pay | | | | 28.50 | | | | December-2016 | | | | HKD | | | | 83,000 | | | | 78,728 | |
Societe Generale | | Hang Seng Index | | | Pay | | | | 32.50 | | | | December-2016 | | | | HKD | | | | 64,000 | | | | 83,469 | |
BNP Paribas S.A. | | S&P 500 Index | | | Pay | | | | 19.95 | | | | December-2016 | | | | USD | | | | 7,466 | | | | 44,626 | |
BNP Paribas S.A. | | S&P 500 Index | | | Pay | | | | 20.50 | | | | December-2016 | | | | USD | | | | 19,187 | | | | 117,190 | |
See accompanying Notes to Consolidated Financial Statements which are an integral part of the financial statements.
23 Invesco Global Targeted Returns Fund
| | | | | | | | | | | | | | | | | | | | | | | | | | |
| Open Over-The-Counter Variance Swap Agreements—(continued) | |
| Counterparty | | Reference Entity | | Pay/Receive
Variance | | | Volatility
Strike Rate | | | Expiration
Date | | | | | | Notional
Value | | | Unrealized
Appreciation
(Depreciation) | |
Goldman Sachs International | | S&P 500 Index | | | Pay | | | | 19.90 | % | | | December-2016 | | | | USD | | | | 13,845 | | | $ | 54,994 | |
Goldman Sachs International | | S&P 500 Index | | | Pay | | | | 20.10 | | | | December-2016 | | | | USD | | | | 43,000 | | | | 178,284 | |
Goldman Sachs International | | S&P 500 Index | | | Pay | | | | 20.50 | | | | December-2017 | | | | USD | | | | 9,024 | | | | 3,124 | |
Goldman Sachs International | | S&P 500 Index | | | Pay | | | | 20.60 | | | | December-2017 | | | | USD | | | | 8,661 | | | | 6,939 | |
Goldman Sachs International | | S&P 500 Index | | | Pay | | | | 21.05 | | | | December-2016 | | | | USD | | | | 5,274 | | | | 29,964 | |
Goldman Sachs International | | S&P 500 Index | | | Pay | | | | 21.15 | | | | December-2017 | | | | USD | | | | 5,408 | | | | 8,997 | |
Goldman Sachs International | | S&P 500 Index | | | Pay | | | | 21.80 | | | | December-2016 | | | | USD | | | | 3,737 | | | | 22,689 | |
Goldman Sachs International | | S&P 500 Index | | | Pay | | | | 21.90 | | | | December-2016 | | | | USD | | | | 9,173 | | | | 56,210 | |
HSBC New York | | S&P 500 Index | | | Pay | | | | 18.75 | | | | December-2016 | | | | USD | | | | 28,000 | | | | 74,892 | |
HSBC New York | | S&P 500 Index | | | Pay | | | | 20.15 | | | | December-2016 | | | | USD | | | | 15,400 | | | | 62,762 | |
HSBC New York | | S&P 500 Index | | | Pay | | | | 20.25 | | | | December-2016 | | | | USD | | | | 27,630 | | | | 116,197 | |
HSBC New York | | S&P 500 Index | | | Pay | | | | 21.50 | | | | December-2016 | | | | USD | | | | 3,956 | | | | 23,766 | |
J.P. Morgan Chase Bank, N.A. | | S&P 500 Index | | | Pay | | | | 18.80 | | | | December-2016 | | | | USD | | | | 7,562 | | | | 34,406 | |
J.P. Morgan Chase Bank, N.A. | | S&P 500 Index | | | Pay | | | | 19.07 | | | | December-2016 | | | | USD | | | | 7,226 | | | | 41,219 | |
J.P. Morgan Chase Bank, N.A. | | S&P 500 Index | | | Pay | | | | 19.12 | | | | December-2016 | | | | USD | | | | 19,270 | | | | 110,596 | |
J.P. Morgan Chase Bank, N.A. | | S&P 500 Index | | | Pay | | | | 19.13 | | | | December-2016 | | | | USD | | | | 4,889 | | | | 24,914 | |
J.P. Morgan Chase Bank, N.A. | | S&P 500 Index | | | Pay | | | | 19.38 | | | | December-2016 | | | | USD | | | | 9,946 | | | | 53,826 | |
J.P. Morgan Chase Bank, N.A. | | S&P 500 Index | | | Pay | | | | 19.41 | | | | December-2016 | | | | USD | | | | 3,729 | | | | 20,262 | |
J.P. Morgan Chase Bank, N.A. | | S&P 500 Index | | | Pay | | | | 19.67 | | | | December-2016 | | | | USD | | | | 2,799 | | | | 16,179 | |
J.P. Morgan Chase Bank, N.A. | | S&P 500 Index | | | Pay | | | | 20.09 | | | | December-2017 | | | | USD | | | | 4,958 | | | | 2,727 | |
J.P. Morgan Chase Bank, N.A. | | S&P 500 Index | | | Pay | | | | 20.20 | | | | December-2017 | | | | USD | | | | 15,837 | | | | (4,205 | ) |
J.P. Morgan Chase Bank, N.A. | | S&P 500 Index | | | Pay | | | | 20.36 | | | | December-2017 | | | | USD | | | | 19,225 | | | | (9,789 | ) |
J.P. Morgan Chase Bank, N.A. | | S&P 500 Index | | | Pay | | | | 20.60 | | | | December-2017 | | | | USD | | | | 11,548 | | | | 9,252 | |
J.P. Morgan Chase Bank, N.A. | | S&P 500 Index | | | Pay | | | | 20.65 | | | | December-2017 | | | | USD | | | | 9,155 | | | | 3,902 | |
J.P. Morgan Chase Bank, N.A. | | S&P 500 Index | | | Pay | | | | 20.73 | | | | December-2017 | | | | USD | | | | 8,762 | | | | 5,972 | |
J.P. Morgan Chase Bank, N.A. | | S&P 500 Index | | | Pay | | | | 20.79 | | | | December-2017 | | | | USD | | | | 11,417 | | | | 17,637 | |
J.P. Morgan Chase Bank, N.A. | | S&P 500 Index | | | Pay | | | | 21.15 | | | | December-2016 | | | | USD | | | | 6,017 | | | | 41,775 | |
J.P. Morgan Chase Bank, N.A. | | S&P 500 Index | | | Pay | | | | 21.25 | | | | December-2017 | | | | USD | | | | 14,422 | | | | 25,308 | |
Morgan Stanley Capital Services LLC | | S&P 500 Index | | | Pay | | | | 21.15 | | | | December-2016 | | | | USD | | | | 4,856 | | | | 27,090 | |
Morgan Stanley Capital Services LLC | | S&P 500 Index | | | Pay | | | | 24.58 | | | | December-2017 | | | | USD | | | | 17,827 | | | | 100,447 | |
Societe Generale | | S&P 500 Index | | | Pay | | | | 16.35 | | | | December-2016 | | | | USD | | | | 27,359 | | | | 100,320 | |
Societe Generale | | S&P 500 Index | | | Pay | | | | 18.30 | | | | December-2016 | | | | USD | | | | 19,266 | | | | 85,187 | |
Societe Generale | | S&P 500 Index | | | Pay | | | | 18.40 | | | | December-2016 | | | | USD | | | | 11,528 | | | | 55,195 | |
Societe Generale | | S&P 500 Index | | | Pay | | | | 19.80 | | | | December-2016 | | | | USD | | | | 2,794 | | | | 15,596 | |
Societe Generale | | S&P 500 Index | | | Pay | | | | 19.85 | | | | December-2016 | | | | USD | | | | 8,910 | | | | 32,610 | |
Societe Generale | | S&P 500 Index | | | Pay | | | | 20.15 | | | | December-2017 | | | | USD | | | | 10,986 | | | | (7,955 | ) |
Societe Generale | | S&P 500 Index | | | Pay | | | | 20.20 | | | | December-2017 | | | | USD | | | | 11,548 | | | | 4,804 | |
Societe Generale | | S&P 500 Index | | | Pay | | | | 20.25 | | | | December-2016 | | | | USD | | | | 13,733 | | | | 85,764 | |
Societe Generale | | S&P 500 Index | | | Pay | | | | 20.30 | | | | December-2016 | | | | USD | | | | 7,599 | | | | 48,231 | |
Societe Generale | | S&P 500 Index | | | Pay | | | | 20.30 | | | | December-2017 | | | | USD | | | | 16,022 | | | | 1,332 | |
Societe Generale | | S&P 500 Index | | | Pay | | | | 20.45 | | | | December-2017 | | | | USD | | | | 15,792 | | | | 4,695 | |
Societe Generale | | S&P 500 Index | | | Pay | | | | 20.60 | | | | December-2016 | | | | USD | | | | 13,052 | | | | 64,895 | |
Societe Generale | | S&P 500 Index | | | Pay | | | | 20.65 | | | | December-2017 | | | | USD | | | | 6,524 | | | | 9,237 | |
Societe Generale | | S&P 500 Index | | | Pay | | | | 20.75 | | | | December-2017 | | | | USD | | | | 3,410 | | | | 179 | |
Societe Generale | | S&P 500 Index | | | Pay | | | | 20.90 | | | | December-2017 | | | | USD | | | | 5,007 | | | | 4,078 | |
Societe Generale | | S&P 500 Index | | | Pay | | | | 21.00 | | | | December-2016 | | | | USD | | | | 33,104 | | | | 220,519 | |
Societe Generale | | S&P 500 Index | | | Pay | | | | 21.10 | | | | December-2016 | | | | USD | | | | 9,864 | | | | 55,158 | |
Societe Generale | | S&P 500 Index | | | Pay | | | | 21.20 | | | | December-2017 | | | | USD | | | | 12,125 | | | | 10,846 | |
Societe Generale | | S&P 500 Index | | | Pay | | | | 21.60 | | | | December-2016 | | | | USD | | | | 5,242 | | | | 30,985 | |
Societe Generale | | S&P 500 Index | | | Pay | | | | 21.80 | | | | December-2016 | | | | USD | | | | 28,853 | | | | 177,347 | |
See accompanying Notes to Consolidated Financial Statements which are an integral part of the financial statements.
24 Invesco Global Targeted Returns Fund
| | | | | | | | | | | | | | | | | | | | | | | | | | |
| Open Over-The-Counter Variance Swap Agreements—(continued) | |
| Counterparty | | Reference Entity | | Pay/Receive
Variance | | | Volatility
Strike Rate | | | Expiration
Date | | | | | | Notional
Value | | | Unrealized
Appreciation
(Depreciation) | |
Societe Generale | | S&P 500 Index | | | Pay | | | | 22.30 | % | | | December-2016 | | | | USD | | | | 17,168 | | | $ | 113,540 | |
Societe Generale | | S&P 500 Index | | | Pay | | | | 23.60 | | | | December-2016 | | | | USD | | | | 13,459 | | | | 114,055 | |
Societe Generale | | S&P 500 Index | | | Pay | | | | 24.30 | | | | December-2016 | | | | USD | | | | 11,543 | | | | 99,493 | |
BNP Paribas S.A. | | Hang Seng China Enterprise Index | | | Receive | | | | 33.30 | | | | December-2016 | | | | HKD | | | | 34,219 | | | | (46,988 | ) |
BNP Paribas S.A. | | Hang Seng China Enterprise Index | | | Receive | | | | 34.67 | | | | December-2017 | | | | HKD | | | | 27,121 | | | | (13,382 | ) |
Goldman Sachs International | | Hang Seng China Enterprise Index | | | Receive | | | | 28.85 | | | | December-2016 | | | | HKD | | | | 38,135 | | | | (21,357 | ) |
Goldman Sachs International | | Hang Seng China Enterprise Index | | | Receive | | | | 29.65 | | | | December-2016 | | | | HKD | | | | 64,185 | | | | (41,505 | ) |
Goldman Sachs International | | Hang Seng China Enterprise Index | | | Receive | | | | 29.65 | | | | December-2017 | | | | HKD | | | | 33,595 | | | | (6,234 | ) |
Goldman Sachs International | | Hang Seng China Enterprise Index | | | Receive | | | | 30.05 | | | | December-2016 | | | | HKD | | | | 9,837 | | | | (4,925 | ) |
Goldman Sachs International | | Hang Seng China Enterprise Index | | | Receive | | | | 30.20 | | | | December-2016 | | | | HKD | | | | 167,000 | | | | (86,990 | ) |
Goldman Sachs International | | Hang Seng China Enterprise Index | | | Receive | | | | 30.20 | | | | December-2017 | | | | HKD | | | | 38,165 | | | | (8,293 | ) |
Goldman Sachs International | | Hang Seng China Enterprise Index | | | Receive | | | | 30.45 | | | | December-2016 | | | | HKD | | | | 87,000 | | | | (63,633 | ) |
Goldman Sachs International | | Hang Seng China Enterprise Index | | | Receive | | | | 30.70 | | | | December-2016 | | | | HKD | | | | 29,869 | | | | (22,627 | ) |
Goldman Sachs International | | Hang Seng China Enterprise Index | | | Receive | | | | 30.85 | | | | December-2017 | | | | HKD | | | | 24,602 | | | | (8,508 | ) |
Goldman Sachs International | | Hang Seng China Enterprise Index | | | Receive | | | | 30.97 | | | | December-2016 | | | | HKD | | | | 65,100 | | | | (51,143 | ) |
Goldman Sachs International | | Hang Seng China Enterprise Index | | | Receive | | | | 30.98 | | | | December-2016 | | | | HKD | | | | 72,579 | | | | (57,093 | ) |
Goldman Sachs International | | Hang Seng China Enterprise Index | | | Receive | | | | 31.70 | | | | December-2016 | | | | HKD | | | | 21,615 | | | | (18,600 | ) |
Goldman Sachs International | | Hang Seng China Enterprise Index | | | Receive | | | | 31.80 | | | | December-2016 | | | | HKD | | | | 10,533 | | | | (9,683 | ) |
Goldman Sachs International | | Hang Seng China Enterprise Index | | | Receive | | | | 32.40 | | | | December-2016 | | | | HKD | | | | 28,607 | | | | (26,638 | ) |
Goldman Sachs International | | Hang Seng China Enterprise Index | | | Receive | | | | 34.93 | | | | December-2017 | | | | HKD | | | | 15,094 | | | | (7,894 | ) |
Goldman Sachs International | | Hang Seng China Enterprise Index | | | Receive | | | | 35.59 | | | | December-2017 | | | | HKD | | | | 100,975 | | | | (60,288 | ) |
Goldman Sachs International | | Hang Seng China Enterprise Index | | | Receive | | | | 35.90 | | | | December-2017 | | | | HKD | | | | 27,237 | | | | (17,199 | ) |
HSBC New York | | Hang Seng China Enterprise Index | | | Receive | | | | 28.33 | | | | December-2016 | | | | HKD | | | | 89,000 | | | | (37,121 | ) |
HSBC New York | | Hang Seng China Enterprise Index | | | Receive | | | | 29.00 | | | | December-2016 | | | | HKD | | | | 38,135 | | | | (21,982 | ) |
HSBC New York | | Hang Seng China Enterprise Index | | | Receive | | | | 30.25 | | | | December-2016 | | | | HKD | | | | 134,000 | | | | (69,706 | ) |
HSBC New York | | Hang Seng China Enterprise Index | | | Receive | | | | 30.40 | | | | December-2016 | | | | HKD | | | | 59,722 | | | | (32,550 | ) |
HSBC New York | | Hang Seng China Enterprise Index | | | Receive | | | | 30.50 | | | | December-2016 | | | | HKD | | | | 44,512 | | | | (32,790 | ) |
HSBC New York | | Hang Seng China Enterprise Index | | | Receive | | | | 42.60 | | | | December-2017 | | | | HKD | | | | 54,382 | | | | (71,963 | ) |
J.P. Morgan Chase Bank, N.A. | | Hang Seng China Enterprise Index | | | Receive | | | | 28.55 | | | | December-2016 | | | | HKD | | | | 51,393 | | | | (48,250 | ) |
J.P. Morgan Chase Bank, N.A. | | Hang Seng China Enterprise Index | | | Receive | | | | 28.78 | | | | December-2016 | | | | HKD | | | | 48,926 | | | | (45,489 | ) |
J.P. Morgan Chase Bank, N.A. | | Hang Seng China Enterprise Index | | | Receive | | | | 30.09 | | | | December-2017 | | | | HKD | | | | 111,934 | | | | (12,123 | ) |
J.P. Morgan Chase Bank, N.A. | | Hang Seng China Enterprise Index | | | Receive | | | | 30.50 | | | | December-2017 | | | | HKD | | | | 42,751 | | | | (14,239 | ) |
J.P. Morgan Chase Bank, N.A. | | Hang Seng China Enterprise Index | | | Receive | | | | 30.52 | | | | December-2016 | | | | HKD | | | | 32,546 | | | | (36,553 | ) |
J.P. Morgan Chase Bank, N.A. | | Hang Seng China Enterprise Index | | | Receive | | | | 30.63 | | | | December-2017 | | | | HKD | | | | 27,067 | | | | (8,953 | ) |
J.P. Morgan Chase Bank, N.A. | | Hang Seng China Enterprise Index | | | Receive | | | | 31.29 | | | | December-2017 | | | | HKD | | | | 25,465 | | | | (2,296 | ) |
J.P. Morgan Chase Bank, N.A. | | Hang Seng China Enterprise Index | | | Receive | | | | 31.45 | | | | December-2017 | | | | HKD | | | | 62,123 | | | | (6,843 | ) |
J.P. Morgan Chase Bank, N.A. | | Hang Seng China Enterprise Index | | | Receive | | | | 31.64 | | | | December-2017 | | | | HKD | | | | 39,789 | | | | (5,323 | ) |
J.P. Morgan Chase Bank, N.A. | | Hang Seng China Enterprise Index | | | Receive | | | | 32.80 | | | | December-2016 | | | | HKD | | | | 24,923 | | | | (33,540 | ) |
J.P. Morgan Chase Bank, N.A. | | Hang Seng China Enterprise Index | | | Receive | | | | 33.06 | | | | December-2016 | | | | HKD | | | | 21,708 | | | | (29,254 | ) |
J.P. Morgan Chase Bank, N.A. | | Hang Seng China Enterprise Index | | | Receive | | | | 33.75 | | | | December-2016 | | | | HKD | | | | 31,835 | | | | (44,291 | ) |
J.P. Morgan Chase Bank, N.A. | | Hang Seng China Enterprise Index | | | Receive | | | | 34.19 | | | | December-2017 | | | | HKD | | | | 11,861 | | | | (5,200 | ) |
J.P. Morgan Chase Bank, N.A. | | Hang Seng China Enterprise Index | | | Receive | | | | 34.29 | | | | December-2017 | | | | HKD | | | | 33,920 | | | | (15,262 | ) |
J.P. Morgan Chase Bank, N.A. | | Hang Seng China Enterprise Index | | | Receive | | | | 35.24 | | | | December-2017 | | | | HKD | | | | 15,305 | | | | (8,539 | ) |
Morgan Stanley Capital Services LLC | | Hang Seng China Enterprise Index | | | Receive | | | | 31.80 | | | | December-2016 | | | | HKD | | | | 42,010 | | | | (38,827 | ) |
Morgan Stanley Capital Services LLC | | Hang Seng China Enterprise Index | | | Receive | | | | 32.25 | | | | December-2017 | | | | HKD | | | | 10,902 | | | | (2,275 | ) |
Morgan Stanley Capital Services LLC | | Hang Seng China Enterprise Index | | | Receive | | | | 34.80 | | | | December-2017 | | | | HKD | | | | 52,850 | | | | (26,859 | ) |
Societe Generale | | Hang Seng China Enterprise Index | | | Receive | | | | 27.25 | | | | December-2016 | | | | HKD | | | | 33,882 | | | | (27,854 | ) |
Societe Generale | | Hang Seng China Enterprise Index | | | Receive | | | | 28.50 | | | | December-2016 | | | | HKD | | | | 10,000 | | | | (4,459 | ) |
Societe Generale | | Hang Seng China Enterprise Index | | | Receive | | | | 29.15 | | | | December-2016 | | | | HKD | | | | 31,784 | | | | (18,839 | ) |
Societe Generale | | Hang Seng China Enterprise Index | | | Receive | | | | 29.30 | | | | December-2016 | | | | HKD | | | | 76,488 | | | | (40,254 | ) |
See accompanying Notes to Consolidated Financial Statements which are an integral part of the financial statements.
25 Invesco Global Targeted Returns Fund
| | | | | | | | | | | | | | | | | | | | | | | | | | |
| Open Over-The-Counter Variance Swap Agreements—(continued) | |
| Counterparty | | Reference Entity | | Pay/Receive
Variance | | | Volatility
Strike Rate | | | Expiration
Date | | | | | | Notional
Value | | | Unrealized
Appreciation
(Depreciation) | |
Societe Generale | | Hang Seng China Enterprise Index | | | Receive | | | | 29.50 | % | | | December-2016 | | | | HKD | | | | 51,489 | | | $ | (32,466 | ) |
Societe Generale | | Hang Seng China Enterprise Index | | | Receive | | | | 29.89 | | | | December-2017 | | | | HKD | | | | 40,573 | | | | (4,299 | ) |
Societe Generale | | Hang Seng China Enterprise Index | | | Receive | | | | 29.93 | | | | December-2017 | | | | HKD | | | | 27,320 | | | | (1,453 | ) |
Societe Generale | | Hang Seng China Enterprise Index | | | Receive | | | | 30.15 | | | | December-2016 | | | | HKD | | | | 37,984 | | | | (41,015 | ) |
Societe Generale | | Hang Seng China Enterprise Index | | | Receive | | | | 30.20 | | | | December-2016 | | | | HKD | | | | 28,139 | | | | (18,005 | ) |
Societe Generale | | Hang Seng China Enterprise Index | | | Receive | | | | 30.42 | | | | December-2017 | | | | HKD | | | | 40,377 | | | | (7,240 | ) |
Societe Generale | | Hang Seng China Enterprise Index | | | Receive | | | | 30.73 | | | | December-2017 | | | | HKD | | | | 38,467 | | | | (7,748 | ) |
Societe Generale | | Hang Seng China Enterprise Index | | | Receive | | | | 31.00 | | | | December-2016 | | | | HKD | | | | 76,855 | | | | (60,705 | ) |
Societe Generale | | Hang Seng China Enterprise Index | | | Receive | | | | 31.30 | | | | December-2016 | | | | HKD | | | | 12,834 | | | | (15,574 | ) |
Societe Generale | | Hang Seng China Enterprise Index | | | Receive | | | | 31.45 | | | | December-2016 | | | | HKD | | | | 44,521 | | | | (37,176 | ) |
Societe Generale | | Hang Seng China Enterprise Index | | | Receive | | | | 31.65 | | | | December-2016 | | | | HKD | | | | 27,802 | | | | (24,722 | ) |
Societe Generale | | Hang Seng China Enterprise Index | | | Receive | | | | 32.10 | | | | December-2017 | | | | HKD | | | | 10,130 | | | | (1,929 | ) |
Societe Generale | | Hang Seng China Enterprise Index | | | Receive | | | | 32.15 | | | | December-2016 | | | | HKD | | | | 15,178 | | | | (14,568 | ) |
Societe Generale | | Hang Seng China Enterprise Index | | | Receive | | | | 32.35 | | | | December-2016 | | | | HKD | | | | 12,937 | | | | (16,517 | ) |
Societe Generale | | Hang Seng China Enterprise Index | | | Receive | | | | 32.50 | | | | December-2016 | | | | HKD | | | | 158,353 | | | | (161,340 | ) |
Societe Generale | | Hang Seng China Enterprise Index | | | Receive | | | | 32.60 | | | | December-2016 | | | | HKD | | | | 19,573 | | | | (19,736 | ) |
Societe Generale | | Hang Seng China Enterprise Index | | | Receive | | | | 32.85 | | | | December-2016 | | | | HKD | | | | 23,920 | | | | (31,471 | ) |
Societe Generale | | Hang Seng China Enterprise Index | | | Receive | | | | 33.10 | | | | December-2016 | | | | HKD | | | | 76,725 | | | | (76,784 | ) |
Societe Generale | | Hang Seng China Enterprise Index | | | Receive | | | | 33.25 | | | | December-2017 | | | | HKD | | | | 31,530 | | | | (10,362 | ) |
Societe Generale | | Hang Seng China Enterprise Index | | | Receive | | | | 34.30 | | | | December-2016 | | | | HKD | | | | 54,745 | | | | (79,210 | ) |
Societe Generale | | Hang Seng China Enterprise Index | | | Receive | | | | 34.75 | | | | December-2016 | | | | HKD | | | | 43,478 | | | | (50,473 | ) |
Societe Generale | | Hang Seng China Enterprise Index | | | Receive | | | | 35.10 | | | | December-2017 | | | | HKD | | | | 12,873 | | | | (6,979 | ) |
Societe Generale | | Hang Seng China Enterprise Index | | | Receive | | | | 35.20 | | | | December-2016 | | | | HKD | | | | 14,728 | | | | (17,899 | ) |
Societe Generale | | Hang Seng China Enterprise Index | | | Receive | | | | 35.35 | | | | December-2017 | | | | HKD | | | | 33,179 | | | | (18,920 | ) |
Societe Generale | | Hang Seng China Enterprise Index | | | Receive | | | | 36.75 | | | | December-2017 | | | | HKD | | | | 49,130 | | | | (35,596 | ) |
Societe Generale | | Hang Seng China Enterprise Index | | | Receive | | | | 37.50 | | | | December-2016 | | | | HKD | | | | 96,876 | | | | (151,030 | ) |
Societe Generale | | Hang Seng China Enterprise Index | | | Receive | | | | 39.80 | | | | December-2017 | | | | HKD | | | | 45,162 | | | | (47,190 | ) |
BNP Paribas S.A. | | Hang Seng Index | | | Receive | | | | 27.20 | | | | December-2016 | | | | HKD | | | | 39,542 | | | | (42,259 | ) |
BNP Paribas S.A. | | Hang Seng Index | | | Receive | | | | 27.30 | | | | December-2016 | | | | HKD | | | | 28,944 | | | | (31,087 | ) |
Goldman Sachs International | | Hang Seng Index | | | Receive | | | | 22.85 | | | | December-2016 | | | | HKD | | | | 20,000 | | | | (5,757 | ) |
Goldman Sachs International | | Hang Seng Index | | | Receive | | | | 24.35 | | | | December-2016 | | | | HKD | | | | 167,000 | | | | (66,276 | ) |
Goldman Sachs International | | Hang Seng Index | | | Receive | | | | 25.20 | | | | December-2016 | | | | HKD | | | | 34,138 | | | | (16,680 | ) |
Goldman Sachs International | | Hang Seng Index | | | Receive | | | | 25.65 | | | | December-2016 | | | | HKD | | | | 75,120 | | | | (51,829 | ) |
Goldman Sachs International | | Hang Seng Index | | | Receive | | | | 25.90 | | | | December-2016 | | | | HKD | | | | 17,410 | | | | (13,247 | ) |
Goldman Sachs International | | Hang Seng Index | | | Receive | | | | 26.00 | | | | December-2016 | | | | HKD | | | | 7,022 | | | | (5,419 | ) |
HSBC New York | | Hang Seng Index | | | Receive | | | | 22.33 | | | | December-2016 | | | | HKD | | | | 84,000 | | | | (18,518 | ) |
HSBC New York | | Hang Seng Index | | | Receive | | | | 24.00 | | | | December-2016 | | | | HKD | | | | 133,139 | | | | (48,988 | ) |
HSBC New York | | Hang Seng Index | | | Receive | | | | 24.15 | | | | December-2016 | | | | HKD | | | | 59,722 | | | | (21,621 | ) |
J.P. Morgan Chase Bank, N.A. | | Hang Seng Index | | | Receive | | | | 23.59 | | | | December-2016 | | | | HKD | | | | 59,643 | | | | (42,578 | ) |
J.P. Morgan Chase Bank, N.A. | | Hang Seng Index | | | Receive | | | | 24.07 | | | | December-2016 | | | | HKD | | | | 68,524 | | | | (57,572 | ) |
J.P. Morgan Chase Bank, N.A. | | Hang Seng Index | | | Receive | | | | 25.08 | | | | December-2017 | | | | HKD | | | | 64,715 | | | | (9,446 | ) |
J.P. Morgan Chase Bank, N.A. | | Hang Seng Index | | | Receive | | | | 25.25 | | | | December-2017 | | | | HKD | | | | 27,496 | | | | (3,080 | ) |
J.P. Morgan Chase Bank, N.A. | | Hang Seng Index | | | Receive | | | | 25.60 | | | | December-2017 | | | | HKD | | | | 51,286 | | | | (13,996 | ) |
J.P. Morgan Chase Bank, N.A. | | Hang Seng Index | | | Receive | | | | 25.70 | | | | December-2016 | | | | HKD | | | | 35,605 | | | | (33,433 | ) |
J.P. Morgan Chase Bank, N.A. | | Hang Seng Index | | | Receive | | | | 26.40 | | | | December-2017 | | | | HKD | | | | 23,155 | | | | (8,715 | ) |
J.P. Morgan Chase Bank, N.A. | | Hang Seng Index | | | Receive | | | | 27.40 | | | | December-2016 | | | | HKD | | | | 50,936 | | | | (55,355 | ) |
Morgan Stanley Capital Services LLC | | Hang Seng Index | | | Receive | | | | 25.95 | | | | December-2016 | | | | HKD | | | | 47,239 | | | | (35,593 | ) |
Societe Generale | | Hang Seng Index | | | Receive | | | | 22.35 | | | | December-2016 | | | | HKD | | | | 55,843 | | | | (38,421 | ) |
Societe Generale | | Hang Seng Index | | | Receive | | | | 24.00 | | | | December-2016 | | | | HKD | | | | 34,535 | | | | (11,104 | ) |
Societe Generale | | Hang Seng Index | | | Receive | | | | 24.45 | | | | December-2016 | | | | HKD | | | | 50,646 | | | | (41,671 | ) |
See accompanying Notes to Consolidated Financial Statements which are an integral part of the financial statements.
26 Invesco Global Targeted Returns Fund
| | | | | | | | | | | | | | | | | | | | | | | | | | |
| Open Over-The-Counter Variance Swap Agreements—(continued) | |
| Counterparty | | Reference Entity | | Pay/Receive
Variance | | | Volatility
Strike Rate | | | Expiration
Date | | | | | | Notional
Value | | | Unrealized
Appreciation
(Depreciation) | |
Societe Generale | | Hang Seng Index | | | Receive | | | | 24.80 | % | | | December-2017 | | | | HKD | | | | 64,593 | | | $ | (928 | ) |
Societe Generale | | Hang Seng Index | | | Receive | | | | 24.99 | | | | December-2017 | | | | HKD | | | | 50,717 | | | | (5,433 | ) |
Societe Generale | | Hang Seng Index | | | Receive | | | | 25.08 | | | | December-2017 | | | | HKD | | | | 38,488 | | | | (2,707 | ) |
Societe Generale | | Hang Seng Index | | | Receive | | | | 25.10 | | | | December-2016 | | | | HKD | | | | 32,512 | | | | (28,710 | ) |
Societe Generale | | Hang Seng Index | | | Receive | | | | 25.15 | | | | December-2017 | | | | HKD | | | | 58,617 | | | | (10,990 | ) |
Societe Generale | | Hang Seng Index | | | Receive | | | | 25.35 | | | | December-2017 | | | | HKD | | | | 50,597 | | | | (14,031 | ) |
Societe Generale | | Hang Seng Index | | | Receive | | | | 25.45 | | | | December-2016 | | | | HKD | | | | 37,195 | | | | (34,335 | ) |
Societe Generale | | Hang Seng Index | | | Receive | | | | 25.52 | | | | December-2017 | | | | HKD | | | | 63,930 | | | | (11,417 | ) |
Societe Generale | | Hang Seng Index | | | Receive | | | | 25.85 | | | | December-2017 | | | | HKD | | | | 41,245 | | | | (13,261 | ) |
Societe Generale | | Hang Seng Index | | | Receive | | | | 25.98 | | | | December-2017 | | | | HKD | | | | 47,871 | | | | (10,591 | ) |
Societe Generale | | Hang Seng Index | | | Receive | | | | 26.20 | | | | December-2016 | | | | HKD | | | | 25,485 | | | | (19,788 | ) |
Societe Generale | | Hang Seng Index | | | Receive | | | | 26.30 | | | | December-2016 | | | | HKD | | | | 17,250 | | | | (17,024 | ) |
Societe Generale | | Hang Seng Index | | | Receive | | | | 26.55 | | | | December-2016 | | | | HKD | | | | 31,057 | | | | (31,080 | ) |
Societe Generale | | Hang Seng Index | | | Receive | | | | 26.60 | | | | December-2016 | | | | HKD | | | | 20,981 | | | | (17,194 | ) |
Societe Generale | | Hang Seng Index | | | Receive | | | | 26.80 | | | | December-2016 | | | | HKD | | | | 81,316 | | | | (69,495 | ) |
Societe Generale | | Hang Seng Index | | | Receive | | | | 28.50 | | | | December-2016 | | | | HKD | | | | 75,801 | | | | (90,558 | ) |
Societe Generale | | Hang Seng Index | | | Receive | | | | 29.00 | | | | December-2016 | | | | HKD | | | | 13,150 | | | | (13,420 | ) |
Societe Generale | | Hang Seng Index | | | Receive | | | | 30.75 | | | | December-2016 | | | | HKD | | | | 99,588 | | | | (118,391 | ) |
Societe Generale | | Hang Seng Index | | | Receive | | | | 32.20 | | | | December-2016 | | | | HKD | | | | 70,629 | | | | (104,328 | ) |
BNP Paribas S.A. | | KOSPI 200 Index | | | Receive | | | | 18.75 | | | | December-2016 | | | | KRW | | | | 4,374,356 | | | | (19,549 | ) |
BNP Paribas S.A. | | KOSPI 200 Index | | | Receive | | | | 19.70 | | | | December-2016 | | | | KRW | | | | 4,307,475 | | | | (22,708 | ) |
Goldman Sachs International | | KOSPI 200 Index | | | Receive | | | | 20.30 | | | | December-2017 | | | | KRW | | | | 8,164,924 | | | | (5,194 | ) |
Goldman Sachs International | | KOSPI 200 Index | | | Receive | | | | 20.80 | | | | December-2016 | | | | KRW | | | | 3,289,007 | | | | (17,652 | ) |
Goldman Sachs International | | KOSPI 200 Index | | | Receive | | | | 21.10 | | | | December-2017 | | | | KRW | | | | 6,109,726 | | | | (10,338 | ) |
Goldman Sachs International | | KOSPI 200 Index | | | Receive | | | | 21.50 | | | | December-2016 | | | | KRW | | | | 3,102,391 | | | | (17,857 | ) |
Goldman Sachs International | | KOSPI 200 Index | | | Receive | | | | 29.00 | | | | December-2016 | | | | KRW | | | | 44,475,000 | | | | (440,004 | ) |
HSBC New York | | KOSPI 200 Index | | | Receive | | | | 21.50 | | | | December-2016 | | | | KRW | | | | 7,995,332 | | | | (46,768 | ) |
J.P. Morgan Chase Bank, N.A. | | KOSPI 200 Index | | | Receive | | | | 17.14 | | | | December-2016 | | | | KRW | | | | 7,065,653 | | | | (22,300 | ) |
J.P. Morgan Chase Bank, N.A. | | KOSPI 200 Index | | | Receive | | | | 17.80 | | | | December-2016 | | | | KRW | | | | 5,525,003 | | | | (22,204 | ) |
J.P. Morgan Chase Bank, N.A. | | KOSPI 200 Index | | | Receive | | | | 17.90 | | | | December-2016 | | | | KRW | | | | 4,283,500 | | | | (16,456 | ) |
J.P. Morgan Chase Bank, N.A. | | KOSPI 200 Index | | | Receive | | | | 18.34 | | | | December-2016 | | | | KRW | | | | 3,957,860 | | | | (16,374 | ) |
J.P. Morgan Chase Bank, N.A. | | KOSPI 200 Index | | | Receive | | | | 18.65 | | | | December-2016 | | | | KRW | | | | 3,513,486 | | | | (15,991 | ) |
J.P. Morgan Chase Bank, N.A. | | KOSPI 200 Index | | | Receive | | | | 18.89 | | | | December-2016 | | | | KRW | | | | 5,948,585 | | | | (27,403 | ) |
J.P. Morgan Chase Bank, N.A. | | KOSPI 200 Index | | | Receive | | | | 20.28 | | | | December-2017 | | | | KRW | | | | 9,543,941 | | | | (1,333 | ) |
J.P. Morgan Chase Bank, N.A. | | KOSPI 200 Index | | | Receive | | | | 20.50 | | | | December-2016 | | | | KRW | | | | 4,331,165 | | | | (25,341 | ) |
J.P. Morgan Chase Bank, N.A. | | KOSPI 200 Index | | | Receive | | | | 20.64 | | | | December-2017 | | | | KRW | | | | 3,928,560 | | | | (2,798 | ) |
J.P. Morgan Chase Bank, N.A. | | KOSPI 200 Index | | | Receive | | | | 20.74 | | | | December-2017 | | | | KRW | | | | 5,313,225 | | | | (4,952 | ) |
J.P. Morgan Chase Bank, N.A. | | KOSPI 200 Index | | | Receive | | | | 21.19 | | | | December-2017 | | | | KRW | | | | 9,170,873 | | | | (14,681 | ) |
J.P. Morgan Chase Bank, N.A. | | KOSPI 200 Index | | | Receive | | | | 21.28 | | | | December-2017 | | | | KRW | | | | 8,385,612 | | | | (17,035 | ) |
J.P. Morgan Chase Bank, N.A. | | KOSPI 200 Index | | | Receive | | | | 21.30 | | | | December-2017 | | | | KRW | | | | 5,469,899 | | | | (10,802 | ) |
J.P. Morgan Chase Bank, N.A. | | KOSPI 200 Index | | | Receive | | | | 21.45 | | | | December-2017 | | | | KRW | | | | 4,600,846 | | | | (9,352 | ) |
Morgan Stanley Capital Services LLC | | KOSPI 200 Index | | | Receive | | | | 22.20 | | | | December-2016 | | | | KRW | | | | 4,902,168 | | | | (30,317 | ) |
Societe Generale | | KOSPI 200 Index | | | Receive | | | | 16.95 | | | | December-2016 | | | | KRW | | | | 4,273,310 | | | | (13,486 | ) |
Societe Generale | | KOSPI 200 Index | | | Receive | | | | 17.75 | | | | December-2016 | | | | KRW | | | | 5,284,926 | | | | (22,510 | ) |
Societe Generale | | KOSPI 200 Index | | | Receive | | | | 17.90 | | | | December-2016 | | | | KRW | | | | 6,852,527 | | | | (28,290 | ) |
Societe Generale | | KOSPI 200 Index | | | Receive | | | | 19.60 | | | | December-2016 | | | | KRW | | | | 2,348,739 | | | | (12,303 | ) |
Societe Generale | | KOSPI 200 Index | | | Receive | | | | 20.00 | | | | December-2016 | | | | KRW | | | | 4,348,553 | | | | (24,078 | ) |
Societe Generale | | KOSPI 200 Index | | | Receive | | | | 20.83 | | | | December-2017 | | | | KRW | | | | 7,959,537 | | | | (5,579 | ) |
Societe Generale | | KOSPI 200 Index | | | Receive | | | | 20.90 | | | | December-2016 | | | | KRW | | | | 10,855,490 | | | | (66,767 | ) |
Societe Generale | | KOSPI 200 Index | | | Receive | | | | 21.10 | | | | December-2016 | | | | KRW | | | | 1,827,696 | | | | (10,322 | ) |
See accompanying Notes to Consolidated Financial Statements which are an integral part of the financial statements.
27 Invesco Global Targeted Returns Fund
| | | | | | | | | | | | | | | | | | | | | | | | | | |
| Open Over-The-Counter Variance Swap Agreements—(continued) | |
| Counterparty | | Reference Entity | | Pay/Receive
Variance | | | Volatility
Strike Rate | | | Expiration
Date | | | | | | Notional
Value | | | Unrealized
Appreciation
(Depreciation) | |
Societe Generale | | KOSPI 200 Index | | | Receive | | | | 21.10 | % | | | December-2017 | | | | KRW | | | | 9,222,065 | | | $ | (12,259 | ) |
Societe Generale | | KOSPI 200 Index | | | Receive | | | | 21.35 | | | | December-2017 | | | | KRW | | | | 7,267,477 | | | | (10,045 | ) |
Societe Generale | | KOSPI 200 Index | | | Receive | | | | 22.70 | | | | December-2016 | | | | KRW | | | | 4,285,384 | | | | (28,349 | ) |
Societe Generale | | KOSPI 200 Index | | | Receive | | | | 22.95 | | | | December-2016 | | | | KRW | | | | 3,507,377 | | | | (23,818 | ) |
Societe Generale | | KOSPI 200 Index | | | Receive | | | | 23.50 | | | | December-2016 | | | | KRW | | | | 3,452,006 | | | | (26,289 | ) |
Societe Generale | | KOSPI 200 Index | | | Receive | | | | 24.30 | | | | December-2016 | | | | KRW | | | | 7,390,037 | | | | (58,247 | ) |
Societe Generale | | KOSPI 200 Index | | | Receive | | | | 24.75 | | | | December-2016 | | | | KRW | | | | 15,304,350 | | | | (119,315 | ) |
Societe Generale | | KOSPI 200 Index | | | Receive | | | | 26.85 | | | | December-2017 | | | | KRW | | | | 21,545,172 | | | | (143,897 | ) |
Morgan Stanley Capital Services LLC | | S&P 500 Index | | | Receive | | | | 24.30 | | | | December-2016 | | | | USD | | | | 17,827 | | | | (151,014 | ) |
Morgan Stanley Capital Services LLC | | S&P 500 Index | | | Receive | | | | 24.50 | | | | December-2016 | | | | USD | | | | 4,128 | | | | (33,924 | ) |
Societe Generale | | S&P 500 Index | | | Receive | | | | 24.00 | | | | December-2016 | | | | USD | | | | 4,128 | | | | (32,547 | ) |
Societe Generale | | S&P 500 Index | | | Receive | | | | 25.30 | | | | December-2016 | | | | USD | | | | 3,500 | | | | (29,247 | ) |
Total — Variance Swap Agreements — Equity Risk | | | $ | (175,332 | ) |
Currency Abbreviations:
| | |
| HKD | | – Hong Kong Dollar |
| KRW | | – South Korean Won |
| USD | | – United States Dollar |
| | | | | | | | | | | | | | | | | | | | | | | | | | |
| Open Over-The-Counter Volatility Swap Agreements | |
| Counterparty | | Reference Entity | | Pay/Receive
Volatility | | | Volatility
Strike Rate | | | Expiration
Date | | | Notional
Value | | | Unrealized
Appreciation
(Depreciation) | |
Barclays Bank PLC | | AUD/JPY | | | Pay | | | | 13.75 | % | | | April-2017 | | | | AUD | | | | 2,850 | | | $ | (4,483 | ) |
Barclays Bank PLC | | AUD/JPY | | | Pay | | | | 13.85 | | | | April-2017 | | | | AUD | | | | 7,050 | | | | (10,556 | ) |
Barclays Bank PLC | | AUD/JPY | | | Pay | | | | 14.20 | | | | April-2017 | | | | AUD | | | | 19,000 | | | | (14,791 | ) |
Deutsche Bank Securities Inc. | | AUD/JPY | | | Pay | | | | 14.90 | | | | March-2017 | | | | AUD | | | | 33,728 | | | | (9,035 | ) |
Deutsche Bank Securities Inc. | | AUD/JPY | | | Pay | | | | 15.275 | | | | March-2017 | | | | AUD | | | | 15,000 | | | | (786 | ) |
Deutsche Bank Securities Inc. | | AUD/JPY | | | Pay | | | | 14.15 | | | | April-2017 | | | | AUD | | | | 17,500 | | | | (20,718 | ) |
Goldman Sachs International | | AUD/JPY | | | Pay | | | | 15.275 | | | | March-2017 | | | | AUD | | | | 6,400 | | | | (335 | ) |
Goldman Sachs International | | AUD/JPY | | | Pay | | | | 15.40 | | | | March-2017 | | | | AUD | | | | 29,772 | | | | 3,256 | |
Goldman Sachs International | | AUD/JPY | | | Pay | | | | 15.55 | | | | March-2017 | | | | AUD | | | | 31,500 | | | | 7,138 | |
Goldman Sachs International | | AUD/JPY | | | Pay | | | | 14.10 | | | | April-2017 | | | | AUD | | | | 14,000 | | | | (18,317 | ) |
Royal Bank of Scotland Securities Inc. | | AUD/JPY | | | Pay | | | | 14.00 | | | | April-2017 | | | | AUD | | | | 22,109 | | | | (30,598 | ) |
UBS | | AUD/JPY | | | Pay | | | | 13.80 | | | | April-2017 | | | | AUD | | | | 14,000 | | | | (21,492 | ) |
BNP Paribas S.A. | | EUR/JPY | | | Pay | | | | 11.225 | | | | January-2017 | | | | EUR | | | | 10,386 | | | | 10,551 | |
Societe Generale | | EUR/JPY | | | Pay | | | | 11.00 | | | | January-2017 | | | | EUR | | | | 10,387 | | | | 7,978 | |
Societe Generale | | EUR/JPY | | | Pay | | | | 11.55 | | | | January-2017 | | | | EUR | | | | 20,773 | | | | 32,404 | |
Bank of America Merrill Lynch | | EUR/USD | | | Pay | | | | 10.30 | | | | January-2017 | | | | EUR | | | | 30,536 | | | | 57,588 | |
BNP Paribas S.A. | | EUR/USD | | | Pay | | | | 9.825 | | | | January-2017 | | | | EUR | | | | 8,077 | | | | 17,768 | |
Goldman Sachs International | | EUR/USD | | | Pay | | | | 10.40 | | | | January-2017 | | | | EUR | | | | 20,630 | | | | 42,563 | |
Societe Generale | | EUR/USD | | | Pay | | | | 9.95 | | | | January-2017 | | | | EUR | | | | 8,077 | | | | 18,752 | |
Societe Generale | | EUR/USD | | | Pay | | | | 11.95 | | | | January-2017 | | | | EUR | | | | 3,977 | | | | 16,365 | |
UBS | | EUR/USD | | | Pay | | | | 10.25 | | | | January-2017 | | | | EUR | | | | 30,536 | | | | 56,779 | |
BNP Paribas S.A. | | USD/EUR | | | Pay | | | | 8.70 | | | | May-2017 | | | | USD | | | | 96,648 | | | | 39,046 | |
BNP Paribas S.A. | | USD/GBP | | | Pay | | | | 10.10 | | | | May-2017 | | | | USD | | | | 6,647 | | | | (9,091 | ) |
BNP Paribas S.A. | | USD/GBP | | | Pay | | | | 10.85 | | | | May-2017 | | | | USD | | | | 13,968 | | | | (57,587 | ) |
BNP Paribas S.A. | | USD/GBP | | | Pay | | | | 11.15 | | | | May-2017 | | | | USD | | | | 19,500 | | | | (69,102 | ) |
BNP Paribas S.A. | | USD/GBP | | | Pay | | | | 11.25 | | | | May-2017 | | | | USD | | | | 19,500 | | | | (66,642 | ) |
BNP Paribas S.A. | | USD/GBP | | | Pay | | | | 11.45 | | | | May-2017 | | | | USD | | | | 19,500 | | | | (63,554 | ) |
BNP Paribas S.A. | | USD/GBP | | | Pay | | | | 13.00 | | | | May-2017 | | | | USD | | | | 30,174 | | | | 45,784 | |
BNP Paribas S.A. | | USD/GBP | | | Pay | | | | 13.20 | | | | May-2017 | | | | USD | | | | 18,000 | | | | 30,900 | |
See accompanying Notes to Consolidated Financial Statements which are an integral part of the financial statements.
28 Invesco Global Targeted Returns Fund
| | | | | | | | | | | | | | | | | | | | | | | | | | |
| Open Over-The-Counter Volatility Swap Agreements—(continued) | |
| Counterparty | | Reference Entity | | Pay/Receive
Volatility | | | Volatility
Strike Rate | | | Expiration
Date | | | Notional
Value | | | Unrealized
Appreciation
(Depreciation) | |
Deutsche Bank Securities Inc. | | USD/GBP | | | Pay | | | | 11.225 | % | | | May-2017 | | | | USD | | | | 18,200 | | | $ | (62,653 | ) |
Deutsche Bank Securities Inc. | | USD/GBP | | | Pay | | | | 11.275 | | | | May-2017 | | | | USD | | | | 9,100 | | | | (31,114 | ) |
Societe Generale | | USD/GBP | | | Pay | | | | 10.80 | | | | January-2017 | | | | USD | | | | 13,700 | | | | (61,932 | ) |
Societe Generale | | USD/GBP | | | Pay | | | | 10.85 | | | | January-2017 | | | | USD | | | | 10,500 | | | | (46,942 | ) |
Societe Generale | | USD/GBP | | | Pay | | | | 11.00 | | | | January-2017 | | | | USD | | | | 21,000 | | | | (89,502 | ) |
Societe Generale | | USD/GBP | | | Pay | | | | 10.00 | | | | May-2017 | | | | USD | | | | 36,234 | | | | (53,433 | ) |
Societe Generale | | USD/GBP | | | Pay | | | | 11.15 | | | | May-2017 | | | | USD | | | | 22,565 | | | | (79,669 | ) |
Societe Generale | | USD/GBP | | | Pay | | | | 11.65 | | | | May-2017 | | | | USD | | | | 33,364 | | | | 8,813 | |
UBS | | USD/GBP | | | Pay | | | | 10.50 | | | | January-2017 | | | | USD | | | | 21,000 | | | | (99,989 | ) |
UBS | | USD/GBP | | | Pay | | | | 10.60 | | | | January-2017 | | | | USD | | | | 21,000 | | | | (98,620 | ) |
Deutsche Bank Securities Inc. | | USD/JPY | | | Pay | | | | 10.525 | | | | November-2016 | | | | USD | | | | 12,800 | | | | 1,938 | |
Deutsche Bank Securities Inc. | | USD/JPY | | | Pay | | | | 12.15 | | | | December-2016 | | | | USD | | | | 3,564 | | | | 6,106 | |
Deutsche Bank Securities Inc. | | USD/JPY | | | Pay | | | | 11.35 | | | | January-2017 | | | | USD | | | | 4,500 | | | | 3,832 | |
Deutsche Bank Securities Inc. | | USD/JPY | | | Pay | | | | 11.55 | | | | January-2017 | | | | USD | | | | 9,000 | | | | 9,288 | |
Deutsche Bank Securities Inc. | | USD/JPY | | | Pay | | | | 11.50 | | | | February-2017 | | | | USD | | | | 6,120 | | | | 5,714 | |
Deutsche Bank Securities Inc. | | USD/JPY | | | Pay | | | | 10.80 | | | | February-2017 | | | | USD | | | | 2,571 | | | | 376 | |
Deutsche Bank Securities Inc. | | USD/JPY | | | Pay | | | | 11.00 | | | | March-2017 | | | | USD | | | | 15,000 | | | | 1,888 | |
Deutsche Bank Securities Inc. | | USD/JPY | | | Pay | | | | 10.10 | | | | May-2017 | | | | USD | | | | 13,500 | | | | (13,629 | ) |
Deutsche Bank Securities Inc. | | USD/JPY | | | Pay | | | | 10.10 | | | | June-2017 | | | | USD | | | | 14,580 | | | | (16,457 | ) |
Deutsche Bank Securities Inc. | | USD/JPY | | | Pay | | | | 11.15 | | | | June-2017 | | | | USD | | | | 12,600 | | | | (646 | ) |
Deutsche Bank Securities Inc. | | USD/JPY | | | Pay | | | | 9.75 | | | | July-2017 | | | | USD | | | | 15,000 | | | | (22,989 | ) |
Deutsche Bank Securities Inc. | | USD/JPY | | | Pay | | | | 10.075 | | | | July-2017 | | | | USD | | | | 11,880 | | | | (13,997 | ) |
Deutsche Bank Securities Inc. | | USD/JPY | | | Pay | | | | 10.40 | | | | July-2017 | | | | USD | | | | 5,500 | | | | (5,388 | ) |
Goldman Sachs International | | USD/JPY | | | Pay | | | | 11.3248 | | | | January-2017 | | | | USD | | | | 13,500 | | | | 10,986 | |
Goldman Sachs International | | USD/JPY | | | Pay | | | | 11.9357 | | | | March-2017 | | | | USD | | | | 6,300 | | | | 7,503 | |
Goldman Sachs International | | USD/JPY | | | Pay | | | | 10.1086 | | | | April-2017 | | | | USD | | | | 14,850 | | | | (11,865 | ) |
Goldman Sachs International | | USD/JPY | | | Pay | | | | 10.1549 | | | | April-2017 | | | | USD | | | | 8,460 | | | | (6,854 | ) |
Goldman Sachs International | | USD/JPY | | | Pay | | | | 10.34 | | | | June-2017 | | | | USD | | | | 15,000 | | | | (13,021 | ) |
Royal Bank of Scotland Securities Inc. | | USD/JPY | | | Pay | | | | 9.75 | | | | June-2017 | | | | USD | | | | 9,000 | | | | (13,392 | ) |
Deutsche Bank Securities Inc. | | AUD/JPY | | | Receive | | | | 11.40 | | | | November-2016 | | | | AUD | | | | 14,700 | | | | 34,315 | |
Deutsche Bank Securities Inc. | | AUD/JPY | | | Receive | | | | 12.70 | | | | December-2016 | | | | AUD | | | | 13,968 | | | | 19,904 | |
Deutsche Bank Securities Inc. | | AUD/JPY | | | Receive | | | | 11.90 | | | | January-2017 | | | | AUD | | | | 3,735 | | | | 8,179 | |
Deutsche Bank Securities Inc. | | AUD/JPY | | | Receive | | | | 12.65 | | | | January-2017 | | | | AUD | | | | 11,360 | | | | 18,134 | |
Deutsche Bank Securities Inc. | | AUD/JPY | | | Receive | | | | 12.10 | | | | February-2017 | | | | AUD | | | | 13,393 | | | | 27,983 | |
Deutsche Bank Securities Inc. | | AUD/JPY | | | Receive | | | | 13.45 | | | | February-2017 | | | | AUD | | | | 7,827 | | | | 7,479 | |
Deutsche Bank Securities Inc. | | AUD/JPY | | | Receive | | | | 12.95 | | | | April-2017 | | | | AUD | | | | 19,718 | | | | 30,999 | |
Deutsche Bank Securities Inc. | | AUD/JPY | | | Receive | | | | 12.30 | | | | May-2017 | | | | AUD | | | | 20,863 | | | | 45,416 | |
Deutsche Bank Securities Inc. | | AUD/JPY | | | Receive | | | | 12.50 | | | | June-2017 | | | | AUD | | | | 16,412 | | | | 35,297 | |
Deutsche Bank Securities Inc. | | AUD/JPY | | | Receive | | | | 12.525 | | | | June-2017 | | | | AUD | | | | 18,942 | | | | 42,170 | |
Deutsche Bank Securities Inc. | | AUD/JPY | | | Receive | | | | 12.75 | | | | July-2017 | | | | AUD | | | | 20,000 | | | | 41,765 | |
Deutsche Bank Securities Inc. | | AUD/JPY | | | Receive | | | | 13.50 | | | | July-2017 | | | | AUD | | | | 18,000 | | | | 28,586 | |
Deutsche Bank Securities Inc. | | AUD/JPY | | | Receive | | | | 13.70 | | | | July-2017 | | | | AUD | | | | 15,933 | | | | 21,368 | |
Goldman Sachs International | | AUD/JPY | | | Receive | | | | 12.0758 | | | | January-2017 | | | | AUD | | | | 16,580 | | | | 33,872 | |
Goldman Sachs International | | AUD/JPY | | | Receive | | | | 13.3976 | | | | March-2017 | | | | AUD | | | | 12,612 | | | | 14,822 | |
Goldman Sachs International | | AUD/JPY | | | Receive | | | | 12.512 | | | | April-2017 | | | | AUD | | | | 10,933 | | | | 21,414 | |
Goldman Sachs International | | AUD/JPY | | | Receive | | | | 12.6407 | | | | April-2017 | | | | AUD | | | | 19,468 | | | | 36,379 | |
Goldman Sachs International | | AUD/JPY | | | Receive | | | | 12.73 | | | | June-2017 | | | | AUD | | | | 20,000 | | | | 41,006 | |
Royal Bank of Scotland Securities Inc. | | AUD/JPY | | | Receive | | | | 12.55 | | | | June-2017 | | | | AUD | | | | 11,719 | | | | 26,190 | |
Bank of America Merrill Lynch | | EUR/JPY | | | Receive | | | | 11.25 | | | | January-2017 | | | | EUR | | | | 15,268 | | | | 22,515 | |
Bank of America Merrill Lynch | | EUR/JPY | | | Receive | | | | 11.425 | | | | January-2017 | | | | EUR | | | | 15,268 | | | | 19,572 | |
See accompanying Notes to Consolidated Financial Statements which are an integral part of the financial statements.
29 Invesco Global Targeted Returns Fund
| | | | | | | | | | | | | | | | | | | | | | | | | | |
| Open Over-The-Counter Volatility Swap Agreements—(continued) | |
| Counterparty | | Reference Entity | | Pay/Receive
Volatility | | | Volatility
Strike Rate | | | Expiration
Date | | | Notional
Value | | | Unrealized
Appreciation
(Depreciation) | |
BNP Paribas S.A. | | EUR/JPY | | | Receive | | | | 11.225 | % | | | January-2017 | | | | EUR | | | | 8,077 | | | $ | 13,489 | |
Goldman Sachs International | | EUR/JPY | | | Receive | | | | 11.65 | | | | January-2017 | | | | EUR | | | | 20,630 | | | | 21,170 | |
Societe Generale | | EUR/JPY | | | Receive | | | | 11.35 | | | | January-2017 | | | | EUR | | | | 8,077 | | | | 12,853 | |
Societe Generale | | EUR/JPY | | | Receive | | | | 13.70 | | | | January-2017 | | | | EUR | | | | 3,977 | | | | (4,767 | ) |
UBS | | EUR/JPY | | | Receive | | | | 11.15 | | | | January-2017 | | | | EUR | | | | 15,268 | | | | 24,197 | |
UBS | | EUR/JPY | | | Receive | | | | 11.475 | | | | January-2017 | | | | EUR | | | | 15,268 | | | | 18,561 | |
UBS | | EUR/JPY | | | Receive | | | | 12.00 | | | | May-2017 | | | | EUR | | | | 2,198 | | | | (1,504 | ) |
BNP Paribas S.A. | | EUR/USD | | | Receive | | | | 8.225 | | | | January-2017 | | | | EUR | | | | 10,386 | | | | (7,313 | ) |
Societe Generale | | EUR/USD | | | Receive | | | | 8.30 | | | | January-2017 | | | | EUR | | | | 10,387 | | | | (8,172 | ) |
Societe Generale | | EUR/USD | | | Receive | | | | 8.55 | | | | January-2017 | | | | EUR | | | | 20,773 | | | | (22,086 | ) |
BNP Paribas S.A. | | USD/EUR | | | Receive | | | | 8.70 | | | | May-2017 | | | | USD | | | | 6,647 | | | | (3,286 | ) |
BNP Paribas S.A. | | USD/EUR | | | Receive | | | | 9.85 | | | | May-2017 | | | | USD | | | | 14,965 | | | | (21,778 | ) |
BNP Paribas S.A. | | USD/EUR | | | Receive | | | | 10.00 | | | | May-2017 | | | | USD | | | | 19,500 | | | | (34,171 | ) |
BNP Paribas S.A. | | USD/EUR | | | Receive | | | | 10.10 | | | | May-2017 | | | | USD | | | | 19,500 | | | | (35,901 | ) |
BNP Paribas S.A. | | USD/EUR | | | Receive | | | | 10.25 | | | | May-2017 | | | | USD | | | | 19,500 | | | | (38,517 | ) |
Deutsche Bank Securities Inc. | | USD/EUR | | | Receive | | | | 10.10 | | | | May-2017 | | | | USD | | | | 18,200 | | | | (33,706 | ) |
Deutsche Bank Securities Inc. | | USD/EUR | | | Receive | | | | 10.25 | | | | May-2017 | | | | USD | | | | 9,100 | | | | (17,117 | ) |
Societe Generale | | USD/EUR | | | Receive | | | | 9.80 | | | | January-2017 | | | | USD | | | | 13,700 | | | | (31,463 | ) |
Societe Generale | | USD/EUR | | | Receive | | | | 9.85 | | | | January-2017 | | | | USD | | | | 10,500 | | | | (24,638 | ) |
Societe Generale | | USD/EUR | | | Receive | | | | 10.00 | | | | January-2017 | | | | USD | | | | 21,000 | | | | (50,317 | ) |
Societe Generale | | USD/EUR | | | Receive | | | | 8.70 | | | | May-2017 | | | | USD | | | | 28,861 | | | | (17,242 | ) |
Societe Generale | | USD/EUR | | | Receive | | | | 9.65 | | | | May-2017 | | | | USD | | | | 24,568 | | | | (40,763 | ) |
Societe Generale | | USD/EUR | | | Receive | | | | 10.15 | | | | May-2017 | | | | USD | | | | 23,542 | | | | (45,201 | ) |
Societe Generale | | USD/EUR | | | Receive | | | | 10.275 | | | | May-2017 | | | | USD | | | | 14,051 | | | | (33,295 | ) |
UBS | | USD/EUR | | | Receive | | | | 9.60 | | | | January-2017 | | | | USD | | | | 42,000 | | | | (83,455 | ) |
BNP Paribas S.A. | | USD/GBP | | | Receive | | | | 10.10 | | | | May-2017 | | | | USD | | | | 97,454 | | | | 139,684 | |
Barclays Bank PLC | | USD/JPY | | | Receive | | | | 9.70 | | | | April-2017 | | | | USD | | | | 7,000 | | | | 16,733 | |
Barclays Bank PLC | | USD/JPY | | | Receive | | | | 10.30 | | | | April-2017 | | | | USD | | | | 13,000 | | | | 14,279 | |
Deutsche Bank Securities Inc. | | USD/JPY | | | Receive | | | | 10.85 | | | | March-2017 | | | | USD | | | | 17,075 | | | | 8,632 | |
Deutsche Bank Securities Inc. | | USD/JPY | | | Receive | | | | 10.90 | | | | March-2017 | | | | USD | | | | 7,000 | | | | 2,655 | |
Deutsche Bank Securities Inc. | | USD/JPY | | | Receive | | | | 11.00 | | | | March-2017 | | | | USD | | | | 12,000 | | | | 3,195 | |
Deutsche Bank Securities Inc. | | USD/JPY | | | Receive | | | | 10.15 | | | | April-2017 | | | | USD | | | | 12,500 | | | | 22,159 | |
Goldman Sachs International | | USD/JPY | | | Receive | | | | 11.00 | | | | March-2017 | | | | USD | | | | 7,600 | | | | 2,023 | |
Goldman Sachs International | | USD/JPY | | | Receive | | | | 11.20 | | | | March-2017 | | | | USD | | | | 20,925 | | | | 3,268 | |
Goldman Sachs International | | USD/JPY | | | Receive | | | | 11.5102 | | | | March-2017 | | | | USD | | | | 21,000 | | | | (4,825 | ) |
Goldman Sachs International | | USD/JPY | | | Receive | | | | 10.00 | | | | April-2017 | | | | USD | | | | 10,000 | | | | 20,912 | |
Royal Bank of Scotland Securities Inc. | | USD/JPY | | | Receive | | | | 9.80 | | | | April-2017 | | | | USD | | | | 18,242 | | | | 41,787 | |
UBS | | USD/JPY | | | Receive | | | | 9.75 | | | | April-2017 | | | | USD | | | | 10,000 | | | | 23,406 | |
Total — Volatility Swap Agreements–Currency Risk | | | | | | | | | | | | | | | | | | | $ | (289,012 | ) |
Currency Abbreviations:
| | |
| AUD | | – Australian Dollar |
| EUR | | — Euro |
| GBP | | – British Pound Sterling |
| JPY | | – Japanese Yen |
| USD | | – U.S. Dollar |
See accompanying Notes to Consolidated Financial Statements which are an integral part of the financial statements.
30 Invesco Global Targeted Returns Fund
| | | | | | | | | | | | | | | | | | | | | | | | | | | | |
| Open Over-The-Counter Total Return Swap Agreements | |
| Counterparty | | Pay/Receive | | | Reference Entity | | | Fixed
Rate | | | Number of
Contracts | | | Termination
Date | | | Notional
Value | | | Unrealized
Appreciation | |
Macquarie Bank Ltd.(c) | | | Pay | | | | Macquarie MQCP174 Index | | | | 0.15 | % | | | 52,665 | | | | February-2017 | | | $ | (4,695,490 | ) | | $ | 51,896 | |
Macquarie Bank Ltd.(c) | | | Receive | | | | Macquarie MQCP515 Index | | | | 0.28 | | | | 63,072 | | | | February-2017 | | | | 11,842,489 | | | | 21,785 | |
Macquarie Bank Ltd.(c) | | | Receive | | | | Macquarie MQCP515 Index | | | | 0.30 | | | | 85,733 | | | | February-2017 | | | | 16,097,443 | | | | 29,612 | |
Total Open Over-The-Counter Total Return Swap Agreements — Commodity Risk | | | | | | | | | | | | | | | $ | 103,293 | |
| (c) | The investment is owned by the Subsidiary. See Note 5. |
Index Information:
| | | | |
| | Macquarie MQCP174 Index | | | – A basket of eleven indices that provide exposure to various components of the agriculture markets. The underlying commodities comprising the indices are: Aluminum, Copper, Crude Oil, Gasoline RBOB, Heating Oil, Natural Gas, Nickel and Zinc. |
| | Macquarie MQCP515 Index | | | – A basket of eleven indices that provide exposure to various components of the agriculture markets. The underlying commodities comprising the indices are: Aluminum, Copper, Crude Oil, Gasoline RBOB, Heating Oil, Natural Gas, Nickel and Zinc. |
| | | | | | | | | | | | | | | | | | | | | | | | | | |
| Open Forward Foreign Currency Contracts | |
Settlement
Date | | Counterparty | | Contract to | | | Notional
Value | | | Unrealized
Appreciation
(Depreciation) | |
| | | | | | Deliver | | | | | | Receive | | | |
11/10/2016 | | Barclays Bank PLC | | | AUD | | | | 2,228,706 | | | | USD | | | | 1,687,198 | | | $ | 1,694,820 | | | $ | (7,622 | ) |
11/10/2016 | | Barclays Bank PLC | | | CAD | | | | 9,675,841 | | | | USD | | | | 7,309,699 | | | | 7,214,517 | | | | 95,182 | |
11/10/2016 | | Barclays Bank PLC | | | CNY | | | | 61,264,831 | | | | USD | | | | 9,184,219 | | | | 9,035,933 | | | | 148,286 | |
11/10/2016 | | Barclays Bank PLC | | | EUR | | | | 3,952,022 | | | | SEK | | | | 38,074,000 | | | | 4,414,863 | | | | (122,683 | ) |
11/10/2016 | | Barclays Bank PLC | | | KRW | | | | 753,418,000 | | | | USD | | | | 670,653 | | | | 658,599 | | | | 12,054 | |
11/10/2016 | | Barclays Bank PLC | | | USD | | | | 10,238,104 | | | | INR | | | | 691,829,966 | | | | 10,349,506 | | | | 111,402 | |
11/10/2016 | | Barclays Bank PLC | | | USD | | | | 4,419,068 | | | | JPY | | | | 456,021,000 | | | | 4,350,052 | | | | (69,016 | ) |
11/10/2016 | | Barclays Bank PLC | | | USD | | | | 277,218 | | | | KRW | | | | 307,421,000 | | | | 268,731 | | | | (8,487 | ) |
11/10/2016 | | Citigroup Global Markets Inc. | | | AUD | | | | 5,526,667 | | | | USD | | | | 4,196,398 | | | | 4,202,754 | | | | (6,356 | ) |
11/10/2016 | | Deutsche Bank Securities Inc. | | | AUD | | | | 200,000 | | | | USD | | | | 149,928 | | | | 152,090 | | | | (2,162 | ) |
11/10/2016 | | Deutsche Bank Securities Inc. | | | CNY | | | | 1,339,100 | | | | USD | | | | 199,137 | | | | 197,503 | | | | 1,634 | |
11/10/2016 | | Deutsche Bank Securities Inc. | | | NZD | | | | 3,956,000 | | | | USD | | | | 2,889,296 | | | | 2,827,643 | | | | 61,653 | |
11/10/2016 | | Deutsche Bank Securities Inc. | | | USD | | | | 4,355,703 | | | | CLP | | | | 2,882,300,000 | | | | 4,409,074 | | | | 53,371 | |
11/10/2016 | | Deutsche Bank Securities Inc. | | | USD | | | | 170,283 | | | | INR | | | | 11,482,200 | | | | 171,769 | | | | 1,486 | |
11/10/2016 | | Goldman Sachs International | | | AUD | | | | 77,000 | | | | USD | | | | 58,909 | | | | 58,555 | | | | 354 | |
11/10/2016 | | Goldman Sachs International | | | GBP | | | | 4,183,914 | | | | NOK | | | | 41,809,433 | | | | 5,196,268 | | | | (61,246 | ) |
11/10/2016 | | Goldman Sachs International | | | JPY | | | | 326,483,000 | | | | USD | | | | 3,144,463 | | | | 3,114,369 | | | | 30,094 | |
11/10/2016 | | Goldman Sachs International | | | KRW | | | | 3,412,937,820 | | | | USD | | | | 3,017,062 | | | | 2,983,411 | | | | 33,651 | |
11/10/2016 | | Goldman Sachs International | | | NOK | | | | 41,809,433 | | | | GBP | | | | 4,170,475 | | | | 5,106,330 | | | | 44,797 | |
11/10/2016 | | Goldman Sachs International | | | NZD | | | | 102,000 | | | | USD | | | | 74,076 | | | | 72,907 | | | | 1,169 | |
11/10/2016 | | Goldman Sachs International | | | THB | | | | 31,235,994 | | | | USD | | | | 894,758 | | | | 891,608 | | | | 3,150 | |
11/10/2016 | | Goldman Sachs International | | | TWD | | | | 16,069,122 | | | | USD | | | | 509,888 | | | | 509,048 | | | | 840 | |
11/10/2016 | | Goldman Sachs International | | | USD | | | | 1,433,948 | | | | AUD | | | | 1,893,000 | | | | 1,439,532 | | | | 5,584 | |
11/10/2016 | | Goldman Sachs International | | | USD | | | | 1,504,201 | | | | CLP | | | | 1,004,400,000 | | | | 1,536,438 | | | | 32,237 | |
11/10/2016 | | Goldman Sachs International | | | USD | | | | 1,575,133 | | | | JPY | | | | 165,265,000 | | | | 1,576,487 | | | | 1,354 | |
11/10/2016 | | Goldman Sachs International | | | USD | | | | 1,775,886 | | | | KRW | | | | 1,994,169,335 | | | | 1,743,198 | | | | (32,688 | ) |
11/10/2016 | | Goldman Sachs International | | | USD | | | | 1,889,883 | | | | RUB | | | | 118,660,045 | | | | 1,866,685 | | | | (23,198 | ) |
11/10/2016 | | Goldman Sachs International | | | USD | | | | 819,395 | | | | TWD | | | | 25,770,786 | | | | 816,384 | | | | (3,011 | ) |
11/10/2016 | | J.P. Morgan Chase Bank N.A. | | | USD | | | | 852,175 | | | | JPY | | | | 89,150,000 | | | | 850,415 | | | | (1,760 | ) |
11/10/2016 | | State Street Bank & Trust Co. | | | AUD | | | | 183,315 | | | | USD | | | | 140,323 | | | | 139,402 | | | | 921 | |
11/10/2016 | | State Street Bank & Trust Co. | | | CAD | | | | 242,691 | | | | USD | | | | 181,453 | | | | 180,956 | | | | 497 | |
11/10/2016 | | State Street Bank & Trust Co. | | | CHF | | | | 32,022 | | | | USD | | | | 32,279 | | | | 32,377 | | | | (98 | ) |
11/10/2016 | | State Street Bank & Trust Co. | | | CNY | | | | 10,598,560 | | | | USD | | | | 1,571,905 | | | | 1,563,179 | | | | 8,726 | |
11/10/2016 | | State Street Bank & Trust Co. | | | EUR | | | | 334,224 | | | | USD | | | | 365,007 | | | | 367,040 | | | | (2,033 | ) |
11/10/2016 | | State Street Bank & Trust Co. | | | GBP | | | | 174,246 | | | | USD | | | | 212,906 | | | | 213,283 | | | | (377 | ) |
11/10/2016 | | State Street Bank & Trust Co. | | | HKD | | | | 24,260,908 | | | | USD | | | | 3,127,749 | | | | 3,128,401 | | | | (652 | ) |
11/10/2016 | | State Street Bank & Trust Co. | | | IDR | | | | 17,471,068,189 | | | | USD | | | | 1,337,307 | | | | 1,337,754 | | | | (447 | ) |
11/10/2016 | | State Street Bank & Trust Co. | | | JPY | | | | 39,833,047 | | | | USD | | | | 382,082 | | | | 379,974 | | | | 2,108 | |
See accompanying Notes to Consolidated Financial Statements which are an integral part of the financial statements.
31 Invesco Global Targeted Returns Fund
| | | | | | | | | | | | | | | | | | | | | | | | | | |
| Open Forward Foreign Currency Contracts—(continued) | |
Settlement
Date | | Counterparty | | Contract to | | | Notional
Value | | | Unrealized
Appreciation
(Depreciation) | |
| | | | | | Deliver | | | | | | Receive | | | |
11/10/2016 | | State Street Bank & Trust Co. | | | MYR | | | | 2,982,686 | | | | USD | | | | 717,799 | | | $ | 710,647 | | | $ | 7,152 | |
11/10/2016 | | State Street Bank & Trust Co. | | | PHP | | | | 71,489,410 | | | | USD | | | | 1,474,486 | | | | 1,474,870 | | | | (384 | ) |
11/10/2016 | | State Street Bank & Trust Co. | | | SGD | | | | 1,966,731 | | | | USD | | | | 1,426,891 | | | | 1,413,855 | | | | 13,036 | |
11/10/2016 | | State Street Bank & Trust Co. | | | USD | | | | 56,523 | | | | PHP | | | | 2,723,213 | | | | 56,181 | | | | (342 | ) |
11/10/2016 | | State Street Bank & Trust Co. | | | USD | | | | 178,436 | | | | SEK | | | | 1,591,951 | | | | 176,337 | | | | (2,099 | ) |
11/21/2016 | | State Street Bank & Trust Co. | | | AUD | | | | 801,646 | | | | USD | | | | 614,859 | | | | 609,435 | | | | 5,424 | |
11/21/2016 | | State Street Bank & Trust Co. | | | CHF | | | | 2,245,000 | | | | USD | | | | 2,275,423 | | | | 2,271,115 | | | | 4,308 | |
11/21/2016 | | State Street Bank & Trust Co. | | | EUR | | | | 6,937,069 | | | | USD | | | | 7,652,836 | | | | 7,621,534 | | | | 31,302 | |
11/21/2016 | | State Street Bank & Trust Co. | | | GBP | | | | 4,076,259 | | | | USD | | | | 4,987,439 | | | | 4,990,506 | | | | (3,067 | ) |
11/21/2016 | | State Street Bank & Trust Co. | | | HKD | | | | 1,170,000 | | | | USD | | | | 150,885 | | | | 150,878 | | | | 7 | |
11/21/2016 | | State Street Bank & Trust Co. | | | JPY | | | | 323,010,000 | | | | USD | | | | 3,109,589 | | | | 3,082,334 | | | | 27,255 | |
11/21/2016 | | State Street Bank & Trust Co. | | | SEK | | | | 2,234,000 | | | | USD | | | | 252,065 | | | | 247,577 | | | | 4,488 | |
11/21/2016 | | State Street Bank & Trust Co. | | | USD | | | | 282,310 | | | | AUD | | | | 370,000 | | | | 281,285 | | | | (1,025 | ) |
11/21/2016 | | State Street Bank & Trust Co. | | | USD | | | | 309,018 | | | | CHF | | | | 306,000 | | | | 309,559 | | | | 541 | |
11/21/2016 | | State Street Bank & Trust Co. | | | USD | | | | 540,440 | | | | GBP | | | | 441,000 | | | | 539,910 | | | | (530 | ) |
11/21/2016 | | State Street Bank & Trust Co. | | | USD | | | | 1,255,207 | | | | HKD | | | | 9,735,000 | | | | 1,255,382 | | | | 175 | |
11/21/2016 | | State Street Bank & Trust Co. | | | USD | | | | 82,192 | | | | JPY | | | | 8,532,000 | | | | 81,417 | | | | (775 | ) |
11/21/2016 | | State Street Bank & Trust Co. | | | USD | | | | 1,406,167 | | | | KRW | | | | 1,588,907,000 | | | | 1,388,676 | | | | (17,491 | ) |
11/21/2016 | | State Street Bank & Trust Co. | | | USD | | | | 249,231 | | | | SEK | | | | 2,239,000 | | | | 248,131 | | | | (1,100 | ) |
12/09/2016 | | Barclays Bank PLC | | | AUD | | | | 5,526,667 | | | | USD | | | | 4,202,008 | | | | 4,199,590 | | | | 2,418 | |
12/09/2016 | | Barclays Bank PLC | | | CAD | | | | 9,675,841 | | | | USD | | | | 7,310,604 | | | | 7,216,112 | | | | 94,492 | |
12/09/2016 | | Barclays Bank PLC | | | CNY | | | | 27,091,931 | | | | USD | | | | 4,032,683 | | | | 3,985,978 | | | | 46,705 | |
12/09/2016 | | Barclays Bank PLC | | | EUR | | | | 3,952,724 | | | | SEK | | | | 38,074,000 | | | | 4,414,863 | | | | (123,007 | ) |
12/09/2016 | | Barclays Bank PLC | | | USD | | | | 4,023,056 | | | | INR | | | | 270,950,007 | | | | 4,040,080 | | | | 17,024 | |
12/09/2016 | | Deutsche Bank Securities Inc. | | | AUD | | | | 200,000 | | | | USD | | | | 149,816 | | | | 151,976 | | | | (2,160 | ) |
12/09/2016 | | Deutsche Bank Securities Inc. | | | CNY | | | | 1,339,100 | | | | USD | | | | 198,621 | | | | 197,019 | | | | 1,602 | |
12/09/2016 | | Deutsche Bank Securities Inc. | | | JPY | | | | 156,291,000 | | | | USD | | | | 1,517,957 | | | | 1,492,644 | | | | 25,313 | |
12/09/2016 | | Deutsche Bank Securities Inc. | | | NZD | | | | 3,956,000 | | | | USD | | | | 2,886,013 | | | | 2,824,505 | | | | 61,508 | |
12/09/2016 | | Deutsche Bank Securities Inc. | | | USD | | | | 191,229 | | | | CLP | | | | 129,300,000 | | | | 197,372 | | | | 6,143 | |
12/09/2016 | | Deutsche Bank Securities Inc. | | | USD | | | | 169,554 | | | | INR | | | | 11,482,200 | | | | 171,209 | | | | 1,655 | |
12/09/2016 | | Goldman Sachs International | | | AUD | | | | 77,000 | | | | USD | | | | 58,868 | | | | 58,510 | | | | 358 | |
12/09/2016 | | Goldman Sachs International | | | GBP | | | | 4,182,575 | | | | NOK | | | | 41,809,433 | | | | 5,196,268 | | | | (62,762 | ) |
12/09/2016 | | Goldman Sachs International | | | NOK | | | | 41,809,433 | | | | GBP | | | | 4,168,770 | | | | 5,104,243 | | | | 45,854 | |
12/09/2016 | | Goldman Sachs International | | | NZD | | | | 102,000 | | | | USD | | | | 73,995 | | | | 72,826 | | | | 1,169 | |
12/09/2016 | | Goldman Sachs International | | | USD | | | | 1,432,925 | | | | AUD | | | | 1,893,000 | | | | 1,438,448 | | | | 5,523 | |
12/09/2016 | | Goldman Sachs International | | | USD | | | | 5,562,987 | | | | CLP | | | | 3,757,400,000 | | | | 5,735,552 | | | | 172,565 | |
12/09/2016 | | Goldman Sachs International | | | USD | | | | 892,301 | | | | KRW | | | | 986,617,000 | | | | 862,113 | | | | (30,188 | ) |
12/09/2016 | | Goldman Sachs International | | | USD | | | | 1,877,770 | | | | RUB | | | | 118,660,045 | | | | 1,852,052 | | | | (25,718 | ) |
01/13/2017 | | Barclays Bank PLC | | | AUD | | | | 4,990,918 | | | | USD | | | | 3,772,675 | | | | 3,789,278 | | | | (16,603 | ) |
01/13/2017 | | Barclays Bank PLC | | | CAD | | | | 12,098,857 | | | | USD | | | | 9,144,192 | | | | 9,026,372 | | | | 117,820 | |
01/13/2017 | | Barclays Bank PLC | | | EUR | | | | 4,957,228 | | | | GBP | | | | 4,482,400 | | | | 5,654,996 | | | | 34,343 | |
01/13/2017 | | Barclays Bank PLC | | | EUR | | | | 3,953,483 | | | | SEK | | | | 38,074,000 | | | | 4,414,863 | | | | (123,322 | ) |
01/13/2017 | | Barclays Bank PLC | | | GBP | | | | 23,470,668 | | | | USD | | | | 29,186,090 | | | | 28,776,143 | | | | 409,947 | |
01/13/2017 | | Barclays Bank PLC | | | JPY | | | | 146,063,981 | | | | USD | | | | 1,413,677 | | | | 1,397,446 | | | | 16,231 | |
01/13/2017 | | Barclays Bank PLC | | | RUB | | | | 10,369,801 | | | | USD | | | | 163,099 | | | | 160,368 | | | | 2,731 | |
01/13/2017 | | Barclays Bank PLC | | | USD | | | | 5,785,502 | | | | CLP | | | | 3,886,700,000 | | | | 5,917,328 | | | | 131,826 | |
01/13/2017 | | Barclays Bank PLC | | | USD | | | | 4,184,739 | | | | INR | | | | 282,432,207 | | | | 4,191,094 | | | | 6,355 | |
01/13/2017 | | Goldman Sachs International | | | EUR | | | | 367,479 | | | | GBP | | | | 332,800 | | | | 411,374 | | | | 3,183 | |
01/13/2017 | | Goldman Sachs International | | | EUR | | | | 15,874,018 | | | | USD | | | | 17,835,253 | | | | 17,488,122 | | | | 347,131 | |
01/13/2017 | | Goldman Sachs International | | | GBP | | | | 4,179,146 | | | | NOK | | | | 41,809,433 | | | | 5,196,268 | | | | (62,766 | ) |
See accompanying Notes to Consolidated Financial Statements which are an integral part of the financial statements.
32 Invesco Global Targeted Returns Fund
| | | | | | | | | | | | | | | | | | | | | | | | | | |
| Open Forward Foreign Currency Contracts—(continued) | |
Settlement
Date | | Counterparty | | Contract to | | | Notional
Value | | | Unrealized
Appreciation
(Depreciation) | |
| | | | | | Deliver | | | | | | Receive | | | |
01/13/2017 | | Goldman Sachs International | | | NOK | | | | 41,809,433 | | | | GBP | | | | 4,165,406 | | �� | $ | 5,100,124 | | | $ | 45,920 | |
01/13/2017 | | Goldman Sachs International | | | USD | | | | 1,863,468 | | | | RUB | | | | 118,660,045 | | | | 1,835,064 | | | | (28,404 | ) |
01/13/2017 | | State Street Bank & Trust Co. | | | CHF | | | | 3,243,522 | | | | USD | | | | 3,328,465 | | | | 3,292,708 | | | | 35,757 | |
01/13/2017 | | State Street Bank & Trust Co. | | | CNY | | | | 28,431,031 | | | | USD | | | | 4,203,104 | | | | 4,166,105 | | | | 36,999 | |
01/13/2017 | | State Street Bank & Trust Co. | | | EUR | | | | 3,029,029 | | | | CHF | | | | 3,307,200 | | | | 3,394,960 | | | | 20,324 | |
01/13/2017 | | State Street Bank & Trust Co. | | | NZD | | | | 4,058,000 | | | | USD | | | | 2,896,247 | | | | 2,893,770 | | | | 2,477 | |
01/13/2017 | | State Street Bank & Trust Co. | | | SEK | | | | 17,701,212 | | | | USD | | | | 2,061,585 | | | | 1,967,599 | | | | 93,986 | |
Total Forward Foreign Currency Contracts — Currency Risk | | | | | | | | | | | | | | | | | | | $ | 1,688,018 | |
Currency Abbreviations:
| | |
| AUD | | – Australian Dollar |
| CAD | | – Canadian Dollar |
| CHF | | – Swiss Franc |
| CLP | | — Chilean Peso |
| CNY | | – Chinese Yuan |
| EUR | | – Euro |
| GBP | | – British Pound Sterling |
| HKD | | – Hong Kong Dollar |
| IDR | | – Indonesian Rupiah |
| INR | | – Indian Rupee |
| JPY | | – Japanese Yen |
| KRW | | – South Korean Won |
| MYR | | – Malaysian Ringgit |
| NOK | | – Norwegian Krone |
| NZD | | – New Zealand Dollar |
| PHP | | – Philippine Peso |
| RUB | | – Russian Ruble |
| SEK | | – Swedish Krona |
| SGD | | – Singapore Dollar |
| THB | | – Thai Baht |
| TWD | | – New Taiwan Dollar |
| USD | | – U.S. Dollar |
See accompanying Notes to Consolidated Financial Statements which are an integral part of the financial statements.
33 Invesco Global Targeted Returns Fund
Consolidated Statement of Assets and Liabilities
October 31, 2016
| | | | |
Assets: | |
Investments, at value (Cost $44,578,462) | | $ | 38,872,586 | |
Investments in affiliated underlying funds, at value (Cost $166,652,297) | | | 165,041,807 | |
Total investments, at value (Cost $211,230,759) | | | 203,914,393 | |
Cash | | | 262,407 | |
Foreign currencies, at value (Cost $9,975,398) | | | 9,977,733 | |
Receivable for: | | | | |
Deposits with brokers | | | 12,935,262 | |
Investments sold | | | 466,268 | |
Variation margin — futures | | | 52,466 | |
Fund shares sold | | | 327,081 | |
Dividends and interest | | | 440,043 | |
Fund expenses absorbed | | | 160,675 | |
Investment for trustee deferred compensation and retirement plans | | | 6,385 | |
Unrealized appreciation on forward foreign currency contracts outstanding | | | 2,531,597 | |
Unrealized appreciation on swap agreements — OTC | | | 7,877,715 | |
Other assets | | | 64,717 | |
Total assets | | | 239,016,742 | |
|
Liabilities: | |
Payable for: | | | | |
Investments purchased | | | 340,729 | |
Investments purchased — affiliated funds | | | 120,408 | |
Fund shares reacquired | | | 543,346 | |
Options written, at value (premiums received $7,811,691) | | | 5,792,764 | |
Variation margin — centrally cleared swap agreements | | | 578,677 | |
Accrued fees to affiliates | | | 67,016 | |
Accrued trustees’ and officers’ fees and benefits | | | 1,929 | |
Accrued other operating expenses | | | 121,833 | |
Trustee deferred compensation and retirement plans | | | 6,385 | |
Unrealized depreciation on forward foreign currency contracts outstanding | | | 843,579 | |
Unrealized depreciation on swap agreements — OTC | | | 9,488,756 | |
Total liabilities | | | 17,905,422 | |
Net assets applicable to shares outstanding | | $ | 221,111,320 | |
|
Net assets consist of: | |
Shares of beneficial interest | | $ | 220,280,528 | |
Undistributed net investment income | | | 1,324,142 | |
Undistributed net realized gain | | | 5,463,279 | |
Net unrealized appreciation (depreciation) | | | (5,956,629 | ) |
| | | $ | 221,111,320 | |
| | | | |
Net Assets: | |
Class A | | $ | 29,308,842 | |
Class C | | $ | 16,428,238 | |
Class R | | $ | 16,501 | |
Class Y | | $ | 175,284,091 | |
Class R5 | | $ | 63,284 | |
Class R6 | | $ | 10,364 | |
|
Shares outstanding, $0.01 par value per share,
with an unlimited number of shares authorized: | |
Class A | | | 2,839,020 | |
Class C | | | 1,621,070 | |
Class R | | | 1,607 | |
Class Y | | | 16,905,810 | |
Class R5 | | | 6,101 | |
Class R6 | | | 1,000 | |
Class A: | | | | |
Net asset value per share | | $ | 10.32 | |
Maximum offering price per share | | | | |
(Net asset value of $10.32 ¸ 94.50%) | | $ | 10.92 | |
Class C: | | | | |
Net asset value and offering price per share | | $ | 10.13 | |
Class R: | | | | |
Net asset value and offering price per share | | $ | 10.27 | |
Class Y: | | | | |
Net asset value and offering price per share | | $ | 10.37 | |
Class R5: | | | | |
Net asset value and offering price per share | | $ | 10.37 | |
Class R6: | | | | |
Net asset value and offering price per share | | $ | 10.36 | |
See accompanying Notes to Consolidated Financial Statements which are an integral part of the financial statements.
34 Invesco Global Targeted Returns Fund
Consolidated Statement of Operations
For the year ended October 31, 2016
| | | | |
Investment income: | |
Dividends from affiliated underlying funds | | $ | 2,652,880 | |
Interest | | | 814,645 | |
Total investment income | | | 3,467,525 | |
| |
Expenses: | | | | |
Advisory fees | | | 2,859,497 | |
Administrative services fees | | | 50,000 | |
Custodian fees | | | 58,910 | |
Distribution fees: | | | | |
Class A | | | 70,356 | |
Class C | | | 140,399 | |
Class R | | | 52 | |
Transfer agent fees — A, C, R and Y | | | 186,333 | |
Transfer agent fees — R5 | | | 57 | |
Transfer agent fees — R6 | | | 51 | |
Trustees’ and officers’ fees and benefits | | | 21,221 | |
Registration and filing fees | | | 117,905 | |
Reports to shareholders | | | 41,772 | |
Professional services fees | | | 94,051 | |
Pricing fees | | | 506,678 | |
Other | | | 51,012 | |
Total expenses | | | 4,198,294 | |
Less: Fees waived and expenses reimbursed | | | (1,973,231 | ) |
Net expenses | | | 2,225,063 | |
Net investment income | | | 1,242,462 | |
| |
Realized and unrealized gain (loss) from: | | | | |
Net realized gain (loss) from: | | | | |
Investment securities | | | 4,406,384 | |
Distributions from affiliated funds | | | 815,988 | |
Foreign currencies | | | (412,258 | ) |
Forward foreign currency contracts | | | 6,704,693 | |
Futures contracts | | | (3,967,263 | ) |
Option contracts written | | | 4,336,634 | |
Swap agreements | | | (5,011,919 | ) |
| | | | 6,872,259 | |
Change in net unrealized appreciation (depreciation) of: | | | | |
Investment securities | | | (4,646,092 | ) |
Investment securities — affiliated funds | | | 33,566 | |
Foreign currencies | | | 121,760 | |
Forward foreign currency contracts | | | 1,685,777 | |
Futures contracts | | | 852,147 | |
Option contracts written | | | 1,620,831 | |
Swap agreements | | | (4,027,776 | ) |
| | | | (4,359,787 | ) |
Net realized and unrealized gain | | | 2,512,472 | |
Net increase in net assets resulting from operations | | $ | 3,754,934 | |
See accompanying Notes to Consolidated Financial Statements which are an integral part of the financial statements.
35 Invesco Global Targeted Returns Fund
Consolidated Statement of Changes in Net Assets
For the years ended October 31, 2016 and 2015
| | | | | | | | |
| | | 2016 | | | 2015 | |
Operations: | | | | | |
Net investment income | | $ | 1,242,462 | | | $ | 141,342 | |
Net realized gain | | | 6,872,259 | | | | 1,837,190 | |
Change in net unrealized appreciation (depreciation) | | | (4,359,787 | ) | | | (2,738,913 | ) |
Net increase (decrease) in net assets resulting from operations | | | 3,754,934 | | | | (760,381 | ) |
| | |
Distributions to shareholders from net investment income: | | | | | | | | |
Class A | | | (146,529 | ) | | | (77,701 | ) |
Class C | | | (38,269 | ) | | | (3,526 | ) |
Class R | | | (47 | ) | | | (54 | ) |
Class Y | | | (947,623 | ) | | | (99,329 | ) |
Class R5 | | | (528 | ) | | | (15,936 | ) |
Class R6 | | | (68,481 | ) | | | (54,412 | ) |
Total distributions from net investment income | | | (1,201,477 | ) | | | (250,958 | ) |
| | |
Distributions to shareholders from net realized gains: | | | | | | | | |
Class A | | | (319,531 | ) | | | (141,226 | ) |
Class C | | | (139,306 | ) | | | (7,470 | ) |
Class R | | | (138 | ) | | | (104 | ) |
Class Y | | | (1,480,056 | ) | | | (168,145 | ) |
Class R5 | | | (825 | ) | | | (26,976 | ) |
Class R6 | | | (106,958 | ) | | | (92,109 | ) |
Total distributions from net realized gains | | | (2,046,814 | ) | | | (436,030 | ) |
| | |
Share transactions–net: | | | | | | | | |
Class A | | | 5,549,639 | | | | 10,666,445 | |
Class C | | | 4,942,790 | | | | 11,241,310 | |
Class R | | | 6,231 | | | | — | |
Class Y | | | 77,180,742 | | | | 82,057,343 | |
Class R5 | | | 1,126 | | | | (2,648,324 | ) |
Class R6 | | | (8,126,492 | ) | | | (1,151,548 | ) |
Net increase in net assets resulting from share transactions | | | 79,554,036 | | | | 100,165,226 | |
Net increase in net assets | | | 80,060,679 | | | | 98,717,857 | |
| | |
Net assets: | | | | | | | | |
Beginning of year | | | 141,050,641 | | | | 42,332,784 | |
End of year (includes undistributed net investment income of $1,324,142 and $(75,216), respectively) | | $ | 221,111,320 | | | $ | 141,050,641 | |
Notes to Consolidated Financial Statements
October 31, 2016
NOTE 1—Significant Accounting Policies
Invesco Global Targeted Returns Fund (the “Fund”) is a series portfolio of AIM Investment Funds (Invesco Investment Funds) (the “Trust”). The Trust is organized as a Delaware statutory trust and is registered under the Investment Company Act of 1940, as amended (the “1940 Act”), as an open-end series management investment company consisting of twenty-two separate series portfolios, each authorized to issue an unlimited number of shares of beneficial interest. The assets, liabilities and operations of each portfolio are accounted for separately. Information presented in these financial statements pertains only to the Fund. Matters affecting each portfolio or class will be voted on exclusively by the shareholders of such portfolio or class.
The Fund will seek to gain exposure to the commodity markets primarily through investments in the Invesco Cayman Commodity Fund VII Ltd. (the “Subsidiary”), a wholly-owned subsidiary of the Fund organized under the laws of the Cayman Islands. The Subsidiary was organized by the Fund to invest in commodity-linked derivatives and other securities that may provide leveraged and non-leveraged exposure to commodities. The Fund may invest up to 25% of its total assets in the Subsidiary.
The Fund’s investment objective is to seek a positive total return over the long term in all market environments.
36 Invesco Global Targeted Returns Fund
The Fund currently consists of six different classes of shares: Class A, Class C, Class R, Class Y, Class R5 and Class R6. Class Y shares are available only to certain investors. Class A shares are sold with a front-end sales charge unless certain waiver criteria are met and under certain circumstances load waived shares may be subject to contingent deferred sales charges (“CDSC”). Class C shares are sold with a CDSC. Class R, Class Y, Class R5 and Class R6 shares are sold at net asset value.
The following is a summary of the significant accounting policies followed by the Fund in the preparation of its financial statements.
| A. | Security Valuations — Securities, including restricted securities, are valued according to the following policy. |
A security listed or traded on an exchange (except convertible securities) is valued at its last sales price or official closing price as of the close of the customary trading session on the exchange where the security is principally traded, or lacking any sales or official closing price on a particular day, the security may be valued at the closing bid price on that day. Securities traded in the over-the-counter market are valued based on prices furnished by independent pricing services or market makers. When such securities are valued by an independent pricing service they may be considered fair valued. Futures contracts are valued at the final settlement price set by an exchange on which they are principally traded. Listed options are valued at the mean between the last bid and asked prices from the exchange on which they are principally traded. Options not listed on an exchange are valued by an independent source at the mean between the last bid and asked prices. For purposes of determining net asset value (“NAV”) per share, futures and option contracts generally are valued 15 minutes after the close of the customary trading session of the New York Stock Exchange (“NYSE”).
Investments in open-end and closed-end registered investment companies that do not trade on an exchange are valued at the end-of-day net asset value per share. Investments in open-end and closed-end registered investment companies that trade on an exchange are valued at the last sales price or official closing price as of the close of the customary trading session on the exchange where the security is principally traded.
Swap agreements are fair valued using an evaluated quote, if available, provided by an independent pricing service. Evaluated quotes provided by the pricing service are valued based on a model which may include end-of-day net present values, spreads, ratings, industry, company performance and returns of referenced assets.
Debt obligations (including convertible securities) and unlisted equities are fair valued using an evaluated quote provided by an independent pricing service. Evaluated quotes provided by the pricing service may be determined without exclusive reliance on quoted prices, and may reflect appropriate factors such as institution-size trading in similar groups of securities, developments related to specific securities, dividend rate (for unlisted equities), yield (for debt obligations), quality, type of issue, coupon rate (for debt obligations), maturity (for debt obligations), individual trading characteristics and other market data. Debt obligations are subject to interest rate and credit risks. In addition, all debt obligations involve some risk of default with respect to interest and/or principal payments.
Foreign securities’ (including foreign exchange contracts) prices are converted into U.S. dollar amounts using the applicable exchange rates as of the close of the NYSE. If market quotations are available and reliable for foreign exchange-traded equity securities, the securities will be valued at the market quotations. Because trading hours for certain foreign securities end before the close of the NYSE, closing market quotations may become unreliable. If between the time trading ends on a particular security and the close of the customary trading session on the NYSE, events occur that the Adviser determines are significant and make the closing price unreliable, the Fund may fair value the security. If the event is likely to have affected the closing price of the security, the security will be valued at fair value in good faith using procedures approved by the Board of Trustees. Adjustments to closing prices to reflect fair value may also be based on a screening process of an independent pricing service to indicate the degree of certainty, based on historical data, that the closing price in the principal market where a foreign security trades is not the current value as of the close of the NYSE. Foreign securities’ prices meeting the approved degree of certainty that the price is not reflective of current value will be priced at the indication of fair value from the independent pricing service. Multiple factors may be considered by the independent pricing service in determining adjustments to reflect fair value and may include information relating to sector indices, American Depositary Receipts and domestic and foreign index futures. Foreign securities may have additional risks including exchange rate changes, potential for sharply devalued currencies and high inflation, political and economic upheaval, the relative lack of issuer information, relatively low market liquidity and the potential lack of strict financial and accounting controls and standards.
Securities for which market prices are not provided by any of the above methods may be valued based upon quotes furnished by independent sources. The last bid price may be used to value equity securities. The mean between the last bid and asked prices is used to value debt obligations, including corporate loans.
Securities for which market quotations are not readily available or became unreliable are valued at fair value as determined in good faith by or under the supervision of the Trust’s officers following procedures approved by the Board of Trustees. Issuer specific events, market trends, bid/asked quotes of brokers and information providers and other market data may be reviewed in the course of making a good faith determination of a security’s fair value.
The Fund may invest in securities that are subject to interest rate risk, meaning the risk that the prices will generally fall as interest rates rise and, conversely, the prices will generally rise as interest rates fall. Specific securities differ in their sensitivity to changes in interest rates depending on their individual characteristics. Changes in interest rates may result in increased market volatility, which may affect the value and/or liquidity of certain Fund investments.
Valuations change in response to many factors including the historical and prospective earnings of the issuer, the value of the issuer’s assets, general economic conditions, interest rates, investor perceptions and market liquidity. Because of the inherent uncertainties of valuation, the values reflected in the financial statements may materially differ from the value received upon actual sale of those investments.
| B. | Securities Transactions and Investment Income — Securities transactions are accounted for on a trade date basis. Realized gains or losses on sales are computed on the basis of specific identification of the securities sold. Interest income (net of withholding tax, if any) is recorded on the accrual basis from settlement date. Dividend income (net of withholding tax, if any) is recorded on the ex-dividend date. Bond premiums and discounts are amortized and/or accreted for financial reporting purposes. |
The Fund may periodically participate in litigation related to Fund investments. As such, the Fund may receive proceeds from litigation settlements. Any proceeds received are included in the Consolidated Statement of Operations as realized gain (loss) for investments no longer held and as unrealized gain (loss) for investments still held.
Brokerage commissions and mark ups are considered transaction costs and are recorded as an increase to the cost basis of securities purchased and/or a reduction of proceeds on a sale of securities. Such transaction costs are included in the determination of net realized and
37 Invesco Global Targeted Returns Fund
unrealized gain (loss) from investment securities reported in the Consolidated Statement of Operations and the Consolidated Statement of Changes in Net Assets and the net realized and unrealized gains (losses) on securities per share in the Financial Highlights. Transaction costs are included in the calculation of the Fund’s net asset value and, accordingly, they reduce the Fund’s total returns. These transaction costs are not considered operating expenses and are not reflected in net investment income reported in the Consolidated Statement of Operations and the Consolidated Statement of Changes in Net Assets, or the net investment income per share and the ratios of expenses and net investment income reported in the Financial Highlights, nor are they limited by any expense limitation arrangements between the Fund and the investment adviser.
The Fund allocates income and realized and unrealized capital gains and losses to a class based on the relative net assets of each class.
| C. | Country Determination — For the purposes of making investment selection decisions and presentation in the Consolidated Schedule of Investments, the investment adviser may determine the country in which an issuer is located and/or credit risk exposure based on various factors. These factors include the laws of the country under which the issuer is organized, where the issuer maintains a principal office, the country in which the issuer derives 50% or more of its total revenues and the country that has the primary market for the issuer’s securities, as well as other criteria. Among the other criteria that may be evaluated for making this determination are the country in which the issuer maintains 50% or more of its assets, the type of security, financial guarantees and enhancements, the nature of the collateral and the sponsor organization. Country of issuer and/or credit risk exposure has been determined to be the United States of America, unless otherwise noted. |
| D. | Distributions — Distributions from net investment income and net realized capital gain, if any, are generally declared and paid annually and recorded on the ex-dividend date. The Fund may elect to treat a portion of the proceeds from redemptions as distributions for federal income tax purposes. |
| E. | Federal Income Taxes — The Fund intends to comply with the requirements of Subchapter M of the Internal Revenue Code of 1986, as amended (the “Internal Revenue Code”), necessary to qualify as a regulated investment company and to distribute substantially all of the Fund’s taxable earnings to shareholders. As such, the Fund will not be subject to federal income taxes on otherwise taxable income (including net realized capital gain) that is distributed to shareholders. Therefore, no provision for federal income taxes is recorded in the consolidated financial statements. |
The Fund recognizes the tax benefits of uncertain tax positions only when the position is more likely than not to be sustained. Management has analyzed the Fund’s uncertain tax positions and concluded that no liability for unrecognized tax benefits should be recorded related to uncertain tax positions. Management is not aware of any tax positions for which it is reasonably possible that the total amounts of unrecognized tax benefits will change materially in the next 12 months.
The Subsidiary is classified as a controlled foreign corporation under Subchapter N of the Internal Revenue Code. Therefore, the Fund is required to increase its taxable income by its share of the Subsidiary’s income. Net investment losses of the Subsidiary cannot be deducted by the Fund in the current period nor carried forward to offset taxable income in future periods.
The Fund files tax returns in the U.S. Federal jurisdiction and certain other jurisdictions. Generally the Fund is subject to examinations by such taxing authorities for up to three years after the filing of the return for the tax period.
| F. | Expenses — Fees provided for under the Rule 12b-1 plan of a particular class of the Fund are charged to the operations of such class. Transfer agency fees and expenses and other shareholder recordkeeping fees and expenses attributable to Class R5 and Class R6 are allocated to each share class based on relative net assets. Sub-accounting fees attributable to Class R5 are charged to the operations of the class. Transfer agency fees and expenses and other shareholder recordkeeping fees and expenses relating to all other classes are allocated among those classes based on relative net assets. All other expenses are allocated among the classes based on relative net assets. |
| G. | Accounting Estimates — The financial statements are prepared on a consolidated basis in conformity with accounting principles generally accepted in the United States of America (“GAAP”), which requires management to make estimates and assumptions that affect the reported amounts of assets and liabilities at the date of the financial statements and the reported amounts of revenues and expenses during the reporting period including estimates and assumptions related to taxation. Actual results could differ from those estimates by a significant amount. The accompanying financial statements reflect the financial position of the Fund and its Subsidiary and the results of operations on a consolidated basis. All inter-company accounts and transactions have been eliminated in consolidation. |
In addition, the Fund monitors for material events or transactions that may occur or become known after the period-end date and before the date the consolidated financial statements are released to print.
| H. | Indemnifications — Under the Trust’s organizational documents, each Trustee, officer, employee or other agent of the Trust, and under the Subsidiary’s organizational documents, the directors and officers of the Subsidiary, are indemnified against certain liabilities that may arise out of the performance of their duties to the Fund and/or the Subsidiary, respectively. Additionally, in the normal course of business, the Fund enters into contracts, including the Fund’s servicing agreements, that contain a variety of indemnification clauses. The Fund’s maximum exposure under these arrangements is unknown as this would involve future claims that may be made against the Fund that have not yet occurred. The risk of material loss as a result of such indemnification claims is considered remote. |
| I. | Foreign Currency Translations — Foreign currency is valued at the close of the NYSE based on quotations posted by banks and major currency dealers. Portfolio securities and other assets and liabilities denominated in foreign currencies are translated into U.S. dollar amounts at date of valuation. Purchases and sales of portfolio securities (net of foreign taxes withheld on disposition) and income items denominated in foreign currencies are translated into U.S. dollar amounts on the respective dates of such transactions. The Fund does not separately account for the portion of the results of operations resulting from changes in foreign exchange rates on investments and the fluctuations arising from changes in market prices of securities held. The combined results of changes in foreign exchange rates and the fluctuation of market prices on investments (net of estimated foreign tax withholding) are included with the net realized and unrealized gain or loss from investments in the Consolidated Statement of Operations. Reported net realized foreign currency gains or losses arise from (1) sales of foreign currencies, (2) currency gains or losses realized between the trade and settlement dates on securities transactions, and (3) the difference between the amounts of dividends, interest, and foreign withholding taxes recorded on the Fund’s books and the U.S. dollar equivalent of the amounts actually received or paid. Net unrealized foreign currency gains and losses arise from changes in the fair values of assets and liabilities, other than investments in securities at fiscal period end, resulting from changes in exchange rates. |
The Fund may invest in foreign securities, which may be subject to foreign taxes on income, gains on investments or currency repatriation, a portion of which may be recoverable. Foreign taxes, if any, are recorded based on the tax regulations and rates that exist in the foreign markets in which the Fund invests and are shown in the Consolidated Statement of Operations.
38 Invesco Global Targeted Returns Fund
| J. | Forward Foreign Currency Contracts — The Fund may engage in foreign currency transactions either on a spot (i.e. for prompt delivery and settlement) basis, or through forward foreign currency contracts, to manage or minimize currency or exchange rate risk. |
The Fund may also enter into forward foreign currency contracts for the purchase or sale of a security denominated in a foreign currency in order to “lock in” the U.S. dollar price of that security, or the Fund may also enter into forward foreign currency contracts that do not provide for physical settlement of the two currencies, but instead are settled by a single cash payment calculated as the difference between the agreed upon exchange rate and the spot rate at settlement based upon an agreed upon notional amount (non-deliverable forwards). The Fund will set aside liquid assets in an amount equal to the daily mark-to-market obligation for forward foreign currency contracts.
A forward foreign currency contract is an obligation between two parties (“Counterparties”) to purchase or sell a specific currency for an agreed-upon price at a future date. The use of forward foreign currency contracts does not eliminate fluctuations in the price of the underlying securities the Fund owns or intends to acquire but establishes a rate of exchange in advance. Fluctuations in the value of these contracts are measured by the difference in the contract date and reporting date exchange rates and are recorded as unrealized appreciation (depreciation) until the contracts are closed. When the contracts are closed, realized gains (losses) are recorded. Realized and unrealized gains (losses) on the contracts are included in the Consolidated Statement of Operations. The primary risks associated with forward foreign currency contracts include failure of the Counterparty to meet the terms of the contract and the value of the foreign currency changing unfavorably. These risks may be in excess of the amounts reflected in the Consolidated Statement of Assets and Liabilities.
| K. | Futures Contracts — The Fund may enter into futures contracts for investment purposes or to manage exposure to interest rate, equity and market price movements and/or currency risks. A futures contract is an agreement between Counterparties to purchase or sell a specified underlying security, currency or commodity (or delivery of a cash settlement price, in the case of an index future) for a fixed price at a future date. The Fund currently invests only in exchange-traded futures and they are standardized as to maturity date and underlying financial instrument. Initial margin deposits required upon entering into futures contracts are satisfied by the segregation of specific securities or cash as collateral at the futures commission merchant (broker). During the period the futures contracts are open, changes in the value of the contracts are recognized as unrealized gains or losses by recalculating the value of the contracts on a daily basis. Subsequent or variation margin payments are received or made depending upon whether unrealized gains or losses are incurred. These amounts are reflected as receivables or payables on the Consolidated Statement of Assets and Liabilities. When the contracts are closed or expire, the Fund recognizes a realized gain or loss equal to the difference between the proceeds from, or cost of, the closing transaction and the Fund’s basis in the contract. The net realized gain (loss) and the change in unrealized gain (loss) on futures contracts held during the period is included on the Consolidated Statement of Operations. The primary risks associated with futures contracts are market risk and the absence of a liquid secondary market. If the Fund were unable to liquidate a futures contract and/or enter into an offsetting closing transaction, the Fund would continue to be subject to market risk with respect to the value of the contracts and continue to be required to maintain the margin deposits on the futures contracts. Futures contracts have minimal Counterparty risk since the exchange’s clearinghouse, as Counterparty to all exchange-traded futures, guarantees the futures against default. Risks may exceed amounts recognized in the Consolidated Statement of Assets and Liabilities. |
| L. | Call Options Purchased and Written — The Fund may write call options and/or buy call options. Options written by the Fund normally will have expiration dates between three and nine months from the date written. The exercise price of a call option may be below, equal to, or above the current market value of the underlying security at the time the option is written. |
Additionally, the Fund may enter into an option on a swap agreement, also called a “swaption”. A swaption is an option that gives the buyer the right, but not the obligation, to enter into a swap on a future date in exchange for paying a market-based premium. A receiver swaption gives the owner the right to receive the total return of a specified asset, reference rate or index. Swaptions also include options that allow an existing swap to be terminated or extended by one of the Counterparties.
When the Fund writes a covered call option, an amount equal to the premium received by the Fund is recorded as an asset and an equivalent liability in the Consolidated Statement of Assets and Liabilities. The amount of the liability is subsequently “marked-to-market” to reflect the current market value of the option written. If a written covered call option expires on the stipulated expiration date, or if the Fund enters into a closing purchase transaction, the Fund realizes a gain (or a loss if the closing purchase transaction exceeds the premium received when the option was written) without regard to any unrealized gain or loss on the underlying security, and the liability related to such option is extinguished. If a written covered call option is exercised, the Fund realizes a gain or a loss from the sale of the underlying security and the proceeds of the sale are increased by the premium originally received. Realized and unrealized gains and losses on these contracts are included in the Consolidated Statement of Operations. A risk in writing a covered call option is that the Fund gives up the opportunity for profit if the market price of the security increases and the option is exercised.
When the Fund buys a call option, an amount equal to the premium paid by the Fund is recorded as an investment on the Consolidated Statement of Assets and Liabilities. The amount of the investment is subsequently “marked-to-market” to reflect the current value of the option purchased. Realized and unrealized gains and losses on these contracts are included in the Consolidated Statement of Operations. A risk in buying an option is that the Fund pays a premium whether or not the option is exercised. In addition, there can be no assurance that a liquid secondary market will exist for any option purchased.
| M. | Put Options Purchased and Written — The Fund may purchase and write put options including options on securities indexes, or foreign currency and/or futures contracts. By purchasing a put option, the Fund obtains the right (but not the obligation) to sell the option’s underlying instrument at a fixed strike price. In return for this right, the Fund pays an option premium. The option’s underlying instrument may be a security, securities index, or a futures contract. Put options may be used by the Fund to hedge securities it owns by locking in a minimum price at which the Fund can sell. If security prices fall, the put option could be exercised to offset all or a portion of the Fund’s resulting losses. At the same time, because the maximum the Fund has at risk is the cost of the option, purchasing put options does not eliminate the potential for the Fund to profit from an increase in the value of the underlying portfolio securities. The Fund may write put options to earn additional income in the form of option premiums if it expects the price of the underlying instrument to remain stable or rise during the option period so that the option will not be exercised. The risk in this strategy is that the price of the underlying securities may decline by an amount greater than the premium received. Put options written are reported as a liability in the Consolidated Statement of Assets and Liabilities. Realized and unrealized gains and losses on put options purchased and put options written are included in the Consolidated Statement of Operations as Net realized gain (loss) from and Change in net unrealized appreciation (depreciation) of from Investment securities and Option contracts written, respectively. A risk in buying an option is |
39 Invesco Global Targeted Returns Fund
| | that the Fund pays a premium whether or not the option is exercised. In addition, there can be no assurance that a liquid secondary market will exist for any option purchased. |
| N. | Swap Agreements — The Fund may enter into various swap transactions, including interest rate, total return, volatility, variance, index, currency and credit default swap contracts (“CDS”) for investment purposes or to manage interest rate, equity, currency or credit risk. Such transactions are agreements between Counterparties. A swap agreement may be negotiated bilaterally and traded over-the-counter (“OTC”) between two parties (“uncleared/OTC”) or, in some instances, must be transacted through a future commission merchant (“FCM”) and cleared through a clearinghouse that serves as a central Counterparty (“centrally cleared swap”). These agreements may contain among other conditions, events of default and termination events, and various covenants and representations such as provisions that require the Fund to maintain a pre-determined level of net assets, and/or provide limits regarding the decline of the Fund’s NAV over specific periods of time. If the Fund were to trigger such provisions and have open derivative positions at that time, the Counterparty may be able to terminate such agreement and request immediate payment in an amount equal to the net liability positions, if any. |
Interest rate, total return, volatility, variance, index and currency swap agreements are two-party contracts entered into primarily to exchange the returns (or differentials in rates of returns) earned or realized on particular predetermined investments or instruments. The gross returns to be exchanged or “swapped” between the parties are calculated with respect to a notional amount, i.e., the return on or increase in value of a particular dollar amount invested at a particular interest rate or return of an underlying asset, in a particular foreign currency, or in a “basket” of securities representing a particular index.
Inflation swap agreements are contracts in which one party agrees to pay the cumulative percentage increase in a price index, such as the Consumer Price Index, over the term of the swap, and the other party pays a compounded fixed rate.
In a centrally cleared swap, the Fund’s ultimate Counterparty is a central clearinghouse. The Fund will initially enter into centrally cleared swaps through an executing broker. When a fund enters into a centrally cleared swap, it must deliver to the central Counterparty (via the FCM) an amount referred to as “initial margin.” Initial margin requirements are determined by the central Counterparty, but an FCM may require additional initial margin above the amount required by the central Counterparty. Initial margin deposits required upon entering into centrally cleared swaps are satisfied by cash or securities as collateral at the FCM. Securities deposited as initial margin are designated on the Consolidated Schedule of Investments and cash deposited is recorded on the Consolidated Statement of Assets and Liabilities. During the term of a cleared swap agreement, a “variation margin” amount may be required to be paid by the Fund or may be received by the Fund, based on the daily change in price of the underlying reference instrument subject to the swap agreement and is recorded as a receivable or payable for variation margin in the Consolidated Statement of Assets and Liabilities until the centrally cleared swap is terminated, at which time a realized gain or loss is recorded.
A CDS is an agreement between Counterparties to exchange the credit risk of an issuer. A buyer of a CDS is said to buy protection by paying a fixed payment over the life of the agreement and in some situations an upfront payment to the seller of the CDS. If a defined credit event occurs (such as payment default or bankruptcy), the Fund as a protection buyer would cease paying its fixed payment, the Fund would deliver eligible bonds issued by the reference entity to the seller, and the seller would pay the full notional value, or the “par value”, of the referenced obligation to the Fund. A seller of a CDS is said to sell protection and thus would receive a fixed payment over the life of the agreement and an upfront payment, if applicable. If a credit event occurs, the Fund as a protection seller would cease to receive the fixed payment stream, the Fund would pay the buyer “par value” or the full notional value of the referenced obligation, and the Fund would receive the eligible bonds issued by the reference entity. In turn, these bonds may be sold in order to realize a recovery value. Alternatively, the seller of the CDS and its Counterparty may agree to net the notional amount and the market value of the bonds and make a cash payment equal to the difference to the buyer of protection. If no credit event occurs, the Fund receives the fixed payment over the life of the agreement. As the seller, the Fund would effectively add leverage to its portfolio because, in addition to its total net assets, the Fund would be subject to investment exposure on the notional amount of the CDS. In connection with these agreements, cash and securities may be identified as collateral in accordance with the terms of the respective swap agreements to provide assets of value and recourse in the event of default under the swap agreement or bankruptcy/insolvency of a party to the swap agreement. If a Counterparty becomes bankrupt or otherwise fails to perform its obligations due to financial difficulties, the Fund may experience significant delays in obtaining any recovery in a bankruptcy or other reorganization proceeding. The Fund may obtain only limited recovery or may obtain no recovery in such circumstances. The Fund’s maximum risk of loss from Counterparty risk, either as the protection seller or as the protection buyer, is the value of the contract. The risk may be mitigated by having a master netting arrangement between the Fund and the Counterparty and by the designation of collateral by the Counterparty to cover the Fund’s exposure to the Counterparty.
Implied credit spreads represent the current level at which protection could be bought or sold given the terms of the existing CDS contract and serve as an indicator of the current status of the payment/performance risk of the CDS. An implied spread that has widened or increased since entry into the initial contract may indicate a deteriorating credit profile and increased risk of default for the reference entity. A declining or narrowing spread may indicate an improving credit profile or decreased risk of default for the reference entity. Alternatively, credit spreads may increase or decrease reflecting the general tolerance for risk in the credit markets.
A volatility swap involves an exchange between the Fund and a Counterparty of periodic payments based on the measured volatility of an underlying security, currency, commodity, interest rate, index or other reference asset over a specified time frame. Depending on the structure of the swap, either the Fund’s or the Counterparty’s payment obligation will typically be based on the realized volatility of the reference asset as measured by changes in its price or level over a specified time period, while the other party’s payment obligation will be based on a specified rate representing expected volatility for the reference asset at the time the swap is executed, or the measured volatility of a different reference asset over a specified time period. The Fund will typically make or lose money on a volatility swap depending on the magnitude of the reference asset’s volatility, or size of the movements in its price, over a specified time period, rather than general increases or decreases in the price of the reference asset. Volatility swaps are often used to speculate on future volatility levels, to trade the spread between realized and expected volatility, or to decrease the volatility exposure of other investments held by the Fund. Variance swaps are similar to volatility swaps, except payments are based on the difference between the implied and measured volatility mathematically squared.
An interest rate swap is an agreement between Counterparties pursuant to which the parties exchange a floating rate payment for a fixed rate payment based on a specified notional amount.
Changes in the value of centrally cleared and OTC swap agreements are recognized as unrealized gains (losses) in the Consolidated Statement of Operations by “marking to market” on a daily basis to reflect the value of the swap agreement at the end of each trading day. Payments
40 Invesco Global Targeted Returns Fund
received or paid at the beginning of the agreement are reflected as such on the Consolidated Statement of Assets and Liabilities and may be referred to as upfront payments. The Fund accrues for the fixed payment stream and amortizes upfront payments, if any, on swap agreements on a daily basis with the net amount, recorded as a component of realized gain (loss) on the Consolidated Statement of Operations. A liquidation payment received or made at the termination of a swap agreement is recorded as realized gain (loss) on the Consolidated Statement of Operations. The Fund segregates cash or liquid securities having a value at least equal to the amount of the potential obligation of the Fund under any swap transaction. Cash held as collateral is recorded as deposits with brokers on the Consolidated Statement of Assets and Liabilities. Entering into these agreements involves, to varying degrees, lack of liquidity and elements of credit, market, and Counterparty risk in excess of amounts recognized on the Consolidated Statement of Assets and Liabilities. Such risks involve the possibility that a swap is difficult to sell or liquidate, the Counterparty does not honor its obligations under the agreement and unfavorable interest rates and market fluctuations. It is possible that developments in the swaps market, including potential government regulation, could adversely affect the Fund’s ability to terminate existing swap agreements or to realize amounts to be received under such agreements. A short position in a security poses more risk than holding the same security long. As there is no limit on how much the price of the security can increase, the Fund’s exposure is unlimited.
Notional amounts of each individual credit default swap agreement outstanding as of October 31, 2016 for which the Fund is the seller of protection are disclosed in the open swap agreements table. These potential amounts would be partially offset by any recovery values of the respective referenced obligations, upfront payments received upon entering into the agreement, or net amounts received from the settlement of buy protection credit default swap agreements entered into by the Fund for the same referenced entity or entities.
| O. | Other Risks — The Fund is non-diversified and may invest in securities of fewer issuers than if it were diversified. Thus, the value of the Fund’s shares may vary more widely and the Fund may be subject to greater market and credit risk than if the Fund invested more broadly. |
The Fund will seek to gain exposure to commodity markets primarily through an investment in the Subsidiary and through investments in exchange-traded funds and commodity-linked derivatives. The Subsidiary, unlike the Fund, may invest without limitation in commodities, commodity-linked derivatives and other securities, such as exchange-traded notes, that may provide leveraged and non-leveraged exposure to commodity markets. The Fund is indirectly exposed to the risks associated with the Subsidiary’s investments.
| P. | Leverage Risk — Leverage exists when the Fund can lose more than it originally invests because it purchases or sells an instrument or enters into a transaction without investing an amount equal to the full economic exposure of the instrument or transaction. |
| Q. | Collateral — To the extent the Fund has designated or segregated a security as collateral and that security is subsequently sold, it is the Fund’s practice to replace such collateral no later than the next business day. |
NOTE 2—Advisory Fees and Other Fees Paid to Affiliates
The Trust has entered into a master investment advisory agreement with Invesco Advisers, Inc. (the “Adviser” or “Invesco”). Under the terms of the investment advisory agreement, the Fund pays an advisory fee to the Adviser based on the annual rate of the Fund’s average daily net assets as follows:
| | | | |
| Average Daily Net Assets | | Rate | |
First $10 billion | | | 1.50% | |
Over $10 billion | | | 1.25% | |
For the year ended October 31, 2016, the effective advisory fees incurred by the Fund was 1.50%.
The Subsidiary has entered into a separate contract with the Adviser whereby the Adviser provides investment advisory and other services to the Subsidiary. In consideration of these services, the Subsidiary pays an advisory fee to the Adviser based on the annual rate of the Subsidiary’s average daily net assets as set forth in the table above.
Under the terms of a master sub-advisory agreement between the Adviser and each of Invesco Asset Management Deutschland GmbH, Invesco Asset Management Limited, Invesco Asset Management (Japan) Limited, Invesco Hong Kong Limited, Invesco Senior Secured Management, Inc., Invesco Canada Ltd. and a sub-advisory agreement with Invesco PowerShares Capital Management, LLC (collectively, the “Affiliated Sub-Advisers”) the Adviser, not the Fund, will pay 40% of the fees paid to the Adviser to any such Affiliated Sub-Adviser(s) that provide(s) discretionary investment management services to the Fund based on the percentage of assets allocated to such Affiliated Sub-Adviser(s).
Effective March 1, 2016, the Adviser has contractually agreed, through at least February 28, 2017, to waive advisory fees and/or reimburse expenses to the extent necessary to limit total annual fund operating expenses after fee waiver and/or expense reimbursement (excluding certain items discussed below) of Class A, Class C, Class R, Class Y, Class R5 and Class R6 shares to 1.65%, 2.40%, 1.90%, 1.40%, 1.40% and 1.40%, respectively, of average daily net assets (the “expense limits”). Prior to March 1, 2016, the Adviser had contractually agreed to waive advisory fees and/or reimburse expenses to the extent necessary to limit total annual fund operating expenses after fee waiver and/or expense reimbursement (excluding certain items discussed below) of Class A, Class C, Class R, Class Y, Class R5 and Class R6 shares to 1.71%, 2.46%, 1.96%, 1.46%, 1.46% and 1.46%, respectively, of average daily net assets. In determining the Adviser’s obligation to waive advisory fees and/or reimburse expenses, the following expenses are not taken into account, and could cause total annual fund operating expenses after fee waiver and/or expense reimbursement to exceed the numbers reflected above: (1) interest; (2) taxes; (3) dividend expense on short sales; (4) extraordinary or non-routine items, including litigation expenses; and (5) expenses that the Fund has incurred but did not actually pay because of an expense offset arrangement. Acquired Fund Fees and Expenses are not operating expenses of the Fund directly, but are fees and expenses, including management fees of the investment companies in which the Fund invests. As a result, the total annual fund operating expenses after expense reimbursement may exceed the expense limits above. Unless Invesco continues the fee waiver agreement, it will terminate on February 28, 2017. During its term, the fee waiver agreement cannot be terminated or amended to increase the expense limits without approval of the Board of Trustees.
Further, the Adviser has contractually agreed, through at least June 30, 2018, to waive the advisory fee payable by the Fund in an amount equal to 100% of the net advisory fees the Adviser receives on the Fund’s investments in certain affiliated funds.
For the year ended October 31, 2016, the Adviser waived advisory fees of $1,786,789 and reimbursed class level expenses of $28,491, $14,214, $10, $143,619, $57 and $51 of Class A, Class C, Class R, Class Y, Class R5 and Class R6 shares, respectively.
41 Invesco Global Targeted Returns Fund
The Trust has entered into a master administrative services agreement with Invesco pursuant to which the Fund has agreed to pay Invesco for certain administrative costs incurred in providing accounting services to the Fund. For the year ended October 31, 2016, expenses incurred under the agreement are shown in the Consolidated Statement of Operations as Administrative services fees.
The Trust has entered into a transfer agency and service agreement with Invesco Investment Services, Inc. (“IIS”) pursuant to which the Fund has agreed to pay IIS a fee for providing transfer agency and shareholder services to the Fund and reimburse IIS for certain expenses incurred by IIS in the course of providing such services. IIS may make payments to intermediaries that provide omnibus account services, sub-accounting services and/or networking services. All fees payable by IIS to intermediaries that provide omnibus account services or sub-accounting are charged back to the Fund, subject to certain limitations approved by the Trust’s Board of Trustees. For the year ended October 31, 2016, expenses incurred under the agreement are shown in the Consolidated Statement of Operations as Transfer agent fees.
The Trust has entered into master distribution agreements with Invesco Distributors, Inc. (“IDI”) to serve as the distributor for the Class A, Class C, Class R, Class Y, Class R5 and Class R6 shares of the Fund. The Trust has adopted plans pursuant to Rule 12b-1 under the 1940 Act with respect to the Fund’s Class A, Class C and Class R shares (collectively, the “Plans”). The Fund, pursuant to the Plans, pays IDI compensation at the annual rate of 0.25% of the Fund’s average daily net assets of Class A shares, 1.00% of the average daily net assets of Class C shares and 0.50% of the average daily net assets of Class R shares. Of the Plan payments, up to 0.25% of the average daily net assets of each class of shares may be paid to furnish continuing personal shareholder services to customers who purchase and own shares of such classes. Any amounts not paid as a service fee under the Plans would constitute an asset-based sales charge. Rules of the Financial Industry Regulatory Authority (“FINRA”) impose a cap on the total sales charges, including asset-based sales charges, that may be paid by any class of shares of the Fund. For the year ended October 31, 2016, expenses incurred under the Plans are shown in the Consolidated Statement of Operations as Distribution fees.
Front-end sales commissions and CDSC (collectively, the “sales charges”) are not recorded as expenses of the Fund. Front-end sales commissions are deducted from proceeds from the sales of Fund shares prior to investment in Class A shares of the Fund. CDSC are deducted from redemption proceeds prior to remittance to the shareholder. During the year ended October 31, 2016, IDI advised the Fund that IDI retained $4,078 in front-end sales commissions from the sale of Class A shares and $1 and $6,289 from Class A and Class C shares, respectively, for CDSC imposed upon redemptions by shareholders.
Certain officers and trustees of the Trust are officers and directors of the Adviser, IIS and/or IDI.
NOTE 3—Additional Valuation Information
GAAP defines fair value as the price that would be received to sell an asset or paid to transfer a liability in an orderly transaction between market participants at the measurement date, under current market conditions. GAAP establishes a hierarchy that prioritizes the inputs to valuation methods, giving the highest priority to readily available unadjusted quoted prices in an active market for identical assets (Level 1) and the lowest priority to significant unobservable inputs (Level 3), generally when market prices are not readily available or are unreliable. Based on the valuation inputs, the securities or other investments are tiered into one of three levels. Changes in valuation methods may result in transfers in or out of an investment’s assigned level:
| | Level 1 — | Prices are determined using quoted prices in an active market for identical assets. |
| | Level 2 — | Prices are determined using other significant observable inputs. Observable inputs are inputs that other market participants may use in pricing a security. These may include quoted prices for similar securities, interest rates, prepayment speeds, credit risk, yield curves, loss severities, default rates, discount rates, volatilities and others. |
| | Level 3 — | Prices are determined using significant unobservable inputs. In situations where quoted prices or observable inputs are unavailable (for example, when there is little or no market activity for an investment at the end of the period), unobservable inputs may be used. Unobservable inputs reflect the Fund’s own assumptions about the factors market participants would use in determining fair value of the securities or instruments and would be based on the best available information. |
The following is a summary of the tiered valuation input levels, as of October 31, 2016. The level assigned to the securities valuations may not be an indication of the risk or liquidity associated with investing in those securities. Because of the inherent uncertainties of valuation, the values reflected in the financial statements may materially differ from the value received upon actual sale of those investments.
| | | | | | | | | | | | | | | | |
| | | Level 1 | | | Level 2 | | | Level 3 | | | Total | |
Mutual Funds | | $ | 99,482,643 | | | $ | — | | | $ | — | | | $ | 99,482,643 | |
Money Market Funds | | | 65,559,164 | | | | — | | | | — | | | | 65,559,164 | |
Sovereign Debt | | | — | | | | 28,274,718 | | | | — | | | | 28,274,718 | |
Options Purchased | | | 4,856,090 | | | | 5,741,778 | | | | — | | | | 10,597,868 | |
| | | | 169,897,897 | | | | 34,016,496 | | | | — | | | | 203,914,393 | |
Forward Foreign Currency Contracts* | | | — | | | | 1,688,018 | | | | — | | | | 1,688,018 | |
Futures Contracts* | | | 4,056 | | | | — | | | | — | | | | 4,056 | |
Options Written* | | | (309,754 | ) | | | (5,483,010 | ) | | | — | | | | (5,792,764 | ) |
Swap Agreements* | | | — | | | | (2,333,872 | ) | | | — | | | | (2,333,872 | ) |
Total Investments | | $ | 169,592,199 | | | $ | 27,887,632 | | | $ | — | | | $ | 197,479,831 | |
| * | Forward foreign currency contracts, futures contracts and swap agreements are valued at unrealized appreciation (depreciation). Options written are shown at value. |
42 Invesco Global Targeted Returns Fund
NOTE 4—Derivative Investments
The Fund may enter into an International Swaps and Derivatives Association Master Agreement (“ISDA Master Agreement”) under which a Fund may trade OTC derivatives. An OTC transaction entered into under an ISDA Master Agreement typically involves a collateral posting arrangement, payment netting provisions and close-out netting provisions. These netting provisions allow for reduction of credit risk through netting of contractual obligations. The enforceability of the netting provisions of the ISDA Master Agreement depends on the governing law of the ISDA Master Agreement, among other factors.
For financial reporting purposes, the Fund does not offset OTC derivative assets or liabilities that are subject to ISDA Master Agreements in the Consolidated Statement of Assets and Liabilities.
Value of Derivative Investments at Period-End
The table below summarizes the value of the Fund’s derivative investments, detailed by primary risk exposure, held as of October 31, 2016:
| | | | | | | | | | | | | | | | | | | | | | | | |
| | | Value | |
| Derivative Assets | | Commodity
Risk | | | Credit
Risk | | | Currency
Risk | | | Equity
Risk | | | Interest Rate
Risk | | | Total | |
Unrealized appreciation on futures contracts — Exchange-Traded(a) | | $ | — | | | $ | — | | | $ | — | | | $ | 2,096,556 | | | $ | 1,471 | | | $ | 2,098,027 | |
Unrealized appreciation on swap agreements — Centrally Cleared(a) | | | — | | | | 59,887 | | | | — | | | | — | | | | 8,678,958 | | | | 8,738,845 | |
Unrealized appreciation on swap agreements — OTC | | | 103,293 | | | | — | | | | 1,409,684 | | | | 5,107,659 | | | | 1,257,079 | | | | 7,877,715 | |
Options purchased, at value — Exchange-Traded(b) | | | — | | | | — | | | | — | | | | 4,856,090 | | | | — | | | | 4,856,090 | |
Options purchased, at value — OTC(b) | | | — | | | | — | | | | 3,818,045 | | | | 1,923,733 | | | | — | | | | 5,741,778 | |
Unrealized appreciation on forward foreign currency contracts outstanding | | | — | | | | — | | | | 2,531,597 | | | | — | | | | — | | | | 2,531,597 | |
Total Derivative Assets | | | 103,293 | | | | 59,887 | | | | 7,759,326 | | | | 13,984,038 | | | | 9,937,508 | | | | 31,844,052 | |
Derivatives not subject to master netting agreements | | | — | | | | (59,887 | ) | | | — | | | | (6,952,646 | ) | | | (8,680,429 | ) | | | (15,692,962 | ) |
Total Derivative Assets subject to master netting agreements | | $ | 103,293 | | | $ | — | | | $ | 7,759,326 | | | $ | 7,031,392 | | | $ | 1,257,079 | | | $ | 16,151,090 | |
| |
| | | Value | |
| Derivative Liabilities | | Commodity
Risk | | | Credit
Risk | | | Currency
Risk | | | Equity
Risk | | | Interest Rate
Risk | | | Total | |
Unrealized depreciation on futures contracts — Exchange-Traded(a) | | $ | — | | | $ | — | | | $ | — | | | $ | (1,055,272 | ) | | $ | (1,038,699 | ) | | $ | (2,093,971 | ) |
Unrealized depreciation on swap agreements — Centrally Cleared(a) | | | — | | | | (183,214 | ) | | | — | | | | — | | | | (9,278,462 | ) | | | (9,461,676 | ) |
Unrealized depreciation on swap agreements — OTC | | | — | | | | — | | | | (1,698,696 | ) | | | (5,282,991 | ) | | | (2,507,069 | ) | | | (9,488,756 | ) |
Options written, at value — Exchange-Traded | | | — | | | | — | | | | — | | | | (309,754 | ) | | | — | | | | (309,754 | ) |
Options written, at value — OTC | | | — | | | | — | | | | (3,743,433 | ) | | | (1,739,576 | ) | | | — | | | | (5,483,009 | ) |
Unrealized depreciation on forward foreign currency contracts outstanding | | | — | | | | — | | | | (843,579 | ) | | | — | | | | — | | | | (843,579 | ) |
Total Derivative Liabilities | | | — | | | | (183,214 | ) | | | (6,285,708 | ) | | | (8,387,593 | ) | | | (12,824,230 | ) | | | (27,680,745 | ) |
Derivatives not subject to master netting agreements | | | — | | | | 183,214 | | | | — | | | | 1,365,026 | | | | 10,317,161 | | | | 11,865,401 | |
Total Derivative Liabilities subject to master netting agreements | | $ | — | | | $ | — | | | $ | (6,285,708 | ) | | $ | (7,022,567 | ) | | $ | (2,507,069 | ) | | $ | (15,815,344 | ) |
| (a) | Includes cumulative appreciation (depreciation) on futures contracts and centrally cleared swap agreements. Only current day’s variation margin receivable (payable) is reported within the Consolidated Statement of Assets and Liabilities. |
| (b) | Options purchased, at value as reported in the Consolidated Schedule of Investments. |
43 Invesco Global Targeted Returns Fund
Offsetting Assets and Liabilities
The table below reflects the Fund’s exposure to Counterparties subject to either an ISDA Master Agreement or other agreement for OTC derivative transactions as of October 31, 2016.
| | | | | | | | | | | | | | | | | | | | | | | | | | | | | | | | | | | | | | | | | | | | | | | | |
| | | Financial Derivative Assets | | | Financial Derivative Liabilities | | | Net value of
derivatives | | | Collateral
(Received)/Pledged | | | Net
amount(a) | |
| | | Forward
foreign
currency
contracts | | | Options
purchased | | | Swap
agreements | | | Total
assets | | | Forward
foreign
currency
contracts | | | Options
written | | | Swap
agreements | | | Total
liabilities | | | | | | |
| Counterparty | | | | | | | | | | | Non-Cash | | | Cash | | |
Fund | | | | | | | | | | | | | | | | | | | | | | | | | | | | | | | | | | | | | | | | | | | | | | | | |
Bank of America Merrill Lynch | | $ | — | | | $ | 88,610 | | | $ | 99,675 | | | $ | 188,285 | | | $ | — | | | $ | (57,488 | ) | | $ | — | | | $ | (57,488 | ) | | $ | 130,797 | | | $ | — | | | $ | (130,797 | ) | | $ | — | |
Barclays Bank PLC | | | 1,246,816 | | | | 546,629 | | | | 31,012 | | | | 1,824,457 | | | | (470,740 | ) | | | (1,064,281 | ) | | | (29,830 | ) | | | (1,564,851 | ) | | | 259,606 | | | | — | | | | — | | | | 259,606 | |
BNP Paribas S.A. | | | — | | | | — | | | | 459,038 | | | | 459,038 | | | | — | | | | — | | | | (582,915 | ) | | | (582,915 | ) | | | (123,877 | ) | | | — | | | | — | | | | (123,877 | ) |
Citigroup Global Markets Inc. | | | — | | | | 129,420 | | | | — | | | | 129,420 | | | | (6,356 | ) | | | (452,033 | ) | | | — | | | | (458,389 | ) | | | (328,969 | ) | | | — | | | | 290,000 | | | | (38,969 | ) |
Deutsche Bank Securities Inc. | | | 214,365 | | | | 723,866 | | | | 427,378 | | | | 1,365,609 | | | | (4,322 | ) | | | (256,107 | ) | | | (248,235 | ) | | | (508,664 | ) | | | 856,945 | | | | — | | | | (630,000 | ) | | | 226,945 | |
Goldman Sachs International | | | 774,933 | | | | 3,526,895 | | | | 1,439,863 | | | | 5,741,691 | | | | (329,981 | ) | | | (3,158,954 | ) | | | (1,218,080 | ) | | | (4,707,015 | ) | | | 1,034,676 | | | | — | | | | (660,000 | ) | | | 374,676 | |
HSBC New York | | | — | | | | — | | | | 587,766 | | | | 587,766 | | | | — | | | | — | | | | (402,007 | ) | | | (402,007 | ) | | | 185,759 | | | | — | | | | (185,759 | ) | | | — | |
J.P. Morgan Chase Bank, N.A. | | | — | | | | — | | | | 407,975 | | | | 407,975 | | | | (1,760 | ) | | | — | | | | (761,346 | ) | | | (763,106 | ) | | | (355,131 | ) | | | — | | | | 250,000 | | | | (105,131 | ) |
Morgan Stanley Capital Services LLC | | | — | | | | 725,941 | | | | 430,961 | | | | 1,156,902 | | | | — | | | | (493,196 | ) | | | (318,809 | ) | | | (812,005 | ) | | | 344,897 | | | | — | | | | (330,000 | ) | | | 14,897 | |
Royal Bank of Scotland Securities Inc. | | | — | | | | — | | | | 67,977 | | | | 67,977 | | | | — | | | | — | | | | (43,990 | ) | | | (43,990 | ) | | | 23,987 | | | | — | | | | — | | | | 23,987 | |
Societe Generale | | | — | | | | — | | | | 2,442,755 | | | | 2,442,755 | | | | — | | | | — | | | | (3,071,415 | ) | | | (3,071,415 | ) | | | (628,660 | ) | | | — | | | | 620,000 | | | | (8,660 | ) |
State Street Bank & Trust Co. | | | 295,483 | | | | — | | | | — | | | | 295,483 | | | | (30,420 | ) | | | — | | | | — | | | | (30,420 | ) | | | 265,063 | | | | — | | | | — | | | | 265,063 | |
UBS | | | — | | | | 417 | | | | 122,943 | | | | 123,360 | | | | — | | | | (950 | ) | | | (305,060 | ) | | | (306,010 | ) | | | (182,650 | ) | | | — | | | | 120,000 | | | | (62,650 | ) |
Subtotal — Fund | | | 2,531,597 | | | | 5,741,778 | | | | 6,517,343 | | | | 14,790,718 | | | | (843,579 | ) | | | (5,483,009 | ) | | | (6,981,687 | ) | | | (13,308,275 | ) | | | 1,482,443 | | | | — | | | | (656,556 | ) | | | 825,887 | |
| | | | | | | | | | | | |
Subsidiary | | | | | | | | | | | | | | | | | | | | | | | | | | | | | | | | | | | | | | | | | | | | | | | | |
Barclays Bank PLC | | | — | | | | — | | | | 97,325 | | | | 97,325 | | | | — | | | | — | | | | (87,271 | ) | | | (87,271 | ) | | | 10,054 | | | | — | | | | — | | | | 10,054 | |
Citigroup Global Markets Inc. | | | — | | | | — | | | | 79,100 | | | | 79,100 | | | | — | | | | — | | | | (156,578 | ) | | | (156,578 | ) | | | (77,478 | ) | | | — | | | | — | | | | (77,478 | ) |
Deutsche Bank Securities Inc. | | | — | | | | — | | | | 326,764 | | | | 326,764 | | | | — | | | | — | | | | (761,623 | ) | | | (761,623 | ) | | | (434,859 | ) | | | — | | | | 400,000 | | | | (34,859 | ) |
Goldman Sachs International | | | — | | | | — | | | | 214,684 | | | | 214,684 | | | | — | | | | — | | | | (368,848 | ) | | | (368,848 | ) | | | (154,164 | ) | | | — | | | | 90,000 | | | | (64,164 | ) |
Macquarie Bank Ltd. | | | — | | | | — | | | | 103,293 | | | | 103,293 | | | | — | | | | — | | | | — | | | | — | | | | 103,293 | | | | — | | | | — | | | | 103,293 | |
Morgan Stanley Capital Services LLC | | | — | | | | — | | | | 539,206 | | | | 539,206 | | | | — | | | | — | | | | (1,132,749 | ) | | | (1,132,749 | ) | | | (593,543 | ) | | | — | | | | 570,000 | | | | (23,543 | ) |
Subtotal — Subsidiary | | | — | | | | — | | | | 1,360,372 | | | | 1,360,372 | | | | — | | | | — | | | | (2,507,069 | ) | | | (2,507,069 | ) | | | (1,146,697 | ) | | | — | | | | 1,060,000 | | | | (86,697 | ) |
Total | | $ | 2,531,597 | | | $ | 5,741,778 | | | $ | 7,877,715 | | | $ | 16,151,090 | | | $ | (843,579 | ) | | $ | (5,483,009 | ) | | $ | (9,488,756 | ) | | $ | (15,815,344 | ) | | $ | 335,746 | | | $ | — | | | $ | 403,444 | | | $ | 739,190 | |
| (a) | The Fund and the Subsidiary are recognized as separate legal entities and as such are subject to separate netting arrangements with the Counterparty. |
Effect of Derivative Investments for the year ended October 31, 2016
The table below summarizes the gains (losses) on derivative investments, detailed by primary risk exposure, recognized in earnings during the period:
| | | | | | | | | | | | | | | | | | | | | | | | |
| | | Location of Gain (Loss) on Consolidated Statement of Operations | |
| | | Commodity
Risk | | | Credit
Risk | | | Currency
Risk | | | Equity
Risk | | | Interest Rate
Risk | | | Total | |
Realized Gain (Loss): | | | | | | | | | | | | | | | | | | | | | | | | |
Forward foreign currency contracts | | $ | — | | | $ | — | | | $ | 6,704,693 | | | $ | — | | | $ | — | | | $ | 6,704,693 | |
Futures contracts | | | — | | | | — | | | | — | | | | (4,125,529 | ) | | | 158,266 | | | | (3,967,263 | ) |
Options purchased(a) | | | — | | | | — | | | | (1,473,799 | ) | | | 5,334,045 | | | | 202,954 | | | | 4,063,200 | |
Options written | | | — | | | | — | | | | 4,285,067 | | | | (1,392,390 | ) | | | 1,443,957 | | | | 4,336,634 | |
Swap agreements | | | (333,539 | ) | | | (37,112 | ) | | | 103,943 | | | | 669,327 | | | | (5,414,538 | ) | | | (5,011,919 | ) |
Change in Net Unrealized Appreciation (Depreciation): | | | | | | | | | | | | | | | | | | | | | | | | |
Forward foreign currency contracts | | | — | | | | — | | | | 1,685,777 | | | | — | | | | — | | | | 1,685,777 | |
Futures contracts | | | — | | | | — | | | | — | | | | 1,889,375 | | | | (1,037,228 | ) | | | 852,147 | |
Options purchased(a) | | | — | | | | — | | | | (719,733 | ) | | | (2,716,097 | ) | | | 44,869 | | | | (3,390,961 | ) |
Options written | | | — | | | | — | | | | 745,838 | | | | 842,663 | | | | 32,330 | | | | 1,620,831 | |
Swap agreements | | | 103,293 | | | | (123,013 | ) | | | (878,447 | ) | | | (1,208,753 | ) | | | (1,920,856 | ) | | | (4,027,776 | ) |
Total | | $ | (230,246 | ) | | $ | (160,125 | ) | | $ | 10,453,339 | | | $ | (707,359 | ) | | $ | (6,490,246 | ) | | $ | 2,865,363 | |
| (a) | Options purchased are included in the net realized gain from investment securities and the change in net unrealized appreciation (depreciation) of investment securities. |
44 Invesco Global Targeted Returns Fund
The table below summarizes the average notional value of forward foreign currency contracts, futures contracts, options purchased, options written and swap agreements outstanding during the period.
| | | | | | | | | | | | | | | | | | | | | | | | | | | | |
| | | Forward
Foreign Currency
Contracts | | | Futures
Contracts | | | Index
Options
Purchased | | | Index
Options
Written | | | Foreign
Currency
Options | | | Swaptions(a) | | | Swap
Agreements | |
Average notional value | | $ | 218,768,607 | | | $ | 104,567,558 | | | $ | 172,923,865 | | | $ | 57,156,171 | | | $ | 211,057,909 | | | $ | 51,191,973 | | | $ | 630,281,303 | |
Average contracts | | | — | | | | — | | | | 6,476 | | | | 2,431 | | | | — | | | | — | | | | — | |
| (a) | Summarizes the ten month average notional value of swaptions contracts outstanding during the period. |
NOTE 5—Subsidiary Information
The Fund’s Consolidated Schedule of Investments includes the holdings, including any investments in derivatives, of both the Fund and the Subsidiary. The Fund’s Consolidated Statement of Assets and Liabilities, Consolidated Statement of Operations and Consolidated Statement of Changes in Net Assets include the account balances of both the Fund and the Subsidiary and all interfund transactions have been eliminated.
The table below summarizes the financial information of the Subsidiary recognized in the consolidated financial statements referred to above.
| | | | |
| Selected Financial Information | | Invesco Cayman
Commodity Fund VII Ltd
(the “Subsidiary”) | |
Total assets | | $ | 8,369,825 | |
Total liabilities | | | 2,510,530 | |
Net assets | | | 5,859,295 | |
Total investment income | | | 22,194 | |
Net investment income (loss) | | | (104,488 | ) |
Net realized gain (loss) from: | | | | |
Swap agreements | | | (177,476 | ) |
Change in net unrealized appreciation (depreciation) of: | | | | |
Foreign currencies | | | (11,532 | ) |
Swap agreements | | | (1,037,538 | ) |
Increase (decrease) in net assets resulting from operations | | $ | (1,331,034 | ) |
NOTE 6—Trustees’ and Officers’ Fees and Benefits
Trustees’ and Officers’ Fees and Benefits include amounts accrued by the Fund to pay remuneration to certain Trustees and Officers of the Fund. Trustees have the option to defer compensation payable by the Fund, and Trustees’ and Officers’ Fees and Benefits also include amounts accrued by the Fund to fund such deferred compensation amounts. Those Trustees who defer compensation have the option to select various Invesco Funds in which their deferral accounts shall be deemed to be invested. Obligations under the deferred compensation plan represent unsecured claims against the general assets of the Fund.
NOTE 7—Cash Balances
The Fund is permitted to temporarily carry a negative or overdrawn balance in its account with State Street Bank and Trust Company, the custodian bank. Such balances, if any at period-end, are shown in the Consolidated Statement of Assets and Liabilities under the payable caption Amount due custodian. To compensate the custodian bank for such overdrafts, the overdrawn Fund may either (1) leave funds as a compensating balance in the account so the custodian bank can be compensated by earning the additional interest; or (2) compensate by paying the custodian bank at a rate agreed upon by the custodian bank and Invesco, not to exceed the contractually agreed upon rate.
45 Invesco Global Targeted Returns Fund
NOTE 8—Distributions to Shareholders and Tax Components of Net Assets
Tax Character of Distributions to Shareholders Paid During the Fiscal Years Ended October 31, 2016 and 2015:
| | | | | | | | |
| | | 2016 | | | 2015 | |
Ordinary income | | $ | 2,702,286 | | | $ | 306,514 | |
Long-term capital gain | | | 546,005 | | | | 380,474 | |
Total distributions | | $ | 3,248,291 | | | $ | 686,988 | |
Tax Components of Net Assets at Period-End:
| | | | |
| | | 2016 | |
Undistributed ordinary income | | $ | 3,448,659 | |
Undistributed long-term gain | | | 4,170,753 | |
Net unrealized appreciation (depreciation) — investments | | | (7,389,148 | ) |
Net unrealized appreciation — other investments | | | 1,938,971 | |
Temporary book/tax differences | | | (1,338,443 | ) |
Shares of beneficial interest | | | 220,280,528 | |
Total net assets | | $ | 221,111,320 | |
The difference between book-basis and tax-basis unrealized appreciation (depreciation) is due to differences in the timing of recognition of gains and losses on investments for tax and book purposes. The Fund’s net unrealized appreciation (depreciation) difference is attributable primarily to wash sales.
The temporary book/tax differences are a result of timing differences between book and tax recognition of income and/or expenses. The Fund’s temporary book/tax differences are the result of the trustee deferral of compensation and retirement plan benefits.
Capital loss carryforward is calculated and reported as of a specific date. Results of transactions and other activity after that date may affect the amount of capital loss carryforward actually available for the Fund to utilize. Capital losses generated in years beginning after December 22, 2010 can be carried forward for an unlimited period, whereas previous losses expire in eight tax years. Capital losses with an expiration period may not be used to offset capital gains until all net capital losses without an expiration date have been utilized. Capital loss carryforwards with no expiration date will retain their character as either short-term or long-term capital losses instead of as short-term capital losses as under prior law. The ability to utilize capital loss carryforwards in the future may be limited under the Internal Revenue Code and related regulations based on the results of future transactions.
The Fund does not have a capital loss carryforward as of October 31, 2016.
NOTE 9—Investment Securities
The aggregate amount of investment securities (other than short-term securities, U.S. Treasury obligations and money market funds, if any) purchased and sold by the Fund during the year ended October 31, 2016 was $78,854,669 and $18,243,107, respectively. During the same period, purchases and sales of U.S. Treasury obligations were $7,254,630 and $8,365,095, respectively. Cost of investments on a tax basis includes the adjustments for financial reporting purposes as of the most recently completed federal income tax reporting period-end.
| | | | |
| Unrealized Appreciation (Depreciation) of Investment Securities on a Tax Basis | |
Aggregate unrealized appreciation of investment securities | | $ | 2,611,243 | |
Aggregate unrealized (depreciation) of investment securities | | | (10,009,391 | ) |
Net unrealized appreciation (depreciation) of investment securities | | $ | (7,398,148 | ) |
Cost of investments for tax purposes is $211,312,541.
NOTE 10—Reclassification of Permanent Differences
Primarily as a result of differing book/tax treatment of foreign currency transactions and income from derivative investments, on October 31, 2016, undistributed net investment income was increased by $1,358,373, undistributed net realized gain was decreased by $1,179,699 and shares of beneficial interest was decreased by $178,674. This reclassification had no effect on the net assets of the Fund.
46 Invesco Global Targeted Returns Fund
NOTE 11—Share Information
| | | | | | | | | | | | | | | | |
| | | Summary of Share Activity | |
| | | Years ended October 31, | |
| | | 2016(a) | | | 2015 | |
| | | Shares | | | Amount | | | Shares | | | Amount | |
Sold: | | | | | | | | | | | | | | | | |
Class A | | | 1,819,533 | | | $ | 18,661,287 | | | | 2,718,836 | | | $ | 28,480,858 | |
Class C | | | 1,066,269 | | | | 10,770,226 | | | | 1,193,463 | | | | 12,327,007 | |
Class R | | | 606 | | | | 6,231 | | | | — | | | | — | |
Class Y | | | 12,374,104 | | | | 127,479,975 | | | | 9,905,242 | | | | 103,429,009 | |
Class R5 | | | — | | | | — | | | | 3,477 | | | | 39,085 | |
| | | | |
Issued as reinvestment of dividends: | | | | | | | | | | | | | | | | |
Class A | | | 46,420 | | | | 466,060 | | | | 3,477 | | | | 35,775 | |
Class C | | | 17,883 | | | | 177,399 | | | | 965 | | | | 9,861 | |
Class Y | | | 221,333 | | | | 2,226,608 | | | | 7,638 | | | | 78,750 | |
Class R5 | | | 112 | | | | 1,126 | | | | 2,164 | | | | 22,311 | |
Class R6 | | | 17,417 | | | | 175,272 | | | | 12,225 | | | | 125,922 | |
| | | | |
Reacquired: | | | | | | | | | | | | | | | | |
Class A | | | (1,319,854 | ) | | | (13,577,708 | ) | | | (1,723,051 | ) | | | (17,850,188 | ) |
Class C | | | (593,471 | ) | | | (6,004,835 | ) | | | (106,890 | ) | | | (1,095,558 | ) |
Class Y | | | (5,106,862 | ) | | | (52,525,841 | ) | | | (2,058,678 | ) | | | (21,450,416 | ) |
Class R5 | | | — | | | | — | | | | (260,038 | ) | | | (2,709,720 | ) |
Class R6 | | | (793,730 | ) | | | (8,301,764 | ) | | | (124,001 | ) | | | (1,277,470 | ) |
Net increase in share activity | | | 7,749,760 | | | $ | 79,554,036 | | | | 9,574,829 | | | $ | 100,165,226 | |
| (a) | There are entities that are record owners of more than 5% of the outstanding shares of the Fund and in the aggregate own 73% of the outstanding shares of the Fund. IDI has an agreement with these entities to sell Fund shares. The Fund, Invesco and/or Invesco affiliates may make payments to these entities, which are considered to be related to the Fund, for providing services to the Fund, Invesco and/or Invesco affiliates including but not limited to services such as securities brokerage, distribution, third party record keeping and account servicing. The Fund has no knowledge as to whether all or any portion of the shares owned of record by these entities are also owned beneficially. |
47 Invesco Global Targeted Returns Fund
NOTE 12—Financial Highlights
The following schedule presents financial highlights for a share of the Fund outstanding throughout the periods indicated.
| | | | | | | | | | | | | | | | | | | | | | | | | | | | | | | | | | | | | | | | | | | | | | | | | | | | | | | | |
| | | Net asset
value,
beginning
of period | | | Net
investment
income
(loss)(a) | | | Net gains
on securities
(both
realized and
unrealized) | | | Total from
investment
operations | | | Dividends
from net
investment
income | | | Distributions
from net
realized
gains | | | Total
distributions | | | Net asset
value, end
of period | | | Total
return(b) | | | Net assets,
end of period
(000’s omitted) | | | Ratio of
expenses
to average
net assets
with fee waivers
and/or expenses
absorbed(c) | | | Ratio of
expenses
to average net
assets without
fee waivers
and/or expenses
absorbed | | | Ratio of net
investment
income (loss)
to average
net assets | | | Portfolio
turnover(d) | |
Class A | | | | | | | | | | | | | | | | | | | | | | | | | | | | | | | | | | | | | | | | | | | | | | | | | | | | | | | | |
Year ended 10/31/16 | | $ | 10.33 | | | $ | 0.05 | | | $ | 0.14 | | | $ | 0.19 | | | $ | (0.06 | ) | | $ | (0.14 | ) | | $ | (0.20 | ) | | $ | 10.32 | | | | 1.90 | % | | $ | 29,309 | | | | 1.31 | %(f) | | | 2.35 | %(f) | | | 0.51 | %(f) | | | 23 | % |
Year ended 10/31/15 | | | 10.44 | | | | 0.01 | | | | 0.04 | | | | 0.05 | | | | (0.06 | ) | | | (0.10 | ) | | | (0.16 | ) | | | 10.33 | | | | 0.49 | | | | 23,688 | | | | 1.33 | | | | 2.38 | | | | 0.05 | | | | 79 | |
Year ended 10/31/14(e) | | | 10.00 | | | | (0.02 | ) | | | 0.46 | | | | 0.44 | | | | — | | | | — | | | | — | | | | 10.44 | | | | 4.40 | | | | 13,504 | | | | 1.29 | (g) | | | 3.16 | (g) | | | (0.18 | )(g) | | | 20 | |
Class C | | | | | | | | | | | | | | | | | | | | | | | | | | | | | | | | | | | | | | | | | | | | | | | | | | | | | | | | |
Year ended 10/31/16 | | | 10.19 | | | | (0.02 | ) | | | 0.14 | | | | 0.12 | | | | (0.04 | ) | | | (0.14 | ) | | | (0.18 | ) | | | 10.13 | | | | 1.17 | | | | 16,428 | | | | 2.06 | (f) | | | 3.10 | (f) | | | (0.24 | )(f) | | | 23 | |
Year ended 10/31/15 | | | 10.37 | | | | (0.07 | ) | | | 0.04 | | | | (0.03 | ) | | | (0.05 | ) | | | (0.10 | ) | | | (0.15 | ) | | | 10.19 | | | | (0.27 | ) | | | 11,524 | | | | 2.08 | | | | 3.13 | | | | (0.70 | ) | | | 79 | |
Year ended 10/31/14(e) | | | 10.00 | | | | (0.08 | ) | | | 0.45 | | | | 0.37 | | | | — | | | | — | | | | — | | | | 10.37 | | | | 3.70 | | | | 444 | | | | 2.04 | (g) | | | 3.91 | (g) | | | (0.93 | )(g) | | | 20 | |
Class R | | | | | | | | | | | | | | | | | | | | | | | | | | | | | | | | | | | | | | | | | | | | | | | | | | | | | | | | |
Year ended 10/31/16 | | | 10.29 | | | | 0.03 | | | | 0.14 | | | | 0.17 | | | | (0.05 | ) | | | (0.14 | ) | | | (0.19 | ) | | | 10.27 | | | | 1.65 | | | | 17 | | | | 1.56 | (f) | | | 2.60 | (f) | | | 0.26 | (f) | | | 23 | |
Year ended 10/31/15 | | | 10.42 | | | | (0.02 | ) | | | 0.04 | | | | 0.02 | | | | (0.05 | ) | | | (0.10 | ) | | | (0.15 | ) | | | 10.29 | | | | 0.27 | | | | 10 | | | | 1.58 | | | | 2.63 | | | | (0.20 | ) | | | 79 | |
Year ended 10/31/14(e) | | | 10.00 | | | | (0.04 | ) | | | 0.46 | | | | 0.42 | | | | — | | | | — | | | | — | | | | 10.42 | | | | 4.20 | | | | 10 | | | | 1.54 | (g) | | | 3.41 | (g) | | | (0.43 | )(g) | | | 20 | |
Class Y | | | | | | | | | | | | | | | | | | | | | | | | | | | | | | | | | | | | | | | | | | | | | | | | | | | | | | | | |
Year ended 10/31/16 | | | 10.37 | | | | 0.08 | | | | 0.15 | | | | 0.23 | | | | (0.09 | ) | | | (0.14 | ) | | | (0.23 | ) | | | 10.37 | | | | 2.24 | | | | 175,284 | | | | 1.06 | (f) | | | 2.10 | (f) | | | 0.76 | (f) | | | 23 | |
Year ended 10/31/15 | | | 10.46 | | | | 0.03 | | | | 0.04 | | | | 0.07 | | | | (0.06 | ) | | | (0.10 | ) | | | (0.16 | ) | | | 10.37 | | | | 0.72 | | | | 97,703 | | | | 1.08 | | | | 2.13 | | | | 0.30 | | | | 79 | |
Year ended 10/31/14(e) | | | 10.00 | | | | 0.01 | | | | 0.45 | | | | 0.46 | | | | — | | | | — | | | | — | | | | 10.46 | | | | 4.60 | | | | 16,352 | | | | 1.04 | (g) | | | 2.91 | (g) | | | 0.07 | (g) | | | 20 | |
Class R5 | | | | | | | | | | | | | | | | | | | | | | | | | | | | | | | | | | | | | | | | | | | | | | | | | | | | | | | | |
Year ended 10/31/16 | | | 10.38 | | | | 0.08 | | | | 0.14 | | | | 0.22 | | | | (0.09 | ) | | | (0.14 | ) | | | (0.23 | ) | | | 10.37 | | | | 2.15 | | | | 63 | | | | 1.06 | (f) | | | 2.09 | (f) | | | 0.76 | (f) | | | 23 | |
Year ended 10/31/15 | | | 10.46 | | | | 0.03 | | | | 0.05 | | | | 0.08 | | | | (0.06 | ) | | | (0.10 | ) | | | (0.16 | ) | | | 10.38 | | | | 0.82 | | | | 62 | | | | 1.08 | | | | 2.07 | | | | 0.30 | | | | 79 | |
Year ended 10/31/14(e) | | | 10.00 | | | | 0.01 | | | | 0.45 | | | | 0.46 | | | | — | | | | — | | | | — | | | | 10.46 | | | | 4.60 | | | | 2,724 | | | | 1.04 | (g) | | | 2.87 | (g) | | | 0.07 | (g) | | | 20 | |
Class R6 | | | | | | | | | | | | | | | | | | | | | | | | | | | | | | | | | | | | | | | | | | | | | | | | | | | | | | | | |
Year ended 10/31/16 | | | 10.37 | | | | 0.08 | | | | 0.14 | | | | 0.22 | | | | (0.09 | ) | | | (0.14 | ) | | | (0.23 | ) | | | 10.36 | | | | 2.14 | | | | 10 | | | | 1.06 | (f) | | | 2.00 | (f) | | | 0.76 | (f) | | | 23 | |
Year ended 10/31/15 | | | 10.46 | | | | 0.03 | | | | 0.04 | | | | 0.07 | | | | (0.06 | ) | | | (0.10 | ) | | | (0.16 | ) | | | 10.37 | | | | 0.73 | | | | 8,063 | | | | 1.08 | | | | 2.07 | | | | 0.30 | | | | 79 | |
Year ended 10/31/14(e) | | | 10.00 | | | | 0.01 | | | | 0.45 | | | | 0.46 | | | | — | | | | — | | | | — | | | | 10.46 | | | | 4.60 | | | | 9,298 | | | | 1.04 | (g) | | | 2.87 | (g) | | | 0.07 | (g) | | | 20 | |
| (a) | Calculated using average shares outstanding. |
| (b) | Includes adjustments in accordance with accounting principles generally accepted in the United States of America and as such, the net asset value for financial reporting purposes and the returns based upon those net asset values may differ from the net asset value and returns for shareholder transactions. Does not include sales charges and is not annualized for periods less than one year, if applicable. |
| (c) | In addition to the fees and expenses which the Fund bears directly; the Fund indirectly bears a pro rata share of the fees and expenses of the underlying funds in which the Fund invests. Because the underlying funds have varied expenses and fee levels and the Fund may own different proportions at different times, the amount of fees and expenses incurred indirectly by the Fund will vary. Estimated underlying fund expenses are not expenses that are incurred directly by your Fund. They are expenses that are incurred directly by the underlying funds and are deducted from the value of the funds your Fund invests in. The effect of the estimated underlying fund expenses that you bear indirectly is included in your Fund’s total return. Estimated acquired fund fees from underlying funds were 0.42%, 0.44% and 0.50% for the years ended October 31, 2016 and 2015 and the period ended October 31, 2014. |
| (d) | Portfolio turnover is calculated at the fund level and is not annualized for periods less than one year, if applicable. |
| (e) | Commencement date of December 19, 2013. |
| (f) | Ratios are based on average daily net assets (000’s omitted) of $28,142, $14,040, $10, $141,865, $63 and $6,512 for Class A, Class C, Class R, Class Y, Class R5 and Class R6 shares, respectively. |
NOTE 13—Subsequent Event
Effective January 1, 2017, the Fund will pay an advisory fee to the Adviser based on the annual rate of the Fund’s average daily net assets as follows:
| | | | |
| Average Daily Net Assets | | Rate | |
| First $250 million | | | 1 | .10% |
| Next $250 million | | | 1 | .08% |
| Next $500 million | | | 1 | .05% |
| Next $1.5 billion | | | 1 | .03% |
| Next $2.5 billion | | | 1 | .00% |
| Next $2.5 billion | | | 0 | .98% |
| Next $2.5 billion | | | 0 | .95% |
Over $10 billion | | | 0 | .93% |
In addition, effective January 1, 2017, the Adviser has contractually agreed, through at least February 28, 2018, to waive advisory fees and/or reimburse expenses to the extent necessary to limit total annual fund operating expenses after fee waiver and/or expense reimbursement (excluding certain items discussed in Note 2) of Class A, Class C, Class R, Class Y, Class R5 and Class R6 shares to 1.44%, 2.19%, 1.69%, 1.19%, 1.19% and 1.19%, respectively, of the Fund’s average daily net assets.
48 Invesco Global Targeted Returns Fund
Report of Independent Registered Public Accounting Firm
To the Board of Trustees
and Shareholders of the Invesco Global Targeted Returns Fund:
In our opinion, the accompanying consolidated statement of assets and liabilities, including the consolidated schedule of investments, and the related consolidated statements of operations and of changes in net assets and the financial highlights present fairly, in all material respects, the consolidated financial position of the Invesco Global Targeted Returns Fund and its subsidiary (the “Fund”) as of October 31, 2016, the results of their operations for the year then ended, the changes in their net assets for each of the two years in the period then ended and the financial highlights for each of the two years in the period then ended and for the period December 19, 2013 (commencement of operations) through October 31, 2014, in conformity with accounting principles generally accepted in the United States of America. These consolidated financial statements and financial highlights (hereafter referred to as “financial statements”) are the responsibility of the Fund’s management. Our responsibility is to express an opinion on these financial statements based on our audits. We conducted our audits of these financial statements in accordance with the standards of the Public Company Accounting Oversight Board (United States). Those standards require that we plan and perform the audit to obtain reasonable assurance about whether the financial statements are free of material misstatement. An audit includes examining, on a test basis, evidence supporting the amounts and disclosures in the financial statements, assessing the accounting principles used and significant estimates made by management, and evaluating the overall financial statement presentation. We believe that our audits, which included confirmation of securities as of October 31, 2016 by correspondence with the custodian and brokers, and the application of alternative auditing procedures where confirmations of security purchases have not been received, provide a reasonable basis for our opinion.
PRICEWATERHOUSECOOPERS LLP
Houston, Texas
December 21, 2016
49 Invesco Global Targeted Returns Fund
Calculating your ongoing Fund expenses
Example
As a shareholder of the Fund, you incur two types of costs: (1) transaction costs, which may include sales charges (loads) on purchase payments or contingent deferred sales charges on redemptions, if any; and (2) ongoing costs, including management fees, distribution and/or service (12b-1) fees, and other Fund expenses. This example is intended to help you understand your ongoing costs (in dollars) of investing in the Fund and to compare these costs with ongoing costs of investing in other mutual funds. The example is based on an investment of $1,000 invested at the beginning of the period and held for the entire period May 1, 2016 through October 31, 2016.
In addition to the fees and expenses which the Fund bears directly, the Fund indirectly bears a pro rata share of the fees and expenses of the underlying funds in which the Fund invests. The amount of fees and expenses incurred indirectly by the Fund will vary because the underlying funds have varied expenses and fee levels and the Fund may own different proportions of the underlying funds at different times. Estimated underlying fund expenses are not expenses that are incurred directly by the Fund. They are expenses that are incurred directly by the underlying funds and are deducted from the value of the underlying funds the Fund invests in. The effect of the estimated underlying fund expenses that the Fund bears indirectly are included in the Fund’s total return.
Actual expenses
The table below provides information about actual account values and actual expenses. You may use the information in this table, together with the amount you invested, to estimate the expenses that you paid over the period. Simply divide your account value by $1,000 (for example, an $8,600 account value divided by $1,000 = 8.6), then multiply the result by the number in the table under the heading entitled “Actual Expenses Paid During Period” to estimate the expenses you paid on your account during this period.
Hypothetical example for comparison purposes
The table below also provides information about hypothetical account values and hypothetical expenses based on the Fund’s actual expense ratio and an assumed rate of return of 5% per year before expenses, which is not the Fund’s actual return.
The hypothetical account values and expenses may not be used to estimate the actual ending account balance or expenses you paid for the period. You may use this information to compare the ongoing costs of investing in the Fund and other funds. To do so, compare this 5% hypothetical example with the 5% hypothetical examples that appear in the shareholder reports of the other funds.
Please note that the expenses shown in the table are meant to highlight your ongoing costs only and do not reflect any transaction costs, such as sales charges (loads) on purchase payments or contingent deferred sales charges on redemptions, if any. Therefore, the hypothetical information is useful in comparing ongoing costs only, and will not help you determine the relative total costs of owning different funds. In addition, if these transaction costs were included, your costs would have been higher.
| | | | | | | | | | | | | | | | | | | | | | | | |
| Class | | Beginning
Account Value
(05/01/16) | | | ACTUAL | | | HYPOTHETICAL (5% annual return before expenses) | | | Annualized
Expense
Ratio2 | |
| | | Ending
Account Value
(10/31/16)1 | | | Expenses
Paid During
Period2,3 | | | Ending
Account Value
(10/31/16) | | | Expenses
Paid During
Period2,4 | | |
Class A | | $ | 1,000.00 | | | $ | 998.10 | | | $ | 6.48 | | | $ | 1,018.65 | | | $ | 6.55 | | | | 1.29 | % |
Class C | | | 1,000.00 | | | | 994.10 | | | | 10.23 | | | | 1,014.88 | | | | 10.33 | | | | 2.04 | |
Class R | | | 1,000.00 | | | | 998.10 | | | | 7.73 | | | | 1,017.39 | | | | 7.81 | | | | 1.54 | |
Class Y | | | 1,000.00 | | | | 1,000.00 | | | | 5.23 | | | | 1,019.91 | | | | 5.28 | | | | 1.04 | |
Class R5 | | | 1,000.00 | | | | 1,000.00 | | | | 5.23 | | | | 1,019.91 | | | | 5.28 | | | | 1.04 | |
Class R6 | | | 1,000.00 | | | | 999.00 | | | | 5.23 | | | | 1,019.91 | | | | 5.28 | | | | 1.04 | |
| 1 | The actual ending account value is based on the actual total return of the Fund for the period May 1, 2016 through October 31, 2016, after actual expenses and will differ from the hypothetical ending account value which is based on the Fund’s expense ratio and a hypothetical annual return of 5% before expenses. |
| 2 | Expenses are equal to the Fund’s annualized expense ratio as indicated above multiplied by the average account value over the period, multiplied by 184/366 to reflect the most recent fiscal half year. Effective January 1, 2017, the Fund’s Adviser has contractually agreed to waive advisory fees and/or reimburse expenses to the extent necessary to limit total fund operating expenses of Class A, Class C, Class R, Class Y, Class R5 and Class R6 shares to 1.44%, 2.19%, 1.69%, 1.19%, 1.19% and 1.19% of average daily net assets, respectively. The annualized ratios restated as if these agreements had been in effect throughout the entire most recent fiscal half year are 1.00%, 1.75%, 1.25%, 0.75%, 0.75% and 0.75% for Class A, Class C, Class R, Class Y Class R5 and Class R6 shares, respectively. |
| 3 | The actual expenses paid restated as if the changes discussed above had been in effect throughout the entire most recent fiscal half year are $5.02, $8.77, $6.28, $3.77, $3.77 and $3.77 for Class A, Class C, Class R, Class Y Class R5 and Class R6 shares, respectively. |
| 4 | The hypothetical expenses paid restated as if the changes discussed above had been in effect throughout the entire most recent fiscal half year are $5.08, $8.87, $6.34, $3.81, $3.81 and $3.81 for Class A, Class C, Class R, Class Y Class R5 and Class R6 shares, respectively. |
50 Invesco Global Targeted Returns Fund
Approval of Investment Advisory and Sub-Advisory Contracts
The Board of Trustees (the Board) of AIM Investment Funds (Invesco Investment Funds) is required under the Investment Company Act of 1940, as amended, to approve annually the renewal of Invesco Global Targeted Returns Fund’s (the Fund) investment advisory agreements. During contract renewal meetings held on June 7-8, 2016, the Board as a whole, and the disinterested or “independent” Trustees, who comprise over 75% of the Board, voting separately, approved the continuance for the Fund of the Master Investment Advisory Agreement with Invesco Advisers, Inc. (Invesco Advisers and the investment advisory agreement) and the Master Intergroup Sub-Advisory Contract for Mutual Funds with Invesco Asset Management Deutschland GmbH, Invesco Asset Management Limited, Invesco Asset Management (Japan) Limited, Invesco Hong Kong Limited, Invesco Senior Secured Management, Inc., Invesco Canada Ltd. and Invesco PowerShares Capital Management LLC (collectively, the Affiliated Sub-Advisers and the sub-advisory contracts) for another year, effective July 1, 2016.
In evaluating the fairness and reasonableness of compensation under the Fund’s investment advisory agreement and sub-advisory contracts, the Board considered, among other things, the factors discussed below. The Board determined that continuation of the Fund’s investment advisory agreement and the sub-advisory contracts is in the best interest of the Fund and its shareholders and that the compensation payable to Invesco Advisers and the Affiliated Sub-Advisers under the agreements is fair and reasonable.
The Board’s Fund Evaluation Process
The Board’s Investments Committee has established three Sub-Committees, which meet throughout the year to review the performance of funds advised by Invesco Advisers (the Invesco Funds). Over the course of each year, the Sub-Committees meet with portfolio managers for their assigned Invesco Funds and other members of management to review the performance, investment objective(s), policies, strategies, limitations and investment risks of these funds. The Board had the benefit of reports from the Sub-Committees and Investments Committee throughout the year in considering approval of the continuance of each Invesco Fund’s investment advisory agreement and sub-advisory contracts for another year.
During the contract renewal process, the Board receives comparative performance and fee data regarding the Invesco Funds prepared by Invesco Advisers and Broadridge Financial Solutions, Inc. (Broadridge), an independent provider of investment company data. The Board also receives an independent written evaluation from the Senior Officer, an officer of the Invesco Funds who reports directly to the
independent Trustees. The Senior Officer’s evaluation is prepared as part of his responsibility to manage the process by which the Invesco Funds’ proposed management fees are negotiated during the annual contract renewal process to ensure they are negotiated in a manner that is at arms’ length and reasonable. In addition to meetings with Invesco Advisers and fund counsel, the independent Trustees also discuss the continuance of the investment advisory agreement and sub-advisory contracts in separate sessions with the Senior Officer and with independent legal counsel.
The Trustees recognized that the advisory fee rates for the Invesco Funds are, in many cases, the result of years of review and negotiation. The Trustees’ deliberations and conclusions in a particular year may be based in part on their deliberations and conclusions regarding these arrangements throughout the year and in prior years. The Trustees’ review and conclusions are based on the comprehensive consideration of all information presented to them and are not the result of any single determinative factor. Moreover, one Trustee may have weighed a particular piece of information or factor differently than another Trustee.
The discussion below is a summary of the Senior Officer’s independent written evaluation with respect to the Fund’s investment advisory agreement as well as a discussion of the material factors and related conclusions that formed the basis for the Board’s approval of the Fund’s investment advisory agreement and sub-advisory contracts. Unless otherwise stated, this information is current as of June 8, 2016, and does not reflect consideration of factors that became known to the Board after that date.
Factors and Conclusions and Summary of Independent Written Fee Evaluation
| A. | Nature, Extent and Quality of Services Provided by Invesco Advisers and the Affiliated Sub-Advisers |
The Board reviewed the advisory services provided to the Fund by Invesco Advisers under the Fund’s investment advisory agreement, the performance of Invesco Advisers in providing these services, and the credentials and experience of the officers and employees of Invesco Advisers who provide these services, including the Fund’s portfolio manager or managers. The Board’s review of the qualifications of Invesco Advisers to provide advisory services included the Board’s consideration of Invesco Advisers’ investment process oversight, independent credit analysis and investment risk management. The Board also considered non-advisory services that Invesco Advisers and its affiliates provide to the Invesco Funds such as various back office support functions, trading operations, internal audit, valuation and legal and compliance.
In determining whether to continue the Fund’s investment advisory agreement, the Board considered the benefits of reapproving an existing relationship and the greater uncertainty that may be associated with entering into a new relationship. The Board concluded that the nature, extent and quality of the services provided to the Fund by Invesco Advisers are appropriate and satisfactory and consistent with the terms of the Fund’s investment advisory agreement.
The Board reviewed the services that may be provided by the Affiliated Sub-Advisers under the sub-advisory contracts and the credentials and experience of the officers and employees of the Affiliated Sub-Advisers who provide these services. The Board noted that the Affiliated Sub-Advisers have offices and personnel that are located in financial centers around the world. As a result, the Board noted that the Affiliated Sub-Advisers can provide research and investment analysis on the markets and economies of various countries in which the Fund may invest, make recommendations regarding securities and assist with security trades. The Board concluded that the sub-advisory contracts may benefit the Fund and its shareholders by permitting Invesco Advisers to use the resources and talents of the Affiliated Sub-Advisers in managing the Fund. The Board concluded that the nature, extent and quality of the services that may be provided by the Affiliated Sub-Advisers are appropriate and satisfactory and consistent with the terms of the Fund’s sub-advisory contracts.
The Board considered Fund performance as a relevant factor in considering whether to approve the investment advisory agreement as well as the sub-advisory contracts for the Fund, as Invesco Asset Management Limited currently manages assets of the Fund.
The Board noted that the Fund was new and compared the Fund’s performance during the past one and two calendar years to the performance of funds in the Broadridge performance universe and against the Lipper Absolute Return Funds Index. The Board noted that performance of Class A shares of the Fund was in the third quintile of its performance universe for the one year period and the first quintile for the two year period (the first quintile being the best performing funds and the fifth quintile being the worst performing funds). The Board noted that performance of Class A shares of the Fund was below the performance of the Index for the one year period and above the performance of the Index for the two year period. The Trustees also reviewed more recent Fund performance and this review did not change their conclusions.
| C. | Advisory and Sub-Advisory Fees |
The Board compared the Fund’s contractual management fee rate to the contractual
51 Invesco Global Targeted Returns Fund
management fee rates of funds in the Fund’s Broadridge expense group at a common asset level. The Board noted that the contractual management fee rate for Class A shares of the Fund was above the median contractual management fee rate of funds in its expense group. The Board noted that the term “contractual management fee” for funds in the expense group may include both advisory and certain administrative services fees, but that Broadridge does not provide information on a fund by fund basis as to what is included. The Board noted that Invesco does not separately charge the Invesco Funds for the administrative services included in the term as defined by Broadridge. The Board also reviewed the methodology used by Broadridge in providing expense group information, which includes using each fund’s contractual fee schedule (including any applicable breakpoints) as reported in the most recent prospectus or statement of information for each fund in the expense group.
The Board noted that Invesco Advisers has contractually agreed to waive fees and/or limit expenses of the Fund through at least February 28, 2017 in an amount necessary to limit total annual operating expenses to a specified percentage of average daily net assets for each class of the Fund.
The Board noted that Invesco Advisers and the Affiliated Sub-Advisers do not manage other mutual funds with investment strategies comparable to those of the Fund.
The Board considered the fees charged by Invesco Advisers and the Affiliated Sub-Advisers to other client accounts with investment strategies comparable to those of the Fund. The Board noted that Invesco Advisers or the Affiliated Sub-Advisers may charge lower fees to large institutional clients. Invesco Advisers reviewed with the Board the significantly greater scope of services it provides to the Invesco Funds relative to certain other types of client accounts. These additional services include provision of administrative services, officers and office space, oversight of service providers, preparation of annual registration statement updates and financial information and regulatory compliance under the Investment Company Act of 1940, as amended.
Invesco Advisers also reviewed generally the higher frequency of shareholder purchases and redemptions in the Invesco Funds relative to the flow of assets for other client accounts. Invesco Advisers advised the Board that advance notice of redemptions is often provided to Invesco Advisers by institutional clients. The Board did note that sub-advisory fee rates charged by the Affiliated Sub-Advisers to manage the Invesco Funds and to manage other client accounts tended to be more comparable, reflecting a similar scope of services.
The Board also considered the services that may be provided by the Affiliated Sub-Advisers pursuant to the sub-advisory contracts, as well as the fees payable by Invesco Advisers to Affiliated Sub-Advisers pursuant to the
sub-advisory contracts. The Board noted that Invesco Advisers retains overall responsibility for, and provides services to, sub-advised Invesco Funds, including oversight of the Affiliated Sub-Advisers as well as the additional services described herein other than day-to-day portfolio management. The Board also noted that the sub-advisory fees are not paid directly by the Fund, but rather, are payable by Invesco Advisers to the Affiliated Sub-Advisers.
| D. | Economies of Scale and Breakpoints |
The Board considered the extent to which there are economies of scale in the provision of advisory services to the Fund. The Board also considered whether the Fund benefits from economies of scale through contractual breakpoints in the Fund’s advisory fee schedule. The Board also noted that the Fund shares directly in economies of scale through lower fees charged by third party service providers based on the combined size of the Invesco Funds and other clients advised by Invesco Advisers.
| E. | Profitability and Financial Resources |
The Board reviewed information from Invesco Advisers concerning the costs of the advisory and other services that Invesco Advisers and its affiliates provide to the Fund and the Invesco Funds and the profitability of Invesco Advisers and its affiliates in providing these services. The Board received information from Invesco Advisers and a report from an independent consultant engaged by the Senior Officer about the methodology used to prepare the profitability information. The Board noted that Invesco Advisers continues to operate at a net profit from services Invesco Advisers and its affiliates provide to the Invesco Funds and the Fund. The Board did not deem the level of profits realized by Invesco Advisers and its affiliates from providing services to the Fund to be excessive given the nature, quality and extent of the services provided. The Board received and accepted information from Invesco Advisers demonstrating that Invesco Advisers and each Affiliated Sub-Adviser are financially sound and have the resources necessary to perform their obligations under the investment advisory agreement and sub-advisory contracts.
| F. | Collateral Benefits to Invesco Advisers and its Affiliates |
The Board considered various other benefits received by Invesco Advisers and its affiliates from the relationship with the Fund, including the fees received for providing transfer agency and distribution services to the Fund. The Board considered comparative information regarding fees charged for these services, including information provided by Broadridge and other independent sources. The Board considered the performance of Invesco Advisers and its affiliates in providing these services and the organizational structure employed to provide these services. The Board also considered that these services are provided to the Fund pursuant to written contracts that are reviewed and approved on an annual basis by the Board;
and that the services are required for the operation of the Fund.
The Board considered the benefits realized by Invesco Advisers and the Affiliated Sub-Advisers as a result of portfolio brokerage transactions executed through “soft dollar” arrangements. Invesco Advisers noted that the Fund does not execute brokerage transactions through “soft dollar” arrangements to any significant degree.
The Board considered that the Fund’s uninvested cash and cash collateral from any securities lending arrangements may be invested in money market funds advised by Invesco Advisers pursuant to procedures approved by the Board. The Board noted that Invesco Advisers receives advisory fees from these affiliated money market funds attributable to such investments, although Invesco Advisers has contractually agreed to waive through varying periods the advisory fees payable by the Invesco Funds with respect to certain investments in the affiliated money market funds. The waiver is in an amount equal to 100% of the net advisory fee Invesco Advisers receives from the affiliated money market funds with respect to the Fund’s investment in the affiliated money market funds of uninvested cash, but not cash collateral. The Board concluded that the amount of advisory fees received by Invesco Advisors from the Fund’s investment of cash collateral from any securities lending arrangements in the affiliated money market funds is fair and reasonable.
52 Invesco Global Targeted Returns Fund
Tax Information
Form 1099-DIV, Form 1042-S and other year-end tax information provide shareholders with actual calendar year amounts that should be included in their tax returns. Shareholders should consult their tax advisors.
The following distribution information is being provided as required by the Internal Revenue Code or to meet a specific state’s requirement.
The Fund designates the following amounts or, if subsequently determined to be different, the maximum amount allowable for its fiscal year ended October 31, 2016:
| | | | |
Federal and State Income Tax | |
Long-Term Capital Gain Distributions | | $ | 546,005 | |
Qualified Dividend Income* | | | 39.54 | % |
Corporate Dividends Received Deduction* | | | 7.02 | % |
U.S. Treasury Obligations* | | | 0.00 | % |
| | * | The above percentages are based on ordinary income dividends paid to shareholders during the Fund’s fiscal year. |
| | | | |
Non-Resident Alien Shareholders | |
Qualified Short-Term Gains | | $ | 1,500,808 | |
53 Invesco Global Targeted Returns Fund
Trustees and Officers
The address of each trustee and officer is AIM Investment Funds (Invesco Investment Funds) (the “Trust”), 11 Greenway Plaza, Suite 1000, Houston, Texas 77046-1173. The trustees serve for the life of the Trust, subject to their earlier death, incapacitation, resignation, retirement or removal as more specifically provided in the Trust’s organizational documents. Each officer serves for a one year term or until their successors are elected and qualified. Column two below includes length of time served with predecessor entities, if any.
| | | | | | | | |
Name, Year of Birth and
Position(s) Held with the Trust | | Trustee and/
or Officer Since | | Principal Occupation(s)
During Past 5 Years | | Number of
Funds in Fund
Complex
Overseen by
Trustee | | Other Directorship(s)
Held by Trustee During
Past 5 Years |
| Interested Persons | | | | | | | | |
| Martin L. Flanagan1 — 1960 Trustee | | 2007 | | Executive Director, Chief Executive Officer and President, Invesco Ltd. (ultimate parent of Invesco and a global investment management firm); Advisor to the Board, Invesco Advisers, Inc. (formerly known as Invesco Institutional (N.A.), Inc.); Trustee, The Invesco Funds; Vice Chair, Investment Company Institute; and Member of Executive Board, SMU Cox School of Business Formerly: Chairman and Chief Executive Officer, Invesco Advisers, Inc. (registered investment adviser); Director, Chairman, Chief Executive Officer and President, Invesco Holding Company (US) Inc. (formerly IVZ Inc.) (holding company), Invesco Group Services, Inc. (service provider) and Invesco North American Holdings, Inc. (holding company); Director, Chief Executive Officer and President, Invesco Holding Company Limited (parent of Invesco and a global investment management firm); Director, Invesco Ltd.; Chairman, Investment Company Institute and President, Co-Chief Executive Officer, Co-President, Chief Operating Officer and Chief Financial Officer, Franklin Resources, Inc. (global investment management organization) | | 146 | | None |
| Philip A. Taylor2 — 1954 Trustee and Senior Vice President | | 2006 | | Head of the Americas and Senior Managing Director, Invesco Ltd.; Director, Co-Chairman, Co-President and Co-Chief Executive Officer, Invesco Advisers, Inc. (formerly known as Invesco Institutional (N.A.), Inc.) (registered investment adviser); Director, Chairman, Chief Executive Officer and President, Invesco Management Group, Inc. (formerly known as Invesco AIM Management Group, Inc.) (financial services holding company); Director and Chairman, Invesco Investment Services, Inc. (formerly known as Invesco AIM Investment Services, Inc.) (registered transfer agent) Chief Executive Officer, Invesco Corporate Class Inc. (corporate mutual fund company) Director, Chairman and Chief Executive Officer, Invesco Canada Ltd. (formerly known as Invesco Trimark Ltd./Invesco Trimark Ltèe) (registered investment adviser and registered transfer agent); Trustee and Senior Vice President, The Invesco Funds; Director, Invesco Investment Advisers LLC (formerly known as Van Kampen Asset Management). Formerly: Director, Chief Executive Officer and President, Van Kampen Exchange Corp.; President and Principal Executive Officer, The Invesco Funds (other than AIM Treasurer’s Series Trust (Invesco Treasurer’s Series Trust), Short-Term Investments Trust and Invesco Management Trust); Executive Vice President, The Invesco Funds (AIM Treasurer’s Series Trust (Invesco Treasurer’s Series Trust), Short-Term Investments Trust and Invesco Management Trust only); Director and President, INVESCO Funds Group, Inc. (registered investment adviser and registered transfer agent); Director and Chairman, IVZ Distributors, Inc. (formerly known as INVESCO Distributors, Inc.) (registered broker dealer); Director, President and Chairman, Invesco Inc. (holding company), Invesco Canada Holdings Inc. (holding company), Trimark Investments Ltd./Placements Trimark Ltèe and Invesco Financial Services Ltd/Services Financiers Invesco Ltèe; Chief Executive Officer, Invesco Canada Fund Inc. (corporate mutual fund company); Director and Chairman, Van Kampen Investor Services Inc.; Director, Chief Executive Officer and President, 1371 Preferred Inc. (holding company) and Van Kampen Investments Inc.; Director and President, AIM GP Canada Inc. (general partner for limited partnerships) and Van Kampen Advisors, Inc.; Director and Chief Executive Officer, Invesco Trimark Dealer Inc. (registered broker dealer); Director, Invesco Distributors, Inc. (formerly known as Invesco AIM Distributors, Inc.) (registered broker dealer); Manager, Invesco PowerShares Capital Management LLC; Director, Chief Executive Officer and President, Invesco Advisers, Inc.; Director, Chairman, Chief Executive Officer and President, Invesco AIM Capital Management, Inc.; President, Invesco Trimark Dealer Inc. and Invesco Trimark Ltd./Invesco Trimark Ltèe; Director and President, AIM Trimark Corporate Class Inc. and AIM Trimark Canada Fund Inc.; Senior Managing Director, Invesco Holding Company Limited; Director and Chairman, Fund Management Company (former registered broker dealer); President and Principal Executive Officer, The Invesco Funds (AIM Treasurer’s Series Trust (Invesco Treasurer’s Series Trust), and Short-Term Investments Trust only); President, AIM Trimark Global Fund Inc. and AIM Trimark Canada Fund Inc. | | 146 | | None |
| 1 | Mr. Flanagan is considered an interested person (within the meaning of Section 2(a)(19) of the 1940 Act) of the Trust because he is an officer of the Adviser to the Trust, and an officer and a director of Invesco Ltd., ultimate parent of the Adviser. |
| 2 | Mr. Taylor is considered an interested person (within the meaning of Section 2(a)(19) of the 1940 Act) of the Trust because he is an officer and a director of the Adviser. |
T-1 Invesco Global Targeted Returns Fund
Trustees and Officers—(continued)
| | | | | | | | |
Name, Year of Birth and
Position(s) Held with the Trust | | Trustee and/
or Officer Since | | Principal Occupation(s) During Past 5 Years | | Number of
Funds in Fund
Complex
Overseen by
Trustee | | Other Directorship(s)
Held by Trustee During
Past 5 Years |
| Independent Trustees | | | | | | | | |
Bruce L. Crockett — 1944 Trustee and Chair | | 2001 | | Chairman, Crockett Technologies Associates (technology consulting company) Formerly: Director, Captaris (unified messaging provider); Director, President and Chief Executive Officer, COMSAT Corporation; Chairman, Board of Governors of INTELSAT (international communications company); ACE Limited (insurance company); Independent Directors Council and Investment Company Institute | | 146 | | ALPS (Attorneys Liability Protection Society) (insurance company) and Globe Specialty Metals, Inc. (metallurgical company); Member of the Audit Committee, Ferroglobe PLC and Investment Company Institute; Member of the Executive Committee and Chair of the Governance Committee, Independent Directors Council |
David C. Arch — 1945 Trustee | | 2010 | | Chairman of Blistex Inc., a consumer health care products manufacturer | | 146 | | Board member of the Illinois Manufacturers’ Association; Member of the Board of Visitors, Institute for the Humanities, University of Michigan |
James T. Bunch — 1942 Trustee | | 2003 | | Managing Member, Grumman Hill Group LLC (family office/private equity investments) Formerly: Chairman of the Board, Denver Film Society, Chairman of the Board of Trustees, Evans Scholarship Foundation; Chairman, Board of Governors, Western Golf Association | | 146 | | Trustee, Evans Scholarship Foundation |
Albert R. Dowden — 1941 Trustee | | 2001 | | Director of a number of public and private business corporations, including Nature’s Sunshine Products, Inc. Formerly: Director, The Boss Group, Ltd. and Reich & Tang Funds (5 portfolios) (registered investment company); Director, Homeowners of America Holding Corporation/Homeowners of America Insurance Company (property casualty company); Director, Continental Energy Services, LLC (oil and gas pipeline service); Director, CompuDyne Corporation (provider of product and services to the public security market) and Director, Annuity and Life Re (Holdings), Ltd. (reinsurance company); Director, President and Chief Executive Officer, Volvo Group North America, Inc.; Senior Vice President, AB Volvo; Director of various public and private corporations; Chairman, DHJ Media, Inc.; Director, Magellan Insurance Company; and Director, The Hertz Corporation, Genmar Corporation (boat manufacturer), National Media Corporation; Advisory Board of Rotary Power International (designer, manufacturer, and seller of rotary power engines); and Chairman, Cortland Trust, Inc. (registered investment company) | | 146 | | Director of Nature’s Sunshine Products, Inc. |
Jack M. Fields — 1952 Trustee | | 2001 | | Chief Executive Officer, Twenty First Century Group, Inc. (government affairs company); and Discovery Learning Alliance (non-profit) Formerly: Owner and Chief Executive Officer, Dos Angeles Ranch L.P. (cattle, hunting, corporate entertainment); Director, Insperity, Inc. (formerly known as Administaff); Chief Executive Officer, Texana Timber LP (sustainable forestry company); Director of Cross Timbers Quail Research Ranch (non-profit); and member of the U.S. House of Representatives | | 146 | | None |
Eli Jones — 1961 Trustee | | 2016 | | Professor and Dean, Mays Business School — Texas A&M University Formerly: Professor and Dean, Walton College of Business, University of Arkansas and E.J. Ourso College of Business, Louisiana State University and Director, Arvest Bank | | 146 | | Director of Insperity, Inc. (formerly known as Administaff) |
Prema Mathai-Davis — 1950 Trustee | | 2001 | | Retired. Formerly: Chief Executive Officer, YWCA of the U.S.A. | | 146 | | None |
Larry Soll — 1942 Trustee | | 2003 | | Retired. Formerly: Chairman, Chief Executive Officer and President, Synergen Corp. (a biotechnology company) | | 146 | | None |
Raymond Stickel, Jr. — 1944 Trustee | | 2005 | | Retired. Formerly: Director, Mainstay VP Series Funds, Inc. (25 portfolios) and Partner, Deloitte & Touche | | 146 | | None |
Robert C. Troccoli — 1949 Trustee | | 2016 | | Adjunct Professor, University of Denver — Daniels College of Business Formerly: Senior Partner, KPMG LLP | | 146 | | None |
T-2 Invesco Global Targeted Returns Fund
Trustees and Officers—(continued)
| | | | | | | | |
Name, Year of Birth and
Position(s) Held with the Trust | | Trustee and/
or Officer Since | | Principal Occupation(s) During Past 5 Years | | Number of
Funds in Fund
Complex
Overseen by
Trustee | | Other Directorship(s)
Held by Trustee During
Past 5 Years |
| Independent Trustees—(continued) |
Suzanne H. Woolsey — 1941 Trustee | | 2014 | | Retired. Formerly: Chief Executive Officer of Woolsey Partners LLC | | 146 | | Director, SunShare LLC; Trustee, Ocean Conservancy; Emeritus Chair of the Board of Trustees of the Institute for Defense Analyses and of Colorado College; Trustee, Chair, Business and Finance Committee of California Institute of Technology; Prior to 2014, Director of Fluor Corp.; Prior to 2010, Trustee of the German Marshall Fund of the United States; Prior to 2010, Trustee of the Rocky Mountain Institute |
| Other Officers | | | | | | | | |
Sheri Morris — 1964 President, Principal Executive Officer and Treasurer | | 1999 | | President, Principal Executive Officer and Treasurer, The Invesco Funds; Vice President, Invesco Advisers, Inc. (formerly known as Invesco Institutional (N.A.), Inc.) (registered investment adviser); and Vice President, PowerShares Exchange-Traded Fund Trust, PowerShares Exchange-Traded Fund Trust II, PowerShares India Exchange-Traded Fund Trust, PowerShares Actively Managed Exchange-Traded Fund Trust, and PowerShares Actively Managed Exchange-Traded Commodity Fund Trust Formerly: Vice President and Principal Financial Officer, The Invesco Funds; Vice President, Invesco AIM Advisers, Inc., Invesco AIM Capital Management, Inc. and Invesco AIM Private Asset Management, Inc.; Assistant Vice President and Assistant Treasurer, The Invesco Funds and Assistant Vice President, Invesco Advisers, Inc., Invesco AIM Capital Management, Inc. and Invesco AIM Private Asset Management, Inc.; and Treasurer, PowerShares Exchange-Traded Fund Trust, PowerShares Exchange-Traded Fund Trust II, PowerShares India Exchange-Traded Fund Trust and PowerShares Actively Managed Exchange-Traded Fund Trust | | N/A | | N/A |
Russell C. Burk — 1958 Senior Vice President and Senior Officer | | 2005 | | Senior Vice President and Senior Officer, The Invesco Funds | | N/A | | N/A |
John M. Zerr — 1962 Senior Vice President, Chief Legal Officer and Secretary | | 2006 | | Director, Senior Vice President, Secretary and General Counsel, Invesco Management Group, Inc. (formerly known as Invesco AIM Management Group, Inc.; Senior Vice President, Invesco Advisers, Inc. (formerly known as Invesco Institutional (N.A.), Inc.) (registered investment adviser); Senior Vice President and Secretary, Invesco Distributors, Inc. (formerly known as Invesco AIM Distributors, Inc.); Director, Vice President and Secretary, Invesco Investment Services, Inc. (formerly known as Invesco AIM Investment Services, Inc.) Senior Vice President, Chief Legal Officer and Secretary, The Invesco Funds; Managing Director, Invesco PowerShares Capital Management LLC; Director, Secretary and General Counsel, Invesco Investment Advisers LLC (formerly known as Van Kampen Asset Management); Secretary and General Counsel, Invesco Capital Markets, Inc. (formerly known as Van Kampen Funds Inc.) and Chief Legal Officer, PowerShares Exchange-Traded Fund Trust, PowerShares Exchange-Traded Fund Trust II, PowerShares India Exchange-Traded Fund Trust, PowerShares Actively Managed Exchange-Traded Fund Trust, and PowerShares Actively Managed Exchange-Traded Commodity Fund Trust Formerly: Director, Secretary, General Counsel and Senior Vice President, Van Kampen Exchange Corp.; Director, Vice President and Secretary, IVZ Distributors, Inc. (formerly known as INVESCO Distributors, Inc.); Director and Vice President, INVESCO Funds Group, Inc.; Director and Vice President, Van Kampen Advisors Inc.; Director, Vice President, Secretary and General Counsel, Van Kampen Investor Services Inc.; Director, Invesco Distributors, Inc. (formerly known as Invesco AIM Distributors, Inc.); Director, Senior Vice President, General Counsel and Secretary, Invesco AIM Advisers, Inc. and Van Kampen Investments Inc.; Director, Vice President and Secretary, Fund Management Company; Director, Senior Vice President, Secretary, General Counsel and Vice President, Invesco AIM Capital Management, Inc.; Chief Operating Officer and General Counsel, Liberty Ridge Capital, Inc. (an investment adviser); Vice President and Secretary, PBHG Funds (an investment company) and PBHG Insurance Series Fund (an investment company); Chief Operating Officer, General Counsel and Secretary, Old Mutual Investment Partners (a broker-dealer); General Counsel and Secretary, Old Mutual Fund Services (an administrator) and Old Mutual Shareholder Services (a shareholder servicing center); Executive Vice President, General Counsel and Secretary, Old Mutual Capital, Inc. (an investment adviser); and Vice President and Secretary, Old Mutual Advisors Funds (an investment company) | | N/A | | N/A |
T-3 Invesco Global Targeted Returns Fund
Trustees and Officers—(continued)
| | | | | | | | |
Name, Year of Birth and
Position(s) Held with the Trust | | Trustee and/
or Officer Since | | Principal Occupation(s) During Past 5 Years | | Number of
Funds in Fund
Complex
Overseen by
Trustee | | Other Directorship(s)
Held by Trustee During
Past 5 Years |
| Other Officers—(continued) | | | | | | | | |
| Karen Dunn Kelley — 1960 Senior Vice President | | 2004 | | Senior Managing Director, Investments, Invesco Ltd.; Director, Co-President, Co-Chief Executive Officer, and Co-Chairman, Invesco Advisers, Inc. (formerly known as Invesco Institutional (N.A.), Inc.) (registered investment adviser); Chairman and Director, Invesco Senior Secured Management, Inc.; Senior Vice President, Invesco Management Group, Inc. (formerly known as Invesco AIM Management Group, Inc.); Executive Vice President, Invesco Distributors, Inc. (formerly known as Invesco AIM Distributors, Inc.); Director, Invesco Mortgage Capital Inc. and Invesco Management Company Limited; Senior Vice President, The Invesco Funds Formerly: Vice President, The Invesco Funds (other than AIM Treasurer’s Series Trust (Invesco Treasurer’s Series Trust), Short-Term Investments Trust and Invesco Management Trust); and President and Principal Executive Officer, The Invesco Funds (AIM Treasurer’s Series Trust (Invesco Treasurer’s Series Trust), Short-Term Investments Trust and Invesco Management Trust only); Director and President, INVESCO Asset Management (Bermuda) Ltd., Director, INVESCO Global Asset Management DAC (formerly known as INVESCO Global Asset Management Limited) and INVESCO Management S.A.; Senior Vice President, Van Kampen Investments Inc. and Invesco Advisers, Inc. (formerly known as Invesco Institutional (N.A.), Inc.) (registered investment adviser); Director and President, Fund Management Company; Chief Cash Management Officer, Director of Cash Management, Senior Vice President, and Managing Director, Invesco AIM Capital Management, Inc.; Director of Cash Management, Senior Vice President, and Vice President, Invesco Advisers, Inc. and Vice President, The Invesco Funds (AIM Treasurer’s Series Trust (Invesco Treasurer’s Series Trust), and Short-Term Investments Trust only) | | N/A | | N/A |
Kelli Gallegos — 1970 Vice President, Principal Financial Officer and Assistant Treasurer | | 2008 | | Vice President, Principal Financial Officer and Assistant Treasurer, The Invesco Funds; Assistant Treasurer, Invesco PowerShares Capital Management LLC, PowerShares Exchange-Traded Fund Trust, PowerShares Exchange-Traded Fund Trust II, PowerShares India Exchange-Traded Fund Trust, PowerShares Actively Managed Exchange-Traded Fund Trust, and PowerShares Actively Managed Exchange-Traded Commodity Fund Trust Formerly: Assistant Vice President, The Invesco Funds | | N/A | | N/A |
Tracy Sullivan — 1962 Vice President, Chief Tax Officer and Assistant Treasurer | | 2008 | | Vice President, Chief Tax Officer and Assistant Treasurer, The Invesco Funds; Assistant Treasurer, Invesco PowerShares Capital Management LLC, PowerShares Exchange-Traded Fund Trust, PowerShares Exchange-Traded Fund Trust II, PowerShares India Exchange-Traded Fund Trust, PowerShares Actively Managed Exchange-Traded Fund Trust, and PowerShares Actively Managed Exchange-Traded Commodity Fund Trust Formerly: Assistant Vice President, The Invesco Funds | | N/A | | N/A |
Crissie M. Wisdom — 1969 Anti-Money Laundering Compliance Officer | | 2013 | | Anti-Money Laundering Compliance Officer, Invesco Advisers, Inc. (formerly known as Invesco Institutional (N.A.), Inc.) (registered investment adviser), Invesco Capital Markets, Inc. (formerly known as Van Kampen Funds Inc.), Invesco Distributors, Inc., Invesco Investment Services, Inc., Invesco Management Group, Inc., The Invesco Funds, and PowerShares Exchange-Traded Fund Trust, PowerShares Exchange-Traded Fund Trust II, PowerShares India Exchange-Traded Fund Trust, PowerShares Actively Managed Exchange-Traded Fund Trust and PowerShares Actively Managed Exchange-Traded Commodity Fund Trust; Anti-Money Laundering Compliance Officer and Bank Secrecy Act Officer, INVESCO National Trust Company and Invesco Trust Company; and Fraud Prevention Manager and Controls and Risk Analysis Manager for Invesco Investment Services, Inc. Formerly: Anti-Money Laundering Compliance Officer, Van Kampen Exchange Corp. | | N/A | | N/A |
Robert R. Leveille — 1969 Chief Compliance Officer | | 2016 | | Chief Compliance Officer, Invesco Advisers, Inc. (registered investment adviser); and Chief Compliance Officer, The Invesco Funds Formerly: Chief Compliance Officer, Putnam Investments and the Putnam Funds | | N/A | | N/A |
The Statement of Additional Information of the Trust includes additional information about the Fund’s Trustees and is available upon request, without charge, by calling 1.800.959.4246. Please refer to the Fund’s Statement of Additional Information for information on the Fund’s sub-advisers.
| | | | | | |
Office of the Fund 11 Greenway Plaza, Suite 1000 Houston, TX 77046-1173 | | Investment Adviser Invesco Advisers, Inc. 1555 Peachtree Street, N.E. Atlanta, GA 30309 | | Distributor Invesco Distributors, Inc. 11 Greenway Plaza, Suite 1000 Houston, TX 77046-1173 | | Auditors PricewaterhouseCoopers LLP 1000 Louisiana Street, Suite 5800 Houston, TX 77002-5678 |
| | | |
| | | | | | |
Counsel to the Fund Stradley Ronon Stevens & Young, LLP 2005 Market Street, Suite 2600 Philadelphia, PA 19103-7018 | | Counsel to the Independent Trustees Goodwin Procter LLP 901 New York Avenue, N.W. Washington, D.C. 20001 | | Transfer Agent Invesco Investment Services, Inc. 11 Greenway Plaza, Suite 1000 Houston, TX 77046-1173 | | Custodian State Street Bank and Trust Company 225 Franklin Street Boston, MA 02110-2801 |
T-4 Invesco Global Targeted Returns Fund
Explore High-Conviction Investing with Invesco

Invesco mailing information
Send general correspondence to Invesco Investment Services, Inc., P.O. Box 219078, Kansas City, MO 64121-9078.
Important notice regarding delivery of security holder documents
To reduce Fund expenses, only one copy of most shareholder documents may be mailed to shareholders with multiple accounts at the same address (Householding). Mailing of your shareholder documents may be householded indefinitely unless you instruct us otherwise. If you do not want the mailing of these documents to be combined with those for other members of your household, please contact Invesco Investment Services, Inc. at 800 959 4246 or contact your financial institution. We will begin sending you individual copies for each account within 30 days after receiving your request.
Fund holdings and proxy voting information
The Fund provides a complete list of its holdings four times in each fiscal year, at the quarter ends. For the second and fourth quarters, the lists appear in the Fund’s semiannual and annual reports to shareholders. For the first and third quarters, the Fund files the lists with the Securities and Exchange Commission (SEC) on Form N-Q. The most recent list of portfolio holdings is available at invesco.com/completeqtrholdings. Shareholders can also look up the Fund’s Forms N-Q on the SEC website at sec.gov. Copies of the Fund’s Forms N-Q may be reviewed and copied at the SEC Public Reference Room in Washington, D.C. You can obtain information on the operation of the Public Reference Room, including information about duplicating fee charges, by calling 202 551 8090 or 800 732 0330, or by electronic request at the following email address: publicinfo@sec.gov.
The SEC file numbers for the Fund are shown below.
A description of the policies and procedures that the Fund uses to determine how to vote proxies relating to portfolio securities is available without charge, upon request, from our Client Services department at 800 959 4246 or at invesco.com/proxyguidelines. The information is also available on the SEC website, sec.gov.
| | |
Information regarding how the Fund voted proxies related to its portfolio securities during the most recent 12-month period ended June 30 is available at invesco.com/proxysearch. The information is also available on the SEC website, sec.gov. Invesco Advisers, Inc. is an investment adviser; it provides investment advisory services to individual and institutional clients and does not sell securities. Invesco Distributors, Inc. is the US distributor for Invesco Ltd.’s retail mutual funds, exchange-traded funds and institutional money market funds. Both are wholly owned, indirect subsidiaries of Invesco Ltd. | | 
|
| | | | | | |
| SEC file numbers: 811-05426 and 033-19338 | | GTR-AR-1 | | Invesco Distributors, Inc. | | |
| | | | |
| | |
 | | Annual Report to Shareholders | | October 31, 2016 |
| | |
| | Invesco Greater China Fund |
| | Nasdaq: |
| | A: AACFX ∎ B: ABCFX ∎ C: CACFX ∎ Y: AMCYX ∎ R5: IACFX |

Letters to Shareholders
| | |

Philip Taylor | | Dear Shareholders: This annual report includes information about your Fund, including performance data and a complete list of its investments as of the close of the reporting period. Inside is a discussion of how your Fund was managed and the factors that affected its performance during the reporting period. In December 2015, the US Federal Reserve raised short-term interest rates for the first time since 2006, signaling its belief that the economy was likely to continue strengthening. Indeed, throughout the reporting period, US economic data were generally positive and the economy expanded at a moderate rate – but there were some bumps along the road. Job growth in May 2016 was very weak, but it was followed by strong increases in nonfarm payrolls in June and July. Increased concerns about global economic weakness caused US stock market indexes to sink at the start of calendar year 2016, but they eventually recovered; they sank again following the UK’s decision to leave the European Union, but |
| then quickly recovered and reached record highs later in the summer. Strong demand for income-producing investments, particularly those perceived to be lower risk, benefited bonds as well as dividend-paying stocks for much of the reporting period. While economic news in the US was generally positive, news overseas was less upbeat. The European Central Bank, and central banks in China and Japan – as well as other countries – maintained extraordinarily accommodative monetary policies in response to economic weakness. As the fiscal year drew to a close, uncertainty about the outcome of the US presidential election resulted in increased market volatility; the surprise outcome after the close of the reporting period suggested that market volatility may continue for some time to come. |
Short-term market volatility can prompt some investors to abandon their investment plans – and can cause others to settle for average results. The investment professionals at Invesco, in contrast, invest with high conviction, take a long-term perspective and have a passion to exceed. Invesco’s pure focus on investment management eliminates possible distractions and means that there are no competing lines of business for us to support. Just as important, we embrace a variety of investment strategies, asset classes and geographies – because we know that no single investment approach meets the diverse needs of all of our clients. We manage all our investment approaches with a passion to exceed. All our investment teams have a highly disciplined, long-term investing style that eliminates short-term decision-making. Of course, investing with high conviction can’t guarantee a profit or ensure success; no investment strategy can. To learn more about how we invest with high conviction, visit invesco.com/HighConviction. |
You, too, can invest with high conviction by maintaining a long-term investment perspective and by working with your financial adviser on a regular basis. During periods of short-term market volatility or uncertainty, your financial adviser can keep you focused on your long-term investment goals – a new home, a child’s college education or a secure retirement. He or she also can share research about the economy, the markets and individual investment options.
Visit our website for more information on your investments
Our website, invesco.com/us, offers a wide range of market insights and investment perspectives. On the website, you’ll find detailed information about our funds, including performance, holdings and portfolio manager commentaries. You can access information about your account by completing a simple, secure online registration. Click on the “Need to register” link in the “Account Access” box on our homepage to get started.
In addition to the resources accessible on our website and through our mobile app, you can obtain timely updates to help you stay informed about the markets, the economy and investing by connecting with Invesco on Twitter, LinkedIn or Facebook. You can access our blog at blog.invesco.us.com. Our goal is to provide you the information you want, when and where you want it.
Finally, I’m pleased to share with you Invesco’s commitment to both the Principles for Responsible Investment and to considering environmental, social and governance issues in our robust investment process. I invite you to learn more at invesco.com/esg.
Have questions?
For questions about your account, contact an Invesco client services representative at 800 959 4246. For Invesco-related questions or comments, please email me directly at phil@invesco.com.
All of us at Invesco look forward to serving your investment management needs. Thank you for investing with us.
Sincerely,

Philip Taylor
Senior Managing Director, Invesco Ltd.
2 Invesco Greater China Fund
| | | | | | |

Bruce Crockett | | | | Dear Fellow Shareholders: Among the many important lessons I’ve learned in more than 40 years in a variety of business endeavors is the value of a trusted advocate. As independent chair of the Invesco Funds Board, I can assure you that the members of the Board are strong advocates for the interests of investors in Invesco’s mutual funds. We work hard to represent your interests through oversight of the quality of the investment management services your funds receive and other matters important to your investment, including but not limited to: |
| | | ∎ | | Ensuring that Invesco offers a diverse lineup of mutual funds that your financial adviser can use to strive to meet your financial needs as your investment goals change over time. |
| | | | ∎ | | Monitoring how the portfolio management teams of the Invesco funds are performing in light of changing economic and market conditions. |
| ∎ | | Assessing each portfolio management team’s investment performance within the context of the investment strategy described in the fund’s prospectus. |
| ∎ | | Monitoring for potential conflicts of interests that may impact the nature of the services that your funds receive. |
We believe one of the most important services we provide our fund shareholders is the annual review of the funds’ advisory and sub-advisory contracts with Invesco Advisers and its affiliates. This review is required by the Investment Company Act of 1940 and focuses on the nature and quality of the services Invesco provides as the adviser to the Invesco funds and the reasonableness of the fees that it charges for those services. Each year, we spend months carefully reviewing information received from Invesco and a variety of independent sources, such as performance and fee data prepared by Lipper Inc., an independent, third-party firm widely recognized as a leader in its field. We also meet with our independent legal counsel and other independent advisers to review and help us assess the information that we have received. Our goal is to assure that you receive quality investment management services for a reasonable fee.
I trust the measures outlined above provide assurance that you have a worthy advocate when it comes to choosing the Invesco Funds.
As always, please contact me at bruce@brucecrockett.com with any questions or concerns you may have. On behalf of the Board, we look forward to continuing to represent your interests and serving your needs.
Sincerely,

Bruce L. Crockett
Independent Chair
Invesco Funds Board of Trustees
3 Invesco Greater China Fund
Management’s Discussion of Fund Performance
| | | | |
Performance summary For the fiscal year ended October 31, 2016, Class A shares of Invesco Greater China Fund (the Fund), at net asset value (NAV), underperformed the MSCI Golden Dragon Index, the Fund’s broad market/style-specific benchmark. Your Fund’s long-term performance appears later in this report. | |
Fund vs. Indexes Total returns, 10/31/15 to 10/31/16, at net asset value (NAV). Performance shown does not include applicable contingent deferred sales charges (CDSC) or front-end sales charges, which would have reduced performance. | |
Class A Shares | | | 6.41 | % |
Class B Shares | | | 5.61 | |
Class C Shares | | | 5.68 | |
Class Y Shares | | | 6.67 | |
Class R5 Shares | | | 6.95 | |
MSCI Golden Dragon Indexq (Broad Market/Style-Specific Index) | | | 6.96 | |
Lipper China Region Funds Index∎ (Peer Group Index) | | | 3.92 | |
Source(s): qFactSet Research Systems Inc.; ∎Lipper Inc. | | | | |
Market conditions and your Fund
The fiscal year ended October 31, 2016, was an eventful year for Chinese equities, with a volatile start followed by a turnaround in investor sentiment. China’s macroeconomic conditions have shown sequential improvements over the course of 2016, with broad-based pick-up seen in various economic activities. Resilient retail sales, a vibrant property market and an upturn in overall investment activity helped the Chinese economy rebalance smoothly toward a higher quality mix of growth.
In the first half of 2016, Chinese equity markets saw volatility on concerns over the lingering of China’s economic slowdown, as well as volatility in the Chinese renminbi in the beginning of the year. The second quarter of 2016 ended in the positive territory despite global market sentiment swings over the uncertainty over the US Federal Reserve’s interest rate decisions, global growth and results of the Brexit referendum in the UK.
In the second half of 2016, there was a notable recovery in corporate
earnings, which echoed the improving macroeconomic backdrop. The approval of the Shenzhen-Hong Kong Stock Connect that was announced in the third quarter of 2016 also lifted investor confidence. When China’s insurance funds were granted access to invest in Hong Kong equities via the southbound Shanghai-Hong Kong Stock Connect channel in September following the removal of the aggregate quotas, there was a record fund flow into Hong Kong via the Stock Connect.
For the reporting period ended October 31, 2016, stock selection was a notable contributor to Fund performance relative to the broad market/style-specific index. In particular, select holdings in the information technology sector benefited Fund performance. Taiwan Semiconductor Manufacturing Company is a market leader in semiconductor manufacturing and is a key supplier for Apple (not a Fund holding) products. Tencent Holdings, a leading online gaming platform in China, has delivered impressive performance in building the user base of Weixin/WeChat, a communication mobile app.
Stock selection in and overweight exposure to the consumer discretionary sector also contributed to the Fund’s performance versus the broad market/style-specific index. Minth Group, a leading supplier of exterior auto parts, is a tier-1 supplier to major domestic and global automakers. The company delivered solid earnings in the first half of 2016 and robust sales growth prospects coming from both domestic and overseas businesses. Pou Sheng International, a sportswear retailer in mainland China, and Hong Kong-based furniture company Man Wah Holdings also contributed to the Fund’s relative performance. Further, stock selection in and underweight exposure to the financials sector contributed to the Fund’s relative performance.
In contrast, stock selection in and overweight exposure to the consumer staples sector were leading detractors from the Fund’s performance versus the broad market/style-specific benchmark. Tingyi, the largest instant noodle producer in China, was the leading detractor due to overall weak domestic consumption, as well as unsuccessful price hikes and product launches. That said, the company’s corporate strategy of focusing on more premium products may drive growth over the long term, but the transition will take time. Hygiene products company Hengan International was another key detractor from Fund performance within the sector.
Stock selection in the telecommunication services sector detracted from the Fund’s performance versus the broad market/style-specific index. In the sector, relative underperformance was driven by Fund holding SmarTone Telecom.
The Fund’s modest cash position detracted from relative results as the market
| | |
| Portfolio Composition |
By sector | | % of total net assets |
| | | | |
Consumer Discretionary | | | 33.4 | % |
Information Technology | | | 30.8 | |
Consumer Staples | | | 15.0 | |
Telecommunication Services | | | 8.1 | |
Industrials | | | 5.7 | |
Health Care | | | 3.9 | |
Utilities | | | 2.6 | |
Money Market Funds | | | | |
| Plus Other Assets Less Liabilities | | | 0.5 | |
| | | | | | |
| Top 10 Equity Holdings* |
| | | | | | % of total net assets |
| | | | | | |
1. | | Tencent Holdings Ltd. | | | 9.6 | % |
2. | | Taiwan Semiconductor Manufacturing Co. Ltd. | | | 7.4 | |
3. | | China Mobile Ltd. | | | 6.3 | |
4. | | New Oriental Education & Technology Group, Inc.-ADR | | | 4.7 | |
5. | | Alibaba Group Holding Ltd.-ADR | | | 4.6 | |
6. | | Vipshop Holdings Ltd. | | | 4.2 | |
7. | | Ctrip.com International, Ltd.-ADR | | | 4.2 | |
8. | | Sun Art Retail Group Ltd. | | | 4.0 | |
9. | | Hengan International Group Co. Ltd. | | | 3.5 | |
10. | | Largan Precision Co., Ltd. | | | 3.2 | |
| | | | |
Total Net Assets | | | $70.8 million | |
| |
| Total Number of Holdings* | | | 38 | |
The Fund’s holdings are subject to change, and there is no assurance that the Fund will continue to hold any particular security.
*Excluding money market fund holdings.
Data presented here are as of October 31, 2016.
4 Invesco Greater China Fund
(represented by the MSCI Golden Dragon Index) was up for the reporting period.
China’s economy continues to transform from an economy that was once dominated by growth in manufacturing and investment to one that is being driven more by consumers. We believe that the positive trend in consumption will continue to play a key role in propelling China’s economy, supported by the ongoing expansion of service industries, ample liquidity and stable income growth. At the same time, we believe it is important for the government to continue to deal with the challenges of unwinding debt and capacity imbalances, while pursuing reforms to improve markets and long-term growth prospects. We believe there may be some supportive catalysts for Chinese equities in terms of earnings, policy developments and economic growth. The imminent launch of the Shenzhen-Hong Kong Stock Connect program demonstrates China’s commitment to improving capital market accessibility and we expect further developments on this front. From a bottom-up perspective, we believe corporate earnings may continue improving with current valuations of Chinese stocks remaining favorable for investors.
We continue to focus purely on bottom-up stock opportunities to build a portfolio with high conviction stock positions. We adopt a selective approach, favoring companies with sustainable leadership and competitive advantages, which are trading at a discount to their fair value.
Thank you for your continued investment in Invesco Greater China Fund.
The views and opinions expressed in management’s discussion of Fund performance are those of Invesco Advisers, Inc. These views and opinions are subject to change at any time based on factors such as market and economic conditions. These views and opinions may not be relied upon as investment advice or recommendations, or as an offer for a particular security. The information is not a complete analysis of every aspect of any market, country, industry, security or the Fund. Statements of fact are from sources considered reliable, but Invesco Advisers, Inc. makes no representation or warranty as to their completeness or accuracy. Although historical performance is no guarantee of future results, these insights may help you understand our investment management philosophy.
See important Fund and, if applicable, index disclosures later in this report.
| | |
 | | Mike Shiao Portfolio Manager and Chief Investment Officer of Invesco’s Greater China equities team, |
is manager of Invesco Greater China Fund. He joined Invesco in 2002. Mr. Shiao earned a bachelor’s degree from National Chung Hsing University, Taiwan and an MS in finance from Drexel University. |
5 Invesco Greater China Fund
Your Fund’s Long-Term Performance
Results of a $10,000 Investment – Oldest Share Class(es)
Fund and index data from 10/31/06
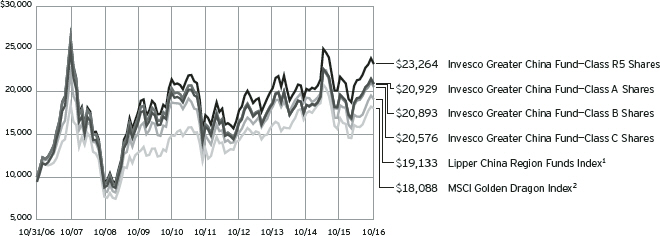
| 2 Source: | FactSet Research Systems Inc. |
Past performance cannot guarantee comparable future results.
The data shown in the chart include reinvested distributions, applicable sales charges and Fund expenses including management fees. Results for Class B shares are calculated as if a hypothetical
shareholder had liquidated his entire investment in the Fund at the close of the reporting period and paid the contingent deferred sales charges, if applicable. Index results include reinvested dividends, but they do not reflect sales charges. Performance of the peer group,
if applicable, reflects fund expenses and management fees; performance of a market index does not. Performance shown in the chart and table(s) does not reflect deduction of taxes a shareholder would pay on Fund distributions or sale of Fund shares.
6 Invesco Greater China Fund
| | | | |
| Average Annual Total Returns | |
As of 10/31/16, including maximum applicable sales charges | |
| |
Class A Shares | | | | |
Inception (3/31/06) | | | 8.18 | % |
10 Years | | | 7.66 | |
5 Years | | | 4.48 | |
1 Year | | | 0.55 | |
| |
Class B Shares | | | | |
Inception (3/31/06) | | | 8.16 | % |
10 Years | | | 7.65 | |
5 Years | | | 4.56 | |
1 Year | | | 0.61 | |
| |
Class C Shares | | | | |
Inception (3/31/06) | | | 7.95 | % |
10 Years | | | 7.48 | |
5 Years | | | 4.89 | |
1 Year | | | 4.68 | |
| |
Class Y Shares | | | | |
10 Years | | | 8.49 | % |
5 Years | | | 5.93 | |
1 Year | | | 6.67 | |
| |
Class R5 Shares | | | | |
Inception (3/31/06) | | | 9.27 | % |
10 Years | | | 8.81 | |
5 Years | | | 6.17 | |
1 Year | | | 6.95 | |
Class Y shares incepted on October 3, 2008. Performance shown prior to that date is that of Class A shares and includes the 12b-1 fees applicable to Class A shares.
The performance data quoted represent past performance and cannot guarantee comparable future results; current performance may be lower or higher. Please visit invesco.com/performance for the most recent month-end performance. Performance figures reflect reinvested distributions, changes in net asset value and the effect of the maximum sales charge unless otherwise stated. Investment return and principal value will fluctuate so that you may have a gain or loss when you sell shares.
The total annual Fund operating expense ratio set forth in the most recent Fund prospectus as of the date of this report for Class A, Class B, Class C, Class Y and Class R5 shares was
1.88%, 2.63%, 2.63%, 1.63% and
1.41%, respectively. The expense ratios presented above may vary from the expense ratios presented in other sections of this report that are based on expenses incurred during the period covered by this report.
| | | | |
| Average Annual Total Returns | |
| As of 9/30/16, the most recent calendar quarter end, including maximum applicable sales charges | |
| |
Class A Shares | | | | |
Inception (3/31/06) | | | 8.54 | % |
10 Years | | | 8.69 | |
5 Years | | | 7.49 | |
1 Year | | | 11.70 | |
| |
Class B Shares | | | | |
Inception (3/31/06) | | | 8.52 | % |
10 Years | | | 8.67 | |
5 Years | | | 7.60 | |
1 Year | | | 12.31 | |
| |
Class C Shares | | | | |
Inception (3/31/06) | | | 8.31 | % |
10 Years | | | 8.50 | |
5 Years | | | 7.91 | |
1 Year | | | 16.34 | |
| |
Class Y Shares | | | | |
10 Years | | | 9.53 | % |
5 Years | | | 8.99 | |
1 Year | | | 18.48 | |
| |
Class R5 Shares | | | | |
Inception (3/31/06) | | | 9.64 | % |
10 Years | | | 9.84 | |
5 Years | | | 9.23 | |
1 Year | | | 18.77 | |
Class A share performance reflects the maximum 5.50% sales charge, and Class B and Class C share performance reflects the applicable contingent deferred sales charge (CDSC) for the period involved. The CDSC on Class B shares declines from 5% beginning at the time of purchase to 0% at the beginning of the seventh year. The CDSC on Class C shares is 1% for the first year after purchase. Class Y and Class R5 shares do not have a front-end sales charge or a CDSC; therefore, performance is at net asset value.
The performance of the Fund’s share classes will differ primarily due to different sales charge structures and class expenses.
Fund performance reflects any applicable fee waivers and/or expense reimbursements. Had the adviser not waived fees and/or reimbursed expenses currently or in the past, returns would have been lower. See current prospectus for more information.
|
7 Invesco Greater China Fund |
Invesco Greater China Fund’s investment objective is long-term growth of capital.
| ∎ | | Unless otherwise stated, information presented in this report is as of October 31, 2016, and is based on total net assets. |
| ∎ | | Unless otherwise noted, all data provided by Invesco. |
| ∎ | | To access your Fund’s reports/prospectus, visit invesco.com/fundreports. |
About share classes
| ∎ | | Class B shares may not be purchased for new or additional investments. Please see the prospectus for more information. |
| ∎ | | Class Y shares are available only to certain investors. Please see the prospectus for more information. |
| ∎ | | Class R5 shares are primarily intended for employer sponsored retirement and benefit plans that meet certain standards and for institutional investors. Please see the prospectus for more information. |
Principal risks of investing in the Fund
| ∎ | | Convertible securities risk. The market values of convertible securities are affected by market interest rates, the risk of actual issuer default on interest or principal payments and the value of the underlying common stock into which the convertible security may be converted. Additionally, a convertible security is subject to the same types of market and issuer risks as apply to the underlying common stock. In addition, certain convertible securities are subject to involuntary conversions and may undergo principal write-downs upon the occurrence of certain triggering events, and, as a result, are subject to an increased risk of loss. |
| ∎ | | Debt securities risk. The prices of debt securities held by the Fund will be affected by changes in interest rates, the creditworthiness of the issuer and other factors. An increase in prevailing interest rates typically causes the value of existing debt securities to fall and often has a greater impact on longer-duration debt securities and higher quality debt securities. Falling interest rates will cause the Fund to reinvest the proceeds of debt securities that have been repaid by the issuer at lower interest rates. Falling interest rates may also reduce the Fund’s distributable income because interest payments on floating rate debt instruments held by the Fund will decline. The Fund could lose money |
| | on investments in debt securities if the issuer or borrower fails to meet its obligations to make interest payments and/or to repay principal in a timely manner. Changes in an issuer’s financial strength, the market’s perception of such strength or in the credit rating of the issuer or the security may affect the value of debt securities. The Adviser’s credit analysis may fail to anticipate such changes, which could result in buying a debt security at an inopportune time or failing to sell a debt security in advance of a price decline or other credit event. |
| ∎ | | Depositary receipts risk. Investing in depositary receipts involves the same risks as direct investments in foreign securities. In addition, the underlying issuers of certain depositary receipts are under no obligation to distribute shareholder communications or pass through any voting rights with respect to the deposited securities to the holders of such receipts. The Fund may therefore receive less timely information or have less control than if it invested directly in the foreign issuer. |
| ∎ | | Emerging markets securities risk. Emerging markets (also referred to as developing markets) are generally subject to greater market volatility, political, social and economic instability, uncertain trading markets and more governmental limitations on foreign investment than more developed markets. In addition, emerging markets may be subject to lower trading volume and greater price fluctuations than companies in more developed markets. Securities law and the enforcement of systems of taxation in many emerging market countries may change quickly and unpredictably. In addition, investments in emerging markets securities may also be subject to additional transaction costs, delays in settlement procedures, and lack of timely information. |
| ∎ | | Foreign government debt risk. Investments in foreign government debt securities (sometimes referred to as sovereign debt securities) involve certain |
| | | risks in addition to those relating to foreign securities or debt securities generally. The issuer of the debt or the governmental authorities that control the repayment of the debt may be unable or unwilling to repay principal or interest when due in accordance with the terms of such debt, and the Fund may have limited recourse in the event of a default against the defaulting government. Without the approval of debt holders, some governmental debtors have in the past been able to reschedule or restructure their debt payments or declare moratoria on payments. |
| ∎ | | Foreign securities risk. The Fund’s foreign investments may be adversely affected by political and social instability, changes in economic or taxation policies, difficulty in enforcing obligations, decreased liquidity or increased volatility. Foreign investments also involve the risk of the possible seizure, nationalization or expropriation of the issuer or foreign deposits (in which the Fund could lose its entire investments in a certain market) and the possible adoption of foreign governmental restrictions such as exchange controls. Unless the Fund has hedged its foreign securities risk, foreign securities risk also involves the risk of negative foreign currency rate fluctuations, which may cause the value of securities denominated in such foreign currency (or other instruments through which the Fund has exposure to foreign currencies) to decline in value. Currency exchange rates may fluctuate significantly over short periods of time. Currency hedging strategies, if used, are not always successful. |
| ∎ | | Geographic focus risk. The Fund may from time to time invest a substantial amount of its assets in securities of issuers located in a single country or a limited number of countries. Adverse economic, political or social conditions in those countries may therefore have a significant negative impact on the Fund’s investment performance. |
| ∎ | | Management risk. The Fund is actively managed and depends heavily on the Adviser’s judgment about markets, interest rates or the attractiveness, relative values, liquidity, or potential appreciation of particular investments made for the Fund’s portfolio. The Fund could experience losses if these judgments |
|
This report must be accompanied or preceded by a currently effective Fund prospectus, which contains more complete information, including sales charges and expenses. Investors should read it carefully before investing. |
|
NOT FDIC INSURED | MAY LOSE VALUE | NO BANK GUARANTEE |
8 Invesco Greater China Fund
prove to be incorrect. Additionally, legislative, regulatory, or tax developments may adversely affect management of the Fund and, therefore, the ability of the Fund to achieve its investment objective.
| ∎ | | Market risk. The market values of the Fund’s investments, and therefore the value of the Fund’s shares, will go up and down, sometimes rapidly or unpredictably. Market risk may affect a single issuer, industry or section of the economy, or it may affect the market as a whole. Individual stock prices tend to go up and down more dramatically than those of certain other types of investments, such as bonds. During a general downturn in the financial markets, multiple asset classes may decline in value. |
When markets perform well, there can be no assurance that specific investments held by the Fund will rise in value.
| ∎ | | Participation notes risk. Investments in participation notes involve the same risks associated with a direct investment in the underlying security, currency or market they seek to replicate, and, in addition, subject the Fund to the creditworthiness of the bank or broker-dealer that issued the participation notes. |
| ∎ | | Preferred securities risk. Preferred securities are subject to issuer-specific and market risks applicable generally to equity securities. Preferred securities also may be subordinated to bonds or other debt instruments, subjecting them to a greater risk of non-payment, may be less liquid than many other securities, such as common stocks, and generally offer no voting rights with respect to the issuer. |
| ∎ | | Sector focus risk. The Fund may from time to time invest a significant amount of its assets (i.e. over 25%) in one market sector or group of related industries. In this event, the Fund’s performance will depend to a greater extent on the overall condition of the sector or group of industries and there is increased risk that the Fund will lose significant value if conditions adversely affect that sector or group of industries. |
| ∎ | | Small- and mid-capitalization companies risks. Small- and mid-capitalization companies tend to be more vulnerable to changing market conditions, may have little or no operating history or track record of success, and may have |
more limited product lines and markets, less experienced management and fewer financial resources than larger companies. These companies’ securities may be more volatile and less liquid than those of more established companies, and their returns may vary, sometimes significantly, from the overall securities market.
| ∎ | | Unique economic and political risks of investing in Greater China. Investments in companies located or operating in Greater China involve risks not associated with investments in Western nations, such as nationalization, expropriation, or confiscation of property; difficulty in obtaining and/or enforcing judgments; alteration or discontinuation of economic reforms; military conflicts, either internal or with other countries; inflation, currency fluctuations and fluctuations in inflation and interest rates that may have negative effects on the economy and securities markets of Greater China; and Greater China’s dependency on the economies of other Asian countries, many of which are developing countries. Events in any one country within Greater China may impact the other countries in the region or Greater China as a whole. Additionally, developing countries, such as those in Greater China, may subject the Fund’s investments to a number of tax rules, and the application of many of those rules may be uncertain. Moreover, China has implemented a number of tax reforms in recent years, and may amend or revise its existing tax laws and/or procedures in the future, possibly with retroactive effect. Changes in applicable Chinese tax law could reduce the after-tax profits of the Fund, directly or indirectly, including by reducing the after-tax profits of companies in China in which the Fund invests. Uncertainties in Chinese tax rules could result in unexpected tax liabilities for the Fund. |
About indexes used in this report
| ∎ | | The MSCI Golden Dragon Index captures the equity market performance of large- and mid-cap China securities and non-domestic China securities listed in Hong Kong and Taiwan. The index is computed using the net return, which withholds applicable taxes for non-residents. |
| ∎ | | The Lipper China Region Funds Index is an unmanaged index considered representative of China region funds tracked by Lipper. |
| ∎ | | The Fund is not managed to track the performance of any particular index, including the index(es) described here, and consequently, the performance of the Fund may deviate significantly from the performance of the index(es). |
| ∎ | | A direct investment cannot be made in an index. Unless otherwise indicated, index results include reinvested dividends, and they do not reflect sales charges. Performance of the peer group, if applicable, reflects fund expenses; performance of a market index does not. |
Other information
| ∎ | | The returns shown in management’s discussion of Fund performance are based on net asset values (NAVs) calculated for shareholder transactions. Generally accepted accounting principles require adjustments to be made to the net assets of the Fund at period end for financial reporting purposes, and as such, the NAVs for shareholder transactions and the returns based on those NAVs may differ from the NAVs and returns reported in the Financial Highlights. |
| ∎ | | Industry classifications used in this report are generally according to the Global Industry Classification Standard, which was developed by and is the exclusive property and a service mark of MSCI Inc. and Standard & Poor’s. |
9 Invesco Greater China Fund
Schedule of Investments(a)
October 31, 2016
| | | | | | | | |
| | | Shares | | | Value | |
Common Stocks & Other Equity Interests–99.53%(b) | |
| Apparel Retail–1.50% | |
Pou Sheng International (Holdings) Ltd. (Hong Kong) | | | 3,383,000 | | | $ | 1,059,989 | |
|
| Auto Parts & Equipment–3.01% | |
Minth Group Ltd. | | | 600,000 | | | | 2,130,994 | |
|
| Automobile Manufacturers–1.11% | |
Jiangling Motors Corp., Ltd.–Class B | | | 311,100 | | | | 785,828 | |
|
| Education Services–4.72% | |
New Oriental Education & Technology Group, Inc.–ADR(c) | | | 66,681 | | | | 3,342,719 | |
|
| Electrical Components & Equipment–3.50% | |
Voltronic Power Technology Corp. (Taiwan) | | | 24,150 | | | | 362,748 | |
Zhuzhou CRRC Times Electric Co., Ltd.–Class H | | | 437,500 | | | | 2,117,733 | |
| | | | | | | | 2,480,481 | |
|
| Electronic Components–4.91% | |
Chin-Poon Industrial Co., Ltd. (Taiwan) | | | 647,000 | | | | 1,240,406 | |
Largan Precision Co., Ltd. (Taiwan) | | | 19,000 | | | | 2,240,499 | |
| | | | | | | | 3,480,905 | |
|
| Electronic Equipment & Instruments–0.47% | |
Flytech Technology Co., Ltd. (Taiwan) | | | 102,000 | | | | 335,628 | |
|
| Electronic Manufacturing Services–2.10% | |
FIH Mobile Ltd. | | | 4,504,000 | | | | 1,486,727 | |
|
| Food Retail–2.91% | |
President Chain Store Corp. (Taiwan) | | | 276,000 | | | | 2,064,075 | |
|
| Footwear–4.92% | |
Stella International Holdings Ltd. | | | 908,500 | | | | 1,576,751 | |
Yue Yuen Industrial (Holdings) Ltd. (Hong Kong) | | | 500,500 | | | | 1,907,017 | |
| | | | | | | | 3,483,768 | |
|
| Gas Utilities–2.58% | |
Towngas China Co. Ltd. (Hong Kong) | | | 3,244,000 | | | | 1,824,784 | |
|
| Health Care Equipment–2.47% | |
MicroPort Scientific Corp.(c) | | | 2,365,000 | | | | 1,750,395 | |
|
| Home Furnishings–1.34% | |
Man Wah Holdings Ltd. (Hong Kong) | | | 1,428,000 | | | | 948,262 | |
|
| Hotels, Resorts & Cruise Lines–0.07% | |
Shanghai Jinjiang International Hotels Development Co., Ltd.–Class B | | | 22,948 | | | | 48,971 | |
|
| Hypermarkets & Super Centers–4.01% | |
Sun Art Retail Group Ltd. (Hong Kong) | | | 4,029,500 | | | | 2,842,048 | |
|
| Industrial Conglomerates–1.71% | |
Beijing Enterprises Holdings Ltd. | | | 242,000 | | | | 1,208,558 | |
|
| Industrial Machinery–0.48% | |
CIMC Enric Holdings Ltd. | | | 814,000 | | | | 341,115 | |
| | | | | | | | |
| | | Shares | | | Value | |
| Internet & Direct Marketing Retail–11.34% | |
Ctrip.com International, Ltd.–ADR(c) | | | 66,560 | | | $ | 2,938,624 | |
JD.com, Inc.–ADR(c) | | | 82,662 | | | | 2,145,079 | |
Vipshop Holdings Ltd.–ADR(c) | | | 215,787 | | | | 2,949,808 | |
| | | | | | | | 8,033,511 | |
|
| Internet Software & Services–14.20% | |
Alibaba Group Holding Ltd.–ADR(c) | | | 31,789 | | | | 3,232,623 | |
Tencent Holdings Ltd. | | | 257,700 | | | | 6,823,917 | |
| | | | | | | | 10,056,540 | |
|
| Leisure Products–0.75% | |
Goodbaby International Holdings Ltd. | | | 1,091,000 | | | | 527,532 | |
|
| Packaged Foods & Meats–4.55% | |
Qinqin Foodstuffs Group (Cayman) Co. Ltd.(c) | | | 55,600 | | | | 19,213 | |
Tingyi (Cayman Islands) Holding Corp. | | | 1,468,000 | | | | 1,584,326 | |
Uni-President China Holdings Ltd. | | | 2,396,000 | | | | 1,621,956 | |
| | | | | | | | 3,225,495 | |
|
| Personal Products–3.51% | |
Hengan International Group Co. Ltd. | | | 312,500 | | | | 2,488,170 | |
|
| Pharmaceuticals–1.46% | |
Sino Biopharmaceutical Ltd. | | | 1,480,000 | | | | 1,036,226 | |
|
| Restaurants–2.33% | |
Ajisen (China) Holdings Ltd. (Hong Kong) | | | 3,673,000 | | | | 1,652,873 | |
|
| Semiconductors–9.14% | |
Himax Technologies, Inc.–ADR (Taiwan) | | | 43,070 | | | | 338,099 | |
Taiwan Semiconductor Manufacturing Co. Ltd. (Taiwan) | | | 883,000 | | | | 5,274,440 | |
Win Semiconductors Corp. (Taiwan) | | | 312,004 | | | | 865,134 | |
| | | | | | | | 6,477,673 | |
|
| Specialty Stores–2.31% | |
Chow Tai Fook Jewellery Group Ltd. (Hong Kong) | | | 2,309,800 | | | | 1,638,061 | |
|
| Wireless Telecommunication Services–8.13% | |
China Mobile Ltd. | | | 391,500 | | | | 4,485,204 | |
SmarTone Telecommunications Holdings Ltd. (Hong Kong) | | | 843,000 | | | | 1,273,938 | |
| | | | | 5,759,142 | |
Total Common Stocks & Other Equity Interests
(Cost $69,988,017) | | | | 70,510,470 | |
| | |
Money Market Funds–0.49% | | | | | | | | |
Government & Agency Portfolio–Institutional Class, 0.29%(d) | | | 210,402 | | | | 210,402 | |
Treasury Portfolio–Institutional Class, 0.22%(d) | | | 140,268 | | | | 140,268 | |
Total Money Market Funds
(Cost $350,670) | | | | | | | 350,670 | |
TOTAL INVESTMENTS–100.02%
(Cost $70,338,687) | | | | 70,861,140 | |
OTHER ASSETS LESS LIABILITIES–(0.02)% | | | | (15,424 | ) |
NET ASSETS–100.00% | | | $ | 70,845,716 | |
See accompanying Notes to Financial Statements which are an integral part of the financial statements.
10 Invesco Greater China Fund
Investment Abbreviations:
| | |
| ADR | | – American Depositary Receipt |
Notes to Schedule of Investments:
| (a) | Industry and/or sector classifications used in this report are generally according to the Global Industry Classification Standard, which was developed by and is the exclusive property and a service mark of MSCI Inc. and Standard & Poor’s. |
| (b) | Country of issuer and/or credit risk exposure listed in Common Stocks & Other Equity Interests has been determined to be China unless otherwise noted. |
| (c) | Non-income producing security. |
| (d) | The money market fund and the Fund are affiliated by having the same investment adviser. The rate shown is the 7-day SEC standardized yield as of October 31, 2016. |
See accompanying Notes to Financial Statements which are an integral part of the financial statements.
11 Invesco Greater China Fund
Statement of Assets and Liabilities
October 31, 2016
| | | | |
Assets: | |
Investments, at value (Cost $69,988,017) | | $ | 70,510,470 | |
Investments in affiliated money market funds, at value and cost | | | 350,670 | |
Total investments, at value (Cost $70,338,687) | | | 70,861,140 | |
Foreign currencies, at value (Cost $53,218) | | | 53,367 | |
Receivable for: | | | | |
Investments sold | | | 285,450 | |
Fund shares sold | | | 167,119 | |
Dividends | | | 23,406 | |
Investment for trustee deferred compensation and retirement plans | | | 47,808 | |
Other assets | | | 15,623 | |
Total assets | | | 71,453,913 | |
|
Liabilities: | |
Payable for: | | | | |
Investments purchased | | | 353,233 | |
Fund shares reacquired | | | 64,284 | |
Accrued fees to affiliates | | | 64,839 | |
Accrued trustees’ and officers’ fees and benefits | | | 1,598 | |
Accrued other operating expenses | | | 70,933 | |
Trustee deferred compensation and retirement plans | | | 53,310 | |
Total liabilities | | | 608,197 | |
Net assets applicable to shares outstanding | | $ | 70,845,716 | |
|
Net assets consist of: | |
Shares of beneficial interest | | $ | 81,582,680 | |
Undistributed net investment income | | | 327,427 | |
Undistributed net realized gain (loss) | | | (11,586,981 | ) |
Net unrealized appreciation | | | 522,590 | |
| | | $ | 70,845,716 | |
| | | | |
Net Assets: | |
Class A | | $ | 52,479,076 | |
Class B | | $ | 1,217,833 | |
Class C | | $ | 11,879,059 | |
Class Y | | $ | 5,215,771 | |
Class R5 | | $ | 53,977 | |
|
Shares outstanding, $0.01 par value per share,
with an unlimited number of shares authorized: | |
Class A | | | 2,360,996 | |
Class B | | | 56,496 | |
Class C | | | 552,025 | |
Class Y | | | 234,340 | |
Class R5 | | | 2,423 | |
Class A: | | | | |
Net asset value per share | | $ | 22.23 | |
Maximum offering price per share | | | | |
(Net asset value of $22.23 ¸ 94.50%) | | $ | 23.52 | |
Class B: | | | | |
Net asset value and offering price per share | | $ | 21.56 | |
Class C: | | | | |
Net asset value and offering price per share | | $ | 21.52 | |
Class Y: | | | | |
Net asset value and offering price per share | | $ | 22.26 | |
Class R5: | | | | |
Net asset value and offering price per share | | $ | 22.28 | |
See accompanying Notes to Financial Statements which are an integral part of the financial statements.
12 Invesco Greater China Fund
Statement of Operations
For the year ended October 31, 2016
| | | | |
Investment income: | |
Dividends (net of foreign withholding taxes of $108,544) | | $ | 1,838,669 | |
Dividends from affiliated money market funds | | | 3,030 | |
Total investment income | | | 1,841,699 | |
| |
Expenses: | | | | |
Advisory fees | | | 643,840 | |
Administrative services fees | | | 50,000 | |
Custodian fees | | | 36,215 | |
Distribution fees: | | | | |
Class A | | | 126,350 | |
Class B | | | 17,543 | |
Class C | | | 123,596 | |
Transfer agent Fees — A, B, C and Y | | | 226,846 | |
Transfer agent fees — R5 | | | 65 | |
Trustees’ and officers’ fees and benefits | | | 21,350 | |
Registration and filing fees | | | 65,735 | |
Reports to shareholders | | | 31,271 | |
Professional services fees | | | 61,069 | |
Other | | | 21,148 | |
Total expenses | | | 1,425,028 | |
Less: Fees waived and expense offset arrangement(s) | | | (3,234 | ) |
Net expenses | | | 1,421,794 | |
Net investment income | | | 419,905 | |
| |
Realized and unrealized gain (loss) from: | | | | |
Net realized gain (loss) from: | | | | |
Investment securities | | | (214,112 | ) |
Foreign currencies | | | (14,263 | ) |
| | | | (228,375 | ) |
Change in net unrealized appreciation of: | | | | |
Investment securities | | | 3,807,706 | |
Foreign currencies | | | 140 | |
| | | | 3,807,846 | |
Net realized and unrealized gain | | | 3,579,471 | |
Net increase in net assets resulting from operations | | $ | 3,999,376 | |
See accompanying Notes to Financial Statements which are an integral part of the financial statements.
13 Invesco Greater China Fund
Statement of Changes in Net Assets
For the years ended October 31, 2016 and 2015
| | | | | | | | |
| | | 2016 | | | 2015 | |
Operations: | | | | | |
Net investment income | | $ | 419,905 | | | $ | 577,260 | |
Net realized gain (loss) | | | (228,375 | ) | | | 7,034,154 | |
Change in net unrealized appreciation (depreciation) | | | 3,807,846 | | | | (2,934,547 | ) |
Net increase in net assets resulting from operations | | | 3,999,376 | | | | 4,676,867 | |
| | |
Distributions to shareholders from net investment income: | | | | | | | | |
Class A | | | (545,985 | ) | | | (268,684 | ) |
Class B | | | (3,961 | ) | | | — | |
Class C | | | (23,094 | ) | | | — | |
Class Y | | | (47,018 | ) | | | (25,936 | ) |
Class R5 | | | (1,312 | ) | | | (865 | ) |
Total distributions from net investment income | | | (621,370 | ) | | | (295,485 | ) |
| | |
Share transactions–net: | | | | | | | | |
Class A | | | (3,173,106 | ) | | | (13,093,503 | ) |
Class B | | | (1,402,208 | ) | | | (3,019,590 | ) |
Class C | | | (2,541,266 | ) | | | (2,861,129 | ) |
Class Y | | | 1,472,686 | | | | (1,077,083 | ) |
Class R5 | | | (21,707 | ) | | | (31,944 | ) |
Net increase (decrease) in net assets resulting from share transactions | | | (5,665,601 | ) | | | (20,083,249 | ) |
Net increase (decrease) in net assets | | | (2,287,595 | ) | | | (15,701,867 | ) |
| | |
Net assets: | | | | | | | | |
Beginning of year | | | 73,133,311 | | | | 88,835,178 | |
End of year (includes undistributed net investment income of $327,427 and $539,600, respectively) | | $ | 70,845,716 | | | $ | 73,133,311 | |
Notes to Financial Statements
October 31, 2016
NOTE 1—Significant Accounting Policies
Invesco Greater China Fund (the “Fund”) is a series portfolio of AIM Investment Funds (Invesco Investment Funds) (the “Trust”). The Trust is organized as a Delaware statutory trust and is registered under the Investment Company Act of 1940, as amended (the “1940 Act”), as an open-end series management investment company consisting of twenty-two separate series portfolios, each authorized to issue an unlimited number of shares of beneficial interest. The assets, liabilities and operations of each portfolio are accounted for separately. Information presented in these financial statements pertains only to the Fund. Matters affecting each portfolio or class will be voted on exclusively by the shareholders of such portfolio or class.
The Fund’s investment objective is long-term growth of capital.
The Fund currently consists of five different classes of shares: Class A, Class B, Class C, Class Y and Class R5. Class Y shares are available only to certain investors. Class A shares are sold with a front-end sales charge unless certain waiver criteria are met and under certain circumstances load waived shares may be subject to contingent deferred sales charges (“CDSC”). Class C shares are sold with a CDSC. Class Y and Class R5 shares are sold at net asset value. Effective November 30, 2010, new or additional investments in Class B shares are no longer permitted. Existing shareholders of Class B shares may continue to reinvest dividends and capital gains distributions in Class B shares until they convert to Class A shares. Also, shareholders in Class B shares will be able to exchange those shares for Class B shares of other Invesco Funds offering such shares until they convert to Class A shares. Generally, Class B shares will automatically convert to Class A shares on or about the month-end, which is at least eight years after the date of purchase. Redemption of Class B shares prior to the conversion date will be subject to a CDSC.
The following is a summary of the significant accounting policies followed by the Fund in the preparation of its financial statements.
| A. | Security Valuations — Securities, including restricted securities, are valued according to the following policy. |
A security listed or traded on an exchange (except convertible securities) is valued at its last sales price or official closing price as of the close of the customary trading session on the exchange where the security is principally traded, or lacking any sales or official closing price on a particular day, the security may be valued at the closing bid price on that day. Securities traded in the over-the-counter market are valued based on prices furnished by independent pricing services or market makers. When such securities are valued by an independent pricing service they may be considered fair valued. Futures contracts are valued at the final settlement price set by an exchange on which they are principally traded. Listed options are valued at the mean between the last bid and asked prices from the exchange on which they are principally traded. Options not listed on an exchange are valued by an independent source at the mean between the last bid and asked prices. For purposes of determining net
14 Invesco Greater China Fund
asset value (“NAV”) per share, futures and option contracts generally are valued 15 minutes after the close of the customary trading session of the New York Stock Exchange (“NYSE”).
Investments in open-end and closed-end registered investment companies that do not trade on an exchange are valued at the end-of-day net asset value per share. Investments in open-end and closed-end registered investment companies that trade on an exchange are valued at the last sales price or official closing price as of the close of the customary trading session on the exchange where the security is principally traded.
Debt obligations (including convertible securities) and unlisted equities are fair valued using an evaluated quote provided by an independent pricing service. Evaluated quotes provided by the pricing service may be determined without exclusive reliance on quoted prices, and may reflect appropriate factors such as institution-size trading in similar groups of securities, developments related to specific securities, dividend rate (for unlisted equities), yield (for debt obligations), quality, type of issue, coupon rate (for debt obligations), maturity (for debt obligations), individual trading characteristics and other market data. Debt obligations are subject to interest rate and credit risks. In addition, all debt obligations involve some risk of default with respect to interest and/or principal payments.
Foreign securities’ (including foreign exchange contracts) prices are converted into U.S. dollar amounts using the applicable exchange rates as of the close of the NYSE. If market quotations are available and reliable for foreign exchange-traded equity securities, the securities will be valued at the market quotations. Because trading hours for certain foreign securities end before the close of the NYSE, closing market quotations may become unreliable. If between the time trading ends on a particular security and the close of the customary trading session on the NYSE, events occur that the Adviser determines are significant and make the closing price unreliable, the Fund may fair value the security. If the event is likely to have affected the closing price of the security, the security will be valued at fair value in good faith using procedures approved by the Board of Trustees. Adjustments to closing prices to reflect fair value may also be based on a screening process of an independent pricing service to indicate the degree of certainty, based on historical data, that the closing price in the principal market where a foreign security trades is not the current value as of the close of the NYSE. Foreign securities’ prices meeting the approved degree of certainty that the price is not reflective of current value will be priced at the indication of fair value from the independent pricing service. Multiple factors may be considered by the independent pricing service in determining adjustments to reflect fair value and may include information relating to sector indices, American Depositary Receipts and domestic and foreign index futures. Foreign securities may have additional risks including exchange rate changes, potential for sharply devalued currencies and high inflation, political and economic upheaval, the relative lack of issuer information, relatively low market liquidity and the potential lack of strict financial and accounting controls and standards.
Securities for which market prices are not provided by any of the above methods may be valued based upon quotes furnished by independent sources. The last bid price may be used to value equity securities. The mean between the last bid and asked prices is used to value debt obligations, including corporate loans.
Securities for which market quotations are not readily available or became unreliable are valued at fair value as determined in good faith by or under the supervision of the Trust’s officers following procedures approved by the Board of Trustees. Issuer specific events, market trends, bid/asked quotes of brokers and information providers and other market data may be reviewed in the course of making a good faith determination of a security’s fair value.
The Fund may invest in securities that are subject to interest rate risk, meaning the risk that the prices will generally fall as interest rates rise and, conversely, the prices will generally rise as interest rates fall. Specific securities differ in their sensitivity to changes in interest rates depending on their individual characteristics. Changes in interest rates may result in increased market volatility, which may affect the value and/or liquidity of certain Fund investments.
Valuations change in response to many factors including the historical and prospective earnings of the issuer, the value of the issuer’s assets, general economic conditions, interest rates, investor perceptions and market liquidity. Because of the inherent uncertainties of valuation, the values reflected in the financial statements may materially differ from the value received upon actual sale of those investments.
| B. | Securities Transactions and Investment Income — Securities transactions are accounted for on a trade date basis. Realized gains or losses on sales are computed on the basis of specific identification of the securities sold. Interest income (net of withholding tax, if any) is recorded on the accrual basis from settlement date. Dividend income (net of withholding tax, if any) is recorded on the ex-dividend date. |
The Fund may periodically participate in litigation related to Fund investments. As such, the Fund may receive proceeds from litigation settlements. Any proceeds received are included in the Statement of Operations as realized gain (loss) for investments no longer held and as unrealized gain (loss) for investments still held.
Brokerage commissions and mark ups are considered transaction costs and are recorded as an increase to the cost basis of securities purchased and/or a reduction of proceeds on a sale of securities. Such transaction costs are included in the determination of net realized and unrealized gain (loss) from investment securities reported in the Statement of Operations and the Statement of Changes in Net Assets and the net realized and unrealized gains (losses) on securities per share in the Financial Highlights. Transaction costs are included in the calculation of the Fund’s net asset value and, accordingly, they reduce the Fund’s total returns. These transaction costs are not considered operating expenses and are not reflected in net investment income reported in the Statement of Operations and the Statement of Changes in Net Assets, or the net investment income per share and the ratios of expenses and net investment income reported in the Financial Highlights, nor are they limited by any expense limitation arrangements between the Fund and the investment adviser.
The Fund allocates income and realized and unrealized capital gains and losses to a class based on the relative net assets of each class.
| C. | Country Determination — For the purposes of making investment selection decisions and presentation in the Schedule of Investments, the investment adviser may determine the country in which an issuer is located and/or credit risk exposure based on various factors. These factors include the laws of the country under which the issuer is organized, where the issuer maintains a principal office, the country in which the issuer derives 50% or more of its total revenues and the country that has the primary market for the issuer’s securities, as well as other criteria. Among the other criteria that may be evaluated for making this determination are the country in which the issuer maintains 50% or more of its assets, the type of security, financial guarantees and enhancements, the nature of the collateral and the sponsor organization. Country of issuer and/or credit risk exposure has been determined to be the United States of America, unless otherwise noted. |
| D. | Distributions — Distributions from net investment income and net realized capital gain, if any, are generally declared and paid annually and recorded on the ex-dividend date. The Fund may elect to treat a portion of the proceeds from redemptions as distributions for federal income tax purposes. |
15 Invesco Greater China Fund
| E. | Federal Income Taxes — The Fund intends to comply with the requirements of Subchapter M of the Internal Revenue Code of 1986, as amended (the “Internal Revenue Code”), necessary to qualify as a regulated investment company and to distribute substantially all of the Fund’s taxable earnings to shareholders. As such, the Fund will not be subject to federal income taxes on otherwise taxable income (including net realized capital gain) that is distributed to shareholders. Therefore, no provision for federal income taxes is recorded in the financial statements. |
The Fund recognizes the tax benefits of uncertain tax positions only when the position is more likely than not to be sustained. Management has analyzed the Fund’s uncertain tax positions and concluded that no liability for unrecognized tax benefits should be recorded related to uncertain tax positions. Management is not aware of any tax positions for which it is reasonably possible that the total amounts of unrecognized tax benefits will change materially in the next 12 months.
The Fund files tax returns in the U.S. Federal jurisdiction and certain other jurisdictions. Generally, the Fund is subject to examinations by such taxing authorities for up to three years after the filing of the return for the tax period.
| F. | Expenses — Fees provided for under the Rule 12b-1 plan of a particular class of the Fund are charged to the operations of such class. Transfer agency fees and expenses and other shareholder recordkeeping fees and expenses attributable to Class R5 are charged to such class. Transfer agency fees and expenses and other shareholder recordkeeping fees and expenses relating to all other classes are allocated among those classes based on relative net assets. All other expenses are allocated among the classes based on relative net assets. |
| G. | Accounting Estimates — The preparation of financial statements in conformity with accounting principles generally accepted in the United States of America (“GAAP”) requires management to make estimates and assumptions that affect the reported amounts of assets and liabilities at the date of the financial statements and the reported amounts of revenues and expenses during the reporting period including estimates and assumptions related to taxation. Actual results could differ from those estimates by a significant amount. In addition, the Fund monitors for material events or transactions that may occur or become known after the period-end date and before the date the financial statements are released to print. |
| H. | Indemnifications — Under the Trust’s organizational documents, each Trustee, officer, employee or other agent of the Trust is indemnified against certain liabilities that may arise out of the performance of their duties to the Fund. Additionally, in the normal course of business, the Fund enters into contracts, including the Fund’s servicing agreements, that contain a variety of indemnification clauses. The Fund’s maximum exposure under these arrangements is unknown as this would involve future claims that may be made against the Fund that have not yet occurred. The risk of material loss as a result of such indemnification claims is considered remote. |
| I. | Foreign Currency Translations — Foreign currency is valued at the close of the NYSE based on quotations posted by banks and major currency dealers. Portfolio securities and other assets and liabilities denominated in foreign currencies are translated into U.S. dollar amounts at date of valuation. Purchases and sales of portfolio securities (net of foreign taxes withheld on disposition) and income items denominated in foreign currencies are translated into U.S. dollar amounts on the respective dates of such transactions. The Fund does not separately account for the portion of the results of operations resulting from changes in foreign exchange rates on investments and the fluctuations arising from changes in market prices of securities held. The combined results of changes in foreign exchange rates and the fluctuation of market prices on investments (net of estimated foreign tax withholding) are included with the net realized and unrealized gain or loss from investments in the Statement of Operations. Reported net realized foreign currency gains or losses arise from (1) sales of foreign currencies, (2) currency gains or losses realized between the trade and settlement dates on securities transactions, and (3) the difference between the amounts of dividends, interest, and foreign withholding taxes recorded on the Fund’s books and the U.S. dollar equivalent of the amounts actually received or paid. Net unrealized foreign currency gains and losses arise from changes in the fair values of assets and liabilities, other than investments in securities at fiscal period end, resulting from changes in exchange rates. |
The Fund may invest in foreign securities, which may be subject to foreign taxes on income, gains on investments or currency repatriation, a portion of which may be recoverable. Foreign taxes, if any, are recorded based on the tax regulations and rates that exist in the foreign markets in which the Fund invests and are shown in the Statement of Operations.
| J. | Forward Foreign Currency Contracts — The Fund may engage in foreign currency transactions either on a spot (i.e. for prompt delivery and settlement) basis, or through forward foreign currency contracts, to manage or minimize currency or exchange rate risk. |
The Fund may also enter into forward foreign currency contracts for the purchase or sale of a security denominated in a foreign currency in order to “lock in” the U.S. dollar price of that security, or the Fund may also enter into forward foreign currency contracts that do not provide for physical settlement of the two currencies, but instead are settled by a single cash payment calculated as the difference between the agreed upon exchange rate and the spot rate at settlement based upon an agreed upon notional amount (non-deliverable forwards). The Fund will set aside liquid assets in an amount equal to the daily mark-to-market obligation for forward foreign currency contracts.
A forward foreign currency contract is an obligation between two parties (“Counterparties”) to purchase or sell a specific currency for an agreed-upon price at a future date. The use of forward foreign currency contracts does not eliminate fluctuations in the price of the underlying securities the Fund owns or intends to acquire but establishes a rate of exchange in advance. Fluctuations in the value of these contracts are measured by the difference in the contract date and reporting date exchange rates and are recorded as unrealized appreciation (depreciation) until the contracts are closed. When the contracts are closed, realized gains (losses) are recorded. Realized and unrealized gains (losses) on the contracts are included in the Statement of Operations. The primary risks associated with forward foreign currency contracts include failure of the Counterparty to meet the terms of the contract and the value of the foreign currency changing unfavorably. These risks may be in excess of the amounts reflected in the Statement of Assets and Liabilities.
| K. | Other Risks — Investing in a single-country mutual fund involves greater risk than investing in a more diversified fund due to lack of exposure to other countries. The political and economic conditions and changes in regulatory, tax or economic policy in a single country could significantly affect the market in that country and in surrounding or related countries. |
Investing in developing countries can add additional risk, such as high rates of inflation or sharply devalued currencies against the U.S. dollar.
Transaction costs are often higher and there may be delays in settlement procedures.
Certain securities issued by companies in China may be less liquid, harder to sell or more volatile than U.S. securities.
16 Invesco Greater China Fund
NOTE 2—Advisory Fees and Other Fees Paid to Affiliates
The Trust has entered into a master investment advisory agreement with Invesco Advisers, Inc. (the “Adviser” or “Invesco”). Under the terms of the investment advisory agreement, the Fund pays an advisory fee to the Adviser based on the annual rate of the Fund’s average daily net assets as follows:
| | | | | | | | |
| Average Daily Net Assets | | Rate | |
First $250 million | | | 0 | .935% | | | | |
Next $250 million | | | 0 | .91% | | | | |
Next $500 million | | | 0 | .885% | | | | |
Next $1.5 billion | | | 0 | .86% | | | | |
Next $2.5 billion | | | 0 | .835% | | | | |
Next $2.5 billion | | | 0 | .81% | | | | |
Next $2.5 billion | | | 0 | .785% | | | | |
Over $10 billion | | | 0 | .76% | | | | |
For the year ended October 31, 2016, the effective advisory fees incurred by the Fund was 0.935%.
Under the terms of a master sub-advisory agreement between the Adviser and each of Invesco Asset Management Deutschland GmbH, Invesco Asset Management Limited, Invesco Asset Management (Japan) Limited, Invesco Hong Kong Limited, Invesco Senior Secured Management, Inc. and Invesco Canada Ltd. (collectively, the “Affiliated Sub-Advisers”) the Adviser, not the Fund, will pay 40% of the fees paid to the Adviser to any such Affiliated Sub-Adviser(s) that provide(s) discretionary investment management services to the Fund based on the percentage of assets allocated to such Affiliated Sub-Adviser(s).
The Adviser has contractually agreed, through at least June 30, 2017, to waive advisory fees and/or reimburse expenses to the extent necessary to limit total annual fund operating expenses after fee waiver and/or expense reimbursement (excluding certain items discussed below) of Class A, Class B, Class C, Class Y and Class R5 shares to 2.25%, 3.00%, 3.00%, 2.00% and 2.00%, respectively, of the Fund’s average daily net assets (the “expense limits”). In determining the Adviser’s obligation to waive advisory fees and/or reimburse expenses, the following expenses are not taken into account, and could cause the total annual fund operating expenses after fee waiver and/or reimbursement to exceed the numbers reflected above: (1) interest; (2) taxes; (3) dividend expense on short sales; (4) extraordinary or non-routine items, including litigation expenses; and (5) expenses that the Fund has incurred but did not actually pay because of an expense offset arrangement. Unless Invesco continues the fee waiver agreement, it will terminate on June 30, 2017. During its term, the fee waiver agreement cannot be terminated or amended to increase the expense limits without approval of the Board of Trustees. The Adviser did not waive fees and/or reimburse expenses during the period under these expense limits.
Further, the Adviser has contractually agreed, through at least June 30, 2018, to waive the advisory fee payable by the Fund in an amount equal to 100% of the net advisory fees the Adviser receives from the affiliated money market funds on investments by the Fund of uninvested cash in such affiliated money market funds.
For the year ended October 31, 2016, the Adviser waived advisory fees of $1,313.
The Trust has entered into a master administrative services agreement with Invesco pursuant to which the Fund has agreed to pay Invesco for certain administrative costs incurred in providing accounting services to the Fund. For the year ended October 31, 2016, expenses incurred under the agreement are shown in the Statement of Operations as Administrative services fees.
The Trust has entered into a transfer agency and service agreement with Invesco Investment Services, Inc. (“IIS”) pursuant to which the Fund has agreed to pay IIS a fee for providing transfer agency and shareholder services to the Fund and reimburse IIS for certain expenses incurred by IIS in the course of providing such services. IIS may make payments to intermediaries that provide omnibus account services, sub-accounting services and/or networking services. All fees payable by IIS to intermediaries that provide omnibus account services or sub-accounting are charged back to the Fund, subject to certain limitations approved by the Trust’s Board of Trustees. For the year ended October 31, 2016, expenses incurred under the agreement are shown in the Statement of Operations as Transfer agent fees.
The Trust has entered into master distribution agreements with Invesco Distributors, Inc. (“IDI”) to serve as the distributor for the Class A, Class B, Class C, Class Y and Class R5 shares of the Fund. The Trust has adopted plans pursuant to Rule 12b-1 under the 1940 Act with respect to the Fund’s Class A, Class B and Class C shares (collectively, the “Plans”). The Fund, pursuant to the Plans, pays IDI compensation at the annual rate of 0.25% of the Fund’s average daily net assets of Class A shares and 1.00% of the average daily net assets of Class B and Class C shares. Of the Plan payments, up to 0.25% of the average daily net assets of each class of shares may be paid to furnish continuing personal shareholder services to customers who purchase and own shares of such classes. Any amounts not paid as a service fee under the Plans would constitute an asset-based sales charge. Rules of the Financial Industry Regulatory Authority (“FINRA”) impose a cap on the total sales charges, including asset-based sales charges, that may be paid by any class of shares of the Fund. For the year ended October 31, 2016, expenses incurred under the Plans are shown in the Statement of Operations as Distribution fees.
Front-end sales commissions and CDSC (collectively, the “sales charges”) are not recorded as expenses of the Fund. Front-end sales commissions are deducted from proceeds from the sales of Fund shares prior to investment in Class A shares of the Fund. CDSC are deducted from redemption proceeds prior to remittance to the shareholder. During the year ended October 31, 2016, IDI advised the Fund that IDI retained $9,425 in front-end sales commissions from the sale of Class A shares and $1, $196 and $682 from Class A, Class B and Class C shares, respectively, for CDSC imposed on redemptions by shareholders.
Certain officers and trustees of the Trust are officers and directors of the Adviser, IIS and/or IDI.
17 Invesco Greater China Fund
NOTE 3—Additional Valuation Information
GAAP defines fair value as the price that would be received to sell an asset or paid to transfer a liability in an orderly transaction between market participants at the measurement date, under current market conditions. GAAP establishes a hierarchy that prioritizes the inputs to valuation methods, giving the highest priority to readily available unadjusted quoted prices in an active market for identical assets (Level 1) and the lowest priority to significant unobservable inputs (Level 3), generally when market prices are not readily available or are unreliable. Based on the valuation inputs, the securities or other investments are tiered into one of three levels. Changes in valuation methods may result in transfers in or out of an investment’s assigned level:
| | Level 1 — | Prices are determined using quoted prices in an active market for identical assets. |
| | Level 2 — | Prices are determined using other significant observable inputs. Observable inputs are inputs that other market participants may use in pricing a security. These may include quoted prices for similar securities, interest rates, prepayment speeds, credit risk, yield curves, loss severities, default rates, discount rates, volatilities and others. |
| | Level 3 — | Prices are determined using significant unobservable inputs. In situations where quoted prices or observable inputs are unavailable (for example, when there is little or no market activity for an investment at the end of the period), unobservable inputs may be used. Unobservable inputs reflect the Fund’s own assumptions about the factors market participants would use in determining fair value of the securities or instruments and would be based on the best available information. |
The following is a summary of the tiered valuation input levels, as of October 31, 2016. The level assigned to the securities valuations may not be an indication of the risk or liquidity associated with investing in those securities. Because of the inherent uncertainties of valuation, the values reflected in the financial statements may materially differ from the value received upon actual sale of those investments.
During the year ended October 31, 2016, there were transfers from Level 2 to Level 1 of $31,184,141, due to foreign fair value adjustments.
| | | | | | | | | | | | | | | | |
| | | Level 1 | | | Level 2 | | | Level 3 | | | Total | |
Common Stocks & Other Equity Interests | | $ | 52,963,223 | | | $ | 17,547,247 | | | $ | — | | | $ | 70,510,470 | |
Money Market Funds | | | 350,670 | | | | — | | | | — | | | | 350,670 | |
Total Investments | | $ | 53,313,893 | | | $ | 17,547,247 | | | $ | — | | | $ | 70,861,140 | |
NOTE 4—Expense Offset Arrangement(s)
The expense offset arrangement is comprised of transfer agency credits which result from balances in demand deposit accounts used by the transfer agent for clearing shareholder transactions. For the year ended October 31, 2016, the Fund received credits from this arrangement, which resulted in the reduction of the Fund’s total expenses of $1,921.
NOTE 5—Trustees’ and Officers’ Fees and Benefits
Trustees’ and Officers’ Fees and Benefits include amounts accrued by the Fund to pay remuneration to certain Trustees and Officers of the Fund. Trustees have the option to defer compensation payable by the Fund, and Trustees’ and Officers’ Fees and Benefits also include amounts accrued by the Fund to fund such deferred compensation amounts. Those Trustees who defer compensation have the option to select various Invesco Funds in which their deferral accounts shall be deemed to be invested. Finally, certain current Trustees were eligible to participate in a retirement plan that provided for benefits to be paid upon retirement to Trustees over a period of time based on the number of years of service. The Fund may have certain former Trustees who also participate in a retirement plan and receive benefits under such plan. Trustees’ and Officers’ Fees and Benefits include amounts accrued by the Fund to fund such retirement benefits. Obligations under the deferred compensation and retirement plans represent unsecured claims against the general assets of the Fund.
NOTE 6—Cash Balances
The Fund is permitted to temporarily carry a negative or overdrawn balance in its account with State Street Bank and Trust Company, the custodian bank. Such balances, if any at period-end, are shown in the Statement of Assets and Liabilities under the payable caption Amount due custodian. To compensate the custodian bank for such overdrafts, the overdrawn Fund may either (1) leave funds as a compensating balance in the account so the custodian bank can be compensated by earning the additional interest; or (2) compensate by paying the custodian bank at a rate agreed upon by the custodian bank and Invesco, not to exceed the contractually agreed upon rate.
18 Invesco Greater China Fund
NOTE 7—Distributions to Shareholders and Tax Components of Net Assets
Tax Character of Distributions to Shareholders Paid During the Fiscal Years Ended October 31, 2016 and 2015:
| | | | | | | | |
| | | 2016 | | | 2015 | |
Ordinary income | | $ | 621,370 | | | $ | 295,485 | |
Tax Components of Net Assets at Period-End:
| | | | |
| | | 2016 | |
Undistributed ordinary income | | $ | 381,179 | |
Net unrealized appreciation — investments | | | 497,443 | |
Net unrealized appreciation — other investments | | | 137 | |
Temporary book/tax differences | | | (53,752 | ) |
Capital loss carryforward | | | (11,561,971 | ) |
Shares of beneficial interest | | | 81,582,680 | |
Total net assets | | $ | 70,845,716 | |
The difference between book-basis and tax-basis unrealized appreciation (depreciation) is due to differences in the timing of recognition of gains and losses on investments for tax and book purposes. The Fund’s net unrealized appreciation difference is attributable primarily to wash sales.
The temporary book/tax differences are a result of timing differences between book and tax recognition of income and/or expenses. The Fund’s temporary book/tax differences are the result of the trustee deferral of compensation and retirement plan benefits.
Capital loss carryforward is calculated and reported as of a specific date. Results of transactions and other activity after that date may affect the amount of capital loss carryforward actually available for the Fund to utilize. Capital losses generated in years beginning after December 22, 2010 can be carried forward for an unlimited period, whereas previous losses expire in eight tax years. Capital losses with an expiration period may not be used to offset capital gains until all net capital losses without an expiration date have been utilized. Capital loss carryforwards with no expiration date will retain their character as either short-term or long-term capital losses instead of as short-term capital losses as under prior law. The ability to utilize capital loss carryforwards in the future may be limited under the Internal Revenue Code and related regulations based on the results of future transactions.
The Fund has a capital loss carryforward as of October 31, 2016, which expires as follows:
| | | | | | | | | | | | |
| Capital Loss Carryforward* | |
| Expiration | | Short-Term | | | Long-Term | | | Total | |
October 31, 2017 | | $ | 11,347,858 | | | $ | — | | | $ | 11,347,858 | |
Not subject to expiration | | | 214,113 | | | | — | | | | 214,113 | |
| | | $ | 11,561,971 | | | $ | — | | | $ | 11,561,971 | |
| * | Capital loss carryforward as of the date listed above is reduced for limitations, if any, to the extent required by the Internal Revenue Code and may be further limited depending upon a variety of factors, including the realization of net unrealized gains or losses as of the date of any reorganization. |
NOTE 8—Investment Securities
The aggregate amount of investment securities (other than short-term securities, U.S. Treasury obligations and money market funds, if any) purchased and sold by the Fund during the year ended October 31, 2016 was $35,737,068 and $41,453,566, respectively. Cost of investments on a tax basis includes the adjustments for financial reporting purposes as of the most recently completed federal income tax reporting period-end.
| | | | |
| Unrealized Appreciation (Depreciation) of Investment Securities on a Tax Basis | |
Aggregate unrealized appreciation of investment securities | | $ | 9,079,928 | |
Aggregate unrealized (depreciation) of investment securities | | | (8,582,485 | ) |
Net unrealized appreciation of investment securities | | $ | 497,443 | |
Cost of investments for tax purposes is $70,363,697.
NOTE 9—Reclassification of Permanent Differences
Primarily as a result of differing book/tax treatment of expired capital loss carryforward, on October 31, 2016, undistributed net investment income was decreased by $10,708, undistributed net realized gain (loss) was increased by $23,395,889 and shares of beneficial interest was decreased by $23,385,181. This reclassification had no effect on the net assets of the Fund.
19 Invesco Greater China Fund
NOTE 10—Share Information
| | | | | | | | | | | | | | | | |
| | | Summary of Share Activity | |
| | | Years ended October 31, | |
| | | 2016(a) | | | 2015 | |
| | | Shares | | | Amount | | | Shares | | | Amount | |
Sold: | | | | | | | | | | | | | | | | |
Class A | | | 249,846 | | | $ | 5,170,461 | | | | 544,471 | | | $ | 12,200,811 | |
Class B | | | 838 | | | | 16,774 | | | | 2,757 | | | | 54,843 | |
Class C | | | 41,490 | | | | 846,424 | | | | 101,802 | | | | 2,205,552 | |
Class Y | | | 337,898 | | | | 6,881,781 | | | | 135,375 | | | | 3,100,738 | |
Class R5 | | | 2,145 | | | | 43,338 | | | | 1,144 | | | | 22,484 | |
| | | | |
Issued as reinvestment of dividends: | | | | | | | | | | | | | | | | |
Class A | | | 26,127 | | | | 514,692 | | | | 13,413 | | | | 255,787 | |
Class B | | | 196 | | | | 3,776 | | | | — | | | | — | |
Class C | | | 1,066 | | | | 20,460 | | | | — | | | | — | |
Class Y | | | 2,144 | | | | 42,201 | | | | 1,259 | | | | 24,002 | |
Class R5 | | | 55 | | | | 1,072 | | | | 37 | | | | 721 | |
| | | | |
Automatic conversion of Class B shares to Class A shares: | | | | | | | | | | | | | | | | |
Class A | | | 50,077 | | | | 1,019,667 | | | | 69,008 | | | | 1,476,447 | |
Class B | | | (51,484 | ) | | | (1,019,667 | ) | | | (71,079 | ) | | | (1,476,447 | ) |
| | | | |
Reacquired: | | | | | | | | | | | | | | | | |
Class A | | | (481,297 | ) | | | (9,877,926 | ) | | | (1,269,798 | ) | | | (27,026,548 | ) |
Class B | | | (20,343 | ) | | | (403,091 | ) | | | (78,472 | ) | | | (1,597,986 | ) |
Class C | | | (173,247 | ) | | | (3,408,150 | ) | | | (246,214 | ) | | | (5,066,681 | ) |
Class Y | | | (268,901 | ) | | | (5,451,296 | ) | | | (198,394 | ) | | | (4,201,823 | ) |
Class R5 | | | (3,336 | ) | | | (66,117 | ) | | | (2,801 | ) | | | (55,149 | ) |
Net increase (decrease) in share activity | | | (286,726 | ) | | $ | (5,665,601 | ) | | | (997,492 | ) | | $ | (20,083,249 | ) |
| (a) | There are entities that are record owners of more than 5% of the outstanding shares of the Fund and in the aggregate own 18% of the outstanding shares of the Fund. IDI has an agreement with these entities to sell Fund shares. The Fund, Invesco and/or Invesco affiliates may make payments to these entities, which are considered to be related to the Fund, for providing services to the Fund, Invesco and/or Invesco affiliates including but not limited to services such as securities brokerage, distribution, third party record keeping and account servicing. The Fund has no knowledge as to whether all or any portion of the shares owned of record by these entities are also owned beneficially. |
20 Invesco Greater China Fund
NOTE 11—Financial Highlights
The following schedule presents financial highlights for a share of the Fund outstanding throughout the periods indicated.
| | | | | | | | | | | | | | | | | | | | | | | | | | | | | | | | | | | | | | | | | | | | | | | | |
| | | Net asset
value,
beginning
of period | | | Net
investment
income
(loss)(a) | | | Net gains
(losses)
on securities
(both
realized and
unrealized) | | | Total from
investment
operations | | | Dividends
from net
investment
income | | | Net asset
value, end
of period(b) | | | Total
return(c) | | | Net assets,
end of period
(000’s omitted) | | | Ratio of
expenses
to average
net assets
with fee waivers
and/or expenses
absorbed | | | Ratio of
expenses
to average net
assets without
fee waivers
and/or expenses
absorbed | | | Ratio of net
investment
income (loss) to average
net assets | | | Portfolio
turnover(d) | |
Class A | | | | | | | | | | | | | | | | | | | | | | | | | | | | | | | | | | | | | | | | | | | | | | | | |
Year ended 10/31/16 | | $ | 21.10 | | | $ | 0.15 | | | $ | 1.20 | | | $ | 1.35 | | | $ | (0.22 | ) | | $ | 22.23 | | | | 6.51 | % | | $ | 52,479 | | | | 1.93 | %(e) | | | 1.93 | %(e) | | | 0.74 | %(e) | | | 52 | % |
Year ended 10/31/15 | | | 19.93 | | | | 0.18 | | | | 1.08 | | | | 1.26 | | | | (0.09 | ) | | | 21.10 | | | | 6.36 | | | | 53,087 | | | | 1.88 | | | | 1.88 | | | | 0.85 | | | | 130 | |
Year ended 10/31/14 | | | 20.31 | | | | (0.03 | ) | | | (0.13 | ) | | | (0.16 | ) | | | (0.22 | ) | | | 19.93 | | | | (0.87 | ) | | | 62,957 | | | | 1.85 | | | | 1.85 | | | | (0.15 | ) | | | 124 | |
Year ended 10/31/13 | | | 17.90 | | | | 0.09 | | | | 2.44 | | | | 2.53 | | | | (0.12 | ) | | | 20.31 | | | | 14.18 | | | | 76,691 | | | | 1.78 | | | | 1.78 | | | | 0.50 | | | | 148 | |
Year ended 10/31/12 | | | 17.52 | | | | 0.11 | | | | 0.37 | | | | 0.48 | | | | (0.10 | ) | | | 17.90 | | | | 2.79 | | | | 82,713 | | | | 1.80 | | | | 1.80 | | | | 0.64 | | | | 109 | |
Class B | |
Year ended 10/31/16 | | | 20.43 | | | | (0.00 | ) | | | 1.16 | | | | 1.16 | | | | (0.03 | ) | | | 21.56 | | | | 5.72 | | | | 1,218 | | | | 2.68 | (e) | | | 2.68 | (e) | | | (0.01 | )(e) | | | 52 | |
Year ended 10/31/15 | | | 19.35 | | | | 0.02 | | | | 1.06 | | | | 1.08 | | | | — | | | | 20.43 | | | | 5.58 | | | | 2,600 | | | | 2.63 | | | | 2.63 | | | | 0.10 | | | | 130 | |
Year ended 10/31/14 | | | 19.71 | | | | (0.18 | ) | | | (0.14 | ) | | | (0.32 | ) | | | (0.04 | ) | | | 19.35 | | | | (1.61 | ) | | | 5,303 | | | | 2.60 | | | | 2.60 | | | | (0.90 | ) | | | 124 | |
Year ended 10/31/13 | | | 17.39 | | | | (0.05 | ) | | | 2.37 | | | | 2.32 | | | | — | | | | 19.71 | | | | 13.34 | | | | 7,411 | | | | 2.53 | | | | 2.53 | | | | (0.25 | ) | | | 148 | |
Year ended 10/31/12 | | | 17.05 | | | | (0.02 | ) | | | 0.36 | | | | 0.34 | | | | — | | | | 17.39 | | | | 1.99 | | | | 9,703 | | | | 2.55 | | | | 2.55 | | | | (0.11 | ) | | | 109 | |
Class C | |
Year ended 10/31/16 | | | 20.39 | | | | (0.00 | ) | | | 1.16 | | | | 1.16 | | | | (0.03 | ) | | | 21.52 | | | | 5.73 | | | | 11,879 | | | | 2.68 | (e) | | | 2.68 | (e) | | | (0.01 | )(e) | | | 52 | |
Year ended 10/31/15 | | | 19.32 | | | | 0.02 | | | | 1.05 | | | | 1.07 | | | | — | | | | 20.39 | | | | 5.54 | | | | 13,922 | | | | 2.63 | | | | 2.63 | | | | 0.10 | | | | 130 | |
Year ended 10/31/14 | | | 19.68 | | | | (0.18 | ) | | | (0.14 | ) | | | (0.32 | ) | | | (0.04 | ) | | | 19.32 | | | | (1.62 | ) | | | 15,978 | | | | 2.60 | | | | 2.60 | | | | (0.90 | ) | | | 124 | |
Year ended 10/31/13 | | | 17.36 | | | | (0.05 | ) | | | 2.37 | | | | 2.32 | | | | — | | | | 19.68 | | | | 13.36 | | | | 21,366 | | | | 2.53 | | | | 2.53 | | | | (0.25 | ) | | | 148 | |
Year ended 10/31/12 | | | 17.02 | | | | (0.02 | ) | | | 0.36 | | | | 0.34 | | | | — | | | | 17.36 | | | | 2.00 | | | | 24,728 | | | | 2.55 | | | | 2.55 | | | | (0.11 | ) | | | 109 | |
Class Y | |
Year ended 10/31/16 | | | 21.14 | | | | 0.21 | | | | 1.19 | | | | 1.40 | | | | (0.28 | ) | | | 22.26 | | | | 6.77 | | | | 5,216 | | | | 1.68 | (e) | | | 1.68 | (e) | | | 0.99 | (e) | | | 52 | |
Year ended 10/31/15 | | | 19.98 | | | | 0.23 | | | | 1.08 | | | | 1.31 | | | | (0.15 | ) | | | 21.14 | | | | 6.62 | | | | 3,449 | | | | 1.63 | | | | 1.63 | | | | 1.10 | | | | 130 | |
Year ended 10/31/14 | | | 20.36 | | | | 0.02 | | | | (0.13 | ) | | | (0.11 | ) | | | (0.27 | ) | | | 19.98 | | | | (0.62 | ) | | | 4,494 | | | | 1.60 | | | | 1.60 | | | | 0.10 | | | | 124 | |
Year ended 10/31/13 | | | 17.95 | | | | 0.14 | | | | 2.44 | | | | 2.58 | | | | (0.17 | ) | | | 20.36 | | | | 14.43 | | | | 4,531 | | | | 1.53 | | | | 1.53 | | | | 0.75 | | | | 148 | |
Year ended 10/31/12 | | | 17.58 | | | | 0.15 | | | | 0.38 | | | | 0.53 | | | | (0.16 | ) | | | 17.95 | | | | 3.08 | | | | 4,384 | | | | 1.55 | | | | 1.55 | | | | 0.89 | | | | 109 | |
Class R5 | |
Year ended 10/31/16 | | | 21.17 | | | | 0.25 | | | | 1.19 | | | | 1.44 | | | | (0.33 | ) | | | 22.28 | | | | 7.00 | | | | 54 | | | | 1.45 | (e) | | | 1.45 | (e) | | | 1.22 | (e) | | | 52 | |
Year ended 10/31/15 | | | 20.01 | | | | 0.28 | | | | 1.08 | | | | 1.36 | | | | (0.20 | ) | | | 21.17 | | | | 6.88 | | | | 75 | | | | 1.41 | | | | 1.41 | | | | 1.32 | | | | 130 | |
Year ended 10/31/14 | | | 20.38 | | | | 0.06 | | | | (0.14 | ) | | | (0.08 | ) | | | (0.29 | ) | | | 20.01 | | | | (0.46 | ) | | | 104 | | | | 1.39 | | | | 1.39 | | | | 0.31 | | | | 124 | |
Year ended 10/31/13 | | | 17.97 | | | | 0.18 | | | | 2.45 | | | | 2.63 | | | | (0.22 | ) | | | 20.38 | | | | 14.71 | | | | 411 | | | | 1.33 | | | | 1.33 | | | | 0.95 | | | | 148 | |
Year ended 10/31/12 | | | 17.61 | | | | 0.20 | | | | 0.37 | | | | 0.57 | | | | (0.21 | ) | | | 17.97 | | | | 3.29 | | | | 757 | | | | 1.30 | | | | 1.30 | | | | 1.14 | | | | 109 | |
| (a) | Calculated using average shares outstanding. |
| (b) | Includes redemption fees added to shares of beneficial interest which were less than $0.005 per share for the fiscal year ended October 31, 2012. |
| (c) | Includes adjustments in accordance with accounting principles generally accepted in the United States of America and as such, the net asset value for financial reporting purposes and the returns based upon those net asset values may differ from the net asset value and returns for shareholder transactions. Does not include sales charges and is not annualized for periods less than one year, if applicable. |
| (d) | Portfolio turnover is calculated at the fund level and is not annualized for periods less than one year, if applicable. |
| (e) | Ratios are based on average daily net assets (000’s omitted) of $50,540, $1,754, $12,360, $4,141, and $65 for Class A, Class B, Class C, Class Y, and Class R5 shares, respectively. |
21 Invesco Greater China Fund
Report of Independent Registered Public Accounting Firm
To the Board of Trustees and Shareholders of the Invesco Greater China Fund:
In our opinion, the accompanying statement of assets and liabilities, including the schedule of investments, and the related statements of operations and of changes in net assets and the financial highlights present fairly, in all material respects, the financial position of the Invesco Greater China Fund (the “Fund”) as of October 31, 2016, the results of its operations for the year then ended, the changes in its net assets for each of the two years in the period then ended and the financial highlights for each of the five years in the period then ended, in conformity with accounting principles generally accepted in the United States of America. These financial statements and financial highlights (hereafter referred to as “financial statements”) are the responsibility of the Fund’s management. Our responsibility is to express an opinion on these financial statements based on our audits. We conducted our audits of these financial statements in accordance with the standards of the Public Company Accounting Oversight Board (United States). Those standards require that we plan and perform the audit to obtain reasonable assurance about whether the financial statements are free of material misstatement. An audit includes examining, on a test basis, evidence supporting the amounts and disclosures in the financial statements, assessing the accounting principles used and significant estimates made by management, and evaluating the overall financial statement presentation. We believe that our audits, which included confirmation of securities as of October 31, 2016 by correspondence with the custodian and brokers, and the application of alternative auditing procedures where confirmations of security purchases have not been received, provide a reasonable basis for our opinion.
PRICEWATERHOUSECOOPERS LLP
Houston, Texas
December 21, 2016
22 Invesco Greater China Fund
Calculating your ongoing Fund expenses
Example
As a shareholder of the Fund, you incur two types of costs: (1) transaction costs, which may include sales charges (loads) on purchase payments or contingent deferred sales charges on redemptions, if any; and (2) ongoing costs, including management fees, distribution and/or service (12b-1) fees, and other Fund expenses. This example is intended to help you understand your ongoing costs (in dollars) of investing in the Fund and to compare these costs with ongoing costs of investing in other mutual funds. The example is based on an investment of $1,000 invested at the beginning of the period and held for the entire period May 1, 2016 through October 31, 2016.
Actual expenses
The table below provides information about actual account values and actual expenses. You may use the information in this table, together with the amount you invested, to estimate the expenses that you paid over the period. Simply divide your account value by $1,000 (for example, an $8,600 account value divided by $1,000 = 8.6), then multiply the result by the number in the table under the heading entitled “Actual Expenses Paid During Period” to estimate the expenses you paid on your account during this period.
Hypothetical example for comparison purposes
The table below also provides information about hypothetical account values and hypothetical expenses based on the Fund’s actual expense ratio and an assumed rate of return of 5% per year before expenses, which is not the Fund’s actual return.
The hypothetical account values and expenses may not be used to estimate the actual ending account balance or expenses you paid for the period. You may use this information to compare the ongoing costs of investing in the Fund and other funds. To do so, compare this 5% hypothetical example with the 5% hypothetical examples that appear in the shareholder reports of the other funds.
Please note that the expenses shown in the table are meant to highlight your ongoing costs only and do not reflect any transaction costs, such as sales charges (loads) on purchase payments or contingent deferred sales charges on redemptions, if any. Therefore, the hypothetical information is useful in comparing ongoing costs only, and will not help you determine the relative total costs of owning different funds. In addition, if these transaction costs were included, your costs would have been higher.
| | | | | | | | | | | | | | | | | | | | | | | | |
| Class | | Beginning
Account Value
(05/01/16) | | | ACTUAL | | | HYPOTHETICAL (5% annual return before expenses) | | | Annualized
Expense
Ratio | |
| | | Ending
Account Value
(10/31/16)1 | | | Expenses
Paid During
Period2 | | | Ending
Account Value
(10/31/16) | | | Expenses
Paid During
Period2 | | |
A | | $ | 1,000.00 | | | $ | 1,086.60 | | | $ | 9.70 | | | $ | 1,015.84 | | | $ | 9.37 | | | | 1.85 | % |
B | | | 1,000.00 | | | | 1,082.40 | | | | 13.61 | | | | 1,012.07 | | | | 13.15 | | | | 2.60 | |
C | | | 1,000.00 | | | | 1,083.00 | | | | 13.61 | | | | 1,012.07 | | | | 13.15 | | | | 2.60 | |
Y | | | 1,000.00 | | | | 1,088.00 | | | | 8.40 | | | | 1,017.09 | | | | 8.11 | | | | 1.60 | |
R5 | | | 1,000.00 | | | | 1,089.50 | | | | 7.30 | | | | 1,018.15 | | | | 7.05 | | | | 1.39 | |
| 1 | The actual ending account value is based on the actual total return of the Fund for the period May 1, 2016 through October 31, 2016, after actual expenses and will differ from the hypothetical ending account value which is based on the Fund’s expense ratio and a hypothetical annual return of 5% before expenses. |
| 2 | Expenses are equal to the Fund’s annualized expense ratio as indicated above multiplied by the average account value over the period, multiplied by 184/366 to reflect the most recent fiscal half year. |
23 Invesco Greater China Fund
Approval of Investment Advisory and Sub-Advisory Contracts
The Board of Trustees (the Board) of AIM Investment Funds (Invesco Investment Funds) is required under the Investment Company Act of 1940, as amended, to approve annually the renewal of Invesco Greater China Fund’s (the Fund) investment advisory agreements. During contract renewal meetings held on June 7-8, 2016, the Board as a whole, and the disinterested or “independent” Trustees, who comprise over 75% of the Board, voting separately, approved the continuance for the Fund of the Master Investment Advisory Agreement with Invesco Advisers, Inc. (Invesco Advisers and the investment advisory agreement) and the Master Intergroup Sub-Advisory Contract for Mutual Funds with Invesco Asset Management Deutschland GmbH, Invesco Asset Management Limited, Invesco Asset Management (Japan) Limited, Invesco Hong Kong Limited, Invesco Senior Secured Management, Inc. and Invesco Canada Ltd. (collectively, the Affiliated Sub-Advisers and the sub-advisory contracts) for another year, effective July 1, 2016.
In evaluating the fairness and reasonableness of compensation under the Fund’s investment advisory agreement and sub-advisory contracts, the Board considered, among other things, the factors discussed below. The Board determined that continuation of the Fund’s investment advisory agreement and the sub-advisory contracts is in the best interest of the Fund and its shareholders and that the compensation payable to Invesco Advisers and the Affiliated Sub-Advisers under the agreements is fair and reasonable.
The Board’s Fund Evaluation Process
The Board’s Investments Committee has established three Sub-Committees, which meet throughout the year to review the performance of funds advised by Invesco Advisers (the Invesco Funds). Over the course of each year, the Sub-Committees meet with portfolio managers for their assigned Invesco Funds and other members of management to review the performance, investment objective(s), policies, strategies, limitations and investment risks of these funds. The Board had the benefit of reports from the Sub-Committees and Investments Committee throughout the year in considering approval of the continuance of each Invesco Fund’s investment advisory agreement and sub-advisory contracts for another year.
During the contract renewal process, the Board receives comparative performance and fee data regarding the Invesco Funds prepared by Invesco Advisers and Broadridge Financial Solutions, Inc. (Broadridge), an independent provider of investment company data. The Board also receives an independent written evaluation from the Senior Officer, an officer of the Invesco Funds who reports directly to the independent Trustees. The Senior Officer’s
evaluation is prepared as part of his responsibility to manage the process by which the Invesco Funds’ proposed management fees are negotiated during the annual contract renewal process to ensure they are negotiated in a manner that is at arms’ length and reasonable. In addition to meetings with Invesco Advisers and fund counsel, the independent Trustees also discuss the continuance of the investment advisory agreement and sub-advisory contracts in separate sessions with the Senior Officer and with independent legal counsel.
The Trustees recognized that the advisory fee rates for the Invesco Funds are, in many cases, the result of years of review and negotiation. The Trustees’ deliberations and conclusions in a particular year may be based in part on their deliberations and conclusions regarding these arrangements throughout the year and in prior years. The Trustees’ review and conclusions are based on the comprehensive consideration of all information presented to them and are not the result of any single determinative factor. Moreover, one Trustee may have weighed a particular piece of information or factor differently than another Trustee.
The discussion below is a summary of the Senior Officer’s independent written evaluation with respect to the Fund’s investment advisory agreement as well as a discussion of the material factors and related conclusions that formed the basis for the Board’s approval of the Fund’s investment advisory agreement and sub-advisory contracts. Unless otherwise stated, this information is current as of June 8, 2016, and does not reflect consideration of factors that became known to the Board after that date.
Factors and Conclusions and Summary of Independent Written Fee Evaluation
| A. | Nature, Extent and Quality of Services Provided by Invesco Advisers and the Affiliated Sub-Advisers |
The Board reviewed the advisory services provided to the Fund by Invesco Advisers under the Fund’s investment advisory agreement, the performance of Invesco Advisers in providing these services, and the credentials and experience of the officers and employees of Invesco Advisers who provide these services, including the Fund’s portfolio manager or managers. The Board’s review of the qualifications of Invesco Advisers to provide advisory services included the Board’s consideration of Invesco Advisers’ investment process oversight, independent credit analysis and investment risk management. The Board also considered non-advisory services that Invesco Advisers and its affiliates provide to the Invesco Funds such as various back office support functions, trading operations, internal audit, valuation and legal and compliance.
In determining whether to continue the Fund’s investment advisory agreement, the Board considered the benefits of reapproving an existing relationship and the greater uncertainty that may be associated with entering into a new relationship. The Board concluded that the nature, extent and quality of the services provided to the Fund by Invesco Advisers are appropriate and satisfactory and consistent with the terms of the Fund’s investment advisory agreement.
The Board reviewed the services that may be provided by the Affiliated Sub-Advisers under the sub-advisory contracts and the credentials and experience of the officers and employees of the Affiliated Sub-Advisers who provide these services. The Board noted that the Affiliated Sub-Advisers have offices and personnel that are located in financial centers around the world. As a result, the Board noted that Affiliated Sub-Advisers can provide research and investment analysis on the markets and economies of various countries in which the Fund may invest, make recommendations regarding securities and assist with security trades. The Board concluded that the sub-advisory contracts may benefit the Fund and its shareholders by permitting Invesco Advisers to use the resources and talents of the Affiliated Sub-Advisers in managing the Fund. The Board concluded that the nature, extent and quality of the services provided by the Affiliated Sub-Advisers are appropriate and satisfactory and consistent with the terms of the Fund’s sub-advisory contracts.
The Board considered Fund performance as a relevant factor in considering whether to approve the investment advisory agreement as well as the sub-advisory contracts for the Fund, as Invesco Hong Kong Limited currently manages assets of the Fund.
The Board compared the Fund’s performance during the past one, three and five calendar years to the performance of funds in the Broadridge performance universe and against the Lipper China Region Funds Index. The Board noted that performance of Class A shares of the Fund was in the first quintile of its performance universe for the one year period and the fourth quintile for the three and five year periods (the first quintile being the best performing funds and the fifth quintile being the worst performing funds). The Board noted that performance of Class A shares of the Fund was above the performance of the Index for the one and five year periods and below the performance of the Index for the three year period. Invesco Advisers noted that a new portfolio manager and team had been named to the Fund in the first quarter of 2015. The Trustees also reviewed more recent Fund performance and this review did not change their conclusions.
24 Invesco Greater China Fund
| C. | Advisory and Sub-Advisory Fees |
The Board compared the Fund’s contractual management fee rate to the contractual management fee rates of funds in the Fund’s Broadridge expense group at a common asset level. The Board noted that the contractual management fee rate for Class A shares of the Fund was below the median contractual management fee rate of funds in its expense group. The Board noted that the term “contractual management fee” for funds in the expense group may include both advisory and certain administrative services fees, but that Broadridge does not provide information on a fund by fund basis as to what is included. The Board noted that Invesco Advisers does not separately charge the Invesco Funds for the administrative services included in the term as defined by Broadridge. The Board also reviewed the methodology used by Broadridge in providing expense group information, which includes using each fund’s contractual management fee schedule (including any applicable breakpoints) as reported in the most recent prospectus or statement of additional information for each fund in the expense group.
The Board also compared the Fund’s effective advisory fee rate (the advisory fee rate after advisory fee waivers and before other expense limitations/waivers) to the effective advisory fee rates of other funds advised by Invesco Advisers and its affiliates with investment strategies comparable to those of the Fund, based on asset balances as of December 31, 2015. The Board also noted how the Fund’s rate compared to the effective sub-adviser fee rate of two off-shore funds advised by Invesco Advisers.
The Board noted that Invesco Advisers and the Affiliated Sub-Advisers do not manage other client accounts with investment strategies comparable to those of the Fund.
The Board also considered the services provided by the Affiliated Sub-Advisers pursuant to the sub-advisory contracts, as well as the fees payable by Invesco Advisers to Affiliated Sub-Advisers pursuant to the sub-advisory contracts. The Board noted that Invesco Advisers retains overall responsibility for, and provides services to, sub-advised Invesco Funds, including oversight of the Affiliated Sub-Advisers as well as the additional services described herein other than day-to-day portfolio management. The Board also noted that the sub-advisory fees are not paid directly by the Fund, but rather, are payable by Invesco Advisers to the Affiliated Sub-Advisers.
| D. | Economies of Scale and Breakpoints |
The Board considered the extent to which there are economies of scale in the provision of advisory services to the Fund. The Board also considered whether the Fund benefits from economies of scale through contractual breakpoints in the Fund’s advisory fee schedule. The Board also noted that the Fund shares directly in economies of scale through lower fees charged by third party service providers based on the combined size of the Invesco Funds and other clients advised by Invesco Advisers.
| E. | Profitability and Financial Resources |
The Board reviewed information from Invesco Advisers concerning the costs of the advisory and other services that Invesco Advisers and its affiliates provide to the Fund and the Invesco Funds and the profitability of Invesco Advisers and its affiliates in providing these services. The Board received information from Invesco Advisers and a report from an independent consultant engaged by the Senior Officer about the methodology used to prepare the profitability information. The Board noted that Invesco Advisers continues to operate at a net profit from services Invesco Advisers and its affiliates provide to the Invesco Funds and the Fund. The Board did not deem the level of profits realized by Invesco Advisers and its affiliates from providing services to the Fund to be excessive given the nature, quality and extent of the services provided. The Board received and accepted information from Invesco Advisers demonstrating that Invesco Advisers and each Affiliated Sub-Adviser are financially sound and have the resources necessary to perform their obligations under the investment advisory agreement and sub-advisory contracts.
| F. | Collateral Benefits to Invesco Advisers and its Affiliates |
The Board considered various other benefits received by Invesco Advisers and its affiliates from the relationship with the Fund, including the fees received for providing transfer agency and distribution services to the Fund. The Board considered comparative information regarding fees charged for these services, including information provided by Broadridge and other independent sources. The Board considered the performance of Invesco Advisers and its affiliates in providing these services and the organizational structure employed to provide these services. The Board also considered that these services are provided to the Fund pursuant to written contracts that are reviewed and approved on an annual basis by the Board; and that the services are required for the operation of the Fund.
The Board considered the benefits realized by Invesco Advisers and the Affiliated Sub-Advisers as a result of portfolio brokerage transactions executed through “soft dollar” arrangements. The Board noted that soft dollar arrangements shift the payment obligation for research services from Invesco Advisers and the Affiliated Sub-Advisers to the Invesco Funds and that the research received may be used with other clients of Invesco Advisers and may reduce Invesco Advisers’ and the Affiliated Sub-Advisers’ expenses. The Board also considered that it receives periodic reports from the Chief Compliance Officer of the Invesco Funds demonstrating that these arrangements are consistent with regulatory requirements. The Board did not deem the soft dollar arrangements to be inappropriate.
The Board considered that the Fund’s uninvested cash and cash collateral from any securities lending arrangements may be invested in money market funds advised by
Invesco Advisers pursuant to procedures approved by the Board. The Board noted that Invesco Advisers receives advisory fees from these affiliated money market funds attributable to such investments, although Invesco Advisers has contractually agreed to waive through varying periods the advisory fees payable by the Invesco Funds with respect to certain investments in the affiliated money market funds. The waiver is in an amount equal to 100% of the net advisory fee Invesco Advisers receives from the affiliated money market funds with respect to the Fund’s investment in the affiliated money market funds of uninvested cash, but not cash collateral. The Board concluded that the amount of advisory fees received by Invesco Advisors from the Fund’s investment of cash collateral from any securities lending arrangements in the affiliated money market funds is fair and reasonable.
The Board also considered the Fund may use an affiliated broker to execute certain trades for the Fund to, among other things, control information leakage, and were advised such trades would be executed in compliance with rules under the Investment Company Act of 1940, as amended, and consistent with best execution obligations.
25 Invesco Greater China Fund
Tax Information
Form 1099-DIV, Form 1042-S and other year-end tax information provide shareholders with actual calendar year amounts that should be included in their tax returns. Shareholders should consult their tax advisors.
The following distribution information is being provided as required by the Internal Revenue Code or to meet a specific state’s requirement.
The Fund designates the following amounts or, if subsequently determined to be different, the maximum amount allowable for its fiscal year ended October 31, 2016:
| | | | |
Federal and State Income Tax | |
Qualified Dividend Income* | | | 100 | % |
Corporate Dividends Received Deduction* | | | 0 | % |
U.S. Treasury Obligations* | | | 0 | % |
| | * | The above percentages are based on ordinary income dividends paid to shareholders during the Fund’s fiscal year. |
26 Invesco Greater China Fund
Trustees and Officers
The address of each trustee and officer is AIM Investment Funds (Invesco Investment Funds) (the “Trust”), 11 Greenway Plaza, Suite 1000, Houston, Texas 77046-1173. The trustees serve for the life of the Trust, subject to their earlier death, incapacitation, resignation, retirement or removal as more specifically provided in the Trust’s organizational documents. Each officer serves for a one year term or until their successors are elected and qualified. Column two below includes length of time served with predecessor entities, if any.
| | | | | | | | |
Name, Year of Birth and
Position(s) Held with the Trust | | Trustee and/
or Officer Since | | Principal Occupation(s)
During Past 5 Years | | Number of
Funds in Fund
Complex
Overseen by
Trustee | | Other Directorship(s)
Held by Trustee During
Past 5 Years |
| Interested Persons | | | | | | | | |
| Martin L. Flanagan1 — 1960 Trustee | | 2007 | | Executive Director, Chief Executive Officer and President, Invesco Ltd. (ultimate parent of Invesco and a global investment management firm); Advisor to the Board, Invesco Advisers, Inc. (formerly known as Invesco Institutional (N.A.), Inc.); Trustee, The Invesco Funds; Vice Chair, Investment Company Institute; and Member of Executive Board, SMU Cox School of Business Formerly: Chairman and Chief Executive Officer, Invesco Advisers, Inc. (registered investment adviser); Director, Chairman, Chief Executive Officer and President, Invesco Holding Company (US) Inc. (formerly IVZ Inc.) (holding company), Invesco Group Services, Inc. (service provider) and Invesco North American Holdings, Inc. (holding company); Director, Chief Executive Officer and President, Invesco Holding Company Limited (parent of Invesco and a global investment management firm); Director, Invesco Ltd.; Chairman, Investment Company Institute and President, Co-Chief Executive Officer, Co-President, Chief Operating Officer and Chief Financial Officer, Franklin Resources, Inc. (global investment management organization) | | 146 | | None |
| Philip A. Taylor2 — 1954 Trustee and Senior Vice President | | 2006 | | Head of the Americas and Senior Managing Director, Invesco Ltd.; Director, Co-Chairman, Co-President and Co-Chief Executive Officer, Invesco Advisers, Inc. (formerly known as Invesco Institutional (N.A.), Inc.) (registered investment adviser); Director, Chairman, Chief Executive Officer and President, Invesco Management Group, Inc. (formerly known as Invesco AIM Management Group, Inc.) (financial services holding company); Director and Chairman, Invesco Investment Services, Inc. (formerly known as Invesco AIM Investment Services, Inc.) (registered transfer agent) Chief Executive Officer, Invesco Corporate Class Inc. (corporate mutual fund company) Director, Chairman and Chief Executive Officer, Invesco Canada Ltd. (formerly known as Invesco Trimark Ltd./Invesco Trimark Ltèe) (registered investment adviser and registered transfer agent); Trustee and Senior Vice President, The Invesco Funds; Director, Invesco Investment Advisers LLC (formerly known as Van Kampen Asset Management). Formerly: Director, Chief Executive Officer and President, Van Kampen Exchange Corp.; President and Principal Executive Officer, The Invesco Funds (other than AIM Treasurer’s Series Trust (Invesco Treasurer’s Series Trust), Short-Term Investments Trust and Invesco Management Trust); Executive Vice President, The Invesco Funds (AIM Treasurer’s Series Trust (Invesco Treasurer’s Series Trust), Short-Term Investments Trust and Invesco Management Trust only); Director and President, INVESCO Funds Group, Inc. (registered investment adviser and registered transfer agent); Director and Chairman, IVZ Distributors, Inc. (formerly known as INVESCO Distributors, Inc.) (registered broker dealer); Director, President and Chairman, Invesco Inc. (holding company), Invesco Canada Holdings Inc. (holding company), Trimark Investments Ltd./Placements Trimark Ltèe and Invesco Financial Services Ltd/Services Financiers Invesco Ltèe; Chief Executive Officer, Invesco Canada Fund Inc. (corporate mutual fund company); Director and Chairman, Van Kampen Investor Services Inc.; Director, Chief Executive Officer and President, 1371 Preferred Inc. (holding company) and Van Kampen Investments Inc.; Director and President, AIM GP Canada Inc. (general partner for limited partnerships) and Van Kampen Advisors, Inc.; Director and Chief Executive Officer, Invesco Trimark Dealer Inc. (registered broker dealer); Director, Invesco Distributors, Inc. (formerly known as Invesco AIM Distributors, Inc.) (registered broker dealer); Manager, Invesco PowerShares Capital Management LLC; Director, Chief Executive Officer and President, Invesco Advisers, Inc.; Director, Chairman, Chief Executive Officer and President, Invesco AIM Capital Management, Inc.; President, Invesco Trimark Dealer Inc. and Invesco Trimark Ltd./Invesco Trimark Ltèe; Director and President, AIM Trimark Corporate Class Inc. and AIM Trimark Canada Fund Inc.; Senior Managing Director, Invesco Holding Company Limited; Director and Chairman, Fund Management Company (former registered broker dealer); President and Principal Executive Officer, The Invesco Funds (AIM Treasurer’s Series Trust (Invesco Treasurer’s Series Trust), and Short-Term Investments Trust only); President, AIM Trimark Global Fund Inc. and AIM Trimark Canada Fund Inc. | | 146 | | None |
| 1 | Mr. Flanagan is considered an interested person (within the meaning of Section 2(a)(19) of the 1940 Act) of the Trust because he is an officer of the Adviser to the Trust, and an officer and a director of Invesco Ltd., ultimate parent of the Adviser. |
| 2 | Mr. Taylor is considered an interested person (within the meaning of Section 2(a)(19) of the 1940 Act) of the Trust because he is an officer and a director of the Adviser. |
T-1 Invesco Greater China Fund
Trustees and Officers—(continued)
| | | | | | | | |
Name, Year of Birth and
Position(s) Held with the Trust | | Trustee and/
or Officer Since | | Principal Occupation(s) During Past 5 Years | | Number of
Funds in Fund
Complex
Overseen by
Trustee | | Other Directorship(s)
Held by Trustee During
Past 5 Years |
| Independent Trustees | | | | | | | | |
Bruce L. Crockett — 1944 Trustee and Chair | | 2001 | | Chairman, Crockett Technologies Associates (technology consulting company) Formerly: Director, Captaris (unified messaging provider); Director, President and Chief Executive Officer, COMSAT Corporation; Chairman, Board of Governors of INTELSAT (international communications company); ACE Limited (insurance company); Independent Directors Council and Investment Company Institute | | 146 | | ALPS (Attorneys Liability Protection Society) (insurance company) and Globe Specialty Metals, Inc. (metallurgical company); Member of the Audit Committee, Ferroglobe PLC and Investment Company Institute; Member of the Executive Committee and Chair of the Governance Committee, Independent Directors Council |
David C. Arch — 1945 Trustee | | 2010 | | Chairman of Blistex Inc., a consumer health care products manufacturer | | 146 | | Board member of the Illinois Manufacturers’ Association; Member of the Board of Visitors, Institute for the Humanities, University of Michigan |
James T. Bunch — 1942 Trustee | | 2003 | | Managing Member, Grumman Hill Group LLC (family office/private equity investments) Formerly: Chairman of the Board, Denver Film Society, Chairman of the Board of Trustees, Evans Scholarship Foundation; Chairman, Board of Governors, Western Golf Association | | 146 | | Trustee, Evans Scholarship Foundation |
Albert R. Dowden — 1941 Trustee | | 2001 | | Director of a number of public and private business corporations, including Nature’s Sunshine Products, Inc. Formerly: Director, The Boss Group, Ltd. and Reich & Tang Funds (5 portfolios) (registered investment company); Director, Homeowners of America Holding Corporation/Homeowners of America Insurance Company (property casualty company); Director, Continental Energy Services, LLC (oil and gas pipeline service); Director, CompuDyne Corporation (provider of product and services to the public security market) and Director, Annuity and Life Re (Holdings), Ltd. (reinsurance company); Director, President and Chief Executive Officer, Volvo Group North America, Inc.; Senior Vice President, AB Volvo; Director of various public and private corporations; Chairman, DHJ Media, Inc.; Director, Magellan Insurance Company; and Director, The Hertz Corporation, Genmar Corporation (boat manufacturer), National Media Corporation; Advisory Board of Rotary Power International (designer, manufacturer, and seller of rotary power engines); and Chairman, Cortland Trust, Inc. (registered investment company) | | 146 | | Director of Nature’s Sunshine Products, Inc. |
Jack M. Fields — 1952 Trustee | | 2001 | | Chief Executive Officer, Twenty First Century Group, Inc. (government affairs company); and Discovery Learning Alliance (non-profit) Formerly: Owner and Chief Executive Officer, Dos Angeles Ranch L.P. (cattle, hunting, corporate entertainment); Director, Insperity, Inc. (formerly known as Administaff); Chief Executive Officer, Texana Timber LP (sustainable forestry company); Director of Cross Timbers Quail Research Ranch (non-profit); and member of the U.S. House of Representatives | | 146 | | None |
Eli Jones — 1961 Trustee | | 2016 | | Professor and Dean, Mays Business School — Texas A&M University Formerly: Professor and Dean, Walton College of Business, University of Arkansas and E.J. Ourso College of Business, Louisiana State University and Director, Arvest Bank | | 146 | | Director of Insperity, Inc. (formerly known as Administaff) |
Prema Mathai-Davis — 1950 Trustee | | 2001 | | Retired. Formerly: Chief Executive Officer, YWCA of the U.S.A. | | 146 | | None |
Larry Soll — 1942 Trustee | | 2003 | | Retired. Formerly: Chairman, Chief Executive Officer and President, Synergen Corp. (a biotechnology company) | | 146 | | None |
Raymond Stickel, Jr. — 1944 Trustee | | 2005 | | Retired. Formerly: Director, Mainstay VP Series Funds, Inc. (25 portfolios) and Partner, Deloitte & Touche | | 146 | | None |
Robert C. Troccoli — 1949 Trustee | | 2016 | | Adjunct Professor, University of Denver — Daniels College of Business Formerly: Senior Partner, KPMG LLP | | 146 | | None |
T-2 Invesco Greater China Fund
Trustees and Officers—(continued)
| | | | | | | | |
Name, Year of Birth and
Position(s) Held with the Trust | | Trustee and/
or Officer Since | | Principal Occupation(s) During Past 5 Years | | Number of
Funds in Fund
Complex
Overseen by
Trustee | | Other Directorship(s)
Held by Trustee During
Past 5 Years |
| Independent Trustees—(continued) |
Suzanne H. Woolsey — 1941 Trustee | | 2014 | | Retired. Formerly: Chief Executive Officer of Woolsey Partners LLC | | 146 | | Director, SunShare LLC; Trustee, Ocean Conservancy; Emeritus Chair of the Board of Trustees of the Institute for Defense Analyses and of Colorado College; Trustee, Chair, Business and Finance Committee of California Institute of Technology; Prior to 2014, Director of Fluor Corp.; Prior to 2010, Trustee of the German Marshall Fund of the United States; Prior to 2010, Trustee of the Rocky Mountain Institute |
| Other Officers | | | | | | | | |
Sheri Morris — 1964 President, Principal Executive Officer and Treasurer | | 1999 | | President, Principal Executive Officer and Treasurer, The Invesco Funds; Vice President, Invesco Advisers, Inc. (formerly known as Invesco Institutional (N.A.), Inc.) (registered investment adviser); and Vice President, PowerShares Exchange-Traded Fund Trust, PowerShares Exchange-Traded Fund Trust II, PowerShares India Exchange-Traded Fund Trust, PowerShares Actively Managed Exchange-Traded Fund Trust, and PowerShares Actively Managed Exchange-Traded Commodity Fund Trust Formerly: Vice President and Principal Financial Officer, The Invesco Funds; Vice President, Invesco AIM Advisers, Inc., Invesco AIM Capital Management, Inc. and Invesco AIM Private Asset Management, Inc.; Assistant Vice President and Assistant Treasurer, The Invesco Funds and Assistant Vice President, Invesco Advisers, Inc., Invesco AIM Capital Management, Inc. and Invesco AIM Private Asset Management, Inc.; and Treasurer, PowerShares Exchange-Traded Fund Trust, PowerShares Exchange-Traded Fund Trust II, PowerShares India Exchange-Traded Fund Trust and PowerShares Actively Managed Exchange-Traded Fund Trust | | N/A | | N/A |
Russell C. Burk — 1958 Senior Vice President and Senior Officer | | 2005 | | Senior Vice President and Senior Officer, The Invesco Funds | | N/A | | N/A |
John M. Zerr — 1962 Senior Vice President, Chief Legal Officer and Secretary | | 2006 | | Director, Senior Vice President, Secretary and General Counsel, Invesco Management Group, Inc. (formerly known as Invesco AIM Management Group, Inc.; Senior Vice President, Invesco Advisers, Inc. (formerly known as Invesco Institutional (N.A.), Inc.) (registered investment adviser); Senior Vice President and Secretary, Invesco Distributors, Inc. (formerly known as Invesco AIM Distributors, Inc.); Director, Vice President and Secretary, Invesco Investment Services, Inc. (formerly known as Invesco AIM Investment Services, Inc.) Senior Vice President, Chief Legal Officer and Secretary, The Invesco Funds; Managing Director, Invesco PowerShares Capital Management LLC; Director, Secretary and General Counsel, Invesco Investment Advisers LLC (formerly known as Van Kampen Asset Management); Secretary and General Counsel, Invesco Capital Markets, Inc. (formerly known as Van Kampen Funds Inc.) and Chief Legal Officer, PowerShares Exchange-Traded Fund Trust, PowerShares Exchange-Traded Fund Trust II, PowerShares India Exchange-Traded Fund Trust, PowerShares Actively Managed Exchange-Traded Fund Trust, and PowerShares Actively Managed Exchange-Traded Commodity Fund Trust Formerly: Director, Secretary, General Counsel and Senior Vice President, Van Kampen Exchange Corp.; Director, Vice President and Secretary, IVZ Distributors, Inc. (formerly known as INVESCO Distributors, Inc.); Director and Vice President, INVESCO Funds Group, Inc.; Director and Vice President, Van Kampen Advisors Inc.; Director, Vice President, Secretary and General Counsel, Van Kampen Investor Services Inc.; Director, Invesco Distributors, Inc. (formerly known as Invesco AIM Distributors, Inc.); Director, Senior Vice President, General Counsel and Secretary, Invesco AIM Advisers, Inc. and Van Kampen Investments Inc.; Director, Vice President and Secretary, Fund Management Company; Director, Senior Vice President, Secretary, General Counsel and Vice President, Invesco AIM Capital Management, Inc.; Chief Operating Officer and General Counsel, Liberty Ridge Capital, Inc. (an investment adviser); Vice President and Secretary, PBHG Funds (an investment company) and PBHG Insurance Series Fund (an investment company); Chief Operating Officer, General Counsel and Secretary, Old Mutual Investment Partners (a broker-dealer); General Counsel and Secretary, Old Mutual Fund Services (an administrator) and Old Mutual Shareholder Services (a shareholder servicing center); Executive Vice President, General Counsel and Secretary, Old Mutual Capital, Inc. (an investment adviser); and Vice President and Secretary, Old Mutual Advisors Funds (an investment company) | | N/A | | N/A |
T-3 Invesco Greater China Fund
Trustees and Officers—(continued)
| | | | | | | | |
Name, Year of Birth and
Position(s) Held with the Trust | | Trustee and/
or Officer Since | | Principal Occupation(s) During Past 5 Years | | Number of
Funds in Fund
Complex
Overseen by
Trustee | | Other Directorship(s)
Held by Trustee During
Past 5 Years |
| Other Officers—(continued) | | | | | | | | |
| Karen Dunn Kelley — 1960 Senior Vice President | | 2004 | | Senior Managing Director, Investments, Invesco Ltd.; Director, Co-President, Co-Chief Executive Officer, and Co-Chairman, Invesco Advisers, Inc. (formerly known as Invesco Institutional (N.A.), Inc.) (registered investment adviser); Chairman and Director, Invesco Senior Secured Management, Inc.; Senior Vice President, Invesco Management Group, Inc. (formerly known as Invesco AIM Management Group, Inc.); Executive Vice President, Invesco Distributors, Inc. (formerly known as Invesco AIM Distributors, Inc.); Director, Invesco Mortgage Capital Inc. and Invesco Management Company Limited; Senior Vice President, The Invesco Funds Formerly: Vice President, The Invesco Funds (other than AIM Treasurer’s Series Trust (Invesco Treasurer’s Series Trust), Short-Term Investments Trust and Invesco Management Trust); and President and Principal Executive Officer, The Invesco Funds (AIM Treasurer’s Series Trust (Invesco Treasurer’s Series Trust), Short-Term Investments Trust and Invesco Management Trust only); Director and President, INVESCO Asset Management (Bermuda) Ltd., Director, INVESCO Global Asset Management DAC (formerly known as INVESCO Global Asset Management Limited) and INVESCO Management S.A.; Senior Vice President, Van Kampen Investments Inc. and Invesco Advisers, Inc. (formerly known as Invesco Institutional (N.A.), Inc.) (registered investment adviser); Director and President, Fund Management Company; Chief Cash Management Officer, Director of Cash Management, Senior Vice President, and Managing Director, Invesco AIM Capital Management, Inc.; Director of Cash Management, Senior Vice President, and Vice President, Invesco Advisers, Inc. and Vice President, The Invesco Funds (AIM Treasurer’s Series Trust (Invesco Treasurer’s Series Trust), and Short-Term Investments Trust only) | | N/A | | N/A |
Kelli Gallegos — 1970 Vice President, Principal Financial Officer and Assistant Treasurer | | 2008 | | Vice President, Principal Financial Officer and Assistant Treasurer, The Invesco Funds; Assistant Treasurer, Invesco PowerShares Capital Management LLC, PowerShares Exchange-Traded Fund Trust, PowerShares Exchange-Traded Fund Trust II, PowerShares India Exchange-Traded Fund Trust, PowerShares Actively Managed Exchange-Traded Fund Trust, and PowerShares Actively Managed Exchange-Traded Commodity Fund Trust Formerly: Assistant Vice President, The Invesco Funds | | N/A | | N/A |
Tracy Sullivan — 1962 Vice President, Chief Tax Officer and Assistant Treasurer | | 2008 | | Vice President, Chief Tax Officer and Assistant Treasurer, The Invesco Funds; Assistant Treasurer, Invesco PowerShares Capital Management LLC, PowerShares Exchange-Traded Fund Trust, PowerShares Exchange-Traded Fund Trust II, PowerShares India Exchange-Traded Fund Trust, PowerShares Actively Managed Exchange-Traded Fund Trust, and PowerShares Actively Managed Exchange-Traded Commodity Fund Trust Formerly: Assistant Vice President, The Invesco Funds | | N/A | | N/A |
Crissie M. Wisdom — 1969 Anti-Money Laundering Compliance Officer | | 2013 | | Anti-Money Laundering Compliance Officer, Invesco Advisers, Inc. (formerly known as Invesco Institutional (N.A.), Inc.) (registered investment adviser), Invesco Capital Markets, Inc. (formerly known as Van Kampen Funds Inc.), Invesco Distributors, Inc., Invesco Investment Services, Inc., Invesco Management Group, Inc., The Invesco Funds, and PowerShares Exchange-Traded Fund Trust, PowerShares Exchange-Traded Fund Trust II, PowerShares India Exchange-Traded Fund Trust, PowerShares Actively Managed Exchange-Traded Fund Trust and PowerShares Actively Managed Exchange-Traded Commodity Fund Trust; Anti-Money Laundering Compliance Officer and Bank Secrecy Act Officer, INVESCO National Trust Company and Invesco Trust Company; and Fraud Prevention Manager and Controls and Risk Analysis Manager for Invesco Investment Services, Inc. Formerly: Anti-Money Laundering Compliance Officer, Van Kampen Exchange Corp. | | N/A | | N/A |
Robert R. Leveille — 1969 Chief Compliance Officer | | 2016 | | Chief Compliance Officer, Invesco Advisers, Inc. (registered investment adviser); and Chief Compliance Officer, The Invesco Funds Formerly: Chief Compliance Officer, Putnam Investments and the Putnam Funds | | N/A | | N/A |
The Statement of Additional Information of the Trust includes additional information about the Fund’s Trustees and is available upon request, without charge, by calling 1.800.959.4246. Please refer to the Fund’s Statement of Additional Information for information on the Fund’s sub-advisers.
| | | | | | |
Office of the Fund 11 Greenway Plaza, Suite 1000 Houston, TX 77046-1173 | | Investment Adviser Invesco Advisers, Inc. 1555 Peachtree Street, N.E. Atlanta, GA 30309 | | Distributor Invesco Distributors, Inc. 11 Greenway Plaza, Suite 1000 Houston, TX 77046-1173 | | Auditors PricewaterhouseCoopers LLP 1000 Louisiana Street, Suite 5800 Houston, TX 77002-5678 |
| | | |
| | | | | | |
Counsel to the Fund Stradley Ronon Stevens & Young, LLP 2005 Market Street, Suite 2600 Philadelphia, PA 19103-7018 | | Counsel to the Independent Trustees Goodwin Procter LLP 901 New York Avenue, N.W. Washington, D.C. 20001 | | Transfer Agent Invesco Investment Services, Inc. 11 Greenway Plaza, Suite 1000 Houston, TX 77046-1173 | | Custodian State Street Bank and Trust Company 225 Franklin Street Boston, MA 02110-2801 |
T-4 Invesco Greater China Fund
Explore High-Conviction Investing with Invesco

Invesco mailing information
Send general correspondence to Invesco Investment Services, Inc., P.O. Box 219078, Kansas City, MO 64121-9078.
Important notice regarding delivery of security holder documents
To reduce Fund expenses, only one copy of most shareholder documents may be mailed to shareholders with multiple accounts at the same address (Householding). Mailing of your shareholder documents may be householded indefinitely unless you instruct us otherwise. If you do not want the mailing of these documents to be combined with those for other members of your house-hold, please contact Invesco Investment Services, Inc. at 800 959 4246 or contact your financial institution. We will begin send-ing you individual copies for each account within 30 days after receiving your request.
Fund holdings and proxy voting information
The Fund provides a complete list of its holdings four times in each fiscal year, at the quarter ends. For the second and fourth quarters, the lists appear in the Fund’s semiannual and annual reports to shareholders. For the first and third quarters, the Fund files the lists with the Securities and Exchange Commission (SEC) on Form N-Q. The most recent list of portfolio holdings is available at invesco.com/completeqtrholdings. Shareholders can also look up the Fund’s Forms N-Q on the SEC website at sec.gov. Copies of the Fund’s Forms N-Q may be reviewed and copied at the SEC Public Reference Room in Washington, D.C. You can obtain information on the operation of the Public Reference Room, including information about duplicating fee charges, by calling 202 551 8090 or 800 732 0330, or by electronic request at the following email address: publicinfo@sec.gov.
The SEC file numbers for the Fund are shown below.
A description of the policies and procedures that the Fund uses to determine how to vote proxies relating to portfolio securities is available without charge, upon request, from our Client Services department at 800 959 4246 or at invesco.com/proxyguidelines. The information is also available on the SEC website, sec.gov.
| | |
Information regarding how the Fund voted proxies related to its portfolio securities during the most recent 12-month period ended June 30 is available at invesco.com/proxysearch. The information is also available on the SEC website, sec.gov. Invesco Advisers, Inc. is an investment adviser; it provides investment advisory services to individual and institutional clients and does not sell securities. Invesco Distributors, Inc. is the US distributor for Invesco Ltd.’s retail mutual funds, exchange-traded funds and institutional money market funds. Both are wholly owned, indirect subsidiaries of Invesco Ltd. | |  |
| | | | |
| SEC file numbers: 811-05426 and 033-19338 | | CHI-AR-1 | | Invesco Distributors, Inc. |
| | | | |
| | |
 | | Annual Report to Shareholders | | October 31, 2016 |
| | |
| | Invesco Long/Short Equity Fund |
| | Nasdaq: |
| | A: LSQAX ∎ C: LSQCX ∎ R: LSQRX ∎ Y: LSQYX ∎ R5: LSQFX ∎ R6: LSQSX |

|
Letters to Shareholders
| | |

Philip Taylor | | Dear Shareholders: This annual report includes information about your Fund, including performance data and a complete list of its investments as of the close of the reporting period. Inside is a discussion of how your Fund was managed and the factors that affected its performance during the reporting period. In December 2015, the US Federal Reserve raised short-term interest rates for the first time since 2006, signaling its belief that the economy was likely to continue strengthening. Indeed, throughout the reporting period, US economic data were generally positive and the economy expanded at a moderate rate – but there were some bumps along the road. Job growth in May 2016 was very weak, but it was followed by strong increases in nonfarm payrolls in June and July. Increased concerns about global economic weakness caused US stock market indexes to sink at the start of calendar year 2016, but they eventually recovered; they sank again following |
| the UK’s decision to leave the European Union, but then quickly recovered and reached record highs later in the summer. Strong demand for income-producing investments, particularly those perceived to be lower risk, benefited bonds as well as dividend-paying stocks for much of the reporting period. While economic news in the US was generally positive, news overseas was less upbeat. The European Central Bank, and central banks in China and Japan – as well as other countries – maintained extraordinarily accommodative monetary policies in response to economic weakness. As the fiscal year drew to a close, uncertainty about the outcome of the US presidential election resulted in increased market volatility; the surprise outcome after the close of the reporting period suggested that market volatility may continue for some time to come. |
Short-term market volatility can prompt some investors to abandon their investment plans – and can cause others to settle for average results. The investment professionals at Invesco, in contrast, invest with high conviction, take a long-term perspective and have a passion to exceed. Invesco’s pure focus on investment management eliminates possible distractions and means that there are no competing lines of business for us to support. Just as important, we embrace a variety of investment strategies, asset classes and geographies – because we know that no single investment approach meets the diverse needs of all of our clients. We manage all our investment approaches with a passion to exceed. All our investment teams have a highly disciplined, long-term investing style that eliminates short-term decision-making. Of course, investing with high conviction can’t guarantee a profit or ensure success; no investment strategy can. To learn more about how we invest with high conviction, visit invesco.com/HighConviction.
You, too, can invest with high conviction by maintaining a long-term investment perspective and by working with your financial adviser on a regular basis. During periods of short-term market volatility or uncertainty, your financial adviser can keep you focused on your long-term investment goals – a new home, a child’s college education or a secure retirement. He or she also can share research about the economy, the markets and individual investment options.
Visit our website for more information on your investments
Our website, invesco.com/us, offers a wide range of market insights and investment perspectives. On the website, you’ll find detailed information about our funds, including performance, holdings and portfolio manager commentaries. You can access information about your account by completing a simple, secure online registration. Click on the “Need to register” link in the “Account Access” box on our homepage to get started.
In addition to the resources accessible on our website and through our mobile app, you can obtain timely updates to help you stay informed about the markets, the economy and investing by connecting with Invesco on Twitter, LinkedIn or Facebook. You can access our blog at blog.invesco.us.com. Our goal is to provide you the information you want, when and where you want it.
Finally, I’m pleased to share with you Invesco’s commitment to both the Principles for Responsible Investment and to considering environmental, social and governance issues in our robust investment process. I invite you to learn more at invesco.com/esg.
Have questions?
For questions about your account, contact an Invesco client services representative at 800 959 4246. For Invesco-related questions or comments, please email me directly at phil@invesco.com.
All of us at Invesco look forward to serving your investment management needs. Thank you for investing with us.
Sincerely,

Philip Taylor
Senior Managing Director, Invesco Ltd.
2 Invesco Long/Short Equity Fund
| | |

Bruce Crockett | | Dear Fellow Shareholders: Among the many important lessons I’ve learned in more than 40 years in a variety of business endeavors is the value of a trusted advocate. As independent chair of the Invesco Funds Board, I can assure you that the members of the Board are strong advocates for the interests of investors in Invesco’s mutual funds. We work hard to represent your interests through oversight of the quality of the investment management services your funds receive and other matters important to your investment, including but not limited to: ∎ Ensuring that Invesco offers a diverse lineup of mutual funds that your financial adviser can use to strive to meet your financial needs as your investment goals change over time. ∎ Monitoring how the portfolio management teams of the Invesco funds are performing in light of changing economic and market conditions. |
∎ Assessing each portfolio management team’s investment performance within the context of the investment strategy described in the fund’s prospectus. ∎ Monitoring for potential conflicts of interests that may impact the nature of the services that your funds receive. |
We believe one of the most important services we provide our fund shareholders is the annual review of the funds’ advisory and sub-advisory contracts with Invesco Advisers and its affiliates. This review is required by the Investment Company Act of 1940 and focuses on the nature and quality of the services Invesco provides as the adviser to the Invesco funds and the reasonableness of the fees that it charges for those services. Each year, we spend months carefully reviewing information received from Invesco and a variety of independent sources, such as performance and fee data prepared by Lipper Inc., an independent, third-party firm widely recognized as a leader in its field. We also meet with our independent legal counsel and other independent advisers to review and help us assess the information that we have received. Our goal is to assure that you receive quality investment management services for a reasonable fee.
I trust the measures outlined above provide assurance that you have a worthy advocate when it comes to choosing the Invesco Funds.
As always, please contact me at bruce@brucecrockett.com with any questions or concerns you may have. On behalf of the Board, we look forward to continuing to represent your interests and serving your needs.
Sincerely,

Bruce L. Crockett
Independent Chair
Invesco Funds Board of Trustees
3 Invesco Long/Short Equity Fund
Management’s Discussion of Fund Performance
| | | | |
Performance summary | | | | |
For the fiscal year ended October 31, 2016, Class A shares of Invesco Long/Short Equity Fund (the Fund), at net asset value (NAV), underperformed the S&P 500 Index and the Citigroup 90-Day Treasury Bill Index, the Fund’s broad market and style-specific benchmarks, respectively. | |
Your Fund’s long-term performance appears later in this report. | |
Fund vs. Indexes | | | | |
Total returns, 10/31/15 to 10/31/16, at net asset value (NAV). Performance shown does not include applicable contingent deferred sales charges (CDSC) or front-end sales charges, which would have reduced performance. | |
| | | | |
| |
Class A Shares | | | -4.11 | % |
Class C Shares | | | -4.68 | |
Class R Shares | | | -4.27 | |
Class Y Shares | | | -3.74 | |
Class R5 Shares | | | -3.83 | |
Class R6 Shares | | | -3.83 | |
S&P 500 Indexq (Broad Market Index) | | | 4.51 | |
Citigroup 90-Day Treasury Bill Indexq (Style-Specific Index) | | | 0.22 | |
Lipper Alternative Long/Short Equity Funds Index∎ (Peer Group Index) | | | -0.52 | |
Source(s): qFactSet Research Systems Inc.; ∎Lipper Inc. | | | | |
Market conditions and your Fund
During the fiscal year, the US economy continued to expand. The initial estimate of US gross domestic product (GDP) showed the US economy grew by 2.9% in the third quarter, beating consensus estimates.1 However, annualized GDP is expected to be lower. Employment data were mixed, though the unemployment rate had a surprise uptick from 4.9% in August to 5.0% in September before ending the fiscal year at 4.9%.2 Oil prices traded in a range from the high $20s to the low $50s during the reporting period.3
The US Federal Reserve (the Fed) raised interest rates in December 2015 – its first increase since 2006 – but that was its only increase during the reporting period. Major US stock market indexes posted gains for the reporting period, but they were fairly volatile. Stocks began calendar year 2016 on a negative note, driven by investor concerns about economic weakness in China, falling oil prices and uncertainty over Fed policy, including rumors of possible negative interest rates in the US. Markets recovered in late February and posted gains until June when UK voters opted to leave the
| | | | | | | | | | | | | | | | | | | | | | |
| | | Portfolio Composition | | | | | | | | |
| | | By sector, based on total net assets | | | | | | | | |
| | | | | Equity Securities | | | | |
| | | | | Long1 | | Short2 | | Gross Exposure3 | | Net Exposure4 |
| | | Information Technology | | | | 46.2 | % | | | | 15.6 | % | | | | 61.8 | % | | | | 30.6 | % |
| | | Financials | | | | 27.3 | | | | | 7.0 | | | | | 34.3 | | | | | 20.3 | |
| | | Industrials | | | | 26.6 | | | | | 9.6 | | | | | 36.2 | | | | | 17.0 | |
| | | Consumer Discretionary | | | | 22.6 | | | | | 28.7 | | | | | 51.3 | | | | | -6.1 | |
| | | Health Care | | | | 19.8 | | | | | 12.0 | | | | | 31.8 | | | | | 7.8 | |
| | | Consumer Staples | | | | 13.6 | | | | | 1.5 | | | | | 15.1 | | | | | 12.1 | |
| | | Energy | | | | 13.3 | | | | | 11.8 | | | | | 25.1 | | | | | 1.5 | |
| | | Materials | | | | 10.1 | | | | | 6.2 | | | | | 16.3 | | | | | 3.9 | |
| | | Real Estate | | | | 8.3 | | | | | 5.8 | | | | | 14.1 | | | | | 2.5 | |
| | | Utilities | | | | 4.5 | | | | | – | | | | | 4.5 | | | | | 4.5 | |
| | | Telecommunication Services | | | | 3.1 | | | | | 1.6 | | | | | 4.7 | | | | | 1.5 | |
| | | Money Market Funds Plus Other Assets Less Liabilities | | | | 4.4 | | | | | – | | | | | 4.4 | | | | | 4.4 | |
| | Total | | | | 199.8 | | | | | 99.8 | | | | | 299.6 | | | | | 100.0 | |
| 1 | Represents the value of equity securities in the portfolio and the equity securities underlying the Fund’s equity long portfolio swap. |
| 2 | Represents the value of the equity securities underlying the Fund’s equity short portfolio swap. |
| 3 | Represents the cumulative exposure of the Fund’s long and short positions. |
| 4 | Represents the net exposure of the Fund’s long and short positions. |
European Union, sending markets sharply lower once again. Markets again recovered, and major US equity indexes hit record highs during the summer.4 In this environment, investors generally favored the perceived safety of government bonds and more defensive, dividend-paying equities often found in the telecommunication services, utilities and consumer staples sectors.
As part of the investment process, the Fund evaluates fundamental and behavioral factors to forecast individual securities’ returns and risks and ranks these securities based on their attractiveness relative to industry peers. The Fund generally maintains a net long bias and implements its strategy by purchasing what we consider to be highly-ranked stocks as long positions, and selling short what we consider to be poorly-ranked stocks within their respective industries. The Fund seeks to add value primarily from stock selection and secondarily by dynamically changing the level of its beta, or market exposure. In a long/short construct, a positive spread between the top- and bottom-ranked stocks (long and short candidates for the portfolio), plus a positive return from market exposure, is intended to result in the Fund outperforming its broad market benchmark.
During the fiscal year, the Fund benefited most from a positive long/short spread in eight of 11 sectors led by the information technology (IT), industrials, materials and consumer staples sectors,
| | | | | | |
| | | Total Net Assets | | $ | 68.5 million | |
Data presented here are as of October 31, 2016.
4 Invesco Long/Short Equity Fund
but it was not enough to offset losses from the negative spread in the energy, health care and financials sectors, which meaningfully detracted from Fund performance.
The top-contributing sector to Fund performance was the IT sector where the Fund benefited from a meaningful net long allocation and positive results from long holdings in the semiconductor and communications equipment industries. The Fund also benefited from a net long allocation in the industrials sector and stock selection in the capital goods industry.
Equity markets experienced intermittent volatility over the fiscal year that led to dramatic shifts in investor risk tolerance, challenging the return-generating potential for the Fund. This was evident in both the energy and health care sectors. Investor risk tolerance shifted in mid-February as oil climbed from its 2015 lows and signs of US economic improvement became evident. The “risk on” sentiment, where investors moved to potentially riskier and higher-yielding investments, was most evident within the energy sector where lower-quality companies with burdensome balance sheets significantly outperformed higher-quality companies with stronger balance sheets. Consequently, the Fund’s long energy positions failed to outperform the short positions.
Returns within the health care sector, particularly the long positions in the biotechnology and equipment and services industries, performed poorly. The long biotechnology holdings sold off as investors reduced risk due to potential political action to regulate drug pricing.
At the end of the reporting period, the Fund’s largest net long sector exposures were in the IT, industrials, financials and consumer staples sectors. The Fund’s largest net short position was in the consumer discretionary sector.
Please note that the Fund may utilize derivative instruments that include equity total return swaps and futures contracts. During the reporting period, the Fund utilized equity total return swaps to efficiently implement its strategy, but did not use futures contracts. The implementation impact of using equity total return swaps is a component of transaction costs. Derivatives may amplify traditional investment risks through the creation of leverage and may be less liquid than traditional securities.
Thank you for your investment in Invesco Long/Short Equity Fund.
| 1 | Source: Bureau of Economic Analysis |
| 2 | Source: Bureau of Labor Statistics |
| 3 | Source: Thompson-Reuters |
The views and opinions expressed in management’s discussion of Fund performance are those of Invesco Advisers, Inc. These views and opinions are subject to change at any time based on factors such as market and economic conditions. These views and opinions may not be relied upon as investment advice or recommendations, or as an offer for a particular security. The information is not a complete analysis of every aspect of any market, country, industry, security or the Fund. Statements of fact are from sources considered reliable, but Invesco Advisers, Inc. makes no representation or warranty as to their completeness or accuracy. Although historical performance is no guarantee of future results, these insights may help you understand our investment management philosophy.
See important Fund and, if applicable, index disclosures later in this report.
| | |
 | | Michael Abata Chartered Financial Analyst, Portfolio Manager, is manager of Invesco Long/Short |
| Equity Fund. He joined Invesco in 2011. Mr. Abata earned a BA in economics from Binghamton University. |
| |
 | | Charles Ko Chartered Financial Analyst, Portfolio Manager, is manager of Invesco Long/Short |
| Equity Fund. He joined Invesco in 2012. Mr. Ko earned a BS from MIT and an MBA from Yale University. |
| |
 | | Anthony Munchak Chartered Financial Analyst, Portfolio Manager, is manager of Invesco Long/Short |
| Equity Fund. He joined Invesco in 2000. Mr. Munchak earned a BS and an MS in finance from Boston College and an MBA from Bentley College. |
| |
 | | Glen Murphy Chartered Financial Analyst, Portfolio Manager, is manager of Invesco Long/Short |
| Equity Fund. He joined Invesco in 1995. Mr. Murphy earned a BA from the University of Massachusetts at Amherst and an MS in finance from Boston College. |
| |
 | | Francis Orlando Chartered Financial Analyst, Portfolio Manager, is manager of Invesco Long/Short |
| Equity Fund. He joined Invesco in 1987. Mr. Orlando earned a BA in business administration from Merrimack College and an MBA from Boston University. |
| | |
 | | Andrew Waisburd Portfolio Manager, is manager of Invesco Long/Short Equity Fund. He joined Invesco |
| in 2008. Dr. Waisburd earned a BS in statistics from Cornell University and an MS and a PhD in finance from Indiana University. |
| |
 | | Donna Chapman Wilson Portfolio Manager and Director of Portfolio Management, is |
| manager of Invesco Long/Short Equity Fund. She joined Invesco in 1997. Ms. Chapman Wilson earned a BA in economics from Hampton University and an MBA in finance from the Wharton School of the University of Pennsylvania. |
5 Invesco Long/Short Equity Fund
Your Fund’s Long-Term Performance
Results of a $10,000 Investment – Oldest Share Class(es) Since Inception
Fund and index data from 12/19/13
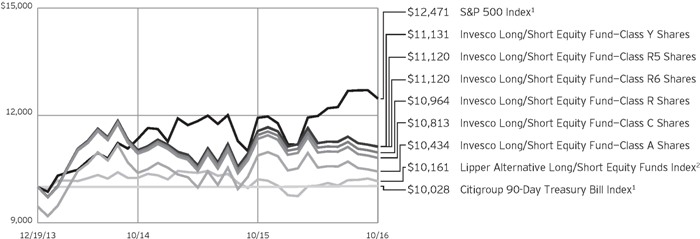
1 Source: FactSet Research Systems Inc.
2 Source: Lipper Inc.
Past performance cannot guarantee comparable future results.
The data shown in the chart include reinvested distributions, applicable sales charges and Fund expenses including management
fees. Index results include reinvested dividends, but they do not reflect sales charges. Performance of the peer group, if applicable, reflects fund expenses and management fees; performance of a market
index does not. Performance shown in the chart and table(s) does not reflect deduction of taxes a shareholder would pay on Fund distributions or sale of Fund shares.
continued from page 8
larger companies. These companies’ securities may be more volatile and less liquid than those of more established companies, and their returns may vary, sometimes significantly, from the overall securities market.
About indexes used in this report
| ∎ | | The S&P 500® Index is an unmanaged index considered representative of the U.S. stock market. |
| ∎ | | The Citigroup 90-Day Treasury Bill Index is an unmanaged index representative of three-month Treasury bills. |
| ∎ | | The Lipper Alternative Long/Short Equity Funds Index is an unmanaged index considered representative of alternative long/short equity funds tracked by Lipper. |
| ∎ | | The Fund is not managed to track the performance of any particular index, including the index(es) described here, and consequently, the performance of the Fund may deviate significantly from the performance of the index(es). |
| ∎ | | A direct investment cannot be made in an index. Unless otherwise indicated, index results include reinvested dividends, and they do not reflect sales |
| | charges. Performance of the peer group, if applicable, reflects fund expenses; performance of a market index does not. |
Other information
| ∎ | | The returns shown in management’s discussion of Fund performance are based on net asset values (NAVs) calculated for shareholder transactions. Generally accepted accounting principles require adjustments to be made to the net assets of the Fund at period end for financial reporting purposes, and as such, the NAVs for shareholder transactions and the returns based on those NAVs may differ from the NAVs and returns reported in the Financial Highlights. |
| ∎ | | Industry classifications used in this report are generally according to the Global Industry Classification Standard, which was developed by and is the exclusive property and a service mark of MSCI Inc. and Standard & Poor’s. |
6 Invesco Long/Short Equity Fund
| | | | |
| Average Annual Total Returns | |
As of 10/31/16, including maximum applicable sales charges | |
| |
| Class A Shares | | | | |
Inception (12/19/13) | | | 1.49 | % |
1 Year | | | -9.39 | |
| |
| Class C Shares | | | | |
Inception (12/19/13) | | | 2.76 | % |
1 Year | | | -5.58 | |
| |
| Class R Shares | | | | |
Inception (12/19/13) | | | 3.26 | % |
1 Year | | | -4.27 | |
| |
| Class Y Shares | | | | |
Inception (12/19/13) | | | 3.81 | % |
1 Year | | | -3.74 | |
| |
| Class R5 Shares | | | | |
Inception (12/19/13) | | | 3.78 | % |
1 Year | | | -3.83 | |
| |
| Class R6 Shares | | | | |
Inception (12/19/13) | | | 3.78 | % |
1 Year | | | -3.83 | |
The performance data quoted represent past performance and cannot guarantee comparable future results; current performance may be lower or higher. Please visit invesco.com/performance for the most recent month-end performance. Performance figures reflect reinvested distributions, changes in net asset value and the effect of the maximum sales charge unless otherwise stated. Investment return and principal value will fluctuate so that you may have a gain or loss when you sell shares.
The net annual Fund operating expense ratio set forth in the most recent Fund prospectus as of the date of this report for Class A, Class C, Class R, Class Y, Class R5 and Class R6 shares was 1.87%, 2.62%, 2.12%, 1.62%, 1.62% and 1.62%, respectively.1,2 The total annual Fund operating expense ratio set forth in the most recent Fund prospectus as of the date of this report for Class A, Class C, Class R, Class Y, Class R5 and Class R6 shares was 2.78%, 3.53%, 3.03%, 2.53%, 2.40% and 2.40%, respectively. The expense ratios presented above may vary from the expense ratios presented in other sections of this report that are based on expenses incurred during the period covered by this report.
Class A share performance reflects the maximum 5.50% sales charge, and Class C share performance reflects the applicable contingent deferred sales charge (CDSC) for the period involved.
| | | | |
| Average Annual Total Returns | |
As of 9/30/16, the most recent calendar quarter end, including maximum applicable sales charges | |
| |
| Class A Shares | | | | |
Inception (12/19/13) | | | 1.75 | % |
1 Year | | | -3.56 | |
| |
| Class C Shares | | | | |
Inception (12/19/13) | | | 3.06 | % |
1 Year | | | 0.27 | |
| |
| Class R Shares | | | | |
Inception (12/19/13) | | | 3.58 | % |
1 Year | | | 1.79 | |
| |
| Class Y Shares | | | | |
Inception (12/19/13) | | | 4.11 | % |
1 Year | | | 2.30 | |
| |
| Class R5 Shares | | | | |
Inception (12/19/13) | | | 4.11 | % |
1 Year | | | 2.30 | |
| |
| Class R6 Shares | | | | |
Inception (12/19/13) | | | 4.11 | % |
1 Year | | | 2.30 | |
The CDSC on Class C shares is 1% for the first year after purchase. Class R, Class Y, Class R5 and Class R6 class shares do not have a front-end sales charge or a CDSC; therefore, performance is at net asset value.
The performance of the Fund’s share classes will differ primarily due to different sales charge structures and class expenses.
Fund performance reflects any applicable fee waivers and/or expense reimbursements. Had the adviser not waived fees and/or reimbursed expenses currently or in the past, returns would have been lower. See current prospectus for more information.
| 1 | Total annual Fund operating expenses after any contractual fee waivers and/or expense reimbursements by the adviser in effect through at least June 30, 2018. See current prospectus for more information. |
| 2 | Total annual Fund operating expenses after any contractual fee waivers and/or expense reimbursements by the adviser in effect through at least February 28, 2017. See current prospectus for more information. |
7 Invesco Long/Short Equity Fund
Invesco Long/Short Equity Fund’s investment objective is to seek long-term capital appreciation.
| ∎ | | Unless otherwise stated, information presented in this report is as of October 31, 2016, and is based on total net assets. |
| ∎ | | Unless otherwise noted, all data provided by Invesco. |
| ∎ | | To access your Fund’s reports/prospectus, visit invesco.com/fundreports. |
About share classes
| ∎ | | Class R shares are generally available only to employer sponsored retirement and benefit plans. Please see the prospectus for more information. |
| ∎ | | Class Y shares are available only to certain investors. Please see the prospectus for more information. |
| ∎ | | Class R5 shares and Class R6 shares are primarily intended for employer sponsored retirement and benefit plans that meet certain standards and for institutional investors. Please see the prospectus for more information. |
Principal risks of investing in the Fund
| ∎ | | Active trading risk. Active trading of portfolio securities may result in added expenses, a lower return and increased tax liability. |
| ∎ | | Derivatives risk. The value of a derivative instrument depends largely on (and is derived from) the value of an underlying security, currency, commodity, interest rate, index or other asset (each referred to as an underlying asset). In addition to risks relating to the underlying assets, the use of derivatives may include other, possibly greater, risks, including counterparty, leverage and liquidity risks. Counterparty risk is the risk that the counterparty to the derivative contract will default on its obligation to pay the Fund the amount owed or otherwise perform under the derivative contract. Derivatives create leverage risk because they do not require payment up front equal to the economic exposure created by owning the derivative. As a result, an adverse change in the value of the underlying asset could result in the Fund sustaining a loss that is substantially greater than the amount invested in the derivative, which may make the Fund’s returns more volatile and increase the risk of loss. Derivative instruments may also be less liquid than more traditional investments and the Fund may be unable to sell or close out its derivative positions at a desirable time or price. This risk may be more acute under adverse market conditions, during which the Fund may be most in need of |
| | | liquidating its derivative positions. Derivatives may also be harder to value, less tax efficient and subject to changing government regulation that could impact the Fund’s ability to use certain derivatives or their cost. Also, derivatives used for hedging or to gain or limit exposure to a particular market segment may not provide the expected benefits, particularly during adverse market conditions. These risks are greater for the Fund than mutual funds that do not use derivative instruments or that use derivative instruments to a lesser extent than the Fund to implement their investment strategies. |
| ∎ | | Management risk. The Fund is actively managed and depends heavily on the Adviser’s judgment about markets, interest rates or the attractiveness, relative values, liquidity, or potential appreciation of particular investments made for the Fund’s portfolio. The Fund could experience losses if these judgments prove to be incorrect. There is no guarantee that the Fund’s mixture of long and short positions or the portfolio manager’s stock selection process will produce a portfolio with reduced exposure to stock market risk. In addition, the Fund’s long/short investment strategy may cause the Fund to underperform the broader equity markets in which the Fund invests during market rallies. Such underperformance could be significant during sudden or significant market rallies. Additionally, legislative, regulatory, or tax developments may adversely affect management of the Fund and, therefore, the ability of the Fund to achieve its investment objective. |
| ∎ | | Market risk. The market values of the Fund’s investments, and therefore the value of the Fund’s shares, will go up and down, sometimes rapidly or unpredictably. Market risk may affect a single issuer, industry or section of the economy, or it may affect the market as a whole. Individual stock prices tend to go up and down more dramatically than those of certain other types of investments, such as bonds. During a general downturn in the financial markets, multiple asset classes may |
| | | decline in value. When markets perform well, there can be no assurance that specific investments held by the Fund will rise in value. |
| ∎ | | Sector focus risk. The Fund may from time to time invest a significant amount of its assets (i.e. over 25%) in one market sector or group of related industries. In this event, the Fund’s performance will depend to a greater extent on the overall condition of the sector or group of industries and there is increased risk that the Fund will lose significant value if conditions adversely affect that sector or group of industries. |
| ∎ | | Short position risk. Because the Fund’s potential loss on a short position arises from increases in the value of the asset sold short, the Fund will incur a loss on a short position, which is theoretically unlimited, if the price of the asset sold short increases from the short sale price. The counterparty to a short position or other market factors may prevent the Fund from closing out a short position at a desirable time or price and may reduce or eliminate any gain or result in a loss. In a rising market, the Fund’s short positions will cause the Fund to underperform the overall market and its peers that do not engage in shorting. If the Fund holds both long and short positions, and both positions decline simultaneously, the short positions will not provide any buffer (hedge) from declines in value of the Fund’s long positions. Certain types of short positions involve leverage, which may exaggerate any losses, potentially more than the actual cost of the investment, and will increase the volatility of the Fund’s returns. |
| ∎ | | Small- and mid-capitalization companies risks. Small- and mid-capitalization companies tend to be more vulnerable to changing market conditions, may have little or no operating history or track record of success, and may have more limited product lines and markets, less experienced management and fewer financial resources than |
continued on page 6
|
This report must be accompanied or preceded by a currently effective Fund prospectus, which contains more complete information, including sales charges and expenses. Investors should read it carefully before investing. |
|
NOT FDIC INSURED | MAY LOSE VALUE | NO BANK GUARANTEE |
8 Invesco Long/Short Equity Fund
Schedule of Investments(a)
October 31, 2016
| | | | | | | | |
| | | Shares | | | Value | |
Common Stocks & Other Equity Interests–95.60% | |
| Aerospace & Defense–5.33% | |
Huntington Ingalls Industries, Inc. | | | 7,650 | | | $ | 1,234,404 | |
L-3 Communications Holdings, Inc. | | | 8,100 | | | | 1,109,214 | |
Spirit AeroSystems Holdings, Inc.–Class A(b) | | | 17,850 | | | | 898,926 | |
United Technologies Corp. | | | 3,950 | | | | 403,690 | |
| | | | | | | | 3,646,234 | |
|
| Agricultural Products–1.96% | |
Ingredion Inc. | | | 10,250 | | | | 1,344,492 | |
|
| Air Freight & Logistics–1.11% | |
Expeditors International of Washington, Inc. | | | 14,750 | | | | 759,183 | |
|
| Aluminum–1.54% | |
Arconic Inc. | | | 36,766 | | | | 1,055,920 | |
|
| Apparel Retail–3.71% | |
Gap, Inc. (The) | | | 46,300 | | | | 1,277,417 | |
Urban Outfitters, Inc.(b) | | | 37,850 | | | | 1,266,082 | |
| | | | | | | | 2,543,499 | |
|
| Apparel, Accessories & Luxury Goods–1.72% | |
PVH Corp. | | | 11,000 | | | | 1,176,780 | |
|
| Application Software–1.06% | |
Nuance Communications, Inc.(b) | | | 51,950 | | | | 728,339 | |
|
| Auto Parts & Equipment–1.33% | |
Lear Corp. | | | 7,400 | | | | 908,572 | |
|
| Biotechnology–1.69% | |
United Therapeutics Corp.(b) | | | 9,650 | | | | 1,158,676 | |
|
| Building Products–0.36% | |
Owens Corning | | | 5,100 | | | | 248,778 | |
|
| Communications Equipment–3.59% | |
F5 Networks, Inc.(b) | | | 9,600 | | | | 1,326,816 | |
Juniper Networks, Inc. | | | 43,050 | | | | 1,133,937 | |
| | | | | | | | 2,460,753 | |
|
| Computer & Electronics Retail–0.63% | |
Best Buy Co., Inc. | | | 11,100 | | | | 431,901 | |
|
| Construction & Engineering–3.77% | |
Fluor Corp. | | | 1,350 | | | | 70,187 | |
Jacobs Engineering Group, Inc.(b) | | | 21,600 | | | | 1,114,128 | |
Quanta Services, Inc.(b) | | | 48,650 | | | | 1,398,687 | |
| | | | | | | | 2,583,002 | |
|
| Construction Machinery & Heavy Trucks–3.05% | |
Allison Transmission Holdings, Inc. | | | 40,600 | | | | 1,189,174 | |
Cummins Inc. | | | 7,050 | | | | 901,131 | |
| | | | | | | | 2,090,305 | |
|
| Consumer Electronics–1.49% | |
Garmin Ltd. | | | 21,050 | | | | 1,017,978 | |
| | | | | | | | |
| | | Shares | | | Value | |
| Consumer Finance–3.91% | |
Navient Corp. | | | 91,350 | | | $ | 1,167,453 | |
Santander Consumer USA Holdings Inc.(b) | | | 39,050 | | | | 476,410 | |
Synchrony Financial | | | 36,150 | | | | 1,033,528 | |
| | | | | | | | 2,677,391 | |
|
| Data Processing & Outsourced Services–2.95% | |
Western Union Co. (The) | | | 55,100 | | | | 1,105,857 | |
Xerox Corp. | | | 93,820 | | | | 916,621 | |
| | | | | | | | 2,022,478 | |
|
| Department Stores–4.49% | |
Kohl’s Corp. | | | 23,750 | | | | 1,039,062 | |
Macy’s, Inc. | | | 26,400 | | | | 963,336 | |
Nordstrom, Inc. | | | 20,600 | | | | 1,071,200 | |
| | | | | | | | 3,073,598 | |
|
| Electric Utilities–0.41% | |
Entergy Corp. | | | 3,820 | | | | 281,458 | |
|
| Gas Utilities–0.90% | |
National Fuel Gas Co. | | | 11,700 | | | | 612,846 | |
|
| Gold–0.31% | |
Newmont Mining Corp. | | | 5,750 | | | | 212,980 | |
|
| Health Care Distributors–0.08% | |
McKesson Corp. | | | 400 | | | | 50,868 | |
|
| Health Care Equipment–0.64% | |
Hologic, Inc.(b) | | | 12,200 | | | | 439,322 | |
|
| Health Care Facilities–0.06% | |
Quorum Health Corp.(b) | | | 9,950 | | | | 40,198 | |
|
| Home Furnishings–0.45% | |
Leggett & Platt, Inc. | | | 6,750 | | | | 309,690 | |
|
| Human Resource & Employment Services–1.95% | |
ManpowerGroup Inc. | | | 17,400 | | | | 1,336,320 | |
|
| Industrial Machinery–1.54% | |
Parker-Hannifin Corp. | | | 8,600 | | | | 1,055,650 | |
|
| Industrial REIT’s–0.34% | |
Prologis, Inc. | | | 4,400 | | | | 229,504 | |
|
| Integrated Oil & Gas–0.18% | |
Cenovus Energy Inc. (Canada) | | | 4,600 | | | | 66,424 | |
Occidental Petroleum Corp. | | | 800 | | | | 58,328 | |
| | | | | | | | 124,752 | |
|
| Integrated Telecommunication Services–0.20% | |
CenturyLink Inc. | | | 5,000 | | | | 132,900 | |
|
| Internet Software & Services–5.15% | |
Akamai Technologies, Inc.(b) | | | 19,850 | | | | 1,378,979 | |
CoStar Group Inc.(b) | | | 2,800 | | | | 523,936 | |
See accompanying Notes to Financial Statements which are an integral part of the financial statements.
9 Invesco Long/Short Equity Fund
| | | | | | | | |
| | | Shares | | | Value | |
| Internet Software & Services–(continued) | |
IAC/InterActiveCorp | | | 6,800 | | | $ | 438,192 | |
VeriSign, Inc.(b) | | | 14,100 | | | | 1,184,682 | |
| | | | | | | | 3,525,789 | |
|
| Investment Banking & Brokerage–1.71% | |
E*TRADE Financial Corp.(b) | | | 41,650 | | | | 1,172,864 | |
|
| IT Consulting & Other Services–1.24% | |
CGI Group Inc.–Class A (Canada)(b) | | | 1,250 | | | | 59,338 | |
Teradata Corp.(b) | | | 29,150 | | | | 785,884 | |
| | | | | | | | 845,222 | |
| | |
| Life & Health Insurance–0.78% | | | | | | | | |
Unum Group | | | 15,100 | | | | 534,540 | |
| | |
| Metal & Glass Containers–0.56% | | | | | | | | |
Crown Holdings, Inc.(b) | | | 7,000 | | | | 379,750 | |
| | |
| Mortgage REIT’s–2.67% | | | | | | | | |
AGNC Investment Corp. | | | 57,900 | | | | 1,161,474 | |
Annaly Capital Management Inc. | | | 64,650 | | | | 669,774 | |
| | | | | | | | 1,831,248 | |
| | |
| Office REIT’s–0.39% | | | | | | | | |
Alexandria Real Estate Equities, Inc. | | | 2,450 | | | | 264,135 | |
| | |
| Oil & Gas Drilling–1.91% | | | | | | | | |
Ensco PLC–Class A | | | 106,900 | | | | 835,958 | |
Noble Corp. PLC (United Kingdom) | | | 94,900 | | | | 468,806 | |
| | | | | | | | 1,304,764 | |
|
| Oil & Gas Equipment & Services–0.36% | |
Superior Energy Services, Inc. | | | 17,350 | | | | 245,676 | |
|
| Oil & Gas Exploration & Production–3.77% | |
Continental Resources, Inc.(b) | | | 25,950 | | | | 1,269,214 | |
Crescent Point Energy Corp. (Canada) | | | 83,150 | | | | 991,148 | |
Denbury Resources Inc.(b) | | | 134,150 | | | | 320,619 | |
| | | | | | | | 2,580,981 | |
|
| Oil & Gas Refining & Marketing–0.07% | |
Valero Energy Corp. | | | 850 | | | | 50,354 | |
|
| Oil & Gas Storage & Transportation–1.59% | |
ONEOK, Inc. | | | 22,500 | | | | 1,089,675 | |
| | |
| Packaged Foods & Meats–1.35% | | | | | | | | |
Campbell Soup Co. | | | 850 | | | | 46,189 | |
JM Smucker Co. (The) | | | 4,300 | | | | 564,633 | |
Pilgrim’s Pride Corp. | | | 14,350 | | | | 313,404 | |
| | | | | | | | 924,226 | |
| | |
| Paper Packaging–2.40% | | | | | | | | |
Avery Dennison Corp. | | | 9,550 | | | | 666,495 | |
International Paper Co. | | | 21,750 | | | | 979,402 | |
| | | | | | | | 1,645,897 | |
| | |
| Railroads–0.56% | | | | | | | | |
Norfolk Southern Corp. | | | 4,150 | | | | 385,950 | |
| | | | | | | | |
| | | Shares | | | Value | |
| Regional Banks–6.02% | | | | | | | | |
Citizens Financial Group, Inc. | | | 38,600 | | | $ | 1,016,724 | |
Fifth Third Bancorp | | | 47,900 | | | | 1,042,304 | |
Regions Financial Corp. | | | 96,500 | | | | 1,033,515 | |
SunTrust Banks, Inc. | | | 22,800 | | | | 1,031,244 | |
| | | | | | | | 4,123,787 | |
| | |
| Reinsurance–0.39% | | | | | | | | |
Reinsurance Group of America, Inc. | | | 2,500 | | | | 269,650 | |
| | |
| Restaurants–1.70% | | | | | | | | |
Darden Restaurants, Inc. | | | 17,950 | | | | 1,162,980 | |
| | |
| Retail REIT’s–1.39% | | | | | | | | |
Macerich Co. (The) | | | 12,850 | | | | 909,523 | |
Urban Edge Properties | | | 1,725 | | | | 44,522 | |
| | | | | | | | 954,045 | |
|
| Semiconductor Equipment–1.94% | |
Applied Materials, Inc. | | | 10,100 | | | | 293,708 | |
KLA-Tencor Corp. | | | 13,800 | | | | 1,036,518 | |
| | | | | | | | 1,330,226 | |
| | |
| Semiconductors–0.14% | | | | | | | | |
Xilinx, Inc. | | | 1,850 | | | | 94,110 | |
| | |
| Soft Drinks–0.35% | | | | | | | | |
Dr Pepper Snapple Group, Inc. | | | 2,750 | | | | 241,423 | |
| | |
| Specialty Chemicals–0.57% | | | | | | | | |
W.R. Grace & Co. | | | 5,800 | | | | 388,368 | |
| | |
| Specialty Stores–1.50% | | | | | | | | |
Staples, Inc. | | | 138,550 | | | | 1,025,270 | |
| | |
| Systems Software–0.25% | | | | | | | | |
CA, Inc. | | | 5,550 | | | | 170,607 | |
|
| Technology Hardware, Storage & Peripherals–5.29% | |
HP Inc. | | | 88,450 | | | | 1,281,640 | |
NetApp, Inc. | | | 36,950 | | | | 1,254,083 | |
Seagate Technology PLC | | | 31,750 | | | | 1,089,343 | |
| | | | | | | | 3,625,066 | |
|
| Trading Companies & Distributors–0.80% | |
United Rentals, Inc.(b) | | | 7,250 | | | | 548,535 | |
Total Common Stocks & Other Equity Interests
(Cost $62,925,961) | | | | 65,469,505 | |
|
Money Market Funds–3.12% | |
Government & Agency Portfolio–Institutional Class, 0.29%(c) | | | 1,283,726 | | | | 1,283,726 | |
Treasury Portfolio–Institutional Class, 0.22%(c) | | | 855,817 | | | | 855,818 | |
Total Money Market Funds
(Cost $2,139,544) | | | | 2,139,544 | |
TOTAL INVESTMENTS–98.72%
(Cost $65,065,505) | | | | 67,609,049 | |
OTHER ASSETS LESS LIABILITIES–1.28% | | | | 874,646 | |
NET ASSETS–100.00% | | | | | | $ | 68,483,695 | |
See accompanying Notes to Financial Statements which are an integral part of the financial statements.
10 Invesco Long/Short Equity Fund
Investment Abbreviations:
| | |
| REIT | | – Real Estate Investment Trust |
Notes to Schedule of Investments:
| (a) | Industry and/or sector classifications used in this report are generally according to the Global Industry Classification Standard, which was developed by and is the exclusive property and a service mark of MSCI Inc. and Standard & Poor’s. |
| (b) | Non-income producing security. |
| (C) | The money market fund and the Fund are affiliated by having the same investment adviser. The rate shown is the 7-day SEC standardized yield as of October 31, 2016. |
| | | | | | | | | | | | | | | | | | | | |
| Open Over-The-Counter Total Return Swap Agreements | |
| Reference Entity | | Counterparty | | Expiration
Dates | | | Floating Rate Index(1) | | Notional
Amount | | | Unrealized
Appreciation
(Depreciation) | | | Net Value of
Reference
Entities | |
Equity Securities — Long | | Morgan Stanley & Co. LLC | | | 12/21/2017 | | | Federal Funds floating rate | | $ | 69,136,834 | | | $ | (565,550 | )(2) | | $ | 68,488,814 | |
Equity Securities — Short | | Morgan Stanley & Co. LLC | | | 12/21/2017 | | | Federal Funds floating rate | | | (70,208,385 | ) | | | 2,001,219 | (3) | | | (68,172,430 | ) |
Total Return Swap Agreements — Equity Risk | | | | | | | | | | | | $ | 1,435,669 | | | $ | 316,384 | |
| (1) | The Fund receives or pays the total return on the long and short positions underlying the total return swap and pays or receives a specific Federal Funds floating rate. |
| (2) | Amount includes $82,470 of dividends receivable and fees from the Fund to the Counterparty. |
| (3) | Amount includes $(34,736) of dividends payable and fees from the Fund to the Counterparty. |
See accompanying Notes to Financial Statements which are an integral part of the financial statements.
11 Invesco Long/Short Equity Fund
The following table represents the individual long and short positions and related values of equity securities underlying the total return swap with Morgan Stanley & Co. LLC as of October 31, 2016.
| | | | | | | | |
| | | Shares | | | Value | |
Equity Securities — Long | |
| Aerospace & Defense | |
Boeing Co. (The) | | | 8,900 | | | $ | 1,267,627 | |
L-3 Communications Holdings, Inc. | | | 800 | | | | 109,552 | |
Spirit AeroSystems Holdings, Inc.–Class A | | | 4,900 | | | | 246,764 | |
United Technologies Corp. | | | 6,100 | | | | 623,420 | |
| | | | | | | | 2,247,363 | |
|
| Air Freight & Logistics | |
Expeditors International of Washington, Inc. | | | 7,300 | | | | 375,731 | |
|
| Apparel, Accessories & Luxury Goods | |
PVH Corp. | | | 1,050 | | | | 112,329 | |
|
| Application Software | |
Citrix Systems, Inc. | | | 14,900 | | | | 1,263,520 | |
Nuance Communications, Inc. | | | 18,800 | | | | 263,576 | |
| | | | | | | | 1,527,096 | |
|
| Asset Management & Custody Banks | |
State Street Corp. | | | 14,800 | | | | 1,039,108 | |
|
| Auto Parts & Equipment | |
Lear Corp. | | | 3,200 | | | | 392,896 | |
|
| Biotechnology | |
AbbVie Inc. | | | 19,050 | | | | 1,062,609 | |
Amgen Inc. | | | 7,250 | | | | 1,023,410 | |
Biogen Inc. | | | 4,360 | | | | 1,221,585 | |
Gilead Sciences, Inc. | | | 13,750 | | | | 1,012,412 | |
United Therapeutics Corp. | | | 250 | | | | 30,018 | |
| | | | | | | | 4,350,034 | |
| Broadcasting | |
CBS Corp.–Class B | | | 20,050 | | | | 1,135,231 | |
|
| Cable & Satellite | |
Comcast Corp.–Class A | | | 17,900 | | | | 1,106,578 | |
|
| Communications Equipment | |
Cisco Systems, Inc. | | | 39,050 | | | | 1,198,054 | |
F5 Networks, Inc. | | | 1,400 | | | | 193,494 | |
Juniper Networks, Inc. | | | 750 | | | | 19,755 | |
Motorola Solutions, Inc. | | | 15,900 | | | | 1,154,022 | |
| | | | | | | | 2,565,325 | |
|
| Computer & Electronics Retail | |
Best Buy Co., Inc. | | | 23,600 | | | | 918,276 | |
|
| Consumer Finance | |
American Express Co. | | | 15,550 | | | | 1,032,831 | |
Discover Financial Services, Inc. | | | 19,100 | | | | 1,075,903 | |
Santander Consumer USA Holdings Inc. | | | 1,800 | | | | 21,960 | |
| | | | | | | | 2,130,694 | |
|
| Data Processing & Outsourced Services | |
Western Union Co. (The) | | | 750 | | | | 15,053 | |
| | | | | | | | |
| | | Shares | | | Value | |
|
| Data Processing & Outsourced Services–(continued) | |
Xerox Corp. | | | 18,580 | | | $ | 181,527 | |
| | | | | | | | 196,580 | |
|
| Department Stores | |
Macy’s Inc. | | | 2,450 | | | | 89,401 | |
|
| Diversified Banks | |
Bank of America Corp. | | | 61,500 | | | | 1,014,750 | |
Bank of Montreal (Canada) | | | 9,000 | | | | 572,400 | |
Bank of Nova Scotia (The) (Canada) | | | 9,650 | | | | 518,784 | |
Canadian Imperial Bank of Commerce (Canada) | | | 8,500 | | | | 637,160 | |
Citigroup Inc. | | | 25,950 | | | | 1,275,442 | |
| | | | | | | | 4,018,536 | |
|
| Electric Utilities | |
Entergy Corp. | | | 480 | | | | 35,366 | |
Exelon Corp. | | | 33,200 | | | | 1,131,124 | |
FirstEnergy Corp. | | | 32,000 | | | | 1,097,280 | |
| | | | | | | | 2,263,770 | |
|
| Electrical Components & Equipment | |
Eaton Corp. PLC | | | 18,450 | | | | 1,176,556 | |
|
| Environmental & Facilities Services | |
Waste Management, Inc. | | | 16,650 | | | | 1,093,239 | |
|
| Food Distributors | |
Sysco Corp. | | | 23,250 | | | | 1,118,790 | |
|
| Gold | |
Barrick Gold Corp. (Canada) | | | 66,900 | | | | 1,176,771 | |
Goldcorp Inc. (Canada) | | | 69,150 | | | | 1,051,080 | |
Newmont Mining Corp. | | | 28,000 | | | | 1,037,120 | |
| | | | | | | | 3,264,971 | |
|
| Health Care Distributors | |
McKesson Corp. | | | 5,800 | | | | 737,586 | |
|
| Health Care Equipment | |
Baxter International Inc. | | | 22,400 | | | | 1,066,016 | |
Hologic Inc. | | | 19,300 | | | | 694,993 | |
| | | | | | | | 1,761,009 | |
|
| Health Care Facilities | |
HCA Holdings, Inc. | | | 15,400 | | | | 1,178,562 | |
|
| Home Furnishings | |
Leggett & Platt, Inc. | | | 1,150 | | | | 52,762 | |
|
| Hypermarkets & Super Centers | |
Wal-Mart Stores Inc. | | | 15,700 | | | | 1,099,314 | |
|
| Industrial REIT’s | |
Prologis Inc. | | | 20,400 | | | | 1,064,064 | |
See accompanying Notes to Financial Statements which are an integral part of the financial statements.
12 Invesco Long/Short Equity Fund
| | | | | | | | |
| | | Shares | | | Value | |
|
| Integrated Oil & Gas | |
Cenovus Energy Inc. (Canada) | | | 18,350 | | | $ | 264,974 | |
Occidental Petroleum Corp. | | | 14,200 | | | | 1,035,322 | |
| | | | | | | | 1,300,296 | |
|
| Integrated Telecommunication Services | |
CenturyLink Inc. | | | 34,750 | | | | 923,655 | |
Verizon Communications Inc. | | | 21,800 | | | | 1,048,580 | |
| | | | | | | | 1,972,235 | |
|
| Internet Software & Services | |
eBay Inc. | | | 43,000 | | | | 1,225,930 | |
IAC/InterActiveCorp | | | 5,000 | | | | 322,200 | |
| | | | | 1,548,130 | |
| IT Consulting & Other Services | |
International Business Machines Corp. | | | 6,650 | | | | 1,022,038 | |
Teradata Corp. | | | 12,600 | | | | 339,696 | |
| | | | | | | | 1,361,734 | |
|
| Life & Health Insurance | |
Aflac Inc. | | | 15,450 | | | | 1,064,041 | |
Prudential Financial, Inc. | | | 15,500 | | | | 1,314,245 | |
Sun Life Financial, Inc. (Canada) | | | 10,300 | | | | 344,844 | |
| | | | | | | | 2,723,130 | |
|
| Managed Health Care | |
UnitedHealth Group Inc. | | | 7,300 | | | | 1,031,709 | |
|
| Mortgage REIT’s | |
Annaly Capital Management, Inc. | | | 39,700 | | | | 411,292 | |
|
| Oil & Gas Drilling | |
Ensco PLC–Class A | | | 6,300 | | | | 49,266 | |
|
| Oil & Gas Exploration & Production | |
Canadian Natural Resources Ltd. (Canada) | | | 40,750 | | | | 1,292,182 | |
|
| Oil & Gas Refining & Marketing | |
Valero Energy Corp. | | | 19,800 | | | | 1,172,952 | |
| | | | | | | | |
| | | Shares | | | Value | |
|
| Packaged Foods & Meats | |
Campbell Soup Co. | | | 16,950 | | | $ | 921,063 | |
ConAgra Foods, Inc. | | | 24,750 | | | | 1,192,455 | |
J.M. Smucker Co. (The) | | | 3,300 | | | | 433,323 | |
Pilgrim’s Pride Corp. | | | 4,300 | | | | 93,912 | |
Tyson Foods, Inc.–Class A | | | 16,550 | | | | 1,172,568 | |
| | | | | | | | 3,813,321 | |
|
| Pharmaceuticals | |
Johnson & Johnson | | | 9,650 | | | | 1,119,304 | |
Merck & Co., Inc. | | | 20,400 | | | | 1,197,888 | |
Pfizer, Inc. | | | 14,600 | | | | 462,966 | |
| | | | | | | | 2,780,158 | |
|
| Railroads | |
Norfolk Southern Corp. | | | 7,400 | | | | 688,200 | |
|
| Semiconductor Equipment | |
Applied Materials, Inc. | | | 35,400 | | | | 1,029,432 | |
|
| Semiconductors | |
Intel Corp. | | | 35,050 | | | | 1,222,193 | |
Maxim Integrated Products, Inc. | | | 30,700 | | | | 1,216,641 | |
NVIDIA Corp. | | | 19,150 | | | | 1,362,714 | |
Qualcomm Inc. | | | 20,250 | | | | 1,391,580 | |
Texas Instruments Inc. | | | 19,250 | | | | 1,363,863 | |
Xilinx, Inc. | | | 21,150 | | | | 1,075,901 | |
| | | | | | | | 7,632,892 | |
|
| Soft Drinks | |
Dr Pepper Snapple Group, Inc. | | | 8,800 | | | | 772,552 | |
| Specialized REIT’s | |
Public Storage | | | 4,200 | | | | 897,624 | |
|
| Systems Software | |
CA Inc. | | | 30,300 | | | | 931,422 | |
|
| Technology Hardware, Storage & Peripherals | |
NetApp, Inc. | | | 1,900 | | | | 64,486 | |
Total Equity Securities — Long | | | | | | | 68,488,814 | |
See accompanying Notes to Financial Statements which are an integral part of the financial statements.
13 Invesco Long/Short Equity Fund
| | | | | | | | |
| | | Shares | | | Value | |
|
Equity Securities — Short | |
| Airlines | |
Southwest Airlines Co. | | | (27,000 | ) | | $ | (1,081,350 | ) |
|
| Alternative Carriers | |
Zayo Group Holdings, Inc. | | | (33,050 | ) | | | (1,063,549 | ) |
|
| Apparel, Accessories & Luxury Goods | |
Fossil Group, Inc. | | | (15,750 | ) | | | (429,502 | ) |
Gildan Activewear Inc. (Canada) | | | (14,200 | ) | | | (364,514 | ) |
Hanesbrands, Inc. | | | (37,000 | ) | | | (950,900 | ) |
Under Armour, Inc.–Class A | | | (14,200 | ) | | | (441,620 | ) |
Under Armour, Inc.–Class C | | | (21,500 | ) | | | (555,990 | ) |
| | | | | | | | (2,742,526 | ) |
|
| Application Software | |
salesforce.com, Inc. | | | (13,800 | ) | | | (1,037,208 | ) |
Splunk Inc. | | | (17,450 | ) | | | (1,050,316 | ) |
SS&C Technologies Holdings, Inc. | | | (30,850 | ) | | | (985,041 | ) |
Tyler Technologies, Inc. | | | (3,800 | ) | | | (609,520 | ) |
| | | | | | | | (3,682,085 | ) |
|
| Asset Management & Custody Banks | |
Brookfield Asset Management Inc.–Class A (Canada) | | | (28,550 | ) | | | (999,821 | ) |
|
| Automobile Manufacturers | |
General Motors Co. | | | (32,450 | ) | | | (1,025,420 | ) |
Tesla Motors, Inc. | | | (1,250 | ) | | | (247,163 | ) |
| | | | | | | | (1,272,583 | ) |
|
| Automotive Retail | |
Advance Auto Parts, Inc. | | | (5,250 | ) | | | (735,420 | ) |
AutoNation, Inc. | | | (20,750 | ) | | | (910,302 | ) |
CarMax, Inc. | | | (17,800 | ) | | | (888,932 | ) |
| | | | | | | | (2,534,654 | ) |
|
| Biotechnology | |
Alnylam Pharmaceuticals Inc. | | | (27,950 | ) | | | (995,020 | ) |
Puma Biotechnology, Inc. | | | (10,500 | ) | | | (402,150 | ) |
| | | | | | | | (1,397,170 | ) |
|
| Casinos & Gaming | |
Wynn Resorts Ltd. | | | (10,800 | ) | | | (1,021,140 | ) |
|
| Commodity Chemicals | |
Methanex Corp. (Canada) | | | (27,600 | ) | | | (1,003,260 | ) |
| Consumer Electronics | |
Harman International Industries, Inc. | | | (12,350 | ) | | | (984,418 | ) |
|
| Data Processing & Outsourced Services | |
MasterCard, Inc.–Class A | | | (9,850 | ) | | | (1,054,147 | ) |
Visa Inc.–Class A | | | (12,500 | ) | | | (1,031,375 | ) |
| | | | | | | | (2,085,522 | ) |
|
| Electrical Components & Equipment | |
Acuity Brands, Inc. | | | (4,450 | ) | | | (994,886 | ) |
| | | | | | | | |
| | | Shares | | | Value | |
|
| Environmental & Facilities Services | |
Stericycle, Inc. | | | (13,550 | ) | | $ | (1,085,220) | |
Waste Connections, Inc. (Canada) | | | (13,750 | ) | | | (1,034,138 | ) |
| | | | | | | | (2,119,358 | ) |
|
| Fertilizers & Agricultural Chemicals | |
CF Industries Holdings, Inc. | | | (40,600 | ) | | | (974,806 | ) |
|
| Financial Exchanges & Data | |
FactSet Research Systems Inc. | | | (5,900 | ) | | | (912,848 | ) |
Intercontinental Exchange, Inc. | | | (1,550 | ) | | | (419,104 | ) |
| | | | | | | | (1,331,952 | ) |
|
| Footwear | |
NIKE, Inc.–Class B | | | (19,950 | ) | | | (1,001,091 | ) |
|
| Gold | |
Franco-Nevada Corp. (Canada) | | | (14,250 | ) | | | (932,805 | ) |
|
| Health Care Distributors | |
Patterson Cos. Inc. | | | (8,050 | ) | | | (343,816 | ) |
|
| Health Care Equipment | |
DexCom Inc. | | | (13,400 | ) | | | (1,048,416 | ) |
|
| Health Care Facilities | |
Brookdale Senior Living Inc. | | | (57,550 | ) | | | (830,446 | ) |
Tenet Healthcare Corp. | | | (36,150 | ) | | | (712,517 | ) |
| | | | | | | | (1,542,963 | ) |
|
| Homebuilding | |
PulteGroup Inc. | | | (51,800 | ) | | | (963,480 | ) |
Toll Brothers, Inc. | | | (35,150 | ) | | | (964,516 | ) |
| | | | | | | | (1,927,996 | ) |
|
| Hotels, Resorts & Cruise Lines | |
Norwegian Cruise Line Holdings Ltd. | | | (27,300 | ) | | | (1,061,151 | ) |
Royal Caribbean Cruises Ltd. | | | (14,800 | ) | | | (1,137,676 | ) |
| | | | | | | | (2,198,827 | ) |
|
| Industrial Machinery | |
Middleby Corp. (The) | | | (2,550 | ) | | | (285,880 | ) |
|
| Integrated Oil & Gas | |
Chevron Corp. | | | (10,150 | ) | | | (1,063,212 | ) |
Exxon Mobil Corp. | | | (11,900 | ) | | | (991,508 | ) |
| | | | | | | | (2,054,720 | ) |
| Internet & Direct Marketing Retail | |
Amazon.com, Inc. | | | (1,140 | ) | | | (900,395 | ) |
Netflix Inc. | | | (8,150 | ) | | | (1,017,690 | ) |
| | | | | | | | (1,918,085 | ) |
|
| Investment Banking & Brokerage | |
Charles Schwab Corp. (The) | | | (32,200 | ) | | | (1,020,740 | ) |
|
| Leisure Products | |
Polaris Industries Inc. | | | (11,150 | ) | | | (854,202 | ) |
See accompanying Notes to Financial Statements which are an integral part of the financial statements.
14 Invesco Long/Short Equity Fund
| | | | | | | | |
| | | Shares | | | Value | |
|
| Life Sciences Tools & Services | |
Illumina, Inc. | | | (7,400 | ) | | $ | (1,007,436 | ) |
|
| Motorcycle Manufacturers | |
Harley-Davidson, Inc. | | | (18,300 | ) | | | (1,043,466 | ) |
|
| Multi-Sector Holdings | |
FNFV Group | | | (28,000 | ) | | | (337,400 | ) |
|
| Oil & Gas Equipment & Services | |
Core Laboratories N.V. | | | (8,100 | ) | | | (785,457 | ) |
Schlumberger Ltd. | | | (12,750 | ) | | | (997,433 | ) |
Weatherford International PLC | | | (180,750 | ) | | | (871,215 | ) |
| | | | | | | | (2,654,105 | ) |
|
| Oil & Gas Exploration & Production | |
Whiting Petroleum Corp. | | | (92,250 | ) | | | (760,140 | ) |
|
| Oil & Gas Storage & Transportation | |
Cheniere Energy, Inc. | | | (26,350 | ) | | | (993,395 | ) |
Pembina Pipeline Corp. (Canada) | | | (19,850 | ) | | | (610,586 | ) |
Plains GP Holdings, L.P.–Class A | | | (78,750 | ) | | | (989,100 | ) |
| | | | | | | | (2,593,081 | ) |
|
| Paper Packaging | |
WestRock Co. | | | (17,400 | ) | | | (803,706 | ) |
|
| Personal Products | |
Coty, Inc.–Class A | | | (45,250 | ) | | | (1,040,297 | ) |
|
| Pharmaceuticals | |
Allergan PLC | | | (4,650 | ) | | | (971,571 | ) |
Endo International PLC | | | (49,900 | ) | | | (935,625 | ) |
Perrigo Co. PLC | | | (11,400 | ) | | | (948,366 | ) |
| | | | | | | | (2,855,562 | ) |
|
| Property & Casualty Insurance | |
XL Group Ltd. (Ireland) | | | (30,500 | ) | | | (1,058,350 | ) |
| | | | | | | | |
| | | Shares | | | Value | |
|
| Real Estate Development | |
Howard Hughes Corp. | | | (9,600 | ) | | $ | (1,054,368 | ) |
|
| Real Estate Services | |
CBRE Group, Inc.–Class A | | | (36,400 | ) | | | (937,664 | ) |
Jones Lang LaSalle Inc. | | | (10,200 | ) | | | (987,870 | ) |
| | | | | | | | (1,925,534 | ) |
|
| Restaurants | |
Chipotle Mexican Grill, Inc. | | | (2,800 | ) | | | (1,010,128 | ) |
| Semiconductors | |
First Solar, Inc. | | | (25,200 | ) | | | (1,020,348 | ) |
Skyworks Solutions, Inc. | | | (13,350 | ) | | | (1,027,149 | ) |
| | | | | | | | (2,047,497 | ) |
|
| Research & Consulting Services | |
IHS Markit Ltd. | | | (27,700 | ) | | | (1,019,083 | ) |
|
| Specialized REIT’s | |
Equinix, Inc. | | | (2,820 | ) | | | (1,007,530 | ) |
|
| Specialty Stores | |
Signet Jewelers Ltd. | | | (12,550 | ) | | | (1,019,813) | |
Tractor Supply Co. | | | (2,350 | ) | | | (147,181 | ) |
| | | | | | | | (1,166,994 | ) |
|
| Steel | |
Allegheny Technologies, Inc. | | | (36,100 | ) | | | (492,404 | ) |
|
| Systems Software | |
FireEye, Inc. | | | (57,100 | ) | | | (663,502 | ) |
ServiceNow, Inc. | | | (13,000 | ) | | | (1,142,830 | ) |
Tableau Software, Inc. | | | (21,550 | ) | | | (1,035,477 | ) |
| | | | | | | | (2,841,809 | ) |
|
| Trading Companies & Distributors | |
Fastenal Co. | | | (26,550 | ) | | | (1,034,919 | ) |
Total Equity Securities — Short | | | | | | $ | (68,172,430 | ) |
15 Invesco Long/Short Equity Fund
Statement of Assets and Liabilities
October 31, 2016
| | | | |
Assets: | |
Investments, at value (Cost $62,925,961) | | $ | 65,469,505 | |
Investments in affiliated money market funds, at value and cost | | | 2,139,544 | |
Total investments, at value (Cost $65,065,505) | | | 67,609,049 | |
Receivable for: | | | | |
Deposits with brokers for swap agreements | | | 50,000 | |
Investments sold | | | 6,797,330 | |
Fund shares sold | | | 1,883 | |
Dividends and interest | | | 58,278 | |
Investment for trustee deferred compensation and retirement plans | | | 6,197 | |
Unrealized appreciation on swap agreements — OTC | | | 2,001,219 | |
Other assets | | | 44,866 | |
Total assets | | | 76,568,822 | |
|
Liabilities: | |
Payable for: | | | | |
Investments purchased | | | 7,279,893 | |
Fund shares reacquired | | | 19,111 | |
Swaps payable | | | 121,748 | |
Accrued fees to affiliates | | | 7,767 | |
Accrued trustees’ and officers’ fees and benefits | | | 1,590 | |
Accrued other operating expenses | | | 83,271 | |
Trustee deferred compensation and retirement plans | | | 6,197 | |
Unrealized depreciation on swap agreements — OTC | | | 565,550 | |
Total liabilities | | | 8,085,127 | |
Net assets applicable to shares outstanding | | $ | 68,483,695 | |
|
Net assets consist of: | |
Shares of beneficial interest | | $ | 65,659,851 | |
Undistributed net investment income | | | (1,441,667 | ) |
Undistributed net realized gain | | | 286,298 | |
Net unrealized appreciation | | | 3,979,213 | |
| | | $ | 68,483,695 | |
| | | | |
Net Assets: | |
Class A | | $ | 11,562,333 | |
Class C | | $ | 2,385,383 | |
Class R | | $ | 83,374 | |
Class Y | | $ | 7,604,359 | |
Class R5 | | $ | 543,396 | |
Class R6 | | $ | 46,304,850 | |
|
Shares outstanding, $0.01 par value per share,
with an unlimited number of shares authorized: | |
Class A | | | 1,106,016 | |
Class C | | | 231,694 | |
Class R | | | 8,015 | |
Class Y | | | 723,873 | |
Class R5 | | | 51,740 | |
Class R6 | | | 4,408,085 | |
Class A: | | | | |
Net asset value per share | | $ | 10.45 | |
Maximum offering price per share | | | | |
(Net asset value of $10.45 ¸ 94.50%) | | $ | 11.06 | |
Class C: | | | | |
Net asset value and offering price per share | | $ | 10.30 | |
Class R: | | | | |
Net asset value and offering price per share | | $ | 10.40 | |
Class Y: | | | | |
Net asset value and offering price per share | | $ | 10.51 | |
Class R5: | | | | |
Net asset value and offering price per share | | $ | 10.50 | |
Class R6: | | | | |
Net asset value and offering price per share | | $ | 10.50 | |
See accompanying Notes to Financial Statements which are an integral part of the financial statements.
16 Invesco Long/Short Equity Fund
Statement of Operations
For the year ended October 31, 2016
| | | | |
Investment income: | |
Dividends (net of foreign withholding taxes of $2,256) | | $ | 1,360,517 | |
Dividends from affiliated money market funds | | | 27,479 | |
Total investment income | | | 1,387,996 | |
| |
Expenses: | | | | |
Advisory fees | | | 712,854 | |
Administrative services fees | | | 50,000 | |
Custodian fees | | | 6,002 | |
Distribution fees: | | | | |
Class A | | | 32,395 | |
Class C | | | 28,817 | |
Class R | | | 302 | |
Transfer agent fees — A, C, R and Y | | | 27,848 | |
Transfer agent fees — R5 | | | 3 | |
Transfer agent fees — R6 | | | 154 | |
Trustees’ and officers’ fees and benefits | | | 19,537 | |
Registration and filing fees | | | 74,871 | |
Reports to shareholders | | | 16,912 | |
Professional services fees | | | 81,684 | |
Other | | | 14,269 | |
Total expenses | | | 1,065,648 | |
Less: Fees waived, expenses reimbursed and expense offset arrangement(s) | | | (91,142 | ) |
Net expenses | | | 974,506 | |
Net investment income | | | 413,490 | |
| |
Realized and unrealized gain (loss) from: | | | | |
Net realized gain (loss) from: | | | | |
Investment securities | | | 2,558,320 | |
Swap agreements | | | (7,712,486 | ) |
| | | | (5,154,166 | ) |
Change in net unrealized appreciation of: | | | | |
Investment securities | | | 2,441,936 | |
Swap agreements | | | 1,169,547 | |
| | | | 3,611,483 | |
Net realized and unrealized gain (loss) | | | (1,542,683 | ) |
Net increase (decrease) in net assets resulting from operations | | $ | (1,129,193 | ) |
See accompanying Notes to Financial Statements which are an integral part of the financial statements.
17 Invesco Long/Short Equity Fund
Statement of Changes in Net Assets
For the years ended October 31, 2016 and 2015
| | | | | | | | |
| | | 2016 | | | 2015 | |
Operations: | | | | | |
Net investment income | | $ | 413,490 | | | $ | 36,036 | |
Net realized gain (loss) | | | (5,154,166 | ) | | | 803,782 | |
Change in net unrealized appreciation | | | 3,611,483 | | | | 43,896 | |
Net increase (decrease) in net assets resulting from operations | | | (1,129,193 | ) | | | 883,714 | |
| | |
Distributions to shareholders from net investment income: | | | | | | | | |
Class A | | | (600,522 | ) | | | — | |
Class C | | | (125,377 | ) | | | — | |
Class R | | | (2,120 | ) | | | — | |
Class Y | | | (392,484 | ) | | | — | |
Class R5 | | | (29,196 | ) | | | — | |
Class R6 | | | (30,735 | ) | | | — | |
Total distributions from net investment income | | | (1,180,434 | ) | | | — | |
| | |
Distributions to shareholders from net realized gains: | | | | | | | | |
Class A | | | (61,333 | ) | | | (4,528 | ) |
Class C | | | (14,863 | ) | | | (854 | ) |
Class R | | | (227 | ) | | | (7 | ) |
Class Y | | | (37,978 | ) | | | (2,596 | ) |
Class R5 | | | (2,825 | ) | | | (189 | ) |
Class R6 | | | (2,974 | ) | | | (150 | ) |
Total distributions from net realized gains | | | (120,200 | ) | | | (8,324 | ) |
| | |
Share transactions–net: | | | | | | | | |
Class A | | | (131,605 | ) | | | (4,378,517 | ) |
Class C | | | 319,228 | | | | (330,484 | ) |
Class R | | | 47,832 | | | | 11,715 | |
Class Y | | | 641,681 | | | | (4,992,049 | ) |
Class R5 | | | 18,068 | | | | (173,215 | ) |
Class R6 | | | 45,877,671 | | | | 18,107 | |
Net increase (decrease) in net assets resulting from share transactions | | | 46,772,875 | | | | (9,844,443 | ) |
Net increase (decrease) in net assets | | | 44,343,048 | | | | (8,969,053 | ) |
| | |
Net assets: | | | | | | | | |
Beginning of year | | | 24,140,647 | | | | 33,109,700 | |
End of year (includes undistributed net investment income of $(1,441,667) and $873,445, respectively) | | $ | 68,483,695 | | | $ | 24,140,647 | |
See accompanying Notes to Financial Statements which are an integral part of the financial statements.
18 Invesco Long/Short Equity Fund
Statement of Cash Flows
For the year ended October 31, 2016
| | | | |
Cash provided by (used in) operating activities: | | | | |
Net increase (decrease) in net assets resulting from operations | | $ | (1,129,193 | ) |
|
Adjustments to reconcile the change in net assets from operations to net cash provided by (used in) operating activities: | |
Purchases of investments | | | (84,875,244 | ) |
Net change in unrealized appreciation on swap agreements | | | (1,169,547 | ) |
Decrease in deposits with broker for swaps | | | 3,925 | |
Increase in swap agreement payable, net | | | 87,140 | |
Proceeds from sales of investments | | | 44,981,453 | |
Increase in receivables and other assets | | | (83,185 | ) |
Increase in accrued expenses and other payables | | | 1,352 | |
Net realized gain from investment securities | | | (2,558,320 | ) |
Net change in unrealized appreciation on investment securities | | | (2,441,936 | ) |
Net cash provided by (used in) operating activities | | | (47,183,555 | ) |
| |
Cash provided by financing activities: | | | | |
Dividends paid to shareholders from net investment income | | | (676,043 | ) |
Proceeds from shares of beneficial interest sold | | | 56,851,043 | |
Disbursements from shares of beneficial interest reacquired | | | (10,708,893 | ) |
Net cash provided by financing activities | | | 45,466,107 | |
Net increase (decrease) in cash and cash equivalents | | | (1,717,448 | ) |
Cash and cash equivalents at beginning of period | | | 3,856,992 | |
Cash and cash equivalents at end of period | | $ | 2,139,544 | |
| |
Non-cash financing activities: | | | | |
Value of shares of beneficial interest issued in reinvestment of dividends paid to shareholders | | $ | 624,591 | |
Notes to Financial Statements
October 31, 2016
NOTE 1—Significant Accounting Policies
Invesco Long/Short Equity Fund (the “Fund”) is a series portfolio of AIM Investment Funds (Invesco Investment Funds) (the “Trust”). The Trust is organized as a Delaware statutory trust and is registered under the Investment Company Act of 1940, as amended (the “1940 Act”), as an open-end series management investment company consisting of twenty-two separate series portfolios, each authorized to issue an unlimited number of shares of beneficial interest. The assets, liabilities and operations of each portfolio are accounted for separately. Information presented in these financial statements pertains only to the Fund. Matters affecting each portfolio or class will be voted on exclusively by the shareholders of such portfolio or class.
The Fund’s investment objective is to seek long-term capital appreciation.
The Fund currently consists of six different classes of shares: Class A, Class C, Class R, Class Y, Class R5 and Class R6. Class Y shares are available only to certain investors. Class A shares are sold with a front-end sales charge unless certain waiver criteria are met and under certain circumstances load waived shares may be subject to contingent deferred sales charges (“CDSC”). Class C shares are sold with a CDSC. Class R, Class Y, Class R5 and Class R6 shares are sold at net asset value.
The following is a summary of the significant accounting policies followed by the Fund in the preparation of its financial statements.
| A. | Security Valuations — Securities, including restricted securities, are valued according to the following policy. |
A security listed or traded on an exchange (except convertible securities) is valued at its last sales price or official closing price as of the close of the customary trading session on the exchange where the security is principally traded, or lacking any sales or official closing price on a particular day, the security may be valued at the closing bid price on that day. Securities traded in the over-the-counter market are valued based on prices furnished by independent pricing services or market makers. When such securities are valued by an independent pricing service they may be considered fair valued. Futures contracts are valued at the final settlement price set by an exchange on which they are principally traded. Listed options are valued at the mean between the last bid and asked prices from the exchange on which they are principally traded. Options not listed on an exchange are valued by an independent source at the mean between the last bid and asked prices. For purposes of determining net asset value (“NAV”) per share, futures and option contracts generally are valued 15 minutes after the close of the customary trading session of the New York Stock Exchange (“NYSE”).
Investments in open-end and closed-end registered investment companies that do not trade on an exchange are valued at the end-of-day net asset value per share. Investments in open-end and closed-end registered investment companies that trade on an exchange are valued at the last sales price or official closing price as of the close of the customary trading session on the exchange where the security is principally traded.
19 Invesco Long/Short Equity Fund
Swap agreements are fair valued using an evaluated quote, if available, provided by an independent pricing service. Evaluated quotes provided by the pricing service are valued based on a model which may include end-of-day net present values, spreads, ratings, industry, company performance and returns of referenced assets.
Debt obligations (including convertible securities) and unlisted equities are fair valued using an evaluated quote provided by an independent pricing service. Evaluated quotes provided by the pricing service may be determined without exclusive reliance on quoted prices, and may reflect appropriate factors such as institution-size trading in similar groups of securities, developments related to specific securities, dividend rate (for unlisted equities), yield (for debt obligations), quality, type of issue, coupon rate (for debt obligations), maturity (for debt obligations), individual trading characteristics and other market data. Debt obligations are subject to interest rate and credit risks. In addition, all debt obligations involve some risk of default with respect to interest and/or principal payments.
Foreign securities’ (including foreign exchange contracts) prices are converted into U.S. dollar amounts using the applicable exchange rates as of the close of the NYSE. If market quotations are available and reliable for foreign exchange-traded equity securities, the securities will be valued at the market quotations. Because trading hours for certain foreign securities end before the close of the NYSE, closing market quotations may become unreliable. If between the time trading ends on a particular security and the close of the customary trading session on the NYSE, events occur that the Adviser determines are significant and make the closing price unreliable, the Fund may fair value the security. If the event is likely to have affected the closing price of the security, the security will be valued at fair value in good faith using procedures approved by the Board of Trustees. Adjustments to closing prices to reflect fair value may also be based on a screening process of an independent pricing service to indicate the degree of certainty, based on historical data, that the closing price in the principal market where a foreign security trades is not the current value as of the close of the NYSE. Foreign securities’ prices meeting the approved degree of certainty that the price is not reflective of current value will be priced at the indication of fair value from the independent pricing service. Multiple factors may be considered by the independent pricing service in determining adjustments to reflect fair value and may include information relating to sector indices, American Depositary Receipts and domestic and foreign index futures. Foreign securities may have additional risks including exchange rate changes, potential for sharply devalued currencies and high inflation, political and economic upheaval, the relative lack of issuer information, relatively low market liquidity and the potential lack of strict financial and accounting controls and standards.
Securities for which market prices are not provided by any of the above methods may be valued based upon quotes furnished by independent sources. The last bid price may be used to value equity securities. The mean between the last bid and asked prices is used to value debt obligations, including corporate loans.
Securities for which market quotations are not readily available or became unreliable are valued at fair value as determined in good faith by or under the supervision of the Trust’s officers following procedures approved by the Board of Trustees. Issuer specific events, market trends, bid/asked quotes of brokers and information providers and other market data may be reviewed in the course of making a good faith determination of a security’s fair value.
The Fund may invest in securities that are subject to interest rate risk, meaning the risk that the prices will generally fall as interest rates rise and, conversely, the prices will generally rise as interest rates fall. Specific securities differ in their sensitivity to changes in interest rates depending on their individual characteristics. Changes in interest rates may result in increased market volatility, which may affect the value and/or liquidity of certain Fund investments.
Valuations change in response to many factors including the historical and prospective earnings of the issuer, the value of the issuer’s assets, general economic conditions, interest rates, investor perceptions and market liquidity. Because of the inherent uncertainties of valuation, the values reflected in the financial statements may materially differ from the value received upon actual sale of those investments.
| B. | Securities Transactions and Investment Income — Securities transactions are accounted for on a trade date basis. Realized gains or losses on sales are computed on the basis of specific identification of the securities sold. Interest income (net of withholding tax, if any) is recorded on the accrual basis from settlement date. Dividend income (net of withholding tax, if any) is recorded on the ex-dividend date. |
The Fund may periodically participate in litigation related to Fund investments. As such, the Fund may receive proceeds from litigation settlements. Any proceeds received are included in the Statement of Operations as realized gain (loss) for investments no longer held and as unrealized gain (loss) for investments still held.
Brokerage commissions and mark ups are considered transaction costs and are recorded as an increase to the cost basis of securities purchased and/or a reduction of proceeds on a sale of securities. Such transaction costs are included in the determination of net realized and unrealized gain (loss) from investment securities reported in the Statement of Operations and the Statement of Changes in Net Assets and the net realized and unrealized gains (losses) on securities per share in the Financial Highlights. Transaction costs are included in the calculation of the Fund’s net asset value and, accordingly, they reduce the Fund’s total returns. These transaction costs are not considered operating expenses and are not reflected in net investment income reported in the Statement of Operations and the Statement of Changes in Net Assets, or the net investment income per share and the ratios of expenses and net investment income reported in the Financial Highlights, nor are they limited by any expense limitation arrangements between the Fund and the investment adviser.
The Fund allocates income and realized and unrealized capital gains and losses to a class based on the relative net assets of each class.
| C. | Country Determination — For the purposes of making investment selection decisions and presentation in the Schedule of Investments, the investment adviser may determine the country in which an issuer is located and/or credit risk exposure based on various factors. These factors include the laws of the country under which the issuer is organized, where the issuer maintains a principal office, the country in which the issuer derives 50% or more of its total revenues and the country that has the primary market for the issuer’s securities, as well as other criteria. Among the other criteria that may be evaluated for making this determination are the country in which the issuer maintains 50% or more of its assets, the type of security, financial guarantees and enhancements, the nature of the collateral and the sponsor organization. Country of issuer and/or credit risk exposure has been determined to be the United States of America, unless otherwise noted. |
| D. | Distributions — Distributions from net investment income and net realized capital gain, if any, are generally declared and paid annually and recorded on the ex-dividend date. The Fund may elect to treat a portion of the proceeds from redemptions as distributions for federal income tax purposes. |
| E. | Federal Income Taxes — The Fund intends to comply with the requirements of Subchapter M of the Internal Revenue Code of 1986, as amended (the “Internal Revenue Code”), necessary to qualify as a regulated investment company and to distribute substantially all of the Fund’s |
20 Invesco Long/Short Equity Fund
| | taxable earnings to shareholders. As such, the Fund will not be subject to federal income taxes on otherwise taxable income (including net realized capital gain) that is distributed to shareholders. Therefore, no provision for federal income taxes is recorded in the financial statements. |
The Fund recognizes the tax benefits of uncertain tax positions only when the position is more likely than not to be sustained. Management has analyzed the Fund’s uncertain tax positions and concluded that no liability for unrecognized tax benefits should be recorded related to uncertain tax positions. Management is not aware of any tax positions for which it is reasonably possible that the total amounts of unrecognized tax benefits will change materially in the next 12 months.
The Fund files tax returns in the U.S. Federal jurisdiction and certain other jurisdictions. Generally, the Fund is subject to examinations by such taxing authorities for up to three years after the filing of the return for the tax period.
| F. | Expenses — Fees provided for under the Rule 12b-1 plan of a particular class of the Fund are charged to the operations of such class. Transfer agency fees and expenses and other shareholder recordkeeping fees and expenses attributable to Class R5 and Class R6 are allocated to each share class based on relative net assets. Sub-accounting fees attributable to Class R5 are charged to the operations of the class. Transfer agency fees and expenses and other shareholder recordkeeping fees and expenses relating to all other classes are allocated among those classes based on relative net assets. All other expenses are allocated among the classes based on relative net assets. |
| G. | Accounting Estimates — The preparation of financial statements in conformity with accounting principles generally accepted in the United States of America (“GAAP”) requires management to make estimates and assumptions that affect the reported amounts of assets and liabilities at the date of the financial statements and the reported amounts of revenues and expenses during the reporting period including estimates and assumptions related to taxation. Actual results could differ from those estimates by a significant amount. In addition, the Fund monitors for material events or transactions that may occur or become known after the period-end date and before the date the financial statements are released to print. |
| H. | Indemnifications — Under the Trust’s organizational documents, each Trustee, officer, employee or other agent of the Trust is indemnified against certain liabilities that may arise out of the performance of their duties to the Fund. Additionally, in the normal course of business, the Fund enters into contracts, including the Fund’s servicing agreements, that contain a variety of indemnification clauses. The Fund’s maximum exposure under these arrangements is unknown as this would involve future claims that may be made against the Fund that have not yet occurred. The risk of material loss as a result of such indemnification claims is considered remote. |
| I. | Cash and Cash Equivalents — For the purposes of the Statement of Cash Flows, the Fund defines Cash and Cash Equivalents as cash (including foreign currency), money market funds and other investments held in lieu of cash and excludes investments made with cash collateral received. |
| J. | Swap Agreements — The Fund may enter into various swap transactions, including interest rate, total return, volatility, variance, index, currency and credit default swap contracts (“CDS”) for investment purposes or to manage interest rate, equity, currency or credit risk. Such transactions are agreements between two parties (“Counterparties”). These agreements may contain among other conditions, events of default and termination events, and various covenants and representations such as provisions that require the Fund to maintain a pre-determined level of net assets, and/or provide limits regarding the decline of the Fund’s NAV over specific periods of time. If the Fund were to trigger such provisions and have open derivative positions at that time, the Counterparty may be able to terminate such agreement and request immediate payment in an amount equal to the net liability positions, if any. |
Interest rate, total return, volatility, variance, index, and currency swap agreements are two-party contracts entered into primarily to exchange the returns (or differentials in rates of returns) earned or realized on particular predetermined investments or instruments. The gross returns to be exchanged or “swapped” between the parties are calculated with respect to a notional amount, i.e., the return on or increase in value of a particular dollar amount invested at a particular interest rate or return of an underlying asset, in a particular foreign currency, or in a “basket” of securities representing a particular index.
A total return swap is an agreement in which one party makes payments based on a set rate, either fixed or variable, while the other party makes payments based on the return of an underlying asset, which includes both the income generated and capital gains, if any. The unrealized appreciation (depreciation) on total return swaps includes dividends on the underlying equity securities and financing rate payable from the Counterparty. At the maturity date, a net cash flow is exchanged where the total return is equivalent to the return of the underlying reference less a financing rate, if any. As a receiver, the Fund would receive payments based on any positive total return and would owe payments in the event of a negative total return. As the payer, the Fund would owe payments on any net positive total return, and would receive payment in the event of a negative total return.
Changes in the value of swap agreements are recognized as unrealized gains (losses) in the Statement of Operations by “marking to market” on a daily basis to reflect the value of the swap agreement at the end of each trading day. Payments received or paid at the beginning of the agreement are reflected as such on the Statement of Assets and Liabilities and may be referred to as upfront payments. The Fund accrues for the fixed payment stream and amortizes upfront payments, if any, on swap agreements on a daily basis with the net amount, recorded as a component of realized gain (loss) on the Statement of Operations. A liquidation payment received or made at the termination of a swap agreement is recorded as realized gain (loss) on the Statement of Operations. The Fund segregates cash or liquid securities having a value at least equal to the amount of the potential obligation of a Fund under any swap transaction. Cash held as collateral is recorded as deposits with brokers on the Statement of Assets and Liabilities. Entering into these agreements involves, to varying degrees, lack of liquidity and elements of credit, market, and Counterparty risk in excess of amounts recognized on the Statement of Assets and Liabilities. Such risks involve the possibility that a swap is difficult to sell or liquidate; the Counterparty does not honor its obligations under the agreement and unfavorable interest rates and market fluctuations. It is possible that developments in the swaps market, including potential government regulation, could adversely affect the Fund’s ability to terminate existing swap agreements or to realize amounts to be received under such agreements. A short position in a security poses more risk than holding the same security long. As there is no limit on how much the price of the security can increase, the Fund’s exposure is unlimited.
| K. | Leverage Risk — Leverage exists when the Fund can lose more than it originally invests because it purchases or sells an instrument or enters into a transaction without investing an amount equal to the full economic exposure of the instrument or transaction. |
| L. | Collateral — To the extent the Fund has designated or segregated a security as collateral and that security is subsequently sold, it is the Fund’s practice to replace such collateral no later than the next business day. |
21 Invesco Long/Short Equity Fund
NOTE 2—Advisory Fees and Other Fees Paid to Affiliates
The Trust has entered into a master investment advisory agreement with Invesco Advisers, Inc. (the “Adviser” or “Invesco”). Under the terms of the investment advisory agreement, the Fund pays an advisory fee to the Adviser based on the annual rate of the Fund’s average daily net assets as follows:
| | | | |
| Average Daily Net Assets | | Rate | |
First $10 billion | | | 1.25% | |
Over $10 billion | | | 1.15% | |
For the year ended October 31, 2016, the effective advisory fees incurred by the Fund was 1.25%.
Under the terms of a master sub-advisory agreement between the Adviser and each of Invesco Asset Management Deutschland GmbH, Invesco Asset Management Limited, Invesco Asset Management (Japan) Limited, Invesco Hong Kong Limited, Invesco Senior Secured Management, Inc., Invesco Canada Ltd. and Invesco PowerShares Capital Management LLC (collectively, the “Affiliated Sub-Advisers”) the Adviser, not the Fund, will pay 40% of the fees paid to the Adviser to any such Affiliated Sub-Adviser(s) that provide(s) discretionary investment management services to the Fund based on the percentage of assets allocated to such Affiliated Sub-Adviser(s).
The Adviser has contractually agreed, through at least February 28, 2017, to waive advisory fees and/or reimburse expenses to the extent necessary to limit total annual fund operating expenses after fee waiver and/or expense reimbursement (excluding certain items discussed below) of Class A, Class C, Class R, Class Y, Class R5 and Class R6 shares to 1.87%, 2.62%, 2.12%, 1.62%, 1.62% and 1.62%, respectively, of the Fund’s average daily net assets (the “expense limits”). In determining the Adviser’s obligation to waive advisory fees and/or reimburse expenses, the following expenses are not taken into account, and could cause total annual fund operating expenses after fee waiver and/or expense reimbursement to exceed the numbers reflected above: (1) interest; (2) taxes; (3) dividend expense on short sales; (4) extraordinary or non-routine items, including litigation expenses; and (5) expenses that the Fund has incurred but did not actually pay because of an expense offset arrangement. Unless Invesco continues the fee waiver agreement, it will terminate on February 28, 2017. During its term, the fee waiver agreement cannot be terminated or amended to increase the expense limits without approval of the Board of Trustees.
Further, the Adviser has contractually agreed, through at least June 30, 2018, to waive the advisory fee payable by the Fund in an amount equal to 100% of the net advisory fees the Adviser receives from the affiliated money market funds on investments by the Fund of uninvested cash in such affiliated money market funds.
For the year ended October 31, 2016, the Adviser waived advisory fees of $63,137 and reimbursed class level expenses of $15,057, $3,349, $70, $9,230, $3 and $154 of Class A, Class C, Class R, Class Y, Class R5 and Class R6 shares, respectively.
The Trust has entered into a master administrative services agreement with Invesco pursuant to which the Fund has agreed to pay Invesco for certain administrative costs incurred in providing accounting services to the Fund. For the year ended October 31, 2016, expenses incurred under the agreement are shown in the Statement of Operations as Administrative services fees.
The Trust has entered into a transfer agency and service agreement with Invesco Investment Services, Inc. (“IIS”) pursuant to which the Fund has agreed to pay IIS a fee for providing transfer agency and shareholder services to the Fund and reimburse IIS for certain expenses incurred by IIS in the course of providing such services. IIS may make payments to intermediaries that provide omnibus account services, sub-accounting services and/or networking services. All fees payable by IIS to intermediaries that provide omnibus account services or sub-accounting are charged back to the Fund, subject to certain limitations approved by the Trust’s Board of Trustees. For the year ended October 31, 2016, expenses incurred under the agreement are shown in the Statement of Operations as Transfer agent fees.
The Trust has entered into master distribution agreements with Invesco Distributors, Inc. (“IDI”) to serve as the distributor for the Class A, Class C, Class R, Class Y, Class R5 and Class R6 shares of the Fund. The Trust has adopted plans pursuant to Rule 12b-1 under the 1940 Act with respect to the Fund’s Class A, Class C and Class R shares (collectively the “Plans”). The Fund, pursuant to the Plans, pays IDI compensation at the annual rate of 0.25% of the Fund’s average daily net assets of Class A shares, 1.00% of the average daily net assets of Class C shares and 0.50% of the average daily net assets of Class R shares. Of the Plan payments, up to 0.25% of the average daily net assets of each class of shares may be paid to furnish continuing personal shareholder services to customers who purchase and own shares of such classes. Any amounts not paid as a service fee under the Plans would constitute an asset-based sales charge. Rules of the Financial Industry Regulatory Authority (“FINRA”) impose a cap on the total sales charges, including asset-based sales charges, that may be paid by any class of shares of the Fund. For the year ended October 31, 2016, expenses incurred under the Plans are shown in the Statement of Operations as Distribution fees.
Front-end sales commissions and CDSC (collectively, the “sales charges”) are not recorded as expenses of the Fund. Front-end sales commissions are deducted from proceeds from the sales of Fund shares prior to investment in Class A shares of the Fund. CDSC are deducted from redemption proceeds prior to remittance to the shareholder. During the year ended October 31, 2016, IDI advised the Fund that IDI retained $20,757 in front-end sales commissions from the sale of Class A shares and $149 and $387 from Class A and Class C shares, respectively, for CDSC imposed upon redemptions by shareholders.
Certain officers and trustees of the Trust are officers and directors of the Adviser, IIS and/or IDI.
NOTE 3—Additional Valuation Information
GAAP defines fair value as the price that would be received to sell an asset or paid to transfer a liability in an orderly transaction between market participants at the measurement date, under current market conditions. GAAP establishes a hierarchy that prioritizes the inputs to valuation methods, giving the highest priority to readily available unadjusted quoted prices in an active market for identical assets (Level 1) and the lowest priority to significant unobservable inputs (Level 3), generally when market prices are not readily available or are unreliable. Based on the valuation inputs, the securities or other investments are tiered into one of three levels. Changes in valuation methods may result in transfers in or out of an investment’s assigned level:
| | Level 1 — | Prices are determined using quoted prices in an active market for identical assets. |
22 Invesco Long/Short Equity Fund
| | Level 2 — | Prices are determined using other significant observable inputs. Observable inputs are inputs that other market participants may use in pricing a security. These may include quoted prices for similar securities, interest rates, prepayment speeds, credit risk, yield curves, loss severities, default rates, discount rates, volatilities and others. |
| | Level 3 — | Prices are determined using significant unobservable inputs. In situations where quoted prices or observable inputs are unavailable (for example, when there is little or no market activity for an investment at the end of the period), unobservable inputs may be used. Unobservable inputs reflect the Fund’s own assumptions about the factors market participants would use in determining fair value of the securities or instruments and would be based on the best available information. |
The following is a summary of the tiered valuation input levels, as of October 31, 2016. The level assigned to the securities valuations may not be an indication of the risk or liquidity associated with investing in those securities. Because of the inherent uncertainties of valuation, the values reflected in the financial statements may materially differ from the value received upon actual sale of those investments.
| | | | | | | | | | | | | | | | |
| | | Level 1 | | | Level 2 | | | Level 3 | | | Total | |
Common Stocks & Other Equity Interests | | $ | 65,469,505 | | | $ | — | | | $ | — | | | $ | 65,469,505 | |
Money Market Funds | | | 2,139,544 | | | | — | | �� | | — | | | | 2,139,544 | |
| | | | 67,609,049 | | | | — | | | | — | | | | 67,609,049 | |
Swap Agreements* | | | — | | | | 1,435,669 | | | | — | | | | 1,435,669 | |
Total Investments | | $ | 67,609,049 | | | $ | 1,435,669 | | | $ | — | | | $ | 69,044,718 | |
| * | Unrealized appreciation. |
NOTE 4—Derivative Investments
The Fund may enter into an International Swaps and Derivatives Association Master Agreement (“ISDA Master Agreement”) under which a Fund may trade OTC derivatives. An OTC transaction entered into under an ISDA Master Agreement typically involves a collateral posting arrangement, payment netting provisions and close-out netting provisions. These netting provisions allow for reduction of credit risk through netting of contractual obligations. The enforceability of the netting provisions of the ISDA Master Agreement depends on the governing law of the ISDA Master Agreement, among other factors.
For financial reporting purposes, the Fund does not offset OTC derivative assets or liabilities that are subject to ISDA Master Agreements in the Statement of Assets and Liabilities.
Value of Derivative Investments at Period-End
The table below summarizes the value of the Fund’s derivative investments, detailed by primary risk exposure, held as of October 31, 2016:
| | | | |
| | | Value | |
| Derivative Assets | | Equity
Risk | |
Unrealized appreciation on swap agreements — OTC | | $ | 2,001,219 | |
Derivatives not subject to master netting agreements | | | — | |
Total Derivative Assets subject to master netting agreements | | $ | 2,001,219 | |
| |
| | | Value | |
| Derivative Liabilities | | Equity
Risk | |
Unrealized depreciation on swap agreements — OTC | | $ | (565,550 | ) |
Derivatives not subject to master netting agreements | | | — | |
Total Derivative Liabilities subject to master netting agreements | | $ | (565,550 | ) |
Offsetting Assets and Liabilities
The table below reflects the Fund’s exposure to Counterparties subject to either an ISDA Master Agreement or other agreement for OTC derivative transactions as of October 31, 2016.
| | | | | | | | | | | | | | | | | | | | | | | | | | | | | | | | |
| | | Financial Derivative Assets | | | Financial Derivative Liabilities | | | | | | Collateral (Received)/Pledged | |
| Counterparty | | Swap
agreements | | | Total assets | | | Swap
agreements | | | Total
liabilities | | | Net value of
derivatives | | | Non-Cash | | | Cash | | | Net amount | |
Morgan Stanley & Co. LLC | | $ | 2,001,219 | | | $ | 2,001,219 | | | $ | (687,298 | ) | | $ | (687,298 | ) | | $ | 1,313,921 | | | $ | — | | | $ | — | | | $ | 1,313,921 | |
Effect of Derivative Investments for the year ended October 31, 2016
The table below summarizes the gains (losses) on derivative investments, detailed by primary risk exposure, recognized in earnings during the period:
| | | | |
| | | Location of Gain (Loss) on
Statement of Operations | |
| | | Equity
Risk | |
Realized Gain (Loss): | | | | |
Swap agreements | | $ | (7,712,486 | ) |
Change in Net Unrealized Appreciation: | | | | |
Swap agreements | | | 1,169,547 | |
Total | | $ | (6,542,939 | ) |
23 Invesco Long/Short Equity Fund
The table below summarizes the average notional value of swap agreements outstanding during the period.
| | | | |
| | | Swap
Agreements | |
Average notional value | | $ | 118,461,086 | |
NOTE 5—Expense Offset Arrangement(s)
The expense offset arrangement is comprised of transfer agency credits which result from balances in demand deposit accounts used by the transfer agent for clearing shareholder transactions. For the year ended October 31, 2016, the Fund received credits from this arrangement, which resulted in the reduction of the Fund’s total expenses of $142.
NOTE 6—Trustees’ and Officers’ Fees and Benefits
Trustees’ and Officers’ Fees and Benefits include amounts accrued by the Fund to pay remuneration to certain Trustees and Officers of the Fund. Trustees have the option to defer compensation payable by the Fund, and Trustees’ and Officers’ Fees and Benefits also include amounts accrued by the Fund to fund such deferred compensation amounts. Those Trustees who defer compensation have the option to select various Invesco Funds in which their deferral accounts shall be deemed to be invested. Obligations under the deferred compensation plan represent unsecured claims against the general assets of the Fund.
NOTE 7—Cash Balances
The Fund is permitted to temporarily carry a negative or overdrawn balance in its account with State Street Bank and Trust Company, the custodian bank. Such balances, if any at period-end, are shown in the Statement of Assets and Liabilities under the payable caption Amount due custodian. To compensate the custodian bank for such overdrafts, the overdrawn Fund may either (1) leave funds as a compensating balance in the account so the custodian bank can be compensated by earning the additional interest; or (2) compensate by paying the custodian bank at a rate agreed upon by the custodian bank and Invesco, not to exceed the contractually agreed upon rate.
NOTE 8—Distributions to Shareholders and Tax Components of Net Assets
Tax Character of Distributions to Shareholders Paid During the Fiscal Years Ended October 31, 2016 and 2015:
| | | | | | | | |
| | | 2016 | | | 2015 | |
Ordinary income | | $ | 1,132,066 | | | $ | — | |
Long-term capital gain | | | 168,568 | | | | 8,324 | |
Total distributions | | $ | 1,300,634 | | | $ | 8,324 | |
Tax Components of Net Assets at Period-End:
| | | | |
| | | 2016 | |
Undistributed long-term gain | | $ | 406,840 | |
Net unrealized appreciation — investments | | | 2,423,002 | |
Temporary book/tax differences | | | (5,998 | ) |
Shares of beneficial interest | | | 65,659,851 | |
Total net assets | | $ | 68,483,695 | |
The difference between book-basis and tax-basis unrealized appreciation (depreciation) is due to differences in the timing of recognition of gains and losses on investments for tax and book purposes. The Fund’s net unrealized appreciation difference is attributable primarily to wash sales.
The temporary book/tax differences are a result of timing differences between book and tax recognition of income and/or expenses. The Fund’s temporary book/tax differences are the result of the trustee deferral of compensation and retirement plan benefits.
Capital loss carryforward is calculated and reported as of a specific date. Results of transactions and other activity after that date may affect the amount of capital loss carryforward actually available for the Fund to utilize. Capital losses generated in years beginning after December 22, 2010 can be carried forward for an unlimited period, whereas previous losses expire in eight tax years. Capital losses with an expiration period may not be used to offset capital gains until all net capital losses without an expiration date have been utilized. Capital loss carryforwards with no expiration date will retain their character as either short-term or long-term capital losses instead of as short-term capital losses as under prior law. The ability to utilize capital loss carryforwards in the future may be limited under the Internal Revenue Code and related regulations based on the results of future transactions.
The Fund does not have a capital loss carryforward as of October 31, 2016.
24 Invesco Long/Short Equity Fund
NOTE 9—Investment Securities
The aggregate amount of investment securities (other than short-term securities, U.S. Treasury obligations and money market funds, if any) purchased and sold by the Fund during the year ended October 31, 2016 was $92,155,137 and $50,751,513, respectively. Cost of investments on a tax basis includes the adjustments for financial reporting purposes as of the most recently completed federal income tax reporting period-end.
| | | | |
| Unrealized Appreciation (Depreciation) of Investment Securities on a Tax Basis | |
Aggregate unrealized appreciation of investment securities | | $ | 5,593,707 | |
Aggregate unrealized (depreciation) of investment securities | | | (3,170,705 | ) |
Net unrealized appreciation of investment securities | | $ | 2,423,002 | |
Cost of investments for tax purposes is $65,186,047.
NOTE 10—Reclassification of Permanent Differences
Primarily as a result of differing book/tax treatment of swap agreements and net operating losses, on October 31, 2016, undistributed net investment income was decreased by $1,548,168, undistributed net realized gain was increased by $5,727,029 and shares of beneficial interest was decreased by $4,178,861. This reclassification had no effect on the net assets of the Fund.
NOTE 11—Share Information
| | | | | | | | | | | | | | | | |
| | | Summary of Share Activity | |
| | | Years ended October 31, | |
| | | 2016(a) | | | 2015 | |
| | | Shares | | | Amount | | | Shares | | | Amount | |
Sold: | | | | | | | | | | | | | | | | |
Class A | | | 485,055 | | | $ | 5,239,306 | | | | 556,814 | | | $ | 6,231,353 | |
Class C | | | 122,278 | | | | 1,335,132 | | | | 185,522 | | | | 2,040,295 | |
Class R | | | 4,388 | | | | 46,734 | | | | 1,785 | | | | 19,704 | |
Class Y | | | 237,370 | | | | 2,565,330 | | | | 353,711 | | | | 3,918,479 | |
Class R5 | | | 1,739 | | | | 18,068 | | | | — | | | | — | |
Class R6(b) | | | 4,517,701 | | | | 47,595,766 | | | | 2,429 | | | | 26,925 | |
| | | | |
Issued as reinvestment of dividends: | | | | | | | | | | | | | | | | |
Class A | | | 33,564 | | | | 364,508 | | | | 238 | | | | 2,611 | |
Class C | | | 11,487 | | | | 123,718 | | | | 77 | | | | 839 | |
Class R | | | 162 | | | | 1,762 | | | | — | | | | — | |
Class Y | | | 12,205 | | | | 132,915 | | | | 76 | | | | 841 | |
Class R5 | | | — | | | | — | | | | 4 | | | | 44 | |
Class R6 | | | 155 | | | | 1,688 | | | | — | | | | — | |
| | | | |
Reacquired: | | | | | | | | | | | | | | | | |
Class A | | | (529,912 | ) | | | (5,735,419 | ) | | | (966,899 | ) | | | (10,612,481 | ) |
Class C | | | (109,262 | ) | | | (1,139,622 | ) | | | (218,028 | ) | | | (2,371,618 | ) |
Class R | | | (63 | ) | | | (664 | ) | | | (725 | ) | | | (7,989 | ) |
Class Y | | | (192,505 | ) | | | (2,056,564 | ) | | | (810,753 | ) | | | (8,911,369 | ) |
Class R5 | | | — | | | | — | | | | (15,106 | ) | | | (173,259 | ) |
Class R6 | | | (162,427 | ) | | | (1,719,783 | ) | | | (777 | ) | | | (8,818 | ) |
Net increase (decrease) in share activity | | | 4,431,935 | | | $ | 46,772,875 | | | | (911,632 | ) | | $ | (9,844,443 | ) |
| (a) | There is an entity that is a record owner of more than 5% of the outstanding shares of the Fund and in the aggregate owns 10% of the outstanding shares of the Fund. IDI has an agreement with this entity to sell Fund shares. The Fund, Invesco and/or Invesco affiliates may make payments to this entity, which is considered to be related to the Fund, for providing services to the Fund, Invesco and/or Invesco affiliates including but not limited to services such as securities brokerage, distribution, third party record keeping and account servicing. The Fund has no knowledge as to whether all or any portion of the shares owned of record by this entity are also owned beneficially. |
| | In addition, 78% of the outstanding shares of the Fund are owned by the Adviser or an affiliate of the Adviser. |
| (b) | On February 18, 2016, 4,184,012 Class R6 shares valued at $44,099,486 were sold to affiliated mutual funds. |
25 Invesco Long/Short Equity Fund
NOTE 12—Financial Highlights
The following schedule presents financial highlights for a share of the Fund outstanding throughout the periods indicated.
| | | | | | | | | | | | | | | | | | | | | | | | | | | | | | | | | | | | | | | | | | | | | | | | | | | | | | | | |
| | | Net asset
value,
beginning
of period | | | Net
investment
income(a) | | | Net gains
(losses) on securities
(both
realized and
unrealized) | | | Total from
investment
operations | | | Dividends
from net
Investment
income | | | Distributions
from net
realized
gains | | | Total
distributions | | | Net asset
value, end
of period | | | Total
return(b) | | | Net assets,
end of period
(000’s omitted) | | | Ratio of
expenses
to average net assets
with fee waivers
and/or expenses
absorbed | | | Ratio of
expenses
to average net
assets without
fee waivers
and/or expenses
absorbed | | | Ratio of net
investment
income (loss)
to average
net assets | | | Portfolio
turnover(c) | |
Class A | | | | | | | | | | | | | | | | | | | | | | | | | | | | | | | | | | | | | | | | | | | | | | | | | | | | | | | | |
Year ended 10/31/16 | | $ | 11.50 | | | $ | 0.06 | (d) | | $ | (0.50 | ) | | $ | (0.44 | ) | | $ | (0.55 | ) | | $ | (0.06 | ) | | $ | (0.61 | ) | | $ | 10.45 | | | | (4.03 | )% | | $ | 11,562 | | | | 1.85 | %(e) | | | 2.08 | %(e) | | | 0.58 | %(d)(e) | | | 102 | % |
Year ended 10/31/15 | | | 11.00 | | | | 0.01 | | | | 0.49 | | | | 0.50 | | | | — | | | | (0.00 | ) | | | — | | | | 11.50 | | | | 4.57 | | | | 12,854 | | | | 1.85 | | | | 2.76 | | | | 0.11 | | | | 89 | |
Year ended 10/31/14(f) | | | 10.00 | | | | (0.02 | ) | | | 1.02 | | | | 1.00 | | | | — | | | | — | | | | — | | | | 11.00 | | | | 10.00 | | | | 16,796 | | | | 1.85 | (g) | | | 3.04 | (g) | | | (0.25 | )(g) | | | 102 | |
Class C | | | | | | | | | | | | | | | | | | | | | | | | | | | | | | | | | | | | | | | | | | | | | | | | | | | | | | | | |
Year ended 10/31/16 | | | 11.34 | | | | (0.02 | )(d) | | | (0.48 | ) | | | (0.50 | ) | | | (0.48 | ) | | | (0.06 | ) | | | (0.54 | ) | | | 10.30 | | | | (4.68 | ) | | | 2,385 | | | | 2.60 | (e) | | | 2.83 | (e) | | | (0.17 | )(d)(e) | | | 102 | |
Year ended 10/31/15 | | | 10.92 | | | | (0.07 | ) | | | 0.49 | | | | 0.42 | | | | — | | | | (0.00 | ) | | | — | | | | 11.34 | | | | 3.87 | | | | 2,350 | | | | 2.60 | | | | 3.51 | | | | (0.64 | ) | | | 89 | |
Year ended 10/31/14(f) | | | 10.00 | | | | (0.10 | ) | | | 1.02 | | | | 0.92 | | | | — | | | | — | | | | — | | | | 10.92 | | | | 9.20 | | | | 2,618 | | | | 2.60 | (g) | | | 3.79 | (g) | | | (1.00 | )(g) | | | 102 | |
Class R | | | | | | | | | | | | | | | | | | | | | | | | | | | | | | | | | | | | | | | | | | | | | | | | | | | | | | | | |
Year ended 10/31/16 | | | 11.45 | | | | 0.04 | (d) | | | (0.50 | ) | | | (0.46 | ) | | | (0.53 | ) | | | (0.06 | ) | | | (0.59 | ) | | | 10.40 | | | | (4.27 | ) | | | 83 | | | | 2.10 | (e) | | | 2.33 | (e) | | | 0.33 | (d)(e) | | | 102 | |
Year ended 10/31/15 | | | 10.98 | | | | (0.02 | ) | | | 0.49 | | | | 0.47 | | | | — | | | | (0.00 | ) | | | — | | | | 11.45 | | | | 4.31 | | | | 40 | | | | 2.10 | | | | 3.01 | | | | (0.14 | ) | | | 89 | |
Year ended 10/31/14(f) | | | 10.00 | | | | (0.04 | ) | | | 1.02 | | | | 0.98 | | | | — | | | | — | | | | — | | | | 10.98 | | | | 9.80 | | | | 27 | | | | 2.10 | (g) | | | 3.29 | (g) | | | (0.50 | )(g) | | | 102 | |
Class Y | | | | | | | | | | | | | | | | | | | | | | | | | | | | | | | | | | | | | | | | | | | | | | | | | | | | | | | | |
Year ended 10/31/16 | | | 11.56 | | | | 0.09 | (d) | | | (0.50 | ) | | | (0.41 | ) | | | (0.58 | ) | | | (0.06 | ) | | | (0.64 | ) | | | 10.51 | | | | (3.74 | ) | | | 7,604 | | | | 1.60 | (e) | | | 1.83 | (e) | | | 0.83 | (d)(e) | | | 102 | |
Year ended 10/31/15 | | | 11.02 | | | | 0.04 | | | | 0.50 | | | | 0.54 | | | | — | | | | (0.00 | ) | | | — | | | | 11.56 | | | | 4.93 | | | | 7,709 | | | | 1.60 | | | | 2.51 | | | | 0.36 | | | | 89 | |
Year ended 10/31/14(f) | | | 10.00 | | | | 0.00 | | | | 1.02 | | | | 1.02 | | | | — | | | | — | | | | — | | | | 11.02 | | | | 10.20 | | | | 12,389 | | | | 1.60 | (g) | | | 2.79 | (g) | | | 0.00 | (g) | | | 102 | |
Class R5 | | | | | | | | | | | | | | | | | | | | | | | | | | | | | | | | | | | | | | | | | | | | | | | | | | | | | | | | |
Year ended 10/31/16 | | | 11.56 | | | | 0.09 | (d) | | | (0.51 | ) | | | (0.42 | ) | | | (0.58 | ) | | | (0.06 | ) | | | (0.64 | ) | | | 10.50 | | | | (3.83 | ) | | | 543 | | | | 1.60 | (e) | | | 1.71 | (e) | | | 0.83 | (d)(e) | | | 102 | |
Year ended 10/31/15 | | | 11.02 | | | | 0.04 | | | | 0.50 | | | | 0.54 | | | | — | | | | (0.00 | ) | | | — | | | | 11.56 | | | | 4.93 | | | | 578 | | | | 1.60 | | | | 2.38 | | | | 0.36 | | | | 89 | |
Year ended 10/31/14(f) | | | 10.00 | | | | 0.00 | | | | 1.02 | | | | 1.02 | | | | — | | | | — | | | | — | | | | 11.02 | | | | 10.20 | | | | 718 | | | | 1.60 | (g) | | | 2.69 | (g) | | | 0.00 | (g) | | | 102 | |
Class R6 | | | | | | | | | | | | | | | | | | | | | | | | | | | | | | | | | | | | | | | | | | | | | | | | | | | | | | | | |
Year ended 10/31/16 | | | 11.56 | | | | 0.09 | (d) | | | (0.51 | ) | | | (0.42 | ) | | | (0.58 | ) | | | (0.06 | ) | | | (0.64 | ) | | | 10.50 | | | | (3.83 | ) | | | 46,305 | | | | 1.60 | (e) | | | 1.71 | (e) | | | 0.83 | (d)(e) | | | 102 | |
Year ended 10/31/15 | | | 11.02 | | | | 0.04 | | | | 0.50 | | | | 0.54 | | | | — | | | | (0.00 | ) | | | — | | | | 11.56 | | | | 4.93 | | | | 609 | | | | 1.60 | | | | 2.38 | | | | 0.36 | | | | 89 | |
Year ended 10/31/14(f) | | | 10.00 | | | | 0.00 | | | | 1.02 | | | | 1.02 | | | | — | | | | — | | | | — | | | | 11.02 | | | | 10.20 | | | | 562 | | | | 1.60 | (g) | | | 2.69 | (g) | | | 0.00 | (g) | | | 102 | |
| (a) | Calculated using average shares outstanding. |
| (b) | Includes adjustments in accordance with accounting principles generally accepted in the United States of America and as such, the net asset value for financial reporting purposes and the returns based upon those net asset values may differ from the net asset value and returns for shareholder transactions. Does not include sales charges and is not annualized for periods less than one year, if applicable. |
| (c) | Portfolio turnover is calculated at the fund level and is not annualized for periods less than one year, if applicable. |
| (d) | Net investment income per share and the ratio of net investment income to average net assets include significant dividends received during the period. Net investment income per share and the ratio of net investment income to average net assets excluding the significant dividends are $(0.00) and (0.00)%, $(0.08) and (0.75)%, $(0.02) and (0.25)%, $0.03 and 0.25%, $0.03 and 0.25% and 0.03 and 0.25% for Class A, Class C, Class R, Class Y, Class R5 and Class R6 shares, respectively. |
| (e) | Ratios are based on average daily net assets (000’s omitted) of $12,958, $2,882, $60, $7,944, $539 and $32,646 for Class A, Class C, Class R, Class Y, Class R5 and Class R6 shares, respectively. |
| (f) | Commencement date of December 19, 2013. |
NOTE 13—Subsequent Event
Effective January 1, 2017, the Fund will pay an advisory fee to the Adviser based on the annual rate of the Fund’s average daily net assets as follows:
| | | | |
| Average Daily Net Assets | | Rate | |
First $250 million | | | 0.80% | �� |
Next $250 million | | | 0.77% | |
Next $500 million | | | 0.75% | |
Next $1.5 billion | | | 0.72% | |
Next $2.5 billion | | | 0.70% | |
Next $2.5 billion | | | 0.67% | |
Next $2.5 billion | | | 0.65% | |
Over $10 billion | | | 0.62% | |
In addition, effective January 1, 2017, the Adviser has contractually agreed, through at least February 28, 2018, to waive advisory fees and/or reimburse expenses to the extent necessary to limit total annual fund operating expenses after fee waiver and/or expense reimbursement (excluding certain items discussed in Note 2) of Class A, Class C, Class R, Class Y, Class R5 and Class R6 shares to 1.59%, 2.34%, 1.84%, 1.34%, 1.34% and 1.34%, respectively, of the Fund’s average daily net assets.
26 Invesco Long/Short Equity Fund
Report of Independent Registered Public Accounting Firm
To the Board of Trustees
and Shareholders of the Invesco Long/Short Equity Fund:
In our opinion, the accompanying statement of assets and liabilities, including the schedule of investments, and the related statements of operations, of changes in net assets, and of cash flows and the financial highlights present fairly, in all material respects, the financial position of the Invesco Long/Short Equity Fund (the “Fund”) as of October 31, 2016, and the results of its operations and its cash flows for the year then ended, the changes in its net assets for each of the two years in the period then ended and the financial highlights for each of the two years in the period then ended and for the period December 19, 2013 (commencement of operations) through October 31, 2014, in conformity with accounting principles generally accepted in the United States of America. These financial statements and financial highlights (hereafter referred to as “financial statements”) are the responsibility of the Fund’s management. Our responsibility is to express an opinion on these financial statements based on our audit. We conducted our audit of these financial statements in accordance with the standards of the Public Company Accounting Oversight Board (United States). Those standards require that we plan and perform the audit to obtain reasonable assurance about whether the financial statements are free of material misstatement. An audit includes examining, on a test basis, evidence supporting the amounts and disclosures in the financial statements, assessing the accounting principles used and significant estimates made by management, and evaluating the overall financial statement presentation. We believe that our audits, which includes confirmation of securities as of October 31, 2016 by correspondence with the custodian and brokers, and the application of alternative auditing procedures where confirmation of security purchases have not been received, provide a reasonable basis for our opinion.
PRICEWATERHOUSECOOPERS LLP
Houston, Texas
December 21, 2016
27 Invesco Long/Short Equity Fund
Calculating your ongoing Fund expenses
Example
As a shareholder of the Fund, you incur two types of costs: (1) transaction costs, which may include sales charges (loads) on purchase payments or contingent deferred sales charges on redemptions, if any; and (2) ongoing costs, including management fees, distribution and/or service (12b-1) fees, and other Fund expenses. This example is intended to help you understand your ongoing costs (in dollars) of investing in the Fund and to compare these costs with ongoing costs of investing in other mutual funds. The example is based on an investment of $1,000 invested at the beginning of the period and held for the entire period May 1, 2016 through October 31, 2016.
Actual expenses
The table below provides information about actual account values and actual expenses. You may use the information in this table, together with the amount you invested, to estimate the expenses that you paid over the period. Simply divide your account value by $1,000 (for example, an $8,600 account value divided by $1,000 = 8.6), then multiply the result by the number in the table under the heading entitled “Actual Expenses Paid During Period” to estimate the expenses you paid on your account during this period.
Hypothetical example for comparison purposes
The table below also provides information about hypothetical account values and hypothetical expenses based on the Fund’s actual expense ratio and an assumed rate of return of 5% per year before expenses, which is not the Fund’s actual return.
The hypothetical account values and expenses may not be used to estimate the actual ending account balance or expenses you paid for the period. You may use this information to compare the ongoing costs of investing in the Fund and other funds. To do so, compare this 5% hypothetical example with the 5% hypothetical examples that appear in the shareholder reports of the other funds.
Please note that the expenses shown in the table are meant to highlight your ongoing costs only and do not reflect any transaction costs, such as sales charges (loads) on purchase payments or contingent deferred sales charges on redemptions, if any. Therefore, the hypothetical information is useful in comparing ongoing costs only, and will not help you determine the relative total costs of owning different funds. In addition, if these transaction costs were included, your costs would have been higher.
| | | | | | | | | | | | | | | | | | | | | | | | |
| Class | | Beginning
Account Value
(05/01/16) | | | ACTUAL | | | HYPOTHETICAL (5% annual return before
expenses) | | | Annualized
Expense
Ratio2 | |
| | | Ending
Account Value
(10/31/16)1 | | | Expenses
Paid During
Period2,3 | | | Ending
Account Value
(10/31/16) | | | Expenses
Paid During
Period2,4 | | |
| A | | $ | 1,000.00 | | | $ | 989.60 | | | $ | 9.25 | | | $ | 1,015.84 | | | $ | 9.37 | | | | 1.85 | % |
| C | | | 1,000.00 | | | | 986.60 | | | | 12.98 | | | | 1,012.07 | | | | 13.15 | | | | 2.60 | |
| R | | | 1,000.00 | | | | 987.70 | | | | 10.49 | | | | 1,014.58 | | | | 10.63 | | | | 2.10 | |
| Y | | | 1,000.00 | | | | 991.50 | | | | 8.01 | | | | 1,017.09 | | | | 8.11 | | | | 1.60 | |
| R5 | | | 1,000.00 | | | | 990.60 | | | | 8.01 | | | | 1,017.09 | | | | 8.11 | | | | 1.60 | |
| R6 | | | 1,000.00 | | | | 990.60 | | | | 8.01 | | | | 1,017.09 | | | | 8.11 | | | | 1.60 | |
| 1 | The actual ending account value is based on the actual total return of the Fund for the period May 1, 2016 through October 31, 2016, after actual expenses and will differ from the hypothetical ending account value which is based on the Fund’s expense ratio and a hypothetical annual return of 5% before expenses. |
| 2 | Expenses are equal to the Fund’s annualized expense ratio as indicated above multiplied by the average account value over the period, multiplied by 184/366 to reflect the most recent fiscal half year. Effective January 1, 2017, the Fund’s adviser has contractually agreed to waive advisory fees and/or reimburse expenses to the extent necessary to limit total annual fund operating expenses of Class A, Class C, Class R, Class Y, Class R5 and Class R6 shares to 1.59%, 2.34%, 1.84%, 1.34%, 1.34%, and 1.34% of average daily net assets, respectively. The annualized ratios restated as these agreements had been in effect throughout the entire most recent fiscal half year are 1.57%,2.32%, 1.82%, 1.32%, 1.32% and 1.32%, for Class A, Class C, Class R, Class Y, Class R5 and Class R6 shares, respectively. |
| 3 | The actual expenses paid restated as if the changes discussed above had been in effect throughout the entire most recent fiscal half year are $7.85, $11.59, $9.09, $6.61, $6.60 and $6.60 for Class A, Class C, Class R, Class Y, Class R5 and Class R6 shares, respectively. |
| 4 | The hypothetical expenses paid restated as if the changes discussed above had been in effect throughout the entire most recent fiscal half year are $7.96, $11.74, $9.22, $6.70, $6.70 and $6.70 for Class A, Class C, Class R, Class Y, Class R5 and Class R6 shares, respectively. |
28 Invesco Long/Short Equity Fund
Approval of Investment Advisory and Sub-Advisory Contracts
The Board of Trustees (the Board) of AIM Investment Funds (Invesco Investment Funds) is required under the Investment Company Act of 1940, as amended, to approve annually the renewal of Invesco Long/Short Equity Fund’s (the Fund) investment advisory agreements. During contract renewal meetings held on June 7-8, 2016, the Board as a whole, and the disinterested or “independent” Trustees, who comprise over 75% of the Board, voting separately, approved the continuance for the Fund of the Master Investment Advisory Agreement with Invesco Advisers, Inc. (Invesco Advisers and the investment advisory agreement) and the Master Intergroup Sub-Advisory Contract for Mutual Funds with Invesco Asset Management Deutschland GmbH, Invesco Asset Management Limited, Invesco Asset Management (Japan) Limited, Invesco Hong Kong Limited, Invesco Senior Secured Management, Inc., Invesco Canada Ltd. and Invesco PowerShares Capital Management LLC (collectively, the Affiliated Sub-Advisers and the sub-advisory contracts) for another year, effective July 1, 2016.
In evaluating the fairness and reasonableness of compensation under the Fund’s investment advisory agreement and sub-advisory contracts, the Board considered, among other things, the factors discussed below. The Board determined that continuation of the Fund’s investment advisory agreement and the sub-advisory contracts is in the best interest of the Fund and its shareholders and that the compensation payable to Invesco Advisers and the Affiliated Sub-Advisers under the agreements is fair and reasonable.
The Board’s Fund Evaluation Process
The Board’s Investments Committee has established three Sub-Committees, which meet throughout the year to review the performance of funds advised by Invesco Advisers (the Invesco Funds). Over the course of each year, the Sub-Committees meet with portfolio managers for their assigned Invesco Funds and other members of management to review the performance, investment objective(s), policies, strategies, limitations and investment risks of these funds. The Board had the benefit of reports from the Sub-Committees and Investments Committee throughout the year in considering approval of the continuance of each Invesco Fund’s investment advisory agreement and sub-advisory contracts for another year.
During the contract renewal process, the Board receives comparative performance and fee data regarding the Invesco Funds prepared by Invesco Advisers and Broadridge Financial Solution, Inc. (Broadridge), an independent provider of investment company data. The Board also receives an independent written evaluation from the Senior Officer, an officer of the Invesco Funds who reports directly to the
independent Trustees. The Senior Officer’s evaluation is prepared as part of his responsibility to manage the process by which the Invesco Funds’ proposed management fees are negotiated during the annual contract renewal process to ensure they are negotiated in a manner that is at arms’ length and reasonable. In addition to meetings with Invesco Advisers and fund counsel, the independent Trustees also discuss the continuance of the investment advisory agreement and sub-advisory contracts in separate sessions with the Senior Officer and with independent legal counsel.
The Trustees recognized that the advisory fee rates for the Invesco Funds are, in many cases, the result of years of review and negotiation. The Trustees’ deliberations and conclusions in a particular year may be based in part on their deliberations and conclusions regarding these arrangements throughout the year and in prior years. The Trustees’ review and conclusions are based on the comprehensive consideration of all information presented to them and are not the result of any single determinative factor. Moreover, one Trustee may have weighed a particular piece of information or factor differently than another Trustee.
The discussion below is a summary of the Senior Officer’s independent written evaluation with respect to the Fund’s investment advisory agreement as well as a discussion of the material factors and related conclusions that formed the basis for the Board’s approval of the Fund’s investment advisory agreement and sub-advisory contracts. Unless otherwise stated, this information is current as of June 8, 2016, and does not reflect consideration of factors that became known to the Board after that date.
Factors and Conclusions and Summary of Independent Written Fee Evaluation
| A. | Nature, Extent and Quality of Services Provided by Invesco Advisers and the Affiliated Sub-Advisers |
The Board reviewed the advisory services provided to the Fund by Invesco Advisers under the Fund’s investment advisory agreement, the performance of Invesco Advisers in providing these services, and the credentials and experience of the officers and employees of Invesco Advisers who provide these services, including the Fund’s portfolio manager or managers. The Board’s review of the qualifications of Invesco Advisers to provide advisory services included the Board’s consideration of Invesco Advisers’ investment process oversight, independent credit analysis and investment risk management. The Board also considered non-advisory services that Invesco Advisers and its affiliates provide to the Invesco Funds such as various back office support functions, trading operations, internal audit, valuation and legal and compliance.
In determining whether to continue the Fund’s investment advisory agreement, the Board considered the benefits of reapproving an existing relationship and the greater uncertainty that may be associated with entering into a new relationship. The Board concluded that the nature, extent and quality of the services provided to the Fund by Invesco Advisers are appropriate and satisfactory and consistent with the terms of the Fund’s investment advisory agreement.
The Board reviewed the services that may be provided by the Affiliated Sub-Advisers under the sub-advisory contracts and the credentials and experience of the officers and employees of the Affiliated Sub-Advisers who provide these services. The Board noted that the Affiliated Sub-Advisers have offices and personnel that are located in financial centers around the world. As a result, the Board noted that Affiliated Sub-Advisers can provide research and investment analysis on the markets and economies of various countries in which the Fund may invest, make recommendations regarding securities and assist with security trades. The Board concluded that the sub-advisory contracts may benefit the Fund and its shareholders by permitting Invesco Advisers to use the resources and talents of the Affiliated Sub-Advisers in managing the Fund. The Board concluded that the nature, extent and quality of the services that may be provided by the Affiliated Sub-Advisers are appropriate and satisfactory and consistent with the terms of the Fund’s sub-advisory contracts.
The Board considered Fund performance as a relevant factor in considering whether to approve the investment advisory agreement. The Board did not view Fund performance as a relevant factor in considering whether to approve the sub-advisory contracts for the Fund, as no Affiliated Sub-Adviser currently manages assets of the Fund.
The Board compared the Fund’s performance during the past one and two calendar years to the performance of funds in the Broadridge performance universe and against the Lipper Alternative Long/Short Equity Funds Index. The Board noted that performance of Class A shares of the Fund was in the second quintile of its performance universe for the one year period and the first quintile for the two year period (the first quintile being the best performing funds and the fifth quintile being the worst performing funds). The Board noted that performance of Class A shares of the Fund was above the performance of the Index for the one and two year periods. The Trustees also reviewed more recent Fund performance and this review did not change their conclusions.
| C. | Advisory and Sub-Advisory Fees |
The Board compared the Fund’s contractual management fee rate to the contractual
29 Invesco Long/Short Equity Fund
management fee rates of funds in the Fund’s Broadridge expense group at a common asset level. The Board noted that the contractual management fee rate for Class A shares of the Fund was at the median contractual management fee rate of funds in its expense group. The Board noted that the term “contractual management fee” for funds in the expense group may include both advisory and certain administrative services fees, but that Broadridge does not provide information on a fund by fund basis as to what is included. The Board noted that Invesco does not separately charge the Invesco Funds for the administrative services included in the term as defined by Broadridge. The Board also reviewed the methodology used by Broadridge in providing expense group information, which includes using each fund’s contractual fee schedule (including any applicable breakpoints) as reported in the most recent prospectus or statement of information for each fund in the expense group.
The Board noted that Invesco Advisers has contractually agreed to waive fees and/or limit expenses of the Fund through at least February 28, 2017 in an amount necessary to limit total annual operating expenses to a specified percentage of average daily net assets for each class of the Fund.
The Board also compared the Fund’s effective advisory fee rate (the advisory fee rate after advisory fee waivers and before other expense limitations/waivers) to the effective advisory fee rates of other mutual funds advised by Invesco Advisers and its affiliates with investment strategies comparable to those of the Fund, based on asset balances as of December 31, 2015. The Board noted that the Fund’s rate was below the rate of one such mutual fund.
The Board noted that Invesco Advisers and the Affiliated Sub-Advisers do not manage other client accounts with investment strategies comparable to those of the Fund.
The Board also considered the services that may be provided by the Affiliated Sub-Advisers pursuant to the sub-advisory contracts, as well as the fees payable by Invesco Advisers to the Affiliated Sub-Advisers pursuant to the sub-advisory contracts. The Board also noted that the sub-advisory fees are not paid directly by the Fund, but rather, are payable by Invesco Advisers to the Affiliated Sub-Advisers.
| D. | Economies of Scale and Breakpoints |
The Board considered the extent to which there are economies of scale in the provision of advisory services to the Fund. The Board also considered whether the Fund benefits from economies of scale through contractual breakpoints in the Fund’s advisory fee schedule. The Board also noted that the Fund shares directly in economies of scale through lower fees charged by third party service providers based on the combined size of the Invesco Funds and other clients advised by Invesco Advisers.
| E. | Profitability and Financial Resources |
The Board reviewed information from Invesco Advisers concerning the costs of the advisory and other services that Invesco Advisers and its affiliates provide to the Fund and the Invesco Funds and the profitability of Invesco Advisers and its affiliates in providing these services. The Board received information from Invesco Advisers and a report from an independent consultant engaged by the Senior Officer about the methodology used to prepare the profitability information. The Board noted that Invesco Advisers continues to operate at a net profit from services Invesco Advisers and its affiliates provide to the Invesco Funds. The Board noted that although Invesco Advisers received a minimal amount of revenues from advising the Fund, Invesco Advisers and its subsidiaries did not make a profit from managing the Fund. The Board received and accepted information from Invesco Advisers demonstrating that Invesco Advisers and each Affiliated Sub-Adviser are financially sound and have the resources necessary to perform their obligations under the investment advisory agreement and sub-advisory contracts.
| F. | Collateral Benefits to Invesco Advisers and its Affiliates |
The Board considered various other benefits received by Invesco Advisers and its affiliates from the relationship with the Fund, including the fees received for providing transfer agency and distribution services to the Fund. The Board considered comparative information regarding fees charged for these services, including information provided by Broadridge and other independent sources. The Board considered the performance of Invesco Advisers and its affiliates in providing these services and the organizational structure employed to provide these services. The Board also considered that these services are provided to the Fund pursuant to written contracts that are reviewed and approved on an annual basis by the Board; and that the services are required for the operation of the Fund.
The Board considered the benefits realized by Invesco Advisers and the Affiliated Sub-Advisers as a result of portfolio brokerage transactions executed through “soft dollar” arrangements. The Board noted that soft dollar arrangements shift the payment obligation for research services from Invesco Advisers and the Affiliated Sub-Advisers to the Invesco Funds and that the research received may be used with other clients of Invesco Advisers and may reduce Invesco Advisers’ and the Affiliated Sub-Advisers’ expenses. The Board also considered that it receives periodic reports from the Chief Compliance Officer of the Invesco Funds demonstrating that these arrangements are consistent with regulatory requirements. The Board did not deem the soft dollar arrangements to be inappropriate.
The Board considered that the Fund’s uninvested cash and cash collateral from any securities lending arrangements may be invested in money market funds advised by
Invesco Advisers pursuant to procedures approved by the Board. The Board noted that Invesco Advisers receives advisory fees from these affiliated money market funds attributable to such investments, although Invesco Advisers has contractually agreed to waive through varying periods the advisory fees payable by the Invesco Funds with respect to certain investments in the affiliated money market funds. The waiver is in an amount equal to 100% of the net advisory fee Invesco Advisers receives from the affiliated money market funds with respect to the Fund’s investment in the affiliated money market funds of uninvested cash, but not cash collateral. The Board concluded that the amount of advisory fees received by Invesco Advisors from the Fund’s investment of cash collateral from any securities lending arrangements in the affiliated money market funds is fair and reasonable.
The Board also considered the Fund may use an affiliated broker to execute certain trades for the Fund to, among other things, control information leakage, and were advised that such trades would be executed in compliance with rules under the Investment Company Act of 1940, as amended, and consistent with best execution obligations.
30 Invesco Long/Short Equity Fund
Tax Information
Form 1099-DIV, Form 1042-S and other year-end tax information provide shareholders with actual calendar year amounts that should be included in their tax returns. Shareholders should consult their tax advisors.
The following distribution information is being provided as required by the Internal Revenue Code or to meet a specific state’s requirement.
The Fund designates the following amounts or, if subsequently determined to be different, the maximum amount allowable for its fiscal year ended October 31, 2016:
| | | | |
Federal and State Income Tax | |
Long-Term Capital Gain Distributions | | $ | 168,568 | |
Qualified Dividend Income* | | | 37.87 | % |
Corporate Dividends Received Deduction* | | | 33.48 | % |
U.S. Treasury Obligations* | | | 0 | % |
| | * | The above percentages are based on ordinary income dividends paid to shareholders during the Fund’s fiscal year. |
31 Invesco Long/Short Equity Fund
Trustees and Officers
The address of each trustee and officer is AIM Investment Funds (Invesco Investment Funds) (the “Trust”), 11 Greenway Plaza, Suite 1000, Houston, Texas 77046-1173. The trustees serve for the life of the Trust, subject to their earlier death, incapacitation, resignation, retirement or removal as more specifically provided in the Trust’s organizational documents. Each officer serves for a one year term or until their successors are elected and qualified. Column two below includes length of time served with predecessor entities, if any.
| | | | | | | | |
Name, Year of Birth and
Position(s) Held with the Trust | | Trustee and/
or Officer Since | | Principal Occupation(s)
During Past 5 Years | | Number of
Funds in Fund
Complex
Overseen by
Trustee | | Other Directorship(s)
Held by Trustee During
Past 5 Years |
| Interested Persons | | | | | | | | |
| Martin L. Flanagan1 — 1960 Trustee | | 2007 | | Executive Director, Chief Executive Officer and President, Invesco Ltd. (ultimate parent of Invesco and a global investment management firm); Advisor to the Board, Invesco Advisers, Inc. (formerly known as Invesco Institutional (N.A.), Inc.); Trustee, The Invesco Funds; Vice Chair, Investment Company Institute; and Member of Executive Board, SMU Cox School of Business Formerly: Chairman and Chief Executive Officer, Invesco Advisers, Inc. (registered investment adviser); Director, Chairman, Chief Executive Officer and President, Invesco Holding Company (US) Inc. (formerly IVZ Inc.) (holding company), Invesco Group Services, Inc. (service provider) and Invesco North American Holdings, Inc. (holding company); Director, Chief Executive Officer and President, Invesco Holding Company Limited (parent of Invesco and a global investment management firm); Director, Invesco Ltd.; Chairman, Investment Company Institute and President, Co-Chief Executive Officer, Co-President, Chief Operating Officer and Chief Financial Officer, Franklin Resources, Inc. (global investment management organization) | | 146 | | None |
| Philip A. Taylor2 — 1954 Trustee and Senior Vice President | | 2006 | | Head of the Americas and Senior Managing Director, Invesco Ltd.; Director, Co-Chairman, Co-President and Co-Chief Executive Officer, Invesco Advisers, Inc. (formerly known as Invesco Institutional (N.A.), Inc.) (registered investment adviser); Director, Chairman, Chief Executive Officer and President, Invesco Management Group, Inc. (formerly known as Invesco AIM Management Group, Inc.) (financial services holding company); Director and Chairman, Invesco Investment Services, Inc. (formerly known as Invesco AIM Investment Services, Inc.) (registered transfer agent) Chief Executive Officer, Invesco Corporate Class Inc. (corporate mutual fund company) Director, Chairman and Chief Executive Officer, Invesco Canada Ltd. (formerly known as Invesco Trimark Ltd./Invesco Trimark Ltèe) (registered investment adviser and registered transfer agent); Trustee and Senior Vice President, The Invesco Funds; Director, Invesco Investment Advisers LLC (formerly known as Van Kampen Asset Management). Formerly: Director, Chief Executive Officer and President, Van Kampen Exchange Corp.; President and Principal Executive Officer, The Invesco Funds (other than AIM Treasurer’s Series Trust (Invesco Treasurer’s Series Trust), Short-Term Investments Trust and Invesco Management Trust); Executive Vice President, The Invesco Funds (AIM Treasurer’s Series Trust (Invesco Treasurer’s Series Trust), Short-Term Investments Trust and Invesco Management Trust only); Director and President, INVESCO Funds Group, Inc. (registered investment adviser and registered transfer agent); Director and Chairman, IVZ Distributors, Inc. (formerly known as INVESCO Distributors, Inc.) (registered broker dealer); Director, President and Chairman, Invesco Inc. (holding company), Invesco Canada Holdings Inc. (holding company), Trimark Investments Ltd./Placements Trimark Ltèe and Invesco Financial Services Ltd/Services Financiers Invesco Ltèe; Chief Executive Officer, Invesco Canada Fund Inc. (corporate mutual fund company); Director and Chairman, Van Kampen Investor Services Inc.; Director, Chief Executive Officer and President, 1371 Preferred Inc. (holding company) and Van Kampen Investments Inc.; Director and President, AIM GP Canada Inc. (general partner for limited partnerships) and Van Kampen Advisors, Inc.; Director and Chief Executive Officer, Invesco Trimark Dealer Inc. (registered broker dealer); Director, Invesco Distributors, Inc. (formerly known as Invesco AIM Distributors, Inc.) (registered broker dealer); Manager, Invesco PowerShares Capital Management LLC; Director, Chief Executive Officer and President, Invesco Advisers, Inc.; Director, Chairman, Chief Executive Officer and President, Invesco AIM Capital Management, Inc.; President, Invesco Trimark Dealer Inc. and Invesco Trimark Ltd./Invesco Trimark Ltèe; Director and President, AIM Trimark Corporate Class Inc. and AIM Trimark Canada Fund Inc.; Senior Managing Director, Invesco Holding Company Limited; Director and Chairman, Fund Management Company (former registered broker dealer); President and Principal Executive Officer, The Invesco Funds (AIM Treasurer’s Series Trust (Invesco Treasurer’s Series Trust), and Short-Term Investments Trust only); President, AIM Trimark Global Fund Inc. and AIM Trimark Canada Fund Inc. | | 146 | | None |
| 1 | Mr. Flanagan is considered an interested person (within the meaning of Section 2(a)(19) of the 1940 Act) of the Trust because he is an officer of the Adviser to the Trust, and an officer and a director of Invesco Ltd., ultimate parent of the Adviser. |
| 2 | Mr. Taylor is considered an interested person (within the meaning of Section 2(a)(19) of the 1940 Act) of the Trust because he is an officer and a director of the Adviser. |
T-1 Invesco Long/Short Equity Fund
Trustees and Officers—(continued)
| | | | | | | | |
Name, Year of Birth and
Position(s) Held with the Trust | | Trustee and/
or Officer Since | | Principal Occupation(s) During Past 5 Years | | Number of
Funds in Fund
Complex
Overseen by
Trustee | | Other Directorship(s)
Held by Trustee During
Past 5 Years |
| Independent Trustees | | | | | | | | |
Bruce L. Crockett — 1944 Trustee and Chair | | 2001 | | Chairman, Crockett Technologies Associates (technology consulting company) Formerly: Director, Captaris (unified messaging provider); Director, President and Chief Executive Officer, COMSAT Corporation; Chairman, Board of Governors of INTELSAT (international communications company); ACE Limited (insurance company); Independent Directors Council and Investment Company Institute | | 146 | | ALPS (Attorneys Liability Protection Society) (insurance company) and Globe Specialty Metals, Inc. (metallurgical company); Member of the Audit Committee, Ferroglobe PLC and Investment Company Institute; Member of the Executive Committee and Chair of the Governance Committee, Independent Directors Council |
David C. Arch — 1945 Trustee | | 2010 | | Chairman of Blistex Inc., a consumer health care products manufacturer | | 146 | | Board member of the Illinois Manufacturers’ Association; Member of the Board of Visitors, Institute for the Humanities, University of Michigan |
James T. Bunch — 1942 Trustee | | 2003 | | Managing Member, Grumman Hill Group LLC (family office/private equity investments) Formerly: Chairman of the Board, Denver Film Society, Chairman of the Board of Trustees, Evans Scholarship Foundation; Chairman, Board of Governors, Western Golf Association | | 146 | | Trustee, Evans Scholarship Foundation |
Albert R. Dowden — 1941 Trustee | | 2001 | | Director of a number of public and private business corporations, including Nature’s Sunshine Products, Inc. Formerly: Director, The Boss Group, Ltd. and Reich & Tang Funds (5 portfolios) (registered investment company); Director, Homeowners of America Holding Corporation/Homeowners of America Insurance Company (property casualty company); Director, Continental Energy Services, LLC (oil and gas pipeline service); Director, CompuDyne Corporation (provider of product and services to the public security market) and Director, Annuity and Life Re (Holdings), Ltd. (reinsurance company); Director, President and Chief Executive Officer, Volvo Group North America, Inc.; Senior Vice President, AB Volvo; Director of various public and private corporations; Chairman, DHJ Media, Inc.; Director, Magellan Insurance Company; and Director, The Hertz Corporation, Genmar Corporation (boat manufacturer), National Media Corporation; Advisory Board of Rotary Power International (designer, manufacturer, and seller of rotary power engines); and Chairman, Cortland Trust, Inc. (registered investment company) | | 146 | | Director of Nature’s Sunshine Products, Inc. |
Jack M. Fields — 1952 Trustee | | 2001 | | Chief Executive Officer, Twenty First Century Group, Inc. (government affairs company); and Discovery Learning Alliance (non-profit) Formerly: Owner and Chief Executive Officer, Dos Angeles Ranch L.P. (cattle, hunting, corporate entertainment); Director, Insperity, Inc. (formerly known as Administaff); Chief Executive Officer, Texana Timber LP (sustainable forestry company); Director of Cross Timbers Quail Research Ranch (non-profit); and member of the U.S. House of Representatives | | 146 | | None |
Eli Jones — 1961 Trustee | | 2016 | | Professor and Dean, Mays Business School — Texas A&M University Formerly: Professor and Dean, Walton College of Business, University of Arkansas and E.J. Ourso College of Business, Louisiana State University and Director, Arvest Bank | | 146 | | Director of Insperity, Inc. (formerly known as Administaff) |
Prema Mathai-Davis — 1950 Trustee | | 2001 | | Retired. Formerly: Chief Executive Officer, YWCA of the U.S.A. | | 146 | | None |
Larry Soll — 1942 Trustee | | 2003 | | Retired. Formerly: Chairman, Chief Executive Officer and President, Synergen Corp. (a biotechnology company) | | 146 | | None |
Raymond Stickel, Jr. — 1944 Trustee | | 2005 | | Retired. Formerly: Director, Mainstay VP Series Funds, Inc. (25 portfolios) and Partner, Deloitte & Touche | | 146 | | None |
Robert C. Troccoli — 1949 Trustee | | 2016 | | Adjunct Professor, University of Denver — Daniels College of Business Formerly: Senior Partner, KPMG LLP | | 146 | | None |
T-2 Invesco Long/Short Equity Fund
Trustees and Officers—(continued)
| | | | | | | | |
Name, Year of Birth and
Position(s) Held with the Trust | | Trustee and/
or Officer Since | | Principal Occupation(s) During Past 5 Years | | Number of
Funds in Fund
Complex
Overseen by
Trustee | | Other Directorship(s)
Held by Trustee During
Past 5 Years |
| Independent Trustees—(continued) |
Suzanne H. Woolsey — 1941 Trustee | | 2014 | | Retired. Formerly: Chief Executive Officer of Woolsey Partners LLC | | 146 | | Director, SunShare LLC; Trustee, Ocean Conservancy; Emeritus Chair of the Board of Trustees of the Institute for Defense Analyses and of Colorado College; Trustee, Chair, Business and Finance Committee of California Institute of Technology; Prior to 2014, Director of Fluor Corp.; Prior to 2010, Trustee of the German Marshall Fund of the United States; Prior to 2010, Trustee of the Rocky Mountain Institute |
| Other Officers | | | | | | | | |
Sheri Morris — 1964 President, Principal Executive Officer and Treasurer | | 1999 | | President, Principal Executive Officer and Treasurer, The Invesco Funds; Vice President, Invesco Advisers, Inc. (formerly known as Invesco Institutional (N.A.), Inc.) (registered investment adviser); and Vice President, PowerShares Exchange-Traded Fund Trust, PowerShares Exchange-Traded Fund Trust II, PowerShares India Exchange-Traded Fund Trust, PowerShares Actively Managed Exchange-Traded Fund Trust, and PowerShares Actively Managed Exchange-Traded Commodity Fund Trust Formerly: Vice President and Principal Financial Officer, The Invesco Funds; Vice President, Invesco AIM Advisers, Inc., Invesco AIM Capital Management, Inc. and Invesco AIM Private Asset Management, Inc.; Assistant Vice President and Assistant Treasurer, The Invesco Funds and Assistant Vice President, Invesco Advisers, Inc., Invesco AIM Capital Management, Inc. and Invesco AIM Private Asset Management, Inc.; and Treasurer, PowerShares Exchange-Traded Fund Trust, PowerShares Exchange-Traded Fund Trust II, PowerShares India Exchange-Traded Fund Trust and PowerShares Actively Managed Exchange-Traded Fund Trust | | N/A | | N/A |
Russell C. Burk — 1958 Senior Vice President and Senior Officer | | 2005 | | Senior Vice President and Senior Officer, The Invesco Funds | | N/A | | N/A |
John M. Zerr — 1962 Senior Vice President, Chief Legal Officer and Secretary | | 2006 | | Director, Senior Vice President, Secretary and General Counsel, Invesco Management Group, Inc. (formerly known as Invesco AIM Management Group, Inc.; Senior Vice President, Invesco Advisers, Inc. (formerly known as Invesco Institutional (N.A.), Inc.) (registered investment adviser); Senior Vice President and Secretary, Invesco Distributors, Inc. (formerly known as Invesco AIM Distributors, Inc.); Director, Vice President and Secretary, Invesco Investment Services, Inc. (formerly known as Invesco AIM Investment Services, Inc.) Senior Vice President, Chief Legal Officer and Secretary, The Invesco Funds; Managing Director, Invesco PowerShares Capital Management LLC; Director, Secretary and General Counsel, Invesco Investment Advisers LLC (formerly known as Van Kampen Asset Management); Secretary and General Counsel, Invesco Capital Markets, Inc. (formerly known as Van Kampen Funds Inc.) and Chief Legal Officer, PowerShares Exchange-Traded Fund Trust, PowerShares Exchange-Traded Fund Trust II, PowerShares India Exchange-Traded Fund Trust, PowerShares Actively Managed Exchange-Traded Fund Trust, and PowerShares Actively Managed Exchange-Traded Commodity Fund Trust Formerly: Director, Secretary, General Counsel and Senior Vice President, Van Kampen Exchange Corp.; Director, Vice President and Secretary, IVZ Distributors, Inc. (formerly known as INVESCO Distributors, Inc.); Director and Vice President, INVESCO Funds Group, Inc.; Director and Vice President, Van Kampen Advisors Inc.; Director, Vice President, Secretary and General Counsel, Van Kampen Investor Services Inc.; Director, Invesco Distributors, Inc. (formerly known as Invesco AIM Distributors, Inc.); Director, Senior Vice President, General Counsel and Secretary, Invesco AIM Advisers, Inc. and Van Kampen Investments Inc.; Director, Vice President and Secretary, Fund Management Company; Director, Senior Vice President, Secretary, General Counsel and Vice President, Invesco AIM Capital Management, Inc.; Chief Operating Officer and General Counsel, Liberty Ridge Capital, Inc. (an investment adviser); Vice President and Secretary, PBHG Funds (an investment company) and PBHG Insurance Series Fund (an investment company); Chief Operating Officer, General Counsel and Secretary, Old Mutual Investment Partners (a broker-dealer); General Counsel and Secretary, Old Mutual Fund Services (an administrator) and Old Mutual Shareholder Services (a shareholder servicing center); Executive Vice President, General Counsel and Secretary, Old Mutual Capital, Inc. (an investment adviser); and Vice President and Secretary, Old Mutual Advisors Funds (an investment company) | | N/A | | N/A |
T-3 Invesco Long/Short Equity Fund
Trustees and Officers—(continued)
| | | | | | | | |
Name, Year of Birth and
Position(s) Held with the Trust | | Trustee and/
or Officer Since | | Principal Occupation(s) During Past 5 Years | | Number of
Funds in Fund
Complex
Overseen by
Trustee | | Other Directorship(s)
Held by Trustee During
Past 5 Years |
| Other Officers—(continued) | | | | | | | | |
| Karen Dunn Kelley — 1960 Senior Vice President | | 2004 | | Senior Managing Director, Investments, Invesco Ltd.; Director, Co-President, Co-Chief Executive Officer, and Co-Chairman, Invesco Advisers, Inc. (formerly known as Invesco Institutional (N.A.), Inc.) (registered investment adviser); Chairman and Director, Invesco Senior Secured Management, Inc.; Senior Vice President, Invesco Management Group, Inc. (formerly known as Invesco AIM Management Group, Inc.); Executive Vice President, Invesco Distributors, Inc. (formerly known as Invesco AIM Distributors, Inc.); Director, Invesco Mortgage Capital Inc. and Invesco Management Company Limited; Senior Vice President, The Invesco Funds Formerly: Vice President, The Invesco Funds (other than AIM Treasurer’s Series Trust (Invesco Treasurer’s Series Trust), Short-Term Investments Trust and Invesco Management Trust); and President and Principal Executive Officer, The Invesco Funds (AIM Treasurer’s Series Trust (Invesco Treasurer’s Series Trust), Short-Term Investments Trust and Invesco Management Trust only); Director and President, INVESCO Asset Management (Bermuda) Ltd., Director, INVESCO Global Asset Management DAC (formerly known as INVESCO Global Asset Management Limited) and INVESCO Management S.A.; Senior Vice President, Van Kampen Investments Inc. and Invesco Advisers, Inc. (formerly known as Invesco Institutional (N.A.), Inc.) (registered investment adviser); Director and President, Fund Management Company; Chief Cash Management Officer, Director of Cash Management, Senior Vice President, and Managing Director, Invesco AIM Capital Management, Inc.; Director of Cash Management, Senior Vice President, and Vice President, Invesco Advisers, Inc. and Vice President, The Invesco Funds (AIM Treasurer’s Series Trust (Invesco Treasurer’s Series Trust), and Short-Term Investments Trust only) | | N/A | | N/A |
Kelli Gallegos — 1970 Vice President, Principal Financial Officer and Assistant Treasurer | | 2008 | | Vice President, Principal Financial Officer and Assistant Treasurer, The Invesco Funds; Assistant Treasurer, Invesco PowerShares Capital Management LLC, PowerShares Exchange-Traded Fund Trust, PowerShares Exchange-Traded Fund Trust II, PowerShares India Exchange-Traded Fund Trust, PowerShares Actively Managed Exchange-Traded Fund Trust, and PowerShares Actively Managed Exchange-Traded Commodity Fund Trust Formerly: Assistant Vice President, The Invesco Funds | | N/A | | N/A |
Tracy Sullivan — 1962 Vice President, Chief Tax Officer and Assistant Treasurer | | 2008 | | Vice President, Chief Tax Officer and Assistant Treasurer, The Invesco Funds; Assistant Treasurer, Invesco PowerShares Capital Management LLC, PowerShares Exchange-Traded Fund Trust, PowerShares Exchange-Traded Fund Trust II, PowerShares India Exchange-Traded Fund Trust, PowerShares Actively Managed Exchange-Traded Fund Trust, and PowerShares Actively Managed Exchange-Traded Commodity Fund Trust Formerly: Assistant Vice President, The Invesco Funds | | N/A | | N/A |
Crissie M. Wisdom — 1969 Anti-Money Laundering Compliance Officer | | 2013 | | Anti-Money Laundering Compliance Officer, Invesco Advisers, Inc. (formerly known as Invesco Institutional (N.A.), Inc.) (registered investment adviser), Invesco Capital Markets, Inc. (formerly known as Van Kampen Funds Inc.), Invesco Distributors, Inc., Invesco Investment Services, Inc., Invesco Management Group, Inc., The Invesco Funds, and PowerShares Exchange-Traded Fund Trust, PowerShares Exchange-Traded Fund Trust II, PowerShares India Exchange-Traded Fund Trust, PowerShares Actively Managed Exchange-Traded Fund Trust and PowerShares Actively Managed Exchange-Traded Commodity Fund Trust; Anti-Money Laundering Compliance Officer and Bank Secrecy Act Officer, INVESCO National Trust Company and Invesco Trust Company; and Fraud Prevention Manager and Controls and Risk Analysis Manager for Invesco Investment Services, Inc. Formerly: Anti-Money Laundering Compliance Officer, Van Kampen Exchange Corp. | | N/A | | N/A |
Robert R. Leveille — 1969 Chief Compliance Officer | | 2016 | | Chief Compliance Officer, Invesco Advisers, Inc. (registered investment adviser); and Chief Compliance Officer, The Invesco Funds Formerly: Chief Compliance Officer, Putnam Investments and the Putnam Funds | | N/A | | N/A |
The Statement of Additional Information of the Trust includes additional information about the Fund’s Trustees and is available upon request, without charge, by calling 1.800.959.4246. Please refer to the Fund’s Statement of Additional Information for information on the Fund’s sub-advisers.
| | | | | | |
Office of the Fund 11 Greenway Plaza, Suite 1000 Houston, TX 77046-1173 | | Investment Adviser Invesco Advisers, Inc. 1555 Peachtree Street, N.E. Atlanta, GA 30309 | | Distributor Invesco Distributors, Inc. 11 Greenway Plaza, Suite 1000 Houston, TX 77046-1173 | | Auditors PricewaterhouseCoopers LLP 1000 Louisiana Street, Suite 5800 Houston, TX 77002-5678 |
| | | |
| | | | | | |
Counsel to the Fund Stradley Ronon Stevens & Young, LLP 2005 Market Street, Suite 2600 Philadelphia, PA 19103-7018 | | Counsel to the Independent Trustees Goodwin Procter LLP 901 New York Avenue, N.W. Washington, D.C. 20001 | | Transfer Agent Invesco Investment Services, Inc. 11 Greenway Plaza, Suite 1000 Houston, TX 77046-1173 | | Custodian State Street Bank and Trust Company 225 Franklin Street Boston, MA 02110-2801 |
T-4 Invesco Long/Short Equity Fund
Explore High-Conviction Investing with Invesco

Invesco mailing information
Send general correspondence to Invesco Investment Services, Inc., P.O. Box 219078, Kansas City, MO 64121-9078.
Important notice regarding delivery of security holder documents
To reduce Fund expenses, only one copy of most shareholder documents may be mailed to shareholders with multiple accounts at the same address (Householding). Mailing of your shareholder documents may be householded indefinitely unless you instruct us otherwise. If you do not want the mailing of these documents to be combined with those for other members of your household, please contact Invesco Investment Services, Inc. at 800 959 4246 or contact your financial institution. We will begin sending you individual copies for each account within 30 days after receiving your request.
Fund holdings and proxy voting information
The Fund provides a complete list of its holdings four times in each fiscal year, at the quarter ends. For the second and fourth quarters, the lists appear in the Fund’s semiannual and annual reports to shareholders. For the first and third quarters, the Fund files the lists with the Securities and Exchange Commission (SEC) on Form N-Q. The most recent list of portfolio holdings is available at invesco.com/completeqtrholdings. Shareholders can also look up the Fund’s Forms N-Q on the SEC website at sec.gov. Copies of the Fund’s Forms N-Q may be reviewed and copied at the SEC Public Reference Room in Washington, D.C. You can obtain information on the operation of the Public Reference Room, including information about duplicating fee charges, by calling 202 551 8090 or 800 732 0330, or by electronic request at the following email address: publicinfo@sec.gov. The SEC file numbers for the Fund are shown below.
A description of the policies and procedures that the Fund uses to determine how to vote proxies relating to portfolio securities is available without charge, upon request, from our Client Services department at 800 959 4246 or at invesco.com/proxyguidelines. The information is also available on the SEC website, sec.gov.
| | |
Information regarding how the Fund voted proxies related to its portfolio securities during the most recent 12-month period ended June 30 is available at invesco.com/proxysearch. The information is also available on the SEC website, sec.gov. Invesco Advisers, Inc. is an investment adviser; it provides investment advisory services to individual and institutional clients and does not sell securities. Invesco Distributors, Inc. is the US distributor for Invesco Ltd.’s retail mutual funds, exchange-traded funds and institutional money market funds. Both are wholly owned, indirect subsidiaries of Invesco Ltd. | |  |
| | | | |
| SEC file numbers: 811-05426 and 033-19338 | | LSE-AR-1 | | Invesco Distributors, Inc. |
| | | | |
| | |
 | | Annual Report to Shareholders | | October 31, 2016 |
| | |
| | Invesco Low Volatility Emerging Markets Fund |
| | Nasdaq: |
| | A: LVLAX ∎ C: LVLCX ∎ R: LVLRX ∎ Y: LVLYX ∎ R5: LVLFX ∎ R6: LVLSX |

Letters to Shareholders
| | |

Philip Taylor | | Dear Shareholders: This annual report includes information about your Fund, including performance data and a complete list of its investments as of the close of the reporting period. Inside is a discussion of how your Fund was managed and the factors that affected its performance during the reporting period. In December 2015, the US Federal Reserve raised short-term interest rates for the first time since 2006, signaling its belief that the economy was likely to continue strengthening. Indeed, throughout the reporting period, US economic data were generally positive and the economy expanded at a moderate rate – but there were some bumps along the road. Job growth in May 2016 was very weak, but it was followed by strong increases in nonfarm payrolls in June and July. Increased concerns about global economic weakness caused US stock market indexes |
| to sink at the start of calendar year 2016, but they eventually recovered; they sank again following the UK’s decision to leave the European Union, but then quickly recovered and reached record highs later in the summer. Strong demand for income-producing investments, particularly those perceived to be lower risk, benefited bonds as well as dividend-paying stocks for much of the reporting period. While economic news in the US was generally positive, news overseas was less upbeat. The European Central Bank, and central banks in China and Japan – as well as other countries – maintained extraordinarily accommodative monetary policies in response to economic weakness. As the fiscal year drew to a close, uncertainty about the outcome of the US presidential election resulted in increased market volatility; the surprise outcome after the close of the reporting period suggested that market volatility may continue for some time to come. |
Short-term market volatility can prompt some investors to abandon their investment plans – and can cause others to settle for average results. The investment professionals at Invesco, in contrast, invest with high conviction, take a long-term perspective and have a passion to exceed. Invesco’s pure focus on investment management eliminates possible distractions and means that there are no competing lines of business for us to support. Just as important, we embrace a variety of investment strategies, asset classes and geographies – because we know that no single investment approach meets the diverse needs of all of our clients. We manage all our investment approaches with a passion to exceed. All our investment teams have a highly disciplined, long-term investing style that eliminates short-term decision-making. Of course, investing with high conviction can’t guarantee a profit or ensure success; no investment strategy can. To learn more about how we invest with high conviction, visit invesco.com/HighConviction.
You, too, can invest with high conviction by maintaining a long-term investment perspective and by working with your financial adviser on a regular basis. During periods of short-term market volatility or uncertainty, your financial adviser can keep you focused on your long-term investment goals – a new home, a child’s college education or a secure retirement. He or she also can share research about the economy, the markets and individual investment options.
Visit our website for more information on your investments
Our website, invesco.com/us, offers a wide range of market insights and investment perspectives. On the website, you’ll find detailed information about our funds, including performance, holdings and portfolio manager commentaries. You can access information about your account by completing a simple, secure online registration. Click on the “Need to register” link in the “Account Access” box on our homepage to get started.
In addition to the resources accessible on our website and through our mobile app, you can obtain timely updates to help you stay informed about the markets, the economy and investing by connecting with Invesco on Twitter, LinkedIn or Facebook. You can access our blog at blog.invesco.us.com. Our goal is to provide you the information you want, when and where you want it.
Finally, I’m pleased to share with you Invesco’s commitment to both the Principles for Responsible Investment and to considering environmental, social and governance issues in our robust investment process. I invite you to learn more at invesco.com/esg.
Have questions?
For questions about your account, contact an Invesco client services representative at 800 959 4246. For Invesco-related questions or comments, please email me directly at phil@invesco.com.
All of us at Invesco look forward to serving your investment management needs. Thank you for investing with us.
Sincerely,

Philip Taylor
Senior Managing Director, Invesco Ltd.
2 �� Invesco Low Volatility Emerging Markets Fund
| | |

Bruce Crockett | | Dear Fellow Shareholders: Among the many important lessons I’ve learned in more than 40 years in a variety of business endeavors is the value of a trusted advocate. As independent chair of the Invesco Funds Board, I can assure you that the members of the Board are strong advocates for the interests of investors in Invesco’s mutual funds. We work hard to represent your interests through oversight of the quality of the investment management services your funds receive and other matters important to your investment, including but not limited to: ∎ Ensuring that Invesco offers a diverse lineup of mutual funds that your financial adviser can use to strive to meet your financial needs as your investment goals change over time. ∎ Monitoring how the portfolio management teams of the Invesco funds are performing in light of changing economic and market conditions. |
| ∎ | | Assessing each portfolio management team’s investment performance within the context of the investment strategy described in the fund’s prospectus. |
| ∎ | | Monitoring for potential conflicts of interests that may impact the nature of the services that your funds receive. |
We believe one of the most important services we provide our fund shareholders is the annual review of the funds’ advisory and sub-advisory contracts with Invesco Advisers and its affiliates. This review is required by the Investment Company Act of 1940 and focuses on the nature and quality of the services Invesco provides as the adviser to the Invesco funds and the reasonableness of the fees that it charges for those services. Each year, we spend months carefully reviewing information received from Invesco and a variety of independent sources, such as performance and fee data prepared by Lipper Inc., an independent, third-party firm widely recognized as a leader in its field. We also meet with our independent legal counsel and other independent advisers to review and help us assess the information that we have received. Our goal is to assure that you receive quality investment management services for a reasonable fee.
I trust the measures outlined above provide assurance that you have a worthy advocate when it comes to choosing the Invesco Funds.
As always, please contact me at bruce@brucecrockett.com with any questions or concerns you may have. On behalf of the Board, we look forward to continuing to represent your interests and serving your needs.
Sincerely,

Bruce L. Crockett
Independent Chair
Invesco Funds Board of Trustees
3 Invesco Low Volatility Emerging Markets Fund
Management’s Discussion of Fund Performance
| | | | |
Performance summary For the fiscal year ended October 31, 2016, Class A shares of Invesco Low Volatility Emerging Markets Fund (the Fund), at net asset value (NAV), underperformed the Fund’s style-specific benchmark, the MSCI Emerging Markets Index. Your Fund’s long-term performance appears later in this report. | |
Fund vs. Indexes Total returns, 10/31/15 to 10/31/16, at net asset value (NAV). Performance shown does not include applicable contingent deferred sales charges (CDSC) or front-end sales charges, which would have reduced performance. | |
Class A Shares | | | 7.98 | % |
Class C Shares | | | 7.08 | |
Class R Shares | | | 7.68 | |
Class Y Shares | | | 8.25 | |
Class R5 Shares | | | 8.25 | |
Class R6 Shares | | | 8.12 | |
MSCI All Country World Indexq (Broad Market Index) | | | 2.05 | |
MSCI Emerging Markets Indexq (Style-Specific Index) | | | 9.27 | |
Lipper Emerging Market Funds Index∎ (Peer Group Index) | | | 11.25 | |
Source(s): qFactSet Research Systems Inc.; ∎Lipper Inc. | | | | |
Market conditions and your Fund
The global economy continued to expand, albeit slowly, for the fiscal year ended October 31, 2016. However, that growth became increasingly uneven across developed and emerging economies, amid continued volatility in oil prices and as the policies of central banks globally began to diverge.
An equity market rally in November 2015 was offset by negative performance in December, as a late-year crash in oil prices rattled the markets. Also in December, the US Federal Reserve (the Fed) followed through on its commitment to normalize monetary policy by raising interest rates – its first increase since 2006 – even as the European Central Bank extended its asset purchase program and Japan introduced additional quantitative easing and negative interest rates.
Stocks began calendar year 2016 on a negative note, driven by investor concerns about economic weakness in China and falling oil prices. Markets recovered in
late February and posted gains amid concerted central bank commitments to very loose monetary policy. As a result, the US dollar fell sharply against the euro and Japanese yen, a development that was largely supportive of oil and stock prices.
All major global stock indexes experienced steep declines again in June after Britain unexpectedly voted to leave the European Union. The resulting sharp sell-off in stocks hit economically sensitive stocks, like energy and financials, the hardest, and investors flocked to the perceived safety of US Treasuries and defensive equities often found in the consumer staples and utilities sectors.
After the initial shock of the Brexit vote, stocks made a strong recovery, regaining most of the losses as fears of a sharp shock to consumer confidence never materialized. For the remainder of the reporting period, emerging markets outperformed as the Fed left interest rates unchanged and expectations for an interest rate increase were delayed again.
The Fund seeks to provide long-term growth of capital while achieving a lower volatility level than its style-specific benchmark. The Fund seeks to accomplish long-term capital growth through stock selection using a proprietary multi-factor model based on fundamental and behavioral factors to forecast individual security returns and risk and rank companies relative to peers within their respective countries and sectors. The multi-factor model forecasts a return for each stock in the investable universe and is based on four concepts: Earnings Expectations, Market Sentiment, Management and Quality, and Value.1
For the reporting period, stock selection in the utilities, consumer discretionary, materials and telecommunication services sectors contributed to the Fund’s performance relative to its style-specific benchmark, but it was not enough to offset losses from stock selection in the financials, information technology (IT) and consumer staples sectors. From a geographic perspective, underweight allocation in China and overweight allocation in Brazil added the most value to Fund performance, as did stock selection in India. Stock selection in Taiwan, Russia and Turkey hindered Fund performance.
Four of the top five contributors to Fund performance over the fiscal year were Brazilian companies –Cosan SA Industria e Comercio, EcoRodovias Infraestrutura (no longer held at the end of the reporting period), Companhia Energetica de Minas Gerais and Smiles SA. Brazil had one of the strongest recoveries in the emerging markets during the fiscal year, after performing poorly in the prior fiscal year due to political unrest and a weak economy. Investor sentiment shifted to less defensive sectors when the Brazilian Central Bank left interest rates unchanged in January and commodities started to recover globally in mid-February. Energy producer
| | | | | | |
| Portfolio Composition | |
By sector | | | % of total net assets | |
| | | | |
Financials | | | 16.7 | % |
Consumer Discretionary | | | 15.2 | |
| Consumer Staples | | | 13.4 | |
| Industrials | | | 13.1 | |
| Utilities | | | 11.1 | |
| Materials | | | 9.6 | |
| Energy | | | 9.1 | |
| Information Technology | | | 4.2 | |
| Telecommunication Services | | | 4.0 | |
| Health Care | | | 2.6 | |
| Money Market Funds Plus Other Assets Less Liabilities | | | 1.0 | |
| | | | |
| Top 10 Equity Holdings* |
| | % of total net assets |
| | | | | | |
1. | | Woori Bank | | | 1.7 | % |
2. | | Hindustan Petroleum Corp. Ltd. | | | 1.6 | |
3. | | Sun TV Network Ltd. | | | 1.6 | |
4. | | Companhia Energetica de Minas Gerais-ADR | | | 1.5 | |
5. | | Barclays Africa Group Ltd. | | | 1.5 | |
6. | | Sappi Ltd. | | | 1.5 | |
7. | | ALROSA PJSC | | | 1.5 | |
8. | | MRV Engenharia e Participacoes S.A. | | | 1.5 | |
9. | | Powertech Technology Inc. | | | 1.5 | |
10. | | Thai Oil PCL | | | 1.5 | |
| | | | |
Total Net Assets | | | $43.0 million | |
| |
| Total Number of Holdings* | | | 99 | |
The Fund’s holdings are subject to change, and there is no assurance that the Fund will continue to hold any particular security.
*Excluding money market fund holdings.
Data presented here are as of October 31, 2016.
4 Invesco Low Volatility Emerging Markets Fund
Cosan and EcoRodovias, an industrial company which focuses on transportation infrastructure, benefited from a rebound in commodities and an improved business outlook. Companhia Energetica, an electric utility company, rebounded after concerns of a power shortage due to last year’s drought dissipated. Smiles, a travel services company focused on loyalty programs primarily for the airline industry, beat earnings estimates and performed well given forecasts of higher market share.
Two of the worst-performing stocks over the fiscal year were Taiwanese companies. Casetek, a technology company that manufactures notebooks and tablets, performed poorly due to pricing pressure and weakening demand, which resulted in a lower earnings outlook. Fubon Financial, a multi-sector financial holding company, declined due to a drop in year-over-year profits given lower investment gains. We sold our positions in Casetek and Fubon Financials during the reporting period. TAV Havalimanlari, a manager of airport terminals in Turkey, performed poorly given a significant drop in tourism income due to security concerns after a terrorist attack in June and an attempted coup in July that led to a three-month state of emergency.
At the close of the reporting period, relative to the Fund’s style-specific index, the Fund held overweight positions in the consumer discretionary, consumer staples, industrials, materials and utilities sectors, and underweight positions in the financials, IT and telecommunication services sectors. Geographically, the Fund held overweight positions in Brazil, Mexico, South Africa and India, and underweight positions in China, South Korea and Taiwan.
Please note, the Fund’s strategy is principally implemented through equity investments, but the Fund may also use futures contracts, a derivative instrument, to gain exposure to the equity market. During the reporting period, the Fund invested in MSCI Emerging Markets Index futures contracts, which generated a negative return and were a slight detractor from Fund performance. Derivatives can be a cost-effective way to gain exposure to asset classes. However, derivatives may amplify traditional investment risks through the creation of leverage and may be less liquid than traditional securities.
Thank you for your investment in Invesco Low Volatility Emerging Markets Fund.
| 1 | The Model’s investment concepts – Earnings Expectations, Market Sentiment, Management and Quality, and Value are the foundation of the Fund’s stock selection process. Earnings Expectations is measured by earnings momentum and earnings revisions. Market Sentiment evaluates the price momentum of the stock. Management and Quality assesses whether management is a benefit for shareholders. The Value concept measures valuation in terms of cash flow yield, dividend yield, and earnings yield. |
The views and opinions expressed in management’s discussion of Fund performance are those of Invesco Advisers, Inc. These views and opinions are subject to change at any time based on factors such as market and economic conditions. These views and opinions may not be relied upon as investment advice or recommendations, or as an offer for a particular security. The information is not a complete analysis of every aspect of any market, country, industry, security or the Fund. Statements of fact are from sources considered reliable, but Invesco Advisers, Inc. makes no representation or warranty as to their completeness or accuracy. Although historical performance is no guarantee of future results, these insights may help you understand our investment management philosophy.
See important Fund and, if applicable, index disclosures later in this report.

Michael Abata
Chartered Financial Analyst, Portfolio Manager, is manager of Invesco Low Volatility Emerging Markets Fund. He joined Invesco in 2011. Mr. Abata earned a BA in economics from Binghamton University.

Uwe Draeger
Portfolio Manager, is manager of Invesco Low Volatility Emerging Markets Fund. He joined Invesco in 2005. Mr. Draeger earned a Diplom-Ökonom degree from Hochschule für Ökonomie Berlin, an MA from City of London Polytechnic and an MBA from Anglia Business School (Cambridge).

Nils Huter
Chartered Financial Analyst, Portfolio Manager, is manager of Invesco Low Volatility Emerging Markets Fund. He joined Invesco in 2007. Mr. Huter earned a business administration degree, Diplom Kaufmann (FH), the University of Applied Sciences and Arts in Hildesheim.

Charles Ko
Chartered Financial Analyst, Portfolio Manager, is manager of Invesco Low Volatility Emerging Markets Fund. He joined Invesco in 2012. Mr. Ko earned a BS from MIT and an MBA from Yale University.

Jens Langewand
Portfolio Manager, is manager of Invesco Low Volatility Emerging Markets Fund. He joined Invesco in 2007. Mr. Langewand earned a Diplom Kaufmann degree from the University of Münster and a PhD from the University of Augsburg.

Andrew Waisburd
Portfolio Manager, is manager of Invesco Low Volatility Emerging Markets Fund. He joined Invesco in 2008. Dr. Waisburd earned a BS in statistics from Cornell University and an MS and a PhD in finance from Indiana University.

Donna Chapman Wilson
Portfolio Manager and Director of Portfolio Management, is manager of Invesco Low Volatility Emerging Markets Fund. She joined Invesco in 1997. Ms. Chapman Wilson earned a BA in economics from Hampton University and an MBA in finance from the Wharton School of the University of Pennsylvania.
5 Invesco Low Volatility Emerging Markets Fund
Your Fund’s Long-Term Performance
Results of a $10,000 Investment – Oldest Share Class(es) Since Inception
Fund and index data from 12/17/13
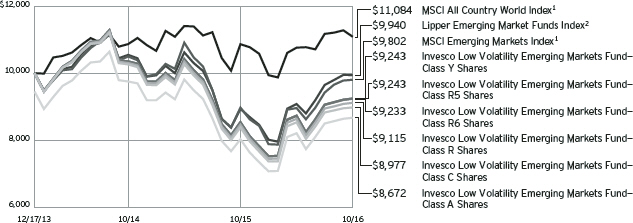
| 1 | Source: FactSet Research Systems Inc. |
Past performance cannot guarantee comparable future results.
The data shown in the chart include reinvested distributions, applicable sales charges and Fund expenses including
management fees. Index results include reinvested dividends, but they do not reflect sales charges. Performance of the peer group, if applicable, reflects fund expenses and management fees; performance
of a market index does not. Performance shown in the chart and table(s) does not reflect deduction of taxes a shareholder would pay on Fund distributions or sale of Fund shares.
6 Invesco Low Volatility Emerging Markets Fund
| | | | |
| Average Annual Total Returns | |
| As of 10/31/16, including maximum applicable sales charges | |
| |
Class A Shares | | | | |
Inception (12/17/13) | | | -4.84 | % |
1 Year | | | 2.04 | |
| |
Class C Shares | | | | |
Inception (12/17/13) | | | -3.69 | % |
1 Year | | | 6.08 | |
| |
Class R Shares | | | | |
Inception (12/17/13) | | | -3.17 | % |
1 Year | | | 7.68 | |
| |
Class Y Shares | | | | |
Inception (12/17/13) | | | -2.70 | % |
1 Year | | | 8.25 | |
| |
Class R5 Shares | | | | |
Inception (12/17/13) | | | -2.70 | % |
1 Year | | | 8.25 | |
| |
Class R6 Shares | | | | |
Inception (12/17/13) | | | -2.74 | % |
1 Year | | | 8.12 | |
The performance data quoted represent past performance and cannot guarantee comparable future results; current performance may be lower or higher. Please visit invesco.com/performance for the most recent month-end performance. Performance figures reflect reinvested distributions, changes in net asset value and the effect of the maximum sales charge unless otherwise stated. Investment return and principal value will fluctuate so that you may have a gain or loss when you sell shares.
The net annual Fund operating expense ratio set forth in the most recent Fund prospectus as of the date of this report for Class A, Class C, Class R, Class Y, Class R5 and Class R6 shares was 1.72%, 2.47%, 1.97%, 1.47%, 1.47% and 1.47%, respectively.1 The total annual Fund operating expense ratio set forth in the most recent Fund prospectus as of the date of this report for Class A, Class C, Class R, Class Y, Class R5 and Class R6 shares was 7.99%, 8.74%, 8.24%, 7.74%, 7.64% and 7.64%, respectively. The expense ratios presented above may vary from the expense ratios presented in other sections of this report that are based on expenses incurred during the period covered by this report.
Class A share performance reflects the maximum 5.50% sales charge, and Class C share performance reflects the applicable contingent deferred sales
| | |
| Average Annual Total Returns |
| As of 9/30/16, the most recent calendar quarter end, including maximum applicable sales charges |
| |
Class A Shares | | |
Inception (12/17/13) | | -5.10% |
1 Year | | 6.42 |
| |
Class C Shares | | |
Inception (12/17/13) | | -3.88% |
1 Year | | 10.86 |
| |
Class R Shares | | |
Inception (12/17/13) | | -3.39% |
1 Year | | 12.47 |
| |
Class Y Shares | | |
Inception (12/17/13) | | -2.91% |
1 Year | | 13.04 |
| |
Class R5 Shares | | |
Inception (12/17/13) | | -2.91% |
1 Year | | 13.04 |
| |
Class R6 Shares | | |
Inception (12/17/13) | | -2.95% |
1 Year | | 12.90 |
charge (CDSC) for the period involved. The CDSC on Class C shares is 1% for the first year after purchase. Class R, Class Y, Class R5 and Class R6 class shares do not have a front-end sales charge or a CDSC; therefore, performance is at net asset value.
The performance of the Fund’s share classes will differ primarily due to different sales charge structures and class expenses.
Fund performance reflects any applicable fee waivers and/or expense reimbursements. Had the adviser not waived fees and/or reimbursed expenses currently or in the past, returns would have been lower. See current prospectus for more information.
| 1 | Total annual Fund operating expenses after any contractual fee waivers and/or expense reimbursements by the adviser in effect through at least February 28, 2017. See current prospectus for more information. |
7 Invesco Low Volatility Emerging Markets Fund
Invesco Low Volatility Emerging Markets Fund’s investment objective is long-term growth of capital.
| ∎ | | Unless otherwise stated, information presented in this report is as of October 31, 2016, and is based on total net assets. |
| ∎ | | Unless otherwise noted, all data provided by Invesco. |
| ∎ | | To access your Fund’s reports/prospectus, visit invesco.com/fundreports. |
About share classes
| ∎ | | Class R shares are generally available only to employer sponsored retirement and benefit plans. Please see the prospectus for more information. |
| ∎ | | Class Y shares are available only to certain investors. Please see the prospectus for more information. |
| ∎ | | Class R5 shares and Class R6 shares are primarily intended for employer sponsored retirement and benefit plans that meet certain standards and for institutional investors. Please see the prospectus for more information. |
Principal risks of investing in the Fund
| ∎ | | Depositary receipts risk. Investing in depositary receipts involves the same risks as direct investments in foreign securities. In addition, the underlying issuers of certain depositary receipts are under no obligation to distribute shareholder communications or pass through any voting rights with respect to the deposited securities to the holders of such receipts. The Fund may therefore receive less timely information or have less control than if it invested directly in the foreign issuer. |
| ∎ | | Derivatives risk. The value of a derivative instrument depends largely on (and is derived from) the value of an underlying security, currency, commodity, interest rate, index or other asset (each referred to as an underlying asset). In addition to risks relating to the underlying assets, the use of derivatives may include other, possibly greater, risks, including counterparty, leverage and liquidity risks. Counterparty risk is the risk that the counterparty to the derivative contract will default on its obligation to pay the Fund the amount owed or otherwise perform under the derivative contract. Derivatives create leverage risk because they do not require payment up front equal to the economic exposure created by owning the derivative. As a result, an adverse change in the value of the underlying asset could result in the Fund sustaining a loss that is substantially greater than the amount invested in the derivative, |
| | | which may make the Fund’s returns more volatile and increase the risk of loss. Derivative instruments may also be less liquid than more traditional investments and the Fund may be unable to sell or close out its derivative positions at a desirable time or price. This risk may be more acute under adverse market conditions, during which the Fund may be most in need of liquidating its derivative positions. Derivatives may also be harder to value, less tax efficient and subject to changing government regulation that could impact the Fund’s ability to use certain derivatives or their cost. Also, derivatives used for hedging or to gain or limit exposure to a particular market segment may not provide the expected benefits, particularly during adverse market conditions. |
| ∎ | | Emerging markets securities risk. Emerging markets (also referred to as developing markets) are generally subject to greater market volatility, political, social and economic instability, uncertain trading markets and more governmental limitations on foreign investment than more developed markets. In addition, emerging markets may be subject to lower trading volume and greater price fluctuations than companies in more developed markets. Securities law and the enforcement of systems of taxation in many emerging market countries may change quickly and unpredictably. In addition, investments in emerging markets securities may also be subject to additional transaction costs, delays in settlement procedures, and lack of timely information. |
| ∎ | | Foreign securities risk. The Fund’s foreign investments may be adversely affected by political and social instability, changes in economic or taxation policies, difficulty in enforcing obligations, decreased liquidity or increased volatility. Foreign investments also involve the risk of the possible seizure, nationalization or expropriation of the issuer or foreign deposits (in which the Fund could lose its entire investments in a certain market) and the possible adoption of foreign governmental restrictions such as exchange controls. Unless the Fund has hedged its foreign securities risk, |
| | | foreign securities risk also involves the risk of negative foreign currency rate fluctuations, which may cause the value of securities denominated in such foreign currency (or other instruments through which the Fund has exposure to foreign currencies) to decline in value. Currency exchange rates may fluctuate significantly over short periods of time. Currency hedging strategies, if used, are not always successful. |
| ∎ | | Geographic focus risk. The Fund may from time to time invest a substantial amount of its assets in securities of issuers located in a single country or a limited number of countries. Adverse economic, political or social conditions in those countries may therefore have a significant negative impact on the Fund’s investment performance. |
| ∎ | | Management risk. The Fund is actively managed and depends heavily on the Adviser’s judgment about markets, interest rates or the attractiveness, relative values, liquidity, or potential appreciation of particular investments made for the Fund’s portfolio. The Fund could experience losses if these judgments prove to be incorrect. There is no guarantee that the portfolio manager’s stock selection process will produce lower volatility than the broader markets in which the Fund invests. In addition, the Fund’s investment strategy to seek lower volatility may cause the Fund to underperform the broader markets in which the Fund invests during market rallies. Such underperformance could be significant during sudden or significant market rallies. Additionally, legislative, regulatory, or tax developments may adversely affect management of the Fund and, therefore, the ability of the Fund to achieve its investment objective. |
| ∎ | | Market risk. The market values of the Fund’s investments, and therefore the value of the Fund’s shares, will go up and down, sometimes rapidly or unpredictably. Market risk may affect a single issuer, industry or section of the economy, or it may affect the market as a |
|
This report must be accompanied or preceded by a currently effective Fund prospectus, which contains more complete information, including sales charges and expenses. Investors should read it carefully before investing. |
|
NOT FDIC INSURED | MAY LOSE VALUE | NO BANK GUARANTEE |
8 Invesco Low Volatility Emerging Markets Fund
whole. Individual stock prices tend to go up and down more dramatically than those of certain other types of investments, such as bonds. During a general downturn in the financial markets, multiple asset classes may decline in value. When markets perform well, there can be no assurance that specific investments held by the Fund will rise in value.
| ∎ | | Preferred securities risk. Preferred securities are subject to issuer-specific and market risks applicable generally to equity securities. Preferred securities also may be subordinated to bonds or other debt instruments, subjecting them to a greater risk of non-payment, may be less liquid than many other securities, such as common stocks, and generally offer no voting rights with respect to the issuer. |
| ∎ | | Small- and mid-capitalization companies risks. Small- and mid-capitalization companies tend to be more vulnerable to changing market conditions, may have little or no operating history or track record of success, and may have more limited product lines and markets, less experienced management and fewer financial resources than larger companies. These companies’ securities may be more volatile and less liquid than those of more established companies, and their returns may vary, sometimes significantly, from the overall securities market. |
About indexes used in this report
| ∎ | | The MSCI All Country World Index is an unmanaged index considered representative of large- and mid-cap stocks across developed and emerging markets. The index is computed using the net return, which withholds applicable taxes for non-resident investors. |
| ∎ | | The MSCI Emerging Markets IndexSM is an unmanaged index considered representative of stocks of developing countries. The index is computed using the net return, which withholds applicable taxes for non-resident investors. |
| ∎ | | The Lipper Emerging Market Funds Index is an unmanaged index considered representative of emerging market funds tracked by Lipper. |
| ∎ | | The Fund is not managed to track the performance of any particular index, including the index(es) described here, and consequently, the performance of the Fund may deviate significantly from the performance of the index(es). |
| ∎ | | A direct investment cannot be made in an index. Unless otherwise indicated, index results include reinvested dividends, and they do not reflect sales charges. Performance of the peer group, if applicable, reflects fund expenses; performance of a market index does not. |
Other information
| ∎ | | The returns shown in management’s discussion of Fund performance are based on net asset values (NAVs) calculated for shareholder transactions. Generally accepted accounting principles require adjustments to be made to the net assets of the Fund at period end for financial reporting purposes, and as such, the NAVs for shareholder transactions and the returns based on those NAVs may differ from the NAVs and returns reported in the Financial Highlights. |
| ∎ | | Industry classifications used in this report are generally according to the Global Industry Classification Standard, which was developed by and is the exclusive property and a service mark of MSCI Inc. and Standard & Poor’s. |
9 Invesco Low Volatility Emerging Markets Fund
Schedule of Investments
October 31, 2016
| | | | | | | | |
| | | Shares | | | Value | |
Common Stocks & Other Equity Interests–99.02% | |
| Brazil–12.43% | |
Ambev S.A.–ADR | | | 90,800 | | | $ | 535,720 | |
Braskem S.A.–Preference Shares–ADR | | | 59,500 | | | | 527,087 | |
Companhia Energetica de Minas Gerais–ADR | | | 216,638 | | | | 654,247 | |
Cosan S.A. Industria e Comercio | | | 46,300 | | | | 622,701 | |
Equatorial Energia S.A. | | | 7,400 | | | | 132,035 | |
Kroton Educacional S.A. | | | 115,400 | | | | 574,966 | |
MRV Engenharia e Participacoes S.A. | | | 166,100 | | | | 643,320 | |
Multiplus S.A. | | | 43,400 | | | | 588,594 | |
Smiles S.A. | | | 33,000 | | | | 602,454 | |
Transmissora Alianca de Energia Eletrica S.A.(a) | | | 71,000 | | | | 461,653 | |
| | | | | | | | 5,342,777 | |
|
| Chile–4.90% | |
Aguas Andinas S.A.–Class A | | | 710,716 | | | | 469,317 | |
Banco de Chile | | | 2,329,881 | | | | 281,365 | |
Cencosud S.A. | | | 183,058 | | | | 605,322 | |
Enersis Américas S.A.–ADR | | | 45,319 | | | | 392,916 | |
Enersis Chile S.A. | | | 3,530,159 | | | | 357,301 | |
| | | | | | | | 2,106,221 | |
|
| China–5.82% | |
China Communication Services Corp. Ltd.–Class H | | | 592,000 | | | | 351,897 | |
Chongqing Rural Commercial Bank Co., Ltd.–Class H | | | 925,000 | | | | 554,610 | |
Guangzhou Automobile Group Co. Ltd.–Class H | | | 404,000 | | | | 487,757 | |
Jiangsu Expressway Co. Ltd.–Class H | | | 134,000 | | | | 182,458 | |
Lao Feng Xiang Co., Ltd.–Class B | | | 64,100 | | | | 218,581 | |
Longfor Properties Co. Ltd. | | | 397,500 | | | | 527,919 | |
Yantai Changyu Pioneer Wine Co. Ltd.–Class B | | | 64,900 | | | | 178,624 | |
| | | | | | | | 2,501,846 | |
|
| India–11.44% | |
Bharat Electronics Ltd. | | | 29,172 | | | | 581,115 | |
Bharat Petroleum Corp. Ltd. | | | 16,666 | | | | 167,022 | |
Hero MotoCorp Ltd. | | | 10,719 | | | | 538,053 | |
Hindustan Petroleum Corp. Ltd. | | | 100,722 | | | | 704,737 | |
ITC Ltd. | | | 116,877 | | | | 423,426 | |
Marico Ltd. | | | 147,087 | | | | 612,752 | |
NHPC Ltd. | | | 660,346 | | | | 264,514 | |
Reliance Infrastructure Ltd. | | | 70,072 | | | | 568,718 | |
Sun TV Network Ltd. | | | 83,829 | | | | 689,474 | |
Vedanta Ltd. | | | 120,856 | | | | 366,568 | |
| | | | | | | | 4,916,379 | |
|
| Indonesia–0.64% | |
PT AKR Corporindo Tbk | | | 504,200 | | | | 273,971 | |
| | | | | | | | |
| | | Shares | | | Value | |
| Malaysia–6.28% | |
AirAsia Bhd. | | | 918,800 | | | $ | 606,765 | |
Berjaya Sports Toto Bhd. | | | 184,600 | | | | 140,392 | |
MISC Bhd. | | | 260,900 | | | | 467,748 | |
PPB Group Bhd. | | | 45,300 | | | | 174,094 | |
Public Bank Bhd. | | | 124,300 | | | | 588,532 | |
Telekom Malaysia Bhd. | | | 116,900 | | | | 182,268 | |
Tenaga Nasional Bhd. | | | 158,400 | | | | 541,532 | |
| | | | | | | | 2,701,331 | |
|
| Mexico–8.53% | |
Alpek S.A.B. de C.V. | | | 290,100 | | | | 431,878 | |
Arca Continental S.A.B. de C.V. | | | 48,600 | | | | 302,006 | |
Coca-Cola Femsa, S.A.B. de C.V.–Series L | | | 60,300 | | | | 452,741 | |
Gentera S.A.B. de C.V. | | | 308,200 | | | | 607,851 | |
Gruma, S.A.B. de C.V.–Class B | | | 15,260 | | | | 212,114 | |
Industrias Bachoco, S.A.B. de C.V.–Series B | | | 67,900 | | | | 300,019 | |
Industrias CH, S.A.B. de C.V.–Series B(b) | | | 30,500 | | | | 144,092 | |
Megacable Holdings S.A.B. de C.V.–Series CPO(c) | | | 68,400 | | | | 250,337 | |
Nemak, S.A.B. de C.V.–REGS(d) | | | 455,900 | | | | 474,661 | |
Wal-Mart de México, S.A.B. de C.V.–Series V | | | 232,700 | | | | 492,185 | |
| | | | | | | | 3,667,884 | |
|
| Philippines–1.20% | |
Aboitiz Equity Ventures Inc. | | | 242,980 | | | | 391,175 | |
Cebu Air, Inc. | | | 58,320 | | | | 126,390 | |
| | | | | | | | 517,565 | |
|
| Poland–1.69% | |
Powszechny Zaklad Ubezpieczen S.A. | | | 59,792 | | | | 415,176 | |
Tauron Polska Energia S.A.(b) | | | 462,192 | | | | 312,212 | |
| | | | | | | | 727,388 | |
|
| Qatar–0.42% | |
Qatar Islamic Bank (S.A.Q) | | | 6,376 | | | | 179,297 | |
|
| Russia–8.50% | |
ALROSA PJSC(b) | | | 461,463 | | | | 644,801 | |
Gazprom PAO–ADR | | | 141,604 | | | | 610,692 | |
Inter RAO UES PJSC | | | 11,718,756 | | | | 628,371 | |
LUKOIL PJSC–ADR | | | 12,774 | | | | 624,788 | |
Magnitogorsk Iron & Steel Works OJSC | | | 1,205,923 | | | | 605,927 | |
Rostelecom PJSC | | | 231,480 | | | | 288,437 | |
Sistema PJSFC–REGS–GDR(d) | | | 33,467 | | | | 249,999 | |
| | | | | | | | 3,653,015 | |
|
| South Africa–10.18% | |
Barclays Africa Group Ltd. | | | 56,264 | | | | 652,484 | |
Bidvest Group Ltd. (The) | | | 23,931 | | | | 297,136 | |
KAP Industrial Holdings Ltd. | | | 390,114 | | | | 224,237 | |
Kumba Iron Ore Ltd.(b) | | | 35,258 | | | | 357,418 | |
Liberty Holdings Ltd. | | | 67,815 | | | | 583,190 | |
See accompanying Notes to Financial Statements which are an integral part of the financial statements.
10 Invesco Low Volatility Emerging Markets Fund
| | | | | | | | |
| | | Shares | | | Value | |
| South Africa–(continued) | |
Life Healthcare Group Holdings Ltd. | | | 87,260 | | | $ | 232,987 | |
Nedbank Group Ltd. | | | 36,913 | | | | 603,672 | |
Reunert Ltd. | | | 54,452 | | | | 249,180 | |
Sappi Ltd.(b) | | | 116,074 | | | | 645,669 | |
Sibanye Gold Ltd. | | | 117,888 | | | | 326,303 | |
Super Group Ltd.(b) | | | 68,235 | | | | 201,420 | |
| | | | | | | | 4,373,696 | |
|
| South Korea–10.62% | |
Hankook Tire Co. Ltd. | | | 11,838 | | | | 571,317 | |
HITEJINRO Co., Ltd. | | | 25,055 | | | | 481,922 | |
Hyundai Development Co. | | | 13,904 | | | | 587,892 | |
Kangwon Land Inc. | | | 16,349 | | | | 542,453 | |
KT&G Corp. | | | 6,029 | | | | 594,512 | |
Lotte Chemical Corp. | | | 315 | | | | 79,268 | |
Samsung Electronics Co., Ltd. | | | 433 | | | | 617,738 | |
Woori Bank | | | 66,654 | | | | 727,304 | |
Yuhan Corp. | | | 1,976 | | | | 362,799 | |
| | | | | | | | 4,565,205 | |
|
| Taiwan–6.44% | |
China Airlines Ltd. | | | 1,048,000 | | | | 316,820 | |
Chunghwa Telecom Co., Ltd. | | | 150,000 | | | | 513,818 | |
Lite-On Technology Corp. | | | 381,896 | | | | 548,211 | |
Powertech Technology Inc. | | | 223,000 | | | | 636,699 | |
St. Shine Optical Co., Ltd. | | | 24,000 | | | | 504,230 | |
| | | | | | | | |
| | | Shares | | | Value | |
| Taiwan–(continued) | |
Wan Hai Lines Ltd. | | | 501,000 | | | $ | 246,620 | |
| | | | | | | | 2,766,398 | |
|
| Thailand–6.57% | |
Airports of Thailand PCL | | | 51,700 | | | | 562,310 | |
Intouch Holdings PCL–Class F | | | 95,700 | | | | 144,793 | |
IRPC PCL | | | 3,948,300 | | | | 538,763 | |
Krung Thai Bank PCL | | | 1,137,000 | | | | 557,490 | |
Thai Oil PCL | | | 317,800 | | | | 635,056 | |
Thai Union Group PCL | | | 451,300 | | | | 279,566 | |
Thai Vegetable Oil PCL | | | 108,500 | | | | 103,761 | |
| | | | | | | | 2,821,739 | |
|
| Turkey–1.24% | |
TAV Havalimanlari Holding A.S. | | | 96,990 | | | | 396,388 | |
Turk Traktor ve Ziraat Makineleri A.S. | | | 5,322 | | | | 137,758 | |
| | | | | | | | 534,146 | |
|
| United Arab Emirates–2.12% | |
Aldar Properties PJSC | | | 863,303 | | | | 619,827 | |
DAMAC Properties Dubai Co. PJSC | | | 485,413 | | | | 290,337 | |
| | | | | 910,164 | |
TOTAL INVESTMENTS–99.02%
(Cost $37,244,734) | | | | 42,559,022 | |
OTHER ASSETS LESS LIABILITIES–0.98% | | | | 421,431 | |
NET ASSETS–100.00% | | | $ | 42,980,453 | |
Investment Abbreviations:
| | |
| ADR | | – American Depositary Receipt |
| GDR | | – Global Depositary Receipt |
| REGS | | – Regulation S |
Notes to Schedule of Investments:
| (a) | Each unit represents two preferred shares and one common share. |
| (b) | Non-income producing security. |
| (c) | Each CPO represents two Series A Shares. |
| (d) | Security purchased or received in a transaction exempt from registration under the Securities Act of 1933, as amended (the “1933 Act”). The security may be resold pursuant to an exemption from registration under the 1933 Act, typically to qualified institutional buyers. The aggregate value of these securities at October 31, 2016 was $724,660, which represented 1.69% of the Fund’s Net Assets. |
See accompanying Notes to Financial Statements which are an integral part of the financial statements.
11 Invesco Low Volatility Emerging Markets Fund
Statement of Assets and Liabilities
October 31, 2016
| | | | |
Assets: | |
Total investments, at value (Cost $37,244,734) | | $ | 42,559,022 | |
Foreign currencies, at value (Cost $682,415) | | | 677,635 | |
Receivable for: | | | | |
Deposits with brokers — futures | | | 12,000 | |
Variation margin — futures | | | 1,380 | |
Fund shares sold | | | 21,012 | |
Dividends | | | 38,814 | |
Investment for trustee deferred compensation and retirement plans | | | 6,116 | |
Other assets | | | 43,829 | |
Total assets | | | 43,359,808 | |
|
Liabilities: | |
Payable for: | | | | |
Fund shares reacquired | | | 17,891 | |
Amount due custodian | | | 51,777 | |
Accrued foreign taxes | | | 219,822 | |
Accrued fees to affiliates | | | 12,033 | |
Accrued trustees’ and officers’ fees and benefits | | | 1,518 | |
Accrued other operating expenses | | | 70,198 | |
Trustee deferred compensation and retirement plans | | | 6,116 | |
Total liabilities | | | 379,355 | |
Net assets applicable to shares outstanding | | $ | 42,980,453 | |
|
Net assets consist of: | |
Shares of beneficial interest | | $ | 35,536,778 | |
Undistributed net investment income | | | 615,905 | |
Undistributed net realized gain | | | 1,517,090 | |
Net unrealized appreciation | | | 5,310,680 | |
| | | $ | 42,980,453 | |
| | | | |
Net Assets: | |
Class A | | $ | 3,616,766 | |
Class C | | $ | 249,861 | |
Class R | | $ | 26,092 | |
Class Y | | $ | 1,987,469 | |
Class R5 | | $ | 129,892 | |
Class R6 | | $ | 36,970,373 | |
|
Shares outstanding, $0.01 par value per share,
with an unlimited number of shares authorized: | |
Class A | | | 418,635 | |
Class C | | | 29,210 | |
Class R | | | 3,028 | |
Class Y | | | 229,525 | |
Class R5 | | | 15,001 | |
Class R6 | | | 4,273,091 | |
Class A: | | | | |
Net asset value per share | | $ | 8.64 | |
Maximum offering price per share | | | | |
(Net asset value of $8.64 ¸ 94.50%) | | $ | 9.14 | |
Class C: | | | | |
Net asset value and offering price per share | | $ | 8.55 | |
Class R: | | | | |
Net asset value and offering price per share | | $ | 8.62 | |
Class Y: | | | | |
Net asset value and offering price per share | | $ | 8.66 | |
Class R5 | | | | |
Net asset value and offering price per share | | $ | 8.66 | |
Class R6: | | | | |
Net asset value and offering price per share | | $ | 8.65 | |
See accompanying Notes to Financial Statements which are an integral part of the financial statements.
12 Invesco Low Volatility Emerging Markets Fund
Statement of Operations
For the year ended October 31, 2016
| | | | |
Investment income: | |
Dividends (net of foreign withholding taxes of $111,690) | | $ | 1,166,101 | |
Dividends from affiliated money market funds | | | 4,052 | |
Total investment income | | | 1,170,153 | |
| |
Expenses: | | | | |
Advisory fees | | | 288,338 | |
Administrative services fees | | | 50,000 | |
Custodian fees | | | 58,706 | |
Distribution fees: | | | | |
Class A | | | 6,030 | |
Class C | | | 1,553 | |
Class R | | | 116 | |
Transfer agent fees — A,C,R and Y | | | 6,032 | |
Transfer agent fees — R5 | | | 1 | |
Transfer agent fees — R6 | | | 115 | |
Trustees’ and officers’ fees and benefits | | | 19,029 | |
Registration and filing fees | | | 63,080 | |
Reports to shareholders | | | 10,752 | |
Professional services fees | | | 58,264 | |
Other | | | 27,267 | |
Total expenses | | | 589,283 | |
Less: Fees waived and expenses reimbursed | | | (129,679 | ) |
Net expenses | | | 459,604 | |
Net investment income | | | 710,549 | |
| |
Realized and unrealized gain (loss) from: | | | | |
Net realized gain (loss) from: | | | | |
Investment securities | | | 1,571,759 | |
Foreign currencies | | | (15,684 | ) |
Futures contracts | | | 239,023 | |
| | | | 1,795,098 | |
Change in net unrealized appreciation (depreciation) of: | | | | |
Investment securities | | | 5,708,769 | |
Foreign currencies | | | (3,008 | ) |
Futures contracts | | | (4,852 | ) |
| | | | 5,700,909 | |
Net realized and unrealized gain | | | 7,496,007 | |
Net increase in net assets resulting from operations | | $ | 8,206,556 | |
See accompanying Notes to Financial Statements which are an integral part of the financial statements.
13 Invesco Low Volatility Emerging Markets Fund
Statement of Changes in Net Assets
For the years ended October 31, 2016 and 2015
| | | | | | | | |
| | | 2016 | | | 2015 | |
Operations: | | | | | |
Net investment income | | $ | 710,549 | | | $ | 59,589 | |
Net realized gain (loss) | | | 1,795,098 | | | | (375,081 | ) |
Change in net unrealized appreciation (depreciation) | | | 5,700,909 | | | | (382,554 | ) |
Net increase (decrease) in net assets resulting from operations | | | 8,206,556 | | | | (698,046 | ) |
| | |
Distributions to shareholders from net investment income: | | | | | | | | |
Class A | | | (15,051 | ) | | | (57,658 | ) |
Class C | | | (69 | ) | | | (2,197 | ) |
Class R | | | (137 | ) | | | (796 | ) |
Class Y | | | (14,541 | ) | | | (50,753 | ) |
Class R5 | | | (1,322 | ) | | | (17,161 | ) |
Class R6 | | | (1,322 | ) | | | (5,585 | ) |
Total distributions from net investment income | | | (32,442 | ) | | | (134,150 | ) |
| | |
Distributions to shareholders from net realized gains: | | | | | | | | |
Class A | | | — | | | | (20,025 | ) |
Class C | | | — | | | | (848 | ) |
Class R | | | — | | | | (287 | ) |
Class Y | | | — | | | | (16,495 | ) |
Class R5 | | | — | | | | (5,577 | ) |
Class R6 | | | — | | | | (1,815 | ) |
Total distributions from net realized gains | | | — | | | | (45,047 | ) |
| | |
Share transactions–net: | | | | | | | | |
Class A | | | 1,857,102 | | | | 286,843 | |
Class C | | | 189,226 | | | | 5,332 | |
Class R | | | 1,464 | | | | 14,205 | |
Class Y | | | 556,260 | | | | 212,647 | |
Class R5 | | | — | | | | (285,563 | ) |
Class R6 | | | 29,026,790 | | | | — | |
Net increase in net assets resulting from share transactions | | | 31,630,842 | | | | 233,464 | |
Net increase (decrease) in net assets | | | 39,804,956 | | | | (643,779 | ) |
| | |
Net assets: | | | | | | | | |
Beginning of year | | | 3,175,497 | | | | 3,819,276 | |
End of year (includes undistributed net investment income of $615,905 and $14,573, respectively) | | $ | 42,980,453 | | | $ | 3,175,497 | |
Notes to Financial Statements
October 31, 2016
NOTE 1—Significant Accounting Policies
Invesco Low Volatility Emerging Markets Fund (the “Fund”) is a series portfolio of AIM Investment Funds (Invesco Investment Funds) (the “Trust”). The Trust is organized as a Delaware statutory trust and is registered under the Investment Company Act of 1940, as amended (the “1940 Act”), as an open-end series management investment company consisting of twenty-two separate series portfolios, each authorized to issue an unlimited number of shares of beneficial interest. The assets, liabilities and operations of each portfolio are accounted for separately. Information presented in these financial statements pertains only to the Fund. Matters affecting each portfolio or class will be voted on exclusively by the shareholders of such portfolio or class.
The Fund’s investment objective is long-term growth of capital.
The Fund currently consists of six different classes of shares: Class A, Class C, Class R, Class Y, Class R5 and Class R6. Class Y shares are available only to certain investors. Class A shares are sold with a front-end sales charge unless certain waiver criteria are met and under certain circumstances load waived shares may be subject to contingent deferred sales charges (“CDSC”). Class C shares are sold with a CDSC. Class R, Class Y, Class R5 and Class R6 shares are sold at net asset value.
14 Invesco Low Volatility Emerging Markets Fund
The following is a summary of the significant accounting policies followed by the Fund in the preparation of its financial statements.
| A. | Security Valuations — Securities, including restricted securities, are valued according to the following policy. |
A security listed or traded on an exchange (except convertible securities) is valued at its last sales price or official closing price as of the close of the customary trading session on the exchange where the security is principally traded, or lacking any sales or official closing price on a particular day, the security may be valued at the closing bid price on that day. Securities traded in the over-the-counter market are valued based on prices furnished by independent pricing services or market makers. When such securities are valued by an independent pricing service they may be considered fair valued. Futures contracts are valued at the final settlement price set by an exchange on which they are principally traded. Listed options are valued at the mean between the last bid and asked prices from the exchange on which they are principally traded. Options not listed on an exchange are valued by an independent source at the mean between the last bid and asked prices. For purposes of determining net asset value (“NAV”) per share, futures and option contracts generally are valued 15 minutes after the close of the customary trading session of the New York Stock Exchange (“NYSE”).
Investments in open-end and closed-end registered investment companies that do not trade on an exchange are valued at the end-of-day net asset value per share. Investments in open-end and closed-end registered investment companies that trade on an exchange are valued at the last sales price or official closing price as of the close of the customary trading session on the exchange where the security is principally traded.
Debt obligations (including convertible securities) and unlisted equities are fair valued using an evaluated quote provided by an independent pricing service. Evaluated quotes provided by the pricing service may be determined without exclusive reliance on quoted prices, and may reflect appropriate factors such as institution-size trading in similar groups of securities, developments related to specific securities, dividend rate (for unlisted equities), yield (for debt obligations), quality, type of issue, coupon rate (for debt obligations), maturity (for debt obligations), individual trading characteristics and other market data. Debt obligations are subject to interest rate and credit risks. In addition, all debt obligations involve some risk of default with respect to interest and/or principal payments.
Foreign securities’ (including foreign exchange contracts) prices are converted into U.S. dollar amounts using the applicable exchange rates as of the close of the NYSE. If market quotations are available and reliable for foreign exchange-traded equity securities, the securities will be valued at the market quotations. Because trading hours for certain foreign securities end before the close of the NYSE, closing market quotations may become unreliable. If between the time trading ends on a particular security and the close of the customary trading session on the NYSE, events occur that the Adviser determines are significant and make the closing price unreliable, the Fund may fair value the security. If the event is likely to have affected the closing price of the security, the security will be valued at fair value in good faith using procedures approved by the Board of Trustees. Adjustments to closing prices to reflect fair value may also be based on a screening process of an independent pricing service to indicate the degree of certainty, based on historical data, that the closing price in the principal market where a foreign security trades is not the current value as of the close of the NYSE. Foreign securities’ prices meeting the approved degree of certainty that the price is not reflective of current value will be priced at the indication of fair value from the independent pricing service. Multiple factors may be considered by the independent pricing service in determining adjustments to reflect fair value and may include information relating to sector indices, American Depositary Receipts and domestic and foreign index futures. Foreign securities may have additional risks including exchange rate changes, potential for sharply devalued currencies and high inflation, political and economic upheaval, the relative lack of issuer information, relatively low market liquidity and the potential lack of strict financial and accounting controls and standards.
Securities for which market prices are not provided by any of the above methods may be valued based upon quotes furnished by independent sources. The last bid price may be used to value equity securities. The mean between the last bid and asked prices is used to value debt obligations, including corporate loans.
Securities for which market quotations are not readily available or became unreliable are valued at fair value as determined in good faith by or under the supervision of the Trust’s officers following procedures approved by the Board of Trustees. Issuer specific events, market trends, bid/asked quotes of brokers and information providers and other market data may be reviewed in the course of making a good faith determination of a security’s fair value.
The Fund may invest in securities that are subject to interest rate risk, meaning the risk that the prices will generally fall as interest rates rise and, conversely, the prices will generally rise as interest rates fall. Specific securities differ in their sensitivity to changes in interest rates depending on their individual characteristics. Changes in interest rates may result in increased market volatility, which may affect the value and/or liquidity of certain Fund investments.
Valuations change in response to many factors including the historical and prospective earnings of the issuer, the value of the issuer’s assets, general economic conditions, interest rates, investor perceptions and market liquidity. Because of the inherent uncertainties of valuation, the values reflected in the financial statements may materially differ from the value received upon actual sale of those investments.
| B. | Securities Transactions and Investment Income — Securities transactions are accounted for on a trade date basis. Realized gains or losses on sales are computed on the basis of specific identification of the securities sold. Interest income (net of withholding tax, if any) is recorded on the accrual basis from settlement date. Dividend income (net of withholding tax, if any) is recorded on the ex-dividend date. |
The Fund may periodically participate in litigation related to Fund investments. As such, the Fund may receive proceeds from litigation settlements. Any proceeds received are included in the Statement of Operations as realized gain (loss) for investments no longer held and as unrealized gain (loss) for investments still held.
Brokerage commissions and mark ups are considered transaction costs and are recorded as an increase to the cost basis of securities purchased and/or a reduction of proceeds on a sale of securities. Such transaction costs are included in the determination of net realized and unrealized gain (loss) from investment securities reported in the Statement of Operations and the Statement of Changes in Net Assets and the net realized and unrealized gains (losses) on securities per share in the Financial Highlights. Transaction costs are included in the calculation of the Fund’s net asset value and, accordingly, they reduce the Fund’s total returns. These transaction costs are not considered operating expenses and are not reflected in net investment income reported in the Statement of Operations and the Statement of Changes in Net Assets, or the net investment income per share and the ratios of expenses and net investment income reported in the Financial Highlights, nor are they limited by any expense limitation arrangements between the Fund and the investment adviser.
The Fund allocates income and realized and unrealized capital gains and losses to a class based on the relative net assets of each class.
15 Invesco Low Volatility Emerging Markets Fund
| C. | Country Determination — For the purposes of making investment selection decisions and presentation in the Schedule of Investments, the investment adviser may determine the country in which an issuer is located and/or credit risk exposure based on various factors. These factors include the laws of the country under which the issuer is organized, where the issuer maintains a principal office, the country in which the issuer derives 50% or more of its total revenues and the country that has the primary market for the issuer’s securities, as well as other criteria. Among the other criteria that may be evaluated for making this determination are the country in which the issuer maintains 50% or more of its assets, the type of security, financial guarantees and enhancements, the nature of the collateral and the sponsor organization. Country of issuer and/or credit risk exposure has been determined to be the United States of America, unless otherwise noted. |
| D. | Distributions — Distributions from net investment income and net realized capital gain, if any, are generally declared and paid annually and recorded on the ex-dividend date. The Fund may elect to treat a portion of the proceeds from redemptions as distributions for federal income tax purposes. |
| E. | Federal Income Taxes — The Fund intends to comply with the requirements of Subchapter M of the Internal Revenue Code of 1986, as amended (the “Internal Revenue Code”), necessary to qualify as a regulated investment company and to distribute substantially all of the Fund’s taxable earnings to shareholders. As such, the Fund will not be subject to federal income taxes on otherwise taxable income (including net realized capital gain) that is distributed to shareholders. Therefore, no provision for federal income taxes is recorded in the financial statements. |
The Fund recognizes the tax benefits of uncertain tax positions only when the position is more likely than not to be sustained. Management has analyzed the Fund’s uncertain tax positions and concluded that no liability for unrecognized tax benefits should be recorded related to uncertain tax positions. Management is not aware of any tax positions for which it is reasonably possible that the total amounts of unrecognized tax benefits will change materially in the next 12 months.
The Fund files tax returns in the U.S. Federal jurisdiction and certain other jurisdictions. Generally, the Fund is subject to examinations by such taxing authorities for up to three years after the filing of the return for the tax period.
| F. | Expenses — Fees provided for under the Rule 12b-1 plan of a particular class of the Fund are charged to the operations of such class. Transfer agency fees and expenses and other shareholder recordkeeping fees and expenses attributable to Class R5 and Class R6 are allocated to each share class based on relative net assets. Sub-accounting fees attributable to Class R5 are charged to the operations of the class. Transfer agency fees and expenses and other shareholder recordkeeping fees and expenses relating to all other classes are allocated among those classes based on relative net assets. All other expenses are allocated among the classes based on relative net assets. |
| G. | Accounting Estimates — The preparation of financial statements in conformity with accounting principles generally accepted in the United States of America (“GAAP”) requires management to make estimates and assumptions that affect the reported amounts of assets and liabilities at the date of the financial statements and the reported amounts of revenues and expenses during the reporting period including estimates and assumptions related to taxation. Actual results could differ from those estimates by a significant amount. In addition, the Fund monitors for material events or transactions that may occur or become known after the period-end date and before the date the financial statements are released to print. |
| H. | Indemnifications — Under the Trust’s organizational documents, each Trustee, officer, employee or other agent of the Trust is indemnified against certain liabilities that may arise out of the performance of their duties to the Fund. Additionally, in the normal course of business, the Fund enters into contracts, including the Fund’s servicing agreements, that contain a variety of indemnification clauses. The Fund’s maximum exposure under these arrangements is unknown as this would involve future claims that may be made against the Fund that have not yet occurred. The risk of material loss as a result of such indemnification claims is considered remote. |
| I. | Foreign Currency Translations — Foreign currency is valued at the close of the NYSE based on quotations posted by banks and major currency dealers. Portfolio securities and other assets and liabilities denominated in foreign currencies are translated into U.S. dollar amounts at date of valuation. Purchases and sales of portfolio securities (net of foreign taxes withheld on disposition) and income items denominated in foreign currencies are translated into U.S. dollar amounts on the respective dates of such transactions. The Fund does not separately account for the portion of the results of operations resulting from changes in foreign exchange rates on investments and the fluctuations arising from changes in market prices of securities held. The combined results of changes in foreign exchange rates and the fluctuation of market prices on investments (net of estimated foreign tax withholding) are included with the net realized and unrealized gain or loss from investments in the Statement of Operations. Reported net realized foreign currency gains or losses arise from (1) sales of foreign currencies, (2) currency gains or losses realized between the trade and settlement dates on securities transactions, and (3) the difference between the amounts of dividends, interest, and foreign withholding taxes recorded on the Fund’s books and the U.S. dollar equivalent of the amounts actually received or paid. Net unrealized foreign currency gains and losses arise from changes in the fair values of assets and liabilities, other than investments in securities at fiscal period end, resulting from changes in exchange rates. |
The Fund may invest in foreign securities, which may be subject to foreign taxes on income, gains on investments or currency repatriation, a portion of which may be recoverable. Foreign taxes, if any, are recorded based on the tax regulations and rates that exist in the foreign markets in which the Fund invests and are shown in the Statement of Operations.
| J. | Forward Foreign Currency Contracts — The Fund may engage in foreign currency transactions either on a spot (i.e. for prompt delivery and settlement) basis, or through forward foreign currency contracts, to manage or minimize currency or exchange rate risk. |
The Fund may also enter into forward foreign currency contracts for the purchase or sale of a security denominated in a foreign currency in order to “lock in” the U.S. dollar price of that security, or the Fund may also enter into forward foreign currency contracts that do not provide for physical settlement of the two currencies, but instead are settled by a single cash payment calculated as the difference between the agreed upon exchange rate and the spot rate at settlement based upon an agreed upon notional amount (non-deliverable forwards). The Fund will set aside liquid assets in an amount equal to the daily mark-to-market obligation for forward foreign currency contracts.
A forward foreign currency contract is an obligation between two parties (“Counterparties”) to purchase or sell a specific currency for an agreed-upon price at a future date. The use of forward foreign currency contracts does not eliminate fluctuations in the price of the underlying securities the Fund owns or intends to acquire but establishes a rate of exchange in advance. Fluctuations in the value of these contracts are measured by the difference in the contract date and reporting date exchange rates and are recorded as unrealized appreciation (depreciation) until the contracts are closed. When the contracts are closed, realized gains (losses) are recorded. Realized and unrealized gains (losses) on the contracts are included in the Statement of Operations. The primary risks associated with forward foreign currency contracts include failure of the
16 Invesco Low Volatility Emerging Markets Fund
Counterparty to meet the terms of the contract and the value of the foreign currency changing unfavorably. These risks may be in excess of the amounts reflected in the Statement of Assets and Liabilities.
| K. | Futures Contracts — The Fund may enter into futures contracts to manage exposure to interest rate, equity and market price movements and/or currency risks. A futures contract is an agreement between two parties (“Counterparties”) to purchase or sell a specified underlying security, currency or commodity (or delivery of a cash settlement price, in the case of an index future) for a fixed price at a future date. The Fund currently invests only in exchange-traded futures and they are standardized as to maturity date and underlying financial instrument. Initial margin deposits required upon entering into futures contracts are satisfied by the segregation of specific securities or cash as collateral at the futures commission merchant (broker). During the period the futures contracts are open, changes in the value of the contracts are recognized as unrealized gains or losses by recalculating the value of the contracts on a daily basis. Subsequent or variation margin payments are received or made depending upon whether unrealized gains or losses are incurred. These amounts are reflected as receivables or payables on the Statement of Assets and Liabilities. When the contracts are closed or expire, the Fund recognizes a realized gain or loss equal to the difference between the proceeds from, or cost of, the closing transaction and the Fund’s basis in the contract. The net realized gain (loss) and the change in unrealized gain (loss) on futures contracts held during the period is included on the Statement of Operations. The primary risks associated with futures contracts are market risk and the absence of a liquid secondary market. If the Fund were unable to liquidate a futures contract and/or enter into an offsetting closing transaction, the Fund would continue to be subject to market risk with respect to the value of the contracts and continue to be required to maintain the margin deposits on the futures contracts. Futures contracts have minimal Counterparty risk since the exchange’s clearinghouse, as Counterparty to all exchange-traded futures, guarantees the futures against default. Risks may exceed amounts recognized in the Statement of Assets and Liabilities. |
| L. | Collateral — To the extent the Fund has designated or segregated a security as collateral and that security is subsequently sold, it is the Fund’s practice to replace such collateral no later than the next business day. |
NOTE 2—Advisory Fees and Other Fees Paid to Affiliates
The Trust has entered into a master investment advisory agreement with Invesco Advisers, Inc. (the “Adviser” or “Invesco”). Under the terms of the investment advisory agreement, the Fund pays an advisory fee to the Adviser based on the annual rate of the Fund’s average daily net assets as follows:
| | | | | | | | |
| Average Daily Net Assets | | Rate | |
First $250 million | | | 0 | .935% | | | | |
Next $250 million | | | 0 | .910% | | | | |
Next $500 million | | | 0 | .885% | | | | |
Next $1.5 billion | | | 0 | .860% | | | | |
Next $2.5 billion | | | 0 | .835% | | | | |
Next $2.5 billion | | | 0 | .810% | | | | |
Next $2.5 billion | | | 0 | .785% | | | | |
Over $10 billion | | | 0 | .760% | | | | |
For the year ended October 31, 2016, the effective advisory fees incurred by the Fund was 0.935%.
Under the terms of a master sub-advisory agreement between the Adviser and each of Invesco Asset Management Deutschland GmbH, Invesco Asset Management Limited, Invesco Asset Management (Japan) Limited, Invesco Hong Kong Limited, Invesco Senior Secured Management, Inc., Invesco Canada Ltd. and Invesco PowerShares Capital Management LLC (collectively, the “Affiliated Sub-Advisers”) the Adviser, not the Fund, will pay 40% of the fees paid to the Adviser to any such Affiliated Sub-Adviser(s) that provide(s) discretionary investment management services to the Fund based on the percentage of assets allocated to such Affiliated Sub-Adviser(s).
The Adviser has contractually agreed, through at least February 28, 2017, to waive advisory fees and/or reimburse expenses to the extent necessary to limit total annual fund operating expenses after fee waiver and/or expense reimbursement (excluding certain items discussed below) of Class A, Class C, Class R, Class Y, Class R5 and Class R6 shares to 1.72%, 2.47%, 1.97%, 1.47%, 1.47% and 1.47%, respectively, of the Fund’s average daily net assets (the “expense limits”). In determining the Adviser’s obligation to waive advisory fees and/or reimburse expenses, the following expenses are not taken into account, and could cause total annual fund operating expenses after fee waiver and/or expense reimbursement to exceed the numbers reflected above: (1) interest; (2) taxes; (3) dividend expense on short sales; (4) extraordinary or non-routine items, including litigation expenses; and (5) expenses that the Fund has incurred but did not actually pay because of an expense offset arrangement. Unless Invesco continues the fee waiver agreement, it will terminate on February 28, 2017. During its term, the fee waiver agreement cannot be terminated or amended to increase the expense limits without approval of the Board of Trustees.
Further, the Adviser has contractually agreed, through at least June 30, 2018, to waive the advisory fee payable by the Fund in an amount equal to 100% of the net advisory fees the Adviser receives from the affiliated money market funds on investments by the Fund of uninvested cash in such affiliated money market funds.
For the year ended October 31, 2016, the Adviser waived advisory fees of $123,531 and reimbursed class level expenses of $3,654, $235, $35, $2,108, $1 and $115 of Class A, Class C, Class R, Class Y, Class R5 and Class R6 shares, respectively.
The Trust has entered into a master administrative services agreement with Invesco pursuant to which the Fund has agreed to pay Invesco for certain administrative costs incurred in providing accounting services to the Fund. For the year ended October 31, 2016, expenses incurred under the agreement are shown in the Statement of Operations as Administrative services fees.
The Trust has entered into a transfer agency and service agreement with Invesco Investment Services, Inc. (“IIS”) pursuant to which the Fund has agreed to pay IIS a fee for providing transfer agency and shareholder services to the Fund and reimburse IIS for certain expenses incurred by IIS in the course of providing such services. IIS may make payments to intermediaries that provide omnibus account services, sub-accounting services and/or networking services. All fees payable by IIS to intermediaries that provide omnibus account services or sub-accounting are charged back to the Fund,
17 Invesco Low Volatility Emerging Markets Fund
subject to certain limitations approved by the Trust’s Board of Trustees. For the year ended October 31, 2016, expenses incurred under the agreement are shown in the Statement of Operations as Transfer agent fees.
The Trust has entered into master distribution agreements with Invesco Distributors, Inc. (“IDI”) to serve as the distributor for the Class A, Class C, Class R, Class Y, Class R5 and Class R6 shares of the Fund. The Trust has adopted plans pursuant to Rule 12b-1 under the 1940 Act with respect to the Fund’s Class A, Class C and Class R shares (collectively the “Plans”). The Fund, pursuant to the Plans, pays IDI compensation at the annual rate of 0.25% of the Fund’s average daily net assets of Class A shares, 1.00% of the average daily net assets of Class C shares and 0.50% of the average daily net assets of Class R shares. Of the Plan payments, up to 0.25% of the average daily net assets of each class of shares may be paid to furnish continuing personal shareholder services to customers who purchase and own shares of such classes. Any amounts not paid as a service fee under the Plans would constitute an asset-based sales charge. Rules of the Financial Industry Regulatory Authority (“FINRA”) impose a cap on the total sales charges, including asset-based sales charges, that may be paid by any class of shares of the Fund. For the year ended October 31, 2016, expenses incurred under the Plans are shown in the Statement of Operations as Distribution fees.
Front-end sales commissions and CDSC (collectively, the “sales charges”) are not recorded as expenses of the Fund. Front-end sales commissions are deducted from proceeds from the sales of Fund shares prior to investment in Class A shares of the Fund. CDSC are deducted from redemption proceeds prior to remittance to the shareholder. During the year ended October 31, 2016, IDI advised the Fund that IDI retained $1,477 in front-end sales commissions from the sale of Class A shares.
Certain officers and trustees of the Trust are officers and directors of the Adviser, IIS and/or IDI.
NOTE 3—Additional Valuation Information
GAAP defines fair value as the price that would be received to sell an asset or paid to transfer a liability in an orderly transaction between market participants at the measurement date, under current market conditions. GAAP establishes a hierarchy that prioritizes the inputs to valuation methods, giving the highest priority to readily available unadjusted quoted prices in an active market for identical assets (Level 1) and the lowest priority to significant unobservable inputs (Level 3), generally when market prices are not readily available or are unreliable. Based on the valuation inputs, the securities or other investments are tiered into one of three levels. Changes in valuation methods may result in transfers in or out of an investment’s assigned level:
| | Level 1 — | Prices are determined using quoted prices in an active market for identical assets. |
| | Level 2 — | Prices are determined using other significant observable inputs. Observable inputs are inputs that other market participants may use in pricing a security. These may include quoted prices for similar securities, interest rates, prepayment speeds, credit risk, yield curves, loss severities, default rates, discount rates, volatilities and others. |
| | Level 3 — | Prices are determined using significant unobservable inputs. In situations where quoted prices or observable inputs are unavailable (for example, when there is little or no market activity for an investment at the end of the period), unobservable inputs may be used. Unobservable inputs reflect the Fund’s own assumptions about the factors market participants would use in determining fair value of the securities or instruments and would be based on the best available information. |
The following is a summary of the tiered valuation input levels, as of October 31, 2016. The level assigned to the securities valuations may not be an indication of the risk or liquidity associated with investing in those securities. Because of the inherent uncertainties of valuation, the values reflected in the financial statements may materially differ from the value received upon actual sale of those investments.
During the year ended October 31, 2016, there were transfers from Level 1 to Level 2 of $2,464,072 and from Level 2 to Level 1 of $3,667,431, due to foreign fair value adjustments.
| | | | | | | | | | | | | | | | |
| | | Level 1 | | | Level 2 | | | Level 3 | | | Total | |
Brazil | | $ | 5,342,777 | | | $ | — | | | $ | — | | | $ | 5,342,777 | |
Chile | | | 862,233 | | | | 1,243,988 | | | | — | | | | 2,106,221 | |
China | | | 1,835,464 | | | | 666,382 | | | | — | | | | 2,501,846 | |
India | | | 3,911,838 | | | | 1,004,541 | | | | — | | | | 4,916,379 | |
Indonesia | | | — | | | | 273,971 | | | | ��� | | | | 273,971 | |
Malaysia | | | 2,701,331 | | | | — | | | | — | | | | 2,701,331 | |
Mexico | | | 3,667,884 | | | | — | | | | — | | | | 3,667,884 | |
Philippines | | | 517,565 | | | | — | | | | — | | | | 517,565 | |
Poland | | | 727,388 | | | | — | | | | — | | | | 727,388 | |
Qatar | | | 179,297 | | | | — | | | | — | | | | 179,297 | |
Russia | | | 249,999 | | | | 3,403,016 | | | | — | | | | 3,653,015 | |
South Africa | | | 4,047,393 | | | | 326,303 | | | | — | | | | 4,373,696 | |
South Korea | | | 1,958,490 | | | | 2,606,715 | | | | — | | | | 4,565,205 | |
Taiwan | | | 1,689,140 | | | | 1,077,258 | | | | — | | | | 2,766,398 | |
Thailand | | | 2,264,249 | | | | 557,490 | | | | — | | | | 2,821,739 | |
Turkey | | | — | | | | 534,146 | | | | — | | | | 534,146 | |
United Arab Emirates | | | — | | | | 910,164 | | | | — | | | | 910,164 | |
| | | $ | 29,955,048 | | | $ | 12,603,974 | | | $ | — | | | $ | 42,559,022 | |
Futures Contracts* | | | 1,218 | | | | — | | | | — | | | | 1,218 | |
Total Investments | | $ | 29,956,266 | | | $ | 12,603,974 | | | $ | — | | | $ | 42,560,240 | |
| * | Unrealized appreciation. |
18 Invesco Low Volatility Emerging Markets Fund
NOTE 4—Derivative Investments
The Fund may enter into an International Swaps and Derivatives Association Master Agreement (“ISDA Master Agreement”) under which a Fund may trade OTC derivatives. An OTC transaction entered into under an ISDA Master Agreement typically involves a collateral posting arrangement, payment netting provisions and close-out netting provisions. These netting provisions allow for reduction of credit risk through netting of contractual obligations. The enforceability of the netting provisions of the ISDA Master Agreement depends on the governing law of the ISDA Master Agreement, among other factors.
For financial reporting purposes, the Fund does not offset OTC derivative assets or liabilities that are subject to ISDA Master Agreements in the Statement of Assets and Liabilities.
Value of Derivative Investments at Period-End
The table below summarizes the value of the Fund’s derivative investments, detailed by primary risk exposure, held as of October 31, 2016:
| | | | |
| | | Value | |
| Derivative Assets | | Equity Risk | |
Unrealized appreciation on futures contracts — Exchange-Traded(a) | | $ | 1,218 | |
Derivatives not subject to master netting agreement | | | (1,218 | ) |
Total Derivative Assets subject to master netting agreements | | $ | — | |
| (a) | Includes cumulative appreciation on futures contracts. Only current day’s variation margin receivable is reported within the Statement of Assets and Liabilities. |
Effect of Derivative Investments for the year ended October 31, 2016
The table below summarizes the gains (losses) on derivative investments, detailed by primary risk exposure, recognized in earnings during the period:
| | | | |
| | | Location of Gain (Loss) on
Statement of Operations | |
| | | Equity Risk | |
Realized Gain: | | | | |
Futures contracts | | $ | 239,023 | |
Change in Net Unrealized Appreciation (Depreciation): | | | | |
Futures contracts | | | (4,852 | ) |
Total | | $ | 234,171 | |
The table below summarizes the average notional value of futures contracts outstanding during the period.
| | | | |
| | | Futures Contracts | |
Average notional value | | $ | 682,697 | |
| | | | | | | | | | | | | | | | | | | | |
| Open Futures Contracts — Equity Risk(a) | |
| Futures Contracts | | Type of
Contract | | | Number of
Contracts | | | Expiration Month | | | Notional
Value | | | Unrealized
Appreciation | |
MSCI Emerging Markets Mini Index | | | Long | | | | 6 | | | | December-2016 | | | $ | 271,050 | | | $ | 1,218 | |
| (a) | Futures contracts collateralized by $12,000 cash held with Merrill Lynch, the futures commission merchant. |
NOTE 5—Trustees’ and Officers’ Fees and Benefits
Trustees’ and Officers’ Fees and Benefits include amounts accrued by the Fund to pay remuneration to certain Trustees and Officers of the Fund. Trustees have the option to defer compensation payable by the Fund, and Trustees’ and Officers’ Fees and Benefits also include amounts accrued by the Fund to fund such deferred compensation amounts. Those Trustees who defer compensation have the option to select various Invesco Funds in which their deferral accounts shall be deemed to be invested. Obligations under the deferred compensation plan represent unsecured claims against the general assets of the Fund.
NOTE 6—Cash Balances
The Fund is permitted to temporarily carry a negative or overdrawn balance in its account with State Street Bank and Trust Company, the custodian bank. Such balances, if any at period-end, are shown in the Statement of Assets and Liabilities under the payable caption Amount due custodian. To compensate the custodian bank for such overdrafts, the overdrawn Fund may either (1) leave funds as a compensating balance in the account so the custodian bank can be compensated by earning the additional interest; or (2) compensate by paying the custodian bank at a rate agreed upon by the custodian bank and Invesco, not to exceed the contractually agreed upon rate.
19 Invesco Low Volatility Emerging Markets Fund
NOTE 7—Distributions to Shareholders and Tax Components of Net Assets
Tax Character of Distributions to Shareholders Paid During the Fiscal Years Ended October 31, 2016 and 2015:
| | | | | | | | |
| | | 2016 | | | 2015 | |
Ordinary income | | $ | 32,442 | | | $ | 174,171 | |
Long-term capital gain | | | — | | | | 5,026 | |
Total distributions | | $ | 32,442 | | | $ | 179,197 | |
Tax Components of Net Assets at Period-End:
| | | | |
| | | 2016 | |
Undistributed ordinary income | | $ | 2,169,043 | |
Net unrealized appreciation — investments | | | 5,285,379 | |
Net unrealized appreciation (depreciation) — other investments | | | (4,827 | ) |
Temporary book/tax differences | | | (5,920 | ) |
Shares of beneficial interest | | | 35,536,778 | |
Total net assets | | | $42,980,453 | |
The difference between book-basis and tax-basis unrealized appreciation (depreciation) is due to differences in the timing of recognition of gains and losses on investments for tax and book purposes. The Fund’s net unrealized appreciation difference is attributable primarily to wash sales.
The temporary book/tax differences are a result of timing differences between book and tax recognition of income and/or expenses. The Fund’s temporary book/tax differences are the result of the trustee deferral of compensation and retirement plan benefits.
Capital loss carryforward is calculated and reported as of a specific date. Results of transactions and other activity after that date may affect the amount of capital loss carryforward actually available for the Fund to utilize. Capital losses generated in years beginning after December 22, 2010 can be carried forward for an unlimited period, whereas previous losses expire in eight tax years. Capital losses with an expiration period may not be used to offset capital gains until all net capital losses without an expiration date have been utilized. Capital loss carryforwards with no expiration date will retain their character as either short-term or long-term capital losses instead of as short-term capital losses as under prior law. The ability to utilize capital loss carryforwards in the future may be limited under the Internal Revenue Code and related regulations based on the results of future transactions.
The Fund does not have a capital loss carryforward as of October 31, 2016.
NOTE 8—Investment Securities
The aggregate amount of investment securities (other than short-term securities, U.S. Treasury obligations and money market funds, if any) purchased and sold by the Fund during the year ended October 31, 2016 was $50,648,425 and $18,673,762, respectively. Cost of investments on a tax basis includes the adjustments for financial reporting purposes as of the most recently completed federal income tax reporting period-end.
| | | | |
| Unrealized Appreciation (Depreciation) of Investment Securities on a Tax Basis | |
Aggregate unrealized appreciation of investment securities | | $ | 6,738,570 | |
Aggregate unrealized (depreciation) of investment securities | | | (1,453,191 | ) |
Net unrealized appreciation of investment securities | | $ | 5,285,379 | |
Cost of investments for tax purposes is $37,273,643.
NOTE 9—Reclassification of Permanent Differences
Primarily as a result of differing book/tax treatment of foreign capital gains taxes and foreign currency transactions, on October 31, 2016, undistributed net investment income was decreased by $76,775, undistributed net realized gain was increased by $76,000 and shares of beneficial interest was increased by $775. This reclassification had no effect on the net assets of the Fund.
20 Invesco Low Volatility Emerging Markets Fund
NOTE 10—Share Information
| | | | | | | | | | | | | | | | |
| | | Summary of Share Activity | |
| | | Years ended October 31, | |
| | | 2016(a) | | | 2015 | |
| | | Shares | | | Amount | | | Shares | | | Amount | |
Sold: | | | | | | | | | | | | | | | | |
Class A | | | 275,849 | | | $ | 2,238,184 | | | | 145,238 | | | $ | 1,412,907 | |
Class C | | | 30,165 | | | | 236,911 | | | | 6,179 | | | | 59,078 | |
Class R | | | 2,519 | | | | 20,393 | | | | 1,391 | | | | 13,595 | |
Class Y | | | 75,991 | | | | 652,971 | | | | 113,987 | | | | 1,037,476 | |
Class R6(b) | | | 5,111,134 | | | | 36,140,706 | | | | — | | | | — | |
| | | | |
Issued as reinvestment of dividends: | | | | | | | | | | | | | | | | |
Class A | | | 561 | | | | 3,960 | | | | 1,508 | | | | 13,720 | |
Class C | | | 8 | | | | 55 | | | | 288 | | | | 2,611 | |
Class R | | | 13 | | | | 89 | | | | 67 | | | | 610 | |
Class Y | | | 387 | | | | 2,735 | | | | 126 | | | | 1,146 | |
Class R5 | | | — | | | | — | | | | 1,686 | | | | 15,338 | |
| | | | |
Reacquired: | | | | | | | | | | | | | | | | |
Class A | | | (47,244 | ) | | | (385,042 | ) | | | (122,441 | ) | | | (1,139,784 | ) |
Class C | | | (6,119 | ) | | | (47,740 | ) | | | (6,888 | ) | | | (56,357 | ) |
Class R | | | (2,323 | ) | | | (19,018 | ) | | | — | | | | — | |
Class Y | | | (11,902 | ) | | | (99,446 | ) | | | (85,388 | ) | | | (825,975 | ) |
Class R5 | | | — | | | | — | | | | (32,778 | ) | | | (300,901 | ) |
Class R6 | | | (853,044 | ) | | | (7,113,916 | ) | | | — | | | | — | |
Net increase in share activity | | | 4,575,995 | | | $ | 31,630,842 | | | | 22,975 | | | $ | 233,464 | |
| (a) | 92% of the outstanding shares of the Fund are owned by the Adviser. |
| (b) | On February 18, 2016, 4,986,532 Class R6 shares valued at $35,254,781 were sold to affiliated mutual funds. |
21 Invesco Low Volatility Emerging Markets Fund
NOTE 11—Financial Highlights
The following schedule presents financial highlights for a share of the Fund outstanding throughout the periods indicated.
| | | | | | | | | | | | | | | | | | | | | | | | | | | | | | | | | | | | | | | | | | | | | | | | | | | | | | | | |
| | | Net asset
value,
beginning
of period | | | Net
investment
income(a) | | | Net gains
(losses)
on securities
(both
realized and
unrealized) | | | Total from
investment
operations | | | Dividends
from net
investment
income | | | Distributions
from net
realized
gains | | | Total
distributions | | | Net asset value, end of period | | | Total
return(b) | | | Net assets,
end of period
(000’s omitted) | | | Ratio of
expenses
to average
net assets
with fee waivers
and/or expenses
absorbed | | | Ratio of
expenses
to average net
assets without
fee waivers
and/or expenses
absorbed | | | Ratio of net
investment
income
to average
net assets | | | Portfolio
turnover(c) | |
Class A | |
Year ended 10/31/16 | | $ | 8.08 | | | $ | 0.17 | | | $ | 0.46 | | | $ | 0.63 | | | $ | (0.07 | ) | | $ | — | | | $ | (0.07 | ) | | $ | 8.64 | | | | 7.98 | % | | $ | 3,617 | | | | 1.72 | %(e) | | | 2.27 | %(e) | | | 2.08 | %(e) | | | 63 | % |
Year ended 10/31/15 | | | 10.32 | | | | 0.14 | | | | (1.91 | ) | | | (1.77 | ) | | | (0.35 | ) | | | (0.12 | ) | | | (0.47 | ) | | | 8.08 | | | | (17.67 | ) | | | 1,531 | | | | 1.72 | | | | 7.99 | | | | 1.52 | | | | 105 | |
Year ended 10/31/14(d) | | | 10.00 | | | | 0.15 | | | | 0.17 | | | | 0.32 | | | | — | | | | — | | | | — | | | | 10.32 | | | | 3.20 | | | | 1,705 | | | | 1.71 | (f) | | | 10.36 | (f) | | | 1.69 | (f) | | | 38 | |
Class C | | | | | | | | | | | | | | | | | | | | | | | | | | | | | | | | | | | | | | | | | | | | | | | | | | | | | | | | |
Year ended 10/31/16 | | | 8.00 | | | | 0.11 | | | | 0.45 | | | | 0.56 | | | | (0.01 | ) | | | — | | | | (0.01 | ) | | | 8.55 | | | | 7.08 | | | | 250 | | | | 2.47 | (e) | | | 3.02 | (e) | | | 1.33 | (e) | | | 63 | |
Year ended 10/31/15 | | | 10.26 | | | | 0.07 | | | | (1.90 | ) | | | (1.83 | ) | | | (0.31 | ) | | | (0.12 | ) | | | (0.43 | ) | | | 8.00 | | | | (18.29 | ) | | | 41 | | | | 2.47 | | | | 8.74 | | | | 0.77 | | | | 105 | |
Year ended 10/31/14(d) | | | 10.00 | | | | 0.09 | | | | 0.17 | | | | 0.26 | | | | — | | | | — | | | | — | | | | 10.26 | | | | 2.60 | | | | 57 | | | | 2.46 | (f) | | | 11.11 | (f) | | | 0.94 | (f) | | | 38 | |
Class R | |
Year ended 10/31/16 | | | 8.06 | | | | 0.15 | | | | 0.46 | | | | 0.61 | | | | (0.05 | ) | | | — | | | | (0.05 | ) | | | 8.62 | | | | 7.68 | | | | 26 | | | | 1.97 | (e) | | | 2.52 | (e) | | | 1.83 | (e) | | | 63 | |
Year ended 10/31/15 | | | 10.30 | | | | 0.12 | | | | (1.90 | ) | | | (1.78 | ) | | | (0.34 | ) | | | (0.12 | ) | | | (0.46 | ) | | | 8.06 | | | | (17.81 | ) | | | 23 | | | | 1.97 | | | | 8.24 | | | | 1.27 | | | | 105 | |
Year ended 10/31/14(d) | | | 10.00 | | | | 0.13 | | | | 0.17 | | | | 0.30 | | | | — | | | | — | | | | — | | | | 10.30 | | | | 3.00 | | | | 14 | | | | 1.96 | (f) | | | 10.61 | (f) | | | 1.44 | (f) | | | 38 | |
Class Y | |
Year ended 10/31/16 | | | 8.10 | | | | 0.19 | | | | 0.46 | | | | 0.65 | | | | (0.09 | ) | | | — | | | | (0.09 | ) | | | 8.66 | | | | 8.25 | | | | 1,987 | | | | 1.47 | (e) | | | 2.02 | (e) | | | 2.33 | (e) | | | 63 | |
Year ended 10/31/15 | | | 10.35 | | | | 0.16 | | | | (1.92 | ) | | | (1.76 | ) | | | (0.37 | ) | | | (0.12 | ) | | | (0.49 | ) | | | 8.10 | | | | (17.50 | ) | | | 1,337 | | | | 1.47 | | | | 7.74 | | | | 1.77 | | | | 105 | |
Year ended 10/31/14(d) | | | 10.00 | | | | 0.18 | | | | 0.17 | | | | 0.35 | | | | — | | | | — | | | | — | | | | 10.35 | | | | 3.50 | | | | 1,411 | | | | 1.46 | (f) | | | 10.11 | (f) | | | 1.94 | (f) | | | 38 | |
Class R5 | |
Year ended 10/31/16 | | | 8.10 | | | | 0.18 | | | | 0.47 | | | | 0.65 | | | | (0.09 | ) | | | — | | | | (0.09 | ) | | | 8.66 | | | | 8.25 | | | | 130 | | | | 1.47 | (e) | | | 1.87 | (e) | | | 2.33 | (e) | | | 63 | |
Year ended 10/31/15 | | | 10.35 | �� | | | 0.16 | | | | (1.92 | ) | | | (1.76 | ) | | | (0.37 | ) | | | (0.12 | ) | | | (0.49 | ) | | | 8.10 | | | | (17.50 | ) | | | 122 | | | | 1.47 | | | | 7.64 | | | | 1.77 | | | | 105 | |
Year ended 10/31/14(d) | | | 10.00 | | | | 0.18 | | | | 0.17 | | | | 0.35 | | | | — | | | | — | | | | — | | | | 10.35 | | | | 3.50 | | | | 477 | | | | 1.46 | (f) | | | 10.06 | (f) | | | 1.94 | (f) | | | 38 | |
Class R6 | |
Year ended 10/31/16 | | | 8.10 | | | | 0.19 | | | | 0.45 | | | | 0.64 | | | | (0.09 | ) | | | — | | | | (0.09 | ) | | | 8.65 | | | | 8.12 | | | | 36,970 | | | | 1.47 | (e) | | | 1.87 | (e) | | | 2.33 | (e) | | | 63 | |
Year ended 10/31/15 | | | 10.35 | | | | 0.16 | | | | (1.92 | ) | | | (1.76 | ) | | | (0.37 | ) | | | (0.12 | ) | | | (0.49 | ) | | | 8.10 | | | | (17.50 | ) | | | 122 | | | | 1.47 | | | | 7.64 | | | | 1.77 | | | | 105 | |
Year ended 10/31/14(d) | | | 10.00 | | | | 0.18 | | | | 0.17 | | | | 0.35 | | | | — | | | | — | | | | — | | | | 10.35 | | | | 3.50 | | | | 155 | | | | 1.46 | (f) | | | 10.06 | (f) | | | 1.94 | (f) | | | 38 | |
| (a) | Calculated using average shares outstanding. |
| (b) | Includes adjustments in accordance with accounting principles generally accepted in the United States of America and as such, the net asset value for financial reporting purposes and the returns based upon those net asset values may differ from the net asset value and returns for shareholder transactions. Does not include sales charges and is not annualized for periods less than one year, if applicable. |
| (c) | Portfolio turnover is calculated at the fund level and is not annualized for periods less than one year, if applicable. |
| (d) | Commencement date of December 17, 2013. |
| (e) | Ratios are based on average daily net assets (000’s omitted) of $2,412, $155, $23, $1,391, $119 and $26,738 for Class A, Class C, Class R, Class Y, Class R5 and Class R6 shares, respectively. |
NOTE 12—Subsequent Event
Effective January 1, 2017, the Adviser has contractually agreed, through at least February 28, 2018, to waive advisory fees and/or reimburse expenses to the extent necessary to limit total annual fund operating expenses after fee waiver and/or expense reimbursement (excluding certain items discussed in Note 2) of Class A, Class C, Class R, Class Y, Class R5 and Class R6 shares to 1.33%, 2.08%, 1.58%, 1.08%, 1.08% and 1.08%, respectively, of the Fund’s average daily net assets.
22 Invesco Low Volatility Emerging Markets Fund
Report of Independent Registered Public Accounting Firm
To the Board of Trustees and Shareholders of the
Invesco Low Volatility Emerging Markets Fund:
In our opinion, the accompanying statement of assets and liabilities, including the schedule of investments, and the related statements of operations and of changes in net assets and the financial highlights present fairly, in all material respects, the financial position of the Invesco Low Volatility Emerging Markets Fund (the “Fund”) as of October 31, 2016, the results of its operations for the year then ended, the changes in its net assets for each of the two years in the period then ended and the financial highlights for each of the two years in the period then ended and for the period December 17, 2013 (commencement of operations) through October 31, 2014, in conformity with accounting principles generally accepted in the United States of America. These financial statements and financial highlights (hereafter referred to as “financial statements”) are the responsibility of the Fund’s management. Our responsibility is to express an opinion on these financial statements based on our audits. We conducted our audits of these financial statements in accordance with the standards of the Public Company Accounting Oversight Board (United States). Those standards require that we plan and perform the audit to obtain reasonable assurance about whether the financial statements are free of material misstatement. An audit includes examining, on a test basis, evidence supporting the amounts and disclosures in the financial statements, assessing the accounting principles used and significant estimates made by management, and evaluating the overall financial statement presentation. We believe that our audits, which included confirmation of securities as of October 31, 2016 by correspondence with the custodian and brokers, provide a reasonable basis for our opinion.
PRICEWATERHOUSECOOPERS LLP
Houston, Texas
December 21, 2016
23 Invesco Low Volatility Emerging Markets Fund
Calculating your ongoing Fund expenses
Example
As a shareholder of the Fund, you incur two types of costs: (1) transaction costs, which may include sales charges (loads) on purchase payments or contingent deferred sales charges on redemptions, if any; and (2) ongoing costs, including management fees, distribution and/or service (12b-1) fees, and other Fund expenses. This example is intended to help you understand your ongoing costs (in dollars) of investing in the Fund and to compare these costs with ongoing costs of investing in other mutual funds. The example is based on an investment of $1,000 invested at the beginning of the period and held for the entire period May 1, 2016 through October 31, 2016.
Actual expenses
The table below provides information about actual account values and actual expenses. You may use the information in this table, together with the amount you invested, to estimate the expenses that you paid over the period. Simply divide your account value by $1,000 (for example, an $8,600 account value divided by $1,000 = 8.6), then multiply the result by the number in the table under the heading entitled “Actual Expenses Paid During Period” to estimate the expenses you paid on your account during this period.
Hypothetical example for comparison purposes
The table below also provides information about hypothetical account values and hypothetical expenses based on the Fund’s actual expense ratio and an assumed rate of return of 5% per year before expenses, which is not the Fund’s actual return.
The hypothetical account values and expenses may not be used to estimate the actual ending account balance or expenses you paid for the period. You may use this information to compare the ongoing costs of investing in the Fund and other funds. To do so, compare this 5% hypothetical example with the 5% hypothetical examples that appear in the shareholder reports of the other funds.
Please note that the expenses shown in the table are meant to highlight your ongoing costs only and do not reflect any transaction costs, such as sales charges (loads) on purchase payments or contingent deferred sales charges on redemptions, if any. Therefore, the hypothetical information is useful in comparing ongoing costs only, and will not help you determine the relative total costs of owning different funds. In addition, if these transaction costs were included, your costs would have been higher.
| | | | | | | | | | | | | | | | | | | | | | | | |
| Class | | Beginning
Account Value
(05/01/16) | | | ACTUAL | | | HYPOTHETICAL
(5% annual return before expenses) | | | Annualized
Expense
Ratio2 | |
| | | Ending
Account Value
(10/31/16)1 | | | Expenses
Paid During
Period2,3 | | | Ending
Account Value
(10/31/16) | | | Expenses
Paid During
Period2,4 | | |
A | | $ | 1,000.00 | | | $ | 1,056.20 | | | $ | 8.89 | | | $ | 1,016.49 | | | $ | 8.72 | | | | 1.72 | % |
C | | | 1,000.00 | | | | 1,051.70 | | | | 12.74 | | | | 1,012.72 | | | | 12.50 | | | | 2.47 | |
R | | | 1,000.00 | | | | 1,055.10 | | | | 10.18 | | | | 1,015.23 | | | | 9.98 | | | | 1.97 | |
Y | | | 1,000.00 | | | | 1,058.70 | | | | 7.61 | | | | 1,017.75 | | | | 7.46 | | | | 1.47 | |
R5 | | | 1,000.00 | | | | 1,058.70 | | | | 7.61 | | | | 1,017.75 | | | | 7.46 | | | | 1.47 | |
R6 | | | 1,000.00 | | | | 1,057.50 | | | | 7.60 | | | | 1,017.75 | | | | 7.46 | | | | 1.47 | |
| 1 | The actual ending account value is based on the actual total return of the Fund for the period May 1, 2016 through October 31, 2016, after actual expenses and will differ from the hypothetical ending account value which is based on the Fund’s expense ratio and a hypothetical annual return of 5% before expenses. |
| 2 | Expenses are equal to the Fund’s annualized expense ratio as indicated above multiplied by the average account value over the period, multiplied by 184/366 to reflect the most recent fiscal half year. Effective January 1, 2017, the Fund’s adviser has contractually agreed to waive advisory fees and/or reimburse expenses to the extent necessary to limit total annual fund operating expenses of Class A, Class C, Class R, Class Y, Class R5 and Class R6 shares to 1.33%, 2.08%, 1.58%, 1.08%, 1.08% and 1.08% of average daily net assets, respectively. The annualized ratios restated as if these agreements had been in effect throughout the entire most recent fiscal half year are 1.33%, 2.08%, 1.58%, 1.08%, 1.08% and 1.08%, for Class A, Class C, Class R, Class Y, Class R5 and Class R6 shares, respectively. |
| 3 | The actual expenses paid restated as if the changes discussed above had been in effect throughout the entire most recent fiscal half year are $6.87, $10.73, $8.16, $5.59, $5.59 and $5.59 for Class A, Class C, Class R, Class Y, Class R5 and Class R6 shares, respectively. |
| 4 | The hypothetical expenses paid restated as if the changes discussed above had been in effect throughout the entire most recent fiscal half year are $6.75, $10.53, $8.01, $5.48, $5.48 and $5.48 for Class A, Class C, Class R, Class Y, Class R5 and Class R6 shares, respectively. |
24 Invesco Low Volatility Emerging Markets Fund
Approval of Investment Advisory and Sub-Advisory Contracts
The Board of Trustees (the Board) of AIM Investment Funds (Invesco Investment Funds) is required under the Investment Company Act of 1940, as amended, to approve annually the renewal of Invesco Low Volatility Emerging Markets Fund’s (the Fund) investment advisory agreements. During contract renewal meetings held on June 7-8, 2016, the Board as a whole, and the disinterested or “independent” Trustees, who comprise over 75% of the Board, voting separately, approved the continuance for the Fund of the Master Investment Advisory Agreement with Invesco Advisers, Inc. (Invesco Advisers and the investment advisory agreement) and the Master Intergroup Sub-Advisory Contract for Mutual Funds with Invesco Asset Management Deutschland GmbH, Invesco Asset Management Limited, Invesco Asset Management (Japan) Limited, Invesco Hong Kong Limited, Invesco Senior Secured Management, Inc., Invesco Canada Ltd. and Invesco PowerShares Capital Management LLC (collectively, the Affiliated Sub-Advisers and the sub-advisory contracts) for another year, effective July 1, 2016.
In evaluating the fairness and reasonableness of compensation under the Fund’s investment advisory agreement and sub-advisory contracts, the Board considered, among other things, the factors discussed below. The Board determined that continuation of the Fund’s investment advisory agreement and the sub-advisory contracts is in the best interest of the Fund and its shareholders and that the compensation payable to Invesco Advisers and the Affiliated Sub-Advisers under the agreements is fair and reasonable.
The Board’s Fund Evaluation Process
The Board’s Investments Committee has established three Sub-Committees, which meet throughout the year to review the performance of funds advised by Invesco Advisers (the Invesco Funds). Over the course of each year, the Sub-Committees meet with portfolio managers for their assigned Invesco Funds and other members of management to review the performance, investment objective(s), policies, strategies, limitations and investment risks of these funds. The Board had the benefit of reports from the Sub-Committees and Investments Committee throughout the year in considering approval of the continuance of each Invesco Fund’s investment advisory agreement and sub-advisory contracts for another year.
During the contract renewal process, the Board receives comparative performance and fee data regarding the Invesco Funds prepared by Invesco Advisers and Broadridge Financial Solutions, Inc. (Broadridge), an independent provider of investment company data. The Board also receives an independent written evaluation from the Senior Officer, an officer of the Invesco Funds who reports directly to the
independent Trustees. The Senior Officer’s evaluation is prepared as part of his responsibility to manage the process by which the Invesco Funds’ proposed management fees are negotiated during the annual contract renewal process to ensure they are negotiated in a manner that is at arms’ length and reasonable. In addition to meetings with Invesco Advisers and fund counsel, the independent Trustees also discuss the continuance of the investment advisory agreement and sub-advisory contracts in separate sessions with the Senior Officer and with independent legal counsel.
The Trustees recognized that the advisory fee rates for the Invesco Funds are, in many cases, the result of years of review and negotiation. The Trustees’ deliberations and conclusions in a particular year may be based in part on their deliberations and conclusions regarding these arrangements throughout the year and in prior years. The Trustees’ review and conclusions are based on the comprehensive consideration of all information presented to them and are not the result of any single determinative factor. Moreover, one Trustee may have weighed a particular piece of information or factor differently than another Trustee.
The discussion below is a summary of the Senior Officer’s independent written evaluation with respect to the Fund’s investment advisory agreement as well as a discussion of the material factors and related conclusions that formed the basis for the Board’s approval of the Fund’s investment advisory agreement and sub-advisory contracts. Unless otherwise stated, this information is current as of June 8, 2016, and does not reflect consideration of factors that became known to the Board after that date.
Factors and Conclusions and Summary of Independent Written Fee Evaluation
| A. | Nature, Extent and Quality of Services Provided by Invesco Advisers and the Affiliated Sub-Advisers |
The Board reviewed the advisory services provided to the Fund by Invesco Advisers under the Fund’s investment advisory agreement, the performance of Invesco Advisers in providing these services, and the credentials and experience of the officers and employees of Invesco Advisers who provide these services, including the Fund’s portfolio manager or managers. The Board’s review of the qualifications of Invesco Advisers to provide advisory services included the Board’s consideration of Invesco Advisers’ investment process oversight, independent credit analysis and investment risk management. The Board also considered non-advisory services that Invesco Advisers and its affiliates provide to the Invesco Funds such as various back office support functions, trading operations, internal audit, valuation and legal and compliance.
In determining whether to continue the Fund’s investment advisory agreement, the Board considered the benefits of reapproving an existing relationship and the greater uncertainty that may be associated with entering into a new relationship. The Board concluded that the nature, extent and quality of the services provided to the Fund by Invesco Advisers are appropriate and satisfactory and consistent with the terms of the Fund’s investment advisory agreement.
The Board reviewed the services that may be provided by the Affiliated Sub-Advisers under the sub-advisory contracts and the credentials and experience of the officers and employees of the Affiliated Sub-Advisers who provide these services. The Board noted that the Affiliated Sub-Advisers have offices and personnel that are located in financial centers around the world. As a result, the Board noted that Affiliated Sub-Advisers can provide research and investment analysis on the markets and economies of various countries in which the Fund may invest, make recommendations regarding securities and assist with security trades. The Board concluded that the sub-advisory contracts may benefit the Fund and its shareholders by permitting Invesco Advisers to use the resources and talents of the Affiliated Sub-Advisers in managing the Fund. The Board concluded that the nature, extent and quality of the services that may be provided by the Affiliated Sub-Advisers are appropriate and satisfactory and consistent with the terms of the Fund’s sub-advisory contracts.
The Board considered Fund performance as a relevant factor in considering whether to approve the investment advisory agreement as well as the sub-advisory contracts for the Fund, as Invesco Asset Management Deutschland GmbH currently manages assets of the Fund.
The Board compared the Fund’s performance during the past one and two calendar years to the performance of funds in the Broadridge performance universe and against the Lipper Emerging Markets Funds Index. The Board noted that performance of Class A shares of the Fund was in the fifth quintile of its performance universe for the one and two year periods (the first quintile being the best performing funds and the fifth quintile being the worst performing funds). The Board noted that performance of Class A shares of the Fund was below the performance of the Index for the one and two year periods. The Trustees also reviewed more recent Fund performance and this review did not change their conclusions.
| C. | Advisory and Sub-Advisory Fees |
The Board compared the Fund’s contractual management fee rate to the contractual management fee rates of funds in the Fund’s Broadridge expense group at a common asset level. The Board noted that the contractual
25 Invesco Low Volatility Emerging Markets Fund
management fee rate for Class A shares of the Fund was below the median contractual management fee rate of funds in its expense group. The Board noted that the term “contractual management fee” for funds in the expense group may include both advisory and certain administrative services fees, but that Broadridge does not provide information on a fund by fund basis as to what is included. The Board noted that Invesco does not separately charge the Invesco Funds for the administrative services included in the term as defined by Broadridge. The Board also reviewed the methodology used by Broadridge in providing expense group information, which includes using each fund’s contractual fee schedule (including any applicable breakpoints) as reported in the most recent prospectus or statement of information for each fund in the expense group.
The Board noted that Invesco Advisers has contractually agreed to waive fees and/or limit expenses of the Fund through at least February 28, 2017 in an amount necessary to limit total annual operating expenses to a specified percentage of average daily net assets for each class of the Fund.
The Board noted that Invesco Advisers and the Affiliated Sub-Advisers do not manage other mutual funds or client accounts with investment strategies comparable to those of the Fund.
The Board also considered the services that may be provided by the Affiliated Sub-Advisers pursuant to the sub-advisory contracts, as well as the fees payable by Invesco Advisers to the Affiliated Sub-Advisers pursuant to the sub-advisory contracts. The Board noted that Invesco Advisers retains overall responsibility for, and provides services to, sub-advised Invesco Funds, including oversight of the Affiliated Sub-Advisers as well as the additional services described herein other than day-to-day portfolio management. The Board also noted that the sub-advisory fees are not paid directly by the Fund, but rather, are payable by Invesco Advisers to the Affiliated Sub-Advisers.
| D. | Economies of Scale and Breakpoints |
The Board considered the extent to which there are economies of scale in the provision of advisory services to the Fund. The Board also considered whether the Fund benefits from economies of scale through contractual breakpoints in the Fund’s advisory fee schedule. The Board also noted that the Fund shares directly in economies of scale through lower fees charged by third party service providers based on the combined size of the Invesco Funds and other clients advised by Invesco Advisers.
| E. | Profitability and Financial Resources |
The Board reviewed information from Invesco Advisers concerning the costs of the advisory and other services that Invesco Advisers and its affiliates provide to the Fund and the Invesco Funds and the profitability of Invesco Advisers and its affiliates in providing these services. The Board received information from Invesco Advisers and a report from an independent
consultant engaged by the Senior Officer about the methodology used to prepare the profitability information. The Board noted that Invesco Advisers continues to operate at a net profit from services Invesco Advisers and its affiliates provide to the Invesco Funds. The Board noted that although Invesco Advisers received a minimal amount of revenues from advising the Fund, Invesco Advisers and its subsidiaries did not make a profit from managing the Fund. The Board received and accepted information from Invesco Advisers demonstrating that Invesco Advisers and each Affiliated Sub-Adviser are financially sound and have the resources necessary to perform their obligations under the investment advisory agreement and sub-advisory contracts.
| F. | Collateral Benefits to Invesco Advisers and its Affiliates |
The Board considered various other benefits received by Invesco Advisers and its affiliates from the relationship with the Fund, including the fees received for providing transfer agency and distribution services to the Fund. The Board considered comparative information regarding fees charged for these services, including information provided by Broadridge and other independent sources. The Board considered the performance of Invesco Advisers and its affiliates in providing these services and the organizational structure employed to provide these services. The Board also considered that these services are provided to the Fund pursuant to written contracts that are reviewed and approved on an annual basis by the Board; and that the services are required for the operation of the Fund.
The Board considered the benefits realized by Invesco Advisers and the Affiliated Sub-Advisers as a result of portfolio brokerage transactions executed through “soft dollar” arrangements. The Board noted that soft dollar arrangements shift the payment obligation for research services from Invesco Advisers and the Affiliated Sub-Advisers to the Invesco Funds and that the research received may be used with other clients of Invesco Advisers and may reduce Invesco Advisers’ and the Affiliated Sub-Advisers’ expenses. The Board also considered that it receives periodic reports from the Chief Compliance Officer of the Invesco Funds demonstrating that these arrangements are consistent with regulatory requirements. The Board did not deem the soft dollar arrangements to be inappropriate.
The Board considered that the Fund’s uninvested cash and cash collateral from any securities lending arrangements may be invested in money market funds advised by Invesco Advisers pursuant to procedures approved by the Board. The Board noted that Invesco Advisers receives advisory fees from these affiliated money market funds attributable to such investments, although Invesco Advisers has contractually agreed to waive through varying periods the advisory fees payable by the Invesco Funds with respect to certain investments in the affiliated money
market funds. The waiver is in an amount equal to 100% of the net advisory fee Invesco Advisers receives from the affiliated money market funds with respect to the Fund’s investment in the affiliated money market funds of uninvested cash, but not cash collateral. The Board concluded that the amount of advisory fees received by Invesco Advisors from the Fund’s investment of cash collateral from any securities lending arrangements in the affiliated money market funds is fair and reasonable.
The Board also considered the Fund may use an affiliated broker to execute certain trades for the Fund to, among other things, control information leakage, and were advised that such trades would be executed in compliance with rules under the Investment Company Act of 1940, as amended, and consistent with best execution obligations.
26 Invesco Low Volatility Emerging Markets Fund
Tax Information
Form 1099-DIV, Form 1042-S and other year–end tax information provide shareholders with actual calendar year amounts that should be included in their tax returns. Shareholders should consult their tax advisors.
The following distribution information is being provided as required by the Internal Revenue Code or to meet a specific state’s requirement.
The Fund designates the following amounts or, if subsequently determined to be different, the maximum amount allowable for its fiscal year ended October 31, 2016:
| | | | |
Federal and State Income Tax | |
Qualified Dividend Income* | | | 72.64 | % |
Corporate Dividends Received Deduction* | | | 0.00 | % |
U.S. Treasury Obligations* | | | 0.00 | % |
| | * | The above percentages are based on ordinary income dividends paid to shareholders during the Fund’s fiscal year. |
27 Invesco Low Volatility Emerging Markets Fund
Trustees and Officers
The address of each trustee and officer is AIM Investment Funds (Invesco Investment Funds) (the “Trust”), 11 Greenway Plaza, Suite 1000, Houston, Texas 77046-1173. The trustees serve for the life of the Trust, subject to their earlier death, incapacitation, resignation, retirement or removal as more specifically provided in the Trust’s organizational documents. Each officer serves for a one year term or until their successors are elected and qualified. Column two below includes length of time served with predecessor entities, if any.
| | | | | | | | |
Name, Year of Birth and
Position(s) Held with the Trust | | Trustee and/
or Officer Since | | Principal Occupation(s)
During Past 5 Years | | Number of
Funds in Fund
Complex
Overseen by
Trustee | | Other Directorship(s)
Held by Trustee During
Past 5 Years |
| Interested Persons | | | | | | | | |
| Martin L. Flanagan1 — 1960 Trustee | | 2007 | | Executive Director, Chief Executive Officer and President, Invesco Ltd. (ultimate parent of Invesco and a global investment management firm); Advisor to the Board, Invesco Advisers, Inc. (formerly known as Invesco Institutional (N.A.), Inc.); Trustee, The Invesco Funds; Vice Chair, Investment Company Institute; and Member of Executive Board, SMU Cox School of Business Formerly: Chairman and Chief Executive Officer, Invesco Advisers, Inc. (registered investment adviser); Director, Chairman, Chief Executive Officer and President, Invesco Holding Company (US) Inc. (formerly IVZ Inc.) (holding company), Invesco Group Services, Inc. (service provider) and Invesco North American Holdings, Inc. (holding company); Director, Chief Executive Officer and President, Invesco Holding Company Limited (parent of Invesco and a global investment management firm); Director, Invesco Ltd.; Chairman, Investment Company Institute and President, Co-Chief Executive Officer, Co-President, Chief Operating Officer and Chief Financial Officer, Franklin Resources, Inc. (global investment management organization) | | 146 | | None |
| Philip A. Taylor2 — 1954 Trustee and Senior Vice President | | 2006 | | Head of the Americas and Senior Managing Director, Invesco Ltd.; Director, Co-Chairman, Co-President and Co-Chief Executive Officer, Invesco Advisers, Inc. (formerly known as Invesco Institutional (N.A.), Inc.) (registered investment adviser); Director, Chairman, Chief Executive Officer and President, Invesco Management Group, Inc. (formerly known as Invesco AIM Management Group, Inc.) (financial services holding company); Director and Chairman, Invesco Investment Services, Inc. (formerly known as Invesco AIM Investment Services, Inc.) (registered transfer agent) Chief Executive Officer, Invesco Corporate Class Inc. (corporate mutual fund company) Director, Chairman and Chief Executive Officer, Invesco Canada Ltd. (formerly known as Invesco Trimark Ltd./Invesco Trimark Ltèe) (registered investment adviser and registered transfer agent); Trustee and Senior Vice President, The Invesco Funds; Director, Invesco Investment Advisers LLC (formerly known as Van Kampen Asset Management). Formerly: Director, Chief Executive Officer and President, Van Kampen Exchange Corp.; President and Principal Executive Officer, The Invesco Funds (other than AIM Treasurer’s Series Trust (Invesco Treasurer’s Series Trust), Short-Term Investments Trust and Invesco Management Trust); Executive Vice President, The Invesco Funds (AIM Treasurer’s Series Trust (Invesco Treasurer’s Series Trust), Short-Term Investments Trust and Invesco Management Trust only); Director and President, INVESCO Funds Group, Inc. (registered investment adviser and registered transfer agent); Director and Chairman, IVZ Distributors, Inc. (formerly known as INVESCO Distributors, Inc.) (registered broker dealer); Director, President and Chairman, Invesco Inc. (holding company), Invesco Canada Holdings Inc. (holding company), Trimark Investments Ltd./Placements Trimark Ltèe and Invesco Financial Services Ltd/Services Financiers Invesco Ltèe; Chief Executive Officer, Invesco Canada Fund Inc. (corporate mutual fund company); Director and Chairman, Van Kampen Investor Services Inc.; Director, Chief Executive Officer and President, 1371 Preferred Inc. (holding company) and Van Kampen Investments Inc.; Director and President, AIM GP Canada Inc. (general partner for limited partnerships) and Van Kampen Advisors, Inc.; Director and Chief Executive Officer, Invesco Trimark Dealer Inc. (registered broker dealer); Director, Invesco Distributors, Inc. (formerly known as Invesco AIM Distributors, Inc.) (registered broker dealer); Manager, Invesco PowerShares Capital Management LLC; Director, Chief Executive Officer and President, Invesco Advisers, Inc.; Director, Chairman, Chief Executive Officer and President, Invesco AIM Capital Management, Inc.; President, Invesco Trimark Dealer Inc. and Invesco Trimark Ltd./Invesco Trimark Ltèe; Director and President, AIM Trimark Corporate Class Inc. and AIM Trimark Canada Fund Inc.; Senior Managing Director, Invesco Holding Company Limited; Director and Chairman, Fund Management Company (former registered broker dealer); President and Principal Executive Officer, The Invesco Funds (AIM Treasurer’s Series Trust (Invesco Treasurer’s Series Trust), and Short-Term Investments Trust only); President, AIM Trimark Global Fund Inc. and AIM Trimark Canada Fund Inc. | | 146 | | None |
| 1 | Mr. Flanagan is considered an interested person (within the meaning of Section 2(a)(19) of the 1940 Act) of the Trust because he is an officer of the Adviser to the Trust, and an officer and a director of Invesco Ltd., ultimate parent of the Adviser. |
| 2 | Mr. Taylor is considered an interested person (within the meaning of Section 2(a)(19) of the 1940 Act) of the Trust because he is an officer and a director of the Adviser. |
T-1 Invesco Low Volatility Emerging Markets Fund
Trustees and Officers—(continued)
| | | | | | | | |
Name, Year of Birth and
Position(s) Held with the Trust | | Trustee and/
or Officer Since | | Principal Occupation(s) During Past 5 Years | | Number of
Funds in Fund
Complex
Overseen by
Trustee | | Other Directorship(s)
Held by Trustee During
Past 5 Years |
| Independent Trustees | | | | | | | | |
Bruce L. Crockett — 1944 Trustee and Chair | | 2001 | | Chairman, Crockett Technologies Associates (technology consulting company) Formerly: Director, Captaris (unified messaging provider); Director, President and Chief Executive Officer, COMSAT Corporation; Chairman, Board of Governors of INTELSAT (international communications company); ACE Limited (insurance company); Independent Directors Council and Investment Company Institute | | 146 | | ALPS (Attorneys Liability Protection Society) (insurance company) and Globe Specialty Metals, Inc. (metallurgical company); Member of the Audit Committee, Ferroglobe PLC and Investment Company Institute; Member of the Executive Committee and Chair of the Governance Committee, Independent Directors Council |
David C. Arch — 1945 Trustee | | 2010 | | Chairman of Blistex Inc., a consumer health care products manufacturer | | 146 | | Board member of the Illinois Manufacturers’ Association; Member of the Board of Visitors, Institute for the Humanities, University of Michigan |
James T. Bunch — 1942 Trustee | | 2003 | | Managing Member, Grumman Hill Group LLC (family office/private equity investments) Formerly: Chairman of the Board, Denver Film Society, Chairman of the Board of Trustees, Evans Scholarship Foundation; Chairman, Board of Governors, Western Golf Association | | 146 | | Trustee, Evans Scholarship Foundation |
Albert R. Dowden — 1941 Trustee | | 2001 | | Director of a number of public and private business corporations, including Nature’s Sunshine Products, Inc. Formerly: Director, The Boss Group, Ltd. and Reich & Tang Funds (5 portfolios) (registered investment company); Director, Homeowners of America Holding Corporation/Homeowners of America Insurance Company (property casualty company); Director, Continental Energy Services, LLC (oil and gas pipeline service); Director, CompuDyne Corporation (provider of product and services to the public security market) and Director, Annuity and Life Re (Holdings), Ltd. (reinsurance company); Director, President and Chief Executive Officer, Volvo Group North America, Inc.; Senior Vice President, AB Volvo; Director of various public and private corporations; Chairman, DHJ Media, Inc.; Director, Magellan Insurance Company; and Director, The Hertz Corporation, Genmar Corporation (boat manufacturer), National Media Corporation; Advisory Board of Rotary Power International (designer, manufacturer, and seller of rotary power engines); and Chairman, Cortland Trust, Inc. (registered investment company) | | 146 | | Director of Nature’s Sunshine Products, Inc. |
Jack M. Fields — 1952 Trustee | | 2001 | | Chief Executive Officer, Twenty First Century Group, Inc. (government affairs company); and Discovery Learning Alliance (non-profit) Formerly: Owner and Chief Executive Officer, Dos Angeles Ranch L.P. (cattle, hunting, corporate entertainment); Director, Insperity, Inc. (formerly known as Administaff); Chief Executive Officer, Texana Timber LP (sustainable forestry company); Director of Cross Timbers Quail Research Ranch (non-profit); and member of the U.S. House of Representatives | | 146 | | None |
Eli Jones — 1961 Trustee | | 2016 | | Professor and Dean, Mays Business School — Texas A&M University Formerly: Professor and Dean, Walton College of Business, University of Arkansas and E.J. Ourso College of Business, Louisiana State University and Director, Arvest Bank | | 146 | | Director of Insperity, Inc. (formerly known as Administaff) |
Prema Mathai-Davis — 1950 Trustee | | 2001 | | Retired. Formerly: Chief Executive Officer, YWCA of the U.S.A. | | 146 | | None |
Larry Soll — 1942 Trustee | | 2003 | | Retired. Formerly: Chairman, Chief Executive Officer and President, Synergen Corp. (a biotechnology company) | | 146 | | None |
Raymond Stickel, Jr. — 1944 Trustee | | 2005 | | Retired. Formerly: Director, Mainstay VP Series Funds, Inc. (25 portfolios) and Partner, Deloitte & Touche | | 146 | | None |
Robert C. Troccoli — 1949 Trustee | | 2016 | | Adjunct Professor, University of Denver — Daniels College of Business Formerly: Senior Partner, KPMG LLP | | 146 | | None |
T-2 Invesco Low Volatility Emerging Markets Fund
Trustees and Officers—(continued)
| | | | | | | | |
Name, Year of Birth and
Position(s) Held with the Trust | | Trustee and/
or Officer Since | | Principal Occupation(s) During Past 5 Years | | Number of
Funds in Fund
Complex
Overseen by
Trustee | | Other Directorship(s)
Held by Trustee During
Past 5 Years |
| Independent Trustees—(continued) |
Suzanne H. Woolsey — 1941 Trustee | | 2014 | | Retired. Formerly: Chief Executive Officer of Woolsey Partners LLC | | 146 | | Director, SunShare LLC; Trustee, Ocean Conservancy; Emeritus Chair of the Board of Trustees of the Institute for Defense Analyses and of Colorado College; Trustee, Chair, Business and Finance Committee of California Institute of Technology; Prior to 2014, Director of Fluor Corp.; Prior to 2010, Trustee of the German Marshall Fund of the United States; Prior to 2010, Trustee of the Rocky Mountain Institute |
| Other Officers | | | | | | | | |
Sheri Morris — 1964 President, Principal Executive Officer and Treasurer | | 1999 | | President, Principal Executive Officer and Treasurer, The Invesco Funds; Vice President, Invesco Advisers, Inc. (formerly known as Invesco Institutional (N.A.), Inc.) (registered investment adviser); and Vice President, PowerShares Exchange-Traded Fund Trust, PowerShares Exchange-Traded Fund Trust II, PowerShares India Exchange-Traded Fund Trust, PowerShares Actively Managed Exchange-Traded Fund Trust, and PowerShares Actively Managed Exchange-Traded Commodity Fund Trust Formerly: Vice President and Principal Financial Officer, The Invesco Funds; Vice President, Invesco AIM Advisers, Inc., Invesco AIM Capital Management, Inc. and Invesco AIM Private Asset Management, Inc.; Assistant Vice President and Assistant Treasurer, The Invesco Funds and Assistant Vice President, Invesco Advisers, Inc., Invesco AIM Capital Management, Inc. and Invesco AIM Private Asset Management, Inc.; and Treasurer, PowerShares Exchange-Traded Fund Trust, PowerShares Exchange-Traded Fund Trust II, PowerShares India Exchange-Traded Fund Trust and PowerShares Actively Managed Exchange-Traded Fund Trust | | N/A | | N/A |
Russell C. Burk �� 1958 Senior Vice President and Senior Officer | | 2005 | | Senior Vice President and Senior Officer, The Invesco Funds | | N/A | | N/A |
John M. Zerr — 1962 Senior Vice President, Chief Legal Officer and Secretary | | 2006 | | Director, Senior Vice President, Secretary and General Counsel, Invesco Management Group, Inc. (formerly known as Invesco AIM Management Group, Inc.; Senior Vice President, Invesco Advisers, Inc. (formerly known as Invesco Institutional (N.A.), Inc.) (registered investment adviser); Senior Vice President and Secretary, Invesco Distributors, Inc. (formerly known as Invesco AIM Distributors, Inc.); Director, Vice President and Secretary, Invesco Investment Services, Inc. (formerly known as Invesco AIM Investment Services, Inc.) Senior Vice President, Chief Legal Officer and Secretary, The Invesco Funds; Managing Director, Invesco PowerShares Capital Management LLC; Director, Secretary and General Counsel, Invesco Investment Advisers LLC (formerly known as Van Kampen Asset Management); Secretary and General Counsel, Invesco Capital Markets, Inc. (formerly known as Van Kampen Funds Inc.) and Chief Legal Officer, PowerShares Exchange-Traded Fund Trust, PowerShares Exchange-Traded Fund Trust II, PowerShares India Exchange-Traded Fund Trust, PowerShares Actively Managed Exchange-Traded Fund Trust, and PowerShares Actively Managed Exchange-Traded Commodity Fund Trust Formerly: Director, Secretary, General Counsel and Senior Vice President, Van Kampen Exchange Corp.; Director, Vice President and Secretary, IVZ Distributors, Inc. (formerly known as INVESCO Distributors, Inc.); Director and Vice President, INVESCO Funds Group, Inc.; Director and Vice President, Van Kampen Advisors Inc.; Director, Vice President, Secretary and General Counsel, Van Kampen Investor Services Inc.; Director, Invesco Distributors, Inc. (formerly known as Invesco AIM Distributors, Inc.); Director, Senior Vice President, General Counsel and Secretary, Invesco AIM Advisers, Inc. and Van Kampen Investments Inc.; Director, Vice President and Secretary, Fund Management Company; Director, Senior Vice President, Secretary, General Counsel and Vice President, Invesco AIM Capital Management, Inc.; Chief Operating Officer and General Counsel, Liberty Ridge Capital, Inc. (an investment adviser); Vice President and Secretary, PBHG Funds (an investment company) and PBHG Insurance Series Fund (an investment company); Chief Operating Officer, General Counsel and Secretary, Old Mutual Investment Partners (a broker-dealer); General Counsel and Secretary, Old Mutual Fund Services (an administrator) and Old Mutual Shareholder Services (a shareholder servicing center); Executive Vice President, General Counsel and Secretary, Old Mutual Capital, Inc. (an investment adviser); and Vice President and Secretary, Old Mutual Advisors Funds (an investment company) | | N/A | | N/A |
T-3 Invesco Low Volatility Emerging Markets Fund
Trustees and Officers—(continued)
| | | | | | | | |
Name, Year of Birth and
Position(s) Held with the Trust | | Trustee and/
or Officer Since | | Principal Occupation(s) During Past 5 Years | | Number of
Funds in Fund
Complex
Overseen by
Trustee | | Other Directorship(s)
Held by Trustee During
Past 5 Years |
| Other Officers—(continued) | | | | | | | | |
| Karen Dunn Kelley — 1960 Senior Vice President | | 2004 | | Senior Managing Director, Investments, Invesco Ltd.; Director, Co-President, Co-Chief Executive Officer, and Co-Chairman, Invesco Advisers, Inc. (formerly known as Invesco Institutional (N.A.), Inc.) (registered investment adviser); Chairman and Director, Invesco Senior Secured Management, Inc.; Senior Vice President, Invesco Management Group, Inc. (formerly known as Invesco AIM Management Group, Inc.); Executive Vice President, Invesco Distributors, Inc. (formerly known as Invesco AIM Distributors, Inc.); Director, Invesco Mortgage Capital Inc. and Invesco Management Company Limited; Senior Vice President, The Invesco Funds Formerly: Vice President, The Invesco Funds (other than AIM Treasurer’s Series Trust (Invesco Treasurer’s Series Trust), Short-Term Investments Trust and Invesco Management Trust); and President and Principal Executive Officer, The Invesco Funds (AIM Treasurer’s Series Trust (Invesco Treasurer’s Series Trust), Short-Term Investments Trust and Invesco Management Trust only); Director and President, INVESCO Asset Management (Bermuda) Ltd., Director, INVESCO Global Asset Management DAC (formerly known as INVESCO Global Asset Management Limited) and INVESCO Management S.A.; Senior Vice President, Van Kampen Investments Inc. and Invesco Advisers, Inc. (formerly known as Invesco Institutional (N.A.), Inc.) (registered investment adviser); Director and President, Fund Management Company; Chief Cash Management Officer, Director of Cash Management, Senior Vice President, and Managing Director, Invesco AIM Capital Management, Inc.; Director of Cash Management, Senior Vice President, and Vice President, Invesco Advisers, Inc. and Vice President, The Invesco Funds (AIM Treasurer’s Series Trust (Invesco Treasurer’s Series Trust), and Short-Term Investments Trust only) | | N/A | | N/A |
Kelli Gallegos — 1970 Vice President, Principal Financial Officer and Assistant Treasurer | | 2008 | | Vice President, Principal Financial Officer and Assistant Treasurer, The Invesco Funds; Assistant Treasurer, Invesco PowerShares Capital Management LLC, PowerShares Exchange-Traded Fund Trust, PowerShares Exchange-Traded Fund Trust II, PowerShares India Exchange-Traded Fund Trust, PowerShares Actively Managed Exchange-Traded Fund Trust, and PowerShares Actively Managed Exchange-Traded Commodity Fund Trust Formerly: Assistant Vice President, The Invesco Funds | | N/A | | N/A |
Tracy Sullivan — 1962 Vice President, Chief Tax Officer and Assistant Treasurer | | 2008 | | Vice President, Chief Tax Officer and Assistant Treasurer, The Invesco Funds; Assistant Treasurer, Invesco PowerShares Capital Management LLC, PowerShares Exchange-Traded Fund Trust, PowerShares Exchange-Traded Fund Trust II, PowerShares India Exchange-Traded Fund Trust, PowerShares Actively Managed Exchange-Traded Fund Trust, and PowerShares Actively Managed Exchange-Traded Commodity Fund Trust Formerly: Assistant Vice President, The Invesco Funds | | N/A | | N/A |
Crissie M. Wisdom — 1969 Anti-Money Laundering Compliance Officer | | 2013 | | Anti-Money Laundering Compliance Officer, Invesco Advisers, Inc. (formerly known as Invesco Institutional (N.A.), Inc.) (registered investment adviser), Invesco Capital Markets, Inc. (formerly known as Van Kampen Funds Inc.), Invesco Distributors, Inc., Invesco Investment Services, Inc., Invesco Management Group, Inc., The Invesco Funds, and PowerShares Exchange-Traded Fund Trust, PowerShares Exchange-Traded Fund Trust II, PowerShares India Exchange-Traded Fund Trust, PowerShares Actively Managed Exchange-Traded Fund Trust and PowerShares Actively Managed Exchange-Traded Commodity Fund Trust; Anti-Money Laundering Compliance Officer and Bank Secrecy Act Officer, INVESCO National Trust Company and Invesco Trust Company; and Fraud Prevention Manager and Controls and Risk Analysis Manager for Invesco Investment Services, Inc. Formerly: Anti-Money Laundering Compliance Officer, Van Kampen Exchange Corp. | | N/A | | N/A |
Robert R. Leveille — 1969 Chief Compliance Officer | | 2016 | | Chief Compliance Officer, Invesco Advisers, Inc. (registered investment adviser); and Chief Compliance Officer, The Invesco Funds Formerly: Chief Compliance Officer, Putnam Investments and the Putnam Funds | | N/A | | N/A |
The Statement of Additional Information of the Trust includes additional information about the Fund’s Trustees and is available upon request, without charge, by calling 1.800.959.4246. Please refer to the Fund’s Statement of Additional Information for information on the Fund’s sub-advisers.
| | | | | | |
Office of the Fund 11 Greenway Plaza, Suite 1000 Houston, TX 77046-1173 | | Investment Adviser Invesco Advisers, Inc. 1555 Peachtree Street, N.E. Atlanta, GA 30309 | | Distributor Invesco Distributors, Inc. 11 Greenway Plaza, Suite 1000 Houston, TX 77046-1173 | | Auditors PricewaterhouseCoopers LLP 1000 Louisiana Street, Suite 5800 Houston, TX 77002-5678 |
| | | |
| | | | | | |
Counsel to the Fund Stradley Ronon Stevens & Young, LLP 2005 Market Street, Suite 2600 Philadelphia, PA 19103-7018 | | Counsel to the Independent Trustees Goodwin Procter LLP 901 New York Avenue, N.W. Washington, D.C. 20001 | | Transfer Agent Invesco Investment Services, Inc. 11 Greenway Plaza, Suite 1000 Houston, TX 77046-1173 | | Custodian State Street Bank and Trust Company 225 Franklin Street Boston, MA 02110-2801 |
T-4 Invesco Low Volatility Emerging Markets Fund
Explore High-Conviction Investing with Invesco

Invesco mailing information
Send general correspondence to Invesco Investment Services, Inc., P.O. Box 219078, Kansas City, MO 64121-9078.
Important notice regarding delivery of security holder documents
To reduce Fund expenses, only one copy of most shareholder documents may be mailed to shareholders with multiple accounts at the same address (Householding). Mailing of your shareholder documents may be householded indefinitely unless you instruct us otherwise. If you do not want the mailing of these documents to be combined with those for other members of your household, please contact Invesco Investment Services, Inc. at 800 959 4246 or contact your financial institution. We will begin sending you individual copies for each account within 30 days after receiving your request.
Fund holdings and proxy voting information
The Fund provides a complete list of its holdings four times in each fiscal year, at the quarter ends. For the second and fourth quarters, the lists appear in the Fund’s semiannual and annual reports to shareholders. For the first and third quarters, the Fund files the lists with the Securities and Exchange Commission (SEC) on Form N-Q. The most recent list of portfolio holdings is available at invesco.com/completeqtrholdings. Shareholders can also look up the Fund’s
Forms N-Q on the SEC website at sec.gov. Copies of the Fund’s Forms N-Q may be reviewed and copied at the SEC Public Reference Room in Washington, D.C. You can obtain information on the operation of the Public Reference Room, including information about duplicating fee charges, by calling 202 551 8090 or 800 732 0330, or by electronic request at the following email address: publicinfo@sec.gov.
The SEC file numbers for the Fund are shown below.
A description of the policies and procedures that the Fund uses to determine how to vote proxies relating to portfolio securities is available without charge, upon request, from our Client Services department at 800 959 4246 or at invesco.com/proxyguidelines. The information is also available on the SEC website, sec.gov.
| | |
Information regarding how the Fund voted proxies related to its portfolio securities during the most recent 12-month period ended June 30 is available at invesco.com/proxysearch. The information is also available on the SEC website, sec.gov. Invesco Advisers, Inc. is an investment adviser; it provides investment advisory services to individual and institutional clients and does not sell securities. Invesco Distributors, Inc. is the US distributor for Invesco Ltd.’s retail mutual funds, exchange-traded funds and institutional money market funds. Both are wholly owned, indirect subsidiaries of Invesco Ltd. | |  |
| | | | |
| SEC file numbers: 811-05426 and 033-19338 | | LVEM-AR-1 | | Invesco Distributors, Inc. |
| | | | |
| | |
 | | Annual Report to Shareholders | | October 31, 2016 |
| | |
| | Invesco Macro Allocation Strategy Fund Effective July 27, 2016, Invesco Global Markets Strategy Fund was renamed Invesco Macro Allocation Strategy Fund. |
| | Nasdaq: |
| | A: GMSDX ∎ C: GMSEX ∎ R: GMSJX ∎ Y: GMSHX ∎ R5: GMSKX ∎ R6: GMSLX |

Letters to Shareholders
| | |

Philip Taylor | | Dear Shareholders: This annual report includes information about your Fund, including performance data and a complete list of its investments as of the close of the reporting period. Inside is a discussion of how your Fund was managed and the factors that affected its performance during the reporting period. In December 2015, the US Federal Reserve raised short-term interest rates for the first time since 2006, signaling its belief that the economy was likely to continue strengthening. Indeed, throughout the reporting period, US economic data were generally positive and the economy expanded at a moderate rate – but there were some bumps along the road. Job growth in May 2016 was very weak, but it was followed by strong increases in nonfarm payrolls in June and July. Increased concerns about global economic weakness caused US stock market indexes |
| to sink at the start of calendar year 2016, but they eventually recovered; they sank again following the UK’s decision to leave the European Union, but then quickly recovered and reached record highs later in the summer. Strong demand for income-producing investments, particularly those perceived to be lower risk, benefited bonds as well as dividend-paying stocks for much of the reporting period. While economic news in the US was generally positive, news overseas was less upbeat. The European Central Bank, and central banks in China and Japan – as well as other countries – maintained extraordinarily accommodative monetary policies in response to economic weakness. As the fiscal year drew to a close, uncertainty about the outcome of the US presidential election resulted in increased market volatility; the surprise outcome after the close of the reporting period suggested that market volatility may continue for some time to come. |
Short-term market volatility can prompt some investors to abandon their investment plans – and can cause others to settle for average results. The investment professionals at Invesco, in contrast, invest with high conviction, take a long-term perspective and have a passion to exceed. Invesco’s pure focus on investment management eliminates possible distractions and means that there are no competing lines of business for us to support. Just as important, we embrace a variety of investment strategies, asset classes and geographies – because we know that no single investment approach meets the diverse needs of all of our clients. We manage all our investment approaches with a passion to exceed. All our investment teams have a highly disciplined, long-term investing style that eliminates short-term decision-making. Of course, investing with high conviction can’t guarantee a profit or ensure success; no investment strategy can. To learn more about how we invest with high conviction, visit invesco.com/HighConviction.
You, too, can invest with high conviction by maintaining a long-term investment perspective and by working with your financial adviser on a regular basis. During periods of short-term market volatility or uncertainty, your financial adviser can keep you focused on your long-term investment goals – a new home, a child’s college education or a secure retirement. He or she also can share research about the economy, the markets and individual investment options.
Visit our website for more information on your investments
Our website, invesco.com/us, offers a wide range of market insights and investment perspectives. On the website, you’ll find detailed information about our funds, including performance, holdings and portfolio manager commentaries. You can access information about your account by completing a simple, secure online registration. Click on the “Need to register” link in the “Account Access” box on our homepage to get started.
In addition to the resources accessible on our website and through our mobile app, you can obtain timely updates to help you stay informed about the markets, the economy and investing by connecting with Invesco on Twitter, LinkedIn or Facebook. You can access our blog at blog.invesco.us.com. Our goal is to provide you the information you want, when and where you want it.
Finally, I’m pleased to share with you Invesco’s commitment to both the Principles for Responsible Investment and to considering environmental, social and governance issues in our robust investment process. I invite you to learn more at invesco.com/esg.
Have questions?
For questions about your account, contact an Invesco client services representative at 800 959 4246. For Invesco-related questions or comments, please email me directly at phil@invesco.com.
All of us at Invesco look forward to serving your investment management needs. Thank you for investing with us.
Sincerely,

Philip Taylor
Senior Managing Director, Invesco Ltd.
2 Invesco Macro Allocation Strategy Fund
| | |

Bruce Crockett | | Dear Fellow Shareholders: Among the many important lessons I’ve learned in more than 40 years in a variety of business endeavors is the value of a trusted advocate. As independent chair of the Invesco Funds Board, I can assure you that the members of the Board are strong advocates for the interests of investors in Invesco’s mutual funds. We work hard to represent your interests through oversight of the quality of the investment management services your funds receive and other matters important to your investment, including but not limited to: ∎ Ensuring that Invesco offers a diverse lineup of mutual funds that your financial adviser can use to strive to meet your financial needs as your investment goals change over time. ∎ Monitoring how the portfolio management teams of the Invesco funds are performing in light of changing economic and market conditions. |
| ∎ | | Assessing each portfolio management team’s investment performance within the context of the investment strategy described in the fund’s prospectus. |
| ∎ | | Monitoring for potential conflicts of interests that may impact the nature of the services that your funds receive. |
We believe one of the most important services we provide our fund shareholders is the annual review of the funds’ advisory and sub-advisory contracts with Invesco Advisers and its affiliates. This review is required by the Investment Company Act of 1940 and focuses on the nature and quality of the services Invesco provides as the adviser to the Invesco funds and the reasonableness of the fees that it charges for those services. Each year, we spend months carefully reviewing information received from Invesco and a variety of independent sources, such as performance and fee data prepared by Lipper Inc., an independent, third-party firm widely recognized as a leader in its field. We also meet with our independent legal counsel and other independent advisers to review and help us assess the information that we have received. Our goal is to assure that you receive quality investment management services for a reasonable fee.
I trust the measures outlined above provide assurance that you have a worthy advocate when it comes to choosing the Invesco Funds.
As always, please contact me at bruce@brucecrockett.com with any questions or concerns you may have. On behalf of the Board, we look forward to continuing to represent your interests and serving your needs.
Sincerely,

Bruce L. Crockett
Independent Chair
Invesco Funds Board of Trustees
3 Invesco Macro Allocation Strategy Fund
Management’s Discussion of Fund Performance
| | | | |
Performance summary For the fiscal year ended October 31, 2016, Class A shares of Invesco Macro Allocation Strategy Fund (the Fund), at net asset value (NAV), outperformed the Bloomberg Barclays 3-Month Treasury Bellwether Index, the Fund’s broad market/style-specific benchmark. | |
Fund vs. Indexes Total returns, 10/31/15 to 10/31/16, at net asset value (NAV). Performance shown does not include applicable contingent deferred sales charges (CDSC) or front-end sales charges, which would have reduced performance. | |
Class A Shares | | | 8.44 | % |
Class C Shares | | | 7.52 | |
Class R Shares | | | 8.19 | |
Class Y Shares | | | 8.73 | |
Class R5 Shares | | | 8.61 | |
Class R6 Shares | | | 8.62 | |
Bloomberg Barclays 3-Month Treasury Bellwether Indexq (Broad Market/Style-Specific Index) | | | 0.32 | |
Lipper Absolute Return Funds Index∎ (Peer Group Index) | | | 0.28 | |
Source(s): qFactSet Research Systems Inc.; ∎Lipper Inc. | | | | |
Market conditions and your Fund
Effective July 27, 2016, Invesco Global Markets Strategy Fund was renamed Invesco Macro Allocation Strategy Fund. The name change is intended to be more representative of the Fund’s investment strategy and the underlying assets in which it invests.
During the fiscal year ended October 31, 2016, each of the asset classes in which the Fund invests provided positive contributions to Fund performance, and the Fund at NAV ended the reporting period in strong positive territory. The Fund invests in derivatives, such as swaps and futures, which are expected to correspond to the performance of US and international fixed income, equity and commodity markets. The strategic portion of the investment process involves first selecting representative assets for each of the three asset classes (equities, fixed income and commodities) from a universe of more than 50 investments. Next, we seek to construct the portfolio so that an approximately equal amount of risk comes from our equity, fixed income and commodity allocations. Tactical adjustments to the Fund’s portfolio are then made on a monthly basis to try and take advantage of short-term
market dynamics. The strategic element benefited Fund performance for the fiscal year.
Exposure to commodities, obtained through the use of swaps and futures, led returns for the Fund for the fiscal year as gains in agriculture, precious metals and energy outweighed losses in industrial metals. Agriculture was the Fund’s leading performer during the fiscal year due to gains in sugar, soybeans, soymeal, cotton and coffee. Generally speaking, supply shortages due to inclement weather and reduced plantings was the primary catalyst for higher prices. For the reporting period, tactical underweight exposure to the agriculture complex detracted from Fund performance. Precious metals exposure was also favorable as gains in silver outpaced gold. Precious metals prices benefited from a combination of volatility in equity prices in the reporting period as well as the inability of central banks to implement interest rate increases. Tactical exposure to precious metals detracted from Fund performance. Energy prices struggled with high levels of oversupply for much of the reporting period, leading to marked volatility in crude oil and distillates. The Fund’s ability to tactically adjust exposures helped to offset weak performance
across the energy complex; the Fund had underweight exposure to energy for most of the fiscal year. The result was a gain from the combined exposure to energy. Industrial metals prices detracted from Fund results as copper prices declined more than aluminum prices rose. Tactical industrial metals exposure detracted from Fund results due to underweight exposure to aluminum.
The Fund’s exposure to global government bonds, obtained through the use of swaps and futures, benefited Fund performance for the reporting period, as a combination of equity market volatility early in the reporting period, concerns over the fallout of the Brexit vote (the UK referendum on whether to remain a part of, or leave, the European Union) in early summer and generally tepid economic data throughout the reporting period created demand for perceived safe haven assets.1 Within the government bond asset class, UK gilts were the top performers on Brexit fears and the resulting accommodative policy response from central banks. German bunds also benefited from these events, although these events also drove their yields into negative territory. The price of Canadian government bonds rallied as the Canadian central bank cut interest rates twice to combat the economic slowdown complicated by weak energy prices. US Treasury prices rallied on market volatility early in the reporting period and “flight to safety” demand in the wake of Brexit, but they surrendered some of those gains late in the reporting period on the incessant jawboning from the US Federal Reserve on the likelihood of a rate increase. Despite engaging in a policy of negative interest rates, Japanese government bonds also posted modest gains for the reporting period. Tactical positioning in government bonds bolstered Fund results due to general overweight exposure to the asset class for the fiscal year.
Performance across developed equity markets was bifurcated though it contributed to Fund results. Perhaps surprisingly, given the angst leading up to and after
| | | | |
| Target Risk Allocation and Notional Asset Weights as of 10/31/16 |
| By asset class | | | | |
| | | | |
| Asset Class | | Target Risk Allocation* | | Notional Asset Weights** |
| | | | | | | | | | |
Equities | | | 70.01 | % | | | 54.19 | % | | |
Fixed Income | | | -1.19 | | | | 11.49 | | | |
Commodities | | | 31.18 | | | | 28.55 | | | |
Total | | | 100.00 | | | | 94.23 | | | |
| * | Reflects the risk that each asset class is expected to contribute to the overall risk of the Fund as measured by standard deviation and estimates of risk based on historical data. Standard deviation measures the annualized fluctuations (volatility) of monthly returns. |
| ** | Proprietary models determine the Notional Asset Weights necessary to achieve the Target Risk Allocations. Total Notional Asset Weight greater than 100% is achieved through derivatives and other instruments that create leverage. |
| | |
Total Net Assets | | $51.7 million |
4 Invesco Macro Allocation Strategy Fund
the Brexit vote, UK equities led results in the asset class; US small caps and large caps and Hong Kong equities made lesser contributions to Fund performance. European and Japanese equities detracted from Fund performance as a combination of weak economic data and concerns over whether the exceptionally accommodative policy response from the European Central Bank and the Bank of Japan was having any of the intended effects on growth and inflation pressured share prices. Tactical exposure to equities, obtained through the use of swaps and futures, helped boost the Fund’s return owing to a combination of underweight exposure during the volatility of the first quarter of 2016 and general overweight exposure when equities recovered in subsequent quarters.
Please note that our strategy is principally implemented with derivative instruments that include futures, commodity-linked notes and total return swaps. Therefore, all or most of the performance of the strategy, both positive and negative, can be attributed to these instruments. Derivatives can be a cost-effective way to gain exposure to asset classes. However, derivatives may amplify traditional investment risks through the creation of leverage and may be less liquid than traditional securities.
Thank you for your continued investment in the Invesco Macro Allocation Strategy Fund.
| 1 | So-called “safe haven” assets do not imply risk-free investing. |
The views and opinions expressed in management’s discussion of Fund performance are those of Invesco Advisers, Inc. These views and opinions are subject to change at any time based on factors such as market and economic conditions. These views and opinions may not be relied upon as investment advice or recommendations, or as an offer for a particular security. The information is not a complete analysis of every aspect of any market, country, industry, security or the Fund. Statements of fact are from sources considered reliable, but Invesco Advisers, Inc. makes no representation or warranty as to their completeness or accuracy. Although historical performance is no guarantee of future results, these insights may help you understand our investment management philosophy.
See important Fund and, if applicable, index disclosures later in this report.
| | |
 | | Scott Wolle Chartered Financial Analyst, Portfolio Manager, is lead manager of Invesco Macro Allocation Strategy Fund. |
| He joined Invesco in 1999. Mr. Wolle earned a BS in finance from Virginia Polytechnic Institute and State University and an MBA from Duke University Fuqua School of Business. |
| | |
 | | Mark Ahnrud Chartered Financial Analyst, Portfolio Manager, is manager of Invesco Macro Allocation Strategy Fund. |
| He joined Invesco in 2000. Mr. Ahnrud earned a BS in finance and investments from Babson College and an MBA from Duke University Fuqua School of Business. |
| | |
 | | Chris Devine Chartered Financial Analyst, Portfolio Manager, is manager of Invesco Macro Allocation Strategy Fund. |
| He joined Invesco in 1998. Mr. Devine earned a BA in economics from Wake Forest University and an MBA from the University of Georgia. |
| | |
 | | Scott Hixon Chartered Financial Analyst, Portfolio Manager, is manager of Invesco Macro Allocation Strategy Fund. |
| He joined Invesco in 1994. Mr. Hixon earned a BBA in finance from Georgia Southern University and an MBA in finance from Georgia State University. |
| | |
 | | Christian Ulrich Chartered Financial Analyst, Portfolio Manager, is manager of Invesco Macro Allocation Strategy Fund. |
| He joined Invesco in 2000. Mr. Ulrich earned the equivalent of a BBA from the KV Zurich Business School in Zurich, Switzerland. |
Assisted by the Invesco Global Asset Allocation Team
5 Invesco Macro Allocation Strategy Fund
Your Fund’s Long-Term Performance
Results of a $10,000 Investment – Oldest Share Class(es) since Inception
Fund and index data from 9/26/12
| 2 | Source: FactSet Research Systems Inc. |
Past performance cannot guarantee comparable future results.
The data shown in the chart include reinvested distributions, applicable sales charges and Fund expenses including
management fees. Index results include reinvested dividends, but they do not reflect sales charges. Performance of the peer group, if applicable, reflects fund expenses and management fees; performance
of a market index does not. Performance shown in the chart and table(s) does not reflect deduction of taxes a shareholder would pay on Fund distributions or sale of Fund shares.
6 Invesco Macro Allocation Strategy Fund
| | | | |
Average Annual Total Returns | |
| As of 10/31/16, including maximum applicable sales charges | |
| |
Class A Shares | | | | |
Inception | | | 2.24 | % |
1 Year | | | 2.51 | |
| |
Class C Shares | | | | |
Inception | | | 2.89 | % |
1 Year | | | 6.52 | |
| |
Class R Shares | | | | |
Inception | | | 3.45 | % |
1 Year | | | 8.19 | |
| |
Class Y Shares | | | | |
Inception (9/26/12) | | | 3.95 | % |
1 Year | | | 8.73 | |
| |
Class R5 Shares | | | | |
Inception | | | 3.95 | % |
1 Year | | | 8.61 | |
| |
Class R6 Shares | | | | |
Inception | | | 3.92 | % |
1 Year | | | 8.62 | |
On August 28, 2013, Class H1 shares converted to Class Y shares.
Class A shares incepted on August 28, 2013. Performance shown prior to that date is that of Class H1 shares and includes the 12b-1 fees applicable to Class H1 shares.
Class C shares incepted on August 28, 2013. Performance shown prior to that date is that of Class H1 shares and includes the 12b-1 fees applicable to Class H1 shares.
Class R shares incepted on August 28, 2013. Performance shown prior to that date is that of Class H1 shares and includes the 12b-1 fees applicable to Class H1 shares.
Class R5 shares incepted on August 28, 2013. Performance shown prior to that date is that of Class H1 shares and includes the 12b-1 fees applicable to Class H1 shares.
Class R6 shares incepted on August 28, 2013. Performance shown prior to that date is that of Class H1 shares and includes the 12b-1 fees applicable to Class H1 shares.
The performance data quoted represent past performance and cannot guarantee comparable future results; current performance may be lower or higher. Please visit invesco.com/performance for the most recent month-end performance. Performance figures reflect reinvested distributions, changes in net asset value and the effect of
| | | | |
Average Annual Total Returns | |
| As of 9/30/16, the most recent calendar quarter end, including maximum applicable sales charges | |
| |
Class A Shares | | | | |
Inception | | | 2.51 | % |
1 Year | | | 4.43 | |
| |
Class C Shares | | | | |
Inception | | | 3.20 | % |
1 Year | | | 8.60 | |
| |
Class R Shares | | | | |
Inception | | | 3.75 | % |
1 Year | | | 10.16 | |
| |
Class Y Shares | | | | |
Inception (9/26/12) | | | 4.26 | % |
1 Year | | | 10.82 | |
| |
Class R5 Shares | | | | |
Inception | | | 4.26 | % |
1 Year | | | 10.81 | |
| |
Class R6 Shares | | | | |
Inception | | | 4.24 | % |
1 Year | | | 10.71 | |
the maximum sales charge unless otherwise stated. Investment return and principal value will fluctuate so that you may have a gain or loss when you sell shares.
The net annual Fund operating expense ratio set forth in the most recent Fund prospectus as of the date of this report for Class A, Class C, Class R, Class Y, Class R5 and Class R6 shares was 1.66%, 2.41%, 1.91%, 1.41%, 1.41% and 1.41%, respectively.1,2 The total annual Fund operating expense ratio set forth in the most recent Fund prospectus as of the date of this report for Class A, Class C, Class R, Class Y, Class R5 and Class R6 shares was 2.14%, 2.89%, 2.39%, 1.89%, 1.76% and 1.76%, respectively. The expense ratios presented above may vary from the expense ratios presented in other sections of this report that are based on expenses incurred during the period covered by this report.
Class A share performance reflects the maximum 5.50% sales charge, and Class C share performance reflects the applicable contingent deferred sales charge (CDSC) for the period involved. The CDSC on Class C shares is 1% for the first year after purchase. Class R, Class Y, Class R5 and Class R6 shares do not have a front-end sales charge or a CDSC; therefore, performance is at net asset value.
The performance of the Fund’s share classes will differ primarily due to different sales charge structures and class expenses.
Fund performance reflects any applicable fee waivers and/or expense reimbursements. Had the adviser not waived fees and/or reimbursed expenses currently or in the past, returns would have been lower. See current prospectus for more information.
| 1 | Total annual Fund operating expenses after any contractual fee waivers and/or expense reimbursements by the adviser in effect through at least June 30, 2018. See current prospectus for more information. |
| 2 | Total annual Fund operating expenses after any contractual fee waivers and/or expense reimbursements by the adviser in effect through at least February 28, 2017. See current prospectus for more information. |
7 Invesco Macro Allocation Strategy Fund
Invesco Macro Allocation Strategy Fund’s investment objective is to seek a positive absolute return over a complete economic and market cycle.
| ∎ | | Unless otherwise stated, information presented in this report is as of October 31, 2016, and is based on total net assets. |
| ∎ | | Unless otherwise noted, all data provided by Invesco. |
| ∎ | | To access your Fund’s reports/prospectus, visit invesco.com/fundreports. |
About share classes
| ∎ | | Class R shares are generally available only to employer sponsored retirement and benefit plans. Please see the prospectus for more information. |
| ∎ | | Class Y shares are available only to certain investors. Please see the prospectus for more information. |
| ∎ | | Class R5 shares and Class R6 shares are primarily intended for employer sponsored retirement and benefit plans that meet certain standards and for institutional investors. Please see the prospectus for more information. |
Principal risks of investing in the Fund
| ∎ | | Changing fixed income market conditions risk. The current low interest rate environment was created in part by the Federal Reserve Board (FRB) and certain foreign central banks keeping the federal funds and equivalent foreign rates near, at or below zero. Increases in the federal funds and equivalent foreign rates may expose fixed income markets to heightened volatility and reduced liquidity for certain fixed income investments, particularly those with longer maturities. In addition, decreases in fixed income dealer market-making capacity may also potentially lead to heightened volatility and reduced liquidity in the fixed income markets. As a result, the value of the Fund’s investments and share price may decline. Changes in central bank policies could also result in higher than normal shareholder redemptions, which could potentially increase portfolio turnover and the Fund’s transaction costs. |
| ∎ | | Commodities tax risk. The tax treatment of commodity-linked derivative instruments may be adversely affected by changes in legislation, regulations or other legally binding authority. If, as a result of any such adverse action, the income of the Fund from certain commodity-linked derivatives was treated as non-qualifying income, the Fund might fail to qualify as a regulated investment |
| | | company and be subject to federal income tax at the Fund level. Should the Internal Revenue Service issue guidance, or Congress enact legislation, that adversely affects the tax treatment of the Fund’s use of commodity-linked notes or the Subsidiary (which guidance might be applied to the Fund retroactively), it could, among other consequences, limit the Fund’s ability to pursue its investment strategy. |
| ∎ | | Commodity-linked notes risk. In addition to risks associated with the underlying commodities, investments in commodity-linked notes may be subject to additional risks, such as non-payment of interest and loss of principal, counterparty risk, lack of a secondary market and risk of greater volatility than traditional equity and debt securities. The value of the commodity-linked notes the Fund buys may fluctuate significantly because the values of the underlying investments to which they are linked are themselves volatile. Additionally, certain commodity-linked notes employ “economic” leverage by requiring payment by the issuer of an amount that is a multiple of the price increase or decrease of the underlying commodity, commodity index, or other economic variable. Such economic leverage will increase the volatility of the value of these commodity-linked notes and the Fund to the extent it invests in such notes. |
| ∎ | | Commodity risk. The Fund may have investment exposure to the commodities markets and/or a particular sector of the commodities markets, which may subject the Fund to greater volatility than investments in traditional securities, such as stocks and bonds. Volatility in the commodities markets may be caused by changes in overall market movements, domestic and foreign political and economic events and policies, war, acts of terrorism, changes in domestic or foreign interest rates and/ or investor expectations concerning interest rates, domestic and foreign inflation rates, investment and trading activities of mutual funds, hedge funds and commodities funds, and factors such as drought, floods, |
| | | weather, livestock disease, embargoes, tariffs and other regulatory developments or supply and demand disruptions. Because the Fund’s performance may be linked to the performance of volatile commodities, investors should be willing to assume the risks of potentially significant fluctuations in the value of the Fund’s shares. |
| ∎ | | Correlation risk. Because the Fund’s investment strategy seeks to balance risk across three asset classes and, within each asset class, across different countries and investments, to the extent either the asset classes or the selected countries and investments become correlated in a way not anticipated by the Adviser, the Fund’s risk allocation process may result in magnified risks and loss instead of balancing (reducing) the risk of loss. |
| ∎ | | Debt securities risk. The prices of debt securities held by the Fund will be affected by changes in interest rates, the creditworthiness of the issuer and other factors. An increase in prevailing interest rates typically causes the value of existing debt securities to fall and often has a greater impact on longer-duration debt securities and higher quality debt securities. Falling interest rates will cause the Fund to reinvest the proceeds of debt securities that have been repaid by the issuer at lower interest rates. Falling interest rates may also reduce the Fund’s distributable income because interest payments on floating rate debt instruments held by the Fund will decline. The Fund could lose money on investments in debt securities if the issuer or borrower fails to meet its obligations to make interest payments and/or to repay principal in a timely manner. Changes in an issuer’s financial strength, the market’s perception of such strength or in the credit rating of the issuer or the security may affect the value of debt securities. The Adviser’s credit analysis may fail to anticipate such changes, which could result in buying a debt security at an inopportune time or failing to sell a debt security in advance of a price decline or other credit event. |
|
This report must be accompanied or preceded by a currently effective Fund prospectus, which contains more complete information, including sales charges and expenses. Investors should read it carefully before investing. |
|
NOT FDIC INSURED | MAY LOSE VALUE | NO BANK GUARANTEE |
8 Invesco Macro Allocation Strategy Fund
| ∎ | | Derivatives risk. The value of a derivative instrument depends largely on (and is derived from) the value of an underlying security, currency, commodity, interest rate, index or other asset (each referred to as an underlying asset). In addition to risks relating to the underlying assets, the use of derivatives may include other, possibly greater, risks, including counterparty, leverage and liquidity risks. Counterparty risk is the risk that the counterparty to the derivative contract will default on its obligation to pay the Fund the amount owed or otherwise perform under the derivative contract. Derivatives create leverage risk because they do not require payment up front equal to the economic exposure created by owning the derivative. As a result, an adverse change in the value of the underlying asset could result in the Fund sustaining a loss that is substantially greater than the amount invested in the derivative, which may make the Fund’s returns more volatile and increase the risk of loss. Derivative instruments may also be less liquid than more traditional investments and the Fund may be unable to sell or close out its derivative positions at a desirable time or price. This risk may be more acute under adverse market conditions, during which the Fund may be most in need of liquidating its derivative positions. Derivatives may also be harder to value, less tax efficient and subject to changing government regulation that could impact the Fund’s ability to use certain derivatives or their cost. Also, derivatives used for hedging or to gain or limit exposure to a particular market segment may not provide the expected benefits, particularly during adverse market conditions. These risks are greater for the Fund than most other mutual funds because the Fund will implement its investment strategy primarily through derivative instruments rather than direct investments in stocks/bonds. |
| ∎ | | Emerging markets securities risk. Emerging markets (also referred to as developing markets) are generally subject to greater market volatility, political, social and economic instability, uncertain trading markets and more governmental limitations on foreign |
| | | investment than more developed markets. In addition, emerging markets may be subject to lower trading volume and greater price fluctuations than companies in more developed markets. Securities law and the enforcement of systems of taxation in many emerging market countries may change quickly and unpredictably. In addition, investments in emerging markets securities may also be subject to additional transaction costs, delays in settlement procedures, and lack of timely information. |
| ∎ | | Exchange-traded funds risk. In addition to the risks associated with the underlying assets held by the exchange-traded fund, investments in exchange-traded funds are subject to the following additional risks: (1) an exchange-traded fund’s shares may trade above or below its net asset value; (2) an active trading market for the exchange-traded fund’s shares may not develop or be maintained; (3) trading an exchange-traded fund’s shares may be halted by the listing exchange; (4) a passively managed exchange-traded fund may not track the performance of the reference asset; and (5) a passively managed exchange-traded fund may hold troubled securities. Investment in exchange-traded funds may involve duplication of management fees and certain other expenses, as the Fund indirectly bears its proportionate share of any expenses paid by the exchange-traded funds in which it invests. Further, certain exchange-traded funds in which the Fund may invest are leveraged, which may result in economic leverage, permitting the Fund to gain exposure that is greater than would be the case in an unlevered instrument and potentially resulting in greater volatility. |
| ∎ | | Exchange-traded notes risk. Exchange-traded notes are subject to credit risk, counterparty risk, and the risk that the value of the exchange-traded note may drop due to a downgrade in the issuer’s credit rating. The value of an exchange-traded note may also be influenced by time to maturity, level of supply and demand for the exchange-traded note, volatility and lack of liquidity in the underlying market, changes in the applicable interest rates, and economic, legal, political, or geographic events that affect the referenced underlying market |
| | | or assets. The Fund will bear its proportionate share of any fees and expenses borne by an exchange-traded note in which it invests. For certain exchange-traded notes, there may be restrictions on the Fund’s right to redeem its investment, which is meant to be held until maturity. |
| ∎ | | Foreign government debt risk. Investments in foreign government debt securities (sometimes referred to as sovereign debt securities) involve certain risks in addition to those relating to foreign securities or debt securities generally. The issuer of the debt or the governmental authorities that control the repayment of the debt may be unable or unwilling to repay principal or interest when due in accordance with the terms of such debt, and the Fund may have limited recourse in the event of a default against the defaulting government. Without the approval of debt holders, some governmental debtors have in the past been able to reschedule or restructure their debt payments or declare moratoria on payments. |
| ∎ | | Foreign securities risk. The Fund’s foreign investments may be adversely affected by political and social instability, changes in economic or taxation policies, difficulty in enforcing obligations, decreased liquidity or increased volatility. Foreign investments also involve the risk of the possible seizure, nationalization or expropriation of the issuer or foreign deposits (in which the Fund could lose its entire investments in a certain market) and the possible adoption of foreign governmental restrictions such as exchange controls. Unless the Fund has hedged its foreign securities risk, foreign securities risk also involves the risk of negative foreign currency rate fluctuations, which may cause the value of securities denominated in such foreign currency (or other instruments through which the Fund has exposure to foreign currencies) to decline in value. Currency exchange rates may fluctuate significantly over short periods of time. Currency hedging strategies, if used, are not always successful. |
| ∎ | | Management risk. The Fund is actively managed and depends heavily on the Adviser’s judgment about markets, interest rates or the attractiveness, relative |
9 Invesco Macro Allocation Strategy Fund
values, liquidity, or potential appreciation of particular investments made for the Fund’s portfolio. The Fund could experience losses if these judgments prove to be incorrect. Because the Fund’s investment process relies heavily on its asset allocation process, market movements that are counter to the portfolio managers’ expectations may have a significant adverse effect on the Fund’s net asset value. Additionally, legislative, regulatory, or tax developments may adversely affect management of the Fund and, therefore, the ability of the Fund to achieve its investment objective.
| ∎ | | Market risk. The market values of the Fund’s investments, and therefore the value of the Fund’s shares, will go up and down, sometimes rapidly or unpredictably. Market risk may affect a single issuer, industry or section of the economy, or it may affect the market as a whole. Individual stock prices tend to go up and down more dramatically than those of certain other types of investments, such as bonds. During a general downturn in the financial markets, multiple asset classes may decline in value. When markets perform well, there can be no assurance that specific investments held by the Fund will rise in value. |
| ∎ | | Short position risk. Because the Fund’s potential loss on a short position arises from increases in the value of the asset sold short, the Fund will incur a loss on a short position, which is theoretically unlimited, if the price of the asset sold short increases from the short sale price. The counterparty to a short position or other market factors may prevent the Fund from closing out a short position at a desirable time or price and may reduce or eliminate any gain or result in a loss. In a rising market, the Fund’s short positions will cause the Fund to underperform the overall market and its peers that do not engage in shorting. If the Fund holds both long and short positions, and both positions decline simultaneously, the short positions will not provide any buffer (hedge) from declines in value of the Fund’s long positions. Certain types of short positions involve leverage, which may exaggerate any losses, potentially more than the actual cost of the investment, and will increase the volatility of the Fund’s returns. |
| ∎ | | Subsidiary risk. By investing in the Subsidiary, the Fund is indirectly exposed to risks associated with the Subsidiary’s investments. The Subsidiary is not registered under the Investment Company Act of 1940, as amended (1940 Act), and, except as otherwise noted in the prospectus, is not subject to the investor protections of the 1940 Act. Changes in the laws of the United States and/or the Cayman Islands, under which the Fund and the Subsidiary, respectively, are organized, could result in the inability of the Fund and/or the Subsidiary to operate as described in the prospectus and the SAI, and could negatively affect the Fund and its shareholders. |
| ∎ | | US government obligations risk. Obligations of US government agencies and authorities receive varying levels of support and may not be backed by the full faith and credit of the US government, which could affect the Fund’s ability to recover should they default. No assurance can be given that the US government will provide financial support to its agencies and authorities if it is not obligated by law to do so. |
| ∎ | | Volatility risk. Although the Fund’s investment strategy targets a specific volatility level, certain of the Fund’s investments may appreciate or decrease significantly in value over short periods of time. This may cause the Fund’s net asset value per share to experience significant increases or declines in value over short periods of time. |
About indexes used in this report
| ∎ | | The Bloomberg Barclays 3-Month Treasury Bellwether Index measures the performance of Treasury bills with maturities of less than three months. |
| ∎ | | The Lipper Absolute Return Funds Index is an unmanaged index considered representative of absolute return funds tracked by Lipper. |
| ∎ | | The Fund is not managed to track the performance of any particular index, including the index(es) described here, and consequently, the performance of the Fund may deviate significantly from the performance of the index(es). |
| ∎ | | A direct investment cannot be made in an index. Unless otherwise indicated, index results include reinvested dividends, and they do not reflect sales charges. Performance of the peer group, if applicable, reflects fund expenses; performance of a market index does not. |
Other information
| ∎ | | The returns shown in management’s discussion of Fund performance are based on net asset values (NAVs) calculated for shareholder transactions. Generally accepted accounting principles require adjustments to be made to the net assets of the Fund at period end for financial reporting purposes, and as such, the NAVs for shareholder transactions and the returns based on those NAVs may differ from the NAVs and returns reported in the Financial Highlights. |
10 Invesco Macro Allocation Strategy Fund
Consolidated Schedule of Investments
October 31, 2016
| | | | | | | | | | | | | | | | |
| | | Interest
Rate | | | Maturity
Date | | | Principal
Amount | | | Value | |
U.S. Treasury Securities–50.72% | |
| U.S. Treasury Bills–26.71%(a) | |
U.S. Treasury Bills(b) | | | 0.34 | % | | | 01/05/2017 | | | $ | 3,000,000 | | | $ | 2,998,591 | |
U.S. Treasury Bills(c) | | | 0.40 | % | | | 01/26/2017 | | | | 770,000 | | | | 769,448 | |
U.S. Treasury Bills(b) | | | 0.40 | % | | | 01/26/2017 | | | | 3,640,000 | | | | 3,637,391 | |
U.S. Treasury Bills | | | 0.47 | % | | | 06/22/2017 | | | | 2,430,000 | | | | 2,422,056 | |
U.S. Treasury Bills(c) | | | 0.57 | % | | | 08/17/2017 | | | | 560,000 | | | | 557,482 | |
U.S. Treasury Bills | | | 0.57 | % | | | 08/17/2017 | | | | 3,440,000 | | | | 3,424,532 | |
| | | | | | | | | | | | | | | | 13,809,500 | |
|
| U.S. Treasury Notes–24.01%(d) | |
U.S. Treasury Floating Rate Notes(b)(c) | | | 0.61 | % | | | 01/31/2018 | | | | 910,000 | | | | 912,277 | |
U.S. Treasury Floating Rate Notes(b) | | | 0.61 | % | | | 01/31/2018 | | | | 5,500,000 | | | | 5,513,761 | |
U.S. Treasury Floating Rate Notes(c) | | | 0.53 | % | | | 04/30/2018 | | | | 695,000 | | | | 695,890 | |
U.S. Treasury Floating Rate Notes | | | 0.53 | % | | | 04/30/2018 | | | | 2,380,000 | | | | 2,383,046 | |
U.S. Treasury Floating Rate Notes(c) | | | 0.51 | % | | | 07/31/2018 | | | | 410,000 | | | | 410,173 | |
U.S. Treasury Floating Rate Notes | | | 0.51 | % | | | 07/31/2018 | | | | 2,500,000 | | | | 2,501,056 | |
| | | | | | | | | | | | | | | | 12,416,203 | |
Total U.S. Treasury Securities (Cost $26,203,433) | | | | | | | | | | | | | | | 26,225,703 | |
| | | | |
| | | | | | | | | Shares | | | | |
|
| Money Market Funds–49.76% | |
Government & Agency Portfolio–Institutional Class, 0.29%(e) | | | | | | | | | | | 10,841,710 | | | | 10,841,710 | |
STIC (Global Series) PLC–U.S. Dollar Liquidity Portfolio (Ireland)–Institutional Class, 0.62%(e) | | | | | | | | | | | 7,662,165 | | | | 7,662,165 | |
Treasury Portfolio–Institutional Class, 0.22%(e) | | | | | | | | | | | 7,227,807 | | | | 7,227,807 | |
Total Money Market Funds (Cost $25,731,682) | | | | | | | | | | | | | | | 25,731,682 | |
TOTAL INVESTMENTS–100.48% (Cost $51,935,115) | | | | | | | | | | | | | | | 51,957,385 | |
OTHER ASSETS LESS LIABILITIES–(0.48)% | | | | | | | | | | | | | | | (247,837 | ) |
NET ASSETS–100.00% | | | | | | | | | | | | | | $ | 51,709,548 | |
| | | | | | | | | | | | | | | | | | |
| Open Futures Contracts | |
| Futures Contracts | | Type of
Contract | | Number of
Contracts | | | Expiration
Month | | | Notional
Value | | | Unrealized
Appreciation
(Depreciation) | |
Brent Crude(c) | | Long | | | 13 | | | | May-2017 | | | $ | 662,220 | | | $ | (27,075 | ) |
Cocoa(c) | | Long | | | 14 | | | | March-2017 | | | | 370,020 | | | | (443 | ) |
Coffee(c) | | Long | | | 29 | | | | December-2016 | | | | 1,785,131 | | | | 235,861 | |
Corn(c) | | Long | | | 7 | | | | December-2016 | | | | 124,163 | | | | 3,128 | |
Cotton No.2(c) | | Long | | | 21 | | | | December-2016 | | | | 723,030 | | | | 5,702 | |
Gas Oil(c) | | Long | | | 6 | | | | December-2016 | | | | 264,750 | | | | (7,601 | ) |
Gasoline Reformulated Blendstock Oxygenate Blending(c) | | Long | | | 9 | | | | December-2016 | | | | 536,571 | | | | (27,525 | ) |
Heating Oil(c) | | Long | | | 13 | | | | April-2017 | | | | 843,734 | | | | (24,592 | ) |
Lean Hogs(c) | | Short | | | 49 | | | | December-2016 | | | | (939,820 | ) | | | 59,382 | |
Silver(c) | | Long | | | 16 | | | | December-2016 | | | | 1,423,680 | | | | (89,785 | ) |
Soybean Oil(c) | | Long | | | 37 | | | | May-2017 | | | | 792,318 | | | | 28,575 | |
Soybeans(c) | | Long | | | 6 | | | | July-2017 | | | | 308,550 | | | | 14,454 | |
Wheat(c) | | Short | | | 15 | | | | December-2016 | | | | (312,187 | ) | | | 49,163 | |
WTI Crude(c) | | Long | | | 12 | | | | April-2017 | | | | 589,560 | | | | (25,976 | ) |
Subtotal — Commodity Risk | | | | | | | | | | | | | | | | $ | 193,268 | |
See accompanying Notes to Consolidated Financial Statements which are an integral part of the financial statements.
11 Invesco Macro Allocation Strategy Fund
| | | | | | | | | | | | | | | | | | |
| Open Futures Contracts–(continued) | |
| Futures Contracts | | Type of
Contract | | Number of
Contracts | | | Expiration
Month | | | Notional
Value | | | Unrealized
Appreciation
(Depreciation) | |
Dow Jones EURO STOXX 50 Index | | Long | | | 159 | | | | December-2016 | | | $ | 5,328,775 | | | $ | 111,092 | |
E-Mini S&P 500 Index | | Long | | | 48 | | | | December-2016 | | | | 5,088,240 | | | | (72,687 | ) |
FTSE 100 Index | | Long | | | 61 | | | | December-2016 | | | | 5,172,623 | | | | 223,075 | |
Hang Seng Index | | Long | | | 36 | | | | November-2016 | | | | 5,316,133 | | | | (123,074 | ) |
Russell 2000 Index Mini | | Long | | | 32 | | | | December-2016 | | | | 3,812,160 | | | | (125,322 | ) |
Tokyo Stock Price Index | | Long | | | 29 | | | | December-2016 | | | | 3,857,817 | | | | 184,834 | |
Subtotal — Equity Risk | | | | | | | | | | | | | | | | | 197,918 | |
Australia 10 Year Bonds | | Long | | | 11 | | | | December-2016 | | | | 1,109,672 | | | | (17,041 | ) |
Canada 10 Year Bonds | | Long | | | 25 | | | | December-2016 | | | | 2,695,620 | | | | (26,610 | ) |
Long Gilt | | Long | | | 6 | | | | December-2016 | | | | 920,346 | | | | (24,317 | ) |
U.S. Treasury Long Bonds | | Long | | | 7 | | | | December-2016 | | | | 1,139,031 | | | | (41,587 | ) |
Subtotal — Interest Rate Risk | | | | | | | | | | | | | | | | | (109,555 | ) |
Total Futures Contracts | | | | | | | | | | | | | | | | $ | 281,631 | |
| | | | | | | | | | | | | | | | | | | | | | | | |
|
| Open Over-The-Counter Total Return Swap Agreements | |
| Counterparty | | Pay/
Receive | | Reference Entity | | Fixed
Rate | | | Number of
Contracts | | | Termination
Date | | | Notional
Value | | | Unrealized
Appreciation
(Depreciation) | |
Barclays Bank PLC(c) | | Receive | | Barclays Commodity Strategy 1452 Excess Return Index (Copper) | | | 0.33 | % | | | 2,500 | | | | October-2017 | | | $ | 949,971 | | | $ | 43,330 | |
Barclays Bank PLC(c) | | Receive | | Barclays Commodity Strategy 1606 Index (Sugar) | | | 0.41 | | | | 2,590 | | | | October-2017 | | | | 1,022,335 | | | | (51,320 | ) |
Barclays Bank PLC(c) | | Receive | | Barclays Live Cattle Roll Yield Excess Return Index | | | 0.47 | | | | 2,100 | | | | February-2017 | | | | 225,497 | | | | 6,363 | |
Canadian Imperial Bank of Commerce(c) | | Receive | | CIBC Silver Index | | | 0.11 | | | | 1,290 | | | | February-2017 | | | | 132,051 | | | | 2,164 | |
Goldman Sachs International(c) | | Receive | | Enhanced Strategy AB31 on the S&P GSCI Cotton Excess Return Index | | | 0.45 | | | | 5,200 | | | | October-2017 | | | | 192,293 | | | | 4,977 | |
Goldman Sachs International(c) | | Receive | | Enhanced Strategy AB44 on the S&P GSCI Corn Excess Return Index | | | 0.30 | | | | 8,900 | | | | May-2017 | | | | 247,286 | | | | 10,918 | |
Goldman Sachs International(c) | | Receive | | Enhanced Strategy A141 on the S&P GSCI Sugar Excess Return Index | | | 0.37 | | | | 2,750 | | | | March-2017 | | | | 902,687 | | | | (71,306 | ) |
JPMorgan Chase Bank, N.A.(c) | | Receive | | J.P. Morgan Contag Beta Gas Oil Excess Return Index | | | 0.25 | | | | 3,050 | | | | April-2017 | | | | 645,347 | | | | (33,290 | ) |
JPMorgan Chase Bank, N.A.(c) | | Receive | | S&P GSCI Gold Index Excess Return | | | 0.09 | | | | 5,680 | | | | October-2017 | | | | 594,381 | | | | 4,421 | |
Merrill Lynch International(c) | | Receive | | Merrill Lynch Gold Excess Return Index | | | 0.14 | | | | 5,780 | | | | June-2017 | | | | 987,978 | | | | 0 | |
Merrill Lynch International(c) | | Receive | | MLCX Natural Gas Annual Excess Return Index | | | 0.25 | | | | 14,100 | | | | August-2017 | | | | 657,153 | | | | 0 | |
Morgan Stanley & Capital Services LLC(c) | | Receive | | MS Soybean Oil Dynamic Roll Index | | | 0.30 | | | | 1,040 | | | | April-2017 | | | | 170,581 | | | | (1,882 | ) |
Morgan Stanley & Capital Services LLC(c) | | Receive | | S&P GSCI Aluminum Dynamic Roll Index Excess Return | | | 0.38 | | | | 12,920 | | | | October-2017 | | | | 1,183,368 | | | | 53,271 | |
Total Swap Agreements — Commodity Risk | | | | | | | | | | | | | | | | | | | | | | $ | (32,354 | ) |
Notes to Consolidated Schedule of Investments:
| (a) | Security traded on a discount basis. The interest rate shown represents the discount rate at the time of purchase by the Fund. |
| (b) | All or a portion of the value was pledged as collateral to cover margin requirements for open futures contracts. See Note 1L and Note 4. |
| (c) | The investment is owned by the Subsidiary. See Note 5. |
| (d) | Interest or dividend rate is redetermined periodically. Rate shown is the rate in effect on October 31, 2016. |
| (e) | The money market fund and the Fund are affiliated by having the same investment adviser. The rate shown is the 7-day SEC standardized yield as of October 31, 2016. |
See accompanying Notes to Consolidated Financial Statements which are an integral part of the financial statements.
12 Invesco Macro Allocation Strategy Fund
Consolidated Statement of Assets and Liabilities
October 31, 2016
| | | | |
Assets: | |
Investments, at value (Cost $26,203,433) | | $ | 26,225,703 | |
Investments in affiliated money market funds, at value and cost | | | 25,731,682 | |
Total investments, at value (Cost $51,935,115) | | | 51,957,385 | |
Receivable for: | | | | |
Deposits with brokers — swap agreements | | | 220,000 | |
Fund shares sold | | | 30,099 | |
Dividends and interest | | | 6,227 | |
Fund expenses absorbed | | | 5,553 | |
Swaps receivables — OTC | | | 24,027 | |
Investment for trustee deferred compensation and retirement plans | | | 13,720 | |
Unrealized appreciation on swap agreements — OTC | | | 125,444 | |
Other assets | | | 49,884 | |
Total assets | | | 52,432,339 | |
|
Liabilities: | |
Payable for: | | | | |
Fund shares reacquired | | | 227,238 | |
Swaps payable — OTC | | | 34,217 | |
Variation margin — futures | | | 198,097 | |
Accrued fees to affiliates | | | 19,023 | |
Accrued trustees’ and officers’ fees and benefits | | | 1,888 | |
Accrued other operating expenses | | | 69,792 | |
Trustee deferred compensation and retirement plans | | | 14,738 | |
Unrealized depreciation on swap agreements — OTC | | | 157,798 | |
Total liabilities | | | 722,791 | |
Net assets applicable to shares outstanding | | $ | 51,709,548 | |
|
Net assets consist of: | |
Shares of beneficial interest | | $ | 48,079,426 | |
Undistributed net investment income (loss) | | | 6,320,075 | |
Undistributed net realized gain | | | (2,961,500 | ) |
Net unrealized appreciation | | | 271,547 | |
| | | $ | 51,709,548 | |
| | | | |
Net Assets: | |
Class A | | $ | 5,865,115 | |
Class C | | $ | 7,539,766 | |
Class R | | $ | 41,598 | |
Class Y | | $ | 38,019,184 | |
Class R5 | | $ | 9,801 | |
Class R6 | | $ | 234,084 | |
| |
Shares outstanding, $0.01 par value per share, with an unlimited number of shares authorized: | | | | |
Class A | | | 571,830 | |
Class C | | | 738,971 | |
Class R | | | 4,057 | |
Class Y | | | 3,693,488 | |
Class R5 | | | 952 | |
Class R6 | | | 22,758 | |
Class A: | | | | |
Net asset value per share | | $ | 10.26 | |
Maximum offering price per share | | | | |
(Net asset value of $10.26 ¸ 94.50%) | | $ | 10.86 | |
Class C: | | | | |
Net asset value and offering price per share | | $ | 10.20 | |
Class R: | | | | |
Net asset value and offering price per share | | $ | 10.25 | |
Class Y: | | | | |
Net asset value and offering price per share | | $ | 10.29 | |
Class R5: | | | | |
Net asset value and offering price per share | | $ | 10.30 | |
Class R6: | | | | |
Net asset value and offering price per share | | $ | 10.29 | |
See accompanying Notes to Consolidated Financial Statements which are an integral part of the financial statements.
13 Invesco Macro Allocation Strategy Fund
Consolidated Statement of Operations
For the year ended October 31, 2016
| | | | |
Investment income: | |
Dividends from affiliated money market funds | | $ | 121,312 | |
Interest | | | 140,202 | |
Total investment income | | | 261,514 | |
| |
Expenses: | | | | |
Advisory fees | | | 1,221,786 | |
Administrative services fees | | | 50,000 | |
Custodian fees | | | 8,385 | |
Distribution fees: | | | | |
Class A | | | 15,182 | |
Class C | | | 81,966 | |
Class R | | | 171 | |
Transfer agent fees – A, C, R, and Y | | | 55,178 | |
Transfer agent fees – R6 | | | 204 | |
Trustees’ and officers’ fees and benefits | | | 20,820 | |
Registration and filing fees | | | 76,443 | |
Reports to shareholders | | | 23,062 | |
Professional services fees | | | 69,142 | |
Other | | | 20,178 | |
Total expenses | | | 1,642,517 | |
Less: Fees waived and expenses reimbursed | | | (425,628 | ) |
Net expenses | | | 1,216,889 | |
Net investment income (loss) | | | (955,375 | ) |
| |
Realized and unrealized gain (loss) from: | | | | |
Net realized gain from: | | | | |
Investment securities | | | 13,672 | |
Foreign currencies | | | 18,023 | |
Futures contracts | | | 9,727,647 | |
Swap agreements | | | 1,465,170 | |
| | | | 11,224,512 | |
Change in net unrealized appreciation (depreciation) of: | | | | |
Investment securities | | | 14,960 | |
Futures contracts | | | (3,023,955 | ) |
Swap agreements | | | (196,194 | ) |
| | | | (3,205,189 | ) |
Net realized and unrealized gain | | | 8,019,323 | |
Net increase in net assets resulting from operations | | $ | 7,063,948 | |
See accompanying Notes to Consolidated Financial Statements which are an integral part of the financial statements.
14 Invesco Macro Allocation Strategy Fund
Consolidated Statement of Changes in Net Assets
For the years ended October 31, 2016 and 2015
| | | | | | | | |
| | | 2016 | | | 2015 | |
Operations: | | | | | |
Net investment income (loss) | | $ | (955,375 | ) | | $ | (2,691,678 | ) |
Net realized gain | | | 11,224,512 | | | | 1,085,067 | |
Change in net unrealized appreciation (depreciation) | | | (3,205,189 | ) | | | 961,724 | |
Net increase (decrease) in net assets resulting from operations | | | 7,063,948 | | | | (644,887 | ) |
| | |
Distributions to shareholders from net investment income: | | | | | | | | |
Class A | | | (166,666 | ) | | | (101,201 | ) |
Class C | | | (98,610 | ) | | | (82,010 | ) |
Class R | | | (476 | ) | | | (320 | ) |
Class Y | | | (1,082,051 | ) | | | (696,170 | ) |
Class R5 | | | (236 | ) | | | (175 | ) |
Class R6 | | | (2,605,719 | ) | | | (2,023,415 | ) |
Total distributions from net investment income | | | (3,953,758 | ) | | | (2,903,291 | ) |
| | |
Distributions to shareholders from net realized gains: | | | | | | | | |
Class A | | | — | | | | (119,584 | ) |
Class C | | | — | | | | (196,803 | ) |
Class R | | | — | | | | (455 | ) |
Class Y | | | — | | | | (705,619 | ) |
Class R5 | | | — | | | | (178 | ) |
Class R6 | | | — | | | | (2,050,877 | ) |
Total distributions from net realized gains | | | — | | | | (3,073,516 | ) |
| | |
Share transactions–net: | | | | | | | | |
Class A | | | (1,863,678 | ) | | | 698,619 | |
Class C | | | (1,087,693 | ) | | | (3,677,350 | ) |
Class R | | | 15,171 | | | | 854 | |
Class Y | | | (11,607,532 | ) | | | 13,895,707 | |
Class R6 | | | (100,961,921 | ) | | | (8,020,707 | ) |
Net increase (decrease) in net assets resulting from share transactions | | | (115,505,653 | ) | | | 2,897,123 | |
Net increase (decrease) in net assets | | | (112,395,463 | ) | | | (3,724,571 | ) |
| | |
Net assets: | | | | | | | | |
Beginning of year | | | 164,105,011 | | | | 167,829,582 | |
End of year (includes undistributed net investment income of $6,320,075 and $3,078,977, respectively) | | $ | 51,709,548 | | | $ | 164,105,011 | |
Notes to Consolidated Financial Statements
October 31, 2016
NOTE 1—Significant Accounting Policies
Invesco Macro Allocation Strategy Fund (the “Fund”), formerly Invesco Global Markets Strategy Fund, is a series portfolio of AIM Investment Funds (Invesco Investment Funds) (the “Trust”). The Trust is organized as a Delaware statutory trust and is registered under the Investment Company Act of 1940, as amended (the “1940 Act”), as an open-end series management investment company consisting of twenty-two separate series portfolios, each authorized to issue an unlimited number of shares of beneficial interest. The assets, liabilities and operations of each portfolio are accounted for separately. Information presented in these consolidated financial statements pertains only to the Fund. Matters affecting each portfolio or class will be voted on exclusively by the shareholders of such portfolio or class.
The Fund will seek to gain exposure to the commodity markets primarily through investments in the Invesco Cayman Commodity Fund V Ltd. (the “Subsidiary”), a wholly-owned subsidiary of the Fund organized under the laws of the Cayman Islands. The Subsidiary was organized by the Fund to invest in commodity-linked derivatives and other securities that may provide leveraged and non-leveraged exposure to commodities. The Fund may invest up to 25% of its total assets in the Subsidiary.
The Fund’s investment objective is to seek a positive absolute return over a complete economic and market cycle.
The Fund currently consists of six different classes of shares: Class A, Class C, Class R, Class Y, Class R5 and Class R6. Class Y shares are available only to certain investors. Class A shares are sold with a front-end sales charge unless certain waiver criteria are met and under certain circumstances
15 Invesco Macro Allocation Strategy Fund
load waiver shares may be subject to contingent deferred sales charges (“CDSC”). Class C shares are sold with a CDSC. Class R, Class Y, Class R5 and Class R6 shares are sold at net asset value.
The following is a summary of the significant accounting policies followed by the Fund in the preparation of its consolidated financial statements.
| A. | Security Valuations — Securities, including restricted securities, are valued according to the following policy. |
Debt obligations (including convertible securities) and unlisted equities are fair valued using an evaluated quote provided by an independent pricing service. Evaluated quotes provided by the pricing service may be determined without exclusive reliance on quoted prices, and may reflect appropriate factors such as institution-size trading in similar groups of securities, developments related to specific securities, dividend rate (for unlisted equities), yield (for debt obligations), quality, type of issue, coupon rate (for debt obligations), maturity (for debt obligations), individual trading characteristics and other market data. Debt obligations are subject to interest rate and credit risks. In addition, all debt obligations involve some risk of default with respect to interest and/or principal payments.
A security listed or traded on an exchange (except convertible securities) is valued at its last sales price or official closing price as of the close of the customary trading session on the exchange where the security is principally traded, or lacking any sales or official closing price on a particular day, the security may be valued at the closing bid price on that day. Securities traded in the over-the-counter market are valued based on prices furnished by independent pricing services or market makers. When such securities are valued by an independent pricing service they may be considered fair valued. Futures contracts are valued at the final settlement price set by an exchange on which they are principally traded. Listed options are valued at the mean between the last bid and asked prices from the exchange on which they are principally traded. Options not listed on an exchange are valued by an independent source at the mean between the last bid and asked prices. For purposes of determining net asset value (“NAV”) per share, futures and option contracts generally are valued 15 minutes after the close of the customary trading session of the New York Stock Exchange (“NYSE”).
Investments in open-end and closed-end registered investment companies that do not trade on an exchange are valued at the end-of-day net asset value per share. Investments in open-end and closed-end registered investment companies that trade on an exchange are valued at the last sales price or official closing price as of the close of the customary trading session on the exchange where the security is principally traded.
Swap agreements are fair valued using an evaluated quote, if available, provided by an independent pricing service. Evaluated quotes provided by the pricing service are valued based on a model which may include end-of-day net present values, spreads, ratings, industry, company performance and returns of referenced assets.
Foreign securities’ (including foreign exchange contracts) prices are converted into U.S. dollar amounts using the applicable exchange rates as of the close of the NYSE. If market quotations are available and reliable for foreign exchange-traded equity securities, the securities will be valued at the market quotations. Because trading hours for certain foreign securities end before the close of the NYSE, closing market quotations may become unreliable. If between the time trading ends on a particular security and the close of the customary trading session on the NYSE, events occur that the Adviser determines are significant and make the closing price unreliable, the Fund may fair value the security. If the event is likely to have affected the closing price of the security, the security will be valued at fair value in good faith using procedures approved by the Board of Trustees. Adjustments to closing prices to reflect fair value may also be based on a screening process of an independent pricing service to indicate the degree of certainty, based on historical data, that the closing price in the principal market where a foreign security trades is not the current value as of the close of the NYSE. Foreign securities’ prices meeting the approved degree of certainty that the price is not reflective of current value will be priced at the indication of fair value from the independent pricing service. Multiple factors may be considered by the independent pricing service in determining adjustments to reflect fair value and may include information relating to sector indices, American Depositary Receipts and domestic and foreign index futures. Foreign securities may have additional risks including exchange rate changes, potential for sharply devalued currencies and high inflation, political and economic upheaval, the relative lack of issuer information, relatively low market liquidity and the potential lack of strict financial and accounting controls and standards.
Securities for which market prices are not provided by any of the above methods may be valued based upon quotes furnished by independent sources. The last bid price may be used to value equity securities. The mean between the last bid and asked prices is used to value debt obligations, including corporate loans.
Securities for which market quotations are not readily available or became unreliable are valued at fair value as determined in good faith by or under the supervision of the Trust’s officers following procedures approved by the Board of Trustees. Issuer specific events, market trends, bid/asked quotes of brokers and information providers and other market data may be reviewed in the course of making a good faith determination of a security’s fair value.
The Fund may invest in securities that are subject to interest rate risk, meaning the risk that the prices will generally fall as interest rates rise and, conversely, the prices will generally rise as interest rates fall. Specific securities differ in their sensitivity to changes in interest rates depending on their individual characteristics. Changes in interest rates may result in increased market volatility, which may affect the value and/or liquidity of certain Fund investments.
Valuations change in response to many factors including the historical and prospective earnings of the issuer, the value of the issuer’s assets, general economic conditions, interest rates, investor perceptions and market liquidity. Because of the inherent uncertainties of valuation, the values reflected in the consolidated financial statements may materially differ from the value received upon actual sale of those investments.
| B. | Securities Transactions and Investment Income — Securities transactions are accounted for on a trade date basis. Realized gains or losses on sales are computed on the basis of specific identification of the securities sold. Interest income (net of withholding tax, if any) is recorded on the accrual basis from settlement date. Dividend income (net of withholding tax, if any) is recorded on the ex-dividend date. Bond premiums and discounts are amortized and/or accreted for financial reporting purposes. |
The Fund may periodically participate in litigation related to Fund investments. As such, the Fund may receive proceeds from litigation settlements. Any proceeds received are included in the Consolidated Statement of Operations as realized gain (loss) for investments no longer held and as unrealized gain (loss) for investments still held.
Brokerage commissions and mark ups are considered transaction costs and are recorded as an increase to the cost basis of securities purchased and/or a reduction of proceeds on a sale of securities. Such transaction costs are included in the determination of net realized and unrealized gain (loss) from investment securities reported in the Consolidated Statement of Operations and the Consolidated Statement of Changes in Net Assets and the net realized and unrealized gains (losses) on securities per share in the Financial Highlights. Transaction costs are
16 Invesco Macro Allocation Strategy Fund
included in the calculation of the Fund’s net asset value and, accordingly, they reduce the Fund’s total returns. These transaction costs are not considered operating expenses and are not reflected in net investment income reported in the Consolidated Statement of Operations and the Consolidated Statement of Changes in Net Assets, or the net investment income per share and the ratios of expenses and net investment income reported in the Financial Highlights, nor are they limited by any expense limitation arrangements between the Fund and the investment adviser.
The Fund allocates income and realized and unrealized capital gains and losses to a class based on the relative net assets of each class.
| C. | Country Determination — For the purposes of making investment selection decisions and presentation in the Consolidated Schedule of Investments, the investment adviser may determine the country in which an issuer is located and/or credit risk exposure based on various factors. These factors include the laws of the country under which the issuer is organized, where the issuer maintains a principal office, the country in which the issuer derives 50% or more of its total revenues and the country that has the primary market for the issuer’s securities, as well as other criteria. Among the other criteria that may be evaluated for making this determination are the country in which the issuer maintains 50% or more of its assets, the type of security, financial guarantees and enhancements, the nature of the collateral and the sponsor organization. Country of issuer and/or credit risk exposure has been determined to be the United States of America, unless otherwise noted. |
| D. | Distributions — Distributions from net investment income and net realized capital gain, if any, are generally declared and paid annually and recorded on the ex-dividend date. The Fund may elect to treat a portion of the proceeds from redemptions as distributions for federal income tax purposes. |
| E. | Federal Income Taxes — The Fund intends to comply with the requirements of Subchapter M of the Internal Revenue Code of 1986, as amended (the “Internal Revenue Code”), necessary to qualify as a regulated investment company and to distribute substantially all of the Fund’s taxable earnings to shareholders. As such, the Fund will not be subject to federal income taxes on otherwise taxable income (including net realized capital gain) that is distributed to shareholders. Therefore, no provision for federal income taxes is recorded in the consolidated financial statements. |
The Fund recognizes the tax benefits of uncertain tax positions only when the position is more likely than not to be sustained. Management has analyzed the Fund’s uncertain tax positions and concluded that no liability for unrecognized tax benefits should be recorded related to uncertain tax positions. Management is not aware of any tax positions for which it is reasonably possible that the total amounts of unrecognized tax benefits will change materially in the next 12 months.
The Subsidiary is classified as a controlled foreign corporation under Subchapter N of the Internal Revenue Code. Therefore, the Fund is required to increase its taxable income by its share of the Subsidiary’s income. Net investment losses of the Subsidiary cannot be deducted by the Fund in the current period nor carried forward to offset taxable income in future periods.
The Fund files tax returns in the U.S. Federal jurisdiction and certain other jurisdictions. Generally the Fund is subject to examinations by such taxing authorities for up to three years after the filing of the return for the tax period.
| F. | Expenses — Fees provided for under the Rule 12b-1 plan of a particular class of the Fund are charged to the operations of such class. Transfer agency fees and expenses and other shareholder recordkeeping fees and expenses attributable to Class R5 and Class R6 are allocated to each share class based on relative net assets. Sub-accounting fees attributable to Class R5 are charged to the operations of the class. Transfer agency fees and expenses and other shareholder recordkeeping fees and expenses relating to all other classes are allocated among those classes based on relative net assets. All other expenses are allocated among the classes based on relative net assets. |
| G. | Accounting Estimates — The financial statements are prepared on a consolidated basis in conformity with accounting principles generally accepted in the United States of America (“GAAP”), which requires management to make estimates and assumptions that affect the reported amounts of assets and liabilities at the date of the financial statements and the reported amounts of revenues and expenses during the reporting period including estimates and assumptions related to taxation. Actual results could differ from those estimates by a significant amount. The accompanying financial statements reflect the financial position of the Fund and its Subsidiary and the results of operations on a consolidated basis. All inter-company accounts and transactions have been eliminated in consolidation. |
In addition, the Fund monitors for material events or transactions that may occur or become known after the period-end date and before the date the consolidated financial statements are released to print.
| H. | Indemnifications — Under the Trust’s organizational documents, each Trustee, officer, employee or other agent of the Trust, and under the Subsidiary’s organizational documents, the directors and officers of the Subsidiary, are indemnified against certain liabilities that may arise out of the performance of their duties to the Fund and/or the Subsidiary, respectively. Additionally, in the normal course of business, the Fund enters into contracts, including the Fund’s servicing agreements, that contain a variety of indemnification clauses. The Fund’s maximum exposure under these arrangements is unknown as this would involve future claims that may be made against the Fund that have not yet occurred. The risk of material loss as a result of such indemnification claims is considered remote. |
| I. | Structured Securities — The Fund may invest in structured securities. Structured securities are a type of derivative security whose value is determined by reference to changes in the value of underlying securities, currencies, interest rates, commodities, indices or other financial indicators (“reference instruments”). Most structured securities are fixed-income securities that have maturities of three years or less. Structured securities may be positively or negatively indexed (i.e., their principal value or interest rates may increase or decrease if the underlying reference instrument appreciates) and may have return characteristics similar to direct investments in the underlying reference instrument. |
Structured securities may entail a greater degree of market risk than other types of debt securities because the investor bears the risk of the reference instruments. In addition to the credit risk of structured securities and the normal risks of price changes in response to changes in interest rates, the principal amount of structured notes or indexed securities may decrease as a result of changes in the value of the underlying reference instruments. Changes in the daily value of structured securities are recorded as unrealized gains (losses) in the Consolidated Statement of Operations. When the structured securities mature or are sold, the Fund recognizes a realized gain (loss) on the Consolidated Statement of Operations.
| J. | Foreign Currency Translations — Foreign currency is valued at the close of the NYSE based on quotations posted by banks and major currency dealers. Portfolio securities and other assets and liabilities denominated in foreign currencies are translated into U.S. dollar amounts at date of valuation. Purchases and sales of portfolio securities (net of foreign taxes withheld on disposition) and income items denominated in foreign currencies are translated into U.S. dollar amounts on the respective dates of such transactions. The Fund does not separately account for the portion of the results of operations resulting from changes in foreign exchange rates on investments and the fluctuations arising from |
17 Invesco Macro Allocation Strategy Fund
| | changes in market prices of securities held. The combined results of changes in foreign exchange rates and the fluctuation of market prices on investments (net of estimated foreign tax withholding) are included with the net realized and unrealized gain or loss from investments in the Consolidated Statement of Operations. Reported net realized foreign currency gains or losses arise from (1) sales of foreign currencies, (2) currency gains or losses realized between the trade and settlement dates on securities transactions, and (3) the difference between the amounts of dividends, interest, and foreign withholding taxes recorded on the Fund’s books and the U.S. dollar equivalent of the amounts actually received or paid. Net unrealized foreign currency gains and losses arise from changes in the fair values of assets and liabilities, other than investments in securities at fiscal period end, resulting from changes in exchange rates. |
The Fund may invest in foreign securities, which may be subject to foreign taxes on income, gains on investments or currency repatriation, a portion of which may be recoverable. Foreign taxes, if any, are recorded based on the tax regulations and rates that exist in the foreign markets in which the Fund invests and are shown in the Consolidated Statement of Operations.
| K. | Forward Foreign Currency Contracts — The Fund may engage in foreign currency transactions either on a spot (i.e. for prompt delivery and settlement) basis, or through forward foreign currency contracts, to manage or minimize currency or exchange rate risk. |
The Fund may also enter into forward foreign currency contracts for the purchase or sale of a security denominated in a foreign currency in order to “lock in” the U.S. dollar price of that security, or the Fund may also enter into forward foreign currency contracts that do not provide for physical settlement of the two currencies, but instead are settled by a single cash payment calculated as the difference between the agreed upon exchange rate and the spot rate at settlement based upon an agreed upon notional amount (non-deliverable forwards). The Fund will set aside liquid assets in an amount equal to the daily mark-to-market obligation for forward foreign currency contracts.
A forward foreign currency contract is an obligation between two parties (“Counterparties”) to purchase or sell a specific currency for an agreed-upon price at a future date. The use of forward foreign currency contracts does not eliminate fluctuations in the price of the underlying securities the Fund owns or intends to acquire but establishes a rate of exchange in advance. Fluctuations in the value of these contracts are measured by the difference in the contract date and reporting date exchange rates and are recorded as unrealized appreciation (depreciation) until the contracts are closed. When the contracts are closed, realized gains (losses) are recorded. Realized and unrealized gains (losses) on the contracts are included in the Consolidated Statement of Operations. The primary risks associated with forward foreign currency contracts include failure of the Counterparty to meet the terms of the contract and the value of the foreign currency changing unfavorably. These risks may be in excess of the amounts reflected in the Consolidated Statement of Assets and Liabilities.
| L. | Futures Contracts — The Fund may enter into futures contracts to manage exposure to interest rate, equity and market price movements and/or currency risks. A futures contract is an agreement between Counterparties to purchase or sell a specified underlying security, currency or commodity (or delivery of a cash settlement price, in the case of an index future) for a fixed price at a future date. The Fund currently invests only in exchange-traded futures and they are standardized as to maturity date and underlying financial instrument. Initial margin deposits required upon entering into futures contracts are satisfied by the segregation of specific securities or cash as collateral at the futures commission merchant (broker). During the period the futures contracts are open, changes in the value of the contracts are recognized as unrealized gains or losses by recalculating the value of the contracts on a daily basis. Subsequent or variation margin payments are received or made depending upon whether unrealized gains or losses are incurred. These amounts are reflected as receivables or payables on the Consolidated Statement of Assets and Liabilities. When the contracts are closed or expire, the Fund recognizes a realized gain or loss equal to the difference between the proceeds from, or cost of, the closing transaction and the Fund’s basis in the contract. The net realized gain (loss) and the change in unrealized gain (loss) on futures contracts held during the period is included on the Consolidated Statement of Operations. The primary risks associated with futures contracts are market risk and the absence of a liquid secondary market. If the Fund were unable to liquidate a futures contract and/or enter into an offsetting closing transaction, the Fund would continue to be subject to market risk with respect to the value of the contracts and continue to be required to maintain the margin deposits on the futures contracts. Futures contracts have minimal Counterparty risk since the exchange’s clearinghouse, as Counterparty to all exchange-traded futures, guarantees the futures against default. Risks may exceed amounts recognized in the Consolidated Statement of Assets and Liabilities. |
| M. | Swap Agreements — The Fund may enter into various swap transactions, including interest rate, total return, index, currency and credit default swap contracts (“CDS”) for investment purposes or to manage interest rate, currency or credit risk. Such transactions are agreements between Counterparties. These agreements may contain among other conditions, events of default and termination events, and various covenants and representations such as provisions that require the Fund to maintain a pre-determined level of net assets, and/or provide limits regarding the decline of the Fund’s NAV over specific periods of time. If the Fund were to trigger such provisions and have open derivative positions at that time, the Counterparty may be able to terminate such agreement and request immediate payment in an amount equal to the net liability positions, if any. |
Interest rate, total return, index, and currency swap agreements are two-party contracts entered into primarily to exchange the returns (or differentials in rates of returns) earned or realized on particular predetermined investments or instruments. The gross returns to be exchanged or “swapped” between the parties are calculated with respect to a notional amount, i.e., the return on or increase in value of a particular dollar amount invested at a particular interest rate or return of an underlying asset, in a particular foreign currency, or in a “basket” of securities representing a particular index. At the maturity date, a net cash flow is exchanged where the total return is equivalent to the return of the underlying reference less a financing rate, if any. As a receiver, the Fund would receive payments based on any positive total return and would owe payments in the event of a negative total return. As the payer, the Fund would owe payments on any net positive total return, and would receive payment in the event of a negative total return.
Changes in the value of swap agreements are recognized as unrealized gains (losses) in the Consolidated Statement of Operations by “marking to market” on a daily basis to reflect the value of the swap agreement at the end of each trading day. Payments received or paid at the beginning of the agreement are reflected as such on the Consolidated Statement of Assets and Liabilities and may be referred to as upfront payments. The Fund accrues for the fixed payment stream and amortizes upfront payments, if any, on swap agreements on a daily basis with the net amount, recorded as a component of realized gain (loss) on the Consolidated Statement of Operations. A liquidation payment received or made at the termination of a swap agreement is recorded as realized gain (loss) on the Consolidated Statement of Operations. The Fund segregates cash or liquid securities having a value at least equal to the amount of the potential obligation of a Fund under any swap transaction. Cash held as collateral is recorded as deposits with brokers on the Consolidated Statement of Assets and Liabilities. Entering into these agreements involves,
18 Invesco Macro Allocation Strategy Fund
to varying degrees, lack of liquidity and elements of credit, market, and Counterparty risk in excess of amounts recognized on the Consolidated Statement of Assets and Liabilities. Such risks involve the possibility that a swap is difficult to sell or liquidate; the Counterparty does not honor its obligations under the agreement and unfavorable interest rates and market fluctuations. It is possible that developments in the swaps market, including potential government regulation, could adversely affect the Fund’s ability to terminate existing swap agreements or to realize amounts to be received under such agreements. A short position in a security poses more risk than holding the same security long. As there is no limit on how much the price of the security can increase, the Fund’s exposure is unlimited.
| N. | Other Risks — The Fund will seek to gain exposure to commodity markets primarily through an investment in the Subsidiary and through investments in exchange-traded funds and commodity-linked derivatives. The Subsidiary, unlike the Fund, may invest without limitation in commodities, commodity-linked derivatives and other securities, such as exchange-traded notes, that may provide leveraged and non-leveraged exposure to commodity markets. The Fund is indirectly exposed to the risks associated with the Subsidiary’s investments. |
The Fund is non-diversified and may invest in securities of fewer issuers than if it were diversified. Thus, the value of the Fund’s shares may vary more widely and the Fund may be subject to greater market and credit risk than if the Fund invested more broadly.
| O. | Leverage Risk — Leverage exists when the Fund can lose more than it originally invests because it purchases or sells an instrument or enters into a transaction without investing an amount equal to the full economic exposure of the instrument or transaction. |
| P. | Collateral — To the extent the Fund has designated or segregated a security as collateral and that security is subsequently sold, it is the Fund’s practice to replace such collateral no later than the next business day. |
NOTE 2—Advisory Fees and Other Fees Paid to Affiliates
The Trust has entered into a master investment advisory agreement with Invesco Advisers, Inc. (the “Adviser” or “Invesco”). Under the terms of the investment advisory agreement, the Fund pays an advisory fee to the Adviser less the amount paid by the Subsidiary to the Adviser based on the annual rate of the Fund’s average daily net assets as follows:
| | | | |
| Average Daily Net Assets | | Rate | |
First $10 billion | | | 1.50% | |
Over $10 billion | | | 1.25% | |
For the year ended October 31, 2016, the effective advisory fees incurred by the Fund was 1.50%.
The Subsidiary has entered into a separate contract with the Adviser whereby the Adviser provides investment advisory and other services to the Subsidiary. In consideration of these services, the Subsidiary pays an advisory fee to the Adviser based on the annual rate of the Subsidiary’s average daily net assets as set forth in the table above.
Under the terms of a master sub-advisory agreement between the Adviser and each of Invesco Asset Management Deutschland GmbH, Invesco Asset Management Limited, Invesco Asset Management (Japan) Limited, Invesco Hong Kong Limited, Invesco Senior Secured Management, Inc., Invesco Canada Ltd. and Invesco PowerShares Capital Management LLC (collectively, the “Affiliated Sub-Advisers”) the Adviser, not the Fund, will pay 40% of the fees paid to the Adviser to any such Affiliated Sub-Adviser(s) that provide(s) discretionary investment management services to the Fund based on the percentage of assets allocated to such Affiliated Sub-Adviser(s).
Effective March 1, 2016, the Adviser has contractually agreed, through at least February 28, 2017, to waive advisory fees and/or reimburse expenses to the extent necessary to limit total annual fund operating expenses after fee waiver and/or expense reimbursement (excluding certain items discussed below) of Class A, Class C, Class R, Class Y, Class R5 and Class R6 shares to 1.65%, 2.40%, 1.90%, 1.40%, 1.40% and 1.40%, respectively, of average daily net assets (the “expense limits”). Prior to March 1, 2016, the Adviser had contractually agreed to waive advisory fees and/or reimburse expenses to the extent necessary to limit total annual fund operating expenses after fee waiver and/or expense reimbursement (excluding certain items discussed below) of Class A, Class C, Class R, Class Y, Class R5 and Class R6 shares to 1.80%, 2.55%, 2.05%, 1.55%, 1.55% and 1.55%, respectively, of average daily net assets. In determining the Adviser’s obligation to waive advisory fees and/or reimburse expenses, the following expenses are not taken into account, and could cause total annual fund operating expenses after fee waiver and/or expense reimbursement to exceed the numbers reflected above: (1) interest; (2) taxes; (3) dividend expense on short sales; (4) extraordinary or non-routine items, including litigation expenses; and (5) expenses that the Fund has incurred but did not actually pay because of an expense offset arrangement. Acquired Fund Fees and Expenses are not operating expenses of a Fund directly, but are fees and expenses, including management fees, of the investment companies in which a Fund invests. As a result, the total annual fund operating expenses after expense reimbursement may exceed the expense limits above. Unless Invesco continues the fee waiver agreement, it will terminate on February 28, 2017. During its term, the fee waiver agreement cannot be terminated or amended to increase the expense limits without approval of the Board of Trustees.
Further, the Adviser has contractually agreed, through at least June 30, 2018, to waive the advisory fee payable by the Fund in an amount equal to 100% of the net advisory fees the Adviser receives from the affiliated money market funds on investments by the Fund of uninvested cash in such affiliated money market funds.
For the year ended October 31, 2016, the Adviser waived advisory fees of $370,246 and reimbursed class level expenses of $6,620, $8,935, $37, $39,586 and $204 of Class A, Class C, Class R, Class Y and Class R6 shares, respectively.
The Trust has entered into a master administrative services agreement with Invesco pursuant to which the Fund has agreed to pay Invesco for certain administrative costs incurred in providing accounting services to the Fund. For the year ended October 31, 2016, expenses incurred under the agreement are shown in the Consolidated Statement of Operations as Administrative services fees.
The Trust has entered into a transfer agency and service agreement with Invesco Investment Services, Inc. (“IIS”) pursuant to which the Fund has agreed to pay IIS a fee for providing transfer agency and shareholder services to the Fund and reimburse IIS for certain expenses incurred by IIS in the course of providing such services. IIS may make payments to intermediaries that provide omnibus account services, sub-accounting services and/or networking services. All fees payable by IIS to intermediaries that provide omnibus account services or sub-accounting are charged back to the Fund, subject to certain limitations approved by the Trust’s Board of Trustees. For the year ended October 31, 2016, expenses incurred under the agreement are shown in the Consolidated Statement of Operations as Transfer agent fees.
The Trust has entered into master distribution agreements with Invesco Distributors, Inc. (“IDI”) to serve as the distributor for the Class A, Class C, Class R, Class Y, Class R5 and Class R6 shares of the Fund. The Trust has adopted plans pursuant to Rule 12b-1 under the 1940 Act with respect to
19 Invesco Macro Allocation Strategy Fund
the Fund’s Class A, Class C and Class R shares (collectively, the “Plans”). The Fund, pursuant to the Plans, pays IDI compensation at the annual rate of 0.25% of the Fund’s average daily net assets of Class A shares, 1.00% of the average daily net assets of Class C shares and 0.50% of the average daily net assets of Class R shares. Of the Plan payments, up to 0.25% of the average daily net assets of each class of shares may be paid to furnish continuing personal shareholder services to customers who purchase and own shares of such classes. Any amounts not paid as a service fee under the Plans would constitute an asset-based sales charge. Rules of the Financial Industry Regulatory Authority (“FINRA”) impose a cap on the total sales charges, including asset-based sales charges, that may be paid by any class of shares of the Fund. For the year ended October 31, 2016, expenses incurred under the Plans are shown in the Consolidated Statement of Operations as Distribution fees.
Front-end sales commissions and CDSC (collectively, the “sales charges”) are not recorded as expenses of the Fund. Front-end sales commissions are deducted from proceeds from the sales of Fund shares prior to investment in Class A shares of the Fund. CDSC are deducted from redemption proceeds prior to remittance to the shareholder. During the year ended October 31, 2016, IDI advised the Fund that IDI retained $1,510 in front-end sales commissions from the sale of Class A shares and $493 and $2,099 from Class A and Class C shares, respectively, for CDSC imposed upon redemptions by shareholders.
Certain officers and trustees of the Trust are officers and directors of the Adviser, IIS and/or IDI.
NOTE 3—Additional Valuation Information
GAAP defines fair value as the price that would be received to sell an asset or paid to transfer a liability in an orderly transaction between market participants at the measurement date, under current market conditions. GAAP establishes a hierarchy that prioritizes the inputs to valuation methods, giving the highest priority to readily available unadjusted quoted prices in an active market for identical assets (Level 1) and the lowest priority to significant unobservable inputs (Level 3), generally when market prices are not readily available or are unreliable. Based on the valuation inputs, the securities or other investments are tiered into one of three levels. Changes in valuation methods may result in transfers in or out of an investment’s assigned level:
| | Level 1 — | Prices are determined using quoted prices in an active market for identical assets. |
| | Level 2 — | Prices are determined using other significant observable inputs. Observable inputs are inputs that other market participants may use in pricing a security. These may include quoted prices for similar securities, interest rates, prepayment speeds, credit risk, yield curves, loss severities, default rates, discount rates, volatilities and others. |
| | Level 3 – | Prices are determined using significant unobservable inputs. In situations where quoted prices or observable inputs are unavailable (for example, when there is little or no market activity for an investment at the end of the period), unobservable inputs may be used. Unobservable inputs reflect the Fund’s own assumptions about the factors market participants would use in determining fair value of the securities or instruments and would be based on the best available information. |
The following is a summary of the tiered valuation input levels, as of October 31, 2016. The level assigned to the securities valuations may not be an indication of the risk or liquidity associated with investing in those securities. Because of the inherent uncertainties of valuation, the values reflected in the consolidated financial statements may materially differ from the value received upon actual sale of those investments.
| | | | | | | | | | | | | | | | |
| | | Level 1 | | | Level 2 | | | Level 3 | | | Total | |
U.S. Treasury Securities | | $ | — | | | $ | 26,225,703 | | | $ | — | | | $ | 26,225,703 | |
Money Market Funds | | | 25,731,682 | | | | — | | | | — | | | | 25,731,682 | |
| | | | 25,731,682 | | | | 26,225,703 | | | | — | | | | 51,957,385 | |
Futures* | | $ | 281,631 | | | $ | — | | | $ | — | | | $ | 281,631 | |
Swap Agreements* | | | — | | | | (32,354 | ) | | | — | | | | (32,354 | ) |
Total Investments | | $ | 26,013,313 | | | $ | 26,193,349 | | | $ | — | | | $ | 52,206,662 | |
| * | Unrealized appreciation (depreciation). |
NOTE 4—Derivative Investments
The Fund may enter into an International Swaps and Derivatives Association Master Agreement (“ISDA Master Agreement”) under which a Fund may trade OTC derivatives. An OTC transaction entered into under an ISDA Master Agreement typically involves a collateral posting arrangement, payment netting provisions and close-out netting provisions. These netting provisions allow for reduction of credit risk through netting of contractual obligations. The enforceability of the netting provisions of the ISDA Master Agreement depends on the governing law of the ISDA Master Agreement, among other factors.
For financial reporting purposes, the Fund does not offset OTC derivative assets or liabilities that are subject to ISDA Master Agreements in the Consolidated Statement of Assets and Liabilities.
Value of Derivative Investments at Period-End
The table below summarizes the value of the Fund’s derivative investments, detailed by primary risk exposure, held as of October 31, 2016:
| | | | | | | | | | | | | | | | |
Derivative Assets | | Value | |
| | Commodity
Risk | | | Equity Risk | | | Interest Rate
Risk | | | Total | |
Unrealized appreciation on futures contracts — Exchange-Traded(a) | | $ | 396,265 | | | $ | 519,001 | | | $ | — | | | $ | 915,266 | |
Unrealized appreciation on swap agreements — OTC | | | 125,444 | | | | — | | | | — | | | | 125,444 | |
Total Derivative Assets | | | 521,709 | | | | 519,001 | | | | — | | | | 1,040,710 | |
Derivatives not subject to master netting agreements | | | (396,265 | ) | | | (519,001 | ) | | | — | | | | (915,266 | ) |
Total Derivative Assets subject to master netting agreements | | $ | 125,444 | | | $ | — | | | $ | — | | | $ | 125,444 | |
20 Invesco Macro Allocation Strategy Fund
| | | | | | | | | | | | | | | | |
Derivative Liabilities | | Value | |
| | Commodity
Risk | | | Equity Risk | | | Interest
Rate Risk | | | Total | |
Unrealized depreciation on futures contracts — Exchange-Traded(a) | | $ | (202,997 | ) | | $ | (321,083 | ) | | $ | (109,555 | ) | | $ | (633,635 | ) |
Unrealized depreciation on swap agreements — OTC | | | (157,798 | ) | | | — | | | | — | | | | (157,798 | ) |
Total Derivative Liabilities | | | (360,795 | ) | | | (321,083 | ) | | | (109,555 | ) | | | (791,433 | ) |
Derivatives not subject to master netting agreements | | | 202,997 | | | | 321,083 | | | | 109,555 | | | | 633,635 | |
Total Derivative Liabilities subject to master netting agreements | | $ | (157,798 | ) | | $ | — | | | $ | — | | | $ | (157,798 | ) |
| (a) | Includes cumulative appreciation (depreciation) on futures contracts. Only current day’s variation margin receivable (payable) is reported within the Consolidated Statement of Assets and Liabilities. |
| | | | | | | | | | | | | | | | | | | | | | | | |
| | | Financial
Derivative Assets | | | Financial
Derivative Liabilities | | | | | | Collateral | | | | |
| | | Swap | | | Swap | | | Net value of | | | (Received)/Pledged | | | Net | |
| Counterparty | | agreements | | | agreements | | | derivatives | | | Non-Cash | | | Cash | | | amount(a) | |
| Subsidiary | | | | | | | | | | | | | | | | | | |
Merrill Lynch International | | $ | 23,952 | | | $ | (33,274 | ) | | $ | (9,322 | ) | | $ | — | | | $ | — | | | $ | (9,322 | ) |
Barclays Bank PLC | | | 49,693 | | | | (51,583 | ) | | | (1,890 | ) | | | — | | | | 1,890 | | | | — | |
Canadian Imperial Bank of Commerce | | | 2,164 | | | | (8 | ) | | | 2,156 | | | | — | | | | — | | | | 2,156 | |
Goldman Sachs International | | | 15,934 | | | | (71,693 | ) | | | (55,759 | ) | | | — | | | | 55,759 | | | | — | |
JP Morgan Chase Bank, N.A. | | | 4,457 | | | | (33,369 | ) | | | (28,912 | ) | | | — | | | | 28,912 | | | | — | |
Morgan Stanley Capital Services LLC | | | 53,271 | | | | (2,088 | ) | | | 51,183 | | | | — | | | | — | | | | 51,183 | |
Total | | $ | 149,471 | | | $ | (192,015 | ) | | $ | (42,544 | ) | | $ | — | | | $ | 86,561 | | | $ | 44,017 | |
| (a) | The Fund and the Subsidiary are recognized as separate legal entities and as such are subject to separate netting arrangements with the Counterparty. |
Effect of Derivative Investments for the year ended October 31, 2016
The table below summarizes the gains (losses) on derivative investments, detailed by primary risk exposure, recognized in earnings during the period:
| | | | | | | | | | | | | | | | |
| | | Location of Gain (Loss) on Consolidated Statement of Operations | |
| | Commodity
Risk | | | Equity Risk | | | Interest Rate
Risk | | | Total | |
Realized Gain (Loss): | | | | | | | | | | | | | | | | |
Futures contracts | | $ | 6,687,203 | | | $ | (1,779,516 | ) | | $ | 4,819,960 | | | $ | 9,727,647 | |
Swap agreements | | | 1,465,170 | | | | — | | | | — | | | | 1,465,170 | |
Change in Net Unrealized Appreciation (Depreciation): | | | | | | | | | | | | | | | | |
Futures contracts | | | (1,008,733 | ) | | | (1,607,174 | ) | | | (408,048 | ) | | | (3,023,955 | ) |
Swap agreements | | | (196,194 | ) | | | — | | | | — | | | | (196,194 | ) |
Total | | $ | 6,947,446 | | | $ | (3,386,690 | ) | | $ | 4,411,912 | | | $ | 7,972,668 | |
The table below summarizes the average notional value of futures contracts and swap agreements outstanding during the period.
| | | | | | | | |
| | | Futures
Contracts | | | Swap
Agreements | |
Average notional value | | $ | 92,203,278 | | | $ | 8,296,564 | |
NOTE 5—Subsidiary Information
The Fund’s Consolidated Schedule of Investments includes the holdings, including any investments in derivatives, of both the Fund and the Subsidiary. The Fund’s Consolidated Statement of Assets and Liabilities, Consolidated Statement of Operations and Consolidated Statement of Changes in Net Assets include the account balances of both the Fund and the Subsidiary and all interfund transactions have been eliminated.
The table below summarizes the financial information of the Subsidiary recognized in the consolidated financial statements referred to above.
| | | | |
| Selected Financial Information | | Invesco Cayman
Commodity Fund V Ltd.
(the “Subsidiary”) | |
Total assets | | $ | 11,386,837 | |
Total liabilities | | | 363,738 | |
Net assets | | | 11,023,099 | |
Total investment income | | | 62,526 | |
Net investment income (loss) | | | (236,670 | ) |
21 Invesco Macro Allocation Strategy Fund
| | | | |
| Selected Financial Information | | Invesco Cayman
Commodity Fund V Ltd.
(the “Subsidiary”) | |
Net realized gain from: | | | | |
Investment securities | | | 4,796 | |
Futures contracts | | | 6,687,203 | |
Swap agreements | | | 1,465,170 | |
Change in net unrealized appreciation (depreciation) of: | | | | |
Investment securities | | | 2,528 | |
Futures contracts | | | (1,008,733 | ) |
Swap agreements | | | (196,194 | ) |
Increase in net assets resulting from operations | | $ | 6,718,100 | |
NOTE 6—Trustees’ and Officers’ Fees and Benefits
Trustees’ and Officers’ Fees and Benefits include amounts accrued by the Fund to pay remuneration to certain Trustees and Officers of the Fund. Trustees have the option to defer compensation payable by the Fund, and Trustees’ and Officers’ Fees and Benefits also include amounts accrued by the Fund to fund such deferred compensation amounts. Those Trustees who defer compensation have the option to select various Invesco Funds in which their deferral accounts shall be deemed to be invested. Finally, certain current Trustees were eligible to participate in a retirement plan that provided for benefits to be paid upon retirement to Trustees over a period of time based on the number of years of service. The Fund may have certain former Trustees who also participate in a retirement plan and receive benefits under such plan. Trustees’ and Officers’ Fees and Benefits include amounts accrued by the Fund to fund such retirement benefits. Obligations under the deferred compensation and retirement plans represent unsecured claims against the general assets of the Fund.
NOTE 7—Cash Balances
The Fund is permitted to temporarily carry a negative or overdrawn balance in its account with State Street Bank and Trust Company, the custodian bank. Such balances, if any at period-end, are shown in the Consolidated Statement of Assets and Liabilities under the payable caption Amount due custodian. To compensate the custodian bank for such overdrafts, the overdrawn Fund may either (1) leave funds as a compensating balance in the account so the custodian bank can be compensated by earning the additional interest; or (2) compensate by paying the custodian bank at a rate agreed upon by the custodian bank and Invesco, not to exceed the contractually agreed upon rate.
NOTE 8—Distributions to Shareholders and Tax Components of Net Assets
Tax Character of Distributions to Shareholders Paid During the Fiscal Years Ended October 31, 2016 and 2015:
| | | | | | | | |
| | | 2016 | | | 2015 | |
Ordinary income | | $ | 3,953,758 | | | $ | 3,868,308 | |
Long-term capital gain | | | — | | | | 2,108,499 | |
Total distributions | | $ | 3,953,758 | | | $ | 5,976,807 | |
Tax Components of Net Assets at Period-End:
| | | | |
| | | 2016 | |
Undistributed ordinary income | �� | $ | 6,302,236 | |
Net unrealized appreciation — investments | | | 22,160 | |
Net unrealized appreciation — other investments | | | 18,110 | |
Temporary book/tax differences | | | (14,516 | ) |
Capital loss carryforward | | | (2,697,868 | ) |
Shares of beneficial interest | | | 48,079,426 | |
Total net assets | | $ | 51,709,548 | |
The difference between book-basis and tax-basis unrealized appreciation (depreciation) is due to differences in the timing of recognition of gains and losses on investments for tax and book purposes. The Fund’s net unrealized appreciation difference is attributable primarily to wash sales.
22 Invesco Macro Allocation Strategy Fund
The temporary book/tax differences are a result of timing differences between book and tax recognition of income and/or expenses. The Fund’s temporary book/tax differences are the result of the trustee deferral of compensation and retirement plan benefits.
Capital loss carryforward is calculated and reported as of a specific date. Results of transactions and other activity after that date may affect the amount of capital loss carryforward actually available for the Fund to utilize. The ability to utilize capital loss carryforward in the future may be limited under the Internal Revenue Code and related regulations based on the results of future transactions.
The Fund has a capital loss carryforward as of October 31, 2016 which expires as follows:
| | | | | | | | | | | | |
| Capital Loss Carryforward* | |
| Expiration | | Short-Term | | | Long-Term | | | Total | |
Not subject to expiration | | $ | 2,234,231 | | | $ | 463,637 | | | $ | 2,697,868 | |
| * | Capital loss carryforward as of the date listed above is reduced for limitations, if any, to the extent required by the Internal Revenue Code and may be further limited depending upon a variety of factors, including the realization of net unrealized gains or losses as of the date of any reorganization. |
NOTE 9—Investment Securities
The aggregate amount of investment securities (other than short-term securities, U.S. Treasury obligations and money market funds, if any) purchased and sold by the Fund during the year ended October 31, 2016 was $16,308,584 and $36,324,215, respectively. Cost of investments on a tax basis includes the adjustments for financial reporting purposes as of the most recently completed federal income tax reporting period-end.
| | | | |
| Unrealized Appreciation (Depreciation) of Investment Securities on a Tax Basis | |
Aggregate unrealized appreciation of investment securities | | $ | 22,752 | |
Aggregate unrealized (depreciation) of investment securities | | | (592 | ) |
Net unrealized appreciation of investment securities | | $ | 22,160 | |
Cost of investments for tax purposes is $51,935,225.
NOTE 10—Reclassification of Permanent Differences
Primarily as a result of differing book/tax treatment of futures contracts, swap agreement income and distributions from subsidiary, on October 31, 2016, undistributed net investment income was increased by $8,150,231 and undistributed net realized gain was decreased by $8,150,231. This reclassification had no effect on the net assets of the Fund.
NOTE 11—Share Information
| | | | | | | | | | | | | | | | |
| | | Summary of Share Activity | |
| | | Years ended October 31, | |
| | | 2016(a) | | | 2015 | |
| | | Shares | | | Amount | | | Shares | | | Amount | |
Sold: | | | | | | | | | | | | | | | | |
Class A | | | 129,199 | | | $ | 1,279,591 | | | | 508,205 | | | $ | 5,092,092 | |
Class C | | | 315,795 | | | | 3,058,442 | | | | 268,392 | | | | 2,710,112 | |
Class R | | | 1,530 | | | | 14,874 | | | | 698 | | | | 7,143 | |
Class Y | | | 2,456,126 | | | | 24,345,778 | | | | 6,132,600 | | | | 61,795,855 | |
Class R6 | | | 373,114 | | | | 3,591,990 | | | | 1,322,303 | | | | 13,256,829 | |
| | | | |
Issued as reinvestment of dividends: | | | | | | | | | | | | | | | | |
Class A | | | 16,934 | | | | 161,717 | | | | 20,165 | | | | 199,635 | |
Class C | | | 9,852 | | | | 94,186 | | | | 26,559 | | | | 262,665 | |
Class R | | | 31 | | | | 297 | | | | 48 | | | | 472 | |
Class Y | | | 82,229 | | | | 786,117 | | | | 122,360 | | | | 1,213,811 | |
Class R6 | | | 272,540 | | | | 2,605,482 | | | | 410,679 | | | | 4,073,939 | |
| | | | |
Reacquired: | | | | | | | | | | | | | | | | |
Class A | | | (339,177 | ) | | | (3,304,986 | ) | | | (461,934 | ) | | | (4,593,108 | ) |
Class C | | | (434,039 | ) | | | (4,240,321 | ) | | | (669,090 | ) | | | (6,650,127 | ) |
Class R | | | — | | | | — | | | | (660 | ) | | | (6,761 | ) |
Class Y | | | (3,749,930 | ) | | | (36,739,427 | ) | | | (4,995,636 | ) | | | (49,113,959 | ) |
Class R6(b) | | | (10,975,099 | ) | | | (107,159,393 | ) | | | (2,525,433 | ) | | | (25,351,475 | ) |
Net increase (decrease) in share activity | | | (11,840,895 | ) | | $ | (115,505,653 | ) | | | 159,256 | | | $ | 2,897,123 | |
| (a) | There are entities that are record owners of more than 5% of the outstanding shares of the Fund and in aggregate own 82% of the outstanding shares of the Fund. IDI has an agreement with these entities to sell Fund shares. The Fund, Invesco and/or Invesco affiliates may make payments to these entities, which is considered to be related to the Fund, for providing services to the Fund, Invesco and/or Invesco affiliates including but not limited to services such as, securities brokerage, distribution, third party record keeping and account servicing. The Fund has no knowledge as to whether all or any portion of the shares owned of record by these entities are also owned beneficially. |
| (b) | On February 18, 2016, 10,015,047 Class R6 shares valued at $97,847,008 were redeemed by affiliated mutual funds. |
23 Invesco Macro Allocation Strategy Fund
NOTE 12—Financial Highlights
The following schedule presents financial highlights for a share of the Fund outstanding throughout the periods indicated.
| | | | | | | | | | | | | | | | | | | | | | | | | | | | | | | | | | | | | | | | | | | | | | | | | | | | | | | | |
| | | Net asset
value,
beginning
of period | | | Net
investment
income
(loss)(a) | | | Net gains
(losses)
on securities
(both
realized and
unrealized) | | | Total from
investment
operations | | | Dividends
from net
investment
income | | | Distributions
from net
realized
gains | | | Total
distributions | | | Net asset
value, end
of period | | | Total
return(b) | | | Net assets,
end of period
(000’s omitted) | | | Ratio of
expenses
to average
net assets
with fee waivers
and/or expenses
absorbed | | | Ratio of
expenses
to average net
assets without
fee waivers
and/or expenses
absorbed | | | Ratio of net
investment
income (loss)
to average
net assets | | | Portfolio
turnover(c) | |
Class A | |
Year ended 10/31/16 | | $ | 9.70 | | | $ | (0.13 | ) | | $ | 0.91 | | | $ | 0.78 | | | $ | (0.22 | ) | | $ | — | | | $ | (0.22 | ) | | $ | 10.26 | | | | 8.21 | % | | $ | 5,865 | | | | 1.63 | %(d) | | | 2.19 | %(d) | | | (1.31 | )%(d) | | | 75 | % |
Year ended 10/31/15 | | | 10.02 | | | | (0.16 | ) | | | 0.18 | | | | 0.02 | | | | (0.15 | ) | | | (0.19 | ) | | | (0.34 | ) | | | 9.70 | | | | 0.18 | | | | 7,418 | | | | 1.70 | (e) | | | 2.03 | (e) | | | (1.64 | )(e) | | | 0 | |
Year ended 10/31/14 | | | 10.78 | | | | (0.17 | ) | | | 0.09 | | | | (0.08 | ) | | | — | | | | (0.68 | ) | | | (0.68 | ) | | | 10.02 | | | | (0.64 | ) | | | 6,996 | | | | 1.73 | | | | 2.06 | | | | (1.68 | ) | | | 0 | |
Year ended 10/31/13(f) | | | 10.52 | | | | (0.04 | ) | | | 0.30 | | | | 0.26 | | | | — | | | | — | | | | — | | | | 10.78 | | | | 2.47 | | | | 607 | | | | 1.99 | (g) | | | 2.04 | (g) | | | (1.92 | )(g) | | | 0 | |
Class C | | | | | | | | | | | | | | | | | | | | | | | | | | | | | | | | | | | | | | | | | | | | | | | | | | | | | | | | |
Year ended 10/31/16 | | | 9.62 | | | | (0.20 | ) | | | 0.90 | | | | 0.70 | | | | (0.12 | ) | | | — | | | | (0.12 | ) | | | 10.20 | | | | 7.41 | | | | 7,540 | | | | 2.38 | (d) | | | 2.94 | (d) | | | (2.06 | )(d) | | | 75 | |
Year ended 10/31/15 | | | 9.94 | | | | (0.24 | ) | | | 0.18 | | | | (0.06 | ) | | | (0.07 | ) | | | (0.19 | ) | | | (0.26 | ) | | | 9.62 | | | | (0.63 | ) | | | 8,155 | | | | 2.45 | (e) | | | 2.78 | (e) | | | (2.39 | )(e) | | | 0 | |
Year ended 10/31/14 | | | 10.78 | | | | (0.24 | ) | | | 0.08 | | | | (0.16 | ) | | | — | | | | (0.68 | ) | | | (0.68 | ) | | | 9.94 | | | | (1.42 | ) | | | 12,136 | | | | 2.48 | | | | 2.81 | | | | (2.43 | ) | | | 0 | |
Year ended 10/31/13(f) | | | 10.52 | | | | (0.05 | ) | | | 0.31 | | | | 0.26 | | | | — | | | | — | | | | — | | | | 10.78 | | | | 2.47 | | | | 818 | | | | 2.74 | (g) | | | 2.79 | (g) | | | (2.67 | )(g) | | | 0 | |
Class R | | | | | | | | | | | | | | | | | | | | | | | | | | | | | | | | | | | | | | | | | | | | | | | | | | | | | | | | |
Year ended 10/31/16 | | | 9.69 | | | | (0.15 | ) | | | 0.90 | | | | 0.75 | | | | (0.19 | ) | | | — | | | | (0.19 | ) | | | 10.25 | | | | 7.86 | | | | 42 | | | | 1.88 | (d) | | | 2.44 | (d) | | | (1.56 | )(d) | | | 75 | |
Year ended 10/31/15 | | | 10.00 | | | | (0.19 | ) | | | 0.20 | | | | 0.01 | | | | (0.13 | ) | | | (0.19 | ) | | | (0.32 | ) | | | 9.69 | | | | 0.00 | | | | 24 | | | | 1.95 | (e) | | | 2.28 | (e) | | | (1.89 | )(e) | | | 0 | |
Year ended 10/31/14 | | | 10.78 | | | | (0.19 | ) | | | 0.09 | | | | (0.10 | ) | | | — | | | | (0.68 | ) | | | (0.68 | ) | | | 10.00 | | | | (0.83 | ) | | | 24 | | | | 1.98 | | | | 2.31 | | | | (1.93 | ) | | | 0 | |
Year ended 10/31/13(f) | | | 10.52 | | | | (0.04 | ) | | | 0.30 | | | | 0.26 | | | | — | | | | — | | | | — | | | | 10.78 | | | | 2.47 | | | | 10 | | | | 2.24 | (g) | | | 2.29 | (g) | | | (2.17 | )(g) | | | 0 | |
Class Y | | | | | | | | | | | | | | | | | | | | | | | | | | | | | | | | | | | | | | | | | | | | | | | | | | | | | | | | |
Year ended 10/31/16 | | | 9.73 | | | | (0.10 | ) | | | 0.91 | | | | 0.81 | | | | (0.25 | ) | | | — | | | | (0.25 | ) | | | 10.29 | | | | 8.51 | | | | 38,019 | | | | 1.38 | (d) | | | 1.94 | (d) | | | (1.06 | )(d) | | | 75 | |
Year ended 10/31/15 | | | 10.05 | | | | (0.14 | ) | | | 0.19 | | | | 0.05 | | | | (0.18 | ) | | | (0.19 | ) | | | (0.37 | ) | | | 9.73 | | | | 0.44 | | | | 47,740 | | | | 1.45 | (e) | | | 1.78 | (e) | | | (1.39 | )(e) | | | 0 | |
Year ended 10/31/14 | | | 10.79 | | | | (0.14 | ) | | | 0.08 | | | | (0.06 | ) | | | — | | | | (0.68 | ) | | | (0.68 | ) | | | 10.05 | | | | (0.44 | ) | | | 36,645 | | | | 1.48 | | | | 1.81 | | | | (1.43 | ) | | | 0 | |
Year ended 10/31/13 | | | 9.91 | | | | (0.19 | ) | | | 1.07 | | | | 0.88 | | | | — | | | | — | | | | — | | | | 10.79 | | | | 8.88 | | | | 6,972 | | | | 1.82 | | | | 1.87 | | | | (1.75 | ) | | | 0 | |
Year ended 10/31/12(f) | | | 10.00 | | | | (0.02 | ) | | | (0.07 | ) | | | (0.09 | ) | | | — | | | | — | | | | — | | | | 9.91 | | | | (0.90 | ) | | | 10,017 | | | | 2.00 | (g) | | | 6.69 | (g) | | | (1.87 | )(g) | | | 0 | |
Class R5 | | | | | | | | | | | | | | | | | | | | | | | | | | | | | | | | | | | | | | | | | | | | | | | | | | | | | | | | |
Year ended 10/31/16 | | | 9.74 | | | | (0.10 | ) | | | 0.91 | | | | 0.81 | | | | (0.25 | ) | | | — | | | | (0.25 | ) | | | 10.30 | | | | 8.50 | | | | 10 | | | | 1.38 | (d) | | | 1.83 | (d) | | | (1.06 | )(d) | | | 75 | |
Year ended 10/31/15 | | | 10.06 | | | | (0.14 | ) | | | 0.19 | | | | 0.05 | | | | (0.18 | ) | | | (0.19 | ) | | | (0.37 | ) | | | 9.74 | | | | 0.44 | | | | 9 | | | | 1.45 | (e) | | | 1.65 | (e) | | | (1.39 | )(e) | | | 0 | |
Year ended 10/31/14 | | | 10.79 | | | | (0.14 | ) | | | 0.09 | | | | (0.05 | ) | | | — | | | | (0.68 | ) | | | (0.68 | ) | | | 10.06 | | | | (0.34 | ) | | | 10 | | | | 1.48 | | | | 1.69 | | | | (1.43 | ) | | | 0 | |
Year ended 10/31/13(f) | | | 10.52 | | | | (0.03 | ) | | | 0.30 | | | | 0.27 | | | | — | | | | — | | | | — | | | | 10.79 | | | | 2.57 | | | | 10 | | | | 1.75 | (g) | | | 1.80 | (g) | | | (1.68 | )(g) | | | 0 | |
Class R6 | | | | | | | | | | | | | | | | | | | | | | | | | | | | | | | | | | | | | | | | | | | | | | | | | | | | | | | | |
Year ended 10/31/16 | | | 9.73 | | | | (0.10 | ) | | | 0.91 | | | | 0.81 | | | | (0.25 | ) | | | — | | | | (0.25 | ) | | | 10.29 | | | | 8.51 | | | | 234 | | | | 1.38 | (d) | | | 1.83 | (d) | | | (1.06 | )(d) | | | 75 | |
Year ended 10/31/15 | | | 10.05 | | | | (0.14 | ) | | | 0.19 | | | | 0.05 | | | | (0.18 | ) | | | (0.19 | ) | | | (0.37 | ) | | | 9.73 | | | | 0.44 | | | | 100,759 | | | | 1.45 | (e) | | | 1.65 | (e) | | | (1.39 | )(e) | | | 0 | |
Year ended 10/31/14 | | | 10.80 | | | | (0.14 | ) | | | 0.07 | | | | (0.07 | ) | | | — | | | | (0.68 | ) | | | (0.68 | ) | | | 10.05 | | | | (0.53 | ) | | | 112,019 | | | | 1.48 | | | | 1.69 | | | | (1.43 | ) | | | 0 | |
Year ended 10/31/13(f) | | | 10.52 | | | | (0.03 | ) | | | 0.31 | | | | 0.28 | | | | — | | | | — | | | | — | | | | 10.80 | | | | 2.66 | | | | 109,848 | | | | 1.71 | (g) | | | 1.76 | (g) | | | (1.64 | )(g) | | | 0 | |
| (a) | Calculated using average shares outstanding. |
| (b) | Includes adjustments in accordance with accounting principles generally accepted in the United States of America and as such, the net asset value for financial reporting purposes and the returns based upon those net asset values may differ from the net asset value and returns for shareholder transactions. Does not include sales charges and is not annualized for periods less than one year, if applicable. |
| (c) | Portfolio turnover is calculated at the fund level and is not annualized for periods less than one year, if applicable. |
| (d) | Ratios are based on average daily net assets (000’s omitted) of $6,073, $8,197, $34, $36,316, $9 and $30,824 for Class A, Class C, Class R, Class Y, Class R5 and Class R6 shares, respectively. |
| (e) | In addition to the fees and expenses which the Fund bears directly; the Fund indirectly bears a pro rata share of the fees and expenses of the underlying funds in which the Fund invests. Because the underlying funds have varied expenses and fee levels and the fund may own different proportions at different times, the amount of fees and expenses incurred indirectly by the Fund will vary. Estimated underlying fund expenses are not expenses are not expenses that are incurred directly by your Fund. They are expenses that are incurred directly by the underlying finds and are deducted from the value of the funds your Funds invests in. The effect of the estimated Underlying fund expenses that you bear indirectly is included in your Fund’s total return. Estimated acquired fund fees from underlying funds were 0.11%. |
| (f) | Commencement date of September 26, 2012 for Class Y shares and August 28, 2013 for Class A, Class C, Class R, Class R5 and Class R6 shares, respectively. |
NOTE 13—Subsequent Event
Effective January 1, 2017, the Fund will pay an advisory fee to the Adviser based on the annual rate of the Fund’s average daily net assets as follows:
| | | | |
| Average Daily Net Assets | | Rate | |
First $250 million | | | 1.10% | |
Next $250 million | | | 1.08% | |
Next $500 million | | | 1.05% | |
Next $1.5 billion | | | 1.03% | |
Next $2.5 billion | | | 1.00% | |
Next $2.5 billion | | | 0.98% | |
Next $2.5 billion | | | 0.95% | |
Over $10 billion | | | 0.93% | |
In addition, effective January 1, 2017, the Adviser has contractually agreed, through at least February 28, 2018, to waive advisory fees and/or reimburse expenses to the extent necessary to limit total annual fund operating expenses after fee waiver and/or expense reimbursement (excluding certain items discussed in Note 2) of Class A, Class C, Class R, Class Y, Class R5 and Class R6 shares to 1.44%, 2.19%, 1.69%, 1.19%, 1.19% and 1.19%, respectively, of the Fund’s average daily net assets.
24 Invesco Macro Allocation Strategy Fund
Report of Independent Registered Public Accounting Firm
To the Board of Trustees
and Shareholders of the Invesco Macro Allocation Strategy Fund:
In our opinion, the accompanying consolidated statement of assets and liabilities, including the consolidated schedule of investments, and the related consolidated statements of operations and of changes in net assets and the financial highlights present fairly, in all material respects, the consolidated financial position of the Invesco Macro Allocation Strategy Fund and its subsidiary (formerly, Invesco Global Markets Strategy Fund, the “Fund”) as of October 31, 2016, the results of their operations for the year then ended, the changes in their net assets for each of the two years in the period then ended and the financial highlights for each of the four years in the period then ended and for the period September 26, 2012 (commencement of operations) through October 31, 2012, in conformity with accounting principles generally accepted in the United States of America. These consolidated financial statements and financial highlights (hereafter referred to as “financial statements”) are the responsibility of the Fund’s management. Our responsibility is to express an opinion on these financial statements based on our audits. We conducted our audits of these financial statements in accordance with the standards of the Public Company Accounting Oversight Board (United States). Those standards require that we plan and perform the audit to obtain reasonable assurance about whether the financial statements are free of material misstatement. An audit includes examining, on a test basis, evidence supporting the amounts and disclosures in the financial statements, assessing the accounting principles used and significant estimates made by management, and evaluating the overall financial statement presentation. We believe that our audits, which included confirmation of securities as of October 31, 2016 by correspondence with the custodian and brokers, provide a reasonable basis for our opinion.
PRICEWATERHOUSECOOPERS LLP
Houston, Texas
December 21, 2016
25 Invesco Macro Allocation Strategy Fund
Calculating your ongoing Fund expenses
Example
As a shareholder of the Fund, you incur two types of costs: (1) transaction costs, which may include sales charges (loads) on purchase payments or contingent deferred sales charges on redemptions, if any; and (2) ongoing costs, including management fees, distribution and/or service (12b-1) fees, and other Fund expenses. This example is intended to help you understand your ongoing costs (in dollars) of investing in the Fund and to compare these costs with ongoing costs of investing in other mutual funds. The example is based on an investment of $1,000 invested at the beginning of the period and held for the entire period May 1, 2016 through October 31, 2016.
Actual expenses
The table below provides information about actual account values and actual expenses. You may use the information in this table, together with the amount you invested, to estimate the expenses that you paid over the period. Simply divide your account value by $1,000 (for example, an $8,600 account value divided by $1,000 = 8.6), then multiply the result by the number in the table under the heading entitled “Actual Expenses Paid During Period” to estimate the expenses you paid on your account during this period.
Hypothetical example for comparison purposes
The table below also provides information about hypothetical account values and hypothetical expenses based on the Fund’s actual expense ratio and an assumed rate of return of 5% per year before expenses, which is not the Fund’s actual return.
The hypothetical account values and expenses may not be used to estimate the actual ending account balance or expenses you paid for the period. You may use this information to compare the ongoing costs of investing in the Fund and other funds. To do so, compare this 5% hypothetical example with the 5% hypothetical examples that appear in the shareholder reports of the other funds.
Please note that the expenses shown in the table are meant to highlight your ongoing costs only and do not reflect any transaction costs, such as sales charges (loads) on purchase payments or contingent deferred sales charges on redemptions, if any. Therefore, the hypothetical information is useful in comparing ongoing costs only, and will not help you determine the relative total costs of owning different funds. In addition, if these transaction costs were included, your costs would have been higher.
| | | | | | | | | | | | | | | | | | | | | | | | |
| Class | | Beginning
Account Value
(05/01/16) | | | ACTUAL | | | HYPOTHETICAL (5% annual return before expenses) | | | Annualized
Expense
Ratio2 | |
| | | Ending
Account Value
(10/31/16)1 | | | Expenses
Paid During
Period2,3 | | | Ending
Account Value
(10/31/16) | | | Expenses
Paid During
Period2,4 | | |
| A | | $ | 1,000.00 | | | $ | 1,044.80 | | | $ | 7.92 | | | $ | 1,017.39 | | | $ | 7.81 | | | | 1.54 | % |
| C | | | 1,000.00 | | | | 1,040.80 | | | | 11.75 | | | | 1,013.62 | | | | 11.59 | | | | 2.29 | |
| R | | | 1,000.00 | | | | 1,043.70 | | | | 9.20 | | | | 1,016.14 | | | | 9.07 | | | | 1.79 | |
| Y | | | 1,000.00 | | | | 1,046.70 | | | | 6.64 | | | | 1,018.65 | | | | 6.55 | | | | 1.29 | |
| R5 | | | 1,000.00 | | | | 1,046.70 | | | | 6.64 | | | | 1,018.65 | | | | 6.55 | | | | 1.29 | |
| R6 | | | 1,000.00 | | | | 1,046.80 | | | | 6.64 | | | | 1,018.65 | | | | 6.55 | | | | 1.29 | |
| 1 | The actual ending account value is based on the actual total return of the Fund for the period May 1, 2016 through October 31, 2016, after actual expenses and will differ from the hypothetical ending account value which is based on the Fund’s expense ratio and a hypothetical annual return of 5% before expenses. |
| 2 | Expenses are equal to the Fund’s annualized expense ratio as indicated above multiplied by the average account value over the period, multiplied by 184/366 to reflect the most recent fiscal half year. Effective January 1, 2017, the Fund’s adviser has contractually agreed to waive advisory fees and/or reimburse expenses to the extent necessary to limit total annual fund operating expenses of Class A, Class C, Class R, Class Y, Class R5 and Class R6 shares to 1.44%, 2.19%, 1.69%, 1.19%, 1.19%, and 1.19% of average daily net assets, respectively. The annualized ratios restated as if these agreements had been in effect throughout the entire most recent fiscal half year are 1.39%, 2.14%, 1.64%, 1.14%, 1.14% and 1.14%, for Class A, Class C, Class R, Class Y, Class R5 and Class R6 shares, respectively. |
| 3 | The actual expenses paid restated as if the changes discussed above had been in effect throughout the entire most recent fiscal half year are $7.14, $10.98, $8.42, $5.86, $5.86 and $5.87 for Class A, Class C, Class R, Class Y, Class R5 and Class R6 shares, respectively. |
| 4 | The hypothetical expenses paid restated as if the changes discussed above had been in effect throughout the entire most recent fiscal half year are $7.05, $10.84, $8.31, $5.79, $5.79 and $5.79 for Class A, Class C, Class R, Class Y, Class R5 and Class R6 shares, respectively. |
26 Invesco Macro Allocation Strategy Fund
Approval of Investment Advisory and Sub-Advisory Contracts
The Board of Trustees (the Board) of AIM Investment Funds (Invesco Investment Funds) is required under the Investment Company Act of 1940, as amended, to approve annually the renewal of Invesco Macro Allocation Strategy Fund’s (the Fund) investment advisory agreements. During contract renewal meetings held on June 7-8, 2016, the Board as a whole, and the disinterested or “independent” Trustees, who comprise over 75% of the Board, voting separately, approved the continuance for the Fund of the Master Investment Advisory Agreement with Invesco Advisers, Inc. (Invesco Advisers and the investment advisory agreement) and the Master Intergroup Sub-Advisory Contract for Mutual Funds with Invesco Asset Management Deutschland GmbH, Invesco Asset Management Limited, Invesco Asset Management (Japan) Limited, Invesco Hong Kong Limited, Invesco Senior Secured Management, Inc., Invesco Canada Ltd. and Invesco PowerShares Capital Management LLC (collectively, the Affiliated Sub-Advisers and the sub-advisory contracts) for another year, effective July 1, 2016.
In evaluating the fairness and reasonableness of compensation under the Fund’s investment advisory agreement and sub-advisory contracts, the Board considered, among other things, the factors discussed below. The Board determined that continuation of the Fund’s investment advisory agreement and the sub-advisory contracts is in the best interest of the Fund and its shareholders and that the compensation payable to Invesco Advisers and the Affiliated Sub-Advisers under the agreements is fair and reasonable.
The Board’s Fund Evaluation Process
The Board’s Investments Committee has established three Sub-Committees, which meet throughout the year to review the performance of funds advised by Invesco Advisers (the Invesco Funds). Over the course of each year, the Sub-Committees meet with portfolio managers for their assigned Invesco Funds and other members of management to review the performance, investment objective(s), policies, strategies, limitations and investment risks of these funds. The Board had the benefit of reports from the Sub-Committees and Investments Committee throughout the year in considering approval of the continuance of each Invesco Fund’s investment advisory agreement and sub-advisory contracts for another year.
During the contract renewal process, the Board receives comparative performance and fee data regarding the Invesco Funds prepared by Invesco Advisers and Broadridge Financial Solutions, Inc. (Broadridge), an independent provider of investment company data. The Board also receives an independent written evaluation from the Senior Officer, an officer of the Invesco Funds who reports directly to the
independent Trustees. The Senior Officer’s evaluation is prepared as part of his responsibility to manage the process by which the Invesco Funds’ proposed management fees are negotiated during the annual contract renewal process to ensure they are negotiated in a manner that is at arms’ length and reasonable. In addition to meetings with Invesco Advisers and fund counsel, the independent Trustees also discuss the continuance of the investment advisory agreement and sub-advisory contracts in separate sessions with the Senior Officer and with independent legal counsel.
The Trustees recognized that the advisory fee rates for the Invesco Funds are, in many cases, the result of years of review and negotiation. The Trustees’ deliberations and conclusions in a particular year may be based in part on their deliberations and conclusions regarding these same arrangements throughout the year and in prior years. The Trustees’ review and conclusions are based on the comprehensive consideration of all information presented to them and are not the result of any single determinative factor. Moreover, one Trustee may have weighed a particular piece of information or factor differently than another Trustee.
The discussion below is a summary of the Senior Officer’s independent written evaluation with respect to the Fund’s investment advisory agreement as well as a discussion of the material factors and related conclusions that formed the basis for the Board’s approval of the Fund’s investment advisory agreement and sub-advisory contracts. Unless otherwise stated, this information is current as of June 8, 2016, and does not reflect consideration of factors that became known to the Board after that date.
Factors and Conclusions and Summary of Independent Written Fee Evaluation
| A. | Nature, Extent and Quality of Services Provided by Invesco Advisers and the Affiliated Sub-Advisers |
The Board reviewed the advisory services provided to the Fund by Invesco Advisers under the Fund’s investment advisory agreement, the performance of Invesco Advisers in providing these services, and the credentials and experience of the officers and employees of Invesco Advisers who provide these services, including the Fund’s portfolio manager or managers. The Board’s review of the qualifications of Invesco Advisers to provide advisory services included the Board’s consideration of Invesco Advisers’ investment process oversight, independent credit analysis and investment risk management. The Board also considered non-advisory services that Invesco Advisers and its affiliates provide to the Invesco Funds such as various back office
support functions, trading operations, internal audit, valuation and legal and compliance.
In determining whether to continue the Fund’s investment advisory agreement, the Board considered the benefits of reapproving an existing relationship and the greater uncertainty that may be associated with entering into a new relationship. The Board concluded that the nature, extent and quality of the services provided to the Fund by Invesco Advisers are appropriate and satisfactory and consistent with the terms of the Fund’s investment advisory agreement.
The Board reviewed the services that may be provided by the Affiliated Sub-Advisers under the sub-advisory contracts and the credentials and experience of the officers and employees of the Affiliated Sub-Advisers who provide these services. The Board noted that the Affiliated Sub-Advisers have offices and personnel that are located in financial centers around the world. As a result, the Board noted that the Affiliated Sub-Advisers can provide research and investment analysis on the markets and economies of various countries in which the Fund may invest, make recommendations regarding securities and assist with security trades. The Board concluded that the sub-advisory contracts may benefit the Fund and its shareholders by permitting Invesco Advisers to use the resources and talents of the Affiliated Sub-Advisers in managing the Fund. The Board concluded that the nature, extent and quality of the services that may be provided by the Affiliated Sub-Advisers are appropriate and satisfactory and consistent with the terms of the Fund’s sub-advisory contracts.
The Board considered Fund performance as a relevant factor in considering whether to approve the investment advisory agreement. The Board did not view Fund performance as a relevant factor in considering whether to approve the sub-advisory contracts for the Fund, as no Affiliated Sub-Adviser currently manages assets of the Fund.
The Board noted that the Fund recently began operations and that comparative performance data for only the past three calendar years was available. The Board compared the Fund’s performance during the past one and three calendar years to the performance of funds in the Broadridge performance universe and against the Lipper Absolute Return Funds Index. The Board noted that performance of Class Y shares of the Fund was in the third quintile of its performance universe for the one year period and the second quintile for the three year period (the first quintile being the best performing funds and the fifth quintile being the worst performing funds). The Board noted that the Fund’s performance was below the performance of the Index for the one year period and above the performance of
27 Invesco Macro Allocation Strategy Fund
the Index for the three year period. The Trustees also reviewed more recent Fund performance and this review did not change their conclusions.
| C. | Advisory and Sub-Advisory Fees |
The Board compared the Fund’s contractual management fee rate to the contractual management fee rates of funds in the Fund’s Broadridge expense group at a common asset level. The Board noted that the contractual management fee rate for Class Y shares of the Fund was above the median contractual management fee rate of funds in its expense group. The Board noted that the term “contractual management fee” for funds in the expense group may include both advisory and certain administrative services fees, but that Broadridge does not provide information on a fund by fund basis as to what is included. The Board noted that Invesco Advisers does not separately charge the Invesco Funds for the administrative services included in the term as defined by Broadridge. The Board also reviewed the methodology used by Broadridge in providing expense group information, which includes using each fund’s contractual management fee schedule (including any applicable breakpoints) as reported in the most recent prospectus or statement of additional information for each fund in the expense group.
The Board noted that Invesco Advisers has contractually agreed to waive fees and/or limit expenses of the Fund through at least February 28, 2017 in an amount necessary to limit total annual operating expenses to a specified percentage of average daily net assets for each class of the Fund.
The Board noted that Invesco Advisers and the Affiliated Sub-Advisers do not manage other mutual funds with investment strategies comparable to those of the Fund.
The Board considered the fees charged by Invesco Advisers and the Affiliated Sub-Advisers to other client accounts with investment strategies comparable to those of the Fund. The Board noted that Invesco Advisers or the Affiliated Sub-Advisers may charge lower fees to large institutional clients. Invesco Advisers reviewed with the Board the significantly greater scope of services it provides to the Invesco Funds relative to certain other types of client accounts. These additional services include provision of administrative services, officers and office space, oversight of service providers, preparation of annual registration statement updates and financial information and regulatory compliance under the Investment Company Act of 1940, as amended.
Invesco Advisers also reviewed generally the higher frequency of shareholder purchases and redemptions in the Invesco Funds relative to the flow of assets for other client accounts. Invesco Advisers advised the Board that advance notice of redemptions is often provided to Invesco Advisers by institutional clients. The Board did note that sub-advisory fee rates charged by the Affiliated Sub-Advisers to manage the Invesco Funds and to manage other client accounts
tended to be more comparable, reflecting a similar scope of services.
The Board also considered the services that may be provided by the Affiliated Sub-Advisers pursuant to the sub-advisory contracts, as well as the fees payable by Invesco Advisers to the Affiliated Sub-Advisers pursuant to the sub-advisory contracts. The Board also noted that the sub-advisory fees are not paid directly by the Fund, but rather, are payable by Invesco Advisers to the Affiliated Sub-Advisers.
| D. | Economies of Scale and Breakpoints |
The Board considered the extent to which there are economies of scale in the provision of advisory services to the Fund. The Board also considered whether the Fund benefits from economies of scale through contractual breakpoints in the Fund’s advisory fee schedule. The Board also noted that the Fund shares directly in economies of scale through lower fees charged by third party service providers based on the combined size of the Invesco Funds and other clients advised by Invesco Advisers.
| E. | Profitability and Financial Resources |
The Board reviewed information from Invesco Advisers concerning the costs of the advisory and other services that Invesco Advisers and its affiliates provide to the Fund and the Invesco Funds and the profitability of Invesco Advisers and its affiliates in providing these services. The Board received information from Invesco Advisers and a report from an independent consultant engaged by the Senior Officer about the methodology used to prepare the profitability information. The Board noted that Invesco Advisers continues to operate at a net profit from services Invesco Advisers and its affiliates provide to the Invesco Funds and the Fund. The Board did not deem the level of profits realized by Invesco Advisers and its affiliates from providing services to the Fund to be excessive given the nature, quality and extent of the services provided. The Board received and accepted information from Invesco Advisers demonstrating that Invesco Advisers and each Affiliated Sub-Adviser are financially sound and have the resources necessary to perform their obligations under the investment advisory agreement and sub-advisory contracts.
| F. | Collateral Benefits to Invesco Advisers and its Affiliates |
The Board considered various other benefits received by Invesco Advisers and its affiliates from the relationship with the Fund, including the fees received for providing transfer agency and distribution services to the Fund. The Board considered comparative information regarding fees charged for these services, including information provided by Broadridge and other independent sources. The Board considered the performance of Invesco Advisers and its affiliates in providing these services and the organizational structure employed to provide these services. The Board also considered that these services are provided to the Fund pursuant to written contracts that are reviewed and approved on an annual basis by the Board;
and that the services are required for the operation of the Fund.
The Board considered the benefits realized by Invesco Advisers and the Affiliated Sub-Advisers as a result of portfolio brokerage transactions executed through “soft dollar” arrangements. The Board noted that soft dollar arrangements shift the payment obligation for research services from Invesco Advisers and the Affiliated Sub-Advisers to the Invesco Funds and that the research received may be used with other clients of Invesco Advisers and may reduce Invesco Advisers’ and the Affiliated Sub-Advisers’ expenses. The Board also considered that it receives periodic reports from the Chief Compliance Officer of the Invesco Funds demonstrating that these arrangements are consistent with regulatory requirements. The Board did not deem the soft dollar arrangements to be inappropriate.
The Board considered that the Fund’s uninvested cash and cash collateral from any securities lending arrangements may be invested in money market funds advised by Invesco Advisers pursuant to procedures approved by the Board. The Board noted that Invesco Advisers receives advisory fees from these affiliated money market funds attributable to such investments, although Invesco Advisers has contractually agreed to waive through varying periods the advisory fees payable by the Invesco Funds with respect to certain investments in the affiliated money market funds. The waiver is in an amount equal to 100% of the net advisory fee Invesco Advisers receives from the affiliated money market funds with respect to the Fund’s investment in the affiliated money market funds of uninvested cash, but not cash collateral. The Board concluded that the amount of advisory fees received by Invesco Advisors from the Fund’s investment of cash collateral from any securities lending arrangements in the affiliated money market funds is fair and reasonable.
The Board also considered that the Fund may use an affiliated broker to execute certain trades for the Fund to, among other things, control information leakage, and was advised that such trades would be executed in compliance with rules under the Investment Company Act of 1940, as amended, and consistent with best execution obligations.
28 Invesco Macro Allocation Strategy Fund
Tax Information
Form 1099-DIV, Form 1042-S and other year–end tax information provide shareholders with actual calendar year amounts that should be included in their tax returns. Shareholders should consult their tax advisors.
The following distribution information is being provided as required by the Internal Revenue Code or to meet a specific state’s requirement.
The Fund designates the following amounts or, if subsequently determined to be different, the maximum amount allowable for its fiscal year ended October 31, 2016:
| | | | |
Federal and State Income Tax | |
Qualified Dividend Income* | | | 0.00 | % |
Corporate Dividends Received Deduction* | | | 0.00 | % |
U.S. Treasury Obligations* | | | 1.56 | % |
| | * | The above percentages are based on ordinary income dividends paid to shareholders during the Fund’s fiscal year. |
29 Invesco Macro Allocation Strategy Fund
Trustees and Officers
The address of each trustee and officer is AIM Investment Funds (Invesco Investment Funds) (the “Trust”), 11 Greenway Plaza, Suite 1000, Houston, Texas 77046-1173. The trustees serve for the life of the Trust, subject to their earlier death, incapacitation, resignation, retirement or removal as more specifically provided in the Trust’s organizational documents. Each officer serves for a one year term or until their successors are elected and qualified. Column two below includes length of time served with predecessor entities, if any.
| | | | | | | | |
Name, Year of Birth and
Position(s) Held with the Trust | | Trustee and/
or Officer Since | | Principal Occupation(s)
During Past 5 Years | | Number of
Funds in Fund
Complex
Overseen by
Trustee | | Other Directorship(s)
Held by Trustee During
Past 5 Years |
| Interested Persons | | | | | | | | |
| Martin L. Flanagan1 — 1960 Trustee | | 2007 | | Executive Director, Chief Executive Officer and President, Invesco Ltd. (ultimate parent of Invesco and a global investment management firm); Advisor to the Board, Invesco Advisers, Inc. (formerly known as Invesco Institutional (N.A.), Inc.); Trustee, The Invesco Funds; Vice Chair, Investment Company Institute; and Member of Executive Board, SMU Cox School of Business Formerly: Chairman and Chief Executive Officer, Invesco Advisers, Inc. (registered investment adviser); Director, Chairman, Chief Executive Officer and President, Invesco Holding Company (US) Inc. (formerly IVZ Inc.) (holding company), Invesco Group Services, Inc. (service provider) and Invesco North American Holdings, Inc. (holding company); Director, Chief Executive Officer and President, Invesco Holding Company Limited (parent of Invesco and a global investment management firm); Director, Invesco Ltd.; Chairman, Investment Company Institute and President, Co-Chief Executive Officer, Co-President, Chief Operating Officer and Chief Financial Officer, Franklin Resources, Inc. (global investment management organization) | | 146 | | None |
| Philip A. Taylor2 — 1954 Trustee and Senior Vice President | | 2006 | | Head of the Americas and Senior Managing Director, Invesco Ltd.; Director, Co-Chairman, Co-President and Co-Chief Executive Officer, Invesco Advisers, Inc. (formerly known as Invesco Institutional (N.A.), Inc.) (registered investment adviser); Director, Chairman, Chief Executive Officer and President, Invesco Management Group, Inc. (formerly known as Invesco AIM Management Group, Inc.) (financial services holding company); Director and Chairman, Invesco Investment Services, Inc. (formerly known as Invesco AIM Investment Services, Inc.) (registered transfer agent) Chief Executive Officer, Invesco Corporate Class Inc. (corporate mutual fund company) Director, Chairman and Chief Executive Officer, Invesco Canada Ltd. (formerly known as Invesco Trimark Ltd./Invesco Trimark Ltèe) (registered investment adviser and registered transfer agent); Trustee and Senior Vice President, The Invesco Funds; Director, Invesco Investment Advisers LLC (formerly known as Van Kampen Asset Management). Formerly: Director, Chief Executive Officer and President, Van Kampen Exchange Corp.; President and Principal Executive Officer, The Invesco Funds (other than AIM Treasurer’s Series Trust (Invesco Treasurer’s Series Trust), Short-Term Investments Trust and Invesco Management Trust); Executive Vice President, The Invesco Funds (AIM Treasurer’s Series Trust (Invesco Treasurer’s Series Trust), Short-Term Investments Trust and Invesco Management Trust only); Director and President, INVESCO Funds Group, Inc. (registered investment adviser and registered transfer agent); Director and Chairman, IVZ Distributors, Inc. (formerly known as INVESCO Distributors, Inc.) (registered broker dealer); Director, President and Chairman, Invesco Inc. (holding company), Invesco Canada Holdings Inc. (holding company), Trimark Investments Ltd./Placements Trimark Ltèe and Invesco Financial Services Ltd/Services Financiers Invesco Ltèe; Chief Executive Officer, Invesco Canada Fund Inc. (corporate mutual fund company); Director and Chairman, Van Kampen Investor Services Inc.; Director, Chief Executive Officer and President, 1371 Preferred Inc. (holding company) and Van Kampen Investments Inc.; Director and President, AIM GP Canada Inc. (general partner for limited partnerships) and Van Kampen Advisors, Inc.; Director and Chief Executive Officer, Invesco Trimark Dealer Inc. (registered broker dealer); Director, Invesco Distributors, Inc. (formerly known as Invesco AIM Distributors, Inc.) (registered broker dealer); Manager, Invesco PowerShares Capital Management LLC; Director, Chief Executive Officer and President, Invesco Advisers, Inc.; Director, Chairman, Chief Executive Officer and President, Invesco AIM Capital Management, Inc.; President, Invesco Trimark Dealer Inc. and Invesco Trimark Ltd./Invesco Trimark Ltèe; Director and President, AIM Trimark Corporate Class Inc. and AIM Trimark Canada Fund Inc.; Senior Managing Director, Invesco Holding Company Limited; Director and Chairman, Fund Management Company (former registered broker dealer); President and Principal Executive Officer, The Invesco Funds (AIM Treasurer’s Series Trust (Invesco Treasurer’s Series Trust), and Short-Term Investments Trust only); President, AIM Trimark Global Fund Inc. and AIM Trimark Canada Fund Inc. | | 146 | | None |
| 1 | Mr. Flanagan is considered an interested person (within the meaning of Section 2(a)(19) of the 1940 Act) of the Trust because he is an officer of the Adviser to the Trust, and an officer and a director of Invesco Ltd., ultimate parent of the Adviser. |
| 2 | Mr. Taylor is considered an interested person (within the meaning of Section 2(a)(19) of the 1940 Act) of the Trust because he is an officer and a director of the Adviser. |
T-1 Invesco Macro Allocation Strategy Fund
Trustees and Officers—(continued)
| | | | | | | | |
Name, Year of Birth and
Position(s) Held with the Trust | | Trustee and/
or Officer Since | | Principal Occupation(s) During Past 5 Years | | Number of
Funds in Fund
Complex
Overseen by
Trustee | | Other Directorship(s)
Held by Trustee During
Past 5 Years |
| Independent Trustees | | | | | | | | |
Bruce L. Crockett — 1944 Trustee and Chair | | 2001 | | Chairman, Crockett Technologies Associates (technology consulting company) Formerly: Director, Captaris (unified messaging provider); Director, President and Chief Executive Officer, COMSAT Corporation; Chairman, Board of Governors of INTELSAT (international communications company); ACE Limited (insurance company); Independent Directors Council and Investment Company Institute | | 146 | | ALPS (Attorneys Liability Protection Society) (insurance company) and Globe Specialty Metals, Inc. (metallurgical company); Member of the Audit Committee, Ferroglobe PLC and Investment Company Institute; Member of the Executive Committee and Chair of the Governance Committee, Independent Directors Council |
David C. Arch — 1945 Trustee | | 2010 | | Chairman of Blistex Inc., a consumer health care products manufacturer | | 146 | | Board member of the Illinois Manufacturers’ Association; Member of the Board of Visitors, Institute for the Humanities, University of Michigan |
James T. Bunch — 1942 Trustee | | 2003 | | Managing Member, Grumman Hill Group LLC (family office/private equity investments) Formerly: Chairman of the Board, Denver Film Society, Chairman of the Board of Trustees, Evans Scholarship Foundation; Chairman, Board of Governors, Western Golf Association | | 146 | | Trustee, Evans Scholarship Foundation |
Albert R. Dowden — 1941 Trustee | | 2001 | | Director of a number of public and private business corporations, including Nature’s Sunshine Products, Inc. Formerly: Director, The Boss Group, Ltd. and Reich & Tang Funds (5 portfolios) (registered investment company); Director, Homeowners of America Holding Corporation/Homeowners of America Insurance Company (property casualty company); Director, Continental Energy Services, LLC (oil and gas pipeline service); Director, CompuDyne Corporation (provider of product and services to the public security market) and Director, Annuity and Life Re (Holdings), Ltd. (reinsurance company); Director, President and Chief Executive Officer, Volvo Group North America, Inc.; Senior Vice President, AB Volvo; Director of various public and private corporations; Chairman, DHJ Media, Inc.; Director, Magellan Insurance Company; and Director, The Hertz Corporation, Genmar Corporation (boat manufacturer), National Media Corporation; Advisory Board of Rotary Power International (designer, manufacturer, and seller of rotary power engines); and Chairman, Cortland Trust, Inc. (registered investment company) | | 146 | | Director of Nature’s Sunshine Products, Inc. |
Jack M. Fields — 1952 Trustee | | 2001 | | Chief Executive Officer, Twenty First Century Group, Inc. (government affairs company); and Discovery Learning Alliance (non-profit) Formerly: Owner and Chief Executive Officer, Dos Angeles Ranch L.P. (cattle, hunting, corporate entertainment); Director, Insperity, Inc. (formerly known as Administaff); Chief Executive Officer, Texana Timber LP (sustainable forestry company); Director of Cross Timbers Quail Research Ranch (non-profit); and member of the U.S. House of Representatives | | 146 | | None |
Eli Jones — 1961 Trustee | | 2016 | | Professor and Dean, Mays Business School — Texas A&M University Formerly: Professor and Dean, Walton College of Business, University of Arkansas and E.J. Ourso College of Business, Louisiana State University and Director, Arvest Bank | | 146 | | Director of Insperity, Inc. (formerly known as Administaff) |
Prema Mathai-Davis — 1950 Trustee | | 2001 | | Retired. Formerly: Chief Executive Officer, YWCA of the U.S.A. | | 146 | | None |
Larry Soll — 1942 Trustee | | 2003 | | Retired. Formerly: Chairman, Chief Executive Officer and President, Synergen Corp. (a biotechnology company) | | 146 | | None |
Raymond Stickel, Jr. — 1944 Trustee | | 2005 | | Retired. Formerly: Director, Mainstay VP Series Funds, Inc. (25 portfolios) and Partner, Deloitte & Touche | | 146 | | None |
Robert C. Troccoli — 1949 Trustee | | 2016 | | Adjunct Professor, University of Denver — Daniels College of Business Formerly: Senior Partner, KPMG LLP | | 146 | | None |
T-2 Invesco Macro Allocation Strategy Fund
Trustees and Officers—(continued)
| | | | | | | | |
Name, Year of Birth and
Position(s) Held with the Trust | | Trustee and/
or Officer Since | | Principal Occupation(s) During Past 5 Years | | Number of
Funds in Fund
Complex
Overseen by
Trustee | | Other Directorship(s)
Held by Trustee During
Past 5 Years |
| Independent Trustees—(continued) |
Suzanne H. Woolsey — 1941 Trustee | | 2014 | | Retired. Formerly: Chief Executive Officer of Woolsey Partners LLC | | 146 | | Director, SunShare LLC; Trustee, Ocean Conservancy; Emeritus Chair of the Board of Trustees of the Institute for Defense Analyses and of Colorado College; Trustee, Chair, Business and Finance Committee of California Institute of Technology; Prior to 2014, Director of Fluor Corp.; Prior to 2010, Trustee of the German Marshall Fund of the United States; Prior to 2010, Trustee of the Rocky Mountain Institute |
| Other Officers | | | | | | | | |
Sheri Morris — 1964 President, Principal Executive Officer and Treasurer | | 1999 | | President, Principal Executive Officer and Treasurer, The Invesco Funds; Vice President, Invesco Advisers, Inc. (formerly known as Invesco Institutional (N.A.), Inc.) (registered investment adviser); and Vice President, PowerShares Exchange-Traded Fund Trust, PowerShares Exchange-Traded Fund Trust II, PowerShares India Exchange-Traded Fund Trust, PowerShares Actively Managed Exchange-Traded Fund Trust, and PowerShares Actively Managed Exchange-Traded Commodity Fund Trust Formerly: Vice President and Principal Financial Officer, The Invesco Funds; Vice President, Invesco AIM Advisers, Inc., Invesco AIM Capital Management, Inc. and Invesco AIM Private Asset Management, Inc.; Assistant Vice President and Assistant Treasurer, The Invesco Funds and Assistant Vice President, Invesco Advisers, Inc., Invesco AIM Capital Management, Inc. and Invesco AIM Private Asset Management, Inc.; and Treasurer, PowerShares Exchange-Traded Fund Trust, PowerShares Exchange-Traded Fund Trust II, PowerShares India Exchange-Traded Fund Trust and PowerShares Actively Managed Exchange-Traded Fund Trust | | N/A | | N/A |
Russell C. Burk — 1958 Senior Vice President and Senior Officer | | 2005 | | Senior Vice President and Senior Officer, The Invesco Funds | | N/A | | N/A |
John M. Zerr — 1962 Senior Vice President, Chief Legal Officer and Secretary | | 2006 | | Director, Senior Vice President, Secretary and General Counsel, Invesco Management Group, Inc. (formerly known as Invesco AIM Management Group, Inc.; Senior Vice President, Invesco Advisers, Inc. (formerly known as Invesco Institutional (N.A.), Inc.) (registered investment adviser); Senior Vice President and Secretary, Invesco Distributors, Inc. (formerly known as Invesco AIM Distributors, Inc.); Director, Vice President and Secretary, Invesco Investment Services, Inc. (formerly known as Invesco AIM Investment Services, Inc.) Senior Vice President, Chief Legal Officer and Secretary, The Invesco Funds; Managing Director, Invesco PowerShares Capital Management LLC; Director, Secretary and General Counsel, Invesco Investment Advisers LLC (formerly known as Van Kampen Asset Management); Secretary and General Counsel, Invesco Capital Markets, Inc. (formerly known as Van Kampen Funds Inc.) and Chief Legal Officer, PowerShares Exchange-Traded Fund Trust, PowerShares Exchange-Traded Fund Trust II, PowerShares India Exchange-Traded Fund Trust, PowerShares Actively Managed Exchange-Traded Fund Trust, and PowerShares Actively Managed Exchange-Traded Commodity Fund Trust Formerly: Director, Secretary, General Counsel and Senior Vice President, Van Kampen Exchange Corp.; Director, Vice President and Secretary, IVZ Distributors, Inc. (formerly known as INVESCO Distributors, Inc.); Director and Vice President, INVESCO Funds Group, Inc.; Director and Vice President, Van Kampen Advisors Inc.; Director, Vice President, Secretary and General Counsel, Van Kampen Investor Services Inc.; Director, Invesco Distributors, Inc. (formerly known as Invesco AIM Distributors, Inc.); Director, Senior Vice President, General Counsel and Secretary, Invesco AIM Advisers, Inc. and Van Kampen Investments Inc.; Director, Vice President and Secretary, Fund Management Company; Director, Senior Vice President, Secretary, General Counsel and Vice President, Invesco AIM Capital Management, Inc.; Chief Operating Officer and General Counsel, Liberty Ridge Capital, Inc. (an investment adviser); Vice President and Secretary, PBHG Funds (an investment company) and PBHG Insurance Series Fund (an investment company); Chief Operating Officer, General Counsel and Secretary, Old Mutual Investment Partners (a broker-dealer); General Counsel and Secretary, Old Mutual Fund Services (an administrator) and Old Mutual Shareholder Services (a shareholder servicing center); Executive Vice President, General Counsel and Secretary, Old Mutual Capital, Inc. (an investment adviser); and Vice President and Secretary, Old Mutual Advisors Funds (an investment company) | | N/A | | N/A |
T-3 Invesco Macro Allocation Strategy Fund
Trustees and Officers—(continued)
| | | | | | | | |
Name, Year of Birth and
Position(s) Held with the Trust | | Trustee and/
or Officer Since | | Principal Occupation(s) During Past 5 Years | | Number of
Funds in Fund
Complex
Overseen by
Trustee | | Other Directorship(s)
Held by Trustee During
Past 5 Years |
| Other Officers—(continued) | | | | | | | | |
| Karen Dunn Kelley — 1960 Senior Vice President | | 2004 | | Senior Managing Director, Investments, Invesco Ltd.; Director, Co-President, Co-Chief Executive Officer, and Co-Chairman, Invesco Advisers, Inc. (formerly known as Invesco Institutional (N.A.), Inc.) (registered investment adviser); Chairman and Director, Invesco Senior Secured Management, Inc.; Senior Vice President, Invesco Management Group, Inc. (formerly known as Invesco AIM Management Group, Inc.); Executive Vice President, Invesco Distributors, Inc. (formerly known as Invesco AIM Distributors, Inc.); Director, Invesco Mortgage Capital Inc. and Invesco Management Company Limited; Senior Vice President, The Invesco Funds Formerly: Vice President, The Invesco Funds (other than AIM Treasurer’s Series Trust (Invesco Treasurer’s Series Trust), Short-Term Investments Trust and Invesco Management Trust); and President and Principal Executive Officer, The Invesco Funds (AIM Treasurer’s Series Trust (Invesco Treasurer’s Series Trust), Short-Term Investments Trust and Invesco Management Trust only); Director and President, INVESCO Asset Management (Bermuda) Ltd., Director, INVESCO Global Asset Management DAC (formerly known as INVESCO Global Asset Management Limited) and INVESCO Management S.A.; Senior Vice President, Van Kampen Investments Inc. and Invesco Advisers, Inc. (formerly known as Invesco Institutional (N.A.), Inc.) (registered investment adviser); Director and President, Fund Management Company; Chief Cash Management Officer, Director of Cash Management, Senior Vice President, and Managing Director, Invesco AIM Capital Management, Inc.; Director of Cash Management, Senior Vice President, and Vice President, Invesco Advisers, Inc. and Vice President, The Invesco Funds (AIM Treasurer’s Series Trust (Invesco Treasurer’s Series Trust), and Short-Term Investments Trust only) | | N/A | | N/A |
Kelli Gallegos — 1970 Vice President, Principal Financial Officer and Assistant Treasurer | | 2008 | | Vice President, Principal Financial Officer and Assistant Treasurer, The Invesco Funds; Assistant Treasurer, Invesco PowerShares Capital Management LLC, PowerShares Exchange-Traded Fund Trust, PowerShares Exchange-Traded Fund Trust II, PowerShares India Exchange-Traded Fund Trust, PowerShares Actively Managed Exchange-Traded Fund Trust, and PowerShares Actively Managed Exchange-Traded Commodity Fund Trust Formerly: Assistant Vice President, The Invesco Funds | | N/A | | N/A |
Tracy Sullivan — 1962 Vice President, Chief Tax Officer and Assistant Treasurer | | 2008 | | Vice President, Chief Tax Officer and Assistant Treasurer, The Invesco Funds; Assistant Treasurer, Invesco PowerShares Capital Management LLC, PowerShares Exchange-Traded Fund Trust, PowerShares Exchange-Traded Fund Trust II, PowerShares India Exchange-Traded Fund Trust, PowerShares Actively Managed Exchange-Traded Fund Trust, and PowerShares Actively Managed Exchange-Traded Commodity Fund Trust Formerly: Assistant Vice President, The Invesco Funds | | N/A | | N/A |
Crissie M. Wisdom — 1969 Anti-Money Laundering Compliance Officer | | 2013 | | Anti-Money Laundering Compliance Officer, Invesco Advisers, Inc. (formerly known as Invesco Institutional (N.A.), Inc.) (registered investment adviser), Invesco Capital Markets, Inc. (formerly known as Van Kampen Funds Inc.), Invesco Distributors, Inc., Invesco Investment Services, Inc., Invesco Management Group, Inc., The Invesco Funds, and PowerShares Exchange-Traded Fund Trust, PowerShares Exchange-Traded Fund Trust II, PowerShares India Exchange-Traded Fund Trust, PowerShares Actively Managed Exchange-Traded Fund Trust and PowerShares Actively Managed Exchange-Traded Commodity Fund Trust; Anti-Money Laundering Compliance Officer and Bank Secrecy Act Officer, INVESCO National Trust Company and Invesco Trust Company; and Fraud Prevention Manager and Controls and Risk Analysis Manager for Invesco Investment Services, Inc. Formerly: Anti-Money Laundering Compliance Officer, Van Kampen Exchange Corp. | | N/A | | N/A |
Robert R. Leveille — 1969 Chief Compliance Officer | | 2016 | | Chief Compliance Officer, Invesco Advisers, Inc. (registered investment adviser); and Chief Compliance Officer, The Invesco Funds Formerly: Chief Compliance Officer, Putnam Investments and the Putnam Funds | | N/A | | N/A |
The Statement of Additional Information of the Trust includes additional information about the Fund’s Trustees and is available upon request, without charge, by calling 1.800.959.4246. Please refer to the Fund’s Statement of Additional Information for information on the Fund’s sub-advisers.
| | | | | | |
Office of the Fund 11 Greenway Plaza, Suite 1000 Houston, TX 77046-1173 | | Investment Adviser Invesco Advisers, Inc. 1555 Peachtree Street, N.E. Atlanta, GA 30309 | | Distributor Invesco Distributors, Inc. 11 Greenway Plaza, Suite 1000 Houston, TX 77046-1173 | | Auditors PricewaterhouseCoopers LLP 1000 Louisiana Street, Suite 5800 Houston, TX 77002-5678 |
| | | |
| | | | | | |
Counsel to the Fund Stradley Ronon Stevens & Young, LLP 2005 Market Street, Suite 2600 Philadelphia, PA 19103-7018 | | Counsel to the Independent Trustees Goodwin Procter LLP 901 New York Avenue, N.W. Washington, D.C. 20001 | | Transfer Agent Invesco Investment Services, Inc. 11 Greenway Plaza, Suite 1000 Houston, TX 77046-1173 | | Custodian State Street Bank and Trust Company 225 Franklin Street Boston, MA 02110-2801 |
T-4 Invesco Macro Allocation Strategy Fund
Explore High-Conviction Investing with Invesco

Invesco mailing information
Send general correspondence to Invesco Investment Services, Inc., P.O. Box 219078, Kansas City, MO 64121-9078.
Important notice regarding delivery of security holder documents
To reduce Fund expenses, only one copy of most shareholder documents may be mailed to shareholders with multiple accounts at the same address (Householding). Mailing of your shareholder documents may be householded indefinitely unless you instruct us otherwise. If you do not want the mailing of these documents to be combined with those for other members of your household, please contact Invesco Investment Services, Inc. at 800 959 4246 or contact your financial institution. We will begin sending you individual copies for each account within 30 days after receiving your request.
Fund holdings and proxy voting information
The Fund provides a complete list of its holdings four times in each fiscal year, at the quarter ends. For the second and fourth quarters, the lists appear in the Fund’s semiannual and annual reports to shareholders. For the first and third quarters, the Fund files the lists with the Securities and Exchange Commission (SEC) on Form N-Q. The most recent list of portfolio holdings is available at invesco.com/completeqtrholdings. Shareholders can also look up the Fund’s
Forms N-Q on the SEC website at sec.gov. Copies of the Fund’s Forms N-Q may be reviewed and copied at the SEC Public Reference Room in Washington, D.C. You can obtain information on the operation of the Public Reference Room, including information about duplicating fee charges, by calling 202 551 8090 or 800 732 0330, or by electronic request at the following email address: publicinfo@sec.gov.
The SEC file numbers for the Fund are shown below.
A description of the policies and procedures that the Fund uses to determine how to vote proxies relating to portfolio securities is available without charge, upon request, from our Client Services department at 800 959 4246 or at invesco.com/proxyguidelines. The information is also available on the SEC website, sec.gov.
| | |
Information regarding how the Fund voted proxies related to its portfolio securities during the most recent 12-month period ended June 30 is available at invesco.com/proxysearch. The information is also available on the SEC website, sec.gov. Invesco Advisers, Inc. is an investment adviser; it provides investment advisory services to individual and institutional clients and does not sell securities. Invesco Distributors, Inc. is the US distributor for Invesco Ltd.’s retail mutual funds, exchange-traded funds and institutional money market funds. Both are wholly owned, indirect subsidiaries of Invesco Ltd. | |  |
| | | | |
| SEC file numbers: 811-05426 and 033-19338 | | MAS-AR-1 | | Invesco Distributors, Inc. |
| | | | |
| | |
 | | Annual Report to Shareholders | | October 31, 2016 |
| | |
| | Invesco Macro International Equity Fund |
| | Nasdaq: |
| | A: VZMAX ∎ C: VZMCX ∎ R: VZMRX ∎ Y: VZMYX ∎ R5: VZMFX ∎ R6: VZMSX |

Letters to Shareholders
| | |

Philip Taylor | | Dear Shareholders: This annual report includes information about your Fund, including performance data and a complete list of its investments as of the close of the reporting period. Inside is a discussion of how your Fund was managed and the factors that affected its performance during the reporting period. In December 2015, the US Federal Reserve raised short-term interest rates for the first time since 2006, signaling its belief that the economy was likely to continue strengthening. Indeed, throughout the reporting period, US economic data were generally positive and the economy expanded at a moderate rate – but there were some bumps along the road. Job growth in May 2016 was very weak, but it was followed by strong increases in nonfarm payrolls in June and July. Increased concerns about global economic weakness caused US stock market indexes to |
| sink at the start of calendar year 2016, but they eventually recovered; they sank again following the UK’s decision to leave the European Union, but then quickly recovered and reached record highs later in the summer. Strong demand for income-producing investments, particularly those perceived to be lower risk, benefited bonds as well as dividend-paying stocks for much of the reporting period. While economic news in the US was generally positive, news overseas was less upbeat. The European Central Bank, and central banks in China and Japan – as well as other countries – maintained extraordinarily accommodative monetary policies in response to economic weakness. As the fiscal year drew to a close, uncertainty about the outcome of the US presidential election resulted in increased market volatility; the surprise outcome after the close of the reporting period suggested that market volatility may continue for some time to come. |
Short-term market volatility can prompt some investors to abandon their investment plans – and can cause others to settle for average results. The investment professionals at Invesco, in contrast, invest with high conviction, take a long-term perspective and have a passion to exceed. Invesco’s pure focus on investment management eliminates possible distractions and means that there are no competing lines of business for us to support. Just as important, we embrace a variety of investment strategies, asset classes and geographies – because we know that no single investment approach meets the diverse needs of all of our clients. We manage all our investment approaches with a passion to exceed. All our investment teams have a highly disciplined, long-term investing style that eliminates short-term decision-making. Of course, investing with high conviction can’t guarantee a profit or ensure success; no investment strategy can. To learn more about how we invest with high conviction, visit invesco.com/HighConviction.
You, too, can invest with high conviction by maintaining a long-term investment perspective and by working with your financial adviser on a regular basis. During periods of short-term market volatility or uncertainty, your financial adviser can keep you focused on your long-term investment goals – a new home, a child’s college education or a secure retirement. He or she also can share research about the economy, the markets and individual investment options.
Visit our website for more information on your investments
Our website, invesco.com/us, offers a wide range of market insights and investment perspectives. On the website, you’ll find detailed information about our funds, including performance, holdings and portfolio manager commentaries. You can access information about your account by completing a simple, secure online registration. Click on the “Need to register” link in the “Account Access” box on our homepage to get started.
In addition to the resources accessible on our website and through our mobile app, you can obtain timely updates to help you stay informed about the markets, the economy and investing by connecting with Invesco on Twitter, LinkedIn or Facebook. You can access our blog at blog.invesco.us.com. Our goal is to provide you the information you want, when and where you want it.
Finally, I’m pleased to share with you Invesco’s commitment to both the Principles for Responsible Investment and to considering environmental, social and governance issues in our robust investment process. I invite you to learn more at invesco.com/esg.
Have questions?
For questions about your account, contact an Invesco client services representative at 800 959 4246. For Invesco-related questions or comments, please email me directly at phil@invesco.com.
All of us at Invesco look forward to serving your investment management needs. Thank you for investing with us.
Sincerely,

Philip Taylor
Senior Managing Director, Invesco Ltd.
2 Invesco Macro International Equity Fund
| | |

Bruce Crockett | | Dear Fellow Shareholders: Among the many important lessons I’ve learned in more than 40 years in a variety of business endeavors is the value of a trusted advocate. As independent chair of the Invesco Funds Board, I can assure you that the members of the Board are strong advocates for the interests of investors in Invesco’s mutual funds. We work hard to represent your interests through oversight of the quality of the investment management services your funds receive and other matters important to your investment, including but not limited to: ∎ Ensuring that Invesco offers a diverse lineup of mutual funds that your financial adviser can use to strive to meet your financial needs as your investment goals change over time. ∎ Monitoring how the portfolio management teams of the Invesco funds are performing in light of changing economic and market conditions. |
∎ Assessing each portfolio management team’s investment performance within the context of the investment strategy described in the fund’s prospectus.
∎ Monitoring for potential conflicts of interests that may impact the nature of the services that your funds receive.
We believe one of the most important services we provide our fund shareholders is the annual review of the funds’ advisory and sub-advisory contracts with Invesco Advisers and its affiliates. This review is required by the Investment Company Act of 1940 and focuses on the nature and quality of the services Invesco provides as the adviser to the Invesco funds and the reasonableness of the fees that it charges for those services. Each year, we spend months carefully reviewing information received from Invesco and a variety of independent sources, such as performance and fee data prepared by Lipper Inc., an independent, third-party firm widely recognized as a leader in its field. We also meet with our independent legal counsel and other independent advisers to review and help us assess the information that we have received. Our goal is to assure that you receive quality investment management services for a reasonable fee.
I trust the measures outlined above provide assurance that you have a worthy advocate when it comes to choosing the Invesco Funds.
As always, please contact me at bruce@brucecrockett.com with any questions or concerns you may have. On behalf of the Board, we look forward to continuing to represent your interests and serving your needs.
Sincerely,

Bruce L. Crockett
Independent Chair
Invesco Funds Board of Trustees
3 Invesco Macro International Equity Fund
Management’s Discussion of Fund Performance
| | | | |
Performance summary For the fiscal year ended October 31, 2016, Class A shares of Invesco Macro International Equity Fund (the Fund), at net asset value (NAV), underperformed the MSCI All Country World ex-U.S. Index, the Fund’s broad market/style-specific benchmark. Your Fund’s long-term performance appears later in this report. | |
Fund vs. Indexes Total returns, 10/31/15 to 10/31/16, at net asset value (NAV). Performance shown does not include applicable contingent deferred sales charges (CDSC) or front-end sales charges, which would have reduced performance. | |
Class A Shares | | | 0.05 | % |
Class C Shares | | | -0.77 | |
Class R Shares | | | -0.16 | |
Class Y Shares | | | 0.33 | |
Class R5 Shares | | | 0.33 | |
Class R6 Shares | | | 0.33 | |
MSCI All Country World ex-U.S. Indexq (Broad Market/Style-Specific Index) | | | 0.22 | |
Lipper International Large-Cap Core Funds Index∎ (Peer Group Index) | | | -1.78 | |
Source(s): qFactSet Research Systems Inc.; ∎Lipper Inc. | | | | |
Market conditions and your Fund
The global economy continued to expand, albeit slowly, for the fiscal year. However, that growth became increasingly uneven across developed and emerging economies, amid continued volatility in oil prices and as the policies of central banks globally began to diverge.
The beginning of the fiscal year was challenging for global equity markets, with volatility indicators spiking and all regions exhibiting substantial price declines. Most of that retrenchment was attributable to the European Central Bank’s underwhelming stimulus measures announced in December 2015 and was probably exacerbated by the US Federal Reserve’s first rate hike since 2006.
Stocks then rebounded amid signs of stabilization in the global economy, strong earnings at bellwether companies and ongoing central bank stimulus measures. However, they nose-dived again sharply after UK voters approved a ballot measure in June to leave the European Union, but a strong bounce-back rally soon erased most of the losses. Rising oil prices also helped to stabilize the energy sector and alleviate fears of substantial defaults within the energy-related high yield market.
The Fund seeks to gain strategic exposure by employing a three-step investment process: smart beta, a value-weighted methodology and tactical adjustments. The Fund uses smart beta indexes to build up core equity exposure. For this strategy,
we intend to invest in companies in approximately the same proportion as they are represented in the smart beta indexes, which utilize equal weighting, low volatility or other methodologies to determine
stock investments and appropriate weightings.
Valuations are considered on an absolute basis first to determine if a market is “rich” or “cheap” relative to its own history and then evaluated on a cross-sectional basis to account for relative attractiveness across markets. This approach reflects the intuitive appeal of having
greater exposure to cheap markets and lower exposure to expensive markets within the Fund’s strategic allocation.
Strategically, Hong Kong and emerging markets were the primary contributors to Fund performance for the reporting period. The noteworthy catalysts for their performance were improving macroeconomic data out of China, rising commodity prices and a marginally weaker US dollar. Conversely, Europe and the UK were the largest detractors from Fund performance for the reporting period, mostly due to fading confidence in the prevailing stimulus policies. Even though the UK equity market experienced a strong rebound following the Brexit referendum, it did not fully offset the negative performance in the first two months of the fiscal year.
The Fund’s tactical overlay portion actively adjusts portfolio positions through the use of futures to reflect the nearterm environment. The tactical component of the Fund’s allocation positively contributed to results through exposure,
| | | | | | |
| Portfolio Composition | |
By country | | | % of total net assets | |
| | | | |
Japan | | | 17.8 | % |
| United Kingdom | | | 15.7 | |
| Australia | | | 9.5 | |
| Hong Kong | | | 5.1 | |
| Taiwan | | | 4.2 | |
| France | | | 3.9 | |
| Switzerland | | | 3.3 | |
| Germany | | | 3.0 | |
| Malaysia | | | 2.7 | |
| Singapore | | | 2.3 | |
| Mexico | | | 2.1 | |
| Countries each with less than 2.0% of portfolio | | | 19.5 | |
Money Market Funds Plus Other Assets Less Liabilities† | | | 10.9 | |
| † | The unrealized appreciation/depreciation of futures, forwards and swaps are included in “Money Market Funds Plus Other Assets Less Liabilities.” |
| | | | |
| Target Regional Breakdown |
| | | Target
Net Assets1 |
| | | | |
| Emerging Market | | | 26.99 | % |
| Europe ex-UK | | | 22.38 | |
| Asia ex-Japan | | | 21.30 | |
| United Kingdom | | | 22.05 | |
| Japan | | | 22.01 | |
| Cash and Money Market Funds | | | 10.00 | |
| Total | | | 124.73 | |
| 1 | Proprietary models determine the target net asset weights necessary to achieve the desired regional breakdown. Target net assets greater than 100% is achieved through derivatives and other instruments that create leverage. Regional breakdown percentages represent the net of the Fund’s long and short positions. |
| | | | |
Total Net Assets | | | $7.3 million | |
| |
| Total Number of Holdings* | | | 689 | |
The Fund’s holdings are subject to change, and there is no assurance that the Fund will continue to hold any particular security.
*Excluding money market fund holdings.
Data presented here are as of October 31, 2016.
4 Invesco Macro International Equity Fund
obtained by futures, to the UK, emerging markets and Hong Kong; the Fund experienced tactical losses in the European and Japanese markets. Considering the strategic and tactical allocations combined, Hong Kong and emerging markets were the largest contributors to Fund performance, while Europe and the UK were the largest detractors from Fund performance.
Please note that our strategy utilizes derivative instruments that include futures and total return swaps. Therefore, some of the performance of the strategy, both positive and negative, can be attributed to these instruments. Derivatives can be a more liquid and cost-effective way to gain exposure to asset classes. However, derivatives may amplify traditional investment risks through the creation of leverage and may be less liquid than traditional securities.
Thank you for your continued investment in Invesco Macro International Equity Fund.
The views and opinions expressed in management’s discussion of Fund performance are those of Invesco Advisers, Inc. These views and opinions are subject to change at any time based on factors such as market and economic conditions. These views and opinions may not be relied upon as investment advice or recommendations, or as an offer for a particular security. The information is not a complete analysis of every aspect of any market, country, industry, security or the Fund. Statements of fact are from sources considered reliable, but Invesco Advisers, Inc. makes no representation or warranty as to their completeness or accuracy. Although historical performance is no guarantee of future results, these insights may help you understand our investment management philosophy.
See important Fund and, if applicable, index disclosures later in this report.

Mark Ahnrud
Chartered Financial Analyst, Portfolio Manager, is manager of Invesco Macro International Equity Fund. He joined Invesco in 2000. Mr. Ahnrud earned a BS in finance and investments from Babson College and an MBA from Duke University Fuqua School of Business.

Chris Devine
Chartered Financial Analyst, Portfolio Manager, is manager of Invesco Macro International Equity Fund. He joined Invesco in 1998. Mr. Devine earned a BA in economics from Wake Forest University and an MBA from the University of Georgia.

Scott Hixon
Chartered Financial Analyst, Portfolio Manager, is manager of Invesco Macro International Equity Fund. He joined Invesco in 1994. Mr. Hixon earned a BBA in finance from Georgia Southern University and an MBA in finance from Georgia State University.

Christian Ulrich
Chartered Financial Analyst, Portfolio Manager, is manager of Invesco Macro International Equity Fund. He joined Invesco in 2000. Mr. Ulrich earned the equivalent of a BBA from the KV Zurich Business School in Zurich, Switzerland.

Scott Wolle
Chartered Financial Analyst, Portfolio Manager, is manager of Invesco Macro International Equity Fund. He joined Invesco in 1999. Mr. Wolle earned a BS in finance from Virginia Polytechnic Institute and State University and an MBA from Duke University Fuqua School of Business.
Assisted by the Invesco Global Asset Allocation Team
5 Invesco Macro International Equity Fund
Your Fund’s Long-Term Performance
Results of a $10,000 Investment - Oldest Share Class(es) since Inception
Fund and index data from 12/17/13
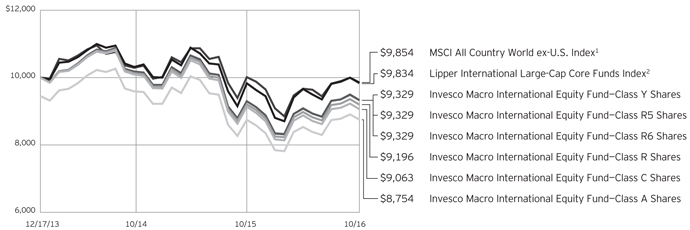
1 Source: FactSet Research Systems Inc.
2 Source: Lipper Inc.
Past performance cannot guarantee comparable future results.
The data shown in the chart include reinvested distributions, applicable sales charges and Fund expenses including
management fees. Index results include reinvested dividends, but they do not reflect sales charges. Performance of the peer group, if applicable, reflects fund expenses and management fees;
performance of a market index does not. Performance shown in the chart and table(s) does not reflect deduction of taxes a shareholder would pay on Fund distributions or sale of Fund shares.
continued from page 8
sold short, the Fund will incur a loss on a short position, which is theoretically unlimited, if the price of the asset sold short increases from the short sale price. The counterparty to a short position or other market factors may prevent the Fund from closing out a short position at a desirable time or price and may reduce or eliminate any gain or result in a loss. In a rising market, the Fund’s short positions will cause the Fund to underperform the overall market and its peers that do not engage in shorting. If the Fund holds both long and short positions, and both positions decline simultaneously, the short positions will not provide any buffer (hedge) from declines in value of the Fund’s long positions. Certain types of short positions involve leverage, which may exaggerate any losses, potentially more than the actual cost of the investment, and will increase the volatility of the Fund’s returns.
∎ Small- and mid-capitalization companies risks. Small- and mid-capitalization companies tend to be more vulnerable to changing market conditions, may have little or no operating history or track record of success, and may have
| | more limited product lines and markets, less experienced management and fewer financial resources than larger companies. These companies’ securities may be more volatile and less liquid than those of more established companies, and their returns may vary, sometimes significantly, from the overall securities market. |
About indexes used in this report
| ∎ | | The MSCI All Country World ex-U.S. Index is an index considered representative of developed and emerging market stock markets, excluding the US. The index is computed using the net return, which withholds applicable taxes for non-resident investors. |
| ∎ | | The Lipper International Large-Cap Core Funds Index is an unmanaged index considered representative of international large-cap core funds tracked by Lipper. |
| ∎ | | The Fund is not managed to track the performance of any particular index, including the index(es) described here, and consequently, the performance of the Fund may deviate significantly from the performance of the index(es). |
| ∎ | | A direct investment cannot be made in an index. Unless otherwise indicated, index results include reinvested dividends, and they do not reflect sales charges. Performance of the peer group, if applicable, reflects fund expenses; performance of a market index does not. |
Other information
| ∎ | | The returns shown in management’s discussion of Fund performance are based on net asset values (NAVs) calculated for shareholder transactions. Generally accepted accounting principles require adjustments to be made to the net assets of the Fund at period end for financial reporting purposes, and as such, the NAVs for shareholder transactions and the returns based on those NAVs may differ from the NAVs and returns reported in the Financial Highlights. |
| ∎ | | Industry classifications used in this report are generally according to the Global Industry Classification Standard, which was developed by and is the exclusive property and a service mark of MSCI Inc. and Standard & Poor’s. |
6 Invesco Macro International Equity Fund
| | | | |
Average Annual Total Returns | |
As of 10/31/16, including maximum applicable sales charges | |
| |
Class A Shares | | | | |
Inception (12/17/13) | | | -4.53 | % |
1 Years | | | -5.41 | |
| |
Class C Shares | | | | |
Inception (12/17/13) | | | -3.37 | % |
1 Year | | | -1.76 | |
| |
Class R Shares | | | | |
Inception (12/17/13) | | | -2.88 | % |
1 Years | | | -0.16 | |
| |
Class Y Shares | | | | |
Inception (12/17/13) | | | -2.39 | % |
1 Years | | | 0.33 | |
| |
Class R5 Shares | | | | |
Inception (12/17/13) | | | -2.39 | % |
1 Years | | | 0.33 | |
| |
Class R6 Shares | | | | |
Inception (12/17/13) | | | -2.39 | % |
1 Years | | | 0.33 | |
The performance data quoted represent past performance and cannot guarantee comparable future results; current performance may be lower or higher. Please visit invesco.com/performance for the most recent month-end performance. Performance figures reflect reinvested distributions, changes in net asset value and the effect of the maximum sales charge unless otherwise stated. Investment return and principal value will fluctuate so that you may have a gain or loss when you sell shares.
The net annual Fund operating expense ratio set forth in the most recent Fund prospectus as of the date of this report for Class A, Class C, Class R, Class Y, Class R5 and Class R6 shares was 1.43%, 2.18%, 1.68%, 1.18%,
1.18% and 1.18%, respectively.1,2 The total annual Fund operating expense ratio set forth in the most recent Fund prospectus as of the date of this report for Class A, Class C, Class R, Class Y, Class R5 and Class R6 shares was 9.01%, 9.76%, 9.26%, 8.76%, 8.72% and 8.72%, respectively. The expense ratios presented above may vary from the expense ratios presented in other sections of this report that are based on expenses incurred during the period covered by this report.
| | | | |
| Average Annual Total Returns | |
| As of 9/30/16, the most recent calendar quarter end, including maximum applicable sales charges | |
| |
Class A Shares | | | | |
Inception (12/17/13) | | | -4.05 | % |
1 Year | | | 1.74 | |
| |
Class C Shares | | | | |
Inception (12/17/13) | | | -2.84 | % |
1 Year | | | 5.90 | |
| |
Class R Shares | | | | |
Inception (12/17/13) | | | -2.34 | % |
1 Year | | | 7.38 | |
| |
Class Y Shares | | | | |
Inception (12/17/13) | | | -1.84 | % |
1 Year | | | 7.99 | |
| |
Class R5 Shares | | | | |
Inception (12/17/13) | | | -1.88 | % |
1 Year | | | 8.00 | |
| |
Class R6 Shares | | | | |
Inception (12/17/13) | | | -1.84 | % |
1 Year | | | 7.99 | |
Class A share performance reflects the maximum 5.50% sales charge, and Class C share performance reflects the applicable contingent deferred sales charge (CDSC) for the period involved. The CDSC on Class C shares is 1% for the first year after purchase. Class R, Class Y, Class R5 and Class R6 class shares do not have a front-end sales charge or a CDSC; therefore, performance is at net asset value.
The performance of the Fund’s share classes will differ primarily due to different sales charge structures and class expenses.
Fund performance reflects any applicable fee waivers and/or expense reimbursements. Had the adviser not waived fees and/or reimbursed expenses currently or in the past, returns would have been lower. See current prospectus for more information.
| 1 | Total annual Fund operating expenses after any contractual fee waivers and/or expense reimbursements by the adviser in effect through at least February 28, 2018. See current prospectus for more information. |
| 2 | Total annual Fund operating expenses after any contractual fee waivers and/or expense reimbursements by the adviser in effect through at least June 30, 2018. See current prospectus for more information. |
7 Invesco Macro International Equity Fund
Invesco Macro International Equity Fund’s investment objective is to provide total return.
∎ Unless otherwise stated, information presented in this report is as of October 31, 2016, and is based on total net assets.
∎ Unless otherwise noted, all data provided by Invesco.
∎ To access your Fund’s reports/prospectus, visit invesco.com/fundreports.
About share classes
| ∎ | | Class R shares are generally available only to employer sponsored retirement and benefit plans. Please see the prospectus for more information. |
| ∎ | | Class Y shares are available only to certain investors. Please see the prospectus for more information. |
| ∎ | | Class R5 shares and Class R6 shares are primarily intended for employer sponsored retirement and benefit plans that meet certain standards and for institutional investors. Please see the prospectus for more information. |
Principal risks of investing
in the Fund
| ∎ | | Derivatives risk. The value of a derivative instrument depends largely on (and is derived from) the value of an underlying security, currency, commodity, interest rate, index or other asset (each referred to as an underlying asset). In addition to risks relating to the underlying assets, the use of derivatives may include other, possibly greater, risks, including counterparty, leverage and liquidity risks. Counterparty risk is the risk that the counterparty to the derivative contract will default on its obligation to pay the Fund the amount owed or otherwise perform under the derivative contract. Derivatives create leverage risk because they do not require payment up front equal to the economic exposure created by owning the derivative. As a result, an adverse change in the value of the underlying asset could result in the Fund sustaining a loss that is substantially greater than the amount invested in the derivative, which may make the Fund’s returns more volatile and increase the risk of loss. Derivative instruments may also be less liquid than more traditional investments and the Fund may be unable to sell or close out its derivative positions at a desirable time or price. This risk may be more acute under adverse market conditions, during which the Fund may be most in need of liquidating its derivative positions. |
| | | Derivatives may also be harder to value, less tax efficient and subject to changing government regulation that could impact the Fund’s ability to use certain derivatives or their cost. Also, derivatives used for hedging or to gain or limit exposure to a particular market segment may not provide the expected benefits, particularly during adverse market conditions. These risks are greater for the Fund than mutual funds that do not use derivative instruments or that use derivative instruments to a lesser extent than the Fund to implement their investment strategies. |
| ∎ | | Emerging markets securities risk. Emerging markets (also referred to as developing markets) are generally subject to greater market volatility, political, social and economic instability, uncertain trading markets and more governmental limitations on foreign investment than more developed markets. In addition, emerging markets may be subject to lower trading volume and greater price fluctuations than companies in more developed markets. Securities law and the enforcement of systems of taxation in many emerging market countries may change quickly and unpredictably. In addition, investments in emerging markets securities may also be subject to additional transaction costs, delays in settlement procedures, and lack of timely information. |
| ∎ | | Foreign securities risk. The Fund’s foreign investments may be adversely affected by political and social instability, changes in economic or taxation policies, difficulty in enforcing obligations, decreased liquidity or increased volatility. Foreign investments also involve the risk of the possible seizure, nationalization or expropriation of the issuer or foreign deposits (in which the Fund could lose its entire investments in a certain market) and the possible adoption of foreign governmental restrictions such as exchange controls. Unless the Fund has hedged its foreign securities risk, foreign securities risk |
| | | also involves the risk of negative foreign currency rate fluctuations, which may cause the value of securities denominated in such foreign currency (or other instruments through which the Fund has exposure to foreign currencies) to decline in value. Currency exchange rates may fluctuate significantly over short periods of time. Currency hedging strategies, if used, are not always successful. |
| ∎ | | Management risk. The Fund is actively managed and depends heavily on the Adviser’s judgment about markets, interest rates or the attractiveness, relative values, liquidity, or potential appreciation of particular investments made for the Fund’s portfolio. The Fund could experience losses if these judgments prove to be incorrect. The portfolio managers’ use of derivative instruments that provide economic leverage may increase the volatility of the Fund’s net asset value, which may increase the potential of greater losses that may cause the Fund to liquidate positions when it may not be advantageous to do so. In addition, the Fund will likely underperform the broader equity markets in which the Fund invests during market rallies when the Fund’s equity exposure is less than 100% of the Fund’s assets. Such underperformance could be significant during sudden or significant market rallies. Additionally, legislative, regulatory, or tax developments may adversely affect management of the Fund and, therefore, the ability of the Fund to achieve its investment objective. |
| ∎ | | Market risk. The market values of the Fund’s investments, and therefore the value of the Fund’s shares, will go up and down, sometimes rapidly or unpredictably. Market risk may affect a single issuer, industry or section of the economy, or it may affect the market as a whole. Individual stock prices tend to go up and down more dramatically than those of certain other types of investments, such as bonds. During a general downturn in the financial markets, multiple asset classes may decline in value. When markets perform well, there can be no assurance that specific investments held by the Fund will rise in value. |
| ∎ | | Short position risk. Because the Fund’s potential loss on a short position arises from increases in the value of the asset |
| | |
This report must be accompanied or preceded by a currently effective Fund prospectus, which contains more complete information, including sales charges and expenses. Investors should read it carefully before investing. | | |
NOT FDIC INSURED | MAY LOSE VALUE | NO BANK GUARANTEE | | continued on page 6 |
8 Invesco Macro International Equity Fund
Schedule of Investments
October 31, 2016
| | | | | | | | |
| | | Shares | | | Value | |
Common Stocks & Other Equity Interests–89.13% | |
| Australia–9.55% | |
AGL Energy Ltd. | | | 948 | | | $ | 13,805 | |
Amcor Ltd. | | | 1,131 | | | | 12,631 | |
AMP Ltd. | | | 3,361 | | | | 11,654 | |
APA Group | | | 1,948 | | | | 11,771 | |
Aristocrat Leisure Ltd. | | | 1,168 | | | | 13,601 | |
ASX Ltd. | | | 345 | | | | 12,343 | |
Aurizon Holdings Ltd. | | | 3,931 | | | | 14,592 | |
Australia and New Zealand Banking Group Ltd. | | | 656 | | | | 13,859 | |
BHP Billiton Ltd. | | | 887 | | | | 15,533 | |
BHP Billiton PLC | | | 2,125 | | | | 31,872 | |
Brambles Ltd. | | | 1,451 | | | | 12,695 | |
Caltex Australia Ltd. | | | 517 | | | | 12,032 | |
Challenger Ltd. | | | 1,961 | | | | 16,008 | |
Cochlear Ltd. | | | 127 | | | | 12,339 | |
Commonwealth Bank of Australia | | | 248 | | | | 13,808 | |
Computershare Ltd. | | | 1,765 | | | | 14,164 | |
CSL Ltd. | | | 168 | | | | 12,815 | |
DEXUS Property Group | | | 1,854 | | | | 12,584 | |
DUET Group | | | 6,826 | | | | 12,331 | |
Goodman Group | | | 2,348 | | | | 12,097 | |
GPT Group (The) | | | 3,374 | | | | 11,935 | |
Healthscope Ltd. | | | 5,909 | | | | 9,906 | |
Incitec Pivot Ltd. | | | 6,094 | | | | 13,637 | |
Insurance Australia Group Ltd. | | | 3,105 | | | | 12,989 | |
Lendlease Group | | | 1,271 | | | | 13,036 | |
Macquarie Group Ltd. | | | 218 | | | | 13,190 | |
Mirvac Group | | | 7,897 | | | | 12,520 | |
National Australia Bank Ltd. | | | 649 | | | | 13,784 | |
Newcrest Mining Ltd. | | | 788 | | | | 13,741 | |
Oil Search Ltd. | | | 2,632 | | | | 13,243 | |
Origin Energy Ltd. | | | 3,393 | | | | 13,651 | |
Qantas Airways Ltd. | | | 5,402 | | | | 12,574 | |
QBE Insurance Group Ltd. | | | 1,791 | | | | 13,610 | |
Ramsay Health Care Ltd. | | | 217 | | | | 12,082 | |
Santos Ltd. | | | 4,095 | | | | 10,959 | |
Scentre Group | | | 3,601 | | | | 11,499 | |
SEEK Ltd. | | | 1,091 | | | | 12,122 | |
Sonic Healthcare Ltd. | | | 782 | | | | 12,155 | |
South32 Ltd. | | | 8,939 | | | | 17,402 | |
Stockland | | | 3,676 | | | | 12,332 | |
Suncorp Group Ltd. | | | 1,422 | | | | 12,920 | |
Sydney Airport | | | 2,473 | | | | 11,745 | |
Tatts Group Ltd. | | | 4,696 | | | | 14,482 | |
Telstra Corp. Ltd. | | | 3,439 | | | | 13,007 | |
Transurban Group | | | 1,528 | | | | 12,051 | |
Treasury Wine Estates Ltd. | | | 1,557 | | | | 12,720 | |
Vicinity Centres | | | 5,572 | | | | 12,136 | |
Wesfarmers Ltd. | | | 415 | | | | 12,923 | |
Westfield Corp. | | | 1,702 | | | | 11,493 | |
| | | | | | | | |
| | | Shares | | | Value | |
| Australia–(continued) | | | | | | | | |
Westpac Banking Corp. | | | 606 | | | $ | 14,006 | |
Woodside Petroleum Ltd. | | | 627 | | | | 13,432 | |
Woolworths Ltd. | | | 734 | | | | 13,165 | |
| | | | | 692,981 | |
| | |
| Austria–0.18% | | | | | | | | |
Erste Group Bank AG | | | 211 | | | | 6,627 | |
Voestalpine AG | | | 177 | | | | 6,262 | |
| | | | | 12,889 | |
|
| Belgium–0.41% | |
Ageas | | | 178 | | | | 6,502 | |
Anheuser-Busch InBev SA/NV | | | 48 | | | | 5,509 | |
KBC Groep N.V.(a) | | | 103 | | | | 6,277 | |
Solvay S.A. | | | 56 | | | | 6,427 | |
UCB S.A. | | | 76 | | | | 5,138 | |
| | | | | 29,853 | |
|
| Brazil–0.35% | |
Ambev S.A. | | | 1,100 | | | | 6,491 | |
Engie Brasil Energia SA | | | 500 | | | | 6,353 | |
Telefonica Brasil S.A.–Preference Shares | | | 400 | | | | 5,788 | |
Ultrapar Participacoes S.A. | | | 300 | | | | 6,800 | |
| | | | | 25,432 | |
|
| Chile–0.93% | |
Banco de Chile | | | 104,936 | | | | 12,672 | |
Banco de Credito e Inversiones (BCI) | | | 1 | | | | 51 | |
Banco Santander Chile | | | 158,689 | | | | 9,063 | |
Cencosud S.A. | | | 2,107 | | | | 6,967 | |
Empresa Nacional de Electricidad S.A. | | | 11,067 | | | | 7,614 | |
Empresas CMPC S.A. | | | 3,441 | | | | 7,453 | |
Empresas COPEC S.A. | | | 793 | | | | 8,000 | |
Enersis Américas S.A. | | | 35,927 | | | | 6,161 | |
S.A.C.I. Falabella | | | 1,248 | | | | 9,792 | |
| | | | | 67,773 | |
|
| China–1.41% | |
AAC Technologies Holdings Inc. | | | 1,000 | | | | 9,517 | |
Agricultural Bank of China Ltd.–Class H | | | 15,000 | | | | 6,325 | |
Bank of China Ltd.–Class H | | | 13,000 | | | | 5,817 | |
Bank of Communications Co. Ltd.–Class H | | | 7,000 | | | | 5,334 | |
China Cinda Asset Management Co. Ltd.–Class H | | | 15,000 | | | | 5,396 | |
China CITIC Bank Corp. Ltd.–Class H | | | 9,000 | | | | 5,814 | |
China Conch Venture Holdings Ltd. | | | 3,000 | | | | 5,602 | |
China Construction Bank Corp.–Class H | | | 8,000 | | | | 5,843 | |
China Minsheng Banking Corp., Ltd.–Class H | | | 5,500 | | | | 6,269 | |
China Mobile Ltd. | | | 500 | | | | 5,728 | |
CITIC Ltd. | | | 4,000 | | | | 5,736 | |
CSPC Pharmaceutical Group Ltd. | | | 14,000 | | | | 14,514 | |
Hengan International Group Co. Ltd. | | | 500 | | | | 3,981 | |
Industrial & Commercial Bank of China Ltd.–Class H | | | 10,000 | | | | 6,006 | |
See accompanying Notes to Financial Statements which are an integral part of the financial statements.
9 Invesco Macro International Equity Fund
| | | | | | | | |
| | | Shares | | | Value | |
| China–(continued) | | | | | | | | |
Jiangsu Expressway Co. Ltd.–Class H | | | 4,000 | | | $ | 5,447 | |
Tencent Holdings Ltd. | | | 200 | | | | 5,296 | |
| | | | | | | | 102,625 | |
|
| Colombia–0.16% | |
Banco Davivienda S.A.–Preference Shares | | | 603 | | | | 6,137 | |
Bancolombia S.A.–Preference Shares | | | 543 | | | | 5,154 | |
| | | | | | | | 11,291 | |
|
| Czech Republic–0.16% | |
CEZ A.S. | | | 306 | | | | 5,760 | |
Komercni Banka A.S. | | | 155 | | | | 5,678 | |
| | | | | | | | 11,438 | |
|
| Denmark–0.96% | |
A.P. Moller — Maersk A/S–Class B | | | 5 | | | | 7,655 | |
Carlsberg A/S–Class B | | | 85 | | | | 7,665 | |
Coloplast A/S–Class B | | | 107 | | | | 7,458 | |
Danske Bank A/S | | | 280 | | | | 8,645 | |
Genmab A/S(a) | | | 52 | | | | 8,580 | |
Novo Nordisk A/S–Class B | | | 180 | | | | 6,439 | |
Novozymes A/S–Class B | | | 187 | | | | 6,947 | |
Pandora A/S | | | 66 | | | | 8,591 | |
Vestas Wind Systems A/S | | | 98 | | | | 7,861 | |
| | | | | | | | 69,841 | |
|
| Finland–0.51% | |
Fortum Oyj | | | 399 | | | | 6,653 | |
Kone Oyj–Class B | | | 125 | | | | 5,754 | |
Nokia Oyj | | | 1,099 | | | | 4,908 | |
Sampo Oyj–Class A | | | 140 | | | | 6,419 | |
UPM-Kymmene Oyj | | | 303 | | | | 7,052 | |
Wartsila OYJ Abp | | | 144 | | | | 6,228 | |
| | | | | | | | 37,014 | |
|
| France–3.93% | |
Accor S.A. | | | 159 | | | | 6,036 | |
Air Liquide S.A. | | | 64 | | | | 6,504 | |
Airbus Group SE | | | 103 | | | | 6,116 | |
Arkema S.A. | | | 68 | | | | 6,448 | |
Atos SE | | | 63 | | | | 6,544 | |
AXA S.A. | | | 293 | | | | 6,597 | |
BNP Paribas S.A. | | | 112 | | | | 6,497 | |
Bouygues S.A. | | | 192 | | | | 6,266 | |
Bureau Veritas S.A. | | | 280 | | | | 5,290 | |
Capgemini S.A. | | | 63 | | | | 5,220 | |
Carrefour S.A. | | | 243 | | | | 6,380 | |
Christian Dior SE | | | 37 | | | | 7,138 | |
Cie Generale des Etablissements Michelin | | | 58 | | | | 6,280 | |
Compagnie de Saint-Gobain | | | 135 | | | | 6,000 | |
Credit Agricole S.A. | | | 639 | | | | 6,878 | |
Danone | | | 80 | | | | 5,540 | |
Dassault Systemes S.A. | | | 73 | | | | 5,785 | |
Engie S.A. | | | 387 | | | | 5,585 | |
Essilor International S.A. | | | 47 | | | | 5,274 | |
| | | | | | | | |
| | | Shares | | | Value | |
| France–(continued) | | | | | | | | |
Hermes International | | | 15 | | | $ | 6,078 | |
Kering | | | 32 | | | | 7,098 | |
Klepierre | | | 135 | | | | 5,522 | |
L’Oreal S.A. | | | 32 | | | | 5,728 | |
Legrand S.A. | | | 107 | | | | 6,042 | |
LVMH Moet Hennessy Louis Vuitton S.E. | | | 36 | | | | 6,542 | |
Orange S.A. | | | 412 | | | | 6,490 | |
Pernod Ricard S.A. | | | 53 | | | | 6,304 | |
Peugeot S.A.(a) | | | 397 | | | | 5,947 | |
Publicis Groupe S.A. | | | 83 | | | | 5,695 | |
Renault S.A. | | | 76 | | | | 6,609 | |
Safran S.A. | | | 86 | | | | 5,906 | |
Sanofi | | | 76 | | | | 5,912 | |
Schneider Electric S.E. | | | 90 | | | | 6,040 | |
SCOR S.E. | | | 209 | | | | 6,772 | |
Societe Generale S.A. | | | 170 | | | | 6,617 | |
Sodexo S.A. | | | 53 | | | | 6,160 | |
SUEZ | | | 395 | | | | 6,260 | |
Technip S.A. | | | 107 | | | | 7,070 | |
Thales S.A. | | | 72 | | | | 6,779 | |
TOTAL S.A. | | | 127 | | | | 6,077 | |
Unibail-Rodamco S.E. | | | 22 | | | | 5,241 | |
Valeo S.A. | | | 120 | | | | 6,916 | |
Veolia Environnement S.A. | | | 272 | | | | 5,936 | |
Vinci S.A. | | | 82 | | | | 5,928 | |
Vivendi S.A. | | | 319 | | | | 6,450 | |
Zodiac Aerospace | | | 277 | | | | 6,741 | |
| | | | | | | | 285,238 | |
|
| Germany–3.02% | |
adidas AG | | | 39 | | | | 6,396 | |
Allianz S.E. | | | 42 | | | | 6,547 | |
BASF S.E. | | | 78 | | | | 6,876 | |
Bayer AG | | | 62 | | | | 6,145 | |
Bayerische Motoren Werke AG | | | 72 | | | | 6,273 | |
Beiersdorf AG | | | 66 | | | | 5,811 | |
Brenntag AG | | | 117 | | | | 6,254 | |
Commerzbank AG | | | 862 | | | | 5,854 | |
Continental AG | | | 29 | | | | 5,557 | |
Daimler AG | | | 93 | | | | 6,627 | |
Deutsche Bank AG(a) | | | 424 | | | | 6,123 | |
Deutsche Lufthansa AG | | | 527 | | | | 6,737 | |
Deutsche Post AG | | | 196 | | | | 6,074 | |
Deutsche Telekom AG | | | 375 | | | | 6,111 | |
Deutsche Wohnen AG | | | 165 | | | | 5,383 | |
E.ON S.E. | | | 680 | | | | 4,964 | |
Fresenius Medical Care AG & Co. KGaA | | | 73 | | | | 5,947 | |
Fresenius S.E. & Co. KGaA | | | 86 | | | | 6,348 | |
GEA Group AG | | | 115 | | | | 4,447 | |
HeidelbergCement AG | | | 68 | | | | 6,432 | |
Henkel AG & Co. KGaA–Preference Shares | | | 48 | | | | 6,160 | |
Infineon Technologies AG | | | 378 | | | | 6,786 | |
K+S AG | | | 300 | | | | 6,069 | |
See accompanying Notes to Financial Statements which are an integral part of the financial statements.
10 Invesco Macro International Equity Fund
| | | | | | | | |
| | | Shares | | | Value | |
| Germany–(continued) | | | | | | | | |
Linde AG | | | 36 | | | $ | 5,940 | |
Merck KGaA | | | 60 | | | | 6,169 | |
Metro AG | | | 202 | | | | 6,051 | |
Muenchener Rueckversicherungs–Gesellschaft AG | | | 34 | | | | 6,591 | |
Porsche Automobil Holding S.E.–Preference Shares | | | 123 | | | | 6,633 | |
ProSiebenSat.1 Media SE | | | 144 | | | | 6,206 | |
RWE AG(a) | | | 376 | | | | 5,968 | |
SAP S.E. | | | 70 | | | | 6,166 | |
Siemens AG | | | 52 | | | | 5,905 | |
Symrise AG | | | 84 | | | | 5,764 | |
thyssenkrupp AG | | | 261 | | | | 6,046 | |
Volkswagen AG–Preference Shares | | | 45 | | | | 6,185 | |
Vonovia SE | | | 160 | | | | 5,643 | |
| | | | | 219,188 | |
|
| Hong Kong–5.06% | |
AIA Group Ltd. | | | 2,000 | | | | 12,623 | |
Bank of East Asia, Ltd. (The) | | | 3,200 | | | | 12,871 | |
Cheung Kong Infrastructure Holdings Ltd. | | | 2,000 | | | | 16,368 | |
Cheung Kong Property Holdings Ltd. | | | 2,000 | | | | 14,815 | |
CK Hutchison Holdings Ltd. | | | 1,000 | | | | 12,372 | |
CLP Holdings Ltd. | | | 1,500 | | | | 15,244 | |
Galaxy Entertainment Group Ltd. | | | 4,000 | | | | 16,427 | |
Hang Lung Properties Ltd. | | | 6,000 | | | | 13,245 | |
Hang Seng Bank Ltd. | | | 800 | | | | 14,427 | |
Henderson Land Development Co. Ltd. | | | 2,441 | | | | 14,463 | |
Hong Kong & China Gas Co., Ltd. | | | 7,103 | | | | 13,921 | |
Hong Kong Exchanges & Clearing Ltd. | | | 500 | | | | 13,216 | |
Hongkong Land Holdings Ltd. | | | 2,100 | | | | 14,070 | |
Jardine Matheson Holdings Ltd. | | | 200 | | | | 12,164 | |
Jardine Strategic Holdings Ltd. | | | 400 | | | | 14,011 | |
Link REIT | | | 2,000 | | | | 14,261 | |
MTR Corp. Ltd. | | | 2,500 | | | | 13,826 | |
New World Development Co. Ltd. | | | 11,000 | | | | 13,715 | |
Power Assets Holdings Ltd. | | | 1,500 | | | | 14,109 | |
Sands China Ltd. | | | 3,200 | | | | 13,888 | |
Sino Land Co. Ltd. | | | 8,000 | | | | 13,585 | |
Sun Hung Kai Properties Ltd. | | | 1,000 | | | | 14,897 | |
Swire Pacific Ltd.–Class A | | | 1,000 | | | | 10,399 | |
Techtronic Industries Co. Ltd. | | | 3,500 | | | | 13,178 | |
WH Group Ltd.–REGS(b) | | | 24,500 | | | | 19,870 | |
Wharf (Holdings) Ltd. (The) | | | 2,000 | | | | 15,035 | |
| | | | | 367,000 | |
|
| Hungary–0.28% | |
MOL Hungarian Oil and Gas PLC | | | 110 | | | | 7,077 | |
OTP Bank Nyrt. | | | 231 | | | | 6,471 | |
Richter Gedeon Nyrt | | | 324 | | | | 6,963 | |
| | | | | 20,511 | |
|
| India–0.27% | |
HDFC Bank Ltd.–ADR | | | 96 | | | | 6,795 | |
Reliance Industries Ltd.–GDR–REGS(b) | | | 204 | | | | 6,467 | |
Wipro Ltd.–ADR | | | 668 | | | | 6,459 | |
| | | | | 19,721 | |
| | | | | | | | |
| | | Shares | | | Value | |
| Indonesia–0.33% | |
PT Bank Central Asia Tbk | | | 6,300 | | | $ | 7,486 | |
PT Telekomunikasi Indonesia Persero Tbk | | | 17,400 | | | | 5,618 | |
PT Unilever Indonesia Tbk | | | 1,600 | | | | 5,454 | |
PT Waskita Karya (Persero) Tbk | | | 27,900 | | | | 5,594 | |
| | | | | 24,152 | |
|
| Ireland–0.67% | |
Bank of Ireland(a) | | | 27,422 | | | | 5,854 | |
CRH PLC | | | 185 | | | | 5,996 | |
Experian PLC | | | 1,369 | | | | 26,284 | |
Kerry Group PLC–Class A | | | 73 | | | | 5,300 | |
Paddy Power Betfair PLC | | | 52 | | | | 5,383 | |
| | | | | 48,817 | |
|
| Italy–0.82% | |
Assicurazioni Generali S.p.A. | | | 487 | | | | 6,292 | |
Atlantia S.p.A. | | | 241 | | | | 5,909 | |
Enel S.p.A. | | | 1,373 | | | | 5,899 | |
Eni S.p.A. | | | 411 | | | | 5,944 | |
Intesa Sanpaolo S.p.A. | | | 2,496 | | | | 5,762 | |
Luxottica Group S.p.A. | | | 129 | | | | 6,394 | |
Snam S.p.A. | | | 1,123 | | | | 5,926 | |
Telecom Italia S.p.A.(a) | | | 6,534 | | | | 5,696 | |
Terna — Rete Elettrica Nazionale S.p.A. | | | 1,206 | | | | 5,914 | |
UniCredit S.p.A. | | | 2,400 | | | | 5,941 | |
| | | | | 59,677 | |
|
| Japan–17.79% | |
AEON Co., Ltd. | | | 600 | | | | 8,314 | |
Aisin Seiki Co., Ltd. | | | 200 | | | | 8,785 | |
Ajinomoto Co., Inc. | | | 400 | | | | 8,902 | |
ANA Holdings Inc. | | | 3,000 | | | | 8,445 | |
Asahi Glass Co., Ltd. | | | 1,000 | | | | 7,009 | |
Asahi Group Holdings, Ltd. | | | 300 | | | | 10,731 | |
Asahi Kasei Corp. | | | 1,000 | | | | 9,024 | |
Astellas Pharma Inc. | | | 600 | | | | 8,923 | |
Bandai Namco Holdings Inc. | | | 300 | | | | 9,012 | |
Bridgestone Corp. | | | 300 | | | | 11,180 | |
Canon Inc. | | | 300 | | | | 8,616 | |
Central Japan Railway Co. | | | 100 | | | | 17,013 | |
Chubu Electric Power Co., Inc. | | | 600 | | | | 8,837 | |
Chugai Pharmaceutical Co., Ltd. | | | 300 | | | | 10,242 | |
Dai Nippon Printing Co., Ltd. | | | 1,000 | | | | 10,037 | |
Dai-ichi Life Holdings, Inc. | | | 600 | | | | 8,792 | |
Daiichi Sankyo Co., Ltd. | | | 400 | | | | 9,622 | |
Daikin Industries, Ltd. | | | 100 | | | | 9,594 | |
Daito Trust Construction Co., Ltd. | | | 100 | | | | 16,760 | |
Daiwa House Industry Co., Ltd. | | | 300 | | | | 8,256 | |
Daiwa Securities Group Inc. | | | 1,000 | | | | 5,972 | |
Denso Corp. | | | 200 | | | | 8,687 | |
Dentsu Inc. | | | 200 | | | | 9,994 | |
East Japan Railway Co. | | | 100 | | | | 8,817 | |
Eisai Co., Ltd. | | | 100 | | | | 6,378 | |
FANUC Corp. | | | 100 | | | | 18,738 | |
See accompanying Notes to Financial Statements which are an integral part of the financial statements.
11 Invesco Macro International Equity Fund
| | | | | | | | |
| | | Shares | | | Value | |
| Japan–(continued) | | | | | | | | |
Fuji Heavy Industries Ltd. | | | 200 | | | $ | 7,787 | |
FUJIFILM Holdings Corp. | | | 200 | | | | 7,581 | |
Fujitsu Ltd. | | | 2,000 | | | | 11,854 | |
Hankyu Hanshin Holdings, Inc. | | | 300 | | | | 9,956 | |
Hitachi, Ltd. | | | 2,000 | | | | 10,641 | |
Honda Motor Co., Ltd. | | | 300 | | | | 8,975 | |
Hoya Corp. | | | 200 | | | | 8,351 | |
INPEX Corp. | | | 1,000 | | | | 9,302 | |
Isuzu Motors Ltd. | | | 700 | | | | 8,656 | |
ITOCHU Corp. | | | 700 | | | | 8,868 | |
Japan Airlines Co. Ltd. | | | 300 | | | | 8,857 | |
Japan Exchange Group Inc. | | | 500 | | | | 7,452 | |
Japan Post Holdings Co., Ltd. | | | 600 | | | | 7,645 | |
Japan Real Estate Investment Corp. | | | 1 | | | | 5,788 | |
Japan Retail Fund Investment Corp. | | | 4 | | | | 9,085 | |
Japan Tobacco, Inc. | | | 200 | | | | 7,617 | |
JFE Holdings, Inc. | | | 600 | | | | 8,600 | |
JX Holdings, Inc. | | | 2,300 | | | | 9,086 | |
Kajima Corp. | | | 1,000 | | | | 6,761 | |
Kansai Electric Power Co., Inc. (The)(a) | | | 1,000 | | | | 9,579 | |
Kao Corp. | | | 200 | | | | 10,309 | |
KDDI Corp. | | | 300 | | | | 9,132 | |
Keio Corp. | | | 1,000 | | | | 8,287 | |
Kintetsu Group Holdings Co., Ltd. | | | 2,000 | | | | 8,079 | |
Kirin Holdings Co., Ltd. | | | 500 | | | | 8,618 | |
Koito Manufacturing Co., Ltd. | | | 200 | | | | 10,428 | |
Komatsu Ltd. | | | 400 | | | | 8,916 | |
Kubota Corp. | | | 600 | | | | 9,672 | |
Kyocera Corp. | | | 200 | | | | 9,730 | |
Lawson, Inc. | | | 100 | | | | 7,610 | |
Makita Corp. | | | 100 | | | | 6,933 | |
Marubeni Corp. | | | 1,800 | | | | 9,472 | |
Mazda Motor Corp. | | | 500 | | | | 8,208 | |
MEIJI Holdings Co., Ltd. | | | 100 | | | | 9,994 | |
Mitsubishi Chemical Holdings Corp. | | | 1,400 | | | | 9,199 | |
Mitsubishi Corp. | | | 400 | | | | 8,739 | |
Mitsubishi Electric Corp. | | | 700 | | | | 9,474 | |
Mitsubishi Heavy Industries, Ltd. | | | 2,000 | | | | 8,553 | |
Mitsubishi UFJ Financial Group, Inc. | | | 1,600 | | | | 8,289 | |
Mitsui & Co., Ltd. | | | 700 | | | | 9,717 | |
Mizuho Financial Group, Inc. | | | 5,000 | | | | 8,430 | |
MS&AD Insurance Group Holdings, Inc. | | | 300 | | | | 8,908 | |
Murata Manufacturing Co., Ltd. | | | 100 | | | | 13,947 | |
NEC Corp. | | | 3,000 | | | | 8,039 | |
NGK Insulators, Ltd. | | | 400 | | | | 7,337 | |
Nidec Corp. | | | 100 | | | | 9,698 | |
Nikon Corp. | | | 600 | | | | 9,080 | |
Nippon Building Fund Inc. | | | 1 | | | | 5,949 | |
Nippon Paint Holdings Co., Ltd. | | | 300 | | | | 10,213 | |
Nippon Steel & Sumitomo Metal Corp. | | | 400 | | | | 7,908 | |
Nippon Telegraph & Telephone Corp. | | | 200 | | | | 8,888 | |
Nissan Motor Co., Ltd. | | | 900 | | | | 9,154 | |
Nitori Holdings Co., Ltd. | | | 100 | | | | 11,987 | |
| | | | | | | | |
| | | Shares | | | Value | |
| Japan–(continued) | | | | | | | | |
Nitto Denko Corp. | | | 100 | | | $ | 6,971 | |
Nomura Holdings, Inc. | | | 1,800 | | | | 9,037 | |
Nomura Real Estate Master Fund, Inc. | | | 5 | | | | 8,106 | |
NTT Data Corp. | | | 200 | | | | 10,337 | |
NTT DOCOMO, Inc. | | | 300 | | | | 7,554 | |
Obayashi Corp. | | | 900 | | | | 8,694 | |
Odakyu Electric Railway Co., Ltd. | | | 400 | | | | 8,172 | |
Olympus Corp. | | | 300 | | | | 10,728 | |
OMRON Corp. | | | 300 | | | | 11,529 | |
Ono Pharmaceutical Co., Ltd. | | | 300 | | | | 7,630 | |
Oriental Land Co., Ltd. | | | 100 | | | | 5,846 | |
ORIX Corp. | | | 600 | | | | 9,529 | |
Osaka Gas Co., Ltd. | | | 2,000 | | | | 8,318 | |
Otsuka Holdings Co., Ltd. | | | 200 | | | | 8,767 | |
Panasonic Corp. | | | 800 | | | | 8,349 | |
Rakuten Inc. | | | 700 | | | | 8,094 | |
Recruit Holdings Co., Ltd. | | | 200 | | | | 8,048 | |
Resona Holdings, Inc. | | | 1,900 | | | | 8,428 | |
Ricoh Co., Ltd. | | | 900 | | | | 7,347 | |
Santen Pharmaceutical Co., Ltd. | | | 700 | | | | 10,223 | |
SECOM Co., Ltd. | | | 100 | | | | 7,221 | |
Sekisui Chemical Co., Ltd. | | | 600 | | | | 9,452 | |
Sekisui House, Ltd. | | | 500 | | | | 8,267 | |
Seven & i Holdings Co., Ltd. | | | 200 | | | | 8,359 | |
Shimano Inc. | | | 100 | | | | 17,127 | |
Shimizu Corp. | | | 1,000 | | | | 8,897 | |
Shin-Etsu Chemical Co., Ltd. | | | 100 | | | | 7,601 | |
Shionogi & Co., Ltd. | | | 200 | | | | 9,855 | |
Shiseido Co., Ltd. | | | 300 | | | | 7,747 | |
SoftBank Group Corp. | | | 100 | | | | 6,296 | |
Sompo Holdings, Inc. | | | 300 | | | | 9,716 | |
Sony Corp. | | | 300 | | | | 9,494 | |
Sumitomo Chemical Co., Ltd. | | | 2,000 | | | | 9,473 | |
Sumitomo Corp. | | | 800 | | | | 9,213 | |
Sumitomo Electric Industries, Ltd. | | | 600 | | | | 8,873 | |
Sumitomo Metal Mining Co., Ltd. | | | 1,000 | | | | 12,964 | |
Sumitomo Mitsui Financial Group, Inc. | | | 200 | | | | 6,952 | |
Sumitomo Mitsui Trust Holdings, Inc. | | | 200 | | | | 6,771 | |
Suntory Beverage & Food Ltd. | | | 200 | | | | 8,738 | |
Suzuki Motor Corp. | | | 300 | | | | 10,649 | |
Sysmex Corp. | | | 100 | | | | 6,940 | |
T&D Holdings, Inc. | | | 700 | | | | 8,465 | |
Taisei Corp. | | | 1,000 | | | | 7,514 | |
Takeda Pharmaceutical Co. Ltd. | | | 200 | | | | 8,955 | |
TDK Corp. | | | 100 | | | | 6,907 | |
Terumo Corp. | | | 200 | | | | 7,753 | |
Tobu Railway Co., Ltd. | | | 2,000 | | | | 9,831 | |
Tohoku Electric Power Co., Inc. | | | 700 | | | | 8,578 | |
Tokio Marine Holdings, Inc. | | | 200 | | | | 7,893 | |
Tokyo Electric Power Co. Holdings, Inc.(a) | | | 2,100 | | | | 8,171 | |
Tokyo Electron Ltd. | | | 100 | | | | 9,048 | |
Tokyo Gas Co., Ltd. | | | 2,000 | | | | 9,068 | |
Tokyu Corp. | | | 1,000 | | | | 7,496 | |
See accompanying Notes to Financial Statements which are an integral part of the financial statements.
12 Invesco Macro International Equity Fund
| | | | | | | | |
| | | Shares | | | Value | |
| Japan–(continued) | | | | | | | | |
Toppan Printing Co., Ltd. | | | 1,000 | | | $ | 9,409 | |
Toray Industries, Inc. | | | 1,000 | | | | 9,334 | |
Toshiba Corp.(a) | | | 3,000 | | | | 10,878 | |
TOTO Ltd. | | | 200 | | | | 7,997 | |
Toyota Industries Corp. | | | 200 | | | | 9,162 | |
Toyota Motor Corp. | | | 100 | | | | 5,777 | |
Toyota Tsusho Corp. | | | 400 | | | | 9,457 | |
Unicharm Corp. | | | 400 | | | | 9,530 | |
West Japan Railway Co. | | | 200 | | | | 12,344 | |
Yahoo! Japan Corp. | | | 2,100 | | | | 8,070 | |
Yamato Holdings Co., Ltd. | | | 400 | | | | 9,136 | |
| | | | | 1,291,103 | |
|
| Luxembourg–0.19% | |
ArcelorMittal S.A.(a) | | | 1,039 | | | | 6,968 | |
Tenaris S.A. | | | 470 | | | | 6,638 | |
| | | | | 13,606 | |
|
| Malaysia–2.67% | |
Axiata Group Bhd. | | | 5,200 | | | | 6,099 | |
CIMB Group Holdings Bhd. | | | 5,000 | | | | 5,996 | |
DiGi.Com Bhd. | | | 6,600 | | | | 7,919 | |
Gamuda Bhd. | | | 5,900 | | | | 6,906 | |
Genting Malaysia Bhd. | | | 5,200 | | | | 5,901 | |
Hap Seng Consolidated Bhd. | | | 4,000 | | | | 7,423 | |
IHH Healthcare Bhd. | | | 6,700 | | | | 10,223 | |
IJM Corp. Bhd. | | | 9,300 | | | | 7,317 | |
IOI Corp. Bhd. | | | 5,400 | | | | 5,785 | |
Kuala Lumpur Kepong Bhd. | | | 1,800 | | | | 10,282 | |
Malayan Banking Bhd. | | | 5,200 | | | | 9,789 | |
Maxis Bhd. | | | 4,900 | | | | 6,962 | |
MISC Bhd. | | | 4,000 | | | | 7,171 | |
Petronas Chemicals Group Bhd. | | | 4,500 | | | | 7,510 | |
Petronas Dagangan Bhd. | | | 1,700 | | | | 9,468 | |
Petronas Gas Bhd. | | | 1,800 | | | | 9,470 | |
Public Bank Bhd. | | | 3,400 | | | | 16,098 | |
RHB Bank Bhd. | | | 5,500 | | | | 6,333 | |
Sime Darby Bhd. | | | 3,000 | | | | 5,858 | |
Telekom Malaysia Bhd. | | | 10,200 | | | | 15,904 | |
Tenaga Nasional Bhd. | | | 3,100 | | | | 10,598 | |
Westports Holdings Bhd. | | | 7,900 | | | | 8,294 | |
YTL Corp. Bhd. | | | 17,900 | | | | 6,785 | |
| | | | | 194,091 | |
| | |
| Mexico–2.08% | | | | | | | | |
Alfa, S.A.B. de C.V.–Class A | | | 4,000 | | | | 6,069 | |
America Movil S.A.B. de C.V.–Series L | | | 9,500 | | | | 6,292 | |
Arca Continental S.A.B. de C.V. | | | 1,200 | | | | 7,457 | |
Coca-Cola Femsa, S.A.B. de C.V.–Series L | | | 1,100 | | | | 8,259 | |
Fibra Uno Administracion S.A. de C.V. | | | 4,200 | | | | 7,992 | |
Fomento Economico Mexicano, S.A.B. de C.V.–Series BD(c) | | | 900 | | | | 8,629 | |
Gruma, S.A.B. de C.V.–Class B | | | 460 | | | | 6,394 | |
| | | | | | | | |
| | | Shares | | | Value | |
| Mexico–(continued) | | | | | | | | |
Grupo Aeroportuario del Pacífico, S.A.B. de C.V.–Class B | | | 700 | | | $ | 6,762 | |
Grupo Aeroportuario del Sureste, S.A.B. de C.V.–Class B | | | 470 | | | | 7,482 | |
Grupo Bimbo, S.A.B. de C.V.–Series A | | | 2,200 | | | | 5,931 | |
Grupo Elektra, S.A.B. de C.V. | | | 400 | | | | 5,535 | |
Grupo Financiero Banorte S.A.B. de C.V.–Class O | | | 1,000 | | | | 5,899 | |
Grupo Financiero Inbursa, S.A.B. de C.V.–Class O | | | 3,400 | | | | 5,540 | |
Grupo Financiero Santander Mexico, S.A.B. de C.V.–Class B | | | 3,300 | | | | 5,976 | |
Grupo Lala, S.A.B. de C.V. | | | 3,200 | | | | 5,951 | |
Grupo Mexico S.A.B. de C.V.–Series B | | | 2,300 | | | | 5,646 | |
Grupo Televisa S.A.B.–Series CPO(d) | | | 1,200 | | | | 5,895 | |
Infraestructura Enérgetica Nova, S.A.B. de C.V. | | | 1,700 | | | | 7,510 | |
Kimberly-Clark de Mexico, S.A.B. de C.V.–Class A | | | 2,800 | | | | 6,033 | |
Mexichem S.A.B. de C.V. | | | 2,500 | | | | 5,974 | |
Nemak, S.A.B. de C.V.–REGS(b) | | | 6,700 | | | | 6,976 | |
Promotora y Operadora de Infraestructura, S.A.B. de C.V. | | | 585 | | | | 6,526 | |
Wal-Mart de México, S.A.B. de C.V.–Series V | | | 2,800 | | | | 5,922 | |
| | | | | 150,650 | |
|
| Netherlands–1.35% | |
Aegon N.V. | | | 1,534 | | | | 6,604 | |
Akzo Nobel N.V. | | | 88 | | | | 5,683 | |
ASML Holding N.V. | | | 60 | | | | 6,356 | |
Gemalto N.V. | | | 89 | | | | 4,823 | |
Heineken Holding N.V. | | | 73 | | | | 5,618 | |
Heineken N.V. | | | 70 | | | | 5,763 | |
ING Groep N.V. | | | 509 | | | | 6,692 | |
Koninklijke Ahold Delhaize N.V. | | | 265 | | | | 6,049 | |
Koninklijke DSM N.V. | | | 88 | | | | 5,653 | |
Koninklijke KPN N.V. | | | 1,950 | | | | 6,360 | |
Koninklijke Philips N.V. | | | 224 | | | | 6,745 | |
NN Group N.V. | | | 210 | | | | 6,328 | |
NXP Semiconductors N.V.(a) | | | 73 | | | | 7,300 | |
Randstad Holding N.V. | | | 136 | | | | 6,995 | |
Steinhoff International Holdings N.V. | | | 986 | | | | 5,323 | |
Wolters Kluwer N.V. | | | 153 | | | | 5,917 | |
| | | | | 98,209 | |
|
| New Zealand–0.67% | |
Auckland International Airport Ltd. | | | 2,447 | | | | 11,531 | |
Fisher & Paykel Healthcare Corp. Ltd. | | | 1,836 | | | | 11,632 | |
Fletcher Building Ltd. | | | 1,711 | | | | 12,687 | |
Spark New Zealand Ltd. | | | 4,833 | | | | 12,648 | |
| | | | | 48,498 | |
|
| Norway–0.47% | |
DNB ASA | | | 661 | | | | 9,560 | |
Orkla ASA | | | 878 | | | | 8,286 | |
Statoil ASA | | | 525 | | | | 8,555 | |
Telenor ASA | | | 470 | | | | 7,480 | |
| | | | | 33,881 | |
See accompanying Notes to Financial Statements which are an integral part of the financial statements.
13 Invesco Macro International Equity Fund
| | | | | | | | |
| | | Shares | | | Value | |
| Philippines–0.84% | |
Aboitiz Equity Ventures Inc. | | | 4,080 | | | $ | 6,569 | |
Ayala Corp. | | | 330 | | | | 5,687 | |
Bank of the Philippine Islands | | | 3,640 | | | | 7,596 | |
BDO Unibank, Inc. | | | 2,690 | | | | 6,263 | |
GT Capital Holdings, Inc. | | | 205 | | | | 5,547 | |
Jollibee Foods Corp. | | | 1,320 | | | | 6,484 | |
Metro Pacific Investments Corp. | | | 40,000 | | | | 5,944 | |
Puregold Price Club, Inc. | | | 6,100 | | | | 5,131 | |
SM Investments Corp. | | | 390 | | | | 5,409 | |
Universal Robina Corp. | | | 1,670 | | | | 6,286 | |
| | | | | 60,916 | |
|
| Poland–0.24% | |
Orange Polska S.A. | | | 3,763 | | | | 5,371 | |
Polski Koncern Naftowy ORLEN S.A. | | | 327 | | | | 6,485 | |
Powszechny Zaklad Ubezpieczen S.A. | | | 752 | | | | 5,222 | |
| | | | | 17,078 | |
|
| Portugal–0.08% | |
EDP — Energias de Portugal, S.A. | | | 1,816 | | | | 6,002 | |
|
| Qatar–0.18% | |
Masraf Al Rayan Q.S.C. | | | 582 | | | | 5,530 | |
Qatar National Bank S.A.Q. | | | 164 | | | | 7,206 | |
| | | | | 12,736 | |
|
| Russia–0.07% | |
PhosAgro PJSC–GDR–REGS(b) | | | 431 | | | | 5,344 | |
|
| Singapore–2.30% | |
Ascendas REIT | | | 7,400 | | | | 12,607 | |
CapitaLand Ltd. | | | 5,900 | | | | 13,072 | |
City Developments Ltd. | | | 2,100 | | | | 12,816 | |
ComfortDelGro Corp. Ltd. | | | 6,400 | | | | 11,685 | |
DBS Group Holdings Ltd. | | | 1,200 | | | | 12,905 | |
Keppel Corp. Ltd. | | | 3,500 | | | | 13,239 | |
Oversea-Chinese Banking Corp. Ltd. | | | 2,100 | | | | 12,779 | |
Singapore Airlines Ltd. | | | 1,700 | | | | 12,379 | |
Singapore Exchange Ltd. | | | 2,400 | | | | 12,232 | |
Singapore Press Holdings Ltd. | | | 4,800 | | | | 12,816 | |
Singapore Telecommunications Ltd. | | | 4,700 | | | | 13,072 | |
United Overseas Bank Ltd. | | | 1,000 | | | | 13,484 | |
Wilmar International Ltd. | | | 5,900 | | | | 14,038 | |
| | | | | 167,124 | |
| | |
| South Africa–0.27% | | | | | | | | |
Life Healthcare Group Holdings Ltd. | | | 2,358 | | | | 6,296 | |
Mondi Ltd. | | | 262 | | | | 5,120 | |
Vodacom Group Ltd. | | | 752 | | | | 8,113 | |
| | | | | 19,529 | |
| | |
| South Korea–1.84% | | | | | | | | |
CJ CheilJedang Corp. | | | 17 | | | | 5,188 | |
DGB Financial Group Inc. | | | 782 | | | | 6,553 | |
E-MART Inc. | | | 44 | | | | 6,245 | |
GS Holdings Corp. | | | 124 | | | | 5,525 | |
| | | | | | | | |
| | | Shares | | | Value | |
| South Korea–(continued) | | | | | | | | |
Hanwha Life Insurance Co., Ltd. | | | 1,229 | | | $ | 6,710 | |
Hyundai Department Store Co., Ltd. | | | 51 | | | | 5,239 | |
Hyundai Home Shopping Network Corp. | | | 56 | | | | 5,557 | |
Hyundai Mobis Co., Ltd. | | | 22 | | | | 5,270 | |
Hyundai Motor Co. | | | 47 | | | | 5,742 | |
Industrial Bank of Korea | | | 535 | | | | 6,174 | |
Kangwon Land Inc. | | | 155 | | | | 5,143 | |
KB Financial Group Inc. | | | 217 | | | | 8,040 | |
Kia Motors Corp. | | | 144 | | | | 5,115 | |
Korea Electric Power Corp. | | | 123 | | | | 5,308 | |
Korea Gas Corp. | | | 141 | | | | 5,704 | |
Korea Zinc Co., Ltd. | | | 12 | | | | 4,766 | |
KT Corp. | | | 358 | | | | 10,101 | |
LG Corp. | | | 89 | | | | 4,760 | |
Samsung Electronics Co., Ltd. | | | 4 | | | | 5,707 | |
Shinhan Financial Group Co., Ltd. | | | 174 | | | | 6,699 | |
SK Telecom Co., Ltd. | | | 33 | | | | 6,468 | |
Woori Bank | | | 673 | | | | 7,344 | |
| | | | | 133,358 | |
| | |
| Spain–1.37% | | | | | | | | |
Abertis Infraestructuras S.A. | | | 397 | | | | 5,894 | |
Aena S.A.–REGS(b) | | | 46 | | | | 6,754 | |
Amadeus IT Group S.A. | | | 135 | | | | 6,373 | |
Banco Bilbao Vizcaya Argentaria, S.A. | | | 967 | | | | 6,969 | |
Banco de Sabadell S.A. | | | 4,541 | | | | 6,063 | |
Banco Santander S.A. | | | 1,362 | | | | 6,672 | |
Banco Santander, S.A.–Rts.(a) | | | 1,362 | | | | 76 | |
CaixaBank S.A. | | | 2,304 | | | | 6,973 | |
Enagas S.A. | | | 199 | | | | 5,713 | |
Ferrovial, S.A. | | | 312 | | | | 6,064 | |
Ferrovial, S.A.–Rts.(a) | | | 312 | | | | 134 | |
Gas Natural SDG, S.A. | | | 290 | | | | 5,722 | |
Grifols S.A. | | | 291 | | | | 5,753 | |
Iberdrola S.A. | | | 890 | | | | 6,066 | |
Industria de Diseno Textil, S.A. | | | 176 | | | | 6,153 | |
Red Eléctrica Corp. S.A. | | | 276 | | | | 5,751 | |
Repsol S.A. | | | 451 | | | | 6,303 | |
Telefónica, S.A. | | | 611 | | | | 6,225 | |
| | | | | 99,658 | |
| | |
| Sweden–1.62% | | | | | | | | |
Assa Abloy AB–Class B | | | 407 | | | | 7,395 | |
Atlas Copco AB–Class A | | | 286 | | | | 8,376 | |
Hennes & Mauritz AB–Class B | | | 272 | | | | 7,652 | |
Hexagon AB–Class B | | | 197 | | | | 6,883 | |
Investor AB–Class B | | | 233 | | | | 8,271 | |
Nordea Bank AB | | | 824 | | | | 8,650 | |
Sandvik AB | | | 754 | | | | 8,558 | |
Skandinaviska Enskilda Banken AB–Class A | | | 832 | | | | 8,383 | |
Skanska AB–Class B | | | 385 | | | | 8,363 | |
Svenska Cellulosa AB SCA–Class B | | | 264 | | | | 7,480 | |
Svenska Handelsbanken AB–Class A | | | 615 | | | | 8,378 | |
See accompanying Notes to Financial Statements which are an integral part of the financial statements.
14 Invesco Macro International Equity Fund
| | | | | | | | |
| | | Shares | | | Value | |
| Sweden–(continued) | | | | | | | | |
Swedbank AB–Class A | | | 356 | | | $ | 8,332 | |
Telefonaktiebolaget LM Ericsson –Class B | | | 1,158 | | | | 5,634 | |
Telia Co. AB | | | 1,775 | | | | 7,085 | |
Volvo AB–Class B | | | 751 | | | | 8,055 | |
| | | | | 117,495 | |
| | |
| Switzerland–3.29% | | | | | | | | |
ABB Ltd. | | | 370 | | | | 7,614 | |
Actelion Ltd. | | | 48 | | | | 6,936 | |
Adecco Group AG (The) | | | 138 | | | | 8,195 | |
Cie Financiere Richemont S.A. | | | 140 | | | | 9,005 | |
Credit Suisse Group AG | | | 633 | | | | 8,823 | |
Geberit AG | | | 19 | | | | 8,032 | |
Givaudan S.A. | | | 4 | | | | 7,731 | |
Glencore PLC(a) | | | 11,642 | | | | 35,474 | |
Julius Baer Group Ltd. | | | 193 | | | | 7,810 | |
Kuehne + Nagel International AG | | | 58 | | | | 7,857 | |
LafargeHolcim Ltd. | | | 155 | | | | 8,278 | |
Nestle S.A. | | | 102 | | | | 7,396 | |
Novartis AG | | | 104 | | | | 7,386 | |
Roche Holding AG | | | 33 | | | | 7,573 | |
Schindler Holding AG–Participation Ctfs. | | | 43 | | | | 7,991 | |
SGS S.A. | | | 4 | | | | 8,109 | |
Sika AG | | | 2 | | | | 9,612 | |
Swatch Group AG (The) | | | 31 | | | | 9,326 | |
Swiss Re AG | | | 94 | | | | 8,730 | |
Swisscom AG | | | 17 | | | | 7,767 | |
Syngenta AG | | | 19 | | | | 7,627 | |
UBS Group AG | | | 572 | | | | 8,093 | |
Wolseley PLC | | | 477 | | | | 24,782 | |
Zurich Insurance Group AG | | | 32 | | | | 8,372 | |
| | | | | 238,519 | |
|
| Taiwan–4.21% | |
Aerospace Industrial Development Corp. | | | 5,000 | | | | 6,338 | |
Asia Cement Corp. | | | 6,140 | | | | 5,353 | |
Asustek Computer Inc. | | | 1,000 | | | | 8,749 | |
Cathay Financial Holding Co., Ltd. | | | 4,250 | | | | 5,515 | |
Chailease Holding Co. Ltd. | | | 3,000 | | | | 5,186 | |
Chang Hwa Commercial Bank, Ltd. | | | 16,000 | | | | 8,177 | |
Cheng Shin Rubber Industry Co., Ltd. | | | 3,000 | | | | 6,103 | |
China Airlines Ltd. | | | 22,000 | | | | 6,651 | |
China Development Financial Holding Corp. | | | 27,000 | | | | 6,760 | |
China Life Insurance Co., Ltd. | | | 7,000 | | | | 6,453 | |
China Steel Corp. | | | 8,240 | | | | 5,953 | |
Chunghwa Telecom Co., Ltd. | | | 3,000 | | | | 10,276 | |
Compal Electronics Inc. | | | 9,000 | | | | 5,355 | |
CTBC Financial Holding Co. Ltd. | | | 12,190 | | | | 6,567 | |
E.Sun Financial Holding Co. Ltd. | | | 12,333 | | | | 7,005 | |
EVA Airways Corp. | | | 12,000 | | | | 5,780 | |
Far Eastern New Century Corp. | | | 8,323 | | | | 6,440 | |
Far EasTone Telecommunications Co., Ltd. | | | 4,000 | | | | 9,456 | |
First Financial Holding Co., Ltd. | | | 21,756 | | | | 11,410 | |
| | | | | | | | |
| | | Shares | | | Value | |
| Taiwan–(continued) | |
Formosa Chemicals & Fibre Corp. | | | 2,000 | | | $ | 5,951 | |
Formosa Petrochemical Corp. | | | 2,000 | | | | 6,686 | |
Formosa Plastics Corp. | | | 3,000 | | | | 8,119 | |
Foxconn Technology Co. Ltd. | | | 2,000 | | | | 5,805 | |
Fubon Financial Holding Co., Ltd. | | | 4,000 | | | | 5,665 | |
Hon Hai Precision Industry Co., Ltd. | | | 2,726 | | | | 7,355 | |
Hua Nan Financial Holdings Co., Ltd. | | | 18,181 | | | | 9,237 | |
Mega Financial Holding Co., Ltd. | | | 11,000 | | | | 7,519 | |
Nan Ya Plastics Corp. | | | 3,000 | | | | 6,246 | |
Powertech Technology Inc. | | | 2,000 | | | | 5,710 | |
President Chain Store Corp. | | | 1,000 | | | | 7,479 | |
Qisda Corp. | | | 13,000 | | | | 5,479 | |
Quanta Computer Inc. | | | 3,000 | | | | 6,059 | |
Shin Kong Financial Holding Co., Ltd.(a) | | | 29,338 | | | | 6,359 | |
Simplo Technology Co., Ltd. | | | 2,000 | | | | 6,179 | |
SinoPac Financial Holdings Co., Ltd. | | | 23,526 | | | | 6,784 | |
Synnex Technology International Corp. | | | 5,300 | | | | 5,645 | |
Taishin Financial Holding Co., Ltd. | | | 19,178 | | | | 7,009 | |
Taiwan Cooperative Financial Holding Co. Ltd. | | | 23,497 | | | | 10,304 | |
Taiwan Mobile Co., Ltd. | | | 3,000 | | | | 10,487 | |
Taiwan Semiconductor Manufacturing Co. Ltd. | | | 1,000 | | | | 5,973 | |
Uni-President Enterprises Corp. | | | 3,409 | | | | 6,600 | |
United Microelectronics Corp. | | | 16,000 | | | | 5,972 | |
WPG Holdings Ltd. | | | 6,000 | | | | 7,035 | |
Yuanta Financial Holding Co., Ltd. | | | 17,726 | | | | 6,618 | |
| | | | | 305,802 | |
| | |
| Thailand–1.89% | | | | | | | | |
Airports of Thailand PCL | | | 600 | | | | 6,526 | |
Bangchak Petroleum PCL (The) | | | 6,300 | | | | 5,433 | |
Bangkok Airways PCL | | | 9,000 | | | | 6,397 | |
Bangkok Bank PCL | | | 1,400 | | | | 6,365 | |
Bangkok Dusit Medical Services PCL | | | 13,000 | | | | 8,449 | |
BTS Group Holdings PCL | | | 31,900 | | | | 7,786 | |
Central Pattana PCL | | | 3,800 | | | | 6,075 | |
CP ALL PCL | | | 3,300 | | | | 5,723 | |
Electricity Generating PCL | | | 1,400 | | | | 7,793 | |
Global Power Synergy PCL | | | 6,000 | | | | 6,072 | |
Home Product Center PCL | | | 19,100 | | | | 5,507 | |
IRPC PCL | | | 39,900 | | | | 5,445 | |
Kasikornbank PCL | | | 1,000 | | | | 4,902 | |
Krung Thai Bank PCL | | | 12,700 | | | | 6,227 | |
Land and Houses PCL | | | 21,900 | | | | 5,724 | |
Muangthai Leasing PCL | | | 12,200 | | | | 6,547 | |
Pruksa Real Estate PCL | | | 8,200 | | | | 5,407 | |
Siam Cement PCL (The) | | | 500 | | | | 7,194 | |
Siam Commercial Bank PCL (The) | | | 1,300 | | | | 5,315 | |
Thai Beverage PCL | | | 26,800 | | | | 18,567 | |
| | | | | 137,454 | |
|
| Turkey–0.37% | |
BIM Birlesik Magazalar A.S. | | | 347 | | | | 5,639 | |
Enka Insaat ve Sanayi A.S. | | | 3,640 | | | | 5,538 | |
See accompanying Notes to Financial Statements which are an integral part of the financial statements.
15 Invesco Macro International Equity Fund
| | | | | | | | |
| | | Shares | | | Value | |
| Turkey–(continued) | |
Petkim PetroKimya Holding A.S. | | | 3,675 | | | $ | 4,977 | |
Turk Telekomunikasyon A.S. | | | 2,800 | | | | 5,162 | |
Turkcell Iletisim Hizmetleri A.S.(a) | | | 1,714 | | | | 5,509 | |
| | | | | 26,825 | |
|
| United Arab Emirates–0.08% | |
Dubai Islamic Bank PJSC | | | 3,906 | | | | 5,572 | |
|
| United Kingdom–15.73% | |
Anglo American PLC(a) | | | 2,619 | | | | 36,163 | |
Associated British Foods PLC | | | 671 | | | | 20,217 | |
AstraZeneca PLC | | | 428 | | | | 23,998 | |
Aviva PLC | | | 4,854 | | | | 26,242 | |
BAE Systems PLC | | | 3,861 | | | | 25,604 | |
Barclays PLC | | | 12,139 | | | | 28,149 | |
BP PLC | | | 4,909 | | | | 28,985 | |
British American Tobacco PLC | | | 438 | | | | 25,148 | |
BT Group PLC | | | 5,376 | | | | 24,702 | |
Centrica PLC | | | 8,969 | | | | 23,511 | |
CNH Industrial N.V. | | | 813 | | | | 6,307 | |
Compass Group PLC | | | 1,418 | | | | 25,640 | |
Diageo PLC | | | 991 | | | | 26,380 | |
Fiat Chrysler Automobiles N.V. | | | 896 | | | | 6,560 | |
GlaxoSmithKline PLC | | | 1,264 | | | | 24,980 | |
HSBC Holdings PLC | | | 3,642 | | | | 27,389 | |
Imperial Brands PLC | | | 512 | | | | 24,741 | |
International Consolidated Airlines Group, S.A. | | | 4,982 | | | | 26,442 | |
ITV PLC | | | 10,119 | | | | 21,068 | |
Kingfisher PLC | | | 5,642 | | | | 24,894 | |
Land Securities Group PLC | | | 1,927 | | | | 23,520 | |
Legal & General Group PLC | | | 9,778 | | | | 24,999 | |
Lloyds Banking Group PLC | | | 34,715 | | | | 24,274 | |
London Stock Exchange Group PLC | | | 765 | | | | 26,246 | |
Marks & Spencer Group PLC | | | 5,975 | | | | 24,846 | |
National Grid PLC | | | 1,977 | | | | 25,745 | |
Next PLC | | | 373 | | | | 21,948 | |
Old Mutual PLC | | | 10,579 | | | | 26,001 | |
Pearson PLC | | | 2,411 | | | | 22,283 | |
| | | | | | | | |
| | | Shares | | | Value | |
| United Kingdom–(continued) | | | | | | | | |
Prudential PLC | | | 1,502 | | | $ | 24,485 | |
Reckitt Benckiser Group PLC | | | 282 | | | | 25,212 | |
RELX N.V. | | | 353 | | | | 5,948 | |
RELX PLC | | | 1,464 | | | | 26,121 | |
Rio Tinto Ltd. | | | 371 | | | | 15,254 | |
Rio Tinto PLC | | | 909 | | | | 31,510 | |
Rolls-Royce Holdings PLC | | | 2,701 | | | | 24,014 | |
Rolls-Royce Holdings PLC–Preference Shares(a) | | | 124,246 | | | | 152 | |
Royal Bank of Scotland Group PLC(a) | | | 10,357 | | | | 23,912 | |
Royal Dutch Shell PLC–Class A | | | 1,131 | | | | 28,141 | |
Sky PLC | | | 2,468 | | | | 24,651 | |
Smith & Nephew PLC | | | 1,705 | | | | 24,565 | |
SSE PLC | | | 1,366 | | | | 26,597 | |
Standard Chartered PLC(a) | | | 3,199 | | | | 27,822 | |
Standard Life PLC | | | 5,711 | | | | 23,521 | |
Tesco PLC(a) | | | 12,327 | | | | 31,793 | |
Unilever N.V. | | | 131 | | | | 5,485 | |
Unilever PLC | | | 584 | | | | 24,428 | |
Vodafone Group PLC | | | 9,258 | | | | 25,416 | |
WPP PLC | | | 1,187 | | | | 25,788 | |
| | | | | 1,141,797 | |
|
| United States–0.53% | |
Samsonite International S.A. | | | 4,200 | | | | 13,214 | |
Shire PLC | | | 441 | | | | 24,899 | |
| | | | | | | | 38,113 | |
Total Common Stocks & Other Equity Interests
(Cost $6,610,786) | | | | 6,468,801 | |
|
Money Market Funds–8.74% | |
Government & Agency Portfolio–Institutional Class, 0.29%(e) | | | 380,399 | | | | 380,399 | |
Treasury Portfolio–Institutional
Class, 0.22%(e) | | | 253,600 | | | | 253,600 | |
Total Money Market Funds
(Cost $633,999) | | | | 633,999 | |
TOTAL INVESTMENTS–97.87%
(Cost $7,244,785) | | | | 7,102,800 | |
OTHER ASSETS LESS LIABILITIES–2.13% | | | | 154,891 | |
NET ASSETS–100.00% | | | $ | 7,257,691 | |
Investment Abbreviations:
| | |
| ADR | | – American Depositary Receipt |
| CPO | | – Certificates of Ordinary Participation |
| Ctfs. | | – Certificates |
| GDR | | – Global Depositary Receipt |
| REGS | | – Regulation S |
| REIT | | – Real Estate Investment Trust |
| Rts. | | – Rights |
Notes to Schedule of Investments:
| (a) | Non-income producing security. |
| (b) | Security purchased or received in a transaction exempt from registration under the Securities Act of 1933, as amended (the “1933 Act”). The security may be resold pursuant to an exemption from registration under the 1933 Act, typically to qualified institutional buyers. The aggregate value of these securities at October 31, 2016 was $45,411, which represented less than 1% of the Fund’s Net Assets. |
| (c) | Each unit represents one Series B share, two Series D-B shares and two Series D-L shares. |
| (d) | Each CPO represents twenty-five Series A shares, twenty-two Series B shares, thirty-five Series D shares and thirty-five Series L shares. |
| (e) | The money market fund and the Fund are affiliated by having the same investment adviser. The rate shown is the 7-day SEC standardized yield as of October 31, 2016. |
See accompanying Notes to Financial Statements which are an integral part of the financial statements.
16 Invesco Macro International Equity Fund
Statement of Assets and Liabilities
October 31, 2016
| | | | |
Assets: | |
Investments, at value (Cost $6,610,786) | | $ | 6,468,801 | |
Investments in affiliated money market funds, at value and cost | | | 633,999 | |
Total investments, at value (Cost $7,244,785) | | | 7,102,800 | |
Foreign currencies, at value (Cost $20,957) | | | 20,848 | |
Receivable for: | | | | |
Deposits with brokers for open futures contracts | | | 124,000 | |
Variation margin — futures | | | 964 | |
Dividends | | | 16,446 | |
Fund expenses absorbed | | | 46,593 | |
Investment for trustee deferred compensation and retirement plans | | | 6,109 | |
Other assets | | | 44,241 | |
Total assets | | | 7,362,001 | |
|
Liabilities: | |
Payable for: | | | | |
Investments purchased | | | 695 | |
Accrued foreign taxes | | | 1,261 | |
Accrued fees to affiliates | | | 1,079 | |
Accrued trustees’ and officers’ fees and benefits | | | 1,713 | |
Accrued other operating expenses | | | 93,453 | |
Trustee deferred compensation and retirement plans | | | 6,109 | |
Total liabilities | | | 104,310 | |
Net assets applicable to shares outstanding | | $ | 7,257,691 | |
|
Net assets consist of: | |
Shares of beneficial interest | | $ | 8,168,693 | |
Undistributed net investment income | | | 87,321 | |
Undistributed net realized gain (loss) | | | (860,013 | ) |
Net unrealized appreciation (depreciation) | | | (138,310 | ) |
| | | $ | 7,257,691 | |
| | | | |
Net Assets: | |
Class A | | $ | 2,894,582 | |
Class C | | $ | 92,183 | |
Class R | | $ | 8,881 | |
Class Y | | $ | 3,637,584 | |
Class R5 | | $ | 312,161 | |
Class R6 | | $ | 312,300 | |
|
Shares outstanding, $0.01 par value per share,
with an unlimited number of shares authorized: | |
Class A | | | 325,101 | |
Class C | | | 10,471 | |
Class R | | | 1,001 | |
Class Y | | | 407,657 | |
Class R5 | | | 35,001 | |
Class R6 | | | 35,001 | |
Class A: | | | | |
Net asset value per share | | $ | 8.90 | |
Maximum offering price per share | | | | |
(Net asset value of $8.90 ¸ 94.50%) | | $ | 9.42 | |
Class C: | | | | |
Net asset value and offering price per share | | $ | 8.80 | |
Class R: | | | | |
Net asset value and offering price per share | | $ | 8.87 | |
Class Y: | | | | |
Net asset value and offering price per share | | $ | 8.92 | |
Class R5: | | | | |
Net asset value and offering price per share | | $ | 8.92 | |
Class R6: | | | | |
Net asset value and offering price per share | | $ | 8.92 | |
See accompanying Notes to Financial Statements which are an integral part of the financial statements.
17 Invesco Macro International Equity Fund
Statement of Operations
For the year ended October 31, 2016
| | | | |
Investment income: | |
Dividends (net of foreign withholding taxes of $15,979) | | $ | 191,361 | |
Dividends from affiliated money market funds | | | 1,982 | |
Total investment income | | | 193,343 | |
| |
Expenses: | | | | |
Advisory fees | | | 66,615 | |
Administrative services fees | | | 50,000 | |
Custodian fees | | | 126,472 | |
Distribution fees: | | | | |
Class A | | | 7,300 | |
Class C | | | 827 | |
Class R | | | 43 | |
Transfer agent fees — A, C, R and Y | | | 3,259 | |
Transfer agent fees — R5 | | | 25 | |
Transfer agent fees — R6 | | | 25 | |
Trustees’ and officers’ fees and benefits | | | 19,085 | |
Registration and filing fees | | | 74,112 | |
Licensing Fees | | | 90,150 | |
Reports to shareholders | | | 12,183 | |
Professional services fees | | | 76,250 | |
Other | | | 107,189 | |
Total expenses | | | 633,535 | |
Less: Fees waived and expenses reimbursed | | | (542,128 | ) |
Net expenses | | | 91,407 | |
Net investment income | | | 101,936 | |
| |
Realized and unrealized gain (loss) from: | | | | |
Net realized gain (loss) from: | | | | |
Investment securities (net of foreign taxes of $507) | | | (389,841 | ) |
Foreign currencies | | | (5,228 | ) |
Futures contracts | | | 56,069 | |
| | | | (339,000 | ) |
Change in net unrealized appreciation (depreciation) of: | | | | |
Investment securities (net of foreign taxes of $827) | | | 267,105 | |
Foreign currencies | | | (500 | ) |
Futures contracts | | | (31,045 | ) |
| | | | 235,560 | |
Net realized and unrealized gain (loss) | | | (103,440 | ) |
Net increase (decrease) in net assets resulting from operations | | $ | (1,504 | ) |
See accompanying Notes to Financial Statements which are an integral part of the financial statements.
18 Invesco Macro International Equity Fund
Statement of Changes in Net Assets
For the years ended October 31, 2016 and 2015
| | | | | | | | |
| | | 2016 | | | 2015 | |
Operations: | | | | | |
Net investment income | | $ | 101,936 | | | $ | 103,966 | |
Net realized gain (loss) | | | (339,000 | ) | | | (560,404 | ) |
Change in net unrealized appreciation (depreciation) | | | 235,560 | | | | (305,292 | ) |
Net increase (decrease) in net assets resulting from operations | | | (1,504 | ) | | | (761,730 | ) |
| | |
Distributions to shareholders from net investment income: | | | | | | | | |
Class A | | | (37,380 | ) | | | (63,932 | ) |
Class C | | | (487 | ) | | | (323 | ) |
Class R | | | (89 | ) | | | (179 | ) |
Class Y | | | (53,159 | ) | | | (68,456 | ) |
Class R5 | | | (4,525 | ) | | | (19,684 | ) |
Class R6 | | | (4,525 | ) | | | (7,613 | ) |
Total distributions from net investment income | | | (100,165 | ) | | | (160,187 | ) |
| | |
Distributions to shareholders from net realized gains: | | | | | | | | |
Class A | | | — | | | | (19,588 | ) |
Class C | | | — | | | | (127 | ) |
Class R | | | — | | | | (60 | ) |
Class Y | | | — | | | | (18,853 | ) |
Class R5 | | | — | | | | (5,421 | ) |
Class R6 | | | — | | | | (2,096 | ) |
Total distributions from net realized gains | | | — | | | | (46,145 | ) |
| | |
Share transactions-net: | | | | | | | | |
Class A | | | (181,307 | ) | | | 287,744 | |
Class C | | | 16,118 | | | | 64,318 | |
Class Y | | | (29,771 | ) | | | 941,777 | |
Class R5 | | | — | | | | (529,245 | ) |
Net increase (decrease) in net assets resulting from share transactions | | | (194,960 | ) | | | 764,594 | |
Net increase (decrease) in net assets | | | (296,629 | ) | | | (203,468 | ) |
| | |
Net assets: | | | | | | | | |
Beginning of year | | | 7,554,320 | | | | 7,757,788 | |
End of year (includes undistributed net investment income of $87,321 and $79,300, respectively) | | $ | 7,257,691 | | | $ | 7,554,320 | |
Notes to Financial Statements
October 31, 2016
NOTE 1—Significant Accounting Policies
Invesco Macro International Equity Fund (the “Fund”) is a series portfolio of AIM Investment Funds (Invesco Investment Funds) (the “Trust”). The Trust is organized as a Delaware statutory trust and is registered under the Investment Company Act of 1940, as amended (the “1940 Act”), as an open-end series management investment company consisting of twenty-two separate series portfolios, each authorized to issue an unlimited number of shares of beneficial interest. The assets, liabilities and operations of each portfolio are accounted for separately. Information presented in these financial statements pertains only to the Fund. Matters affecting each portfolio or class will be voted on exclusively by the shareholders of such portfolio or class.
The Fund’s investment objective is to provide total return.
The Fund currently consists of six different classes of shares: Class A, Class C, Class R, Class Y, Class R5 and Class R6. Class Y shares are available only to certain investors. Class A shares are sold with a front-end sales charge unless certain waiver criteria are met and under certain circumstances load waived shares may be subject to contingent deferred sales charges (“CDSC”). Class C shares are sold with a CDSC. Class R, Class Y, Class R5 and Class R6 shares are sold at net asset value.
19 Invesco Macro International Equity Fund
The following is a summary of the significant accounting policies followed by the Fund in the preparation of its financial statements.
| A. | Security Valuations — Securities, including restricted securities, are valued according to the following policy. |
A security listed or traded on an exchange (except convertible securities) is valued at its last sales price or official closing price as of the close of the customary trading session on the exchange where the security is principally traded, or lacking any sales or official closing price on a particular day, the security may be valued at the closing bid price on that day. Securities traded in the over-the-counter market are valued based on prices furnished by independent pricing services or market makers. When such securities are valued by an independent pricing service they may be considered fair valued. Futures contracts are valued at the final settlement price set by an exchange on which they are principally traded. Listed options are valued at the mean between the last bid and asked prices from the exchange on which they are principally traded. Options not listed on an exchange are valued by an independent source at the mean between the last bid and asked prices. For purposes of determining net asset value (“NAV”) per share, futures and option contracts generally are valued 15 minutes after the close of the customary trading session of the New York Stock Exchange (“NYSE”).
Investments in open-end and closed-end registered investment companies that do not trade on an exchange are valued at the end-of-day net asset value per share. Investments in open-end and closed-end registered investment companies that trade on an exchange are valued at the last sales price or official closing price as of the close of the customary trading session on the exchange where the security is principally traded.
Debt obligations (including convertible securities) and unlisted equities are fair valued using an evaluated quote provided by an independent pricing service. Evaluated quotes provided by the pricing service may be determined without exclusive reliance on quoted prices, and may reflect appropriate factors such as institution-size trading in similar groups of securities, developments related to specific securities, dividend rate (for unlisted equities), yield (for debt obligations), quality, type of issue, coupon rate (for debt obligations), maturity (for debt obligations), individual trading characteristics and other market data. Debt obligations are subject to interest rate and credit risks. In addition, all debt obligations involve some risk of default with respect to interest and/or principal payments.
Foreign securities’ (including foreign exchange contracts) prices are converted into U.S. dollar amounts using the applicable exchange rates as of the close of the NYSE. If market quotations are available and reliable for foreign exchange-traded equity securities, the securities will be valued at the market quotations. Because trading hours for certain foreign securities end before the close of the NYSE, closing market quotations may become unreliable. If between the time trading ends on a particular security and the close of the customary trading session on the NYSE, events occur that the Adviser determines are significant and make the closing price unreliable, the Fund may fair value the security. If the event is likely to have affected the closing price of the security, the security will be valued at fair value in good faith using procedures approved by the Board of Trustees. Adjustments to closing prices to reflect fair value may also be based on a screening process of an independent pricing service to indicate the degree of certainty, based on historical data, that the closing price in the principal market where a foreign security trades is not the current value as of the close of the NYSE. Foreign securities’ prices meeting the approved degree of certainty that the price is not reflective of current value will be priced at the indication of fair value from the independent pricing service. Multiple factors may be considered by the independent pricing service in determining adjustments to reflect fair value and may include information relating to sector indices, American Depositary Receipts and domestic and foreign index futures. Foreign securities may have additional risks including exchange rate changes, potential for sharply devalued currencies and high inflation, political and economic upheaval, the relative lack of issuer information, relatively low market liquidity and the potential lack of strict financial and accounting controls and standards.
Securities for which market prices are not provided by any of the above methods may be valued based upon quotes furnished by independent sources. The last bid price may be used to value equity securities. The mean between the last bid and asked prices is used to value debt obligations, including corporate loans.
Securities for which market quotations are not readily available or became unreliable are valued at fair value as determined in good faith by or under the supervision of the Trust’s officers following procedures approved by the Board of Trustees. Issuer specific events, market trends, bid/asked quotes of brokers and information providers and other market data may be reviewed in the course of making a good faith determination of a security’s fair value.
The Fund may invest in securities that are subject to interest rate risk, meaning the risk that the prices will generally fall as interest rates rise and, conversely, the prices will generally rise as interest rates fall. Specific securities differ in their sensitivity to changes in interest rates depending on their individual characteristics. Changes in interest rates may result in increased market volatility, which may affect the value and/or liquidity of certain Fund investments.
Valuations change in response to many factors including the historical and prospective earnings of the issuer, the value of the issuer’s assets, general economic conditions, interest rates, investor perceptions and market liquidity. Because of the inherent uncertainties of valuation, the values reflected in the financial statements may materially differ from the value received upon actual sale of those investments.
| B. | Securities Transactions and Investment Income — Securities transactions are accounted for on a trade date basis. Realized gains or losses on sales are computed on the basis of specific identification of the securities sold. Interest income (net of withholding tax, if any) is recorded on the accrual basis from settlement date. Dividend income (net of withholding tax, if any) is recorded on the ex-dividend date. |
The Fund may periodically participate in litigation related to Fund investments. As such, the Fund may receive proceeds from litigation settlements. Any proceeds received are included in the Statement of Operations as realized gain (loss) for investments no longer held and as unrealized gain (loss) for investments still held.
Brokerage commissions and mark ups are considered transaction costs and are recorded as an increase to the cost basis of securities purchased and/or a reduction of proceeds on a sale of securities. Such transaction costs are included in the determination of net realized and unrealized gain (loss) from investment securities reported in the Statement of Operations and the Statement of Changes in Net Assets and the net realized and unrealized gains (losses) on securities per share in the Financial Highlights. Transaction costs are included in the calculation of the Fund’s net asset value and, accordingly, they reduce the Fund’s total returns. These transaction costs are not considered operating expenses and are not reflected in net investment income reported in the Statement of Operations and the Statement of Changes in Net Assets, or the net investment income per share and the ratios of expenses and net investment income reported in the Financial Highlights, nor are they limited by any expense limitation arrangements between the Fund and the investment adviser.
The Fund allocates income and realized and unrealized capital gains and losses to a class based on the relative net assets of each class.
20 Invesco Macro International Equity Fund
| C. | Country Determination — For the purposes of making investment selection decisions and presentation in the Schedule of Investments, the investment adviser may determine the country in which an issuer is located and/or credit risk exposure based on various factors. These factors include the laws of the country under which the issuer is organized, where the issuer maintains a principal office, the country in which the issuer derives 50% or more of its total revenues and the country that has the primary market for the issuer’s securities, as well as other criteria. Among the other criteria that may be evaluated for making this determination are the country in which the issuer maintains 50% or more of its assets, the type of security, financial guarantees and enhancements, the nature of the collateral and the sponsor organization. Country of issuer and/or credit risk exposure has been determined to be the United States of America, unless otherwise noted. |
| D. | Distributions — Distributions from net investment income and net realized capital gain, if any, are generally declared and paid annually and recorded on the ex-dividend date. The Fund may elect to treat a portion of the proceeds from redemptions as distributions for federal income tax purposes. |
| E. | Federal Income Taxes — The Fund intends to comply with the requirements of Subchapter M of the Internal Revenue Code of 1986, as amended (the “Internal Revenue Code”), necessary to qualify as a regulated investment company and to distribute substantially all of the Fund’s taxable earnings to shareholders. As such, the Fund will not be subject to federal income taxes on otherwise taxable income (including net realized capital gain) that is distributed to shareholders. Therefore, no provision for federal income taxes is recorded in the financial statements. |
The Fund recognizes the tax benefits of uncertain tax positions only when the position is more likely than not to be sustained. Management has analyzed the Fund’s uncertain tax positions and concluded that no liability for unrecognized tax benefits should be recorded related to uncertain tax positions. Management is not aware of any tax positions for which it is reasonably possible that the total amounts of unrecognized tax benefits will change materially in the next 12 months.
The Fund files tax returns in the U.S. Federal jurisdiction and certain other jurisdictions. Generally, the Fund is subject to examinations by such taxing authorities for up to three years after the filing of the return for the tax period.
| F. | Expenses — Fees provided for under the Rule 12b-1 plan of a particular class of the Fund are charged to the operations of such class. Transfer agency fees and expenses and other shareholder recordkeeping fees and expenses attributable to Class R5 and Class R6 are allocated to each share class based on relative net assets. Sub-accounting fees attributable to Class R5 are charged to the operations of the class. Transfer agency fees and expenses and other shareholder recordkeeping fees and expenses relating to all other classes are allocated among those classes based on relative net assets. All other expenses are allocated among the classes based on relative net assets. |
| G. | Accounting Estimates — The preparation of financial statements in conformity with accounting principles generally accepted in the United States of America (“GAAP”) requires management to make estimates and assumptions that affect the reported amounts of assets and liabilities at the date of the financial statements and the reported amounts of revenues and expenses during the reporting period including estimates and assumptions related to taxation. Actual results could differ from those estimates by a significant amount. In addition, the Fund monitors for material events or transactions that may occur or become known after the period-end date and before the date the financial statements are released to print. |
| H. | Indemnifications — Under the Trust’s organizational documents, each Trustee, officer, employee or other agent of the Trust is indemnified against certain liabilities that may arise out of the performance of their duties to the Fund. Additionally, in the normal course of business, the Fund enters into contracts, including the Fund’s servicing agreements, that contain a variety of indemnification clauses. The Fund’s maximum exposure under these arrangements is unknown as this would involve future claims that may be made against the Fund that have not yet occurred. The risk of material loss as a result of such indemnification claims is considered remote. |
| I. | Foreign Currency Translations — Foreign currency is valued at the close of the NYSE based on quotations posted by banks and major currency dealers. Portfolio securities and other assets and liabilities denominated in foreign currencies are translated into U.S. dollar amounts at date of valuation. Purchases and sales of portfolio securities (net of foreign taxes withheld on disposition) and income items denominated in foreign currencies are translated into U.S. dollar amounts on the respective dates of such transactions. The Fund does not separately account for the portion of the results of operations resulting from changes in foreign exchange rates on investments and the fluctuations arising from changes in market prices of securities held. The combined results of changes in foreign exchange rates and the fluctuation of market prices on investments (net of estimated foreign tax withholding) are included with the net realized and unrealized gain or loss from investments in the Statement of Operations. Reported net realized foreign currency gains or losses arise from (1) sales of foreign currencies, (2) currency gains or losses realized between the trade and settlement dates on securities transactions, and (3) the difference between the amounts of dividends, interest, and foreign withholding taxes recorded on the Fund’s books and the U.S. dollar equivalent of the amounts actually received or paid. Net unrealized foreign currency gains and losses arise from changes in the fair values of assets and liabilities, other than investments in securities at fiscal period end, resulting from changes in exchange rates. |
The Fund may invest in foreign securities, which may be subject to foreign taxes on income, gains on investments or currency repatriation, a portion of which may be recoverable. Foreign taxes, if any, are recorded based on the tax regulations and rates that exist in the foreign markets in which the Fund invests and are shown in the Statement of Operations.
| J. | Forward Foreign Currency Contracts — The Fund may engage in foreign currency transactions either on a spot (i.e. for prompt delivery and settlement) basis, or through forward foreign currency contracts, to manage or minimize currency or exchange rate risk. |
The Fund may also enter into forward foreign currency contracts for the purchase or sale of a security denominated in a foreign currency in order to “lock in” the U.S. dollar price of that security, or the Fund may also enter into forward foreign currency contracts that do not provide for physical settlement of the two currencies, but instead are settled by a single cash payment calculated as the difference between the agreed upon exchange rate and the spot rate at settlement based upon an agreed upon notional amount (non-deliverable forwards). The Fund will set aside liquid assets in an amount equal to the daily mark-to-market obligation for forward foreign currency contracts.
A forward foreign currency contract is an obligation between two parties (“Counterparties”) to purchase or sell a specific currency for an agreed-upon price at a future date. The use of forward foreign currency contracts does not eliminate fluctuations in the price of the underlying securities the Fund owns or intends to acquire but establishes a rate of exchange in advance. Fluctuations in the value of these contracts are measured by the difference in the contract date and reporting date exchange rates and are recorded as unrealized appreciation (depreciation) until the contracts are closed. When the contracts are closed, realized gains (losses) are recorded. Realized and unrealized gains (losses) on the contracts are included in the Statement of Operations. The primary risks associated with forward foreign currency contracts include failure of the
21 Invesco Macro International Equity Fund
Counterparty to meet the terms of the contract and the value of the foreign currency changing unfavorably. These risks may be in excess of the amounts reflected in the Statement of Assets and Liabilities.
| K. | Futures Contracts — The Fund may enter into futures contracts to manage exposure to interest rate, equity and market price movements and/or currency risks. A futures contract is an agreement between Counterparties to purchase or sell a specified underlying security, currency or commodity (or delivery of a cash settlement price, in the case of an index future) for a fixed price at a future date. The Fund currently invests only in exchange-traded futures and they are standardized as to maturity date and underlying financial instrument. Initial margin deposits required upon entering into futures contracts are satisfied by the segregation of specific securities or cash as collateral at the futures commission merchant (broker). During the period the futures contracts are open, changes in the value of the contracts are recognized as unrealized gains or losses by recalculating the value of the contracts on a daily basis. Subsequent or variation margin payments are received or made depending upon whether unrealized gains or losses are incurred. These amounts are reflected as receivables or payables on the Statement of Assets and Liabilities. When the contracts are closed or expire, the Fund recognizes a realized gain or loss equal to the difference between the proceeds from, or cost of, the closing transaction and the Fund’s basis in the contract. The net realized gain (loss) and the change in unrealized gain (loss) on futures contracts held during the period is included on the Statement of Operations. The primary risks associated with futures contracts are market risk and the absence of a liquid secondary market. If the Fund were unable to liquidate a futures contract and/or enter into an offsetting closing transaction, the Fund would continue to be subject to market risk with respect to the value of the contracts and continue to be required to maintain the margin deposits on the futures contracts. Futures contracts have minimal Counterparty risk since the exchange’s clearinghouse, as Counterparty to all exchange-traded futures, guarantees the futures against default. Risks may exceed amounts recognized in the Statement of Assets and Liabilities. |
| L. | Collateral — To the extent the Fund has designated or segregated a security as collateral and that security is subsequently sold, it is the Fund’s practice to replace such collateral no later than the next business day. |
NOTE 2—Advisory Fees and Other Fees Paid to Affiliates
The Trust has entered into a master investment advisory agreement with Invesco Advisers, Inc. (the “Adviser” or “Invesco”). Under the terms of the investment advisory agreement, the Fund pays an advisory fee to the Adviser based on the annual rate of the Fund’s average daily net assets as follows:
| | | | |
| Average Daily Net Assets | | Rate | |
First $250 million | | | 0.935% | |
Next $250 million | | | 0.910% | |
Next $500 million | | | 0.885% | |
Next $1.5 billion | | | 0.860% | |
Next $2.5 billion | | | 0.835% | |
Next $2.5 billion | | | 0.810% | |
Next $2.5 billion | | | 0.785% | |
Over $10 billion | | | 0.760% | |
For the year ended October 31, 2016, the effective advisory fees incurred by the Fund was 0.935%.
Under the terms of a master sub-advisory agreement between the Adviser and each of Invesco Asset Management Deutschland GmbH, Invesco Asset Management Limited, Invesco Asset Management (Japan) Limited, Invesco Hong Kong Limited, Invesco Senior Secured Management, Inc., Invesco Canada Ltd. and Invesco PowerShares Capital Management LLC (collectively, the “Affiliated Sub-Advisers”) the Adviser, not the Fund, will pay 40% of the fees paid to the Adviser to any such Affiliated Sub-Adviser(s) that provide(s) discretionary investment management services to the Fund based on the percentage of assets allocated to such Affiliated Sub-Adviser(s).
The Adviser has contractually agreed, through at least February 28, 2018, to waive advisory fees and/or reimburse expenses to the extent necessary to limit total annual fund operating expenses after fee waiver and/or expense reimbursement (excluding certain items discussed below) of Class A, Class C, Class R, Class Y, Class R5 and Class R6 shares to 1.43%, 2.18%, 1.68%, 1.18%, 1.18% and 1.18%, respectively, of the Fund’s average daily net assets (the “expense limits”). In determining the Adviser’s obligation to waive advisory fees and/or reimburse expenses, the following expenses are not taken into account, and could cause total annual fund operating expenses after fee waiver and/or expense reimbursement to exceed the numbers reflected above: (1) interest; (2) taxes; (3) dividend expense on short sales; (4) extraordinary or non-routine items, including litigation expenses; and (5) expenses that the Fund has incurred but did not actually pay because of an expense offset arrangement. Unless Invesco continues the fee waiver agreement, it will terminate on February 28, 2018. During its term, the fee waiver agreement cannot be terminated or amended to increase the expense limits without approval of the Board of Trustees.
Further, the Adviser has contractually agreed, through at least June 30, 2018, to waive the advisory fee payable by the Fund in an amount equal to 100% of the net advisory fees the Adviser receives from the affiliated money market funds on investments by the Fund of uninvested cash in such affiliated money market funds.
For the year ended October 31, 2016, the Adviser waived advisory fees and reimbursed fund level expenses of $538,819 and reimbursed class level expenses of $1,458, $41, $4, $1,754, $26 and $26 of Class A, Class C, Class R, Class Y, Class R5 and Class R6 shares, respectively.
The Trust has entered into a master administrative services agreement with Invesco pursuant to which the Fund has agreed to pay Invesco for certain administrative costs incurred in providing accounting services to the Fund. For the year ended October 31, 2016, expenses incurred under the agreement are shown in the Statement of Operations as Administrative services fees.
The Trust has entered into a transfer agency and service agreement with Invesco Investment Services, Inc. (“IIS”) pursuant to which the Fund has agreed to pay IIS a fee for providing transfer agency and shareholder services to the Fund and reimburse IIS for certain expenses incurred by IIS in the course of providing such services. IIS may make payments to intermediaries that provide omnibus account services, sub-accounting services and/or networking services. All fees payable by IIS to intermediaries that provide omnibus account services or sub-accounting are charged back to the Fund,
22 Invesco Macro International Equity Fund
subject to certain limitations approved by the Trust’s Board of Trustees. For the year ended October 31, 2016, expenses incurred under the agreement are shown in the Statement of Operations as Transfer agent fees.
The Trust has entered into master distribution agreements with Invesco Distributors, Inc. (“IDI”) to serve as the distributor for the Class A, Class C, Class R, Class Y, Class R5 and Class R6 shares of the Fund. The Trust has adopted plans pursuant to Rule 12b-1 under the 1940 Act with respect to the Fund’s Class A, Class C and Class R shares (collectively the “Plans”). The Fund, pursuant to the Plans, pays IDI compensation at the annual rate of 0.25% of the Fund’s average daily net assets of Class A shares, 1.00% of the average daily net assets of Class C shares and 0.50% of the average daily net assets of Class R shares. Of the Plan payments, up to 0.25% of the average daily net assets of each class of shares may be paid to furnish continuing personal shareholder services to customers who purchase and own shares of such classes. Any amounts not paid as a service fee under the Plans would constitute an asset-based sales charge. Rules of the Financial Industry Regulatory Authority (“FINRA”) impose a cap on the total sales charges, including asset-based sales charges, that may be paid by any class of shares of the Fund. For the year ended October 31, 2016, expenses incurred under the Plans are shown in the Statement of Operations as Distribution fees.
Front-end sales commissions and CDSC (collectively, the “sales charges”) are not recorded as expenses of the Fund. Front-end sales commissions are deducted from proceeds from the sales of Fund shares prior to investment in Class A shares of the Fund. CDSC are deducted from redemption proceeds prior to remittance to the shareholder. During the year ended October 31, 2016, IDI advised the Fund that IDI retained $84 in front-end sales commissions from the sale of Class A shares.
Certain officers and trustees of the Trust are officers and directors of the Adviser, IIS and/or IDI.
NOTE 3—Additional Valuation Information
GAAP defines fair value as the price that would be received to sell an asset or paid to transfer a liability in an orderly transaction between market participants at the measurement date, under current market conditions. GAAP establishes a hierarchy that prioritizes the inputs to valuation methods, giving the highest priority to readily available unadjusted quoted prices in an active market for identical assets (Level 1) and the lowest priority to significant unobservable inputs (Level 3), generally when market prices are not readily available or are unreliable. Based on the valuation inputs, the securities or other investments are tiered into one of three levels. Changes in valuation methods may result in transfers in or out of an investment’s assigned level:
| | Level 1 — | Prices are determined using quoted prices in an active market for identical assets. |
| | Level 2 — | Prices are determined using other significant observable inputs. Observable inputs are inputs that other market participants may use in pricing a security. These may include quoted prices for similar securities, interest rates, prepayment speeds, credit risk, yield curves, loss severities, default rates, discount rates, volatilities and others. |
| | Level 3 — | Prices are determined using significant unobservable inputs. In situations where quoted prices or observable inputs are unavailable (for example, when there is little or no market activity for an investment at the end of the period), unobservable inputs may be used. Unobservable inputs reflect the Fund’s own assumptions about the factors market participants would use in determining fair value of the securities or instruments and would be based on the best available information. |
The following is a summary of the tiered valuation input levels, as of October 31, 2016. The level assigned to the securities valuations may not be an indication of the risk or liquidity associated with investing in those securities. Because of the inherent uncertainties of valuation, the values reflected in the financial statements may materially differ from the value received upon actual sale of those investments.
During the year ended October 31, 2016, there were transfers from Level 1 to Level 2 of $643,584 and from Level 2 to Level 1 of $1,598,786, due to foreign fair value adjustments.
| | | | | | | | | | | | | | | | |
| | | Level 1 | | | Level 2 | | | Level 3 | | | Total | |
Australia | | $ | 67,660 | | | $ | 625,321 | | | $ | — | | | $ | 692,981 | |
Austria | | | 12,889 | | | | — | | | | — | | | | 12,889 | |
Belgium | | | 24,715 | | | | 5,138 | | | | — | | | | 29,853 | |
Brazil | | | 25,432 | | | | — | | | | — | | | | 25,432 | |
Chile | | | 25,296 | | | | 42,477 | | | | — | | | | 67,773 | |
China | | | 52,539 | | | | 50,086 | | | | — | | | | 102,625 | |
Colombia | | | 11,291 | | | | — | | | | — | | | | 11,291 | |
Czech Republic | | | 5,678 | | | | 5,760 | | | | — | | | | 11,438 | |
Denmark | | | 54,728 | | | | 15,113 | | | | — | | | | 69,841 | |
Finland | | | 37,014 | | | | — | | | | — | | | | 37,014 | |
France | | | 154,500 | | | | 130,738 | | | | — | | | | 285,238 | |
Germany | | | 208,581 | | | | 10,607 | | | | — | | | | 219,188 | |
Hong Kong | | | 212,503 | | | | 154,497 | | | | — | | | | 367,000 | |
Hungary | | | 14,040 | | | | 6,471 | | | | — | | | | 20,511 | |
India | | | 19,721 | | | | — | | | | — | | | | 19,721 | |
Indonesia | | | 5,454 | | | | 18,698 | | | | — | | | | 24,152 | |
Ireland | | | 10,683 | | | | 38,134 | | | | — | | | | 48,817 | |
Italy | | | 6,292 | | | | 53,385 | | | | — | | | | 59,677 | |
Japan | | | 559,752 | | | | 731,351 | | | | — | | | | 1,291,103 | |
Luxembourg | | | — | | | | 13,606 | | | | — | | | | 13,606 | |
Malaysia | | | 145,411 | | | | 48,680 | | | | — | | | | 194,091 | |
23 Invesco Macro International Equity Fund
| | | | | | | | | | | | | | | | |
| | | Level 1 | | | Level 2 | | | Level 3 | | | Total | |
Mexico | | $ | 150,650 | | | $ | — | | | $ | — | | | $ | 150,650 | |
Netherlands | | | 43,334 | | | | 54,875 | | | | — | | | | 98,209 | |
New Zealand | | | 48,498 | | | | — | | | | — | | | | 48,498 | |
Norway | | | 17,040 | | | | 16,841 | | | | — | | | | 33,881 | |
Philippines | | | 54,630 | | | | 6,286 | | | | — | | | | 60,916 | |
Poland | | | 17,078 | | | | — | | | | — | | | | 17,078 | |
Portugal | | | 6,002 | | | | — | | | | — | | | | 6,002 | |
Qatar | | | 12,736 | | | | — | | | | — | | | | 12,736 | |
Russia | | | 5,344 | | | | — | | | | — | | | | 5,344 | |
Singapore | | | 75,757 | | | | 91,367 | | | | — | | | | 167,124 | |
South Africa | | | 19,529 | | | | — | | | | — | | | | 19,529 | |
South Korea | | | 27,383 | | | | 105,975 | | | | — | | | | 133,358 | |
Spain | | | 55,611 | | | | 44,047 | | | | — | | | | 99,658 | |
Sweden | | | 23,495 | | | | 94,000 | | | | — | | | | 117,495 | |
Switzerland | | | 91,848 | | | | 146,671 | | | | — | | | | 238,519 | |
Taiwan | | | 128,281 | | | | 177,521 | | | | — | | | | 305,802 | |
Thailand | | | 70,400 | | | | 67,054 | | | | — | | | | 137,454 | |
Turkey | | | — | | | | 26,825 | | | | — | | | | 26,825 | |
United Arab Emirates | | | 5,572 | | | | — | | | | — | | | | 5,572 | |
United Kingdom | | | 182,420 | | | | 959,377 | | | | — | | | | 1,141,797 | |
United States | | | 13,214 | | | | 24,899 | | | | — | | | | 38,113 | |
Money Market Funds | | | 633,999 | | | | — | | | | — | | | | 633,999 | |
| | | | 3,337,000 | | | | 3,765,800 | | | | — | | | | 7,102,800 | |
Futures Contracts* | | | 4,275 | | | | — | | | | — | | | | 4,275 | |
Total Investments | | $ | 3,341,275 | | | $ | 3,765,800 | | | $ | — | | | $ | 7,107,075 | |
| * | Unrealized appreciation. |
NOTE 4—Derivative Investments
Value of Derivative Investments at Period-End
The Fund may enter into an International Swaps and Derivatives Association Master Agreement (“ISDA Master Agreement”) under which a Fund may trade OTC derivatives. An OTC transaction entered into under an ISDA Master Agreement typically involves a collateral posting arrangement, payment netting provisions and close-out netting provisions. These netting provisions allow for reduction of credit risk through netting of contractual obligations. The enforceability of the netting provisions of the ISDA Master Agreement depends on the governing law of the ISDA Master Agreement, among other factors.
For financial reporting purposes, the Fund does not offset OTC derivative assets or liabilities that are subject to ISDA Master Agreements in the Statement of Assets and Liabilities.
The table below summarizes the value of the Fund’s derivative investments, detailed by primary risk exposure, held as of October 31, 2016:
| | | | |
| | | Value | |
| Derivative Assets | | Equity Risk | |
Unrealized appreciation on futures contracts — Exchange-Traded(a) | | $ | 28,744 | |
Derivatives not subject to master netting agreements | | | (28,744 | ) |
Total Derivative Assets subject to master netting agreements | | $ | — | |
| | | | |
| | | Value | |
| Derivative Liabilities | | Equity Risk | |
Unrealized depreciation on futures contracts — Exchange-Traded(a) | | $ | (24,469 | ) |
Derivatives not subject to master netting agreements | | | 24,469 | |
Total Derivative Liabilities subject to master netting agreements | | $ | — | |
| (a) | Includes cumulative appreciation (depreciation) on futures contracts. Only current day’s variation margin receivable is reported within the Statement of Assets and Liabilities. |
24 Invesco Macro International Equity Fund
Effect of Derivative Investments for the year ended October 31, 2016
The table below summarizes the gains (losses) on derivative investments, detailed by primary risk exposure, recognized in earnings during the period:
| | | | |
| | | Location of Gain (Loss) on
Statement of Operations | |
| | | Equity Risk | |
Realized Gain: | | | | |
Futures contracts | | $ | 56,069 | |
Change in Net Unrealized Appreciation (Depreciation): | | | | |
Futures contracts | | | (31,045 | ) |
Total | | $ | 25,024 | |
The table below summarizes the average notional value of futures contracts outstanding during the period.
| | | | |
| | | Futures Contracts | |
Average notional value | | $ | 1,743,798 | |
| | | | | | | | | | | | | | | | | | | | |
| Open Futures Contracts(a) | |
| Futures Contracts | | Type of
Contract | | | Number of
Contracts | | | Expiration Month | | | Notional
Value | | | Unrealized
Appreciation
(Depreciation) | |
Dow Jones EURO STOXX 50 Index | | | Long | | | | 10 | | | | December–2016 | | | $ | 335,143 | | | $ | 6,282 | |
FTSE 100 Index | | | Long | | | | 3 | | | | December–2016 | | | | 254,931 | | | | 11,262 | |
Hang Seng Index | | | Long | | | | 2 | | | | November–2016 | | | | 295,341 | | | | (6,888 | ) |
Mini MSCI Emerging Markets Index | | | Long | | | | 15 | | | | December–2016 | | | | 677,525 | | | | (17,581 | ) |
Tokyo Stock Price Index | | | Long | | | | 2 | | | | December–2016 | | | | 266,056 | | | | 11,200 | |
Total Futures Contracts — Equity Risk | | | | | | | | | | | | | | | | | | $ | 4,275 | |
| (a) | Futures contracts collateralized by $124,000 cash held with Goldman Sachs & Co., the futures commission merchant. |
NOTE 5—Trustees’ and Officers’ Fees and Benefits
Trustees’ and Officers’ Fees and Benefits include amounts accrued by the Fund to pay remuneration to certain Trustees and Officers of the Fund. Trustees have the option to defer compensation payable by the Fund, and Trustees’ and Officers’ Fees and Benefits also include amounts accrued by the Fund to fund such deferred compensation amounts. Those Trustees who defer compensation have the option to select various Invesco Funds in which their deferral accounts shall be deemed to be invested. Obligations under the deferred compensation plan represent unsecured claims against the general assets of the Fund.
NOTE 6—Cash Balances
The Fund is permitted to temporarily carry a negative or overdrawn balance in its account with State Street Bank and Trust Company, the custodian bank. Such balances, if any at period-end, are shown in the Statement of Assets and Liabilities under the payable caption Amount due custodian. To compensate the custodian bank for such overdrafts, the overdrawn Fund may either (1) leave funds as a compensating balance in the account so the custodian bank can be compensated by earning the additional interest; or (2) compensate by paying the custodian bank at a rate agreed upon by the custodian bank and Invesco, not to exceed the contractually agreed upon rate.
NOTE 7—Distributions to Shareholders and Tax Components of Net Assets
Tax Character of Distributions to Shareholders Paid During the Fiscal Years Ended October 31, 2016 and 2015:
| | | | | | | | |
| | | 2016 | | | 2015 | |
Ordinary income | | $ | 100,165 | | | $ | 200,246 | |
Long-term capital gain | | | — | | | | 6,086 | |
Total distributions | | $ | 100,165 | | | $ | 206,332 | |
Tax Components of Net Assets at Period-End:
| | | | |
| | | 2016 | |
Undistributed ordinary income | | $ | 109,320 | |
Net unrealized appreciation (depreciation) — investments | | | (208,551 | ) |
Net unrealized appreciation — other investments | | | 3,712 | |
Temporary book/tax differences | | | (45,005 | ) |
Capital loss carryforward | | | (770,478 | ) |
Shares of beneficial interest | | | 8,168,693 | |
Total net assets | | $ | 7,257,691 | |
25 Invesco Macro International Equity Fund
The difference between book-basis and tax-basis unrealized appreciation (depreciation) is due to differences in the timing of recognition of gains and losses on investments for tax and book purposes. The Fund’s net unrealized appreciation (depreciation) difference is attributable primarily to wash sales and passive foreign investment companies.
The temporary book/tax differences are a result of timing differences between book and tax recognition of income and/or expenses. The Fund’s temporary book/tax differences are the result of the trustee deferral of compensation and retirement plan benefits.
Capital loss carryforward is calculated and reported as of a specific date. Results of transactions and other activity after that date may affect the amount of capital loss carryforward actually available for the Fund to utilize. The ability to utilize capital loss carryforward in the future may be limited under the Internal Revenue Code and related regulations based on the results of future transactions.
The Fund has a capital loss carryforward as of October 31, 2016, as follows:
| | | | |
| Capital Loss Carryforward* | |
| Expiration | | Total | |
Not subject to expiration | | $ | 770,478 | |
| * | Capital loss carryforward as of the date listed above is reduced for limitations, if any, to the extent required by the Internal Revenue Code and may be further limited depending upon a variety of factors, including the realization of net unrealized gains or losses as of the date of any reorganization. |
NOTE 8—Investment Securities
The aggregate amount of investment securities (other than short-term securities, U.S. Treasury obligations and money market funds, if any) purchased and sold by the Fund during the year ended October 31, 2016 was $3,293,184 and $3,527,459, respectively. Cost of investments on a tax basis includes the adjustments for financial reporting purposes as of the most recently completed federal income tax reporting period-end.
| | | | |
| Unrealized Appreciation (Depreciation) of Investment Securities on a Tax Basis | |
Aggregate unrealized appreciation of investment securities | | $ | 491,954 | |
Aggregate unrealized (depreciation) of investment securities | | | (700,505 | ) |
Net unrealized appreciation (depreciation) of investment securities | | $ | (208,551 | ) |
Cost of investments for tax purposes is $7,311,351.
NOTE 9—Reclassification of Permanent Differences
Primarily as a result of differing book/tax treatment of foreign currency transactions and passive foreign investment companies, on October 31, 2016, undistributed net investment income was increased by $6,250, undistributed net realized gain (loss) was decreased by $6,354 and shares of beneficial interest was increased by $104. This reclassification had no effect on the net assets of the Fund.
NOTE 10—Share Information
| | | | | | | | | | | | | | | | |
| | | Summary of Share Activity | |
| | | Years ended October 31, | |
| | | 2016(a) | | | 2015 | |
| | | Shares | | | Amount | | | Shares | | | Amount | |
Sold: | | | | | | | | | | | | | | | | |
Class A | | | 16,268 | | | $ | 141,818 | | | | 76,956 | | | $ | 787,039 | |
Class C | | | 1,925 | | | | 16,204 | | | | 6,508 | | | | 64,463 | |
Class Y | | | 1 | | | | 9 | | | | 114,771 | | | | 1,130,479 | |
| | | | |
Issued as reinvestment of dividends: | | | | | | | | | | | | | | | | |
Class A | | | 495 | | | | 4,074 | | | | 351 | | | | 3,272 | |
Class C | | | 53 | | | | 430 | | | | 25 | | | | 237 | |
Class Y | | | 1,524 | | | | 12,558 | | | | 22 | | | | 205 | |
Class R5 | | | — | | | | — | | | | 1,650 | | | | 15,396 | |
| | | | |
Reacquired: | | | | | | | | | | | | | | | | |
Class A | | | (38,265 | ) | | | (327,199 | ) | | | (50,570 | ) | | | (502,567 | ) |
Class C | | | (62 | ) | | | (516 | ) | | | (37 | ) | | | (382 | ) |
Class Y | | | (4,995 | ) | | | (42,338 | ) | | | (18,408 | ) | | | (188,907 | ) |
Class R5 | | | — | | | | — | | | | (57,150 | ) | | | (544,641 | ) |
Net increase (decrease) in share activity | | | (23,056 | ) | | $ | (194,960 | ) | | | 74,118 | | | $ | 764,594 | |
| (a) | There is an entity that is a record owner of more than 5% of the outstanding shares of the Fund and owns 6% of the outstanding shares of the Fund. IDI has an agreement with this entity to sell Fund shares. The Fund, Invesco and/or Invesco affiliates may make payments to this entity, which is considered to be related to the Fund, for providing services to the Fund, Invesco and/or Invesco affiliates including but not limited to services such as securities brokerage, distribution, third party record keeping and account servicing. The Fund has no knowledge as to whether all or any portion of the shares owned of record by this entity are also owned beneficially. |
| | In addition, 91% of the outstanding shares of the Fund are owned by the Adviser or an affiliate of the Adviser. |
26 Invesco Macro International Equity Fund
NOTE 11—Financial Highlights
The following schedule presents financial highlights for a share of the Fund outstanding throughout the periods indicated.
| | | | | | | | | | | | | | | | | | | | | | | | | | | | | | | | | | | | | | | | | | | | | | | | | | | | | | | | |
| | | Net asset
value,
beginning
of period | | | Net
investment
income(a) | | | Net gains
(losses)
on securities
(both
realized and
unrealized) | | | Total from
investment
operations | | | Dividends
from net
investment
income | | | Distributions
from net
realized
gains | | | Total
distributions | | | Net asset
value, end
of period | | | Total
return(b) | | | Net assets,
end of period
(000’s omitted) | | | Ratio of
expenses
to average
net assets
with fee waivers
and/or expenses
absorbed | | | Ratio of
expenses
to average net
assets without
fee waivers
and/or expenses
absorbed | | | Ratio of net
investment
income
to average
net assets | | | Portfolio
turnover(c) | |
Class A | |
Year ended 10/31/16 | | $ | 9.01 | | | $ | 0.11 | | | $ | (0.11 | ) | | $ | 0.00 | | | $ | (0.11 | ) | | $ | — | | | $ | (0.11 | ) | | $ | 8.90 | | | | 0.05 | % | | $ | 2,895 | | | | 1.42 | %(d) | | | 9.03 | %(d) | | | 1.29 | %(d) | | | 51 | % |
Year ended 10/31/15 | | | 10.15 | | | | 0.12 | | | | (1.00 | ) | | | (0.88 | ) | | | (0.20 | ) | | | (0.06 | ) | | | (0.26 | ) | | | 9.01 | | | | (8.80 | ) | | | 3,123 | | | | 1.42 | | | | 9.00 | | | | 1.18 | | | | 53 | |
Year ended 10/31/14(e) | | | 10.00 | | | | 0.12 | | | | 0.03 | | | | 0.15 | | | | — | | | | — | | | | — | | | | 10.15 | | | | 1.50 | | | | 3,247 | | | | 1.42 | (f) | | | 8.20 | (f) | | | 1.29 | (f) | | | 45 | |
Class C | | | | | | | | | | | | | | | | | | | | | | | | | | | | | | | | | | | | | | | | | | | | | | | | | | | | | | | | |
Year ended 10/31/16 | | | 8.92 | | | | 0.05 | | | | (0.11 | ) | | | (0.06 | ) | | | (0.06 | ) | | | — | | | | (0.06 | ) | | | 8.80 | | | | (0.66 | ) | | | 92 | | | | 2.17 | (d) | | | 9.78 | (d) | | | 0.54 | (d) | | | 51 | |
Year ended 10/31/15 | | | 10.09 | | | | 0.04 | | | | (1.00 | ) | | | (0.96 | ) | | | (0.15 | ) | | | (0.06 | ) | | | (0.21 | ) | | | 8.92 | | | | (9.58 | ) | | | 76 | | | | 2.17 | | | | 9.75 | | | | 0.43 | | | | 53 | |
Year ended 10/31/14(e) | | | 10.00 | | | | 0.05 | | | | 0.04 | | | | 0.09 | | | | — | | | | — | | | | — | | | | 10.09 | | | | 0.90 | | | | 21 | | | | 2.17 | (f) | | | 8.95 | (f) | | | 0.54 | (f) | | | 45 | |
Class R | |
Year ended 10/31/16 | | | 8.98 | | | | 0.09 | | | | (0.11 | ) | | | (0.02 | ) | | | (0.09 | ) | | | — | | | | (0.09 | ) | | | 8.87 | | | | (0.16 | ) | | | 9 | | | | 1.67 | (d) | | | 9.28 | (d) | | | 1.04 | (d) | | | 51 | |
Year ended 10/31/15 | | | 10.13 | | | | 0.09 | | | | (1.00 | ) | | | (0.91 | ) | | | (0.18 | ) | | | (0.06 | ) | | | (0.24 | ) | | | 8.98 | | | | (9.08 | ) | | | 9 | | | | 1.67 | | | | 9.25 | | | | 0.93 | | | | 53 | |
Year ended 10/31/14(e) | | | 10.00 | | | | 0.09 | | | | 0.04 | | | | 0.13 | | | | — | | | | — | | | | — | | | | 10.13 | | | | 1.30 | | | | 10 | | | | 1.67 | (f) | | | 8.45 | (f) | | | 1.04 | (f) | | | 45 | |
Class Y | |
Year ended 10/31/16 | | | 9.03 | | | | 0.13 | | | | (0.11 | ) | | | 0.02 | | | | (0.13 | ) | | | — | | | | (0.13 | ) | | | 8.92 | | | | 0.33 | | | | 3,638 | | | | 1.17 | (d) | | | 8.78 | (d) | | | 1.54 | (d) | | | 51 | |
Year ended 10/31/15 | | | 10.17 | | | | 0.14 | | | | (1.00 | ) | | | (0.86 | ) | | | (0.22 | ) | | | (0.06 | ) | | | (0.28 | ) | | | 9.03 | | | | (8.57 | ) | | | 3,714 | | | | 1.17 | | | | 8.75 | | | | 1.43 | | | | 53 | |
Year ended 10/31/14(e) | | | 10.00 | | | | 0.14 | | | | 0.03 | | | | 0.17 | | | | — | | | | — | | | | — | | | | 10.17 | | | | 1.70 | | | | 3,202 | | | | 1.17 | (f) | | | 7.95 | (f) | | | 1.54 | (f) | | | 45 | |
Class R5 | |
Year ended 10/31/16 | | | 9.03 | | | | 0.13 | | | | (0.11 | ) | | | 0.02 | | | | (0.13 | ) | | | — | | | | (0.13 | ) | | | 8.92 | | | | 0.33 | | | | 312 | | | | 1.17 | (d) | | | 8.74 | (d) | | | 1.54 | (d) | | | 51 | |
Year ended 10/31/15 | | | 10.18 | | | | 0.14 | | | | (1.01 | ) | | | (0.87 | ) | | | (0.22 | ) | | | (0.06 | ) | | | (0.28 | ) | | | 9.03 | | | | (8.66 | ) | | | 316 | | | | 1.17 | | | | 8.71 | | | | 1.43 | | | | 53 | |
Year ended 10/31/14(e) | | | 10.00 | | | | 0.14 | | | | 0.04 | | | | 0.18 | | | | — | | | | — | | | | — | | | | 10.18 | | | | 1.80 | | | | 921 | | | | 1.17 | (f) | | | 7.92 | (f) | | | 1.54 | (f) | | | 45 | |
Class R6 | |
Year ended 10/31/16 | | | 9.03 | | | | 0.13 | | | | (0.11 | ) | | | 0.02 | | | | (0.13 | ) | | | — | | | | (0.13 | ) | | | 8.92 | | | | 0.33 | | | | 312 | | | | 1.17 | (d) | | | 8.74 | (d) | | | 1.54 | (d) | | | 51 | |
Year ended 10/31/15 | | | 10.17 | | | | 0.14 | | | | (1.00 | ) | | | (0.86 | ) | | | (0.22 | ) | | | (0.06 | ) | | | (0.28 | ) | | | 9.03 | | | | (8.57 | ) | | | 316 | | | | 1.17 | | | | 8.71 | | | | 1.43 | | | | 53 | |
Year ended 10/31/14(e) | | | 10.00 | | | | 0.14 | | | | 0.03 | | | | 0.17 | | | | — | | | | — | | | | — | | | | 10.17 | | | | 1.70 | | | | 356 | | | | 1.17 | (f) | | | 7.92 | (f) | | | 1.54 | (f) | | | 45 | |
| (a) | Calculated using average shares outstanding. |
| (b) | Includes adjustments in accordance with accounting principles generally accepted in the United States of America and as such, the net asset value for financial reporting purposes and the returns based upon those net asset values may differ from the net asset value and returns for shareholder transactions. Does not include sales charges and is not annualized for periods less than one year, if applicable. |
| (c) | Portfolio turnover is calculated at the fund level and is not annualized for periods less than one year, if applicable. |
| (d) | Ratios are based on average daily net assets (000’s omitted) of $2,920, $83, $9, $3,514, $300 and $300 for Class A, Class C, Class R, Class Y, Class R5 and Class R6 shares, respectively. |
| (e) | Commencement date of December 17, 2013. |
27 Invesco Macro International Equity Fund
Report of Independent Registered Public Accounting Firm
To the Board of Trustees and Shareholders of the Invesco Macro International Equity Fund:
In our opinion, the accompanying statement of assets and liabilities, including the schedule of investments, and the related statements of operations and of changes in net assets and the financial highlights present fairly, in all material respects, the financial position of the Invesco Macro International Equity Fund (the “Fund”) as of October 31, 2016, the results of its operations for the year then ended, the changes in its net assets for each of the two years in the period then ended and the financial highlights for each of the two years in the period then ended and for the period December 17, 2013 (commencement of operations) through October 31, 2014, in conformity with accounting principles generally accepted in the United States of America. These financial statements and financial highlights (hereafter referred to as “financial statements”) are the responsibility of the Fund’s management. Our responsibility is to express an opinion on these financial statements based on our audits. We conducted our audits of these financial statements in accordance with the standards of the Public Company Accounting Oversight Board (United States). Those standards require that we plan and perform the audit to obtain reasonable assurance about whether the financial statements are free of material misstatement. An audit includes examining, on a test basis, evidence supporting the amounts and disclosures in the financial statements, assessing the accounting principles used and significant estimates made by management, and evaluating the overall financial statement presentation. We believe that our audits, which included confirmation of securities as of October 31, 2016 by correspondence with the custodian and brokers, and the application of alternative auditing procedures where confirmation of security purchases have not been received, provide a reasonable basis for our opinion.
PRICEWATERHOUSECOOPERS LLP
Houston, Texas
December 21, 2016
28 Invesco Macro International Equity Fund
Calculating your ongoing Fund expenses
Example
As a shareholder of the Fund, you incur two types of costs: (1) transaction costs, which may include sales charges (loads) on purchase payments or contingent deferred sales charges on redemptions, if any; and (2) ongoing costs, including management fees, distribution and/or service (12b-1) fees, and other Fund expenses. This example is intended to help you understand your ongoing costs (in dollars) of investing in the Fund and to compare these costs with ongoing costs of investing in other mutual funds. The example is based on an investment of $1,000 invested at the beginning of the period and held for the entire period May 1, 2016 through October 31, 2016.
Actual expenses
The table below provides information about actual account values and actual expenses. You may use the information in this table, together with the amount you invested, to estimate the expenses that you paid over the period. Simply divide your account value by $1,000 (for example, an $8,600 account value divided by $1,000 = 8.6), then multiply the result by the number in the table under the heading entitled “Actual Expenses Paid During Period” to estimate the expenses you paid on your account during this period.
Hypothetical example for comparison purposes
The table below also provides information about hypothetical account values and hypothetical expenses based on the Fund’s actual expense ratio and an assumed rate of return of 5% per year before expenses, which is not the Fund’s actual return.
The hypothetical account values and expenses may not be used to estimate the actual ending account balance or expenses you paid for the period. You may use this information to compare the ongoing costs of investing in the Fund and other funds. To do so, compare this 5% hypothetical example with the 5% hypothetical examples that appear in the shareholder reports of the other funds.
Please note that the expenses shown in the table are meant to highlight your ongoing costs only and do not reflect any transaction costs, such as sales charges (loads) on purchase payments or contingent deferred sales charges on redemptions, if any. Therefore, the hypothetical information is useful in comparing ongoing costs only, and will not help you determine the relative total costs of owning different funds. In addition, if these transaction costs were included, your costs would have been higher.
| | | | | | | | | | | | | | | | | | | | | | | | |
| Class | | Beginning
Account Value
(05/01/16) | | | Actual | | | HYPOTHETICAL (5% annual return before
expenses) | | | Annualized
Expense
Ratio | |
| | | Ending
Account Value
(10/31/16)1 | | | Expenses
Paid During
Period2 | | | Ending
Account Value
(10/31/16) | | | Expenses
Paid During
Period2 | | |
| A | | $ | 1,000.00 | | | $ | 1,025.30 | | | $ | 7.23 | | | $ | 1,018.00 | | | $ | 7.20 | | | | 1.42 | % |
| C | | | 1,000.00 | | | | 1,020.90 | | | | 11.02 | | | | 1,014.23 | | | | 10.99 | | | | 2.17 | |
| R | | | 1,000.00 | | | | 1,024.20 | | | | 8.50 | | | | 1,016.74 | | | | 8.47 | | | | 1.67 | |
| Y | | | 1,000.00 | | | | 1,026.50 | | | | 5.96 | | | | 1,019.25 | | | | 5.94 | | | | 1.17 | |
| R5 | | | 1,000.00 | | | | 1,027.60 | | | | 5.96 | | | | 1,019.25 | | | | 5.94 | | | | 1.17 | |
| R6 | | | 1,000.00 | | | | 1,026.50 | | | | 5.96 | | | | 1,019.25 | | | | 5.94 | | | | 1.17 | |
| 1 | The actual ending account value is based on the actual total return of the Fund for the period May 1, 2016 through October 31, 2016, after actual expenses and will differ from the hypothetical ending account value which is based on the Fund’s expense ratio and a hypothetical annual return of 5% before expenses. |
| 2 | Expenses are equal to the Fund’s annualized expense ratio as indicated above multiplied by the average account value over the period, multiplied by 184/366 to reflect the most recent fiscal half year. |
29 Invesco Macro International Equity Fund
Approval of Investment Advisory and Sub-Advisory Contracts
The Board of Trustees (the Board) of AIM Investment Funds (Invesco Investment Funds) is required under the Investment Company Act of 1940, as amended, to approve annually the renewal of Invesco Macro International Equity Fund’s (the Fund) investment advisory agreements. During contract renewal meetings held on June 7-8, 2016, the Board as a whole, and the disinterested or “independent” Trustees, who comprise over 75% of the Board, voting separately, approved the continuance for the Fund of the Master Investment Advisory Agreement with Invesco Advisers, Inc. (Invesco Advisers and the investment advisory agreement) and the Master Intergroup Sub-Advisory Contract for Mutual Funds with Invesco Asset Management Deutschland GmbH, Invesco Asset Management Limited, Invesco Asset Management (Japan) Limited, Invesco Hong Kong Limited, Invesco Senior Secured Management, Inc., Invesco Canada Ltd. and Invesco PowerShares Capital Management LLC (collectively, the Affiliated Sub-Advisers and the sub-advisory contracts) for another year, effective July 1, 2016.
In evaluating the fairness and reasonableness of compensation under the Fund’s investment advisory agreement and sub-advisory contracts, the Board considered, among other things, the factors discussed below. The Board determined that continuation of the Fund’s investment advisory agreement and the sub-advisory contracts is in the best interest of the Fund and its shareholders and that the compensation payable to Invesco Advisers and the Affiliated Sub-Advisers under the agreements is fair and reasonable.
The Board’s Fund Evaluation Process
The Board’s Investments Committee has established three Sub-Committees, which meet throughout the year to review the performance of funds advised by Invesco Advisers (the Invesco Funds). Over the course of each year, the Sub-Committees meet with portfolio managers for their assigned Invesco Funds and other members of management to review the performance, investment objective(s), policies, strategies, limitations and investment risks of these funds. The Board had the benefit of reports from the Sub-Committees and Investments Committee throughout the year in considering approval of the continuance of each Invesco Fund’s investment advisory agreement and sub-advisory contracts for another year.
During the contract renewal process, the Board receives comparative performance and fee data regarding the Invesco Funds prepared by Invesco Advisers and Broadridge Financial Solutions, Inc. (Broadridge), an independent provider of investment company data. The Board also receives an independent written evaluation from the Senior Officer, an officer of the Invesco Funds who reports directly to the
independent Trustees. The Senior Officer’s evaluation is prepared as part of his responsibility to manage the process by which the Invesco Funds’ proposed management fees are negotiated during the annual contract renewal process to ensure they are negotiated in a manner that is at arms’ length and reasonable. In addition to meetings with Invesco Advisers and fund counsel, the independent Trustees also discuss the continuance of the investment advisory agreement and sub-advisory contracts in separate sessions with the Senior Officer and with independent legal counsel.
The Trustees recognized that the advisory fee rates for the Invesco Funds are, in many cases, the result of years of review and negotiation. The Trustees’ deliberations and conclusions in a particular year may be based in part on their deliberations and conclusions regarding these same arrangements throughout the year and in prior years. The Trustees’ review and conclusions are based on the comprehensive consideration of all information presented to them and are not the result of any single determinative factor. Moreover, one Trustee may have weighed a particular piece of information or factor differently than another Trustee.
The discussion below is a summary of the Senior Officer’s independent written evaluation with respect to the Fund’s investment advisory agreement as well as a discussion of the material factors and related conclusions that formed the basis for the Board’s approval of the Fund’s investment advisory agreement and sub-advisory contracts. Unless otherwise stated, this information is current as of June 8, 2016, and does not reflect consideration of factors that became known to the Board after that date.
Factors and Conclusions and Summary of Independent Written Fee Evaluation
| A. | Nature, Extent and Quality of Services Provided by Invesco Advisers and the Affiliated Sub-Advisers |
The Board reviewed the advisory services provided to the Fund by Invesco Advisers under the Fund’s investment advisory agreement, the performance of Invesco Advisers in providing these services, and the credentials and experience of the officers and employees of Invesco Advisers who provide these services, including the Fund’s portfolio manager or managers. The Board’s review of the qualifications of Invesco Advisers to provide advisory services included the Board’s consideration of Invesco Advisers’ investment process oversight, independent credit analysis and investment risk management. The Board also considered non-advisory services that Invesco Advisers and its affiliates provide to the Invesco Funds such as various back office
support functions, trading operations, internal audit, valuation and legal and compliance.
In determining whether to continue the Fund’s investment advisory agreement, the Board considered the benefits of reapproving an existing relationship and the greater uncertainty that may be associated with entering into a new relationship. The Board concluded that the nature, extent and quality of the services provided to the Fund by Invesco Advisers are appropriate and satisfactory and consistent with the terms of the Fund’s investment advisory agreement.
The Board reviewed the services that may be provided by the Affiliated Sub-Advisers under the sub-advisory contracts and the credentials and experience of the officers and employees of the Affiliated Sub-Advisers who provide these services. The Board noted that the Affiliated Sub-Advisers have offices and personnel that are located in financial centers around the world. As a result, the Board noted that the Affiliated Sub-Advisers can provide research and investment analysis on the markets and economies of various countries in which the Fund may invest, make recommendations regarding securities and assist with security trades. The Board concluded that the sub-advisory contracts may benefit the Fund and its shareholders by permitting Invesco Advisers to use the resources and talents of the Affiliated Sub-Advisers in managing the Fund. The Board concluded that the nature, extent and quality of the services that may be provided by the Affiliated Sub-Advisers are appropriate and satisfactory and consistent with the terms of the Fund’s sub-advisory contracts.
The Board considered Fund performance as a relevant factor in considering whether to approve the investment advisory agreement. The Board did not view Fund performance as a relevant factor in considering whether to approve the sub-advisory contracts for the Fund, as no Affiliated Sub-Adviser currently manages assets of the Fund.
The Board noted that the Fund recently began operations and that comparative performance data for only the past two calendar years was available. The Board compared the Fund’s performance during the past two calendar years to the performance of funds in the Broadridge performance universe and against the Lipper International Multi-Cap Core Funds Index. The Board noted that performance of Class A shares of the Fund was in the fifth quintile of its performance universe for the one and two year periods (the first quintile being the best performing funds and the fifth quintile being the worst performing funds). The Board noted that the Fund’s performance was below the performance of the Index for the one and two year periods. The Trustees also reviewed more recent Fund performance and this review did not change their conclusions.
30 Invesco Macro International Equity Fund
| C. | Advisory and Sub-Advisory Fees |
The Board compared the Fund’s contractual management fee rate to the contractual management fee rates of funds in the Fund’s Broadridge expense group at a common asset level. The Board noted that the contractual management fee rate for Class A shares of the Fund was above the median contractual management fee rate of funds in its expense group. The Board noted that the term “contractual management fee” for funds in the expense group may include both advisory and certain administrative services fees, but that Broadridge does not provide information on a fund by fund basis as to what is included. The Board noted that Invesco Advisers does not separately charge the Invesco Funds for the administrative services included in the term as defined by Broadridge. The Board also reviewed the methodology used by Broadridge in providing expense group information, which includes using each fund’s contractual management fee schedule (including any applicable breakpoints) as reported in the most recent prospectus or statement of additional information for each fund in the expense group.
The Board noted that Invesco Advisers has contractually agreed to waive fees and/or limit expenses of the Fund through at least February 28, 2017 in an amount necessary to limit total annual operating expenses to a specified percentage of average daily net assets for each class of the Fund.
The Board noted that Invesco Advisers and the Affiliated Sub-Advisers do not manage other mutual funds or client accounts with investment strategies comparable to those of the Fund.
The Board also considered the services that may be provided by the Affiliated Sub-Advisers pursuant to the sub-advisory contracts, as well as the fees payable by Invesco Advisers to the Affiliated Sub-Advisers pursuant to the sub-advisory contracts. The Board also noted that the sub-advisory fees are not paid directly by the Fund, but rather, are payable to the Affiliated Sub-Advisers.
| D. | Economies of Scale and Breakpoints |
The Board considered the extent to which there are economies of scale in the provision of advisory services to the Fund. The Board also considered whether the Fund benefits from economies of scale through contractual breakpoints in the Fund’s advisory fee schedule. The Board also noted that the Fund shares directly in economies of scale through lower fees charged by third party service providers based on the combined size of the Invesco Funds and other clients advised by Invesco Advisers.
| E. | Profitability and Financial Resources |
The Board reviewed information from Invesco Advisers concerning the costs of the advisory and other services that Invesco Advisers and its affiliates provide to the Fund and the Invesco Funds and the profitability of Invesco Advisers and its affiliates in providing these services. The Board received information from Invesco Advisers and a report from an independent
consultant engaged by the Senior Officer about the methodology used to prepare the profitability information. The Board noted that Invesco Advisers continues to operate at a net profit from services Invesco Advisers and its affiliates provide to the Invesco Funds. The Board noted that Invesco Advisers and its affiliates did not make a profit from managing the Fund as a result of fee and expense waivers. The Board received and accepted information from Invesco Advisers demonstrating that Invesco Advisers and each Affiliated Sub-Adviser are financially sound and have the resources necessary to perform their obligations under the investment advisory agreement and sub-advisory contracts.
| F. | Collateral Benefits to Invesco Advisers and its Affiliates |
The Board considered various other benefits received by Invesco Advisers and its affiliates from the relationship with the Fund, including the fees received for providing transfer agency and distribution services to the Fund. The Board considered comparative information regarding fees charged for these services, including information provided by Broadridge and other independent sources. The Board considered the performance of Invesco Advisers and its affiliates in providing these services and the organizational structure employed to provide these services. The Board also considered that these services are provided to the Fund pursuant to written contracts that are reviewed and approved on an annual basis by the Board; and that the services are required for the operation of the Fund.
The Board considered the benefits realized by Invesco Advisers and the Affiliated Sub-Advisers as a result of portfolio brokerage transactions executed through “soft dollar” arrangements. The Board noted that soft dollar arrangements shift the payment obligation for research services from Invesco Advisers and the Affiliated Sub-Advisers to the Invesco Funds and that the research received may be used with other clients of Invesco Advisers and may reduce Invesco Advisers’ and the Affiliated Sub-Advisers’ expenses. The Board also considered that it receives periodic reports from the Chief Compliance Officer of the Invesco Funds demonstrating that these arrangements are consistent with regulatory requirements. The Board did not deem the soft dollar arrangements to be inappropriate.
The Board considered that the Fund’s uninvested cash and cash collateral from any securities lending arrangements may be invested in money market funds advised by Invesco Advisers pursuant to procedures approved by the Board. The Board noted that Invesco Advisers receives advisory fees from these affiliated money market funds attributable to such investments, although Invesco Advisers has contractually agreed to waive through varying periods the advisory fees payable by the Invesco Funds with respect to certain investments in the affiliated money market funds. The waiver is in an amount equal
to 100% of the net advisory fee Invesco Advisers receives from the affiliated money market funds with respect to the Fund’s investment in the affiliated money market funds of uninvested cash, but not cash collateral. The Board concluded that the amount of advisory fees received by Invesco Advisors from the Fund’s investment of cash collateral from any securities lending arrangements in the affiliated money market funds is fair and reasonable.
The Board also considered that the Fund may use an affiliated broker to execute certain trades for the Fund to, among other things, control information leakage, and was advised that such trades would be executed in compliance with rules under the Investment Company Act of 1940, as amended, and consistent with best execution obligations.
31 Invesco Macro International Equity Fund
Tax Information
Form 1099-DIV, Form 1042-S and other year–end tax information provide shareholders with actual calendar year amounts that should be included in their tax returns. Shareholders should consult their tax advisors.
The following distribution information is being provided as required by the Internal Revenue Code or to meet a specific state’s requirement.
The Fund designates the following amounts or, if subsequently determined to be different, the maximum amount allowable for its fiscal year ended October 31, 2016:
| | | | |
Federal and State Income Tax | |
Qualified Dividend Income* | | | 100.00 | % |
Corporate Dividends Received Deduction* | | | 0.00 | % |
U.S. Treasury Obligations* | | | 0.00 | % |
| | * | The above percentages are based on ordinary income dividends paid to shareholders during the Fund’s fiscal year. |
32 Invesco Macro International Equity Fund
Trustees and Officers
The address of each trustee and officer is AIM Investment Funds (Invesco Investment Funds) (the “Trust”), 11 Greenway Plaza, Suite 1000, Houston, Texas 77046-1173. The trustees serve for the life of the Trust, subject to their earlier death, incapacitation, resignation, retirement or removal as more specifically provided in the Trust’s organizational documents. Each officer serves for a one year term or until their successors are elected and qualified. Column two below includes length of time served with predecessor entities, if any.
| | | | | | | | |
Name, Year of Birth and
Position(s) Held with the Trust | | Trustee and/
or Officer Since | | Principal Occupation(s)
During Past 5 Years | | Number of
Funds in Fund
Complex
Overseen by
Trustee | | Other Directorship(s)
Held by Trustee During
Past 5 Years |
| Interested Persons | | | | | | | | |
| Martin L. Flanagan1 — 1960 Trustee | | 2007 | | Executive Director, Chief Executive Officer and President, Invesco Ltd. (ultimate parent of Invesco and a global investment management firm); Advisor to the Board, Invesco Advisers, Inc. (formerly known as Invesco Institutional (N.A.), Inc.); Trustee, The Invesco Funds; Vice Chair, Investment Company Institute; and Member of Executive Board, SMU Cox School of Business Formerly: Chairman and Chief Executive Officer, Invesco Advisers, Inc. (registered investment adviser); Director, Chairman, Chief Executive Officer and President, Invesco Holding Company (US) Inc. (formerly IVZ Inc.) (holding company), Invesco Group Services, Inc. (service provider) and Invesco North American Holdings, Inc. (holding company); Director, Chief Executive Officer and President, Invesco Holding Company Limited (parent of Invesco and a global investment management firm); Director, Invesco Ltd.; Chairman, Investment Company Institute and President, Co-Chief Executive Officer, Co-President, Chief Operating Officer and Chief Financial Officer, Franklin Resources, Inc. (global investment management organization) | | 146 | | None |
| Philip A. Taylor2 — 1954 Trustee and Senior Vice President | | 2006 | | Head of the Americas and Senior Managing Director, Invesco Ltd.; Director, Co-Chairman, Co-President and Co-Chief Executive Officer, Invesco Advisers, Inc. (formerly known as Invesco Institutional (N.A.), Inc.) (registered investment adviser); Director, Chairman, Chief Executive Officer and President, Invesco Management Group, Inc. (formerly known as Invesco AIM Management Group, Inc.) (financial services holding company); Director and Chairman, Invesco Investment Services, Inc. (formerly known as Invesco AIM Investment Services, Inc.) (registered transfer agent) Chief Executive Officer, Invesco Corporate Class Inc. (corporate mutual fund company) Director, Chairman and Chief Executive Officer, Invesco Canada Ltd. (formerly known as Invesco Trimark Ltd./Invesco Trimark Ltèe) (registered investment adviser and registered transfer agent); Trustee and Senior Vice President, The Invesco Funds; Director, Invesco Investment Advisers LLC (formerly known as Van Kampen Asset Management). Formerly: Director, Chief Executive Officer and President, Van Kampen Exchange Corp.; President and Principal Executive Officer, The Invesco Funds (other than AIM Treasurer’s Series Trust (Invesco Treasurer’s Series Trust), Short-Term Investments Trust and Invesco Management Trust); Executive Vice President, The Invesco Funds (AIM Treasurer’s Series Trust (Invesco Treasurer’s Series Trust), Short-Term Investments Trust and Invesco Management Trust only); Director and President, INVESCO Funds Group, Inc. (registered investment adviser and registered transfer agent); Director and Chairman, IVZ Distributors, Inc. (formerly known as INVESCO Distributors, Inc.) (registered broker dealer); Director, President and Chairman, Invesco Inc. (holding company), Invesco Canada Holdings Inc. (holding company), Trimark Investments Ltd./Placements Trimark Ltèe and Invesco Financial Services Ltd/Services Financiers Invesco Ltèe; Chief Executive Officer, Invesco Canada Fund Inc. (corporate mutual fund company); Director and Chairman, Van Kampen Investor Services Inc.; Director, Chief Executive Officer and President, 1371 Preferred Inc. (holding company) and Van Kampen Investments Inc.; Director and President, AIM GP Canada Inc. (general partner for limited partnerships) and Van Kampen Advisors, Inc.; Director and Chief Executive Officer, Invesco Trimark Dealer Inc. (registered broker dealer); Director, Invesco Distributors, Inc. (formerly known as Invesco AIM Distributors, Inc.) (registered broker dealer); Manager, Invesco PowerShares Capital Management LLC; Director, Chief Executive Officer and President, Invesco Advisers, Inc.; Director, Chairman, Chief Executive Officer and President, Invesco AIM Capital Management, Inc.; President, Invesco Trimark Dealer Inc. and Invesco Trimark Ltd./Invesco Trimark Ltèe; Director and President, AIM Trimark Corporate Class Inc. and AIM Trimark Canada Fund Inc.; Senior Managing Director, Invesco Holding Company Limited; Director and Chairman, Fund Management Company (former registered broker dealer); President and Principal Executive Officer, The Invesco Funds (AIM Treasurer’s Series Trust (Invesco Treasurer’s Series Trust), and Short-Term Investments Trust only); President, AIM Trimark Global Fund Inc. and AIM Trimark Canada Fund Inc. | | 146 | | None |
| 1 | Mr. Flanagan is considered an interested person (within the meaning of Section 2(a)(19) of the 1940 Act) of the Trust because he is an officer of the Adviser to the Trust, and an officer and a director of Invesco Ltd., ultimate parent of the Adviser. |
| 2 | Mr. Taylor is considered an interested person (within the meaning of Section 2(a)(19) of the 1940 Act) of the Trust because he is an officer and a director of the Adviser. |
T-1 Invesco Macro International Equity Fund
Trustees and Officers—(continued)
| | | | | | | | |
Name, Year of Birth and
Position(s) Held with the Trust | | Trustee and/
or Officer Since | | Principal Occupation(s) During Past 5 Years | | Number of
Funds in Fund
Complex
Overseen by
Trustee | | Other Directorship(s)
Held by Trustee During
Past 5 Years |
| Independent Trustees | | | | | | | | |
Bruce L. Crockett — 1944 Trustee and Chair | | 2001 | | Chairman, Crockett Technologies Associates (technology consulting company) Formerly: Director, Captaris (unified messaging provider); Director, President and Chief Executive Officer, COMSAT Corporation; Chairman, Board of Governors of INTELSAT (international communications company); ACE Limited (insurance company); Independent Directors Council and Investment Company Institute | | 146 | | ALPS (Attorneys Liability Protection Society) (insurance company) and Globe Specialty Metals, Inc. (metallurgical company); Member of the Audit Committee, Ferroglobe PLC and Investment Company Institute; Member of the Executive Committee and Chair of the Governance Committee, Independent Directors Council |
David C. Arch — 1945 Trustee | | 2010 | | Chairman of Blistex Inc., a consumer health care products manufacturer | | 146 | | Board member of the Illinois Manufacturers’ Association; Member of the Board of Visitors, Institute for the Humanities, University of Michigan |
James T. Bunch — 1942 Trustee | | 2003 | | Managing Member, Grumman Hill Group LLC (family office/private equity investments) Formerly: Chairman of the Board, Denver Film Society, Chairman of the Board of Trustees, Evans Scholarship Foundation; Chairman, Board of Governors, Western Golf Association | | 146 | | Trustee, Evans Scholarship Foundation |
Albert R. Dowden — 1941 Trustee | | 2001 | | Director of a number of public and private business corporations, including Nature’s Sunshine Products, Inc. Formerly: Director, The Boss Group, Ltd. and Reich & Tang Funds (5 portfolios) (registered investment company); Director, Homeowners of America Holding Corporation/Homeowners of America Insurance Company (property casualty company); Director, Continental Energy Services, LLC (oil and gas pipeline service); Director, CompuDyne Corporation (provider of product and services to the public security market) and Director, Annuity and Life Re (Holdings), Ltd. (reinsurance company); Director, President and Chief Executive Officer, Volvo Group North America, Inc.; Senior Vice President, AB Volvo; Director of various public and private corporations; Chairman, DHJ Media, Inc.; Director, Magellan Insurance Company; and Director, The Hertz Corporation, Genmar Corporation (boat manufacturer), National Media Corporation; Advisory Board of Rotary Power International (designer, manufacturer, and seller of rotary power engines); and Chairman, Cortland Trust, Inc. (registered investment company) | | 146 | | Director of Nature’s Sunshine Products, Inc. |
Jack M. Fields — 1952 Trustee | | 2001 | | Chief Executive Officer, Twenty First Century Group, Inc. (government affairs company); and Discovery Learning Alliance (non-profit) Formerly: Owner and Chief Executive Officer, Dos Angeles Ranch L.P. (cattle, hunting, corporate entertainment); Director, Insperity, Inc. (formerly known as Administaff); Chief Executive Officer, Texana Timber LP (sustainable forestry company); Director of Cross Timbers Quail Research Ranch (non-profit); and member of the U.S. House of Representatives | | 146 | | None |
Eli Jones — 1961 Trustee | | 2016 | | Professor and Dean, Mays Business School — Texas A&M University Formerly: Professor and Dean, Walton College of Business, University of Arkansas and E.J. Ourso College of Business, Louisiana State University and Director, Arvest Bank | | 146 | | Director of Insperity, Inc. (formerly known as Administaff) |
Prema Mathai-Davis — 1950 Trustee | | 2001 | | Retired. Formerly: Chief Executive Officer, YWCA of the U.S.A. | | 146 | | None |
Larry Soll — 1942 Trustee | | 2003 | | Retired. Formerly: Chairman, Chief Executive Officer and President, Synergen Corp. (a biotechnology company) | | 146 | | None |
Raymond Stickel, Jr. — 1944 Trustee | | 2005 | | Retired. Formerly: Director, Mainstay VP Series Funds, Inc. (25 portfolios) and Partner, Deloitte & Touche | | 146 | | None |
Robert C. Troccoli — 1949 Trustee | | 2016 | | Adjunct Professor, University of Denver — Daniels College of Business Formerly: Senior Partner, KPMG LLP | | 146 | | None |
T-2 Invesco Macro International Equity Fund
Trustees and Officers—(continued)
| | | | | | | | |
Name, Year of Birth and
Position(s) Held with the Trust | | Trustee and/
or Officer Since | | Principal Occupation(s) During Past 5 Years | | Number of
Funds in Fund
Complex
Overseen by
Trustee | | Other Directorship(s)
Held by Trustee During
Past 5 Years |
| Independent Trustees—(continued) |
Suzanne H. Woolsey — 1941 Trustee | | 2014 | | Retired. Formerly: Chief Executive Officer of Woolsey Partners LLC | | 146 | | Director, SunShare LLC; Trustee, Ocean Conservancy; Emeritus Chair of the Board of Trustees of the Institute for Defense Analyses and of Colorado College; Trustee, Chair, Business and Finance Committee of California Institute of Technology; Prior to 2014, Director of Fluor Corp.; Prior to 2010, Trustee of the German Marshall Fund of the United States; Prior to 2010, Trustee of the Rocky Mountain Institute |
| Other Officers | | | | | | | | |
Sheri Morris — 1964 President, Principal Executive Officer and Treasurer | | 1999 | | President, Principal Executive Officer and Treasurer, The Invesco Funds; Vice President, Invesco Advisers, Inc. (formerly known as Invesco Institutional (N.A.), Inc.) (registered investment adviser); and Vice President, PowerShares Exchange-Traded Fund Trust, PowerShares Exchange-Traded Fund Trust II, PowerShares India Exchange-Traded Fund Trust, PowerShares Actively Managed Exchange-Traded Fund Trust, and PowerShares Actively Managed Exchange-Traded Commodity Fund Trust Formerly: Vice President and Principal Financial Officer, The Invesco Funds; Vice President, Invesco AIM Advisers, Inc., Invesco AIM Capital Management, Inc. and Invesco AIM Private Asset Management, Inc.; Assistant Vice President and Assistant Treasurer, The Invesco Funds and Assistant Vice President, Invesco Advisers, Inc., Invesco AIM Capital Management, Inc. and Invesco AIM Private Asset Management, Inc.; and Treasurer, PowerShares Exchange-Traded Fund Trust, PowerShares Exchange-Traded Fund Trust II, PowerShares India Exchange-Traded Fund Trust and PowerShares Actively Managed Exchange-Traded Fund Trust | | N/A | | N/A |
Russell C. Burk — 1958 Senior Vice President and Senior Officer | | 2005 | | Senior Vice President and Senior Officer, The Invesco Funds | | N/A | | N/A |
John M. Zerr — 1962 Senior Vice President, Chief Legal Officer and Secretary | | 2006 | | Director, Senior Vice President, Secretary and General Counsel, Invesco Management Group, Inc. (formerly known as Invesco AIM Management Group, Inc.; Senior Vice President, Invesco Advisers, Inc. (formerly known as Invesco Institutional (N.A.), Inc.) (registered investment adviser); Senior Vice President and Secretary, Invesco Distributors, Inc. (formerly known as Invesco AIM Distributors, Inc.); Director, Vice President and Secretary, Invesco Investment Services, Inc. (formerly known as Invesco AIM Investment Services, Inc.) Senior Vice President, Chief Legal Officer and Secretary, The Invesco Funds; Managing Director, Invesco PowerShares Capital Management LLC; Director, Secretary and General Counsel, Invesco Investment Advisers LLC (formerly known as Van Kampen Asset Management); Secretary and General Counsel, Invesco Capital Markets, Inc. (formerly known as Van Kampen Funds Inc.) and Chief Legal Officer, PowerShares Exchange-Traded Fund Trust, PowerShares Exchange-Traded Fund Trust II, PowerShares India Exchange-Traded Fund Trust, PowerShares Actively Managed Exchange-Traded Fund Trust, and PowerShares Actively Managed Exchange-Traded Commodity Fund Trust Formerly: Director, Secretary, General Counsel and Senior Vice President, Van Kampen Exchange Corp.; Director, Vice President and Secretary, IVZ Distributors, Inc. (formerly known as INVESCO Distributors, Inc.); Director and Vice President, INVESCO Funds Group, Inc.; Director and Vice President, Van Kampen Advisors Inc.; Director, Vice President, Secretary and General Counsel, Van Kampen Investor Services Inc.; Director, Invesco Distributors, Inc. (formerly known as Invesco AIM Distributors, Inc.); Director, Senior Vice President, General Counsel and Secretary, Invesco AIM Advisers, Inc. and Van Kampen Investments Inc.; Director, Vice President and Secretary, Fund Management Company; Director, Senior Vice President, Secretary, General Counsel and Vice President, Invesco AIM Capital Management, Inc.; Chief Operating Officer and General Counsel, Liberty Ridge Capital, Inc. (an investment adviser); Vice President and Secretary, PBHG Funds (an investment company) and PBHG Insurance Series Fund (an investment company); Chief Operating Officer, General Counsel and Secretary, Old Mutual Investment Partners (a broker-dealer); General Counsel and Secretary, Old Mutual Fund Services (an administrator) and Old Mutual Shareholder Services (a shareholder servicing center); Executive Vice President, General Counsel and Secretary, Old Mutual Capital, Inc. (an investment adviser); and Vice President and Secretary, Old Mutual Advisors Funds (an investment company) | | N/A | | N/A |
T-3 Invesco Macro International Equity Fund
Trustees and Officers—(continued)
| | | | | | | | |
Name, Year of Birth and
Position(s) Held with the Trust | | Trustee and/
or Officer Since | | Principal Occupation(s) During Past 5 Years | | Number of
Funds in Fund
Complex
Overseen by
Trustee | | Other Directorship(s)
Held by Trustee During
Past 5 Years |
| Other Officers—(continued) | | | | | | | | |
| Karen Dunn Kelley — 1960 Senior Vice President | | 2004 | | Senior Managing Director, Investments, Invesco Ltd.; Director, Co-President, Co-Chief Executive Officer, and Co-Chairman, Invesco Advisers, Inc. (formerly known as Invesco Institutional (N.A.), Inc.) (registered investment adviser); Chairman and Director, Invesco Senior Secured Management, Inc.; Senior Vice President, Invesco Management Group, Inc. (formerly known as Invesco AIM Management Group, Inc.); Executive Vice President, Invesco Distributors, Inc. (formerly known as Invesco AIM Distributors, Inc.); Director, Invesco Mortgage Capital Inc. and Invesco Management Company Limited; Senior Vice President, The Invesco Funds Formerly: Vice President, The Invesco Funds (other than AIM Treasurer’s Series Trust (Invesco Treasurer’s Series Trust), Short-Term Investments Trust and Invesco Management Trust); and President and Principal Executive Officer, The Invesco Funds (AIM Treasurer’s Series Trust (Invesco Treasurer’s Series Trust), Short-Term Investments Trust and Invesco Management Trust only); Director and President, INVESCO Asset Management (Bermuda) Ltd., Director, INVESCO Global Asset Management DAC (formerly known as INVESCO Global Asset Management Limited) and INVESCO Management S.A.; Senior Vice President, Van Kampen Investments Inc. and Invesco Advisers, Inc. (formerly known as Invesco Institutional (N.A.), Inc.) (registered investment adviser); Director and President, Fund Management Company; Chief Cash Management Officer, Director of Cash Management, Senior Vice President, and Managing Director, Invesco AIM Capital Management, Inc.; Director of Cash Management, Senior Vice President, and Vice President, Invesco Advisers, Inc. and Vice President, The Invesco Funds (AIM Treasurer’s Series Trust (Invesco Treasurer’s Series Trust), and Short-Term Investments Trust only) | | N/A | | N/A |
Kelli Gallegos — 1970 Vice President, Principal Financial Officer and Assistant Treasurer | | 2008 | | Vice President, Principal Financial Officer and Assistant Treasurer, The Invesco Funds; Assistant Treasurer, Invesco PowerShares Capital Management LLC, PowerShares Exchange-Traded Fund Trust, PowerShares Exchange-Traded Fund Trust II, PowerShares India Exchange-Traded Fund Trust, PowerShares Actively Managed Exchange-Traded Fund Trust, and PowerShares Actively Managed Exchange-Traded Commodity Fund Trust Formerly: Assistant Vice President, The Invesco Funds | | N/A | | N/A |
Tracy Sullivan — 1962 Vice President, Chief Tax Officer and Assistant Treasurer | | 2008 | | Vice President, Chief Tax Officer and Assistant Treasurer, The Invesco Funds; Assistant Treasurer, Invesco PowerShares Capital Management LLC, PowerShares Exchange-Traded Fund Trust, PowerShares Exchange-Traded Fund Trust II, PowerShares India Exchange-Traded Fund Trust, PowerShares Actively Managed Exchange-Traded Fund Trust, and PowerShares Actively Managed Exchange-Traded Commodity Fund Trust Formerly: Assistant Vice President, The Invesco Funds | | N/A | | N/A |
Crissie M. Wisdom — 1969 Anti-Money Laundering Compliance Officer | | 2013 | | Anti-Money Laundering Compliance Officer, Invesco Advisers, Inc. (formerly known as Invesco Institutional (N.A.), Inc.) (registered investment adviser), Invesco Capital Markets, Inc. (formerly known as Van Kampen Funds Inc.), Invesco Distributors, Inc., Invesco Investment Services, Inc., Invesco Management Group, Inc., The Invesco Funds, and PowerShares Exchange-Traded Fund Trust, PowerShares Exchange-Traded Fund Trust II, PowerShares India Exchange-Traded Fund Trust, PowerShares Actively Managed Exchange-Traded Fund Trust and PowerShares Actively Managed Exchange-Traded Commodity Fund Trust; Anti-Money Laundering Compliance Officer and Bank Secrecy Act Officer, INVESCO National Trust Company and Invesco Trust Company; and Fraud Prevention Manager and Controls and Risk Analysis Manager for Invesco Investment Services, Inc. Formerly: Anti-Money Laundering Compliance Officer, Van Kampen Exchange Corp. | | N/A | | N/A |
Robert R. Leveille — 1969 Chief Compliance Officer | | 2016 | | Chief Compliance Officer, Invesco Advisers, Inc. (registered investment adviser); and Chief Compliance Officer, The Invesco Funds Formerly: Chief Compliance Officer, Putnam Investments and the Putnam Funds | | N/A | | N/A |
The Statement of Additional Information of the Trust includes additional information about the Fund’s Trustees and is available upon request, without charge, by calling 1.800.959.4246. Please refer to the Fund’s Statement of Additional Information for information on the Fund’s sub-advisers.
| | | | | | |
Office of the Fund 11 Greenway Plaza, Suite 1000 Houston, TX 77046-1173 | | Investment Adviser Invesco Advisers, Inc. 1555 Peachtree Street, N.E. Atlanta, GA 30309 | | Distributor Invesco Distributors, Inc. 11 Greenway Plaza, Suite 1000 Houston, TX 77046-1173 | | Auditors PricewaterhouseCoopers LLP 1000 Louisiana Street, Suite 5800 Houston, TX 77002-5678 |
| | | |
| | | | | | |
Counsel to the Fund Stradley Ronon Stevens & Young, LLP 2005 Market Street, Suite 2600 Philadelphia, PA 19103-7018 | | Counsel to the Independent Trustees Goodwin Procter LLP 901 New York Avenue, N.W. Washington, D.C. 20001 | | Transfer Agent Invesco Investment Services, Inc. 11 Greenway Plaza, Suite 1000 Houston, TX 77046-1173 | | Custodian State Street Bank and Trust Company 225 Franklin Street Boston, MA 02110-2801 |
T-4 Invesco Macro International Equity Fund
Explore High-Conviction Investing with Invesco

Invesco mailing information
Send general correspondence to Invesco Investment Services, Inc., P.O. Box 219078, Kansas City, MO 64121-9078.
Important notice regarding delivery of security holder documents
To reduce Fund expenses, only one copy of most shareholder documents may be mailed to shareholders with multiple accounts at the same address (Householding). Mailing of your shareholder documents may be householded indefinitely unless you instruct us otherwise. If you do not want the mailing of these documents to be combined with those for other members of your household, please contact Invesco Investment Services, Inc. at 800 959 4246 or contact your financial institution. We will begin sending you individual copies for each account within 30 days after receiving your request.
Fund holdings and proxy voting information
The Fund provides a complete list of its holdings four times in each fiscal year, at the quarter ends. For the second and fourth quarters, the lists appear in the Fund’s semiannual and annual reports to shareholders. For the first and third quarters, the Fund files the lists with the Securities and Exchange Commission (SEC) on Form N-Q. The most recent list of portfolio holdings is available at invesco.com/completeqtrholdings. Shareholders can also look up the Fund’s Forms N-Q on the SEC website at sec.gov. Copies of the Fund’s Forms N-Q may be reviewed and copied at the SEC Public Reference Room in Washington, D.C. You can obtain information on the operation of the Public Reference Room, including information about duplicating fee charges, by calling 202 551 8090 or 800 732 0330, or by electronic request at the following email address: publicinfo@sec.gov. The SEC file numbers for the Fund are shown below.
A description of the policies and procedures that the Fund uses to determine how to vote proxies relating to portfolio securities is available without charge, upon request, from our Client Services department at 800 959 4246 or at invesco.com/proxyguidelines. The information is also available on the SEC website, sec.gov.
| | |
Information regarding how the Fund voted proxies related to its portfolio securities during the most recent 12-month period ended June 30 is available at invesco.com/proxysearch. The information is also available on the SEC website, sec.gov. Invesco Advisers, Inc. is an investment adviser; it provides investment advisory services to individual and institutional clients and does not sell securities. Invesco Distributors, Inc. is the US distributor for Invesco Ltd.’s retail mutual funds, exchange-traded funds and institutional money market funds. Both are wholly owned, indirect subsidiaries of Invesco Ltd. | |  |
| | | | |
| SEC file numbers: 811-05426 and 033-19338 | | MIE-AR-1 | | Invesco Distributors, Inc. |
| | | | |
| | |
 | | Annual Report to Shareholders | | October 31, 2016 |
| | |
| | Invesco Macro Long/Short Fund |
| | Nasdaq: |
| | A: LSTAX ∎ C: LSTCX ∎ R: LSTRX ∎ Y: LSTYX ∎ R5: LSTFX ∎ R6: LSTSX |

Letters to Shareholders
| | |

Philip Taylor | | Dear Shareholders: This annual report includes information about your Fund, including performance data and a complete list of its investments as of the close of the reporting period. Inside is a discussion of how your Fund was managed and the factors that affected its performance during the reporting period. In December 2015, the US Federal Reserve raised short-term interest rates for the first time since 2006, signaling its belief that the economy was likely to continue strengthening. Indeed, throughout the reporting period, US economic data were generally positive and the economy expanded at a moderate rate – but there were some bumps along the road. Job growth in May 2016 was very weak, but it was followed by strong increases in nonfarm payrolls in June and July. Increased concerns about global economic weakness caused US stock market indexes to |
sink at the start of calendar year 2016, but they eventually recovered; they sank again following the UK’s decision to leave the European Union, but then quickly recovered and reached record highs later in the summer. Strong demand for income-producing investments, particularly those perceived to be lower risk, benefited bonds as well as dividend-paying stocks for much of the reporting period. While economic news in the US was generally positive, news overseas was less upbeat. The European Central Bank, and central banks in China and Japan – as well as other countries – maintained extraordinarily accommodative monetary policies in response to economic weakness. As the fiscal year drew to a close, uncertainty about the outcome of the US presidential election resulted in increased market volatility; the surprise outcome after the close of the reporting period suggested that market volatility may continue for some time to come. Short-term market volatility can prompt some investors to abandon their investment plans – and can cause others to settle for average results. The investment professionals at Invesco, in contrast, invest with high conviction, take a long-term perspective and have a passion to exceed. Invesco’s pure focus on investment management eliminates possible distractions and means that there are no competing lines of business for us to support. Just as important, we embrace a variety of investment strategies, asset classes and geographies – because we know that no single investment approach meets the diverse needs of all of our clients. We manage all our investment approaches with a passion to exceed. All our investment teams have a highly disciplined, long-term investing style that eliminates short-term decision-making. Of course, investing with high conviction can’t guarantee a profit or ensure success; no investment strategy can. To learn more about how we invest with high conviction, visit invesco.com/HighConviction. You, too, can invest with high conviction by maintaining a long-term investment perspective and by working with your financial adviser on a regular basis. During periods of short-term market volatility or uncertainty, your financial adviser can keep you focused on your long-term investment goals – a new home, a child’s college education or a secure retirement. He or she also can share research about the economy, the markets and individual investment options. |
Visit our website for more information on your investments
Our website, invesco.com/us, offers a wide range of market insights and investment perspectives. On the website, you’ll find detailed information about our funds, including performance, holdings and portfolio manager commentaries. You can access information about your account by completing a simple, secure online registration. Click on the “Need to register” link in the “Account Access” box on our homepage to get started.
In addition to the resources accessible on our website and through our mobile app, you can obtain timely updates to help you stay informed about the markets, the economy and investing by connecting with Invesco on Twitter, LinkedIn or Facebook. You can access our blog at blog.invesco.us.com. Our goal is to provide you the information you want, when and where you want it.
Finally, I’m pleased to share with you Invesco’s commitment to both the Principles for Responsible Investment and to considering environmental, social and governance issues in our robust investment process. I invite you to learn more at invesco.com/esg.
Have questions?
For questions about your account, contact an Invesco client services representative at 800 959 4246. For Invesco-related questions or comments, please email me directly at phil@invesco.com.
All of us at Invesco look forward to serving your investment management needs. Thank you for investing with us.
Sincerely,

Philip Taylor
Senior Managing Director, Invesco Ltd.
2 Invesco Macro Long/Short Fund
| | | | | | |

Bruce Crockett | | | | Dear Fellow Shareholders: Among the many important lessons I’ve learned in more than 40 years in a variety of business endeavors is the value of a trusted advocate. As independent chair of the Invesco Funds Board, I can assure you that the members of the Board are strong advocates for the interests of investors in Invesco’s mutual funds. We work hard to represent your interests through oversight of the quality of the investment management services your funds receive and other matters important to your investment, including but not limited to: |
| | | | ∎ | | Ensuring that Invesco offers a diverse lineup of mutual funds that your financial adviser can use to strive to meet your financial needs as your investment goals change over time. |
| | | | ∎ | | Monitoring how the portfolio management teams of the Invesco funds are performing in light of changing economic and market conditions. |
| ∎ | | Assessing each portfolio management team’s investment performance within the context of the investment strategy described in the fund’s prospectus. |
| ∎ | | Monitoring for potential conflicts of interests that may impact the nature of the services that your funds receive. |
We believe one of the most important services we provide our fund shareholders is the annual review of the funds’ advisory and sub-advisory contracts with Invesco Advisers and its affiliates. This review is required by the Investment Company Act of 1940 and focuses on the nature and quality of the services Invesco provides as the adviser to the Invesco funds and the reasonableness of the fees that it charges for those services. Each year, we spend months carefully reviewing information received from Invesco and a variety of independent sources, such as performance and fee data prepared by Lipper Inc., an independent, third-party firm widely recognized as a leader in its field. We also meet with our independent legal counsel and other independent advisers to review and help us assess the information that we have received. Our goal is to assure that you receive quality investment management services for a reasonable fee.
I trust the measures outlined above provide assurance that you have a worthy advocate when it comes to choosing the Invesco Funds.
As always, please contact me at bruce@brucecrockett.com with any questions or concerns you may have. On behalf of the Board, we look forward to continuing to represent your interests and serving your needs.
Sincerely,

Bruce L. Crockett
Independent Chair
Invesco Funds Board of Trustees
3 Invesco Macro Long/Short Fund
Management’s Discussion of Fund Performance
| | | | |
Performance summary For the fiscal year ended October 31, 2016, Class A shares of Invesco Macro Long/Short Fund, at net asset value (NAV), underperformed the Bloomberg Barclays 3-Month Treasury Bellwether Index, the Fund’s style-specific index. Your Fund’s long-term performance appears later in this report. | |
Fund vs. Indexes Total returns, 10/31/15 to 10/31/16, at net asset value (NAV). Performance shown does not include applicable contingent deferred sales charges (CDSC) or front-end sales charges, which would have reduced performance. | |
Class A Shares | | | -0.46 | % |
Class C Shares | | | -1.17 | |
Class R Shares | | | -0.74 | |
Class Y Shares | | | -0.22 | |
Class R5 Shares | | | -0.11 | |
Class R6 Shares | | | -0.22 | |
MSCI All Country World Indexq (Broad Market Index) | | | 2.05 | |
| Bloomberg Barclays 3-Month Treasury Bellwether Indexq (Style-Specific Index) | | | 0.32 | |
Lipper Alternative Long/Short Equity Funds Index∎ (Peer Group Index) | | | -0.52 | |
Source(s): qFactSet Research Systems Inc.; ∎Lipper Inc. | | | | |
Market conditions and your Fund
The global economy continued to expand, albeit slowly, for the fiscal year. However, that growth became increasingly uneven across developed and emerging economies, amid continued volatility in oil prices and as the policies of central banks globally began to diverge.
The beginning of the fiscal year was challenging for global equity markets, with volatility indicators spiking and all regions exhibiting substantial price declines. Most of that retrenchment was attributable to the European Central Bank’s underwhelming stimulus measures announced in December 2015; it was exacerbated by the US Federal Reserve’s first interest rate hike since 2006.
Stocks then rebounded in mid-February amid signs of stabilization in the global economy, strong earnings at bellwether
companies and ongoing central bank stimulus measures. However, they nose-dived again sharply after British voters approved a ballot measure in June to leave the European Union; a strong bounce-back rally quickly erased most of the losses. Rising oil prices also helped to stabilize the energy sector and alleviate fears of substantial defaults in the energy-related high yield market.
Emerging market equities performed strongly during the reporting period, helped by improving economic data in China, strengthening commodity prices and a slightly weaker US dollar. Furthermore, earnings growth stabilized somewhat, which, coupled with relatively attractive valuations, led to further stock price appreciation as corporate profits improved. At the same time there were risks to monitor. For example, in July, a
failed coup in Turkey was a reminder that political risk can stoke market volatility.
The Fund uses smart beta indexes to build up core equity exposure, including regional exposure. Beta is a measure of risk representing how a security is expected to respond to general market movements. Smart beta represents an alternative and selection index based methodology that seeks to outperform a benchmark or reduce portfolio risk, or both. Smart beta funds may underperform cap-weighted benchmarks and increase portfolio risk. For this strategy, we invest in companies in approximately the same proportion as they are represented in the smart beta indexes, which utilize equal weighting, low volatility or other methodologies to determine stock investments and appropriate weightings. The main source of Fund performance for the fiscal year was the Fund’s regional strategic asset allocation approach; strong contributions to Fund performance came from our overweight exposure to Asia and emerging markets. The Fund also used multifactor models that looked at valuation, economic environments and price trends to tactically adjust the portfolio to complement short-term market dynamics. The Fund’s tactical exposure, which was implemented primarily through the use of futures, detracted from Fund performance for the reporting period. This was the case particularly early in the fiscal year, when equity markets struggled and the Fund had overweight exposure to the UK and US small- and large-cap core stocks.
Please note that our strategy utilizes derivative instruments that include futures. Therefore, some of the performance of the strategy, both positive and
| | | | | | |
| Portfolio Composition | |
| By country | | | % of total net assets | |
| | | | |
United States | | | 22.2 | % |
Japan | | | 11.5 | |
| United Kingdom | | | 9.8 | |
| Australia | | | 5.9 | |
| Hong Kong | | | 3.0 | |
| Taiwan | | | 2.6 | |
| France | | | 2.5 | |
| Switzerland | | | 2.1 | |
| Countries each with less than 2.0% of portfolio | | | 18.0 | |
| Money Market Funds Plus Other Assets Less Liabilities† | | | 22.4 | |
| † | The unrealized appreciation/depreciation of futures, forwards and swaps are included in “Money Market Funds Plus Other Assets Less Liabilities.” |
| | | | | | |
| Targeted Regional Breakdown | |
| | | Target Net Assets | 1 |
| | | | |
Emerging Market | | | 14.06 | % |
European ex-UK | | | 10.84 | |
| United Kingdom | | | 10.67 | |
| Japan | | | 10.12 | |
| Asia ex-Japan | | | 10.11 | |
| United States Large Cap | | | 6.22 | |
| United States Small-Cap | | | 5.26 | |
| Cash and Money Market Funds | | | 20.00 | |
| Total | | | 87.28 | |
| 1 | Proprietary models determine the target net asset weights necessary to achieve the desired regional breakdown. Target net assets less than or greater than 100% is achieved through derivatives and other instruments that create leverage. Regional breakdown percentages represent the net of the Fund’s long and short positions. |
| | | | |
Total Net Assets | | | $13.5 million | |
| |
| Total Number of Holdings* | | | 1,060 | |
The Fund’s holdings are subject to change, and there is no assurance that the Fund will continue to hold any particular security.
*Excluding money market fund holdings.
Data presented here are as of October 31, 2016.
4 Invesco Macro Long/Short Fund
negative, can be attributed to these instruments. Derivatives can be a cost-effective way to gain exposure to asset classes. However, derivatives may amplify traditional investment risks through the creation of leverage and may be less liquid than traditional securities.
Thank you for your continued investment in Invesco Macro Long/Short Fund.
The views and opinions expressed in management’s discussion of Fund performance are those of Invesco Advisers, Inc. These views and opinions are subject to change at any time based on factors such as market and economic conditions. These views and opinions may not be relied upon as investment advice or recommendations, or as an offer for a particular security. The information is not a complete analysis of every aspect of any market, country, industry, security or the Fund. Statements of fact are from sources considered reliable, but Invesco Advisers, Inc. makes no representation or warranty as to their completeness or accuracy. Although historical performance is no guarantee of future results, these insights may help you understand our investment management philosophy.
See important Fund and, if applicable, index disclosures later in this report.
| | |
 | | Mark Ahnrud Chartered Financial Analyst, Portfolio Manager, is manager of Invesco Macro Long/Short Fund. He |
| joined Invesco in 2000. Mr. Ahnrud earned a BS in finance and investments from Babson College and an MBA from Duke University Fuqua School of Business. |
| |
 | | Chris Devine Chartered Financial Analyst, Portfolio Manager, is manager of Invesco Macro Long/Short Fund. He |
joined Invesco in 1998. Mr. Devine earned a BA in economics from Wake Forest University and an MBA from the University of Georgia. |
| |
 | | Scott Hixon Chartered Financial Analyst, Portfolio Manager, is manager of Invesco Macro Long/Short Fund. He |
| joined Invesco in 1994. Mr. Hixon earned a BBA in finance from Georgia Southern University and an MBA in finance from Georgia State University. |
| | |
 | | Christian Ulrich Chartered Financial Analyst, Portfolio Manager, is manager of Invesco Macro Long/Short Fund. He |
| joined Invesco in 2000. Mr. Ulrich earned the equivalent of a BBA from the KV Zurich Business School in Zurich, Switzerland. |
| |
 | | Scott Wolle Chartered Financial Analyst, Portfolio Manager, is manager of Invesco Macro Long/Short Fund. He |
| joined Invesco in 1999. Mr. Wolle earned a BS in finance from Virginia Polytechnic Institute and State University and an MBA from Duke University Fuqua School of Business. |
Assisted by the Invesco Global Asset Allocation Team
5 Invesco Macro Long/Short Fund
Your Fund’s Long-Term Performance
Results of a $10,000 Investment – Oldest Share Class(es) since Inception
Fund and index data from 12/17/13
| 1 | Source: FactSet Research Systems Inc. |
Past performance cannot guarantee comparable future results.
The data shown in the chart include reinvested distributions, applicable sales charges and Fund expenses including
management fees. Index results include reinvested dividends, but they do not reflect sales charges. Performance of the peer group, if applicable, reflects fund expenses and management fees; performance
of a market index does not. Performance shown in the chart and table(s) does not reflect deduction of taxes a shareholder would pay on Fund distributions or sale of Fund shares.
6 Invesco Macro Long/Short Fund
| | | | |
| Average Annual Total Returns | |
| As of 10/31/16, including maximum applicable sales charges | |
| |
Class A Shares | | | | |
Inception (12/17/13) | | | -2.98 | % |
1 Year | | | -5.92 | |
| |
Class C Shares | | | | |
Inception (12/17/13) | | | -1.78 | % |
1 Year | | | -2.14 | |
| |
Class R Shares | | | | |
Inception (12/17/13) | | | -1.31 | % |
1 Year | | | -0.74 | |
| |
Class Y Shares | | | | |
Inception (12/17/13) | | | -0.79 | % |
1 Year | | | -0.22 | |
| |
Class R5 Shares | | | | |
Inception (12/17/13) | | | -0.76 | % |
1 Year | | | -0.11 | |
| |
Class R6 Shares | | | | |
Inception (12/17/13) | | | -0.79 | % |
1 Year | | | -0.22 | |
| | | | |
| Average Annual Total Returns | |
| As of 9/30/16, the most recent calendar quarter end, including maximum applicable sales charges | |
| |
Class A Shares | | | | |
Inception (12/17/13) | | | -3.07 | % |
1 Year | | | -2.88 | |
| |
Class C Shares | | | | |
Inception (12/17/13) | | | -1.83 | % |
1 Year | | | 1.01 | |
| |
Class R Shares | | | | |
Inception (12/17/13) | | | -1.35 | % |
1 Year | | | 2.45 | |
| |
Class Y Shares | | | | |
Inception (12/17/13) | | | -0.85 | % |
1 Year | | | 2.98 | |
| |
Class R5 Shares | | | | |
Inception (12/17/13) | | | -0.82 | % |
1 Year | | | 2.98 | |
| |
Class R6 Shares | | | | |
Inception (12/17/13) | | | -0.85 | % |
1 Year | | | 2.98 | |
The performance data quoted represent past performance and cannot guarantee comparable future results; current performance may be lower or higher. Please visit invesco.com/performance for the most recent month-end performance. Performance figures reflect reinvested distributions, changes in net asset value and the effect of the maximum sales charge unless otherwise stated. Investment return and principal value will fluctuate so that you may have a gain or loss when you sell shares.
The net annual Fund operating expense ratio set forth in the most recent Fund prospectus as of the date of this report for Class A, Class C, Class R, Class Y, Class R5 and Class R6 shares was 1.88%, 2.63%, 2.13%, 1.63%, 1.63% and 1.63%, respectively.1,2 The total annual Fund operating expense ratio set forth in the most recent Fund prospectus as of the date of this report for Class A, Class C, Class R, Class Y, Class R5 and Class R6 shares was 5.65%, 6.40%, 5.90%, 5.40%, 5.39% and 5.39%, respectively. The expense ratios presented above may vary from the expense ratios presented in other sections of this report that are based on expenses incurred during the period covered by this report.
Class A share performance reflects the maximum 5.50% sales charge, and Class C share performance reflects the applicable contingent deferred sales charge (CDSC) for the period involved.
The CDSC on Class C shares is 1% for the first year after purchase. Class R, Class Y, Class R5 and Class R6 class shares do not have a front-end sales charge or a CDSC; therefore, performance is at net asset value.
The performance of the Fund’s share classes will differ primarily due to different sales charge structures and class expenses.
Fund performance reflects any applicable fee waivers and/or expense reimbursements. Had the adviser not waived fees and/or reimbursed expenses currently or in the past, returns would have been lower. See current prospectus for more information.
| 1 | Total annual Fund operating expenses after any contractual fee waivers and/or expense reimbursements by the adviser in effect through at least June 30, 2018. See current prospectus for more information. |
| 2 | Total annual Fund operating expenses after any contractual fee waivers and/or expense reimbursements by the adviser in effect through at least February 28, 2018. See current prospectus for more information. |
7 Invesco Macro Long/Short Fund
Invesco Macro Long/Short Fund’s investment objective is to seek a positive absolute return over a complete economic and market cycle.
| ∎ | | Unless otherwise stated, information presented in this report is as of October 31, 2016, and is based on total net assets. |
| ∎ | | Unless otherwise noted, all data provided by Invesco. |
| ∎ | | To access your Fund’s reports/prospectus, visit invesco.com/fundreports. |
About share classes
| ∎ | | Class R shares are generally available only to employer sponsored retirement and benefit plans. Please see the prospectus for more information. |
| ∎ | | Class Y shares are available only to certain investors. Please see the prospectus for more information. |
| ∎ | | Class R5 shares and Class R6 shares are primarily intended for employer sponsored retirement and benefit plans that meet certain standards and for institutional investors. Please see the prospectus for more information. |
Principal risks of investing in the Fund
| ∎ | | Derivatives risk. The value of a derivative instrument depends largely on (and is derived from) the value of an underlying security, currency, commodity, interest rate, index or other asset (each referred to as an underlying asset). In addition to risks relating to the underlying assets, the use of derivatives may include other, possibly greater, risks, including counterparty, leverage and liquidity risks. Counterparty risk is the risk that the counterparty to the derivative contract will default on its obligation to pay the Fund the amount owed or otherwise perform under the derivative contract. Derivatives create leverage risk because they do not require payment up front equal to the economic exposure created by owning the derivative. As a result, an adverse change in the value of the underlying asset could result in the Fund sustaining a loss that is substantially greater than the amount invested in the derivative, which may make the Fund’s returns more volatile and increase the risk of loss. Derivative instruments may also be less liquid than more traditional investments and the Fund may be unable to sell or close out its derivative positions at a desirable time or price. This risk may be more acute under adverse market conditions, during which the Fund may be most in need of liquidating its derivative positions. |
| | | Derivatives may also be harder to value, less tax efficient and subject to changing government regulation that could impact the Fund’s ability to use certain derivatives or their cost. Also, derivatives used for hedging or to gain or limit exposure to a particular market segment may not provide the expected benefits, particularly during adverse market conditions. These risks are greater for the Fund than mutual funds that do not use derivative instruments or that use derivative instruments to a lesser extent than the Fund to implement their investment strategies. |
| ∎ | | Emerging markets securities risk. Emerging markets (also referred to as developing markets) are generally subject to greater market volatility, political, social and economic instability, uncertain trading markets and more governmental limitations on foreign investment than more developed markets. In addition, emerging markets may be subject to lower trading volume and greater price fluctuations than companies in more developed markets. Securities law and the enforcement of systems of taxation in many emerging market countries may change quickly and unpredictably. In addition, investments in emerging markets securities may also be subject to additional transaction costs, delays in settlement procedures, and lack of timely information. |
| ∎ | | Foreign securities risk. The Fund’s foreign investments may be adversely affected by political and social instability, changes in economic or taxation policies, difficulty in enforcing obligations, decreased liquidity or increased volatility. Foreign investments also involve the risk of the possible seizure, nationalization or expropriation of the issuer or foreign deposits (in which the Fund could lose its entire investments in a certain market) and the possible adoption of foreign governmental restrictions such as exchange controls. Unless the Fund has hedged its foreign securities risk, foreign securities risk |
| | | also involves the risk of negative foreign currency rate fluctuations, which may cause the value of securities denominated in such foreign currency (or other instruments through which the Fund has exposure to foreign currencies) to decline in value. Currency exchange rates may fluctuate significantly over short periods of time. Currency hedging strategies, if used, are not always successful. |
| ∎ | | Management risk. The Fund is actively managed and depends heavily on the Adviser’s judgment about markets, interest rates or the attractiveness, relative values, liquidity, or potential appreciation of particular investments made for the Fund’s portfolio. The Fund could experience losses if these judgments prove to be incorrect. There can be no guarantee that the Adviser’s investment techniques or investment decisions will produce the desired results. In particular, there is no guarantee that the Fund’s mixture of long and short positions or the portfolio manager’s stock selection process will produce a portfolio with reduced exposure to stock market risk. In addition, the Fund’s long/short investment strategy may cause the Fund to underperform the broader equity markets in which the Fund invests during market rallies. Such underperformance could be significant during sudden or significant market rallies. Additionally, legislative, regulatory, or tax developments may affect the investments or investment strategies available to the investment manager in connection with managing the Fund, which may also adversely affect the ability of the Fund to achieve its investment objective. |
| ∎ | | Market risk. The market values of the Fund’s investments, and therefore the value of the Fund’s shares, will go up and down, sometimes rapidly or unpredictably. Market risk may affect a single issuer, industry or section of the economy, or it may affect the market as a whole. Individual stock prices tend to go up and down more dramatically than those of certain other types of investments, such as bonds. During a general downturn in the financial markets, multiple asset classes may decline in value. |
|
This report must be accompanied or preceded by a currently effective Fund prospectus, which contains more complete information, including sales charges and expenses. Investors should read it carefully before investing. |
|
NOT FDIC INSURED | MAY LOSE VALUE | NO BANK GUARANTEE |
8 Invesco Macro Long/Short Fund
When markets perform well, there can be no assurance that specific investments held by the Fund will rise in value.
| ∎ | | Short position risk. Because the Fund’s potential loss on a short position arises from increases in the value of the asset sold short, the Fund will incur a loss on a short position, which is theoretically unlimited, if the price of the asset sold short increases from the short sale price. The counterparty to a short position or other market factors may prevent the Fund from closing out a short position at a desirable time or price and may reduce or eliminate any gain or result in a loss. In a rising market, the Fund’s short positions will cause the Fund to underperform the overall market and its peers that do not engage in shorting. If the Fund holds both long and short positions, and both positions decline simultaneously, the short positions will not provide any buffer (hedge) from declines in value of the Fund’s long positions. Certain types of short positions involve leverage, which may exaggerate any losses, potentially more than the actual cost of the investment, and will increase the volatility of the Fund’s returns. |
| ∎ | | Small- and mid-capitalization companies risks. Small- and mid-capitalization companies tend to be more vulnerable to changing market conditions, may have little or no operating history or track record of success, and may have more limited product lines and markets, less experienced management and fewer financial resources than larger companies. These companies’ securities may be more volatile and less liquid than those of more established companies, and their returns may vary, sometimes significantly, from the overall securities market. |
About indexes used in this report
| ∎ | | The MSCI All Country World Index is an unmanaged index considered representative of large- and mid-cap stocks across developed and emerging markets. The index is computed using the net return, which withholds applicable taxes for non-resident investors. |
| ∎ | | The Bloomberg Barclays 3-Month Treasury Bellwether Index measures the performance of Treasury bills with maturities of less than three months. |
| ∎ | | The Lipper Alternative Long/Short Equity Funds Index is an unmanaged index considered representative of alternative equity long/short funds tracked by Lipper. |
| ∎ | | The Fund is not managed to track the performance of any particular index, including the index(es) described here, and consequently, the performance of the Fund may deviate significantly from the performance of the index(es). |
| ∎ | | A direct investment cannot be made in an index. Unless otherwise indicated, index results include reinvested dividends, and they do not reflect sales charges. Performance of the peer group, if applicable, reflects fund expenses; performance of a market index does not. |
Other information
| ∎ | | The returns shown in management’s discussion of Fund performance are based on net asset values (NAVs) calculated for shareholder transactions. Generally accepted accounting principles require adjustments to be made to the net assets of the Fund at period end for financial reporting purposes, and as such, the NAVs for shareholder transactions and the returns based on those NAVs may differ from the NAVs and returns reported in the Financial Highlights. |
| ∎ | | Industry classifications used in this report are generally according to the Global Industry Classification Standard, which was developed by and is the exclusive property and a service mark of MSCI Inc. and Standard & Poor’s. |
9 Invesco Macro Long/Short Fund
Schedule of Investments
October 31, 2016
| | | | | | | | |
| | | Shares | | | Value | |
Common Stocks & Other Equity Interests–77.60% | |
| Australia–5.92% | |
AGL Energy Ltd. | | | 1,093 | | | $ | 15,917 | |
Amcor Ltd. | | | 1,315 | | | | 14,686 | |
AMP Ltd. | | | 3,798 | | | | 13,170 | |
APA Group | | | 2,246 | | | | 13,572 | |
Aristocrat Leisure Ltd. | | | 1,346 | | | | 15,674 | |
ASX Ltd. | | | 398 | | | | 14,240 | |
Aurizon Holdings Ltd. | | | 4,571 | | | | 16,967 | |
Australia and New Zealand Banking Group Ltd. | | | 757 | | | | 15,993 | |
BHP Billiton Ltd. | | | 1,022 | | | | 17,897 | |
BHP Billiton PLC | | | 2,450 | | | | 36,747 | |
Brambles Ltd. | | | 1,645 | | | | 14,392 | |
Caltex Australia Ltd. | | | 601 | | | | 13,987 | |
Challenger Ltd. | | | 2,261 | | | | 18,457 | |
Cochlear Ltd. | | | 146 | | | | 14,185 | |
Commonwealth Bank of Australia | | | 279 | | | | 15,534 | |
Computershare Ltd. | | | 2,034 | | | | 16,323 | |
CSL Ltd. | | | 193 | | | | 14,722 | |
DEXUS Property Group | | | 2,138 | | | | 14,511 | |
DUET Group | | | 7,869 | | | | 14,215 | |
Goodman Group | | | 2,707 | | | | 13,946 | |
GPT Group (The) | | | 3,762 | | | | 13,308 | |
Healthscope Ltd. | | | 6,813 | | | | 11,421 | |
Incitec Pivot Ltd. | | | 7,026 | | | | 15,722 | |
Insurance Australia Group Ltd. | | | 3,610 | | | | 15,101 | |
Lendlease Group | | | 1,466 | | | | 15,036 | |
Macquarie Group Ltd. | | | 252 | | | | 15,247 | |
Mirvac Group | | | 9,105 | | | | 14,435 | |
National Australia Bank Ltd. | | | 748 | | | | 15,887 | |
Newcrest Mining Ltd. | | | 908 | | | | 15,833 | |
Oil Search Ltd. | | | 3,035 | | | | 15,271 | |
Origin Energy Ltd. | | | 3,798 | | | | 15,281 | |
Qantas Airways Ltd. | | | 6,229 | | | | 14,499 | |
QBE Insurance Group Ltd. | | | 2,066 | | | | 15,699 | |
Ramsay Health Care Ltd. | | | 250 | | | | 13,919 | |
Santos Ltd. | | | 4,542 | | | | 12,156 | |
Scentre Group | | | 4,152 | | | | 13,259 | |
SEEK Ltd. | | | 1,258 | | | | 13,977 | |
Sonic Healthcare Ltd. | | | 901 | | | | 14,005 | |
South32 Ltd. | | | 10,307 | | | | 20,065 | |
Stockland | | | 4,239 | | | | 14,220 | |
Suncorp Group Ltd. | | | 1,653 | | | | 15,019 | |
Sydney Airport | | | 2,851 | | | | 13,540 | |
Tatts Group Ltd. | | | 5,414 | | | | 16,697 | |
Telstra Corp. Ltd. | | | 3,966 | | | | 15,000 | |
Transurban Group | | | 1,778 | | | | 14,023 | |
Treasury Wine Estates Ltd. | | | 1,795 | | | | 14,664 | |
Vicinity Centres | | | 6,478 | | | | 14,110 | |
Wesfarmers Ltd. | | | 479 | | | | 14,916 | |
| | | | | | | | |
| | | Shares | | | Value | |
| Australia–(continued) | |
Westfield Corp. | | | 1,980 | | | $ | 13,370 | |
Westpac Banking Corp. | | | 705 | | | | 16,294 | |
Woodside Petroleum Ltd. | | | 723 | | | | 15,488 | |
Woolworths Ltd. | | | 846 | | | | 15,174 | |
| | | | | 797,771 | |
|
| Austria–0.11% | |
Erste Group Bank AG | | | 261 | | | | 8,197 | |
Voestalpine AG | | | 207 | | | | 7,324 | |
| | | | | 15,521 | |
|
| Belgium–0.25% | |
Ageas | | | 205 | | | | 7,488 | |
Anheuser-Busch InBev SA/NV | | | 58 | | | | 6,657 | |
KBC Groep N.V.(a) | | | 114 | | | | 6,947 | |
Solvay S.A. | | | 64 | | | | 7,345 | |
UCB S.A. | | | 87 | | | | 5,882 | |
| | | | | 34,319 | |
|
| Brazil–0.21% | |
Ambev S.A. | | | 1,300 | | | | 7,671 | |
Engie Brasil Energia SA | | | 600 | | | | 7,624 | |
Telefonica Brasil S.A.–Preference Shares | | | 400 | | | | 5,788 | |
Ultrapar Participacoes S.A. | | | 300 | | | | 6,799 | |
| | | | | 27,882 | |
|
| Chile–0.58% | |
Banco de Chile | | | 120,987 | | | | 14,611 | |
Banco de Credito e Inversiones (BCI) | | | 1 | | | | 27 | |
Banco Santander Chile | | | 182,957 | | | | 10,449 | |
Cencosud S.A. | | | 2,485 | | | | 8,217 | |
Empresa Nacional de Electricidad S.A. | | | 12,760 | | | | 8,778 | |
Empresas CMPC S.A. | | | 3,968 | | | | 8,595 | |
Empresas COPEC S.A. | | | 926 | | | | 9,342 | |
Enersis Américas S.A. | | | 42,385 | | | | 7,268 | |
S.A.C.I. Falabella | | | 1,439 | | | | 11,290 | |
| | | | | 78,577 | |
|
| China–0.90% | |
AAC Technologies Holdings Inc. | | | 1,284 | | | | 12,220 | |
Agricultural Bank of China Ltd.–Class H | | | 18,000 | | | | 7,590 | |
Bank of China Ltd.–Class H | | | 15,000 | | | | 6,712 | |
Bank of Communications Co. Ltd.–Class H | | | 8,000 | | | | 6,096 | |
China Cinda Asset Management Co. Ltd.–Class H | | | 18,000 | | | | 6,476 | |
China CITIC Bank Corp. Ltd.–Class H | | | 11,000 | | | | 7,106 | |
China Conch Venture Holdings Ltd. | | | 3,500 | | | | 6,536 | |
China Construction Bank Corp.–Class H | | | 10,000 | | | | 7,304 | |
China Minsheng Banking Corp., Ltd.–Class H | | | 6,000 | | | | 6,838 | |
China Mobile Ltd. | | | 500 | | | | 5,728 | |
CITIC Ltd. | | | 4,000 | | | | 5,736 | |
See accompanying Notes to Financial Statements which are an integral part of the financial statements.
10 Invesco Macro Long/Short Fund
| | | | | | | | |
| | | Shares | | | Value | |
| China–(continued) | |
CSPC Pharmaceutical Group Ltd. | | | 16,000 | | | $ | 16,587 | |
Hengan International Group Co. Ltd. | | | 817 | | | | 6,505 | |
Industrial & Commercial Bank of China Ltd.–Class H | | | 11,000 | | | | 6,606 | |
Jiangsu Expressway Co. Ltd.–Class H | | | 4,000 | | | | 5,447 | |
Tencent Holdings Ltd. | | | 300 | | | | 7,944 | |
| | | | | 121,431 | |
|
| Colombia–0.10% | |
Banco Davivienda S.A.–Preference Shares | | | 695 | | | | 7,073 | |
Bancolombia S.A.–Preference Shares | | | 626 | | | | 5,942 | |
| | | | | 13,015 | |
|
| Czech Republic–0.10% | |
CEZ A.S. | | | 361 | | | | 6,796 | |
Komercni Banka A.S. | | | 175 | | | | 6,410 | |
| | | | | 13,206 | |
|
| Denmark–0.60% | |
A.P. Møller — Maersk A/S–Class B | | | 6 | | | | 9,186 | |
Carlsberg A/S–Class B | | | 103 | | | | 9,288 | |
Coloplast A/S–Class B | | | 123 | | | | 8,573 | |
Danske Bank A/S | | | 327 | | | | 10,096 | |
Genmab A/S(a) | | | 60 | | | | 9,900 | |
Novo Nordisk A/S–Class B | | | 207 | | | | 7,405 | |
Novozymes A/S–Class B | | | 207 | | | | 7,689 | |
Pandora A/S | | | 75 | | | | 9,763 | |
Vestas Wind Systems A/S | | | 112 | | | | 8,984 | |
| | | | | 80,884 | |
|
| Finland–0.33% | |
Fortum Oyj | | | 468 | | | | 7,804 | |
Kone Oyj–Class B | | | 147 | | | | 6,766 | |
Nokia Oyj | | | 1,296 | | | | 5,787 | |
Sampo Oyj–Class A | | | 165 | | | | 7,566 | |
UPM-Kymmene Oyj | | | 364 | | | | 8,471 | |
Wartsila OYJ Abp | | | 174 | | | | 7,526 | |
| | | | | 43,920 | |
|
| France–2.45% | |
Accor S.A. | | | 183 | | | | 6,948 | |
Air Liquide S.A. | | | 73 | | | | 7,419 | |
Airbus Group SE | | | 122 | | | | 7,244 | |
Arkema S.A. | | | 78 | | | | 7,396 | |
Atos SE | | | 72 | | | | 7,479 | |
AXA S.A. | | | 338 | | | | 7,611 | |
BNP Paribas S.A. | | | 126 | | | | 7,309 | |
Bouygues S.A. | | | 227 | | | | 7,408 | |
Bureau Veritas S.A. | | | 324 | | | | 6,121 | |
Capgemini S.A. | | | 76 | | | | 6,297 | |
Carrefour S.A. | | | 268 | | | | 7,037 | |
Christian Dior SE | | | 44 | | | | 8,489 | |
Cie Generale des Etablissements Michelin | | | 70 | | | | 7,579 | |
Compagnie de Saint-Gobain | | | 162 | | | | 7,200 | |
| | | | | | | | |
| | | Shares | | | Value | |
| France–(continued) | |
Credit Agricole S.A. | | | 753 | | | $ | 8,105 | |
Danone | | | 96 | | | | 6,648 | |
Dassault Systemes S.A. | | | 83 | | | | 6,577 | |
Engie S.A. | | | 438 | | | | 6,320 | |
Essilor International S.A. | | | 56 | | | | 6,284 | |
Hermes International | | | 17 | | | | 6,888 | |
Kering | | | 37 | | | | 8,207 | |
Klepierre | | | 159 | | | | 6,504 | |
L’Oreal S.A. | | | 39 | | | | 6,981 | |
Legrand S.A. | | | 127 | | | | 7,171 | |
LVMH Moet Hennessy Louis Vuitton S.E. | | | 40 | | | | 7,269 | |
Orange S.A. | | | 476 | | | | 7,498 | |
Pernod Ricard S.A. | | | 64 | | | | 7,612 | |
Peugeot S.A.(a) | | | 469 | | | | 7,025 | |
Publicis Groupe S.A. | | | 95 | | | | 6,518 | |
Renault S.A. | | | 81 | | | | 7,044 | |
Safran S.A. | | | 105 | | | | 7,211 | |
Sanofi | | | 86 | | | | 6,689 | |
Schneider Electric S.E. | | | 105 | | | | 7,047 | |
SCOR S.E. | | | 226 | | | | 7,323 | |
Societe Generale S.A. | | | 196 | | | | 7,629 | |
Sodexo S.A. | | | 61 | | | | 7,090 | |
SUEZ | | | 456 | | | | 7,227 | |
Technip S.A. | | | 124 | | | | 8,194 | |
Thales S.A. | | | 85 | | | | 8,003 | |
TOTAL S.A. | | | 138 | | | | 6,604 | |
Unibail-Rodamco S.E. | | | 26 | | | | 6,193 | |
Valeo S.A. | | | 135 | | | | 7,780 | |
Veolia Environnement S.A. | | | 324 | | | | 7,071 | |
Vinci S.A. | | | 95 | | | | 6,868 | |
Vivendi S.A. | | | 377 | | | | 7,623 | |
Zodiac Aerospace | | | 299 | | | | 7,277 | |
| | | | | 330,017 | |
| | |
| Germany–1.86% | | | | | | | | |
adidas AG | | | 45 | | | | 7,380 | |
Allianz S.E. | | | 48 | | | | 7,482 | |
BASF S.E. | | | 92 | | | | 8,110 | |
Bayer AG | | | 73 | | | | 7,235 | |
Bayerische Motoren Werke AG | | | 82 | | | | 7,144 | |
Beiersdorf AG | | | 73 | | | | 6,427 | |
Brenntag AG | | | 132 | | | | 7,056 | |
Commerzbank AG | | | 994 | | | | 6,751 | |
Continental AG | | | 35 | | | | 6,706 | |
Daimler AG | | | 110 | | | | 7,838 | |
Deutsche Bank AG(a) | | | 489 | | | | 7,062 | |
Deutsche Lufthansa AG | | | 607 | | | | 7,759 | |
Deutsche Post AG | | | 226 | | | | 7,004 | |
Deutsche Telekom AG | | | 432 | | | | 7,040 | |
Deutsche Wohnen AG | | | 190 | | | | 6,199 | |
E.ON S.E. | | | 707 | | | | 5,161 | |
Fresenius Medical Care AG & Co. KGaA | | | 81 | | | | 6,599 | |
See accompanying Notes to Financial Statements which are an integral part of the financial statements.
11 Invesco Macro Long/Short Fund
| | | | | | | | |
| | | Shares | | | Value | |
| Germany–(continued) | | | | | | | | |
Fresenius S.E. & Co. KGaA | | | 94 | | | $ | 6,938 | |
GEA Group AG | | | 132 | | | | 5,104 | |
HeidelbergCement AG | | | 78 | | | | 7,377 | |
Henkel AG & Co. KGaA–Preference Shares | | | 54 | | | | 6,930 | |
Infineon Technologies AG | | | 436 | | | | 7,828 | |
K+S AG | | | 345 | | | | 6,980 | |
Linde AG | | | 42 | | | | 6,930 | |
Merck KGaA | | | 67 | | | | 6,889 | |
Metro AG | | | 233 | | | | 6,980 | |
Muenchener Rueckversicherungs-Gesellschaft AG | | | 38 | | | | 7,367 | |
Porsche Automobil Holding S.E.–Preference Shares | | | 142 | | | | 7,658 | |
ProSiebenSat.1 Media SE | | | 166 | | | | 7,154 | |
RWE AG(a) | | | 433 | | | | 6,873 | |
SAP S.E. | | | 80 | | | | 7,047 | |
Siemens AG | | | 59 | | | | 6,700 | |
Symrise AG | | | 96 | | | | 6,588 | |
thyssenkrupp AG | | | 315 | | | | 7,293 | |
Uniper SE(a) | | | 1 | | | | 9 | |
Volkswagen AG–Preference Shares | | | 49 | | | | 6,734 | |
Vonovia SE | | | 184 | | | | 6,490 | |
| | | | | 250,822 | |
|
| Hong Kong–3.00% | |
AIA Group Ltd. | | | 2,400 | | | | 15,148 | |
Bank of East Asia, Ltd.(The) | | | 3,600 | | | | 14,480 | |
Cheung Kong Infrastructure Holdings Ltd. | | | 2,000 | | | | 16,368 | |
Cheung Kong Property Holdings Ltd. | | | 2,000 | | | | 14,815 | |
CK Hutchison Holdings Ltd. | | | 1,000 | | | | 12,372 | |
CLP Holdings Ltd. | | | 1,500 | | | | 15,244 | |
Galaxy Entertainment Group Ltd. | | | 4,000 | | | | 16,427 | |
Hang Lung Properties Ltd. | | | 7,000 | | | | 15,452 | |
Hang Seng Bank Ltd. | | | 900 | | | | 16,231 | |
Henderson Land Development Co. Ltd. | | | 2,441 | | | | 14,463 | |
Hong Kong & China Gas Co., Ltd. | | | 8,224 | | | | 16,118 | |
Hong Kong Exchanges & Clearing Ltd. | | | 600 | | | | 15,859 | |
Hongkong Land Holdings Ltd. | | | 2,400 | | | | 16,080 | |
Jardine Matheson Holdings Ltd. | | | 200 | | | | 12,164 | |
Jardine Strategic Holdings Ltd. | | | 500 | | | | 17,513 | |
Link REIT | | | 2,000 | | | | 14,261 | |
MTR Corp. Ltd. | | | 3,000 | | | | 16,591 | |
New World Development Co. Ltd. | | | 12,000 | | | | 14,962 | |
Power Assets Holdings Ltd. | | | 1,500 | | | | 14,109 | |
Sands China Ltd. | | | 3,600 | | | | 15,624 | |
Sino Land Co. Ltd. | | | 10,000 | | | | 16,981 | |
Sun Hung Kai Properties Ltd. | | | 1,000 | | | | 14,897 | |
Swire Pacific Ltd.–Class A | | | 1,500 | | | | 15,599 | |
Techtronic Industries Co. Ltd. | | | 4,000 | | | | 15,060 | |
WH Group Ltd.–REGS(b) | | | 27,500 | | | | 22,304 | |
Wharf (Holdings) Ltd.(The) | | | 2,000 | | | | 15,035 | |
| | | | | 404,157 | |
| | | | | | | | |
| | | Shares | | | Value | |
| Hungary–0.17% | | | | | | | | |
MOL Hungarian Oil and Gas PLC | | | 129 | | | $ | 8,299 | |
OTP Bank Nyrt. | | | 254 | | | | 7,116 | |
Richter Gedeon Nyrt | | | 357 | | | | 7,672 | |
| | | | | 23,087 | |
|
| India–0.17% | |
HDFC Bank Ltd.–ADR | | | 105 | | | | 7,432 | |
Reliance Industries Ltd.–GDR–REGS(b) | | | 235 | | | | 7,449 | |
Wipro Ltd.–ADR | | | 765 | | | | 7,398 | |
| | | | | 22,279 | |
|
| Indonesia–0.21% | |
PT Bank Central Asia Tbk | | | 7,400 | | | | 8,793 | |
PT Telekomunikasi Indonesia Persero Tbk | | | 20,100 | | | | 6,489 | |
PT Unilever Indonesia Tbk | | | 1,800 | | | | 6,136 | |
PT Waskita Karya (Persero) Tbk | | | 32,200 | | | | 6,456 | |
| | | | | 27,874 | |
|
| Ireland–0.42% | |
Bank of Ireland(a) | | | 31,616 | | | | 6,750 | |
CRH PLC | | | 214 | | | | 6,936 | |
Experian PLC | | | 1,579 | | | | 30,315 | |
Kerry Group PLC–Class A | | | 84 | | | | 6,099 | |
Paddy Power Betfair PLC | | | 60 | | | | 6,211 | |
| | | | | 56,311 | |
|
| Italy–0.50% | |
Assicurazioni Generali S.p.A. | | | 562 | | | | 7,262 | |
Atlantia S.p.A. | | | 258 | | | | 6,326 | |
Enel S.p.A. | | | 1,607 | | | | 6,904 | |
Eni S.p.A. | | | 444 | | | | 6,421 | |
Intesa Sanpaolo S.p.A. | | | 2,945 | | | | 6,799 | |
Luxottica Group S.p.A. | | | 149 | | | | 7,385 | |
Snam S.p.A. | | | 1,235 | | | | 6,517 | |
Telecom Italia S.p.A.(a) | | | 7,709 | | | | 6,720 | |
Terna — Rete Elettrica Nazionale S.p.A. | | | 1,391 | | | | 6,821 | |
UniCredit S.p.A. | | | 2,767 | | | | 6,849 | |
| | | | | 68,004 | |
|
| Japan–11.48% | |
AEON Co., Ltd. | | | 700 | | | | 9,699 | |
Aisin Seiki Co., Ltd. | | | 200 | | | | 8,785 | |
Ajinomoto Co., Inc. | | | 500 | | | | 11,128 | |
ANA Holdings Inc. | | | 4,000 | | | | 11,260 | |
Asahi Glass Co., Ltd. | | | 2,000 | | | | 14,018 | |
Asahi Group Holdings, Ltd. | | | 300 | | | | 10,731 | |
Asahi Kasei Corp. | | | 1,000 | | | | 9,024 | |
Astellas Pharma Inc. | | | 600 | | | | 8,923 | |
Bandai Namco Holdings Inc. | | | 400 | | | | 12,015 | |
Bridgestone Corp. | | | 300 | | | | 11,180 | |
Canon Inc. | | | 300 | | | | 8,616 | |
Central Japan Railway Co. | | | 100 | | | | 17,013 | |
Chubu Electric Power Co., Inc. | | | 700 | | | | 10,310 | |
See accompanying Notes to Financial Statements which are an integral part of the financial statements.
12 Invesco Macro Long/Short Fund
| | | | | | | | |
| | | Shares | | | Value | |
| Japan–(continued) | |
Chugai Pharmaceutical Co., Ltd. | | | 300 | | | $ | 10,242 | |
Dai Nippon Printing Co., Ltd. | | | 1,000 | | | | 10,037 | |
Dai-ichi Life Holdings, Inc. | | | 700 | | | | 10,257 | |
Daiichi Sankyo Co., Ltd. | | | 400 | | | | 9,622 | |
Daikin Industries, Ltd. | | | 100 | | | | 9,594 | |
Daito Trust Construction Co., Ltd. | | | 100 | | | | 16,760 | |
Daiwa House Industry Co., Ltd. | | | 400 | | | | 11,008 | |
Daiwa Securities Group Inc. | | | 2,000 | | | | 11,944 | |
Denso Corp. | | | 200 | | | | 8,687 | |
Dentsu Inc. | | | 200 | | | | 9,994 | |
East Japan Railway Co. | | | 100 | | | | 8,817 | |
Eisai Co., Ltd. | | | 200 | | | | 12,757 | |
FANUC Corp. | | | 100 | | | | 18,738 | |
Fuji Heavy Industries Ltd. | | | 200 | | | | 7,787 | |
FUJIFILM Holdings Corp. | | | 300 | | | | 11,372 | |
Fujitsu Ltd. | | | 2,000 | | | | 11,854 | |
Hankyu Hanshin Holdings, Inc. | | | 300 | | | | 9,956 | |
Hitachi, Ltd. | | | 2,000 | | | | 10,641 | |
Honda Motor Co., Ltd. | | | 300 | | | | 8,975 | |
Hoya Corp. | | | 300 | | | | 12,526 | |
INPEX Corp. | | | 1,200 | | | | 11,162 | |
Isuzu Motors Ltd. | | | 900 | | | | 11,129 | |
ITOCHU Corp. | | | 800 | | | | 10,135 | |
Japan Airlines Co. Ltd. | | | 300 | | | | 8,857 | |
Japan Exchange Group Inc. | | | 600 | | | | 8,943 | |
Japan Post Holdings Co., Ltd. | | | 800 | | | | 10,193 | |
Japan Real Estate Investment Corp. | | | 2 | | | | 11,577 | |
Japan Retail Fund Investment Corp. | | | 4 | | | | 9,085 | |
Japan Tobacco, Inc. | | | 300 | | | | 11,426 | |
JFE Holdings, Inc. | | | 600 | | | | 8,600 | |
JX Holdings, Inc. | | | 2,700 | | | | 10,667 | |
Kajima Corp. | | | 2,000 | | | | 13,522 | |
Kansai Electric Power Co., Inc.(The)(a) | | | 1,100 | | | | 10,537 | |
Kao Corp. | | | 200 | | | | 10,308 | |
KDDI Corp. | | | 300 | | | | 9,132 | |
Keio Corp. | | | 1,000 | | | | 8,287 | |
Kintetsu Group Holdings Co., Ltd. | | | 3,000 | | | | 12,119 | |
Kirin Holdings Co., Ltd. | | | 600 | | | | 10,342 | |
Koito Manufacturing Co., Ltd. | | | 200 | | | | 10,428 | |
Komatsu Ltd. | | | 500 | | | | 11,145 | |
Kubota Corp. | | | 700 | | | | 11,284 | |
Kyocera Corp. | | | 200 | | | | 9,730 | |
Lawson, Inc. | | | 100 | | | | 7,610 | |
Makita Corp. | | | 200 | | | | 13,865 | |
Marubeni Corp. | | | 2,100 | | | | 11,051 | |
Mazda Motor Corp. | | | 600 | | | | 9,849 | |
MEIJI Holdings Co., Ltd. | | | 100 | | | | 9,994 | |
Mitsubishi Chemical Holdings Corp. | | | 1,600 | | | | 10,514 | |
Mitsubishi Corp. | | | 500 | | | | 10,924 | |
Mitsubishi Electric Corp. | | | 800 | | | | 10,828 | |
Mitsubishi Estate Co., Ltd. | | | 1,000 | | | | 19,822 | |
| | | | | | | | |
| | | Shares | | | Value | |
| Japan–(continued) | |
Mitsubishi Heavy Industries, Ltd. | | | 2,000 | | | $ | 8,553 | |
Mitsubishi UFJ Financial Group, Inc. | | | 1,800 | | | | 9,325 | |
Mitsui & Co., Ltd. | | | 800 | | | | 11,105 | |
Mizuho Financial Group, Inc. | | | 5,700 | | | | 9,610 | |
MS&AD Insurance Group Holdings, Inc. | | | 300 | | | | 8,908 | |
Murata Manufacturing Co., Ltd. | | | 100 | | | | 13,947 | |
NEC Corp. | | | 4,000 | | | | 10,719 | |
NGK Insulators, Ltd. | | | 500 | | | | 9,171 | |
Nidec Corp. | | | 100 | | | | 9,698 | |
Nikon Corp. | | | 700 | | | | 10,594 | |
Nippon Building Fund Inc. | | | 2 | | | | 11,898 | |
Nippon Paint Holdings Co., Ltd. | | | 300 | | | | 10,213 | |
Nippon Steel & Sumitomo Metal Corp. | | | 500 | | | | 9,885 | |
Nippon Telegraph & Telephone Corp. | | | 200 | | | | 8,888 | |
Nissan Motor Co., Ltd. | | | 1,000 | | | | 10,171 | |
Nitori Holdings Co., Ltd. | | | 100 | | | | 11,987 | |
Nitto Denko Corp. | | | 200 | | | | 13,942 | |
Nomura Holdings, Inc. | | | 2,100 | | | | 10,544 | |
Nomura Real Estate Master Fund, Inc. | | | 6 | | | | 9,727 | |
NTT Data Corp. | | | 200 | | | | 10,337 | |
NTT DOCOMO, Inc. | | | 400 | | | | 10,072 | |
Obayashi Corp. | | | 1,100 | | | | 10,626 | |
Odakyu Electric Railway Co., Ltd. | | | 500 | | | | 10,214 | |
Olympus Corp. | | | 300 | | | | 10,728 | |
OMRON Corp. | | | 300 | | | | 11,529 | |
Ono Pharmaceutical Co., Ltd. | | | 400 | | | | 10,173 | |
Oriental Land Co., Ltd. | | | 200 | | | | 11,691 | |
ORIX Corp. | | | 700 | | | | 11,118 | |
Osaka Gas Co., Ltd. | | | 3,000 | | | | 12,477 | |
Otsuka Holdings Co., Ltd. | | | 200 | | | | 8,767 | |
Panasonic Corp. | | | 1,000 | | | | 10,437 | |
Rakuten Inc. | | | 800 | | | | 9,250 | |
Recruit Holdings Co., Ltd. | | | 300 | | | | 12,073 | |
Resona Holdings, Inc. | | | 2,200 | | | | 9,758 | |
Ricoh Co., Ltd. | | | 1,100 | | | | 8,979 | |
Ryohin Keikaku Co., Ltd. | | | 100 | | | | 21,399 | |
Santen Pharmaceutical Co., Ltd. | | | 800 | | | | 11,683 | |
SECOM Co., Ltd. | | | 100 | | | | 7,221 | |
Sekisui Chemical Co., Ltd. | | | 700 | | | | 11,027 | |
Sekisui House, Ltd. | | | 600 | | | | 9,920 | |
Seven & i Holdings Co., Ltd. | | | 200 | | | | 8,359 | |
Shimano Inc. | | | 100 | | | | 17,127 | |
Shimizu Corp. | | | 1,000 | | | | 8,897 | |
Shin-Etsu Chemical Co., Ltd. | | | 100 | | | | 7,601 | |
Shionogi & Co., Ltd. | | | 200 | | | | 9,855 | |
Shiseido Co., Ltd. | | | 400 | | | | 10,329 | |
SoftBank Group Corp. | | | 200 | | | | 12,591 | |
Sompo Holdings, Inc. | | | 300 | | | | 9,716 | |
Sony Corp. | | | 300 | | | | 9,494 | |
Sumitomo Chemical Co., Ltd. | | | 2,000 | | | | 9,473 | |
Sumitomo Corp. | | | 900 | | | | 10,365 | |
See accompanying Notes to Financial Statements which are an integral part of the financial statements.
13 Invesco Macro Long/Short Fund
| | | | | | | | |
| | | Shares | | | Value | |
| Japan–(continued) | |
Sumitomo Electric Industries, Ltd. | | | 700 | | | $ | 10,352 | |
Sumitomo Metal Mining Co., Ltd. | | | 1,000 | | | | 12,964 | |
Sumitomo Mitsui Financial Group, Inc. | | | 300 | | | | 10,429 | |
Sumitomo Mitsui Trust Holdings, Inc. | | | 300 | | | | 10,156 | |
Suntory Beverage & Food Ltd. | | | 200 | | | | 8,738 | |
Suzuki Motor Corp. | | | 300 | | | | 10,649 | |
Sysmex Corp. | | | 200 | | | | 13,880 | |
T&D Holdings, Inc. | | | 900 | | | | 10,884 | |
Taisei Corp. | | | 1,000 | | | | 7,514 | |
Takeda Pharmaceutical Co. Ltd. | | | 200 | | | | 8,955 | |
TDK Corp. | | | 200 | | | | 13,815 | |
Terumo Corp. | | | 300 | | | | 11,629 | |
Tobu Railway Co., Ltd. | | | 2,000 | | | | 9,831 | |
Tohoku Electric Power Co., Inc. | | | 800 | | | | 9,803 | |
Tokio Marine Holdings, Inc. | | | 300 | | | | 11,840 | |
Tokyo Electric Power Co. Holdings, Inc.(a) | | | 2,400 | | | | 9,338 | |
Tokyo Electron Ltd. | | | 100 | | | | 9,048 | |
Tokyo Gas Co., Ltd. | | | 2,000 | | | | 9,068 | |
Tokyu Corp. | | | 1,000 | | | | 7,496 | |
Toppan Printing Co., Ltd. | | | 1,000 | | | | 9,409 | |
Toray Industries, Inc. | | | 1,000 | | | | 9,334 | |
Toshiba Corp.(a) | | | 3,000 | | | | 10,878 | |
TOTO Ltd. | | | 300 | | | | 11,995 | |
Toyota Industries Corp. | | | 200 | | | | 9,162 | |
Toyota Motor Corp. | | | 200 | | | | 11,554 | |
Toyota Tsusho Corp. | | | 400 | | | | 9,457 | |
Unicharm Corp. | | | 400 | | | | 9,530 | |
West Japan Railway Co. | | | 200 | | | | 12,343 | |
Yahoo! Japan Corp. | | | 2,500 | | | | 9,608 | |
Yamato Holdings Co., Ltd. | | | 400 | | | | 9,136 | |
| | | | | 1,548,301 | |
|
| Luxembourg–0.12% | |
ArcelorMittal S.A.(a) | | | 1,198 | | | | 8,034 | |
Tenaris S.A. | | | 541 | | | | 7,641 | |
| | | | | 15,675 | |
|
| Malaysia–1.64% | |
Axiata Group Bhd. | | | 5,968 | | | | 7,000 | |
CIMB Group Holdings Bhd. | | | 5,900 | | | | 7,075 | |
DiGi.Com Bhd. | | | 7,300 | | | | 8,759 | |
Gamuda Bhd. | | | 6,800 | | | | 7,960 | |
Genting Malaysia Bhd. | | | 6,100 | | | | 6,922 | |
Hap Seng Consolidated Bhd. | | | 4,700 | | | | 8,722 | |
IHH Healthcare Bhd. | | | 7,421 | | | | 11,323 | |
IJM Corp. Bhd. | | | 10,158 | | | | 7,992 | |
IOI Corp. Bhd. | | | 6,200 | | | | 6,642 | |
Kuala Lumpur Kepong Bhd. | | | 2,000 | | | | 11,425 | |
Malayan Banking Bhd. | | | 5,919 | | | | 11,142 | |
Maxis Bhd. | | | 5,781 | | | | 8,214 | |
MISC Bhd. | | | 4,624 | | | | 8,290 | |
Petronas Chemicals Group Bhd. | | | 5,100 | | | | 8,511 | |
| | | | | | | | |
| | | Shares | | | Value | |
| Malaysia–(continued) | |
Petronas Dagangan Bhd. | | | 2,000 | | | $ | 11,138 | |
Petronas Gas Bhd. | | | 2,000 | | | | 10,522 | |
Public Bank Bhd. | | | 3,885 | | | | 18,395 | |
RHB Bank Bhd. | | | 6,300 | | | | 7,255 | |
Sime Darby Bhd. | | | 3,305 | | | | 6,453 | |
Telekom Malaysia Bhd. | | | 11,691 | | | | 18,229 | |
Tenaga Nasional Bhd. | | | 3,622 | | | | 12,383 | |
Westports Holdings Bhd. | | | 9,000 | | | | 9,449 | |
YTL Corp. Bhd. | | | 21,100 | | | | 7,998 | |
| | | | | 221,799 | |
|
| Mexico–1.28% | |
Alfa, S.A.B. de C.V.–Class A | | | 4,600 | | | | 6,979 | |
America Movil S.A.B. de C.V.–Series L | | | 10,840 | | | | 7,180 | |
Arca Continental S.A.B. de C.V. | | | 1,332 | | | | 8,277 | |
Coca-Cola Femsa, S.A.B. de C.V.–Series L | | | 1,200 | | | | 9,010 | |
Fibra Uno Administracion S.A. de C.V. | | | 4,900 | | | | 9,324 | |
Fomento Economico Mexicano, S.A.B. de C.V.–Series BD(c) | | | 1,000 | | | | 9,588 | |
Gruma, S.A.B. de C.V. –Class B | | | 525 | | | | 7,297 | |
Grupo Aeroportuario del Pacífico, S.A.B. de C.V.–Class B | | | 800 | | | | 7,728 | |
Grupo Aeroportuario del Sureste, S.A.B. de C.V.–Class B | | | 555 | | | | 8,835 | |
Grupo Bimbo, S.A.B. de C.V.–Series A | | | 2,700 | | | | 7,279 | |
Grupo Elektra, S.A.B. de C.V. | | | 425 | | | | 5,881 | |
Grupo Financiero Banorte S.A.B. de C.V.–Class O | | | 1,200 | | | | 7,079 | |
Grupo Financiero Inbursa, S.A.B. de C.V.–Class O | | | 3,900 | | | | 6,355 | |
Grupo Financiero Santander Mexico, S.A.B. de C.V.–Class B | | | 3,900 | | | | 7,063 | |
Grupo Lala, S.A.B. de C.V. | | | 3,700 | | | | 6,880 | |
Grupo Mexico S.A.B. de C.V.–Series B | | | 2,900 | | | | 7,119 | |
Grupo Televisa S.A.B.–Series CPO(d) | | | 1,400 | | | | 6,878 | |
Infraestructura Enérgetica Nova, S.A.B. de C.V. | | | 2,000 | | | | 8,835 | |
Kimberly-Clark de Mexico, S.A.B. de C.V.–Class A | | | 3,200 | | | | 6,895 | |
Mexichem S.A.B. de C.V. | | | 3,000 | | | | 7,169 | |
Nemak, S.A.B. de C.V.–REGS(b) | | | 7,600 | | | | 7,913 | |
Promotora y Operadora de Infraestructura, S.A.B. de C.V. | | | 645 | | | | 7,195 | |
Wal-Mart de México, S.A.B. de C.V.–Series V | | | 3,024 | | | | 6,396 | |
| | | | | 173,155 | |
|
| Netherlands–0.84% | |
Aegon N.V. | | | 1,769 | | | | 7,616 | |
Akzo Nobel N.V. | | | 109 | | | | 7,039 | |
ASML Holding N.V. | | | 71 | | | | 7,521 | |
Gemalto N.V. | | | 102 | | | | 5,527 | |
Heineken Holding N.V. | | | 86 | | | | 6,619 | |
Heineken N.V. | | | 78 | | | | 6,421 | |
ING Groep N.V. | | | 540 | | | | 7,099 | |
See accompanying Notes to Financial Statements which are an integral part of the financial statements.
14 Invesco Macro Long/Short Fund
| | | | | | | | |
| | | Shares | | | Value | |
| Netherlands–(continued) | |
Koninklijke Ahold Delhaize N.V. | | | 304 | | | $ | 6,939 | |
Koninklijke DSM N.V. | | | 101 | | | | 6,489 | |
Koninklijke KPN N.V. | | | 2,248 | | | | 7,332 | |
Koninklijke Philips N.V. | | | 263 | | | | 7,920 | |
NN Group N.V. | | | 242 | | | | 7,292 | |
NXP Semiconductors N.V.(a) | | | 86 | | | | 8,600 | |
Randstad Holding N.V. | | | 156 | | | | 8,024 | |
Steinhoff International Holdings N.V. | | | 1,204 | | | | 6,500 | |
Wolters Kluwer N.V. | | | 178 | | | | 6,883 | |
| | | | | 113,821 | |
|
| New Zealand–0.41% | |
Auckland International Airport Ltd. | | | 2,846 | | | | 13,411 | |
Fisher & Paykel Healthcare Corp. Ltd. | | | 2,118 | | | | 13,418 | |
Fletcher Building Ltd. | | | 1,972 | | | | 14,622 | |
Spark New Zealand Ltd. | | | 5,378 | | | | 14,075 | |
| | | | | 55,526 | |
|
| Norway–0.29% | |
DNB ASA | | | 777 | | | | 11,237 | |
Orkla ASA | | | 1,013 | | | | 9,560 | |
Statoil ASA | | | 588 | | | | 9,582 | |
Telenor ASA | | | 542 | | | | 8,626 | |
| | | | | 39,005 | |
|
| Philippines–0.52% | |
Aboitiz Equity Ventures Inc. | | | 4,520 | | | | 7,277 | |
Ayala Corp. | | | 360 | | | | 6,204 | |
Bank of the Philippine Islands | | | 4,290 | | | | 8,952 | |
BDO Unibank, Inc. | | | 3,200 | | | | 7,450 | |
GT Capital Holdings, Inc. | | | 240 | | | | 6,494 | |
Jollibee Foods Corp. | | | 1,560 | | | | 7,663 | |
Metro Pacific Investments Corp. | | | 47,100 | | | | 6,999 | |
Puregold Price Club, Inc. | | | 6,800 | | | | 5,719 | |
SM Investments Corp. | | | 465 | | | | 6,450 | |
Universal Robina Corp. | | | 1,920 | | | | 7,228 | |
| | | | | 70,436 | |
|
| Poland–0.14% | |
Orange Polska S.A. | | | 4,338 | | | | 6,192 | |
Polski Koncern Naftowy ORLEN S.A. | | | 352 | | | | 6,981 | |
Powszechny Zaklad Ubezpieczen S.A. | | | 867 | | | | 6,020 | |
| | | | | 19,193 | |
|
| Portugal–0.05% | |
EDP — Energias de Portugal, S.A. | | | 2,038 | | | | 6,736 | |
| | |
| Qatar–0.11% | | | | | | | | |
Masraf Al Rayan Q.S.C. | | | 686 | | | | 6,518 | |
Qatar National Bank S.A.Q. | | | 198 | | | | 8,700 | |
| | | | | 15,218 | |
|
| Russia–0.05% | |
PhosAgro PJSC–GDR–REGS(b) | | | 498 | | | | 6,175 | |
| | | | | | | | |
| | | Shares | | | Value | |
| Singapore–1.47% | | | | | | | | |
Ascendas REIT | | | 8,500 | | | $ | 14,481 | |
Broadcom Ltd. | | | 37 | | | | 6,300 | |
CapitaLand Ltd. | | | 6,700 | | | | 14,844 | |
City Developments Ltd. | | | 2,400 | | | | 14,647 | |
ComfortDelGro Corp. Ltd. | | | 7,300 | | | | 13,329 | |
DBS Group Holdings Ltd. | | | 1,400 | | | | 15,056 | |
Keppel Corp. Ltd. | | | 4,000 | | | | 15,130 | |
Oversea-Chinese Banking Corp. Ltd. | | | 2,400 | | | | 14,605 | |
Singapore Airlines Ltd. | | | 2,000 | | | | 14,563 | |
Singapore Exchange Ltd. | | | 2,800 | | | | 14,270 | |
Singapore Press Holdings Ltd. | | | 5,500 | | | | 14,685 | |
Singapore Telecommunications Ltd. | | | 5,200 | | | | 14,463 | |
United Overseas Bank Ltd. | | | 1,200 | | | | 16,181 | |
Wilmar International Ltd. | | | 6,700 | | | | 15,942 | |
| | | | | 198,496 | |
|
| South Africa–0.17% | |
Life Healthcare Group Holdings Ltd. | | | 2,646 | | | | 7,065 | |
Mondi Ltd. | | | 322 | | | | 6,293 | |
Vodacom Group Ltd. | | | 866 | | | | 9,342 | |
| | | | | 22,700 | |
|
| South Korea–1.14% | |
CJ CheilJedang Corp. | | | 19 | | | | 5,799 | |
DGB Financial Group Inc. | | | 923 | | | | 7,735 | |
E-MART Inc. | | | 51 | | | | 7,238 | |
GS Holdings Corp. | | | 145 | | | | 6,461 | |
Hanwha Life Insurance Co., Ltd. | | | 1,418 | | | | 7,742 | |
Hyundai Department Store Co., Ltd. | | | 58 | | | | 5,958 | |
Hyundai Home Shopping Network Corp. | | | 64 | | | | 6,351 | |
Hyundai Mobis Co., Ltd. | | | 25 | | | | 5,989 | |
Hyundai Motor Co. | | | 54 | | | | 6,597 | |
Industrial Bank of Korea | | | 631 | | | | 7,282 | |
Kangwon Land Inc. | | | 179 | | | | 5,939 | |
KB Financial Group Inc. | | | 244 | | | | 9,040 | |
Kia Motors Corp. | | | 166 | | | | 5,896 | |
Korea Electric Power Corp. | | | 136 | | | | 5,869 | |
Korea Gas Corp. | | | 163 | | | | 6,594 | |
Korea Zinc Co., Ltd. | | | 15 | | | | 5,958 | |
KT Corp. | | | 413 | | | | 11,653 | |
LG Corp. | | | 103 | | | | 5,509 | |
Samsung Electronics Co., Ltd. | | | 5 | | | | 7,133 | |
Shinhan Financial Group Co., Ltd. | | | 192 | | | | 7,392 | |
SK Telecom Co., Ltd. | | | 37 | | | | 7,252 | |
Woori Bank | | | 777 | | | | 8,478 | |
| | | | | 153,865 | |
|
| Spain–0.86% | |
Abertis Infraestructuras S.A. | | | 437 | | | | 6,496 | |
Aena S.A.–REGS(b) | | | 54 | | | | 7,929 | |
Amadeus IT Group S.A. | | | 162 | | | | 7,647 | |
Banco Bilbao Vizcaya Argentaria, S.A. | | | 1,140 | | | | 8,216 | |
Banco de Sabadell S.A. | | | 5,236 | | | | 6,991 | |
See accompanying Notes to Financial Statements which are an integral part of the financial statements.
15 Invesco Macro Long/Short Fund
| | | | | | | | |
| | | Shares | | | Value | |
| Spain–(continued) | |
Banco Santander S.A. | | | 1,607 | | | $ | 7,872 | |
CaixaBank S.A. | | | 2,718 | | | | 8,226 | |
Enagas S.A. | | | 230 | | | | 6,603 | |
Ferrovial, S.A. | | | 338 | | | | 6,570 | |
Ferrovial, S.A.–Rts.(a) | | | 338 | | | | 145 | |
Gas Natural SDG, S.A. | | | 335 | | | | 6,610 | |
Grifols S.A. | | | 336 | | | | 6,643 | |
Iberdrola S.A. | | | 1,041 | | | | 7,095 | |
Industria de Diseno Textil, S.A. | | | 205 | | | | 7,166 | |
Red Eléctrica Corp. S.A. | | | 320 | | | | 6,668 | |
Repsol S.A. | | | 552 | | | | 7,714 | |
Telefónica, S.A. | | | 721 | | | | 7,346 | |
| | | | | 115,937 | |
|
| Sweden–1.00% | |
Assa Abloy AB–Class B | | | 476 | | | | 8,649 | |
Atlas Copco AB–Class A | | | 331 | | | | 9,694 | |
Hennes & Mauritz AB–Class B | | | 321 | | | | 9,031 | |
Hexagon AB–Class B | | | 227 | | | | 7,931 | |
Investor AB–Class B | | | 266 | | | | 9,443 | |
Nordea Bank AB | | | 950 | | | | 9,973 | |
Sandvik AB | | | 869 | | | | 9,864 | |
Skandinaviska Enskilda Banken AB–Class A | | | 959 | | | | 9,662 | |
Skanska AB–Class B | | | 421 | | | | 9,145 | |
Svenska Cellulosa AB SCA–Class B | | | 308 | | | | 8,727 | |
Svenska Handelsbanken AB–Class A | | | 710 | | | | 9,672 | |
Swedbank AB–Class A | | | 411 | | | | 9,619 | |
Telefonaktiebolaget LM Ericsson–Class B | | | 1,298 | | | | 6,315 | |
Telia Co. AB | | | 2,094 | | | | 8,359 | |
Volvo AB–Class B | | | 877 | | | | 9,406 | |
| | | | | | | | 135,490 | |
| | |
| Switzerland–2.08% | | | | | | | | |
ABB Ltd. | | | 426 | | | | 8,766 | |
Actelion Ltd. | | | 56 | | | | 8,093 | |
Adecco Group AG (The) | | | 164 | | | | 9,739 | |
Cie Financiere Richemont S.A. | | | 165 | | | | 10,613 | |
Credit Suisse Group AG | | | 746 | | | | 10,398 | |
Geberit AG | | | 22 | | | | 9,300 | |
Givaudan S.A. | | | 5 | | | | 9,664 | |
Glencore PLC(a) | | | 13,423 | | | | 40,901 | |
Julius Baer Group Ltd. | | | 208 | | | | 8,417 | |
Kuehne + Nagel International AG | | | 68 | | | | 9,212 | |
LafargeHolcim Ltd. | | | 178 | | | | 9,507 | |
Nestle S.A. | | | 123 | | | | 8,918 | |
Novartis AG | | | 117 | | | | 8,310 | |
Roche Holding AG | | | 37 | | | | 8,490 | |
Schindler Holding AG–Participation Ctfs. | | | 50 | | | | 9,292 | |
SGS S.A. | | | 4 | | | | 8,109 | |
Sika AG | | | 2 | | | | 9,612 | |
Swatch Group AG (The) | | | 36 | | | | 10,830 | |
Swiss Re AG | | | 111 | | | | 10,309 | |
| | | | | | | | |
| | | Shares | | | Value | |
| Switzerland–(continued) | | | | | | | | |
Swisscom AG | | | 20 | | | $ | 9,138 | |
Syngenta AG | | | 23 | | | | 9,233 | |
TE Connectivity Ltd. | | | 95 | | | | 5,973 | |
UBS Group AG | | | 675 | | | | 9,550 | |
Wolseley PLC | | | 550 | | | | 28,574 | |
Zurich Insurance Group AG | | | 37 | | | | 9,680 | |
| | | | | | | | 280,628 | |
| | |
| Taiwan–2.62% | | | | | | | | |
Aerospace Industrial Development Corp. | | | 6,000 | | | | 7,605 | |
Asia Cement Corp. | | | 7,450 | | | | 6,495 | |
Asustek Computer Inc. | | | 1,000 | | | | 8,748 | |
Cathay Financial Holding Co., Ltd. | | | 4,758 | | | | 6,174 | |
Chailease Holding Co. Ltd. | | | 4,000 | | | | 6,915 | |
Chang Hwa Commercial Bank, Ltd. | | | 19,000 | | | | 9,710 | |
Cheng Shin Rubber Industry Co., Ltd. | | | 3,000 | | | | 6,103 | |
China Airlines Ltd. | | | 26,000 | | | | 7,860 | |
China Development Financial Holding Corp. | | | 31,224 | | | | 7,817 | |
China Life Insurance Co., Ltd. | | | 8,000 | | | | 7,375 | |
China Steel Corp. | | | 10,409 | | | | 7,520 | |
Chunghwa Telecom Co., Ltd. | | | 3,551 | | | | 12,164 | |
Compal Electronics Inc. | | | 11,000 | | | | 6,545 | |
CTBC Financial Holding Co. Ltd. | | | 14,325 | | | | 7,717 | |
E.Sun Financial Holding Co. Ltd. | | | 13,628 | | | | 7,740 | |
EVA Airways Corp. | | | 13,000 | | | | 6,262 | |
Far Eastern New Century Corp. | | | 9,691 | | | | 7,499 | |
Far EasTone Telecommunications Co., Ltd. | | | 4,267 | | | | 10,087 | |
First Financial Holding Co., Ltd. | | | 25,286 | | | | 13,261 | |
Formosa Chemicals & Fibre Corp. | | | 2,267 | | | | 6,746 | |
Formosa Petrochemical Corp. | | | 2,000 | | | | 6,686 | |
Formosa Plastics Corp. | | | 3,734 | | | | 10,105 | |
Foxconn Technology Co. Ltd. | | | 2,000 | | | | 5,805 | |
Fubon Financial Holding Co., Ltd. | | | 5,000 | | | | 7,082 | |
Hon Hai Precision Industry Co., Ltd. | | | 3,222 | | | | 8,694 | |
Hua Nan Financial Holdings Co., Ltd. | | | 20,367 | | | | 10,348 | |
Mega Financial Holding Co., Ltd. | | | 12,000 | | | | 8,202 | |
Nan Ya Plastics Corp. | | | 4,384 | | | | 9,127 | |
Powertech Technology Inc. | | | 2,000 | | | | 5,710 | |
President Chain Store Corp. | | | 1,000 | | | | 7,479 | |
Qisda Corp. | | | 15,000 | | | | 6,322 | |
Quanta Computer Inc. | | | 3,000 | | | | 6,059 | |
Shin Kong Financial Holding Co., Ltd.(a) | | | 34,412 | | | | 7,459 | |
Simplo Technology Co., Ltd. | | | 2,000 | | | | 6,179 | |
SinoPac Financial Holdings Co., Ltd. | | | 27,572 | | | | 7,951 | |
Synnex Technology International Corp. | | | 6,350 | | | | 6,763 | |
Taishin Financial Holding Co., Ltd. | | | 22,343 | | | | 8,166 | |
Taiwan Cooperative Financial Holding Co. Ltd. | | | 27,602 | | | | 12,105 | |
Taiwan Mobile Co., Ltd. | | | 3,217 | | | | 11,246 | |
Taiwan Semiconductor Manufacturing Co. Ltd. | | | 1,750 | | | | 10,453 | |
Uni-President Enterprises Corp. | | | 4,105 | | | | 7,948 | |
United Microelectronics Corp. | | | 18,000 | | | | 6,718 | |
WPG Holdings Ltd. | | | 7,068 | | | | 8,287 | |
See accompanying Notes to Financial Statements which are an integral part of the financial statements.
16 Invesco Macro Long/Short Fund
| | | | | | | | |
| | | Shares | | | Value | |
| Taiwan–(continued) | | | | | | | | |
Yuanta Financial Holding Co., Ltd. | | | 20,752 | | | $ | 7,748 | |
| | | | | | | | 352,985 | |
| | |
| Thailand–1.16% | | | | | | | | |
Airports of Thailand PCL | | | 700 | | | | 7,613 | |
Bangchak Petroleum PCL (The) | | | 6,800 | | | | 5,864 | |
Bangkok Airways PCL | | | 9,600 | | | | 6,824 | |
Bangkok Bank PCL | | | 1,700 | | | | 7,729 | |
Bangkok Dusit Medical Services PCL | | | 14,900 | | | | 9,684 | |
BTS Group Holdings PCL | | | 35,000 | | | | 8,543 | |
Central Pattana PCL | | | 4,300 | | | | 6,874 | |
CP ALL PCL | | | 3,900 | | | | 6,763 | |
Electricity Generating PCL | | | 1,600 | | | | 8,907 | |
Global Power Synergy PCL | | | 6,800 | | | | 6,881 | |
Home Product Center PCL | | | 22,033 | | | | 6,353 | |
IRPC PCL | | | 46,000 | | | | 6,277 | |
Kasikornbank PCL | | | 1,200 | | | | 5,882 | |
Krung Thai Bank PCL | | | 14,200 | | | | 6,962 | |
Land and Houses PCL | | | 25,700 | | | | 6,717 | |
Muangthai Leasing PCL | | | 14,000 | | | | 7,514 | |
Pruksa Real Estate PCL | | | 8,700 | | | | 5,737 | |
Siam Cement PCL (The) | | | 550 | | | | 7,913 | |
Siam Commercial Bank PCL (The) | | | 1,500 | | | | 6,133 | |
Thai Beverage PCL | | | 31,000 | | | | 21,477 | |
| | �� | | | | | | 156,647 | |
| | |
| Turkey–0.23% | | | | | | | | |
BIM Birlesik Magazalar A.S. | | | 400 | | | | 6,500 | |
Enka Insaat ve Sanayi A.S. | | | 4,197 | | | | 6,386 | |
Petkim PetroKimya Holding A.S. | | | 4,237 | | | | 5,738 | |
Turk Telekomunikasyon A.S. | | | 3,228 | | | | 5,951 | |
Turkcell Iletisim Hizmetleri A.S.(a) | | | 1,826 | | | | 5,869 | |
| | | | | | | | 30,444 | |
| | |
| United Arab Emirates–0.05% | | | | | | | | |
Dubai Islamic Bank PJSC | | | 4,488 | | | | 6,403 | |
| | |
| United Kingdom–9.81% | | | | | | | | |
Anglo American PLC(a) | | | 3,020 | | | | 41,700 | |
Associated British Foods PLC | | | 774 | | | | 23,321 | |
AstraZeneca PLC | | | 494 | | | | 27,698 | |
Aviva PLC | | | 5,596 | | | | 30,253 | |
BAE Systems PLC | | | 4,411 | | | | 29,251 | |
Barclays PLC | | | 13,996 | | | | 32,455 | |
BP PLC | | | 5,660 | | | | 33,419 | |
British American Tobacco PLC | | | 502 | | | | 28,822 | |
BT Group PLC | | | 6,199 | | | | 28,484 | |
Centrica PLC | | | 10,341 | | | | 27,108 | |
CNH Industrial N.V. | | | 966 | | | | 7,494 | |
Compass Group PLC | | | 1,666 | | | | 30,125 | |
Delphi Automotive PLC | | | 90 | | | | 5,856 | |
Diageo PLC | | | 1,137 | | | | 30,266 | |
Fiat Chrysler Automobiles N.V. | | | 1,057 | | | | 7,739 | |
| | | | | | | | |
| | | Shares | | | Value | |
| United Kingdom–(continued) | | | | | | | | |
GlaxoSmithKline PLC | | | 1,484 | | | $ | 29,328 | |
HSBC Holdings PLC | | | 4,199 | | | | 31,578 | |
Imperial Brands PLC | | | 590 | | | | 28,510 | |
International Consolidated Airlines Group, S.A. | | | 5,744 | | | | 30,486 | |
ITV PLC | | | 11,667 | | | | 24,291 | |
Kingfisher PLC | | | 6,505 | | | | 28,702 | |
Land Securities Group PLC | | | 2,222 | | | | 27,120 | |
Legal & General Group PLC | | | 11,273 | | | | 28,822 | |
Lloyds Banking Group PLC | | | 40,024 | | | | 27,986 | |
London Stock Exchange Group PLC | | | 882 | | | | 30,260 | |
Marks & Spencer Group PLC | | | 6,890 | | | | 28,650 | |
National Grid PLC | | | 2,279 | | | | 29,678 | |
Next PLC | | | 429 | | | | 25,243 | |
Old Mutual PLC | | | 12,152 | | | | 29,867 | |
Pearson PLC | | | 2,780 | | | | 25,693 | |
Prudential PLC | | | 1,732 | | | | 28,235 | |
Reckitt Benckiser Group PLC | | | 325 | | | | 29,057 | |
RELX N.V. | | | 408 | | | | 6,875 | |
RELX PLC | | | 1,670 | | | | 29,796 | |
Rio Tinto Ltd. | | | 428 | | | | 17,598 | |
Rio Tinto PLC | | | 1,048 | | | | 36,328 | |
Rolls-Royce Holdings PLC | | | 3,113 | | | | 27,678 | |
Rolls-Royce Holdings PLC–Preference Shares(a) | | | 143,198 | | | | 175 | |
Royal Bank of Scotland Group PLC(a) | | | 11,941 | | | | 27,569 | |
Royal Dutch Shell PLC–Class A | | | 1,292 | | | | 32,147 | |
Sky PLC | | | 2,845 | | | | 28,416 | |
Smith & Nephew PLC | | | 1,965 | | | | 28,311 | |
SSE PLC | | | 1,575 | | | | 30,666 | |
Standard Chartered PLC(a) | | | 3,689 | | | | 32,084 | |
Standard Life PLC | | | 6,618 | | | | 27,256 | |
Tesco PLC(a) | | | 14,212 | | | | 36,655 | |
Unilever N.V. | | | 153 | | | | 6,407 | |
Unilever PLC | | | 677 | | | | 28,319 | |
Vodafone Group PLC | | | 10,674 | | | | 29,303 | |
WPP PLC | | | 1,370 | | | | 29,763 | |
| | | | | | | | 1,322,843 | |
| | |
| United States–22.20% | | | | | | | | |
3M Co. | | | 34 | | | | 5,620 | |
Abbott Laboratories | | | 149 | | | | 5,847 | |
AbbVie Inc. | | | 93 | | | | 5,188 | |
ABM Industries Inc. | | | 385 | | | | 15,046 | |
Acadia Realty Trust | | | 400 | | | | 13,476 | |
Accenture PLC–Class A | | | 51 | | | | 5,928 | |
Activision Blizzard, Inc. | | | 145 | | | | 6,260 | |
Adobe Systems Inc.(a) | | | 61 | | | | 6,558 | |
AdvanSix Inc.(a) | | | 2 | | | | 32 | |
Aetna Inc. | | | 50 | | | | 5,368 | |
Aflac, Inc. | | | 87 | | | | 5,992 | |
Agree Realty Corp. | | | 313 | | | | 15,134 | |
Air Products and Chemicals, Inc. | | | 40 | | | | 5,337 | |
Alexion Pharmaceuticals, Inc.(a) | | | 50 | | | | 6,525 | |
See accompanying Notes to Financial Statements which are an integral part of the financial statements.
17 Invesco Macro Long/Short Fund
| | | | | | | | |
| | | Shares | | | Value | |
| United States–(continued) | | | | | | | | |
Allergan PLC(a) | | | 24 | | | $ | 5,015 | |
ALLETE, Inc. | | | 249 | | | | 15,261 | |
Allstate Corp.(The) | | | 91 | | | | 6,179 | |
Alphabet Inc.–Class A(a) | | | 8 | | | | 6,479 | |
Altria Group, Inc. | | | 94 | | | | 6,215 | |
Amazon.com, Inc.(a) | | | 8 | | | | 6,319 | |
American Airlines Group Inc. | | | 170 | | | | 6,902 | |
American Assets Trust, Inc. | | | 330 | | | | 13,104 | |
American Electric Power Co., Inc. | | | 95 | | | | 6,160 | |
American Express Co. | | | 92 | | | | 6,111 | |
American International Group, Inc. | | | 101 | | | | 6,232 | |
American States Water Co. | | | 285 | | | | 11,394 | |
American Tower Corp.–Class A | | | 56 | | | | 6,563 | |
Ameriprise Financial, Inc. | | | 58 | | | | 5,127 | |
Ameris Bancorp | | | 339 | | | | 12,306 | |
AMERISAFE, Inc. | | | 205 | | | | 11,398 | |
AmerisourceBergen Corp. | | | 70 | | | | 4,922 | |
Amgen Inc. | | | 36 | | | | 5,082 | |
Anadarko Petroleum Corp. | | | 117 | | | | 6,954 | |
Analog Devices, Inc. | | | 106 | | | | 6,795 | |
Analogic Corp. | | | 124 | | | | 10,149 | |
Anthem, Inc. | | | 50 | | | | 6,093 | |
Aon PLC | | | 53 | | | | 5,874 | |
Apache Corp. | | | 120 | | | | 7,138 | |
Apple Inc. | | | 55 | | | | 6,245 | |
Applied Industrial Technologies, Inc. | | | 284 | | | | 14,427 | |
Applied Materials, Inc. | | | 206 | | | | 5,990 | |
Archer-Daniels-Midland Co. | | | 138 | | | | 6,013 | |
Astoria Financial Corp. | | | 822 | | | | 12,026 | |
AT&T Inc. | | | 156 | | | | 5,739 | |
ATN International, Inc. | | | 181 | | | | 12,243 | |
Automatic Data Processing, Inc. | | | 69 | | | | 6,007 | |
AutoZone, Inc.(a) | | | 8 | | | | 5,937 | |
AvalonBay Communities, Inc. | | | 35 | | | | 5,991 | |
Avista Corp. | | | 360 | | | | 14,904 | |
Badger Meter, Inc. | | | 304 | | | | 9,774 | |
Baker Hughes Inc. | | | 126 | | | | 6,980 | |
Bank Mutual Corp. | | | 1,570 | | | | 12,246 | |
Bank of America Corp. | | | 387 | | | | 6,385 | |
Bank of New York Mellon Corp.(The) | | | 145 | | | | 6,274 | |
Baxter International Inc. | | | 134 | | | | 6,377 | |
BB&T Corp. | | | 163 | | | | 6,390 | |
Becton, Dickinson and Co. | | | 36 | | | | 6,045 | |
Berkshire Hathaway Inc.–Class B(a) | | | 42 | | | | 6,061 | |
Biglari Holdings, Inc.(a) | | | 26 | | | | 11,393 | |
Biogen Inc.(a) | | | 21 | | | | 5,884 | |
BlackRock, Inc. | | | 16 | | | | 5,460 | |
Bob Evans Farms, Inc. | | | 295 | | | | 12,160 | |
Boeing Co.(The) | | | 46 | | | | 6,552 | |
Boston Properties, Inc. | | | 45 | | | | 5,422 | |
Boston Scientific Corp.(a) | | | 264 | | | | 5,808 | |
| | | | | | | | |
| | | Shares | | | Value | |
| United States–(continued) | | | | | | | | |
Bristol-Myers Squibb Co. | | | 110 | | | $ | 5,600 | |
Brookline Bancorp, Inc. | | | 1,069 | | | | 13,683 | |
Cabot Microelectronics Corp. | | | 226 | | | | 12,489 | |
California Water Service Group | | | 379 | | | | 11,749 | |
Callaway Golf Co. | | | 925 | | | | 9,444 | |
Capital One Financial Corp. | | | 84 | | | | 6,219 | |
Capstead Mortgage Corp. | | | 1,425 | | | | 13,552 | |
Cardinal Financial Corp. | | | 423 | | | | 11,116 | |
Cardinal Health, Inc. | | | 75 | | | | 5,152 | |
Carnival Corp. | | | 123 | | | | 6,039 | |
Caterpillar Inc. | | | 75 | | | | 6,259 | |
CBS Corp.–Class B | | | 115 | | | | 6,511 | |
Cedar Realty Trust Inc. | | | 1,661 | | | | 11,245 | |
Celgene Corp.(a) | | | 54 | | | | 5,518 | |
CenturyLink Inc. | | | 220 | | | | 5,848 | |
Charles Schwab Corp.(The) | | | 202 | | | | 6,403 | |
Charter Communications, Inc.–Class A(a) | | | 23 | | | | 5,747 | |
Chevron Corp. | | | 60 | | | | 6,285 | |
Chubb Ltd. | | | 45 | | | | 5,715 | |
Cigna Corp. | | | 49 | | | | 5,823 | |
Cisco Systems, Inc. | | | 199 | | | | 6,105 | |
Citigroup Inc. | | | 137 | | | | 6,734 | |
City Holding Co. | | | 268 | | | | 14,008 | |
CME Group Inc.–Class A | | | 56 | | | | 5,606 | |
Coca-Cola Co.(The) | | | 135 | | | | 5,724 | |
Cognizant Technology Solutions Corp.–
Class A(a) | | | 101 | | | | 5,186 | |
Colgate-Palmolive Co. | | | 87 | | | | 6,208 | |
Comcast Corp.–Class A | | | 97 | | | | 5,997 | |
Community Bank System, Inc. | | | 278 | | | | 13,097 | |
ConocoPhillips | | | 151 | | | | 6,561 | |
Consolidated Edison, Inc. | | | 83 | | | | 6,271 | |
Constellation Brands, Inc.–Class A | | | 39 | | | | 6,518 | |
CoreSite Realty Corp. | | | 147 | | | | 10,840 | |
Corning Inc. | | | 286 | | | | 6,495 | |
Costco Wholesale Corp. | | | 39 | | | | 5,767 | |
Cousins Properties, Inc. | | | 2,268 | | | | 17,626 | |
Crown Castle International Corp. | | | 68 | | | | 6,187 | |
CSX Corp. | | | 233 | | | | 7,109 | |
Cummins Inc. | | | 53 | | | | 6,774 | |
CVB Financial Corp. | | | 624 | | | | 10,471 | |
CVS Health Corp. | | | 60 | | | | 5,046 | |
Danaher Corp. | | | 78 | | | | 6,127 | |
Deere & Co. | | | 70 | | | | 6,181 | |
Delta Air Lines, Inc. | | | 167 | | | | 6,976 | |
Deltic Timber Corp. | | | 175 | | | | 9,831 | |
Devon Energy Corp. | | | 140 | | | | 5,305 | |
Dime Community Bancshares, Inc. | | | 769 | | | | 12,458 | |
DineEquity, Inc. | | | 175 | | | | 13,842 | |
Discover Financial Services | | | 107 | | | | 6,027 | |
Dollar General Corp. | | | 84 | | | | 5,804 | |
See accompanying Notes to Financial Statements which are an integral part of the financial statements.
18 Invesco Macro Long/Short Fund
| | | | | | | | |
| | | Shares | | | Value | |
| United States–(continued) | | | | | | | | |
Dominion Resources, Inc. | | | 84 | | | $ | 6,317 | |
Dorman Products, Inc.(a) | | | 170 | | | | 10,921 | |
Dow Chemical Co.(The) | | | 113 | | | | 6,081 | |
Drew Industries, Inc. | | | 115 | | | | 10,298 | |
Duke Energy Corp. | | | 79 | | | | 6,322 | |
E. I. du Pont de Nemours and Co. | | | 88 | | | | 6,054 | |
EastGroup Properties, Inc. | | | 203 | | | | 13,786 | |
Eaton Corp. PLC | | | 91 | | | | 5,803 | |
eBay Inc.(a) | | | 192 | | | | 5,474 | |
Ecolab Inc. | | | 49 | | | | 5,594 | |
Edison International | | | 80 | | | | 5,878 | |
Edwards Lifesciences Corp.(a) | | | 53 | | | | 5,047 | |
El Paso Electric Co. | | | 304 | | | | 14,045 | |
Electronic Arts Inc.(a) | | | 79 | | | | 6,203 | |
Eli Lilly and Co. | | | 78 | | | | 5,760 | |
Emerson Electric Co. | | | 116 | | | | 5,879 | |
EOG Resources, Inc. | | | 73 | | | | 6,601 | |
Equinix, Inc. | | | 17 | | | | 6,074 | |
Equity Residential | | | 93 | | | | 5,743 | |
ESCO Technologies Inc. | | | 319 | | | | 14,211 | |
Exelon Corp. | | | 178 | | | | 6,064 | |
ExlService Holdings, Inc.(a) | | | 215 | | | | 9,466 | |
Exponent, Inc. | | | 230 | | | | 13,167 | |
Express Scripts Holding Co.(a) | | | 82 | | | | 5,527 | |
Exxon Mobil Corp. | | | 72 | | | | 5,999 | |
Facebook Inc.–Class A(a) | | | 49 | | | | 6,419 | |
FedEx Corp. | | | 35 | | | | 6,101 | |
Fidelity National Information Services, Inc. | | | 80 | | | | 5,914 | |
First Commonwealth Financial Corp. | | | 1,108 | | | | 11,257 | |
First Financial Bancorp. | | | 548 | | | | 11,782 | |
First Midwest Bancorp, Inc. | | | 561 | | | | 10,833 | |
Fiserv, Inc.(a) | | | 57 | | | | 5,613 | |
Ford Motor Co. | | | 496 | | | | 5,823 | |
Forrester Research, Inc. | | | 285 | | | | 10,616 | |
Franklin Street Properties Corp. | | | 949 | | | | 10,980 | |
G & K Services, Inc.–Class A | | | 169 | | | | 16,004 | |
General Dynamics Corp. | | | 43 | | | | 6,482 | |
General Electric Co. | | | 195 | | | | 5,675 | |
General Mills, Inc. | | | 87 | | | | 5,392 | |
General Motors Co. | | | 200 | | | | 6,320 | |
Getty Realty Corp. | | | 749 | | | | 17,025 | |
Gilead Sciences, Inc. | | | 80 | | | | 5,890 | |
Goldman Sachs Group, Inc.(The) | | | 37 | | | | 6,595 | |
Government Properties Income Trust | | | 474 | | | | 9,072 | |
Griffon Corp. | | | 691 | | | | 11,540 | |
H.B. Fuller Co. | | | 258 | | | | 10,854 | |
Halliburton Co. | | | 141 | | | | 6,486 | |
Haverty Furniture Cos., Inc. | | | 528 | | | | 9,372 | |
HCA Holdings, Inc.(a) | | | 81 | | | | 6,199 | |
HCP, Inc. | | | 158 | | | | 5,412 | |
Healthcare Services Group, Inc. | | | 359 | | | | 13,272 | |
| | | | | | | | |
| | | Shares | | | Value | |
| United States–(continued) | | | | | | | | |
Hess Corp. | | | 116 | | | $ | 5,565 | |
Hewlett Packard Enterprise Co. | | | 280 | | | | 6,292 | |
Hillenbrand, Inc. | | | 380 | | | | 11,533 | |
Hilton Worldwide Holdings Inc. | | | 261 | | | | 5,899 | |
Home Depot, Inc.(The) | | | 44 | | | | 5,368 | |
Honeywell International Inc. | | | 50 | | | | 5,484 | |
Horace Mann Educators Corp. | | | 366 | | | | 13,158 | |
HP Inc. | | | 449 | | | | 6,506 | |
Humana Inc. | | | 32 | | | | 5,489 | |
Illinois Tool Works Inc. | | | 54 | | | | 6,133 | |
Illumina, Inc.(a) | | | 37 | | | | 5,037 | |
Independent Bank Corp. | | | 212 | | | | 11,692 | |
Infinity Property & Casualty Corp. | | | 192 | | | | 15,734 | |
Ingersoll-Rand PLC | | | 92 | | | | 6,191 | |
Innospec Inc. | | | 183 | | | | 11,026 | |
Integra LifeSciences Holdings Corp.(a) | | | 149 | | | | 11,847 | |
Intel Corp. | | | 172 | | | | 5,998 | |
Intercontinental Exchange, Inc. | | | 21 | | | | 5,678 | |
International Business Machines Corp. | | | 39 | | | | 5,994 | |
International Paper Co. | | | 126 | | | | 5,674 | |
Intuit Inc. | | | 54 | | | | 5,872 | |
Intuitive Surgical, Inc.(a) | | | 9 | | | | 6,049 | |
J & J Snack Foods Corp. | | | 134 | | | | 16,368 | |
Johnson & Johnson | | | 50 | | | | 5,799 | |
JPMorgan Chase & Co. | | | 97 | | | | 6,718 | |
Kaiser Aluminum Corp. | | | 148 | | | | 10,729 | |
Kaman Corp. | | | 344 | | | | 15,019 | |
Kellogg Co. | | | 79 | | | | 5,935 | |
Kimberly-Clark Corp. | | | 45 | | | | 5,148 | |
Kinder Morgan Inc. | | | 283 | | | | 5,782 | |
Kite Realty Group Trust | | | 484 | | | | 12,066 | |
Kraft Heinz Co.(The) | | | 71 | | | | 6,315 | |
Kroger Co.(The) | | | 191 | | | | 5,917 | |
Las Vegas Sands Corp. | | | 114 | | | | 6,598 | |
Lexington Realty Trust | | | 1,241 | | | | 12,584 | |
LinkedIn Corp.–Class A(a) | | | 32 | | | | 6,067 | |
Littelfuse, Inc. | | | 91 | | | | 12,694 | |
Lockheed Martin Corp. | | | 24 | | | | 5,913 | |
Lowe’s Cos., Inc. | | | 75 | | | | 4,999 | |
LTC Properties, Inc. | | | 305 | | | | 15,284 | |
LyondellBasell Industries N.V.–Class A | | | 77 | | | | 6,125 | |
ManTech International Corp.–Class A | | | 272 | | | | 10,562 | |
Marathon Petroleum Corp. | | | 158 | | | | 6,887 | |
Marcus Corp.(The) | | | 491 | | | | 13,011 | |
Marsh & McLennan Cos., Inc. | | | 91 | | | | 5,768 | |
Mastercard Inc.–Class A | | | 60 | | | | 6,421 | |
Matthews International Corp.–Class A | | | 215 | | | | 12,878 | |
McDonald’s Corp. | | | 51 | | | | 5,741 | |
McKesson Corp. | | | 32 | | | | 4,069 | |
Mead Johnson Nutrition Co. | | | 76 | | | | 5,683 | |
Medifast, Inc. | | | 291 | | | | 11,948 | |
See accompanying Notes to Financial Statements which are an integral part of the financial statements.
19 Invesco Macro Long/Short Fund
| | | | | | | | |
| | | Shares | | | Value | |
| United States–(continued) | | | | | | | | |
Medtronic PLC | | | 70 | | | $ | 5,741 | |
Merck & Co., Inc. | | | 102 | | | | 5,989 | |
Meridian Bioscience, Inc. | | | 599 | | | | 9,854 | |
MetLife, Inc. | | | 131 | | | | 6,152 | |
Microsoft Corp. | | | 107 | | | | 6,411 | |
MKS Instruments, Inc. | | | 246 | | | | 12,411 | |
Mondelez International, Inc.–Class A | | | 133 | | | | 5,977 | |
Monro Muffler Brake, Inc. | | | 194 | | | | 10,670 | |
Monsanto Co. | | | 54 | | | | 5,442 | |
Monster Beverage Corp.(a) | | | 39 | | | | 5,629 | |
Morgan Stanley | | | 194 | | | | 6,513 | |
Mueller Industries, Inc. | | | 349 | | | | 10,571 | |
Mylan N.V.(a) | | | 155 | | | | 5,658 | |
National Presto Industries, Inc. | | | 117 | | | | 10,208 | |
Navigators Group, Inc.(The) | | | 151 | | | | 14,073 | |
NBT Bancorp Inc. | | | 403 | | | | 13,585 | |
Neenah Paper, Inc. | | | 167 | | | | 13,343 | |
Netflix Inc.(a) | | | 58 | | | | 7,242 | |
Newell Brands, Inc. | | | 115 | | | | 5,522 | |
NextEra Energy, Inc. | | | 47 | | | | 6,016 | |
NIKE, Inc.–Class B | | | 110 | | | | 5,520 | |
Noble Energy, Inc. | | | 167 | | | | 5,756 | |
Norfolk Southern Corp. | | | 65 | | | | 6,045 | |
Northern Trust Corp. | | | 85 | | | | 6,156 | |
Northfield Bancorp, Inc. | | | 1,193 | | | | 19,625 | |
Northrop Grumman Corp. | | | 28 | | | | 6,412 | |
Northwest Bancshares, Inc. | | | 1,047 | | | | 16,480 | |
Northwest Natural Gas Co. | | | 248 | | | | 14,582 | |
Nucor Corp. | | | 121 | | | | 5,911 | |
NVIDIA Corp. | | | 99 | | | | 7,045 | |
O’Reilly Automotive, Inc.(a) | | | 22 | | | | 5,818 | |
Occidental Petroleum Corp. | | | 81 | | | | 5,906 | |
Old National Bancorp | | | 811 | | | | 11,922 | |
Omnicom Group Inc. | | | 75 | | | | 5,986 | |
Oracle Corp. | | | 157 | | | | 6,032 | |
Oritani Financial Corp. | | | 908 | | | | 14,210 | |
PACCAR Inc. | | | 111 | | | | 6,096 | |
Parkway, Inc.(a) | | | 283 | | | | 5,100 | |
PayPal Holdings, Inc.(a) | | | 167 | | | | 6,957 | |
PepsiCo, Inc. | | | 59 | | | | 6,325 | |
Perrigo Co. PLC | | | 68 | | | | 5,657 | |
PetMed Express, Inc. | | | 622 | | | | 12,359 | |
Pfizer Inc. | | | 174 | | | | 5,518 | |
PG&E Corp. | | | 95 | | | | 5,901 | |
Philip Morris International Inc. | | | 57 | | | | 5,497 | |
Phillips 66 | | | 73 | | | | 5,924 | |
Pioneer Natural Resources Co. | | | 34 | | | | 6,087 | |
PNC Financial Services Group, Inc.(The) | | | 69 | | | | 6,596 | |
Popeyes Louisiana Kitchen, Inc.(a) | | | 211 | | | | 11,263 | |
PPG Industries, Inc. | | | 58 | | | | 5,402 | |
PPL Corp. | | | 177 | | | | 6,078 | |
| | | | | | | | |
| | | Shares | | | Value | |
| United States–(continued) | | | | | | | | |
Praxair, Inc. | | | 50 | | | $ | 5,853 | |
Priceline Group Inc.(The)(a) | | | 4 | | | | 5,897 | |
ProAssurance Corp. | | | 347 | | | | 18,495 | |
Procter & Gamble Co.(The) | | | 71 | | | | 6,163 | |
Prologis, Inc. | | | 124 | | | | 6,468 | |
Provident Financial Services, Inc. | | | 688 | | | | 15,611 | |
Prudential Financial, Inc. | | | 78 | | | | 6,614 | |
PS Business Parks, Inc. | | | 151 | | | | 16,578 | |
Public Service Enterprise Group Inc. | | | 133 | | | | 5,597 | |
Public Storage | | | 27 | | | | 5,770 | |
QUALCOMM, Inc. | | | 97 | | | | 6,666 | |
Raytheon Co. | | | 43 | | | | 5,874 | |
Regeneron Pharmaceuticals, Inc.(a) | | | 15 | | | | 5,175 | |
Retail Opportunity Investments Corp. | | | 695 | | | | 13,976 | |
Reynolds American Inc. | | | 115 | | | | 6,334 | |
RLI Corp. | | | 202 | | | | 11,259 | |
Ross Stores, Inc. | | | 98 | | | | 6,129 | |
Ruth’s Hospitality Group, Inc. | | | 724 | | | | 11,475 | |
S&P Global Inc. | | | 50 | | | | 6,092 | |
S&T Bancorp, Inc. | | | 398 | | | | 12,493 | |
Safety Insurance Group, Inc. | | | 212 | | | | 14,352 | |
salesforce.com, inc.(a) | | | 82 | | | | 6,163 | |
Samsonite International S.A. | | | 4,588 | | | | 14,435 | |
Saul Centers, Inc. | | | 203 | | | | 12,277 | |
Schlumberger Ltd. | | | 79 | | | | 6,180 | |
Scholastic Corp. | | | 300 | | | | 11,475 | |
Selective Insurance Group, Inc. | | | 330 | | | | 12,193 | |
Sempra Energy | | | 55 | | | | 5,890 | |
Sherwin-Williams Co.(The) | | | 21 | | | | 5,142 | |
Shire PLC | | | 509 | | | | 28,738 | |
Simon Property Group, Inc. | | | 30 | | | | 5,579 | |
Simpson Manufacturing Co., Inc. | | | 350 | | | | 14,980 | |
South Jersey Industries, Inc. | | | 380 | | | | 11,267 | |
Southern Co.(The) | | | 122 | | | | 6,292 | |
Southwest Airlines Co. | | | 168 | | | | 6,728 | |
Spectra Energy Corp. | | | 171 | | | | 7,150 | |
Spire, Inc. | | | 261 | | | | 16,391 | |
St. Jude Medical, Inc. | | | 80 | | | | 6,227 | |
Standex International Corp. | | | 130 | | | | 9,932 | |
Starbucks Corp. | | | 101 | | | | 5,360 | |
State Street Corp. | | | 92 | | | | 6,459 | |
Sterling Bancorp | | | 642 | | | | 11,556 | |
Stewart Information Services Corp. | | | 262 | | | | 11,777 | |
Stryker Corp. | | | 51 | | | | 5,883 | |
SunTrust Banks, Inc. | | | 139 | | | | 6,287 | |
Sykes Enterprises, Inc.(a) | | | 404 | | | | 10,803 | |
Synchrony Financial | | | 206 | | | | 5,890 | |
Sysco Corp. | | | 119 | | | | 5,726 | |
T. Rowe Price Group Inc. | | | 82 | | | | 5,249 | |
Target Corp. | | | 88 | | | | 6,048 | |
TeleTech Holdings, Inc. | | | 409 | | | | 11,493 | |
See accompanying Notes to Financial Statements which are an integral part of the financial statements.
20 Invesco Macro Long/Short Fund
| | | | | | | | |
| | | Shares | | | Value | |
| United States–(continued) | | | | | | | | |
Tennant Co. | | | 177 | | | $ | 11,142 | |
Tetra Tech, Inc. | | | 348 | | | | 13,381 | |
Texas Instruments Inc. | | | 88 | | | | 6,235 | |
Thermo Fisher Scientific, Inc. | | | 38 | | | | 5,587 | |
Time Warner Inc. | | | 80 | | | | 7,119 | |
TJX Cos., Inc. (The) | | | 79 | | | | 5,826 | |
Tompkins Financial Corp. | | | 156 | | | | 12,368 | |
Travelers Cos., Inc. (The) | | | 54 | | | | 5,842 | |
TrustCo Bank Corp NY | | | 1,683 | | | | 11,781 | |
Twenty-First Century Fox, Inc. –Class A | | | 253 | | | | 6,646 | |
U.S. Bancorp | | | 137 | | | | 6,132 | |
UMB Financial Corp. | | | 187 | | | | 11,603 | |
UniFirst Corp. | | | 105 | | | | 12,862 | |
Union Pacific Corp. | | | 67 | | | | 5,908 | |
United Bankshares, Inc. | | | 301 | | | | 11,348 | |
United Community Banks, Inc. | | | 571 | | | | 12,316 | |
United Fire Group, Inc. | | | 249 | | | | 9,840 | |
United Parcel Service, Inc.–Class B | | | 59 | | | | 6,358 | |
United Technologies Corp. | | | 61 | | | | 6,234 | |
UnitedHealth Group Inc. | | | 44 | | | | 6,219 | |
Universal Corp. | | | 196 | | | | 10,623 | |
Universal Health Realty Income Trust | | | 214 | | | | 12,562 | |
Urstadt Biddle Properties Inc.–Class A | | | 583 | | | | 12,534 | |
Valero Energy Corp. | | | 109 | | | | 6,457 | |
Ventas, Inc. | | | 90 | | | | 6,097 | |
Verizon Communications Inc. | | | 115 | | | | 5,532 | |
Versum Materials, Inc.(a) | | | 20 | | | | 454 | |
Vertex Pharmaceuticals Inc.(a) | | | 66 | | | | 5,007 | |
VF Corp. | | | 103 | | | | 5,584 | |
Viacom Inc.–Class B | | | 155 | | | | 5,822 | |
Visa Inc.–Class A | | | 73 | | | | 6,023 | |
Vornado Realty Trust | | | 64 | | | | 5,938 | |
| | | | | | | | |
| | | Shares | | | Value | |
| United States–(continued) | | | | | | | | |
Wal-Mart Stores, Inc. | | | 89 | | | $ | 6,232 | |
Walgreens Boots Alliance, Inc. | | | 73 | | | | 6,039 | |
Walt Disney Co. (The) | | | 60 | | | | 5,561 | |
Waste Management, Inc. | | | 95 | | | | 6,238 | |
Watts Water Technologies, Inc. -Class A | | | 161 | | | | 9,660 | |
WD-40 Co. | | | 125 | | | | 13,328 | |
Wells Fargo & Co. | | | 116 | | | | 5,337 | |
Welltower Inc. | | | 80 | | | | 5,482 | |
Westamerica Bancorp. | | | 241 | | | | 11,944 | |
Western Digital Corp. | | | 132 | | | | 7,714 | |
Weyerhaeuser Co. | | | 186 | | | | 5,567 | |
Williams Cos., Inc. (The) | | | 218 | | | | 6,366 | |
Xcel Energy, Inc. | | | 149 | | | | 6,191 | |
Yahoo! Inc.(a) | | | 143 | | | | 5,942 | |
Yum! Brands, Inc. | | | 70 | | | | 6,040 | |
Zimmer Biomet Holdings, Inc. | | | 50 | | | | 5,270 | |
Zoetis Inc. | | | 126 | | | | 6,023 | |
| | | | | | | | 2,994,511 | |
Total Common Stocks & Other Equity Interests
(Cost $10,209,998) | | | | 10,465,066 | |
|
Money Market Funds–14.86% | |
Government & Agency Portfolio–Institutional Class, 0.29%(e) | | | 1,202,576 | | | | 1,202,576 | |
Treasury Portfolio–Institutional Class, 0.22%(e) | | | 801,718 | | | | 801,718 | |
Total Money Market Funds
(Cost $2,004,294) | | | | 2,004,294 | |
TOTAL INVESTMENTS–92.46%
(Cost $12,214,292) | | | | 12,469,360 | |
OTHER ASSETS LESS LIABILITIES–7.54% | | | | | | | 1,017,530 | |
NET ASSETS–100.00% | | | | | | $ | 13,486,890 | |
Investment Abbreviations:
| | |
| ADR | | – American Depositary Receipt |
| CPO | | – Certificates of Ordinary Participation |
| Ctfs. | | – Certificates |
| GDR | | – Global Depositary Receipt |
| REGS | | – Regulation S |
| REIT | | – Real Estate Investment Trust |
| Rts. | | – Rights |
Notes to Schedule of Investments:
| (a) | Non-income producing security. |
| (b) | Security purchased or received in a transaction exempt from registration under the Securities Act of 1933, as amended (the “1933 Act”). The security may be resold pursuant to an exemption from registration under the 1933 Act, typically to qualified institutional buyers. The aggregate value of these securities at October 31, 2016 was $51,770, which represented less than 1% of the Fund’s Net Assets. |
| (c) | Each unit represents one Series B share, two Series D-B shares and two Series D-L shares. |
| (d) | Each CPO represents twenty-five Series A shares, twenty-two Series B shares, thirty-five Series D shares and thirty-five Series L shares. |
| (e) | The money market fund and the Fund are affiliated by having the same investment adviser. The rate shown is the 7-day SEC standardized yield as of October 31, 2016. |
See accompanying Notes to Financial Statements which are an integral part of the financial statements.
21 Invesco Macro Long/Short Fund
Statement of Assets and Liabilities
October 31, 2016
| | | | |
Assets: | |
Investments, at value (Cost $10,209,998) | | $ | 10,465,066 | |
Investments in affiliated money market funds, at value and cost | | | 2,004,294 | |
Total investments, at value (Cost $12,214,292) | | | 12,469,360 | |
Foreign currencies, at value (Cost $22,845) | | | 22,751 | |
Receivable for: | | | | |
Deposits with brokers for open futures contracts | | | 835,000 | |
Dividends | | | 21,248 | |
Fund expenses absorbed | | | 45,577 | |
Investment for trustee deferred compensation and retirement plans | | | 6,131 | |
Unrealized appreciation on forward foreign currency contracts outstanding | | | 158,879 | |
Unrealized appreciation on swap agreements — OTC | | | 8,630 | |
Other assets | | | 44,340 | |
Total assets | | | 13,611,916 | |
|
Liabilities: | |
Payable for: | | | | |
Accrued foreign taxes | | | 1,653 | |
Variation margin — futures | | | 2,861 | |
Accrued fees to affiliates | | | 1,661 | |
Accrued trustees’ and officers’ fees and benefits | | | 1,538 | |
Accrued other operating expenses | | | 97,023 | |
Trustee deferred compensation and retirement plans | | | 6,131 | |
Unrealized depreciation on forward foreign currency contracts outstanding | | | 14,159 | |
Total liabilities | | | 125,026 | |
Net assets applicable to shares outstanding | | $ | 13,486,890 | |
|
Net assets consist of: | |
Shares of beneficial interest | | $ | 14,294,057 | |
Undistributed net investment income | | | 45,295 | |
Undistributed net realized gain (loss) | | | (1,303,033 | ) |
Net unrealized appreciation | | | 450,571 | |
| | | $ | 13,486,890 | |
| | | | |
Net Assets: | |
Class A | | $ | 5,881,157 | |
Class C | | $ | 32,228 | |
Class R | | $ | 9,375 | |
Class Y | | $ | 6,174,058 | |
Class R5 | | $ | 613,368 | |
Class R6 | | $ | 776,704 | |
|
Shares outstanding, $0.01 par value per share,
with an unlimited number of shares authorized: | |
Class A | | | 625,295 | |
Class C | | | 3,459 | |
Class R | | | 1,001 | |
Class Y | | | 654,743 | |
Class R5 | | | 65,001 | |
Class R6 | | | 82,358 | |
Class A: | | | | |
Net asset value per share | | $ | 9.41 | |
Maximum offering price per share | | | | |
(Net asset value of $9.41 ¸ 94.50%) | | $ | 9.96 | |
Class C: | | | | |
Net asset value and offering price per share | | $ | 9.32 | |
Class R: | | | | |
Net asset value and offering price per share | | $ | 9.37 | |
Class Y: | | | | |
Net asset value and offering price per share | | $ | 9.43 | |
Class R5: | | | | |
Net asset value and offering price per share | | $ | 9.44 | |
Class R6: | | | | |
Net asset value and offering price per share | | $ | 9.43 | |
See accompanying Notes to Financial Statements which are an integral part of the financial statements.
22 Invesco Macro Long/Short Fund
Statement of Operations
For the year ended October 31, 2016
| | | | |
Investment income: | |
Dividends (net of foreign withholding taxes of $18,904) | | $ | 305,168 | |
Dividends from affiliated money market funds | | | 6,670 | |
Total investment income | | | 311,838 | |
| |
Expenses: | | | | |
Advisory fees | | | 166,737 | |
Administrative services fees | | | 50,000 | |
Custodian fees | | | 155,766 | |
Distribution fees: | | | | |
Class A | | | 14,736 | |
Class C | | | 486 | |
Class R | | | 46 | |
Transfer agent fees — A, C, R and Y | | | 3,797 | |
Transfer agent fees — R5 | | | 95 | |
Transfer agent fees — R6 | | | 113 | |
Trustees’ and officers’ fees and benefits | | | 18,903 | |
Registration and filing fees | | | 74,272 | |
Licensing Fees | | | 90,150 | |
Reports to shareholders | | | 13,182 | |
Professional services fees | | | 88,542 | |
Other | | | 93,639 | |
Total expenses | | | 770,464 | |
Less: Fees waived and expenses reimbursed | | | (541,931 | ) |
Net expenses | | | 228,533 | |
Net investment income | | | 83,305 | |
| |
Realized and unrealized gain (loss) from: | | | | |
Net realized gain (loss) from: | | | | |
Investment securities (net of foreign taxes of $788) | | | (335,422 | ) |
Foreign currencies | | | (6,469 | ) |
Forward foreign currency contracts | | | (86,360 | ) |
Futures contracts | | | (461,731 | ) |
Swap agreements | | | 4,703 | |
| | | | (885,279 | ) |
Change in net unrealized appreciation (depreciation) of: | | | | |
Investment securities (net of foreign taxes of $945) | | | 413,645 | |
Foreign currencies | | | (552 | ) |
Forward foreign currency contracts | | | 177,914 | |
Futures contracts | | | 122,225 | |
Swap agreements | | | 11,423 | |
| | | | 724,655 | |
Net realized and unrealized gain (loss) | | | (160,624 | ) |
Net increase (decrease) in net assets resulting from operations | | $ | (77,319 | ) |
See accompanying Notes to Financial Statements which are an integral part of the financial statements.
23 Invesco Macro Long/Short Fund
Statement of Changes in Net Assets
For the years ended October 31, 2016 and 2015
| | | | | | | | |
| | | 2016 | | | 2015 | |
Operations: | | | | | | | | |
Net investment income | | $ | 83,305 | | | $ | 72,039 | |
Net realized gain (loss) | | | (885,279 | ) | | | 5,446 | |
Change in net unrealized appreciation (depreciation) | | | 724,655 | | | | (386,441 | ) |
Net increase (decrease) in net assets resulting from operations | | | (77,319 | ) | | | (308,956 | ) |
| | |
Distributions to shareholders from net investment income: | | | | | | | | |
Class A | | | (21,819 | ) | | | (61,803 | ) |
Class C | | | (192 | ) | | | — | |
Class R | | | (26 | ) | | | (82 | ) |
Class Y | | | (35,615 | ) | | | (73,701 | ) |
Class R5 | | | (3,497 | ) | | | (15,530 | ) |
Class R6 | | | (4,092 | ) | | | (9,070 | ) |
Total distributions from net investment income | | | (65,241 | ) | | | (160,186 | ) |
| | |
Distributions to shareholders from net realized gains: | | | | | | | | |
Class A | | | (106,784 | ) | | | — | |
Class C | | | (1,985 | ) | | | — | |
Class R | | | (157 | ) | | | — | |
Class Y | | | (104,000 | ) | | | — | |
Class R5 | | | (10,212 | ) | | | — | |
Class R6 | | | (11,950 | ) | | | — | |
Total distributions from net realized gains | | | (235,088 | ) | | | — | |
| | |
Share transactions–net: | | | | | | | | |
Class A | | | 14,171 | | | | 323,315 | |
Class C | | | 16,134 | | | | (45,450 | ) |
Class Y | | | (66,073 | ) | | | 773,498 | |
Class R5 | | | — | | | | (571,965 | ) |
Class R6 | | | 64,117 | | | | 65,636 | |
Net increase in net assets resulting from share transactions | | | 28,349 | | | | 545,034 | |
Net increase (decrease) in net assets | | | (349,299 | ) | | | 75,892 | |
| | |
Net assets: | | | | | | | | |
Beginning of year | | | 13,836,189 | | | | 13,760,297 | |
End of year (includes undistributed net investment income of $45,295 and $41,809, respectively) | | $ | 13,486,890 | | | $ | 13,836,189 | |
Notes to Financial Statements
October 31, 2016
NOTE 1—Significant Accounting Policies
Invesco Macro Long/Short Fund (the “Fund”) is a series portfolio of AIM Investment Funds (Invesco Investment Funds) (the “Trust”). The Trust is organized as a Delaware statutory trust and is registered under the Investment Company Act of 1940, as amended (the “1940 Act”), as an open-end series management investment company consisting of twenty-two separate series portfolios, each authorized to issue an unlimited number of shares of beneficial interest. The assets, liabilities and operations of each portfolio are accounted for separately. Information presented in these financial statements pertains only to the Fund. Matters affecting each portfolio or class will be voted on exclusively by the shareholders of such portfolio or class.
The Fund’s investment objective is to seek a positive absolute return over a complete economic and market cycle.
The Fund currently consists of six different classes of shares: Class A, Class C, Class R, Class Y, Class R5 and Class R6. Class Y shares are available only to certain investors. Class A shares are sold with a front-end sales charge unless certain waiver criteria are met and under certain circumstances load waived shares may be subject to contingent deferred sales charges (“CDSC”). Class C shares are sold with a CDSC. Class R, Class Y, Class R5 and Class R6 shares are sold at net asset value.
The following is a summary of the significant accounting policies followed by the Fund in the preparation of its financial statements.
| A. | Security Valuations — Securities, including restricted securities, are valued according to the following policy. |
24 Invesco Macro Long/Short Fund
A security listed or traded on an exchange (except convertible securities) is valued at its last sales price or official closing price as of the close of the customary trading session on the exchange where the security is principally traded, or lacking any sales or official closing price on a particular day, the security may be valued at the closing bid price on that day. Securities traded in the over-the-counter market are valued based on prices furnished by independent pricing services or market makers. When such securities are valued by an independent pricing service they may be considered fair valued. Futures contracts are valued at the final settlement price set by an exchange on which they are principally traded. Listed options are valued at the mean between the last bid and asked prices from the exchange on which they are principally traded. Options not listed on an exchange are valued by an independent source at the mean between the last bid and asked prices. For purposes of determining net asset value (“NAV”) per share, futures and option contracts generally are valued 15 minutes after the close of the customary trading session of the New York Stock Exchange (“NYSE”).
Investments in open-end and closed-end registered investment companies that do not trade on an exchange are valued at the end-of-day net asset value per share. Investments in open-end and closed-end registered investment companies that trade on an exchange are valued at the last sales price or official closing price as of the close of the customary trading session on the exchange where the security is principally traded.
Swap agreements are fair valued using an evaluated quote, if available, provided by an independent pricing service. Evaluated quotes provided by the pricing service are valued based on a model which may include end-of-day net present values, spreads, ratings, industry, company performance and returns of referenced assets.
Debt obligations (including convertible securities) and unlisted equities are fair valued using an evaluated quote provided by an independent pricing service. Evaluated quotes provided by the pricing service may be determined without exclusive reliance on quoted prices, and may reflect appropriate factors such as institution-size trading in similar groups of securities, developments related to specific securities, dividend rate (for unlisted equities), yield (for debt obligations), quality, type of issue, coupon rate (for debt obligations), maturity (for debt obligations), individual trading characteristics and other market data. Debt obligations are subject to interest rate and credit risks. In addition, all debt obligations involve some risk of default with respect to interest and/or principal payments.
Foreign securities’ (including foreign exchange contracts) prices are converted into U.S. dollar amounts using the applicable exchange rates as of the close of the NYSE. If market quotations are available and reliable for foreign exchange-traded equity securities, the securities will be valued at the market quotations. Because trading hours for certain foreign securities end before the close of the NYSE, closing market quotations may become unreliable. If between the time trading ends on a particular security and the close of the customary trading session on the NYSE, events occur that the Adviser determines are significant and make the closing price unreliable, the Fund may fair value the security. If the event is likely to have affected the closing price of the security, the security will be valued at fair value in good faith using procedures approved by the Board of Trustees. Adjustments to closing prices to reflect fair value may also be based on a screening process of an independent pricing service to indicate the degree of certainty, based on historical data, that the closing price in the principal market where a foreign security trades is not the current value as of the close of the NYSE. Foreign securities’ prices meeting the approved degree of certainty that the price is not reflective of current value will be priced at the indication of fair value from the independent pricing service. Multiple factors may be considered by the independent pricing service in determining adjustments to reflect fair value and may include information relating to sector indices, American Depositary Receipts and domestic and foreign index futures. Foreign securities may have additional risks including exchange rate changes, potential for sharply devalued currencies and high inflation, political and economic upheaval, the relative lack of issuer information, relatively low market liquidity and the potential lack of strict financial and accounting controls and standards.
Securities for which market prices are not provided by any of the above methods may be valued based upon quotes furnished by independent sources. The last bid price may be used to value equity securities. The mean between the last bid and asked prices is used to value debt obligations, including corporate loans.
Securities for which market quotations are not readily available or became unreliable are valued at fair value as determined in good faith by or under the supervision of the Trust’s officers following procedures approved by the Board of Trustees. Issuer specific events, market trends, bid/asked quotes of brokers and information providers and other market data may be reviewed in the course of making a good faith determination of a security’s fair value.
The Fund may invest in securities that are subject to interest rate risk, meaning the risk that the prices will generally fall as interest rates rise and, conversely, the prices will generally rise as interest rates fall. Specific securities differ in their sensitivity to changes in interest rates depending on their individual characteristics. Changes in interest rates may result in increased market volatility, which may affect the value and/or liquidity of certain Fund investments.
Valuations change in response to many factors including the historical and prospective earnings of the issuer, the value of the issuer’s assets, general economic conditions, interest rates, investor perceptions and market liquidity. Because of the inherent uncertainties of valuation, the values reflected in the financial statements may materially differ from the value received upon actual sale of those investments.
| B. | Securities Transactions and Investment Income — Securities transactions are accounted for on a trade date basis. Realized gains or losses on sales are computed on the basis of specific identification of the securities sold. Interest income (net of withholding tax, if any) is recorded on the accrual basis from settlement date. Dividend income (net of withholding tax, if any) is recorded on the ex-dividend date. |
The Fund may periodically participate in litigation related to Fund investments. As such, the Fund may receive proceeds from litigation settlements. Any proceeds received are included in the Statement of Operations as realized gain (loss) for investments no longer held and as unrealized gain (loss) for investments still held.
Brokerage commissions and mark ups are considered transaction costs and are recorded as an increase to the cost basis of securities purchased and/or a reduction of proceeds on a sale of securities. Such transaction costs are included in the determination of net realized and unrealized gain (loss) from investment securities reported in the Statement of Operations and the Statement of Changes in Net Assets and the net realized and unrealized gains (losses) on securities per share in the Financial Highlights. Transaction costs are included in the calculation of the Fund’s net asset value and, accordingly, they reduce the Fund’s total returns. These transaction costs are not considered operating expenses and are not reflected in net investment income reported in the Statement of Operations and the Statement of Changes in Net Assets, or the net investment income per share and the ratios of expenses and net investment income reported in the Financial Highlights, nor are they limited by any expense limitation arrangements between the Fund and the investment adviser.
The Fund allocates income and realized and unrealized capital gains and losses to a class based on the relative net assets of each class.
25 Invesco Macro Long/Short Fund
| C. | Country Determination — For the purposes of making investment selection decisions and presentation in the Schedule of Investments, the investment adviser may determine the country in which an issuer is located and/or credit risk exposure based on various factors. These factors include the laws of the country under which the issuer is organized, where the issuer maintains a principal office, the country in which the issuer derives 50% or more of its total revenues and the country that has the primary market for the issuer’s securities, as well as other criteria. Among the other criteria that may be evaluated for making this determination are the country in which the issuer maintains 50% or more of its assets, the type of security, financial guarantees and enhancements, the nature of the collateral and the sponsor organization. Country of issuer and/or credit risk exposure has been determined to be the United States of America, unless otherwise noted. |
| D. | Distributions — Distributions from net investment income and net realized capital gain, if any, are generally declared and paid annually and recorded on the ex-dividend date. The Fund may elect to treat a portion of the proceeds from redemptions as distributions for federal income tax purposes. |
| E. | Federal Income Taxes — The Fund intends to comply with the requirements of Subchapter M of the Internal Revenue Code of 1986, as amended (the “Internal Revenue Code”), necessary to qualify as a regulated investment company and to distribute substantially all of the Fund’s taxable earnings to shareholders. As such, the Fund will not be subject to federal income taxes on otherwise taxable income (including net realized capital gain) that is distributed to shareholders. Therefore, no provision for federal income taxes is recorded in the financial statements. |
The Fund recognizes the tax benefits of uncertain tax positions only when the position is more likely than not to be sustained. Management has analyzed the Fund’s uncertain tax positions and concluded that no liability for unrecognized tax benefits should be recorded related to uncertain tax positions. Management is not aware of any tax positions for which it is reasonably possible that the total amounts of unrecognized tax benefits will change materially in the next 12 months.
The Fund files tax returns in the U.S. Federal jurisdiction and certain other jurisdictions. Generally, the Fund is subject to examinations by such taxing authorities for up to three years after the filing of the return for the tax period.
| F. | Expenses — Fees provided for under the Rule 12b-1 plan of a particular class of the Fund are charged to the operations of such class. Transfer agency fees and expenses and other shareholder recordkeeping fees and expenses attributable to Class R5 and Class R6 are allocated to each share class based on relative net assets. Sub-accounting fees attributable to Class R5 are charged to the operations of the class. Transfer agency fees and expenses and other shareholder recordkeeping fees and expenses relating to all other classes are allocated among those classes based on relative net assets. All other expenses are allocated among the classes based on relative net assets. |
| G. | Accounting Estimates — The preparation of financial statements in conformity with accounting principles generally accepted in the United States of America (“GAAP”) requires management to make estimates and assumptions that affect the reported amounts of assets and liabilities at the date of the financial statements and the reported amounts of revenues and expenses during the reporting period including estimates and assumptions related to taxation. Actual results could differ from those estimates by a significant amount. In addition, the Fund monitors for material events or transactions that may occur or become known after the period-end date and before the date the financial statements are released to print. |
| H. | Indemnifications — Under the Trust’s organizational documents, each Trustee, officer, employee or other agent of the Trust is indemnified against certain liabilities that may arise out of the performance of their duties to the Fund. Additionally, in the normal course of business, the Fund enters into contracts, including the Fund’s servicing agreements, that contain a variety of indemnification clauses. The Fund’s maximum exposure under these arrangements is unknown as this would involve future claims that may be made against the Fund that have not yet occurred. The risk of material loss as a result of such indemnification claims is considered remote. |
| I. | Foreign Currency Translations — Foreign currency is valued at the close of the NYSE based on quotations posted by banks and major currency dealers. Portfolio securities and other assets and liabilities denominated in foreign currencies are translated into U.S. dollar amounts at date of valuation. Purchases and sales of portfolio securities (net of foreign taxes withheld on disposition) and income items denominated in foreign currencies are translated into U.S. dollar amounts on the respective dates of such transactions. The Fund does not separately account for the portion of the results of operations resulting from changes in foreign exchange rates on investments and the fluctuations arising from changes in market prices of securities held. The combined results of changes in foreign exchange rates and the fluctuation of market prices on investments (net of estimated foreign tax withholding) are included with the net realized and unrealized gain or loss from investments in the Statement of Operations. Reported net realized foreign currency gains or losses arise from (1) sales of foreign currencies, (2) currency gains or losses realized between the trade and settlement dates on securities transactions, and (3) the difference between the amounts of dividends, interest, and foreign withholding taxes recorded on the Fund’s books and the U.S. dollar equivalent of the amounts actually received or paid. Net unrealized foreign currency gains and losses arise from changes in the fair values of assets and liabilities, other than investments in securities at fiscal period end, resulting from changes in exchange rates. |
The Fund may invest in foreign securities, which may be subject to foreign taxes on income, gains on investments or currency repatriation, a portion of which may be recoverable. Foreign taxes, if any, are recorded based on the tax regulations and rates that exist in the foreign markets in which the Fund invests and are shown in the Statement of Operations.
| J. | Forward Foreign Currency Contracts — The Fund may engage in foreign currency transactions either on a spot (i.e. for prompt delivery and settlement) basis, or through forward foreign currency contracts, to manage or minimize currency or exchange rate risk. |
The Fund may also enter into forward foreign currency contracts for the purchase or sale of a security denominated in a foreign currency in order to “lock in” the U.S. dollar price of that security, or the Fund may also enter into forward foreign currency contracts that do not provide for physical settlement of the two currencies, but instead are settled by a single cash payment calculated as the difference between the agreed upon exchange rate and the spot rate at settlement based upon an agreed upon notional amount (non-deliverable forwards). The Fund will set aside liquid assets in an amount equal to the daily mark-to-market obligation for forward foreign currency contracts.
A forward foreign currency contract is an obligation between two parties (“Counterparties”) to purchase or sell a specific currency for an agreed-upon price at a future date. The use of forward foreign currency contracts does not eliminate fluctuations in the price of the underlying securities the Fund owns or intends to acquire but establishes a rate of exchange in advance. Fluctuations in the value of these contracts are measured by the difference in the contract date and reporting date exchange rates and are recorded as unrealized appreciation (depreciation) until the contracts are closed. When the contracts are closed, realized gains (losses) are recorded. Realized and unrealized gains (losses) on the contracts are included in the Statement of Operations. The primary risks associated with forward foreign currency contracts include failure of the
26 Invesco Macro Long/Short Fund
Counterparty to meet the terms of the contract and the value of the foreign currency changing unfavorably. These risks may be in excess of the amounts reflected in the Statement of Assets and Liabilities.
| K. | Futures Contracts — The Fund may enter into futures contracts to manage exposure to interest rate, equity and market price movements and/or currency risks. A futures contract is an agreement between Counterparties to purchase or sell a specified underlying security, currency or commodity (or delivery of a cash settlement price, in the case of an index future) for a fixed price at a future date. The Fund currently invests only in exchange-traded futures and they are standardized as to maturity date and underlying financial instrument. Initial margin deposits required upon entering into futures contracts are satisfied by the segregation of specific securities or cash as collateral at the futures commission merchant (broker). During the period the futures contracts are open, changes in the value of the contracts are recognized as unrealized gains or losses by recalculating the value of the contracts on a daily basis. Subsequent or variation margin payments are received or made depending upon whether unrealized gains or losses are incurred. These amounts are reflected as receivables or payables on the Statement of Assets and Liabilities. When the contracts are closed or expire, the Fund recognizes a realized gain or loss equal to the difference between the proceeds from, or cost of, the closing transaction and the Fund’s basis in the contract. The net realized gain (loss) and the change in unrealized gain (loss) on futures contracts held during the period is included on the Statement of Operations. The primary risks associated with futures contracts are market risk and the absence of a liquid secondary market. If the Fund were unable to liquidate a futures contract and/or enter into an offsetting closing transaction, the Fund would continue to be subject to market risk with respect to the value of the contracts and continue to be required to maintain the margin deposits on the futures contracts. Futures contracts have minimal Counterparty risk since the exchange’s clearinghouse, as Counterparty to all exchange-traded futures, guarantees the futures against default. Risks may exceed amounts recognized in the Statement of Assets and Liabilities. |
| L. | Swap Agreements — The Fund may enter into various swap transactions, including interest rate, total return, index, currency and credit default swap contracts (“CDS”) for investment purposes or to manage interest rate, currency or credit risk. Such transactions are agreements between Counterparties. These agreements may contain among other conditions, events of default and termination events, and various covenants and representations such as provisions that require the Fund to maintain a pre-determined level of net assets, and/or provide limits regarding the decline of the Fund’s NAV over specific periods of time. If the Fund were to trigger such provisions and have open derivative positions at that time, the Counterparty may be able to terminate such agreement and request immediate payment in an amount equal to the net liability positions, if any. |
Interest rate, total return, index, and currency swap agreements are two-party contracts entered into primarily to exchange the returns (or differentials in rates of returns) earned or realized on particular predetermined investments or instruments. The gross returns to be exchanged or “swapped” between the parties are calculated with respect to a notional amount, i.e., the return on or increase in value of a particular dollar amount invested at a particular interest rate or return of an underlying asset, in a particular foreign currency, or in a “basket” of securities representing a particular index. At the maturity date, a net cash flow is exchanged where the total return is equivalent to the return of the underlying reference less a financing rate, if any. As a receiver, the Fund would receive payments based on any positive total return and would owe payments in the event of a negative total return. As the payer, the Fund would owe payments on any net positive total return, and would receive payment in the event of a negative total return.
Changes in the value of swap agreements are recognized as unrealized gains (losses) in the Statement of Operations by “marking to market” on a daily basis to reflect the value of the swap agreement at the end of each trading day. Payments received or paid at the beginning of the agreement are reflected as such on the Statement of Assets and Liabilities and may be referred to as upfront payments. The Fund accrues for the fixed payment stream and amortizes upfront payments, if any, on swap agreements on a daily basis with the net amount, recorded as a component of realized gain (loss) on the Statement of Operations. A liquidation payment received or made at the termination of a swap agreement is recorded as realized gain (loss) on the Statement of Operations. The Fund segregates cash or liquid securities having a value at least equal to the amount of the potential obligation of a Fund under any swap transaction. Cash held as collateral is recorded as deposits with brokers on the Statement of Assets and Liabilities. Entering into these agreements involves, to varying degrees, lack of liquidity and elements of credit, market, and Counterparty risk in excess of amounts recognized on the Statement of Assets and Liabilities. Such risks involve the possibility that a swap is difficult to sell or liquidate; the Counterparty does not honor its obligations under the agreement and unfavorable interest rates and market fluctuations. It is possible that developments in the swaps market, including potential government regulation, could adversely affect the Fund’s ability to terminate existing swap agreements or to realize amounts to be received under such agreements. A short position in a security poses more risk than holding the same security long. As there is no limit on how much the price of the security can increase, the Fund’s exposure is unlimited.
| M. | Leverage Risk — Leverage exists when the Fund can lose more than it originally invests because it purchases or sells an instrument or enters into a transaction without investing an amount equal to the full economic exposure of the instrument or transaction. |
| N. | Collateral — To the extent the Fund has designated or segregated a security as collateral and that security is subsequently sold, it is the Fund’s practice to replace such collateral no later than the next business day. |
NOTE 2—Advisory Fees and Other Fees Paid to Affiliates
The Trust has entered into a master investment advisory agreement with Invesco Advisers, Inc. (the “Adviser” or “Invesco”). Under the terms of the investment advisory agreement, the Fund pays an advisory fee to the Adviser based on the annual rate of the Fund’s average daily net assets as follows:
| | | | |
| Average Daily Net Assets | | Rate | |
First $10 billion | | | 1.25% | |
Over $10 billion | | | 1.15% | |
For the year ended October 31, 2016, the effective advisory fees incurred by the Fund was 1.25%.
Under the terms of a master sub-advisory agreement between the Adviser and each of Invesco Asset Management Deutschland GmbH, Invesco Asset Management Limited, Invesco Asset Management (Japan) Limited, Invesco Hong Kong Limited, Invesco Senior Secured Management, Inc.,
27 Invesco Macro Long/Short Fund
Invesco Canada Ltd. and Invesco PowerShares Capital Management LLC (collectively, the “Affiliated Sub-Advisers”) the Adviser, not the Fund, will pay 40% of the fees paid to the Adviser to any such Affiliated Sub-Adviser(s) that provide(s) discretionary investment management services to the Fund based on the percentage of assets allocated to such Affiliated Sub-Adviser(s).
The Adviser has contractually agreed, through at least February 28, 2018, to waive advisory fees and/or reimburse expenses to the extent necessary to limit total annual fund operating expenses after fee waiver and/or expense reimbursement (excluding certain items discussed below) of Class A, Class C, Class R, Class Y, Class R5 and Class R6 shares to 1.87%, 2.62%, 2.12%, 1.62%, 1.62% and 1.62%, respectively, of the Fund’s average daily net assets (the “expense limits”). In determining the Adviser’s obligation to waive advisory fees and/or reimburse expenses, the following expenses are not taken into account, and could cause total annual fund operating expenses after fee waiver and/or expense reimbursement to exceed the numbers reflected above: (1) interest; (2) taxes; (3) dividend expense on short sales; (4) extraordinary or non-routine items, including litigation expenses; and (5) expenses that the Fund has incurred but did not actually pay because of an expense offset arrangement. Unless Invesco continues the fee waiver agreement, it will terminate on February 28, 2018. During its term, the fee waiver agreement cannot be terminated or amended to increase the expense limits without approval of the Board of Trustees.
Further, the Adviser has contractually agreed, through at least June 30, 2018, to waive the advisory fee payable by the Fund in an amount equal to 100% of the net advisory fees the Adviser receives from the affiliated money market funds on investments by the Fund of uninvested cash in such affiliated money market funds.
For the year ended October 31, 2016, the Adviser waived advisory fees and reimbursed fund level expenses of $537,926 and reimbursed class level expenses of $1,862, $15, $3, $1,917, $95 and $113 of Class A, Class C, Class R, Class Y, Class R5 and Class R6 shares, respectively.
The Trust has entered into a master administrative services agreement with Invesco pursuant to which the Fund has agreed to pay Invesco for certain administrative costs incurred in providing accounting services to the Fund. For the year ended October 31, 2016, expenses incurred under the agreement are shown in the Statement of Operations as Administrative services fees.
The Trust has entered into a transfer agency and service agreement with Invesco Investment Services, Inc. (“IIS”) pursuant to which the Fund has agreed to pay IIS a fee for providing transfer agency and shareholder services to the Fund and reimburse IIS for certain expenses incurred by IIS in the course of providing such services. IIS may make payments to intermediaries that provide omnibus account services, sub-accounting services and/or networking services. All fees payable by IIS to intermediaries that provide omnibus account services or sub-accounting are charged back to the Fund, subject to certain limitations approved by the Trust’s Board of Trustees. For the year ended October 31, 2016, expenses incurred under the agreement are shown in the Statement of Operations as Transfer agent fees.
The Trust has entered into master distribution agreements with Invesco Distributors, Inc. (“IDI”) to serve as the distributor for the Class A, Class C, Class R, Class Y, Class R5 and Class R6 shares of the Fund. The Trust has adopted plans pursuant to Rule 12b-1 under the 1940 Act with respect to the Fund’s Class A, Class C and Class R shares (collectively the “Plans”). The Fund, pursuant to the Plans, pays IDI compensation at the annual rate of 0.25% of the Fund’s average daily net assets of Class A shares, 1.00% of the average daily net assets of Class C shares and 0.50% of the average daily net assets of Class R shares. Of the Plan payments, up to 0.25% of the average daily net assets of each class of shares may be paid to furnish continuing personal shareholder services to customers who purchase and own shares of such classes. Any amounts not paid as a service fee under the Plans would constitute an asset-based sales charge. Rules of the Financial Industry Regulatory Authority (“FINRA”) impose a cap on the total sales charges, including asset-based sales charges, that may be paid by any class of shares of the Fund. For the year ended October 31, 2016, expenses incurred under the Plans are shown in the Statement of Operations as Distribution fees.
Front-end sales commissions and CDSC (collectively, the “sales charges”) are not recorded as expenses of the Fund. Front-end sales commissions are deducted from proceeds from the sales of Fund shares prior to investment in Class A shares of the Fund. CDSC are deducted from redemption proceeds prior to remittance to the shareholder. During the year ended October 31, 2016, IDI advised the Fund that IDI retained $25 in front-end sales commissions from the sale of Class A shares for CDSC imposed upon redemptions by shareholders.
Certain officers and trustees of the Trust are officers and directors of the Adviser, IIS and/or IDI.
NOTE 3—Additional Valuation Information
GAAP defines fair value as the price that would be received to sell an asset or paid to transfer a liability in an orderly transaction between market participants at the measurement date, under current market conditions. GAAP establishes a hierarchy that prioritizes the inputs to valuation methods, giving the highest priority to readily available unadjusted quoted prices in an active market for identical assets (Level 1) and the lowest priority to significant unobservable inputs (Level 3), generally when market prices are not readily available or are unreliable. Based on the valuation inputs, the securities or other investments are tiered into one of three levels. Changes in valuation methods may result in transfers in or out of an investment’s assigned level:
| | Level 1 — | Prices are determined using quoted prices in an active market for identical assets. |
| | Level 2 — | Prices are determined using other significant observable inputs. Observable inputs are inputs that other market participants may use in pricing a security. These may include quoted prices for similar securities, interest rates, prepayment speeds, credit risk, yield curves, loss severities, default rates, discount rates, volatilities and others. |
| | Level 3 — | Prices are determined using significant unobservable inputs. In situations where quoted prices or observable inputs are unavailable (for example, when there is little or no market activity for an investment at the end of the period), unobservable inputs may be used. Unobservable inputs reflect the Fund’s own assumptions about the factors market participants would use in determining fair value of the securities or instruments and would be based on the best available information. |
The following is a summary of the tiered valuation input levels, as of October 31, 2016. The level assigned to the securities valuations may not be an indication of the risk or liquidity associated with investing in those securities. Because of the inherent uncertainties of valuation, the values reflected in the financial statements may materially differ from the value received upon actual sale of those investments.
28 Invesco Macro Long/Short Fund
During the year ended October 31, 2016, there were transfers from Level 1 to Level 2 of $743,043 and from Level 2 to Level 1 of $1,893,851, due to foreign fair value adjustments.
| | | | | | | | | | | | | | | | |
| | | Level 1 | | | Level 2 | | | Level 3 | | | Total | |
Australia | | $ | 78,152 | | | $ | 719,619 | | | $ | — | | | $ | 797,771 | |
Austria | | | 15,521 | | | | — | | | | — | | | | 15,521 | |
Belgium | | | 28,437 | | | | 5,882 | | | | — | | | | 34,319 | |
Brazil | | | 27,882 | | | | — | | | | — | | | | 27,882 | |
Chile | | | 29,253 | | | | 49,324 | | | | — | | | | 78,577 | |
China | | | 61,534 | | | | 59,897 | | | | — | | | | 121,431 | |
Colombia | | | 13,015 | | | | — | | | | — | | | | 13,015 | |
Czech Republic | | | 6,410 | | | | 6,796 | | | | — | | | | 13,206 | |
Denmark | | | 63,125 | | | | 17,759 | | | | — | | | | 80,884 | |
Finland | | | 43,920 | | | | — | | | | — | | | | 43,920 | |
France | | | 179,762 | | | | 150,255 | | | | — | | | | 330,017 | |
Germany | | | 239,171 | | | | 11,651 | | | | — | | | | 250,822 | |
Hong Kong | | | 232,206 | | | | 171,951 | | | | — | | | | 404,157 | |
Hungary | | | 15,971 | | | | 7,116 | | | | — | | | | 23,087 | |
India | | | 22,279 | | | | — | | | | — | | | | 22,279 | |
Indonesia | | | 6,136 | | | | 21,738 | | | | — | | | | 27,874 | |
Ireland | | | 12,310 | | | | 44,001 | | | | — | | | | 56,311 | |
Italy | | | 7,262 | | | | 60,742 | | | | — | | | | 68,004 | |
Japan | | | 677,077 | | | | 871,224 | | | | — | | | | 1,548,301 | |
Luxembourg | | | — | | | | 15,675 | | | | — | | | | 15,675 | |
Malaysia | | | 166,563 | | | | 55,236 | | | | — | | | | 221,799 | |
Mexico | | | 173,155 | | | | — | | | | — | | | | 173,155 | |
Netherlands | | | 50,803 | | | | 63,018 | | | | — | | | | 113,821 | |
New Zealand | | | 55,526 | | | | — | | | | — | | | | 55,526 | |
Norway | | | 19,863 | | | | 19,142 | | | | — | | | | 39,005 | |
Philippines | | | 63,209 | | | | 7,227 | | | | — | | | | 70,436 | |
Poland | | | 19,193 | | | | — | | | | — | | | | 19,193 | |
Portugal | | | 6,736 | | | | — | | | | — | | | | 6,736 | |
Qatar | | | 15,218 | | | | — | | | | — | | | | 15,218 | |
Russia | | | 6,175 | | | | — | | | | — | | | | 6,175 | |
Singapore | | | 93,532 | | | | 104,964 | | | | — | | | | 198,496 | |
South Africa | | | 22,700 | | | | — | | | | — | | | | 22,700 | |
South Korea | | | 31,519 | | | | 122,346 | | | | — | | | | 153,865 | |
Spain | | | 64,560 | | | | 51,377 | | | | — | | | | 115,937 | |
Sweden | | | 26,904 | | | | 108,586 | | | | — | | | | 135,490 | |
Switzerland | | | 110,486 | | | | 170,142 | | | | — | | | | 280,628 | |
Taiwan | | | 149,475 | | | | 203,510 | | | | — | | | | 352,985 | |
Thailand | | | 79,318 | | | | 77,329 | | | | — | | | | 156,647 | |
Turkey | | | — | | | | 30,444 | | | | — | | | | 30,444 | |
United Arab Emirates | | | 6,403 | | | | — | | | | — | | | | 6,403 | |
United Kingdom | | | 216,339 | | | | 1,106,504 | | | | — | | | | 1,322,843 | |
United States | | | 2,965,771 | | | | 28,740 | | | | — | | | | 2,994,511 | |
Money Market Funds | | | 2,004,294 | | | | — | | | | — | | | | 2,004,294 | |
| | | | 8,107,165 | | | | 4,362,195 | | | | — | | | | 12,469,360 | |
Forward Foreign Currency Contracts* | | | — | | | | 144,720 | | | | — | | | | 144,720 | |
Futures Contracts* | | | 42,834 | | | | — | | | | — | | | | 42,834 | |
Swap Agreements* | | | — | | | | 8,630 | | | | — | | | | 8,630 | |
Total Investments | | $ | 8,149,999 | | | $ | 4,515,545 | | | $ | — | | | $ | 12,665,544 | |
| * | Unrealized appreciation. |
29 Invesco Macro Long/Short Fund
NOTE 4—Derivative Investments
The Fund may enter into an International Swaps and Derivatives Association Master Agreement (“ISDA Master Agreement”) under which a Fund may trade OTC derivatives. An OTC transaction entered into under an ISDA Master Agreement typically involves a collateral posting arrangement, payment netting provisions and close-out netting provisions. These netting provisions allow for reduction of credit risk through netting of contractual obligations. The enforceability of the netting provisions of the ISDA Master Agreement depends on the governing law of the ISDA Master Agreement, among other factors.
For financial reporting purposes, the Fund does not offset OTC derivative assets or liabilities that are subject to ISDA Master Agreements in the Statement of Assets and Liabilities.
Value of Derivative Investments at Period-End
The table below summarizes the value of the Fund’s derivative investments, detailed by primary risk exposure, held as of October 31, 2016:
| | | | | | | | | | | | |
| | | Value | |
| Derivative Assets | | Currency
Risk | | | Equity Risk | | | Total | |
Unrealized appreciation on futures contracts — Exchange-Traded(a) | | $ | — | | | $ | 172,468 | | | $ | 172,468 | |
Unrealized appreciation on swap agreements — OTC | | | — | | | | 8,630 | | | | 8,630 | |
Unrealized appreciation on forward foreign currency contracts outstanding | | | 158,879 | | | | — | | | | 158,879 | |
Total Derivative Assets | | | 158,879 | | | | 181,098 | | | | 339,977 | |
Derivatives not subject to master netting agreements | | | — | | | | (172,468 | ) | | | (172,468 | ) |
Total Derivative Assets subject to master netting agreements | | $ | 158,879 | | | $ | 8,630 | | | $ | 167,509 | |
| |
| | | Value | |
| Derivative Liabilities | | Currency
Risk | | | Equity Risk | | | Total | |
Unrealized depreciation on futures contracts — Exchange-Traded(a) | | $ | — | | | $ | (129,634 | ) | | $ | (129,634 | ) |
Unrealized depreciation on forward foreign currency contracts outstanding | | | (14,159 | ) | | | — | | | | (14,159 | ) |
Total Derivative Liabilities | | | (14,159 | ) | | | (129,634 | ) | | | (143,793 | ) |
Derivatives not subject to master netting agreements | | | — | | | | 129,634 | | | | 129,634 | |
Total Derivative Liabilities subject to master netting agreements | | $ | (14,159 | ) | | $ | — | | | $ | (14,159 | ) |
| (a) | Includes cumulative appreciation (depreciation) on futures contracts. Only current day’s variation margin receivable (payable) is reported within the Statement of Assets and Liabilities. |
Offsetting Assets and Liabilities
The table below reflects the Fund’s exposure to Counterparties subject to either an ISDA Master Agreement or other agreement for OTC derivative transactions as of October 31, 2016.
| | | | | | | | | | | | | | | | | | | | | | | | | | | | | | | | |
| | | Financial Derivative Assets | | | Financial
Derivative
Liabilities | | | | | |
Collateral
(Received)/Pledged | | | | |
| Counterparty | | Forward
foreign currency
contracts | | | Swap
agreements | | | Total
assets | | | Forward
foreign currency
contracts | | | Net value of
derivatives | | | Non-Cash | | | Cash | | | Net
amount | |
Fund | | | | | | | | | | | | | | | | | | | | | | | | | | | | | | | | |
Canadian Imperial Bank of Commerce | | $ | 158,879 | | | $ | — | | | $ | 158,879 | | | $ | (14,159 | ) | | $ | 144,720 | | | $ | — | | | $ | — | | | $ | 144,720 | |
Goldman Sachs International | | | — | | | | 8,630 | | | | 8,630 | | | | — | | | | 8,630 | | | | — | | | | — | | | | 8,630 | |
Total | | $ | 158,879 | | | $ | 8,630 | | | $ | 167,509 | | | $ | (14,159 | ) | | $ | 153,350 | | | $ | — | | | $ | — | | | $ | 153,350 | |
30 Invesco Macro Long/Short Fund
Effect of Derivative Investments for the year ended October 31, 2016
The table below summarizes the gains (losses) on derivative investments, detailed by primary risk exposure, recognized in earnings during the period:
| | | | | | | | | | | | |
| | | Location of Gain (Loss) on
Statement of Operations | |
| | Currency
Risk | | | Equity Risk | | | Total | |
Realized Gain (Loss): | | | | | | | | | | | | |
Forward foreign currency contracts | | $ | (86,360 | ) | | $ | — | | | $ | (86,360 | ) |
Futures contracts | | | — | | | | (461,731 | ) | | | (461,731 | ) |
Swap agreements | | | — | | | | 4,703 | | | | 4,703 | |
Change in Net Unrealized Appreciation: | | | | | | | | | | | | |
Forward foreign currency contracts | | | 177,914 | | | | — | | | | 177,914 | |
Futures contracts | | | — | | | | 122,225 | | | | 122,225 | |
Swap agreements | | | — | | | | 11,423 | | | | 11,423 | |
Total | | $ | 91,554 | | | $ | (323,380 | ) | | $ | (231,826 | ) |
The table below summarizes the average notional value of forward foreign currency contracts, futures contracts and swap agreements outstanding during the period.
| | | | | | | | | | | | |
| | | Forward
Foreign Currency
Contracts | | | Futures
Contracts | | | Swap
Agreements | |
Average notional value | | $ | 5,794,715 | | | $ | 10,177,827 | | | $ | 164,835 | |
| | | | | | | | | | | | | | | | | | | | | | | | | | |
| Open Forward Foreign Currency Contracts | |
Settlement
Date | | Counterparty | | Contract to | | | Notional
Value | | | Unrealized
Appreciation
(Depreciation) | |
| | | Deliver | | | Receive | | | |
01/19/17 | | Canadian Imperial Bank of Commerce | | | AUD | | | | 1,080,000 | | | | USD | | | | 815,508 | | | $ | 819,862 | | | $ | (4,354 | ) |
01/19/17 | | Canadian Imperial Bank of Commerce | | | CHF | | | | 210,000 | | | | USD | | | | 215,941 | | | | 213,258 | | | | 2,683 | |
01/19/17 | | Canadian Imperial Bank of Commerce | | | EUR | | | | 1,010,000 | | | | USD | | | | 1,128,632 | | | | 1,113,001 | | | | 15,631 | |
01/19/17 | | Canadian Imperial Bank of Commerce | | | GBP | | | | 1,200,000 | | | | USD | | | | 1,596,806 | | | | 1,471,425 | | | | 125,381 | |
01/19/17 | | Canadian Imperial Bank of Commerce | | | JPY | | | | 158,700,000 | | | | USD | | | | 1,511,005 | | | | 1,518,681 | | | | (7,676 | ) |
01/19/17 | | Canadian Imperial Bank of Commerce | | | NOK | | | | 330,000 | | | | USD | | | | 39,216 | | | | 39,948 | | | | (732 | ) |
01/19/17 | | Canadian Imperial Bank of Commerce | | | NZD | | | | 80,000 | | | | USD | | | | 56,576 | | | | 57,037 | | | | (461 | ) |
01/19/17 | | Canadian Imperial Bank of Commerce | | | SEK | | | | 1,230,000 | | | | USD | | | | 145,425 | | | | 136,763 | | | | 8,662 | |
01/19/17 | | Canadian Imperial Bank of Commerce | | | SGD | | | | 310,000 | | | | USD | | | | 229,450 | | | | 222,928 | | | | 6,522 | |
01/19/17 | | Canadian Imperial Bank of Commerce | | | USD | | | | 15,290 | | | | AUD | | | | 20,000 | | | | 15,183 | | | | (107 | ) |
01/19/17 | | Canadian Imperial Bank of Commerce | | | USD | | | | 19,802 | | | | JPY | | | | 2,000,000 | | | | 19,139 | | | | (663 | ) |
01/19/17 | | Canadian Imperial Bank of Commerce | | | USD | | | | 7,356 | | | | SGD | | | | 10,000 | | | | 7,190 | | | | (166 | ) |
Total Forward Foreign Currency Contracts — Currency Risk | | | | | | | | | | | | | | | | | | | | | | $ | 144,720 | |
Currency Abbreviations:
| | |
| AUD | | – Australian Dollar |
| CHF | | – Swiss Franc |
| EUR | | – Euro |
| GBP | | – British Pound Sterling |
| JPY | | – Japanese Yen |
| NOK | | – Norwegian Krone |
| NZD | | – New Zealand Dollar |
| SEK | | – Swedish Krona |
| SGD | | – Singapore Dollar |
| USD | | – U.S. Dollar |
31 Invesco Macro Long/Short Fund
| | | | | | | | | | | | | | | | | | | | |
| Open Futures Contracts(a) | |
| Futures Contracts | | Type of
Contract | | | Number of
Contracts | | | Expiration
Month | | | Notional
Value | | | Unrealized
Appreciation
(Depreciation) | |
Dow Jones EURO STOXX 50 Index | | | Long | | | | 24 | | | | December-2016 | | | $ | 804,343 | | | $ | 16,597 | |
Dow Jones EURO STOXX 50 Index | | | Short | | | | 21 | | | | December-2016 | | | | (703,800 | ) | | | (17,775 | ) |
E-Mini S&P 500 Index | | | Long | | | | 2 | | | | December-2016 | | | | 212,010 | | | | (5,435 | ) |
E-Mini S&P 500 Index | | | Short | | | | 8 | | | | December-2016 | | | | (848,040 | ) | | | 20,284 | |
FTSE 100 Index | | | Long | | | | 9 | | | | December-2016 | | | | 763,174 | | | | 30,703 | |
FTSE 100 Index | | | Short | | | | 10 | | | | December-2016 | | | | (847,971 | ) | | | (16,364 | ) |
Hang Seng Index | | | Long | | | | 5 | | | | November-2016 | | | | 738,352 | | | | (14,959 | ) |
Hang Seng Index | | | Short | | | | 2 | | | | November-2016 | | | | (295,341 | ) | | | 9,058 | |
Mini MSCI Emerging Markets Asia Index | | | Long | | | | 27 | | | | December-2016 | | | | 1,219,725 | | | | (31,645 | ) |
Mini MSCI Emerging Markets Asia Index | | | Short | | | | 19 | | | | December-2016 | | | | (858,325 | ) | | | 22,192 | |
MSCI Singapore Index | | | Short | | | | 4 | | | | November-2016 | | | | (88,617 | ) | | | 1,513 | |
Russell 2000 Mini Index | | | Short | | | | 7 | | | | December-2016 | | | | (833,910 | ) | | | 43,469 | |
SPI 200 Index | | | Short | | | | 5 | | | | December-2016 | | | | (502,980 | ) | | | (6,088 | ) |
Tokyo Stock Price Index | | | Long | | | | 5 | | | | December-2016 | | | | 665,141 | | | | 28,652 | |
Tokyo Stock Price Index | | | Short | | | | 7 | | | | December-2016 | | | | (931,197 | ) | | | (37,368 | ) |
Total Futures Contracts — Equity Risk | | | | | | | | | | | $ | 42,834 | |
| (a) | Futures contracts collateralized by $835,000 cash held with Goldman Sachs & Co., the futures commission merchant. |
| | | | | | | | | | | | | | | | | | | | | | | | |
| Open Over-The-Counter Total Return Swap Agreements | |
| Counterparty | | Pay/Receive
Floating Rate | | | Reference
Entity | | | Number of
Contracts | | | Termination
Date | | | Notional
Value | | | Unrealized
Appreciation | |
Goldman Sachs International | | | Pay | | | | Swiss Market Index Futures | | | | 2 | | | | December-2016 | | | $ | 158,234 | | | $ | 8,630 | |
NOTE 5—Trustees’ and Officers’ Fees and Benefits
Trustees’ and Officers’ Fees and Benefits include amounts accrued by the Fund to pay remuneration to certain Trustees and Officers of the Fund. Trustees have the option to defer compensation payable by the Fund, and Trustees’ and Officers’ Fees and Benefits also include amounts accrued by the Fund to fund such deferred compensation amounts. Those Trustees who defer compensation have the option to select various Invesco Funds in which their deferral accounts shall be deemed to be invested. Obligations under the deferred compensation plan represent unsecured claims against the general assets of the Fund.
NOTE 6—Cash Balances
The Fund is permitted to temporarily carry a negative or overdrawn balance in its account with State Street Bank and Trust Company, the custodian bank. Such balances, if any at period-end, are shown in the Statement of Assets and Liabilities under the payable caption Amount due custodian. To compensate the custodian bank for such overdrafts, the overdrawn Fund may either (1) leave funds as a compensating balance in the account so the custodian bank can be compensated by earning the additional interest; or (2) compensate by paying the custodian bank at a rate agreed upon by the custodian bank and Invesco, not to exceed the contractually agreed upon rate.
NOTE 7—Distributions to Shareholders and Tax Components of Net Assets
Tax Character of Distributions to Shareholders Paid During the Fiscal Years Ended October 31, 2016 and 2015:
| | | | | | | | |
| | | 2016 | | | 2015 | |
Ordinary income | | $ | 251,747 | | | $ | 160,186 | |
Long-term capital gain | | | 48,582 | | | | — | |
Total distributions | | $ | 300,329 | | | $ | 160,186 | |
Tax Components of Net Assets at Period-End:
| | | | |
| | | 2016 | |
Undistributed ordinary income | | $ | 71,283 | |
Net unrealized appreciation — investments | | | 143,068 | |
Net unrealized appreciation (depreciation) — other investments | | | (3,487 | ) |
Temporary book/tax differences | | | (545,478 | ) |
Capital loss carryforward | | | (472,553 | ) |
Shares of beneficial interest | | | 14,294,057 | |
Total net assets | | $ | 13,486,890 | |
32 Invesco Macro Long/Short Fund
The difference between book-basis and tax-basis unrealized appreciation (depreciation) is due to differences in the timing of recognition of gains and losses on investments for tax and book purposes. The Fund’s net unrealized appreciation difference is attributable primarily to wash sales and passive foreign investment companies.
The temporary book/tax differences are a result of timing differences between book and tax recognition of income and/or expenses. The Fund’s temporary book/tax differences are the result of the trustee deferral of compensation and retirement plan benefits.
Capital loss carryforward is calculated and reported as of a specific date. Results of transactions and other activity after that date may affect the amount of capital loss carryforward actually available for the Fund to utilize. Capital losses generated in years beginning after December 22, 2010 can be carried forward for an unlimited period, whereas previous losses expire in eight tax years. Capital losses with an expiration period may not be used to offset capital gains until all net capital losses without an expiration date have been utilized. Capital loss carryforwards with no expiration date will retain their character as either short-term or long-term capital losses instead of as short-term capital losses as under prior law. The ability to utilize capital loss carryforward in the future may be limited under the Internal Revenue Code and related regulations based on the results of future transactions.
The Fund has a capital loss carryforward as of October 31, 2016, as follows:
| | | | |
| Capital Loss Carryforward* | |
| Expiration | | Total | |
Not subject to expiration | | $ | 472,553 | |
| * | Capital loss carryforward as of the date listed above is reduced for limitations, if any, to the extent required by the Internal Revenue Code and may be further limited depending upon a variety of factors, including the realization of net unrealized gains or losses as of the date of any reorganization. |
NOTE 8—Investment Securities
The aggregate amount of investment securities (other than short-term securities, U.S. Treasury obligations and money market funds, if any) purchased and sold by the Fund during the year ended October 31, 2016 was $5,530,010 and $6,543,798, respectively. Cost of investments on a tax basis includes the adjustments for financial reporting purposes as of the most recently completed federal income tax reporting period-end.
| | | | |
| Unrealized Appreciation (Depreciation) of Investment Securities on a Tax Basis | |
Aggregate unrealized appreciation of investment securities | | $ | 884,877 | |
Aggregate unrealized (depreciation) of investment securities | | | (741,809 | ) |
Net unrealized appreciation of investment securities | | $ | 143,068 | |
Cost of investments for tax purposes is $12,326,292.
NOTE 9—Reclassification of Permanent Differences
Primarily as a result of differing book/tax treatment of distribution reclass, foreign currency transactions and passive foreign investment companies, on October 31, 2016, undistributed net investment income was decreased by $14,578, undistributed net realized gain (loss) was increased by $14,391 and shares of beneficial interest was increased by $187. This reclassification had no effect on the net assets of the Fund.
NOTE 10—Share Information
| | | | | | | | | | | | | | | | |
| | | Summary of Share Activity | |
| | | Years ended October 31, | |
| | | 2016(a) | | | 2015 | |
| | | Shares | | | Amount | | | Shares | | | Amount | |
Sold: | | | | | | | | | | | | | | | | |
Class A | | | 67,973 | | | $ | 641,143 | | | | 43,327 | | | $ | 415,185 | |
Class C | | | 13,124 | | | | 122,770 | | | | 1,013 | | | | 10,055 | |
Class Y | | | — | | | | — | | | | 85,470 | | | | 848,088 | |
Class R6 | | | 13,518 | | | | 124,276 | | | | 10,211 | | | | 100,649 | |
| | | | |
Issued as reinvestment of dividends: | | | | | | | | | | | | | | | | |
Class A | | | 1,906 | | | | 17,302 | | | | 73 | | | | 710 | |
Class C | | | 221 | | | | 2,005 | | | | — | | | | — | |
Class Y | | | 1,812 | | | | 16,449 | | | | — | | | | — | |
Class R5 | | | — | | | | — | | | | 753 | | | | 7,327 | |
Class R6 | | | 257 | | | | 2,333 | | | | 89 | | | | 866 | |
| | | | |
Reacquired: | | | | | | | | | | | | | | | | |
Class A | | | (71,661 | ) | | | (644,274 | ) | | | (9,415 | ) | | | (92,580 | ) |
Class C | | | (12,045 | ) | | | (108,641 | ) | | | (5,542 | ) | | | (55,505 | ) |
Class Y | | | (9,066 | ) | | | (82,522 | ) | | | (7,474 | ) | | | (74,590 | ) |
Class R5 | | | — | | | | — | | | | (58,811 | ) | | | (579,292 | ) |
Class R6 | | | (6,911 | ) | | | (62,492 | ) | | | (3,694 | ) | | | (35,879 | ) |
Net increase (decrease) in share activity | | | (872 | ) | | $ | 28,349 | | | | 56,000 | | | $ | 545,034 | |
| (a) | 95% of the outstanding shares of the Fund are owned by the Adviser or an affiliate of the Adviser. |
33 Invesco Macro Long/Short Fund
NOTE 11—Financial Highlights
The following schedule presents financial highlights for a share of the Fund outstanding throughout the periods indicated.
| | | | | | | | | | | | | | | | | | | | | | | | | | | | | | | | | | | | | | | | | | | | | | | | | | | | | | | | |
| | | Net asset
value,
beginning
of period | | | Net
investment
income
(loss)(a) | | | Net gains
(losses)
on securities
(both
realized and
unrealized) | | | Total from
investment
operations | | | Dividends
from net
investment
income | | | Distributions
from net
realized
gains | | | Total
distributions | | | Net asset
value, end
of period | | | Total
return(b) | | | Net assets,
end of period
(000’s omitted) | | | Ratio of
expenses
to average
net assets
with fee waivers
and/or expenses
absorbed | | | Ratio of
expenses
to average net
assets without
fee waivers
and/or expenses
absorbed | | | Ratio of net
investment
income (loss)
to average
net assets | | | Portfolio
turnover(c) | |
Class A | | | | | | | | | | | | | | | | | | | | | | | | | | | | | | | | | | | | | | | | | | | | | | | | | | | | | | | | |
Year ended 10/31/16 | | $ | 9.64 | | | $ | 0.05 | | | $ | (0.09 | ) | | $ | (0.04 | ) | | $ | (0.03 | ) | | $ | (0.16 | ) | | $ | (0.19 | ) | | $ | 9.41 | | | | (0.35 | )% | | $ | 5,881 | | | | 1.85 | %(e) | | | 5.91 | %(e) | | | 0.49 | %(e) | | | 30 | % |
Year ended 10/31/15 | | | 9.98 | | | | 0.04 | | | | (0.27 | ) | | | (0.23 | ) | | | (0.11 | ) | | | — | | | | (0.11 | ) | | | 9.64 | | | | (2.37 | ) | | | 6,048 | | | | 1.85 | | | | 5.62 | | | | 0.38 | | | | 45 | |
Year ended 10/31/14(d) | | | 10.00 | | | | 0.04 | | | | (0.06 | ) | | | (0.02 | ) | | | — | | | | — | | | | — | | | | 9.98 | | | | (0.20 | ) | | | 5,921 | | | | 1.85 | (f) | | | 5.82 | (f) | | | 0.45 | (f) | | | 44 | |
Class C | | | | | | | | | | | | | | | | | | | | | | | | | | | | | | | | | | | | | | | | | | | | | | | | | | | | | | | | |
Year ended 10/31/16 | | | 9.61 | | | | (0.02 | ) | | | (0.09 | ) | | | (0.11 | ) | | | (0.02 | ) | | | (0.16 | ) | | | (0.18 | ) | | | 9.32 | | | | (1.17 | ) | | | 32 | | | | 2.60 | (e) | | | 6.66 | (e) | | | (0.26 | )(e) | | | 30 | |
Year ended 10/31/15 | | | 9.92 | | | | (0.04 | ) | | | (0.27 | ) | | | (0.31 | ) | | | — | | | | — | | | | — | | | | 9.61 | | | | (3.13 | ) | | | 21 | | | | 2.60 | | | | 6.37 | | | | (0.37 | ) | | | 45 | |
Year ended 10/31/14(d) | | | 10.00 | | | | (0.03 | ) | | | (0.05 | ) | | | (0.08 | ) | | | — | | | | — | | | | — | | | | 9.92 | | | | (0.80 | ) | | | 66 | | | | 2.60 | (f) | | | 6.57 | (f) | | | (0.30 | )(f) | | | 44 | |
Class R | | | | | | | | | | | | | | | | | | | | | | | | | | | | | | | | | | | | | | | | | | | | | | | | | | | | | | | | |
Year ended 10/31/16 | | | 9.62 | | | | 0.02 | | | | (0.09 | ) | | | (0.07 | ) | | | (0.02 | ) | | | (0.16 | ) | | | (0.18 | ) | | | 9.37 | | | | (0.64 | ) | | | 9 | | | | 2.10 | (e) | | | 6.16 | (e) | | | 0.24 | (e) | | | 30 | |
Year ended 10/31/15 | | | 9.96 | | | | 0.01 | | | | (0.27 | ) | | | (0.26 | ) | | | (0.08 | ) | | | — | | | | (0.08 | ) | | | 9.62 | | | | (2.59 | ) | | | 10 | | | | 2.10 | | | | 5.87 | | | | 0.13 | | | | 45 | |
Year ended 10/31/14(d) | | | 10.00 | | | | 0.02 | | | | (0.06 | ) | | | (0.04 | ) | | | — | | | | — | | | | — | | | | 9.96 | | | | (0.40 | ) | | | 10 | | | | 2.10 | (f) | | | 6.07 | (f) | | | 0.20 | (f) | | | 44 | |
Class Y | | | | | | | | | | | | | | | | | | | | | | | | | | | | | | | | | | | | | | | | | | | | | | | | | | | | | | | | |
Year ended 10/31/16 | | | 9.67 | | | | 0.07 | | | | (0.10 | ) | | | (0.03 | ) | | | (0.05 | ) | | | (0.16 | ) | | | (0.21 | ) | | | 9.43 | | | | (0.22 | ) | | | 6,174 | | | | 1.60 | (e) | | | 5.66 | (e) | | | 0.74 | (e) | | | 30 | |
Year ended 10/31/15 | | | 10.00 | | | | 0.06 | | | | (0.26 | ) | | | (0.20 | ) | | | (0.13 | ) | | | — | | | | (0.13 | ) | | | 9.67 | | | | (2.05 | ) | | | 6,400 | | | | 1.60 | | | | 5.37 | | | | 0.63 | | | | 45 | |
Year ended 10/31/14(d) | | | 10.00 | | | | 0.06 | | | | (0.06 | ) | | | — | | | | — | | | | — | | | | — | | | | 10.00 | | | | — | | | | 5,843 | | | | 1.60 | (f) | | | 5.57 | (f) | | | 0.70 | (f) | | | 44 | |
Class R5 | | | | | | | | | | | | | | | | | | | | | | | | | | | | | | | | | | | | | | | | | | | | | | | | | | | | | | | | |
Year ended 10/31/16 | | | 9.67 | | | | 0.07 | | | | (0.09 | ) | | | (0.02 | ) | | | (0.05 | ) | | | (0.16 | ) | | | (0.21 | ) | | | 9.44 | | | | (0.11 | ) | | | 613 | | | | 1.60 | (e) | | | 5.65 | (e) | | | 0.74 | (e) | | | 30 | |
Year ended 10/31/15 | | | 10.01 | | | | 0.06 | | | | (0.27 | ) | | | (0.21 | ) | | | (0.13 | ) | | | — | | | | (0.13 | ) | | | 9.67 | | | | (2.14 | ) | | | 629 | | | | 1.60 | | | | 5.36 | | | | 0.63 | | | | 45 | |
Year ended 10/31/14(d) | | | 10.00 | | | | 0.06 | | | | (0.05 | ) | | | 0.01 | | | | — | | | | — | | | | — | | | | 10.01 | | | | 0.10 | | | | 1,231 | | | | 1.60 | (f) | | | 5.54 | (f) | | | 0.70 | (f) | | | 44 | |
Class R6 | | | | | | | | | | | | | | | | | | | | | | | | | | | | | | | | | | | | | | | | | | | | | | | | | | | | | | | | |
Year ended 10/31/16 | | | 9.67 | | | | 0.07 | | | | (0.10 | ) | | | (0.03 | ) | | | (0.05 | ) | | | (0.16 | ) | | | (0.21 | ) | | | 9.43 | | | | (0.22 | ) | | | 777 | | | | 1.60 | (e) | | | 5.65 | (e) | | | 0.74 | (e) | | | 30 | |
Year ended 10/31/15 | | | 10.00 | | | | 0.06 | | | | (0.26 | ) | | | (0.20 | ) | | | (0.13 | ) | | | — | | | | (0.13 | ) | | | 9.67 | | | | (2.05 | ) | | | 730 | | | | 1.60 | | | | 5.36 | | | | 0.63 | | | | 45 | |
Year ended 10/31/14(d) | | | 10.00 | | | | 0.06 | | | | (0.06 | ) | | | — | | | | — | | | | — | | | | — | | | | 10.00 | | | | 0.00 | | | | 689 | | | | 1.60 | (f) | | | 5.54 | (f) | | | 0.70 | (f) | | | 44 | |
| (a) | Calculated using average shares outstanding. |
| (b) | Includes adjustments in accordance with accounting principles generally accepted in the United States of America and as such, the net asset value for financial reporting purposes and the returns based upon those net asset values may differ from the net asset value and returns for shareholder transactions. Does not include sales charges and is not annualized for periods less than one year, if applicable. |
| (c) | Portfolio turnover is calculated at the fund level and is not annualized for periods less than one year, if applicable. |
| (d) | Commencement date of December 17, 2013. |
| (e) | Ratios are based on average daily net assets (000’s omitted) of $5,894, $49, $9, $6,069, $600 and $718 for Class A, Class C, Class R, Class Y, Class R5 and Class R6 shares, respectively. |
34 Invesco Macro Long/Short Fund
Report of Independent Registered Public Accounting Firm
To the Board of Trustees and Shareholders of the Invesco Macro Long/Short Fund:
In our opinion, the accompanying statement of assets and liabilities, including the schedule of investments, and the related statements of operations and of changes in net assets and the financial highlights present fairly, in all material respects, the financial position of the Invesco Macro Long/Short Fund (the “Fund”) as of October 31, 2016, the results of its operations for the year then ended, the changes in its net assets for each of the two years in the period then ended and the financial highlights for each of the two years in the period then ended and for the period December 17, 2013 (commencement of operations) through October 31, 2014, in conformity with accounting principles generally accepted in the United States of America. These financial statements and financial highlights (hereafter referred to as “financial statements”) are the responsibility of the Fund’s management. Our responsibility is to express an opinion on these financial statements based on our audits. We conducted our audits of these financial statements in accordance with the standards of the Public Company Accounting Oversight Board (United States). Those standards require that we plan and perform the audit to obtain reasonable assurance about whether the financial statements are free of material misstatement. An audit includes examining, on a test basis, evidence supporting the amounts and disclosures in the financial statements, assessing the accounting principles used and significant estimates made by management, and evaluating the overall financial statement presentation. We believe that our audits, which included confirmation of securities as of October 31, 2016 by correspondence with the custodian and brokers, provide a reasonable basis for our opinion.
PRICEWATERHOUSECOOPERS LLP
Houston, Texas
December 21, 2016
35 Invesco Macro Long/Short Fund
Calculating your ongoing Fund expenses
Example
As a shareholder of the Fund, you incur two types of costs: (1) transaction costs, which may include sales charges (loads) on purchase payments or contingent deferred sales charges on redemptions, if any; and (2) ongoing costs, including management fees, distribution and/or service (12b-1) fees, and other Fund expenses. This example is intended to help you understand your ongoing costs (in dollars) of investing in the Fund and to compare these costs with ongoing costs of investing in other mutual funds. The example is based on an investment of $1,000 invested at the beginning of the period and held for the entire period May 1, 2016 through October 31, 2016.
Actual expenses
The table below provides information about actual account values and actual expenses. You may use the information in this table, together with the amount you invested, to estimate the expenses that you paid over the period. Simply divide your account value by $1,000 (for example, an $8,600 account value divided by $1,000 = 8.6), then multiply the result by the number in the table under the heading entitled “Actual Expenses Paid During Period” to estimate the expenses you paid on your account during this period.
Hypothetical example for comparison purposes
The table below also provides information about hypothetical account values and hypothetical expenses based on the Fund’s actual expense ratio and an assumed rate of return of 5% per year before expenses, which is not the Fund’s actual return.
The hypothetical account values and expenses may not be used to estimate the actual ending account balance or expenses you paid for the period. You may use this information to compare the ongoing costs of investing in the Fund and other funds. To do so, compare this 5% hypothetical example with the 5% hypothetical examples that appear in the shareholder reports of the other funds.
Please note that the expenses shown in the table are meant to highlight your ongoing costs only and do not reflect any transaction costs, such as sales charges (loads) on purchase payments or contingent deferred sales charges on redemptions, if any. Therefore, the hypothetical information is useful in comparing ongoing costs only, and will not help you determine the relative total costs of owning different funds. In addition, if these transaction costs were included, your costs would have been higher.
| | | | | | | | | | | | | | | | | | | | | | | | |
| Class | | Beginning
Account Value
(05/01/16) | | | ACTUAL | | | HYPOTHETICAL
(5% annual return before
expenses) | | | Annualized
Expense
Ratio | |
| | | Ending
Account Value
(10/31/16)1 | | | Expenses
Paid During
Period2 | | | Ending
Account Value
(10/31/16) | | | Expenses
Paid During
Period2 | | |
A | | $ | 1,000.00 | | | $ | 1,033.00 | | | $ | 9.45 | | | $ | 1,015.84 | | | $ | 9.37 | | | | 1.85 | % |
C | | | 1,000.00 | | | | 1,029.80 | | | | 13.27 | | | | 1,012.07 | | | | 13.15 | | | | 2.60 | |
R | | | 1,000.00 | | | | 1,030.80 | | | | 10.72 | | | | 1,014.58 | | | | 10.63 | | | | 2.10 | |
Y | | | 1,000.00 | | | | 1,034.00 | | | | 8.18 | | | | 1,017.09 | | | | 8.11 | | | | 1.60 | |
R5 | | | 1,000.00 | | | | 1,035.10 | | | | 8.18 | | | | 1,017.09 | | | | 8.11 | | | | 1.60 | |
R6 | | | 1,000.00 | | | | 1,034.00 | | | | 8.18 | | | | 1,017.09 | | | | 8.11 | | | | 1.60 | |
| 1 | The actual ending account value is based on the actual total return of the Fund for the period May 1, 2016 through October 31, 2016, after actual expenses and will differ from the hypothetical ending account value which is based on the Fund’s expense ratio and a hypothetical annual return of 5% before expenses. |
| 2 | Expenses are equal to the Fund’s annualized expense ratio as indicated above multiplied by the average account value over the period, multiplied by 184/366 to reflect the most recent fiscal half year. |
36 Invesco Macro Long/Short Fund
Approval of Investment Advisory and Sub-Advisory Contracts
The Board of Trustees (the Board) of AIM Investment Funds (Invesco Investment Funds) is required under the Investment Company Act of 1940, as amended, to approve annually the renewal of Invesco Macro Long/Short Fund’s (the Fund) investment advisory agreements. During contract renewal meetings held on June 7-8, 2016, the Board as a whole, and the disinterested or “independent” Trustees, who comprise over 75% of the Board, voting separately, approved the continuance for the Fund of the Master Investment Advisory Agreement with Invesco Advisers, Inc. (Invesco Advisers and the investment advisory agreement) and the Master Intergroup Sub-Advisory Contract for Mutual Funds with Invesco Asset Management Deutschland GmbH, Invesco Asset Management Limited, Invesco Asset Management (Japan) Limited, Invesco Hong Kong Limited, Invesco Senior Secured Management, Inc., Invesco Canada Ltd. and Invesco PowerShares Capital Management LLC (collectively, the Affiliated Sub-Advisers and the sub-advisory contracts) for another year, effective July 1, 2016.
In evaluating the fairness and reasonableness of compensation under the Fund’s investment advisory agreement and sub-advisory contracts, the Board considered, among other things, the factors discussed below. The Board determined that continuation of the Fund’s investment advisory agreement and the sub-advisory contracts is in the best interest of the Fund and its shareholders and that the compensation payable to Invesco Advisers and the Affiliated Sub-Advisers under the agreements is fair and reasonable.
The Board’s Fund Evaluation Process
The Board’s Investments Committee has established three Sub-Committees, which meet throughout the year to review the performance of funds advised by Invesco Advisers (the Invesco Funds). Over the course of each year, the Sub-Committees meet with portfolio managers for their assigned Invesco Funds and other members of management to review the performance, investment objective(s), policies, strategies, limitations and investment risks of these funds. The Board had the benefit of reports from the Sub-Committees and Investments Committee throughout the year in considering approval of the continuance of each Invesco Fund’s investment advisory agreement and sub-advisory contracts for another year.
During the contract renewal process, the Board receives comparative performance and fee data regarding the Invesco Funds prepared by Invesco Advisers and Broadridge Financial Solutions, Inc. (Broadridge), an independent provider of investment company data. The Board also receives an independent written evaluation from the Senior Officer, an officer of the Invesco Funds who reports directly to the
independent Trustees. The Senior Officer’s evaluation is prepared as part of his responsibility to manage the process by which the Invesco Funds’ proposed management fees are negotiated during the annual contract renewal process to ensure they are negotiated in a manner that is at arms’ length and reasonable. In addition to meetings with Invesco Advisers and fund counsel, the independent Trustees also discuss the continuance of the investment advisory agreement and sub-advisory contracts in separate sessions with the Senior Officer and with independent legal counsel.
The Trustees recognized that the advisory fee rates for the Invesco Funds are, in many cases, the result of years of review and negotiation. The Trustees’ deliberations and conclusions in a particular year may be based in part on their deliberations and conclusions regarding these same arrangements throughout the year and in prior years. The Trustees’ review and conclusions are based on the comprehensive consideration of all information presented to them and are not the result of any single determinative factor. Moreover, one Trustee may have weighed a particular piece of information or factor differently than another Trustee.
The discussion below is a summary of the Senior Officer’s independent written evaluation with respect to the Fund’s investment advisory agreement as well as a discussion of the material factors and related conclusions that formed the basis for the Board’s approval of the Fund’s investment advisory agreement and sub-advisory contracts. Unless otherwise stated, this information is current as of June 8, 2016, and does not reflect consideration of factors that became known to the Board after that date.
Factors and Conclusions and Summary of Independent Written Fee Evaluation
| A. | Nature, Extent and Quality of Services Provided by Invesco Advisers and the Affiliated Sub-Advisers |
The Board reviewed the advisory services provided to the Fund by Invesco Advisers under the Fund’s investment advisory agreement, the performance of Invesco Advisers in providing these services, and the credentials and experience of the officers and employees of Invesco Advisers who provide these services, including the Fund’s portfolio manager or managers. The Board’s review of the qualifications of Invesco Advisers to provide advisory services included the Board’s consideration of Invesco Advisers’ investment process oversight, independent credit analysis and investment risk management. The Board also considered non-advisory services that Invesco Advisers and its affiliates provide to the Invesco Funds such as various back office
support functions, trading operations, internal audit, valuation and legal and compliance.
In determining whether to continue the Fund’s investment advisory agreement, the Board considered the benefits of reapproving an existing relationship and the greater uncertainty that may be associated with entering into a new relationship. The Board concluded that the nature, extent and quality of the services provided to the Fund by Invesco Advisers are appropriate and satisfactory and consistent with the terms of the Fund’s investment advisory agreement.
The Board reviewed the services that may be provided by the Affiliated Sub-Advisers under the sub-advisory contracts and the credentials and experience of the officers and employees of the Affiliated Sub-Advisers who provide these services. The Board noted that the Affiliated Sub-Advisers have offices and personnel that are located in financial centers around the world. As a result, the Board noted that the Affiliated Sub-Advisers can provide research and investment analysis on the markets and economies of various countries in which the Fund may invest, make recommendations regarding securities and assist with security trades. The Board concluded that the sub-advisory contracts may benefit the Fund and its shareholders by permitting Invesco Advisers to use the resources and talents of the Affiliated Sub-Advisers in managing the Fund. The Board concluded that the nature, extent and quality of the services that may be provided by the Affiliated Sub-Advisers are appropriate and satisfactory and consistent with the terms of the Fund’s sub-advisory contracts.
The Board considered Fund performance as a relevant factor in considering whether to approve the investment advisory agreement. The Board did not view Fund performance as a relevant factor in considering whether to approve the sub-advisory contracts for the Fund, as no Affiliated Sub-Adviser currently manages assets of the Fund.
The Board noted that the Fund recently began operations and that comparative performance data for only the past two calendar years was available. The Board compared the Fund’s performance during the past two calendar years to the performance of funds in the Broadridge performance universe and against the Lipper Alternative Long/Short Equity Funds Index. The Board noted that performance of Class A shares of the Fund was in the fourth quintile of its performance universe for the one year period and the fifth quintile for the two year period (the first quintile being the best performing funds and the fifth quintile being the worst performing funds). The Board noted that the Fund’s performance was below the
37 Invesco Macro Long/Short Fund
performance of the Index for the one and two year periods. The Trustees also reviewed more recent Fund performance and this review did not change their conclusions.
| C. | Advisory and Sub-Advisory Fees |
The Board compared the Fund’s contractual management fee rate to the contractual management fee rates of funds in the Fund’s Broadridge expense group at a common asset level. The Board noted that the contractual management fee rate for Class A shares of the Fund was below the median contractual management fee rate of funds in its expense group. The Board noted that the term “contractual management fee” for funds in the expense group may include both advisory and certain administrative services fees, but that Broadridge does not provide information on a fund by fund basis as to what is included. The Board noted that Invesco Advisers does not separately charge the Invesco Funds for the administrative services included in the term as defined by Broadridge. The Board also reviewed the methodology used by Broadridge in providing expense group information, which includes using each fund’s contractual management fee schedule (including any applicable breakpoints) as reported in the most recent prospectus or statement of additional information for each fund in the expense group.
The Board noted that Invesco Advisers has contractually agreed to waive fees and/or limit expenses of the Fund through at least February 28, 2017 in an amount necessary to limit total annual operating expenses to a specified percentage of average daily net assets for each class of the Fund.
The Board compared the Fund’s effective advisory fee rate (the advisory fee rate after advisory fee waivers and before other expense limitations/waivers) to the effective advisory fee rates of other mutual funds advised by Invesco Advisers and its affiliates with investment strategies comparable to those of the Fund, based on asset balances as of December 31, 2015.
The Board noted that the Fund’s rate was above the rate of one mutual fund. The Board noted that Invesco Advisers and the Affiliated Sub-Advisers do not manage other client accounts with investment strategies comparable to those of the Fund.
The Board also considered the services that may be provided by the Affiliated Sub-Advisers pursuant to the sub-advisory contracts, as well as the fees payable by Invesco Advisers to the Affiliated Sub-Advisers pursuant to the sub-advisory contracts. The Board also noted that the sub-advisory fees are not paid directly by the Fund, but rather, are payable by Invesco Advisers to the Affiliated Sub-Advisers.
| D. | Economies of Scale and Breakpoints |
The Board considered the extent to which there are economies of scale in the provision of advisory services to the Fund. The Board also considered whether the Fund benefits from economies of scale through contractual breakpoints in the Fund’s advisory fee schedule.
The Board also noted that the Fund shares directly in economies of scale through lower fees charged by third party service providers based on the combined size of the Invesco Funds and other clients advised by Invesco Advisers.
| E. | Profitability and Financial Resources |
The Board reviewed information from Invesco Advisers concerning the costs of the advisory and other services that Invesco Advisers and its affiliates provide to the Fund and the Invesco Funds and the profitability of Invesco Advisers and its affiliates in providing these services. The Board received information from Invesco Advisers and a report from an independent consultant engaged by the Senior Officer about the methodology used to prepare the profitability information. The Board noted that Invesco Advisers continues to operate at a net profit from services Invesco Advisers and its affiliates provide to the Invesco Funds. The Board noted that Invesco Advisers and its affiliates did not make a profit from managing the Fund as a result of fee and expense waivers. The Board received and accepted information from Invesco Advisers demonstrating that Invesco Advisers and each Affiliated Sub-Adviser are financially sound and have the resources necessary to perform their obligations under the investment advisory agreement and sub-advisory contracts.
| F. | Collateral Benefits to Invesco Advisers and its Affiliates |
The Board considered various other benefits received by Invesco Advisers and its affiliates from the relationship with the Fund, including the fees received for providing transfer agency and distribution services to the Fund. The Board considered comparative information regarding fees charged for these services, including information provided by Broadridge and other independent sources. The Board considered the performance of Invesco Advisers and its affiliates in providing these services and the organizational structure employed to provide these services. The Board also considered that these services are provided to the Fund pursuant to written contracts that are reviewed and approved on an annual basis by the Board; and that the services are required for the operation of the Fund.
The Board considered the benefits realized by Invesco Advisers and the Affiliated Sub-Advisers as a result of portfolio brokerage transactions executed through “soft dollar” arrangements. The Board noted that soft dollar arrangements shift the payment obligation for research services from Invesco Advisers and the Affiliated Sub-Advisers to the Invesco Funds and that the research received may be used with other clients of Invesco Advisers and may reduce Invesco Advisers’ and the Affiliated Sub-Advisers’ expenses. The Board also considered that it receives periodic reports from the Chief Compliance Officer of the Invesco Funds demonstrating that these arrangements are consistent with regulatory requirements.
The Board did not deem the soft dollar arrangements to be inappropriate.
The Board considered that the Fund’s uninvested cash and cash collateral from any securities lending arrangements may be invested in money market funds advised by Invesco Advisers pursuant to procedures approved by the Board. The Board noted that Invesco Advisers receives advisory fees from these affiliated money market funds attributable to such investments, although Invesco Advisers has contractually agreed to waive through varying periods the advisory fees payable by the Invesco Funds with respect to certain investments in the affiliated money market funds. The waiver is in an amount equal to 100% of the net advisory fee Invesco Advisers receives from the affiliated money market funds with respect to the Fund’s investment in the affiliated money market funds of uninvested cash, but not cash collateral. The Board concluded that the amount of advisory fees received by Invesco Advisors from the Fund’s investment of cash collateral from any securities lending arrangements in the affiliated money market funds is fair and reasonable.
The Board also considered that the Fund may use an affiliated broker to execute certain trades for the Fund to, among other things, control information leakage, and was advised that such trades would be executed in compliance with rules under the Investment Company Act of 1940, as amended, and consistent with best execution obligations.
38 Invesco Macro Long/Short Fund
Tax Information
Form 1099-DIV, Form 1042-S and other year-end tax information provide shareholders with actual calendar year amounts that should be included in their tax returns. Shareholders should consult their tax advisors.
The following distribution information is being provided as required by the Internal Revenue Code or to meet a specific state’s requirement.
The Fund designates the following amounts or, if subsequently determined to be different, the maximum amount allowable for its fiscal year ended October 31, 2016:
| | | | |
Federal and State Income Tax | |
Long-Term Capital Gain Distributions | | $ | 48,582 | |
Qualified Dividend Income* | | | 99.99 | % |
Corporate Dividends Received Deduction* | | | 25.87 | % |
U.S. Treasury Obligations* | | | 0.00 | % |
| | * | The above percentages are based on ordinary income dividends paid to shareholders during the Fund’s fiscal year. |
| | | | |
Non-Resident Alien Shareholders | |
Qualified Short-Term Gains | | $ | 166,946 | |
39 Invesco Macro Long/Short Fund
Trustees and Officers
The address of each trustee and officer is AIM Investment Funds (Invesco Investment Funds) (the “Trust”), 11 Greenway Plaza, Suite 1000, Houston, Texas 77046-1173. The trustees serve for the life of the Trust, subject to their earlier death, incapacitation, resignation, retirement or removal as more specifically provided in the Trust’s organizational documents. Each officer serves for a one year term or until their successors are elected and qualified. Column two below includes length of time served with predecessor entities, if any.
| | | | | | | | |
Name, Year of Birth and
Position(s) Held with the Trust | | Trustee and/
or Officer Since | | Principal Occupation(s)
During Past 5 Years | | Number of
Funds in Fund
Complex
Overseen by
Trustee | | Other Directorship(s)
Held by Trustee During
Past 5 Years |
| Interested Persons | | | | | | | | |
| Martin L. Flanagan1 — 1960 Trustee | | 2007 | | Executive Director, Chief Executive Officer and President, Invesco Ltd. (ultimate parent of Invesco and a global investment management firm); Advisor to the Board, Invesco Advisers, Inc. (formerly known as Invesco Institutional (N.A.), Inc.); Trustee, The Invesco Funds; Vice Chair, Investment Company Institute; and Member of Executive Board, SMU Cox School of Business Formerly: Chairman and Chief Executive Officer, Invesco Advisers, Inc. (registered investment adviser); Director, Chairman, Chief Executive Officer and President, Invesco Holding Company (US) Inc. (formerly IVZ Inc.) (holding company), Invesco Group Services, Inc. (service provider) and Invesco North American Holdings, Inc. (holding company); Director, Chief Executive Officer and President, Invesco Holding Company Limited (parent of Invesco and a global investment management firm); Director, Invesco Ltd.; Chairman, Investment Company Institute and President, Co-Chief Executive Officer, Co-President, Chief Operating Officer and Chief Financial Officer, Franklin Resources, Inc. (global investment management organization) | | 146 | | None |
| Philip A. Taylor2 — 1954 Trustee and Senior Vice President | | 2006 | | Head of the Americas and Senior Managing Director, Invesco Ltd.; Director, Co-Chairman, Co-President and Co-Chief Executive Officer, Invesco Advisers, Inc. (formerly known as Invesco Institutional (N.A.), Inc.) (registered investment adviser); Director, Chairman, Chief Executive Officer and President, Invesco Management Group, Inc. (formerly known as Invesco AIM Management Group, Inc.) (financial services holding company); Director and Chairman, Invesco Investment Services, Inc. (formerly known as Invesco AIM Investment Services, Inc.) (registered transfer agent) Chief Executive Officer, Invesco Corporate Class Inc. (corporate mutual fund company) Director, Chairman and Chief Executive Officer, Invesco Canada Ltd. (formerly known as Invesco Trimark Ltd./Invesco Trimark Ltèe) (registered investment adviser and registered transfer agent); Trustee and Senior Vice President, The Invesco Funds; Director, Invesco Investment Advisers LLC (formerly known as Van Kampen Asset Management). Formerly: Director, Chief Executive Officer and President, Van Kampen Exchange Corp.; President and Principal Executive Officer, The Invesco Funds (other than AIM Treasurer’s Series Trust (Invesco Treasurer’s Series Trust), Short-Term Investments Trust and Invesco Management Trust); Executive Vice President, The Invesco Funds (AIM Treasurer’s Series Trust (Invesco Treasurer’s Series Trust), Short-Term Investments Trust and Invesco Management Trust only); Director and President, INVESCO Funds Group, Inc. (registered investment adviser and registered transfer agent); Director and Chairman, IVZ Distributors, Inc. (formerly known as INVESCO Distributors, Inc.) (registered broker dealer); Director, President and Chairman, Invesco Inc. (holding company), Invesco Canada Holdings Inc. (holding company), Trimark Investments Ltd./Placements Trimark Ltèe and Invesco Financial Services Ltd/Services Financiers Invesco Ltèe; Chief Executive Officer, Invesco Canada Fund Inc. (corporate mutual fund company); Director and Chairman, Van Kampen Investor Services Inc.; Director, Chief Executive Officer and President, 1371 Preferred Inc. (holding company) and Van Kampen Investments Inc.; Director and President, AIM GP Canada Inc. (general partner for limited partnerships) and Van Kampen Advisors, Inc.; Director and Chief Executive Officer, Invesco Trimark Dealer Inc. (registered broker dealer); Director, Invesco Distributors, Inc. (formerly known as Invesco AIM Distributors, Inc.) (registered broker dealer); Manager, Invesco PowerShares Capital Management LLC; Director, Chief Executive Officer and President, Invesco Advisers, Inc.; Director, Chairman, Chief Executive Officer and President, Invesco AIM Capital Management, Inc.; President, Invesco Trimark Dealer Inc. and Invesco Trimark Ltd./Invesco Trimark Ltèe; Director and President, AIM Trimark Corporate Class Inc. and AIM Trimark Canada Fund Inc.; Senior Managing Director, Invesco Holding Company Limited; Director and Chairman, Fund Management Company (former registered broker dealer); President and Principal Executive Officer, The Invesco Funds (AIM Treasurer’s Series Trust (Invesco Treasurer’s Series Trust), and Short-Term Investments Trust only); President, AIM Trimark Global Fund Inc. and AIM Trimark Canada Fund Inc. | | 146 | | None |
| 1 | Mr. Flanagan is considered an interested person (within the meaning of Section 2(a)(19) of the 1940 Act) of the Trust because he is an officer of the Adviser to the Trust, and an officer and a director of Invesco Ltd., ultimate parent of the Adviser. |
| 2 | Mr. Taylor is considered an interested person (within the meaning of Section 2(a)(19) of the 1940 Act) of the Trust because he is an officer and a director of the Adviser. |
T-1 Invesco Macro Long/Short Fund
Trustees and Officers—(continued)
| | | | | | | | |
Name, Year of Birth and
Position(s) Held with the Trust | | Trustee and/
or Officer Since | | Principal Occupation(s) During Past 5 Years | | Number of
Funds in Fund
Complex
Overseen by
Trustee | | Other Directorship(s)
Held by Trustee During
Past 5 Years |
| Independent Trustees | | | | | | | | |
Bruce L. Crockett — 1944 Trustee and Chair | | 2001 | | Chairman, Crockett Technologies Associates (technology consulting company) Formerly: Director, Captaris (unified messaging provider); Director, President and Chief Executive Officer, COMSAT Corporation; Chairman, Board of Governors of INTELSAT (international communications company); ACE Limited (insurance company); Independent Directors Council and Investment Company Institute | | 146 | | ALPS (Attorneys Liability Protection Society) (insurance company) and Globe Specialty Metals, Inc. (metallurgical company); Member of the Audit Committee, Ferroglobe PLC and Investment Company Institute; Member of the Executive Committee and Chair of the Governance Committee, Independent Directors Council |
David C. Arch — 1945 Trustee | | 2010 | | Chairman of Blistex Inc., a consumer health care products manufacturer | | 146 | | Board member of the Illinois Manufacturers’ Association; Member of the Board of Visitors, Institute for the Humanities, University of Michigan |
James T. Bunch — 1942 Trustee | | 2003 | | Managing Member, Grumman Hill Group LLC (family office/private equity investments) Formerly: Chairman of the Board, Denver Film Society, Chairman of the Board of Trustees, Evans Scholarship Foundation; Chairman, Board of Governors, Western Golf Association | | 146 | | Trustee, Evans Scholarship Foundation |
Albert R. Dowden — 1941 Trustee | | 2001 | | Director of a number of public and private business corporations, including Nature’s Sunshine Products, Inc. Formerly: Director, The Boss Group, Ltd. and Reich & Tang Funds (5 portfolios) (registered investment company); Director, Homeowners of America Holding Corporation/Homeowners of America Insurance Company (property casualty company); Director, Continental Energy Services, LLC (oil and gas pipeline service); Director, CompuDyne Corporation (provider of product and services to the public security market) and Director, Annuity and Life Re (Holdings), Ltd. (reinsurance company); Director, President and Chief Executive Officer, Volvo Group North America, Inc.; Senior Vice President, AB Volvo; Director of various public and private corporations; Chairman, DHJ Media, Inc.; Director, Magellan Insurance Company; and Director, The Hertz Corporation, Genmar Corporation (boat manufacturer), National Media Corporation; Advisory Board of Rotary Power International (designer, manufacturer, and seller of rotary power engines); and Chairman, Cortland Trust, Inc. (registered investment company) | | 146 | | Director of Nature’s Sunshine Products, Inc. |
Jack M. Fields — 1952 Trustee | | 2001 | | Chief Executive Officer, Twenty First Century Group, Inc. (government affairs company); and Discovery Learning Alliance (non-profit) Formerly: Owner and Chief Executive Officer, Dos Angeles Ranch L.P. (cattle, hunting, corporate entertainment); Director, Insperity, Inc. (formerly known as Administaff); Chief Executive Officer, Texana Timber LP (sustainable forestry company); Director of Cross Timbers Quail Research Ranch (non-profit); and member of the U.S. House of Representatives | | 146 | | None |
Eli Jones — 1961 Trustee | | 2016 | | Professor and Dean, Mays Business School — Texas A&M University Formerly: Professor and Dean, Walton College of Business, University of Arkansas and E.J. Ourso College of Business, Louisiana State University and Director, Arvest Bank | | 146 | | Director of Insperity, Inc. (formerly known as Administaff) |
Prema Mathai-Davis — 1950 Trustee | | 2001 | | Retired. Formerly: Chief Executive Officer, YWCA of the U.S.A. | | 146 | | None |
Larry Soll — 1942 Trustee | | 2003 | | Retired. Formerly: Chairman, Chief Executive Officer and President, Synergen Corp. (a biotechnology company) | | 146 | | None |
Raymond Stickel, Jr. — 1944 Trustee | | 2005 | | Retired. Formerly: Director, Mainstay VP Series Funds, Inc. (25 portfolios) and Partner, Deloitte & Touche | | 146 | | None |
Robert C. Troccoli — 1949 Trustee | | 2016 | | Adjunct Professor, University of Denver — Daniels College of Business Formerly: Senior Partner, KPMG LLP | | 146 | | None |
T-2 Invesco Macro Long/Short Fund
Trustees and Officers—(continued)
| | | | | | | | |
Name, Year of Birth and
Position(s) Held with the Trust | | Trustee and/
or Officer Since | | Principal Occupation(s) During Past 5 Years | | Number of
Funds in Fund
Complex
Overseen by
Trustee | | Other Directorship(s)
Held by Trustee During
Past 5 Years |
| Independent Trustees—(continued) |
Suzanne H. Woolsey — 1941 Trustee | | 2014 | | Retired. Formerly: Chief Executive Officer of Woolsey Partners LLC | | 146 | | Director, SunShare LLC; Trustee, Ocean Conservancy; Emeritus Chair of the Board of Trustees of the Institute for Defense Analyses and of Colorado College; Trustee, Chair, Business and Finance Committee of California Institute of Technology; Prior to 2014, Director of Fluor Corp.; Prior to 2010, Trustee of the German Marshall Fund of the United States; Prior to 2010, Trustee of the Rocky Mountain Institute |
| Other Officers | | | | | | | | |
Sheri Morris — 1964 President, Principal Executive Officer and Treasurer | | 1999 | | President, Principal Executive Officer and Treasurer, The Invesco Funds; Vice President, Invesco Advisers, Inc. (formerly known as Invesco Institutional (N.A.), Inc.) (registered investment adviser); and Vice President, PowerShares Exchange-Traded Fund Trust, PowerShares Exchange-Traded Fund Trust II, PowerShares India Exchange-Traded Fund Trust, PowerShares Actively Managed Exchange-Traded Fund Trust, and PowerShares Actively Managed Exchange-Traded Commodity Fund Trust Formerly: Vice President and Principal Financial Officer, The Invesco Funds; Vice President, Invesco AIM Advisers, Inc., Invesco AIM Capital Management, Inc. and Invesco AIM Private Asset Management, Inc.; Assistant Vice President and Assistant Treasurer, The Invesco Funds and Assistant Vice President, Invesco Advisers, Inc., Invesco AIM Capital Management, Inc. and Invesco AIM Private Asset Management, Inc.; and Treasurer, PowerShares Exchange-Traded Fund Trust, PowerShares Exchange-Traded Fund Trust II, PowerShares India Exchange-Traded Fund Trust and PowerShares Actively Managed Exchange-Traded Fund Trust | | N/A | | N/A |
Russell C. Burk — 1958 Senior Vice President and Senior Officer | | 2005 | | Senior Vice President and Senior Officer, The Invesco Funds | | N/A | | N/A |
John M. Zerr — 1962 Senior Vice President, Chief Legal Officer and Secretary | | 2006 | | Director, Senior Vice President, Secretary and General Counsel, Invesco Management Group, Inc. (formerly known as Invesco AIM Management Group, Inc.; Senior Vice President, Invesco Advisers, Inc. (formerly known as Invesco Institutional (N.A.), Inc.) (registered investment adviser); Senior Vice President and Secretary, Invesco Distributors, Inc. (formerly known as Invesco AIM Distributors, Inc.); Director, Vice President and Secretary, Invesco Investment Services, Inc. (formerly known as Invesco AIM Investment Services, Inc.) Senior Vice President, Chief Legal Officer and Secretary, The Invesco Funds; Managing Director, Invesco PowerShares Capital Management LLC; Director, Secretary and General Counsel, Invesco Investment Advisers LLC (formerly known as Van Kampen Asset Management); Secretary and General Counsel, Invesco Capital Markets, Inc. (formerly known as Van Kampen Funds Inc.) and Chief Legal Officer, PowerShares Exchange-Traded Fund Trust, PowerShares Exchange-Traded Fund Trust II, PowerShares India Exchange-Traded Fund Trust, PowerShares Actively Managed Exchange-Traded Fund Trust, and PowerShares Actively Managed Exchange-Traded Commodity Fund Trust Formerly: Director, Secretary, General Counsel and Senior Vice President, Van Kampen Exchange Corp.; Director, Vice President and Secretary, IVZ Distributors, Inc. (formerly known as INVESCO Distributors, Inc.); Director and Vice President, INVESCO Funds Group, Inc.; Director and Vice President, Van Kampen Advisors Inc.; Director, Vice President, Secretary and General Counsel, Van Kampen Investor Services Inc.; Director, Invesco Distributors, Inc. (formerly known as Invesco AIM Distributors, Inc.); Director, Senior Vice President, General Counsel and Secretary, Invesco AIM Advisers, Inc. and Van Kampen Investments Inc.; Director, Vice President and Secretary, Fund Management Company; Director, Senior Vice President, Secretary, General Counsel and Vice President, Invesco AIM Capital Management, Inc.; Chief Operating Officer and General Counsel, Liberty Ridge Capital, Inc. (an investment adviser); Vice President and Secretary, PBHG Funds (an investment company) and PBHG Insurance Series Fund (an investment company); Chief Operating Officer, General Counsel and Secretary, Old Mutual Investment Partners (a broker-dealer); General Counsel and Secretary, Old Mutual Fund Services (an administrator) and Old Mutual Shareholder Services (a shareholder servicing center); Executive Vice President, General Counsel and Secretary, Old Mutual Capital, Inc. (an investment adviser); and Vice President and Secretary, Old Mutual Advisors Funds (an investment company) | | N/A | | N/A |
T-3 Invesco Macro Long/Short Fund
Trustees and Officers—(continued)
| | | | | | | | |
Name, Year of Birth and
Position(s) Held with the Trust | | Trustee and/
or Officer Since | | Principal Occupation(s) During Past 5 Years | | Number of
Funds in Fund
Complex
Overseen by
Trustee | | Other Directorship(s)
Held by Trustee During
Past 5 Years |
| Other Officers—(continued) | | | | | | | | |
| Karen Dunn Kelley — 1960 Senior Vice President | | 2004 | | Senior Managing Director, Investments, Invesco Ltd.; Director, Co-President, Co-Chief Executive Officer, and Co-Chairman, Invesco Advisers, Inc. (formerly known as Invesco Institutional (N.A.), Inc.) (registered investment adviser); Chairman and Director, Invesco Senior Secured Management, Inc.; Senior Vice President, Invesco Management Group, Inc. (formerly known as Invesco AIM Management Group, Inc.); Executive Vice President, Invesco Distributors, Inc. (formerly known as Invesco AIM Distributors, Inc.); Director, Invesco Mortgage Capital Inc. and Invesco Management Company Limited; Senior Vice President, The Invesco Funds Formerly: Vice President, The Invesco Funds (other than AIM Treasurer’s Series Trust (Invesco Treasurer’s Series Trust), Short-Term Investments Trust and Invesco Management Trust); and President and Principal Executive Officer, The Invesco Funds (AIM Treasurer’s Series Trust (Invesco Treasurer’s Series Trust), Short-Term Investments Trust and Invesco Management Trust only); Director and President, INVESCO Asset Management (Bermuda) Ltd., Director, INVESCO Global Asset Management DAC (formerly known as INVESCO Global Asset Management Limited) and INVESCO Management S.A.; Senior Vice President, Van Kampen Investments Inc. and Invesco Advisers, Inc. (formerly known as Invesco Institutional (N.A.), Inc.) (registered investment adviser); Director and President, Fund Management Company; Chief Cash Management Officer, Director of Cash Management, Senior Vice President, and Managing Director, Invesco AIM Capital Management, Inc.; Director of Cash Management, Senior Vice President, and Vice President, Invesco Advisers, Inc. and Vice President, The Invesco Funds (AIM Treasurer’s Series Trust (Invesco Treasurer’s Series Trust), and Short-Term Investments Trust only) | | N/A | | N/A |
Kelli Gallegos — 1970 Vice President, Principal Financial Officer and Assistant Treasurer | | 2008 | | Vice President, Principal Financial Officer and Assistant Treasurer, The Invesco Funds; Assistant Treasurer, Invesco PowerShares Capital Management LLC, PowerShares Exchange-Traded Fund Trust, PowerShares Exchange-Traded Fund Trust II, PowerShares India Exchange-Traded Fund Trust, PowerShares Actively Managed Exchange-Traded Fund Trust, and PowerShares Actively Managed Exchange-Traded Commodity Fund Trust Formerly: Assistant Vice President, The Invesco Funds | | N/A | | N/A |
Tracy Sullivan — 1962 Vice President, Chief Tax Officer and Assistant Treasurer | | 2008 | | Vice President, Chief Tax Officer and Assistant Treasurer, The Invesco Funds; Assistant Treasurer, Invesco PowerShares Capital Management LLC, PowerShares Exchange-Traded Fund Trust, PowerShares Exchange-Traded Fund Trust II, PowerShares India Exchange-Traded Fund Trust, PowerShares Actively Managed Exchange-Traded Fund Trust, and PowerShares Actively Managed Exchange-Traded Commodity Fund Trust Formerly: Assistant Vice President, The Invesco Funds | | N/A | | N/A |
Crissie M. Wisdom — 1969 Anti-Money Laundering Compliance Officer | | 2013 | | Anti-Money Laundering Compliance Officer, Invesco Advisers, Inc. (formerly known as Invesco Institutional (N.A.), Inc.) (registered investment adviser), Invesco Capital Markets, Inc. (formerly known as Van Kampen Funds Inc.), Invesco Distributors, Inc., Invesco Investment Services, Inc., Invesco Management Group, Inc., The Invesco Funds, and PowerShares Exchange-Traded Fund Trust, PowerShares Exchange-Traded Fund Trust II, PowerShares India Exchange-Traded Fund Trust, PowerShares Actively Managed Exchange-Traded Fund Trust and PowerShares Actively Managed Exchange-Traded Commodity Fund Trust; Anti-Money Laundering Compliance Officer and Bank Secrecy Act Officer, INVESCO National Trust Company and Invesco Trust Company; and Fraud Prevention Manager and Controls and Risk Analysis Manager for Invesco Investment Services, Inc. Formerly: Anti-Money Laundering Compliance Officer, Van Kampen Exchange Corp. | | N/A | | N/A |
Robert R. Leveille — 1969 Chief Compliance Officer | | 2016 | | Chief Compliance Officer, Invesco Advisers, Inc. (registered investment adviser); and Chief Compliance Officer, The Invesco Funds Formerly: Chief Compliance Officer, Putnam Investments and the Putnam Funds | | N/A | | N/A |
The Statement of Additional Information of the Trust includes additional information about the Fund’s Trustees and is available upon request, without charge, by calling 1.800.959.4246. Please refer to the Fund’s Statement of Additional Information for information on the Fund’s sub-advisers.
| | | | | | |
Office of the Fund 11 Greenway Plaza, Suite 1000 Houston, TX 77046-1173 | | Investment Adviser Invesco Advisers, Inc. 1555 Peachtree Street, N.E. Atlanta, GA 30309 | | Distributor Invesco Distributors, Inc. 11 Greenway Plaza, Suite 1000 Houston, TX 77046-1173 | | Auditors PricewaterhouseCoopers LLP 1000 Louisiana Street, Suite 5800 Houston, TX 77002-5678 |
| | | |
| | | | | | |
Counsel to the Fund Stradley Ronon Stevens & Young, LLP 2005 Market Street, Suite 2600 Philadelphia, PA 19103-7018 | | Counsel to the Independent Trustees Goodwin Procter LLP 901 New York Avenue, N.W. Washington, D.C. 20001 | | Transfer Agent Invesco Investment Services, Inc. 11 Greenway Plaza, Suite 1000 Houston, TX 77046-1173 | | Custodian State Street Bank and Trust Company 225 Franklin Street Boston, MA 02110-2801 |
T-4 Invesco Macro Long/Short Fund
Explore High-Conviction Investing with Invesco

Invesco mailing information
Send general correspondence to Invesco Investment Services, Inc., P.O. Box 219078, Kansas City, MO 64121-9078.
Important notice regarding delivery of security holder documents
To reduce Fund expenses, only one copy of most shareholder documents may be mailed to shareholders with multiple accounts at the same address (Householding). Mailing of your shareholder documents may be householded indefinitely unless you instruct us otherwise. If you do not want the mailing of these documents to be combined with those for other members of your household, please contact Invesco Investment Services, Inc. at 800 959 4246 or contact your financial institution. We will begin sending you individual copies for each account within 30 days after receiving your request.
Fund holdings and proxy voting information
The Fund provides a complete list of its holdings four times in each fiscal year, at the quarter ends. For the second and fourth quarters, the lists appear in the Fund’s semiannual and annual reports to shareholders. For the first and third quarters, the Fund files the lists with the Securities and Exchange Commission (SEC) on Form N-Q. The most recent list of portfolio holdings is available at invesco.com/completeqtrholdings. Shareholders can also look up the Fund’s Forms N-Q on the SEC website at sec.gov. Copies of the Fund’s Forms N-Q may be reviewed and copied at the SEC Public Reference Room in Washington, D.C. You can obtain information on the operation of the Public Reference Room, including information about duplicating fee charges, by calling 202 551 8090 or 800 732 0330, or by electronic request at the following email address: publicinfo@sec.gov.
The SEC file numbers for the Fund are shown below.
A description of the policies and procedures that the Fund uses to determine how to vote proxies relating to portfolio securities is available without charge, upon request, from our Client Services department at 800 959 4246 or at invesco.com/proxyguidelines. The information is also available on the SEC website, sec.gov.
| | |
Information regarding how the Fund voted proxies related to its portfolio securities during the most recent 12-month period ended June 30 is available at invesco.com/proxysearch. The information is also available on the SEC website, sec.gov. Invesco Advisers, Inc. is an investment adviser; it provides investment advisory services to individual and institutional clients and does not sell securities. Invesco Distributors, Inc. is the US distributor for Invesco Ltd.’s retail mutual funds, exchange-traded funds and institutional money market funds. Both are wholly owned, indirect subsidiaries of Invesco Ltd. | |  |
| | | | |
| SEC file numbers: 811-05426 and 033-19338 | | MLS-AR-1 | | Invesco Distributors, Inc. |
| | | | |
| | |
 | | Annual Report to Shareholders | | October 31, 2016 |
| | |
| | Invesco MLP Fund |
| | Nasdaq: |
| | A: ILPAX ∎ C: ILPCX ∎ R: ILPRX ∎ Y: ILPYX ∎ R5: ILPFX ∎ R6: ILPQX |

Letters to Shareholders
| | | | |

Philip Taylor | | | | Dear Shareholders: This annual report includes information about your Fund, including performance data and a complete list of its investments as of the close of the reporting period. Inside is a discussion of how your Fund was managed and the factors that affected its performance during the reporting period. In December 2015, the US Federal Reserve raised short-term interest rates for the first time since 2006, signaling its belief that the economy was likely to continue strengthening. Indeed, throughout the reporting period, US economic data were generally positive and the economy expanded at a moderate rate – but there were some bumps along the road. Job growth in May 2016 was very weak, but it was followed by strong increases in nonfarm payrolls in June and July. Increased concerns about global economic weakness caused US stock market indexes to sink at the start of calendar year 2016, but they eventually recovered; they sank again following |
the UK’s decision to leave the European Union, but then quickly recovered and reached record highs later in the summer. Strong demand for income-producing investments, particularly those perceived to be lower risk, benefited bonds as well as dividend-paying stocks for much of the reporting period. While economic news in the US was generally positive, news overseas was less upbeat. The European Central Bank, and central banks in China and Japan – as well as other countries – maintained extraordinarily accommodative monetary policies in response to economic weakness. As the fiscal year drew to a close, uncertainty about the outcome of the US presidential election resulted in increased market volatility; the surprise outcome after the close of the reporting period suggested that market volatility may continue for some time to come.
Short-term market volatility can prompt some investors to abandon their investment plans – and can cause others to settle for average results. The investment professionals at Invesco, in contrast, invest with high conviction, take a long-term perspective and have a passion to exceed. Invesco’s pure focus on investment management eliminates possible distractions and means that there are no competing lines of business for us to support. Just as important, we embrace a variety of investment strategies, asset classes and geographies – because we know that no single investment approach meets the diverse needs of all of our clients. We manage all our investment approaches with a passion to exceed. All our investment teams have a highly disciplined, long-term investing style that eliminates short-term decision-making. Of course, investing with high conviction can’t guarantee a profit or ensure success; no investment strategy can. To learn more about how we invest with high conviction, visit invesco.com/HighConviction.
You, too, can invest with high conviction by maintaining a long-term investment perspective and by working with your financial adviser on a regular basis. During periods of short-term market volatility or uncertainty, your financial adviser can keep you focused on your long-term investment goals – a new home, a child’s college education or a secure retirement. He or she also can share research about the economy, the markets and individual investment options.
Visit our website for more information on your investments
Our website, invesco.com/us, offers a wide range of market insights and investment perspectives. On the website, you’ll find detailed information about our funds, including performance, holdings and portfolio manager commentaries. You can access information about your account by completing a simple, secure online registration. Click on the “Need to register” link in the “Account Access” box on our homepage to get started.
In addition to the resources accessible on our website and through our mobile app, you can obtain timely updates to help you stay informed about the markets, the economy and investing by connecting with Invesco on Twitter, LinkedIn or Facebook. You can access our blog at blog.invesco.us.com. Our goal is to provide you the information you want, when and where you want it.
Finally, I’m pleased to share with you Invesco’s commitment to both the Principles for Responsible Investment and to considering environmental, social and governance issues in our robust investment process. I invite you to learn more at invesco.com/esg.
Have questions?
For questions about your account, contact an Invesco client services representative at 800 959 4246. For Invesco-related questions or comments, please email me directly at phil@invesco.com.
All of us at Invesco look forward to serving your investment management needs. Thank you for investing with us.
Sincerely,

Philip Taylor
Senior Managing Director, Invesco Ltd.
2 Invesco MLP Fund
| | | | | | |

Bruce Crockett | | | | Dear Fellow Shareholders: Among the many important lessons I’ve learned in more than 40 years in a variety of business endeavors is the value of a trusted advocate. As independent chair of the Invesco Funds Board, I can assure you that the members of the Board are strong advocates for the interests of investors in Invesco’s mutual funds. We work hard to represent your interests through oversight of the quality of the investment management services your funds receive and other matters important to your investment, including but not limited to: |
| | | | ∎ | | Ensuring that Invesco offers a diverse lineup of mutual funds that your financial adviser can use to strive to meet your financial needs as your investment goals change over time. |
| | | | ∎ | | Monitoring how the portfolio management teams of the Invesco funds are performing in light of changing economic and market conditions. |
| ∎ | | Assessing each portfolio management team’s investment performance within the context of the investment strategy described in the fund’s prospectus. |
| ∎ | | Monitoring for potential conflicts of interests that may impact the nature of the services that your funds receive. |
We believe one of the most important services we provide our fund shareholders is the annual review of the funds’ advisory and sub-advisory contracts with Invesco Advisers and its affiliates. This review is required by the Investment Company Act of 1940 and focuses on the nature and quality of the services Invesco provides as the adviser to the Invesco funds and the reasonableness of the fees that it charges for those services. Each year, we spend months carefully reviewing information received from Invesco and a variety of independent sources, such as performance and fee data prepared by Lipper Inc., an independent, third-party firm widely recognized as a leader in its field. We also meet with our independent legal counsel and other independent advisers to review and help us assess the information that we have received. Our goal is to assure that you receive quality investment management services for a reasonable fee.
I trust the measures outlined above provide assurance that you have a worthy advocate when it comes to choosing the Invesco Funds.
As always, please contact me at bruce@brucecrockett.com with any questions or concerns you may have. On behalf of the Board, we look forward to continuing to represent your interests and serving your needs.
Sincerely,

Bruce L. Crockett
Independent Chair
Invesco Funds Board of Trustees
3 Invesco MLP Fund
Management’s Discussion of Fund Performance
| | | | | |
Performance summary For the fiscal year ended October 31, 2016, Class A shares of Invesco MLP Fund (the Fund), at net asset value (NAV), outperformed the Fund’s style-specific bench-mark, the Alerian MLP Index. Your Fund’s long-term performance appears later in this report. |
| | | | | |
Fund vs. Indexes Total returns, 10/31/15 to 10/31/16, at net asset value (NAV). Performance shown does not include applicable contingent deferred sales charges (CDSC) or front-end sales charges, which would have reduced performance. |
| | | | | |
Class A Shares | | | | -0.14 | % |
Class C Shares | | | | -1.08 | |
Class R Shares | | | | -0.39 | |
Class Y Shares | | | | 0.14 | |
Class R5 Shares | | | | -0.03 | |
Class R6 Shares | | | | -0.03 | |
S&P 500 Indexq (Broad Market Index) | | | | 4.51 | |
Alerian MLP Indexq (Style-Specific Index) | | | | -1.80 | |
Lipper Energy MLP Funds Index∎ (Peer Group Index) | | | | 1.14 | |
| |
Source(s): qFactSet Research Systems Inc.; ∎Lipper Inc. | | | | | |
Market conditions and your Fund
During the fiscal year ended October 31, 2016, the US economy continued to expand. The initial estimate of US gross domestic product (GDP) showed the US economy grew by 2.9% in the third quarter, beating consensus estimates.1 However, annualized GDP is expected to be lower. Employment data were mixed, though the unemployment rate had a surprise uptick from 4.9% in August to 5.0% in September before ending the fiscal year at 4.9%.2
The US Federal Reserve (the Fed) raised interest rates in December 2015 – its first increase since 2006 – but that was its only increase during the reporting period. Major US stock market indexes posted gains for the reporting period, but they were fairly volatile. Stocks began calendar year 2016 on a negative note, driven by investor concerns about economic weakness in China, falling oil prices and uncertainty over Fed policy, including rumors of possible negative interest rates in the US. Markets recovered in late
February and posted gains until June when UK voters opted to leave the European Union, sending markets sharply lower once again. Markets again recovered, and major US equity indexes hit record highs during the summer.3 In this environment, investors generally favored the perceived safety of government bonds and more defensive, dividend-paying equities often found in the telecommunication services, utilities and consumer staples sectors.
A combination of high production levels and weakened demand outlook led to further imbalances in crude oil and natural gas supply and demand, causing energy prices to plunge at the beginning of the fiscal year; crude oil fell from $49 to a low of $28 per barrel and natural gas fell from $2.25 to a low $1.64 per thousand cubic feet.4 Toward the end of the reporting period, OPEC provided some respite by finally agreeing to limit production in an effort to stabilize crude prices. Additionally, continued capital expenditure cuts helped to reduce natural gas
production. Crude oil and natural gas prices ended the reporting period at $48 per barrel and $3.03 per thousand cubic feet, respectively.4
In general for the reporting period, master limited partnership (MLP) equities experienced losses, underperforming broad market equities, given investor sentiment surrounding volatile energy prices. For the fiscal year, the Fund’s Class A shares at NAV experienced a negative return, but outperformed the Fund’s style-specific benchmark, the Alerian MLP Index.
On an absolute basis, Fund holdings in gathering and processing MLPs as well as natural gas pipelines and storage were the largest contributors to performance. Pipelines and midstream diversified MLPs as well as non-traditional MLPs were the only MLP sectors to detract from absolute Fund performance during the fiscal year.
The Fund outperformed its style-specific benchmark, the Alerian MLP Index, as a result of security selection and market allocation during the fiscal year. In particular, security selection and an overweight position in gathering and processing MLPs and refined product pipelines and terminals were the largest contributors to relative performance. Underweight exposure to marine MLPs, as well as security selection in and underweight exposure to non-traditional MLPs, also contributed to relative returns. Ancillary cash held by the Fund was also beneficial during the reporting period given the declines in MLP equities overall. Relative detractors from Fund performance included security selection in and overweight exposure to pipelines and midstream diversified MLPs, as well as lack of exposure to coal and propane MLPs.
Energy Transfer Equity, which is not in the benchmark, was the largest absolute and relative detractor to Fund performance during the reporting period. Prior to the fiscal year, Energy Transfer Equity announced
| | | | | |
By sector | | | | % of total net assets | |
| | | | | |
Pipelines & Midstream Diversified | | | | 46.5 | % |
Refined Products Pipelines & Terminals | | | | 30.8 | |
Gathering & Processing MLP | | | | 11.6 | |
Natural Gas Pipelines & Storage | | | | 6.3 | |
Marine | | | | 1.8 | |
General Partner (C-Corp) | | | | 1.0 | |
Refinery Logistics | | | | 0.9 | |
Gathering & Processing | | | | 0.2 | |
Money Market Funds Plus Other Assets Less Liabilities | | | | 0.9 | |
| | |
| Top 10 Equity Holdings* |
| | % of total net assets |
| | | | | | | |
| 1. | | Enterprise Products Partners L.P. | | | | 17.1 | % |
| 2. | | Energy Transfer Partners, L.P. | | | | 9.5 | |
| 3. | | Magellan Midstream Partners, L.P. | | | | 6.8 | |
| 4. | | Plains All American Pipeline, L.P. | | | | 6.6 | |
| 5. | | MPLX L.P. | | | | 5.0 | |
| 6. | | Enbridge Energy Partners, L.P. | | | | 4.8 | |
| 7. | | Williams Partners L.P. | | | | 4.7 | |
| 8. | | Buckeye Partners, L.P. | | | | 3.6 | |
| 9. | | Sunoco Logistics Partners L.P. | | | | 3.4 | |
| 10. | | ONEOK Partners, L.P. | | | | 3.1 | |
| | | | | |
Total Net Assets | | | | $9.1 million | |
Total Number of Holdings* | | | | 37 | |
The Fund’s holdings are subject to change, and there is no assurance that the Fund will continue to hold any particular security.
*Excluding money market fund holdings.
Data presented here are as of October 31, 2016.
4 Invesco MLP Fund
plans to merge with Williams Companies (also a Fund holding). Rumblings that the merger was not in the best interests of Williams’ shareholders roiled both stocks. Williams’ shareholders ultimately accepted the proposal; however, Energy Transfer Equity decided to terminate the merger. Subsequently, both companies have filed lawsuits for alleged breach of contract.
Magellan Midstream Partners was the top absolute contributor to performance. During the fiscal year, Magellan entered into an agreement to connect its Texas delivery system to TransCanada’s (not a Fund holding) Houston tank terminal. The company also announced plans to build a new Pasadena, Texas, marine terminal with initial storage capacity of 1 million barrels of refined products and ethanol – expandable to 10 million barrels with five docks, depending on future demand. Magellan also increased its quarterly distribution twice during the fiscal year.
During the reporting period, the Fund held an average overweight position relative to its style-specific benchmark in refined products pipelines and terminals; gathering and processing MLPs; and pipelines and midstream diversified MLPs. The Fund held an average underweight position in marine MLPs, non-traditional, as well as natural gas pipelines and storage. Out-of-benchmark sector exposure included minor exposure to general partners and refined products. The Fund lacked exposure to several MLP sectors in which its style-specific benchmark had minor exposure: upstream, oilfield services, propane and coal.
At the close of the reporting period, we believed the lifting of the US crude oil export ban would likely be a long-term positive for continued US midstream infrastructure build-out. Growth characteristics for midstream services were relatively attractive, in our view. We believed an anticipated increase in US energy production in 2017 and 2018 would likely be positive for midstream services companies, which tend to be influenced more by the volume, rather than the price, of energy.
We also believed that the Permian and Marcellus basins remained the strongest basins with drilling economics that were relatively attractive, with production volumes that have remained insulated from downward pressure. Despite distribution cuts from upstream MLPs, our expectations for distribution growth among companies focused on refined products, natural gas pipelines and storage remained positive given the contractual nature of existing cash flows, combined with a still-healthy project backlog. In general, the
Fund remained focused on companies that exhibit a relatively high fee-based cash flow, have access to a growing asset base through both organic capital expenditures and acquisitions, and operate in what we view to be the most attractive natural resource basins in the US.
We thank you for your investment in Invesco MLP Fund.
| 1 | Source: Bureau of Economic Analysis |
| 2 | Source: Bureau of Labor Statistics |
The views and opinions expressed in management’s discussion of Fund performance are those of Invesco Advisers, Inc. These views and opinions are subject to change at any time based on factors such as market and economic conditions. These views and opinions may not be relied upon as investment advice or recommendations, or as an offer for a particular security. The information is not a complete analysis of every aspect of any market, country, industry, security or the Fund. Statements of fact are from sources considered reliable, but Invesco Advisers, Inc. makes no representation or warranty as to their completeness or accuracy. Although historical performance is no guarantee of future results, these insights may help you understand our investment management philosophy.
See important Fund and, if applicable, index disclosures later in this report.
| | |
 | | Joe Rodriguez Jr. Portfolio Manager, is lead manager of Invesco MLP Fund. He is Head of Global |
| |
Securities with Invesco Real Estate, where he oversees all phases of the unit, including securities research and administration. Mr. Rodriguez joined Invesco in 1990. He earned a BBA in economics and finance and an MBA in finance from Baylor University.
| | |
 | | Mark Blackburn Chartered Financial Analyst, Portfolio Manager, is manager of Invesco MLP Fund. |
| |
He joined Invesco in 1998. Mr. Blackburn earned a BS in accounting from Louisiana State University and an MBA from Southern Methodist University. He is also a Certified Public Accountant.
| | |
 | | James Cowen Portfolio Manager, is manager of Invesco MLP Fund. He joined Invesco in 2000. |
| |
Mr. Cowen earned a Master of Town and Country Planning degree from the University of Manchester and a Master of Philosophy degree in land economy from Cambridge University.
| | |
 | | Paul Curbo Chartered Financial Analyst, Portfolio Manager, is manager of Invesco MLP Fund. |
| |
He joined Invesco in 1998. Mr. Curbo earned a BBA in finance from The University of Texas at Austin.
| | |
 | | Darin Turner Portfolio Manager, is manager of Invesco MLP Fund. He joined Invesco in 2005. |
| |
Mr. Turner earned a BBA in finance from Baylor University, an MS in real estate from The University of Texas at Arlington and an MBA specializing in investments from Southern Methodist University.
| | |
 | | Ping Ying Wang Chartered Financial Analyst, Portfolio Manager, is manager of Invesco MLP Fund. |
| |
She joined Invesco in 1998. Ms. Wang earned a BS in international finance from the People’s University of China and a PhD in finance from The University of Texas at Dallas.
Your Fund’s Long-Term Performance
Results of a $10,000 Investment – Oldest Share Class(es) since Inception
Fund and index data from 8/29/14
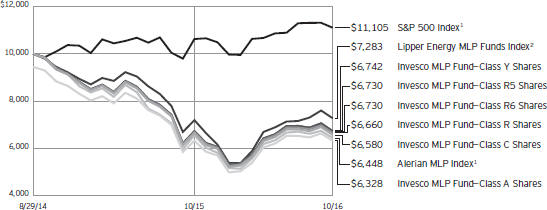
| 1 | Source: FactSet Research Systems Inc. |
Past performance cannot guarantee comparable future results.
The data shown in the chart include reinvested distributions, applicable sales charges and Fund expenses including
management fees. Performance of the peer group, if applicable, reflects fund expenses and management fees; performance of a market index does not. Performance shown in the chart and
table(s) does not reflect deduction of taxes a shareholder would pay on Fund distributions or sale of Fund shares.
6 Invesco MLP Fund
| | | | |
| Average Annual Total Returns | |
As of 10/31/16, including maximum applicable sales charges | |
| |
Class A Shares | | | | |
Inception (8/29/14) | | | -18.99 | % |
1 Year | | | -5.69 | |
| |
Class C Shares | | | | |
Inception (8/29/14) | | | -17.52 | % |
1 Year | | | -2.02 | |
| |
Class R Shares | | | | |
Inception (8/29/14) | | | -17.06 | % |
1 Year | | | -0.39 | |
| |
Class Y Shares | | | | |
Inception (8/29/14) | | | -16.60 | % |
1 Year | | | 0.14 | |
| |
Class R5 Shares | | | | |
Inception (8/29/14) | | | -16.66 | % |
1 Year | | | -0.03 | |
| |
Class R6 Shares | | | | |
Inception (8/29/14) | | | -16.66 | % |
1 Year | | | -0.03 | |
The performance data quoted represent past performance and cannot guarantee comparable future results; current performance may be lower or higher. Please visit invesco.com/performance for the most recent month-end performance. Performance figures reflect reinvested distributions, changes in net asset value and the effect of the maximum sales charge unless otherwise stated. Investment return and principal value will fluctuate so that you may have a gain or loss when you sell shares.
The net annual Fund operating expense ratio set forth in the most recent Fund prospectus as of the date of this report for Class A, Class C, Class R, Class Y, Class R5 and Class R6 shares was 1.50%, 2.25%, 1.75%, 1.25%, 1.25% and 1.25%, respectively.1 The total annual Fund operating expense ratio set forth in the most recent Fund prospectus as of the date of this report for Class A, Class C, Class R, Class Y, Class R5 and Class R6 shares was 6.37%, 7.12%, 6.62%, 6.12%, 6.10% and 6.10%, respectively. The expense ratios presented above may vary from the expense ratios presented in other sections of this report that are based on expenses incurred during the period covered by this report.
Class A share performance reflects the maximum 5.50% sales charge, and Class C share performance reflects the applicable contingent deferred sales
| | | | |
| Average Annual Total Returns | |
| As of 9/30/16, the most recent calendar quarter end, including maximum applicable sales charges | |
| |
Class A Shares | | | | |
Inception (8/29/14) | | | -17.80 | % |
1 Year | | | 7.13 | |
| |
Class C Shares | | | | |
Inception (8/29/14) | | | -16.25 | % |
1 Year | | | 11.36 | |
| |
Class R Shares | | | | |
Inception (8/29/14) | | | -15.82 | % |
1 Year | | | 12.95 | |
| |
Class Y Shares | | | | |
Inception (8/29/14) | | | -15.34 | % |
1 Year | | | 13.72 | |
| |
Class R5 Shares | | | | |
Inception (8/29/14) | | | -15.34 | % |
1 Year | | | 13.72 | |
| |
Class R6 Shares | | | | |
Inception (8/29/14) | | | -15.34 | % |
1 Year | | | 13.72 | |
charge (CDSC) for the period involved. The CDSC on Class C shares is 1% for the first year after purchase. Class R, Class Y, Class R5 and Class R6 class shares do not have a front-end sales charge or a CDSC; therefore, performance is at net asset value.
The performance of the Fund’s share classes will differ primarily due to different sales charge structures and class expenses.
Fund performance reflects any applicable fee waivers and/or expense reimbursements. Had the adviser not waived fees and/or reimbursed expenses currently or in the past, returns would have been lower. See current prospectus for more information.
| 1 | Total annual Fund operating expenses after any contractual fee waivers and/or expense reimbursements by the adviser in effect through at least February 28, 2017. See current prospectus for more information. |
7 Invesco MLP Fund
Invesco MLP Fund’s investment objective is capital appreciation and, secondarily, income.
| ∎ | | Unless otherwise stated, information presented in this report is as of October 31, 2016, and is based on total net assets. |
| ∎ | | Unless otherwise noted, all data provided by Invesco. |
| ∎ | | To access your Fund’s reports/prospectus, visit invesco.com/fundreports. |
About share classes
| ∎ | | Class R shares are generally available only to employer sponsored retirement and benefit plans. Please see the prospectus for more information. |
| ∎ | | Class Y shares are available only to certain investors. Please see the prospectus for more information. |
| ∎ | | Class R5 shares and Class R6 shares are primarily intended for employer sponsored retirement and benefit plans that meet certain standards and for institutional investors. Please see the prospectus for more information. |
Principal risks of investing
in the Fund
| ∎ | | Debt securities risk. The prices of debt securities held by the Fund will be affected by changes in interest rates, the creditworthiness of the issuer and other factors. An increase in prevailing interest rates typically causes the value of existing debt securities to fall and often has a greater impact on longer-duration debt securities and higher quality debt securities. Falling interest rates will cause the Fund to reinvest the proceeds of debt securities that have been repaid by the issuer at lower interest rates. Falling interest rates may also reduce the Fund’s distributable income because interest payments on floating rate debt instruments held by the Fund will decline. The Fund could lose money on investments in debt securities if the issuer or borrower fails to meet its obligations to make interest payments and/or to repay principal in a timely manner. Changes in an issuer’s financial strength, the market’s perception of such strength or in the credit rating of the issuer or the security may affect the value of debt securities. The Adviser’s credit analysis may fail to anticipate such changes, which could result in buying a debt security at an inopportune time or failing to sell a debt security in advance of a price decline or other credit event. |
| ∎ | | Deferred tax risk. The Fund is classified for federal tax purposes as a taxable regular corporation or so-called Subchapter “C” corporation. As a “C” corporation, the Fund is subject to US federal income tax on its taxable income at the graduated rates applicable to corporations (currently at a maximum rate of 35%) as well as state and local income taxes. The Fund will not benefit from the current favorable federal income tax rates on long-term capital gains and Fund income, losses and expenses will not be passed through to the Fund’s shareholders. An investment strategy whereby a fund is taxed as a regular corporation, or “C” corporation, rather than as a regulated investment company for US federal income tax purposes, is a relatively recent strategy for open-end registered investment companies such as the Fund. This strategy involves complicated accounting, tax, net asset value (NAV) and share valuation aspects that would cause the Fund to differ significantly from most other open-end registered investment companies. |
| ∎ | | Energy infrastructure MLP risk. The Fund will concentrate its investments in the energy sector. Energy infrastructure MLPs are subject to a variety of industry specific risk factors, including reduced volumes of energy commodities available for transporting, processing, storing or distributing; changes in energy commodity prices; a sustained reduced demand for crude oil, natural gas and refined petroleum products; depletion of the natural gas reserves or other commodities if not replaced; natural disasters, extreme weather and environmental hazards; rising interest rates which could drive investors into other investment opportunities; environmental damage claims; and threats of attack by terrorists on energy assets. In addition, taxes, government regulation, international politics, price and supply fluctuations, volatile interest rates and energy conservation may cause difficulties for energy infrastructure MLPs. |
| ∎ | | High yield debt securities (junk bond) risk. Investments in high yield debt securities (“junk bonds”) and other lower-rated securities will subject the Fund to substantial risk of loss. These securities are considered to be speculative with respect to the issuer’s ability to pay interest and principal when due, are more susceptible to default or decline in market value and are less liquid than investment grade debt securities. Prices of high yield debt securities tend to be very volatile. |
| ∎ | | Management risk. The Fund is actively managed and depends heavily on the Adviser’s judgment about markets, interest rates or the attractiveness, relative values, liquidity, or potential appreciation of particular investments made for the Fund’s portfolio. The Fund could experience losses if these judgments prove to be incorrect. Additionally, legislative, regulatory, or tax developments may adversely affect management of the Fund and, therefore, the ability of the Fund to achieve its investment objective. |
| ∎ | | Market risk. The market values of the Fund’s investments, and therefore the value of the Fund’s shares, will go up and down, sometimes rapidly or unpredictably. Market risk may affect a single issuer, industry or section of the economy, or it may affect the market as a whole. Individual stock prices tend to go up and down more dramatically than those of certain other types of investments, such as bonds. During a general downturn in the financial markets, multiple asset classes may decline in value. When markets perform well, there can be no assurance that specific investments held by the Fund will rise in value. |
| ∎ | | MLP risk. The Fund invests principally in securities of MLPs, which are subject to the following risks: |
| | – | Limited partner risk. An MLP is a public limited partnership or limited liability company taxed as a partnership under the Code. Although the characteristics of MLPs closely resemble a traditional limited partnership, a major difference is that MLPs may trade on a public exchange or in the over-the-counter market. The risks of investing in an MLP are similar to those of investing in a partnership, including more flexible governance |
|
This report must be accompanied or preceded by a currently effective Fund prospectus, which contains more complete information, including sales charges and expenses. Investors should read it carefully before investing. |
NOT FDIC INSURED | MAY LOSE VALUE | NO BANK GUARANTEE
8 Invesco MLP Fund
structures, which could result in less protection for investors than investments in a corporation. Investors in an MLP normally would not be liable for the debts of the MLP beyond the amount that the investor has contributed but investors may not be shielded to the same extent that a shareholder of a corporation would be. In certain circumstances, creditors of an MLP would have the right to seek return of capital distributed to a limited partner, which right would continue after an investor sold its investment in the MLP.
| – | Liquidity risk. The ability to trade on a public exchange or in the over-the-counter market provides a certain amount of liquidity not found in many limited partnership investments. However, MLP interests may be less liquid than conventional publicly traded securities and, therefore, more difficult to trade at desirable times and/or prices. |
| – | Interest rate risk. In addition, MLP distributions may be reduced by fees and other expenses incurred by the MLP. MLPs generally are considered interest-rate sensitive investments. During periods of interest rate volatility, these investments may not provide attractive returns. |
| – | General partner risk. The holder of the general partner or managing member interest can be liable in certain circumstances for amounts greater than the amount of the holder’s investment in the general partner or managing member. |
| ∎ | | MLP tax risk. MLPs taxed as partnerships do not pay US federal income tax at the partnership level. A change in current tax law, or a change in the underlying business mix of a given MLP, however, could result in an MLP being classified as a corporation for US federal income tax purposes, which would have the effect of reducing the amount of cash available for distribution by the MLP and, as a result, could cause a reduction of the value of the Fund’s investment, and consequently your investment in the Fund and lower income. Each year, the Fund will send you an annual tax statement (Form 1099) to assist you in completing your federal, state and local tax returns. If |
an MLP in which the Fund invests amends its partnership tax return, the Fund will, when necessary, send you a corrected Form 1099, which could, in turn, require you to amend your federal, state or local tax returns.
| ∎ | | Non-diversification risk. The Fund is non-diversified and can invest a greater portion of its assets in the obligations or securities of a small number of issuers or any single issuer than a diversified fund can. A change in the value of one or a few issuers’ securities will therefore affect the value of the Fund more than if it was a diversified fund. |
| ∎ | | Small- and mid-capitalization companies risks. Small- and mid-capitalization companies tend to be more vulnerable to changing market conditions, may have little or no operating history or track record of success, and may have more limited product lines and markets, less experienced management and fewer financial resources than larger companies. These companies’ securities may be more volatile and less liquid than those of more established companies, and their returns may vary, sometimes significantly, from the overall securities market. |
About indexes used in this report
| ∎ | | The S&P 500® Index is an unmanaged index considered representative of the US stock market. |
| ∎ | | The Alerian MLP Index is designed to capture the performance of energy master limited partnerships (MLPs). |
| ∎ | | The Lipper Energy MLP Funds Index is an unmanaged index considered representative of energy MLP funds tracked by Lipper. |
| ∎ | | The Fund is not managed to track the performance of any particular index, including the index(es) described here, and consequently, the performance of the Fund may deviate significantly from the performance of the index(es). |
| ∎ | | A direct investment cannot be made in an index. Unless otherwise indicated, index results include reinvested dividends, and they do not reflect sales charges. Performance of the peer group, if applicable, reflects fund expenses; performance of a market index does not. |
Other information
| ∎ | | The returns shown in management’s discussion of Fund performance are based on net asset values (NAVs) calculated for shareholder transactions. Generally accepted accounting principles require adjustments to be made to the net assets of the Fund at period end for financial reporting purposes, and as such, the NAVs for shareholder transactions and the returns based on those NAVs may differ from the NAVs and returns reported in the Financial Highlights. |
| ∎ | | CPA® and Certified Public Accountant® are trademarks owned by the American Institute of Certified Public Accountants. |
9 Invesco MLP Fund
Schedule of Investments
October 31, 2016
| | | | | | | | |
| | | Units | | | Value | |
Master Limited Partnerships–97.13% | |
| Gathering & Processing MLP–11.57% | |
Antero Midstream Partners L.P. | | | 4,748 | | | $ | 138,357 | |
DCP Midstream Partners, L.P. | | | 4,840 | | | | 161,414 | |
Enable Midstream Partners, L.P. | | | 3,667 | | | | 53,978 | |
EnLink Midstream Partners, L.P. | | | 6,315 | | | | 104,766 | |
EQT Midstream Partners L.P. | | | 2,555 | | | | 191,293 | |
Rice Midstream Partners L.P. | | | 8,050 | | | | 174,444 | |
Western Gas Partners L.P. | | | 4,214 | | | | 232,402 | |
| | | | | | | | 1,056,654 | |
|
| Marine–1.76% | |
GasLog Partners L.P. (Monaco) | | | 5,591 | | | | 114,615 | |
Golar LNG Partners L.P. (United Kingdom) | | | 2,239 | | | | 46,034 | |
| | | | | | | | 160,649 | |
|
| Natural Gas Pipelines & Storage–6.30% | |
Boardwalk Pipeline Partners, L.P. | | | 11,246 | | | | 193,544 | |
Cheniere Energy Partners, L.P. | | | 1,594 | | | | 42,241 | |
Columbia Pipeline Partners L.P. | | | 1,110 | | | | 17,760 | |
Spectra Energy Partners, L.P. | | | 458 | | | | 19,529 | |
Tallgrass Energy Partners L.P. | | | 2,969 | | | | 134,288 | |
TC Pipelines, L.P. | | | 3,224 | | | | 168,164 | |
| | | | | | | | 575,526 | |
|
| Pipelines & Midstream Diversified–45.79% | |
Enbridge Energy Partners, L.P. | | | 17,793 | | | | 438,598 | |
Energy Transfer Partners, L.P. | | | 24,674 | | | | 863,097 | |
Enterprise Products Partners L.P. | | | 61,955 | | | | 1,563,744 | |
ONEOK Partners, L.P. | | | 7,113 | | | | 282,671 | |
Plains All American Pipeline, L.P. | | | 19,845 | | | | 602,494 | |
Williams Partners L.P. | | | 12,021 | | | | 430,592 | |
| | | | | | | | 4,181,196 | |
|
| Refined Products Pipelines & Terminals–30.83% | |
Buckeye Partners, L.P. | | | 5,156 | | | | 332,768 | |
Genesis Energy, L.P. | | | 7,939 | | | | 277,309 | |
Holly Energy Partners, L.P. | | | 2,426 | | | | 74,114 | |
Magellan Midstream Partners, L.P. | | | 9,205 | | | | 618,852 | |
| | | | | | | | |
| | | Units | | | Value | |
| Refined Products Pipelines & Terminals–(continued) | |
Martin Midstream Partners L.P. | | | 1,413 | | | $ | 27,624 | |
MPLX L.P. | | | 13,338 | | | | 453,759 | |
NGL Energy Partners L.P. | | | 4,610 | | | | 82,058 | |
NuStar Energy L.P. | | | 4,727 | | | | 223,067 | |
PBF Logistics L.P. | | | 3,578 | | | | 69,950 | |
Phillips 66 Partners L.P. | | | 2,472 | | | | 109,262 | |
Sunoco Logistics Partners L.P. | | | 11,999 | | | | 307,654 | |
Tesoro Logistics L.P. | | | 5,006 | | | | 238,986 | |
| | | | | | | | 2,815,403 | |
|
| Refinery Logistics–0.88% | |
Shell Midstream Partners, L.P. | | | 2,940 | | | | 79,762 | |
Total Master Limited Partnerships
(Cost $8,641,057) | | | | 8,869,190 | |
| | |
| | | Shares | | | | |
Common Stocks–1.98% | |
| Gathering & Processing–0.24% | |
Targa Resources Corp. | | | 499 | | | | 21,906 | |
|
| General Partner (C-Corp)–0.99% | |
Kinder Morgan Inc. | | | 4,429 | | | | 90,484 | |
|
| Pipelines & Midstream Diversified–0.75% | |
Williams Cos., Inc. (The) | | | 2,338 | | | | 68,270 | |
Total Common Stocks
(Cost $176,787) | | | | 180,660 | |
| | |
Money Market Funds–0.24% | | | | | | | | |
Government & Agency Portfolio–Institutional Class, 0.29%(a) | | | 13,303 | | | | 13,303 | |
Treasury Portfolio–Institutional Class,
0.22%(a) | | | 8,869 | | | | 8,869 | |
Total Money Market Funds
(Cost $22,172) | | | | 22,172 | |
TOTAL INVESTMENTS–99.35%
(Cost $8,840,016) | | | | 9,072,022 | |
OTHER ASSETS LESS LIABILITIES–0.65% | | | | 59,391 | |
NET ASSETS–100.00% | | | $ | 9,131,413 | |
Notes to Schedule of Investments:
| (a) | The money market fund and the Fund are affiliated by having the same investment adviser. The rate shown is the 7-day SEC standardized yield as of October 31, 2016. |
See accompanying Notes to Financial Statements which are an integral part of the financial statements.
10 Invesco MLP Fund
Statement of Assets and Liabilities
October 31, 2016
| | | | |
Assets: | |
Investments, at value (Cost $8,817,844) | | $ | 9,049,850 | |
Investments in affiliated money market funds, at value and cost | | | 22,172 | |
Total investments, at value (Cost $8,840,016) | | | 9,072,022 | |
Receivable for: | | | | |
Investments sold | | | 89,202 | |
Fund shares sold | | | 1,669 | |
Dividends | | | 73,265 | |
Fund expenses absorbed | | | 143,278 | |
Deferred tax asset, net | | | 0 | |
Other assets | | | 38,454 | |
Total assets | | | 9,417,890 | |
|
Liabilities: | |
Payable for: | | | | |
Investments purchased | | | 93,915 | |
Accrued fees to affiliates | | | 3,986 | |
Accrued trustees’ and officers’ fees and benefits | | | 1,512 | |
Accrued other operating expenses | | | 187,064 | |
Total liabilities | | | 286,477 | |
Net assets applicable to shares outstanding | | $ | 9,131,413 | |
|
Net assets consist of: | |
Shares of beneficial interest | | $ | 11,379,252 | |
Undistributed net investment income (loss), net of taxes | | | (725,036 | ) |
Undistributed net realized gain (loss), net of taxes | | | (1,754,809 | ) |
Net unrealized appreciation, net of taxes | | | 232,006 | |
| | | $ | 9,131,413 | |
| | | | |
Net Assets: | |
Class A | | $ | 4,050,462 | |
Class C | | $ | 1,283,241 | |
Class R | | $ | 240,625 | |
Class Y | | $ | 3,544,943 | |
Class R5 | | $ | 6,071 | |
Class R6 | | $ | 6,071 | |
|
Shares outstanding, $0.01 par value per share,
with an unlimited number of shares authorized: | |
Class A | | | 668,099 | |
Class C | | | 212,001 | |
Class R | | | 39,709 | |
Class Y | | | 584,406 | |
Class R5 | | | 1,001 | |
Class R6 | | | 1,001 | |
Class A: | | | | |
Net asset value per share | | $ | 6.06 | |
Maximum offering price per share | | | | |
(Net asset value of $6.06 ¸ 94.50%) | | $ | 6.41 | |
Class C: | | | | |
Net asset value and offering price per share | | $ | 6.05 | |
Class R: | | | | |
Net asset value and offering price per share | | $ | 6.06 | |
Class Y: | | | | |
Net asset value and offering price per share | | $ | 6.07 | |
Class R5: | | | | |
Net asset value and offering price per share | | $ | 6.06 | |
Class R6: | | | | |
Net asset value and offering price per share | | $ | 6.06 | |
See accompanying Notes to Financial Statements which are an integral part of the financial statements.
11 Invesco MLP Fund
Statement of Operations
For the year ended October 31, 2016
| | | | |
Investment income: | |
Dividends (net of return of capital distributions of $457,793) | | $ | 14,079 | |
Dividends from affiliated money market funds | | | 519 | |
Total investment income | | | 14,598 | |
| |
Expenses: | | | | |
Advisory fees | | | 65,520 | |
Administrative services fees | | | 50,000 | |
Custodian fees | | | 7,681 | |
Distribution fees: | | | | |
Class A | | | 7,768 | |
Class C | | | 5,178 | |
Class R | | | 746 | |
Transfer agent fees — A, C, R and Y | | | 10,102 | |
Transfer agent fees — R5 | | | 6 | |
Transfer agent fees — R6 | | | 6 | |
Trustees’ and officers’ fees and benefits | | | 18,833 | |
Registration and filing fees | | | 69,475 | |
Reports to shareholders | | | 13,826 | |
Professional services fees | | | 44,558 | |
Taxes | | | 1,822 | |
Other | | | 12,759 | |
Total expenses, before waivers and taxes | | | 308,280 | |
Less: Fees waived and expenses reimbursed | | | (212,877 | ) |
Net expenses, before taxes | | | 95,403 | |
Net investment income (loss), before taxes | | | (80,805 | ) |
Net tax expense (benefit) | | | 0 | |
Net investment income (loss), net of taxes | | | (80,805 | ) |
| |
Realized and unrealized gain (loss) from: | | | | |
Net realized gain from (loss): | | | | |
Investment securities | | | (575,663 | ) |
Net tax expense (benefit) | | | 0 | |
Net realized gain (loss), net of taxes | | | (575,663 | ) |
Change in net unrealized appreciation of: | | | | |
Investment securities | | | 1,016,948 | |
Net tax expense (benefit) | | | 0 | |
Net change in net unrealized appreciation of investment securities, net of taxes | | | 1,016,948 | |
Net realized and unrealized gain, net of taxes | | | 441,285 | |
Net increase in net assets resulting from operations | | $ | 360,480 | |
See accompanying Notes to Financial Statements which are an integral part of the financial statements.
12 Invesco MLP Fund
Statement of Changes in Net Assets
For the years ended October 31, 2016 and 2015
| | | | | | | | |
| | | 2016 | | | 2015 | |
Operations: | | | | | |
Net investment income (loss), net of taxes | | $ | (80,805 | ) | | $ | (55,530 | ) |
Net realized gain (loss), net of taxes | | | (575,663 | ) | | | (1,150,488 | ) |
Change in net unrealized appreciation (depreciation), net of taxes | | | 1,016,948 | | | | (490,056 | ) |
Net increase (decrease) in net assets resulting from operations | | | 360,480 | | | | (1,696,074 | ) |
| | |
Return of Capital: | | | | | | | | |
Class A | | | (182,591 | ) | | | (89,680 | ) |
Class C | | | (25,040 | ) | | | (10,464 | ) |
Class R | | | (8,321 | ) | | | (890 | ) |
Class Y | | | (163,922 | ) | | | (82,612 | ) |
Class R5 | | | (358 | ) | | | (320 | ) |
Class R6 | | | (358 | ) | | | (320 | ) |
Total return of capital | | | (380,590 | ) | | | (184,286 | ) |
| | |
Share transactions–net: | | | | | | | | |
Class A | | | 1,616,085 | | | | 1,427,803 | |
Class C | | | 1,089,108 | | | | (1,256,392 | ) |
Class R | | | 176,423 | | | | 22,493 | |
Class Y | | | 1,433,308 | | | | 1,210,530 | |
Net increase in net assets resulting from share transactions | | | 4,314,924 | | | | 1,404,434 | |
Net increase (decrease) in net assets | | | 4,294,814 | | | | (475,926 | ) |
| | |
Net assets: | | | | | | | | |
Beginning of year | | | 4,836,599 | | | | 5,312,525 | |
End of year (includes undistributed net investment income (loss), net of taxes of $(725,036) and $(259,541), respectively) | | $ | 9,131,413 | | | $ | 4,836,599 | |
Notes to Financial Statements
October 31, 2016
NOTE 1—Significant Accounting Policies
Invesco MLP Fund (the “Fund”) is a series portfolio of AIM Investment Funds (Invesco Investment Funds) (the “Trust”). The Trust is organized as a Delaware statutory trust and is registered under the Investment Company Act of 1940, as amended (the “1940 Act”), as an open-end series management investment company consisting of twenty-two separate series portfolios, each authorized to issue an unlimited number of shares of beneficial interest. The assets, liabilities and operations of each portfolio are accounted for separately. Information presented in these financial statements pertains only to the Fund. Matters affecting each portfolio or class will be voted on exclusively by the shareholders of such portfolio or class.
The Fund’s investment objective is capital appreciation and secondarily income.
The Fund currently consists of six different classes of shares: Class A, Class C, Class R, Class Y, Class R5 and Class R6. Class Y shares are available only to certain investors. Class A shares are sold with a front-end sales charge unless certain waiver criteria are met and under certain circumstances load waived shares may be subject to contingent deferred sales charges (“CDSC”). Class C shares are sold with a CDSC. Class R, Class Y, Class R5 and Class R6 shares are sold at net asset value.
The following is a summary of the significant accounting policies followed by the Fund in the preparation of its financial statements.
| A. | Security Valuations — Securities, including restricted securities, are valued according to the following policy. |
A security listed or traded on an exchange (except convertible securities) is valued at its last sales price or official closing price as of the close of the customary trading session on the exchange where the security is principally traded, or lacking any sales or official closing price on a particular day, the security may be valued at the closing bid price on that day. Securities traded in the over-the-counter market are valued based on prices furnished by independent pricing services or market makers. When such securities are valued by an independent pricing service they may be considered fair valued. Futures contracts are valued at the final settlement price set by an exchange on which they are principally traded. Listed options are valued at the mean between the last bid and asked prices from the exchange on which they are principally traded. Options not listed on an exchange are valued by an independent source at the mean between the last bid and asked prices. For purposes of determining net asset value (“NAV”) per share, futures and option contracts generally are valued 15 minutes after the close of the customary trading session of the New York Stock Exchange (“NYSE”).
Investments in open-end and closed-end registered investment companies that do not trade on an exchange are valued at the end-of-day net asset value per share. Investments in open-end and closed-end registered investment companies that trade on an exchange are valued at the last sales price or official closing price as of the close of the customary trading session on the exchange where the security is principally traded.
13 Invesco MLP Fund
Debt obligations (including convertible securities) and unlisted equities are fair valued using an evaluated quote provided by an independent pricing service. Evaluated quotes provided by the pricing service may be determined without exclusive reliance on quoted prices, and may reflect appropriate factors such as institution-size trading in similar groups of securities, developments related to specific securities, dividend rate (for unlisted equities), yield (for debt obligations), quality, type of issue, coupon rate (for debt obligations), maturity (for debt obligations), individual trading characteristics and other market data. Debt obligations are subject to interest rate and credit risks. In addition, all debt obligations involve some risk of default with respect to interest and/or principal payments.
Foreign securities’ (including foreign exchange contracts) prices are converted into U.S. dollar amounts using the applicable exchange rates as of the close of the NYSE. If market quotations are available and reliable for foreign exchange-traded equity securities, the securities will be valued at the market quotations. Because trading hours for certain foreign securities end before the close of the NYSE, closing market quotations may become unreliable. If between the time trading ends on a particular security and the close of the customary trading session on the NYSE, events occur that the Adviser determines are significant and make the closing price unreliable, the Fund may fair value the security. If the event is likely to have affected the closing price of the security, the security will be valued at fair value in good faith using procedures approved by the Board of Trustees. Adjustments to closing prices to reflect fair value may also be based on a screening process of an independent pricing service to indicate the degree of certainty, based on historical data, that the closing price in the principal market where a foreign security trades is not the current value as of the close of the NYSE. Foreign securities’ prices meeting the approved degree of certainty that the price is not reflective of current value will be priced at the indication of fair value from the independent pricing service. Multiple factors may be considered by the independent pricing service in determining adjustments to reflect fair value and may include information relating to sector indices, American Depositary Receipts and domestic and foreign index futures. Foreign securities may have additional risks including exchange rate changes, potential for sharply devalued currencies and high inflation, political and economic upheaval, the relative lack of issuer information, relatively low market liquidity and the potential lack of strict financial and accounting controls and standards.
Securities for which market prices are not provided by any of the above methods may be valued based upon quotes furnished by independent sources. The last bid price may be used to value equity securities. The mean between the last bid and asked prices is used to value debt obligations, including corporate loans.
Securities for which market quotations are not readily available or became unreliable are valued at fair value as determined in good faith by or under the supervision of the Trust’s officers following procedures approved by the Board of Trustees. Issuer specific events, market trends, bid/asked quotes of brokers and information providers and other market data may be reviewed in the course of making a good faith determination of a security’s fair value.
The Fund may invest in securities that are subject to interest rate risk, meaning the risk that the prices will generally fall as interest rates rise and, conversely, the prices will generally rise as interest rates fall. Specific securities differ in their sensitivity to changes in interest rates depending on their individual characteristics. Changes in interest rates may result in increased market volatility, which may affect the value and/or liquidity of certain Fund investments.
Valuations change in response to many factors including the historical and prospective earnings of the issuer, the value of the issuer’s assets, general economic conditions, interest rates, investor perceptions and market liquidity. Because of the inherent uncertainties of valuation, the values reflected in the financial statements may materially differ from the value received upon actual sale of those investments.
| B. | Securities Transactions and Investment Income — Securities transactions are accounted for on a trade date basis. Realized gains or losses on sales are computed on the basis of specific identification of the securities sold. Interest income (net of withholding tax, if any) is recorded on the accrual basis from settlement date. Dividend income (net of withholding tax, if any) is recorded on the ex-dividend date. |
The Fund may periodically participate in litigation related to Fund investments. As such, the Fund may receive proceeds from litigation settlements. Any proceeds received are included in the Statement of Operations as realized gain (loss) for investments no longer held and as unrealized gain (loss) for investments still held.
Brokerage commissions and mark ups are considered transaction costs and are recorded as an increase to the cost basis of securities purchased and/or a reduction of proceeds on a sale of securities. Such transaction costs are included in the determination of net realized and unrealized gain (loss) from investment securities reported in the Statement of Operations and the Statement of Changes in Net Assets and the net realized and unrealized gains (losses) on securities per share in the Financial Highlights. Transaction costs are included in the calculation of the Fund’s net asset value and, accordingly, they reduce the Fund’s total returns. These transaction costs are not considered operating expenses and are not reflected in net investment income reported in the Statement of Operations and the Statement of Changes in Net Assets, or the net investment income per share and the ratios of expenses and net investment income reported in the Financial Highlights, nor are they limited by any expense limitation arrangements between the Fund and the investment adviser.
The Fund allocates income and realized and unrealized capital gains and losses to a class based on the relative net assets of each class.
| C. | Country Determination — For the purposes of making investment selection decisions and presentation in the Schedule of Investments, the investment adviser may determine the country in which an issuer is located and/or credit risk exposure based on various factors. These factors include the laws of the country under which the issuer is organized, where the issuer maintains a principal office, the country in which the issuer derives 50% or more of its total revenues and the country that has the primary market for the issuer’s securities, as well as other criteria. Among the other criteria that may be evaluated for making this determination are the country in which the issuer maintains 50% or more of its assets, the type of security, financial guarantees and enhancements, the nature of the collateral and the sponsor organization. Country of issuer and/or credit risk exposure has been determined to be the United States of America, unless otherwise noted. |
| D. | Distributions — Distributions from net investment income, if any, are declared and paid quarterly and are recorded on the ex-dividend date. Distributions from net realized capital gain, if any, are generally declared and paid annually and recorded on the ex-dividend date. |
| E. | Master Limited Partnerships — The Fund primarily invests in Master Limited Partnerships (“MLPs”). MLPs are publicly traded partnerships and limited liability companies taxed as partnerships under the Internal Revenue Code of 1986, as amended (the “Internal Revenue Code”). The Fund principally invests in MLPs that derive their revenue primarily from businesses involved in the gathering, transporting, processing, treating, storing, refining, distributing, mining or marketing of natural gas, natural gas liquids, crude oil, refined products or coal (“energy infrastructure MLPs”). The Fund is a partner in each MLP; accordingly, the Fund is required to take into account the Fund’s allocable share of income, gains, losses, deductions, expenses, and tax credits recognized by each MLP. |
14 Invesco MLP Fund
The Fund is non-diversified and will concentrate its investments in the energy sector. Energy infrastructure MLPs are subject to a variety of industry specific risk factors that may adversely affect their business or operations, including a decrease in production or reduced volumes of natural gas or other energy commodities available for transporting, processing, storing or distributing; changes in energy commodity prices; a sustained reduced demand for crude oil, natural gas and refined petroleum products; depletion of natural gas reserves or other commodities if not replaced; natural disasters, extreme weather and environmental hazards; rising interest rates, how facilities are constructed, maintained and operated, environmental and safety controls, and the prices they may charge for products and services. In addition, taxes, government regulation, international politics, price, and supply fluctuations, volatile interest rates and energy conservation may cause difficulties for energy infrastructure MLPs.
MLPs may be less liquid and subject to more abrupt or erratic price movements than conventional publicly traded securities.
| F. | Return of Capital — Distributions received from the Fund’s investments in MLPs generally are comprised of income and return of capital. The Fund records investment income and return of capital based on estimates made at the time such distributions are received. The return of capital portion of the distribution is a reduction to investment income that results in an equivalent reduction in the cost basis of the associated investments and increases net realized gains (losses) and change in unrealized appreciation (depreciation). Such estimates are based on historical information available from each MLP and other industry sources. These estimates will subsequently be revised and may materially differ primarily based on information received from the MLPs after their tax reporting periods are concluded. |
| G. | Federal Income Taxes — The Fund does not intend to qualify as a regulated investment company pursuant to Subchapter M of the Internal Revenue Code. The Fund is treated as a regular corporation, or “C” corporation, for U.S. federal income tax purposes and generally is subject to U.S. federal income tax on its taxable income at the graduated rates applicable to corporations. In addition, as a regular corporation, the Fund may be subject to state and local taxes in jurisdictions in which the MLPs operate. The estimate state tax rate is based on a periodic analysis of the Fund’s holdings. The Fund may also be subject to a federal alternative minimum tax on its alternative minimum taxable income to the extent that the alternative minimum tax exceeds the Fund’s regular federal income tax liability. |
Taxes include current and deferred taxes. Current taxes reflect the estimated tax liability of the Fund as of a measurement date based on taxable income. Deferred taxes reflect estimates of (i) taxes on net unrealized gains (losses), which are attributable to the difference between fair market value and tax basis, (ii) the net tax effects of temporary differences between the carrying amounts of assets and liabilities for financial reporting purposes and the amounts used for tax purposes, and (iii) the net tax benefit of accumulated net operating losses, capital loss carryforwards and other tax attributes.
The Fund’s deferred tax asset (“DTA”) and/or liability balances are estimated using estimates of effective tax rates expected to apply to taxable income in the years such balances are realized. A DTA will be recognized for temporary book/tax differences, net of unrealized losses, and carryforwards (net operating losses, capital loss carryforward, or tax credits). To the extent the Fund has a DTA, the Fund will assess whether a valuation allowance is required to offset the value of a portion, or all, of the DTA. Prior year ordinary income or capital gains (carrybacks), unrealized net gains, future reversals of existing taxable timing differences, forecast of future profitability (based on historical evidence), potential tax planning strategies, unsettled circumstances, and other evidence will be used in determining the valuation allowance. The valuation allowance is reviewed periodically and the Fund may modify its estimates or assumptions regarding the net deferred tax asset or liability balances and any applicable valuation allowance.
The Fund recognizes interest and penalties associated with underpayment of federal and state income taxes, if any, in tax expense. The Fund recognizes the tax benefits of uncertain tax positions only when the position is more likely than not to be sustained. Management has analyzed the Fund’s uncertain tax positions and concluded that no liability for unrecognized tax benefits should be recorded related to uncertain tax positions. Management is not aware of any tax positions for which it is reasonably possible that the total amounts of unrecognized tax benefits will change materially in the next 12 months.
The Fund files tax returns in the U.S. Federal jurisdiction and certain other jurisdictions. Generally, the Fund is subject to examinations by such taxing authorities for up to three years after the filing of the return for the tax period.
| H. | Expenses — Fees provided for under the Rule 12b-1 plan of a particular class of the Fund are charged to the operations of such class. Transfer agency fees and expenses and other shareholder recordkeeping fees and expenses attributable to Class R5 and Class R6 are allocated to each share class based on relative net assets. Sub-accounting fees attributable to Class R5 are charged to the operations of the class. Transfer agency fees and expenses and other shareholder recordkeeping fees and expenses relating to all other classes are allocated among those classes based on relative net assets. All other expenses are allocated among the classes based on relative net assets. |
| I. | Accounting Estimates — The preparation of financial statements in conformity with accounting principles generally accepted in the United States of America (“GAAP”) requires management to make estimates and assumptions that affect the reported amounts of assets and liabilities at the date of the financial statements and the reported amounts of revenues and expenses during the reporting period including estimates and assumptions related to taxation. Actual results could differ from those estimates by a significant amount. In addition, the Fund monitors for material events or transactions that may occur or become known after the period-end date and before the date the financial statements are released to print. |
| J. | Indemnifications — Under the Trust’s organizational documents, each Trustee, officer, employee or other agent of the Trust is indemnified against certain liabilities that may arise out of the performance of their duties to the Fund. Additionally, in the normal course of business, the Fund enters into contracts, including the Fund’s servicing agreements, that contain a variety of indemnification clauses. The Fund’s maximum exposure under these arrangements is unknown as this would involve future claims that may be made against the Fund that have not yet occurred. The risk of material loss as a result of such indemnification claims is considered remote. |
15 Invesco MLP Fund
NOTE 2—Advisory Fees and Other Fees Paid to Affiliates
The Trust has entered into a master investment advisory agreement with Invesco Advisers, Inc. (the “Adviser” or “Invesco”). Under the terms of the investment advisory agreement, the Fund pays an advisory fee to the Adviser based on the annual rate of the Fund’s average daily net assets as follows:
| | | | |
| Average Daily Net Assets | | Rate | |
First $1.0 billion | | | 1.00% | |
Next $1.5 billion | | | 0.95% | |
Next $2.0 billion | | | 0.93% | |
Next $3.5 billion | | | 0.91% | |
Over $8 billion | | | 0.90% | |
For the year ended October 31, 2016, the effective advisory fees incurred by the Fund was 1.00%.
Under the terms of a master sub-advisory agreement between the Adviser and each of Invesco Asset Management Deutschland GmbH, Invesco Asset Management Limited, Invesco Asset Management (Japan) Limited, Invesco Hong Kong Limited, Invesco Senior Secured Management, Inc., Invesco Canada Ltd. and Invesco PowerShares Capital Management LLC (collectively, the “Affiliated Sub-Advisers”) the Adviser, not the Fund, will pay 40% of the fees paid to the Adviser to any such Affiliated Sub-Adviser(s) that provide(s) discretionary investment management services to the Fund based on the percentage of assets allocated to such Affiliated Sub-Adviser(s).
The Adviser has contractually agreed, through at least February 28, 2017, to waive advisory fees and/or reimburse expenses of all shares to the extent necessary to limit total annual fund operating expenses after fee waiver and/or expense reimbursement (excluding certain items discussed below) of Class A, Class C, Class R, Class Y, Class R5 and Class R6 shares to 1.50%, 2.25%, 1.75%, 1.25%, 1.25% and 1.25%, respectively, of the Fund’s average daily net assets (the “expense limits”). In determining the Adviser’s obligation to waive advisory fees and/or reimburse expenses, the following expenses are not taken into account, and could cause the total annual fund operating expenses after fee waiver and/or expense reimbursement to exceed the numbers reflected above: (1) interest; (2) taxes; (3) dividend expense on short sales; (4) extraordinary or non-routine items, including litigation expenses; and (5) expenses that the Fund has incurred but did not actually pay because of an expense offset arrangement. Unless Invesco continues the fee waiver agreement, it will terminate on February 28, 2017. During its term, the fee waiver agreement cannot be terminated or amended to increase the expense limits without approval of the Board of Trustees.
Further, the Adviser has contractually agreed, through at least June 30, 2018, to waive the advisory fee payable by the Fund in an amount equal to 100% of the net advisory fees the Adviser receives from the affiliated money market funds on investments by the Fund of uninvested cash in such affiliated money market funds.
For the year ended October 31, 2016, the Adviser waived advisory fees and reimbursed fund level expenses of $202,763 and reimbursed class level expenses of $4,799, $800, $230, $4,273, $6 and $6 of Class A, Class C, Class R, Class Y, Class R5 and Class R6 shares, respectively.
The Trust has entered into a master administrative services agreement with Invesco pursuant to which the Fund has agreed to pay Invesco for certain administrative costs incurred in providing accounting services to the Fund. For the year ended October 31, 2016, expenses incurred under the agreement are shown in the Statement of Operations as Administrative services fees.
The Trust has entered into a transfer agency and service agreement with Invesco Investment Services, Inc. (“IIS”) pursuant to which the Fund has agreed to pay IIS a fee for providing transfer agency and shareholder services to the Fund and reimburse IIS for certain expenses incurred by IIS in the course of providing such services. IIS may make payments to intermediaries that provide omnibus account services, sub-accounting services and/or networking services. All fees payable by IIS to intermediaries that provide omnibus account services or sub-accounting are charged back to the Fund, subject to certain limitations approved by the Trust’s Board of Trustees. For the year ended October 31, 2016, expenses incurred under the agreement are shown in the Statement of Operations as Transfer agent fees.
The Trust has entered into master distribution agreements with Invesco Distributors, Inc. (“IDI”) to serve as the distributor for the Class A, Class C, Class R, Class Y, Class R5 and Class R6 shares of the Fund. The Trust has adopted plans pursuant to Rule 12b-1 under the 1940 Act with respect to the Fund’s Class A, Class C and Class R shares (collectively the “Plans”). The Fund, pursuant to the Plans, pays IDI compensation at the annual rate of 0.25% of the Fund’s average daily net assets of Class A shares, 1.00% of the average daily net assets of Class C shares and 0.50% of the average daily net assets of Class R shares. Of the Plan payments, up to 0.25% of the average daily net assets of each class of shares may be paid to furnish continuing personal shareholder services to customers who purchase and own shares of such classes. Any amounts not paid as a service fee under the Plans would constitute an asset-based sales charge. Rules of the Financial Industry Regulatory Authority (“FINRA”) impose a cap on the total sales charges, including asset-based sales charges, that may be paid by any class of shares of the Fund. For the year ended October 31, 2016, expenses incurred under the Plans are shown in the Statement of Operations as Distribution fees.
Front-end sales commissions and CDSC (collectively, the “sales charges”) are not recorded as expenses of the Fund. Front-end sales commissions are deducted from proceeds from the sales of Fund shares prior to investment in Class A shares of the Fund. CDSC are deducted from redemption proceeds prior to remittance to the shareholder. During the year ended October 31, 2016, IDI advised the Fund that IDI retained $5,514 in front-end sales commissions from the sale of Class A shares.
Certain officers and trustees of the Trust are officers and directors of the Adviser, IIS and/or IDI.
16 Invesco MLP Fund
NOTE 3—Additional Valuation Information
GAAP defines fair value as the price that would be received to sell an asset or paid to transfer a liability in an orderly transaction between market participants at the measurement date, under current market conditions. GAAP establishes a hierarchy that prioritizes the inputs to valuation methods, giving the highest priority to readily available unadjusted quoted prices in an active market for identical assets (Level 1) and the lowest priority to significant unobservable inputs (Level 3), generally when market prices are not readily available or are unreliable. Based on the valuation inputs, the securities or other investments are tiered into one of three levels. Changes in valuation methods may result in transfers in or out of an investment’s assigned level:
| | Level 1 — | Prices are determined using quoted prices in an active market for identical assets. |
| | Level 2 — | Prices are determined using other significant observable inputs. Observable inputs are inputs that other market participants may use in pricing a security. These may include quoted prices for similar securities, interest rates, prepayment speeds, credit risk, yield curves, loss severities, default rates, discount rates, volatilities and others. |
| | Level 3 — | Prices are determined using significant unobservable inputs. In situations where quoted prices or observable inputs are unavailable (for example, when there is little or no market activity for an investment at the end of the period), unobservable inputs may be used. Unobservable inputs reflect the Fund’s own assumptions about the factors market participants would use in determining fair value of the securities or instruments and would be based on the best available information. |
As of October 31, 2016, all of the securities in this Fund were valued based on Level 1 inputs (see the Schedule of Investments for security categories). The level assigned to the securities valuations may not be an indication of the risk or liquidity associated with investing in those securities. Because of the inherent uncertainties of valuation, the values reflected in the financial statements may materially differ from the value received upon actual sale of those investments.
NOTE 4—Trustees’ and Officers’ Fees and Benefits
Trustees’ and Officers’ Fees and Benefits include amounts accrued by the Fund to pay remuneration to certain Trustees and Officers of the Fund.
NOTE 5—Cash Balances
The Fund is permitted to temporarily carry a negative or overdrawn balance in its account with State Street Bank and Trust Company, the custodian bank. Such balances, if any at period-end, are shown in the Statement of Assets and Liabilities under the payable caption Amount due custodian. To compensate the custodian bank for such overdrafts, the overdrawn Fund may either (1) leave funds as a compensating balance in the account so the custodian bank can be compensated by earning the additional interest; or (2) compensate by paying the custodian bank at a rate agreed upon by the custodian bank and Invesco, not to exceed the contractually agreed upon rate.
NOTE 6—Distributions to Shareholders and Tax Components of Net Assets
Total taxes have been computed by applying the federal statutory tax rate of 34% plus a blended state and other tax rate of 2.73%. The Fund applied this rate to net investment income (loss) and realized and unrealized gains (losses) on investments before taxes in computing its total tax expense (benefit).
The provision for taxes differs from the amount derived from applying the statutory tax rate to net investment income (loss) and realized and unrealized gains (losses) before taxes at period-end as follows:
| | | | | | | | |
Provision at statutory rates | | $ | 122,564 | | | | 34.00 | % |
State and other taxes, net of federal tax benefit | | | 8,926 | | | | 2.48 | |
Permanent differences, current period | | | (1,394 | ) | | | (0.39 | ) |
Valuation allowance | | | (130,096 | ) | | | (36.09 | ) |
Total | | $ | 0 | | | | 0.00 | % |
Components of the Fund’s Net Deferred Tax Asset at Period-End:
| | | | |
Deferred Tax Assets: | | | | |
Net operating loss carryforward | | $ | 149,839 | |
Capital loss carryforward | | | 373,190 | |
Unrealized gains/losses on investment securities | | | 76,749 | |
Total Deferred Tax Assets | | | 599,778 | |
Valuation allowance | | | (599,778 | ) |
Deferred Tax Asset, Net | | $ | 0 | |
The Fund has a capital loss carryforward as of October 31, 2016, of $1,049,767. Capital losses may be carried forward for 5 years and accordingly, would begin to expire as of October 31, 2019.
The Fund has a federal net operating loss carryforward as of October 31, 2016, of $418,810, which begin to expire in 2034. As of October 31, 2016, the Fund has state net operating loss carryforward of approximately $413,628. If not utilized, these state net operating losses will expire in various years through October 31, 2036.
At October 31, 2016, based on the net unrealized losses on the Fund’s investment securities, the Fund has recorded a valuation allowance to offset the DTA as the Fund has determined at October 31, 2016 based on historical evidence it is unlikely the DTA will be realized.
17 Invesco MLP Fund
Tax Character of Distributions to Shareholders Paid During the Fiscal Years Ended October 31, 2016 and 2015:
| | | | | | | | |
| | | 2016 | | | 2015 | |
Return of capital | | $ | 380,590 | | | $ | 184,286 | |
NOTE 7—Investment Securities
The aggregate amount of investment securities (other than short-term securities, U.S. Treasury obligations and money market funds, if any) purchased and sold by the Fund during the year ended October 31, 2016 was $8,106,029 and $3,711,442, respectively. Cost of investments on a tax basis includes the adjustments for financial reporting purposes as of the most recently completed federal income tax reporting period-end.
| | | | |
| Unrealized Appreciation (Depreciation) of Investment Securities on a Tax Basis | |
Aggregate unrealized appreciation of investment securities | | $ | 356,596 | |
Aggregate unrealized (depreciation) of investment securities | | | (576,387 | ) |
Net unrealized appreciation (depreciation) of investment securities | | $ | (219,791 | ) |
Cost of investments for tax purposes is $9,291,813.
NOTE 8—Reclassification of Permanent Differences
Primarily as a result of differing book/tax treatment of dividends received deduction, on October 31, 2016, undistributed net investment income (loss) was decreased by $4,100 and shares of beneficial interest was increased by $4,100. This reclassification had no effect on the net assets of the Fund.
NOTE 9—Share Information
| | | | | | | | | | | | | | | | |
| | | Summary of Share Activity | |
| | | Years ended October 31, | |
| | | 2016(a) | | | 2015 | |
| | | Shares | | | Amount | | | Shares | | | Amount | |
Sold: | | | | | | | | | | | | | | | | |
Class A | | | 320,430 | | | $ | 1,847,014 | | | | 245,529 | | | $ | 1,973,144 | |
Class C | | | 182,453 | | | | 1,102,203 | | | | 39,161 | | | | 326,314 | |
Class R | | | 33,865 | | | | 174,013 | | | | 3,039 | | | | 21,882 | |
Class Y | | | 292,748 | | | | 1,626,732 | | | | 152,367 | | | | 1,224,893 | |
| | | | |
Issued as reinvestment of dividends: | | | | | | | | | | | | | | | | |
Class A | | | 20,756 | | | | 117,814 | | | | 5,681 | | | | 42,918 | |
Class C | | | 3,359 | | | | 19,487 | | | | 1,176 | | | | 9,203 | |
Class R | | | 1,379 | | | | 7,992 | | | | 81 | | | | 611 | |
Class Y | | | 11,016 | | | | 63,540 | | | | 2,700 | | | | 20,473 | |
| | | | |
Reacquired: | | | | | | | | | | | | | | | | |
Class A | | | (58,763 | ) | | | (348,743 | ) | | | (72,038 | ) | | | (588,259 | ) |
Class C | | | (5,647 | ) | | | (32,582 | ) | | | (192,021 | ) | | | (1,591,909 | ) |
Class R | | | (944 | ) | | | (5,582 | ) | | | — | | | | — | |
Class Y | | | (43,714 | ) | | | (256,964 | ) | | | (4,668 | ) | | | (34,836 | ) |
Net increase in share activity | | | 756,938 | | | $ | 4,314,924 | | | | 181,007 | | | $ | 1,404,434 | |
| (a) | There are entities that are record owners of more than 5% of the outstanding shares of the Fund and in the aggregate own 27% of the outstanding shares of the Fund. IDI has an agreement with these entities to sell Fund shares. The Fund, Invesco and/or Invesco affiliates may make payments to these entities, which are considered to be related to the Fund, for providing services to the Fund, Invesco and/or Invesco affiliates including but not limited to services such as securities brokerage, distribution, third party record keeping and account servicing. The Trust has no knowledge as to whether all or any portion of the shares owned of record by these entities are also owned beneficially. |
| | In addition, 31% of the outstanding shares of the Fund are owned by the Adviser or an affiliated of the Adviser. |
18 Invesco MLP Fund
NOTE 10—Financial Highlights
The following schedule presents financial highlights for a share of the Fund outstanding throughout the periods indicated.
| | | | | | | | | | | | |
| | | Class A | |
| | Years ended October 31, | |
| | | 2016 | | | 2015 | | | 2014(a) | |
Net asset value, beginning of period | | $ | 6.45 | | | $ | 9.35 | | | $ | 10.00 | |
Net investment income (loss)(b) | | | (0.07 | ) | | | (0.09 | ) | | | (0.01 | ) |
Net gains (losses) on securities (both realized and unrealized) | | | 0.02 | | | | (2.51 | ) | | | (0.64 | ) |
Total from investment operations | | | (0.05 | ) | | | (2.60 | ) | | | (0.65 | ) |
Less: | | | | | | | | | | | | |
Return of capital | | | (0.34 | ) | | | (0.30 | ) | | | — | |
Net asset value, end of period | | $ | 6.06 | | | $ | 6.45 | | | $ | 9.35 | |
Total return(c) | | | (0.14 | )% | | | (28.30 | )% | | | (6.50 | )% |
Net assets, end of period (000’s omitted) | | $ | 4,050 | | | $ | 2,489 | | | $ | 1,931 | |
Portfolio turnover rate(d) | | | 57 | % | | | 107 | % | | | 5 | % |
| | |
Ratios/supplemental data based on average net assets: | | | | | | | | | |
Ratio of expenses: | | | | | | | | | | | | |
With fee waivers and/or expense reimbursements, before taxes | | | 1.50 | %(e) | | | 1.50 | % | | | 1.49 | %(f) |
Tax expense (benefit)(g) | | | 0 | %(e) | | | 0 | % | | | 0 | %(f) |
With fee waivers and/or expense reimbursements, after taxes(g) | | | 1.50 | %(e) | | | 1.50 | % | | | 1.49 | %(f) |
Without fee waivers and/or expense reimbursements, after taxes(g) | | | 4.75 | %(e) | | | 6.37 | % | | | 72.56 | %(f) |
Ratio of net investment income (loss), before taxes | | | (1.28 | )%(e) | | | (1.16 | )% | | | (0.54 | )%(f) |
Ratio of net investment income (loss), after taxes(h) | | | (1.28 | )%(e) | | | (1.16 | )% | | | (0.54 | )%(f) |
| (a) | Commencement date of August 29, 2014. |
| (b) | Calculated using average shares outstanding. |
| (c) | Includes adjustments in accordance with accounting principles generally accepted in the United States of America and as such, the net asset value for financial reporting purposes and the returns based upon those net asset values may differ from the net asset value and returns for shareholder transactions. Does not include sales charges and is not annualized for periods less than one year, if applicable. |
| (d) | Portfolio turnover is calculated at the fund level and is not annualized for periods less than one year, if applicable. |
| (e) | Ratios are based on average daily net assets (000’s omitted) of $3,107. |
| (g) | Ratio includes tax expense derived from net investment income (loss) and realized and unrealized gains (losses). |
| (h) | Ratio includes tax expense derived from net investment income (loss) only. |
19 Invesco MLP Fund
NOTE 10—Financial Highlights—(continued)
| | | | | | | | | | | | |
| | | Class C | |
| | Years ended October 31, | |
| | | 2016 | | | 2015 | | | 2014(a) | |
Net asset value, beginning of period | | $ | 6.45 | | | $ | 9.34 | | | $ | 10.00 | |
Net investment income (loss)(b) | | | (0.12 | ) | | | (0.16 | ) | | | (0.02 | ) |
Net gains (losses) on securities (both realized and unrealized) | | | 0.02 | | | | (2.49 | ) | | | (0.64 | ) |
Total from investment operations | | | (0.10 | ) | | | (2.65 | ) | | | (0.66 | ) |
Less: | | | | | | | | | | | | |
Return of capital | | | (0.30 | ) | | | (0.24 | ) | | | — | |
Net asset value, end of period | | $ | 6.05 | | | $ | 6.45 | | | $ | 9.34 | |
Total return(c) | | | (1.08 | )% | | | (28.78 | )% | | | (6.60 | )% |
Net assets, end of period (000’s omitted) | | $ | 1,283 | | | $ | 205 | | | $ | 1,713 | |
Portfolio turnover rate(d) | | | 57 | % | | | 107 | % | | | 5 | % |
| | |
Ratios/supplemental data based on average net assets: | | | | | | | | | |
Ratio of expenses: | | | | | | | | | | | | |
With fee waivers and/or expense reimbursements, before taxes | | | 2.25 | %(e) | | | 2.25 | % | | | 2.24 | %(f) |
Tax expense (benefit)(g) | | | 0 | %(e) | | | 0 | % | | | 0 | %(f) |
With fee waivers and/or expense reimbursements, after taxes(g) | | | 2.25 | %(e) | | | 2.25 | % | | | 2.24 | %(f) |
Without fee waivers and/or expense reimbursements, after taxes(g) | | | 5.50 | %(e) | | | 7.12 | % | | | 73.31 | %(f) |
Ratio of net investment income (loss), before taxes | | | (2.03 | )%(e) | | | (1.91 | )% | | | (1.29 | )%(f) |
Ratio of net investment income (loss), after taxes(h) | | | (2.03 | )%(e) | | | (1.91 | )% | | | (1.29 | )%(f) |
| (a) | Commencement date of August 29, 2014. |
| (b) | Calculated using average shares outstanding. |
| (c) | Includes adjustments in accordance with accounting principles generally accepted in the United States of America and as such, the net asset value for financial reporting purposes and the returns based upon those net asset values may differ from the net asset value and returns for shareholder transactions. Does not include sales charges and is not annualized for periods less than one year, if applicable. |
| (d) | Portfolio turnover is calculated at the fund level and is not annualized for periods less than one year, if applicable. |
| (e) | Ratios are based on average daily net assets (000’s omitted) of $518. |
| (g) | Ratio includes tax expense derived from net investment income (loss) and realized and unrealized gains (losses). |
| (h) | Ratio includes tax expense derived from net investment income (loss) only. |
20 Invesco MLP Fund
NOTE 10—Financial Highlights—(continued)
| | | | | | | | | | | | |
| | | Class R | |
| | Years ended October 31, | |
| | | 2016 | | | 2015 | | | 2014(a) | |
Net asset value, beginning of period | | $ | 6.45 | | | $ | 9.35 | | | $ | 10.00 | |
Net investment income (loss)(b) | | | (0.09 | ) | | | (0.11 | ) | | | (0.01 | ) |
Net gains (losses) on securities (both realized and unrealized) | | | 0.03 | | | | (2.51 | ) | | | (0.64 | ) |
Total from investment operations | | | (0.06 | ) | | | (2.62 | ) | | | (0.65 | ) |
Less: | | | | | | | | | | | | |
Return of capital | | | (0.33 | ) | | | (0.28 | ) | | | — | |
Net asset value, end of period | | $ | 6.06 | | | $ | 6.45 | | | $ | 9.35 | |
Total return(c) | | | (0.39 | )% | | | (28.48 | )% | | | (6.50 | )% |
Net assets, end of period (000’s omitted) | | $ | 241 | | | $ | 35 | | | $ | 21 | |
Portfolio turnover rate(d) | | | 57 | % | | | 107 | % | | | 5 | % |
| | |
Ratios/supplemental data based on average net assets: | | | | | | | | | |
Ratio of expenses: | | | | | | | | | | | | |
With fee waivers and/or expense reimbursements, before taxes | | | 1.75 | %(e) | | | 1.75 | % | | | 1.74 | %(f) |
Tax expense (benefit)(g) | | | 0 | %(e) | | | 0 | % | | | 0 | %(f) |
With fee waivers and/or expense reimbursements, after taxes(g) | | | 1.75 | %(e) | | | 1.75 | % | | | 1.74 | %(f) |
Without fee waivers and/or expense reimbursements, after taxes(g) | | | 5.00 | %(e) | | | 6.62 | % | | | 72.80 | %(f) |
Ratio of net investment income (loss), before taxes | | | (1.53 | )%(e) | | | (1.41 | )% | | | (0.79 | )%(f) |
Ratio of net investment income (loss), after taxes(h) | | | (1.53 | )%(e) | | | (1.41 | )% | | | (0.79 | )%(f) |
| (a) | Commencement date of August 29, 2014. |
| (b) | Calculated using average shares outstanding. |
| (c) | Includes adjustments in accordance with accounting principles generally accepted in the United States of America and as such, the net asset value for financial reporting purposes and the returns based upon those net asset values may differ from the net asset value and returns for shareholder transactions. Does not include sales charges and is not annualized for periods less than one year, if applicable. |
| (d) | Portfolio turnover is calculated at the fund level and is not annualized for periods less than one year, if applicable. |
| (e) | Ratios are based on average daily net assets (000’s omitted) of $149. |
| (g) | Ratio includes tax expense derived from net investment income (loss) and realized and unrealized gains (losses). |
| (h) | Ratio includes tax expense derived from net investment income (loss) only. |
21 Invesco MLP Fund
NOTE 10—Financial Highlights—(continued)
| | | | | | | | | | | | |
| | | Class Y | |
| | Years ended October 31, | |
| | | 2016 | | | 2015 | | | 2014(a) | |
Net asset value, beginning of period | | $ | 6.46 | | | $ | 9.36 | | | $ | 10.00 | |
Net investment income (loss)(b) | | | (0.06 | ) | | | (0.07 | ) | | | (0.01 | ) |
Net gains (losses) on securities (both realized and unrealized) | | | 0.03 | | | | (2.51 | ) | | | (0.63 | ) |
Total from investment operations | | | (0.03 | ) | | | (2.58 | ) | | | (0.64 | ) |
Less: | | | | | | | | | | | | |
Return of capital | | | (0.36 | ) | | | (0.32 | ) | | | — | |
Net asset value, end of period | | $ | 6.07 | | | $ | 6.46 | | | $ | 9.36 | |
Total return(c) | | | 0.14 | % | | | (28.07 | )% | | | (6.40 | )% |
Net assets, end of period (000’s omitted) | | $ | 3,545 | | | $ | 2,094 | | | $ | 1,628 | |
Portfolio turnover rate(d) | | | 57 | % | | | 107 | % | | | 5 | % |
| | |
Ratios/supplemental data based on average net assets: | | | | | | | | | |
Ratio of expenses: | | | | | | | | | | | | |
With fee waivers and/or expense reimbursements, before taxes | | | 1.25 | %(e) | | | 1.25 | % | | | 1.24 | %(f) |
Tax expense (benefit)(g) | | | 0 | %(e) | | | 0 | % | | | 0 | %(f) |
With fee waivers and/or expense reimbursements, after taxes(g) | | | 1.25 | %(e) | | | 1.25 | % | | | 1.24 | %(f) |
Without fee waivers and/or expense reimbursements, after taxes(g) | | | 4.50 | %(e) | | | 6.12 | % | | | 72.31 | %(f) |
Ratio of net investment income (loss), before taxes | | | (1.03 | )%(e) | | | (0.91 | )% | | | (0.29 | )%(f) |
Ratio of net investment income (loss) to average net assets(h) | | | (1.03 | )%(e) | | | (0.91 | )% | | | (0.29 | )%(f) |
| (a) | Commencement date of August 29, 2014. |
| (b) | Calculated using average shares outstanding. |
| (c) | Includes adjustments in accordance with accounting principles generally accepted in the United States of America and as such, the net asset value for financial reporting purposes and the returns based upon those net asset values may differ from the net asset value and returns for shareholder transactions. Does not include sales charges and is not annualized for periods less than one year, if applicable. |
| (d) | Portfolio turnover is calculated at the fund level and is not annualized for periods less than one year, if applicable. |
| (e) | Ratios are based on average daily net assets (000’s omitted) of $2,766. |
| (g) | Ratio includes tax expense derived from net investment income (loss) and realized and unrealized gains (losses). |
| (h) | Ratio includes tax expense derived from net investment income (loss) only. |
22 Invesco MLP Fund
NOTE 10—Financial Highlights—(continued)
| | | | | | | | | | | | |
| | | Class R5 | |
| | Years ended October 31, | |
| | | 2016 | | | 2015 | | | 2014(a) | |
Net asset value, beginning of period | | $ | 6.46 | | | $ | 9.36 | | | $ | 10.00 | |
Net investment income (loss)(b) | | | (0.06 | ) | | | (0.07 | ) | | | (0.01 | ) |
Net gains (losses) on securities (both realized and unrealized) | | | 0.02 | | | | (2.51 | ) | | | (0.63 | ) |
Total from investment operations | | | (0.04 | ) | | | (2.58 | ) | | | (0.64 | ) |
Less: | | | | | | | | | | | | |
Return of capital | | | (0.36 | ) | | | (0.32 | ) | | | — | |
Net asset value, end of period | | $ | 6.06 | | | $ | 6.46 | | | $ | 9.36 | |
Total return(c) | | | (0.03 | )% | | | (28.07 | )% | | | (6.40 | )% |
Net assets, end of period (000’s omitted) | | $ | 6 | | | $ | 6 | | | $ | 9 | |
Portfolio turnover rate(d) | | | 57 | % | | | 107 | % | | | 5 | % |
| | |
Ratios/supplemental data based on average net assets: | | | | | | | | | |
Ratio of expenses: | | | | | | | | | | | | |
With fee waivers and/or expense reimbursements, before taxes | | | 1.25 | %(e) | | | 1.25 | % | | | 1.24 | %(f) |
Tax expense (benefit)(g) | | | 0 | %(e) | | | 0 | % | | | 0 | %(f) |
With fee waivers and/or expense reimbursements, after taxes(g) | | | 1.25 | %(e) | | | 1.25 | % | | | 1.24 | %(f) |
Without fee waivers and/or expense reimbursements, after taxes(g) | | | 4.44 | %(e) | | | 6.10 | % | | | 72.28 | %(f) |
Ratio of net investment income (loss), before taxes | | | (1.03 | )%(e) | | | (0.91 | )% | | | (0.29 | )%(f) |
Ratio of net investment income (loss), after taxes(h) | | | (1.03 | )%(e) | | | (0.91 | )% | | | (0.29 | )%(f) |
| (a) | Commencement date of August 29, 2014. |
| (b) | Calculated using average shares outstanding. |
| (c) | Includes adjustments in accordance with accounting principles generally accepted in the United States of America and as such, the net asset value for financial reporting purposes and the returns based upon those net asset values may differ from the net asset value and returns for shareholder transactions. Does not include sales charges and is not annualized for periods less than one year, if applicable. |
| (d) | Portfolio turnover is calculated at the fund level and is not annualized for periods less than one year, if applicable. |
| (e) | Ratios are based on average daily net assets (000’s omitted) of $6. |
| (g) | Ratio includes tax expense derived from net investment income (loss) and realized and unrealized gains (losses). |
| (h) | Ratio includes tax expense derived from net investment income (loss) only. |
23 Invesco MLP Fund
NOTE 10—Financial Highlights—(continued)
| | | | | | | | | | | | |
| | | Class R6 | |
| | Years ended October 31, | |
| | | 2016 | | | 2015 | | | 2014(a) | |
Net asset value, beginning of period | | $ | 6.46 | | | $ | 9.36 | | | $ | 10.00 | |
Net investment income (loss)(b) | | | (0.06 | ) | | | (0.07 | ) | | | (0.01 | ) |
Net gains (losses) on securities (both realized and unrealized) | | | 0.02 | | | | (2.51 | ) | | | (0.63 | ) |
Total from investment operations | | | (0.04 | ) | | | (2.58 | ) | | | (0.64 | ) |
Less: | | | | | | | | | | | | |
Return of capital | | | (0.36 | ) | | | (0.32 | ) | | | — | |
Net asset value, end of period | | $ | 6.06 | | | $ | 6.46 | | | $ | 9.36 | |
Total return(c) | | | (0.03 | )% | | | (28.07 | )% | | | (6.40 | )% |
Net assets, end of period (000’s omitted) | | $ | 6 | | | $ | 6 | | | $ | 9 | |
Portfolio turnover rate(d) | | | 57 | % | | | 107 | % | | | 5 | % |
| | |
Ratios/supplemental data based on average net assets: | | | | | | | | | |
Ratio of expenses: | | | | | | | | | | | | |
With fee waivers and/or expense reimbursements, before taxes | | | 1.25 | %(e) | | | 1.25 | % | | | 1.24 | %(f) |
Tax expense (benefit)(g) | | | 0 | %(e) | | | 0 | % | | | 0 | %(f) |
With fee waivers and/or expense reimbursements, after taxes(g) | | | 1.25 | %(e) | | | 1.25 | % | | | 1.24 | %(f) |
Without fee waivers and/or expense reimbursements, after taxes(g) | | | 4.44 | %(e) | | | 6.10 | % | | | 72.23 | %(f) |
Ratio of net investment income (loss), before taxes | | | (1.03 | )%(e) | | | (0.91 | )% | | | (0.29 | )%(f) |
Ratio of net investment income (loss), after taxes(h) | | | (1.03 | )%(e) | | | (0.91 | )% | | | (0.29 | )%(f) |
| (a) | Commencement date of August 29, 2014. |
| (b) | Calculated using average shares outstanding. |
| (c) | Includes adjustments in accordance with accounting principles generally accepted in the United States of America and as such, the net asset value for financial reporting purposes and the returns based upon those net asset values may differ from the net asset value and returns for shareholder transactions. Does not include sales charges and is not annualized for periods less than one year, if applicable. |
| (d) | Portfolio turnover is calculated at the fund level and is not annualized for periods less than one year, if applicable. |
| (e) | Ratios are based on average daily net assets (000’s omitted) of $6. |
| (g) | Ratio includes tax expense derived from net investment income (loss) and realized and unrealized gains (losses). |
| (h) | Ratio includes tax expense derived from net investment income (loss) only. |
NOTE 11—Subsequent Event
Effective January 1, 2017, the Adviser has contractually agreed, through at least February 28, 2018, to waive advisory fees and/or reimburse expenses to the extent necessary to limit total annual fund operating expenses after fee waiver and/or expense reimbursement (excluding certain items discussed in Note 2) of Class A, Class C, Class R, Class Y, Class R5 and Class R6 shares to 1.28%, 2.03%, 1.53%, 1.03%, 1.03% and 1.03%, respectively, of the Fund’s average daily net assets.
24 Invesco MLP Fund
Report of Independent Registered Public Accounting Firm
To the Board of Trustees and Shareholders of the Invesco MLP Fund:
In our opinion, the accompanying statement of assets and liabilities, including the schedule of investments, and the related statements of operations and of changes in net assets and the financial highlights present fairly, in all material respects, the financial position of the Invesco MLP Fund (the “Fund”) as of October 31, 2016, the results of its operations for the year then ended, the changes in its net assets for each of the two years in the period then ended and the financial highlights for each of the two years in the period then ended and for the period August 29, 2014 (commencement of operations) through October 31, 2014, in conformity with accounting principles generally accepted in the United States of America. These financial statements and financial highlights (hereafter referred to as “financial statements”) are the responsibility of the Fund’s management. Our responsibility is to express an opinion on these financial statements based on our audits. We conducted our audits of these financial statements in accordance with the standards of the Public Company Accounting Oversight Board (United States). Those standards require that we plan and perform the audit to obtain reasonable assurance about whether the financial statements are free of material misstatement. An audit includes examining, on a test basis, evidence supporting the amounts and disclosures in the financial statements, assessing the accounting principles used and significant estimates made by management, and evaluating the overall financial statement presentation. We believe that our audits, which included confirmation of securities as of October 31, 2016 by correspondence with the custodian and brokers, and the application of alternative auditing procedures where confirmations of security purchases have not been received, provide a reasonable basis for our opinion.
PRICEWATERHOUSECOOPERS LLP
Houston, Texas
December 21, 2016
25 Invesco MLP Fund
Calculating your ongoing Fund expenses
Example
As a shareholder of the Fund, you incur two types of costs: (1) transaction costs, which may include sales charges (loads) on purchase payments or contingent deferred sales charges on redemptions, if any; and (2) ongoing costs, including management fees, distribution and/or service (12b-1) fees, and other Fund expenses. This example is intended to help you understand your ongoing costs (in dollars) of investing in the Fund and to compare these costs with ongoing costs of investing in other mutual funds. The example is based on an investment of $1,000 invested at the beginning of the period and held for the entire period May 1, 2016 through October 31, 2016.
Actual expenses
The table below provides information about actual account values and actual expenses. You may use the information in this table, together with the amount you invested, to estimate the expenses that you paid over the period. Simply divide your account value by $1,000 (for example, an $8,600 account value divided by $1,000 = 8.6), then multiply the result by the number in the table under the heading entitled “Actual Expenses Paid During Period” to estimate the expenses you paid on your account during this period.
Hypothetical example for comparison purposes
The table below also provides information about hypothetical account values and hypothetical expenses based on the Fund’s actual expense ratio and an assumed rate of return of 5% per year before expenses, which is not the Fund’s actual return.
The hypothetical account values and expenses may not be used to estimate the actual ending account balance or expenses you paid for the period. You may use this information to compare the ongoing costs of investing in the Fund and other funds. To do so, compare this 5% hypothetical example with the 5% hypothetical examples that appear in the shareholder reports of the other funds.
Please note that the expenses shown in the table are meant to highlight your ongoing costs only and do not reflect any transaction costs, such as sales charges (loads) on purchase payments or contingent deferred sales charges on redemptions, if any. Therefore, the hypothetical information is useful in comparing ongoing costs only, and will not help you determine the relative total costs of owning different funds. In addition, if these transaction costs were included, your costs would have been higher.
| | | | | | | | | | | | | | | | | | | | | | | | |
| Class | | Beginning
Account Value
(05/01/16) | | | ACTUAL | | | HYPOTHETICAL
(5% annual return before
expenses) | | | Annualized
Expense
Ratio2 | |
| | | Ending
Account Value
(10/31/16)1 | | | Expenses
Paid During
Period2,3 | | | Ending
Account Value
(10/31/16) | | | Expenses
Paid During
Period2,4 | | |
| A | | $ | 1,000.00 | | | $ | 1,045.60 | | | $ | 7.71 | | | $ | 1,017.60 | | | $ | 7.61 | | | | 1.50 | % |
| C | | | 1,000.00 | | | | 1,041.70 | | | | 11.54 | | | | 1,013.84 | | | | 11.38 | | | | 2.25 | |
| R | | | 1,000.00 | | | | 1,044.30 | | | | 8.98 | | | | 1,016.35 | | | | 8.86 | | | | 1.75 | |
| Y | | | 1,000.00 | | | | 1,048.70 | | | | 6.44 | | | | 1,018.85 | | | | 6.34 | | | | 1.25 | |
| R5 | | | 1,000.00 | | | | 1,047.00 | | | | 6.42 | | | | 1,018.86 | | | | 6.33 | | | | 1.25 | |
| R6 | | | 1,000.00 | | | | 1,047.00 | | | | 6.42 | | | | 1,018.86 | | | | 6.33 | | | | 1.25 | |
| 1 | The actual ending account value is based on the actual total return of the Fund for the period May 1, 2016 through October 31, 2016, after actual expenses and will differ from the hypothetical ending account value which is based on the Fund’s expense ratio and a hypothetical annual return of 5% before expenses. |
| 2 | Expenses are equal to the Fund’s annualized expense ratio as indicated above multiplied by the average account value over the period, multiplied by 184/366 to reflect the most recent fiscal half year. Effective January 1, 2017, the Fund’s adviser has contractually agreed to waive advisory fees and/or reimburse expenses to the extent necessary to limit total annual fund operating expenses of Class A, Class C, Class R, Class Y, Class R5 and Class R6 shares to 1.28%, 2.03%, 1.53%, 1.03%, 1.03%, and 1.03% of average daily net assets, respectively. The annualized ratios restated as if these agreements had been in effect throughout the entire most recent fiscal half year are 1.28%, 2.03%, 1.53%, 1.03%, 1.03% and 1.03%, for Class A, Class C, Class R, Class Y, Class R5 and Class R6 shares, respectively. |
| 3 | The actual expenses paid restated as if the changes discussed above had been in effect throughout the entire most recent fiscal half year are $6.56, $10.41, $7.85, $5.30, $5.29 and $5.29 for Class A, Class C, Class R, Class Y, Class R5 and Class R6 shares, respectively. |
| 4 | The hypothetical expenses paid restated as if the changes discussed above had been in effect throughout the entire most recent fiscal half year are $6.47, $10.27, $7.75, $5.23, $5.22 and $5.22 for Class A, Class C, Class R, Class Y, Class R5 and Class R6 shares, respectively. |
26 Invesco MLP Fund
Approval of Investment Advisory and Sub-Advisory Contracts
The Board of Trustees (the Board) of AIM Investment Funds (Invesco Investment Funds) is required under the Investment Company Act of 1940, as amended, to approve annually the renewal of Invesco MLP Fund’s (the Fund) investment advisory agreements. During contract renewal meetings held on June 7-8, 2016, the Board as a whole, and the disinterested or “independent” Trustees, who comprise over 75% of the Board, voting separately, approved the continuance for the Fund of the Master Investment Advisory Agreement with Invesco Advisers, Inc. (Invesco Advisers and the investment advisory agreement) and the Master Intergroup Sub-Advisory Contract for Mutual Funds with Invesco Asset Management Deutschland GmbH, Invesco Asset Management Limited, Invesco Asset Management (Japan) Limited, Invesco Hong Kong Limited, Invesco Senior Secured Management, Inc., Invesco Canada Ltd. and Invesco PowerShares Capital Management LLC (collectively, the Affiliated Sub-Advisers and the sub-advisory contracts) for another year, effective July 1, 2016.
In evaluating the fairness and reasonableness of compensation under the Fund’s investment advisory agreement and sub-advisory contracts, the Board considered, among other things, the factors discussed below. The Board determined that continuation of the Fund’s investment advisory agreement and the sub-advisory contracts is in the best interest of the Fund and its shareholders and that the compensation payable to Invesco Advisers and the Affiliated Sub-Advisers under the agreements is fair and reasonable.
The Board’s Fund Evaluation Process
The Board’s Investments Committee has established three Sub-Committees, which meet throughout the year to review the performance of funds advised by Invesco Advisers (the Invesco Funds). Over the course of each year, the Sub-Committees meet with portfolio managers for their assigned Invesco Funds and other members of management to review the performance, investment objective(s), policies, strategies, limitations and investment risks of these funds. The Board had the benefit of reports from the Sub-Committees and Investments Committee throughout the year in considering approval of the continuance of each Invesco Fund’s investment advisory agreement and sub-advisory contracts for another year.
During the contract renewal process, the Board receives comparative performance and fee data regarding the Invesco Funds prepared by Invesco Advisers and Broadridge Financial Solutions, Inc. (Broadridge), an independent provider of investment company data. The Board also receives an independent written evaluation from the Senior Officer, an officer of the Invesco Funds who reports directly to the
independent Trustees. The Senior Officer’s evaluation is prepared as part of his responsibility to manage the process by which the Invesco Funds’ proposed management fees are negotiated during the annual contract renewal process to ensure they are negotiated in a manner that is at arms’ length and reasonable. In addition to meetings with Invesco Advisers and fund counsel, the independent Trustees also discuss the continuance of the investment advisory agreement and sub-advisory contracts in separate sessions with the Senior Officer and with independent legal counsel.
The Trustees recognized that the advisory fee rates for the Invesco Funds are, in many cases, the result of years of review and negotiation. The Trustees’ deliberations and conclusions in a particular year may be based in part on their deliberations and conclusions regarding these arrangements throughout the year and in prior years. The Trustees’ review and conclusions are based on the comprehensive consideration of all information presented to them and are not the result of any single determinative factor. Moreover, one Trustee may have weighed a particular piece of information or factor differently than another Trustee.
The discussion below is a summary of the Senior Officer’s independent written evaluation with respect to the Fund’s investment advisory agreement as well as a discussion of the material factors and related conclusions that formed the basis for the Board’s approval of the Fund’s investment advisory agreement and sub-advisory contracts. Unless otherwise stated, this information is current as of June 8, 2016, and does not reflect consideration of factors that became known to the Board after that date.
Factors and Conclusions and Summary of Evaluation of Investment Advisory and Sub-Advisory Agreements
| A. | Nature, Extent and Quality of Services Provided by Invesco Advisers and the Affiliated Sub-Advisers |
The Board reviewed the advisory services provided to the Fund by Invesco Advisers under the Fund’s investment advisory agreement, the performance of Invesco Advisers in providing these services, and the credentials and experience of the officers and employees of Invesco Advisers who provide these services, including the Fund’s portfolio manager or managers. The Board’s review of the qualifications of Invesco Advisers to provide advisory services included the Board’s consideration of Invesco Advisers’ investment process oversight, independent credit analysis and investment risk management. The Board also considered non-advisory services that Invesco Advisers and its affiliates provide to the Invesco Funds such as various back office
support functions, trading operations, internal audit, valuation and legal and compliance.
In determining whether to continue the Fund’s investment advisory agreement, the Board considered the benefits of reapproving an existing relationship and the greater uncertainty that may be associated with entering into a new relationship. The Board concluded that the nature, extent and quality of the services provided to the Fund by Invesco Advisers are appropriate and satisfactory and consistent with the terms of the Fund’s investment advisory agreement.
The Board reviewed the services that may be provided by the Affiliated Sub-Advisers under the sub-advisory contracts and the credentials and experience of the officers and employees of the Affiliated Sub-Advisers who provide these services. The Board noted that the Affiliated Sub-Advisers have offices and personnel that are located in financial centers around the world. As a result, the Board noted that Affiliated Sub-Advisers can provide research and investment analysis on the markets and economies of various countries in which the Fund may invest, make recommendations regarding securities and assist with security trades. The Board concluded that the sub-advisory contracts may benefit the Fund and its shareholders by permitting Invesco Advisers to use the resources and talents of the Affiliated Sub-Advisers in managing the Fund. The Board concluded that the nature, extent and quality of the services that may be provided by the Affiliated Sub-Advisers are appropriate and satisfactory and consistent with the terms of the Fund’s sub-advisory contracts.
The Board considered Fund performance as a relevant factor in considering whether to approve the investment advisory agreement. The Board did not view Fund performance as a relevant factor in considering whether to approve the sub-advisory contracts for the Fund, as no Affiliated Sub-Adviser currently manages assets of the Fund.
The Board compared the Fund’s performance during the past one calendar year to the performance of funds in the Broadridge performance universe and against Lipper Energy MLP Funds Index. The Board noted that performance of Class A shares of the Fund was in the second quintile of its performance universe for the one year period (the first quintile being the best performing funds and the fifth quintile being the worst performing funds). The Board noted that performance of Class A shares of the Fund was below the performance of the Index for the one year period. The Trustees also reviewed more recent Fund performance and this review did not change their conclusions.
27 Invesco MLP Fund
| C. | Advisory and Sub-Advisory Fees |
The Board compared the Fund’s contractual management fee rate to the contractual management fee rates of funds in the Fund’s Broadridge expense group at a common asset level. The Board noted that the contractual management fee rate for Class A shares of the Fund was below the median contractual management fee rate of funds in its expense group. The Board noted that the term “contractual management fee” for funds in the expense group may include both advisory and certain administrative services fees, but that Broadridge does not provide information on a fund by fund basis as to what is included. The Board noted that Invesco does not separately charge the Invesco Funds for the administrative services included in the term as defined by Broadridge. The Board also reviewed the methodology used by Broadridge in providing expense group information, which includes using each fund’s contractual fee schedule (including any applicable breakpoints) as reported in the most recent prospectus or statement of information for each fund in the expense group.
The Board noted that Invesco Advisers has contractually agreed to waive fees and/or limit expenses of the Fund through at least February 28, 2017 in an amount necessary to limit total annual operating expenses to a specified percentage of average daily net assets for each class of the Fund.
The Board noted that Invesco Advisers and the Affiliated Sub-Advisers do not manage other mutual funds or client accounts with investment strategies comparable to those of the Fund.
The Board also considered the services that may be provided by the Affiliated Sub-Advisers pursuant to the sub-advisory contracts, as well as the fees payable by Invesco Advisers to the Affiliated Sub-Advisers pursuant to the sub-advisory contracts. The Board also noted that the sub-advisory fees are not paid directly by the Fund, but rather, are payable by Invesco Advisers to the Affiliated Sub-Advisers.
| D. | Economies of Scale and Breakpoints |
The Board considered the extent to which there are economies of scale in the provision of advisory services to the Fund. The Board also considered whether the Fund benefits from economies of scale through contractual breakpoints in the Fund’s advisory fee schedule. The Board also noted that the Fund shares directly in economies of scale through lower fees charged by third party service providers based on the combined size of the Invesco Funds and other clients advised by Invesco Advisers.
| E. | Profitability and Financial Resources |
The Board reviewed information from Invesco Advisers concerning the costs of the advisory and other services that Invesco Advisers and its affiliates provide to the Fund and the Invesco Funds and the profitability of Invesco Advisers and its affiliates in providing these services. The Board received information from Invesco Advisers and a report from an independent
consultant engaged by the Senior Officer about the methodology used to prepare the profitability information. The Board noted that Invesco Advisers continues to operate at a net profit from services Invesco Advisers and its affiliates provide to the Invesco Funds. The Board noted that Invesco Advisers and its subsidiaries did not make a profit from managing the Fund. The Board received and accepted information from Invesco Advisers demonstrating that Invesco Advisers and each Affiliated Sub-Adviser are financially sound and have the resources necessary to perform their obligations under the investment advisory agreement and sub-advisory contracts.
| F. | Collateral Benefits to Invesco Advisers and its Affiliates |
The Board considered various other benefits received by Invesco Advisers and its affiliates from the relationship with the Fund, including the fees received for providing transfer agency and distribution services to the Fund. The Board considered comparative information regarding fees charged for these services, including information provided by Broadridge and other independent sources. The Board considered the performance of Invesco Advisers and its affiliates in providing these services and the organizational structure employed to provide these services. The Board also considered that these services are provided to the Fund pursuant to written contracts that are reviewed and approved on an annual basis by the Board; and that the services are required for the operation of the Fund.
The Board considered the benefits realized by Invesco Advisers and the Affiliated Sub-Advisers as a result of portfolio brokerage transactions executed through “soft dollar” arrangements. The Board noted that soft dollar arrangements shift the payment obligation for research services from Invesco Advisers and the Affiliated Sub-Advisers to the Invesco Funds and that the research received may be used with other clients of Invesco Advisers and may reduce Invesco Advisers’ and the Affiliated Sub-Advisers’ expenses. The Board also considered that it receives periodic reports from the Chief Compliance Officer of the Invesco Funds demonstrating that these arrangements are consistent with regulatory requirements. The Board did not deem the soft dollar arrangements to be inappropriate.
The Board considered that the Fund’s uninvested cash and cash collateral from any securities lending arrangements may be invested in money market funds advised by Invesco Advisers pursuant to procedures approved by the Board. The Board noted that Invesco Advisers receives advisory fees from these affiliated money market funds attributable to such investments, although Invesco Advisers has contractually agreed to waive through varying periods the advisory fees payable by the Invesco Funds with respect to certain investments in the affiliated money market funds. The waiver is in an amount equal to 100% of the net advisory fee Invesco
Advisers receives from the affiliated money market funds with respect to the Fund’s investment in the affiliated money market funds of uninvested cash, but not cash collateral. The Board concluded that the amount of advisory fees received by Invesco Advisors from the Fund’s investment of cash collateral from any securities lending arrangements in the affiliated money market funds is fair and reasonable.
The Board also considered the Fund may use an affiliated broker to execute certain trades for the Fund to, among other things, control information leakage, and were advised that such trades would be executed in compliance with rules under the Investment Company Act of 1940, as amended, and consistent with best execution obligations.
28 Invesco MLP Fund
Trustees and Officers
The address of each trustee and officer is AIM Investment Funds (Invesco Investment Funds) (the “Trust”), 11 Greenway Plaza, Suite 1000, Houston, Texas 77046-1173. The trustees serve for the life of the Trust, subject to their earlier death, incapacitation, resignation, retirement or removal as more specifically provided in the Trust’s organizational documents. Each officer serves for a one year term or until their successors are elected and qualified. Column two below includes length of time served with predecessor entities, if any.
| | | | | | | | |
Name, Year of Birth and
Position(s) Held with the Trust | | Trustee and/
or Officer Since | | Principal Occupation(s)
During Past 5 Years | | Number of
Funds in Fund
Complex
Overseen by
Trustee | | Other Directorship(s)
Held by Trustee During
Past 5 Years |
| Interested Persons | | | | | | | | |
| Martin L. Flanagan1 — 1960 Trustee | | 2007 | | Executive Director, Chief Executive Officer and President, Invesco Ltd. (ultimate parent of Invesco and a global investment management firm); Advisor to the Board, Invesco Advisers, Inc. (formerly known as Invesco Institutional (N.A.), Inc.); Trustee, The Invesco Funds; Vice Chair, Investment Company Institute; and Member of Executive Board, SMU Cox School of Business Formerly: Chairman and Chief Executive Officer, Invesco Advisers, Inc. (registered investment adviser); Director, Chairman, Chief Executive Officer and President, Invesco Holding Company (US) Inc. (formerly IVZ Inc.) (holding company), Invesco Group Services, Inc. (service provider) and Invesco North American Holdings, Inc. (holding company); Director, Chief Executive Officer and President, Invesco Holding Company Limited (parent of Invesco and a global investment management firm); Director, Invesco Ltd.; Chairman, Investment Company Institute and President, Co-Chief Executive Officer, Co-President, Chief Operating Officer and Chief Financial Officer, Franklin Resources, Inc. (global investment management organization) | | 146 | | None |
| Philip A. Taylor2 — 1954 Trustee and Senior Vice President | | 2006 | | Head of the Americas and Senior Managing Director, Invesco Ltd.; Director, Co-Chairman, Co-President and Co-Chief Executive Officer, Invesco Advisers, Inc. (formerly known as Invesco Institutional (N.A.), Inc.) (registered investment adviser); Director, Chairman, Chief Executive Officer and President, Invesco Management Group, Inc. (formerly known as Invesco AIM Management Group, Inc.) (financial services holding company); Director and Chairman, Invesco Investment Services, Inc. (formerly known as Invesco AIM Investment Services, Inc.) (registered transfer agent) Chief Executive Officer, Invesco Corporate Class Inc. (corporate mutual fund company) Director, Chairman and Chief Executive Officer, Invesco Canada Ltd. (formerly known as Invesco Trimark Ltd./Invesco Trimark Ltèe) (registered investment adviser and registered transfer agent); Trustee and Senior Vice President, The Invesco Funds; Director, Invesco Investment Advisers LLC (formerly known as Van Kampen Asset Management). Formerly: Director, Chief Executive Officer and President, Van Kampen Exchange Corp.; President and Principal Executive Officer, The Invesco Funds (other than AIM Treasurer’s Series Trust (Invesco Treasurer’s Series Trust), Short-Term Investments Trust and Invesco Management Trust); Executive Vice President, The Invesco Funds (AIM Treasurer’s Series Trust (Invesco Treasurer’s Series Trust), Short-Term Investments Trust and Invesco Management Trust only); Director and President, INVESCO Funds Group, Inc. (registered investment adviser and registered transfer agent); Director and Chairman, IVZ Distributors, Inc. (formerly known as INVESCO Distributors, Inc.) (registered broker dealer); Director, President and Chairman, Invesco Inc. (holding company), Invesco Canada Holdings Inc. (holding company), Trimark Investments Ltd./Placements Trimark Ltèe and Invesco Financial Services Ltd/Services Financiers Invesco Ltèe; Chief Executive Officer, Invesco Canada Fund Inc. (corporate mutual fund company); Director and Chairman, Van Kampen Investor Services Inc.; Director, Chief Executive Officer and President, 1371 Preferred Inc. (holding company) and Van Kampen Investments Inc.; Director and President, AIM GP Canada Inc. (general partner for limited partnerships) and Van Kampen Advisors, Inc.; Director and Chief Executive Officer, Invesco Trimark Dealer Inc. (registered broker dealer); Director, Invesco Distributors, Inc. (formerly known as Invesco AIM Distributors, Inc.) (registered broker dealer); Manager, Invesco PowerShares Capital Management LLC; Director, Chief Executive Officer and President, Invesco Advisers, Inc.; Director, Chairman, Chief Executive Officer and President, Invesco AIM Capital Management, Inc.; President, Invesco Trimark Dealer Inc. and Invesco Trimark Ltd./Invesco Trimark Ltèe; Director and President, AIM Trimark Corporate Class Inc. and AIM Trimark Canada Fund Inc.; Senior Managing Director, Invesco Holding Company Limited; Director and Chairman, Fund Management Company (former registered broker dealer); President and Principal Executive Officer, The Invesco Funds (AIM Treasurer’s Series Trust (Invesco Treasurer’s Series Trust), and Short-Term Investments Trust only); President, AIM Trimark Global Fund Inc. and AIM Trimark Canada Fund Inc. | | 146 | | None |
| 1 | Mr. Flanagan is considered an interested person (within the meaning of Section 2(a)(19) of the 1940 Act) of the Trust because he is an officer of the Adviser to the Trust, and an officer and a director of Invesco Ltd., ultimate parent of the Adviser. |
| 2 | Mr. Taylor is considered an interested person (within the meaning of Section 2(a)(19) of the 1940 Act) of the Trust because he is an officer and a director of the Adviser. |
T-1 Invesco MLP Fund
Trustees and Officers—(continued)
| | | | | | | | |
Name, Year of Birth and
Position(s) Held with the Trust | | Trustee and/
or Officer Since | | Principal Occupation(s) During Past 5 Years | | Number of
Funds in Fund
Complex
Overseen by
Trustee | | Other Directorship(s)
Held by Trustee During
Past 5 Years |
| Independent Trustees | | | | | | | | |
Bruce L. Crockett — 1944 Trustee and Chair | | 2001 | | Chairman, Crockett Technologies Associates (technology consulting company) Formerly: Director, Captaris (unified messaging provider); Director, President and Chief Executive Officer, COMSAT Corporation; Chairman, Board of Governors of INTELSAT (international communications company); ACE Limited (insurance company); Independent Directors Council and Investment Company Institute | | 146 | | ALPS (Attorneys Liability Protection Society) (insurance company) and Globe Specialty Metals, Inc. (metallurgical company); Member of the Audit Committee, Ferroglobe PLC and Investment Company Institute; Member of the Executive Committee and Chair of the Governance Committee, Independent Directors Council |
David C. Arch — 1945 Trustee | | 2010 | | Chairman of Blistex Inc., a consumer health care products manufacturer | | 146 | | Board member of the Illinois Manufacturers’ Association; Member of the Board of Visitors, Institute for the Humanities, University of Michigan |
James T. Bunch — 1942 Trustee | | 2003 | | Managing Member, Grumman Hill Group LLC (family office/private equity investments) Formerly: Chairman of the Board, Denver Film Society, Chairman of the Board of Trustees, Evans Scholarship Foundation; Chairman, Board of Governors, Western Golf Association | | 146 | | Trustee, Evans Scholarship Foundation |
Albert R. Dowden — 1941 Trustee | | 2001 | | Director of a number of public and private business corporations, including Nature’s Sunshine Products, Inc. Formerly: Director, The Boss Group, Ltd. and Reich & Tang Funds (5 portfolios) (registered investment company); Director, Homeowners of America Holding Corporation/Homeowners of America Insurance Company (property casualty company); Director, Continental Energy Services, LLC (oil and gas pipeline service); Director, CompuDyne Corporation (provider of product and services to the public security market) and Director, Annuity and Life Re (Holdings), Ltd. (reinsurance company); Director, President and Chief Executive Officer, Volvo Group North America, Inc.; Senior Vice President, AB Volvo; Director of various public and private corporations; Chairman, DHJ Media, Inc.; Director, Magellan Insurance Company; and Director, The Hertz Corporation, Genmar Corporation (boat manufacturer), National Media Corporation; Advisory Board of Rotary Power International (designer, manufacturer, and seller of rotary power engines); and Chairman, Cortland Trust, Inc. (registered investment company) | | 146 | | Director of Nature’s Sunshine Products, Inc. |
Jack M. Fields — 1952 Trustee | | 2001 | | Chief Executive Officer, Twenty First Century Group, Inc. (government affairs company); and Discovery Learning Alliance (non-profit) Formerly: Owner and Chief Executive Officer, Dos Angeles Ranch L.P. (cattle, hunting, corporate entertainment); Director, Insperity, Inc. (formerly known as Administaff); Chief Executive Officer, Texana Timber LP (sustainable forestry company); Director of Cross Timbers Quail Research Ranch (non-profit); and member of the U.S. House of Representatives | | 146 | | None |
Eli Jones — 1961 Trustee | | 2016 | | Professor and Dean, Mays Business School — Texas A&M University Formerly: Professor and Dean, Walton College of Business, University of Arkansas and E.J. Ourso College of Business, Louisiana State University and Director, Arvest Bank | | 146 | | Director of Insperity, Inc. (formerly known as Administaff) |
Prema Mathai-Davis — 1950 Trustee | | 2001 | | Retired. Formerly: Chief Executive Officer, YWCA of the U.S.A. | | 146 | | None |
Larry Soll — 1942 Trustee | | 2003 | | Retired. Formerly: Chairman, Chief Executive Officer and President, Synergen Corp. (a biotechnology company) | | 146 | | None |
Raymond Stickel, Jr. — 1944 Trustee | | 2005 | | Retired. Formerly: Director, Mainstay VP Series Funds, Inc. (25 portfolios) and Partner, Deloitte & Touche | | 146 | | None |
Robert C. Troccoli — 1949 Trustee | | 2016 | | Adjunct Professor, University of Denver — Daniels College of Business Formerly: Senior Partner, KPMG LLP | | 146 | | None |
T-2 Invesco MLP Fund
Trustees and Officers—(continued)
| | | | | | | | |
Name, Year of Birth and
Position(s) Held with the Trust | | Trustee and/
or Officer Since | | Principal Occupation(s) During Past 5 Years | | Number of
Funds in Fund
Complex
Overseen by
Trustee | | Other Directorship(s)
Held by Trustee During
Past 5 Years |
| Independent Trustees—(continued) |
Suzanne H. Woolsey — 1941 Trustee | | 2014 | | Retired. Formerly: Chief Executive Officer of Woolsey Partners LLC | | 146 | | Director, SunShare LLC; Trustee, Ocean Conservancy; Emeritus Chair of the Board of Trustees of the Institute for Defense Analyses and of Colorado College; Trustee, Chair, Business and Finance Committee of California Institute of Technology; Prior to 2014, Director of Fluor Corp.; Prior to 2010, Trustee of the German Marshall Fund of the United States; Prior to 2010, Trustee of the Rocky Mountain Institute |
| Other Officers | | | | | | | | |
Sheri Morris — 1964 President, Principal Executive Officer and Treasurer | | 1999 | | President, Principal Executive Officer and Treasurer, The Invesco Funds; Vice President, Invesco Advisers, Inc. (formerly known as Invesco Institutional (N.A.), Inc.) (registered investment adviser); and Vice President, PowerShares Exchange-Traded Fund Trust, PowerShares Exchange-Traded Fund Trust II, PowerShares India Exchange-Traded Fund Trust, PowerShares Actively Managed Exchange-Traded Fund Trust, and PowerShares Actively Managed Exchange-Traded Commodity Fund Trust Formerly: Vice President and Principal Financial Officer, The Invesco Funds; Vice President, Invesco AIM Advisers, Inc., Invesco AIM Capital Management, Inc. and Invesco AIM Private Asset Management, Inc.; Assistant Vice President and Assistant Treasurer, The Invesco Funds and Assistant Vice President, Invesco Advisers, Inc., Invesco AIM Capital Management, Inc. and Invesco AIM Private Asset Management, Inc.; and Treasurer, PowerShares Exchange-Traded Fund Trust, PowerShares Exchange-Traded Fund Trust II, PowerShares India Exchange-Traded Fund Trust and PowerShares Actively Managed Exchange-Traded Fund Trust | | N/A | | N/A |
Russell C. Burk — 1958 Senior Vice President and Senior Officer | | 2005 | | Senior Vice President and Senior Officer, The Invesco Funds | | N/A | | N/A |
John M. Zerr — 1962 Senior Vice President, Chief Legal Officer and Secretary | | 2006 | | Director, Senior Vice President, Secretary and General Counsel, Invesco Management Group, Inc. (formerly known as Invesco AIM Management Group, Inc.; Senior Vice President, Invesco Advisers, Inc. (formerly known as Invesco Institutional (N.A.), Inc.) (registered investment adviser); Senior Vice President and Secretary, Invesco Distributors, Inc. (formerly known as Invesco AIM Distributors, Inc.); Director, Vice President and Secretary, Invesco Investment Services, Inc. (formerly known as Invesco AIM Investment Services, Inc.) Senior Vice President, Chief Legal Officer and Secretary, The Invesco Funds; Managing Director, Invesco PowerShares Capital Management LLC; Director, Secretary and General Counsel, Invesco Investment Advisers LLC (formerly known as Van Kampen Asset Management); Secretary and General Counsel, Invesco Capital Markets, Inc. (formerly known as Van Kampen Funds Inc.) and Chief Legal Officer, PowerShares Exchange-Traded Fund Trust, PowerShares Exchange-Traded Fund Trust II, PowerShares India Exchange-Traded Fund Trust, PowerShares Actively Managed Exchange-Traded Fund Trust, and PowerShares Actively Managed Exchange-Traded Commodity Fund Trust Formerly: Director, Secretary, General Counsel and Senior Vice President, Van Kampen Exchange Corp.; Director, Vice President and Secretary, IVZ Distributors, Inc. (formerly known as INVESCO Distributors, Inc.); Director and Vice President, INVESCO Funds Group, Inc.; Director and Vice President, Van Kampen Advisors Inc.; Director, Vice President, Secretary and General Counsel, Van Kampen Investor Services Inc.; Director, Invesco Distributors, Inc. (formerly known as Invesco AIM Distributors, Inc.); Director, Senior Vice President, General Counsel and Secretary, Invesco AIM Advisers, Inc. and Van Kampen Investments Inc.; Director, Vice President and Secretary, Fund Management Company; Director, Senior Vice President, Secretary, General Counsel and Vice President, Invesco AIM Capital Management, Inc.; Chief Operating Officer and General Counsel, Liberty Ridge Capital, Inc. (an investment adviser); Vice President and Secretary, PBHG Funds (an investment company) and PBHG Insurance Series Fund (an investment company); Chief Operating Officer, General Counsel and Secretary, Old Mutual Investment Partners (a broker-dealer); General Counsel and Secretary, Old Mutual Fund Services (an administrator) and Old Mutual Shareholder Services (a shareholder servicing center); Executive Vice President, General Counsel and Secretary, Old Mutual Capital, Inc. (an investment adviser); and Vice President and Secretary, Old Mutual Advisors Funds (an investment company) | | N/A | | N/A |
T-3 Invesco MLP Fund
Trustees and Officers—(continued)
| | | | | | | | |
Name, Year of Birth and
Position(s) Held with the Trust | | Trustee and/
or Officer Since | | Principal Occupation(s) During Past 5 Years | | Number of
Funds in Fund
Complex
Overseen by
Trustee | | Other Directorship(s)
Held by Trustee During
Past 5 Years |
| Other Officers—(continued) | | | | | | | | |
| Karen Dunn Kelley — 1960 Senior Vice President | | 2004 | | Senior Managing Director, Investments, Invesco Ltd.; Director, Co-President, Co-Chief Executive Officer, and Co-Chairman, Invesco Advisers, Inc. (formerly known as Invesco Institutional (N.A.), Inc.) (registered investment adviser); Chairman and Director, Invesco Senior Secured Management, Inc.; Senior Vice President, Invesco Management Group, Inc. (formerly known as Invesco AIM Management Group, Inc.); Executive Vice President, Invesco Distributors, Inc. (formerly known as Invesco AIM Distributors, Inc.); Director, Invesco Mortgage Capital Inc. and Invesco Management Company Limited; Senior Vice President, The Invesco Funds Formerly: Vice President, The Invesco Funds (other than AIM Treasurer’s Series Trust (Invesco Treasurer’s Series Trust), Short-Term Investments Trust and Invesco Management Trust); and President and Principal Executive Officer, The Invesco Funds (AIM Treasurer’s Series Trust (Invesco Treasurer’s Series Trust), Short-Term Investments Trust and Invesco Management Trust only); Director and President, INVESCO Asset Management (Bermuda) Ltd., Director, INVESCO Global Asset Management DAC (formerly known as INVESCO Global Asset Management Limited) and INVESCO Management S.A.; Senior Vice President, Van Kampen Investments Inc. and Invesco Advisers, Inc. (formerly known as Invesco Institutional (N.A.), Inc.) (registered investment adviser); Director and President, Fund Management Company; Chief Cash Management Officer, Director of Cash Management, Senior Vice President, and Managing Director, Invesco AIM Capital Management, Inc.; Director of Cash Management, Senior Vice President, and Vice President, Invesco Advisers, Inc. and Vice President, The Invesco Funds (AIM Treasurer’s Series Trust (Invesco Treasurer’s Series Trust), and Short-Term Investments Trust only) | | N/A | | N/A |
Kelli Gallegos — 1970 Vice President, Principal Financial Officer and Assistant Treasurer | | 2008 | | Vice President, Principal Financial Officer and Assistant Treasurer, The Invesco Funds; Assistant Treasurer, Invesco PowerShares Capital Management LLC, PowerShares Exchange-Traded Fund Trust, PowerShares Exchange-Traded Fund Trust II, PowerShares India Exchange-Traded Fund Trust, PowerShares Actively Managed Exchange-Traded Fund Trust, and PowerShares Actively Managed Exchange-Traded Commodity Fund Trust Formerly: Assistant Vice President, The Invesco Funds | | N/A | | N/A |
Tracy Sullivan — 1962 Vice President, Chief Tax Officer and Assistant Treasurer | | 2008 | | Vice President, Chief Tax Officer and Assistant Treasurer, The Invesco Funds; Assistant Treasurer, Invesco PowerShares Capital Management LLC, PowerShares Exchange-Traded Fund Trust, PowerShares Exchange-Traded Fund Trust II, PowerShares India Exchange-Traded Fund Trust, PowerShares Actively Managed Exchange-Traded Fund Trust, and PowerShares Actively Managed Exchange-Traded Commodity Fund Trust Formerly: Assistant Vice President, The Invesco Funds | | N/A | | N/A |
Crissie M. Wisdom — 1969 Anti-Money Laundering Compliance Officer | | 2013 | | Anti-Money Laundering Compliance Officer, Invesco Advisers, Inc. (formerly known as Invesco Institutional (N.A.), Inc.) (registered investment adviser), Invesco Capital Markets, Inc. (formerly known as Van Kampen Funds Inc.), Invesco Distributors, Inc., Invesco Investment Services, Inc., Invesco Management Group, Inc., The Invesco Funds, and PowerShares Exchange-Traded Fund Trust, PowerShares Exchange-Traded Fund Trust II, PowerShares India Exchange-Traded Fund Trust, PowerShares Actively Managed Exchange-Traded Fund Trust and PowerShares Actively Managed Exchange-Traded Commodity Fund Trust; Anti-Money Laundering Compliance Officer and Bank Secrecy Act Officer, INVESCO National Trust Company and Invesco Trust Company; and Fraud Prevention Manager and Controls and Risk Analysis Manager for Invesco Investment Services, Inc. Formerly: Anti-Money Laundering Compliance Officer, Van Kampen Exchange Corp. | | N/A | | N/A |
Robert R. Leveille — 1969 Chief Compliance Officer | | 2016 | | Chief Compliance Officer, Invesco Advisers, Inc. (registered investment adviser); and Chief Compliance Officer, The Invesco Funds Formerly: Chief Compliance Officer, Putnam Investments and the Putnam Funds | | N/A | | N/A |
The Statement of Additional Information of the Trust includes additional information about the Fund’s Trustees and is available upon request, without charge, by calling 1.800.959.4246. Please refer to the Fund’s Statement of Additional Information for information on the Fund’s sub-advisers.
| | | | | | |
Office of the Fund 11 Greenway Plaza, Suite 1000 Houston, TX 77046-1173 | | Investment Adviser Invesco Advisers, Inc. 1555 Peachtree Street, N.E. Atlanta, GA 30309 | | Distributor Invesco Distributors, Inc. 11 Greenway Plaza, Suite 1000 Houston, TX 77046-1173 | | Auditors PricewaterhouseCoopers LLP 1000 Louisiana Street, Suite 5800 Houston, TX 77002-5678 |
| | | |
| | | | | | |
Counsel to the Fund Stradley Ronon Stevens & Young, LLP 2005 Market Street, Suite 2600 Philadelphia, PA 19103-7018 | | Counsel to the Independent Trustees Goodwin Procter LLP 901 New York Avenue, N.W. Washington, D.C. 20001 | | Transfer Agent Invesco Investment Services, Inc. 11 Greenway Plaza, Suite 1000 Houston, TX 77046-1173 | | Custodian State Street Bank and Trust Company 225 Franklin Street Boston, MA 02110-2801 |
T-4 Invesco MLP Fund
Explore High-Conviction Investing with Invesco

Invesco mailing information
Send general correspondence to Invesco Investment Services, Inc., P.O. Box 219078, Kansas City, MO 64121-9078.
Important notice regarding delivery of security holder documents
To reduce Fund expenses, only one copy of most shareholder documents may be mailed to shareholders with multiple accounts at the same address (Householding). Mailing of your shareholder documents may be householded indefinitely unless you instruct us otherwise. If you do not want the mailing of these documents to be combined with those for other members of your household, please contact Invesco Investment Services, Inc. at 800 959 4246 or contact your financial institution. We will begin sending you individual copies for each account within 30 days after receiving your request.
Fund holdings and proxy voting information
The Fund provides a complete list of its holdings four times in each fiscal year, at the quarter ends. For the second and fourth quarters, the lists appear in the Fund’s semiannual and annual reports to shareholders. For the first and third quarters, the Fund files the lists with the Securities and Exchange Commission (SEC) on Form N-Q. The most recent list of portfolio holdings is available at invesco.com/completeqtrholdings. Shareholders can also look up the Fund’s Forms N-Q on the SEC website at sec.gov. Copies of the Fund’s Forms N-Q may be reviewed and copied at the SEC Public Reference Room in Washington, D.C. You can obtain information on the operation of the Public Reference Room, including information about duplicating fee charges, by calling 202 551 8090 or 800 732 0330, or by electronic request at the following email address: publicinfo@sec.gov. The SEC file numbers for the Fund are shown below.
A description of the policies and procedures that the Fund uses to determine how to vote proxies relating to portfolio securities is available without charge, upon request, from our Client Services department at 800 959 4246 or at invesco.com/proxyguidelines. The information is also available on the SEC website, sec.gov.
| | |
Information regarding how the Fund voted proxies related to its portfolio securities during the most recent 12-month period ended June 30 is available at invesco.com/proxysearch. The information is also available on the SEC website, sec.gov. Invesco Advisers, Inc. is an investment adviser; it provides investment advisory services to individual and institutional clients and does not sell securities. Invesco Distributors, Inc. is the US distributor for Invesco Ltd.’s retail mutual funds, exchange-traded funds and institutional money market funds. Both are wholly owned, indirect subsidiaries of Invesco Ltd. | |  |
| | | | |
| SEC file numbers: 811-05426 and 033-19338 | | MLP-AR-1 | | Invesco Distributors, Inc. |
| | | | | | | | |
| | | | | |
 | | | | Annual Report to Shareholders | | | October 31, 2016 | |
| | | | |
| | | Invesco Multi-Asset Income Fund | |
| | | Effective July 27, 2016, Invesco Premium Income Fund was renamed Invesco Multi-Asset Income Fund. | |
| | | Nasdaq: | | | | |
| | | A: PIAFX ∎ C: PICFX ∎ R: PIRFX ∎ Y: PIYFX ∎ R5: IPNFX ∎ R6: PIFFX | |

Letters to Shareholders
| | |

Philip Taylor | | Dear Shareholders: This annual report includes information about your Fund, including performance data and a complete list of its investments as of the close of the reporting period. Inside is a discussion of how your Fund was managed and the factors that affected its performance during the reporting period. In December 2015, the US Federal Reserve raised short-term interest rates for the first time since 2006, signaling its belief that the economy was likely to continue strengthening. Indeed, throughout the reporting period, US economic data were generally positive and the economy expanded at a moderate rate – but there were some bumps along the road. Job growth in May 2016 was very weak, but it was followed by strong increases in nonfarm payrolls in June and July. Increased concerns about global economic weakness caused US stock market indexes to sink at the start of calendar year 2016, but they eventually recovered; they sank again following the UK’s decision to leave the European Union, but |
then quickly recovered and reached record highs later in the summer. Strong demand for income-producing investments, particularly those perceived to be lower risk, benefited bonds as well as dividend-paying stocks for much of the reporting period. While economic news in the US was generally positive, news overseas was less upbeat. The European Central Bank, and central banks in China and Japan – as well as other countries – maintained extraordinarily accommodative monetary policies in response to economic weakness. As the fiscal year drew to a close, uncertainty about the outcome of the US presidential election resulted in increased market volatility; the surprise outcome after the close of the reporting period suggested that market volatility may continue for some time to come.
Short-term market volatility can prompt some investors to abandon their investment plans – and can cause others to settle for average results. The investment professionals at Invesco, in contrast, invest with high conviction, take a long-term perspective and have a passion to exceed. Invesco’s pure focus on investment management eliminates possible distractions and means that there are no competing lines of business for us to support. Just as important, we embrace a variety of investment strategies, asset classes and geographies – because we know that no single investment approach meets the diverse needs of all of our clients. We manage all our investment approaches with a passion to exceed. All our investment teams have a highly disciplined, long-term investing style that eliminates short-term decision-making. Of course, investing with high conviction can’t guarantee a profit or ensure success; no investment strategy can. To learn more about how we invest with high conviction, visit invesco.com/HighConviction.
You, too, can invest with high conviction by maintaining a long-term investment perspective and by working with your financial adviser on a regular basis. During periods of short-term market volatility or uncertainty, your financial adviser can keep you focused on your long-term investment goals – a new home, a child’s college education or a secure retirement. He or she also can share research about the economy, the markets and individual investment options.
Visit our website for more information on your investments
Our website, invesco.com/us, offers a wide range of market insights and investment perspectives. On the website, you’ll find detailed information about our funds, including performance, holdings and portfolio manager commentaries. You can access information about your account by completing a simple, secure online registration. Click on the “Need to register” link in the “Account Access” box on our homepage to get started.
In addition to the resources accessible on our website and through our mobile app, you can obtain timely updates to help you stay informed about the markets, the economy and investing by connecting with Invesco on Twitter, LinkedIn or Facebook. You can access our blog at blog.invesco.us.com. Our goal is to provide you the information you want, when and where you want it.
Finally, I’m pleased to share with you Invesco’s commitment to both the Principles for Responsible Investment and to considering environmental, social and governance issues in our robust investment process. I invite you to learn more at invesco.com/esg.
Have questions?
For questions about your account, contact an Invesco client services representative at 800 959 4246. For Invesco-related questions or comments, please email me directly at phil@invesco.com.
All of us at Invesco look forward to serving your investment management needs. Thank you for investing with us.
Sincerely,

Philip Taylor
Senior Managing Director, Invesco Ltd.
2 Invesco Multi-Asset Income Fund
| | | | | | |

Bruce Crockett | | | | Dear Fellow Shareholders: Among the many important lessons I’ve learned in more than 40 years in a variety of business endeavors is the value of a trusted advocate. As independent chair of the Invesco Funds Board, I can assure you that the members of the Board are strong advocates for the interests of investors in Invesco’s mutual funds. We work hard to represent your interests through oversight of the quality of the investment management services your funds receive and other matters important to your investment, including but not limited to: |
| | | | ∎ | | Ensuring that Invesco offers a diverse lineup of mutual funds that your financial adviser can use to strive to meet your financial needs as your investment goals change over time. |
| | | | ∎ | | Monitoring how the portfolio management teams of the Invesco funds are performing in light of changing economic and market conditions. |
| ∎ | | Assessing each portfolio management team’s investment performance within the context of the investment strategy described in the fund’s prospectus. |
| ∎ | | Monitoring for potential conflicts of interests that may impact the nature of the services that your funds receive. |
We believe one of the most important services we provide our fund shareholders is the annual review of the funds’ advisory and sub-advisory contracts with Invesco Advisers and its affiliates. This review is required by the Investment Company Act of 1940 and focuses on the nature and quality of the services Invesco provides as the adviser to the Invesco funds and the reasonableness of the fees that it charges for those services. Each year, we spend months carefully reviewing information received from Invesco and a variety of independent sources, such as performance and fee data prepared by Lipper Inc., an independent, third-party firm widely recognized as a leader in its field. We also meet with our independent legal counsel and other independent advisers to review and help us assess the information that we have received. Our goal is to assure that you receive quality investment management services for a reasonable fee.
I trust the measures outlined above provide assurance that you have a worthy advocate when it comes to choosing the Invesco Funds.
As always, please contact me at bruce@brucecrockett.com with any questions or concerns you may have. On behalf of the Board, we look forward to continuing to represent your interests and serving your needs.
Sincerely,

Bruce L. Crockett
Independent Chair
Invesco Funds Board of Trustees
3 Invesco Multi-Asset Income Fund
Management’s Discussion of Fund Performance
| | | | | |
Performance summary For the fiscal year ended October 31, 2016, Class A shares of Invesco Multi-Asset Income Fund (the Fund), at net asset value (NAV), outperformed the Custom Invesco Multi-Asset Income Index, the Fund’s style-specific benchmark. Your Fund’s long-term performance appears later in this report. |
| | | | | |
Fund vs. Indexes Total returns, 10/31/15 to 10/31/16, at net asset value (NAV). Performance shown does not include applicable contingent deferred sales charges (CDSC) or front-end sales charges, which would have reduced performance. |
| | | | | |
| |
| Class A Shares | | | | 9.44 | % |
| Class C Shares | | | | 8.62 | |
| Class R Shares | | | | 9.28 | |
| Class Y Shares | | | | 9.71 | |
| Class R5 Shares | | | | 9.82 | |
| Class R6 Shares | | | | 9.71 | |
| Bloomberg Barclays U.S. Aggregate Index▼ (Broad Market Index) | | | | 4.37 | |
| Custom Invesco Multi-Asset Income Index∎ (Style-Specific Index) | | | | 5.08 | |
| Lipper Mixed-Asset Target Allocation Conservative Funds Index◆ (Peer Group Index) | | | | 4.08 | |
|
| Source(s): ▼FactSet Research Systems, Inc.; ∎Invesco, FactSet Research Systems, Inc.; ◆Lipper Inc. | |
Market conditions and your Fund
Effective July 27, 2016, Invesco Premium Income Fund was renamed Invesco Multi-Asset Income Fund. The name change is intended to be more representative of the Fund’s investment strategy and the underlying assets in which it invests.
For the fiscal year ended October 31, 2016, Invesco Multi-Asset Income Fund provided positive returns led by gains in high yield securities, emerging market bonds, mortgage real estate investment trusts (REITs) and preferred stocks. The tactical component of the strategy was also a contributor to Fund performance, led by gains in global government bonds. We make tactical adjustments to the Fund’s portfolio on a monthly basis to try
to take advantage of short-term market dynamics.
Despite the Fund’s positive performance, there were some challenges at the beginning of the fiscal year; these included deflationary pressures fueled by monetary policy, plunging oil prices and a rising US dollar. Then, in June 2016, the UK’s vote to leave the European Union roiled global financial markets. Overall, interest rate levels remained low as US Treasury prices rallied on volatility early in the reporting period and “flight-to-safety” demand in the wake of the UK vote. However, US Treasuries surrendered some of those gains late in the reporting period as economic data improved and the US Federal Reserve hinted at an increase in interest rates.
As part of its strategic allocation process, the Fund invests in eight primary asset classes: preferred stocks, high yield bonds, emerging market debt securities, dividend-producing equities, securities of real estate and real estate-related issuers (including mortgage REITs, equity REITs, and equity securities of global companies principally engaged in the real estate industry), floating rate debt securities and loans, US master limited partnerships (MLPs) and US government obligations. All components of the Fund’s strategic allocation finished the reporting period with gains, but high yield bonds was the top-performing component due to a rally in oil prices in the middle of the fiscal year; the rally buoyed the energy sector and reduced the prospect of widespread defaults. The energy rally also helped the Fund’s financials sector-dominated preferred stock allocation after fears of a banking crisis, caused by plunging oil prices, subsided. Emerging market bonds and MLPs benefited from a broad rally in commodities and weakening in the US dollar. Mortgage REIT prices benefited from their attractive yields, given a sluggish global economy and highly accommodative global monetary policy, which drove down yields of government bonds.
The Fund’s tactical allocation, obtained through the use of swaps and futures, contributed further to overall results mainly led by exposure to global government bonds, with UK gilts, German bunds and Canadian government bonds being the largest contributors. Tactical equity exposure also aided results as gains in
| | |
Portfolio Composition | | |
By security type | | % of total net assets |
| | | | | |
| |
| U.S. Dollar-Denominated Bonds and Notes | | | | 39.9 | % |
| Preferred Stocks | | | | 21.8 | |
| Common Stocks and Other Equity Interests | | | | 16.7 | |
| U.S. Treasury Securities | | | | 8.2 | |
| Exchange-Traded Notes | | | | 4.1 | |
| Non-U.S. Dollar-Denominated Bonds and Notes | | | | 0.3 | |
| Money Market Funds Plus Other Assets Less Liabilities | | | | 9.0 | |
| | | | |
Top 5 Debt Issuers | | |
| | | | % of total net assets |
| | | | | | |
| 1. | | U.S. Treasury Securities | | 8.2% |
| 2. | | El Salvador Government International Bond | | 0.8 |
| 3. | | Sri Lanka Government International Bonds | | 0.7 |
| 4. | | Colombia Government International Bond | | 0.6 |
| 5. | | Brazilian Government International Bond | | 0.6 |
| | | | | |
Total Net Assets | | | | $196.8 million | |
| | | | | |
| |
| Total Number of Holdings* | | | | 627 | |
The Fund’s holdings are subject to change, and there is no assurance that the Fund will continue to hold any particular security.
*Excluding money market fund holdings.
Data presented here are as of October 31, 2016.
4 Invesco Multi-Asset Income Fund
the UK, Japan and Hong Kong overcame losses in Europe and the US.
Please note that our strategy utilizes derivative instruments that include futures and total return swaps. Therefore, some of the performance of the strategy, both positive and negative, can be attributed to these instruments. Derivatives can be a cost-effective way to gain exposure to asset classes. However, derivatives may amplify traditional investment risks through the creation of leverage and may be less liquid than traditional securities.
Thank you for your continued investment in Invesco Multi-Asset Income Fund.
The views and opinions expressed in management’s discussion of Fund performance are those of Invesco Advisers, Inc. These views and opinions are subject to change at any time based on factors such as market and economic conditions. These views and opinions may not be relied upon as investment advice or recommendations, or as an offer for a particular security. The information is not a complete analysis of every aspect of any market, country, industry, security or the Fund. Statements of fact are from sources considered reliable, but Invesco Advisers, Inc. makes no representation or warranty as to their completeness or accuracy. Although historical performance is no guarantee of future results, these insights may help you understand our investment management philosophy.
See important Fund and, if applicable, index disclosures later in this report.
| | |
 | | Scott Wolle Chartered Financial Analyst, Portfolio Manager, is lead manager of Invesco Multi-Asset Income |
| Fund. He joined Invesco in 1999. Mr. Wolle earned a BS in finance from Virginia Polytechnic Institute and State University and an MBA from Duke University Fuqua School of Business. |
| | |
 | | Mark Ahnrud Chartered Financial Analyst, Portfolio Manager, is manager of Invesco Multi-Asset Income Fund. He |
| joined Invesco in 2000. Mr. Ahnrud earned a BS in finance and investments from Babson College and an MBA from Duke University Fuqua School of Business. |
| | |
 | | Chris Devine Chartered Financial Analyst, Portfolio Manager, is manager of Invesco Multi-Asset Income Fund. He |
| joined Invesco in 1998. Mr. Devine earned a BA in economics from Wake Forest University and an MBA from the University of Georgia. |
| | |
 | | Scott Hixon Chartered Financial Analyst, Portfolio Manager, is manager of Invesco Multi-Asset Income Fund. He |
| joined Invesco in 1994. Mr. Hixon earned a BBA in finance from Georgia Southern University and an MBA in finance from Georgia State University. |
| | |
 | | Christian Ulrich Chartered Financial Analyst, Portfolio Manager, is manager of Invesco Multi-Asset Income Fund. He |
| joined Invesco in 2000. Mr. Ulrich earned the equivalent of a BBA from the KV Zurich Business School in Zurich, Switzerland. |
5 Invesco Multi-Asset Income Fund
Your Fund’s Long-Term Performance
Results of a $10,000 Investment – Oldest Share Class(es) since Inception
Fund and index data from 12/14/11
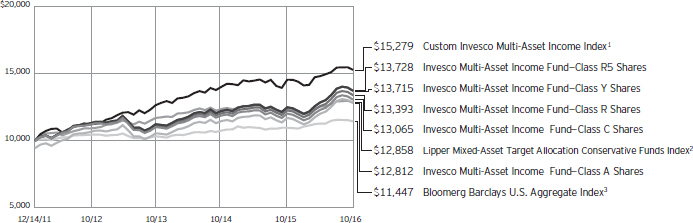
| 1 | Source(s): Invesco, FactSet Research Systems Inc. |
| 3 | Source: FactSet Research Systems Inc. |
Past performance cannot guarantee comparable future results.
The data shown in the chart include reinvested distributions, applicable sales charges and Fund expenses including management fees. Index results include reinvested dividends, but they do not reflect sales charges. Performance of the
peer group, if applicable, reflects fund expenses and management fees; performance of a market index does not. Performance shown in the chart and table(s) does not reflect deduction of taxes a shareholder would pay on Fund distributions or sale of Fund shares.
6 Invesco Multi-Asset Income Fund
| | | | |
| Average Annual Total Returns | |
As of 10/31/16, including maximum applicable sales charges | |
| |
Class A Shares | | | | |
Inception (12/14/11) | | | 5.21 | % |
1 Year | | | 3.40 | |
| |
Class C Shares | | | | |
Inception (12/14/11) | | | 5.63 | % |
1 Year | | | 7.62 | |
| |
Class R Shares | | | | |
Inception (12/14/11) | | | 6.17 | % |
1 Year | | | 9.28 | |
| |
Class Y Shares | | | | |
Inception (12/14/11) | | | 6.68 | % |
1 Year | | | 9.71 | |
| |
Class R5 Shares | | | | |
Inception (12/14/11) | | | 6.71 | % |
1 Year | | | 9.82 | |
| |
Class R6 Shares | | | | |
Inception | | | 6.65 | % |
1 Year | | | 9.71 | |
Class R6 shares incepted on September 24, 2012. Performance shown prior to that date is that of Class A shares and includes the 12b-1 fees applicable to Class A shares.
The performance data quoted represent past performance and cannot guarantee comparable future results; current performance may be lower or higher. Please visit invesco.com/performance for the most recent month-end performance. Performance figures reflect reinvested distributions, changes in net asset value and the effect of the maximum sales charge unless otherwise stated. Investment return and principal value will fluctuate so that you may have a gain or loss when you sell shares.
The net annual Fund operating expense ratio set forth in the most recent Fund prospectus as of the date of this report for Class A, Class C, Class R, Class Y, Class R5 and Class R6 shares was 1.05%, 1.80%, 1.30%, 0.80%, 0.80% and 0.80%, respectively.1,2 The total annual Fund operating expense ratio set forth in the most recent Fund prospectus as of the date of this report for Class A, Class C, Class R, Class Y, Class R5 and Class R6 shares was 1.28%, 2.03%, 1.53%, 1.03%, 0.90% and 0.90%, respectively. The expense ratios presented above may vary from the expense ratios presented in other
| | |
| Average Annual Total Returns |
| As of 9/30/16, the most recent calendar quarter end, including maximum applicable sales charges |
| | | | |
| |
Class A Shares | | | | |
Inception (12/14/11) | | | 5.69 | % |
1 Year | | | 8.42 | |
| |
Class C Shares | | | | |
Inception (12/14/11) | | | 6.14 | % |
1 Year | | | 12.74 | |
| |
Class R Shares | | | | |
Inception (12/14/11) | | | 6.68 | % |
1 Year | | | 14.42 | |
| |
Class Y Shares | | | | |
Inception (12/14/11) | | | 7.22 | % |
1 Year | | | 14.98 | |
| |
Class R5 Shares | | | | |
Inception (12/14/11) | | | 7.22 | % |
1 Year | | | 14.98 | |
| |
Class R6 Shares | | | | |
Inception | | | 7.19 | % |
1 Year | | | 14.98 | |
sections of this report that are based on expenses incurred during the period covered by this report.
Class A share performance reflects the maximum 5.50% sales charge, and Class C share performance reflects the applicable contingent deferred sales charge (CDSC) for the period involved. The CDSC on Class C shares is 1% for the first year after purchase. Class R, Class Y, Class R5 and Class R6 shares do not have a front-end sales charge or a CDSC; therefore, performance is at net asset value.
The performance of the Fund’s share classes will differ primarily due to different sales charge structures and class expenses.
Fund performance reflects any applicable fee waivers and/or expense reimbursements. Had the adviser not waived fees and/or reimbursed expenses currently or in the past, returns would have been lower. See current prospectus for more information.
| 1 | Total annual Fund operating expenses after any contractual fee waivers by the adviser in effect through at least June 30, 2018. See current prospectus for more information. |
| 2 | Total annual Fund operating expenses after any contractual fee waivers and/or expense reimbursements by the adviser in effect through at least February 28, 2017. See current prospectus for more information. |
7 Invesco Multi-Asset Income Fund
Invesco Multi-Asset Income Fund’s investment objective is to provide current income.
| ∎ | | Unless otherwise stated, information presented in this report is as of October 31, 2016, and is based on total net assets. |
| ∎ | | Unless otherwise noted, all data provided by Invesco. |
| ∎ | | To access your Fund’s reports/prospectus, visit invesco.com/fundreports. |
About share classes
| ∎ | | Class R shares are generally available only to employer sponsored retirement and benefit plans. Please see the prospectus for more information. |
| ∎ | | Class Y shares are available only to certain investors. Please see the prospectus for more information. |
| ∎ | | Class R5 shares and Class R6 shares are primarily intended for employer sponsored retirement and benefit plans that meet certain standards and for institutional investors. Please see the prospectus for more information. |
Principal risks of investing
in the Fund
| ∎ | | Active trading risk. Active trading of portfolio securities may result in added expenses, a lower return and increased tax liability. |
| ∎ | | Bank loan risk. There are a number of risks associated with an investment in bank loans including credit risk, interest rate risk, liquidity risk and prepayment risk. Lack of an active trading market, restrictions on resale, irregular trading activity, wide bid/ask spreads and extended trade settlement periods may impair the Fund’s ability to sell bank loans within its desired time frame or at an acceptable price and its ability to accurately value existing and prospective investments. Extended trade settlement periods may result in cash not being immediately available to the Fund. As a result, the Fund may have to sell other investments or engage in borrowing transactions to raise cash to meet its obligations. The risk of holding bank loans is also directly tied to the risk of insolvency or bankruptcy of the issuing banks. These risks could cause the Fund to lose income or principal on a particular investment, which in turn could affect the Fund’s returns. The value of bank loans can be affected by and sensitive to changes in government regulation and to economic downturns in the United States and abroad. Bank loans generally are floating rate loans, which are subject to interest rate risk as the interest |
| | | paid on the floating rate loans adjusts periodically based on changes in widely accepted reference rates. |
| ∎ | | Changing fixed income market conditions risk. The current low interest rate environment was created in part by the Federal Reserve Board (FRB) and certain foreign central banks keeping the federal funds and equivalent foreign rates near, at or below zero. Increases in the federal funds and equivalent foreign rates may expose fixed income markets to heightened volatility and reduced liquidity for certain fixed income investments, particularly those with longer maturities. In addition, decreases in fixed income dealer market-making capacity may also potentially lead to heightened volatility and reduced liquidity in the fixed income markets. As a result, the value of the Fund’s investments and share price may decline. Changes in central bank policies could also result in higher than normal shareholder redemptions, which could potentially increase portfolio turnover and the Fund’s transaction costs. |
| ∎ | | Commodities tax risk. The tax treatment of commodity-linked derivative instruments may be adversely affected by changes in legislation, regulations or other legally binding authority. If, as a result of any such adverse action, the income of the Fund from certain commodity-linked derivatives was treated as non-qualifying income, the Fund might fail to qualify as a regulated investment company and be subject to federal income tax at the Fund level. Should the Internal Revenue Service issue guidance, or Congress enact legislation, that adversely affects the tax treatment of the Fund’s use of the Subsidiary (which guidance might be applied to the Fund retroactively), it could, among other consequences, limit the Fund’s ability to pursue its investment strategy. |
| ∎ | | Commodity risk. The Fund may have investment exposure to the commodities markets and/or a particular sector of the commodities markets, which may subject the Fund to greater volatility than investments in traditional securities, such as stocks and bonds. Volatility in the commodities markets may |
| | | be caused by changes in overall market movements, domestic and foreign political and economic events and policies, war, acts of terrorism, changes in domestic or foreign interest rates and/ or investor expectations concerning interest rates, domestic and foreign inflation rates, investment and trading activities of mutual funds, hedge funds and commodities funds, and factors such as drought, floods, weather, livestock disease, embargoes, tariffs and other regulatory developments or supply and demand disruptions. Because the Fund’s performance may be linked to the performance of volatile commodities, investors should be willing to assume the risks of potentially significant fluctuations in the value of the Fund’s shares. |
| ∎ | | Credit linked notes risk. Risks of credit linked notes include those risks associated with the underlying reference obligation including but not limited to market risk, interest rate risk, credit risk, default risk and, in some cases, foreign currency risk. An investor in a credit linked note bears counterparty risk or the risk that the issuer of the credit linked note will default or become bankrupt and not make timely payment of principal and interest of the structured security. Credit linked notes may be less liquid than other investments and therefore harder to dispose of at the desired time and price. In addition, credit linked notes may be leveraged and, as a result, small changes in the value of the underlying reference obligation may produce disproportionate losses to the Fund. |
| ∎ | | Debt securities risk. The prices of debt securities held by the Fund will be affected by changes in interest rates, the creditworthiness of the issuer and other factors. An increase in prevailing interest rates typically causes the value of existing debt securities to fall and often has a greater impact on longer-duration debt securities and higher quality debt securities. Falling interest rates |
|
This report must be accompanied or preceded by a currently effective Fund prospectus, which contains more complete information, including sales charges and expenses. Investors should read it carefully before investing. |
|
NOT FDIC INSURED | MAY LOSE VALUE | NO BANK GUARANTEE |
8 Invesco Multi-Asset Income Fund
will cause the Fund to reinvest the proceeds of debt securities that have been repaid by the issuer at lower interest rates. Falling interest rates may also reduce the Fund’s distributable income because interest payments on floating rate debt instruments held by the Fund will decline. The Fund could lose money on investments in debt securities if the issuer or borrower fails to meet its obligations to make interest payments and/or to repay principal in a timely manner. Changes in an issuer’s financial strength, the market’s perception of such strength or in the credit rating of the issuer or the security may affect the value of debt securities. The Adviser’s credit analysis may fail to anticipate such changes, which could result in buying a debt security at an inopportune time or failing to sell a debt security in advance of a price decline or other credit event.
| ∎ | | Derivatives risk. The value of a derivative instrument depends largely on (and is derived from) the value of an underlying security, currency, commodity, interest rate, index or other asset (each referred to as an underlying asset). In addition to risks relating to the underlying assets, the use of derivatives may include other, possibly greater, risks, including counterparty, leverage and liquidity risks. Counterparty risk is the risk that the counterparty to the derivative contract will default on its obligation to pay the Fund the amount owed or otherwise perform under the derivative contract. Derivatives create leverage risk because they do not require payment up front equal to the economic exposure created by owning the derivative. As a result, an adverse change in the value of the underlying asset could result in the Fund sustaining a loss that is substantially greater than the amount invested in the derivative, which may make the Fund’s returns more volatile and increase the risk of loss. Derivative instruments may also be less liquid than more traditional investments and the Fund may be unable to sell or close out its derivative positions at a desirable time or price. This risk may be more acute under adverse market conditions, during which the Fund may be |
| | | most in need of liquidating its derivative positions. Derivatives may also be harder to value, less tax efficient and subject to changing government regulation that could impact the Fund’s ability to use certain derivatives or their cost. Also, derivatives used for hedging or to gain or limit exposure to a particular market segment may not provide the expected benefits, particularly during adverse market conditions. These risks are greater for the Fund than mutual funds that do not use derivative instruments or that use derivative instruments to a lesser extent than the Fund to implement their investment strategies. |
| ∎ | | Emerging markets securities risk. Emerging markets (also referred to as developing markets) are generally subject to greater market volatility, political, social and economic instability, uncertain trading markets and more governmental limitations on foreign investment than more developed markets. In addition, companies operating in emerging markets may be subject to lower trading volume and greater price fluctuations than companies in more developed markets. Securities law and the enforcement of systems of taxation in many emerging market countries may change quickly and unpredictably. In addition, investments in emerging markets securities may also be subject to additional transaction costs, delays in settlement procedures, and lack of timely information. |
| ∎ | | Exchange-traded funds risk. In addition to the risks associated with the underlying assets held by the exchange-traded fund, investments in exchange-traded funds are subject to the following additional risks: (1) an exchange-traded fund’s shares may trade above or below its net asset value; (2) an active trading market for the exchange-traded fund’s shares may not develop or be maintained; (3) trading an exchange-traded fund’s shares may be halted by the listing exchange; (4) a passively managed exchange-traded fund may not track the performance of the reference asset; and (5) a passively managed exchange-traded fund may hold troubled securities. Investment in exchange-traded funds may involve |
| | | duplication of management fees and certain other expenses, as the Fund indirectly bears its proportionate share of any expenses paid by the exchange-traded funds in which it invests. Further, certain exchange-traded funds in which the Fund may invest are leveraged, which may result in economic leverage, permitting the Fund to gain exposure that is greater than would be the case in an unlevered instrument and potentially resulting in greater volatility. |
| ∎ | | Foreign currency tax risk. If the US Treasury Department were to exercise its authority to issue regulations that exclude from the definition of “qualifying income” foreign currency gains not directly related to the Fund’s business of investing in securities, the Fund may be unable to qualify as a regulated investment company for one or more years. In this event, the Fund’s Board of Trustees may authorize a significant change in investment strategy or other action. |
| ∎ | | Foreign government debt risk. Investments in foreign government debt securities (sometimes referred to as sovereign debt securities) involve certain risks in addition to those relating to foreign securities or debt securities generally. The issuer of the debt or the governmental authorities that control the repayment of the debt may be unable or unwilling to repay principal or interest when due in accordance with the terms of such debt, and the Fund may have limited recourse in the event of a default against the defaulting government. Without the approval of debt holders, some governmental debtors have in the past been able to reschedule or restructure their debt payments or declare moratoria on payments. |
| ∎ | | Foreign securities risk. The Fund’s foreign investments may be adversely affected by political and social instability, changes in economic or taxation policies, difficulty in enforcing obligations, decreased liquidity or increased volatility. Foreign investments also involve the risk of the possible seizure, nationalization or expropriation of the issuer or foreign deposits (in which the Fund could lose its entire investments in a certain market) and the possible adoption of foreign governmental restrictions |
continued on page 10
9 Invesco Multi-Asset Income Fund
continued from page 9
such as exchange controls. Unless the Fund has hedged its foreign securities risk, foreign securities risk also involves the risk of negative foreign currency rate fluctuations, which may cause the value of securities denominated in such foreign currency (or other instruments through which the Fund has exposure to foreign currencies) to decline in value. Currency exchange rates may fluctuate significantly over short periods of time. Currency hedging strategies, if used, are not always successful.
| ∎ | | High yield debt securities (junk bond) risk. Investments in high yield debt securities (“junk bonds”) and other lower-rated securities will subject the Fund to substantial risk of loss. These securities are considered to be speculative with respect to the issuer’s ability to pay interest and principal when due, are more susceptible to default or decline in market value and are less liquid than investment grade debt securities. Prices of high yield debt securities tend to be very volatile. |
| ∎ | | Indexing risk. Certain portions of the Fund’s assets are managed pursuant to an indexing approach (Indexed Assets) and, therefore, the adverse performance of a particular security necessarily will not result in the elimination of the security from the Indexed Assets. Ordinarily, the Adviser will not sell portfolio securities of the Indexed Assets except to reflect additions or deletions of the securities that comprise the index the Fund seeks to track with respect to the Indexed Assets (Underlying Index), or as may be necessary to raise cash to pay Fund shareholders who sell Fund shares. As such, the Indexed Assets, and therefore the Fund, will be negatively affected by declines in the securities represented by the Underlying Index. Also, there is no guarantee that the Adviser will be able to correlate the performance of the Indexed Assets with that of the Underlying Index. |
| ∎ | | Investment companies risk. Investing in other investment companies could result in the duplication of certain fees, including management and administrative fees, and may expose the Fund to the risks of owning the underlying investments that the other investment company holds. |
| ∎ | | Liquidity risk. The Fund may be unable to sell illiquid investments at the time or price it desires and, as a result, could lose its entire investment in such |
| | investments. Liquid securities can become illiquid during periods of market stress. If a significant amount of the Fund’s securities become illiquid, the Fund may not be able to timely pay redemption proceeds and may need to sell securities at significantly reduced prices. |
| ∎ | | Management risk. The Fund is actively managed and depends heavily on the Adviser’s and/or sub-adviser’s judgment about markets, interest rates or the attractiveness, relative values, liquidity, or potential appreciation of particular investments made for the Fund’s portfolio. The Fund could experience losses if these judgments prove to be incorrect. Because the Fund’s investment process relies heavily on its asset allocation process, market movements that are counter to the portfolio managers’ expectations may have a significant adverse effect on the Fund’s net asset value. In addition, the Fund is subject to the risk that the investment decisions made by the Adviser or a sub-adviser may conflict with other decisions made by the Adviser or the same or a different sub-adviser. For example, it is possible that the Adviser may purchase a security for the Fund at the same time that a sub-adviser sells the same security, resulting in higher expenses without accomplishing any net investment result and, possibly, resulting in a wash sale for tax purposes, which would defer the ability of the Fund to utilize any realized loss. Conflicting investment decisions made by the Adviser, a sub-adviser or some combination thereof (including decisions made by different teams in the Adviser or the same sub-adviser) also could subject the Fund to other special tax rules that may, for example, defer or disallow the ability of the Fund to utilize realized losses. Additionally, legislative, regulatory, or tax developments may affect the investments or investment strategies available to the portfolio managers in connection with managing the Fund, which may also adversely affect the ability of the Fund to achieve its investment objective. |
| ∎ | | Market risk. The market values of the Fund’s investments, and therefore the value of the Fund’s shares, will go up and down, sometimes rapidly or unpredictably. Market risk may affect a single issuer, industry or section of the economy, or it may affect the market as a whole. Individual stock prices tend to go up and down more dramatically |
than those of certain other types of investments, such as bonds. During a general downturn in the financial markets, multiple asset classes may decline in value. When markets perform well, there can be no assurance that specific investments held by the Fund will rise in value.
| ∎ | | MLP risk. The Fund invests in securities of MLPs, which are subject to the following risks: |
| | - | Limited partner risk. An MLP is a public limited partnership or limited liability company taxed as a partnership under the Internal Revenue Code of 1986, as amended (the “Internal Revenue Code”). Although the characteristics of MLPs closely resemble a traditional limited partnership, a major difference is that MLPs may trade on a public exchange or in the over-the-counter market. The risks of investing in an MLP are similar to those of investing in a partnership, including more flexible governance structures, which could result in less protection for investors than investments in a corporation. Investors in an MLP normally would not be liable for the debts of the MLP beyond the amount that the investor has contributed but investors may not be shielded to the same extent that a shareholder of a corporation would be. In certain circumstances, creditors of an MLP would have the right to seek return of capital distributed to a limited partner, which right would continue after an investor sold its investment in the MLP. |
| | - | Liquidity risk. The ability to trade on a public exchange or in the over-the-counter market provides a certain amount of liquidity not found in many limited partnership investments. However, MLP interests may be less liquid than conventional publicly traded securities and, therefore, more difficult to trade at desirable times and/or prices. |
| | - | Interest rate risk. In addition, MLP distributions may be reduced by fees and other expenses incurred by the MLP. MLPs generally are considered interest-rate sensitive investments. During periods of interest rate volatility, these investments may not provide attractive returns. |
| | - | General partner risk. The holder of the general partner or managing member interest can be liable in certain circumstances for amounts |
10 Invesco Multi-Asset Income Fund
| | greater than the amount of the holder’s investment in the general partner or managing member. Additionally, if the Fund were to invest more than 25% of its total assets in MLPs that are taxed as partnerships this could cause the Fund to lose its status as a regulated investment company under Subchapter M of the Internal Revenue Code. |
| ∎ | | MLP tax risk. MLPs taxed as partnerships do not pay US federal income tax at the partnership level. A change in current tax law, or a change in the underlying business mix of a given MLP, however, could result in an MLP being classified as a corporation for US federal income tax purposes, which would have the effect of reducing the amount of cash available for distribution by the MLP and, as a result, could cause a reduction of the value of the Fund’s investment, and consequently your investment in the Fund and lower income. Each year, the Fund will send you an annual tax statement (Form 1099) to assist you in completing your federal, state and local tax returns. If an MLP in which the Fund invests amends its partnership tax return, the Fund will, when necessary, send you a corrected Form 1099, which could, in turn, require you to amend your federal, state or local tax returns. |
| ∎ | | Mortgage- and asset-backed securities risk. Mortgage- and asset-backed securities, including collateralized debt obligations and collateralized mortgage obligations, are subject to prepayment or call risk, which is the risk that a borrower’s payments may be received earlier or later than expected due to changes in prepayment rates on underlying loans. This could result in the Fund reinvesting these early payments at lower interest rates, thereby reducing the Fund’s income. Mortgage- and asset-backed securities also are subject to extension risk, which is the risk that an unexpected rise in interest rates could reduce the rate of prepayments, causing the price of the mortgage- and asset-backed securities and the Fund’s share price to fall. An unexpectedly high rate of defaults on the mortgages held by a mortgage pool may adversely affect the value of mortgage-backed securities and could result in losses to the Fund. The Fund may invest in mortgage pools that include subprime mortgages, which are loans made to borrowers with weakened credit histories or with lower capacity to make timely payments on their mortgages. Privately issued mortgage-related securities are |
| | | not subject to the same underwriting requirements as those with government or government-sponsored entity guarantees and, therefore, mortgage loans underlying privately issued mortgage-related securities may have less favorable collateral, credit risk or other underwriting characteristics, and wider variances in interest rate, term, size, purpose and borrower characteristics. |
| ∎ | | Non-correlation risk. The return of the Fund’s assets managed pursuant to an indexing approach (Indexed Assets) may not match the return of the index the Fund seeks to track with respect to the Indexed Assets (Underlying Index) for a number of reasons. For example, the Fund incurs operating expenses not applicable to the Underlying Index, and incurs costs in buying and selling securities, especially when rebalancing securities holdings to reflect changes in the Underlying Index. In addition, the performance of the Indexed Assets and the Underlying Index may vary due to asset valuation differences and differences between the Indexed Assets and the Underlying Index resulting from legal restrictions, costs or liquidity constraints. |
| ∎ | | Preferred securities risk. Preferred securities are subject to issuer-specific and market risks applicable generally to equity securities. Preferred securities also may be subordinated to bonds or other debt instruments, subjecting them to a greater risk of non-payment, may be less liquid than many other securities, such as common stocks, and generally offer no voting rights with respect to the issuer. |
| ∎ | | REIT risk/real estate risk. Investments in real estate related instruments may be affected by economic, legal, cultural, environmental or technological factors that affect property values, rents or occupancies of real estate related to the Fund’s holdings. Shares of real estate related companies, which tend to be small- and mid-cap companies, may be more volatile and less liquid. |
| ∎ | | Sampling risk. The Fund’s use of a sampling methodology with respect to assets managed pursuant to an indexing approach (Indexed Assets) may result in the Indexed Assets including a smaller number of securities than are in the index the Fund seeks to track with respect to the Indexed Assets (Underlying Index), and in the Indexed Assets including securities that are not included in the Underlying Index. As a result, an adverse development to an |
| | | issuer of securities included in the Indexed Assets could result in a greater decline in the Fund’s NAV than would be the case if all of the securities in the Underlying Index were included in the Indexed Assets. The Fund’s use of a sampling methodology may also include the risk that the Indexed Assets may not track the return of the Underlying Index as well as they would have if the Indexed Assets included all of the securities in the Underlying Index. To the extent the assets in the Indexed Assets are smaller, these risks will be greater. |
| ∎ | | Short position risk. Because the Fund’s potential loss on a short position arises from increases in the value of the asset sold short, the Fund will incur a loss on a short position, which is theoretically unlimited, if the price of the asset sold short increases from the short sale price. The counterparty to a short position or other market factors may prevent the Fund from closing out a short position at a desirable time or price and may reduce or eliminate any gain or result in a loss. In a rising market, the Fund’s short positions will cause the Fund to underperform the overall market and its peers that do not engage in shorting. If the Fund holds both long and short positions, and both positions decline simultaneously, the short positions will not provide any buffer (hedge) from declines in value of the Fund’s long positions. Certain types of short positions involve leverage, which may exaggerate any losses, potentially more than the actual cost of the investment, and will increase the volatility of the Fund’s returns. |
| ∎ | | Subsidiary risk. By investing in the Subsidiary, the Fund is indirectly exposed to risks associated with the Subsidiary’s investments. The Subsidiary is not registered under the Investment Company Act of 1940, as amended (1940 Act), and, except as otherwise noted in the prospectus, is not subject to the investor protections of the 1940 Act. Changes in the laws of the United States and/or the Cayman Islands, under which the Fund and the Subsidiary, respectively, are organized, could result in the inability of the Fund and/or the Subsidiary to operate as described in the prospectus and the SAI, and could negatively affect the Fund and its shareholders. |
| ∎ | | US government obligations risk. Obligations of US government agencies and authorities receive varying levels of support and may not be backed by the full faith and credit of the US government, |
continued on page 12
11 Invesco Multi-Asset Income Fund
continued from page 11
| | which could affect the Fund’s ability to recover should they default. No assurance can be given that the US government will provide financial support to its agencies and authorities if it is not obligated by law to do so. |
About indexes used in this report
| ∎ | | The Bloomberg Barclays U.S. Aggregate Index is an unmanaged index considered representative of the US investment-grade, fixed-rate bond market. |
| ∎ | | The Custom Invesco Multi-Asset Income Index, created by Invesco to serve as a benchmark for Invesco Multi-Asset Income Fund, comprises the following indexes: S&P 500 (50%) and Bloomberg Barclays U.S. Universal (50%). |
| ∎ | | The Lipper Mixed-Asset Target Allocation Conservative Funds Index is an unmanaged index considered representative of mixed-asset target allocation conservative funds tracked by Lipper. |
| ∎ | | The S&P 500® Index is an unmanaged index considered representative of the US stock market. |
| ∎ | | The Bloomberg Barclays U.S. Universal Index is an unmanaged index comprising US dollar-denominated, taxable bonds that are rated investment grade or below investment grade. |
| ∎ | | The Fund is not managed to track the performance of any particular index, including the index(es) described here, and consequently, the performance of the Fund may deviate significantly from the performance of the index(es). |
| ∎ | | A direct investment cannot be made in an index. Unless otherwise indicated, index results include reinvested dividends, and they do not reflect sales charges. Performance of the peer group, if applicable, reflects fund expenses; performance of a market index does not. |
Other information
| ∎ | | The returns shown in management’s discussion of Fund performance are based on net asset values (NAVs) calculated for shareholder transactions. Generally accepted accounting principles require adjustments to be made to the net assets of the Fund at period end for financial reporting purposes, and as such, the NAVs for shareholder transactions and the returns based on those NAVs may differ from the NAVs and returns reported in the Financial Highlights. |
12 Invesco Multi-Asset Income Fund
Schedule of Investments(a)
October 31, 2016
| | | | | | | | |
| | | Principal
Amount | | | Value | |
U.S. Dollar Denominated Bonds and Notes–39.92% | |
| Aerospace & Defense–0.51% | |
Bombardier Inc. (Canada), Sr. Unsec. Notes, 6.00%, 10/15/2022(b) | | $ | 90,000 | | | $ | 79,988 | |
DigitalGlobe Inc., Sr. Unsec. Gtd. Notes, 5.25%, 02/01/2021(b) | | | 107,000 | | | | 108,070 | |
KLX Inc., Sr. Unsec. Gtd. Notes,
5.88%, 12/01/2022(b) | | | 240,000 | | | | 244,800 | |
Moog Inc., Sr. Unsec. Gtd. Notes,
5.25%, 12/01/2022(b) | | | 130,000 | | | | 134,062 | |
TransDigm Inc., Sr. Unsec. Gtd. Sub. Global Notes, 6.50%, 05/15/2025 | | | 414,000 | | | | 434,700 | |
| | | | | | | | 1,001,620 | |
|
| Agricultural & Farm Machinery–0.10% | |
Titan International Inc., Sr. Sec. Gtd. First Lien Global Notes,
6.88%, 10/01/2020 | | | 196,000 | | | | 187,915 | |
|
| Alternative Carriers–0.26% | |
EarthLink Holdings Corp., Sr. Sec. Gtd. First Lien Global Notes,
7.38%, 06/01/2020 | | | 255,000 | | | | 268,387 | |
Level 3 Financing, Inc., | | | | | | | | |
Sr. Unsec. Gtd. Global Notes,
5.38%, 05/01/2025 | | | 140,000 | | | | 143,675 | |
Sr. Unsec. Gtd. Notes,
5.25%, 03/15/2026(b) | | | 94,000 | | | | 95,645 | |
| | | | | | | 507,707 | |
|
| Aluminum–0.33% | |
Alcoa Nederland B.V., Sr. Unsec. Gtd. Notes, 6.75%, 09/30/2024(b) | | | 400,000 | | | | 415,354 | |
Novelis Corp., Sr. Unsec. Gtd. Notes, 5.88%, 09/30/2026(b) | | | 231,000 | | | | 235,042 | |
| | | | | | | | 650,396 | |
|
| Apparel Retail–0.17% | |
Hot Topic, Inc., Sr. Sec. Gtd. First Lien Notes, 9.25%, 06/15/2021(b) | | | 184,000 | | | | 195,960 | |
Men’s Wearhouse, Inc. (The), Sr. Unsec. Gtd. Global Notes, 7.00%, 07/01/2022 | | | 155,000 | | | | 144,344 | |
| | | | | | | | 340,304 | |
|
| Asset Management & Custody Banks–0.71% | |
CommScope Technologies Finance LLC, Sr. Unsec. Notes,
6.00%, 06/15/2025(b) | | | 230,000 | | | | 242,650 | |
First Data Corp., | | | | | | | | |
Sr. Sec. Gtd. First Lien Notes, | | | | | | | | |
5.00%, 01/15/2024(b) | | | 60,000 | | | | 60,825 | |
Sr. Unsec. Gtd. Notes, | | | | | | | | |
7.00%, 12/01/2023(b) | | | 750,000 | | | | 787,500 | |
Prime Security Services Borrower, LLC/Prime Finance, Inc., Sec. Gtd. Second Lien Notes, 9.25%, 05/15/2023(b) | | | 227,000 | | | | 241,471 | |
| | | | | | | | |
| | | Principal
Amount | | | Value | |
| Asset Management & Custody Banks–(continued) | |
RegionalCare Hospital Partners Holdings Inc., Sr. Sec. Gtd. First Lien Notes, 8.25%, 05/01/2023(b) | | $ | 56,000 | | | $ | 57,050 | |
| | | | | | | | 1,389,496 | |
|
| Auto Parts & Equipment–0.04% | |
Dana Inc., Sr. Unsec. Notes, 5.38%, 09/15/2021 | | | 67,000 | | | | 69,680 | |
|
| Broadcasting–0.63% | |
Clear Channel Worldwide Holdings, Inc., | | | | | | | | |
Series B, Sr. Unsec. Gtd. Global Notes, | | | | | | | | |
6.50%, 11/15/2022 | | | 135,000 | | | | 138,375 | |
Sr. Unsec. Gtd. Sub. Global Notes, | | | | | | | | |
7.63%, 03/15/2020 | | | 220,000 | | | | 213,400 | |
iHeartCommunications, Inc., Sr. Sec. Gtd. First Lien Global Notes, 9.00%, 12/15/2019 | | | 349,000 | | | | 266,549 | |
Netflix, Inc., Sr. Unsec. Global Notes, 5.75%, 03/01/2024 | | | 163,000 | | | | 177,670 | |
Nexstar Escrow Corp., Sr. Unsec. Gtd. Notes, 5.63%, 08/01/2024(b) | | | 142,000 | | | | 141,645 | |
Sirius XM Radio Inc., Sr. Unsec. Gtd. Notes, 5.38%, 07/15/2026(b) | | | 168,000 | | | | 171,360 | |
Tribune Media Co., Sr. Unsec. Gtd. Global Notes, 5.88%, 07/15/2022 | | | 140,000 | | | | 140,000 | |
| | | | | | | | 1,248,999 | |
|
| Building Products–0.19% | |
Allegion PLC, Sr. Unsec. Gtd. Notes, 5.88%, 09/15/2023 | | | 172,000 | | | | 185,061 | |
Gibraltar Industries Inc., Sr. Unsec. Gtd. Sub. Global Notes,
6.25%, 02/01/2021 | | | 191,000 | | | | 198,640 | |
| | | | | | | | 383,701 | |
|
| Cable & Satellite–2.27% | |
Altice Luxembourg S.A. (Luxembourg), Sr. Unsec. Gtd. Notes, 7.75%, 05/15/2022(b) | | | 600,000 | | | | 630,750 | |
AMC Networks Inc., Sr. Unsec. Gtd. Global Notes, 5.00%, 04/01/2024 | | | 215,000 | | | | 219,837 | |
CCO Holdings LLC/CCO Holdings Capital Corp., Sr. Unsec. Notes, 5.75%, 02/15/2026(b) | | | 860,000 | | | | 903,000 | |
CSC Holdings LLC, | | | | | | | | |
Sr. Unsec. Global Notes, | | | | | | | | |
6.75%, 11/15/2021 | | | 175,000 | | | | 185,062 | |
Sr. Unsec. Gtd. Notes, | | | | | | | | |
6.63%, 10/15/2025(b) | | | 200,000 | | | | 217,500 | |
Sr. Unsec. Notes, | | | | | | | | |
10.13%, 01/15/2023(b) | | | 200,000 | | | | 226,500 | |
10.88%, 10/15/2025(b) | | | 226,000 | | | | 261,030 | |
DISH DBS Corp., Sr. Unsec. Gtd. Global Notes, 5.88%, 11/15/2024 | | | 627,000 | | | | 634,837 | |
See accompanying Notes to Financial Statements which are an integral part of the financial statements.
13 Invesco Multi-Asset Income Fund
| | | | | | | | |
| | | Principal
Amount | | | Value | |
| Cable & Satellite–(continued) | |
Intelsat Jackson Holdings S.A. (Luxembourg), Sr. Unsec. Gtd. Global Notes, | | | | | | | | |
7.25%, 04/01/2019 | | $ | 64,000 | | | $ | 51,360 | |
7.25%, 10/15/2020 | | | 140,000 | | | | 105,700 | |
SFR Group S.A. (France), | | | | | | | | |
Sr. Sec. Gtd. First Lien Bonds, | | | | | | | | |
6.00%, 05/15/2022(b) | | | 400,000 | | | | 410,000 | |
Sr. Sec. Gtd. First Lien Notes, | | | | | | | | |
7.38%, 05/01/2026(b) | | | 200,000 | | | | 202,750 | |
Unitymedia Hessen GmbH & Co. KG/Unitymedia NRW GmbH (Germany), REGS, Sr. Sec. Gtd. First Lien Euro Bonds,
5.00%, 01/15/2025(b) | | | 200,000 | | | | 203,750 | |
VTR Finance B.V. (Chile), Sr. Sec. First Lien Notes, 6.88%, 01/15/2024(b) | | | 200,000 | | | | 208,500 | |
| | | | | | | | 4,460,576 | |
|
| Casinos & Gaming–0.54% | |
Boyd Gaming Corp., | | | | | | | | |
Sr. Unsec. Gtd. Global Notes, | | | | | | | | |
6.88%, 05/15/2023 | | | 220,000 | | | | 236,500 | |
Sr. Unsec. Gtd. Notes, | | | | | | | | |
6.38%, 04/01/2026(b) | | | 148,000 | | | | 159,100 | |
MGM Resorts International, | | | | | | | | |
Sr. Unsec. Gtd. Global Notes, | | | | | | | | |
6.63%, 12/15/2021 | | | 45,000 | | | | 50,513 | |
Sr. Unsec. Gtd. Notes, | | | | | | | | |
4.63%, 09/01/2026 | | | 69,000 | | | | 66,757 | |
6.00%, 03/15/2023 | | | 230,000 | | | | 250,125 | |
7.75%, 03/15/2022 | | | 188,000 | | | | 218,550 | |
Wynn Las Vegas LLC/Wynn Las Vegas Capital Corp., Sr. Unsec. Gtd. Notes, 5.50%, 03/01/2025(b) | | | 80,000 | | | | 80,800 | |
| | | | | | | | 1,062,345 | |
|
| Commercial Printing–0.19% | |
Multi-Color Corp., Sr. Unsec. Gtd. Notes, 6.13%, 12/01/2022(b) | | | 364,000 | | | | 382,200 | |
|
| Commodity Chemicals–0.07% | |
Koppers Inc., Sr. Unsec. Gtd. Global Notes, 7.88%, 12/01/2019 | | | 113,000 | | | | 114,695 | |
Valvoline Inc., Sr. Unsec. Gtd. Notes, 5.50%, 07/15/2024(b) | | | 23,000 | | | | 24,323 | |
| | | | | | | | 139,018 | |
|
| Communications Equipment–0.15% | |
Hughes Satellite Systems Corp., | | | | | | | | |
Sr. Sec. Gtd. First Lien Notes, | | | | | | | | |
5.25%, 08/01/2026(b) | | | 136,000 | | | | 134,640 | |
Sr. Unsec. Gtd. Global Notes, | | | | | | | | |
7.63%, 06/15/2021 | | | 142,000 | | | | 156,200 | |
| | | | | | | | 290,840 | |
|
| Construction Machinery & Heavy Trucks–0.54% | |
Allied Specialty Vehicles, Inc., Sr. Sec. Notes, 8.50%, 11/01/2019(b) | | | 159,000 | | | | 162,776 | |
| | | | | | | | |
| | | Principal
Amount | | | Value | |
| Construction Machinery & Heavy Trucks–(continued) | |
Commercial Vehicle Group Inc., Sec. Gtd. Second Lien Global Notes, 7.88%, 04/15/2019 | | $ | 213,000 | | | $ | 211,402 | |
Meritor Inc., Sr. Unsec. Gtd. Notes, | | | | | | | | |
6.25%, 02/15/2024 | | | 13,000 | | | | 12,903 | |
6.75%, 06/15/2021 | | | 160,000 | | | | 163,600 | |
Navistar International Corp., Sr. Unsec. Gtd. Notes, 8.25%, 11/01/2021 | | | 149,000 | | | | 146,393 | |
Oshkosh Corp., Sr. Unsec. Gtd. Global Notes, | | | | | | | | |
5.38%, 03/01/2022 | | | 164,000 | | | | 172,405 | |
5.38%, 03/01/2025 | | | 180,000 | | | | 188,775 | |
| | | | | | | | 1,058,254 | |
|
| Consumer Finance–0.45% | |
Ally Financial Inc., Sr. Unsec. Global Notes, | | | | | | | | |
4.63%, 03/30/2025 | | | 250,000 | | | | 255,625 | |
5.13%, 09/30/2024 | | | 593,000 | | | | 625,615 | |
| | | | | | | | 881,240 | |
|
| Copper–0.23% | |
First Quantum Minerals Ltd. (Canada), Sr. Unsec. Gtd. Notes, 6.75%, 02/15/2020(b) | | | 135,000 | | | | 130,444 | |
Freeport-McMoRan Inc., Sr. Unsec. Gtd. Global Notes, 5.40%, 11/14/2034 | | | 140,000 | | | | 121,275 | |
Lundin Mining Corp. (Canada), Sr. Sec. Gtd. First Lien Notes, 7.88%, 11/01/2022(b) | | | 184,000 | | | | 199,640 | |
| | | | | | | | 451,359 | |
|
| Department Stores–0.03% | |
Pinnacle Foods Finance LLC / Corp., Sr. Unsec. Gtd. Global Notes, 5.88%, 01/15/2024 | | | 61,000 | | | | 66,109 | |
|
| Diversified Banks–0.28% | |
Citigroup Inc., Series T, Jr. Unsec. Sub. Global Notes, 6.25%(c) | | | 169,000 | | | | 182,309 | |
Dresdner Funding Trust I (Germany), REGS, Jr. Unsec. Sub. Euro Notes, 8.15%, 06/30/2031(b) | | | 100,000 | | | | 119,209 | |
Royal Bank of Scotland Group PLC (The) (United Kingdom), Unsec. Sub. Global Bonds, | | | | | | | | |
5.13%, 05/28/2024 | | | 100,000 | | | | 99,353 | |
6.13%, 12/15/2022 | | | 145,000 | | | | 153,876 | |
| | | | | | | | 554,747 | |
|
| Diversified Chemicals–0.31% | |
Chemours Co. (The), Sr. Unsec. Gtd. Global Notes, 6.63%, 05/15/2023 | | | 416,000 | | | | 407,680 | |
Consolidated Energy Finance S.A. (Trinidad), Sr. Unsec. Gtd. Notes, 6.75%, 10/15/2019(b) | | | 200,000 | | | | 199,500 | |
| | | | | | | | 607,180 | |
See accompanying Notes to Financial Statements which are an integral part of the financial statements.
14 Invesco Multi-Asset Income Fund
| | | | | | | | |
| | | Principal
Amount | | | Value | |
| Diversified Metals & Mining–0.42% | |
Teck Resources Ltd. (Canada), | | | | | | | | |
Sr. Unsec. Gtd. Global Notes, | | | | | | | | |
4.75%, 01/15/2022 | | $ | 429,000 | | | $ | 429,536 | |
Sr. Unsec. Gtd. Notes, | | | | | | | | |
4.50%, 01/15/2021 | | | 154,000 | | | | 155,155 | |
8.50%, 06/01/2024(b) | | | 96,000 | | | | 111,480 | |
Sr. Unsec. Notes, | | | | | | | | |
6.13%, 10/01/2035 | | | 130,000 | | | | 129,350 | |
| | | | | | | | 825,521 | |
|
| Electrical Components & Equipment–0.26% | |
EnerSys, Sr. Unsec. Gtd. Notes, 5.00%, 04/30/2023(b) | | | 269,000 | | | | 275,725 | |
Sensata Technologies B.V., Sr. Unsec. Gtd. Notes, | | | | | | | | |
4.88%, 10/15/2023(b) | | | 99,000 | | | | 103,455 | |
5.00%, 10/01/2025(b) | | | 134,000 | | | | 138,690 | |
| | | | | | | | 517,870 | |
|
| Environmental & Facilities Services–0.06% | |
Advanced Disposal Services, Inc., Sr. Unsec. Notes, 5.63%, 11/15/2024(b) | | | 112,000 | | | | 112,560 | |
|
| Financial Exchanges & Data–0.13% | |
MSCI Inc., Sr. Unsec. Gtd. Notes, 5.25%, 11/15/2024(b) | | | 250,000 | | | | 263,750 | |
|
| Food Distributors–0.07% | |
US Foods, Inc., Sr. Unsec. Gtd. Notes, 5.88%, 06/15/2024(b) | | | 132,000 | | | | 138,930 | |
|
| Forest Products–0.07% | |
Norbord Inc. (Canada), Sr. Sec. Gtd. First Lien Notes, 6.25%, 04/15/2023(b) | | | 125,000 | | | | 133,750 | |
|
| Gas Utilities–0.45% | |
AmeriGas Partners, L.P./AmeriGas Finance Corp., Sr. Unsec. Global Notes, | | | | | | | | |
5.63%, 05/20/2024 | | | 134,000 | | | | 141,035 | |
5.88%, 08/20/2026 | | | 60,000 | | | | 62,700 | |
Ferrellgas L.P./Ferrellgas Finance Corp., Sr. Unsec. Global Notes, 6.50%, 05/01/2021 | | | 295,000 | | | | 280,250 | |
Suburban Propane Partners, L.P./Suburban Energy Finance Corp., | | | | | | | | |
Sr. Unsec. Global Notes, | | | | | | | | |
5.50%, 06/01/2024 | | | 340,000 | | | | 350,200 | |
7.38%, 08/01/2021 | | | 44,000 | | | | 45,980 | |
| | | | | | | | 880,165 | |
|
| General Merchandise Stores–0.09% | |
Dollar Tree, Inc., Sr. Unsec. Gtd. Global Notes, 5.75%, 03/01/2023 | | | 170,000 | | | | 181,475 | |
|
| Health Care Facilities–1.23% | |
Acadia Healthcare Co., Inc., Sr. Unsec. Gtd. Global Notes, 6.50%, 03/01/2024 | | | 110,000 | | | | 113,850 | |
| | | | | | | | |
| | | Principal
Amount | | | Value | |
| Health Care Facilities–(continued) | |
Community Health Systems, Inc., | | | | | | | | |
Sr. Sec. Gtd. First Lien Global Notes, | | | | | | | | |
5.13%, 08/01/2021 | | $ | 55,000 | | | $ | 51,562 | |
Sr. Unsec. Gtd. Global Notes, | | | | | | | | |
6.88%, 02/01/2022 | | | 146,470 | | | | 110,219 | |
HCA, Inc., | | | | | | | | |
Sr. Sec. Gtd. First Lien Notes, | | | | | | | | |
5.25%, 04/15/2025 | | | 190,000 | | | | 200,569 | |
Sr. Unsec. Gtd. Global Notes, | | | | | | | | |
5.88%, 05/01/2023 | | | 45,000 | | | | 47,925 | |
7.50%, 02/15/2022 | | | 116,000 | | | | 132,675 | |
Sr. Unsec. Gtd. Notes, | | | | | | | | |
5.38%, 02/01/2025 | | | 120,000 | | | | 123,300 | |
5.88%, 02/15/2026 | | | 465,000 | | | | 491,737 | |
HealthSouth Corp., Sr. Unsec. Gtd. Global Notes, 5.75%, 09/15/2025 | | | 80,000 | | | | 83,200 | |
LifePoint Health, Inc., Sr. Unsec. Gtd. Notes, | | | | | | | | |
5.38%, 05/01/2024(b) | | | 80,000 | | | | 80,000 | |
5.88%, 12/01/2023 | | | 23,000 | | | | 23,633 | |
Surgical Care Affiliates, Inc., Sr. Unsec. Gtd. Notes, 6.00%, 04/01/2023(b) | | | 310,000 | | | | 324,725 | |
Tenet Healthcare Corp., Sr. Unsec. Global Notes, | | | | | | | | |
6.75%, 06/15/2023 | | | 141,000 | | | | 130,425 | |
8.00%, 08/01/2020 | | | 74,000 | | | | 74,000 | |
8.13%, 04/01/2022 | | | 395,000 | | | | 388,087 | |
Universal Health Services, Inc, Sr. Sec. Gtd. First Lien Notes, 5.00%, 06/01/2026(b) | | | 36,000 | | | | 37,125 | |
| | | | | | | | 2,413,032 | |
|
| Health Care Services–0.33% | |
AMN Healthcare Services, Inc., Sr. Unsec. Gtd. Notes,
5.13%, 10/01/2024(b) | | | 110,000 | | | | 112,200 | |
DaVita Inc., Sr. Unsec. Gtd. Global Notes, 5.00%, 05/01/2025 | | | 165,000 | | | | 159,844 | |
MEDNAX, Inc., Sr. Unsec. Gtd. Notes, 5.25%, 12/01/2023(b) | | | 191,000 | | | | 200,550 | |
MPH Acquisition Holdings LLC, Sr. Unsec. Notes, 7.13%, 06/01/2024(b) | | | 167,000 | | | | 179,525 | |
| | | | | | | | 652,119 | |
|
| Home Improvement Retail–0.10% | |
Hillman Group Inc. (The), Sr. Unsec. Gtd. Notes, 6.38%, 07/15/2022(b) | | | 205,000 | | | | 192,188 | |
|
| Homebuilding–0.23% | |
Ashton Woods USA LLC/Ashton Woods Finance Co., Sr. Unsec. Notes, 6.88%, 02/15/2021(b) | | | 112,000 | | | | 109,480 | |
K. Hovnanian Enterprises Inc., Sr. Sec. Gtd. First Lien Notes, 7.25%, 10/15/2020(b) | | | 61,000 | | | | 55,968 | |
KB Home, Sr. Unsec. Gtd. Notes, 7.50%, 09/15/2022 | | | 23,000 | | | | 25,128 | |
See accompanying Notes to Financial Statements which are an integral part of the financial statements.
15 Invesco Multi-Asset Income Fund
| | | | | | | | |
| | | Principal
Amount | | | Value | |
| Homebuilding–(continued) | |
Meritage Homes Corp., Sr. Unsec. Gtd. Global Notes, | | | | | | | | |
6.00%, 06/01/2025 | | $ | 85,000 | | | $ | 89,781 | |
7.15%, 04/15/2020 | | | 65,000 | | | | 72,637 | |
Taylor Morrison Communities Inc./ Monarch Communities Inc., Sr. Unsec. Gtd. Notes, 5.88%, 04/15/2023(b) | | | 104,000 | | | | 109,720 | |
| | | | | | | | 462,714 | |
|
| Household Products–0.29% | |
Reynolds Group Issuer Inc./LLC (New Zealand), | | | | | | | | |
Sr. Sec. Gtd. First Lien Notes, | | | | | | | | |
5.13%, 07/15/2023(b) | | | 41,000 | | | | 42,230 | |
Sr. Unsec. Gtd. Global Notes, | | | | | | | | |
8.25%, 02/15/2021 | | | 300,000 | | | | 314,250 | |
Sr. Unsec. Gtd. Notes, | | | | | | | | |
7.00%, 07/15/2024(b) | | | 13,000 | | | | 14,040 | |
Spectrum Brands, Inc., Sr. Unsec. Gtd. Global Notes, 5.75%, 07/15/2025 | | | 80,000 | | | | 87,000 | |
Springs Industries, Inc., Sr. Sec. Global Notes, 6.25%, 06/01/2021 | | | 106,000 | | | | 110,637 | |
| | | | | | | | 568,157 | |
|
| Independent Power Producers & Energy Traders–0.89% | |
AES Corp. (The), Sr. Unsec. Notes, | | | | | | | | |
5.50%, 04/15/2025 | | | 822,000 | | | | 834,330 | |
6.00%, 05/15/2026 | | | 10,000 | | | | 10,400 | |
Calpine Corp., Sr. Unsec. Global Notes, | | | | | | | | |
5.38%, 01/15/2023 | | | 364,000 | | | | 361,725 | |
5.50%, 02/01/2024 | | | 227,000 | | | | 220,190 | |
NRG Energy, Inc., Sr. Unsec. Gtd. Notes, 6.63%, 01/15/2027(b) | | | 336,000 | | | | 317,520 | |
| | | | | | | | 1,744,165 | |
|
| Integrated Oil & Gas–0.02% | |
California Resources Corp., Sec. Gtd. Second Lien Notes, 8.00%, 12/15/2022(b) | | | 68,000 | | | | 46,580 | |
|
| Integrated Telecommunication Services–1.42% | |
CenturyLink, Inc., Series Y, Sr. Unsec. Global Notes, 7.50%, 04/01/2024 | | | 216,000 | | | | 225,720 | |
Cincinnati Bell Inc., Sr. Unsec. Gtd. Notes, 7.00%, 07/15/2024(b) | | | 72,000 | | | | 75,600 | |
Communications Sales & Leasing, Inc./CSL Capital LLC, Sr. Sec. Gtd. First Lien Notes, 6.00%, 04/15/2023(b) | | | 15,000 | | | | 15,675 | |
Frontier Communications Corp., | | | | | | | | |
Sr. Unsec. Global Notes, | | | | | | | | |
8.88%, 09/15/2020 | | | 58,000 | | | | 61,988 | |
10.50%, 09/15/2022 | | | 380,000 | | | | 399,000 | |
GCI, Inc., Sr. Unsec. Global Notes, 6.88%, 04/15/2025 | | | 64,000 | | | | 64,960 | |
SBA Communications Corp., | | | | | | | | |
Sr. Unsec. Global Notes, | | | | | | | | |
4.88%, 07/15/2022 | | | 100,000 | | | | 102,000 | |
Sr. Unsec. Notes, | | | | | | | | |
4.88%, 09/01/2024(b) | | | 296,000 | | | | 297,850 | |
| | | | | | | | |
| | | Principal
Amount | | | Value | |
| Integrated Telecommunication Services–(continued) | |
T-Mobile USA, Inc., | | | | | | | | |
Sr. Unsec. Gtd. Global Bonds, | | | | | | | | |
6.50%, 01/15/2026 | | $ | 565,000 | | | $ | 622,206 | |
6.84%, 04/28/2023 | | | 173,000 | | | | 185,543 | |
Sr. Unsec. Gtd. Global Notes, | | | | | | | | |
6.38%, 03/01/2025 | | | 221,000 | | | | 238,127 | |
Sr. Unsec. Gtd. Notes, | | | | | | | | |
6.00%, 04/15/2024 | | | 34,000 | | | | 36,253 | |
Telecom Italia S.p.A. (Italy), Sr. Unsec. Notes, 5.30%, 05/30/2024(b) | | | 250,000 | | | | 254,687 | |
Virgin Media Finance PLC (United Kingdom), Sr. Unsec. Gtd. Notes, 6.00%, 10/15/2024(b) | | | 200,000 | | | | 207,500 | |
| | | | | | | | 2,787,109 | |
|
| Internet Software & Services–0.05% | |
Match Group, Inc., Sr. Unsec. Global Notes, 6.38%, 06/01/2024 | | | 92,000 | | | | 100,050 | |
|
| Leisure Products–0.15% | |
Vista Outdoor Inc., Sr. Unsec. Gtd. Global Notes, 5.88%, 10/01/2023 | | | 286,000 | | | | 301,730 | |
|
| Life Sciences Tools & Services–0.13% | |
Quintiles IMS Holdings, Inc., | | | | | | | | |
Sr. Unsec. Gtd. Notes, | | | | | | | | |
4.88%, 05/15/2023(b) | | | 38,000 | | | | 39,378 | |
5.00%, 10/15/2026(b) | | | 200,000 | | | | 207,750 | |
| | | | | | | | 247,128 | |
|
| Managed Health Care–0.11% | |
Centene Corp., Sr. Unsec. Notes, | | | | | | | | |
4.75%, 05/15/2022 | | | 53,000 | | | | 54,193 | |
4.75%, 01/15/2025 | | | 87,000 | | | | 87,217 | |
Molina Healthcare, Inc., Sr. Unsec. Gtd. Global Notes, 5.38%, 11/15/2022 | | | 65,000 | | | | 67,763 | |
| | | | | | | | 209,173 | |
|
| Marine–0.10% | |
Navios Maritime Acquisition Corp./Navios Acquisition Finance U.S. Inc., Sr. Sec. Gtd. First Lien Mortgage Notes, 8.13%, 11/15/2021 (Acquired 01/08/2015-07/16/2015; Cost $250,700)(b) | | | 255,000 | | | | 193,163 | |
|
| Metal & Glass Containers–0.16% | |
Berry Plastics Corp., | | | | | | | | |
Sec. Gtd. Second Lien Global Notes, | | | | | | | | |
6.00%, 10/15/2022 | | | 85,000 | | | | 90,844 | |
Sec. Gtd. Second Lien Notes, | | | | | | | | |
5.50%, 05/15/2022 | | | 15,000 | | | | 15,712 | |
Coveris Holdings S.A. (Luxembourg), Sr. Unsec. Gtd. Notes, 7.88%, 11/01/2019(b) | | | 200,000 | | | | 206,500 | |
| | | | | | | | 313,056 | |
|
| Movies & Entertainment–0.25% | |
AMC Entertainment Holdings, Inc., Sr. Unsec. Sub. Notes, 5.88%, 11/15/2026(b) | | | 29,000 | | | | 29,290 | |
See accompanying Notes to Financial Statements which are an integral part of the financial statements.
16 Invesco Multi-Asset Income Fund
| | | | | | | | |
| | | Principal
Amount | | | Value | |
| Movies & Entertainment–(continued) | |
AMC Entertainment Inc., Sr. Unsec. Gtd. Sub. Global Notes, 5.75%, 06/15/2025 | | $ | 100,000 | | | $ | 100,625 | |
LG FinanceCo Corp., Sr. Unsec. Notes, 5.88%, 11/01/2024(b) | | | 125,000 | | | | 126,562 | |
Pinnacle Entertainment, Inc., Sr. Unsec. Notes, 5.63%, 05/01/2024(b) | | | 240,000 | | | | 242,100 | |
| | | | | | | | 498,577 | |
|
| Oil & Gas Drilling–0.05% | |
Ensco PLC, Sr. Unsec. Global Notes, 4.50%, 10/01/2024 | | | 60,000 | | | | 48,300 | |
Precision Drilling Corp. (Canada), Sr. Unsec. Gtd. Global Notes, 5.25%, 11/15/2024 | | | 55,000 | | | | 48,675 | |
| | | | | | | | 96,975 | |
|
| Oil & Gas Equipment & Services–0.06% | |
SESI, L.L.C., Sr. Unsec. Gtd. Global Notes, 7.13%, 12/15/2021 | | | 59,000 | | | | 57,820 | |
Weatherford International Ltd., Sr. Unsec. Gtd. Notes, 6.50%, 08/01/2036 | | | 75,000 | | | | 59,625 | |
| | | | | | | | 117,445 | |
|
| Oil & Gas Exploration & Production–1.81% | |
Antero Resources Corp., Sr. Unsec. Gtd. Global Notes, | | | | | | | | |
5.38%, 11/01/2021 | | | 78,000 | | | | 79,170 | |
5.63%, 06/01/2023 | | | 286,000 | | | | 293,150 | |
Callon Petroleum Co., Sr. Unsec. Gtd. Notes, 6.13%, 10/01/2024(b) | | | 84,000 | | | | 86,940 | |
Concho Resources Inc., Sr. Unsec. Gtd. Global Notes,
5.50%, 10/01/2022 | | | 161,000 | | | | 165,830 | |
5.50%, 04/01/2023 | | | 73,000 | | | | 75,190 | |
Continental Resources Inc., Sr. Unsec. Gtd. Global Notes, 5.00%, 09/15/2022 | | | 255,000 | | | | 251,812 | |
Denbury Resources Inc., Sr. Unsec. Gtd. Sub. Notes, 5.50%, 05/01/2022 | | | 18,000 | | | | 14,130 | |
Gulfport Energy Corp., Sr. Unsec. Gtd. Notes, 6.00%, 10/15/2024(b) | | | 125,000 | | | | 127,500 | |
Newfield Exploration Co., Sr. Unsec. Global Notes, 5.63%, 07/01/2024 | | | 474,000 | | | | 495,330 | |
Oasis Petroleum Inc., | | | | | | | | |
Sr. Unsec. Gtd. Global Notes, 6.88%, 01/15/2023 | | | 127,000 | | | | 125,730 | |
Sr. Unsec. Gtd. Notes, | | | | | | | | |
6.50%, 11/01/2021 | | | 34,000 | | | | 33,830 | |
Parsley Energy LLC/Parsley Finance Corp., Sr. Unsec. Gtd. Notes, 6.25%, 06/01/2024(b) | | | 14,000 | | | | 14,805 | |
QEP Resources, Inc., Sr. Unsec. Notes, 6.88%, 03/01/2021 | | | 64,000 | | | | 67,680 | |
Range Resources Corp., | | | | | | | | |
Sr. Unsec. Gtd. Global Notes,
4.88%, 05/15/2025 | | | 150,000 | | | | 143,250 | |
Sr. Unsec. Gtd. Notes, | | | | | | | | |
5.00%, 03/15/2023(b) | | | 210,000 | | | | 206,850 | |
| | | | | | | | |
| | | Principal
Amount | | | Value | |
| Oil & Gas Exploration & Production–(continued) | |
Rice Energy Inc., Sr. Unsec. Gtd. Global Notes, 6.25%, 05/01/2022 | | $ | 337,000 | | | $ | 345,425 | |
RSP Permian, Inc., Sr. Unsec. Gtd. Global Notes, 6.63%, 10/01/2022 | | | 63,000 | | | | 66,780 | |
SM Energy Co., Sr. Unsec. Global Notes, | | | | | | | | |
6.13%, 11/15/2022 | | | 31,000 | | | | 31,078 | |
6.50%, 01/01/2023 | | | 55,000 | | | | 55,137 | |
Southwestern Energy Co., Sr. Unsec. Global Notes, 4.10%, 03/15/2022 | | | 402,000 | | | | 367,830 | |
Whiting Petroleum Corp., Sr. Unsec. Gtd. Global Notes, 6.25%, 04/01/2023 | | | 163,000 | | | | 150,775 | |
WPX Energy Inc., Sr. Unsec. Global Notes, 6.00%, 01/15/2022 | | | 368,000 | | | | 368,000 | |
| | | | | | | | 3,566,222 | |
|
| Oil & Gas Refining & Marketing–0.03% | |
Tesoro Corp., Sr. Unsec. Gtd. Global Notes, 5.13%, 04/01/2024 | | | 65,000 | | | | 67,600 | |
|
| Oil & Gas Storage & Transportation–1.30% | |
Antero Midstream Partners LP/Antero Midstream Finance Corp., Sr. Unsec. Gtd. Notes, 5.38%, 09/15/2024(b) | | | 49,000 | | | | 49,612 | |
Energy Transfer Equity, L.P., Sr. Sec. First Lien Notes, 5.88%, 01/15/2024 | | | 352,000 | | | | 359,040 | |
Holly Energy Partners L.P./Holly Energy Finance Corp., Sr. Unsec. Gtd. Notes, 6.00%, 08/01/2024(b) | | | 152,000 | | | | 159,220 | |
MPLX LP, Sr. Unsec. Gtd. Global Notes, 5.50%, 02/15/2023 | | | 250,000 | | | | 260,859 | |
Sabine Pass Liquefaction, LLC, | | | | | | | | |
Sr. Sec. First Lien Global Notes, | | | | | | | | |
5.63%, 03/01/2025 | | | 678,000 | | | | 719,104 | |
Sr. Sec. Notes, | | | | | | | | |
5.00%, 03/15/2027(b) | | | 87,000 | | | | 88,849 | |
Targa Resources Partners L.P./Targa Resources Partners Finance Corp., | | | | | | | | |
Sr. Unsec. Gtd. Global Bonds, | | | | | | | | |
5.25%, 05/01/2023 | | | 114,000 | | | | 114,000 | |
Sr. Unsec. Gtd. Notes, | | | | | | | | |
5.13%, 02/01/2025(b) | | | 190,000 | | | | 190,475 | |
Tesoro Logistics L.P./Tesoro Logistics Finance Corp., Sr. Unsec. Gtd. Global Notes, | | | | | | | | |
6.13%, 10/15/2021 | | | 11,000 | | | | 11,550 | |
6.25%, 10/15/2022 | | | 14,000 | | | | 14,910 | |
6.38%, 05/01/2024 | | | 392,000 | | | | 423,360 | |
Willams Cos. Inc. (The), Sr. Unsec. Global Notes, 4.55%, 06/24/2024 | | | 162,000 | | | | 165,890 | |
| | | | | | | | 2,556,869 | |
|
| Other Diversified Financial Services–0.11% | |
Lincoln Finance Ltd. (Netherlands), Sr. Sec. Gtd. Notes, 7.38%, 04/15/2021(b) | | | 200,000 | | | | 215,666 | |
See accompanying Notes to Financial Statements which are an integral part of the financial statements.
17 Invesco Multi-Asset Income Fund
| | | | | | | | |
| | | Principal
Amount | | | Value | |
| Packaged Foods & Meats–0.25% | |
FAGE International S.A./FAGE USA Dairy Industry, Inc. (Luxembourg), Sr. Unsec. Gtd. Notes, 5.63%, 08/15/2026(b) | | $ | 200,000 | | | $ | 206,500 | |
JBS Investments GmbH (Brazil), REGS, Sr. Unsec. Gtd. Euro Notes, 7.25%, 04/03/2024(b) | | | 200,000 | | | | 203,000 | |
Smithfield Foods Inc., Sr. Unsec. Notes, 6.63%, 08/15/2022 | | | 84,000 | | | | 88,830 | |
| | | | | | | | 498,330 | |
|
| Paper Packaging–0.07% | |
Graphic Packaging International Inc., Sr. Unsec. Gtd. Notes, 4.88%, 11/15/2022 | | | 138,000 | | | | 145,245 | |
|
| Paper Products–0.08% | |
Clearwater Paper Corp., Sr. Unsec. Gtd. Global Notes, 4.50%, 02/01/2023 | | | 156,000 | | | | 156,780 | |
|
| Pharmaceuticals–0.42% | |
Concordia International Corp. (Canada), | | | | | | | | |
Sr. Sec. First Lien Notes, | | | | | | | | |
9.00%, 04/01/2022(b) | | | 8,000 | | | | 7,840 | |
Sr. Unsec. Gtd. Notes, | | | | | | | | |
7.00%, 04/15/2023(b) | | | 148,000 | | | | 86,210 | |
REGS, Sr. Unsec. Gtd. Euro Notes, | | | | | | | | |
7.00%, 04/15/2023(b) | | | 120,000 | | | | 72,600 | |
Endo Ltd./Endo Finance LLC/Endo Finco Inc., Sr. Unsec. Gtd. Notes, 6.00%, 07/15/2023(b) | | | 200,000 | | | | 175,500 | |
Valeant Pharmaceuticals International, Inc., | | | | | | | | |
Sr. Unsec. Gtd. Notes,
5.63%, 12/01/2021(b) | | | 140,000 | | | | 116,200 | |
6.13%, 04/15/2025(b) | | | 100,000 | | | | 79,500 | |
7.50%, 07/15/2021(b) | | | 250,000 | | | | 223,750 | |
REGS, Sr. Unsec. Gtd. Euro Notes,
6.13%, 04/15/2025(b) | | | 90,000 | | | | 71,325 | |
| | | | | | | | 832,925 | |
|
| Regional Banks–0.27% | |
CIT Group Inc., Sr. Unsec. Global Notes, | | | | | | | | |
5.00%, 08/15/2022 | | | 319,000 | | | | 341,330 | |
5.00%, 08/01/2023 | | | 175,000 | | | | 187,250 | |
| | | | | | | | 528,580 | |
|
| Restaurants–0.20% | |
1011778 BC ULC/ New Red Finance, Inc. (Canada), | | | | | | | | |
Sec. Gtd. Second Lien Notes, | | | | | | | | |
6.00%, 04/01/2022(b) | | | 97,000 | | | | 101,729 | |
REGS, Sec. Gtd. Second Lien Euro Notes,
6.00%, 04/01/2022(b) | | | 120,000 | | | | 125,700 | |
Brinker International Inc., Sr. Unsec. Gtd. Notes, 5.00%, 10/01/2024(b) | | | 51,000 | | | | 51,648 | |
Carrols Restaurant Group, Inc., Sec. Gtd. Second Lien Global Notes, 8.00%, 05/01/2022 | | | 106,000 | | | | 116,335 | |
| | | | | | | | 395,412 | |
| | | | | | | | |
| | | Principal
Amount | | | Value | |
| Semiconductors–0.31% | |
Micron Technology, Inc., | | | | | | | | |
Sr. Unsec. Global Notes, | | | | | | | | |
5.50%, 02/01/2025 | | $ | 187,000 | | | $ | 184,195 | |
Sr. Unsec. Notes, | | | | | | | | |
5.25%, 08/01/2023(b) | | | 330,000 | | | | 325,050 | |
5.25%, 01/15/2024(b) | | | 105,000 | | | | 103,950 | |
| | | | | | | | 613,195 | |
|
| Sovereign Debt–16.41% | |
Brazilian Government International Bond (Brazil), Sr. Unsec. Global Bonds, | | | | | | | | |
5.63%, 01/07/2041 | | | 400,000 | | | | 388,000 | |
7.13%, 01/20/2037 | | | 350,000 | | | | 400,750 | |
8.25%, 01/20/2034 | | | 325,000 | | | | 413,156 | |
Colombia Government International Bond (Colombia), Sr. Unsec. Global Bonds, | | | | | | | | |
5.63%, 02/26/2044 | | | 400,000 | | | | 439,000 | |
6.13%, 01/18/2041 | | | 350,000 | | | | 401,625 | |
7.38%, 09/18/2037 | | | 300,000 | | | | 385,500 | |
Croatia Government International Bond (Croatia), REGS, Sr. Unsec. Euro Notes, | | | | | | | | |
6.00%, 01/26/2024(b) | | | 300,000 | | | | 339,248 | |
6.38%, 03/24/2021(b) | | | 300,000 | | | | 333,726 | |
6.63%, 07/14/2020(b) | | | 300,000 | | | | 333,353 | |
Dominican Republic International Bond (Dominican Repubic), REGS, | | | | | | | | |
Sr. Unsec. Euro Bonds, | | | | | | | | |
6.60%, 01/28/2024(b) | | | 300,000 | | | | 327,000 | |
7.45%, 04/30/2044(b) | | | 300,000 | | | | 334,500 | |
Sr. Unsec. Euro Notes, | | | | | | | | |
6.85%, 01/27/2045(b) | | | 350,000 | | | | 365,750 | |
El Salvador Government International Bond (El Salvador), | | | | | | | | |
Sr. Unsec. Notes, | | | | | | | | |
6.38%, 01/18/2027(b) | | | 172,000 | | | | 172,000 | |
REGS, Sr. Unsec. Euro Notes, | | | | | | | | |
5.88%, 01/30/2025(b) | | | 225,000 | | | | 223,875 | |
7.63%, 02/01/2041(b) | | | 400,000 | | | | 412,620 | |
7.65%, 06/15/2035(b) | | | 350,000 | | | | 364,318 | |
8.25%, 04/10/2032(b) | | | 350,000 | | | | 383,204 | |
Hungary Government International Bond (Hungary), Sr. Unsec. Global Notes, | | | | | | | | |
5.38%, 03/25/2024 | | | 300,000 | | | | 345,241 | |
5.75%, 11/22/2023 | | | 300,000 | | | | 350,513 | |
7.63%, 03/29/2041 | | | 240,000 | | | | 366,660 | |
Indonesia Government International Bond (Indonesia), REGS, Sr. Unsec. Euro Bonds, | | | | | | | | |
6.63%, 02/17/2037(b) | | | 300,000 | | | | 377,772 | |
7.75%, 01/17/2038(b) | | | 250,000 | | | | 351,405 | |
8.50%, 10/12/2035(b) | | | 250,000 | | | | 370,759 | |
Kazakhstan Government International Bond (Kazakhstan),
REGS, Sr. Unsec. Euro Notes, | | | | | | | | |
4.88%, 10/14/2044(b) | | | 350,000 | | | | 354,851 | |
Sr. Unsec. Medium-Term Euro Notes, | | | | | | | | |
5.13%, 07/21/2025(b) | | | 350,000 | | | | 388,944 | |
6.50%, 07/21/2045(b) | | | 300,000 | | | | 359,868 | |
See accompanying Notes to Financial Statements which are an integral part of the financial statements.
18 Invesco Multi-Asset Income Fund
| | | | | | | | |
| | | Principal
Amount | | | Value | |
| Sovereign Debt–(continued) | |
Korea International Bond (South Korea), | | | | | | | | |
Sr. Unsec. Global Notes, | | | | | | | | |
3.88%, 09/11/2023 | | $ | 450,000 | | | $ | 505,732 | |
4.13%, 06/10/2044 | | | 400,000 | | | | 506,490 | |
Latvia Government International Bond (Latvia), REGS, Sr. Unsec. Euro Notes, 2.75%, 01/12/2020(b) | | | 950,000 | | | | 987,126 | |
Lebanon Government International Bond (Lebanon),
REGS, Sr. Unsec. Euro Bonds, | | | | | | | | |
6.65%, 04/22/2024(b) | | | 325,000 | | | | 321,750 | |
Sr. Unsec. Euro Notes, | | | | | | | | |
6.75%, 11/29/2027(b) | | | 300,000 | | | | 296,850 | |
Sr. Unsec. Medium-Term Euro Notes, | | | | | | | | |
6.65%, 02/26/2030(b) | | | 350,000 | | | | 338,625 | |
Lithuania Government International Bond (Lithuania), REGS, Sr. Unsec. Euro Notes, | | | | | | | | |
6.13%, 03/09/2021(b) | | | 300,000 | | | | 349,875 | |
6.63%, 02/01/2022(b) | | | 250,000 | | | | 303,204 | |
7.38%, 02/11/2020(b) | | | 300,000 | | | | 353,122 | |
Mexico Government International Bond (Mexico),
Sr. Unsec. Global Notes, | | | | | | | | |
4.60%, 01/23/2046 | | | 350,000 | | | | 343,438 | |
5.55%, 01/21/2045 | | | 320,000 | | | | 359,600 | |
Series A, Sr. Unsec. Medium-Term Global Notes, 6.05%, 01/11/2040 | | | 300,000 | | | | 358,500 | |
Morocco Government International Bond (Morocco), REGS, Sr. Unsec. Euro Notes, | | | | | | | | |
4.25%, 12/11/2022(b) | | | 450,000 | | | | 480,667 | |
5.50%, 12/11/2042(b) | | | 500,000 | | | | 565,010 | |
Pakistan Government International Bond (Pakistan), REGS, Sr. Unsec. Euro Notes, | | | | | | | | |
8.25%, 04/15/2024(b) | | | 300,000 | | | | 338,682 | |
8.25%, 09/30/2025(b) | | | 300,000 | | | | 342,028 | |
Panama Government International Bond (Panama), Sr. Unsec. Global Bonds, | | | | | | | | |
6.70%, 01/26/2036 | | | 270,000 | | | | 360,113 | |
7.13%, 01/29/2026 | | | 250,000 | | | | 331,875 | |
8.88%, 09/30/2027 | | | 250,000 | | | | 370,000 | |
Peruvian Government International Bond (Peru), Sr. Unsec. Global Bonds, | | | | | | | | |
4.13%, 08/25/2027 | | | 320,000 | | | | 358,860 | |
5.63%, 11/18/2050 | | | 300,000 | | | | 381,750 | |
8.75%, 11/21/2033 | | | 250,000 | | | | 395,000 | |
Philippine Government International Bond (Philippines), | | | | | | | | |
Sr. Unsec. Global Bonds, | | | | | | | | |
6.38%, 10/23/2034 | | | 250,000 | | | | 349,178 | |
9.50%, 02/02/2030 | | | 200,000 | | | | 335,068 | |
Sr. Unsec. Global Notes, | | | | | | | | |
7.75%, 01/14/2031 | | | 200,000 | | | | 302,812 | |
| | | | | | | | |
| | | Principal
Amount | | | Value | |
| Sovereign Debt–(continued) | |
Qatar Government International Bond (Qatar), REGS, | | | | | | | | |
Sr. Unsec. Euro Bonds, | | | | | | | | |
4.63%, 06/02/2046(b) | | $ | 300,000 | | | $ | 316,836 | |
Sr. Unsec. Euro Notes, | | | | | | | | |
5.75%, 01/20/2042(b) | | | 225,000 | | | | 284,981 | |
6.40%, 01/20/2040(b) | | | 300,000 | | | | 405,113 | |
Republic of Poland Government International Bond (Poland), | | | | | | | | |
Sr. Unsec. Global Notes, | | | | | | | | |
3.25%, 04/06/2026 | | | 325,000 | | | | 337,860 | |
4.00%, 01/22/2024 | | | 300,000 | | | | 327,930 | |
5.00%, 03/23/2022 | | | 300,000 | | | | 340,139 | |
Republic of South Africa Government International Bond (South Africa), | | | | | | | | |
Sr. Unsec. Global Bonds, | | | | | | | | |
5.38%, 07/24/2044 | | | 350,000 | | | | 365,225 | |
Sr. Unsec. Global Notes, | | | | | | | | |
5.88%, 09/16/2025 | | | 300,000 | | | | 337,371 | |
6.25%, 03/08/2041 | | | 300,000 | | | | 350,759 | |
Romanian Government International Bond (Romania), REGS, Sr. Unsec. Medium-Term Euro Notes, | | | | | | | | |
4.38%, 08/22/2023(b) | | | 300,000 | | | | 326,564 | |
6.13%, 01/22/2044(b) | | | 250,000 | | | | 325,449 | |
6.75%, 02/07/2022(b) | | | 300,000 | | | | 356,625 | |
Russian Foreign Bond (Russia), REGS, | | | | | | | | |
Sr. Unsec. Euro Bonds, | | | | | | | | |
4.88%, 09/16/2023(b) | | | 200,000 | | | | 215,431 | |
5.63%, 04/04/2042(b) | | | 400,000 | | | | 442,680 | |
5.88%, 09/16/2043(b) | | | 400,000 | | | | 457,700 | |
Second Pakistan International Sukuk Co. Ltd. (The) (Pakistan), REGS, Sr. Unsec. Euro Bonds,
6.75%, 12/03/2019(b) | | | 300,000 | | | | 318,483 | |
Serbia International Bond (Serbia),
REGS, Sr. Unsec. Euro Bonds, | | | | | | | | |
4.88%, 02/25/2020(b) | | | 475,000 | | | | 492,634 | |
Sr. Unsec. Euro Notes, | | | | | | | | |
7.25%, 09/28/2021(b) | | | 400,000 | | | | 460,203 | |
Slovenia Government International Bond (Slovenia), REGS, Sr. Unsec. Euro Notes, | | | | | | | | |
5.25%, 02/18/2024(b) | | | 300,000 | | | | 349,546 | |
5.50%, 10/26/2022(b) | | | 300,000 | | | | 347,705 | |
5.85%, 05/10/2023(b) | | | 250,000 | | | | 296,750 | |
Sri Lanka Government International Bond (Sri Lanka),
REGS, Sr. Unsec. Euro Bonds, | | | | | | | | |
6.83%, 07/18/2026(b) | | | 350,000 | | | | 370,597 | |
6.85%, 11/03/2025(b) | | | 350,000 | | | | 369,719 | |
Sr. Unsec. Euro Notes, | | | | | | | | |
6.13%, 06/03/2025(b) | | | 550,000 | | | | 553,484 | |
Turkey Government International Bond (Turkey), Sr. Unsec. Global Notes, | | | | | | | | |
6.88%, 03/17/2036 | | | 300,000 | | | | 342,015 | |
7.25%, 03/05/2038 | | | 280,000 | | | | 333,332 | |
8.00%, 02/14/2034 | | | 270,000 | | | | 340,798 | |
See accompanying Notes to Financial Statements which are an integral part of the financial statements.
19 Invesco Multi-Asset Income Fund
| | | | | | | | |
| | | Principal
Amount | | | Value | |
| Sovereign Debt–(continued) | |
Ukraine Government International Bond (Ukraine), REGS, Sr. Unsec. Euro Notes, | | | | | | | | |
7.75%, 09/01/2019(b) | | $ | 350,000 | | | $ | 349,956 | |
7.75%, 09/01/2020(b) | | | 350,000 | | | | 347,743 | |
7.75%, 09/01/2021(b) | | | 350,000 | | | | 345,625 | |
Uruguay Government International Bond (Uruguay), | | | | | | | | |
Sr. Unsec. Euro Bonds, | | | | | | | | |
7.88%, 01/15/2033 | | | 275,000 | | | | 383,212 | |
Sr. Unsec. Global Bonds, | | | | | | | | |
7.63%, 03/21/2036 | | | 275,000 | | | | 380,462 | |
Unsec. Global Notes, | | | | | | | | |
8.00%, 11/18/2022 | | | 250,000 | | | | 321,875 | |
Venezuela Government International Bond (Venezuela),
REGS, Sr. Unsec. Euro Bonds, | | | | | | | | |
6.00%, 12/09/2020(b) | | | 915,000 | | | | 410,835 | |
9.00%, 05/07/2023(b) | | | 800,000 | | | | 371,200 | |
Sr. Unsec. Euro Notes, | | | | | | | | |
7.75%, 10/13/2019(b) | | | 800,000 | | | | 410,000 | |
| | | | | | | | 32,305,830 | |
|
| Specialized Consumer Services–0.14% | |
ServiceMaster Co., LLC (The), Sr. Unsec. Notes, 7.45%, 08/15/2027 | | | 254,000 | | | | 273,368 | |
|
| Specialized Finance–0.30% | |
Aircastle Ltd., Sr. Unsec. Notes, | | | | | | | | |
5.00%, 04/01/2023 | | | 250,000 | | | | 260,000 | |
5.50%, 02/15/2022 | | | 310,000 | | | | 334,025 | |
| | | | | | | | 594,025 | |
|
| Specialized REIT’s–0.48% | |
CyrusOne L.P./CyrusOne Finance Corp., Sr. Unsec. Gtd. Global Notes, 6.38%, 11/15/2022 | | | 321,000 | | | | 341,063 | |
Equinix Inc., Sr. Unsec. Notes, 5.88%, 01/15/2026 | | | 300,000 | | | | 321,000 | |
GLP Capital LP/GLP Financing II Inc., Sr. Unsec. Gtd. Notes, 5.38%, 04/15/2026 | | | 100,000 | | | | 106,750 | |
Lamar Media Corp., Sr. Unsec. Gtd. Global Notes, 5.75%, 02/01/2026 | | | 100,000 | | | | 107,375 | |
Rayonier A.M. Products Inc., Sr. Unsec. Gtd. Notes, 5.50%, 06/01/2024(b) | | | 69,000 | | | | 63,911 | |
| | | | | | | | 940,099 | |
|
| Specialty Chemicals–0.48% | |
Ashland LLC, Sr. Unsec. Gtd. Global Notes, 4.75%, 08/15/2022 | | | 130,000 | | | | 134,713 | |
Axalta Coating Systems, LLC, Sr. Unsec. Gtd. Notes, 4.88%, 08/15/2024(b) | | | 150,000 | | | | 153,562 | |
GCP Applied Technologies Inc., Sr. Unsec. Gtd. Notes, 9.50%, 02/01/2023(b) | | | 115,000 | | | | 131,388 | |
Kraton Polymers LLC/Kraton Polymers Capital Corp., Sr. Unsec. Gtd. Notes, 10.50%, 04/15/2023(b) | | | 210,000 | | | | 235,987 | |
| | | | | | | | |
| | | Principal
Amount | | | Value | |
| Specialty Chemicals–(continued) | |
PolyOne Corp., Sr. Unsec. Global Notes, 5.25%, 03/15/2023 | | $ | 192,000 | | | $ | 197,760 | |
PQ Corp., Sr. Sec. Gtd. First Lien Notes, 6.75%, 11/15/2022(b) | | | 85,000 | | | | 91,906 | |
| | | | | | | | 945,316 | |
|
| Steel–0.45% | |
ArcelorMittal (Luxembourg), | | | | | | | | |
Sr. Unsec. Global Bonds, | | | | | | | | |
6.13%, 06/01/2025 | | | 190,000 | | | | 209,950 | |
Sr. Unsec. Global Notes, | | | | | | | | |
8.00%, 10/15/2039 | | | 35,000 | | | | 38,281 | |
FMG Resources (August 2006) Pty. Ltd. (Australia), Sr. Unsec. Gtd. Notes, 6.88%, 04/01/2022(b) | | | 366,000 | | | | 377,895 | |
United States Steel Corp., | | | | | | | | |
Sr. Sec. First Lien Notes, | | | | | | | | |
8.38%, 07/01/2021(b) | | | 45,000 | | | | 47,925 | |
Sr. Unsec. Global Notes, | | | | | | | | |
7.50%, 03/15/2022 | | | 218,000 | | | | 209,280 | |
| | | | | | | | 883,331 | |
|
| Technology Hardware, Storage & Peripherals–0.24% | |
Diamond 1 Finance Corp./Diamond 2 Finance Corp., Sr. Unsec. Gtd. Notes, 7.13%, 06/15/2024(b) | | | 235,000 | | | | 257,912 | |
Western Digital Corp., Sr. Sec. Gtd. First Lien Notes, 7.38%, 04/01/2023(b) | | | 195,000 | | | | 213,952 | |
| | | | | | | | 471,864 | |
|
| Tobacco–0.04% | |
Alliance One International, Inc., Sr. Sec. First Lien Notes, 8.50%, 04/15/2021(b) | | | 78,000 | | | | 78,975 | |
|
| Trading Companies & Distributors–0.54% | |
AerCap Global Aviation Trust (Netherlands), Jr. Unsec. Gtd. Sub. Notes, 6.50%, 06/15/2045(b) | | | 400,000 | | | | 412,000 | |
BMC East, LLC, Sr. Sec. Gtd. First Lien Notes, 5.50%, 10/01/2024(b) | | | 91,000 | | | | 93,048 | |
Fly Leasing Ltd. (Ireland), Sr. Unsec. Global Notes, 6.75%, 12/15/2020 | | | 200,000 | | | | 208,502 | |
HD Supply, Inc., Sr. Unsec. Gtd. Notes, 5.75%, 04/15/2024(b) | | | 35,000 | | | | 36,881 | |
United Rentals North America, Inc., | | | | | | | | |
Sr. Unsec. Gtd. Global Notes, | | | | | | | | |
5.50%, 07/15/2025 | | | 50,000 | | | | 50,750 | |
Sr. Unsec. Gtd. Notes, | | | | | | | | |
5.50%, 05/15/2027 | | | 55,000 | | | | 55,275 | |
6.13%, 06/15/2023 | | | 200,000 | | | | 210,000 | |
| | | | | | | | 1,066,456 | |
|
| Trucking–0.20% | |
Avis Budget Car Rental LLC/Avis Budget Finance Inc., Sr. Unsec. Gtd. Notes, | | | | | | | | |
5.13%, 06/01/2022(b) | | | 87,000 | | | | 85,804 | |
6.38%, 04/01/2024(b) | | | 125,000 | | | | 126,250 | |
See accompanying Notes to Financial Statements which are an integral part of the financial statements.
20 Invesco Multi-Asset Income Fund
| | | | | | | | |
| | | Principal
Amount | | | Value | |
| Trucking–(continued) | | | | | | | | |
OPE KAG Finance Sub Inc., Sr. Unsec. Notes, 7.88%, 07/31/2023(b) | | $ | 190,000 | | | $ | 180,737 | |
| | | | | | | | 392,791 | |
|
| Wireless Telecommunication Services–0.67% | |
Digicel Ltd. (Jamaica), Sr. Unsec. Gtd. Notes, 6.75%, 03/01/2023(b) | | | 200,000 | | | | 179,750 | |
Sprint Corp., Sr. Unsec. Gtd. Global Notes, | | | | | | | | |
7.25%, 09/15/2021 | | | 514,000 | | | | 528,777 | |
7.88%, 09/15/2023 | | | 359,000 | | | | 357,205 | |
Wind Acquisition Finance S.A. (Italy), Sec. Gtd. Second Lien Notes, 7.38%, 04/23/2021(b) | | | 250,000 | | | | 256,875 | |
| | | | | | | | 1,322,607 | |
Total U.S. Dollar Denominated Bonds and Notes
(Cost $78,484,630) | | | | 78,582,554 | |
| | |
| | | Shares | | | | |
|
Preferred Stocks–21.82% | |
| Asset Management & Custody Banks–0.91% | |
Affiliated Managers Group Inc., 6.38% Sr. Unsec. Pfd. | | | 2,700 | | | | 69,471 | |
Apollo Investment Corp., 6.88% Sr. Unsec. Pfd. | | | 2,700 | | | | 71,172 | |
Ares Management, L.P., Series A, 7.00% Pfd. | | | 2,700 | | | | 70,011 | |
Bank of New York Mellon Corp. (The), 5.20% Pfd. | | | 6,600 | | | | 174,900 | |
KKR & Co. L.P., Series A, 6.75% Sr. Pfd. | | | 4,300 | | | | 116,358 | |
KKR & Co. L.P., Series B, 6.50% Pfd. | | | 1,900 | | | | 50,673 | |
Legg Mason, Inc., 5.45% Jr. Unsec. Sub. Pfd. | | | 5,500 | | | | 136,895 | |
Legg Mason, Inc., 6.38% Jr. Unsec. Sub. Pfd. | | | 3,400 | | | | 90,780 | |
Northern Trust Corp., Series C, 5.85% Pfd. | | | 4,000 | | | | 107,640 | |
OM Asset Management PLC, 5.13% Sr. Unsec. Pfd. | | | 1,300 | | | | 32,100 | |
Prospect Capital Corp., 6.25%
Sr. Unsec. Pfd. | | | 2,000 | | | | 51,320 | |
State Street Corp., Series C, 5.25% Pfd. | | | 4,500 | | | | 114,300 | |
State Street Corp., Series D, 5.90% Pfd. | | | 6,100 | | | | 171,105 | |
State Street Corp., Series E, 6.00% Pfd. | | | 12,200 | | | | 324,520 | |
State Street Corp., Series G, 5.35% Pfd. | | | 8,200 | | | | 219,514 | |
| | | | | | | | 1,800,759 | |
|
| Cable & Satellite–0.03% | |
Comcast Corp., 5.00% Sr. Unsec. Gtd. Pfd. | | | 2,600 | | | | 67,522 | |
|
| Consumer Finance–0.64% | |
Capital One Financial Corp., Series B, 6.00% Pfd. | | | 10,900 | | | | 281,329 | |
Capital One Financial Corp., Series C, 6.25% Pfd. | | | 6,000 | | | | 159,360 | |
| | | | | | | | |
| | |
Shares | | | Vlaue | |
| Consumer Finance–(continued) | | | | | | | | |
Capital One Financial Corp., Series D, 6.70% Pfd. | | | 5,400 | | | $ | 151,686 | |
Capital One Financial Corp., Series F, 6.20% Pfd. | | | 5,400 | | | | 144,126 | |
Capital One Financial Corp., Series G, 5.20% Pfd. | | | 8,200 | | | | 203,606 | |
Discover Financial Services, Series B, 6.50% Pfd. | | | 7,000 | | | | 183,330 | |
Navient Corp., 6.00% Sr. Unsec. Pfd. | | | 5,600 | | | | 128,072 | |
| | | | | | | | 1,251,509 | |
|
| Diversified Banks–7.57% | |
Bank of America Corp., Series 3, 6.38% Pfd. | | | 1,600 | | | | 41,280 | |
Bank of America Corp., Series I, 6.63% Pfd. | | | 16,351 | | | | 429,868 | |
Bank of America Corp., Series W, 6.63% Pfd. | | | 35,400 | | | | 965,358 | |
Bank of America Corp., Series Y, 6.50% Pfd. | | | 27,200 | | | | 731,408 | |
Bank of America Corp., Class CC, 6.20% Pfd. | | | 21,800 | | | | 567,672 | |
Bank of America Corp., Series EE, 6.00% Pfd. | | | 12,200 | | | | 317,200 | |
Barclays Bank PLC (United Kingdom), Series 5, 8.13% Jr. Unsec. Sub. Pfd. | | | 40,000 | | | | 1,041,600 | |
Citigroup Inc., Series J, 7.13% Pfd. | | | 16,300 | | | | 464,876 | |
Citigroup Inc., Series K, 6.88% Pfd. | | | 15,200 | | | | 436,088 | |
Citigroup Inc., Series L, 6.88% Pfd. | | | 6,000 | | | | 162,240 | |
Citigroup Inc., Series S, 6.30% Pfd. | | | 19,100 | | | | 506,341 | |
HSBC Holdings PLC (United Kingdom), Series 2, 8.00% Jr. Unsec. Sub. Pfd. | | | 68,000 | | | | 1,772,080 | |
JPMorgan Chase & Co., Series O, 5.50% Pfd. | | | 5,000 | | | | 127,100 | |
JPMorgan Chase & Co., Series P, 5.45% Pfd. | | | 7,200 | | | | 185,472 | |
JPMorgan Chase & Co., Series T, 6.70% Pfd. | | | 3,200 | | | | 87,744 | |
JPMorgan Chase & Co., Series W, 6.30% Pfd. | | | 4,100 | | | | 110,167 | |
JPMorgan Chase & Co., Series Y, 6.13% Unsec. Pfd. | | | 21,800 | | | | 585,548 | |
JPMorgan Chase & Co., Series AA, 6.10% Pfd. | | | 29,900 | | | | 797,732 | |
JPMorgan Chase & Co., Series BB, 6.15% Pfd. | | | 29,900 | | | | 797,433 | |
Royal Bank of Scotland Group PLC (The) (United Kingdom), Series L, 5.75% Jr. Unsec. Sub. Pfd. | | | 16,301 | | | | 409,970 | |
Royal Bank of Scotland Group PLC (The) (United Kingdom), Series S, 6.60% Pfd. | | | 8,200 | | | | 208,526 | |
Santander Finance Preferred SAU (Spain), 6.50% Jr. Unsec. Gtd. Sub. Pfd. | | | 3,400 | | | | 86,190 | |
US Bancorp, Series F, 6.50% Pfd. | | | 20,400 | | | | 598,740 | |
Wells Fargo & Co., 5.20% Unsec. Pfd. | | | 19,100 | | | | 483,994 | |
Wells Fargo & Co., 5.85% Pfd. | | | 9,700 | | | | 258,408 | |
Wells Fargo & Co., 6.63% Unsec. Pfd. | | | 9,700 | | | | 286,247 | |
See accompanying Notes to Financial Statements which are an integral part of the financial statements.
21 Invesco Multi-Asset Income Fund
| | | | | | | | |
| | | Shares | | | Vlaue | |
| Diversified Banks–(continued) | |
Wells Fargo & Co., Series J, 8.00% Pfd. | | | 4,500 | | | $ | 122,130 | |
Wells Fargo & Co., Series O, 5.13% Unsec. Pfd. | | | 17,700 | | | | 448,695 | |
Wells Fargo & Co., Series P, 5.25% Unsec. Pfd. | | | 6,100 | | | | 154,574 | |
Wells Fargo & Co., Series T, 6.00% Unsec. Pfd. | | | 15,000 | | | | 393,000 | |
Wells Fargo & Co., Series V, 6.00% Pfd. | | | 12,200 | | | | 318,176 | |
Wells Fargo & Co., Series W, 5.70% Pfd. | | | 12,200 | | | | 314,150 | |
Wells Fargo & Co., Series X, 5.50% Pfd. | | | 27,200 | | | | 692,240 | |
| | | | | | | | 14,902,247 | |
|
| Diversified Capital Markets–0.75% | |
Deutsche Bank Contingent Capital Trust III (Germany), 7.60% Jr. Unsec. Gtd. Sub. Pfd. | | | 24,500 | | | | 595,105 | |
Deutsche Bank Contingent Capital Trust V (Germany), 8.05% Jr. Unsec. Gtd. Sub. Pfd. | | | 27,200 | | | | 672,656 | |
KKR Financial Holdings LLC, 8.38% Sr. Unsec. Pfd. | | | 3,800 | | | | 96,938 | |
KKR Financial Holdings LLC, Series A, 7.38% Pfd. | | | 4,600 | | | | 119,554 | |
| | | | | | | | 1,484,253 | |
|
| Diversified REIT’s–0.14% | |
PS Business Parks, Inc., Series S, 6.45% Pfd. | | | 10,600 | | | | 269,346 | |
|
| Electric Utilities–1.52% | |
BGE Capital Trust II, 6.20% Jr. Unsec. Gtd. Sub. Pfd. | | | 2,300 | | | | 59,225 | |
Duke Energy Corp., 5.13% Jr. Unsec. Sub. Pfd. | | | 6,800 | | | | 177,480 | |
Entergy Arkansas, Inc., 4.88% Sr. Sec. Mortgage Pfd. | | | 4,500 | | | | 110,295 | |
Entergy Arkansas, Inc., 4.90% Sr. Sec. First Mortgage Pfd. | | | 3,000 | | | | 75,900 | |
Entergy Louisiana, LLC, 4.88% Sec. Mortgage Pfd. | | | 5,500 | | | | 135,850 | |
Entergy Louisiana, LLC, 5.25% Sr. Sec. First Mortgage Pfd. | | | 3,300 | | | | 85,173 | |
Entergy Mississippi, Inc., 4.90% Sr. Sec. Mortgage Pfd. | | | 3,400 | | | | 83,130 | |
Entergy Texas Inc., 5.63% Sr. Sec. First Mortgage Pfd. | | | 4,000 | | | | 109,520 | |
Interstate Power & Light Co., Series D, 5.10% Pfd. | | | 1,800 | | | | 48,348 | |
NextEra Energy Capital Holdings Inc., 5.00% Jr. Unsec. Gtd. Sub. Pfd. | | | 7,300 | | | | 182,500 | |
NextEra Energy Capital Holdings Inc., Series G, 5.70% Jr. Unsec. Gtd. Sub. Pfd. | | | 3,200 | | | | 81,856 | |
NextEra Energy Capital Holdings Inc., Series H, 5.63% Jr. Unsec. Gtd. Sub. Pfd. | | | 8,400 | | | | 215,040 | |
NextEra Energy Capital Holdings Inc., Series K, 5.25% Jr. Unsec. Gtd. Sub. Pfd. | | | 10,300 | | | | 258,942 | |
| | | | | | | | |
| | | Shares | | | Vlaue | |
| Electric Utilities–(continued) | |
Pacific Gas & Electric Co., Series A, 6.00% Pfd. | | | 1,000 | | | $ | 32,710 | |
PPL Capital Funding, Inc., Series B, 5.90% Jr. Unsec. Gtd. Sub. Pfd. | | | 5,500 | | | | 143,330 | |
SCE Trust I, 5.63% Jr. Unsec. Sub. Pfd. | | | 8,200 | | | | 209,756 | |
SCE Trust IV, Series J, 5.38% Jr. Unsec. Sub. Pfd. | | | 6,700 | | | | 186,662 | |
SCE Trust V, Series K, 5.45% Jr. Unsec. Sub. Pfd. | | | 6,100 | | | | 172,020 | |
Southern Co. (The), 5.25% Jr. Unsec. Sub. Pfd. | | | 11,600 | | | | 288,608 | |
Southern Co. (The), 6.25% Jr. Unsec. Sub. Pfd. | | | 12,200 | | | | 325,862 | |
| | | | | | | | 2,982,207 | |
|
| Health Care REIT’s–0.17% | |
Senior Housing Properties Trust, 5.63% Sr. Unsec. Pfd. | | | 8,200 | | | | 204,180 | |
Ventas Realty L.P. / Ventas Capital Corp., 5.45% Sr. Unsec. Gtd. Pfd. | | | 2,300 | | | | 60,996 | |
Welltower Inc., Series J, 6.50% Pfd. | | | 2,600 | | | | 65,936 | |
| | | | | | | | 331,112 | |
|
| Hotel and Resort REIT’s–0.03% | |
Hospitality Properties Trust, Series D, 7.13% Pfd. | | | 2,600 | | | | 65,884 | |
|
| Industrial Conglomerates–0.33% | |
General Electric Co., 4.70%
Sr. Unsec. Pfd. | | | 6,200 | | | | 160,208 | |
General Electric Co., 4.88%
Sr. Unsec. Pfd. | | | 8,500 | | | | 222,105 | |
General Electric Co., 4.88%
Sr. Unsec. Pfd. | | | 10,200 | | | | 262,140 | |
| | | | | | | | 644,453 | |
|
| Industrial Machinery–0.13% | |
Stanley Black & Decker Inc., 5.75% Jr. Unsec. Sub. Pfd. | | | 10,200 | | | | 263,976 | |
|
| Integrated Telecommunication Services–0.78% | |
Qwest Corp., 6.13% Sr. Unsec. Pfd. | | | 7,300 | | | | 184,325 | |
Qwest Corp., 6.50% Sr. Unsec. Pfd. | | | 13,600 | | | | 345,984 | |
Qwest Corp., 6.63% Sr. Unsec. Pfd. | | | 6,800 | | | | 173,808 | |
Qwest Corp., 6.88% Sr. Unsec. Pfd. | | | 8,200 | | | | 211,560 | |
Qwest Corp., 7.00% Sr. Unsec. Pfd. | | | 7,300 | | | | 188,340 | |
Qwest Corp., 7.00% Sr. Unsec. Pfd. | | | 5,200 | | | | 132,080 | |
Qwest Corp., 7.50% Sr. Unsec. Pfd. | | | 5,456 | | | | 138,692 | |
Verizon Communications Inc., 5.90% Sr. Unsec. Pfd. | | | 6,000 | | | | 160,740 | |
| | | | | | | | 1,535,529 | |
|
| Internet Software & Services–0.12% | |
eBay Inc., 6.00% Sr. Unsec. Pfd. | | | 9,100 | | | | 241,605 | |
|
| Investment Banking & Brokerage–1.76% | |
BGC Partners Inc., 8.13% Sr. Unsec. Pfd. | | | 1,000 | | | | 26,100 | |
See accompanying Notes to Financial Statements which are an integral part of the financial statements.
22 Invesco Multi-Asset Income Fund
| | | | | | | | |
| | | Shares | | | Vlaue | |
| Investment Banking & Brokerage–(continued) | |
Charles Schwab Corp. (The), Series B, 6.00% Pfd. | | | 5,800 | | | $ | 153,410 | |
Charles Schwab Corp. (The), Series C, 6.00% Pfd. | | | 6,800 | | | | 188,020 | |
Charles Schwab Corp. (The), Series D, 5.95% Pfd. | | | 10,200 | | | | 276,114 | |
Goldman Sachs Group, Inc. (The), 6.50% Sr. Unsec. Pfd. | | | 500 | | | | 12,490 | |
Goldman Sachs Group, Inc. (The), Series I, 5.95% Pfd. | | | 5,000 | | | | 129,100 | |
Goldman Sachs Group, Inc. (The), Series J, 5.50% Pfd. | | | 12,200 | | | | 318,054 | |
Goldman Sachs Group, Inc. (The), Series K, 6.38% Pfd. | | | 19,100 | | | | 544,923 | |
Goldman Sachs Group, Inc. (The), Series N, 6.30% Pfd. | | | 19,100 | | | | 509,206 | |
Morgan Stanley, Series E, 7.13% Pfd. | | | 3,000 | | | | 87,540 | |
Morgan Stanley, Series F, 6.88% Pfd. | | | 8,500 | | | | 247,010 | |
Morgan Stanley, Series G, 6.63% Pfd. | | | 6,800 | | | | 185,980 | |
Morgan Stanley, Series I, 6.38% Pfd. | | | 23,100 | | | | 637,560 | |
Raymond James Financial Inc., 6.90% Sr. Unsec. Pfd. | | | 3,800 | | | | 98,078 | |
Stifel Financial Corp., Series A, 6.25% Pfd. | | | 1,500 | | | | 40,320 | |
| | | | | | | | 3,453,905 | |
| | |
| Life & Health Insurance–0.86% | | | | | | | | |
Aegon N.V. (Netherlands), 6.38% Jr. Unsec. Sub. Pfd. | | | 2,900 | | | | 73,834 | |
Aegon N.V. (Netherlands), 8.00% Unsec. Sub. Pfd. | | | 20,100 | | | | 534,258 | |
Aflac Inc., 5.50% Jr. Unsec. Sub. Pfd. | | | 6,800 | | | | 175,848 | |
Protective Life Corp., 6.25% Unsec. Sub. Pfd. | | | 6,000 | | | | 154,980 | |
Prudential Financial Inc., 5.70% Jr. Unsec. Sub. Pfd. | | | 8,800 | | | | 228,536 | |
Prudential Financial Inc., 5.75% Jr. Unsec. Sub. Pfd. | | | 7,300 | | | | 192,647 | |
Prudential PLC (United Kingdom), 6.75% Jr. Unsec. Sub. Pfd. | | | 7,500 | | | | 198,600 | |
Torchmark Corp., 5.88% Jr. Unsec. Sub. Pfd. | | | 1,100 | | | | 28,435 | |
Torchmark Corp., 6.13% Jr. Unsec. Sub. Pfd. | | | 4,100 | | | | 110,823 | |
| | | | | | | | 1,697,961 | |
| | |
| Mortgage REIT’s–0.06% | | | | | | | | |
Wells Fargo Real Estate Investment Corp., Series A, 6.38% Pfd. | | | 4,300 | | | | 116,444 | |
| | |
| Multi-Line Insurance–0.27% | | | | | | | | |
American Financial Group, Inc., 6.00% Unsec. Sub. Pfd. | | | 1,500 | | | | 40,200 | |
American Financial Group, Inc., 6.38% Sr. Unsec. Pfd. | | | 5,800 | | | | 150,974 | |
Aviva PLC (United Kingdom), 8.25% Unsec. Sub. Pfd. | | | 4,900 | | | | 125,587 | |
Hartford Financial Services Group Inc. (The), 7.88% Jr. Unsec. Sub. Pfd. | | | 6,100 | | | | 190,808 | |
| | | | | | | | |
| | | Shares | | | Vlaue | |
| Multi-Line Insurance–(continued) | |
Kemper Corp., 7.38% Unsec. Sub. Pfd. | | | 1,200 | | | $ | 32,028 | |
| | | | | | | | 539,597 | |
| | |
| Multi-Utilities–0.31% | | | | | | | | |
Dominion Resources, Inc., Series A, 5.25% Jr. Unsec. Sub. Pfd. | | | 9,700 | | | | 241,821 | |
DTE Energy Co., 6.50% Jr. Unsec. Sub. Pfd. | | | 4,800 | | | | 122,256 | |
DTE Energy Co., Series B, 5.38% Jr. Unsec. Sub. Pfd. | | | 4,500 | | | | 113,670 | |
Integrys Holding, Inc., 6.00% Jr. Unsec. Sub. Pfd. | | | 4,900 | | | | 133,537 | |
| | | | | | | | 611,284 | |
| | |
| Office REIT’s–0.35% | | | | | | | | |
Alexandria Real Estate Equities Inc., Series E, 6.45% Pfd. | | | 1,200 | | | | 30,708 | |
Boston Properties, Inc., 5.25% Pfd. | | | 1,800 | | | | 47,070 | |
Equity Commonwealth, 5.75% Sr. Unsec. Pfd. | | | 1,300 | | | | 32,916 | |
Government Properties Income Trust, 5.88% Sr. Unsec. Pfd. | | | 4,200 | | | | 107,394 | |
Kilroy Realty Corp., Series G, 6.88% Pfd. | | | 900 | | | | 22,779 | |
Kilroy Realty Corp., Series H, 6.38% Pfd. | | | 900 | | | | 22,950 | |
SL Green Realty Corp., Series I, 6.50% Pfd. | | | 2,100 | | | | 54,579 | |
Vornado Realty Trust, Series L, 5.40% Pfd. | | | 14,600 | | | | 367,190 | |
| | | | | | | | 685,586 | |
| | |
| Office Services & Supplies–0.06% | | | | | | | | |
Pitney Bowes Inc., 6.70% Sr. Unsec. Pfd. | | | 4,300 | | | | 114,466 | |
|
| Oil & Gas Refining & Marketing–0.06% | |
NuStar Logistics L.P., 7.63% Jr. Unsec. Gtd. Sub. Pfd. | | | 4,500 | | | | 115,245 | |
|
| Oil & Gas Storage & Transportation–0.01% | |
Targa Resources Partners LP, Series A, 9.00% Pfd. | | | 1,000 | | | | 26,810 | |
|
| Other Diversified Financial Services–0.39% | |
ING Groep NV (Netherlands), 6.38% Jr. Unsec. Sub. Pfd. | | | 30,000 | | | | 774,000 | |
|
| Property & Casualty Insurance–0.90% | |
Allstate Corp. (The), 5.10% Unsec. Sub. Pfd. | | | 3,600 | | | | 96,696 | |
Allstate Corp. (The), 5.63% Pfd. | | | 2,800 | | | | 73,668 | |
Allstate Corp. (The), Series C, 6.75% Pfd. | | | 3,000 | | | | 81,030 | |
Allstate Corp. (The), Series E, 6.63% Pfd. | | | 9,700 | | | | 263,452 | |
Allstate Corp. (The), Series F, 6.25% Pfd. | | | 4,000 | | | | 109,000 | |
Arch Capital Group Ltd. (Bermuda), Series C, 6.75% Pfd. | | | 4,000 | | | | 102,280 | |
Arch Capital Group Ltd. (Bermuda), Series E, 5.25% Pfd. | | | 6,100 | | | | 148,718 | |
Argo Group U.S. Inc., 6.50% Sr. Unsec. Gtd. Pfd. | | | 1,300 | | | | 33,449 | |
See accompanying Notes to Financial Statements which are an integral part of the financial statements.
23 Invesco Multi-Asset Income Fund
| | | | | | | | |
| | | Shares | | | Vlaue | |
| Property & Casualty Insurance–(continued) | |
Aspen Insurance Holdings Ltd. (Bermuda), 5.63% Pfd. | | | 3,400 | | | $ | 86,938 | |
Aspen Insurance Holdings Ltd. (Bermuda), 5.95% Pfd. | | | 3,700 | | | | 105,302 | |
Aspen Insurance Holdings Ltd. (Bermuda), 7.25% Pfd. | | | 1,300 | | | | 33,540 | |
Assured Guaranty Municipal Holdings Inc., 6.25% Sr. Unsec. Gtd. Pfd. | | | 5,200 | | | | 138,320 | |
Axis Capital Holdings Ltd., Series C, 6.88% Pfd. | | | 7,300 | | | | 187,245 | |
Hanover Insurance Group, Inc. (The), 6.35% Jr. Unsec. Sub. Pfd. | | | 1,600 | | | | 41,168 | |
Selective Insurance Group, Inc., 5.88% Sr. Unsec. Pfd. | | | 1,600 | | | | 40,896 | |
W. R. Berkley Corp., 5.63% Jr. Unsec. Sub. Pfd. | | | 3,200 | | | | 82,016 | |
W. R. Berkley Corp., 5.75% Unsec. Sub. Pfd. | | | 6,100 | | | | 157,014 | |
| | | | | | | | 1,780,732 | |
| | |
| Regional Banks–1.72% | | | | | | | | |
Associated Banc-Corp, Series D, 5.38% Pfd. | | | 1,400 | | | | 35,000 | |
BB&T Corp., Series E, 5.63% Pfd. | | | 21,800 | | | | 562,440 | |
BB&T Corp., Series D, 5.85% Pfd. | | | 7,500 | | | | 192,225 | |
BB&T Corp., Series H, 5.63% Pfd. | | | 9,600 | | | | 254,112 | |
BOK Financial Corp., 5.38% Unsec. Sub. Pfd. | | | 1,300 | | | | 32,695 | |
Commerce Bancshares Inc., Series B, 6.00% Pfd. | | | 1,600 | | | | 43,344 | |
Cullen/Frost Bankers, Inc., 5.38% Pfd. | | | 1,400 | | | | 37,100 | |
Fifth Third Bancorp, Series I, 6.63% Pfd. | | | 5,500 | | | | 165,055 | |
First Horizon National Corp., Series A, 6.20% Pfd. | | | 900 | | | | 23,094 | |
First Republic Bank, Series A, 6.70% Pfd. | | | 2,100 | | | | 53,550 | |
First Republic Bank, Series B, 6.20% Pfd. | | | 2,200 | | | | 56,210 | |
First Republic Bank, Series D, 5.50% Pfd. | | | 900 | | | | 22,950 | |
First Republic Bank, Series E, 7.00% Pfd. | | | 1,800 | | | | 48,960 | |
First Republic Bank, Series F, 5.70% Pfd. | | | 2,300 | | | | 63,250 | |
First Republic Bank, Series G, 5.50% Pfd. | | | 1,300 | | | | 33,969 | |
FNB Corp., 7.25% Pfd. | | | 1,000 | | | | 29,790 | |
Hancock Holding Co., 5.95% Unsec. Sub. Pfd. | | | 1,800 | | | | 46,980 | |
Huntington Bancshares, Inc., Series C, 5.88% Pfd. | | | 900 | | | | 23,256 | |
Huntington Bancshares, Inc., Series D, 6.25% Pfd. | | | 6,500 | | | | 173,940 | |
PNC Financial Services Group, Inc. (The), Series P, 6.13% Pfd. | | | 24,500 | | | | 690,900 | |
Regions Financial Corp., Series A, 6.38% Pfd. | | | 6,100 | | | | 158,478 | |
Regions Financial Corp., Series B, 6.38% Pfd. | | | 6,800 | | | | 195,636 | |
SunTrust Banks, Inc., Series E, 5.88% Pfd. | | | 5,500 | | | | 142,615 | |
TCF Financial Corp., 7.50% Pfd. | | | 1,200 | | | | 31,344 | |
TCF Financial Corp., Series B, 6.45% Pfd. | | | 1,200 | | | | 30,948 | |
| | | | | | | | |
| | | Shares | | | Vlaue | |
| Regional Banks–(continued) | | | | | | | | |
Texas Capital Bancshares, Inc., Series A, 6.50% Pfd. | | | 2,400 | | | $ | 61,896 | |
Valley National Bancorp, Series A, 6.25% Pfd. | | | 1,000 | | | | 28,830 | |
Webster Financial Corp., Series E, 6.40% Pfd. | | | 1,100 | | | | 28,512 | |
Wintrust Financial Corp., Series D, 6.50% Pfd. | | | 1,500 | | | | 42,315 | |
Zions Bancorp., Series F, 7.90% Pfd. | | | 2,872 | | | | 74,959 | |
| | | | | | | | 3,384,353 | |
| | |
| Reinsurance–0.46% | | | | | | | | |
Endurance Specialty Holdings Ltd., Series C, 6.35% Pfd. | | | 1,900 | | | | 50,616 | |
Maiden Holdings, Ltd., 6.63% Sr. Unsec. Pfd. | | | 1,000 | | | | 26,470 | |
Maiden Holdings, Ltd., Series A, 8.25% Pfd. | | | 3,300 | | | | 86,064 | |
Maiden Holdings, Ltd., Series C, 7.13% Pfd. | | | 1,900 | | | | 49,457 | |
PartnerRe Ltd. (Bermuda), Series H, 7.25% Pfd. | | | 8,700 | | | | 259,260 | |
Reinsurance Group of America, Inc., 5.75% Unsec. Sub. Pfd. | | | 6,000 | | | | 172,080 | |
Reinsurance Group of America, Inc., 6.20% Unsec. Sub. Pfd. | | | 3,300 | | | | 94,347 | |
RenaissanceRe Holdings Ltd. (Bermuda), Series E, 5.38% Pfd. | | | 4,900 | | | | 125,636 | |
Validus Holdings, Ltd., Series A, 5.88% Pfd. | | | 1,300 | | | | 32,955 | |
| | | | | | | | 896,885 | |
| | |
| Retail REIT’s–0.34% | | | | | | | | |
DDR Corp., Series J, 6.50% Pfd. | | | 3,200 | | | | 82,240 | |
Kimco Realty Corp., Series I, 6.00% Pfd. | | | 8,600 | | | | 218,096 | |
National Retail Properties Inc., Series D, 6.63% Pfd. | | | 7,000 | | | | 178,850 | |
Realty Income Corp., Series F, 6.63% Pfd. | | | 5,000 | | | | 127,500 | |
Regency Centers Corp., Series 6, 6.63% Pfd. | | | 2,300 | | | | 58,581 | |
| | | | | | | | 665,267 | |
| | |
| Specialized REIT’s–0.83% | | | | | | | | |
Digital Realty Trust, Inc., Series F, 6.63% Pfd. | | | 3,300 | | | | 84,480 | |
Digital Realty Trust, Inc., Series G, 5.88% Pfd. | | | 4,500 | | | | 115,920 | |
Digital Realty Trust, Inc., Series H, 7.38% Pfd. | | | 4,500 | | | | 124,785 | |
DuPont Fabros Technology, Inc., Series C, 6.63% Pfd. | | | 3,000 | | | | 82,500 | |
EPR Properties, Series F, 6.63% Pfd. | | | 1,100 | | | | 28,600 | |
Public Storage, Series A, 5.88% Pfd. | | | 8,400 | | | | 224,364 | |
Public Storage, Series B, 5.40% Pfd. | | | 10,900 | | | | 281,002 | |
Public Storage, Series C, 5.13% Pfd. | | | 8,800 | | | | 224,928 | |
Public Storage, Series D, 4.95% Pfd. | | | 9,700 | | | | 238,620 | |
Public Storage, Series Y, 6.38% Pfd. | | | 8,100 | | | | 221,211 | |
| | | | | | | | 1,626,410 | |
See accompanying Notes to Financial Statements which are an integral part of the financial statements.
24 Invesco Multi-Asset Income Fund
| | | | | | | | |
| | | Shares | | | Vlaue | |
| Thrifts & Mortgage Finance–0.02% | |
Astoria Financial Corp., Series C, 6.50% Pfd. | | | 1,200 | | | $ | 31,392 | |
|
| Trading Companies & Distributors–0.02% | |
GATX Corp., 5.63% Sr. Unsec. Pfd. | | | 1,300 | | | | 33,176 | |
|
| Wireless Telecommunication Services–0.28% | |
Telephone & Data Systems Inc., 7.00% Sr. Unsec. Pfd. | | | 11,400 | | | | 290,358 | |
United States Cellular Corp., 6.95% Sr. Unsec. Pfd. | | | 3,100 | | | | 81,003 | |
United States Cellular Corp., 7.25% Sr. Unsec. Pfd. | | | 2,800 | | | | 73,276 | |
United States Cellular Corp., 7.25% Sr. Unsec. Pfd. | | | 4,100 | | | | 108,691 | |
| | | | | | | | 553,328 | |
Total Preferred Stocks
(Cost $41,691,768) | | | | | | | 42,947,243 | |
|
| Common Stocks & Other Equity Interests–16.65% | |
| Diversified REIT’s–2.37% | | | | | | | | |
Armada Hoffler Properties, Inc. | | | 32,083 | | | | 430,875 | |
Gladstone Commercial Corp. | | | 39,210 | | | | 699,898 | |
Global Net Lease, Inc. | | | 87,287 | | | | 646,797 | |
Gramercy Property Trust | | | 39,770 | | | | 366,679 | |
Investors Real Estate Trust | | | 99,888 | | | | 606,320 | |
Lexington Realty Trust | | | 49,467 | | | | 501,595 | |
Spirit Realty Capital, Inc. | | | 33,769 | | | | 402,189 | |
VEREIT, Inc. | | | 42,656 | | | | 400,966 | |
Whitestone REIT | | | 45,985 | | | | 611,601 | |
| | | | | | | | 4,666,920 | |
| | |
| Health Care REIT’s–1.65% | | | | | | | | |
Care Capital Properties, Inc. | | | 21,470 | | | | 570,458 | |
Community Healthcare Trust, Inc. | | | 24,560 | | | | 549,653 | |
Medical Properties Trust Inc. | | | 33,416 | | | | 465,819 | |
New Senior Investment Group Inc. | | | 57,377 | | | | 597,868 | |
Sabra Health Care REIT, Inc. | | | 21,916 | | | | 510,643 | |
Senior Housing Properties Trust | | | 26,473 | | | | 563,081 | |
| | | | | | | | 3,257,522 | |
| | |
| Hotel and Resort REIT’s–0.51% | | | | | | | | |
Ashford Hospitality Trust, Inc. | | | 83,681 | | | | 486,187 | |
Hospitality Properties Trust | | | 18,585 | | | | 508,485 | |
| | | | | | | | 994,672 | |
| | |
| Industrial REIT’s–0.42% | | | | | | | | |
Monmouth REIT Corp. | | | 27,655 | | | | 378,044 | |
STAG Industrial, Inc. | | | 19,095 | | | | 440,521 | |
| | | | | | | | 818,565 | |
| | |
| Mortgage REIT’s–8.51% | | | | | | | | |
AGNC Investment Corp. | | | 86,287 | | | | 1,730,917 | |
Altisource Residential Corp. | | | 23,287 | | | | 234,500 | |
Annaly Capital Management, Inc. | | | 154,975 | | | | 1,605,541 | |
| | | | | | | | |
| | | Shares | | | Vlaue | |
| Mortgage REIT’s–(continued) | |
Apollo Commercial Real Estate Finance, Inc. | | | 28,815 | | | $ | 487,550 | |
ARMOUR Residential REIT, Inc. | | | 15,692 | | | | 355,738 | |
Blackstone Mortgage Trust, Inc.–Class A | | | 40,161 | | | | 1,212,862 | |
Capstead Mortgage Corp. | | | 41,067 | | | | 390,547 | |
Chimera Investment Corp. | | | 80,281 | | | | 1,258,003 | |
Colony Capital, Inc.–Class A | | | 48,664 | | | | 925,103 | |
CYS Investments, Inc. | | | 64,743 | | | | 558,085 | |
Hannon Armstrong Sustainable Infrastructure Capital, Inc. | | | 18,522 | | | | 423,413 | |
Ladder Capital Corp. | | | 46,845 | | | | 593,995 | |
MFA Financial, Inc. | | | 158,726 | | | | 1,160,287 | |
MTGE Investment Corp. | | | 19,579 | | | | 333,822 | |
New Residential Investment Corp. | | | 98,581 | | | | 1,376,191 | |
New York Mortgage Trust, Inc. | | | 46,845 | | | | 276,854 | |
PennyMac Mortgage Investment Trust | | | 28,941 | | | | 440,482 | |
Redwood Trust, Inc. | | | 32,909 | | | | 462,700 | |
Starwood Property Trust, Inc. | | | 76,182 | | | | 1,694,288 | |
Two Harbors Investment Corp. | | | 148,668 | | | | 1,238,404 | |
| | | | | | | | 16,759,282 | |
| | |
| Office REIT’s–0.50% | | | | | | | | |
Franklin Street Properties Corp. | | | 40,802 | | | | 472,079 | |
Government Properties Income Trust | | | 26,833 | | | | 513,584 | |
| | | | | | | | 985,663 | |
| | |
| Residential REIT’s–0.53% | | | | | | | | |
Independence Realty Trust, Inc. | | | 68,283 | | | | 568,798 | |
Preferred Apartment Communities, Inc.–Class A | | | 35,815 | | | | 466,311 | |
| | | | | | | | 1,035,109 | |
| | |
| Retail REIT’s–0.48% | | | | | | | | |
CBL & Associates Properties, Inc. | | | 44,087 | | | | 471,731 | |
Washington Prime Group Inc. | | | 44,862 | | | | 470,602 | |
| | | | | | | | 942,333 | |
| | |
| Specialized REIT’s–1.68% | | | | | | | | |
Corrections Corp. of America | | | 72,089 | | | | 1,041,686 | |
EPR Properties | | | 5,302 | | | | 385,561 | |
Gaming and Leisure Properties, Inc. | | | 17,368 | | | | 570,192 | |
Geo Group Inc. (The) | | | 54,831 | | | | 1,313,751 | |
| | | | | | | | 3,311,190 | |
Total Common Stocks & Other Equity Interests
(Cost $31,334,998) | | | | 32,771,256 | |
| | |
| | | Principal
Amount | | | | |
U.S. Treasury Securities–8.16% | |
| U.S. Treasury Bills–0.13% | | | | | | | | |
0.27%, 11/17/2016(d)(e) | | $ | 105,000 | | | | 104,992 | |
0.28%, 11/17/2016(d)(e) | | | 160,000 | | | | 159,988 | |
| | | | | | | | 264,980 | |
See accompanying Notes to Financial Statements which are an integral part of the financial statements.
25 Invesco Multi-Asset Income Fund
| | | | | | | | |
| | | Principal
Amount | | | Value | |
| U.S. Treasury STRIPS–8.03% | |
2.28%, 02/15/2043(d)(f) | | $ | 2,550,000 | | | $ | 1,272,899 | |
2.30%, 02/15/2043(d)(f) | | | 1,700,000 | | | | 848,599 | |
2.32%, 02/15/2043(d)(f) | | | 650,000 | | | | 324,464 | |
2.34%, 02/15/2043(d)(f) | | | 2,650,000 | | | | 1,322,816 | |
2.38%, 02/15/2043(d)(f) | | | 450,000 | | | | 224,629 | |
2.50%, 02/15/2043(d)(f) | | | 1,900,000 | | | | 948,435 | |
3.03%, 02/15/2043(d)(f) | | | 1,100,000 | | | | 549,094 | |
3.07%, 02/15/2043(d)(f) | | | 2,700,000 | | | | 1,347,775 | |
3.36%, 02/15/2043(d)(f) | | | 2,450,000 | | | | 1,222,981 | |
3.98%, 02/15/2043(d)(f) | | | 10,800,000 | | | | 5,391,101 | |
4.11%, 02/15/2043(d)(f) | | | 4,700,000 | | | | 2,346,127 | |
| | | | | | | | 15,798,920 | |
Total U.S. Treasury Securities
(Cost $13,793,134) | | | | | | | 16,063,900 | |
| | |
| | | Shares | | | | |
Exchange-Traded Notes–4.12% | |
JPMorgan Alerian MLP Index ETN, 6.53%, 05/24/2024(g) (Cost $8,376,699) | | | 269,000 | | | | 8,107,660 | |
| | |
| | | Principal
Amount | | | | |
Non-U.S. Dollar Denominated Bonds & Notes–
0.35%(h) | |
| Cable & Satellite–0.19% | | | | | | | | |
Virgin Media Secured Finance PLC (United Kingdom),
Sr. Sec. Gtd. First Lien Notes,
4.88%, 01/15/2027(b) | | GBP | 100,000 | | | | 120,086 | |
REGS, Sr. Sec. Gtd. First Lien Medium-Term Euro Notes,
5.13%, 01/15/2025(b) | | GBP | 200,000 | | | | 248,217 | |
| | | | | | | | 368,303 | |
| | | | | | | | |
| | | Principal
Amount | | | Value | |
| Hotels, Resorts & Cruise Lines–0.06% | |
Thomas Cook Finance PLC (United Kingdom), Sr. Unsec. Gtd. Bonds,
6.75%, 06/15/2021(b) | | EUR | 100,000 | | | $ | 112,822 | |
|
| Multi-Sector Holdings–0.04% | |
Gala Electric Casinos Ltd. (United Kingdom), REGS, Sec. Gtd. Second Lien Euro Notes,
11.50%, 06/01/2019(b) | | GBP | 63,636 | | | | 80,993 | |
|
| Other Diversified Financial Services–0.06% | |
Garfunkelux Holdco 3 S.A. (Luxembourg), REGS, Sr. Sec. Gtd. First Lien Euro Notes,
8.50%, 11/01/2022(b) | | GBP | 100,000 | | | | 121,554 | |
Total Non-U.S. Dollar Denominated Bonds & Notes (Cost $793,832) | | | | 683,672 | |
| | |
| | | Shares | | | | |
Money Market Funds–7.34% | |
Government & Agency Portfolio–Institutional Class, 0.29% (i) | | | 8,664,018 | | | | 8,664,018 | |
Treasury Portfolio–Institutional Class, 0.22%(i) | | | 5,776,012 | | | | 5,776,012 | |
Total Money Market Funds
(Cost $14,440,030) | | | | 14,440,030 | |
TOTAL INVESTMENTS–98.36%
(Cost $188,915,091) | | | | 193,596,315 | |
OTHER ASSETS LESS LIABILITIES–1.64% | | | | 3,221,228 | |
NET ASSETS–100.00% | | | $ | 196,817,543 | |
Investment Abbreviations:
| | |
| EUR | | – Euro |
| ETN | | – Exchange-Traded Notes |
| GBP | | – British Pound Sterling |
| Gtd. | | – Guaranteed |
| Jr. | | – Junior |
| MLP | | – Master Limited Partnerships |
| Pfd. | | – Preferred |
| | |
| REGS | | – Regulation S |
| REIT | | – Real Estate Investment Trust |
| Sec. | | – Secured |
| Sr. | | – Senior |
| STRIPS | | – Separately Traded Registered Interest and Principal Security |
| Sub. | | – Subordinated |
| Unsec. | | – Unsecured |
Notes to Schedule of Investments:
| (a) | Industry and/or sector classifications used in this report are generally according to the Global Industry Classification Standard, which was developed by and is the exclusive property and a service mark of MSCI Inc. and Standard & Poor’s. |
| (b) | Security purchased or received in a transaction exempt from registration under the Securities Act of 1933, as amended (the “1933 Act”). The security may be resold pursuant to an exemption from registration under the 1933 Act, typically to qualified institutional buyers. The aggregate value of these securities at October 31, 2016 was $39,258,920, which represented 19.95% of the Fund’s Net Assets. |
| (c) | Perpetual bond with no specified maturity date. |
| (d) | Security traded on a discount basis. The interest rate shown represents the discount rate at the time of purchase by the Fund. |
| (e) | All or a portion of the value was pledged as collateral to cover margin requirements for open swap agreements. See Note 1N and Note 4. |
| (f) | All or a portion of the value was pledged as collateral to cover margin requirements for open futures contracts. See Note 1M and Note 4 |
| (g) | Interest or dividend rate is redetermined periodically. Rate shown is the rate in effect on October 31, 2016. |
| (h) | Foreign denominated security. Principal amount is denominated in the currency indicated. |
| (i) | The money market fund and the Fund are affiliated by having the same investment adviser. The rate shown is the 7-day SEC standardized yield as of October 31, 2016. |
See accompanying Notes to Financial Statements which are an integral part of the financial statements.
26 Invesco Multi-Asset Income Fund
Statement of Assets and Liabilities
October 31, 2016
| | | | |
Assets: | |
Investments, at value (Cost $174,475,061) | | $ | 179,156,285 | |
Investments in affiliated money market funds, at value and cost | | | 14,440,030 | |
Total investments, at value (Cost $188,915,091) | | | 193,596,315 | |
Cash | | | 117,179 | |
Foreign currencies, at value (Cost $131,868) | | | 130,767 | |
Receivable for: | | | | |
Investments sold | | | 734,425 | |
Fund shares sold | | | 1,869,160 | |
Dividends and interest | | | 1,407,817 | |
Fund expenses absorbed | | | 6,563 | |
Investment for trustee deferred compensation and retirement plans | | | 23,661 | |
Unrealized appreciation on forward foreign currency contracts outstanding | | | 54,259 | |
Other assets | | | 55,480 | |
Total assets | | | 197,995,626 | |
|
Liabilities: | |
Payable for: | | | | |
Investments purchased | | | 507,076 | |
Fund shares reacquired | | | 396,408 | |
Variation margin — futures | | | 72,856 | |
Variation margin — centrally cleared swap agreements | | | 4,155 | |
Accrued fees to affiliates | | | 87,210 | |
Accrued trustees’ and officers’ fees and benefits | | | 1,616 | |
Accrued other operating expenses | | | 79,504 | |
Trustee deferred compensation and retirement plans | | | 26,615 | |
Unrealized depreciation on forward foreign currency contracts outstanding | | | 2,643 | |
Total liabilities | | | 1,178,083 | |
Net assets applicable to shares outstanding | | $ | 196,817,543 | |
|
Net assets consist of: | |
Shares of beneficial interest | | $ | 201,446,012 | |
Undistributed net investment income | | | (145,929 | ) |
Undistributed net realized gain (loss) | | | (9,560,585 | ) |
Net unrealized appreciation | | | 5,078,045 | |
| | | $ | 196,817,543 | |
| | | | |
Net Assets: | |
Class A | | $ | 91,584,700 | |
Class C | | $ | 24,237,749 | |
Class R | | $ | 538,405 | |
Class Y | | $ | 31,049,284 | |
Class R5 | | $ | 19,405 | |
Class R6 | | $ | 49,388,000 | |
|
Shares outstanding, $0.01 par value per share,
with an unlimited number of shares authorized: | |
Class A | | | 8,713,272 | |
Class C | | | 2,308,038 | |
Class R | | | 51,235 | |
Class Y | | | 2,952,998 | |
Class R5 | | | 1,845 | |
Class R6 | | | 4,697,380 | |
Class A: | | | | |
Net asset value per share | | $ | 10.51 | |
Maximum offering price per share | | | | |
(Net asset value of $10.51 ¸ 94.50%) | | $ | 11.12 | |
Class C: | | | | |
Net asset value and offering price per share | | $ | 10.50 | |
Class R: | | | | |
Net asset value and offering price per share | | $ | 10.51 | |
Class Y: | | | | |
Net asset value and offering price per share | | $ | 10.51 | |
Class R5: | | | | |
Net asset value and offering price per share | | $ | 10.52 | |
Class R6: | | | | |
Net asset value and offering price per share | | $ | 10.51 | |
See accompanying Notes to Financial Statements which are an integral part of the financial statements.
27 Invesco Multi-Asset Income Fund
Statement of Operations
For the year ended October 31, 2016
| | | | |
Investment income: | |
Interest (net of foreign withholding taxes of $1,009) | | $ | 4,127,449 | |
Dividends (net of foreign withholding taxes of $1,141) | | | 4,043,329 | |
Dividends from affiliated money market funds | | | 38,708 | |
Total investment income | | | 8,209,486 | |
| |
Expenses: | | | | |
Advisory fees | | | 946,304 | |
Administrative services fees | | | 50,000 | |
Custodian fees | | | 26,058 | |
Distribution fees: | | | | |
Class A | | | 145,662 | |
Class C | | | 181,961 | |
Class R | | | 1,880 | |
Transfer agent fees — A, C, R and Y | | | 124,851 | |
Transfer agent fees — R6 | | | 289 | |
Trustees’ and officers’ fees and benefits | | | 21,697 | |
Registration and filing fees | | | 92,659 | |
Licensing Fees | | | 40,423 | |
Reports to shareholders | | | 40,564 | |
Professional services fees | | | 55,889 | |
Other | | | 38,132 | |
Total expenses | | | 1,766,369 | |
Less: Fees waived, expenses reimbursed and expense offset arrangement(s) | | | (286,601 | ) |
Net expenses | | | 1,479,768 | |
Net investment income | | | 6,729,718 | |
| |
Realized and unrealized gain (loss) from: | | | | |
Net realized gain (loss) from: | | | | |
Investment securities | | | (707,393 | ) |
Foreign currencies | | | 733 | |
Forward foreign currency contracts | | | 156,608 | |
Futures contracts | | | 1,558,873 | |
Swap agreements | | | (27,606 | ) |
| | | | 981,215 | |
Change in net unrealized appreciation (depreciation) of: | | | | |
Investment securities | | | 2,205,953 | |
Foreign currencies | | | (1,718 | ) |
Forward foreign currency contracts | | | 42,521 | |
Futures contracts | | | (368,354 | ) |
Swap agreements | | | 14,837 | |
| | | | 1,893,239 | |
Net realized and unrealized gain | | | 2,874,454 | |
Net increase in net assets resulting from operations | | $ | 9,604,172 | |
See accompanying Notes to Financial Statements which are an integral part of the financial statements.
28 Invesco Multi-Asset Income Fund
Statement of Changes in Net Assets
For the years ended October 31, 2016 and 2015
| | | | | | | | |
| | | 2016 | | | 2015 | |
Operations: | | | | | |
Net investment income | | $ | 6,729,718 | | | $ | 6,262,903 | |
Net realized gain (loss) | | | 981,215 | | | | (3,404,074 | ) |
Change in net unrealized appreciation (depreciation) | | | 1,893,239 | | | | (487,253 | ) |
Net increase in net assets resulting from operations | | | 9,604,172 | | | | 2,371,576 | |
| | |
Distributions to shareholders from net investment income: | | | | | | | | |
Class A | | | (2,847,881 | ) | | | (2,285,486 | ) |
Class C | | | (751,745 | ) | | | (649,749 | ) |
Class R | | | (17,519 | ) | | | (7,758 | ) |
Class Y | | | (825,464 | ) | | | (631,870 | ) |
Class R5 | | | (587 | ) | | | (513 | ) |
Class R6 | | | (2,805,712 | ) | | | (2,998,898 | ) |
Total distributions from net investment income | | | (7,248,908 | ) | | | (6,574,274 | ) |
| | |
Share transactions–net: | | | | | | | | |
Class A | | | 37,737,567 | | | | 12,053,236 | |
Class C | | | 6,501,206 | | | | 2,778,173 | |
Class R | | | 194,926 | | | | 201,235 | |
Class Y | | | 18,353,047 | | | | 6,112,094 | |
Class R5 | | | 9,064 | | | | — | |
Class R6 | | | (18,420,097 | ) | | | 18,253,102 | |
Net increase in net assets resulting from share transactions | | | 44,375,713 | | | | 39,397,840 | |
Net increase in net assets | | | 46,730,977 | | | | 35,195,142 | |
| | |
Net assets: | | | | | | | | |
Beginning of year | | | 150,086,566 | | | | 114,891,424 | |
End of year (includes undistributed net investment income of $(145,929) and $(122,117), respectively) | | $ | 196,817,543 | | | $ | 150,086,566 | |
Notes to Financial Statements
October 31, 2016
NOTE 1—Significant Accounting Policies
Invesco Multi-Asset Income Fund (the “Fund”), formerly Invesco Premium Income Fund, is a series portfolio of AIM Investment Funds (Invesco Investment Funds) (the “Trust”). The Trust is organized as a Delaware statutory trust and is registered under the Investment Company Act of 1940, as amended (the “1940 Act”), as an open-end series management investment company consisting of twenty-two separate series portfolios, each authorized to issue an unlimited number of shares of beneficial interest. The assets, liabilities and operations of each portfolio are accounted for separately. Information presented in these financial statements pertains only to the Fund. Matters affecting each portfolio or class will be voted on exclusively by the shareholders of such portfolio or class.
The Fund’s investment objective is to provide current income.
The Fund currently consists of six different classes of shares: Class A, Class C, Class R, Class Y, Class R5 and Class R6. Class Y shares are available only to certain investors. Class A shares are sold with a front-end sales charge unless certain waiver criteria are met and under certain circumstances load waived shares may be subject to contingent deferred sales charges (“CDSC”). Class C shares are sold with a CDSC. Class R, Class Y, Class R5 and Class R6 shares are sold at net asset value.
The following is a summary of the significant accounting policies followed by the Fund in the preparation of its financial statements.
| A. | Security Valuations — Securities, including restricted securities, are valued according to the following policy. |
Debt obligations (including convertible securities) and unlisted equities are fair valued using an evaluated quote provided by an independent pricing service. Evaluated quotes provided by the pricing service may be determined without exclusive reliance on quoted prices, and may reflect appropriate factors such as institution-size trading in similar groups of securities, developments related to specific securities, dividend rate (for unlisted equities), yield (for debt obligations), quality, type of issue, coupon rate (for debt obligations), maturity (for debt obligations), individual trading characteristics and other market data. Debt obligations are subject to interest rate and credit risks. In addition, all debt obligations involve some risk of default with respect to interest and/or principal payments.
A security listed or traded on an exchange (except convertible securities) is valued at its last sales price or official closing price as of the close of the customary trading session on the exchange where the security is principally traded, or lacking any sales or official closing price on a particular day, the security may be valued at the closing bid price on that day. Securities traded in the over-the-counter market are valued based
29 Invesco Multi-Asset Income Fund
on prices furnished by independent pricing services or market makers. When such securities are valued by an independent pricing service they may be considered fair valued. Futures contracts are valued at the final settlement price set by an exchange on which they are principally traded. Listed options are valued at the mean between the last bid and asked prices from the exchange on which they are principally traded. Options not listed on an exchange are valued by an independent source at the mean between the last bid and asked prices. For purposes of determining net asset value (“NAV”) per share, futures and option contracts generally are valued 15 minutes after the close of the customary trading session of the New York Stock Exchange (“NYSE”).
Investments in open-end and closed-end registered investment companies that do not trade on an exchange are valued at the end-of-day net asset value per share. Investments in open-end and closed-end registered investment companies that trade on an exchange are valued at the last sales price or official closing price as of the close of the customary trading session on the exchange where the security is principally traded.
Swap agreements are fair valued using an evaluated quote, if available, provided by an independent pricing service. Evaluated quotes provided by the pricing service are valued based on a model which may include end-of-day net present values, spreads, ratings, industry, company performance and returns of referenced assets.
Foreign securities’ (including foreign exchange contracts) prices are converted into U.S. dollar amounts using the applicable exchange rates as of the close of the NYSE. If market quotations are available and reliable for foreign exchange-traded equity securities, the securities will be valued at the market quotations. Because trading hours for certain foreign securities end before the close of the NYSE, closing market quotations may become unreliable. If between the time trading ends on a particular security and the close of the customary trading session on the NYSE, events occur that the Adviser determines are significant and make the closing price unreliable, the Fund may fair value the security. If the event is likely to have affected the closing price of the security, the security will be valued at fair value in good faith using procedures approved by the Board of Trustees. Adjustments to closing prices to reflect fair value may also be based on a screening process of an independent pricing service to indicate the degree of certainty, based on historical data, that the closing price in the principal market where a foreign security trades is not the current value as of the close of the NYSE. Foreign securities’ prices meeting the approved degree of certainty that the price is not reflective of current value will be priced at the indication of fair value from the independent pricing service. Multiple factors may be considered by the independent pricing service in determining adjustments to reflect fair value and may include information relating to sector indices, American Depositary Receipts and domestic and foreign index futures. Foreign securities may have additional risks including exchange rate changes, potential for sharply devalued currencies and high inflation, political and economic upheaval, the relative lack of issuer information, relatively low market liquidity and the potential lack of strict financial and accounting controls and standards.
Securities for which market prices are not provided by any of the above methods may be valued based upon quotes furnished by independent sources. The last bid price may be used to value equity securities. The mean between the last bid and asked prices is used to value debt obligations, including corporate loans.
Securities for which market quotations are not readily available or became unreliable are valued at fair value as determined in good faith by or under the supervision of the Trust’s officers following procedures approved by the Board of Trustees. Issuer specific events, market trends, bid/asked quotes of brokers and information providers and other market data may be reviewed in the course of making a good faith determination of a security’s fair value.
The Fund may invest in securities that are subject to interest rate risk, meaning the risk that the prices will generally fall as interest rates rise and, conversely, the prices will generally rise as interest rates fall. Specific securities differ in their sensitivity to changes in interest rates depending on their individual characteristics. Changes in interest rates may result in increased market volatility, which may affect the value and/or liquidity of certain Fund investments.
Valuations change in response to many factors including the historical and prospective earnings of the issuer, the value of the issuer’s assets, general economic conditions, interest rates, investor perceptions and market liquidity. Because of the inherent uncertainties of valuation, the values reflected in the financial statements may materially differ from the value received upon actual sale of those investments.
| B. | Securities Transactions and Investment Income — Securities transactions are accounted for on a trade date basis. Realized gains or losses on sales are computed on the basis of specific identification of the securities sold. Interest income (net of withholding tax, if any) is recorded on the accrual basis from settlement date. Paydown gains and losses on mortgage and asset-backed securities are recorded as adjustments to interest income. Dividend income (net of withholding tax, if any) is recorded on the ex-dividend date. Bond premiums and discounts are amortized and/or accreted for financial reporting purposes. |
The Fund may periodically participate in litigation related to Fund investments. As such, the Fund may receive proceeds from litigation settlements. Any proceeds received are included in the Statement of Operations as realized gain (loss) for investments no longer held and as unrealized gain (loss) for investments still held.
Brokerage commissions and mark ups are considered transaction costs and are recorded as an increase to the cost basis of securities purchased and/or a reduction of proceeds on a sale of securities. Such transaction costs are included in the determination of net realized and unrealized gain (loss) from investment securities reported in the Statement of Operations and the Statement of Changes in Net Assets and the net realized and unrealized gains (losses) on securities per share in the Financial Highlights. Transaction costs are included in the calculation of the Fund’s net asset value and, accordingly, they reduce the Fund’s total returns. These transaction costs are not considered operating expenses and are not reflected in net investment income reported in the Statement of Operations and the Statement of Changes in Net Assets, or the net investment income per share and the ratios of expenses and net investment income reported in the Financial Highlights, nor are they limited by any expense limitation arrangements between the Fund and the investment adviser.
The Fund allocates income and realized and unrealized capital gains and losses to a class based on the relative net assets of each class.
| C. | Country Determination — For the purposes of making investment selection decisions and presentation in the Schedule of Investments, the investment adviser may determine the country in which an issuer is located and/or credit risk exposure based on various factors. These factors include the laws of the country under which the issuer is organized, where the issuer maintains a principal office, the country in which the issuer derives 50% or more of its total revenues and the country that has the primary market for the issuer’s securities, as well as other criteria. Among the other criteria that may be evaluated for making this determination are the country in which the issuer maintains 50% or more of its assets, the type of security, financial guarantees and enhancements, the nature of the collateral and the sponsor organization. Country of issuer and/or credit risk exposure has been determined to be the United States of America, unless otherwise noted. |
30 Invesco Multi-Asset Income Fund
| D. | Distributions — Distributions from net investment income, if any, are declared and paid monthly. Distributions from net realized capital gain, if any, are generally declared and paid annually and recorded on the ex-dividend date. The Fund may elect to treat a portion of the proceeds from redemptions as distributions for federal income tax purposes. |
| E. | Master Limited Partnerships — The Fund invests in Master Limited Partnerships (“MLPs”). MLPs are publicly traded partnerships and limited liability companies taxed as partnerships under the Internal Revenue Code of 1986, as amended (the “Internal Revenue Code”). The Fund invests in MLPs engaged in, among other things, the transportation, storage, processing, refining, marketing, exploration, production and mining of minerals and natural resources. The Fund is a partner in each MLP; accordingly, the Fund is required to take into account the Fund’s allocable share of income, gains, losses, deductions, expenses, and tax credits recognized by each MLP. |
MLP’s may be less liquid and subject to more abrupt or erratic price movements than conventional publicly traded securities.
| F. | Federal Income Taxes — The Fund intends to comply with the requirements of Subchapter M of the Internal Revenue Code of 1986, as amended (the “Internal Revenue Code”), necessary to qualify as a regulated investment company and to distribute substantially all of the Fund’s taxable earnings to shareholders. As such, the Fund will not be subject to federal income taxes on otherwise taxable income (including net realized capital gain) that is distributed to shareholders. Therefore, no provision for federal income taxes is recorded in the financial statements. |
The Fund recognizes the tax benefits of uncertain tax positions only when the position is more likely than not to be sustained. Management has analyzed the Fund’s uncertain tax positions and concluded that no liability for unrecognized tax benefits should be recorded related to uncertain tax positions. Management is not aware of any tax positions for which it is reasonably possible that the total amounts of unrecognized tax benefits will change materially in the next 12 months.
The Fund files tax returns in the U.S. Federal jurisdiction and certain other jurisdictions. Generally, the Fund is subject to examinations by such taxing authorities for up to three years after the filing of the return for the tax period.
| G. | Expenses — Fees provided for under the Rule 12b-1 plan of a particular class of the Fund are charged to the operations of such class. Transfer agency fees and expenses and other shareholder recordkeeping fees and expenses attributable to Class R5 and Class R6 are allocated to each share class based on relative net assets. Sub-accounting fees attributable to Class R5 are charged to the operations of the class. Transfer agency fees and expenses and other shareholder recordkeeping fees and expenses relating to all other classes are allocated among those classes based on relative net assets. All other expenses are allocated among the classes based on relative net assets. |
| H. | Accounting Estimates — The preparation of financial statements in conformity with accounting principles generally accepted in the United States of America (“GAAP”) requires management to make estimates and assumptions that affect the reported amounts of assets and liabilities at the date of the financial statements and the reported amounts of revenues and expenses during the reporting period including estimates and assumptions related to taxation. Actual results could differ from those estimates by a significant amount. In addition, the Fund monitors for material events or transactions that may occur or become known after the period-end date and before the date the financial statements are released to print. |
| I. | Indemnifications — Under the Trust’s organizational documents, each Trustee, officer, employee or other agent of the Trust is indemnified against certain liabilities that may arise out of the performance of their duties to the Fund. Additionally, in the normal course of business, the Fund enters into contracts, including the Fund’s servicing agreements, that contain a variety of indemnification clauses. The Fund’s maximum exposure under these arrangements is unknown as this would involve future claims that may be made against the Fund that have not yet occurred. The risk of material loss as a result of such indemnification claims is considered remote. |
| J. | Exchange-traded Notes — The Fund may invest in exchange-traded notes (“ETNs”) which are senior, unsecured, unsubordinated debt securities whose returns are linked to the performance of a particular market benchmark or strategy, minus applicable fees. ETNs can be traded on an exchange and/or they can be held to maturity. At maturity, the issuer pays the investor a cash amount equal to the principal amount, subject to the day’s market benchmark or strategy factor. ETNs do not make periodic coupon payments or provide principal protection. The value of an ETN may be influenced by time to maturity, level of supply and demand for the ETN, volatility and lack of liquidity in underlying assets and changes in the applicable interest rates. ETNs are subject to credit risk, including the credit risk of the issuer. |
| K. | Foreign Currency Translations — Foreign currency is valued at the close of the NYSE based on quotations posted by banks and major currency dealers. Portfolio securities and other assets and liabilities denominated in foreign currencies are translated into U.S. dollar amounts at date of valuation. Purchases and sales of portfolio securities (net of foreign taxes withheld on disposition) and income items denominated in foreign currencies are translated into U.S. dollar amounts on the respective dates of such transactions. The Fund does not separately account for the portion of the results of operations resulting from changes in foreign exchange rates on investments and the fluctuations arising from changes in market prices of securities held. The combined results of changes in foreign exchange rates and the fluctuation of market prices on investments (net of estimated foreign tax withholding) are included with the net realized and unrealized gain or loss from investments in the Statement of Operations. Reported net realized foreign currency gains or losses arise from (1) sales of foreign currencies, (2) currency gains or losses realized between the trade and settlement dates on securities transactions, and (3) the difference between the amounts of dividends, interest, and foreign withholding taxes recorded on the Fund’s books and the U.S. dollar equivalent of the amounts actually received or paid. Net unrealized foreign currency gains and losses arise from changes in the fair values of assets and liabilities, other than investments in securities at fiscal period end, resulting from changes in exchange rates. |
The Fund may invest in foreign securities, which may be subject to foreign taxes on income, gains on investments or currency repatriation, a portion of which may be recoverable. Foreign taxes, if any, are recorded based on the tax regulations and rates that exist in the foreign markets in which the Fund invests and are shown in the Statement of Operations.
| L. | Forward Foreign Currency Contracts — The Fund may engage in foreign currency transactions either on a spot (i.e. for prompt delivery and settlement) basis, or through forward foreign currency contracts, to manage or minimize currency or exchange rate risk. |
The Fund may also enter into forward foreign currency contracts for the purchase or sale of a security denominated in a foreign currency in order to “lock in” the U.S. dollar price of that security, or the Fund may also enter into forward foreign currency contracts that do not provide for physical settlement of the two currencies, but instead are settled by a single cash payment calculated as the difference between the agreed upon exchange rate and the spot rate at settlement based upon an agreed upon notional amount (non-deliverable forwards). The Fund will set aside liquid assets in an amount equal to the daily mark-to-market obligation for forward foreign currency contracts.
A forward foreign currency contract is an obligation between two parties (“Counterparties”) to purchase or sell a specific currency for an agreed-upon price at a future date. The use of forward foreign currency contracts does not eliminate fluctuations in the price of the underlying
31 Invesco Multi-Asset Income Fund
securities the Fund owns or intends to acquire but establishes a rate of exchange in advance. Fluctuations in the value of these contracts are measured by the difference in the contract date and reporting date exchange rates and are recorded as unrealized appreciation (depreciation) until the contracts are closed. When the contracts are closed, realized gains (losses) are recorded. Realized and unrealized gains (losses) on the contracts are included in the Statement of Operations. The primary risks associated with forward foreign currency contracts include failure of the Counterparty to meet the terms of the contract and the value of the foreign currency changing unfavorably. These risks may be in excess of the amounts reflected in the Statement of Assets and Liabilities.
| M. | Futures Contracts — The Fund may enter into futures contracts to manage exposure to interest rate, equity and market price movements and/or currency risks. A futures contract is an agreement between Counterparties to purchase or sell a specified underlying security, currency or commodity (or delivery of a cash settlement price, in the case of an index future) for a fixed price at a future date. The Fund currently invests only in exchange-traded futures and they are standardized as to maturity date and underlying financial instrument. Initial margin deposits required upon entering into futures contracts are satisfied by the segregation of specific securities or cash as collateral at the futures commission merchant (broker). During the period the futures contracts are open, changes in the value of the contracts are recognized as unrealized gains or losses by recalculating the value of the contracts on a daily basis. Subsequent or variation margin payments are received or made depending upon whether unrealized gains or losses are incurred. These amounts are reflected as receivables or payables on the Statement of Assets and Liabilities. When the contracts are closed or expire, the Fund recognizes a realized gain or loss equal to the difference between the proceeds from, or cost of, the closing transaction and the Fund’s basis in the contract. The net realized gain (loss) and the change in unrealized gain (loss) on futures contracts held during the period is included on the Statement of Operations. The primary risks associated with futures contracts are market risk and the absence of a liquid secondary market. If the Fund were unable to liquidate a futures contract and/or enter into an offsetting closing transaction, the Fund would continue to be subject to market risk with respect to the value of the contracts and continue to be required to maintain the margin deposits on the futures contracts. Futures contracts have minimal Counterparty risk since the exchange’s clearinghouse, as Counterparty to all exchange-traded futures, guarantees the futures against default. Risks may exceed amounts recognized in the Statement of Assets and Liabilities. |
| N. | Swap Agreements — The Fund may enter into various swap transactions, including interest rate, total return, index, currency and credit default swap contracts (“CDS”) for investment purposes or to manage interest rate, currency or credit risk. Such transactions are agreements between Counterparties. A swap agreement may be negotiated bilaterally and traded over-the-counter (“OTC”) between two parties (“uncleared/OTC”) or, in some instances, must be transacted through a future commission merchant (“FCM”) and cleared through a clearinghouse that serves as a central Counterparty (“centrally cleared swap”). These agreements may contain among other conditions, events of default and termination events, and various covenants and representations such as provisions that require the Fund to maintain a pre-determined level of net assets, and/or provide limits regarding the decline of the Fund’s NAV over specific periods of time. If the Fund were to trigger such provisions and have open derivative positions at that time, the Counterparty may be able to terminate such agreement and request immediate payment in an amount equal to the net liability positions, if any. |
Interest rate, total return, index, and currency swap agreements are two-party contracts entered into primarily to exchange the returns (or differentials in rates of returns) earned or realized on particular predetermined investments or instruments. The gross returns to be exchanged or “swapped” between the parties are calculated with respect to a notional amount, i.e., the return on or increase in value of a particular dollar amount invested at a particular interest rate or return of an underlying asset, in a particular foreign currency, or in a “basket” of securities representing a particular index.
In a centrally cleared swap, the Fund’s ultimate Counterparty is a central clearinghouse. The Fund initially will enter into centrally cleared swaps through an executing broker. When a fund enters into a centrally cleared swap, it must deliver to the central Counterparty (via the FCM) an amount referred to as “initial margin.” Initial margin requirements are determined by the central Counterparty, but an FCM may require additional initial margin above the amount required by the central Counterparty. Initial margin deposits required upon entering into centrally cleared swaps are satisfied by cash or securities as collateral at the FCM. Securities deposited as initial margin are designated on the Schedule of Investments and cash deposited is recorded on the Statement of Assets and Liabilities. During the term of a cleared swap agreement, a “variation margin” amount may be required to be paid by the Fund or may be received by the Fund, based on the daily change in price of the underlying reference instrument subject to the swap agreement and is recorded as a receivable or payable for variation margin in the Statement of Assets and Liabilities until the centrally cleared swap is terminated at which time a realized gain or loss is recorded.
A CDS is an agreement between Counterparties to exchange the credit risk of an issuer. A buyer of a CDS is said to buy protection by paying a fixed payment over the life of the agreement and in some situations an upfront payment to the seller of the CDS. If a defined credit event occurs (such as payment default or bankruptcy), the Fund as a protection buyer would cease paying its fixed payment, the Fund would deliver eligible bonds issued by the reference entity to the seller, and the seller would pay the full notional value, or the “par value”, of the referenced obligation to the Fund. A seller of a CDS is said to sell protection and thus would receive a fixed payment over the life of the agreement and an upfront payment, if applicable. If a credit event occurs, the Fund as a protection seller would cease to receive the fixed payment stream, the Fund would pay the buyer “par value” or the full notional value of the referenced obligation, and the Fund would receive the eligible bonds issued by the reference entity. In turn, these bonds may be sold in order to realize a recovery value. Alternatively, the seller of the CDS and its Counterparty may agree to net the notional amount and the market value of the bonds and make a cash payment equal to the difference to the buyer of protection. If no credit event occurs, the Fund receives the fixed payment over the life of the agreement. As the seller, the Fund would effectively add leverage to its portfolio because, in addition to its total net assets, the Fund would be subject to investment exposure on the notional amount of the CDS. In connection with these agreements, cash and securities may be identified as collateral in accordance with the terms of the respective swap agreements to provide assets of value and recourse in the event of default under the swap agreement or bankruptcy/insolvency of a party to the swap agreement. If a Counterparty becomes bankrupt or otherwise fails to perform its obligations due to financial difficulties, the Fund may experience significant delays in obtaining any recovery in a bankruptcy or other reorganization proceeding. The Fund may obtain only limited recovery or may obtain no recovery in such circumstances. The Fund’s maximum risk of loss from Counterparty risk, either as the protection seller or as the protection buyer, is the value of the contract. The risk may be mitigated by having a master netting arrangement between the Fund and the Counterparty and by the designation of collateral by the Counterparty to cover the Fund’s exposure to the Counterparty.
32 Invesco Multi-Asset Income Fund
Implied credit spreads represent the current level at which protection could be bought or sold given the terms of the existing CDS contract and serve as an indicator of the current status of the payment/performance risk of the CDS. An implied spread that has widened or increased since entry into the initial contract may indicate a deteriorating credit profile and increased risk of default for the reference entity. A declining or narrowing spread may indicate an improving credit profile or decreased risk of default for the reference entity. Alternatively, credit spreads may increase or decrease reflecting the general tolerance for risk in the credit markets.
An interest rate swap is an agreement between Counterparties pursuant to which the parties exchange a floating rate payment for a fixed rate payment based on a specified notional amount.
Changes in the value of centrally cleared and OTC swap agreements are recognized as unrealized gains (losses) in the Statement of Operations by “marking to market” on a daily basis to reflect the value of the swap agreement at the end of each trading day. Payments received or paid at the beginning of the agreement are reflected as such on the Statement of Assets and Liabilities and may be referred to as upfront payments. The Fund accrues for the fixed payment stream and amortizes upfront payments, if any, on swap agreements on a daily basis with the net amount, recorded as a component of realized gain (loss) on the Statement of Operations. A liquidation payment received or made at the termination of a swap agreement is recorded as realized gain (loss) on the Statement of Operations. The Fund segregates cash or liquid securities having a value at least equal to the amount of the potential obligation of a Fund under any swap transaction. Cash held as collateral is recorded as deposits with brokers on the Statement of Assets and Liabilities. Entering into these agreements involves, to varying degrees, lack of liquidity and elements of credit, market, and Counterparty risk in excess of amounts recognized on the Statement of Assets and Liabilities. Such risks involve the possibility that a swap is difficult to sell or liquidate; the Counterparty does not honor its obligations under the agreement and unfavorable interest rates and market fluctuations. It is possible that developments in the swaps market, including potential government regulation, could adversely affect the Fund’s ability to terminate existing swap agreements or to realize amounts to be received under such agreements. A short position in a security poses more risk than holding the same security long. As there is no limit on how much the price of the security can increase, the Fund’s exposure is unlimited.
Notional amounts of each individual credit default swap agreement outstanding as of October 31, 2016 for which the Fund is the seller of protection are disclosed in the open swap agreements table. These potential amounts would be partially offset by any recovery values of the respective referenced obligations, upfront payments received upon entering into the agreement, or net amounts received from the settlement of buy protection credit default swap agreements entered into by the Fund for the same referenced entity or entities.
| O. | Other Risks — The Fund may invest in lower-quality debt securities, i.e., “junk bonds”. Investments in lower-rated securities or unrated securities of comparable quality tend to be more sensitive to economic conditions than higher rated securities. Junk bonds involve a greater risk of default by the issuer because such securities are generally unsecured and are often subordinated to other creditors’ claim. |
| P. | Leverage Risk — Leverage exists when the Fund can lose more than it originally invests because it purchases or sells an instrument or enters into a transaction without investing an amount equal to the full economic exposure of the instrument or transaction. |
| Q. | Collateral — To the extent the Fund has designated or segregated a security as collateral and that security is subsequently sold, it is the Fund’s practice to replace such collateral no later than the next business day. |
NOTE 2—Advisory Fees and Other Fees Paid to Affiliates
The Trust has entered into a master investment advisory agreement with Invesco Advisers, Inc. (the “Adviser” or “Invesco”). Under the terms of the investment advisory agreement, the Fund pays an advisory fee to the Adviser based on the annual rate of the Fund’s average daily net assets as follows:
| | | | |
| Average Daily Net Assets | | Rate | |
First $500 million | | | 0.65% | |
Next $500 million | | | 0.60% | |
Next $500 million | | | 0.55% | |
Over $1.5 billion | | | 0.54% | |
For the year ended October 31, 2016, the effective advisory fees incurred by the Fund was 0.65%.
Under the terms of a master sub-advisory agreement between the Adviser and each of Invesco Asset Management Deutschland GmbH, Invesco Asset Management Limited, Invesco Asset Management (Japan) Limited, Invesco Hong Kong Limited, Invesco Senior Secured Management, Inc., Invesco Canada Ltd. and Invesco PowerShares Capital Management LLC (collectively, the “Affiliated Sub-Advisers”) the Adviser, not the Fund, will pay 40% of the fees paid to the Adviser to any such Affiliated Sub-Adviser(s) that provide(s) discretionary investment management services to the Fund based on the percentage of assets allocated to such Affiliated Sub-Adviser(s).
The Adviser has contractually agreed, through at least February 28, 2017, to waive advisory fees and/or reimburse expenses of all shares to the extent necessary to limit total annual fund operating expenses after fee waiver and/or expense reimbursement (excluding certain items discussed below) of Class A, Class C, Class R, Class Y, Class R5 and Class R6 shares to 1.05%, 1.80%, 1.30%, 0.80%, 0.80% and 0.80%, respectively, of the Fund’s average daily net assets (the “expense limits”). In determining the Adviser’s obligation to waive advisory fees and/or reimburse expenses, the following expenses are not taken into account, and could cause the total annual fund operating expenses after fee waiver and/or expense reimbursement to exceed the numbers reflected above: (1) interest; (2) taxes; (3) dividend expense on short sales; (4) extraordinary or non-routine items, including litigation expenses; and (5) expenses that the Fund has incurred but did not actually pay because of an expense offset arrangement. Unless Invesco continues the fee waiver agreement, it will terminate on February 28, 2017. During its term, the fee waiver agreement cannot be terminated or amended to increase the expense limits without approval of the Board of Trustees.
Further, the Adviser has contractually agreed, through at least June 30, 2018, to waive the advisory fee payable by the Fund in an amount equal to 100% of the net advisory fees the Adviser receives from the affiliated money market funds on investments by the Fund of uninvested cash in such affiliated money market funds.
For the year ended October 31, 2016, the Adviser waived advisory fees of $161,461 and reimbursed class level expenses of $77,926, $24,336, $503, $21,723 and $289 of Class A, Class C, Class R, Class Y and Class R6 shares, respectively.
33 Invesco Multi-Asset Income Fund
The Trust has entered into a master administrative services agreement with Invesco pursuant to which the Fund has agreed to pay Invesco for certain administrative costs incurred in providing accounting services to the Fund. For the year ended October 31, 2016, expenses incurred under the agreement are shown in the Statement of Operations as Administrative services fees.
The Trust has entered into a transfer agency and service agreement with Invesco Investment Services, Inc. (“IIS”) pursuant to which the Fund has agreed to pay IIS a fee for providing transfer agency and shareholder services to the Fund and reimburse IIS for certain expenses incurred by IIS in the course of providing such services. IIS may make payments to intermediaries that provide omnibus account services, sub-accounting services and/or networking services. All fees payable by IIS to intermediaries that provide omnibus account services or sub-accounting are charged back to the Fund, subject to certain limitations approved by the Trust’s Board of Trustees. For the year ended October 31, 2016, expenses incurred under the agreement are shown in the Statement of Operations as Transfer agent fees.
The Trust has entered into master distribution agreements with Invesco Distributors, Inc. (“IDI”) to serve as the distributor for the Class A, Class C, Class R, Class Y, Class R5 and Class R6 shares of the Fund. The Trust has adopted plans pursuant to Rule 12b-1 under the 1940 Act with respect to the Fund’s Class A, Class C and Class R shares (collectively the “Plans”). The Fund, pursuant to the Plans, pays IDI compensation at the annual rate of 0.25% of the Fund’s average daily net assets of Class A shares, 1.00% of the average daily net assets of Class C shares and 0.50% of the average daily net assets of Class R shares. Of the Plan payments, up to 0.25% of the average daily net assets of each class of shares may be paid to furnish continuing personal shareholder services to customers who purchase and own shares of such classes. Any amounts not paid as a service fee under the Plans would constitute an asset-based sales charge. Rules of the Financial Industry Regulatory Authority (“FINRA”) impose a cap on the total sales charges, including asset-based sales charges, that may be paid by any class of shares of the Fund. For the year ended October 31, 2016, expenses incurred under the Plans are shown in the Statement of Operations as Distribution fees.
Front-end sales commissions and CDSC (collectively, the “sales charges”) are not recorded as expenses of the Fund. Front-end sales commissions are deducted from proceeds from the sales of Fund shares prior to investment in Class A shares of the Fund. CDSC are deducted from redemption proceeds prior to remittance to the shareholder. During the year ended October 31, 2016, IDI advised the Fund that IDI retained $23,628 in front-end sales commissions from the sale of Class A shares and $2,470 from Class C shares, for CDSC imposed upon redemptions by shareholders.
Certain officers and trustees of the Trust are officers and directors of the Adviser, IIS and/or IDI.
NOTE 3—Additional Valuation Information
GAAP defines fair value as the price that would be received to sell an asset or paid to transfer a liability in an orderly transaction between market participants at the measurement date, under current market conditions. GAAP establishes a hierarchy that prioritizes the inputs to valuation methods, giving the highest priority to readily available unadjusted quoted prices in an active market for identical assets (Level 1) and the lowest priority to significant unobservable inputs (Level 3), generally when market prices are not readily available or are unreliable. Based on the valuation inputs, the securities or other investments are tiered into one of three levels. Changes in valuation methods may result in transfers in or out of an investment’s assigned level:
| | Level 1 — | Prices are determined using quoted prices in an active market for identical assets. |
| | Level 2 — | Prices are determined using other significant observable inputs. Observable inputs are inputs that other market participants may use in pricing a security. These may include quoted prices for similar securities, interest rates, prepayment speeds, credit risk, yield curves, loss severities, default rates, discount rates, volatilities and others. |
| | Level 3 — | Prices are determined using significant unobservable inputs. In situations where quoted prices or observable inputs are unavailable (for example, when there is little or no market activity for an investment at the end of the period), unobservable inputs may be used. Unobservable inputs reflect the Fund’s own assumptions about the factors market participants would use in determining fair value of the securities or instruments and would be based on the best available information. |
The following is a summary of the tiered valuation input levels, as of October 31, 2016. The level assigned to the securities valuations may not be an indication of the risk or liquidity associated with investing in those securities. Because of the inherent uncertainties of valuation, the values reflected in the financial statements may materially differ from the value received upon actual sale of those investments.
| | | | | | | | | | | | | | | | |
| | | Level 1 | | | Level 2 | | | Level 3 | | | Total | |
Common Stocks & Other Equity Interests | | $ | 32,771,256 | | | $ | — | | | $ | — | | | $ | 32,771,256 | |
Preferred Stocks | | | 42,781,606 | | | | 165,637 | | | | — | | | | 42,947,243 | |
Exchange-Traded Notes | | | 8,107,660 | | | | — | | | | — | | | | 8,107,660 | |
Money Market Funds | | | 14,440,030 | | | | — | | | | — | | | | 14,440,030 | |
U.S. Treasury Securities | | | — | | | | 16,063,900 | | | | — | | | | 16,063,900 | |
U.S. Dollar Denominated Bonds and Notes | | | — | | | | 78,582,554 | | | | — | | | | 78,582,554 | |
Non-U.S. Dollar Denominated Bonds and Notes | | | — | | | | 683,672 | | | | — | | | | 683,672 | |
| | | | 98,100,552 | | | | 95,495,763 | | | | — | | | | 193,596,315 | |
Forward Foreign Currency Contracts* | | | — | | | | 51,616 | | | | — | | | | 51,616 | |
Futures Contracts* | | | 314,783 | | | | — | | | | — | | | | 314,783 | |
Swap Agreements* | | | — | | | | 32,453 | | | | — | | | | 32,453 | |
Total Investments | | $ | 98,415,335 | | | $ | 95,579,832 | | | $ | — | | | $ | 193,995,167 | |
| * | Unrealized appreciation. |
34 Invesco Multi-Asset Income Fund
NOTE 4—Derivative Investments
The Fund may enter into an International Swaps and Derivatives Association Master Agreement (“ISDA Master Agreement”) under which a Fund may trade OTC derivatives. An OTC transaction entered into under an ISDA Master Agreement typically involves a collateral posting arrangement, payment netting provisions and close-out netting provisions. These netting provisions allow for reduction of credit risk through netting of contractual obligations. The enforceability of the netting provisions of the ISDA Master Agreement depends on the governing law of the ISDA Master Agreement, among other factors.
For financial reporting purposes, the Fund does not offset OTC derivative assets or liabilities that are subject to ISDA Master Agreements in the Statement of Assets and Liabilities.
Value of Derivative Investments at Period-End
The table below summarizes the value of the Fund’s derivative investments, detailed by primary risk exposure, held as of October 31, 2016:
| | | | | | | | | | | | | | | | | | | | |
| | | Value | |
| Derivative Assets | | Credit Risk | | | Currency
Risk | | | Equity
Risk | | | Interest Rate
Risk | | | Total | |
Unrealized appreciation on futures contracts — Exchange-Traded(a) | | $ | — | | | $ | — | | | $ | 606,233 | | | $ | 188,748 | | | $ | 794,981 | |
Unrealized appreciation on swap agreements — Centrally Cleared(a) | | | 32,453 | | | | — | | | | — | | | | — | | | | 32,453 | |
Unrealized appreciation on forward foreign currency contracts outstanding | | | — | | | | 54,259 | | | | — | | | | — | | | | 54,259 | |
Total Derivative Assets | | | 32,453 | | | | 54,259 | | | | 606,233 | | | | 188,748 | | | | 881,693 | |
Derivatives not subject to master netting agreements | | | (32,453 | ) | | | — | | | | (606,233 | ) | | | (188,748 | ) | | | (827,434 | ) |
Total Derivative Assets subject to master netting agreements | | $ | — | | | $ | 54,259 | | | $ | — | | | $ | — | | | $ | 54,259 | |
| |
| | | Value | |
| Derivative Liabilities | | Credit Risk | | | Currency
Risk | | | Equity
Risk | | | Interest Rate
Risk | | | Total | |
Unrealized depreciation on futures contracts — Exchange-Traded(a) | | $ | — | | | $ | — | | | $ | (480,198 | ) | | $ | — | | | $ | (480,198 | ) |
Unrealized depreciation on forward foreign currency contracts outstanding | | | — | | | | (2,643 | ) | | | — | | | | — | | | | (2,643 | ) |
Total Derivative Liabilities | | | — | | | | (2,643 | ) | | | (480,198 | ) | | | — | | | | (482,841 | ) |
Derivatives not subject to master netting agreements | | | — | | | | — | | | | 480,198 | | | | — | | | | 480,198 | |
Total Derivative Liabilities subject to master netting agreements | | $ | — | | | $ | (2,643 | ) | | $ | — | | | $ | — | | | $ | (2,643 | ) |
| (a) | Includes cumulative appreciation (depreciation) on futures contracts and centrally cleared swap agreements. Only current day’s variation margin receivable (payable) is reported within the Statement of Assets and Liabilities. |
Offsetting Assets and Liabilities
The table below reflects the Fund’s exposure to Counterparties subject to either an ISDA Master Agreement or other agreement for OTC derivative transactions as of October 31, 2016.
| | | | | | | | | | | | | | | | | | | | | | | | |
| | | Financial
Derivative Assets | | | Financial
Derivative
Liabilities | | | Net Value of
Derivatives | | | Collateral
(Received)/Pledged | | | | |
| Counterparty | | Forward
Foreign Currency
contracts | | | Forward
Foreign Currency
contracts | | | | Non-Cash | | | Cash | | | Net
amount | |
Citigroup Global Markets Inc. | | $ | 54,259 | | | $ | — | | | $ | 54,259 | | | $ | — | | | $ | — | | | $ | 54,259 | |
Goldman Sachs International | | | — | | | | (2,643 | ) | | | (2,643 | ) | | | — | | | | — | | | | (2,643 | ) |
Total | | $ | 54,259 | | | $ | (2,643 | ) | | $ | 51,616 | | | $ | — | | | $ | — | | | $ | 51,616 | |
Effect of Derivative Investments for the year ended October 31, 2016
The table below summarizes the gains (losses) on derivative investments, detailed by primary risk exposure, recognized in earnings during the period:
| | | | | | | | | | | | | | | | | | | | |
| | | Location of Gain (Loss) on Statement of Operations | |
| | Credit Risk | | | Currency
Risk | | | Equity
Risk | | | Interest Rate
Risk | | | Total | |
Realized Gain (Loss): | | | | | | | | | | | | | | | | | | | | |
Forward foreign currency contracts | | $ | — | | | $ | 156,608 | | | $ | — | | | $ | — | | | $ | 156,608 | |
Futures contracts | | | — | | | | — | | | | (19,405 | ) | | | 1,578,278 | | | | 1,558,873 | |
Swap agreements | | | (27,606 | ) | | | — | | | | — | | | | — | | | | (27,606 | ) |
Change in Net Unrealized Appreciation (Depreciation): | | | | | | | | | | | | | | | | | | | | |
Forward foreign currency contracts | | | — | | | | 42,521 | | | | — | | | | — | | | | 42,521 | |
Futures contracts | | | — | | | | — | | | | (434,541 | ) | | | 66,187 | | | | (368,354 | ) |
Swap agreements | | | 14,837 | | | | — | | | | — | | | | — | | | | 14,837 | |
Total | | $ | (12,769 | ) | | $ | 199,129 | | | $ | (453,946 | ) | | $ | 1,644,465 | | | $ | 1,376,879 | |
35 Invesco Multi-Asset Income Fund
The table below summarizes the 12-month average notional value of forward foreign currency contracts and futures contracts and the 9-month average notional value of swap agreements outstanding during the period.
| | | | | | | | | | | | |
| | | Forward Foreign
Currency Contracts | | | Futures
Contracts | | | Swap
Agreements | |
Average notional value | | $ | 1,948,758 | | | $ | 46,219,669 | | | $ | 2,246,111 | |
| | | | | | | | | | | | | | | | | | | | | | | | | | |
| Open Forward Foreign Currency Contracts | |
Settlement
Date | | Counterparty | | Contract to | | | Notional
Value | | | Unrealized
Appreciation
(Depreciation) | |
| | | Deliver | | | Receive | | | |
11/30/2016 | | Citigroup Global Markets Inc. | | | EUR | | | | 283,150 | | | | USD | | | | 317,082 | | | $ | 311,199 | | | $ | 5,883 | |
11/30/2016 | | Citigroup Global Markets Inc. | | | GBP | | | | 451,502 | | | | USD | | | | 601,238 | | | | 552,862 | | | | 48,376 | |
11/30/2016 | | Goldman Sachs International | | | USD | | | | 123,540 | | | | EUR | | | | 110,000 | | | | 120,897 | | | | (2,643 | ) |
Total open forward foreign currency contracts — currency risk | | | | | | | | | | | | | | | | | | | | | | $ | 51,616 | |
Currency Abbreviations:
| | |
| EUR | | – Euro |
| GBP | | – British Pound Sterling |
| USD | | – U.S. Dollar |
| | | | | | | | | | | | | | | | | | | | |
| Open Futures Contracts | |
| Futures Contracts | | Type of
Contract | | | Number of
Contracts | | | Expiration
Month | | | Notional
Value | | | Unrealized
Appreciation
(Depreciation) | |
Dow Jones Euro STOXX 50 Index | | | Long | | | | 205 | | | | December-2016 | | | $ | 6,870,433 | | | $ | 137,597 | |
E-Mini S&P 500 Index | | | Long | | | | 66 | | | | December-2016 | | | | 6,996,330 | | | | (124,666 | ) |
FTSE 100 Index | | | Long | | | | 80 | | | | December-2016 | | | | 6,783,768 | | | | 283,322 | |
Hang Seng Index | | | Long | | | | 47 | | | | November-2016 | | | | 6,940,506 | | | | (160,745 | ) |
Russell 2000 Mini Index | | | Long | | | | 43 | | | | December-2016 | | | | 5,122,590 | | | | (194,787 | ) |
Tokyo Stock Price Index | | | Long | | | | 32 | | | | December-2016 | | | | 4,256,902 | | | | 185,314 | |
Subtotal — Equity Risk | | | | | | | | | | | | 126,035 | |
Australian 10 Year Bonds | | | Short | | | | 28 | | | | December-2016 | | | | (2,824,619 | ) | | | 62,394 | |
Canadian 10 Year Bonds | | | Short | | | | 10 | | | | December-2016 | | | | (1,078,248 | ) | | | 19,101 | |
Euro Bonds | | | Short | | | | 6 | | | | December-2016 | | | | (1,068,133 | ) | | | 21,858 | |
Japanese Mini 10 Year Bonds | | | Short | | | | 8 | | | | December-2016 | | | | (1,157,221 | ) | | | 3,275 | |
Long Gilt | | | Short | | | | 7 | | | | December-2016 | | | | (1,073,738 | ) | | | 44,687 | |
U.S. Treasury Long Bonds | | | Short | | | | 7 | | | | December-2016 | | | | (1,139,031 | ) | | | 37,433 | |
Subtotal — Interest Rate Risk | | | | | | | | | | | | 188,748 | |
Total Futures Contracts | | | | | | | | | | | $ | 314,783 | |
| | | | | | | | | | | | | | | | | | | | | | | | | | | | | | |
| Open Centrally Cleared Credit Default Swap Agreements — Credit Risk | |
Counterparty/ Clearinghouse | | Reference Entity | | Buy/Sell Protection | | | (Pay)/Receive Fixed Rate | | | Expiration
Date | | | Implied
Credit
Spread(a) | | | Notional Value | | | Upfront
Payments | | | Unrealized Appreciation | |
Credit Suisse Securities (USA) LLC/CME | | Markit CDX North America High Yield Index, Series 26, Version 1 | | | Sell | | | | 5.00 | % | | | 06/20/2021 | | | | 3.93 | % | | $ | 4,500,000 | | | $ | 159,427 | | | $ | 32,453 | |
Abbreviations:
| | |
| CME | | – Chicago Mercantile Exchange |
| (a) | Implied credit spreads represent the current level as of October 31, 2016, at which protection could be bought or sold given the terms of the existing credit default swap contract and serve as an indicator of the current status of the payment/performance risk of the credit default swap contract. An implied credit spread that has widened or increased since entry into the initial contract may indicate a deteriorating credit profile and increased risk of default for the reference entity. A declining or narrowing spread may indicate an improving credit profile or decreased risk of default for the reference entity. Alternatively, credit spreads may increase or decrease reflecting the general tolerance for risk in the credit markets generally. |
NOTE 5—Expense Offset Arrangement(s)
The expense offset arrangement is comprised of transfer agency credits which result from balances in demand deposit accounts used by the transfer agent for clearing shareholder transactions. For the year ended October 31, 2016, the Fund received credits from this arrangement, which resulted in the reduction of the Fund’s total expenses of $363.
36 Invesco Multi-Asset Income Fund
NOTE 6—Trustees’ and Officers’ Fees and Benefits
Trustees’ and Officers’ Fees and Benefits include amounts accrued by the Fund to pay remuneration to certain Trustees and Officers of the Fund. Trustees have the option to defer compensation payable by the Fund, and Trustees’ and Officers’ Fees and Benefits also include amounts accrued by the Fund to fund such deferred compensation amounts. Those Trustees who defer compensation have the option to select various Invesco Funds in which their deferral accounts shall be deemed to be invested. Finally, certain current Trustees were eligible to participate in a retirement plan that provided for benefits to be paid upon retirement to Trustees over a period of time based on the number of years of service. The Fund may have certain former Trustees who also participate in a retirement plan and receive benefits under such plan. Trustees’ and Officers’ Fees and Benefits include amounts accrued by the Fund to fund such retirement benefits. Obligations under the deferred compensation and retirement plans represent unsecured claims against the general assets of the Fund.
NOTE 7—Cash Balances
The Fund is permitted to temporarily carry a negative or overdrawn balance in its account with State Street Bank and Trust Company, the custodian bank. Such balances, if any at period-end, are shown in the Statement of Assets and Liabilities under the payable caption Amount due custodian. To compensate the custodian bank for such overdrafts, the overdrawn Fund may either (1) leave funds as a compensating balance in the account so the custodian bank can be compensated by earning the additional interest; or (2) compensate by paying the custodian bank at a rate agreed upon by the custodian bank and Invesco, not to exceed the contractually agreed upon rate.
NOTE 8—Distributions to Shareholders and Tax Components of Net Assets
Tax Character of Distributions to Shareholders Paid During the Fiscal Years Ended October 31, 2016 and 2015:
| | | | | | | | |
| | | 2016 | | | 2015 | |
Ordinary income | | $ | 7,248,908 | | | $ | 6,574,274 | |
Tax Components of Net Assets at Period-End:
| | | | |
| | | 2016 | |
Net unrealized appreciation — investments | | $ | 4,187,762 | |
Net unrealized appreciation — other investments | | | 113,542 | |
Temporary book/tax differences | | | (26,722 | ) |
Capital loss carryforward | | | (8,903,051 | ) |
Shares of beneficial interest | | | 201,446,012 | |
Total net assets | | $ | 196,817,543 | |
The difference between book-basis and tax-basis unrealized appreciation (depreciation) is due to differences in the timing of recognition of gains and losses on investments for tax and book purposes. The Fund’s net unrealized appreciation difference is attributable primarily to wash sales and bond premiums.
The temporary book/tax differences are a result of timing differences between book and tax recognition of income and/or expenses. The Fund’s temporary book/tax differences are the result of the trustee deferral of compensation and retirement plan benefits.
Capital loss carryforward is calculated and reported as of a specific date. Results of transactions and other activity after that date may affect the amount of capital loss carryforward actually available for the Fund to utilize. The ability to utilize capital loss carryforward in the future may be limited under the Internal Revenue Code and related regulations based on the results of future transactions.
The Fund has a capital loss carryforward as of October 31, 2016, as follows:
| | | | | | | | | | | | |
| Capital Loss Carryforward* | |
| Expiration | | Short-Term | | | Long-Term | | | Total | |
Not subject to expiration | | $ | 7,105,236 | | | $ | 1,797,815 | | | $ | 8,903,051 | |
| * | Capital loss carryforward as of the date listed above is reduced for limitations, if any, to the extent required by the Internal Revenue Code and may be further limited depending upon a variety of factors, including the realization of net unrealized gains or losses as of the date of any reorganization. |
37 Invesco Multi-Asset Income Fund
NOTE 9—Investment Securities
The aggregate amount of investment securities (other than short-term securities, U.S. Treasury obligations and money market funds, if any) purchased and sold by the Fund during the year ended October 31, 2016 was $178,967,587 and $128,151,251, respectively. During the same period, purchases and sales of U.S. Treasury obligations were $12,180,852 and $7,084,320, respectively. Cost of investments on a tax basis includes the adjustments for financial reporting purposes as of the most recently completed federal income tax reporting period-end.
| | | | |
| Unrealized Appreciation (Depreciation) of Investment Securities on a Tax Basis | |
Aggregate unrealized appreciation of investment securities | | $ | 6,619,456 | |
Aggregate unrealized (depreciation) of investment securities | | | (2,431,694 | ) |
Net unrealized appreciation of investment securities | | $ | 4,187,762 | |
Cost of investments for tax purposes is $189,408,553.
NOTE 10—Reclassification of Permanent Differences
Primarily as a result of differing book/tax treatment of bond premium amortization, foreign currency transactions, futures contracts and swap income, on October 31, 2016, undistributed net investment income (loss) was increased by $495,378, undistributed net realized gain (loss) was decreased by $469,744 and shares of beneficial interest was decreased by $25,634. This reclassification had no effect on the net assets of the Fund.
NOTE 11—Share Information
| | | | | | | | | | | | | | | | |
| | | Summary of Share Activity | |
| | | Years ended October 31, | |
| | | 2016(a) | | | 2015 | |
| | | Shares | | | Amount | | | Shares | | | Amount | |
Sold: | | | | | | | | | | | | | | | | |
Class A | | | 5,267,027 | | | $ | 55,774,372 | | | | 3,054,961 | | | $ | 31,571,397 | |
Class C | | | 973,923 | | | | 10,215,089 | | | | 665,576 | | | | 6,862,470 | |
Class R | | | 35,654 | | | | 374,579 | | | | 22,519 | | | | 227,585 | |
Class Y | | | 2,466,882 | | | | 25,860,783 | | | | 1,777,827 | | | | 18,357,253 | |
Class R5 | | | 838 | | | | 9,002 | | | | — | | | | — | |
Class R6 | | | 949,592 | | | | 9,507,580 | | | | 1,558,502 | | | | 16,063,482 | |
| | | | |
Issued as reinvestment of dividends: | | | | | | | | | | | | | | | | |
Class A | | | 250,608 | | | | 2,538,721 | | | | 149,450 | | | | 1,530,255 | |
Class C | | | 64,533 | | | | 650,905 | | | | 42,814 | | | | 438,178 | |
Class R | | | 1,661 | | | | 16,789 | | | | 705 | | | | 7,215 | |
Class Y | | | 71,597 | | | | 730,390 | | | | 37,371 | | | | 383,770 | |
Class R5 | | | 6 | | | | 62 | | | | — | | | | — | |
Class R6 | | | 275,154 | | | | 2,746,085 | | | | 292,705 | | | | 2,998,897 | |
| | | | |
Reacquired: | | | | | | | | | | | | | | | | |
Class A | | | (2,020,290 | ) | | | (20,575,526 | ) | | | (2,049,651 | ) | | | (21,048,416 | ) |
Class C | | | (430,535 | ) | | | (4,364,788 | ) | | | (442,432 | ) | | | (4,522,475 | ) |
Class R | | | (19,673 | ) | | | (196,442 | ) | | | (3,273 | ) | | | (33,565 | ) |
Class Y | | | (816,554 | ) | | | (8,238,126 | ) | | | (1,232,469 | ) | | | (12,628,929 | ) |
Class R6(b) | | | (3,221,075 | ) | | | (30,673,762 | ) | | | (78,709 | ) | | | (809,277 | ) |
Net increase in share activity | | | 3,849,348 | | | $ | 44,375,713 | | | | 3,795,896 | | | $ | 39,397,840 | |
| (a) | There are entities that are record owners of more than 5% of the outstanding shares of the Fund and in the aggregate own 47% of the outstanding shares of the Fund. IDI has an agreement with these entities to sell Fund shares. The Fund, Invesco and/or Invesco affiliates may make payments to these entities, which are considered to be related to the Fund, for providing services to the Fund, Invesco and/or Invesco affiliates including but not limited to services such as securities brokerage, distribution, third party record keeping and account servicing. The Fund has no knowledge as to whether all or any portion of the shares owned of record by these entities are also owned beneficially. |
| | In addition, 25% of the outstanding shares of the Fund are owned by the Adviser or an affiliate of the Adviser. |
| (b) | On February 18, 2016, 3,221,845 Class R6 shares valued at $30,671,968 were redeemed by affiliated mutual funds. |
38 Invesco Multi-Asset Income Fund
NOTE 12—Financial Highlights
The following schedule presents financial highlights for a share of the Fund outstanding throughout the periods indicated.
| | | | | | | | | | | | | | | | | | | | | | | | | | | | | | | | | | | | | | | | | | | | | | | | | | | | | | | | |
| | | Net asset
value,
beginning
of period | | | Net
investment
income(a) | | | Net gains
(losses)
on securities
(both
realized and
unrealized) | | | Total from
investment
operations | | | Dividends
from net
investment
income | | | Distributions
from net
realized
gains | | | Total
distributions | | | Net asset
value, end
of period | | | Total
return(b) | | | Net assets,
end of period
(000’s omitted) | | | Ratio of
expenses
to average
net assets
with fee waivers
and/or expenses
absorbed | | | Ratio of
expenses
to average net
assets without
fee waivers
and/or expenses
absorbed | | | Ratio of net
investment
income
to average
net assets | | | Portfolio
turnover(c) | |
Class A | |
Year ended 10/31/16 | | $ | 10.09 | | | $ | 0.47 | | | $ | 0.45 | | | $ | 0.92 | | | $ | (0.50 | ) | | $ | — | | | $ | (0.50 | ) | | $ | 10.51 | | | | 9.44 | % | | $ | 91,585 | | | | 1.04 | %(d) | | | 1.28 | %(d) | | | 4.60 | %(d) | | | 101 | % |
Year ended 10/31/15 | | | 10.37 | | | | 0.46 | | | | (0.25 | ) | | | 0.21 | | | | (0.49 | ) | | | — | | | | (0.49 | ) | | | 10.09 | | | | 2.02 | | | | 52,613 | | | | 0.99 | | | | 1.27 | | | | 4.52 | | | | 120 | |
Year ended 10/31/14 | | | 10.04 | | | | 0.48 | | | | 0.37 | | | | 0.85 | | | | (0.52 | ) | | | — | | | | (0.52 | ) | | | 10.37 | | | | 8.66 | | | | 42,104 | | | | 0.88 | | | | 1.28 | | | | 4.69 | | | | 89 | |
Year ended 10/31/13 | | | 10.83 | | | | 0.50 | | | | (0.58 | ) | | | (0.08 | ) | | | (0.55 | ) | | | (0.16 | ) | | | (0.71 | ) | | | 10.04 | | | | (0.83 | ) | | | 40,515 | | | | 0.88 | | | | 1.22 | | | | 4.83 | | | | 86 | |
Year ended 10/31/12(e) | | | 10.03 | | | | 0.43 | | | | 0.81 | | | | 1.24 | | | | (0.44 | ) | | | — | | | | (0.44 | ) | | | 10.83 | | | | 12.64 | | | | 24,388 | | | | 0.88 | (f) | | | 1.18 | (f) | | | 4.54 | (f) | | | 79 | |
Class C | | | | | | | | | | | | | | | | | | | | | | | | | | | | | | | | | | | | | | | | | | | | | | | | | | | | | | | | |
Year ended 10/31/16 | | | 10.08 | | | | 0.39 | | | | 0.45 | | | | 0.84 | | | | (0.42 | ) | | | — | | | | (0.42 | ) | | | 10.50 | | | | 8.62 | | | | 24,238 | | | | 1.79 | (d) | | | 2.03 | (d) | | | 3.85 | (d) | | | 101 | |
Year ended 10/31/15 | | | 10.36 | | | | 0.39 | | | | (0.26 | ) | | | 0.13 | | | | (0.41 | ) | | | — | | | | (0.41 | ) | | | 10.08 | | | | 1.26 | | | | 17,133 | | | | 1.74 | | | | 2.02 | | | | 3.77 | | | | 120 | |
Year ended 10/31/14 | | | 10.03 | | | | 0.40 | | | | 0.37 | | | | 0.77 | | | | (0.44 | ) | | | — | | | | (0.44 | ) | | | 10.36 | | | | 7.85 | | | | 14,854 | | | | 1.63 | | | | 2.03 | | | | 3.94 | | | | 89 | |
Year ended 10/31/13 | | | 10.82 | | | | 0.42 | | | | (0.58 | ) | | | (0.16 | ) | | | (0.47 | ) | | | (0.16 | ) | | | (0.63 | ) | | | 10.03 | | | | (1.58 | ) | | | 16,592 | | | | 1.63 | | | | 1.97 | | | | 4.08 | | | | 86 | |
Year ended 10/31/12(e) | | | 10.03 | | | | 0.36 | | | | 0.81 | | | | 1.17 | | | | (0.38 | ) | | | — | | | | (0.38 | ) | | | 10.82 | | | | 11.91 | | | | 10,469 | | | | 1.63 | (f) | | | 1.93 | (f) | | | 3.79 | (f) | | | 79 | |
Class R | | | | | | | | | | | | | | | | | | | | | | | | | | | | | | | | | | | | | | | | | | | | | | | | | | | | | | | | |
Year ended 10/31/16 | | | 10.08 | | | | 0.44 | | | | 0.46 | | | | 0.90 | | | | (0.47 | ) | | | — | | | | (0.47 | ) | | | 10.51 | | | | 9.28 | | | | 538 | | | | 1.29 | (d) | | | 1.53 | (d) | | | 4.35 | (d) | | | 101 | |
Year ended 10/31/15 | | | 10.36 | | | | 0.44 | | | | (0.26 | ) | | | 0.18 | | | | (0.46 | ) | | | — | | | | (0.46 | ) | | | 10.08 | | | | 1.77 | | | | 339 | | | | 1.24 | | | | 1.52 | | | | 4.27 | | | | 120 | |
Year ended 10/31/14 | | | 10.03 | | | | 0.46 | | | | 0.36 | | | | 0.82 | | | | (0.49 | ) | | | — | | | | (0.49 | ) | | | 10.36 | | | | 8.39 | | | | 141 | | | | 1.13 | | | | 1.53 | | | | 4.44 | | | | 89 | |
Year ended 10/31/13 | | | 10.83 | | | | 0.47 | | | | (0.59 | ) | | | (0.12 | ) | | | (0.52 | ) | | | (0.16 | ) | | | (0.68 | ) | | | 10.03 | | | | (1.17 | ) | | | 51 | | | | 1.13 | | | | 1.47 | | | | 4.58 | | | | 86 | |
Year ended 10/31/12(e) | | | 10.03 | | | | 0.40 | | | | 0.82 | | | | 1.22 | | | | (0.42 | ) | | | — | | | | (0.42 | ) | | | 10.83 | | | | 12.43 | | | | 50 | | | | 1.13 | (f) | | | 1.43 | (f) | | | 4.29 | (f) | | | 79 | |
Class Y | | | | | | | | | | | | | | | | | | | | | | | | | | | | | | | | | | | | | | | | | | | | | | | | | | | | | | | | |
Year ended 10/31/16 | | | 10.09 | | | | 0.50 | | | | 0.44 | | | | 0.94 | | | | (0.52 | ) | | | — | | | | (0.52 | ) | | | 10.51 | | | | 9.71 | | | | 31,049 | | | | 0.79 | (d) | | | 1.03 | (d) | | | 4.85 | (d) | | | 101 | |
Year ended 10/31/15 | | | 10.37 | | | | 0.49 | | | | (0.26 | ) | | | 0.23 | | | | (0.51 | ) | | | — | | | | (0.51 | ) | | | 10.09 | | | | 2.28 | | | | 12,424 | | | | 0.74 | | | | 1.02 | | | | 4.77 | | | | 120 | |
Year ended 10/31/14 | | | 10.05 | | | | 0.51 | | | | 0.35 | | | | 0.86 | | | | (0.54 | ) | | | — | | | | (0.54 | ) | | | 10.37 | | | | 8.82 | | | | 6,725 | | | | 0.63 | | | | 1.03 | | | | 4.94 | | | | 89 | |
Year ended 10/31/13 | | | 10.84 | | | | 0.53 | | | | (0.58 | ) | | | (0.05 | ) | | | (0.58 | ) | | | (0.16 | ) | | | (0.74 | ) | | | 10.05 | | | | (0.57 | ) | | | 7,409 | | | | 0.63 | | | | 0.97 | | | | 5.08 | | | | 86 | |
Year ended 10/31/12(e) | | | 10.03 | | | | 0.45 | | | | 0.82 | | | | 1.27 | | | | (0.46 | ) | | | — | | | | (0.46 | ) | | | 10.84 | | | | 12.96 | | | | 4,482 | | | | 0.63 | (f) | | | 0.93 | (f) | | | 4.79 | (f) | | | 79 | |
Class R5 | | | | | | | | | | | | | | | | | | | | | | | | | | | | | | | | | | | | | | | | | | | | | | | | | | | | | | | | |
Year ended 10/31/16 | | | 10.09 | | | | 0.50 | | | | 0.45 | | | | 0.95 | | | | (0.52 | ) | | | — | | | | (0.52 | ) | | | 10.52 | | | | 9.82 | | | | 19 | | | | 0.79 | (d) | | | 0.90 | (d) | | | 4.85 | (d) | | | 101 | |
Year ended 10/31/15 | | | 10.37 | | | | 0.49 | | | | (0.26 | ) | | | 0.23 | | | | (0.51 | ) | | | — | | | | (0.51 | ) | | | 10.09 | | | | 2.28 | | | | 10 | | | | 0.74 | | | | 0.89 | | | | 4.77 | | | | 120 | |
Year ended 10/31/14 | | | 10.05 | | | | 0.50 | | | | 0.36 | | | | 0.86 | | | | (0.54 | ) | | | — | | | | (0.54 | ) | | | 10.37 | | | | 8.82 | | | | 10 | | | | 0.63 | | | | 0.90 | | | | 4.94 | | | | 89 | |
Year ended 10/31/13 | | | 10.84 | | | | 0.54 | | | | (0.59 | ) | | | (0.05 | ) | | | (0.58 | ) | | | (0.16 | ) | | | (0.74 | ) | | | 10.05 | | | | (0.57 | ) | | | 10 | | | | 0.63 | | | | 0.90 | | | | 5.08 | | | | 86 | |
Year ended 10/31/12(e) | | | 10.03 | | | | 0.44 | | | | 0.83 | | | | 1.27 | | | | (0.46 | ) | | | — | | | | (0.46 | ) | | | 10.84 | | | | 12.96 | | | | 766 | | | | 0.63 | (f) | | | 0.85 | (f) | | | 4.79 | (f) | | | 79 | |
Class R6 | | | | | | | | | | | | | | | | | | | | | | | | | | | | | | | | | | | | | | | | | | | | | | | | | | | | | | | | |
Year ended 10/31/16 | | | 10.09 | | | | 0.49 | | | | 0.45 | | | | 0.94 | | | | (0.52 | ) | | | — | | | | (0.52 | ) | | | 10.51 | | | | 9.71 | | | | 49,388 | | | | 0.79 | (d) | | | 0.90 | (d) | | | 4.85 | (d) | | | 101 | |
Year ended 10/31/15 | | | 10.37 | | | | 0.49 | | | | (0.26 | ) | | | 0.23 | | | | (0.51 | ) | | | — | | | | (0.51 | ) | | | 10.09 | | | | 2.28 | | | | 67,568 | | | | 0.74 | | | | 0.89 | | | | 4.77 | | | | 120 | |
Year ended 10/31/14 | | | 10.04 | | | | 0.50 | | | | 0.37 | | | | 0.87 | | | | (0.54 | ) | | | — | | | | (0.54 | ) | | | 10.37 | | | | 8.93 | | | | 51,057 | | | | 0.63 | | | | 0.90 | | | | 4.94 | | | | 89 | |
Year ended 10/31/13 | | | 10.84 | | | | 0.53 | | | | (0.59 | ) | | | (0.06 | ) | | | (0.58 | ) | | | (0.16 | ) | | | (0.74 | ) | | | 10.04 | | | | (0.67 | ) | | | 171,140 | | | | 0.63 | | | | 0.85 | | | | 5.08 | | | | 86 | |
Year ended 10/31/12(e) | | | 10.75 | | | | 0.05 | | | | 0.09 | | | | 0.14 | | | | (0.05 | ) | | | — | | | | (0.05 | ) | | | 10.84 | | | | 1.31 | | | | 138,779 | | | | 0.63 | (f) | | | 0.82 | (f) | | | 4.79 | (f) | | | 79 | |
| (a) | Calculated using average shares outstanding. |
| (b) | Includes adjustments in accordance with accounting principles generally accepted in the United States of America and as such, the net asset value for financial reporting purposes and the returns based upon those net asset values may differ from the net asset value and returns for shareholder transactions. Does not include sales charges and is not annualized for periods less than one year, if applicable. |
| (c) | Portfolio turnover is calculated at the fund level and is not annualized for periods less than one year, if applicable. |
| (d) | Ratios are based on average daily net assets (000’s omitted) of $58,265, $18,196, $, $376, $16,242, $11 and $52,495 for Class A, Class C, Class R, Class Y, Class R5 and Class R6 shares, respectively. |
| (e) | Commencement date of December 14, 2011 for Class A, Class C, Class R, Class Y and Class R5 and September 24, 2012 for Class R6 shares. |
NOTE 13—Subsequent Event
Effective January 1, 2017, the Fund will pay an advisory fee to the Adviser based on the annual rate of the Fund’s average daily net assets as follows:
| | | | |
| Average Daily Net Assets | | Rate | |
First $500 million | | | 0.50% | |
Next $500 million | | | 0.45% | |
Next $500 million | | | 0.40% | |
Over $1.5 billion | | | 0.39% | |
In addition, effective January 1, 2017, the Adviser has contractually agreed, through at least February 28, 2018, to waive advisory fees and/or reimburse expenses to the extent necessary to limit total annual fund operating expenses after fee waiver and/or expense reimbursement (excluding certain items discussed in Note 2) of Class A, Class C, Class R, Class Y, Class R5 and Class R6 shares to 0.85%, 1.60%, 1.10%, 0.60%, 0.60% and 0.60%, respectively, of the Fund’s average daily net assets.
39 Invesco Multi-Asset Income Fund
Report of Independent Registered Public Accounting Firm
To the Board of Trustees and Shareholders of the Invesco Multi-Asset Income Fund:
In our opinion, the accompanying statement of assets and liabilities, including the schedule of investments, and the related statements of operations and of changes in net assets and the financial highlights present fairly, in all material respects, the financial position of the Invesco Multi-Asset Income Fund (formerly, Invesco Premium Income Fund, the “Fund”) as of October 31, 2016, the results of its operations for the year then ended, the changes in its net assets for each of the two years in the period then ended and the financial highlights for each of the four years in the period then ended and for the period December 14, 2011 (commencement of operations) through October 31, 2012, in conformity with accounting principles generally accepted in the United States of America. These financial statements and financial highlights (hereafter referred to as “financial statements”) are the responsibility of the Fund’s management. Our responsibility is to express an opinion on these financial statements based on our audits. We conducted our audits of these financial statements in accordance with the standards of the Public Company Accounting Oversight Board (United States). Those standards require that we plan and perform the audit to obtain reasonable assurance about whether the financial statements are free of material misstatement. An audit includes examining, on a test basis, evidence supporting the amounts and disclosures in the financial statements, assessing the accounting principles used and significant estimates made by management, and evaluating the overall financial statement presentation. We believe that our audits, which included confirmation of securities as of October 31, 2016 by correspondence with the custodian and brokers, and the application of alternative auditing procedures where confirmations of security purchases have not been received, provide a reasonable basis for our opinion.
PRICEWATERHOUSECOOPERS LLP
Houston, Texas
December 21, 2016
40 Invesco Multi-Asset Income Fund
Calculating your ongoing Fund expenses
Example
As a shareholder of the Fund, you incur two types of costs: (1) transaction costs, which may include sales charges (loads) on purchase payments or contingent deferred sales charges on redemptions, if any; and (2) ongoing costs, including management fees, distribution and/or service (12b-1) fees, and other Fund expenses. This example is intended to help you understand your ongoing costs (in dollars) of investing in the Fund and to compare these costs with ongoing costs of investing in other mutual funds. The example is based on an investment of $1,000 invested at the beginning of the period and held for the entire period May 1, 2016 through October 31, 2016.
Actual expenses
The table below provides information about actual account values and actual expenses. You may use the information in this table, together with the amount you invested, to estimate the expenses that you paid over the period. Simply divide your account value by $1,000 (for example, an $8,600 account value divided by $1,000 = 8.6), then multiply the result by the number in the table under the heading entitled “Actual Expenses Paid During Period” to estimate the expenses you paid on your account during this period.
Hypothetical example for comparison purposes
The table below also provides information about hypothetical account values and hypothetical expenses based on the Fund’s actual expense ratio and an assumed rate of return of 5% per year before expenses, which is not the Fund’s actual return.
The hypothetical account values and expenses may not be used to estimate the actual ending account balance or expenses you paid for the period. You may use this information to compare the ongoing costs of investing in the Fund and other funds. To do so, compare this 5% hypothetical example with the 5% hypothetical examples that appear in the shareholder reports of the other funds.
Please note that the expenses shown in the table are meant to highlight your ongoing costs only and do not reflect any transaction costs, such as sales charges (loads) on purchase payments or contingent deferred sales charges on redemptions, if any. Therefore, the hypothetical information is useful in comparing ongoing costs only, and will not help you determine the relative total costs of owning different funds. In addition, if these transaction costs were included, your costs would have been higher.
| | | | | | | | | | | | | | | | | | | | | | | | |
| Class | | Beginning
Account Value
(05/01/16) | | | ACTUAL | | | HYPOTHETICAL
(5% annual return before
expenses) | | | Annualized
Expense
Ratio2 | |
| | | Ending
Account Value
(10/31/16)1 | | | Expenses
Paid During
Period2,3 | | | Ending
Account Value
(10/31/16) | | | Expenses
Paid During
Period2,4 | | |
A | | $ | 1,000.00 | | | $ | 1,065.60 | | | $ | 5.40 | | | $ | 1,019.91 | | | $ | 5.28 | | | | 1.04 | % |
C | | | 1,000.00 | | | | 1,061.70 | | | | 9.28 | | | | 1,016.14 | | | | 9.07 | | | | 1.79 | |
R | | | 1,000.00 | | | | 1,064.30 | | | | 6.69 | | | | 1,018.65 | | | | 6.55 | | | | 1.29 | |
Y | | | 1,000.00 | | | | 1,066.90 | | | | 4.10 | | | | 1,021.17 | | | | 4.01 | | | | 0.79 | |
R5 | | | 1,000.00 | | | | 1,066.90 | | | | 4.10 | | | | 1,021.17 | | | | 4.01 | | | | 0.79 | |
R6 | | | 1,000.00 | | | | 1,066.90 | | | | 4.10 | | | | 1,021.17 | | | | 4.01 | | | | 0.79 | |
| 1 | The actual ending account value is based on the actual total return of the Fund for the period May 1, 2016 through October 31, 2016, after actual expenses and will differ from the hypothetical ending account value which is based on the Fund’s expense ratio and a hypothetical annual return of 5% before expenses. |
| 2 | Expenses are equal to the Fund’s annualized expense ratio as indicated above multiplied by the average account value over the period, multiplied by 184/366 to reflect the most recent fiscal half year. Effective January 1, 2017, the Fund’s adviser has contractually agreed to waive advisory fees and/or reimburse expenses to the extent necessary to limit total annual fund operating expense of Class A, Class C, Class R, Class Y Class R5 and Class R6 shares to 0.85%, 1.60%, 1.10%, 0.60%, 0.60% and 0.60% of average daily net assets, respectively. The annualized expense ratios restated as if these agreements had been in effect throughout the entire most recent fiscal half year are 0.84%, 1.59%, 1.09%, 0.59%, 0.59% and 0.59% for Class A, Class C, Class R, Class Y Class R5 and Class R6 shares, respectively. |
| 3 | The actual expenses paid restated as if the changes discussed above had been in effect throughout the entire most recent fiscal half year are $4.36, $8.24, $5.66, $3.07, $3.07 and $3.07 for Class A, Class C, Class R, Class Y Class R5 and Class R6 shares, respectively. |
| 4 | The hypothetical expenses paid restated as if the changes discussed above had been in effect throughout the entire most recent fiscal half year are $4.27, $8.06, $5.53, $3.00, $3.00 and $3.00 for Class A, Class C, Class R, Class Y Class R5 and Class R6 shares, respectively. |
41 Invesco Multi-Asset Income Fund
Approval of Investment Advisory and Sub-Advisory Contracts
The Board of Trustees (the Board) of AIM Investment Funds (Invesco Investment Funds) is required under the Investment Company Act of 1940, as amended, to approve annually the renewal of Invesco Multi-Asset Income Fund’s (the Fund) investment advisory agreements. During contract renewal meetings held on June 7-8, 2016, the Board as a whole, and the disinterested or “independent” Trustees, who comprise over 75% of the Board, voting separately, approved the continuance for the Fund of the Master Investment Advisory Agreement with Invesco Advisers, Inc. (Invesco Advisers and the investment advisory agreement) and the Master Intergroup Sub-Advisory Contract for Mutual Funds with Invesco Asset Management Deutschland GmbH, Invesco Asset Management Limited, Invesco Asset Management (Japan) Limited, Invesco Hong Kong Limited, Invesco Senior Secured Management, Inc., Invesco Canada Ltd. and Invesco PowerShares Capital Management LLC (collectively, the Affiliated Sub-Advisers and the sub-advisory contracts) for another year, effective July 1, 2016.
In evaluating the fairness and reasonableness of compensation under the Fund’s investment advisory agreement and sub-advisory contracts, the Board considered, among other things, the factors discussed below. The Board determined that continuation of the Fund’s investment advisory agreement and the sub-advisory contracts is in the best interest of the Fund and its shareholders and that the compensation payable to Invesco Advisers and the Affiliated Sub-Advisers under the agreements is fair and reasonable.
The Board’s Fund Evaluation Process
The Board’s Investments Committee has established three Sub-Committees, which meet throughout the year to review the performance of funds advised by Invesco Advisers (the Invesco Funds). Over the course of each year, the Sub-Committees meet with portfolio managers for their assigned Invesco Funds and other members of management to review the performance, investment objective(s), policies, strategies, limitations and investment risks of these funds. The Board had the benefit of reports from the Sub-Committees and Investments Committee throughout the year in considering approval of the continuance of each Invesco Fund’s investment advisory agreement and sub-advisory contracts for another year.
During the contract renewal process, the Board receives comparative performance and fee data regarding the Invesco Funds prepared by Invesco Advisers and Broadridge Financial Solutions, Inc. (Broadridge), an independent provider of investment company data. The Board also receives an independent written evaluation from the Senior Officer, an officer of the Invesco Funds who reports directly to the
independent Trustees. The Senior Officer’s evaluation is prepared as part of his responsibility to manage the process by which the Invesco Funds’ proposed management fees are negotiated during the annual contract renewal process to ensure they are negotiated in a manner that is at arms’ length and reasonable. In addition to meetings with Invesco Advisers and fund counsel, the independent Trustees also discuss the continuance of the investment advisory agreement and sub-advisory contracts in separate sessions with the Senior Officer and with independent legal counsel.
The Trustees recognized that the advisory fee rates for the Invesco Funds are, in many cases, the result of years of review and negotiation. The Trustees’ deliberations and conclusions in a particular year may be based in part on their deliberations and conclusions regarding these same arrangements throughout the year and in prior years. The Trustees’ review and conclusions are based on the comprehensive consideration of all information presented to them and are not the result of any single determinative factor. Moreover, one Trustee may have weighed a particular piece of information or factor differently than another Trustee.
The discussion below is a summary of the Senior Officer’s independent written evaluation with respect to the Fund’s investment advisory agreement as well as a discussion of the material factors and related conclusions that formed the basis for the Board’s approval of the Fund’s investment advisory agreement and sub-advisory contracts. Unless otherwise stated, this information is current as of June 8, 2016, and does not reflect consideration of factors that became known to the Board after that date.
Factors and Conclusions and Summary of Independent Written Fee Evaluation
| A. | Nature, Extent and Quality of Services Provided by Invesco Advisers and the Affiliated Sub-Advisers |
The Board reviewed the advisory services provided to the Fund by Invesco Advisers under the Fund’s investment advisory agreement, the performance of Invesco Advisers in providing these services, and the credentials and experience of the officers and employees of Invesco Advisers who provide these services, including the Fund’s portfolio manager or managers. The Board’s review of the qualifications of Invesco Advisers to provide advisory services included the Board’s consideration of Invesco Advisers’ investment process oversight, independent credit analysis and investment risk management. The Board also considered non-advisory services that Invesco Advisers and its affiliates provide to the Invesco Funds such as various back office
support functions, trading operations, internal audit, valuation and legal and compliance.
In determining whether to continue the Fund’s investment advisory agreement, the Board considered the benefits of reapproving an existing relationship and the greater uncertainty that may be associated with entering into a new relationship. The Board concluded that the nature, extent and quality of the services provided to the Fund by Invesco Advisers are appropriate and satisfactory and consistent with the terms of the Fund’s investment advisory agreement.
The Board reviewed the services that may be provided by the Affiliated Sub-Advisers under the sub-advisory contracts and the credentials and experience of the officers and employees of the Affiliated Sub-Advisers who provide these services. The Board noted that the Affiliated Sub-Advisers have offices and personnel that are located in financial centers around the world. As a result, the Board noted that the Affiliated Sub-Advisers can provide research and investment analysis on the markets and economies of various countries in which the Fund may invest, make recommendations regarding securities and assist with security trades. The Board concluded that the sub-advisory contracts may benefit the Fund and its shareholders by permitting Invesco Advisers to use the resources and talents of the Affiliated Sub-Advisers in managing the Fund. The Board concluded that the nature, extent and quality of the services that may be provided by the Affiliated Sub-Advisers are appropriate and satisfactory and consistent with the terms of the Fund’s sub-advisory contracts.
The Board considered Fund performance as a relevant factor in considering whether to approve the investment advisory agreement as well as the sub-advisory contracts for the Fund, as Invesco PowerShares Capital Management LLC currently manages certain assets of the Fund.
The Board noted that the Fund recently began operations and that comparative performance data for only the past four calendar years was available. The Board compared the Fund’s performance during the past four calendar years to the performance of funds in the Broadridge performance universe and against the Lipper Mixed-Asset Target Allocation Conservative Funds Index. The Board noted that performance of Class A shares of the Fund was in the first quintile of its performance universe for the one year and in the fifth quintile for the three year period (the first quintile being the best performing funds and the fifth quintile being the worst performing funds). The Board noted that the Fund’s performance was above the performance of the Index for the one year period and below the performance of the index for the three year period. The
42 Invesco Multi-Asset Income Fund
Trustees also reviewed more recent Fund performance and this review did not change their conclusions.
| C. | Advisory and Sub-Advisory Fees |
The Board compared the Fund’s contractual management fee rate to the contractual management fee rates of funds in the Fund’s Broadridge expense group at a common asset level. The Board noted that the contractual management fee rate for Class A shares of the Fund was at the median contractual management fee rate of funds in its expense group. The Board noted that the term “contractual management fee” for funds in the expense group may include both advisory and certain administrative services fees, but that Broadridge does not provide information on a fund by fund basis as to what is included. The Board noted that Invesco Advisers does not separately charge the Invesco Funds for the administrative services included in the term as defined by Broadridge. The Board also reviewed the methodology used by Broadridge in providing expense group information, which includes using each fund’s contractual management fee schedule (including any applicable breakpoints) as reported in the most recent prospectus or statement of additional information for each fund in the expense group.
The Board noted that Invesco Advisers has contractually agreed to waive fees and/or limit expenses of the Fund through at least February��28, 2017 in an amount necessary to limit total annual operating expenses to a specified percentage of average daily net assets for each class of the Fund.
The Board noted that Invesco Advisers and its affiliates manage two other mutual funds using an investment process substantially similar to the investment process used for the Fund. The Board noted that both of the other mutual funds are fund of funds and Invesco Advisers does not charge advisory fees at the fund level. Invesco Advisors and the Affiliated Sub-Advisers do not manage other client accounts using an investment process substantially similar to the investment process used for the Fund.
The Board also considered the services that may be provided by the Affiliated Sub-Advisers pursuant to the sub-advisory contracts, as well as the fees payable by Invesco Advisers to the Affiliated Sub-Advisers pursuant to the sub-advisory contracts. The Board noted that Invesco Advisers retains overall responsibility for, and provides services to, sub-advised Invesco Funds, including oversight of the Affiliated Sub-Advisers as well as the additional services described herein other than day-to-day portfolio management other than day-to-day portfolio management. The Board also noted that the sub-advisory fees are not paid directly by the Fund, but rather, are payable by Invesco Advisers to the Affiliated Sub-Advisers.
| D. | Economies of Scale and Breakpoints |
The Board considered the extent to which there are economies of scale in the provision of advisory services to the Fund. The Board also considered whether the Fund benefits from
economies of scale through contractual breakpoints in the Fund’s advisory fee schedule. The Board also noted that the Fund shares directly in economies of scale through lower fees charged by third party service providers based on the combined size of the Invesco Funds and other clients advised by Invesco Advisers.
| E. | Profitability and Financial Resources |
The Board reviewed information from Invesco Advisers concerning the costs of the advisory and other services that Invesco Advisers and its affiliates provide to the Fund and the Invesco Funds and the profitability of Invesco Advisers and its affiliates in providing these services. The Board received information from Invesco Advisers and a report from an independent consultant engaged by the Senior Officer about the methodology used to prepare the profitability information. The Board noted that Invesco Advisers continues to operate at a net profit from services Invesco Advisers and its affiliates provide to the Invesco Funds. The Board noted that although Invesco Advisers received a minimal amount of revenues from advising the Fund, Invesco Advisers and its affiliates did not make a profit from managing the Fund as a result of fee and expense waivers. The Board received and accepted information from Invesco Advisers demonstrating that Invesco Advisers and each Affiliated Sub-Adviser are financially sound and have the resources necessary to perform their obligations under the investment advisory agreement and sub-advisory contracts.
| F. | Collateral Benefits to Invesco Advisers and its Affiliates |
The Board considered various other benefits received by Invesco Advisers and its affiliates from the relationship with the Fund, including the fees received for providing transfer agency and distribution services to the Fund. The Board considered comparative information regarding fees charged for these services, including information provided by Broadridge and other independent sources. The Board considered the performance of Invesco Advisers and its affiliates in providing these services and the organizational structure employed to provide these services. The Board also considered that these services are provided to the Fund pursuant to written contracts that are reviewed and approved on an annual basis by the Board; and that the services are required for the operation of the Fund.
The Board considered the benefits realized by Invesco Advisers and the Affiliated Sub-Advisers as a result of portfolio brokerage transactions executed through “soft dollar” arrangements. Invesco Advisers noted that the Fund does not execute brokerage transaction through “soft dollar” arrangements to any significant degree.
The Board considered that the Fund’s uninvested cash and cash collateral from any securities lending arrangements may be invested in money market funds advised by Invesco Advisers pursuant to procedures approved by the Board. The Board noted that
Invesco Advisers receives advisory fees from these affiliated money market funds attributable to such investments, although Invesco Advisers has contractually agreed to waive through varying periods the advisory fees payable by the Invesco Funds with respect to certain investments in the affiliated money market funds. The waiver is in an amount equal to 100% of the net advisory fee Invesco Advisers receives from the affiliated money market funds with respect to the Fund’s investment in the affiliated money market funds of uninvested cash, but not cash collateral. The Board concluded that the amount of advisory fees received by Invesco Advisors from the Fund’s investment of cash collateral from any securities lending arrangements in the affiliated money market funds is fair and reasonable.
43 Invesco Multi-Asset Income Fund
Tax Information
Form 1099-DIV, Form 1042-S and other year-end tax information provide shareholders with actual calendar year amounts that should be included in their tax returns. Shareholders should consult their tax advisors.
The following distribution information is being provided as required by the Internal Revenue Code or to meet a specific state’s requirement.
The Fund designates the following amounts or, if subsequently determined to be different, the maximum amount allowable for its fiscal year ended October 31, 2016:
| | | | |
Federal and State Income Tax | |
Qualified Dividend Income* | | | 0.00 | % |
Corporate Dividends Received Deduction* | | | 0.00 | % |
U.S. Treasury Obligations* | | | 4.14 | % |
| | * | The above percentages are based on ordinary income dividends paid to shareholders during the Fund’s fiscal year. |
44 Invesco Multi-Asset Income Fund
Trustees and Officers
The address of each trustee and officer is AIM Investment Funds (Invesco Investment Funds) (the “Trust”), 11 Greenway Plaza, Suite 1000, Houston, Texas 77046-1173. The trustees serve for the life of the Trust, subject to their earlier death, incapacitation, resignation, retirement or removal as more specifically provided in the Trust’s organizational documents. Each officer serves for a one year term or until their successors are elected and qualified. Column two below includes length of time served with predecessor entities, if any.
| | | | | | | | |
Name, Year of Birth and
Position(s) Held with the Trust | | Trustee and/
or Officer Since | | Principal Occupation(s)
During Past 5 Years | | Number of
Funds in Fund
Complex
Overseen by
Trustee | | Other Directorship(s)
Held by Trustee During
Past 5 Years |
| Interested Persons | | | | | | | | |
| Martin L. Flanagan1 — 1960 Trustee | | 2007 | | Executive Director, Chief Executive Officer and President, Invesco Ltd. (ultimate parent of Invesco and a global investment management firm); Advisor to the Board, Invesco Advisers, Inc. (formerly known as Invesco Institutional (N.A.), Inc.); Trustee, The Invesco Funds; Vice Chair, Investment Company Institute; and Member of Executive Board, SMU Cox School of Business Formerly: Chairman and Chief Executive Officer, Invesco Advisers, Inc. (registered investment adviser); Director, Chairman, Chief Executive Officer and President, Invesco Holding Company (US) Inc. (formerly IVZ Inc.) (holding company), Invesco Group Services, Inc. (service provider) and Invesco North American Holdings, Inc. (holding company); Director, Chief Executive Officer and President, Invesco Holding Company Limited (parent of Invesco and a global investment management firm); Director, Invesco Ltd.; Chairman, Investment Company Institute and President, Co-Chief Executive Officer, Co-President, Chief Operating Officer and Chief Financial Officer, Franklin Resources, Inc. (global investment management organization) | | 146 | | None |
| Philip A. Taylor2 — 1954 Trustee and Senior Vice President | | 2006 | | Head of the Americas and Senior Managing Director, Invesco Ltd.; Director, Co-Chairman, Co-President and Co-Chief Executive Officer, Invesco Advisers, Inc. (formerly known as Invesco Institutional (N.A.), Inc.) (registered investment adviser); Director, Chairman, Chief Executive Officer and President, Invesco Management Group, Inc. (formerly known as Invesco AIM Management Group, Inc.) (financial services holding company); Director and Chairman, Invesco Investment Services, Inc. (formerly known as Invesco AIM Investment Services, Inc.) (registered transfer agent) Chief Executive Officer, Invesco Corporate Class Inc. (corporate mutual fund company) Director, Chairman and Chief Executive Officer, Invesco Canada Ltd. (formerly known as Invesco Trimark Ltd./Invesco Trimark Ltèe) (registered investment adviser and registered transfer agent); Trustee and Senior Vice President, The Invesco Funds; Director, Invesco Investment Advisers LLC (formerly known as Van Kampen Asset Management). Formerly: Director, Chief Executive Officer and President, Van Kampen Exchange Corp.; President and Principal Executive Officer, The Invesco Funds (other than AIM Treasurer’s Series Trust (Invesco Treasurer’s Series Trust), Short-Term Investments Trust and Invesco Management Trust); Executive Vice President, The Invesco Funds (AIM Treasurer’s Series Trust (Invesco Treasurer’s Series Trust), Short-Term Investments Trust and Invesco Management Trust only); Director and President, INVESCO Funds Group, Inc. (registered investment adviser and registered transfer agent); Director and Chairman, IVZ Distributors, Inc. (formerly known as INVESCO Distributors, Inc.) (registered broker dealer); Director, President and Chairman, Invesco Inc. (holding company), Invesco Canada Holdings Inc. (holding company), Trimark Investments Ltd./Placements Trimark Ltèe and Invesco Financial Services Ltd/Services Financiers Invesco Ltèe; Chief Executive Officer, Invesco Canada Fund Inc. (corporate mutual fund company); Director and Chairman, Van Kampen Investor Services Inc.; Director, Chief Executive Officer and President, 1371 Preferred Inc. (holding company) and Van Kampen Investments Inc.; Director and President, AIM GP Canada Inc. (general partner for limited partnerships) and Van Kampen Advisors, Inc.; Director and Chief Executive Officer, Invesco Trimark Dealer Inc. (registered broker dealer); Director, Invesco Distributors, Inc. (formerly known as Invesco AIM Distributors, Inc.) (registered broker dealer); Manager, Invesco PowerShares Capital Management LLC; Director, Chief Executive Officer and President, Invesco Advisers, Inc.; Director, Chairman, Chief Executive Officer and President, Invesco AIM Capital Management, Inc.; President, Invesco Trimark Dealer Inc. and Invesco Trimark Ltd./Invesco Trimark Ltèe; Director and President, AIM Trimark Corporate Class Inc. and AIM Trimark Canada Fund Inc.; Senior Managing Director, Invesco Holding Company Limited; Director and Chairman, Fund Management Company (former registered broker dealer); President and Principal Executive Officer, The Invesco Funds (AIM Treasurer’s Series Trust (Invesco Treasurer’s Series Trust), and Short-Term Investments Trust only); President, AIM Trimark Global Fund Inc. and AIM Trimark Canada Fund Inc. | | 146 | | None |
| 1 | Mr. Flanagan is considered an interested person (within the meaning of Section 2(a)(19) of the 1940 Act) of the Trust because he is an officer of the Adviser to the Trust, and an officer and a director of Invesco Ltd., ultimate parent of the Adviser. |
| 2 | Mr. Taylor is considered an interested person (within the meaning of Section 2(a)(19) of the 1940 Act) of the Trust because he is an officer and a director of the Adviser. |
T-1 Invesco Multi-Asset Income Fund
Trustees and Officers—(continued)
| | | | | | | | |
Name, Year of Birth and
Position(s) Held with the Trust | | Trustee and/
or Officer Since | | Principal Occupation(s) During Past 5 Years | | Number of
Funds in Fund
Complex
Overseen by
Trustee | | Other Directorship(s)
Held by Trustee During
Past 5 Years |
| Independent Trustees | | | | | | | | |
Bruce L. Crockett — 1944 Trustee and Chair | | 2001 | | Chairman, Crockett Technologies Associates (technology consulting company) Formerly: Director, Captaris (unified messaging provider); Director, President and Chief Executive Officer, COMSAT Corporation; Chairman, Board of Governors of INTELSAT (international communications company); ACE Limited (insurance company); Independent Directors Council and Investment Company Institute | | 146 | | ALPS (Attorneys Liability Protection Society) (insurance company) and Globe Specialty Metals, Inc. (metallurgical company); Member of the Audit Committee, Ferroglobe PLC and Investment Company Institute; Member of the Executive Committee and Chair of the Governance Committee, Independent Directors Council |
David C. Arch — 1945 Trustee | | 2010 | | Chairman of Blistex Inc., a consumer health care products manufacturer | | 146 | | Board member of the Illinois Manufacturers’ Association; Member of the Board of Visitors, Institute for the Humanities, University of Michigan |
James T. Bunch — 1942 Trustee | | 2003 | | Managing Member, Grumman Hill Group LLC (family office/private equity investments) Formerly: Chairman of the Board, Denver Film Society, Chairman of the Board of Trustees, Evans Scholarship Foundation; Chairman, Board of Governors, Western Golf Association | | 146 | | Trustee, Evans Scholarship Foundation |
Albert R. Dowden — 1941 Trustee | | 2001 | | Director of a number of public and private business corporations, including Nature’s Sunshine Products, Inc. Formerly: Director, The Boss Group, Ltd. and Reich & Tang Funds (5 portfolios) (registered investment company); Director, Homeowners of America Holding Corporation/Homeowners of America Insurance Company (property casualty company); Director, Continental Energy Services, LLC (oil and gas pipeline service); Director, CompuDyne Corporation (provider of product and services to the public security market) and Director, Annuity and Life Re (Holdings), Ltd. (reinsurance company); Director, President and Chief Executive Officer, Volvo Group North America, Inc.; Senior Vice President, AB Volvo; Director of various public and private corporations; Chairman, DHJ Media, Inc.; Director, Magellan Insurance Company; and Director, The Hertz Corporation, Genmar Corporation (boat manufacturer), National Media Corporation; Advisory Board of Rotary Power International (designer, manufacturer, and seller of rotary power engines); and Chairman, Cortland Trust, Inc. (registered investment company) | | 146 | | Director of Nature’s Sunshine Products, Inc. |
Jack M. Fields — 1952 Trustee | | 2001 | | Chief Executive Officer, Twenty First Century Group, Inc. (government affairs company); and Discovery Learning Alliance (non-profit) Formerly: Owner and Chief Executive Officer, Dos Angeles Ranch L.P. (cattle, hunting, corporate entertainment); Director, Insperity, Inc. (formerly known as Administaff); Chief Executive Officer, Texana Timber LP (sustainable forestry company); Director of Cross Timbers Quail Research Ranch (non-profit); and member of the U.S. House of Representatives | | 146 | | None |
Eli Jones — 1961 Trustee | | 2016 | | Professor and Dean, Mays Business School — Texas A&M University Formerly: Professor and Dean, Walton College of Business, University of Arkansas and E.J. Ourso College of Business, Louisiana State University and Director, Arvest Bank | | 146 | | Director of Insperity, Inc. (formerly known as Administaff) |
Prema Mathai-Davis — 1950 Trustee | | 2001 | | Retired. Formerly: Chief Executive Officer, YWCA of the U.S.A. | | 146 | | None |
Larry Soll — 1942 Trustee | | 2003 | | Retired. Formerly: Chairman, Chief Executive Officer and President, Synergen Corp. (a biotechnology company) | | 146 | | None |
Raymond Stickel, Jr. — 1944 Trustee | | 2005 | | Retired. Formerly: Director, Mainstay VP Series Funds, Inc. (25 portfolios) and Partner, Deloitte & Touche | | 146 | | None |
Robert C. Troccoli — 1949 Trustee | | 2016 | | Adjunct Professor, University of Denver — Daniels College of Business Formerly: Senior Partner, KPMG LLP | | 146 | | None |
T-2 Invesco Multi-Asset Income Fund
Trustees and Officers—(continued)
| | | | | | | | |
Name, Year of Birth and
Position(s) Held with the Trust | | Trustee and/
or Officer Since | | Principal Occupation(s) During Past 5 Years | | Number of
Funds in Fund
Complex
Overseen by
Trustee | | Other Directorship(s)
Held by Trustee During
Past 5 Years |
| Independent Trustees—(continued) |
Suzanne H. Woolsey — 1941 Trustee | | 2014 | | Retired. Formerly: Chief Executive Officer of Woolsey Partners LLC | | 146 | | Director, SunShare LLC; Trustee, Ocean Conservancy; Emeritus Chair of the Board of Trustees of the Institute for Defense Analyses and of Colorado College; Trustee, Chair, Business and Finance Committee of California Institute of Technology; Prior to 2014, Director of Fluor Corp.; Prior to 2010, Trustee of the German Marshall Fund of the United States; Prior to 2010, Trustee of the Rocky Mountain Institute |
| Other Officers | | | | | | | | |
Sheri Morris — 1964 President, Principal Executive Officer and Treasurer | | 1999 | | President, Principal Executive Officer and Treasurer, The Invesco Funds; Vice President, Invesco Advisers, Inc. (formerly known as Invesco Institutional (N.A.), Inc.) (registered investment adviser); and Vice President, PowerShares Exchange-Traded Fund Trust, PowerShares Exchange-Traded Fund Trust II, PowerShares India Exchange-Traded Fund Trust, PowerShares Actively Managed Exchange-Traded Fund Trust, and PowerShares Actively Managed Exchange-Traded Commodity Fund Trust Formerly: Vice President and Principal Financial Officer, The Invesco Funds; Vice President, Invesco AIM Advisers, Inc., Invesco AIM Capital Management, Inc. and Invesco AIM Private Asset Management, Inc.; Assistant Vice President and Assistant Treasurer, The Invesco Funds and Assistant Vice President, Invesco Advisers, Inc., Invesco AIM Capital Management, Inc. and Invesco AIM Private Asset Management, Inc.; and Treasurer, PowerShares Exchange-Traded Fund Trust, PowerShares Exchange-Traded Fund Trust II, PowerShares India Exchange-Traded Fund Trust and PowerShares Actively Managed Exchange-Traded Fund Trust | | N/A | | N/A |
Russell C. Burk — 1958 Senior Vice President and Senior Officer | | 2005 | | Senior Vice President and Senior Officer, The Invesco Funds | | N/A | | N/A |
John M. Zerr — 1962 Senior Vice President, Chief Legal Officer and Secretary | | 2006 | | Director, Senior Vice President, Secretary and General Counsel, Invesco Management Group, Inc. (formerly known as Invesco AIM Management Group, Inc.; Senior Vice President, Invesco Advisers, Inc. (formerly known as Invesco Institutional (N.A.), Inc.) (registered investment adviser); Senior Vice President and Secretary, Invesco Distributors, Inc. (formerly known as Invesco AIM Distributors, Inc.); Director, Vice President and Secretary, Invesco Investment Services, Inc. (formerly known as Invesco AIM Investment Services, Inc.) Senior Vice President, Chief Legal Officer and Secretary, The Invesco Funds; Managing Director, Invesco PowerShares Capital Management LLC; Director, Secretary and General Counsel, Invesco Investment Advisers LLC (formerly known as Van Kampen Asset Management); Secretary and General Counsel, Invesco Capital Markets, Inc. (formerly known as Van Kampen Funds Inc.) and Chief Legal Officer, PowerShares Exchange-Traded Fund Trust, PowerShares Exchange-Traded Fund Trust II, PowerShares India Exchange-Traded Fund Trust, PowerShares Actively Managed Exchange-Traded Fund Trust, and PowerShares Actively Managed Exchange-Traded Commodity Fund Trust Formerly: Director, Secretary, General Counsel and Senior Vice President, Van Kampen Exchange Corp.; Director, Vice President and Secretary, IVZ Distributors, Inc. (formerly known as INVESCO Distributors, Inc.); Director and Vice President, INVESCO Funds Group, Inc.; Director and Vice President, Van Kampen Advisors Inc.; Director, Vice President, Secretary and General Counsel, Van Kampen Investor Services Inc.; Director, Invesco Distributors, Inc. (formerly known as Invesco AIM Distributors, Inc.); Director, Senior Vice President, General Counsel and Secretary, Invesco AIM Advisers, Inc. and Van Kampen Investments Inc.; Director, Vice President and Secretary, Fund Management Company; Director, Senior Vice President, Secretary, General Counsel and Vice President, Invesco AIM Capital Management, Inc.; Chief Operating Officer and General Counsel, Liberty Ridge Capital, Inc. (an investment adviser); Vice President and Secretary, PBHG Funds (an investment company) and PBHG Insurance Series Fund (an investment company); Chief Operating Officer, General Counsel and Secretary, Old Mutual Investment Partners (a broker-dealer); General Counsel and Secretary, Old Mutual Fund Services (an administrator) and Old Mutual Shareholder Services (a shareholder servicing center); Executive Vice President, General Counsel and Secretary, Old Mutual Capital, Inc. (an investment adviser); and Vice President and Secretary, Old Mutual Advisors Funds (an investment company) | | N/A | | N/A |
T-3 Invesco Multi-Asset Income Fund
Trustees and Officers—(continued)
| | | | | | | | |
Name, Year of Birth and
Position(s) Held with the Trust | | Trustee and/
or Officer Since | | Principal Occupation(s) During Past 5 Years | | Number of
Funds in Fund
Complex
Overseen by
Trustee | | Other Directorship(s)
Held by Trustee During
Past 5 Years |
| Other Officers—(continued) | | | | | | | | |
| Karen Dunn Kelley — 1960 Senior Vice President | | 2004 | | Senior Managing Director, Investments, Invesco Ltd.; Director, Co-President, Co-Chief Executive Officer, and Co-Chairman, Invesco Advisers, Inc. (formerly known as Invesco Institutional (N.A.), Inc.) (registered investment adviser); Chairman and Director, Invesco Senior Secured Management, Inc.; Senior Vice President, Invesco Management Group, Inc. (formerly known as Invesco AIM Management Group, Inc.); Executive Vice President, Invesco Distributors, Inc. (formerly known as Invesco AIM Distributors, Inc.); Director, Invesco Mortgage Capital Inc. and Invesco Management Company Limited; Senior Vice President, The Invesco Funds Formerly: Vice President, The Invesco Funds (other than AIM Treasurer’s Series Trust (Invesco Treasurer’s Series Trust), Short-Term Investments Trust and Invesco Management Trust); and President and Principal Executive Officer, The Invesco Funds (AIM Treasurer’s Series Trust (Invesco Treasurer’s Series Trust), Short-Term Investments Trust and Invesco Management Trust only); Director and President, INVESCO Asset Management (Bermuda) Ltd., Director, INVESCO Global Asset Management DAC (formerly known as INVESCO Global Asset Management Limited) and INVESCO Management S.A.; Senior Vice President, Van Kampen Investments Inc. and Invesco Advisers, Inc. (formerly known as Invesco Institutional (N.A.), Inc.) (registered investment adviser); Director and President, Fund Management Company; Chief Cash Management Officer, Director of Cash Management, Senior Vice President, and Managing Director, Invesco AIM Capital Management, Inc.; Director of Cash Management, Senior Vice President, and Vice President, Invesco Advisers, Inc. and Vice President, The Invesco Funds (AIM Treasurer’s Series Trust (Invesco Treasurer’s Series Trust), and Short-Term Investments Trust only) | | N/A | | N/A |
Kelli Gallegos — 1970 Vice President, Principal Financial Officer and Assistant Treasurer | | 2008 | | Vice President, Principal Financial Officer and Assistant Treasurer, The Invesco Funds; Assistant Treasurer, Invesco PowerShares Capital Management LLC, PowerShares Exchange-Traded Fund Trust, PowerShares Exchange-Traded Fund Trust II, PowerShares India Exchange-Traded Fund Trust, PowerShares Actively Managed Exchange-Traded Fund Trust, and PowerShares Actively Managed Exchange-Traded Commodity Fund Trust Formerly: Assistant Vice President, The Invesco Funds | | N/A | | N/A |
Tracy Sullivan — 1962 Vice President, Chief Tax Officer and Assistant Treasurer | | 2008 | | Vice President, Chief Tax Officer and Assistant Treasurer, The Invesco Funds; Assistant Treasurer, Invesco PowerShares Capital Management LLC, PowerShares Exchange-Traded Fund Trust, PowerShares Exchange-Traded Fund Trust II, PowerShares India Exchange-Traded Fund Trust, PowerShares Actively Managed Exchange-Traded Fund Trust, and PowerShares Actively Managed Exchange-Traded Commodity Fund Trust Formerly: Assistant Vice President, The Invesco Funds | | N/A | | N/A |
Crissie M. Wisdom — 1969 Anti-Money Laundering Compliance Officer | | 2013 | | Anti-Money Laundering Compliance Officer, Invesco Advisers, Inc. (formerly known as Invesco Institutional (N.A.), Inc.) (registered investment adviser), Invesco Capital Markets, Inc. (formerly known as Van Kampen Funds Inc.), Invesco Distributors, Inc., Invesco Investment Services, Inc., Invesco Management Group, Inc., The Invesco Funds, and PowerShares Exchange-Traded Fund Trust, PowerShares Exchange-Traded Fund Trust II, PowerShares India Exchange-Traded Fund Trust, PowerShares Actively Managed Exchange-Traded Fund Trust and PowerShares Actively Managed Exchange-Traded Commodity Fund Trust; Anti-Money Laundering Compliance Officer and Bank Secrecy Act Officer, INVESCO National Trust Company and Invesco Trust Company; and Fraud Prevention Manager and Controls and Risk Analysis Manager for Invesco Investment Services, Inc. Formerly: Anti-Money Laundering Compliance Officer, Van Kampen Exchange Corp. | | N/A | | N/A |
Robert R. Leveille — 1969 Chief Compliance Officer | | 2016 | | Chief Compliance Officer, Invesco Advisers, Inc. (registered investment adviser); and Chief Compliance Officer, The Invesco Funds Formerly: Chief Compliance Officer, Putnam Investments and the Putnam Funds | | N/A | | N/A |
The Statement of Additional Information of the Trust includes additional information about the Fund’s Trustees and is available upon request, without charge, by calling 1.800.959.4246. Please refer to the Fund’s Statement of Additional Information for information on the Fund’s sub-advisers.
| | | | | | |
Office of the Fund 11 Greenway Plaza, Suite 1000 Houston, TX 77046-1173 | | Investment Adviser Invesco Advisers, Inc. 1555 Peachtree Street, N.E. Atlanta, GA 30309 | | Distributor Invesco Distributors, Inc. 11 Greenway Plaza, Suite 1000 Houston, TX 77046-1173 | | Auditors PricewaterhouseCoopers LLP 1000 Louisiana Street, Suite 5800 Houston, TX 77002-5678 |
| | | |
| | | | | | |
Counsel to the Fund Stradley Ronon Stevens & Young, LLP 2005 Market Street, Suite 2600 Philadelphia, PA 19103-7018 | | Counsel to the Independent Trustees Goodwin Procter LLP 901 New York Avenue, N.W. Washington, D.C. 20001 | | Transfer Agent Invesco Investment Services, Inc. 11 Greenway Plaza, Suite 1000 Houston, TX 77046-1173 | | Custodian State Street Bank and Trust Company 225 Franklin Street Boston, MA 02110-2801 |
T-4 Invesco Multi-Asset Income Fund
Explore High-Conviction Investing with Invesco

Invesco mailing information
Send general correspondence to Invesco Investment Services, Inc., P.O. Box 219078, Kansas City, MO 64121-9078.
Important notice regarding delivery of security holder documents
To reduce Fund expenses, only one copy of most shareholder documents may be mailed to shareholders with multiple accounts at the same address (Householding). Mailing of your shareholder documents may be householded indefinitely unless you instruct us otherwise. If you do not want the mailing of these documents to be combined with those for other members of your household, please contact Invesco Investment Services, Inc. at 800 959 4246 or contact your financial institution. We will begin sending you individual copies for each account within 30 days after receiving your request.
Fund holdings and proxy voting information
The Fund provides a complete list of its holdings four times in each fiscal year, at the quarter ends. For the second and fourth quarters, the lists appear in the Fund’s semiannual and annual reports to shareholders. For the first and third quarters, the Fund files the lists with the Securities and Exchange Commission (SEC) on Form N-Q. The most recent list of portfolio holdings is available at invesco.com/completeqtrholdings. Shareholders can also look up the Fund’s Forms N-Q on the SEC website at sec.gov. Copies of the Fund’s Forms N-Q may be reviewed and copied at the SEC Public Reference Room in Washington, D.C. You can obtain information on the operation of the Public Reference Room, including information about duplicating fee charges, by calling 202 551 8090 or 800 732 0330, or by electronic request at the following email address: publicinfo@sec.gov.
The SEC file numbers for the Fund are shown below.
A description of the policies and procedures that the Fund uses to determine how to vote proxies relating to portfolio securities is available without charge, upon request, from our Client Services department at 800 959 4246 or at invesco.com/proxyguidelines. The information is also available on the SEC website, sec.gov.
| | |
Information regarding how the Fund voted proxies related to its portfolio securities during the most recent 12-month period ended June 30 is available at invesco.com/proxysearch. The information is also available on the SEC website, sec.gov. Invesco Advisers, Inc. is an investment adviser; it provides investment advisory services to individual and institutional clients and does not sell securities. Invesco Distributors, Inc. is the US distributor for Invesco Ltd.’s retail mutual funds, exchange-traded funds and institutional money market funds. Both are wholly owned, indirect subsidiaries of Invesco Ltd. | |  |
| | | | |
| SEC file numbers: 811-05426 and 033-19338 | | MAIN-AR-1 | | Invesco Distributors, Inc. |
| | | | |
| | |
 | | Annual Report to Shareholders | | October 31, 2016 |
| | |
| | Invesco Pacific Growth Fund Nasdaq: A: TGRAX ∎ B: TGRBX ∎ C: TGRCX ∎ R: TGRRX ∎ Y: TGRDX ∎ R5: TGRSX |

Letters to Shareholders
| | |

Philip Taylor | | Dear Shareholders: This annual report includes information about your Fund, including performance data and a complete list of its investments as of the close of the reporting period. Inside is a discussion of how your Fund was managed and the factors that affected its performance during the reporting period. In December 2015, the US Federal Reserve raised short-term interest rates for the first time since 2006, signaling its belief that the economy was likely to continue strengthening. Indeed, throughout the reporting period, US economic data were generally positive and the economy expanded at a moderate rate – but there were some bumps along the road. Job growth in May 2016 was very weak, but it was followed by strong increases in nonfarm payrolls in June and July. Increased concerns about global economic weakness caused US stock market indexes to sink at the start of calendar year 2016, but they eventually recovered; they sank again following the UK’s decision to leave the European Union, but then quickly recovered and reached record highs later in the summer. Strong demand for |
income-producing investments, particularly those perceived to be lower risk, benefited bonds as well as dividend-paying stocks for much of the reporting period. While economic news in the US was generally positive, news overseas was less upbeat. The European Central Bank, and central banks in China and Japan – as well as other countries – maintained extraordinarily accommodative monetary policies in response to economic weakness. As the fiscal year drew to a close, uncertainty about the outcome of the US presidential election resulted in increased market volatility; the surprise outcome after the close of the reporting period suggested that market volatility may continue for some time to come.
Short-term market volatility can prompt some investors to abandon their investment plans – and can cause others to settle for average results. The investment professionals at Invesco, in contrast, invest with high conviction, take a long-term perspective and have a passion to exceed. Invesco’s pure focus on investment management eliminates possible distractions and means that there are no competing lines of business for us to support. Just as important, we embrace a variety of investment strategies, asset classes and geographies – because we know that no single investment approach meets the diverse needs of all of our clients. We manage all our investment approaches with a passion to exceed. All our investment teams have a highly disciplined, long-term investing style that eliminates short-term decision-making. Of course, investing with high conviction can’t guarantee a profit or ensure success; no investment strategy can. To learn more about how we invest with high conviction, visit invesco.com/HighConviction.
You, too, can invest with high conviction by maintaining a long-term investment perspective and by working with your financial adviser on a regular basis. During periods of short-term market volatility or uncertainty, your financial adviser can keep you focused on your long-term investment goals – a new home, a child’s college education or a secure retirement. He or she also can share research about the economy, the markets and individual investment options.
Visit our website for more information on your investments
Our website, invesco.com/us, offers a wide range of market insights and investment perspectives. On the website, you’ll find detailed information about our funds, including performance, holdings and portfolio manager commentaries. You can access information about your account by completing a simple, secure online registration. Click on the “Need to register” link in the “Account Access” box on our homepage to get started.
In addition to the resources accessible on our website and through our mobile app, you can obtain timely updates to help you stay informed about the markets, the economy and investing by connecting with Invesco on Twitter, LinkedIn or Facebook. You can access our blog at blog.invesco.us.com. Our goal is to provide you the information you want, when and where you want it.
Finally, I’m pleased to share with you Invesco’s commitment to both the Principles for Responsible Investment and to considering environmental, social and governance issues in our robust investment process. I invite you to learn more at invesco.com/esg.
Have questions?
For questions about your account, contact an Invesco client services representative at 800 959 4246. For Invesco-related questions or comments, please email me directly at phil@invesco.com.
All of us at Invesco look forward to serving your investment management needs. Thank you for investing with us.
Sincerely,

Philip Taylor
Senior Managing Director, Invesco Ltd.
2 Invesco Pacific Growth Fund
| | |

Bruce Crockett | | Dear Fellow Shareholders: Among the many important lessons I’ve learned in more than 40 years in a variety of business endeavors is the value of a trusted advocate. As independent chair of the Invesco Funds Board, I can assure you that the members of the Board are strong advocates for the interests of investors in Invesco’s mutual funds. We work hard to represent your interests through oversight of the quality of the investment management services your funds receive and other matters important to your investment, including but not limited to: ∎ Ensuring that Invesco offers a diverse lineup of mutual funds that your financial adviser can use to strive to meet your financial needs as your investment goals change over time. ∎ Monitoring how the portfolio management teams of the Invesco funds are performing in light of changing economic and market conditions. |
| ∎ | | Assessing each portfolio management team’s investment performance within the context of the investment strategy described in the fund’s prospectus. |
| ∎ | | Monitoring for potential conflicts of interests that may impact the nature of the services that your funds receive. |
We believe one of the most important services we provide our fund shareholders is the annual review of the funds’ advisory and sub-advisory contracts with Invesco Advisers and its affiliates. This review is required by the Investment Company Act of 1940 and focuses on the nature and quality of the services Invesco provides as the adviser to the Invesco funds and the reasonableness of the fees that it charges for those services. Each year, we spend months carefully reviewing information received from Invesco and a variety of independent sources, such as performance and fee data prepared by Lipper Inc., an independent, third-party firm widely recognized as a leader in its field. We also meet with our independent legal counsel and other independent advisers to review and help us assess the information that we have received. Our goal is to assure that you receive quality investment management services for a reasonable fee.
I trust the measures outlined above provide assurance that you have a worthy advocate when it comes to choosing the Invesco Funds.
As always, please contact me at bruce@brucecrockett.com with any questions or concerns you may have. On behalf of the Board, we look forward to continuing to represent your interests and serving your needs.
Sincerely,

Bruce L. Crockett
Independent Chair
Invesco Funds Board of Trustees
3 Invesco Pacific Growth Fund
Management’s Discussion of Fund Performance
| | | | |
Performance summary For the fiscal year ended October 31, 2016, Class A shares of Invesco Pacific Growth Fund (the Fund), at net asset value (NAV), outperformed the MSCI All Country Asia Pacific Index, the Fund’s style-specific benchmark. Your Fund’s long-term performance appears later in this report. | |
Fund vs. Indexes Total returns, 10/31/15 to 10/31/16, at net asset value (NAV). Performance shown does not include applicable contingent deferred sales charges (CDSC) or front-end sales charges, which would have reduced performance. | |
Class A Shares | | | 9.53 | % |
Class B Shares | | | 8.73 | |
Class C Shares | | | 8.71 | |
Class R Shares | | | 9.24 | |
Class Y Shares | | | 9.80 | |
Class R5 Shares | | | 9.91 | |
MSCI EAFE Indexq (Broad Market Index) | | | -3.23 | |
MSCI All Country Asia Pacific Indexq (Style-Specific Index) | | | 5.98 | |
Lipper Pacific Region Funds Index∎ (Peer Group Index) | | | 8.94 | |
Source(s): qFactSet Research Systems Inc.; ∎Lipper Inc. | | | | |
Market conditions and your Fund
The Asia Pacific economy started to show signs of stabilizing during the fiscal year ended October 31, 2016. A combination of positive earnings across the region in the second quarter of 2016 combined with accommodative monetary policies and progress on reforms helped raise investor confidence.
After a strong rally in October 2015, markets in Asia retreated in November on concerns over the greater likelihood of a US Federal Reserve (the Fed) rate hike. In December, the Fed followed through on its commitment to normalize monetary policy by raising interest rates – its first increase since 2006. Monetary policies elsewhere moved in the opposite direction as the European Central Bank extended its asset purchase program and Japan introduced additional quantitative easing and even negative interest rates the following month.
It was a turbulent start to calendar year 2016, driven by investor concerns about further economic weakness in China and the selloff in commodities. By late February, markets had begun to recover, with some posting gains amid the concerted central bank commitments to very loose monetary policy. A sharp rise in property prices in first-tier cities in China and the start of the restocking cycle in information technology were some of the developments triggering a shift in sentiment. The global cyclical shift led to an increase in fund flows to Asia and a weakening US dollar, a development that was largely supportive of oil and stock prices. Throughout Asia, the rebound in oil prices and a general risk-on sentiment helped drive Asian markets in March, leading to a strong double-digit rally. Growth conditions, however, were reassessed in the subsequent months as economic conditions continued to be uneven.
June 2016 was an eventful month with global sentiment changing rapidly following the results of the Fed’s decision to keep interest rates unchanged and the Brexit referendum in the UK where voters opted to leave the European Union. Despite the heightened global market volatility, Asia Pacific equity markets ended on a high note, outperforming developed equity markets. There were high hopes for the new president in the Philippines. South Korea also announced a stimulus package while a few countries cut rates throughout Asia. Strong inflows into emerging markets continued to lift equity markets in Asia on the renewed growth prospects for the region. Positive earnings in China, Thailand, South Korea and Taiwan, as well as the pick-up in GDP in some countries, kept markets moving higher. However, sentiment once again started to shift over concerns regarding the outcome of the US presidential election and future monetary policies among developed countries toward the end of the reporting period. In Japan, a stronger Japanese currency amid risk-off mode resulting from China’s bubble fear, as well as Brexit shock weighed on Japanese equity markets for the reporting period on the back of investors’ concerns over corporate earnings particularly exporters. On top of that, the Bank of Japan’s surprising introduction of a negative interest rate policy caused most financials sector stocks like banks to decline.
On a geographic basis, positive stock selection in Japan was the leading contributor to relative Fund performance versus the MSCI All Country Asia Pacific Index. Stock selection in India and China contributed to Fund outperformance versus the style-specific index, as well. Underweight exposure versus the style-specific index in Hong Kong also helped the Fund’s relative performance.
| | | | |
| Portfolio Composition |
By sector | | % of total net assets |
| | | | |
| |
Information Technology | | | 20.8% | |
Industrials | | | 19.6 | |
Consumer Discretionary | | | 16.6 | |
Consumer Staples | | | 11.7 | |
Financials | | | 11.2 | |
Health Care | | | 7.4 | |
Utilities | | | 5.7 | |
Telecommunication Services | | | 4.3 | |
Materials | | | 2.2 | |
Money Market Funds Plus Other Assets Less Liabilities | | | 0.5 | |
| | | | | | |
| Top 10 Equity Holdings* | | | | |
| | % of total net assets | |
| | |
| 1. | | Tencent Holdings Ltd. | | | 6.6% | |
| 2. | | Taiwan Semiconductor Manufacturing Co. Ltd. | | | 3.5 | |
| 3. | | Bajaj Finance Ltd. | | | 3.4 | |
| 4. | | AIA Group Ltd. | | | 3.3 | |
| 5. | | APA Group | | | 2.4 | |
| 6. | | Maruti Suzuki India Ltd. | | | 2.3 | |
| 7. | | Yamaha Motor Co., Ltd. | | | 2.3 | |
| 8. | | Nidec Corp. | | | 2.3 | |
| 9. | | Sekisui Chemical Co., Ltd. | | | 2.3 | |
| 10. | | Guangdong Investment Ltd. | | | 2.3 | |
| | | | |
Total Net Assets | | | $80.5 million | |
| |
Total Number of Holdings* | | | 55 | |
The Fund’s holdings are subject to change, and there is no assurance that the Fund will continue to hold any particular security.
*Excluding money market fund holdings.
Data presented here are as of October 31, 2016.
4 Invesco Pacific Growth Fund
In contrast, negative stock selection in South Korea was the leading detractor from the Fund’s relative performance versus the style-specific index following very strong contribution from previous reporting periods. Holdings in Australia, Thailand and Singapore also detracted from relative results.
At the sector level, stock selection in and underweight exposure to the financials sector led relative outperformance versus the MSCI All Country Asia Pacific Index. Bajaj Finance, an Indian non-banking finance company, was the leading contributor to Fund performance during the fiscal year. Australian bank and financial services provider, Westpac Banking, was also a key contributor to Fund performance within the financials sector. We sold the holding before the close of the reporting period.
Stock selection in the consumer discretionary sector also contributed to relative Fund performance versus the style-specific index. Japanese discount retailer, Seria, was the largest contributor within the sector to Fund performance during the fiscal year. The company’s stock price rose after it announced strong results thanks to its share increase in the one-dollar shop segment in Japan. Nifco, a Japanese manufacturer and seller of industrial plastic parts and components, was a leading contributor to Fund performance within the sector during the reporting period, as well.
Conversely, stock selection in the health care sector was the leading detractor from both absolute and relative Fund performance versus the style-specific index. Yuhan, a pharmaceutical and chemical company based in South Korea, was the leading detractor from relative Fund performance within the sector.
Bumrungrad International Hospital, a multi-specialty medical center located in Bangkok, Thailand, and Green Cross, a biopharmaceutical company headquartered in Yongin, South Korea, were also detractors from the Fund’s relative performance during the reporting period.
Stock selection in and overweight exposure to the consumer staples sector was a detractor from relative performance versus the style-specific index. Nongshim, the largest ramen and snack food company in South Korea, was the largest detractor from relative performance within the sector. Stock selection in the telecommunication services sector detracted from relative Fund performance, as well. Australian telecommunications and IT company, TPG Telecom, was the largest detractor in the sector from Fund performance during the fiscal year.
During the reporting period, we reduced our exposure to the financials and energy sectors. The Fund’s Asia ex-Japan allocation favored consumer-related sectors, with overweight allocations in the consumer discretionary and consumer staples sectors, as well as in the health care and IT sectors.
We continue to look for stocks that have a competitive edge to successfully expand businesses in the long term, and stocks with positive fundamentals and prospects that have not been priced across a broad range of sectors.
We thank you for your continued investment in Invesco Pacific Growth Fund.
The views and opinions expressed in management’s discussion of Fund performance are those of Invesco Advisers, Inc. These views and opinions are subject to change at any time based on factors such as market and economic conditions. These views and opinions may not be relied upon as investment advice or recommendations, or as an offer for a particular security. The information is not a complete analysis of every aspect of any market, country, industry, security or the Fund. Statements of fact are from sources considered reliable, but Invesco Advisers, Inc. makes no representation or warranty as to their completeness or accuracy. Although historical performance is no guarantee of future results, these insights may help you understand our investment management philosophy.
See important Fund and, if applicable, index disclosures later in this report.
| | |
 | | Paul Chan Chartered Financial Analyst, Portfolio Manager, is manager of Invesco Pacific Growth Fund. He joined |
| Invesco in 2001. Mr. Chan earned a BS in economics from the University of Manitoba. |
| | |
 | | Daiji Ozawa Chartered Financial Analyst, Portfolio Manager, is manager of Invesco Pacific Growth Fund. He joined |
| Invesco in 2010. Mr. Ozawa earned a BA in political science from Waseda University. |
5 Invesco Pacific Growth Fund
Your Fund’s Long-Term Performance
Results of a $10,000 Investment – Oldest Share Class(es)
Fund and index data from 10/31/06
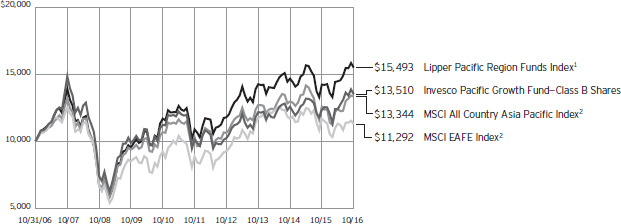
| 2 | Source: FactSet Research Systems Inc. |
Past performance cannot guarantee comparable future results.
The data shown in the chart include reinvested distributions, applicable sales charges and Fund expenses including management fees. Results for Class B shares are calculated as if a hypothetical shareholder had liquidated his entire
investment in the Fund at the close of the reporting period and paid the contingent deferred sales charges, if applicable. Index results include reinvested dividends, but they do not reflect sales charges. Performance of the peer group, if applicable, reflects fund expenses and management fees; performance of a
market index does not. Performance shown in the chart and table(s) does not reflect deduction of taxes a shareholder would pay on Fund distributions or sale of Fund shares.
continued from page 8
my, or it may affect the market as a whole. Individual stock prices tend to go up and down more dramatically than those of certain other types of investments, such as bonds. During a general downturn in the financial markets, multiple asset classes may decline in value. When markets perform well, there can be no assurance that specific investments held by the Fund will rise in value.
| ∎ | | Preferred securities risk. Preferred securities are subject to issuer-specific and market risks applicable generally to equity securities. Preferred securities also may be subordinated to bonds or other debt instruments, subjecting them to a greater risk of non-payment, may be less liquid than many other securities, such as common stocks, and generally offer no voting rights with respect to the issuer. |
| ∎ | | Small- and mid-capitalization companies risks. Small- and mid-capitalization companies tend to be more vulnerable to changing market conditions, may have little or no operating history or track record of success, and may have more limited product lines and markets, less experienced management and fewer financial resources than larger companies. These companies’ securities may be more volatile and less liquid than those of more established companies, and their returns may vary, sometimes significantly, from the overall securities market. |
About indexes used in this report
| ∎ | | The MSCI EAFE® Index is an unmanaged index considered representative of stocks of Europe, Australasia and the Far East. The index is computed using the net return, which withholds applicable taxes for non-resident investors. |
| ∎ | | The MSCI All Country Asia Pacific Index is an unmanaged index considered representative of Asia Pacific region stock markets. The index is computed using the net return, which withholds applicable taxes for non-resident investors. |
| ∎ | | The Lipper Pacific Region Funds Index is an unmanaged index considered representative of Pacific region funds tracked by Lipper. |
| ∎ | | The Fund is not managed to track the performance of any particular index, including the index(es) described here, and consequently, the performance of the Fund may deviate significantly from the performance of the index(es). |
| ∎ | | A direct investment cannot be made in an index. Unless otherwise indicated, index results include reinvested dividends, and they do not reflect sales charges. Performance of the peer group, if applicable, reflects fund expenses; performance of a market index does not. |
continued on page 7
6 Invesco Pacific Growth Fund
| | | | |
Average Annual Total Returns As of 10/31/16, including maximum applicable
sales charges | |
| |
Class A Shares | | | | |
Inception (7/28/97) | | | 1.90 | % |
10 Years | | | 3.09 | |
5 Years | | | 5.21 | |
1 Year | | | 3.50 | |
| |
Class B Shares | | | | |
Inception (11/30/90) | | | 4.71 | % |
10 Years | | | 3.05 | |
5 Years | | | 5.28 | |
1 Year | | | 3.73 | |
| |
Class C Shares | | | | |
Inception (7/28/97) | | | 1.47 | % |
10 Years | | | 2.92 | |
5 Years | | | 5.63 | |
1 Year | | | 7.71 | |
| |
Class R Shares | | | | |
Inception (3/31/08) | | | 1.75 | % |
5 Years | | | 6.12 | |
1 Year | | | 9.24 | |
| |
Class Y Shares | | | | |
Inception (7/28/97) | | | 2.45 | % |
10 Years | | | 3.94 | |
5 Years | | | 6.67 | |
1 Year | | | 9.80 | |
| |
Class R5 Shares | | | | |
10 Years | | | 3.90 | % |
5 Years | | | 6.82 | |
1 Year | | | 9.91 | |
Effective June 1, 2010, Class A, Class B, Class C, Class R, Class W and Class I shares of the predecessor fund, Morgan Stanley Pacific Growth Fund Inc., advised by Morgan Stanley Investment Advisors Inc. were reorganized into Class A, Class B, Class C, Class R, Class A and Class Y shares, respectively, of Invesco Pacific Growth Fund. Returns shown above, prior to June 1, 2010, for Class A, Class B, Class C, Class R and Class Y shares are blended returns of the predecessor fund and
| | | | |
Average Annual Total Returns As of 9/30/16, the most recent calendar quarter
end, including maximum applicable sales charges | |
| |
Class A Shares | | | | |
Inception (7/28/97) | | | 2.05 | % |
10 Years | | | 3.64 | |
5 Years | | | 7.21 | |
1 Year | | | 11.16 | |
| |
Class B Shares | | | | |
Inception (11/30/90) | | | 4.83 | % |
10 Years | | | 3.61 | |
5 Years | | | 7.31 | |
1 Year | | | 11.77 | |
| |
Class C Shares | | | | |
Inception (7/28/97) | | | 1.61 | % |
10 Years | | | 3.48 | |
5 Years | | | 7.65 | |
1 Year | | | 15.84 | |
| |
Class R Shares | | | | |
Inception (3/31/08) | | | 2.08 | % |
5 Years | | | 8.15 | |
1 Year | | | 17.36 | |
| |
Class Y Shares | | | | |
Inception (7/28/97) | | | 2.60 | % |
10 Years | | | 4.50 | |
5 Years | | | 8.70 | |
1 Year | | | 17.93 | |
| |
Class R5 Shares | | | | |
10 Years | | | 4.45 | % |
5 Years | | | 8.85 | |
1 Year | | | 18.05 | |
Invesco Pacific Growth Fund. Share class returns will differ from the predecessor fund because of different expenses.
Class R5 shares incepted on May 23, 2011. Performance shown prior to that date is that of the Fund’s and the predecessor fund’s Class A shares and includes the 12b-1 fees applicable to Class A shares.
The performance data quoted represent past performance and cannot guarantee comparable future
results; current performance may be lower or higher. Please visit invesco.com/performance for the most recent month-end performance. Performance figures reflect reinvested distributions, changes in net asset value and the effect of the maximum sales charge unless otherwise stated. Investment return and principal value will fluctuate so that you may have a gain or loss when you sell shares.
The total annual Fund operating expense ratio set forth in the most recent Fund prospectus as of the date of this report for Class A, Class B, Class C, Class R, Class Y and Class R5 shares was 1.78%, 2.53%, 2.53%, 2.03%, 1.53% and 1.39%, respectively. The expense ratios presented above may vary from the expense ratios presented in other sections of this report that are based on expenses incurred during the period covered by this report.
Class A share performance reflects the maximum 5.50% sales charge, and Class B and Class C share performance reflects the applicable contingent deferred sales charge (CDSC) for the period involved. The CDSC on Class B shares declines from 5% beginning at the time of purchase to 0% at the beginning of the seventh year. The CDSC on Class C shares is 1% for the first year after purchase. Class R, Class Y and Class R5 shares do not have a front-end sales charge or a CDSC; therefore, performance is at net asset value.
The performance of the Fund’s share classes will differ primarily due to different sales charge structures and class expenses.
Fund performance reflects any applicable fee waivers and/or expense reimbursements. Had the adviser not waived fees and/or reimbursed expenses currently or in the past, returns would have been lower. See current prospectus for more information.
continued from page 7
Other information
| ∎ | | The returns shown in management’s discussion of Fund performance are based on net asset values (NAVs) calculated for shareholder transactions. Generally accepted accounting principles require adjustments to be made to the net assets of the Fund at period end for financial reporting purposes, and as such, the NAVs for shareholder trans- |
| | actions and the returns based on those NAVs may differ from the NAVs and returns reported in the Financial Highlights. |
| ∎ | | Industry classifications used in this report are generally according to the Global Industry Classification Standard, which was developed by and is the exclusive property and a service mark of MSCI Inc. and Standard & Poor’s. |
7 Invesco Pacific Growth Fund
Invesco Pacific Growth Fund’s investment objective is long-term growth of capital.
| ∎ | | Unless otherwise stated, information presented in this report is as of October 31, 2016, and is based on total net assets. |
| ∎ | | Unless otherwise noted, all data provided by Invesco. |
| ∎ | | To access your Fund’s reports/prospectus, visit invesco.com/fundreports. |
About share classes
| ∎ | | Class B shares may not be purchased for new or additional investments. Please see the prospectus for more information. |
| ∎ | | Class R shares are generally available only to employer sponsored retirement and benefit plans. Please see the prospectus for more information. |
| ∎ | | Class Y shares are available only to certain investors. Please see the prospectus for more information. |
| ∎ | | Class R5 shares are primarily intended for employer sponsored retirement and benefit plans that meet certain standards and for institutional investors. Please see the prospectus for more information. |
Principal risks of investing in the Fund
| ∎ | | Depositary receipts risk. Investing in depositary receipts involves the same risks as direct investments in foreign securities. In addition, the underlying issuers of certain depositary receipts are under no obligation to distribute shareholder communications or pass through any voting rights with respect to the deposited securities to the holders of such receipts. The Fund may therefore receive less timely information or have less control than if it invested directly in the foreign issuer. |
| ∎ | | Derivatives risk. The value of a derivative instrument depends largely on (and is derived from) the value of an underlying security, currency, commodity, interest rate, index or other asset (each referred to as an underlying asset). In addition to risks relating to the underlying assets, the use of derivatives may include other, possibly greater, risks, including counterparty, leverage and liquidity risks. Counter-party risk is the risk that the counter-party to the derivative contract will default on its obligation to pay the Fund the amount owed or otherwise perform under the derivative contract. Derivatives create leverage risk because they |
| | do not require payment up front equal to the economic exposure created by owning the derivative. As a result, an adverse change in the value of the underlying asset could result in the Fund sustaining a loss that is substantially greater than the amount invested in the derivative, which may make the Fund’s returns more volatile and increase the risk of loss. Derivative instruments may also be less liquid than more traditional investments and the Fund may be unable to sell or close out its derivative positions at a desirable time or price. This risk may be more acute under adverse market conditions, during which the Fund may be most in need of liquidating its derivative positions. Derivatives may also be harder to value, less tax efficient and subject to changing government regulation that could impact the Fund’s ability to use certain derivatives or their cost. Also, derivatives used for hedging or to gain or limit exposure to a particular market segment may not provide the expected benefits, particularly during adverse market conditions. |
| ∎ | | Emerging markets securities risk. Emerging markets (also referred to as developing markets) are generally subject to greater market volatility, political, social and economic instability, uncertain trading markets and more governmental limitations on foreign investment than more developed markets. In addition, emerging markets may be subject to lower trading volume and greater price fluctuations than companies in more developed markets. Securities law and the enforcement of systems of taxation in many emerging market countries may change quickly and unpredictably. In addition, investments in emerging markets securities may also be subject to additional transaction costs, delays in settlement procedures, and lack of timely information. |
| ∎ | | Foreign securities risk. The Fund’s foreign investments may be adversely affected by political and social instability, changes in economic or taxation poli- |
| | cies, difficulty in enforcing obligations, decreased liquidity or increased volatility. Foreign investments also involve the risk of the possible seizure, nationalization or expropriation of the issuer or foreign deposits (in which the Fund could lose its entire investments in a certain market) and the possible adoption of foreign governmental restrictions such as exchange controls. Unless the Fund has hedged its foreign securities risk, foreign securities risk also involves the risk of negative foreign currency rate fluctuations, which may cause the value of securities denominated in such foreign currency (or other instruments through which the Fund has exposure to foreign currencies) to decline in value. Currency exchange rates may fluctuate significantly over short periods of time. Currency hedging strategies, if used, are not always successful. |
| ∎ | | Geographic focus risk. The Fund may from time to time invest a substantial amount of its assets in securities of issuers located in a single country or a limited number of countries. Adverse economic, political or social conditions in those countries may therefore have a significant negative impact on the Fund’s investment performance. |
| ∎ | | Growth investing risk. Growth stocks tend to be more expensive relative to the issuing company’s earnings or assets compared with other types of stock. As a result, they tend to be more sensitive to changes in, or investors’ expectations of, the issuing company’s earnings and can be more volatile. |
| ∎ | | Management risk. The Fund is actively managed and depends heavily on the Adviser’s judgment about markets, interest rates or the attractiveness, relative values, liquidity, or potential appreciation of particular investments made for the Fund’s portfolio. The Fund could experience losses if these judgments prove to be incorrect. Additionally, legislative, regulatory, or tax developments may adversely affect management of the Fund and, therefore, the ability of the Fund to achieve its investment objective. |
| ∎ | | Market risk. The market values of the Fund’s investments, and therefore the value of the Fund’s shares, will go up and down, sometimes rapidly or unpredictably. Market risk may affect a single issuer, industry or section of the econo- |
| | |
This report must be accompanied or preceded by a currently effective Fund prospectus, which contains more complete information, including sales charges and expenses. Investors should read it carefully before investing. | | |
| | |
| NOT FDIC INSURED | MAY LOSE VALUE | NO BANK GUARANTEE | | |
| | continued on page 6 |
8 Invesco Pacific Growth Fund
Schedule of Investments
October 31, 2016
| | | | | | | | |
| | | Shares | | | Value | |
Common Stocks & Other Equity Interests–99.46% | |
| Australia–8.65% | |
APA Group | | | 317,310 | | | $ | 1,917,413 | |
Orora Ltd. | | | 794,697 | | | | 1,747,851 | |
Sydney Airport | | | 194,233 | | | | 922,485 | |
Telstra Corp. Ltd. | | | 337,327 | | | | 1,275,797 | |
TPG Telecom Ltd. | | | 191,531 | | | | 1,099,206 | |
| | | | | | | | 6,962,752 | |
|
| China–13.48% | |
Beijing Capital International Airport Co. Ltd.–Class H | | | 1,574,000 | | | | 1,650,016 | |
Beijing Enterprises Water Group Ltd. | | | 1,220,000 | | | | 885,648 | |
China Animal Healthcare Ltd.(a) | | | 349,000 | | | | 58,501 | |
China Mobile Ltd. | | | 97,500 | | | | 1,117,005 | |
Guangdong Investment Ltd. | | | 1,202,000 | | | | 1,816,457 | |
Tencent Holdings Ltd. | | | 200,900 | | | | 5,319,848 | |
| | | | | | | | 10,847,475 | |
|
| Hong Kong–3.33% | |
AIA Group Ltd. | | | 424,800 | | | | 2,681,206 | |
Henderson Land Development Co. Ltd. | | | 110 | | | | 652 | |
| | | | | | | | 2,681,858 | |
|
| India–7.81% | |
Bajaj Finance Ltd. | | | 168,480 | | | | 2,725,753 | |
Britannia Industries Ltd. | | | 33,795 | | | | 1,682,610 | |
Maruti Suzuki India Ltd. | | | 21,270 | | | | 1,877,974 | |
| | | | | | | | 6,286,337 | |
|
| Indonesia–2.13% | |
PT Unilever Indonesia Tbk | | | 502,300 | | | | 1,712,190 | |
|
| Japan–46.38% | |
AIDA ENGINEERING, LTD. | | | 122,700 | | | | 1,057,749 | |
Astellas Pharma Inc. | | | 67,800 | | | | 1,008,288 | |
Daikin Industries, Ltd. | | | 18,800 | | | | 1,803,730 | |
Daiwa House Industry Co., Ltd. | | | 53,400 | | | | 1,469,627 | |
FUKUSHIMA INDUSTRIES CORP. | | | 44,000 | | | | 1,504,220 | |
H.I.S. Co., Ltd.(b) | | | 43,700 | | | | 1,195,171 | |
Hitachi High-Technologies Corp. | | | 36,900 | | | | 1,542,998 | |
K’s Holdings Corp. | | | 81,000 | | | | 1,405,035 | |
Komatsu Ltd. | | | 34,500 | | | | 768,989 | |
Konoike Transport Co., Ltd. | | | 96,000 | | | | 1,273,409 | |
MAEDA ROAD CONSTRUCTION CO., LTD. | | | 40,000 | | | | 741,525 | |
Mitsubishi Corp. | | | 77,500 | | | | 1,693,153 | |
Nidec Corp. | | | 18,800 | | | | 1,823,258 | |
Nifco Inc. | | | 28,900 | | | | 1,664,546 | |
OMRON Corp. | | | 38,000 | | | | 1,460,354 | |
OTSUKA CORP. | | | 32,500 | | | | 1,549,611 | |
Relo Group, Inc. | | | 4,600 | | | | 761,074 | |
Resorttrust, Inc. | | | 55,600 | | | | 1,113,962 | |
| | | | | | | | |
| | | Shares | | | Value | |
| Japan–(continued) | |
SCSK Corp. | | | 37,300 | | | $ | 1,394,326 | |
Sekisui Chemical Co., Ltd. | | | 115,600 | | | | 1,821,090 | |
Seria Co., Ltd. | | | 13,800 | | | | 1,088,759 | |
Seven & i Holdings Co., Ltd. | | | 19,900 | | | | 831,752 | |
Shimamura Co., Ltd. | | | 10,700 | | | | 1,372,384 | |
Temp Holdings Co. Ltd. | | | 58,900 | | | | 1,000,904 | |
transcosmos inc. | | | 38,400 | | | | 974,052 | |
Tsubakimoto Chain Co. | | | 197,000 | | | | 1,561,852 | |
Yamaha Motor Co., Ltd. | | | 82,400 | | | | 1,829,336 | |
Yaskawa Electric Corp. | | | 100,700 | | | | 1,606,704 | |
| | | | | | | | 37,317,858 | |
|
| Philippines–1.69% | |
Ayala Corp. | | | 78,980 | | | | 1,361,162 | |
|
| Singapore–1.45% | |
Raffles Medical Group Ltd. | | | 1,080,640 | | | | 1,169,078 | |
|
| South Korea–8.96% | |
AMOREPACIFIC Group | | | 13,299 | | | | 1,720,838 | |
BGF Retail Co., Ltd. | | | 8,607 | | | | 1,309,364 | |
Green Cross Corp. | | | 6,067 | | | | 739,959 | |
Nongshim Co., Ltd. | | | 5,942 | | | | 1,496,182 | |
Ottogi Corp. | | | 1,079 | | | | 620,736 | |
Yuhan Corp. | | | 7,188 | | | | 1,319,735 | |
| | | | | | | | 7,206,814 | |
|
| Taiwan–3.54% | |
Taiwan Semiconductor Manufacturing Co. Ltd. | | | 477,143 | | | | 2,850,127 | |
|
| Thailand–2.04% | |
Bumrungrad Hospital PCL | | | 313,200 | | | | 1,636,186 | |
Total Common Stocks & Other Equity Interests
(Cost $67,603,739) | | | | 80,031,837 | |
| | |
Money Market Funds–0.52% | | | | | | | | |
Government & Agency Portfolio–Institutional Class, 0.29%(c) | | | 250,355 | | | | 250,355 | |
Treasury Portfolio–Institutional Class, 0.22%(c) | | | 166,578 | | | | 166,578 | |
Total Money Market Funds
(Cost $416,933) | | | | 416,933 | |
TOTAL INVESTMENTS (excluding investments purchased with cash collateral from securities on loan)–99.98% (Cost $68,020,672) | | | | 80,448,770 | |
See accompanying Notes to Financial Statements which are an integral part of the financial statements.
9 Invesco Pacific Growth Fund
| | | | | | | | |
| | | Shares | | | Value | |
Investments Purchased with Cash Collateral from Securities on Loan | | | | | |
Money Market Funds–0.35% | |
Government & Agency Portfolio–Institutional Class, 0.29%
(Cost $285,700)(c)(d) | | | 285,700 | | | $ | 285,700 | |
TOTAL INVESTMENTS–100.33%
(Cost $68,306,372) | | | | 80,734,470 | |
OTHER ASSETS LESS LIABILITIES–(0.33)% | | | | (268,024 | ) |
NET ASSETS–100.00% | | | $ | 80,466,446 | |
Notes to Schedule of Investments:
| (a) | Non-income producing security. |
| (b) | All or a portion of this security was out on loan at October 31, 2016. |
| (c) | The money market fund and the Fund are affiliated by having the same investment adviser. The rate shown is the 7-day SEC standardized yield as of October 31, 2016. |
| (d) | The security has been segregated to satisfy the commitment to return the cash collateral received in securities lending transactions upon the borrower’s return of the securities loaned. See Note 1I. |
See accompanying Notes to Financial Statements which are an integral part of the financial statements.
10 Invesco Pacific Growth Fund
Statement of Assets and Liabilities
October 31, 2016
| | | | |
Assets: | |
Investments, at value (Cost $67,603,739)* | | $ | 80,031,837 | |
Investments in affiliated money market funds, at value and cost | | | 702,633 | |
Total investments, at value (Cost $68,306,372) | | | 80,734,470 | |
Foreign currencies, at value (Cost $42,685) | | | 42,530 | |
Receivable for: | | | | |
Fund shares sold | | | 151,585 | |
Dividends | | | 382,547 | |
Investment for trustee deferred compensation and retirement plans | | | 38,011 | |
Other assets | | | 26,396 | |
Total assets | | | 81,375,539 | |
|
Liabilities: | |
Payable for: | | | | |
Fund shares reacquired | | | 347,269 | |
Collateral upon return of securities loaned | | | 285,700 | |
Accrued foreign taxes | | | 48,931 | |
Accrued fees to affiliates | | | 66,570 | |
Accrued trustees’ and officers’ fees and benefits | | | 1,571 | |
Accrued other operating expenses | | | 66,219 | |
Trustee deferred compensation and retirement plans | | | 92,833 | |
Total liabilities | | | 909,093 | |
Net assets applicable to shares outstanding | | $ | 80,466,446 | |
|
Net assets consist of: | |
Shares of beneficial interest | | $ | 83,691,736 | |
Undistributed net investment income | | | 43,531 | |
Undistributed net realized gain (loss) | | | (15,686,630 | ) |
Net unrealized appreciation | | | 12,417,809 | |
| | | $ | 80,466,446 | |
| | | | |
Net Assets: | |
Class A | | $ | 65,106,681 | |
Class B | | $ | 126,114 | |
Class C | | $ | 4,477,066 | |
Class R | | $ | 241,708 | |
Class Y | | $ | 10,500,840 | |
Class R5 | | $ | 14,037 | |
|
Shares outstanding, $0.01 par value per share,
with an unlimited number of shares authorized: | |
Class A | | | 2,474,664 | |
Class B | | | 5,168 | |
Class C | | | 183,073 | |
Class R | | | 9,290 | |
Class Y | | | 391,961 | |
Class R5 | | | 523 | |
Class A: | | | | |
Net asset value per share | | $ | 26.31 | |
Maximum offering price per share | | | | |
(Net asset value of $26.31 ¸ 94.50%) | | $ | 27.84 | |
Class B: | | | | |
Net asset value and offering price per share | | $ | 24.40 | |
Class C: | | | | |
Net asset value and offering price per share | | $ | 24.46 | |
Class R: | | | | |
Net asset value and offering price per share | | $ | 26.02 | |
Class Y: | | | | |
Net asset value and offering price per share | | $ | 26.79 | |
Class R5: | | | | |
Net asset value and offering price per share | | $ | 26.84 | |
| * | At October 31, 2016, securities with an aggregate value of $272,080 were on loan to brokers. |
See accompanying Notes to Financial Statements which are an integral part of the financial statements.
11 Invesco Pacific Growth Fund
Statement of Operations
For the year ended October 31, 2016
| | | | |
Investment income: | |
Dividends (net of foreign withholding taxes of $132,007) | | $ | 1,397,264 | |
Dividends from affiliated money market funds (includes securities lending income of $5,991) | | | 10,121 | |
Other income | | | 13,395 | |
Total investment income | | | 1,420,780 | |
| |
Expenses: | | | | |
Advisory fees | | | 683,709 | |
Administrative services fees | | | 50,000 | |
Distribution fees: | | | | |
Class A | | | 163,870 | |
Class B | | | 2,126 | |
Class C | | | 45,005 | |
Class R | | | 1,137 | |
Transfer agent fees — A, B, C, R and Y | | | 172,618 | |
Transfer agent fees — R5 | | | 13 | |
Trustees’ and officers’ fees and benefits | | | 22,944 | |
Registration and filing fees | | | 73,060 | |
Reports to shareholders | | | 25,616 | |
Professional services fees | | | 56,104 | |
Other | | | 12,640 | |
Total expenses | | | 1,308,842 | |
Less: Fees waived and expense offset arrangement(s) | | | (2,439 | ) |
Net expenses | | | 1,306,403 | |
Net investment income | | | 114,377 | |
| |
Realized and unrealized gain (loss) from: | | | | |
Net realized gain (loss) from: | | | | |
Investment securities (net of foreign taxes of $5,933) | | | (1,049,512 | ) |
Foreign currencies | | | 22,495 | |
| | | | (1,027,017 | ) |
Change in net unrealized appreciation (depreciation) of: | | | | |
Investment securities (net of foreign taxes of $7,053) | | | 8,112,334 | |
Foreign currencies | | | (6,468 | ) |
| | | | 8,105,866 | |
Net realized and unrealized gain | | | 7,078,849 | |
Net increase in net assets resulting from operations | | $ | 7,193,226 | |
See accompanying Notes to Financial Statements which are an integral part of the financial statements.
12 Invesco Pacific Growth Fund
Statement of Changes in Net Assets
For the years ended October 31, 2016 and 2015
| | | | | | | | |
| | | 2016 | | | 2015 | |
Operations: | | | | | |
Net investment income | | $ | 114,377 | | | $ | 140,270 | |
Net realized gain (loss) | | | (1,027,017 | ) | | | 2,603,452 | |
Change in net unrealized appreciation (depreciation) | | | 8,105,866 | | | | (4,562,286 | ) |
Net increase (decrease) in net assets resulting from operations | | | 7,193,226 | | | | (1,818,564 | ) |
| | |
Distributions to shareholders from net investment income: | | | | | | | | |
Class A | | | — | | | | (82,200 | ) |
Class Y | | | — | | | | (11,222 | ) |
Class R5 | | | — | | | | (67 | ) |
Total distributions from net investment income | | | — | | | | (93,489 | ) |
| | |
Share transactions–net: | | | | | | | | |
Class A | | | (7,698,132 | ) | | | (5,325,439 | ) |
Class B | | | (162,410 | ) | | | (199,876 | ) |
Class C | | | (764,548 | ) | | | 440,928 | |
Class R | | | (20,547 | ) | | | (94,501 | ) |
Class Y | | | 6,323,559 | | | | 809,820 | |
Net increase (decrease) in net assets resulting from share transactions | | | (2,322,078 | ) | | | (4,369,068 | ) |
Net increase (decrease) in net assets | | | 4,871,148 | | | | (6,281,121 | ) |
| | |
Net assets: | | | | | | | | |
Beginning of year | | | 75,595,298 | | | | 81,876,419 | |
End of year (includes undistributed net investment income of $43,531 and $(103,879), respectively) | | $ | 80,466,446 | | | $ | 75,595,298 | |
Notes to Financial Statements
October 31, 2016
NOTE 1—Significant Accounting Policies
Invesco Pacific Growth Fund (the “Fund”) is a series portfolio of AIM Investment Funds (Invesco Investment Funds) (the “Trust”). The Trust is organized as a Delaware statutory trust and is registered under the Investment Company Act of 1940, as amended (the “1940 Act”), as an open-end series management investment company consisting of twenty-two separate series portfolios, each authorized to issue an unlimited number of shares of beneficial interest. The assets, liabilities and operations of each portfolio are accounted for separately. Information presented in these financial statements pertains only to the Fund. Matters affecting each portfolio or class will be voted on exclusively by the shareholders of such portfolio or class.
The Fund’s investment objective is long-term growth of capital.
The Fund currently consists of six different classes of shares: Class A, Class B, Class C, Class R, Class Y and Class R5. Class Y shares are available only to certain investors. Class A shares are sold with a front-end sales charge unless certain waiver criteria are met and under certain circumstances load waived shares may be subject to contingent deferred sales charges (“CDSC”). Class C shares are sold with a CDSC. Class R, Class Y and Class R5 shares are sold at net asset value. Effective November 30, 2010, new or additional investments in Class B shares are no longer permitted. Existing shareholders of Class B shares may continue to reinvest dividends and capital gains distributions in Class B shares until they convert to Class A shares. Also, shareholders in Class B shares will be able to exchange those shares for Class B shares of other Invesco Funds offering such shares until they convert to Class A shares. Generally, Class B shares will automatically convert to Class A shares on or about the month-end, which is at least eight years after the date of purchase. Redemption of Class B shares prior to the conversion date will be subject to a CDSC.
The following is a summary of the significant accounting policies followed by the Fund in the preparation of its financial statements.
| A. | Security Valuations — Securities, including restricted securities, are valued according to the following policy. |
A security listed or traded on an exchange (except convertible securities) is valued at its last sales price or official closing price as of the close of the customary trading session on the exchange where the security is principally traded, or lacking any sales or official closing price on a particular day, the security may be valued at the closing bid price on that day. Securities traded in the over-the-counter market are valued based on prices furnished by independent pricing services or market makers. When such securities are valued by an independent pricing service they may be considered fair valued. Futures contracts are valued at the final settlement price set by an exchange on which they are principally traded. Listed options are valued at the mean between the last bid and asked prices from the exchange on which they are principally traded. Options not listed on an exchange are valued by an independent source at the mean between the last bid and asked prices. For purposes of determining net asset value (“NAV”) per share, futures and option contracts generally are valued 15 minutes after the close of the customary trading session of the New York Stock Exchange (“NYSE”).
13 Invesco Pacific Growth Fund
Investments in open-end and closed-end registered investment companies that do not trade on an exchange are valued at the end-of-day net asset value per share. Investments in open-end and closed-end registered investment companies that trade on an exchange are valued at the last sales price or official closing price as of the close of the customary trading session on the exchange where the security is principally traded.
Debt obligations (including convertible securities) and unlisted equities are fair valued using an evaluated quote provided by an independent pricing service. Evaluated quotes provided by the pricing service may be determined without exclusive reliance on quoted prices, and may reflect appropriate factors such as institution-size trading in similar groups of securities, developments related to specific securities, dividend rate (for unlisted equities), yield (for debt obligations), quality, type of issue, coupon rate (for debt obligations), maturity (for debt obligations), individual trading characteristics and other market data. Debt obligations are subject to interest rate and credit risks. In addition, all debt obligations involve some risk of default with respect to interest and/or principal payments.
Foreign securities’ (including foreign exchange contracts) prices are converted into U.S. dollar amounts using the applicable exchange rates as of the close of the NYSE. If market quotations are available and reliable for foreign exchange-traded equity securities, the securities will be valued at the market quotations. Because trading hours for certain foreign securities end before the close of the NYSE, closing market quotations may become unreliable. If between the time trading ends on a particular security and the close of the customary trading session on the NYSE, events occur that the Adviser determines are significant and make the closing price unreliable, the Fund may fair value the security. If the event is likely to have affected the closing price of the security, the security will be valued at fair value in good faith using procedures approved by the Board of Trustees. Adjustments to closing prices to reflect fair value may also be based on a screening process of an independent pricing service to indicate the degree of certainty, based on historical data, that the closing price in the principal market where a foreign security trades is not the current value as of the close of the NYSE. Foreign securities’ prices meeting the approved degree of certainty that the price is not reflective of current value will be priced at the indication of fair value from the independent pricing service. Multiple factors may be considered by the independent pricing service in determining adjustments to reflect fair value and may include information relating to sector indices, American Depositary Receipts and domestic and foreign index futures. Foreign securities may have additional risks including exchange rate changes, potential for sharply devalued currencies and high inflation, political and economic upheaval, the relative lack of issuer information, relatively low market liquidity and the potential lack of strict financial and accounting controls and standards.
Securities for which market prices are not provided by any of the above methods may be valued based upon quotes furnished by independent sources. The last bid price may be used to value equity securities. The mean between the last bid and asked prices is used to value debt obligations, including corporate loans.
Securities for which market quotations are not readily available or became unreliable are valued at fair value as determined in good faith by or under the supervision of the Trust’s officers following procedures approved by the Board of Trustees. Issuer specific events, market trends, bid/asked quotes of brokers and information providers and other market data may be reviewed in the course of making a good faith determination of a security’s fair value.
The Fund may invest in securities that are subject to interest rate risk, meaning the risk that the prices will generally fall as interest rates rise and, conversely, the prices will generally rise as interest rates fall. Specific securities differ in their sensitivity to changes in interest rates depending on their individual characteristics. Changes in interest rates may result in increased market volatility, which may affect the value and/or liquidity of certain Fund investments.
Valuations change in response to many factors including the historical and prospective earnings of the issuer, the value of the issuer’s assets, general economic conditions, interest rates, investor perceptions and market liquidity. Because of the inherent uncertainties of valuation, the values reflected in the financial statements may materially differ from the value received upon actual sale of those investments.
| B. | Securities Transactions and Investment Income — Securities transactions are accounted for on a trade date basis. Realized gains or losses on sales are computed on the basis of specific identification of the securities sold. Interest income (net of withholding tax, if any) is recorded on the accrual basis from settlement date. Dividend income (net of withholding tax, if any) is recorded on the ex-dividend date. |
The Fund may periodically participate in litigation related to Fund investments. As such, the Fund may receive proceeds from litigation settlements. Any proceeds received are included in the Statement of Operations as realized gain (loss) for investments no longer held and as unrealized gain (loss) for investments still held.
Brokerage commissions and mark ups are considered transaction costs and are recorded as an increase to the cost basis of securities purchased and/or a reduction of proceeds on a sale of securities. Such transaction costs are included in the determination of net realized and unrealized gain (loss) from investment securities reported in the Statement of Operations and the Statement of Changes in Net Assets and the net realized and unrealized gains (losses) on securities per share in the Financial Highlights. Transaction costs are included in the calculation of the Fund’s net asset value and, accordingly, they reduce the Fund’s total returns. These transaction costs are not considered operating expenses and are not reflected in net investment income reported in the Statement of Operations and the Statement of Changes in Net Assets, or the net investment income per share and the ratios of expenses and net investment income reported in the Financial Highlights, nor are they limited by any expense limitation arrangements between the Fund and the investment adviser.
The Fund allocates income and realized and unrealized capital gains and losses to a class based on the relative net assets of each class.
| C. | Country Determination — For the purposes of making investment selection decisions and presentation in the Schedule of Investments, the investment adviser may determine the country in which an issuer is located and/or credit risk exposure based on various factors. These factors include the laws of the country under which the issuer is organized, where the issuer maintains a principal office, the country in which the issuer derives 50% or more of its total revenues and the country that has the primary market for the issuer’s securities, as well as other criteria. Among the other criteria that may be evaluated for making this determination are the country in which the issuer maintains 50% or more of its assets, the type of security, financial guarantees and enhancements, the nature of the collateral and the sponsor organization. Country of issuer and/or credit risk exposure has been determined to be the United States of America, unless otherwise noted. |
| D. | Distributions — Distributions from net investment income and net realized capital gain, if any, are generally declared and paid annually and recorded on the ex-dividend date. The Fund may elect to treat a portion of the proceeds from redemptions as distributions for federal income tax purposes. |
| E. | Federal Income Taxes — The Fund intends to comply with the requirements of Subchapter M of the Internal Revenue Code of 1986, as amended (the “Internal Revenue Code”), necessary to qualify as a regulated investment company and to distribute substantially all of the Fund’s |
14 Invesco Pacific Growth Fund
| | taxable earnings to shareholders. As such, the Fund will not be subject to federal income taxes on otherwise taxable income (including net realized capital gain) that is distributed to shareholders. Therefore, no provision for federal income taxes is recorded in the financial statements. |
The Fund recognizes the tax benefits of uncertain tax positions only when the position is more likely than not to be sustained. Management has analyzed the Fund’s uncertain tax positions and concluded that no liability for unrecognized tax benefits should be recorded related to uncertain tax positions. Management is not aware of any tax positions for which it is reasonably possible that the total amounts of unrecognized tax benefits will change materially in the next 12 months.
The Fund files tax returns in the U.S. Federal jurisdiction and certain other jurisdictions. Generally, the Fund is subject to examinations by such taxing authorities for up to three years after the filing of the return for the tax period.
| F. | Expenses — Fees provided for under the Rule 12b-1 plan of a particular class of the Fund are charged to the operations of such class. Transfer agency fees and expenses and other shareholder recordkeeping fees and expenses attributable to Class R5 are charged to such class. Transfer agency fees and expenses and other shareholder recordkeeping fees and expenses relating to all other classes are allocated among those classes based on relative net assets. All other expenses are allocated among the classes based on relative net assets. |
| G. | Accounting Estimates — The preparation of financial statements in conformity with accounting principles generally accepted in the United States of America (“GAAP”) requires management to make estimates and assumptions that affect the reported amounts of assets and liabilities at the date of the financial statements and the reported amounts of revenues and expenses during the reporting period including estimates and assumptions related to taxation. Actual results could differ from those estimates by a significant amount. In addition, the Fund monitors for material events or transactions that may occur or become known after the period-end date and before the date the financial statements are released to print. |
| H. | Indemnifications — Under the Trust’s organizational documents, each Trustee, officer, employee or other agent of the Trust is indemnified against certain liabilities that may arise out of the performance of their duties to the Fund. Additionally, in the normal course of business, the Fund enters into contracts, including the Fund’s servicing agreements, that contain a variety of indemnification clauses. The Fund’s maximum exposure under these arrangements is unknown as this would involve future claims that may be made against the Fund that have not yet occurred. The risk of material loss as a result of such indemnification claims is considered remote. |
| I. | Securities Lending — The Fund may lend portfolio securities having a market value up to one-third of the Fund’s total assets. Such loans are secured by collateral equal to no less than the market value of the loaned securities determined daily by the securities lending provider. Such collateral will be cash or debt securities issued or guaranteed by the U.S. Government or any of its sponsored agencies. Cash collateral received in connection with these loans is invested in short-term money market instruments or affiliated money market funds and is shown as such on the Schedule of Investments. The Fund bears the risk of loss with respect to the investment of collateral. It is the Fund’s policy to obtain additional collateral from or return excess collateral to the borrower by the end of the next business day, following the valuation date of the securities loaned. Therefore, the value of the collateral held may be temporarily less than the value of the securities on loan. When loaning securities, the Fund retains certain benefits of owning the securities, including the economic equivalent of dividends or interest generated by the security. Lending securities entails a risk of loss to the Fund if, and to the extent that, the market value of the securities loaned were to increase and the borrower did not increase the collateral accordingly, and the borrower failed to return the securities. The securities loaned are subject to termination at the option of the borrower or the Fund. Upon termination, the borrower will return to the Fund the securities loaned and the Fund will return the collateral. Upon the failure of the borrower to return the securities, collateral may be liquidated and the securities may be purchased on the open market to replace the loaned securities. The Fund could experience delays and costs in gaining access to the collateral and the securities may lose value during the delay which could result in potential losses to the Fund. Some of these losses may be indemnified by the lending agent. The Fund bears the risk of any deficiency in the amount of the collateral available for return to the borrower due to any loss on the collateral invested. Dividends received on cash collateral investments for securities lending transactions, which are net of compensation to counterparties, are included in Dividends from affiliated money market funds on the Statement of Operations. The aggregate value of securities out on loan, if any, is shown as a footnote on the Statement of Assets and Liabilities. |
| J. | Foreign Currency Translations — Foreign currency is valued at the close of the NYSE based on quotations posted by banks and major currency dealers. Portfolio securities and other assets and liabilities denominated in foreign currencies are translated into U.S. dollar amounts at date of valuation. Purchases and sales of portfolio securities (net of foreign taxes withheld on disposition) and income items denominated in foreign currencies are translated into U.S. dollar amounts on the respective dates of such transactions. The Fund does not separately account for the portion of the results of operations resulting from changes in foreign exchange rates on investments and the fluctuations arising from changes in market prices of securities held. The combined results of changes in foreign exchange rates and the fluctuation of market prices on investments (net of estimated foreign tax withholding) are included with the net realized and unrealized gain or loss from investments in the Statement of Operations. Reported net realized foreign currency gains or losses arise from (1) sales of foreign currencies, (2) currency gains or losses realized between the trade and settlement dates on securities transactions, and (3) the difference between the amounts of dividends, interest, and foreign withholding taxes recorded on the Fund’s books and the U.S. dollar equivalent of the amounts actually received or paid. Net unrealized foreign currency gains and losses arise from changes in the fair values of assets and liabilities, other than investments in securities at fiscal period end, resulting from changes in exchange rates. |
The Fund may invest in foreign securities, which may be subject to foreign taxes on income, gains on investments or currency repatriation, a portion of which may be recoverable. Foreign taxes, if any, are recorded based on the tax regulations and rates that exist in the foreign markets in which the Fund invests and are shown in the Statement of Operations.
| K. | Forward Foreign Currency Contracts — The Fund may engage in foreign currency transactions either on a spot (i.e. for prompt delivery and settlement) basis, or through forward foreign currency contracts, to manage or minimize currency or exchange rate risk. |
The Fund may also enter into forward foreign currency contracts for the purchase or sale of a security denominated in a foreign currency in order to “lock in” the U.S. dollar price of that security, or the Fund may also enter into forward foreign currency contracts that do not provide for physical settlement of the two currencies, but instead are settled by a single cash payment calculated as the difference between the agreed upon exchange rate and the spot rate at settlement based upon an agreed upon notional amount (non-deliverable forwards). The Fund will set aside liquid assets in an amount equal to the daily mark-to-market obligation for forward foreign currency contracts.
15 Invesco Pacific Growth Fund
A forward foreign currency contract is an obligation between two parties (“Counterparties”) to purchase or sell a specific currency for an agreed-upon price at a future date. The use of forward foreign currency contracts does not eliminate fluctuations in the price of the underlying securities the Fund owns or intends to acquire but establishes a rate of exchange in advance. Fluctuations in the value of these contracts are measured by the difference in the contract date and reporting date exchange rates and are recorded as unrealized appreciation (depreciation) until the contracts are closed. When the contracts are closed, realized gains (losses) are recorded. Realized and unrealized gains (losses) on the contracts are included in the Statement of Operations. The primary risks associated with forward foreign currency contracts include failure of the Counterparty to meet the terms of the contract and the value of the foreign currency changing unfavorably. These risks may be in excess of the amounts reflected in the Statement of Assets and Liabilities.
NOTE 2—Advisory Fees and Other Fees Paid to Affiliates
The Trust has entered into a master investment advisory agreement with Invesco Advisers, Inc. (the “Adviser” or “Invesco”). Under the terms of the investment advisory agreement, the Fund pays an advisory fee to the Adviser based on the annual rate of the Fund’s average daily net assets as follows:
| | | | |
| Average Daily Net Assets | | Rate | |
First $1 billion | | | 0.87% | |
Next $1 billion | | | 0.82% | |
Over $2 billion | | | 0.77% | |
For the year ended October 31, 2016, the effective advisory fees incurred by the Fund was 0.87%.
Under the terms of a master sub-advisory agreement between the Adviser and each of Invesco Asset Management Deutschland GmbH, Invesco Asset Management Limited, Invesco Asset Management (Japan) Limited, Invesco Hong Kong Limited, Invesco Senior Secured Management, Inc. and Invesco Canada Ltd. (collectively, the “Affiliated Sub-Advisers”) the Adviser, not the Fund, will pay 40% of the fees paid to the Adviser to any such Affiliated Sub-Adviser(s) that provide(s) discretionary investment management services to the Fund based on the percentage of assets allocated to such Affiliated Sub-Adviser(s).
The Adviser has contractually agreed, through at least June 30, 2017, to waive advisory fees and/or reimburse expenses of all shares to the extent necessary to limit total annual fund operating expenses after fee waiver and/or expense reimbursement (excluding certain items discussed below) of Class A, Class B, Class C, Class R, Class Y and Class R5 shares to 2.25%, 3.00%, 3.00%, 2.50%, 2.00% and 2.00%, respectively, of the Fund’s average daily net assets (the “expense limits”). In determining the Adviser’s obligation to waive advisory fees and/or reimburse expenses, the following expenses are not taken into account, and could cause the total annual fund operating expenses after fee waiver and/or expense reimbursement to exceed the numbers reflected above: (1) interest; (2) taxes; (3) dividend expense on short sales; (4) extraordinary or non-routine items, including litigation expenses; and (5) expenses that the Fund has incurred but did not actually pay because of an expense offset arrangement. Unless Invesco continues the fee waiver agreement, it will terminate on June 30, 2017. During its term, the fee waiver agreement cannot be terminated or amended to increase the expense limits without approval of the Board of Trustees. The Adviser did not waive fees and/or reimburse expenses during the period under these expense limits.
Further, the Adviser has contractually agreed, through at least June 30, 2018, to waive the advisory fee payable by the Fund in an amount equal to 100% of the net advisory fees the Adviser receives from the affiliated money market funds on investments by the Fund of uninvested cash (excluding investments of cash collateral from securities lending) in such affiliated money market funds.
For the year ended October 31, 2016, the Adviser waived advisory fees of $1,836.
The Trust has entered into a master administrative services agreement with Invesco pursuant to which the Fund has agreed to pay Invesco for certain administrative costs incurred in providing accounting services to the Fund. For the year ended October 31, 2016, expenses incurred under the agreement are shown in the Statement of Operations as Administrative services fees.
The Trust has entered into a transfer agency and service agreement with Invesco Investment Services, Inc. (“IIS”) pursuant to which the Fund has agreed to pay IIS a fee for providing transfer agency and shareholder services to the Fund and reimburse IIS for certain expenses incurred by IIS in the course of providing such services. IIS may make payments to intermediaries that provide omnibus account services, sub-accounting services and/or networking services. All fees payable by IIS to intermediaries that provide omnibus account services or sub-accounting are charged back to the Fund, subject to certain limitations approved by the Trust’s Board of Trustees. For the year ended October 31, 2016, expenses incurred under the agreement are shown in the Statement of Operations as Transfer agent fees.
Shares of the Fund are distributed by Invesco Distributors, Inc. (“IDI”), an affiliate of the Adviser. The Fund has adopted a Plan of Distribution (the “Plan”) pursuant to Rule 12b-1 under the 1940 Act. The Plan provides that the Fund will reimburse IDI for distribution related expenses that IDI incurs up to a maximum of the following annual rates: (1) Class A — up to 0.25% of the average daily net assets of Class A shares; (2) Class B — up to 1.00% of the average daily net assets of Class B shares; (3) Class C — up to 1.00% of the average daily net assets of Class C shares; and (4) Class R — up to 0.50% of the average daily net assets of Class R shares.
In the case of Class B shares, provided that the Plan continues in effect, any cumulative expenses incurred by IDI, but not yet reimbursed to IDI, may be recovered through the payment of future distribution fees from the Fund pursuant to the Plan and contingent deferred sales charges paid by investors upon redemption of Class B shares.
For the year ended October 31, 2016, expenses incurred under these agreements are shown in the Statement of Operations as Distribution fees.
Front-end sales commissions and CDSC (collectively, the “sales charges”) are not recorded as expenses of the Fund. Front-end sales commissions are deducted from proceeds from the sales of Fund shares prior to investment in Class A shares of the Fund. CDSC are deducted from redemption proceeds prior to remittance to the shareholder. During the year ended October 31, 2016, IDI advised the Fund that IDI retained $59,798 in front-end sales commissions from the sale of Class A shares and $1,475, $11 and $202 from Class A, Class B and Class C shares, respectively, for CDSC imposed on redemptions by shareholders.
Certain officers and trustees of the Trust are officers and directors of the Adviser, IIS and/or IDI.
16 �� Invesco Pacific Growth Fund
NOTE 3—Additional Valuation Information
GAAP defines fair value as the price that would be received to sell an asset or paid to transfer a liability in an orderly transaction between market participants at the measurement date, under current market conditions. GAAP establishes a hierarchy that prioritizes the inputs to valuation methods, giving the highest priority to readily available unadjusted quoted prices in an active market for identical assets (Level 1) and the lowest priority to significant unobservable inputs (Level 3), generally when market prices are not readily available or are unreliable. Based on the valuation inputs, the securities or other investments are tiered into one of three levels. Changes in valuation methods may result in transfers in or out of an investment’s assigned level:
| | Level 1 — | Prices are determined using quoted prices in an active market for identical assets. |
| | Level 2 — | Prices are determined using other significant observable inputs. Observable inputs are inputs that other market participants may use in pricing a security. These may include quoted prices for similar securities, interest rates, prepayment speeds, credit risk, yield curves, loss severities, default rates, discount rates, volatilities and others. |
| | Level 3 — | Prices are determined using significant unobservable inputs. In situations where quoted prices or observable inputs are unavailable (for example, when there is little or no market activity for an investment at the end of the period), unobservable inputs may be used. Unobservable inputs reflect the Fund’s own assumptions about the factors market participants would use in determining fair value of the securities or instruments and would be based on the best available information. |
The following is a summary of the tiered valuation input levels, as of October 31, 2016. The level assigned to the securities valuations may not be an indication of the risk or liquidity associated with investing in those securities. Because of the inherent uncertainties of valuation, the values reflected in the financial statements may materially differ from the value received upon actual sale of those investments.
During the year ended October 31, 2016, there were transfers from Level 1 to Level 2 of $4,115,696 and from Level 2 to Level 1 of $44,242,891, due to foreign fair value adjustments.
| | | | | | | | | | | | | | | | |
| | | Level 1 | | | Level 2 | | | Level 3 | | | Total | |
Australia | | $ | — | | | $ | 6,962,752 | | | $ | — | | | $ | 6,962,752 | |
China | | | 5,469,126 | | | | 5,319,848 | | | | 58,501 | | | | 10,847,475 | |
Hong Kong | | | 2,681,858 | | | | — | | | | — | | | | 2,681,858 | |
India | | | 4,603,727 | | | | 1,682,610 | | | | — | | | | 6,286,337 | |
Indonesia | | | 1,712,190 | | | | — | | | | — | | | | 1,712,190 | |
Japan | | | 25,172,851 | | | | 12,145,007 | | | | — | | | | 37,317,858 | |
Philippines | | | 1,361,162 | | | | — | | | | — | | | | 1,361,162 | |
Singapore | | | 1,169,078 | | | | — | | | | — | | | | 1,169,078 | |
South Korea | | | 7,206,814 | | | | — | | | | — | | | | 7,206,814 | |
Taiwan | | | 2,850,127 | | | | — | | | | — | | | | 2,850,127 | |
Thailand | | | 1,636,186 | | | | — | | | | — | | | | 1,636,186 | |
Money Market Funds | | | 702,633 | | | | — | | | | — | | | | 702,633 | |
Total Investments | | $ | 54,565,752 | | | $ | 26,110,217 | | | $ | 58,501 | | | $ | 80,734,470 | |
NOTE 4—Expense Offset Arrangement(s)
The expense offset arrangement is comprised of transfer agency credits which result from balances in demand deposit accounts used by the transfer agent for clearing shareholder transactions. For the year ended October 31, 2016, the Fund received credits from this arrangement, which resulted in the reduction of the Fund’s total expenses of $603.
NOTE 5—Trustees’ and Officers’ Fees and Benefits
Trustees’ and Officers’ Fees and Benefits include amounts accrued by the Fund to pay remuneration to certain Trustees and Officers of the Fund. Trustees have the option to defer compensation payable by the Fund, and Trustees’ and Officers’ Fees and Benefits also include amounts accrued by the Fund to fund such deferred compensation amounts. Those Trustees who defer compensation have the option to select various Invesco Funds in which their deferral accounts shall be deemed to be invested. Finally, certain current Trustees were eligible to participate in a retirement plan that provided for benefits to be paid upon retirement to Trustees over a period of time based on the number of years of service. The Fund may have certain former Trustees who also participate in a retirement plan and receive benefits under such plan. Trustees’ and Officers’ Fees and Benefits include amounts accrued by the Fund to fund such retirement benefits. Obligations under the deferred compensation and retirement plans represent unsecured claims against the general assets of the Fund.
NOTE 6—Cash Balances
The Fund is permitted to temporarily carry a negative or overdrawn balance in its account with State Street Bank and Trust Company, the custodian bank. Such balances, if any at period-end, are shown in the Statement of Assets and Liabilities under the payable caption Amount due custodian. To compensate the custodian bank for such overdrafts, the overdrawn Fund may either (1) leave funds as a compensating balance in the account so the custodian bank can be compensated by earning the additional interest; or (2) compensate by paying the custodian bank at a rate agreed upon by the custodian bank and Invesco, not to exceed the contractually agreed upon rate.
17 Invesco Pacific Growth Fund
NOTE 7—Distributions to Shareholders and Tax Components of Net Assets
Tax Character of Distributions to Shareholders Paid During the Fiscal Years Ended October 31, 2016 and 2015:
| | | | | | | | |
| | | 2016 | | | 2015 | |
Ordinary income | | $ | — | | | $ | 93,489 | |
Tax Components of Net Assets at Period-End:
| | | | |
| | | 2016 | |
Undistributed ordinary income | | $ | 135,906 | |
Net unrealized appreciation — investments | | | 12,249,167 | |
Net unrealized appreciation (depreciation) — other investments | | | (10,289 | ) |
Temporary book/tax differences | | | (92,375 | ) |
Capital loss carryforward | | | (15,507,699 | ) |
Shares of beneficial interest | | | 83,691,736 | |
Total net assets | | $ | 80,466,446 | |
The difference between book-basis and tax-basis unrealized appreciation (depreciation) is due to differences in the timing of recognition of gains and losses on investments for tax and book purposes. The Fund’s net unrealized appreciation (depreciation) difference is attributable primarily to wash sales.
The temporary book/tax differences are a result of timing differences between book and tax recognition of income and/or expenses. The Fund’s temporary book/tax differences are the result of the trustee deferral of compensation and retirement plan benefits.
Capital loss carryforward is calculated and reported as of a specific date. Results of transactions and other activity after that date may affect the amount of capital loss carryforward actually available for the Fund to utilize. Capital losses generated in years beginning after December 22, 2010 can be carried forward for an unlimited period, whereas previous losses expire in eight tax years. Capital losses with an expiration period may not be used to offset capital gains until all net capital losses without an expiration date have been utilized. Capital loss carryforwards with no expiration date will retain their character as either short-term or long-term capital losses instead of as short-term capital losses as under prior law. The ability to utilize capital loss carryforwards in the future may be limited under the Internal Revenue Code and related regulations based on the results of future transactions.
The Fund has a capital loss carryforward as of October 31, 2016, which expires as follows:
| | | | | | | | | | | | |
| Capital Loss Carryforward* | |
| Expiration | | Short-Term | | | Long-Term | | | Total | |
October 31, 2017 | | $ | 14,498,927 | | | $ | — | | | $ | 14,498,927 | |
Not subject to expiration | | | 1,008,772 | | | | — | | | | 1,008,772 | |
| | | $ | 15,507,699 | | | $ | — | | | $ | 15,507,699 | |
| * | Capital loss carryforward as of the date listed above is reduced for limitations, if any, to the extent required by the Internal Revenue Code and may be further limited depending upon a variety of factors, including the realization of net unrealized gains or losses as of the date of any reorganization. |
NOTE 8—Investment Securities
The aggregate amount of investment securities (other than short-term securities, U.S. Treasury obligations and money market funds, if any) purchased and sold by the Fund during the year ended October 31, 2016 was $24,277,608 and $25,339,322, respectively. Cost of investments on a tax basis includes the adjustments for financial reporting purposes as of the most recently completed federal income tax reporting period-end.
| | | | |
| Unrealized Appreciation (Depreciation) of Investment Securities on a Tax Basis | |
Aggregate unrealized appreciation of investment securities | | $ | 14,124,815 | |
Aggregate unrealized (depreciation) of investment securities | | | (1,875,648 | ) |
Net unrealized appreciation of investment securities | | $ | 12,249,167 | |
Cost of investments for tax purposes is $68,485,303.
NOTE 9—Reclassification of Permanent Differences
Primarily as a result of differing book/tax treatment of expired capital loss carryforwards, on October 31, 2016, undistributed net investment income was increased by $33,033, undistributed net realized gain (loss) was increased by $267,439 and shares of beneficial interest was decreased by $300,472. This reclassification had no effect on the net assets of the Fund.
18 Invesco Pacific Growth Fund
NOTE 10—Share Information
| | | | | | | | | | | | | | | | |
| | | Summary of Share Activity | |
| | | Years ended October 31, | |
| | | 2016(a) | | | 2015 | |
| | | Shares | | | Amount | | | Shares | | | Amount | |
Sold: | | | | | | | | | | | | | | | | |
Class A | | | 279,894 | | | $ | 6,771,918 | | | | 342,880 | | | $ | 8,510,509 | |
Class B | | | 275 | | | | 5,882 | | | | 1,080 | | | | 24,936 | |
Class C | | | 27,117 | | | | 623,727 | | | | 98,266 | | | | 2,337,682 | |
Class R | | | 2,450 | | | | 60,652 | | | | 5,689 | | | | 141,656 | |
Class Y | | | 366,237 | | | | 9,295,285 | | | | 161,849 | | | | 4,107,733 | |
| | | | |
Issued as reinvestment of dividends: | | | | | | | | | | | | | | | | |
Class A | | | — | | | | — | | | | 3,049 | | | | 70,381 | |
Class Y | | | — | | | | — | | | | 450 | | | | 10,535 | |
| | | | |
Automatic conversion of Class B shares to Class A shares: | | | | | | | | | | | | | | | | |
Class A | | | 4,452 | | | | 112,008 | | | | 6,968 | | | | 169,471 | |
Class B | | | (4,785 | ) | | | (112,008 | ) | | | (7,427 | ) | | | (169,471 | ) |
| | | | |
Reacquired: | | | | | | | | | | | | | | | | |
Class A | | | (581,521 | ) | | | (14,582,058 | ) | | | (578,288 | ) | | | (14,075,800 | ) |
Class B | | | (2,418 | ) | | | (56,284 | ) | | | (2,389 | ) | | | (55,341 | ) |
Class C | | | (60,951 | ) | | | (1,388,275 | ) | | | (82,173 | ) | | | (1,896,754 | ) |
Class R | | | (3,457 | ) | | | (81,199 | ) | | | (9,528 | ) | | | (236,157 | ) |
Class Y | | | (121,219 | ) | | | (2,971,726 | ) | | | (133,611 | ) | | | (3,308,448 | ) |
Net increase (decrease) in share activity | | | (93,926 | ) | | $ | (2,322,078 | ) | | | (193,185 | ) | | $ | (4,369,068 | ) |
| (a) | There is an entity that is record owner of more than 5% of the outstanding shares of the Fund that owns 57% of the outstanding shares of the Fund. IDI has an agreement with this entity to sell Fund shares. The Fund, Invesco and/or Invesco affiliates may make payments to this entity, which is considered to be related to the Fund, for providing services to the Fund, Invesco and/or Invesco affiliates including but not limited to services such as securities brokerage, distribution, third party record keeping and account servicing. The Fund has no knowledge as to whether all or any portion of the shares owned of record by this entity are also owned beneficially. |
19 Invesco Pacific Growth Fund
NOTE 11—Financial Highlights
The following schedule presents financial highlights for a share of the Fund outstanding throughout the periods indicated.
| | | | | | | | | | | | | | | | | | | | | | | | | | | | | | | | | | | | | | | | | | | | | | | | |
| | | Net asset
value,
beginning
of period | | | Net
investment
income
(loss)(a) | | | Net gains
(losses)
on securities
(both
realized and
unrealized) | | | Total from
investment
operations | | | Dividends
from net
investment
income | | | Net asset
value, end
of period(b) | | | Total
return(c) | | | Net assets,
end of period
(000’s omitted) | | | Ratio of
expenses
to average
net assets
with fee waivers
and/or expenses
absorbed | | | Ratio of
expenses
to average net
assets without
fee waivers
and/or expenses
absorbed | | | Ratio of net
investment
income (loss)
to average
net assets | | | Portfolio
turnover(d) | |
Class A | |
Year ended 10/31/16 | | $ | 24.03 | | | $ | 0.04 | | | $ | 2.24 | | | $ | 2.28 | | | $ | — | | | $ | 26.31 | | | | 9.49 | % | | $ | 65,107 | | | | 1.64 | %(e) | | | 1.64 | %(e) | | | 0.17 | %(e) | | | 31 | % |
Year ended 10/31/15 | | | 24.51 | | | | 0.05 | | | | (0.50 | ) | | | (0.45 | ) | | | (0.03 | ) | | | 24.03 | | | | (1.84 | ) | | | 66,599 | | | | 1.78 | | | | 1.78 | | | | 0.21 | | | | 137 | |
Year ended 10/31/14 | | | 23.90 | | | | 0.14 | | | | 0.82 | | | | 0.96 | | | | (0.35 | ) | | | 24.51 | | | | 4.10 | (f) | | | 73,457 | | | | 1.77 | (f) | | | 1.77 | (f) | | | 0.60 | (f) | | | 63 | |
Year ended 10/31/13 | | | 20.05 | | | | 0.12 | | | | 3.83 | | | | 3.95 | | | | (0.10 | ) | | | 23.90 | | | | 19.76 | | | | 79,672 | | | | 1.81 | | | | 1.81 | | | | 0.56 | | | | 87 | |
Year ended 10/31/12 | | | 20.05 | | | | 0.15 | | | | 0.20 | | | | 0.35 | | | | (0.35 | ) | | | 20.05 | | | | 1.81 | | | | 74,319 | | | | 1.79 | | | | 1.79 | | | | 0.76 | | | | 101 | |
Class B | | | | | | | | | | | | | | | | | | | | | | | | | | | | | | | | | | | | | | | | | | | | | | | | |
Year ended 10/31/16 | | | 22.46 | | | | (0.13 | ) | | | 2.07 | | | | 1.94 | | | | — | | | | 24.40 | | | | 8.64 | | | | 126 | | | | 2.39 | (e) | | | 2.39 | (e) | | | (0.58 | )(e) | | | 31 | |
Year ended 10/31/15 | | | 23.05 | | | | (0.12 | ) | | | (0.47 | ) | | | (0.59 | ) | | | — | | | | 22.46 | | | | (2.56 | ) | | | 272 | | | | 2.53 | | | | 2.53 | | | | (0.54 | ) | | | 137 | |
Year ended 10/31/14 | | | 22.49 | | | | (0.04 | ) | | | 0.77 | | | | 0.73 | | | | (0.17 | ) | | | 23.05 | | | | 3.28 | | | | 480 | | | | 2.53 | | | | 2.53 | | | | (0.16 | ) | | | 63 | |
Year ended 10/31/13 | | | 18.92 | | | | (0.04 | ) | | | 3.61 | | | | 3.57 | | | | – | | | | 22.49 | | | | 18.87 | | | | 889 | | | | 2.56 | | | | 2.56 | | | | (0.19 | ) | | | 87 | |
Year ended 10/31/12 | | | 18.91 | | | | (0.00 | ) | | | 0.20 | | | | 0.20 | | | | (0.19 | ) | | | 18.92 | | | | 1.09 | | | | 1,847 | | | | 2.55 | | | | 2.55 | | | | (0.00 | ) | | | 101 | |
Class C | | | | | | | | | | | | | | | | | | | | | | | | | | | | | | | | | | | | | | | | | | | | | | | | |
Year ended 10/31/16 | | | 22.50 | | | | (0.13 | ) | | | 2.09 | | | | 1.96 | | | | — | | | | 24.46 | | | | 8.71 | (g) | | | 4,477 | | | | 2.37 | (e)(g) | | | 2.37 | (e)(g) | | | (0.56 | )(e)(g) | | | 31 | |
Year ended 10/31/15 | | | 23.09 | | | | (0.12 | ) | | | (0.47 | ) | | | (0.59 | ) | | | — | | | | 22.50 | | | | (2.55 | ) | | | 4,880 | | | | 2.53 | | | | 2.53 | | | | (0.54 | ) | | | 137 | |
Year ended 10/31/14 | | | 22.53 | | | | (0.03 | ) | | | 0.76 | | | | 0.73 | | | | (0.17 | ) | | | 23.09 | | | | 3.28 | (g) | | | 4,638 | | | | 2.52 | (g) | | | 2.52 | (g) | | | (0.15 | )(g) | | | 63 | |
Year ended 10/31/13 | | | 18.95 | | | | (0.04 | ) | | | 3.62 | | | | 3.58 | | | | — | | | | 22.53 | | | | 18.89 | | | | 5,049 | | | | 2.56 | | | | 2.56 | | | | (0.19 | ) | | | 87 | |
Year ended 10/31/12 | | | 18.94 | | | | 0.02 | | | | 0.19 | | | | 0.21 | | | | (0.20 | ) | | | 18.95 | | | | 1.15 | (g) | | | 4,624 | | | | 2.46 | (g) | | | 2.46 | (g) | | | 0.09 | (g) | | | 101 | |
Class R | | | | | | | | | | | | | | | | | | | | | | | | | | | | | | | | | | | | | | | | | | | | | | | | |
Year ended 10/31/16 | | | 23.82 | | | | (0.02 | ) | | | 2.22 | | | | 2.20 | | | | — | | | | 26.02 | | | | 9.24 | | | | 242 | | | | 1.89 | (e) | | | 1.89 | (e) | | | (0.08 | )(e) | | | 31 | |
Year ended 10/31/15 | | | 24.33 | | | | (0.01 | ) | | | (0.50 | ) | | | (0.51 | ) | | | — | | | | 23.82 | | | | (2.10 | ) | | | 245 | | | | 2.03 | | | | 2.03 | | | | (0.04 | ) | | | 137 | |
Year ended 10/31/14 | | | 23.74 | | | | 0.08 | | | | 0.80 | | | | 0.88 | | | | (0.29 | ) | | | 24.33 | | | | 3.78 | | | | 344 | | | | 2.03 | | | | 2.03 | | | | 0.34 | | | | 63 | |
Year ended 10/31/13 | | | 19.93 | | | | 0.07 | | | | 3.80 | | | | 3.87 | | | | (0.06 | ) | | | 23.74 | | | | 19.44 | | | | 295 | | | | 2.06 | | | | 2.06 | | | | 0.31 | | | | 87 | |
Year ended 10/31/12 | | | 19.95 | | | | 0.10 | | | | 0.20 | | | | 0.30 | | | | (0.32 | ) | | | 19.93 | | | | 1.59 | | | | 236 | | | | 2.05 | | | | 2.05 | | | | 0.50 | | | | 101 | |
Class Y | | | | | | | | | | | | | | | | | | | | | | | | | | | | | | | | | | | | | | | | | | | | | | | | |
Year ended 10/31/16 | | | 24.41 | | | | 0.11 | | | | 2.27 | | | | 2.38 | | | | — | | | | 26.79 | | | | 9.75 | | | | 10,501 | | | | 1.39 | (e) | | | 1.39 | (e) | | | 0.42 | (e) | | | 31 | |
Year ended 10/31/15 | | | 24.90 | | | | 0.12 | | | | (0.52 | ) | | | (0.40 | ) | | | (0.09 | ) | | | 24.41 | | | | (1.59 | ) | | | 3,587 | | | | 1.53 | | | | 1.53 | | | | 0.46 | | | | 137 | |
Year ended 10/31/14 | | | 24.28 | | | | 0.20 | | | | 0.82 | | | | 1.02 | | | | (0.40 | ) | | | 24.90 | | | | 4.34 | | | | 2,944 | | | | 1.53 | | | | 1.53 | | | | 0.84 | | | | 63 | |
Year ended 10/31/13 | | | 20.37 | | | | 0.18 | | | | 3.88 | | | | 4.06 | | | | (0.15 | ) | | | 24.28 | | | | 20.03 | | | | 3,291 | | | | 1.56 | | | | 1.56 | | | | 0.81 | | | | 87 | |
Year ended 10/31/12 | | | 20.37 | | | | 0.20 | | | | 0.21 | | | | 0.41 | | | | (0.41 | ) | | | 20.37 | | | | 2.10 | | | | 5,240 | | | | 1.55 | | | | 1.55 | | | | 1.00 | | | | 101 | |
Class R5 | | | | | | | | | | | | | | | | | | | | | | | | | | | | | | | | | | | | | | | | | | | | | | | | |
Year ended 10/31/16 | | | 24.42 | | | | 0.13 | | | | 2.29 | | | | 2.42 | | | | — | | | | 26.84 | | | | 9.91 | | | | 14 | | | | 1.28 | (e) | | | 1.28 | (e) | | | 0.53 | (e) | | | 31 | |
Year ended 10/31/15 | | | 24.92 | | | | 0.15 | | | | (0.52 | ) | | | (0.37 | ) | | | (0.13 | ) | | | 24.42 | | | | (1.47 | ) | | | 13 | | | | 1.39 | | | | 1.39 | | | | 0.60 | | | | 137 | |
Year ended 10/31/14 | | | 24.30 | | | | 0.24 | | | | 0.82 | | | | 1.06 | | | | (0.44 | ) | | | 24.92 | | | | 4.48 | | | | 13 | | | | 1.37 | | | | 1.37 | | | | 1.00 | | | | 63 | |
Year ended 10/31/13 | | | 20.39 | | | | 0.21 | | | | 3.89 | | | | 4.10 | | | | (0.19 | ) | | | 24.30 | | | | 20.23 | | | | 13 | | | | 1.43 | | | | 1.43 | | | | 0.94 | | | | 87 | |
Year ended 10/31/12 | | | 20.39 | | | | 0.24 | | | | 0.20 | | | | 0.44 | | | | (0.44 | ) | | | 20.39 | | | | 2.24 | | | | 11 | | | | 1.37 | | | | 1.37 | | | | 1.18 | | | | 101 | |
| (a) | Calculated using average shares outstanding. |
| (b) | Includes redemption fees added to shares of beneficial interest which were less than $0.005 per share for the year ended October 31, 2012. |
| (c) | Includes adjustments in accordance with accounting principles generally accepted in the United States of America and as such, the net asset value for financial reporting purposes and the returns based upon those net asset values may differ from the net asset value and returns for shareholder transactions. Does not include sales charges and is not annualized for periods less than one year, if applicable. |
| (d) | Portfolio turnover is calculated at the fund level and is not annualized for periods less than one year, if applicable. |
| (e) | Ratios are based on average daily net assets (000’s omitted) of $66,935, $213, $4,600, $227, $6,599 and $13 for Class A, Class B, Class C, Class R, Class Y and Class R5 shares, respectively. |
| (f) | The total return, ratio of expenses to average net assets and ratio of net investment income (loss) to average net assets reflect actual 12b-1 fees of 0.24% for Class A shares for the year ended October 31, 2014. |
| (g) | The total return, ratio of expenses to average net assets and ratio of net investment income (loss) to average net assets reflect actual 12b-1 fees of 0.98%, 0.99% and 0.90% for Class C shares for the years ended October 31, 2016, 2014 and 2012, respectively. |
20 Invesco Pacific Growth Fund
Report of Independent Registered Public Accounting Firm
To the Board of Trustees
and Shareholders of the Invesco Pacific Growth Fund:
In our opinion, the accompanying statement of assets and liabilities, including the schedule of investments, and the related statements of operations and of changes in net assets and the financial highlights present fairly, in all material respects, the financial position of the Invesco Pacific Growth Fund (the “Fund”) as of October 31, 2016, the results of its operations for the year then ended, the changes in its net assets for each of the two years in the period then ended and the financial highlights for each of the five years in the period then ended, in conformity with accounting principles generally accepted in the United States of America. These financial statements and financial highlights (hereafter referred to as “financial statements”) are the responsibility of the Fund’s management. Our responsibility is to express an opinion on these financial statements based on our audits. We conducted our audits of these financial statements in accordance with the standards of the Public Company Accounting Oversight Board (United States). Those standards require that we plan and perform the audit to obtain reasonable assurance about whether the financial statements are free of material misstatement. An audit includes examining, on a test basis, evidence supporting the amounts and disclosures in the financial statements, assessing the accounting principles used and significant estimates made by management, and evaluating the overall financial statement presentation. We believe that our audits, which included confirmation of securities as of October 31, 2016 by correspondence with the custodian, provide a reasonable basis for our opinion.
PRICEWATERHOUSECOOPERS LLP
Houston, Texas
December 21, 2016
21 Invesco Pacific Growth Fund
Calculating your ongoing Fund expenses
Example
As a shareholder of the Fund, you incur two types of costs: (1) transaction costs, which may include sales charges (loads) on purchase payments or contingent deferred sales charges on redemptions, if any; and (2) ongoing costs, including management fees, distribution and/or service (12b-1) fees, and other Fund expenses. This example is intended to help you understand your ongoing costs (in dollars) of investing in the Fund and to compare these costs with ongoing costs of investing in other mutual funds. The example is based on an investment of $1,000 invested at the beginning of the period and held for the entire period May 1, 2016 through October 31, 2016.
Actual expenses
The table below provides information about actual account values and actual expenses. You may use the information in this table, together with the amount you invested, to estimate the expenses that you paid over the period. Simply divide your account value by $1,000 (for example, an $8,600 account value divided by $1,000 = 8.6), then multiply the result by the number in the table under the heading entitled “Actual Expenses Paid During Period” to estimate the expenses you paid on your account during this period.
Hypothetical example for comparison purposes
The table below also provides information about hypothetical account values and hypothetical expenses based on the Fund’s actual expense ratio and an assumed rate of return of 5% per year before expenses, which is not the Fund’s actual return.
The hypothetical account values and expenses may not be used to estimate the actual ending account balance or expenses you paid for the period. You may use this information to compare the ongoing costs of investing in the Fund and other funds. To do so, compare this 5% hypothetical example with the 5% hypothetical examples that appear in the shareholder reports of the other funds.
Please note that the expenses shown in the table are meant to highlight your ongoing costs only and do not reflect any transaction costs, such as sales charges (loads) on purchase payments or contingent deferred sales charges on redemptions, if any. Therefore, the hypothetical information is useful in comparing ongoing costs only, and will not help you determine the relative total costs of owning different funds. In addition, if these transaction costs were included, your costs would have been higher.
| | | | | | | | | | | | | | | | | | | | | | | | |
| Class | | Beginning
Account Value
(05/01/16) | | | ACTUAL | | | HYPOTHETICAL
(5% annual return before expenses) | | | Annualized
Expense
Ratio | |
| | | Ending
Account Value
(10/31/16)1 | | | Expenses
Paid During
Period2 | | | Ending
Account Value
(10/31/16) | | | Expenses
Paid During
Period2 | | |
| A | | $ | 1,000.00 | | | $ | 1,089.90 | | | $ | 8.04 | | | $ | 1,017.44 | | | $ | 7.76 | | | | 1.53 | % |
| B | | | 1,000.00 | | | | 1,086.30 | | | | 12.01 | | | | 1,013.62 | | | | 11.59 | | | | 2.29 | |
| C | | | 1,000.00 | | | | 1,086.10 | | | | 11.80 | | | | 1,013.83 | | | | 11.39 | | | | 2.25 | |
| R | | | 1,000.00 | | | | 1,088.70 | | | | 9.40 | | | | 1,016.14 | | | | 9.07 | | | | 1.79 | |
| Y | | | 1,000.00 | | | | 1,091.20 | | | | 6.78 | | | | 1,018.65 | | | | 6.55 | | | | 1.29 | |
| R5 | | | 1,000.00 | | | | 1,091.90 | | | | 6.26 | | | | 1,019.15 | | | | 6.04 | | | | 1.19 | |
| 1 | The actual ending account value is based on the actual total return of the Fund for the period May 1, 2016 through October 31, 2016, after actual expenses and will differ from the hypothetical ending account value which is based on the Fund’s expense ratio and a hypothetical annual return of 5% before expenses. |
| 2 | Expenses are equal to the Fund’s annualized expense ratio as indicated above multiplied by the average account value over the period, multiplied by 184/366 to reflect the most recent fiscal half year. |
22 Invesco Pacific Growth Fund
Approval of Investment Advisory and Sub-Advisory Contracts
The Board of Trustees (the Board) of AIM Investment Funds (Invesco Investment Funds) is required under the Investment Company Act of 1940, as amended, to approve annually the renewal of Invesco Pacific Growth Fund’s (the Fund) investment advisory agreements. During contract renewal meetings held on June 7-8, 2016, the Board as a whole, and the disinterested or “independent” Trustees, who comprise over 75% of the Board, voting separately, approved the continuance for the Fund of the Master Investment Advisory Agreement with Invesco Advisers, Inc. (Invesco Advisers and the investment advisory agreement) and the Master Intergroup Sub-Advisory Contract for Mutual Funds with Invesco Asset Management Deutschland GmbH, Invesco Asset Management Limited, Invesco Asset Management (Japan) Limited, Invesco Hong Kong Limited, Invesco Senior Secured Management, Inc. and Invesco Canada Ltd. (collectively, the Affiliated Sub-Advisers and the sub-advisory contracts) for another year, effective July 1, 2016.
In evaluating the fairness and reasonableness of compensation under the Fund’s investment advisory agreement and sub-advisory contracts, the Board considered, among other things, the factors discussed below. The Board determined that continuation of the Fund’s investment advisory agreement and the sub-advisory contracts is in the best interest of the Fund and its shareholders and that the compensation payable to Invesco Advisers and the Affiliated Sub-Advisers under the agreements is fair and reasonable.
The Board’s Fund Evaluation Process
The Board’s Investments Committee has established three Sub-Committees, which meet throughout the year to review the performance of funds advised by Invesco Advisers (the Invesco Funds). Over the course of each year, the Sub-Committees meet with portfolio managers for their assigned Invesco Funds and other members of management to review the performance, investment objective(s), policies, strategies, limitations and investment risks of these funds. The Board had the benefit of reports from the Sub-Committees and Investments Committee throughout the year in considering approval of the continuance of each Invesco Fund’s investment advisory agreement and sub-advisory contracts for another year.
During the contract renewal process, the Board receives comparative performance and fee data regarding the Invesco Funds prepared by Invesco Advisers and Broadridge Financial Solutions, Inc. (Broadridge), an independent provider of investment company data. The Board also receives an independent written evaluation from the Senior Officer, an officer of the Invesco Funds who reports directly to the independent Trustees. The Senior Officer’s
evaluation is prepared as part of his responsibility to manage the process by which the Invesco Funds’ proposed management fees are negotiated during the annual contract renewal process to ensure they are negotiated in a manner that is at arms’ length and reasonable. In addition to meetings with Invesco Advisers and fund counsel, the independent Trustees also discuss the continuance of the investment advisory agreement and sub-advisory contracts in separate sessions with the Senior Officer and with independent legal counsel.
The Trustees recognized that the advisory fee rates for the Invesco Funds are, in many cases, the result of years of review and negotiation. The Trustees’ deliberations and conclusions in a particular year may be based in part on their deliberations and conclusions regarding these arrangements throughout the year and in prior years. The Trustees’ review and conclusions are based on the comprehensive consideration of all information presented to them and are not the result of any single determinative factor. Moreover, one Trustee may have weighed a particular piece of information or factor differently than another Trustee.
The discussion below is a summary of the Senior Officer’s independent written evaluation with respect to the Fund’s investment advisory agreement as well as a discussion of the material factors and related conclusions that formed the basis for the Board’s approval of the Fund’s investment advisory agreement and sub-advisory contracts. Unless otherwise stated, this information is current as of June 8, 2016, and does not reflect consideration of factors that became known to the Board after that date.
Factors and Conclusions and Summary of Independent Written Fee Evaluation
| A. | Nature, Extent and Quality of Services Provided by Invesco Advisers and the Affiliated Sub-Advisers |
The Board reviewed the advisory services provided to the Fund by Invesco Advisers under the Fund’s investment advisory agreement, the performance of Invesco Advisers in providing these services, and the credentials and experience of the officers and employees of Invesco Advisers who provide these services, including the Fund’s portfolio manager or managers. The Board’s review of the qualifications of Invesco Advisers to provide advisory services included the Board’s consideration of Invesco Advisers’ investment process oversight, independent credit analysis and investment risk management. The Board also considered non-advisory services that Invesco Advisers and its affiliates provide to the Invesco Funds such as various back office support functions, trading operations, internal audit, valuation and legal and compliance.
In determining whether to continue the Fund’s investment advisory agreement, the Board considered the benefits of reapproving an existing relationship and the greater uncertainty that may be associated with entering into a new relationship. The Board concluded that the nature, extent and quality of the services provided to the Fund by Invesco Advisers are appropriate and satisfactory and consistent with the terms of the Fund’s investment advisory agreement.
The Board reviewed the services provided by the Affiliated Sub-Advisers under the sub-advisory contracts and the credentials and experience of the officers and employees of the Affiliated Sub-Advisers who provide these services. The Board noted that the Affiliated Sub-Advisers have offices and personnel that are located in financial centers around the world. As a result, the Board noted that Affiliated Sub-Advisers can provide research and investment analysis on the markets and economies of various countries in which the Fund may invest, make recommendations regarding securities and assist with security trades. The Board concluded that the sub-advisory contracts may benefit the Fund and its shareholders by permitting Invesco Advisers to use the resources and talents of the Affiliated Sub-Advisers in managing the Fund. The Board concluded that the nature, extent and quality of the services provided by the Affiliated Sub-Advisers are appropriate and satisfactory and consistent with the terms of the Fund’s sub-advisory contracts.
The Board considered Fund performance as a relevant factor in considering whether to approve the investment advisory agreement as well as the sub-advisory contracts for the Fund, as Invesco Asset Management (Japan) Limited and Invesco Hong Kong Limited currently manage assets of the Fund.
The Board compared the Fund’s performance during the past one, three and five calendar years to the performance of funds in the Broadridge performance universe and against the Lipper Pacific Region Funds Index. The Board noted that performance of Class A shares of the Fund was in the first quintile of its performance universe for the one and three year periods and the fourth quintile for the five year period (the first quintile being the best performing funds and the fifth quintile being the worst performing funds). The Board noted that performance of Class A shares of the Fund was above the performance of the Index for the one and three year periods and below the performance of the Index for the five year period. Invesco Advisers noted that the portfolio management team is managing to a new index, which has slightly lower exposure to Japan, but that the Fund still has larger exposure to Japan than its peers. The Trustees also reviewed more
23 Invesco Pacific Growth Fund
recent Fund performance and this review did not change their conclusions.
| C. | Advisory and Sub-Advisory Fees |
The Board compared the Fund’s contractual management fee rate to the contractual management fee rates of funds in the Fund’s Broadridge expense group at a common asset level. The Board noted that the contractual management fee rate for Class A shares of the Fund was below the median contractual management fee rate of funds in its expense group. The Board noted that the term “contractual management fee” for funds in the expense group may include both advisory and certain administrative services fees, but that Broadridge does not provide information on a fund by fund basis as to what is included. The Board noted that Invesco Advisers does not separately charge the Invesco Funds for the administrative services included in the term as defined by Broadridge. The Board also reviewed the methodology used by Broadridge in providing expense group information, which includes using each fund’s contractual management fee schedule (including any applicable breakpoints) as reported in the most recent prospectus or statement of additional information for each fund in the expense group.
The Board noted that Invesco Advisers and the Affiliated Sub-Advisers do not manage other mutual funds or client accounts with investment strategies comparable to those of the Fund.
The Board also considered the services provided by the Affiliated Sub-Advisers pursuant to the sub-advisory contracts, as well as the fees payable by Invesco Advisers to the Affiliated Sub-Advisers pursuant to the sub-advisory contracts. The Board noted that Invesco Advisers retains overall responsibility for, and provides services to, sub-advised Invesco Funds, including oversight of the Affiliated Sub-Advisers as well as the additional services described herein other than day-to-day portfolio management. The Board also noted that the sub-advisory fees are not paid directly by the Fund, but rather, are payable by Invesco Advisers to the Affiliated Sub-Advisers.
| D. | Economies of Scale and Breakpoints |
The Board considered the extent to which there are economies of scale in the provision of advisory services to the Fund. The Board also considered whether the Fund benefits from economies of scale through contractual breakpoints in the Fund’s advisory fee schedule. The Board also noted that the Fund shares directly in economies of scale through lower fees charged by third party service providers based on the combined size of the Invesco Funds and other clients advised by Invesco Advisers.
| E. | Profitability and Financial Resources |
The Board reviewed information from Invesco Advisers concerning the costs of the advisory and other services that Invesco Advisers and its affiliates provide to the Fund and the Invesco Funds and the profitability of Invesco Advisers and its affiliates in providing these services. The Board received information from Invesco
Advisers and a report from an independent consultant engaged by the Senior Officer about the methodology used to prepare the profitability information. The Board noted that Invesco Advisers continues to operate at a net profit from services Invesco Advisers and its affiliates provide to the Invesco Funds and the Fund. The Board did not deem the level of profits realized by Invesco Advisers and its affiliates from providing services to the Fund to be excessive given the nature, quality and extent of the services provided. The Board received and accepted information from Invesco Advisers demonstrating that Invesco Advisers and each Affiliated Sub-Adviser are financially sound and have the resources necessary to perform their obligations under the investment advisory agreement and sub-advisory contracts.
| F. | Collateral Benefits to Invesco Advisers and its Affiliates |
The Board considered various other benefits received by Invesco Advisers and its affiliates from the relationship with the Fund, including the fees received for providing transfer agency and distribution services to the Fund. The Board considered comparative information regarding fees charged for these services, including information provided by Broadridge and other independent sources. The Board considered the performance of Invesco Advisers and its affiliates in providing these services and the organizational structure employed to provide these services. The Board also considered that these services are provided to the Fund pursuant to written contracts that are reviewed and approved on an annual basis by the Board; and that the services are required for the operation of the Fund.
The Board considered the benefits realized by Invesco Advisers and the Affiliated Sub-Advisers as a result of portfolio brokerage transactions executed through “soft dollar” arrangements. The Board noted that soft dollar arrangements shift the payment obligation for research services from Invesco Advisers and the Affiliated Sub-Advisers to the Invesco Funds and that the research received may be used with other clients of Invesco Advisers and may reduce Invesco Advisers’ and the Affiliated Sub-Advisers’ expenses. The Board also considered that it receives periodic reports from the Chief Compliance Officer of the Invesco Funds demonstrating that these arrangements are consistent with regulatory requirements. The Board did not deem the soft dollar arrangements to be inappropriate.
The Board considered that the Fund’s uninvested cash and cash collateral from any securities lending arrangements may be invested in money market funds advised by Invesco Advisers pursuant to procedures approved by the Board. The Board noted that Invesco Advisers receives advisory fees from these affiliated money market funds attributable to such investments, although Invesco Advisers has contractually agreed to waive through varying periods the advisory fees payable by the Invesco Funds with respect to
certain investments in the affiliated money market funds. The waiver is in an amount equal to 100% of the net advisory fee Invesco Advisers receives from the affiliated money market funds with respect to the Fund’s investment in the affiliated money market funds of uninvested cash, but not cash collateral. The Board concluded that the amount of advisory fees received by Invesco Advisors from the Fund’s investment of cash collateral from any securities lending arrangements in the affiliated money market funds is fair and reasonable.
The Board also considered the Fund may use an affiliated broker to execute certain trades for the Fund to, among other things, control information leakage, and were advised that such trades would be executed in compliance with rules under the Investment Company Act of 1940, as amended, and consistent with best execution obligations.
24 Invesco Pacific Growth Fund
Trustees and Officers
The address of each trustee and officer is AIM Investment Funds (Invesco Investment Funds) (the “Trust”), 11 Greenway Plaza, Suite 1000, Houston, Texas 77046-1173. The trustees serve for the life of the Trust, subject to their earlier death, incapacitation, resignation, retirement or removal as more specifically provided in the Trust’s organizational documents. Each officer serves for a one year term or until their successors are elected and qualified. Column two below includes length of time served with predecessor entities, if any.
| | | | | | | | |
Name, Year of Birth and
Position(s) Held with the Trust | | Trustee and/
or Officer Since | | Principal Occupation(s)
During Past 5 Years | | Number of
Funds in Fund
Complex
Overseen by
Trustee | | Other Directorship(s)
Held by Trustee During
Past 5 Years |
| Interested Persons | | | | | | | | |
| Martin L. Flanagan1 — 1960 Trustee | | 2007 | | Executive Director, Chief Executive Officer and President, Invesco Ltd. (ultimate parent of Invesco and a global investment management firm); Advisor to the Board, Invesco Advisers, Inc. (formerly known as Invesco Institutional (N.A.), Inc.); Trustee, The Invesco Funds; Vice Chair, Investment Company Institute; and Member of Executive Board, SMU Cox School of Business Formerly: Chairman and Chief Executive Officer, Invesco Advisers, Inc. (registered investment adviser); Director, Chairman, Chief Executive Officer and President, Invesco Holding Company (US) Inc. (formerly IVZ Inc.) (holding company), Invesco Group Services, Inc. (service provider) and Invesco North American Holdings, Inc. (holding company); Director, Chief Executive Officer and President, Invesco Holding Company Limited (parent of Invesco and a global investment management firm); Director, Invesco Ltd.; Chairman, Investment Company Institute and President, Co-Chief Executive Officer, Co-President, Chief Operating Officer and Chief Financial Officer, Franklin Resources, Inc. (global investment management organization) | | 146 | | None |
| Philip A. Taylor2 — 1954 Trustee and Senior Vice President | | 2006 | | Head of the Americas and Senior Managing Director, Invesco Ltd.; Director, Co-Chairman, Co-President and Co-Chief Executive Officer, Invesco Advisers, Inc. (formerly known as Invesco Institutional (N.A.), Inc.) (registered investment adviser); Director, Chairman, Chief Executive Officer and President, Invesco Management Group, Inc. (formerly known as Invesco AIM Management Group, Inc.) (financial services holding company); Director and Chairman, Invesco Investment Services, Inc. (formerly known as Invesco AIM Investment Services, Inc.) (registered transfer agent) Chief Executive Officer, Invesco Corporate Class Inc. (corporate mutual fund company) Director, Chairman and Chief Executive Officer, Invesco Canada Ltd. (formerly known as Invesco Trimark Ltd./Invesco Trimark Ltèe) (registered investment adviser and registered transfer agent); Trustee and Senior Vice President, The Invesco Funds; Director, Invesco Investment Advisers LLC (formerly known as Van Kampen Asset Management). Formerly: Director, Chief Executive Officer and President, Van Kampen Exchange Corp.; President and Principal Executive Officer, The Invesco Funds (other than AIM Treasurer’s Series Trust (Invesco Treasurer’s Series Trust), Short-Term Investments Trust and Invesco Management Trust); Executive Vice President, The Invesco Funds (AIM Treasurer’s Series Trust (Invesco Treasurer’s Series Trust), Short-Term Investments Trust and Invesco Management Trust only); Director and President, INVESCO Funds Group, Inc. (registered investment adviser and registered transfer agent); Director and Chairman, IVZ Distributors, Inc. (formerly known as INVESCO Distributors, Inc.) (registered broker dealer); Director, President and Chairman, Invesco Inc. (holding company), Invesco Canada Holdings Inc. (holding company), Trimark Investments Ltd./Placements Trimark Ltèe and Invesco Financial Services Ltd/Services Financiers Invesco Ltèe; Chief Executive Officer, Invesco Canada Fund Inc. (corporate mutual fund company); Director and Chairman, Van Kampen Investor Services Inc.; Director, Chief Executive Officer and President, 1371 Preferred Inc. (holding company) and Van Kampen Investments Inc.; Director and President, AIM GP Canada Inc. (general partner for limited partnerships) and Van Kampen Advisors, Inc.; Director and Chief Executive Officer, Invesco Trimark Dealer Inc. (registered broker dealer); Director, Invesco Distributors, Inc. (formerly known as Invesco AIM Distributors, Inc.) (registered broker dealer); Manager, Invesco PowerShares Capital Management LLC; Director, Chief Executive Officer and President, Invesco Advisers, Inc.; Director, Chairman, Chief Executive Officer and President, Invesco AIM Capital Management, Inc.; President, Invesco Trimark Dealer Inc. and Invesco Trimark Ltd./Invesco Trimark Ltèe; Director and President, AIM Trimark Corporate Class Inc. and AIM Trimark Canada Fund Inc.; Senior Managing Director, Invesco Holding Company Limited; Director and Chairman, Fund Management Company (former registered broker dealer); President and Principal Executive Officer, The Invesco Funds (AIM Treasurer’s Series Trust (Invesco Treasurer’s Series Trust), and Short-Term Investments Trust only); President, AIM Trimark Global Fund Inc. and AIM Trimark Canada Fund Inc. | | 146 | | None |
| 1 | Mr. Flanagan is considered an interested person (within the meaning of Section 2(a)(19) of the 1940 Act) of the Trust because he is an officer of the Adviser to the Trust, and an officer and a director of Invesco Ltd., ultimate parent of the Adviser. |
| 2 | Mr. Taylor is considered an interested person (within the meaning of Section 2(a)(19) of the 1940 Act) of the Trust because he is an officer and a director of the Adviser. |
T-1 Invesco Pacific Growth Fund
Trustees and Officers—(continued)
| | | | | | | | |
Name, Year of Birth and
Position(s) Held with the Trust | | Trustee and/
or Officer Since | | Principal Occupation(s) During Past 5 Years | | Number of
Funds in Fund
Complex
Overseen by
Trustee | | Other Directorship(s)
Held by Trustee During
Past 5 Years |
| Independent Trustees | | | | | | | | |
Bruce L. Crockett — 1944 Trustee and Chair | | 2003 | | Chairman, Crockett Technologies Associates (technology consulting company) Formerly: Director, Captaris (unified messaging provider); Director, President and Chief Executive Officer, COMSAT Corporation; Chairman, Board of Governors of INTELSAT (international communications company); ACE Limited (insurance company); Independent Directors Council and Investment Company Institute | | 146 | | ALPS (Attorneys Liability Protection Society) (insurance company) and Globe Specialty Metals, Inc. (metallurgical company); Member of the Audit Committee, Ferroglobe PLC and Investment Company Institute; Member of the Executive Committee and Chair of the Governance Committee, Independent Directors Council |
David C. Arch — 1945 Trustee | | 2010 | | Chairman of Blistex Inc., a consumer health care products manufacturer | | 146 | | Board member of the Illinois Manufacturers’ Association; Member of the Board of Visitors, Institute for the Humanities, University of Michigan |
James T. Bunch — 1942 Trustee | | 2000 | | Managing Member, Grumman Hill Group LLC (family office/private equity investments) Formerly: Chairman of the Board, Denver Film Society, Chairman of the Board of Trustees, Evans Scholarship Foundation; Chairman, Board of Governors, Western Golf Association | | 146 | | Trustee, Evans Scholarship Foundation |
Albert R. Dowden — 1941 Trustee | | 2003 | | Director of a number of public and private business corporations, including Nature’s Sunshine Products, Inc. Formerly: Director, The Boss Group, Ltd. and Reich & Tang Funds (5 portfolios) (registered investment company); Director, Homeowners of America Holding Corporation/Homeowners of America Insurance Company (property casualty company); Director, Continental Energy Services, LLC (oil and gas pipeline service); Director, CompuDyne Corporation (provider of product and services to the public security market) and Director, Annuity and Life Re (Holdings), Ltd. (reinsurance company); Director, President and Chief Executive Officer, Volvo Group North America, Inc.; Senior Vice President, AB Volvo; Director of various public and private corporations; Chairman, DHJ Media, Inc.; Director, Magellan Insurance Company; and Director, The Hertz Corporation, Genmar Corporation (boat manufacturer), National Media Corporation; Advisory Board of Rotary Power International (designer, manufacturer, and seller of rotary power engines); and Chairman, Cortland Trust, Inc. (registered investment company) | | 146 | | Director of Nature’s Sunshine Products, Inc. |
Jack M. Fields — 1952 Trustee | | 2003 | | Chief Executive Officer, Twenty First Century Group, Inc. (government affairs company); and Discovery Learning Alliance (non-profit) Formerly: Owner and Chief Executive Officer, Dos Angeles Ranch L.P. (cattle, hunting, corporate entertainment); Director, Insperity, Inc. (formerly known as Administaff); Chief Executive Officer, Texana Timber LP (sustainable forestry company); Director of Cross Timbers Quail Research Ranch (non-profit); and member of the U.S. House of Representatives | | 146 | | None |
Eli Jones — 1961 Trustee | | 2016 | | Professor and Dean, Mays Business School — Texas A&M University Formerly: Professor and Dean, Walton College of Business, University of Arkansas and E.J. Ourso College of Business, Louisiana State University and Director, Arvest Bank | | 146 | | Director of Insperity, Inc. (formerly known as Administaff) |
Prema Mathai-Davis — 1950 Trustee | | 2003 | | Retired. Formerly: Chief Executive Officer, YWCA of the U.S.A. | | 146 | | None |
Larry Soll — 1942 Trustee | | 1997 | | Retired. Formerly: Chairman, Chief Executive Officer and President, Synergen Corp. (a biotechnology company) | | 146 | | None |
Raymond Stickel, Jr. — 1944 Trustee | | 2005 | | Retired. Formerly: Director, Mainstay VP Series Funds, Inc. (25 portfolios) and Partner, Deloitte & Touche | | 146 | | None |
Robert C. Troccoli — 1949 Trustee | | 2016 | | Adjunct Professor, University of Denver — Daniels College of Business Formerly: Senior Partner, KPMG LLP | | 146 | | None |
T-2 Invesco Pacific Growth Fund
Trustees and Officers—(continued)
| | | | | | | | |
Name, Year of Birth and
Position(s) Held with the Trust | | Trustee and/
or Officer Since | | Principal Occupation(s) During Past 5 Years | | Number of
Funds in Fund
Complex
Overseen by
Trustee | | Other Directorship(s)
Held by Trustee During
Past 5 Years |
| Independent Trustees—(continued) |
Suzanne H. Woolsey — 1941 Trustee | | 2014 | | Retired. Formerly: Chief Executive Officer of Woolsey Partners LLC | | 146 | | Director, SunShare LLC; Trustee, Ocean Conservancy; Emeritus Chair of the Board of Trustees of the Institute for Defense Analyses and of Colorado College; Trustee, Chair, Business and Finance Committee of California Institute of Technology; Prior to 2014, Director of Fluor Corp.; Prior to 2010, Trustee of the German Marshall Fund of the United States; Prior to 2010, Trustee of the Rocky Mountain Institute |
| Other Officers | | | | | | | | |
Sheri Morris — 1964 President, Principal Executive Officer and Treasurer | | 2003 | | President, Principal Executive Officer and Treasurer, The Invesco Funds; Vice President, Invesco Advisers, Inc. (formerly known as Invesco Institutional (N.A.), Inc.) (registered investment adviser); and Vice President, PowerShares Exchange-Traded Fund Trust, PowerShares Exchange-Traded Fund Trust II, PowerShares India Exchange-Traded Fund Trust, PowerShares Actively Managed Exchange-Traded Fund Trust, and PowerShares Actively Managed Exchange-Traded Commodity Fund Trust Formerly: Vice President and Principal Financial Officer, The Invesco Funds; Vice President, Invesco AIM Advisers, Inc., Invesco AIM Capital Management, Inc. and Invesco AIM Private Asset Management, Inc.; Assistant Vice President and Assistant Treasurer, The Invesco Funds and Assistant Vice President, Invesco Advisers, Inc., Invesco AIM Capital Management, Inc. and Invesco AIM Private Asset Management, Inc.; and Treasurer, PowerShares Exchange-Traded Fund Trust, PowerShares Exchange-Traded Fund Trust II, PowerShares India Exchange-Traded Fund Trust and PowerShares Actively Managed Exchange-Traded Fund Trust | | N/A | | N/A |
Russell C. Burk — 1958 Senior Vice President and Senior Officer | | 2005 | | Senior Vice President and Senior Officer, The Invesco Funds | | N/A | | N/A |
John M. Zerr — 1962 Senior Vice President, Chief Legal Officer and Secretary | | 2006 | | Director, Senior Vice President, Secretary and General Counsel, Invesco Management Group, Inc. (formerly known as Invesco AIM Management Group, Inc.; Senior Vice President, Invesco Advisers, Inc. (formerly known as Invesco Institutional (N.A.), Inc.) (registered investment adviser); Senior Vice President and Secretary, Invesco Distributors, Inc. (formerly known as Invesco AIM Distributors, Inc.); Director, Vice President and Secretary, Invesco Investment Services, Inc. (formerly known as Invesco AIM Investment Services, Inc.) Senior Vice President, Chief Legal Officer and Secretary, The Invesco Funds; Managing Director, Invesco PowerShares Capital Management LLC; Director, Secretary and General Counsel, Invesco Investment Advisers LLC (formerly known as Van Kampen Asset Management); Secretary and General Counsel, Invesco Capital Markets, Inc. (formerly known as Van Kampen Funds Inc.) and Chief Legal Officer, PowerShares Exchange-Traded Fund Trust, PowerShares Exchange-Traded Fund Trust II, PowerShares India Exchange-Traded Fund Trust, PowerShares Actively Managed Exchange-Traded Fund Trust, and PowerShares Actively Managed Exchange-Traded Commodity Fund Trust Formerly: Director, Secretary, General Counsel and Senior Vice President, Van Kampen Exchange Corp.; Director, Vice President and Secretary, IVZ Distributors, Inc. (formerly known as INVESCO Distributors, Inc.); Director and Vice President, INVESCO Funds Group, Inc.; Director and Vice President, Van Kampen Advisors Inc.; Director, Vice President, Secretary and General Counsel, Van Kampen Investor Services Inc.; Director, Invesco Distributors, Inc. (formerly known as Invesco AIM Distributors, Inc.); Director, Senior Vice President, General Counsel and Secretary, Invesco AIM Advisers, Inc. and Van Kampen Investments Inc.; Director, Vice President and Secretary, Fund Management Company; Director, Senior Vice President, Secretary, General Counsel and Vice President, Invesco AIM Capital Management, Inc.; Chief Operating Officer and General Counsel, Liberty Ridge Capital, Inc. (an investment adviser); Vice President and Secretary, PBHG Funds (an investment company) and PBHG Insurance Series Fund (an investment company); Chief Operating Officer, General Counsel and Secretary, Old Mutual Investment Partners (a broker-dealer); General Counsel and Secretary, Old Mutual Fund Services (an administrator) and Old Mutual Shareholder Services (a shareholder servicing center); Executive Vice President, General Counsel and Secretary, Old Mutual Capital, Inc. (an investment adviser); and Vice President and Secretary, Old Mutual Advisors Funds (an investment company) | | N/A | | N/A |
T-3 Invesco Pacific Growth Fund
Trustees and Officers—(continued)
| | | | | | | | |
Name, Year of Birth and
Position(s) Held with the Trust | | Trustee and/
or Officer Since | | Principal Occupation(s) During Past 5 Years | | Number of
Funds in Fund
Complex
Overseen by
Trustee | | Other Directorship(s)
Held by Trustee During
Past 5 Years |
| Other Officers—(continued) | | | | | | | | |
| Karen Dunn Kelley — 1960 Senior Vice President | | 2003 | | Senior Managing Director, Investments, Invesco Ltd.; Director, Co-President, Co-Chief Executive Officer, and Co-Chairman, Invesco Advisers, Inc. (formerly known as Invesco Institutional (N.A.), Inc.) (registered investment adviser); Chairman and Director, Invesco Senior Secured Management, Inc.; Senior Vice President, Invesco Management Group, Inc. (formerly known as Invesco AIM Management Group, Inc.); Executive Vice President, Invesco Distributors, Inc. (formerly known as Invesco AIM Distributors, Inc.); Director, Invesco Mortgage Capital Inc. and Invesco Management Company Limited; Senior Vice President, The Invesco Funds Formerly: Vice President, The Invesco Funds (other than AIM Treasurer’s Series Trust (Invesco Treasurer’s Series Trust), Short-Term Investments Trust and Invesco Management Trust); and President and Principal Executive Officer, The Invesco Funds (AIM Treasurer’s Series Trust (Invesco Treasurer’s Series Trust), Short-Term Investments Trust and Invesco Management Trust only); Director and President, INVESCO Asset Management (Bermuda) Ltd., Director, INVESCO Global Asset Management DAC (formerly known as INVESCO Global Asset Management Limited) and INVESCO Management S.A.; Senior Vice President, Van Kampen Investments Inc. and Invesco Advisers, Inc. (formerly known as Invesco Institutional (N.A.), Inc.) (registered investment adviser); Director and President, Fund Management Company; Chief Cash Management Officer, Director of Cash Management, Senior Vice President, and Managing Director, Invesco AIM Capital Management, Inc.; Director of Cash Management, Senior Vice President, and Vice President, Invesco Advisers, Inc. and Vice President, The Invesco Funds (AIM Treasurer’s Series Trust (Invesco Treasurer’s Series Trust), and Short-Term Investments Trust only) | | N/A | | N/A |
Kelli Gallegos — 1970 Vice President, Principal Financial Officer and Assistant Treasurer | | 2008 | | Vice President, Principal Financial Officer and Assistant Treasurer, The Invesco Funds; Assistant Treasurer, Invesco PowerShares Capital Management LLC, PowerShares Exchange-Traded Fund Trust, PowerShares Exchange-Traded Fund Trust II, PowerShares India Exchange-Traded Fund Trust, PowerShares Actively Managed Exchange-Traded Fund Trust, and PowerShares Actively Managed Exchange-Traded Commodity Fund Trust Formerly: Assistant Vice President, The Invesco Funds | | N/A | | N/A |
Tracy Sullivan — 1962 Vice President, Chief Tax Officer and Assistant Treasurer | | 2008 | | Vice President, Chief Tax Officer and Assistant Treasurer, The Invesco Funds; Assistant Treasurer, Invesco PowerShares Capital Management LLC, PowerShares Exchange-Traded Fund Trust, PowerShares Exchange-Traded Fund Trust II, PowerShares India Exchange-Traded Fund Trust, PowerShares Actively Managed Exchange-Traded Fund Trust, and PowerShares Actively Managed Exchange-Traded Commodity Fund Trust Formerly: Assistant Vice President, The Invesco Funds | | N/A | | N/A |
Crissie M. Wisdom — 1969 Anti-Money Laundering Compliance Officer | | 2013 | | Anti-Money Laundering Compliance Officer, Invesco Advisers, Inc. (formerly known as Invesco Institutional (N.A.), Inc.) (registered investment adviser), Invesco Capital Markets, Inc. (formerly known as Van Kampen Funds Inc.), Invesco Distributors, Inc., Invesco Investment Services, Inc., Invesco Management Group, Inc., The Invesco Funds, and PowerShares Exchange-Traded Fund Trust, PowerShares Exchange-Traded Fund Trust II, PowerShares India Exchange-Traded Fund Trust, PowerShares Actively Managed Exchange-Traded Fund Trust and PowerShares Actively Managed Exchange-Traded Commodity Fund Trust; Anti-Money Laundering Compliance Officer and Bank Secrecy Act Officer, INVESCO National Trust Company and Invesco Trust Company; and Fraud Prevention Manager and Controls and Risk Analysis Manager for Invesco Investment Services, Inc. Formerly: Anti-Money Laundering Compliance Officer, Van Kampen Exchange Corp. | | N/A | | N/A |
Robert R. Leveille — 1969 Chief Compliance Officer | | 2016 | | Chief Compliance Officer, Invesco Advisers, Inc. (registered investment adviser); and Chief Compliance Officer, The Invesco Funds Formerly: Chief Compliance Officer, Putnam Investments and the Putnam Funds | | N/A | | N/A |
The Statement of Additional Information of the Trust includes additional information about the Fund’s Trustees and is available upon request, without charge, by calling 1.800.959.4246. Please refer to the Fund’s Statement of Additional Information for information on the Fund’s sub-advisers.
| | | | | | |
Office of the Fund 11 Greenway Plaza, Suite 1000 Houston, TX 77046-1173 | | Investment Adviser Invesco Advisers, Inc. 1555 Peachtree Street, N.E. Atlanta, GA 30309 | | Distributor Invesco Distributors, Inc. 11 Greenway Plaza, Suite 1000 Houston, TX 77046-1173 | | Auditors PricewaterhouseCoopers LLP 1000 Louisiana Street, Suite 5800 Houston, TX 77002-5678 |
| | | |
| | | | | | |
Counsel to the Fund Stradley Ronon Stevens & Young, LLP 2005 Market Street, Suite 2600 Philadelphia, PA 19103-7018 | | Counsel to the Independent Trustees Goodwin Procter LLP 901 New York Avenue, N.W. Washington, D.C. 20001 | | Transfer Agent Invesco Investment Services, Inc. 11 Greenway Plaza, Suite 1000 Houston, TX 77046-1173 | | Custodian State Street Bank and Trust Company 225 Franklin Street Boston, MA 02110-2801 |
T-4 Invesco Pacific Growth Fund
Explore High-Conviction Investing with Invesco

Invesco mailing information
Send general correspondence to Invesco Investment Services, Inc., P.O. Box 219078, Kansas City, MO 64121-9078.
Important notice regarding delivery of security holder documents
To reduce Fund expenses, only one copy of most shareholder documents may be mailed to shareholders with multiple accounts at the same address (Householding). Mailing of your shareholder documents may be householded indefinitely unless you instruct us otherwise. If you do not want the mailing of these documents to be combined with those for other members of your household, please contact Invesco Investment Services, Inc. at 800 959 4246 or contact your financial institution. We will begin sending you individual copies for each account within 30 days after receiving your request.
Fund holdings and proxy voting information
The Fund provides a complete list of its holdings four times in each fiscal year, at the quarter ends. For the second and fourth quarters, the lists appear in the Fund’s semiannual and annual reports to shareholders. For the first and third quarters, the Fund files the lists with the Securities and Exchange Commission (SEC) on Form N-Q. The most recent list of portfolio holdings is available at invesco.com/completeqtrholdings. Shareholders can also look up the Fund’s Forms N-Q on the SEC website at sec.gov. Copies of the Fund’s Forms N-Q may be reviewed and copied at the SEC Public Reference Room in Washington, D.C. You can obtain information on the operation of the Public Reference Room, including information about duplicating fee charges, by calling 202 551 8090 or 800 732 0330, or by electronic request at the following email address: publicinfo@sec.gov.
The SEC file numbers for the Fund are shown below.
A description of the policies and procedures that the Fund uses to determine how to vote proxies relating to portfolio securities is available without charge, upon request, from our Client Services department at 800 959 4246 or at invesco.com/proxyguidelines. The information is also available on the SEC website, sec.gov.
| | | | | | |
Information regarding how the Fund voted proxies related to its portfolio securities during the most recent 12-month period ended June 30 is available at invesco.com/proxysearch. The information is also available on the SEC website, sec.gov. Invesco Advisers, Inc. is an investment adviser; it provides investment advisory services to individual and institutional clients and does not sell securities. Invesco Distributors, Inc. is the US distributor for Invesco Ltd.’s retail mutual funds, exchange-traded funds and institutional money market funds. Both are wholly owned, indirect subsidiaries of Invesco Ltd. | |  |
| | | |
| SEC file numbers: 811-05426 and 033-19338 | | MS-PGRO-AR-1 | | Invesco Distributors, Inc. | | |
| | | | |
| | |
 | | Annual Report to Shareholders | | October 31, 2016 |
| | |
| | Invesco Select Companies Fund |
| | Nasdaq: |
| | A: ATIAX ∎ B: ATIBX ∎ C: ATICX ∎ R: ATIRX ∎ Y: ATIYX ∎ R5: ATIIX |

Letters to Shareholders
| | |

Philip Taylor | | Dear Shareholders: This annual report includes information about your Fund, including performance data and a complete list of its investments as of the close of the reporting period. Inside is a discussion of how your Fund was managed and the factors that affected its performance during the reporting period. In December 2015, the US Federal Reserve raised short-term interest rates for the first time since 2006, signaling its belief that the economy was likely to continue strengthening. Indeed, throughout the reporting period, US economic data were generally positive and the economy expanded at a moderate rate – but there were some bumps along the road. Job growth in May 2016 was very weak, but it was followed by strong increases in nonfarm payrolls in June and July. Increased concerns about global economic weakness caused US stock market indexes to |
| sink at the start of calendar year 2016, but they eventually recovered; they sank again following the UK’s decision to leave the European Union, but then quickly recovered and reached record highs later in the summer. Strong demand for income-producing investments, particularly those perceived to be lower risk, benefited bonds as well as dividend-paying stocks for much of the reporting period. While economic news in the US was generally positive, news overseas was less upbeat. The European Central Bank, and central banks in China and Japan – as well as other countries – maintained extraordinarily accommodative monetary policies in response to economic weakness. As the fiscal year drew to a close, uncertainty about the outcome of the US presidential election resulted in increased market volatility; the surprise outcome after the close of the reporting period suggested that market volatility may continue for some time to come. |
Short-term market volatility can prompt some investors to abandon their investment plans – and can cause others to settle for average results. The investment professionals at Invesco, in contrast, invest with high conviction, take a long-term perspective and have a passion to exceed. Invesco’s pure focus on investment management eliminates possible distractions and means that there are no competing lines of business for us to support. Just as important, we embrace a variety of investment strategies, asset classes and geographies – because we know that no single investment approach meets the diverse needs of all of our clients. We manage all our investment approaches with a passion to exceed. All our investment teams have a highly disciplined, long-term investing style that eliminates short-term decision-making. Of course, investing with high conviction can’t guarantee a profit or ensure success; no investment strategy can. To learn more about how we invest with high conviction, visit invesco.com/HighConviction.
You, too, can invest with high conviction by maintaining a long-term investment perspective and by working with your financial adviser on a regular basis. During periods of short-term market volatility or uncertainty, your financial adviser can keep you focused on your long-term investment goals – a new home, a child’s college education or a secure retirement. He or she also can share research about the economy, the markets and individual investment options.
Visit our website for more information on your investments
Our website, invesco.com/us, offers a wide range of market insights and investment perspectives. On the website, you’ll find detailed information about our funds, including performance, holdings and portfolio manager commentaries. You can access information about your account by completing a simple, secure online registration. Click on the “Need to register” link in the “Account Access” box on our homepage to get started.
In addition to the resources accessible on our website and through our mobile app, you can obtain timely updates to help you stay informed about the markets, the economy and investing by connecting with Invesco on Twitter, LinkedIn or Facebook. You can access our blog at blog.invesco.us.com. Our goal is to provide you the information you want, when and where you want it.
Finally, I’m pleased to share with you Invesco’s commitment to both the Principles for Responsible Investment and to considering environmental, social and governance issues in our robust investment process. I invite you to learn more at invesco.com/esg.
Have questions?
For questions about your account, contact an Invesco client services representative at 800 959 4246. For Invesco-related questions or comments, please email me directly at phil@invesco.com.
All of us at Invesco look forward to serving your investment management needs. Thank you for investing with us.
Sincerely,

Philip Taylor
Senior Managing Director, Invesco Ltd.
2 Invesco Select Companies Fund
| | |

Bruce Crockett | | Dear Fellow Shareholders: Among the many important lessons I’ve learned in more than 40 years in a variety of business endeavors is the value of a trusted advocate. As independent chair of the Invesco Funds Board, I can assure you that the members of the Board are strong advocates for the interests of investors in Invesco’s mutual funds. We work hard to represent your interests through oversight of the quality of the investment management services your funds receive and other matters important to your investment, including but not limited to: ∎ Ensuring that Invesco offers a diverse lineup of mutual funds that your financial adviser can use to strive to meet your financial needs as your investment goals change over time. ∎ Monitoring how the portfolio management teams of the Invesco funds are performing in light of changing economic and market conditions. |
∎ Assessing each portfolio management team’s investment performance within the context of the investment strategy described in the fund’s prospectus.
∎ Monitoring for potential conflicts of interests that may impact the nature of the services that your funds receive.
We believe one of the most important services we provide our fund shareholders is the annual review of the funds’ advisory and sub-advisory contracts with Invesco Advisers and its affiliates. This review is required by the Investment Company Act of 1940 and focuses on the nature and quality of the services Invesco provides as the adviser to the Invesco funds and the reasonableness of the fees that it charges for those services. Each year, we spend months carefully reviewing information received from Invesco and a variety of independent sources, such as performance and fee data prepared by Lipper Inc., an independent, third-party firm widely recognized as a leader in its field. We also meet with our independent legal counsel and other independent advisers to review and help us assess the information that we have received. Our goal is to assure that you receive quality investment management services for a reasonable fee.
I trust the measures outlined above provide assurance that you have a worthy advocate when it comes to choosing the Invesco Funds.
As always, please contact me at bruce@brucecrockett.com with any questions or concerns you may have. On behalf of the Board, we look forward to continuing to represent your interests and serving your needs.
Sincerely,

Bruce L. Crockett
Independent Chair
Invesco Funds Board of Trustees
3 Invesco Select Companies Fund
Management’s Discussion of Fund Performance
| | | | |
Performance summary For the fiscal year ended October 31, 2016, Class A shares of Invesco Select Companies Fund (the Fund), at net asset value (NAV), outperformed the Russell 2000 Index, the Fund’s style-specific benchmark. Your Fund’s long-term performance appears later in this report. | |
Fund vs. Indexes Total returns, 10/31/15 to 10/31/16, at net asset value (NAV). Performance shown does not include applicable contingent deferred sales charges (CDSC) or front-end sales charges, which would have reduced performance. | |
Class A Shares | | | 5.22 | % |
Class B Shares | | | 4.36 | |
Class C Shares | | | 4.39 | |
Class R Shares | | | 4.90 | |
Class Y Shares | | | 5.44 | |
Class R5 Shares | | | 5.54 | |
S&P 500 Indexq (Broad Market Index) | | | 4.51 | |
Russell 2000 Indexq (Style-Specific Index) | | | 4.11 | |
Lipper Small-Cap Core Funds Index∎ (Peer Group Index) | | | 4.46 | |
Source(s): qFactSet Research Systems Inc.; ∎Lipper Inc. | | | | |
Market conditions and your Fund
During the fiscal year ended October 31, 2016, the US economy continued to expand. The initial estimate of US gross domestic product (GDP) showed the US economy grew by 2.9% in the third quarter, beating consensus estimates.1 However, annualized GDP is expected to be lower. Employment data were mixed, though the unemployment rate had a surprise uptick from 4.9% in August to 5.0% in September before ending the fiscal year at 4.9%.2 Oil prices traded in a range from the high $20s to the low $50s during the reporting period.3
The US Federal Reserve (the Fed) raised interest rates in December 2015 – its first increase since 2006 – but that was its only increase during the reporting period. Major US stock market indexes posted gains for the reporting period, but they were fairly volatile. Stocks began
calendar year 2016 on a negative note, driven by investor concerns about economic weakness in China, falling oil prices and uncertainty over Fed policy, including rumors of possible negative interest rates in the US. Markets recovered in late February and posted gains until June when UK voters opted to leave the European Union, sending markets sharply lower once again. Markets again recovered, and major US equity indexes hit record highs during the summer.4 In this environment, investors generally favored the perceived safety of government bonds and more defensive, dividend-paying equities often found in the telecommunication services, utilities and consumer staples sectors.
Before we discuss the Fund’s results during the fiscal year, it is helpful to briefly explain how we manage the Fund for shareholders. We view ourselves as business people buying businesses, and we consider the purchase of a stock as an
ownership interest in a business. We strive to develop a proprietary view of a business through in-depth, fundamental research that includes careful financial statement analysis and meetings with company management. We then seek to purchase businesses whose stock prices are below what we have calculated to be the true value of the company based on its future free cash flows.
Our investment approach focuses on individual businesses rather than market sectors. Therefore, your Fund has little in common with sector weightings of various market indexes. However, if we were to broadly categorize businesses with which we had the most success during the fiscal year, our investments in select information technology (IT) and energy stocks were the largest contributors to Fund performance. Select holdings in the financials and energy sectors were among the largest detractors. Our avoidance of the utilities and consumer staples sectors also hurt the Fund’s relative performance, as these were some of the best-performing sectors in the Russell 2000 Index for the fiscal year.
IT sector holding TiVo (formerly Rovi) was the largest contributor to the Fund’s absolute performance for the fiscal year. TiVo is focused on revolutionizing the digital entertainment landscape by delivering solutions that enable consumers to intuitively connect to new entertainment from many sources and locations. TiVo holds over 5,000 issued or pending patents and patent applications worldwide. An example of the company’s technology is the TV Guide, a segment where TiVo has a 100% market share and 40% margins. Over the long term, we believe the growth opportunity of TiVo stems from sales increases from higher-margin, internally-developed guides and the sale
| | | | | | |
| Portfolio Composition | |
By sector | | | % of total net assets | |
| | | | |
Information Technology | | | 33.4 | % |
| Consumer Discretionary | | | 16.3 | |
| Industrials | | | 15.6 | |
| Health Care | | | 10.2 | |
| Financials | | | 8.7 | |
| Energy | | | 5.9 | |
Materials | | | 3.1 | |
Telecommunication Services | | | 2.2 | |
Money Market Funds | | | | |
| Plus Other Assets Less Liabilities | | | 4.6 | |
| | | | |
| Top 10 Equity Holdings* |
| | % of total net assets |
| | | | | | |
| | |
| 1. | | CommScope Holding Co., Inc. | | | 6.3 | % |
| 2. | | Booz Allen Hamilton Holding Corp. | | | 6.0 | |
| 3. | | Encore Capital Group, Inc. | | | 5.8 | |
| 4. | | Microsemi Corp. | | | 5.7 | |
| 5. | | America’s Car-Mart, Inc. | | | 4.9 | |
| 6. | | Spirit Airlines Inc. | | | 4.9 | |
| 7. | | GasLog Ltd. | | | 4.8 | |
| 8. | | Charles River Laboratories International, Inc. | | | 4.6 | |
| 9. | | John Wiley & Sons, Inc.-Class A | | | 4.5 | |
| 10. | | Liberty Broadband Corp.-Class A | | | 4.5 | |
| | | | |
Total Net Assets | | | $550.6 million | |
| |
| Total Number of Holdings* | | | 28 | |
The Fund’s holdings are subject to change, and there is no assurance that the Fund will continue to hold any particular security.
*Excluding money market fund holdings.
Data presented here are as of October 31, 2016.
4 Invesco Select Companies Fund
of ancillary services. The company’s share price rose over the reporting period as TiVo signed a major customer, which means that currently nine of the top 10 US TV service providers are licensing its guide patents. As litigation continues with the remaining TV service provider, we believe the probability of a licensing contract is high.
Energy sector holding GasLog was also a large contributor to the Fund’s absolute performance during the fiscal year. GasLog is a merchant marine shipper of liquefied natural gas (LNG). The majority of the company’s ships have firm contracts with strategic, financially-strong customers. The contracts provide a steady cash flow with five-, seven- or 10-year terms. The company plays an important part in LNG transportation from low-cost producing countries to high-demand countries. The ships are modern and powered by tri-fuel diesel engines that enjoy a 30% cost savings compared to the existing fleet. The company’s management team is both strategic and patient, and has a large personal ownership in the company. The company’s stock price rose as there was a recovery in the day rate for LNG carriers. Longer term, we believe natural gas is set to gain market share versus other fossil fuels due to its relative cleanliness, lower cost and extremely long reserve life.
Financials sector holding Encore Capital Group was the largest detractor from absolute Fund performance for the fiscal year. Encore Capital Group is a leading global provider of debt recovery. The company purchases portfolios of defaulted credit at pennies on the dollar. It seeks repayment that amounts to multiple that of its acquisition costs. The competitive advantage of the business is that it is one of the largest debt recovery companies in the US. Therefore, the company has scale and is able to meet the regulatory needs of its clients, and has the infrastructure built to be successful in this space. Given its success in the US, the company has begun to expand internationally, which should benefit the company in the long term. Shares of the company declined during the fiscal year due to industry uncertainty and a changing regulatory environment.
Energy sector holding Ultra Petroleum was also a large detractor from the Fund’s absolute performance. Ultra Petroleum is a low-cost natural gas producer in the US. The company’s share price declined
during the reporting period due to increased balance sheet risk that resulted from low commodity prices that occurred throughout 2015 and in early 2016. Ultra Petroleum filed for bankruptcy protection in May of 2016 and we subsequently sold our position in the company.
During the fiscal year, we made some new investments and added to some of our existing holdings during periods of market volatility, which reduced the Fund’s cash position. We also sold several holdings based on valuations and other factors.
We continued to focus on finding quality businesses trading at attractive values relative to what we believe are their long-term prospects. In contrast, the market is often driven by short-term events or outlooks in both good times and bad. Market volatility during the reporting period allowed us to take advantage of investment opportunities we believe may benefit the Fund in the long term.
While we can never predict future Fund performance, we pledge to you that we will adhere to our discipline of being business people who buy businesses – and we will continually strive to upgrade the quality of your Fund’s portfolio.
As always, we thank you for your investment in Invesco Select Companies Fund and for sharing our long-term investment perspective.
1 Source: Bureau of Economic Analysis
2 Source: Bureau of Labor Statistics
3 Source: Thompson-Reuters
4 Source: Reuters
The views and opinions expressed in management’s discussion of Fund performance are those of Invesco Advisers, Inc. These views and opinions are subject to change at any time based on factors such as market and economic conditions. These views and opinions may not be relied upon as investment advice or recommendations, or as an offer for a particular security. The information is not a complete analysis of every aspect of any market, country, industry, security or the Fund. Statements of fact are from sources considered reliable, but Invesco Advisers, Inc. makes no representation or warranty as to their completeness or accuracy. Although historical performance is no guarantee of future results, these insights may help you understand our investment management philosophy.
See important Fund and, if applicable, index disclosures later in this report.

Rob Mikalachki
Chartered Financial Analyst, Portfolio Manager, is lead manager of Invesco Select Companies Fund. He joined Invesco in 1999. Mr. Mikalachki earned a business degree from Wilfrid Laurier University.

Virginia Au
Chartered Financial Analyst, Portfolio Manager, is manager of Invesco Select Companies Fund. She joined Invesco in 2006. Ms. Au earned a Bachelor of Commerce degree in finance from The University of British Columbia.

Jason Whiting
Chartered Financial Analyst, Portfolio Manager, is manager of Invesco Select Companies Fund. He joined Invesco in 2003. Mr. Whiting earned a BBA from Wilfrid Laurier University.
5 Invesco Select Companies Fund
Your Fund’s Long-Term Performance
Results of a $10,000 Investment - Oldest Share Class(es)
Fund and index data from 10/31/06
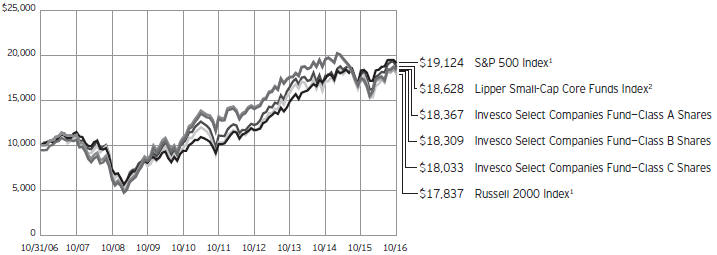
1 Source: FactSet Research Systems Inc.
2 Source: Lipper Inc.
Past performance cannot guarantee comparable future results.
The data shown in the chart include reinvested distributions, applicable sales charges and Fund expenses including management fees. Results for Class B shares are calculated as if a hypothetical
shareholder had liquidated his entire investment in the Fund at the close of the reporting period and paid the contingent deferred sales charges, if applicable. Index results include reinvested dividends, but they do not reflect sales charges. Performance of the peer group,
if applicable, reflects fund expenses and management fees; performance of a market index does not. Performance shown in the chart and table(s) does not reflect deduction of taxes a shareholder would pay on Fund distributions or sale of Fund shares.
continued from page 8
∎ Value investing style risk. A value investing style subjects the Fund to the risk that the valuations never improve or that the returns on value equity securities are less than returns on other styles of investing or the overall stock market.
About indexes used in this report
| ∎ | | The S&P 500® Index is an unmanaged index considered representative of the US stock market. |
| ∎ | | The Russell 2000® Index is an unmanaged index considered representative of small-cap stocks. The Russell 2000 Index is a trademark/service mark of the Frank Russell Co. Russell® is a trademark of the Frank Russell Co. |
| ∎ | | The Lipper Small-Cap Core Funds Index is an unmanaged index considered representative of small-cap core funds tracked by Lipper. |
| ∎ | | The Fund is not managed to track the performance of any particular index, including the index(es) described here, and consequently, the performance of the Fund may deviate significantly from the performance of the index(es). |
| ∎ | | A direct investment cannot be made in an index. Unless otherwise indicated, index results include reinvested dividends, and they do not reflect sales charges. Performance of the peer group, if applicable, reflects fund expenses; performance of a market index does not. |
Other information
| ∎ | | The returns shown in management’s discussion of Fund performance are based on net asset values (NAVs) calculated for shareholder transactions. Generally accepted accounting principles require adjustments to be made to |
| | | the net assets of the Fund at period end for financial reporting purposes, and as such, the NAVs for shareholder transactions and the returns based on those NAVs may differ from the NAVs and returns reported in the Financial Highlights. |
| ∎ | | Industry classifications used in this report are generally according to the Global Industry Classification Standard, which was developed by and is the exclusive property and a service mark of MSCI Inc. and Standard & Poor’s. |
6 Invesco Select Companies Fund
| | | | |
Average Annual Total Returns | |
As of 10/31/16, including maximum applicable sales charges | |
| | | | |
| |
Class A Shares | | | | |
Inception (11/4/03) | | | 8.88 | % |
10 Years | | | 6.27 | |
5 Years | | | 6.09 | |
1 Year | | | -0.57 | |
| |
Class B Shares | | | | |
Inception (11/4/03) | | | 8.87 | % |
10 Years | | | 6.23 | |
5 Years | | | 6.23 | |
1 Year | | | 0.42 | |
| |
Class C Shares | | | | |
Inception (11/4/03) | | | 8.55 | % |
10 Years | | | 6.07 | |
5 Years | | | 6.49 | |
1 Year | | | 3.61 | |
| |
Class R Shares | | | | |
Inception (4/30/04) | | | 9.00 | % |
10 Years | | | 6.61 | |
5 Years | | | 7.02 | |
1 Year | | | 4.90 | |
| |
Class Y Shares | | | | |
10 Years | | | 7.08 | % |
5 Years | | | 7.56 | |
1 Year | | | 5.44 | |
| |
Class R5 Shares | | | | |
Inception (4/30/04) | | | 9.71 | % |
10 Years | | | 7.30 | |
5 Years | | | 7.65 | |
1 Year | | | 5.54 | |
| | | | |
| Average Annual Total Returns | |
| As of 9/30/16, the most recent calendar quarter end, including maximum applicable sales charges | |
| |
Class A Shares | | | | |
Inception (11/4/03) | | | 9.10 | % |
10 Years | | | 6.97 | |
5 Years | | | 8.97 | |
1 Year | | | 6.18 | |
| |
Class B Shares | | | | |
Inception (11/4/03) | | | 9.08 | % |
10 Years | | | 6.93 | |
5 Years | | | 9.12 | |
1 Year | | | 7.26 | |
| |
Class C Shares | | | | |
Inception (11/4/03) | | | 8.77 | % |
10 Years | | | 6.77 | |
5 Years | | | 9.37 | |
1 Year | | | 10.65 | |
| |
Class R Shares | | | | |
Inception (4/30/04) | | | 9.23 | % |
10 Years | | | 7.31 | |
5 Years | | | 9.93 | |
1 Year | | | 12.06 | |
| |
Class Y Shares | | | | |
10 Years | | | 7.78 | % |
5 Years | | | 10.48 | |
1 Year | | | 12.58 | |
| |
Class R5 Shares | | | | |
Inception (4/30/04) | | | 9.94 | % |
10 Years | | | 8.00 | |
5 Years | | | 10.57 | |
1 Year | | | 12.73 | |
Class Y shares incepted on October 3, 2008. Performance shown prior to that date is that of Class A shares and includes the 12b-1 fees applicable to Class A shares.
The performance data quoted represent past performance and cannot guarantee comparable future results; current performance may be lower or higher. Please visit invesco.com/performance for the most recent month-end performance. Performance figures reflect reinvested distributions, changes in net asset value and the effect of the maximum sales charge unless otherwise stated. Investment return and principal value will fluctuate so that you may have a gain or loss when you sell shares.
The net annual Fund operating expense ratio set forth in the most recent Fund prospectus as of the date of this report for Class A, Class B, Class C, Class R, Class Y and Class R5 shares was 1.20%, 1.95%, 1.95%, 1.45%,
0.95% and 0.88%, respectively.1 The total annual Fund operating expense ratio set forth in the most recent Fund prospectus as of the date of this report for Class A, Class B, Class C, Class R, Class Y and Class R5 shares was 1.23%, 1.98%, 1.98%, 1.48%, 0.98% and 0.91%, respectively. The expense ratios presented above may vary from the expense ratios presented in other sections of this report that are based on expenses incurred during the period covered by this report.
Class A share performance reflects the maximum 5.50% sales charge, and Class B and Class C share performance reflects the applicable contingent deferred sales charge (CDSC) for the period involved. The CDSC on Class B shares declines from 5% beginning at the time of purchase to 0% at the beginning of the seventh year. The CDSC on Class C shares is 1% for the first year after purchase. Class R, Class Y and Class R5 shares do not have a
front-end sales charge or a CDSC; therefore, performance is at net asset value.
The performance of the Fund’s share classes will differ primarily due to different sales charge structures and class expenses.
Fund performance reflects any applicable fee waivers and/or expense reimbursements. Had the adviser not waived fees and/or reimbursed expenses currently or in the past, returns would have been lower. See current prospectus for more information.
| 1 | Total annual Fund operating expenses after any contractual fee waivers and/or expense reimbursements by the adviser in effect through at least June 30, 2018. See current prospectus for more information. |
7 Invesco Select Companies Fund
Invesco Select Companies Fund’s investment objective is long-term growth of capital.
∎ Unless otherwise stated, information presented in this report is as of October 31, 2016, and is based on total net assets.
∎ Unless otherwise noted, all data provided by Invesco.
∎ To access your Fund’s reports/prospectus, visit invesco.com/fundreports.
About share classes
| ∎ | | Class B shares may not be purchased for new or additional investments. Please see the prospectus for more information. |
| ∎ | | Class R shares are generally available only to employer sponsored retirement and benefit plans. Please see the prospectus for more information. |
| ∎ | | Class Y shares are available only to certain investors. Please see the prospectus for more information. |
| ∎ | | Class R5 shares are primarily intended for employer sponsored retirement and benefit plans that meet certain standards and for institutional investors. Please see the prospectus for more information. |
Principal risks of investing
in the Fund
| ∎ | | Cash/cash equivalents risk. In rising markets, holding cash or cash equivalents will negatively affect the Fund’s performance relative to its benchmark. |
| ∎ | | Debt securities risk. The prices of debt securities held by the Fund will be affected by changes in interest rates, the creditworthiness of the issuer and other factors. An increase in prevailing interest rates typically causes the value of existing debt securities to fall and often has a greater impact on longer-duration debt securities and higher quality debt securities. Falling interest rates will cause the Fund to reinvest the proceeds of debt securities that have been repaid by the issuer at lower interest rates. Falling interest rates may also reduce the Fund’s distributable income because interest payments on floating rate debt instruments held by the Fund will decline. The Fund could lose money on investments in debt securities if the issuer or borrower fails to meet its obligations to make interest payments and/or to repay principal in a timely manner. Changes in an issuer’s financial strength, the market’s perception of such strength or in the credit rating of the issuer or the security may affect |
| | | the value of debt securities. The Adviser’s credit analysis may fail to anticipate such changes, which could result in buying a debt security at an inopportune time or failing to sell a debt security in advance of a price decline or other credit event. |
| ∎ | | Foreign securities risk. The Fund’s foreign investments may be adversely affected by political and social instability, changes in economic or taxation policies, difficulty in enforcing obligations, decreased liquidity or increased volatility. Foreign investments also involve the risk of the possible seizure, nationalization or expropriation of the issuer or foreign deposits (in which the Fund could lose its entire investments in a certain market) and the possible adoption of foreign governmental restrictions such as exchange controls. Unless the Fund has hedged its foreign securities risk, foreign securities risk also involves the risk of negative foreign currency rate fluctuations, which may cause the value of securities denominated in such foreign currency (or other instruments through which the Fund has exposure to foreign currencies) to decline in value. Currency exchange rates may fluctuate significantly over short periods of time. Currency hedging strategies, if used, are not always successful. |
| ∎ | | Limited number of holdings risk. Because the Fund may hold a more limited number of securities than other funds with a similar investment strategy, a change in the value of these securities could significantly affect the value of your investment in the Fund. |
| ∎ | | Management risk. The Fund is actively managed and depends heavily on the Adviser’s judgment about markets, interest rates or the attractiveness, relative values, liquidity, or potential appreciation of particular investments made for the Fund’s portfolio. The Fund could experience losses if these judgments prove to be incorrect. Additionally, legislative, regulatory, or tax developments |
| | | may adversely affect management of the Fund and, therefore, the ability of the Fund to achieve its investment objective. |
| ∎ | | Market risk. The market values of the Fund’s investments, and therefore the value of the Fund’s shares, will go up and down, sometimes rapidly or unpredictably. Market risk may affect a single issuer, industry or section of the economy, or it may affect the market as a whole. Individual stock prices tend to go up and down more dramatically than those of certain other types of investments, such as bonds. During a general downturn in the financial markets, multiple asset classes may decline in value. When markets perform well, there can be no assurance that specific investments held by the Fund will rise in value. |
| ∎ | | Sector focus risk. The Fund may from time to time invest a significant amount of its assets (i.e. over 25%) in one market sector or group of related industries. In this event, the Fund’s performance will depend to a greater extent on the overall condition of the sector or group of industries and there is increased risk that the Fund will lose significant value if conditions adversely affect that sector or group of industries. |
| ∎ | | Small- and mid-capitalization companies risks. Small- and mid-capitalization companies tend to be more vulnerable to changing market conditions, may have little or no operating history or track record of success, and may have more limited product lines and markets, less experienced management and fewer financial resources than larger companies. These companies’ securities may be more volatile and less liquid than those of more established companies, and their returns may vary, sometimes significantly, from the overall securities market. |
| ∎ | | US government obligations risk. Obligations of US government agencies and authorities receive varying levels of support and may not be backed by the full faith and credit of the US government, which could affect the Fund’s ability to recover should they default. No assurance can be given that the US government will provide financial support to its agencies and authorities if it is not obligated by law to do so. |
| | |
This report must be accompanied or preceded by a currently effective Fund prospectus, which contains more complete information, including sales charges and expenses. Investors should read it carefully before investing. | | |
NOT FDIC INSURED | MAY LOSE VALUE | NO BANK GUARANTEE | | continued on page 6 |
8 Invesco Select Companies Fund
Schedule of Investments(a)
October 31, 2016
| | | | | | | | |
| | | Shares | | | Value | |
Common Stocks–95.38% | |
| Aerospace & Defense–3.63% | |
Cubic Corp. | | | 467,529 | | | $ | 19,963,488 | |
|
| Airlines–4.86% | |
Spirit Airlines Inc.(b) | | | 557,975 | | | | 26,743,742 | |
|
| Aluminum–0.01% | |
Cymat Technologies Ltd. (Canada)(b) | | | 249,750 | | | | 38,172 | |
|
| Apparel, Accessories & Luxury Goods–0.00% | |
Hampshire Group, Ltd.(b)(c) | | | 592,824 | | | | 7,114 | |
|
| Automotive Retail–4.88% | |
America’s Car-Mart, Inc.(b)(c) | | | 657,903 | | | | 26,875,338 | |
|
| Cable & Satellite–4.48% | |
Liberty Broadband Corp.–Class A(b) | | | 380,201 | | | | 24,694,055 | |
|
| Commodity Chemicals–2.50% | |
Chemtrade Logistics Income Fund (Canada) | | | 1,045,784 | | | | 13,761,855 | |
|
| Communications Equipment–10.03% | |
CommScope Holding Co., Inc.(b) | | | 1,136,702 | | | | 34,726,246 | |
Mitel Networks Corp.(b) | | | 3,066,441 | | | | 20,514,490 | |
| | | | | | | | 55,240,736 | |
|
| Consumer Finance–5.76% | |
Encore Capital Group, Inc.(b)(c) | | | 1,597,305 | | | | 31,706,504 | |
|
| Data Processing & Outsourced Services–7.36% | |
Alliance Data Systems Corp.(b) | | | 109,016 | | | | 22,290,502 | |
Global Payments Inc. | | | 251,404 | | | | 18,231,818 | |
| | | | | | | | 40,522,320 | |
|
| Diversified Support Services–3.00% | |
Performant Financial Corp.(b)(c) | | | 5,527,196 | | | | 16,526,316 | |
|
| Education Services–2.47% | |
American Public Education Inc.(b) | | | 675,426 | | | | 13,609,834 | |
|
| Electrical Components & Equipment–4.10% | |
Regal-Beloit Corp. | | | 381,856 | | | | 22,567,690 | |
|
| Health Care Supplies–5.64% | |
Alere, Inc.(b) | | | 369,403 | | | | 16,504,926 | |
Cooper Cos., Inc. (The) | | | 82,635 | | | | 14,547,065 | |
| | | | | | | | 31,051,991 | |
| | | | | | | | |
| | | Shares | | | Value | |
| Integrated Telecommunication Services–2.17% | |
General Communication, Inc.–
Class A(b) | | | 753,654 | | | $ | 11,937,879 | |
|
| IT Consulting & Other Services–6.02% | |
Booz Allen Hamilton Holding Corp. | | | 1,087,737 | | | | 33,143,346 | |
|
| Life Sciences Tools & Services–4.56% | |
Charles River Laboratories International, Inc.(b) | | | 331,067 | | | | 25,121,364 | |
|
| Oil & Gas Equipment & Services–1.00% | |
ION Geophysical Corp.(b)(c) | | | 938,486 | | | | 5,537,067 | |
|
| Oil & Gas Storage & Transportation–4.84% | |
GasLog Ltd. (Monaco) | | | 1,735,410 | | | | 26,638,544 | |
|
| Other Diversified Financial Services–0.00% | |
Brompton Corp. (Canada)(b) | | | 69,374 | | | | 0 | |
|
| Publishing–4.50% | |
John Wiley & Sons, Inc.–Class A | | | 479,820 | | | | 24,758,712 | |
|
| Real Estate Services–2.98% | |
Colliers International Group Inc. (Canada) | | | 471,395 | | | | 16,413,157 | |
|
| Semiconductors–5.72% | |
Microsemi Corp.(b) | | | 747,142 | | | | 31,477,092 | |
|
| Specialty Chemicals–0.59% | |
Axalta Coating Systems Ltd.(b) | | | 128,604 | | | | 3,230,533 | |
|
| Systems Software–4.28% | |
TiVo Corp.(b) | | | 1,186,166 | | | | 23,545,395 | |
Total Common Stocks
(Cost $518,000,408) | | | | 525,112,244 | |
|
Money Market Funds–5.69% | |
Government & Agency Portfolio–Institutional Class, 0.29%(d) | | | 18,805,823 | | | | 18,805,823 | |
Treasury Portfolio–Institutional Class, 0.22%(d) | | | 12,537,216 | | | | 12,537,216 | |
Total Money Market Funds
(Cost $31,343,039) | | | | 31,343,039 | |
TOTAL INVESTMENTS–101.07%
(Cost $549,343,447) | | | | 556,455,283 | |
OTHER ASSETS LESS LIABILITIES–(1.07)% | | | | (5,890,469 | ) |
NET ASSETS–100.00% | | | $ | 550,564,814 | |
Notes to Schedule of Investments:
| (a) | Industry and/or sector classifications used in this report are generally according to the Global Industry Classification Standard, which was developed by and is the exclusive property and a service mark of MSCI Inc. and Standard & Poor’s. |
| (b) | Non-income producing security. |
| (c) | Affiliated company during the period. The Investment Company Act of 1940 defines an “affiliated person” as an issuance in which a fund holds 5% or more of the outstanding voting securities. The Fund has not owned enough of the outstanding voting securities of the issuer to have control (as defined in the Investment Company Act of 1940) of that issuer. The aggregate value of these securities as of October 31, 2016 was $80,652,339, which represented 14.65% of the Fund’s Net Assets. See Note 4. |
| (d) | The money market fund and the Fund are affiliated by having the same investment adviser. The rate shown is the 7-day SEC standardized yield as of October 31, 2016. |
See accompanying Notes to Financial Statements which are an integral part of the financial statements.
9 Invesco Select Companies Fund
Statement of Assets and Liabilities
October 31, 2016
| | | | |
Assets: | |
Investments, at value (Cost $289,717,979) | | $ | 444,459,905 | |
Investments in affiliates, at value (Cost $259,625,468) | | | 111,995,378 | |
Total investments, at value (Cost $549,343,447) | | | 556,455,283 | |
Foreign currencies, at value (Cost $66,416) | | | 66,275 | |
Receivable for: | | | | |
Investments sold | | | 420,651 | |
Fund shares sold | | | 345,369 | |
Dividends | | | 74,325 | |
Investment for trustee deferred compensation and retirement plans | | | 137,657 | |
Other assets | | | 41,179 | |
Total assets | | | 557,540,739 | |
|
Liabilities: | |
Payable for: | | | | |
Investments purchased | | | 3,220,122 | |
Fund shares reacquired | | | 3,083,004 | |
Accrued fees to affiliates | | | 438,803 | |
Accrued trustees’ and officers’ fees and benefits | | | 2,450 | |
Accrued other operating expenses | | | 74,266 | |
Trustee deferred compensation and retirement plans | | | 157,280 | |
Total liabilities | | | 6,975,925 | |
Net assets applicable to shares outstanding | | $ | 550,564,814 | |
|
Net assets consist of: | |
Shares of beneficial interest | | $ | 526,823,942 | |
Undistributed net investment income (loss) | | | (3,138,618 | ) |
Undistributed net realized gain | | | 19,767,938 | |
Net unrealized appreciation | | | 7,111,552 | |
| | | $ | 550,564,814 | |
| | | | |
Net Assets: | |
Class A | | $ | 305,003,029 | |
Class B | | $ | 2,261,449 | |
Class C | | $ | 99,413,221 | |
Class R | | $ | 29,623,022 | |
Class Y | | $ | 81,268,563 | |
Class R5 | | $ | 32,995,530 | |
|
Shares outstanding, $0.01 par value per share,
with an unlimited number of shares authorized: | |
Class A | | | 18,246,004 | |
Class B | | | 154,313 | |
Class C | | | 6,796,920 | |
Class R | | | 1,843,992 | |
Class Y | | | 4,769,937 | |
Class R5 | | | 1,863,607 | |
Class A: | | | | |
Net asset value per share | | $ | 16.72 | |
Maximum offering price per share | | | | |
(Net asset value of $16.72 ¸ 94.50%) | | $ | 17.69 | |
Class B: | | | | |
Net asset value and offering price per share | | $ | 14.65 | |
Class C: | | | | |
Net asset value and offering price per share | | $ | 14.63 | |
Class R: | | | | |
Net asset value and offering price per share | | $ | 16.06 | |
Class Y: | | | | |
Net asset value and offering price per share | | $ | 17.04 | |
Class R5: | | | | |
Net asset value and offering price per share | | $ | 17.71 | |
See accompanying Notes to Financial Statements which are an integral part of the financial statements.
10 Invesco Select Companies Fund
Statement of Operations
For the year ended October 31, 2016
| | | | |
Investment income: | |
Dividends (net of foreign withholding taxes of $147,899) | | $ | 4,354,339 | |
Dividends from affiliates | | | 163,849 | |
Total investment income | | | 4,518,188 | |
| |
Expenses: | | | | |
Advisory fees | | | 4,635,773 | |
Administrative services fees | | | 170,504 | |
Custodian fees | | | 23,267 | |
Distribution fees: | | | | |
Class A | | | 882,610 | |
Class B | | | 28,759 | |
Class C | | | 1,056,525 | |
Class R | | | 176,834 | |
Transfer agent fees — A, B, C, R and Y | | | 1,153,190 | |
Transfer agent fees — R5 | | | 38,231 | |
Trustees’ and officers’ fees and benefits | | | 36,511 | |
Registration and filing fees | | | 86,632 | |
Reports to shareholders | | | 64,823 | |
Professional services fees | | | 46,120 | |
Other | | | 28,849 | |
Total expenses | | | 8,428,628 | |
Less: Fees waived and expense offset arrangement(s) | | | (93,033 | ) |
Net expenses | | | 8,335,595 | |
Net investment income (loss) | | | (3,817,407 | ) |
| |
Realized and unrealized gain (loss) from: | | | | |
Net realized gain (loss) from: | | | | |
Investment securities | | | 22,499,647 | |
Foreign currencies | | | (38,444 | ) |
| | | | 22,461,203 | |
Change in net unrealized appreciation (depreciation) of: | | | | |
Investment securities | | | (2,472,114 | ) |
Foreign currencies | | | (1,258 | ) |
| | | | (2,473,372 | ) |
Net realized and unrealized gain | | | 19,987,831 | |
Net increase in net assets resulting from operations | | $ | 16,170,424 | |
See accompanying Notes to Financial Statements which are an integral part of the financial statements.
11 Invesco Select Companies Fund
Statement of Changes in Net Assets
For the years ended October 31, 2016 and 2015
| | | | | | | | |
| | | 2016 | | | 2015 | |
Operations: | | | | | |
Net investment income (loss) | | $ | (3,817,407 | ) | | $ | (10,676,285 | ) |
Net realized gain | | | 22,461,203 | | | | 159,822,637 | |
Change in net unrealized appreciation (depreciation) | | | (2,473,372 | ) | | | (271,320,461 | ) |
Net increase (decrease) in net assets resulting from operations | | | 16,170,424 | | | | (122,174,109 | ) |
| | |
Distributions to shareholders from net realized gains: | | | | | | | | |
Class A | | | (90,607,514 | ) | | | (71,199,853 | ) |
Class B | | | (852,464 | ) | | | (916,857 | ) |
Class C | | | (27,331,498 | ) | | | (18,752,500 | ) |
Class R | | | (9,286,133 | ) | | | (6,758,426 | ) |
Class Y | | | (25,445,697 | ) | | | (28,688,490 | ) |
Class R5 | | | (9,411,972 | ) | | | (6,188,617 | ) |
Total distributions from net realized gains | | | (162,935,278 | ) | | | (132,504,743 | ) |
| | |
Share transactions–net: | | | | | | | | |
Class A | | | (88,653,328 | ) | | | (140,909,514 | ) |
Class B | | | (960,874 | ) | | | (3,398,328 | ) |
Class C | | | (2,538,965 | ) | | | (17,809,047 | ) |
Class R | | | (7,773,269 | ) | | | (11,731,066 | ) |
Class Y | | | (43,089,014 | ) | | | (104,389,400 | ) |
Class R5 | | | (10,311,968 | ) | | | (1,476,849 | ) |
Net increase (decrease) in net assets resulting from share transactions | | | (153,327,418 | ) | | | (279,714,204 | ) |
Net increase (decrease) in net assets | | | (300,092,272 | ) | | | (534,393,056 | ) |
| | |
Net assets: | | | | | | | | |
Beginning of year | | | 850,657,086 | | | | 1,385,050,142 | |
End of year (includes undistributed net investment income (loss) of $(3,138,618) and $(9,250,127), respectively) | | $ | 550,564,814 | | | $ | 850,657,086 | |
Notes to Financial Statements
October 31, 2016
NOTE 1—Significant Accounting Policies
Invesco Select Companies Fund (the “Fund”) is a series portfolio of AIM Investment Funds (Invesco Investment Funds) (the “Trust”). The Trust is organized as a Delaware statutory trust and is registered under the Investment Company Act of 1940, as amended (the “1940 Act”), as an open-end series management investment company consisting of twenty-two separate series portfolios, each authorized to issue an unlimited number of shares of beneficial interest. The assets, liabilities and operations of each portfolio are accounted for separately. Information presented in these financial statements pertains only to the Fund. Matters affecting each portfolio or class will be voted on exclusively by the shareholders of such portfolio or class.
The Fund’s investment objective is long-term growth of capital.
The Fund currently consists of six different classes of shares: Class A, Class B, Class C, Class R, Class Y and Class R5. Class Y shares are available only to certain investors. Class A shares are sold with a front-end sales charge unless certain waiver criteria are met and under certain circumstances load waived shares may be subject to contingent deferred sales charges (“CDSC”). Class C shares are sold with a CDSC. Class R, Class Y and Class R5 shares are sold at net asset value. Effective November 30, 2010, new or additional investments in Class B shares are no longer permitted. Existing shareholders of Class B shares may continue to reinvest dividends and capital gains distributions in Class B shares until they convert to Class A shares. Also, shareholders in Class B shares will be able to exchange those shares for Class B shares of other Invesco Funds offering such shares until they convert to Class A shares. Generally, Class B shares will automatically convert to Class A shares on or about the month-end, which is at least eight years after the date of purchase. Redemption of Class B shares prior to the conversion date will be subject to a CDSC.
Effective the open of business on October 17, 2016, the Fund re-opened public sales of its shares to all investors.
The following is a summary of the significant accounting policies followed by the Fund in the preparation of its financial statements.
| A. | Security Valuations — Securities, including restricted securities, are valued according to the following policy. |
A security listed or traded on an exchange (except convertible securities) is valued at its last sales price or official closing price as of the close of the customary trading session on the exchange where the security is principally traded, or lacking any sales or official closing price on a particular day, the security may be valued at the closing bid price on that day. Securities traded in the over-the-counter market are valued based on prices furnished by independent pricing services or market makers. When such securities are valued by an independent pricing service they
12 Invesco Select Companies Fund
may be considered fair valued. Futures contracts are valued at the final settlement price set by an exchange on which they are principally traded. Listed options are valued at the mean between the last bid and asked prices from the exchange on which they are principally traded. Options not listed on an exchange are valued by an independent source at the mean between the last bid and asked prices. For purposes of determining net asset value (“NAV”) per share, futures and option contracts generally are valued 15 minutes after the close of the customary trading session of the New York Stock Exchange (“NYSE”).
Investments in open-end and closed-end registered investment companies that do not trade on an exchange are valued at the end-of-day net asset value per share. Investments in open-end and closed-end registered investment companies that trade on an exchange are valued at the last sales price or official closing price as of the close of the customary trading session on the exchange where the security is principally traded.
Debt obligations (including convertible securities) and unlisted equities are fair valued using an evaluated quote provided by an independent pricing service. Evaluated quotes provided by the pricing service may be determined without exclusive reliance on quoted prices, and may reflect appropriate factors such as institution-size trading in similar groups of securities, developments related to specific securities, dividend rate (for unlisted equities), yield (for debt obligations), quality, type of issue, coupon rate (for debt obligations), maturity (for debt obligations), individual trading characteristics and other market data. Debt obligations are subject to interest rate and credit risks. In addition, all debt obligations involve some risk of default with respect to interest and/or principal payments.
Foreign securities’ (including foreign exchange contracts) prices are converted into U.S. dollar amounts using the applicable exchange rates as of the close of the NYSE. If market quotations are available and reliable for foreign exchange-traded equity securities, the securities will be valued at the market quotations. Because trading hours for certain foreign securities end before the close of the NYSE, closing market quotations may become unreliable. If between the time trading ends on a particular security and the close of the customary trading session on the NYSE, events occur that the Adviser determines are significant and make the closing price unreliable, the Fund may fair value the security. If the event is likely to have affected the closing price of the security, the security will be valued at fair value in good faith using procedures approved by the Board of Trustees. Adjustments to closing prices to reflect fair value may also be based on a screening process of an independent pricing service to indicate the degree of certainty, based on historical data, that the closing price in the principal market where a foreign security trades is not the current value as of the close of the NYSE. Foreign securities’ prices meeting the approved degree of certainty that the price is not reflective of current value will be priced at the indication of fair value from the independent pricing service. Multiple factors may be considered by the independent pricing service in determining adjustments to reflect fair value and may include information relating to sector indices, American Depositary Receipts and domestic and foreign index futures. Foreign securities may have additional risks including exchange rate changes, potential for sharply devalued currencies and high inflation, political and economic upheaval, the relative lack of issuer information, relatively low market liquidity and the potential lack of strict financial and accounting controls and standards.
Securities for which market prices are not provided by any of the above methods may be valued based upon quotes furnished by independent sources. The last bid price may be used to value equity securities. The mean between the last bid and asked prices is used to value debt obligations, including corporate loans.
Securities for which market quotations are not readily available or became unreliable are valued at fair value as determined in good faith by or under the supervision of the Trust’s officers following procedures approved by the Board of Trustees. Issuer specific events, market trends, bid/asked quotes of brokers and information providers and other market data may be reviewed in the course of making a good faith determination of a security’s fair value.
The Fund may invest in securities that are subject to interest rate risk, meaning the risk that the prices will generally fall as interest rates rise and, conversely, the prices will generally rise as interest rates fall. Specific securities differ in their sensitivity to changes in interest rates depending on their individual characteristics. Changes in interest rates may result in increased market volatility, which may affect the value and/or liquidity of certain Fund investments.
Valuations change in response to many factors including the historical and prospective earnings of the issuer, the value of the issuer’s assets, general economic conditions, interest rates, investor perceptions and market liquidity. Because of the inherent uncertainties of valuation, the values reflected in the financial statements may materially differ from the value received upon actual sale of those investments.
| B. | Securities Transactions and Investment Income — Securities transactions are accounted for on a trade date basis. Realized gains or losses on sales are computed on the basis of specific identification of the securities sold. Interest income (net of withholding tax, if any) is recorded on the accrual basis from settlement date. Dividend income (net of withholding tax, if any) is recorded on the ex-dividend date. |
The Fund may periodically participate in litigation related to Fund investments. As such, the Fund may receive proceeds from litigation settlements. Any proceeds received are included in the Statement of Operations as realized gain (loss) for investments no longer held and as unrealized gain (loss) for investments still held.
Brokerage commissions and mark ups are considered transaction costs and are recorded as an increase to the cost basis of securities purchased and/or a reduction of proceeds on a sale of securities. Such transaction costs are included in the determination of net realized and unrealized gain (loss) from investment securities reported in the Statement of Operations and the Statement of Changes in Net Assets and the net realized and unrealized gains (losses) on securities per share in the Financial Highlights. Transaction costs are included in the calculation of the Fund’s net asset value and, accordingly, they reduce the Fund’s total returns. These transaction costs are not considered operating expenses and are not reflected in net investment income reported in the Statement of Operations and the Statement of Changes in Net Assets, or the net investment income per share and the ratios of expenses and net investment income reported in the Financial Highlights, nor are they limited by any expense limitation arrangements between the Fund and the investment adviser.
The Fund allocates income and realized and unrealized capital gains and losses to a class based on the relative net assets of each class.
| C. | Country Determination — For the purposes of making investment selection decisions and presentation in the Schedule of Investments, the investment adviser may determine the country in which an issuer is located and/or credit risk exposure based on various factors. These factors include the laws of the country under which the issuer is organized, where the issuer maintains a principal office, the country in which the issuer derives 50% or more of its total revenues and the country that has the primary market for the issuer’s securities, as well as other criteria. Among the other criteria that may be evaluated for making this determination are the country in which the issuer maintains 50% or more of its assets, the type of security, financial guarantees and enhancements, the nature of the collateral and the sponsor organization. Country of issuer and/or credit risk exposure has been determined to be the United States of America, unless otherwise noted. |
13 Invesco Select Companies Fund
| D. | Distributions — Distributions from net investment income and net realized capital gain, if any, are generally declared and paid annually and recorded on the ex-dividend date. The Fund may elect to treat a portion of the proceeds from redemptions as distributions for federal income tax purposes. |
| E. | Federal Income Taxes — The Fund intends to comply with the requirements of Subchapter M of the Internal Revenue Code of 1986, as amended (the “Internal Revenue Code”), necessary to qualify as a regulated investment company and to distribute substantially all of the Fund’s taxable earnings to shareholders. As such, the Fund will not be subject to federal income taxes on otherwise taxable income (including net realized capital gain) that is distributed to shareholders. Therefore, no provision for federal income taxes is recorded in the financial statements. |
The Fund recognizes the tax benefits of uncertain tax positions only when the position is more likely than not to be sustained. Management has analyzed the Fund’s uncertain tax positions and concluded that no liability for unrecognized tax benefits should be recorded related to uncertain tax positions. Management is not aware of any tax positions for which it is reasonably possible that the total amounts of unrecognized tax benefits will change materially in the next 12 months.
The Fund files tax returns in the U.S. Federal jurisdiction and certain other jurisdictions. Generally, the Fund is subject to examinations by such taxing authorities for up to three years after the filing of the return for the tax period.
| F. | Expenses — Fees provided for under the Rule 12b-1 plan of a particular class of the Fund are charged to the operations of such class. Transfer agency fees and expenses and other shareholder recordkeeping fees and expenses attributable to Class R5 are charged to such class. Transfer agency fees and expenses and other shareholder recordkeeping fees and expenses relating to all other classes are allocated among those classes based on relative net assets. All other expenses are allocated among the classes based on relative net assets. |
| G. | Accounting Estimates — The preparation of financial statements in conformity with accounting principles generally accepted in the United States of America (“GAAP”) requires management to make estimates and assumptions that affect the reported amounts of assets and liabilities at the date of the financial statements and the reported amounts of revenues and expenses during the reporting period including estimates and assumptions related to taxation. Actual results could differ from those estimates by a significant amount. In addition, the Fund monitors for material events or transactions that may occur or become known after the period-end date and before the date the financial statements are released to print. |
| H. | Indemnifications — Under the Trust’s organizational documents, each Trustee, officer, employee or other agent of the Trust is indemnified against certain liabilities that may arise out of the performance of their duties to the Fund. Additionally, in the normal course of business, the Fund enters into contracts, including the Fund’s servicing agreements, that contain a variety of indemnification clauses. The Fund’s maximum exposure under these arrangements is unknown as this would involve future claims that may be made against the Fund that have not yet occurred. The risk of material loss as a result of such indemnification claims is considered remote. |
| I. | Foreign Currency Translations — Foreign currency is valued at the close of the NYSE based on quotations posted by banks and major currency dealers. Portfolio securities and other assets and liabilities denominated in foreign currencies are translated into U.S. dollar amounts at date of valuation. Purchases and sales of portfolio securities (net of foreign taxes withheld on disposition) and income items denominated in foreign currencies are translated into U.S. dollar amounts on the respective dates of such transactions. The Fund does not separately account for the portion of the results of operations resulting from changes in foreign exchange rates on investments and the fluctuations arising from changes in market prices of securities held. The combined results of changes in foreign exchange rates and the fluctuation of market prices on investments (net of estimated foreign tax withholding) are included with the net realized and unrealized gain or loss from investments in the Statement of Operations. Reported net realized foreign currency gains or losses arise from (1) sales of foreign currencies, (2) currency gains or losses realized between the trade and settlement dates on securities transactions, and (3) the difference between the amounts of dividends, interest, and foreign withholding taxes recorded on the Fund’s books and the U.S. dollar equivalent of the amounts actually received or paid. Net unrealized foreign currency gains and losses arise from changes in the fair values of assets and liabilities, other than investments in securities at fiscal period end, resulting from changes in exchange rates. |
The Fund may invest in foreign securities, which may be subject to foreign taxes on income, gains on investments or currency repatriation, a portion of which may be recoverable. Foreign taxes, if any, are recorded based on the tax regulations and rates that exist in the foreign markets in which the Fund invests and are shown in the Statement of Operations.
| J. | Forward Foreign Currency Contracts — The Fund may engage in foreign currency transactions either on a spot (i.e. for prompt delivery and settlement) basis, or through forward foreign currency contracts, to manage or minimize currency or exchange rate risk. |
The Fund may also enter into forward foreign currency contracts for the purchase or sale of a security denominated in a foreign currency in order to “lock in” the U.S. dollar price of that security, or the Fund may also enter into forward foreign currency contracts that do not provide for physical settlement of the two currencies, but instead are settled by a single cash payment calculated as the difference between the agreed upon exchange rate and the spot rate at settlement based upon an agreed upon notional amount (non-deliverable forwards). The Fund will set aside liquid assets in an amount equal to the daily mark-to-market obligation for forward foreign currency contracts.
A forward foreign currency contract is an obligation between two parties (“Counterparties”) to purchase or sell a specific currency for an agreed-upon price at a future date. The use of forward foreign currency contracts does not eliminate fluctuations in the price of the underlying securities the Fund owns or intends to acquire but establishes a rate of exchange in advance. Fluctuations in the value of these contracts are measured by the difference in the contract date and reporting date exchange rates and are recorded as unrealized appreciation (depreciation) until the contracts are closed. When the contracts are closed, realized gains (losses) are recorded. Realized and unrealized gains (losses) on the contracts are included in the Statement of Operations. The primary risks associated with forward foreign currency contracts include failure of the Counterparty to meet the terms of the contract and the value of the foreign currency changing unfavorably. These risks may be in excess of the amounts reflected in the Statement of Assets and Liabilities.
14 Invesco Select Companies Fund
NOTE 2—Advisory Fees and Other Fees Paid to Affiliates
The Trust has entered into a master investment advisory agreement with Invesco Advisers, Inc. (the “Adviser” or “Invesco”). Under the terms of the investment advisory agreement, the Fund pays an advisory fee to the Adviser based on the annual rate of the Fund’s average daily net assets as follows:
| | | | | | | | |
| Average Daily Net Assets | | Rate | |
First $250 million | | | 0 | .745% | | | | |
Next $250 million | | | 0 | .73% | | | | |
Next $500 million | | | 0 | .715% | | | | |
Next $1.5 billion | | | 0 | .70% | | | | |
Next $2.5 billion | | | 0 | .685% | | | | |
Next $2.5 billion | | | 0 | .67% | | | | |
Next $2.5 billion | | | 0 | .655% | | | | |
Over $10 billion | | | 0 | .64% | | | | |
For the year ended October 31, 2016, the effective advisory fees incurred by the Fund was 0.73%.
Under the terms of a master sub-advisory agreement between the Adviser and each of Invesco Asset Management Deutschland GmbH, Invesco Asset Management Limited, Invesco Asset Management (Japan) Limited, Invesco Hong Kong Limited, Invesco Senior Secured Management, Inc. and Invesco Canada Ltd. (collectively, the “Affiliated Sub-Advisers”) the Adviser, not the Fund, will pay 40% of the fees paid to the Adviser to any such Affiliated Sub-Adviser(s) that provide(s) discretionary investment management services to the Fund based on the percentage of assets allocated to such Affiliated Sub-Adviser(s).
The Adviser has contractually agreed, through at least June 30, 2017, to waive advisory fees and/or reimburse expenses to the extent necessary to limit total annual fund operating expenses after fee waivers and/or expense reimbursements (excluding certain items discussed below) of Class A, Class B, Class C, Class R, Class Y and Class R5 shares to 2.00%, 2.75%, 2.75%, 2.25%, 1.75% and 1.75%, respectively of the Fund’s average daily net assets (the “expense limits”). In determining the Adviser’s obligation to waive advisory fees and/or reimburse expenses, the following expenses are not taken into account, and could cause the total annual fund operating expenses after fee waivers and/or expense reimbursements to exceed the numbers reflected above: (1) interest; (2) taxes; (3) dividend expense on short sales; (4) extraordinary or non-routine items, including litigation expenses; and (5) expenses that the Fund has incurred but did not actually pay because of an expense offset arrangement. Unless Invesco continues the fee waiver agreement, it will terminate on June 30, 2017. During its term, the fee waiver agreement cannot be terminated or amended to increase the expense limits without approval of the Board of Trustees. The Adviser did not waive fees and/or reimburse expenses during the period under these expense limits.
Further, the Adviser has contractually agreed, through at least June 30, 2018, to waive the advisory fee payable by the Fund in an amount equal to 100% of the net advisory fees the Adviser receives from the affiliated money market funds on investments by the Fund of uninvested cash in such affiliated money market funds.
For the year ended October 31, 2016, the Adviser waived advisory fees of $90,317.
The Trust has entered into a master administrative services agreement with Invesco pursuant to which the Fund has agreed to pay Invesco for certain administrative costs incurred in providing accounting services to the Fund. For the year ended October 31, 2016, expenses incurred under the agreement are shown in the Statement of Operations as Administrative services fees.
The Trust has entered into a transfer agency and service agreement with Invesco Investment Services, Inc. (“IIS”) pursuant to which the Fund has agreed to pay IIS a fee for providing transfer agency and shareholder services to the Fund and reimburse IIS for certain expenses incurred by IIS in the course of providing such services. IIS may make payments to intermediaries that provide omnibus account services, sub-accounting services and/or networking services. All fees payable by IIS to intermediaries that provide omnibus account services or sub-accounting are charged back to the Fund, subject to certain limitations approved by the Trust’s Board of Trustees. For the year ended October 31, 2016, expenses incurred under the agreement are shown in the Statement of Operations as Transfer agent fees.
The Trust has entered into master distribution agreements with Invesco Distributors, Inc. (“IDI”) to serve as the distributor for the Class A, Class B, Class C, Class R, Class Y and Class R5 shares of the Fund. The Trust has adopted plans pursuant to Rule 12b-1 under the 1940 Act with respect to the Fund’s Class A, Class B, Class C and Class R shares (collectively, the “Plans”). The Fund, pursuant to the Plans, pays IDI compensation at the annual rate of 0.25% of the Fund’s average daily net assets of Class A shares, 1.00% of the average daily net assets of Class B and Class C shares and 0.50% of the average daily net assets of Class R shares. Of the Plan payments, up to 0.25% of the average daily net assets of each class of shares may be paid to furnish continuing personal shareholder services to customers who purchase and own shares of such classes. Any amounts not paid as a service fee under the Plans would constitute an asset-based sales charge. Rules of the Financial Industry Regulatory Authority (“FINRA”) impose a cap on the total sales charges, including asset-based sales charges, that may be paid by any class of shares of the Fund. For the year ended October 31, 2016, expenses incurred under the Plans are shown in the Statement of Operations as Distribution fees.
Front-end sales commissions and CDSC (collectively, the “sales charges”) are not recorded as expenses of the Fund. Front-end sales commissions are deducted from proceeds from the sales of Fund shares prior to investment in Class A shares of the Fund. CDSC are deducted from redemption proceeds prior to remittance to the shareholder. During the year ended October 31, 2016, IDI advised the Fund that IDI retained $1,461 in front-end sales commissions from the sale of Class A shares and $641 and $242 from Class B and Class C shares, respectively, for CDSC imposed on redemptions by shareholders.
For the year ended October 31, 2016, the Fund incurred $4,426 in brokerage commissions with Invesco Capital Markets, Inc., an affiliate of the Adviser and IDI for portfolio transactions executed on behalf of the Fund.
Certain officers and trustees of the Trust are officers and directors of the Adviser, IIS and/or IDI.
15 Invesco Select Companies Fund
NOTE 3—Additional Valuation Information
GAAP defines fair value as the price that would be received to sell an asset or paid to transfer a liability in an orderly transaction between market participants at the measurement date, under current market conditions. GAAP establishes a hierarchy that prioritizes the inputs to valuation methods, giving the highest priority to readily available unadjusted quoted prices in an active market for identical assets (Level 1) and the lowest priority to significant unobservable inputs (Level 3), generally when market prices are not readily available or are unreliable. Based on the valuation inputs, the securities or other investments are tiered into one of three levels. Changes in valuation methods may result in transfers in or out of an investment’s assigned level:
| | Level 1 — | Prices are determined using quoted prices in an active market for identical assets. |
| | Level 2 — | Prices are determined using other significant observable inputs. Observable inputs are inputs that other market participants may use in pricing a security. These may include quoted prices for similar securities, interest rates, prepayment speeds, credit risk, yield curves, loss severities, default rates, discount rates, volatilities and others. |
| | Level 3 — | Prices are determined using significant unobservable inputs. In situations where quoted prices or observable inputs are unavailable (for example, when there is little or no market activity for an investment at the end of the period), unobservable inputs may be used. Unobservable inputs reflect the Fund’s own assumptions about the factors market participants would use in determining fair value of the securities or instruments and would be based on the best available information. |
The following is a summary of the tiered valuation input levels, as of October 31, 2016. The level assigned to the securities valuations may not be an indication of the risk or liquidity associated with investing in those securities. Because of the inherent uncertainties of valuation, the values reflected in the financial statements may materially differ from the value received upon actual sale of those investments.
| | | | | | | | | | | | | | | | |
| | | Level 1 | | | Level 2 | | | Level 3 | | | Total | |
Common Stocks | | $ | 525,105,130 | | | $ | 7,114 | | | $ | 0 | | | $ | 525,112,244 | |
Money Market Funds | | | 31,343,039 | | | | — | | | | — | | | | 31,343,039 | |
Total Investments | | $ | 556,448,169 | | | $ | 7,114 | | | $ | 0 | | | $ | 556,455,283 | |
NOTE 4—Investments in Other Affiliates
The 1940 Act defines an “affiliated person” as an issuance in which a fund holds 5% or more of the outstanding voting securities. The Fund has not owned enough of the outstanding voting securities of the issuer to have control (as defined in the 1940 Act) of that issuer. The following is a summary of the investments in other affiliates for the year ended October 31, 2016.
| | | | | | | | | | | | | | | | | | | | | | | | | | | | |
| | | Value 10/31/15 | | | Purchases
at Cost | | | Proceeds
from Sales | | | Change in
Unrealized
Appreciation
(Depreciation) | | | Realized
Gain (Loss) | | | Value 10/31/16 | | | Dividend
Income | |
America’s Car-Mart, Inc. | | $ | 32,258,737 | | | $ | — | | | $ | (10,050,796 | ) | | $ | 6,482,125 | | | $ | (1,814,728 | ) | | $ | 26,875,338 | | | $ | — | |
American Public Education Inc.(a) | | | 24,773,765 | | | | — | | | | (12,690,730 | ) | | | 5,110,338 | | | | (3,583,539 | ) | | | 13,609,834 | | | | — | |
Encore Capital Group, Inc. | | | 65,010,313 | | | | — | | | | — | | | | (33,303,809 | ) | | | — | | | | 31,706,504 | | | | — | |
Hampshire Group, Ltd. | | | 88,924 | | | | — | | | | — | | | | (81,810 | ) | | | — | | | | 7,114 | | | | — | |
ION Geophysical Corp. | | | 5,208,597 | | | | — | | | | 0 | | | | 328,470 | | | | 0 | | | | 5,537,067 | | | | — | |
Performant Financial Corp. | | | 12,767,823 | | | | — | | | | — | | | | 3,758,493 | | | | — | | | | 16,526,316 | | | | — | |
Total | | $ | 140,108,159 | | | $ | — | | | $ | (22,741,526 | ) | | $ | (17,706,193 | ) | | $ | (5,398,267 | ) | | $ | 94,262,173 | | | $ | — | |
| (a) | As of October 31, 2016, this security is no longer considered as an affiliate of the Fund. |
NOTE 5—Expense Offset Arrangement(s)
The expense offset arrangement is comprised of transfer agency credits which result from balances in demand deposit accounts used by the transfer agent for clearing shareholder transactions. For the year ended October 31, 2016, the Fund received credits from this arrangement, which resulted in the reduction of the Fund’s total expenses of $2,716.
NOTE 6—Trustees’ and Officers’ Fees and Benefits
Trustees’ and Officers’ Fees and Benefits include amounts accrued by the Fund to pay remuneration to certain Trustees and Officers of the Fund. Trustees have the option to defer compensation payable by the Fund, and Trustees’ and Officers’ Fees and Benefits also include amounts accrued by the Fund to fund such deferred compensation amounts. Those Trustees who defer compensation have the option to select various Invesco Funds in which their deferral accounts shall be deemed to be invested. Finally, certain current Trustees were eligible to participate in a retirement plan that provided for benefits to be paid upon retirement to Trustees over a period of time based on the number of years of service. The Fund may have certain former Trustees who also participate in a retirement plan and receive benefits under such plan. Trustees’ and Officers’ Fees and Benefits include amounts accrued by the Fund to fund such retirement benefits. Obligations under the deferred compensation and retirement plans represent unsecured claims against the general assets of the Fund.
16 Invesco Select Companies Fund
NOTE 7—Cash Balances
The Fund is permitted to temporarily carry a negative or overdrawn balance in its account with State Street Bank and Trust Company, the custodian bank. Such balances, if any at period-end, are shown in the Statement of Assets and Liabilities under the payable caption Amount due custodian. To compensate the custodian bank for such overdrafts, the overdrawn Fund may either (1) leave funds as a compensating balance in the account so the custodian bank can be compensated by earning the additional interest; or (2) compensate by paying the custodian bank at a rate agreed upon by the custodian bank and Invesco, not to exceed the contractually agreed upon rate.
NOTE 8—Distributions to Shareholders and Tax Components of Net Assets
Tax Character of Distributions to Shareholders Paid During the Fiscal Years Ended October 31, 2016 and 2015:
| | | | | | | | |
| | | 2016 | | | 2015 | |
Long-term capital gain | | $ | 162,935,278 | | | $ | 132,504,743 | |
Tax Components of Net Assets at Period-End:
| | | | |
| | | 2016 | |
Undistributed ordinary income | | $ | 19,965,493 | |
Net unrealized appreciation — investments | | | 6,914,281 | |
Net unrealized appreciation (depreciation) — other investments | | | (284 | ) |
Temporary book/tax differences | | | (162,787 | ) |
Late-Year ordinary loss deferral | | | (2,975,831 | ) |
Shares of beneficial interest | | | 526,823,942 | |
Total net assets | | $ | 550,564,814 | |
The difference between book-basis and tax-basis unrealized appreciation (depreciation) is due to differences in the timing of recognition of gains and losses on investments for tax and book purposes. The Fund’s net unrealized appreciation difference is attributable primarily to wash sales.
The temporary book/tax differences are a result of timing differences between book and tax recognition of income and/or expenses. The Fund’s temporary book/tax differences are the result of the trustee deferral of compensation and retirement plan benefits.
Capital loss carryforward is calculated and reported as of a specific date. Results of transactions and other activity after that date may affect the amount of capital loss carryforward actually available for the Fund to utilize. Capital losses generated in years beginning after December 22, 2010 can be carried forward for an unlimited period, whereas previous losses expire in eight tax years. Capital losses with an expiration period may not be used to offset capital gains until all net capital losses without an expiration date have been utilized. Capital loss carryforwards with no expiration date will retain their character as either short-term or long-term capital losses instead of as short-term capital losses as under prior law. The ability to utilize capital loss carryforwards in the future may be limited under the Internal Revenue Code and related regulations based on the results of future transactions.
The Fund does not have a capital loss carryforward as of October 31, 2016.
NOTE 9—Investment Securities
The aggregate amount of investment securities (other than short-term securities, U.S. Treasury obligations and money market funds, if any) purchased and sold by the Fund during the year ended October 31, 2016 was $117,318,299 and $309,742,719, respectively. Cost of investments on a tax basis includes the adjustments for financial reporting purposes as of the most recently completed federal income tax reporting period-end.
| | | | |
| Unrealized Appreciation (Depreciation) of Investment Securities on a Tax Basis | |
Aggregate unrealized appreciation of investment securities | | $ | 171,073,591 | |
Aggregate unrealized (depreciation) of investment securities | | | (164,159,310 | ) |
Net unrealized appreciation of investment securities | | $ | 6,914,281 | |
Cost of investments for tax purposes is $549,541,002.
NOTE 10—Reclassification of Permanent Differences
Primarily as a result of differing book/tax treatment of net operating loss, on October 31, 2016, undistributed net investment income (loss) was increased by $9,928,916, undistributed net realized gain was decreased by $2,443,703 and shares of beneficial interest was decreased by $7,485,213. This reclassification had no effect on the net assets of the Fund.
17 Invesco Select Companies Fund
NOTE 11—Share Information
| | | | | | | | | | | | | | | | |
| | | Summary of Share Activity | |
| | | Years ended October 31, | |
| | | 2016(a) | | | 2015 | |
| | | Shares | | | Amount | | | Shares | | | Amount | |
Sold: | | | | | | | | | | | | | | | | |
Class A | | | 1,203,364 | | | $ | 19,243,385 | | | | 1,412,942 | | | $ | 31,995,201 | |
Class B | | | 1,546 | | | | 21,378 | | | | 3,991 | | | | 75,134 | |
Class C | | | 69,465 | | | | 978,040 | | | | 108,970 | | | | 2,269,796 | |
Class R | | | 378,007 | | | | 5,747,730 | | | | 489,174 | | | | 10,794,717 | |
Class Y | | | 921,734 | | | | 15,071,060 | | | | 754,311 | | | | 17,155,525 | |
Class R5 | | | 446,188 | | | | 7,561,416 | | | | 506,037 | | | | 11,854,368 | |
| | | | |
Issued as reinvestment of dividends: | | | | | | | | | | | | | | | | |
Class A | | | 5,815,428 | | | | 85,254,170 | | | | 3,010,749 | | | | 66,718,192 | |
Class B | | | 61,365 | | | | 794,066 | | | | 42,091 | | | | 854,027 | |
Class C | | | 2,045,411 | | | | 26,406,259 | | | | 881,605 | | | | 17,861,315 | |
Class R | | | 657,658 | | | | 9,286,133 | | | | 313,180 | | | | 6,758,426 | |
Class Y | | | 1,568,201 | | | | 23,381,875 | | | | 1,152,785 | | | | 25,822,392 | |
Class R5 | | | 603,276 | | | | 9,338,706 | | | | 264,206 | | | | 6,089,938 | |
| | | | |
Automatic conversion of Class B shares to Class A shares: | | | | | | | | | | | | | | | | |
Class A | | | 71,499 | | | | 1,143,484 | | | | 133,661 | | | | 2,972,639 | |
Class B | | | (81,026 | ) | | | (1,143,484 | ) | | | (146,438 | ) | | | (2,972,639 | ) |
| | | | |
Reacquired: | | | | | | | | | | | | | | | | |
Class A | | | (12,105,276 | ) | | | (194,294,367 | ) | | | (10,911,072 | ) | | | (242,595,546 | ) |
Class B | | | (44,170 | ) | | | (632,834 | ) | | | (66,806 | ) | | | (1,354,850 | ) |
Class C | | | (2,101,670 | ) | | | (29,923,264 | ) | | | (1,894,478 | ) | | | (37,940,158 | ) |
Class R | | | (1,485,324 | ) | | | (22,807,132 | ) | | | (1,329,652 | ) | | | (29,284,209 | ) |
Class Y | | | (4,863,702 | ) | | | (81,541,949 | ) | | | (6,613,315 | ) | | | (147,367,317 | ) |
Class R5 | | | (1,608,274 | ) | | | (27,212,090 | ) | | | (851,150 | ) | | | (19,421,155 | ) |
Net increase (decrease) in share activity | | | (8,446,300 | ) | | $ | (153,327,418 | ) | | | (12,739,209 | ) | | $ | (279,714,204 | ) |
| (a) | There are entities that are record owners of more than 5% of the outstanding shares of the Fund and in the aggregate own 32% of the outstanding shares of the Fund. IDI has an agreement with these entities to sell Fund shares. The Fund, Invesco and/or Invesco affiliates may make payments to these entities, which are considered to be related to the Fund, for providing services to the Fund, Invesco and/or Invesco affiliates including but not limited to services such as securities brokerage, distribution, third party record keeping and account servicing. The Fund has no knowledge as to whether all or any portion of the shares owned of record by these entities are also owned beneficially. |
18 Invesco Select Companies Fund
NOTE 12—Financial Highlights
The following schedule presents financial highlights for a share of the Fund outstanding throughout the periods indicated.
| | | | | | | | | | | | | | | | | | | | | | | | | | | | | | | | | | | | | | | | | | | | | | | | | | | | | | | | |
| | | Net asset
value,
beginning
of period | | | Net
investment
income (loss)(a) | | | Net gains
(losses)
on securities
(both
realized and
unrealized) | | | Total from
investment
operations | | | Dividends
from net
investment
income | | | Distributions
from net
realized
gains | | | Total
distributions | | | Net asset
value, end
of period | | | Total
return(b) | | | Net assets,
end of period
(000’s omitted) | | | Ratio of
expenses
to average
net assets
with fee waivers
and/or expenses
absorbed | | | Ratio of
expenses
to average net
assets without
fee waivers
and/or expenses
absorbed | | | Ratio of net
investment
income (loss)
to average
net assets | | | Portfolio
turnover(c) | |
Class A | |
Year ended 10/31/16 | | $ | 20.44 | | | $ | (0.08 | ) | | $ | 0.56 | | | $ | 0.48 | | | $ | — | | | $ | (4.20 | ) | | $ | (4.20 | ) | | $ | 16.72 | | | | 5.22 | % | | $ | 305,003 | | | | 1.24 | %(d) | | | 1.25 | %(d) | | | (0.53 | )%(d) | | | 20 | % |
Year ended 10/31/15 | | | 25.47 | | | | (0.19 | ) | | | (2.37 | ) | | | (2.56 | ) | | | — | | | | (2.47 | ) | | | (2.47 | ) | | | 20.44 | | | | (10.79 | ) | | | 475,536 | | | | 1.17 | | | | 1.20 | | | | (0.86 | ) | | | 14 | |
Year ended 10/31/14 | | | 23.95 | | | | (0.06 | ) | | | 2.71 | | | | 2.65 | | | | — | | | | (1.13 | ) | | | (1.13 | ) | | | 25.47 | | | | 11.66 | | | | 754,310 | | | | 1.16 | | | | 1.20 | | | | (0.28 | ) | | | 10 | |
Year ended 10/31/13 | | | 20.57 | | | | (0.12 | ) | | | 4.95 | | | | 4.83 | | | | (0.23 | ) | | | (1.22 | ) | | | (1.45 | ) | | | 23.95 | | | | 25.11 | | | | 883,072 | | | | 1.16 | | | | 1.20 | | | | (0.55 | ) | | | 19 | |
Year ended 10/31/12 | | | 18.97 | | | | (0.07 | ) | | | 1.67 | (e) | | | 1.60 | | | | — | | | | — | | | | — | | | | 20.57 | | | | 8.43 | | | | 725,950 | | | | 1.18 | | | | 1.23 | | | | (0.34 | ) | | | 37 | |
Class B | | | | | | | | | | | | | | | | | | | | | | | | | | | | | | | | | | | | | | | | | | | | | | | | | | | | | | | | |
Year ended 10/31/16 | | | 18.59 | | | | (0.18 | ) | | | 0.44 | | | | 0.26 | | | | — | | | | (4.20 | ) | | | (4.20 | ) | | | 14.65 | | | | 4.36 | | | | 2,261 | | | | 1.99 | (d) | | | 2.00 | (d) | | | (1.28 | )(d) | | | 20 | |
Year ended 10/31/15 | | | 23.55 | | | | (0.33 | ) | | | (2.16 | ) | | | (2.49 | ) | | | — | | | | (2.47 | ) | | | (2.47 | ) | | | 18.59 | | | | (11.44 | ) | | | 4,027 | | | | 1.92 | | | | 1.95 | | | | (1.61 | ) | | | 14 | |
Year ended 10/31/14 | | | 22.40 | | | | (0.23 | ) | | | 2.51 | | | | 2.28 | | | | — | | | | (1.13 | ) | | | (1.13 | ) | | | 23.55 | | | | 10.77 | | | | 9,039 | | | | 1.91 | | | | 1.95 | | | | (1.03 | ) | | | 10 | |
Year ended 10/31/13 | | | 19.32 | | | | (0.26 | ) | | | 4.65 | | | | 4.39 | | | | (0.09 | ) | | | (1.22 | ) | | | (1.31 | ) | | | 22.40 | | | | 24.22 | | | | 11,551 | | | | 1.91 | | | | 1.95 | | | | (1.30 | ) | | | 19 | |
Year ended 10/31/12 | | | 17.95 | | | | (0.21 | ) | | | 1.58 | (e) | | | 1.37 | | | | — | | | | — | | | | — | | | | 19.32 | | | | 7.63 | | | | 13,251 | | | | 1.93 | | | | 1.98 | | | | (1.09 | ) | | | 37 | |
Class C | | | | | | | | | | | | | | | | | | | | | | | | | | | | | | | | | | | | | | | | | | | | | | | | | | | | | | | | |
Year ended 10/31/16 | | | 18.57 | | | | (0.18 | ) | | | 0.44 | | | | 0.26 | | | | — | | | | (4.20 | ) | | | (4.20 | ) | | | 14.63 | | | | 4.39 | | | | 99,413 | | | | 1.99 | (d) | | | 2.00 | (d) | | | (1.28 | )(d) | | | 20 | |
Year ended 10/31/15 | | | 23.53 | | | | (0.33 | ) | | | (2.16 | ) | | | (2.49 | ) | | | — | | | | (2.47 | ) | | | (2.47 | ) | | | 18.57 | | | | (11.45 | ) | | | 125,947 | | | | 1.92 | | | | 1.95 | | | | (1.61 | ) | | | 14 | |
Year ended 10/31/14 | | | 22.37 | | | | (0.23 | ) | | | 2.52 | | | | 2.29 | | | | — | | | | (1.13 | ) | | | (1.13 | ) | | | 23.53 | | | | 10.83 | | | | 180,853 | | | | 1.91 | | | | 1.95 | | | | (1.03 | ) | | | 10 | |
Year ended 10/31/13 | | | 19.30 | | | | (0.26 | ) | | | 4.64 | | | | 4.38 | | | | (0.09 | ) | | | (1.22 | ) | | | (1.31 | ) | | | 22.37 | | | | 24.19 | | | | 182,221 | | | | 1.91 | | | | 1.95 | | | | (1.30 | ) | | | 19 | |
Year ended 10/31/12 | | | 17.93 | | | | (0.21 | ) | | | 1.58 | (e) | | | 1.37 | | | | — | | | | — | | | | — | | | | 19.30 | | | | 7.64 | | | | 160,090 | | | | 1.93 | | | | 1.98 | | | | (1.09 | ) | | | 37 | |
Class R | | | | | | | | | | | | | | | | | | | | | | | | | | | | | | | | | | | | | | | | | | | | | | | | | | | | | | | | |
Year ended 10/31/16 | | | 19.86 | | | | (0.12 | ) | | | 0.52 | | | | 0.40 | | | | — | | | | (4.20 | ) | | | (4.20 | ) | | | 16.06 | | | | 4.90 | | | | 29,623 | | | | 1.49 | (d) | | | 1.50 | (d) | | | (0.78 | )(d) | | | 20 | |
Year ended 10/31/15 | | | 24.88 | | | | (0.24 | ) | | | (2.31 | ) | | | (2.55 | ) | | | — | | | | (2.47 | ) | | | (2.47 | ) | | | 19.86 | | | | (11.03 | ) | | | 45,561 | | | | 1.42 | | | | 1.45 | | | | (1.11 | ) | | | 14 | |
Year ended 10/31/14 | | | 23.48 | | | | (0.12 | ) | | | 2.65 | | | | 2.53 | | | | — | | | | (1.13 | ) | | | (1.13 | ) | | | 24.88 | | | | 11.37 | | | | 70,177 | | | | 1.41 | | | | 1.45 | | | | (0.53 | ) | | | 10 | |
Year ended 10/31/13 | | | 20.19 | | | | (0.17 | ) | | | 4.86 | | | | 4.69 | | | | (0.18 | ) | | | (1.22 | ) | | | (1.40 | ) | | | 23.48 | | | | 24.83 | | | | 76,385 | | | | 1.41 | | | | 1.45 | | | | (0.80 | ) | | | 19 | |
Year ended 10/31/12 | | | 18.66 | | | | (0.12 | ) | | | 1.65 | (e) | | | 1.53 | | | | — | | | | — | | | | — | | | | 20.19 | | | | 8.20 | | | | 71,040 | | | | 1.43 | | | | 1.48 | | | | (0.59 | ) | | | 37 | |
Class Y | | | | | | | | | | | | | | | | | | | | | | | | | | | | | | | | | | | | | | | | | | | | | | | | | | | | | | | | |
Year ended 10/31/16 | | | 20.71 | | | | (0.04 | ) | | | 0.57 | | | | 0.53 | | | | — | | | | (4.20 | ) | | | (4.20 | ) | | | 17.04 | | | | 5.44 | | | | 81,269 | | | | 0.99 | (d) | | | 1.00 | (d) | | | (0.28 | )(d) | | | 20 | |
Year ended 10/31/15 | | | 25.71 | | | | (0.13 | ) | | | (2.40 | ) | | | (2.53 | ) | | | — | | | | (2.47 | ) | | | (2.47 | ) | | | 20.71 | | | | (10.56 | ) | | | 147,927 | | | | 0.92 | | | | 0.95 | | | | (0.61 | ) | | | 14 | |
Year ended 10/31/14 | | | 24.11 | | | | (0.01 | ) | | | 2.74 | | | | 2.73 | | | | — | | | | (1.13 | ) | | | (1.13 | ) | | | 25.71 | | | | 11.92 | | | | 304,629 | | | | 0.91 | | | | 0.95 | | | | (0.03 | ) | | | 10 | |
Year ended 10/31/13 | | | 20.69 | | | | (0.06 | ) | | | 4.98 | | | | 4.92 | | | | (0.28 | ) | | | (1.22 | ) | | | (1.50 | ) | | | 24.11 | | | | 25.47 | | | | 372,632 | | | | 0.91 | | | | 0.95 | | | | (0.30 | ) | | | 19 | |
Year ended 10/31/12 | | | 19.03 | | | | (0.02 | ) | | | 1.68 | (e) | | | 1.66 | | | | — | | | | — | | | | — | | | | 20.69 | | | | 8.72 | | | | 235,268 | | | | 0.93 | | | | 0.98 | | | | (0.09 | ) | | | 37 | |
Class R5 | | | | | | | | | | | | | | | | | | | | | | | | | | | | | | | | | | | | | | | | | | | | | | | | | | | | | | | | |
Year ended 10/31/16 | | | 21.33 | | | | (0.03 | ) | | | 0.61 | | | | 0.58 | | | | — | | | | (4.20 | ) | | | (4.20 | ) | | | 17.71 | | | | 5.54 | | | | 32,996 | | | | 0.89 | (d) | | | 0.90 | (d) | | | (0.18 | )(d) | | | 20 | |
Year ended 10/31/15 | | | 26.38 | | | | (0.12 | ) | | | (2.46 | ) | | | (2.58 | ) | | | — | | | | (2.47 | ) | | | (2.47 | ) | | | 21.33 | | | | (10.47 | ) | | | 51,659 | | | | 0.85 | | | | 0.88 | | | | (0.54 | ) | | | 14 | |
Year ended 10/31/14 | | | 24.69 | | | | 0.01 | | | | 2.81 | | | | 2.82 | | | | — | | | | (1.13 | ) | | | (1.13 | ) | | | 26.38 | | | | 12.01 | | | | 66,042 | | | | 0.84 | | | | 0.88 | | | | 0.04 | | | | 10 | |
Year ended 10/31/13 | | | 21.16 | | | | (0.05 | ) | | | 5.10 | | | | 5.05 | | | | (0.30 | ) | | | (1.22 | ) | | | (1.52 | ) | | | 24.69 | | | | 25.53 | | | | 81,527 | | | | 0.83 | | | | 0.87 | | | | (0.22 | ) | | | 19 | |
Year ended 10/31/12 | | | 19.45 | | | | (0.00 | ) | | | 1.71 | (e) | | | 1.71 | | | | — | | | | — | | | | — | | | | 21.16 | | | | 8.79 | | | | 71,138 | | | | 0.84 | | | | 0.89 | | | | (0.00 | ) | | | 37 | |
| (a) | Calculated using average shares outstanding. |
| (b) | Includes adjustments in accordance with accounting principles generally accepted in the United States of America and as such, the net asset value for financial reporting purposes and the returns based upon those net asset values may differ from the net asset value and returns for shareholder transactions. Does not include sales charges and is not annualized for periods less than one year, if applicable. |
| (c) | Portfolio turnover is calculated at the fund level and is not annualized for periods less than one year, if applicable. |
| (d) | Ratios are based on average daily net assets (000’s omitted) of $353,044, $2,876, $105,653, $35,367, $97,417, and $38,269 for Class A, Class B, Class C, Class R, Class Y and Class R5 shares, respectively. |
| (e) | Net gains (losses) on securities (both realized and unrealized) include capital gains realized on distributions from Booz Allen Hamilton Holding Corp. on June 7, 2012 and Generac Holdings, Inc. on July 2, 2012. Net gains (losses) on securities (both realized and unrealized) excluding the capital gains are $1.55, $1.46, $1.46, $1.53, $1.56 and $1.59 for Class A, Class B, Class C, Class R, Class Y and Class R5 shares, respectively. |
19 Invesco Select Companies Fund
Report of Independent Registered Public Accounting Firm
To the Board of Trustees
and Shareholders of the Invesco Select Companies Fund:
In our opinion, the accompanying statement of assets and liabilities, including the schedule of investments, and the related statements of operations and of changes in net assets and the financial highlights present fairly, in all material respects, the financial position of the Invesco Select Companies Fund (the “Fund”) as of October 31, 2016, the results of its operations for the year then ended, the changes in its net assets for each of the two years in the period then ended and the financial highlights for each of the five years in the period then ended, in conformity with accounting principles generally accepted in the United States of America. These financial statements and financial highlights (hereafter referred to as “financial statements”) are the responsibility of the Fund’s management. Our responsibility is to express an opinion on these financial statements based on our audits. We conducted our audits of these financial statements in accordance with the standards of the Public Company Accounting Oversight Board (United States). Those standards require that we plan and perform the audit to obtain reasonable assurance about whether the financial statements are free of material misstatement. An audit includes examining, on a test basis, evidence supporting the amounts and disclosures in the financial statements, assessing the accounting principles used and significant estimates made by management, and evaluating the overall financial statement presentation. We believe that our audits, which included confirmation of securities as of October 31, 2016 by correspondence with the custodian and brokers, and the application of alternative auditing procedures where confirmations of security purchases have not been received, provide a reasonable basis for our opinion.
PRICEWATERHOUSECOOPERS LLP
Houston, Texas
December 21, 2016
20 Invesco Select Companies Fund
Calculating your ongoing Fund expenses
Example
As a shareholder of the Fund, you incur two types of costs: (1) transaction costs, which may include sales charges (loads) on purchase payments or contingent deferred sales charges on redemptions, if any; and (2) ongoing costs, including management fees, distribution and/or service (12b-1) fees, and other Fund expenses. This example is intended to help you understand your ongoing costs (in dollars) of investing in the Fund and to compare these costs with ongoing costs of investing in other mutual funds. The example is based on an investment of $1,000 invested at the beginning of the period and held for the entire period May 1, 2016 through October 31, 2016.
Actual expenses
The table below provides information about actual account values and actual expenses. You may use the information in this table, together with the amount you invested, to estimate the expenses that you paid over the period. Simply divide your account value by $1,000 (for example, an $8,600 account value divided by $1,000 = 8.6), then multiply the result by the number in the table under the heading entitled “Actual Expenses Paid During Period” to estimate the expenses you paid on your account during this period.
Hypothetical example for comparison purposes
The table below also provides information about hypothetical account values and hypothetical expenses based on the Fund’s actual expense ratio and an assumed rate of return of 5% per year before expenses, which is not the Fund’s actual return.
The hypothetical account values and expenses may not be used to estimate the actual ending account balance or expenses you paid for the period. You may use this information to compare the ongoing costs of investing in the Fund and other funds. To do so, compare this 5% hypothetical example with the 5% hypothetical examples that appear in the shareholder reports of the other funds.
Please note that the expenses shown in the table are meant to highlight your ongoing costs only and do not reflect any transaction costs, such as sales charges (loads) on purchase payments or contingent deferred sales charges on redemptions, if any. Therefore, the hypothetical information is useful in comparing ongoing costs only, and will not help you determine the relative total costs of owning different funds. In addition, if these transaction costs were included, your costs would have been higher.
| | | | | | | | | | | | | | | | | | | | | | | | |
| Class | | Beginning
Account Value
(05/01/16) | | | ACTUAL | | | HYPOTHETICAL (5% annual return before expenses) | | | Annualized
Expense
Ratio | |
| | | Ending
Account Value
(10/31/16)1 | | | Expenses
Paid During
Period2 | | | Ending
Account Value
(10/31/16) | | | Expenses
Paid During
Period2 | | |
| A | | $ | 1,000.00 | | | $ | 1,048.30 | | | $ | 6.44 | | | $ | 1,018.85 | | | $ | 6.34 | | | | 1.25 | % |
| B | | | 1,000.00 | | | | 1,043.40 | | | | 10.27 | | | | 1,015.08 | | | | 10.13 | | | | 2.00 | |
| C | | | 1,000.00 | | | | 1,044.30 | | | | 10.28 | | | | 1,015.08 | | | | 10.13 | | | | 2.00 | |
| R | | | 1,000.00 | | | | 1,046.30 | | | | 7.72 | | | | 1,017.60 | | | | 7.61 | | | | 1.50 | |
| Y | | | 1,000.00 | | | | 1,049.30 | | | | 5.15 | | | | 1,020.11 | | | | 5.08 | | | | 1.00 | |
| R5 | | | 1,000.00 | | | | 1,049.80 | | | | 4.69 | | | | 1,020.56 | | | | 4.62 | | | | 0.91 | |
| 1 | The actual ending account value is based on the actual total return of the Fund for the period May 1, 2016 through October 31, 2016, after actual expenses and will differ from the hypothetical ending account value which is based on the Fund’s expense ratio and a hypothetical annual return of 5% before expenses. |
| 2 | Expenses are equal to the Fund’s annualized expense ratio as indicated above multiplied by the average account value over the period, multiplied by 184/366 to reflect the most recent fiscal half year. |
21 Invesco Select Companies Fund
Approval of Investment Advisory and Sub-Advisory Contracts
The Board of Trustees (the Board) of AIM Investment Funds (Invesco Investment Funds) is required under the Investment Company Act of 1940, as amended, to approve annually the renewal of Invesco Select Companies Fund’s (the Fund) investment advisory agreements. During contract renewal meetings held on June 7-8, 2016, the Board as a whole, and the disinterested or “independent” Trustees, who comprise over 75% of the Board, voting separately, approved the continuance for the Fund of the Master Investment Advisory Agreement with Invesco Advisers, Inc. (Invesco Advisers and the investment advisory agreement) and the Master Intergroup Sub-Advisory Contract for Mutual Funds with Invesco Asset Management Deutschland GmbH, Invesco Asset Management Limited, Invesco Asset Management (Japan) Limited, Invesco Hong Kong Limited, Invesco Senior Secured Management, Inc. and Invesco Canada Ltd. (collectively, the Affiliated Sub-Advisers and the sub-advisory contracts) for another year, effective July 1, 2016.
In evaluating the fairness and reasonableness of compensation under the Fund’s investment advisory agreement and sub-advisory contracts, the Board considered, among other things, the factors discussed below. The Board determined that continuation of the Fund’s investment advisory agreement and the sub-advisory contracts is in the best interest of the Fund and its shareholders and that the compensation payable to Invesco Advisers and the Affiliated Sub-Advisers under the agreements is fair and reasonable.
The Board’s Fund Evaluation Process
The Board’s Investments Committee has established three Sub-Committees, which meet throughout the year to review the performance of funds advised by Invesco Advisers (the Invesco Funds). Over the course of each year, the Sub-Committees meet with portfolio managers for their assigned Invesco Funds and other members of management to review the performance, investment objective(s), policies, strategies, limitations and investment risks of these funds. The Board had the benefit of reports from the Sub-Committees and Investments Committee throughout the year in considering approval of the continuance of each Invesco Fund’s investment advisory agreement and sub-advisory contracts for another year.
During the contract renewal process, the Board receives comparative performance and fee data regarding the Invesco Funds prepared by Invesco Advisers and Broadridge Financial Solutions, Inc. (Broadridge), an independent provider of investment company data. The Board also receives an independent written evaluation from the Senior Officer, an officer of the Invesco Funds who reports directly to the independent Trustees. The Senior Officer’s
evaluation is prepared as part of his responsibility to manage the process by which the Invesco Funds’ proposed management fees are negotiated during the annual contract renewal process to ensure they are negotiated in a manner that is at arms’ length and reasonable. In addition to meetings with Invesco Advisers and fund counsel, the independent Trustees also discuss the continuance of the investment advisory agreement and sub-advisory contracts in separate sessions with the Senior Officer and with independent legal counsel.
The Trustees recognized that the advisory fee rates for the Invesco Funds are, in many cases, the result of years of review and negotiation. The Trustees’ deliberations and conclusions in a particular year may be based in part on their deliberations and conclusions regarding these same arrangements throughout the year and in prior years. The Trustees’ review and conclusions are based on the comprehensive consideration of all information presented to them and are not the result of any single determinative factor. Moreover, one Trustee may have weighed a particular piece of information or factor differently than another Trustee.
The discussion below is a summary of the Senior Officer’s independent written evaluation with respect to the Fund’s investment advisory agreement as well as a discussion of the material factors and related conclusions that formed the basis for the Board’s approval of the Fund’s investment advisory agreement and sub-advisory contracts. Unless otherwise stated, this information is current as of June 8, 2016, and does not reflect consideration of factors that became known to the Board after that date.
Factors and Conclusions and Summary of Independent Written Fee Evaluation
| A. | Nature, Extent and Quality of Services Provided by Invesco Advisers and the Affiliated Sub-Advisers |
The Board reviewed the advisory services provided to the Fund by Invesco Advisers under the Fund’s investment advisory agreement, the performance of Invesco Advisers in providing these services, and the credentials and experience of the officers and employees of Invesco Advisers who provide these services, including the Fund’s portfolio manager or managers. The Board’s review of the qualifications of Invesco Advisers to provide advisory services included the Board’s consideration of Invesco Advisers’ investment process oversight, independent credit analysis and investment risk management. The Board also considered non-advisory services that Invesco Advisers and its affiliates provide to the Invesco Funds such as various back office
support functions, trading operations, internal audit, valuation and legal and compliance.
In determining whether to continue the Fund’s investment advisory agreement, the Board considered the benefits of reapproving an existing relationship and the greater uncertainty that may be associated with entering into a new relationship. The Board concluded that the nature, extent and quality of the services provided to the Fund by Invesco Advisers are appropriate and satisfactory and consistent with the terms of the Fund’s investment advisory agreement.
The Board reviewed the services that may be provided by the Affiliated Sub-Advisers under the sub-advisory contracts and the credentials and experience of the officers and employees of the Affiliated Sub-Advisers who provide these services. The Board noted that the Affiliated Sub-Advisers have offices and personnel that are located in financial centers around the world. As a result, the Board noted that the Affiliated Sub-Advisers can provide research and investment analysis on the markets and economies of various countries in which the Fund may invest, make recommendations regarding securities and assist with security trades. The Board concluded that the sub-advisory contracts may benefit the Fund and its shareholders by permitting Invesco Advisers to use the resources and talents of the Affiliated Sub-Advisers in managing the Fund. The Board concluded that the nature, extent and quality of the services that may be provided by the Affiliated Sub-Advisers are appropriate and satisfactory and consistent with the terms of the Fund’s sub-advisory contracts.
The Board considered Fund performance as a relevant factor in considering whether to approve the investment advisory agreement as well as the sub-advisory contracts for the Fund, as Invesco Canada Ltd. currently manages assets of the Fund.
The Board compared the Fund’s performance during the past one, three and five calendar years to the performance of funds in the Broadridge performance universe and against the Lipper Small-Cap Core Funds Index. The Board noted that performance of Class A shares of the Fund was in the fifth quintile of its performance universe for the one and three year periods and the fourth quintile for the five year period (the first quintile being the best performing funds and the fifth quintile being the worst performing funds). The Board noted that performance of Class A shares of the Fund was below the performance of the Index for the one, three and five year periods. Invesco Advisers noted that performance was affected by negative stock selection in several sectors. The Trustees also reviewed more recent Fund performance and this review did not change their conclusions.
22 Invesco Select Companies Fund
| C. | Advisory and Sub-Advisory Fees |
The Board compared the Fund’s contractual management fee rate to the contractual management fee rates of funds in the Fund’s Broadridge expense group at a common asset level. The Board noted that the contractual management fee rate for Class A shares of the Fund was below the median contractual management fee rate of funds in its expense group. The Board noted that the term “contractual management fee” for funds in the expense group may include both advisory and certain administrative services fees, but that Broadridge does not provide information on a fund by fund basis as to what is included. The Board noted that Invesco Advisers does not separately charge the Invesco Funds for the administrative services included in the term as defined by Broadridge. The Board also reviewed the methodology used by Broadridge in providing expense group information, which includes using each fund’s contractual management fee schedule (including any applicable breakpoints) as reported in the most recent prospectus or statement of additional information for each fund in the expense group.
The Board also compared the Fund’s effective advisory fee rate (the advisory fee rate after advisory fee waivers and before other expense limitations/waivers) to the effective advisory fee rates of other funds advised by Invesco Advisers and its affiliates with investment strategies comparable to those of the Fund, based on asset balances as of December 31, 2015. The Board noted that the Fund’s rate was below the effective advisory fee rate of one off-shore advised by Invesco Advisers using a similar investment process. The Board also noted how the Fund’s rate compared to the effective sub-adviser fee rate of one fund sub-advised by Invesco Advisers. The Board noted that Invesco Advisers and the Affiliated Sub-Advisers do not manage other client accounts with investment strategies comparable to those of the Fund.
The Board also considered the services that may be provided by the Affiliated Sub-Advisers pursuant to the sub-advisory contracts, as well as the fees payable by Invesco Advisers to the Affiliated Sub-Advisers pursuant to the sub-advisory contracts. The Board noted that Invesco Advisers retains overall responsibility for, and provides services to, sub-advised Invesco Funds, including oversight of the Affiliated Sub-Advisers as well as the additional services described herein other than day-to-day portfolio management. The Board also noted that the sub-advisory fees are not paid directly by the Fund, but rather, are payable by Invesco Advisers to the Affiliated Sub-Advisers.
| D. | Economies of Scale and Breakpoints |
The Board considered the extent to which there are economies of scale in the provision of advisory services to the Fund. The Board also considered whether the Fund benefits from economies of scale through contractual breakpoints in the Fund’s advisory fee schedule. The Board also noted that the Fund shares directly in economies of scale through lower
fees charged by third party service providers based on the combined size of the Invesco Funds and other clients advised by Invesco Advisers.
| E. | Profitability and Financial Resources |
The Board reviewed information from Invesco Advisers concerning the costs of the advisory and other services that Invesco Advisers and its affiliates provide to the Fund and the Invesco Funds and the profitability of Invesco Advisers and its affiliates in providing these services. The Board received information from Invesco Advisers and a report from an independent consultant engaged by the Senior Officer about the methodology used to prepare the profitability information. The Board noted that Invesco Advisers continues to operate at a net profit from services Invesco Advisers and its affiliates provide to the Invesco Funds and the Fund. The Board received and accepted information from Invesco Advisers demonstrating that Invesco Advisers and each Affiliated Sub-Adviser are financially sound and have the resources necessary to perform their obligations under the investment advisory agreement and sub-advisory contracts.
| F. | Collateral Benefits to Invesco Advisers and its Affiliates |
The Board considered various other benefits received by Invesco Advisers and its affiliates from the relationship with the Fund, including the fees received for providing transfer agency and distribution services to the Fund. The Board considered comparative information regarding fees charged for these services, including information provided by Broadridge and other independent sources. The Board considered the performance of Invesco Advisers and its affiliates in providing these services and the organizational structure employed to provide these services. The Board also considered that these services are provided to the Fund pursuant to written contracts that are reviewed and approved on an annual basis by the Board; and that the services are required for the operation of the Fund.
The Board considered the benefits realized by Invesco Advisers and the Affiliated Sub-Advisers as a result of portfolio brokerage transactions executed through “soft dollar” arrangements. The Board noted that soft dollar arrangements shift the payment obligation for research services from Invesco Advisers and the Affiliated Sub-Advisers to the Invesco Funds and that the research received may be used with other clients of Invesco Advisers and may reduce Invesco Advisers’ and the Affiliated Sub-Advisers’ expenses. The Board also considered that it receives periodic reports from the Chief Compliance Officer of the Invesco Funds demonstrating that these arrangements are consistent with regulatory requirements. The Board did not deem the soft dollar arrangements to be inappropriate.
The Board considered that the Fund’s uninvested cash and cash collateral from any securities lending arrangements may be invested in money market funds advised by
Invesco Advisers pursuant to procedures approved by the Board. The Board noted that Invesco Advisers receives advisory fees from these affiliated money market funds attributable to such investments, although Invesco Advisers has contractually agreed to waive through varying periods the advisory fees payable by the Invesco Funds with respect to certain investments in the affiliated money market funds. The waiver is in an amount equal to 100% of the net advisory fee Invesco Advisers receives from the affiliated money market funds with respect to the Fund’s investment in the affiliated money market funds of uninvested cash, but not cash collateral. The Board concluded that the amount of advisory fees received by Invesco Advisors from the Fund’s investment of cash collateral from any securities lending arrangements in the affiliated money market funds is fair and reasonable.
The Board also considered that the Fund may use an affiliated broker to execute certain trades for the Fund to, among other things, control information leakage, and was advised that such trades would be executed in compliance with rules under the Investment Company Act of 1940, as amended, and consistent with best execution obligations.
23 Invesco Select Companies Fund
Tax Information
Form 1099-DIV, Form 1042-S and other year-end tax information provide shareholders with actual calendar year amounts that should be included in their tax returns. Shareholders should consult their tax advisors.
The following distribution information is being provided as required by the Internal Revenue Code or to meet a specific state’s requirement.
The Fund designates the following amounts or, if subsequently determined to be different, the maximum amount allowable for its fiscal year ended October 31, 2016:
| | | | |
Federal and State Income Tax | |
Long-Term Capital Gain Distributions | | $ | 162,935,278 | |
Qualified Dividend Income* | | | 0.00 | % |
Corporate Dividends Received Deduction* | | | 0.00 | % |
U.S. Treasury Obligations* | | | 0.00 | % |
| | * | The above percentages are based on ordinary income dividends paid to shareholders during the Fund’s fiscal year. |
24 Invesco Select Companies Fund
Trustees and Officers
The address of each trustee and officer is AIM Investment Funds (Invesco Investment Funds) (the “Trust”), 11 Greenway Plaza, Suite 1000, Houston, Texas 77046-1173. The trustees serve for the life of the Trust, subject to their earlier death, incapacitation, resignation, retirement or removal as more specifically provided in the Trust’s organizational documents. Each officer serves for a one year term or until their successors are elected and qualified. Column two below includes length of time served with predecessor entities, if any.
| | | | | | | | |
Name, Year of Birth and
Position(s) Held with the Trust | | Trustee and/
or Officer Since | | Principal Occupation(s)
During Past 5 Years | | Number of
Funds in Fund
Complex
Overseen by
Trustee | | Other Directorship(s)
Held by Trustee During
Past 5 Years |
| Interested Persons | | | | | | | | |
| Martin L. Flanagan1 — 1960 Trustee | | 2007 | | Executive Director, Chief Executive Officer and President, Invesco Ltd. (ultimate parent of Invesco and a global investment management firm); Advisor to the Board, Invesco Advisers, Inc. (formerly known as Invesco Institutional (N.A.), Inc.); Trustee, The Invesco Funds; Vice Chair, Investment Company Institute; and Member of Executive Board, SMU Cox School of Business Formerly: Chairman and Chief Executive Officer, Invesco Advisers, Inc. (registered investment adviser); Director, Chairman, Chief Executive Officer and President, Invesco Holding Company (US) Inc. (formerly IVZ Inc.) (holding company), Invesco Group Services, Inc. (service provider) and Invesco North American Holdings, Inc. (holding company); Director, Chief Executive Officer and President, Invesco Holding Company Limited (parent of Invesco and a global investment management firm); Director, Invesco Ltd.; Chairman, Investment Company Institute and President, Co-Chief Executive Officer, Co-President, Chief Operating Officer and Chief Financial Officer, Franklin Resources, Inc. (global investment management organization) | | 146 | | None |
| Philip A. Taylor2 — 1954 Trustee and Senior Vice President | | 2006 | | Head of the Americas and Senior Managing Director, Invesco Ltd.; Director, Co-Chairman, Co-President and Co-Chief Executive Officer, Invesco Advisers, Inc. (formerly known as Invesco Institutional (N.A.), Inc.) (registered investment adviser); Director, Chairman, Chief Executive Officer and President, Invesco Management Group, Inc. (formerly known as Invesco AIM Management Group, Inc.) (financial services holding company); Director and Chairman, Invesco Investment Services, Inc. (formerly known as Invesco AIM Investment Services, Inc.) (registered transfer agent) Chief Executive Officer, Invesco Corporate Class Inc. (corporate mutual fund company) Director, Chairman and Chief Executive Officer, Invesco Canada Ltd. (formerly known as Invesco Trimark Ltd./Invesco Trimark Ltèe) (registered investment adviser and registered transfer agent); Trustee and Senior Vice President, The Invesco Funds; Director, Invesco Investment Advisers LLC (formerly known as Van Kampen Asset Management). Formerly: Director, Chief Executive Officer and President, Van Kampen Exchange Corp.; President and Principal Executive Officer, The Invesco Funds (other than AIM Treasurer’s Series Trust (Invesco Treasurer’s Series Trust), Short-Term Investments Trust and Invesco Management Trust); Executive Vice President, The Invesco Funds (AIM Treasurer’s Series Trust (Invesco Treasurer’s Series Trust), Short-Term Investments Trust and Invesco Management Trust only); Director and President, INVESCO Funds Group, Inc. (registered investment adviser and registered transfer agent); Director and Chairman, IVZ Distributors, Inc. (formerly known as INVESCO Distributors, Inc.) (registered broker dealer); Director, President and Chairman, Invesco Inc. (holding company), Invesco Canada Holdings Inc. (holding company), Trimark Investments Ltd./Placements Trimark Ltèe and Invesco Financial Services Ltd/Services Financiers Invesco Ltèe; Chief Executive Officer, Invesco Canada Fund Inc. (corporate mutual fund company); Director and Chairman, Van Kampen Investor Services Inc.; Director, Chief Executive Officer and President, 1371 Preferred Inc. (holding company) and Van Kampen Investments Inc.; Director and President, AIM GP Canada Inc. (general partner for limited partnerships) and Van Kampen Advisors, Inc.; Director and Chief Executive Officer, Invesco Trimark Dealer Inc. (registered broker dealer); Director, Invesco Distributors, Inc. (formerly known as Invesco AIM Distributors, Inc.) (registered broker dealer); Manager, Invesco PowerShares Capital Management LLC; Director, Chief Executive Officer and President, Invesco Advisers, Inc.; Director, Chairman, Chief Executive Officer and President, Invesco AIM Capital Management, Inc.; President, Invesco Trimark Dealer Inc. and Invesco Trimark Ltd./Invesco Trimark Ltèe; Director and President, AIM Trimark Corporate Class Inc. and AIM Trimark Canada Fund Inc.; Senior Managing Director, Invesco Holding Company Limited; Director and Chairman, Fund Management Company (former registered broker dealer); President and Principal Executive Officer, The Invesco Funds (AIM Treasurer’s Series Trust (Invesco Treasurer’s Series Trust), and Short-Term Investments Trust only); President, AIM Trimark Global Fund Inc. and AIM Trimark Canada Fund Inc. | | 146 | | None |
| 1 | Mr. Flanagan is considered an interested person (within the meaning of Section 2(a)(19) of the 1940 Act) of the Trust because he is an officer of the Adviser to the Trust, and an officer and a director of Invesco Ltd., ultimate parent of the Adviser. |
| 2 | Mr. Taylor is considered an interested person (within the meaning of Section 2(a)(19) of the 1940 Act) of the Trust because he is an officer and a director of the Adviser. |
T-1 Invesco Select Companies Fund
Trustees and Officers—(continued)
| | | | | | | | |
Name, Year of Birth and
Position(s) Held with the Trust | | Trustee and/
or Officer Since | | Principal Occupation(s) During Past 5 Years | | Number of
Funds in Fund
Complex
Overseen by
Trustee | | Other Directorship(s)
Held by Trustee During
Past 5 Years |
| Independent Trustees | | | | | | | | |
Bruce L. Crockett — 1944 Trustee and Chair | | 2001 | | Chairman, Crockett Technologies Associates (technology consulting company) Formerly: Director, Captaris (unified messaging provider); Director, President and Chief Executive Officer, COMSAT Corporation; Chairman, Board of Governors of INTELSAT (international communications company); ACE Limited (insurance company); Independent Directors Council and Investment Company Institute | | 146 | | ALPS (Attorneys Liability Protection Society) (insurance company) and Globe Specialty Metals, Inc. (metallurgical company); Member of the Audit Committee, Ferroglobe PLC and Investment Company Institute; Member of the Executive Committee and Chair of the Governance Committee, Independent Directors Council |
David C. Arch — 1945 Trustee | | 2010 | | Chairman of Blistex Inc., a consumer health care products manufacturer | | 146 | | Board member of the Illinois Manufacturers’ Association; Member of the Board of Visitors, Institute for the Humanities, University of Michigan |
James T. Bunch — 1942 Trustee | | 2003 | | Managing Member, Grumman Hill Group LLC (family office/private equity investments) Formerly: Chairman of the Board, Denver Film Society, Chairman of the Board of Trustees, Evans Scholarship Foundation; Chairman, Board of Governors, Western Golf Association | | 146 | | Trustee, Evans Scholarship Foundation |
Albert R. Dowden — 1941 Trustee | | 2001 | | Director of a number of public and private business corporations, including Nature’s Sunshine Products, Inc. Formerly: Director, The Boss Group, Ltd. and Reich & Tang Funds (5 portfolios) (registered investment company); Director, Homeowners of America Holding Corporation/Homeowners of America Insurance Company (property casualty company); Director, Continental Energy Services, LLC (oil and gas pipeline service); Director, CompuDyne Corporation (provider of product and services to the public security market) and Director, Annuity and Life Re (Holdings), Ltd. (reinsurance company); Director, President and Chief Executive Officer, Volvo Group North America, Inc.; Senior Vice President, AB Volvo; Director of various public and private corporations; Chairman, DHJ Media, Inc.; Director, Magellan Insurance Company; and Director, The Hertz Corporation, Genmar Corporation (boat manufacturer), National Media Corporation; Advisory Board of Rotary Power International (designer, manufacturer, and seller of rotary power engines); and Chairman, Cortland Trust, Inc. (registered investment company) | | 146 | | Director of Nature’s Sunshine Products, Inc. |
Jack M. Fields — 1952 Trustee | | 2001 | | Chief Executive Officer, Twenty First Century Group, Inc. (government affairs company); and Discovery Learning Alliance (non-profit) Formerly: Owner and Chief Executive Officer, Dos Angeles Ranch L.P. (cattle, hunting, corporate entertainment); Director, Insperity, Inc. (formerly known as Administaff); Chief Executive Officer, Texana Timber LP (sustainable forestry company); Director of Cross Timbers Quail Research Ranch (non-profit); and member of the U.S. House of Representatives | | 146 | | None |
Eli Jones — 1961 Trustee | | 2016 | | Professor and Dean, Mays Business School — Texas A&M University Formerly: Professor and Dean, Walton College of Business, University of Arkansas and E.J. Ourso College of Business, Louisiana State University and Director, Arvest Bank | | 146 | | Director of Insperity, Inc. (formerly known as Administaff) |
Prema Mathai-Davis — 1950 Trustee | | 2001 | | Retired. Formerly: Chief Executive Officer, YWCA of the U.S.A. | | 146 | | None |
Larry Soll — 1942 Trustee | | 2003 | | Retired. Formerly: Chairman, Chief Executive Officer and President, Synergen Corp. (a biotechnology company) | | 146 | | None |
Raymond Stickel, Jr. — 1944 Trustee | | 2005 | | Retired. Formerly: Director, Mainstay VP Series Funds, Inc. (25 portfolios) and Partner, Deloitte & Touche | | 146 | | None |
Robert C. Troccoli — 1949 Trustee | | 2016 | | Adjunct Professor, University of Denver — Daniels College of Business Formerly: Senior Partner, KPMG LLP | | 146 | | None |
T-2 Invesco Select Companies Fund
Trustees and Officers—(continued)
| | | | | | | | |
Name, Year of Birth and
Position(s) Held with the Trust | | Trustee and/
or Officer Since | | Principal Occupation(s) During Past 5 Years | | Number of
Funds in Fund
Complex
Overseen by
Trustee | | Other Directorship(s)
Held by Trustee During
Past 5 Years |
| Independent Trustees—(continued) |
Suzanne H. Woolsey — 1941 Trustee | | 2014 | | Retired. Formerly: Chief Executive Officer of Woolsey Partners LLC | | 146 | | Director, SunShare LLC; Trustee, Ocean Conservancy; Emeritus Chair of the Board of Trustees of the Institute for Defense Analyses and of Colorado College; Trustee, Chair, Business and Finance Committee of California Institute of Technology; Prior to 2014, Director of Fluor Corp.; Prior to 2010, Trustee of the German Marshall Fund of the United States; Prior to 2010, Trustee of the Rocky Mountain Institute |
| Other Officers | | | | | | | | |
Sheri Morris — 1964 President, Principal Executive Officer and Treasurer | | 1999 | | President, Principal Executive Officer and Treasurer, The Invesco Funds; Vice President, Invesco Advisers, Inc. (formerly known as Invesco Institutional (N.A.), Inc.) (registered investment adviser); and Vice President, PowerShares Exchange-Traded Fund Trust, PowerShares Exchange-Traded Fund Trust II, PowerShares India Exchange-Traded Fund Trust, PowerShares Actively Managed Exchange-Traded Fund Trust, and PowerShares Actively Managed Exchange-Traded Commodity Fund Trust Formerly: Vice President and Principal Financial Officer, The Invesco Funds; Vice President, Invesco AIM Advisers, Inc., Invesco AIM Capital Management, Inc. and Invesco AIM Private Asset Management, Inc.; Assistant Vice President and Assistant Treasurer, The Invesco Funds and Assistant Vice President, Invesco Advisers, Inc., Invesco AIM Capital Management, Inc. and Invesco AIM Private Asset Management, Inc.; and Treasurer, PowerShares Exchange-Traded Fund Trust, PowerShares Exchange-Traded Fund Trust II, PowerShares India Exchange-Traded Fund Trust and PowerShares Actively Managed Exchange-Traded Fund Trust | | N/A | | N/A |
Russell C. Burk — 1958 Senior Vice President and Senior Officer | | 2005 | | Senior Vice President and Senior Officer, The Invesco Funds | | N/A | | N/A |
John M. Zerr — 1962 Senior Vice President, Chief Legal Officer and Secretary | | 2006 | | Director, Senior Vice President, Secretary and General Counsel, Invesco Management Group, Inc. (formerly known as Invesco AIM Management Group, Inc.; Senior Vice President, Invesco Advisers, Inc. (formerly known as Invesco Institutional (N.A.), Inc.) (registered investment adviser); Senior Vice President and Secretary, Invesco Distributors, Inc. (formerly known as Invesco AIM Distributors, Inc.); Director, Vice President and Secretary, Invesco Investment Services, Inc. (formerly known as Invesco AIM Investment Services, Inc.) Senior Vice President, Chief Legal Officer and Secretary, The Invesco Funds; Managing Director, Invesco PowerShares Capital Management LLC; Director, Secretary and General Counsel, Invesco Investment Advisers LLC (formerly known as Van Kampen Asset Management); Secretary and General Counsel, Invesco Capital Markets, Inc. (formerly known as Van Kampen Funds Inc.) and Chief Legal Officer, PowerShares Exchange-Traded Fund Trust, PowerShares Exchange-Traded Fund Trust II, PowerShares India Exchange-Traded Fund Trust, PowerShares Actively Managed Exchange-Traded Fund Trust, and PowerShares Actively Managed Exchange-Traded Commodity Fund Trust Formerly: Director, Secretary, General Counsel and Senior Vice President, Van Kampen Exchange Corp.; Director, Vice President and Secretary, IVZ Distributors, Inc. (formerly known as INVESCO Distributors, Inc.); Director and Vice President, INVESCO Funds Group, Inc.; Director and Vice President, Van Kampen Advisors Inc.; Director, Vice President, Secretary and General Counsel, Van Kampen Investor Services Inc.; Director, Invesco Distributors, Inc. (formerly known as Invesco AIM Distributors, Inc.); Director, Senior Vice President, General Counsel and Secretary, Invesco AIM Advisers, Inc. and Van Kampen Investments Inc.; Director, Vice President and Secretary, Fund Management Company; Director, Senior Vice President, Secretary, General Counsel and Vice President, Invesco AIM Capital Management, Inc.; Chief Operating Officer and General Counsel, Liberty Ridge Capital, Inc. (an investment adviser); Vice President and Secretary, PBHG Funds (an investment company) and PBHG Insurance Series Fund (an investment company); Chief Operating Officer, General Counsel and Secretary, Old Mutual Investment Partners (a broker-dealer); General Counsel and Secretary, Old Mutual Fund Services (an administrator) and Old Mutual Shareholder Services (a shareholder servicing center); Executive Vice President, General Counsel and Secretary, Old Mutual Capital, Inc. (an investment adviser); and Vice President and Secretary, Old Mutual Advisors Funds (an investment company) | | N/A | | N/A |
T-3 Invesco Select Companies Fund
Trustees and Officers—(continued)
| | | | | | | | |
Name, Year of Birth and
Position(s) Held with the Trust | | Trustee and/
or Officer Since | | Principal Occupation(s) During Past 5 Years | | Number of
Funds in Fund
Complex
Overseen by
Trustee | | Other Directorship(s)
Held by Trustee During
Past 5 Years |
| Other Officers—(continued) | | | | | | | | |
| Karen Dunn Kelley — 1960 Senior Vice President | | 2004 | | Senior Managing Director, Investments, Invesco Ltd.; Director, Co-President, Co-Chief Executive Officer, and Co-Chairman, Invesco Advisers, Inc. (formerly known as Invesco Institutional (N.A.), Inc.) (registered investment adviser); Chairman and Director, Invesco Senior Secured Management, Inc.; Senior Vice President, Invesco Management Group, Inc. (formerly known as Invesco AIM Management Group, Inc.); Executive Vice President, Invesco Distributors, Inc. (formerly known as Invesco AIM Distributors, Inc.); Director, Invesco Mortgage Capital Inc. and Invesco Management Company Limited; Senior Vice President, The Invesco Funds Formerly: Vice President, The Invesco Funds (other than AIM Treasurer’s Series Trust (Invesco Treasurer’s Series Trust), Short-Term Investments Trust and Invesco Management Trust); and President and Principal Executive Officer, The Invesco Funds (AIM Treasurer’s Series Trust (Invesco Treasurer’s Series Trust), Short-Term Investments Trust and Invesco Management Trust only); Director and President, INVESCO Asset Management (Bermuda) Ltd., Director, INVESCO Global Asset Management DAC (formerly known as INVESCO Global Asset Management Limited) and INVESCO Management S.A.; Senior Vice President, Van Kampen Investments Inc. and Invesco Advisers, Inc. (formerly known as Invesco Institutional (N.A.), Inc.) (registered investment adviser); Director and President, Fund Management Company; Chief Cash Management Officer, Director of Cash Management, Senior Vice President, and Managing Director, Invesco AIM Capital Management, Inc.; Director of Cash Management, Senior Vice President, and Vice President, Invesco Advisers, Inc. and Vice President, The Invesco Funds (AIM Treasurer’s Series Trust (Invesco Treasurer’s Series Trust), and Short-Term Investments Trust only) | | N/A | | N/A |
Kelli Gallegos — 1970 Vice President, Principal Financial Officer and Assistant Treasurer | | 2008 | | Vice President, Principal Financial Officer and Assistant Treasurer, The Invesco Funds; Assistant Treasurer, Invesco PowerShares Capital Management LLC, PowerShares Exchange-Traded Fund Trust, PowerShares Exchange-Traded Fund Trust II, PowerShares India Exchange-Traded Fund Trust, PowerShares Actively Managed Exchange-Traded Fund Trust, and PowerShares Actively Managed Exchange-Traded Commodity Fund Trust Formerly: Assistant Vice President, The Invesco Funds | | N/A | | N/A |
Tracy Sullivan — 1962 Vice President, Chief Tax Officer and Assistant Treasurer | | 2008 | | Vice President, Chief Tax Officer and Assistant Treasurer, The Invesco Funds; Assistant Treasurer, Invesco PowerShares Capital Management LLC, PowerShares Exchange-Traded Fund Trust, PowerShares Exchange-Traded Fund Trust II, PowerShares India Exchange-Traded Fund Trust, PowerShares Actively Managed Exchange-Traded Fund Trust, and PowerShares Actively Managed Exchange-Traded Commodity Fund Trust Formerly: Assistant Vice President, The Invesco Funds | | N/A | | N/A |
Crissie M. Wisdom — 1969 Anti-Money Laundering Compliance Officer | | 2013 | | Anti-Money Laundering Compliance Officer, Invesco Advisers, Inc. (formerly known as Invesco Institutional (N.A.), Inc.) (registered investment adviser), Invesco Capital Markets, Inc. (formerly known as Van Kampen Funds Inc.), Invesco Distributors, Inc., Invesco Investment Services, Inc., Invesco Management Group, Inc., The Invesco Funds, and PowerShares Exchange-Traded Fund Trust, PowerShares Exchange-Traded Fund Trust II, PowerShares India Exchange-Traded Fund Trust, PowerShares Actively Managed Exchange-Traded Fund Trust and PowerShares Actively Managed Exchange-Traded Commodity Fund Trust; Anti-Money Laundering Compliance Officer and Bank Secrecy Act Officer, INVESCO National Trust Company and Invesco Trust Company; and Fraud Prevention Manager and Controls and Risk Analysis Manager for Invesco Investment Services, Inc. Formerly: Anti-Money Laundering Compliance Officer, Van Kampen Exchange Corp. | | N/A | | N/A |
Robert R. Leveille — 1969 Chief Compliance Officer | | 2016 | | Chief Compliance Officer, Invesco Advisers, Inc. (registered investment adviser); and Chief Compliance Officer, The Invesco Funds Formerly: Chief Compliance Officer, Putnam Investments and the Putnam Funds | | N/A | | N/A |
The Statement of Additional Information of the Trust includes additional information about the Fund’s Trustees and is available upon request, without charge, by calling 1.800.959.4246. Please refer to the Fund’s Statement of Additional Information for information on the Fund’s sub-advisers.
| | | | | | |
Office of the Fund 11 Greenway Plaza, Suite 1000 Houston, TX 77046-1173 | | Investment Adviser Invesco Advisers, Inc. 1555 Peachtree Street, N.E. Atlanta, GA 30309 | | Distributor Invesco Distributors, Inc. 11 Greenway Plaza, Suite 1000 Houston, TX 77046-1173 | | Auditors PricewaterhouseCoopers LLP 1000 Louisiana Street, Suite 5800 Houston, TX 77002-5678 |
| | | |
| | | | | | |
Counsel to the Fund Stradley Ronon Stevens & Young, LLP 2005 Market Street, Suite 2600 Philadelphia, PA 19103-7018 | | Counsel to the Independent Trustees Goodwin Procter LLP 901 New York Avenue, N.W. Washington, D.C. 20001 | | Transfer Agent Invesco Investment Services, Inc. 11 Greenway Plaza, Suite 1000 Houston, TX 77046-1173 | | Custodian State Street Bank and Trust Company 225 Franklin Street Boston, MA 02110-2801 |
T-4 Invesco Select Companies Fund
Explore High-Conviction Investing with Invesco

Invesco mailing information
Send general correspondence to Invesco Investment Services, Inc., P.O. Box 219078, Kansas City, MO 64121-9078.
Important notice regarding delivery of security holder documents
To reduce Fund expenses, only one copy of most shareholder documents may be mailed to shareholders with multiple accounts at the same address (Householding). Mailing of your shareholder documents may be householded indefinitely unless you instruct us otherwise. If you do not want the mailing of these documents to be combined with those for other members of your household, please contact Invesco Investment Services, Inc. at 800 959 4246 or contact your financial institution. We will begin sending you individual copies for each account within 30 days after receiving your request.
Fund holdings and proxy voting information
The Fund provides a complete list of its holdings four times in each fiscal year, at the quarter ends. For the second and fourth quarters, the lists appear in the Fund’s semiannual and annual reports to shareholders. For the first and third quarters, the Fund files the lists with the Securities and Exchange Commission (SEC) on Form N-Q. The most recent list of portfolio holdings is available at invesco.com/completeqtrholdings. Shareholders can also look up the Fund’s Forms N-Q on the SEC website at sec.gov. Copies of the Fund’s Forms N-Q may be reviewed and copied at the SEC Public Reference Room in Washington, D.C. You can obtain information on the operation of the Public Reference Room, including information about duplicating fee charges, by calling 202 551 8090 or 800 732 0330, or by electronic request at the following email address: publicinfo@sec.gov. The SEC file numbers for the Fund are shown below.
A description of the policies and procedures that the Fund uses to determine how to vote proxies relating to portfolio securities is available without charge, upon request, from our Client Services department at 800 959 4246 or at invesco.com/proxyguidelines. The information is also available on the SEC website, sec.gov.
| | |
Information regarding how the Fund voted proxies related to its portfolio securities during the most recent 12-month period ended June 30 is available at invesco.com/proxysearch. The information is also available on the SEC website, sec.gov. Invesco Advisers, Inc. is an investment adviser; it provides investment advisory services to individual and institutional clients and does not sell securities. Invesco Distributors, Inc. is the US distributor for Invesco Ltd.’s retail mutual funds, exchange-traded funds and institutional money market funds. Both are wholly owned, indirect subsidiaries of Invesco Ltd. | |  |
| | | | |
| SEC file numbers: 811-05426 and 033-19338 | | SCO-AR-1 | | Invesco Distributors, Inc. |
| | | | |
| | |
 | | Annual Report to Shareholders | | October 31, 2016 |
| | |
| | Invesco International Total Return Fund |
| | Effective December 1, 2016, after the close of the reporting period, |
| | Invesco International Total Return Fund was renamed Invesco World Bond Fund. |
| |
| | Nasdaq: |
| | A: AUBAX ∎ B: AUBBX ∎ C: AUBCX ∎ Y: AUBYX ∎ R5: AUBIX ∎ R6: AUBFX |

Letters to Shareholders
| | |

Philip Taylor | | Dear Shareholders: This annual report includes information about your Fund, including performance data and a complete list of its investments as of the close of the reporting period. Inside is a discussion of how your Fund was managed and the factors that affected its performance during the reporting period. In December 2015, the US Federal Reserve raised short-term interest rates for the first time since 2006, signaling its belief that the economy was likely to continue strengthening. Indeed, throughout the reporting period, US economic data were generally positive and the economy expanded at a moderate rate – but there were some bumps along the road. Job growth in May 2016 was very weak, but it was followed by strong increases in nonfarm payrolls in June and July. Increased concerns about global economic weakness caused US stock market indexes to sink at the start of calendar year 2016, but they eventually recovered; they sank again following |
| the UK’s decision to leave the European Union, but then quickly recovered and reached record highs later in the summer. Strong demand for income-producing investments, particularly those perceived to be lower risk, benefited bonds as well as dividend-paying stocks for much of the reporting period. While economic news in the US was generally positive, news overseas was less upbeat. The European Central Bank, and central banks in China and Japan – as well as other countries – maintained extraordinarily accommodative monetary policies in response to economic weakness. As the fiscal year drew to a close, uncertainty about the outcome of the US presidential election resulted in increased market volatility; the surprise outcome after the close of the reporting period suggested that market volatility may continue for some time to come. |
Short-term market volatility can prompt some investors to abandon their investment plans – and can cause others to settle for average results. The investment professionals at Invesco, in contrast, invest with high conviction, take a long-term perspective and have a passion to exceed. Invesco’s pure focus on investment management eliminates possible distractions and means that there are no competing lines of business for us to support. Just as important, we embrace a variety of investment strategies, asset classes and geographies – because we know that no single investment approach meets the diverse needs of all of our clients. We manage all our investment approaches with a passion to exceed. All our investment teams have a highly disciplined, long-term investing style that eliminates short-term decision-making. Of course, investing with high conviction can’t guarantee a profit or ensure success; no investment strategy can. To learn more about how we invest with high conviction, visit invesco.com/HighConviction.
You, too, can invest with high conviction by maintaining a long-term investment perspective and by working with your financial adviser on a regular basis. During periods of short-term market volatility or uncertainty, your financial adviser can keep you focused on your long-term investment goals – a new home, a child’s college education or a secure retirement. He or she also can share research about the economy, the markets and individual investment options.
Visit our website for more information on your investments
Our website, invesco.com/us, offers a wide range of market insights and investment perspectives. On the website, you’ll find detailed information about our funds, including performance, holdings and portfolio manager commentaries. You can access information about your account by completing a simple, secure online registration. Click on the “Need to register” link in the “Account Access” box on our homepage to get started.
In addition to the resources accessible on our website and through our mobile app, you can obtain timely updates to help you stay informed about the markets, the economy and investing by connecting with Invesco on Twitter, LinkedIn or Facebook. You can access our blog at blog.invesco.us.com. Our goal is to provide you the information you want, when and where you want it.
Finally, I’m pleased to share with you Invesco’s commitment to both the Principles for Responsible Investment and to considering environmental, social and governance issues in our robust investment process. I invite you to learn more at invesco.com/esg.
Have questions?
For questions about your account, contact an Invesco client services representative at 800 959 4246. For Invesco-related questions or comments, please email me directly at phil@invesco.com.
All of us at Invesco look forward to serving your investment management needs. Thank you for investing with us.
Sincerely,

Philip Taylor
Senior Managing Director, Invesco Ltd.
2 Invesco International Total Return Fund
| | | | | | |

Bruce Crockett | | | | Dear Fellow Shareholders: Among the many important lessons I’ve learned in more than 40 years in a variety of business endeavors is the value of a trusted advocate. As independent chair of the Invesco Funds Board, I can assure you that the members of the Board are strong advocates for the interests of investors in Invesco’s mutual funds. We work hard to represent your interests through oversight of the quality of the investment management services your funds receive and other matters important to your investment, including but not limited to: |
| | | | ∎ | | Ensuring that Invesco offers a diverse lineup of mutual funds that your financial adviser can use to strive to meet your financial needs as your investment goals change over time. |
| | | | ∎ | | Monitoring how the portfolio management teams of the Invesco funds are performing in light of changing economic and market conditions. |
| ∎ | Assessing each portfolio management team’s investment performance within the context of the investment strategy described in the fund’s prospectus. |
| ∎ | Monitoring for potential conflicts of interests that may impact the nature of the services that your funds receive. |
We believe one of the most important services we provide our fund shareholders is the annual review of the funds’ advisory and sub-advisory contracts with Invesco Advisers and its affiliates. This review is required by the Investment Company Act of 1940 and focuses on the nature and quality of the services Invesco provides as the adviser to the Invesco funds and the reasonableness of the fees that it charges for those services. Each year, we spend months carefully reviewing information received from Invesco and a variety of independent sources, such as performance and fee data prepared by Lipper Inc., an independent, third-party firm widely recognized as a leader in its field. We also meet with our independent legal counsel and other independent advisers to review and help us assess the information that we have received. Our goal is to assure that you receive quality investment management services for a reasonable fee.
I trust the measures outlined above provide assurance that you have a worthy advocate when it comes to choosing the Invesco Funds.
As always, please contact me at bruce@brucecrockett.com with any questions or concerns you may have. On behalf of the Board, we look forward to continuing to represent your interests and serving your needs.
Sincerely,

Bruce L. Crockett
Independent Chair
Invesco Funds Board of Trustees
3 Invesco International Total Return Fund
Management’s Discussion of Fund Performance
| | | | |
Performance summary For the fiscal year ended October 31, 2016, Class A shares of Invesco International Total Return Fund (the Fund), at net asset value (NAV), outperformed the Fund’s broad market/style-specific index, the Bloomberg Barclays Global Aggregate ex-U.S. Index. Your Fund’s long-term performance appears later in this report. | |
Fund vs. Indexes Total returns, 10/31/15 to 10/31/16, at net asset value (NAV). Performance shown does not include applicable contingent deferred sales charges (CDSC) or front-end sales charges, which would have reduced performance. | |
Class A Shares | | | 8.02 | % |
Class B Shares | | | 7.35 | |
Class C Shares | | | 7.24 | |
Class Y Shares | | | 8.40 | |
Class R5 Shares | | | 8.29 | |
Class R6 Shares | | | 8.29 | |
Bloomberg Barclays Global Aggregate ex-U.S. Indexq (Broad Market/Style-Specific Index) | | | 6.47 | |
Lipper International Income Funds Index∎ (Peer Group Index) | | | 5.13 | |
Source(s): qFactSet Research Systems Inc.; ∎Lipper Inc. | | | | |
Market conditions and your Fund
The fiscal year began in the midst of heightened global financial market volatility triggered by a significant sell-off in Chinese equities over economic growth concerns and uncertainty regarding China’s monetary and fiscal policy. In January, the confluence of global growth concerns with respect to emerging economies such as China and the effect of slower growth with respect to oil demand and lower oil prices and the impact that this had on energy company profits and firm solvency all came together to produce a “perfect storm” that roiled global financial markets. From just before the end of 2015 through mid-February, 10-year global government yields plummeted while government bond prices rose. Government bonds played their traditional role of buffering risk-asset volatility such as that of equities. Riskier asset
classes such as equities, commodities and bonds that carry credit risks associated with them (such as high yield and emerging market debt) posted significant losses.
With respect to global central bank policy, the US Federal Reserve (the Fed) raised interest rates in December 2015 – its first increase since 2006. Realizing the systemic risks from the fallout of financial markets and the subsequent financial tightening – which could significantly hamper economic growth and overall economic health – global central banks quickly acted to provide liquidity and more accommodative monetary policy measures to help spur growth. In the case of the Fed, it was more rhetoric as it adopted language stating that risks to the economy would slow the frequency of rate hikes and that the neutral rate would likely be lower than it has been historically. In September 2016, the Fed decided against raising short-term rates again, but signaled that a
| | |
Portfolio Composition |
By sector | | % of total net assets |
| | | | |
| Sovereign Debt | | | 46.1 | % |
Financials | | | 20.3 | |
| Industrials | | | 4.7 | |
Energy | | | 4.3 | |
| Telecommunication Services | | | 3.9 | |
| Collateralized Mortgage Obligations | | | 3.6 | |
Utilities | | | 3.6 | |
Consumer Staples | | | 2.6 | |
Information Technology | | | 2.6 | |
Consumer Discretionary | | | 1.6 | |
| Other Sectors, Each Less than 2% | | | 1.7 | |
| Money Market Funds Plus Other Assets Less Liabilities | | | 5.0 | |
| | | | | | |
| Top 5 Debt Issuers* |
| | | | | | % of total net assets |
| | | | | | | | |
| | 1. | | | Italy Buoni Poliennali Del Tesoro | | | 9.0 | % |
| | 2. | | | Spain Government Bond | | | 4.9 | |
| | 3. | | | Ireland Government Bond | | | 4.8 | |
| | 4. | | | United Kingdom Gilt | | | 4.3 | |
| | 5. | | | Asian Development Bank | | | 3.5 | |
| | | | | | |
Total Net Assets | | $ | 44.9 million | |
| |
Total Number of Holdings* | | | 94 | |
The Fund’s holdings are subject to change, and there is no assurance that the Fund will continue to hold any particular security.
*Excluding money market fund holdings.
Data presented here are as of October 31, 2016.
December hike would be likely. The Bank of Japan and the European Central Bank adopted negative interest rates in an attempt to stimulate growth by forcing investors to spend rather than save. These actions, together with the stabilization of oil prices, calmed markets and induced a significant rally across most risk asset classes. Additionally, the Bank of Japan adjusted its monetary policy in September in an effort to manage the steepness of its yield curve. This softened Japanese demand for US Treasuries, which helped to steepen the US yield curve as Japanese investors sold US Treasuries to purchase Japanese government bonds.
Geopolitics in the form of the UK vote to leave the European Union did its part to reignite volatility. However, it was short-lived as central banks remained diligent in their commitment to keep financial markets functioning and promote economic growth. The UK vote, coupled with negative global government interest rates, had the effect of driving the 10-year US Treasury yield to an all-time low of 1.37%.1 The 10-year US Treasury yield ended the reporting period at 1.84%, 32 basis points lower than at the beginning of the reporting period.1 (A basis point is one one-hundredth of a percentage point.)
All fixed income sectors (Treasuries, government-related, corporate and securitized debt) posted positive returns for the fiscal year. Exposure to global high yield and emerging market debt provided strong gains despite concerns over global growth, volatile commodity prices and the specter of Fed interest rate hikes. Helping to support returns in high yield and emerging market debt were very accommodative central bank policies, signs of recovery in various emerging market economies, and global demand for assets carrying adequate yields.
The Fund, at NAV, outperformed its broad market/style-specific benchmark, the Bloomberg Barclays Global Aggregate ex-U.S. Index, for the reporting period. Exposure to high yield corporate credit was one of the most notable contributors to the Fund’s relative performance. Overweight exposure and security selection within US dollar-denominated investment grade credit also added to performance relative to the Fund’s broad market/style-specific index. Security selection within high yield corporate credit detracted from the Fund’s relative performance. The Fund’s exposure to derivatives, which are used to hedge credit risk,
|
| 4 Invesco International Total Return Fund |
also detracted from relative returns. With respect to foreign currency, the Fund’s exposure to the British pound, the Chinese renminbi and Canadian dollar contributed to relative performance, while exposure to the euro, Japanese yen and Mexican peso detracted from Fund returns.
The Fund used active duration and yield curve positioning for risk management and for generating alpha versus its broad market/style-specific index. Alpha is a measure of performance on a risk-adjusted basis. Duration measures a portfolio’s price sensitivity to interest rate changes. Yield curve positioning refers to actively emphasizing points (maturities) along the yield curve with favorable risk/return expectations. Duration and yield curve positioning across the various global yield curves contributed to Fund performance versus the Fund’s broad market/style-specific index. Duration was managed with cash, bonds and futures positions. Buying and selling interest rate futures contracts across multiple global yield curves was an important tool we used to manage interest rate risk and maintain our targeted portfolio duration.
Please note that we implemented our strategy using derivative instruments, including futures, forwards, swaps and options. Therefore, a portion of the performance of the strategy, both positive and negative, can be attributed to these instruments. Derivatives can be a cost-effective way to gain or hedge exposure to certain investment risks. However, derivatives may amplify traditional investment risks through the creation of leverage and may be less liquid than traditional securities.
Part of the Fund’s strategy to manage credit and currency risk in the portfolio during the reporting period entailed purchasing and selling credit and currency derivatives. We managed credit market risk by purchasing and selling protection through credit default swaps at various points throughout the fiscal year. The currency management was carried out via currency forwards and options on an as-needed basis and was effective in managing the currency positioning within the Fund.
We wish to remind you that the Fund is subject to interest rate risk, meaning when interest rates rise, the value of fixed income securities tends to fall. The risk may be greater in the current market environment because interest rates are at or near historic lows. The degree to which the value of fixed income securities may decline due to rising interest rates
may vary depending on the speed and magnitude of the increase in interest rates, as well as individual security characteristics such as price, maturity, duration and coupon and market forces such as supply and demand for similar securities. We are monitoring interest rates, and the market, economic and geopolitical factors that may impact the direction, speed and magnitude of changes to interest rates across the maturity spectrum, including the potential impact of monetary policy changes by the Fed and certain foreign central banks. If interest rates rise, markets may experience increased volatility, which may affect the value and/ or liquidity of certain of the Fund’s investments.
Thank you for investing in Invesco International Total Return Fund and for sharing our long-term investment horizon.
1 Source: US Department of Treasury
The views and opinions expressed in management’s discussion of Fund performance are those of Invesco Advisers, Inc. These views and opinions are subject to change at any time based on factors such as market and economic conditions. These views and opinions may not be relied upon as investment advice or recommendations, or as an offer for a particular security. The information is not a complete analysis of every aspect of any market, country, industry, security or the Fund. Statements of fact are from sources considered reliable, but Invesco Advisers, Inc. makes no representation or warranty as to their completeness or accuracy. Although historical performance is no guarantee of future results, these insights may help you understand our investment management philosophy.
See important Fund and, if applicable, index disclosures later in this report.

Avi Hooper
Chartered Financial Analyst, Portfolio Manager, is lead manager of Invesco International Total Return Fund. He joined Invesco in 2010. Mr. Hooper earned a BAS with a focus in accounting and finance from York University.

Raymund Uy
Chartered Financial Analyst, Portfolio Manager and Head of Currencies for Invesco Fixed Income, is manager of Invesco International Total Return Fund. He joined Invesco in 2012. Mr. Uy earned a BBA from Hofstra University.

Robert Waldner
Chartered Financial Analyst, Portfolio Manager, is manager of Invesco International Total Return Fund. He joined Invesco in 2013. Mr. Waldner earned a BSE degree in civil engineering from Princeton University.
|
| 5 Invesco International Total Return Fund |
Your Fund’s Long-Term Performance
Results of a $10,000 Investment – Oldest Share Class(es)
Fund and index data from 10/31/06
| 2 | Source: FactSet Research Systems Inc. |
Past performance cannot guarantee comparable future results.
The data shown in the chart include reinvested distributions, applicable sales charges and Fund expenses including management fees. Results for Class B shares are calculated as if a hypothetical
shareholder had liquidated his entire investment in the Fund at the close of the reporting period and paid the contingent deferred sales charges, if applicable. Index results include reinvested dividends, but they do not reflect sales charges. Performance of the peer group,
if applicable, reflects fund expenses and management fees; performance of a market index does not. Performance shown in the chart and table(s) does not reflect deduction of taxes a shareholder would pay on Fund distributions or sale of Fund shares.
continued from page 9
About indexes used in this report
| ∎ | | The Bloomberg Barclays Global Aggregate ex-U.S. Index is an unmanaged index considered representative of bonds of foreign countries. |
| ∎ | | The Lipper International Income Funds Index is an unmanaged index considered representative of international income funds tracked by Lipper. |
| ∎ | | The Fund is not managed to track the performance of any particular index, including the index(es) described here, and consequently, the performance of the Fund may deviate significantly from the performance of the index(es). |
| ∎ | | A direct investment cannot be made in an index. Unless otherwise indicated, index results include reinvested dividends, and they do not reflect sales charges. Performance of the peer group, if applicable, reflects fund expenses; performance of a market index does not. |
Other information
| ∎ | | The returns shown in management’s discussion of Fund performance are based on net asset values (NAVs) calculated for shareholder transactions. Generally accepted accounting principles require adjustments to be made to the net assets of the Fund at period end for financial reporting purposes, and as such, the NAVs for shareholder transactions and the returns based on those NAVs may differ from the NAVs and returns reported in the Financial Highlights. |
| ∎ | | Industry classifications used in this report are generally according to the Global Industry Classification Standard, which was developed by and is the exclusive property and a service mark of MSCI Inc. and Standard & Poor’s. |
6 Invesco International Total Return Fund
| | | | |
Average Annual Total Returns | |
As of 10/31/16, including maximum applicable sales charges | |
| |
Class A Shares | | | | |
Inception (3/31/06) | | | 3.21 | % |
10 Years | | | 2.79 | |
5 Years | | | -0.30 | |
1 Year | | | 3.39 | |
| |
Class B Shares | | | | |
Inception (3/31/06) | | | 3.04 | % |
10 Years | | | 2.63 | |
5 Years | | | -0.52 | |
1 Year | | | 2.35 | |
| |
Class C Shares | | | | |
Inception (3/31/06) | | | 2.85 | % |
10 Years | | | 2.46 | |
5 Years | | | -0.18 | |
1 Year | | | 6.24 | |
| |
Class Y Shares | | | | |
10 Years | | | 3.44 | % |
5 Years | | | 0.83 | |
1 Year | | | 8.40 | |
| |
Class R5 Shares | | | | |
Inception (3/31/06) | | | 3.89 | % |
10 Years | | | 3.49 | |
5 Years | | | 0.83 | |
1 Year | | | 8.29 | |
| |
Class R6 Shares | | | | |
10 Years | | | 3.34 | % |
5 Years | | | 0.78 | |
1 Year | | | 8.29 | |
Class Y shares incepted on October 3, 2008. Performance shown prior to that date is that of Class A shares and includes the 12b-1 fees applicable to Class A shares.
Class R6 shares incepted on September 24, 2012. Performance shown prior to that date is that of Class A shares and includes the 12b-1 fees applicable to Class A shares.
The performance data quoted represent past performance and cannot guarantee comparable future results; current performance may be lower or higher. Please visit invesco.com/performance for the most recent month-end performance. Performance figures reflect reinvested distributions, changes in net asset value and the effect of the maximum sales charge unless otherwise stated. Investment return and principal value will fluctuate so that you may have a gain or loss when you sell shares.
The net annual Fund operating expense ratio set forth in the most recent Fund prospectus as of the date of this
| | |
Average Annual Total Returns |
As of 9/30/16, the most recent calendar quarter end, including maximum applicable sales charges |
| | | | |
| |
Class A Shares | | | | |
Inception (3/31/06) | | | 3.60 | % |
10 Years | | | 3.26 | |
5 Years | | | 0.77 | |
1 Year | | | 7.88 | |
| |
Class B Shares | | | | |
Inception (3/31/06) | | | 3.43 | % |
10 Years | | | 3.11 | |
5 Years | | | 0.54 | |
1 Year | | | 6.82 | |
| |
Class C Shares | | | | |
Inception (3/31/06) | | | 3.24 | % |
10 Years | | | 2.93 | |
5 Years | | | 0.89 | |
1 Year | | | 10.71 | |
| |
Class Y Shares | | | | |
10 Years | | | 3.91 | % |
5 Years | | | 1.91 | |
1 Year | | | 12.92 | |
| |
Class R5 Shares | | | | |
Inception (3/31/06) | | | 4.28 | % |
10 Years | | | 3.97 | |
5 Years | | | 1.91 | |
1 Year | | | 12.80 | |
| |
Class R6 Shares | | | | |
10 Years | | | 3.81 | % |
5 Years | | | 1.84 | |
1 Year | | | 12.80 | |
report for Class A, Class B, Class C, Class Y, Class R5 and Class R6 shares was 1.10%, 1.85%, 1.85%, 0.85%, 0.85% and 0.85%, respectively.1 The total annual Fund operating expense ratio set forth in the most recent Fund prospectus as of the date of this report for Class A, Class B, Class C, Class Y, Class R5 and Class R6 shares was 1.72%, 2.47%, 2.47%, 1.47%, 1.16% and 1.16%, respectively. The expense ratios presented above may vary from the expense ratios presented in other sections of this report that are based on expenses incurred during the period covered by this report.
Class A share performance reflects the maximum 4.25% sales charge, and Class B and Class C share performance reflects the applicable contingent deferred sales charge (CDSC) for the period involved. The CDSC on Class B shares declines from 5% beginning at the time of purchase to 0% at the beginning of the seventh year. The CDSC on Class C shares is 1% for the first year after purchase. Class Y, Class R5 and
Class R6 shares do not have a front-end sales charge or a CDSC; therefore, performance is at net asset value.
The performance of the Fund’s share classes will differ primarily due to different sales charge structures and class expenses.
Fund performance reflects any applicable fee waivers and/or expense reimbursements. Had the adviser not waived fees and/or reimbursed expenses currently or in the past, returns would have been lower. See current prospectus for more information.
| 1 | Total annual Fund operating expenses after any contractual fee waivers and/or expense reimbursements by the adviser in effect through at least February 28, 2017. See current prospectus for more information. |
7 Invesco International Total Return Fund
Invesco International Total Return Fund’s investment objective is total return, comprised of current income and capital appreciation.
| ∎ | | Unless otherwise stated, information presented in this report is as of October 31, 2016, and is based on total net assets. |
| ∎ | | Unless otherwise noted, all data provided by Invesco. |
| ∎ | | To access your Fund’s reports/prospectus, visit invesco.com/fundreports. |
About share classes
| ∎ | | Class B shares may not be purchased for new or additional investments. Please see the prospectus for more information. |
| ∎ | | Class Y shares are available to only certain investors. Please see the prospectus for more information. |
| ∎ | | Class R5 shares and Class R6 shares are primarily intended for employer sponsored retirement and benefit plans that meet certain standards and for institutional investors. Please see the prospectus for more information. |
Principal risks of investing
in the Fund
| ∎ | | Active trading risk. Active trading of portfolio securities may result in added expenses, a lower return and increased tax liability. |
| ∎ | | Changing fixed income market conditions risk. The current low interest rate environment was created in part by the Federal Reserve Board (FRB) and certain foreign central banks keeping the federal funds and equivalent foreign rates at or near zero. Increases in the federal funds and equivalent foreign rates may expose fixed income markets to heightened volatility and reduced liquidity for certain fixed income investments, particularly those with longer maturities. In addition, decreases in fixed income dealer market-making capacity may also potentially lead to heightened volatility and reduced liquidity in the fixed income markets. As a result, the value of the Fund’s investments and share price may decline. Changes in central bank policies could also result in higher than normal shareholder redemptions, which could potentially increase portfolio turnover and the Fund’s transaction costs. |
| ∎ | | Collateralized loan obligations risk. CLOs are subject to the risks of substantial losses due to actual defaults by underlying borrowers, which will be greater during periods of economic or financial stress. CLOs may also lose |
value due to collateral defaults and disappearance of subordinate tranches, market anticipation of defaults, and investor aversion to CLO securities as a class. The risks of CLOs will be greater if the Fund invests in CLOs that hold loans of uncreditworthy borrowers or if the Fund holds subordinate tranches of the CLO that absorbs losses from the defaults before senior tranches. In addition, CLOs are subject to interest rate risk and credit risk.
| ∎ | | Debt securities risk. The prices of debt securities held by the Fund will be affected by changes in interest rates, the creditworthiness of the issuer and other factors. An increase in prevailing interest rates typically causes the value of existing debt securities to fall and often has a greater impact on longer-duration debt securities and higher quality debt securities. Falling interest rates will cause the Fund to reinvest the proceeds of debt securities that have been repaid by the issuer at lower interest rates. Falling interest rates may also reduce the Fund’s distributable income because interest payments on floating rate debt instruments held by the Fund will decline. The Fund could lose money on investments in debt securities if the issuer or borrower fails to meet its obligations to make interest payments and/or to repay principal in a timely manner. Changes in an issuer’s financial strength, the market’s perception of such strength or in the credit rating of the issuer or the security may affect the value of debt securities. The Adviser’s credit analysis may fail to anticipate such changes, which could result in buying a debt security at an inopportune time or failing to sell a debt security in advance of a price decline or other credit event. |
| ∎ | | Derivatives risk. The value of a derivative instrument depends largely on (and is derived from) the value of an underlying security, currency, commodity, interest rate, index or other asset (each referred to as an underlying |
asset). In addition to risks relating to the underlying assets, the use of derivatives may include other, possibly greater, risks, including counterparty, leverage and liquidity risks. Counter-party risk is the risk that the counter-party to the derivative contract will default on its obligation to pay the Fund the amount owed or otherwise perform under the derivative contract. Derivatives create leverage risk because they do not require payment up front equal to the economic exposure created by owning the derivative. As a result, an adverse change in the value of the underlying asset could result in the Fund sustaining a loss that is substantially greater than the amount invested in the derivative, which may make the Fund’s returns more volatile and increase the risk of loss. Derivative instruments may also be less liquid than more traditional investments and the Fund may be unable to sell or close out its derivative positions at a desirable time or price. This risk may be more acute under adverse market conditions, during which the Fund may be most in need of liquidating its derivative positions. Derivatives may also be harder to value, less tax efficient and subject to changing government regulation that could impact the Fund’s ability to use certain derivatives or their cost. Also, derivatives used for hedging or to gain or limit exposure to a particular market segment may not provide the expected benefits, particularly during adverse market conditions.
| ∎ | | Emerging markets securities risk. Emerging markets (also referred to as developing markets) are generally subject to greater market volatility, political, social and economic instability, uncertain trading markets and more governmental limitations on foreign investment than more developed markets. In addition, emerging markets may be subject to lower trading volume and greater price fluctuations than companies in more developed markets. Securities law and the enforcement of systems of taxation in many emerging market countries may change quickly and unpredictably. In addition, investments in emerging markets securities may also be subject to additional transaction costs, delays in settlement procedures, and lack of timely information. |
| | |
This report must be accompanied or preceded by a currently effective Fund prospectus, which contains more complete information, including sales charges and expenses. Investors should read it carefully before investing. | | |
| | |
| NOT FDIC INSURED | MAY LOSE VALUE | NO BANK GUARANTEE | | |
8 Invesco International Total Return Fund
| ∎ | | Foreign currency tax risk. If the US Treasury Department were to exercise its authority to issue regulations that exclude from the definition of “qualifying income” foreign currency gains not directly related to the Fund’s business of investing in securities, the Fund may be unable to qualify as a regulated investment company for one or more years. In this event, the Fund’s Board of Trustees may authorize a significant change in investment strategy or other action. |
| ∎ | | Foreign government debt risk. Investments in foreign government debt securities (sometimes referred to as sovereign debt securities) involve certain risks in addition to those relating to foreign securities or debt securities generally. The issuer of the debt or the governmental authorities that control the repayment of the debt may be unable or unwilling to repay principal or interest when due in accordance with the terms of such debt, and the Fund may have limited recourse in the event of a default against the defaulting government. Without the approval of debt holders, some governmental debtors have in the past been able to reschedule or restructure their debt payments or declare moratoria on payments. |
| ∎ | | Foreign securities risk. The Fund’s foreign investments may be adversely affected by political and social instability, changes in economic or taxation policies, difficulty in enforcing obligations, decreased liquidity or increased volatility. Foreign investments also involve the risk of the possible seizure, nationalization or expropriation of the issuer or foreign deposits (in which the Fund could lose its entire investments in a certain market) and the possible adoption of foreign governmental restrictions such as exchange controls. Unless the Fund has hedged its foreign securities risk, foreign securities risk also involves the risk of negative foreign currency rate fluctuations, which may cause the value of securities denominated in such foreign currency (or other instruments through which the Fund has exposure to foreign currencies) to decline in value. Currency exchange rates may fluctuate significantly over short periods of time. Currency hedging strategies, if used, are not always successful. |
| ∎ | | High yield debt securities (junk bond) risk. Investments in high yield debt securities (“junk bonds”) and other lower-rated securities will subject the Fund to substantial risk of loss. These securities are considered to be speculative with |
respect to the issuer’s ability to pay interest and principal when due, are more susceptible to default or decline in market value and are less liquid than investment grade debt securities. Prices of high yield debt securities tend to be very volatile.
| ∎ | | Liquidity risk. The Fund may be unable to sell illiquid investments at the time or price it desires and, as a result, could lose its entire investment in such investments. Liquid securities can become illiquid during periods of market stress. If a significant amount of the Fund’s securities become illiquid, the Fund may not be able to timely pay redemption proceeds and may need to sell securities at significantly reduced prices. |
| ∎ | | Management risk. The Fund is actively managed and depends heavily on the Adviser’s judgment about markets, interest rates or the attractiveness, relative values, liquidity, or potential appreciation of particular investments made for the Fund’s portfolio. The Fund could experience losses if these judgments prove to be incorrect. Additionally, legislative, regulatory, or tax developments may adversely affect management of the Fund and, therefore, the ability of the Fund to achieve its investment objective. |
| ∎ | | Market risk. The market values of the Fund’s investments, and therefore the value of the Fund’s shares, will go up and down, sometimes rapidly or unpredictably. Market risk may affect a single issuer, industry or section of the economy, or it may affect the market as a whole. Individual stock prices tend to go up and down more dramatically than those of certain other types of investments, such as bonds. During a general downturn in the financial markets, multiple asset classes may decline in value. When markets perform well, there can be no assurance that specific investments held by the Fund will rise in value. |
| ∎ | | Mortgage- and asset-backed securities risk. Mortgage- and asset-backed securities, including collateralized debt obligations and collateralized mortgage obligations, are subject to prepayment or call risk, which is the risk that a borrower’s payments may be received earlier or later than expected due to changes in prepayment rates on underlying loans. This could result in the Fund reinvesting these early payments at lower interest rates, thereby reducing the Fund’s income. Mortgage- and asset-backed securities also are subject to extension risk, which is the risk that an unexpected rise in interest rates |
could reduce the rate of prepayments, causing the price of the mortgage- and asset-backed securities and the Fund’s share price to fall. An unexpectedly high rate of defaults on the mortgages held by a mortgage pool may adversely affect the value of mortgage-backed securities and could result in losses to the Fund. The Fund may invest in mortgage pools that include subprime mortgages, which are loans made to borrowers with weakened credit histories or with lower capacity to make timely payments on their mortgages. Privately issued mortgage-related securities are not subject to the same underwriting requirements as those with government or government-sponsored entity guarantee and, therefore, mortgage loans underlying privately issued mortgage-related securities may have less favorable collateral, credit risk or other underwriting characteristics, and wider variances in interest rate, term, size, purpose and borrower characteristics.
| ∎ | | When-issued, delayed delivery and forward commitment risks. When-issued and delayed delivery transactions subject the Fund to market risk because the value or yield of a security at delivery may be more or less than the purchase price or yield generally available when delivery occurs, and counter-party risk because the Fund relies on the buyer or seller, as the case may be, to consummate the transaction. These transactions also have a leveraging effect on the Fund because the Fund commits to purchase securities that it does not have to pay for until a later date, which increases the Fund’s overall investment exposure and, as a result, its volatility. |
| ∎ | | Zero coupon or pay-in-kind securities risk. The value, interest rates, and liquidity of non-cash paying instruments, such as zero coupon and pay-in-kind securities, are subject to greater fluctuation than other types of securities. The higher yields and interest rates on pay-in-kind securities reflect the payment deferral and increased credit risk associated with such instruments and that such investments may represent a higher credit risk than loans that periodically pay interest. |
continued on page 6
9 Invesco International Total Return Fund
Schedule of Investments
October 31, 2016
| | | | | | | | |
| | | Principal
Amount | | | Value | |
Non U.S. Dollar Denominated Bonds &
Notes–67.46%(a) | |
| Australia–1.71% | | | | | | | | |
Australia Government Bond, REGS, Sr. Unsec. Australian Bonds, 3.75%, 04/21/2037(b) | | AUD | 900,000 | | | $ | 770,685 | |
|
| Austria–1.05% | |
OMV AG, REGS, Jr. Unsec. Sub. Euro Bonds, 6.75%(b)(c) | | EUR | 400,000 | | | | 471,146 | |
|
| Belgium–1.15% | |
Anheuser-Busch InBev SA/NV, REGS, Sr. Unsec. Gtd. Medium-Term Euro Notes, 4.00%, 09/24/2025(b) | | GBP | 200,000 | | | | 282,735 | |
Solvay Finance S.A., REGS, Jr. Unsec. Gtd. Sub. Euro Bonds, 5.12%(b)(c) | | EUR | 200,000 | | | | 235,820 | |
| | | | | | | | 518,555 | |
|
| Canada–5.39% | |
City of Ottawa, Unsec. Canadian Bonds, 3.10%, 07/27/2048 | | CAD | 500,000 | | | | 359,105 | |
Province of British Columbia | | | | | | | | |
Sr. Unsec. Bonds, | | | | | | | | |
6.60%, 01/09/2020(b) | | INR | 30,000,000 | | | | 448,535 | |
Unsec. Bonds, | | | | | | | | |
2.80%, 06/18/2048 | | CAD | 290,000 | | | | 218,762 | |
Province of Ontario Canada, Unsec. Canadian Bonds, 3.45%, 06/2/2045 | | CAD | 1,670,000 | | | | 1,395,690 | |
| | | | | | | | 2,422,092 | |
|
| Denmark–0.47% | |
Danske Bank A/S, Jr. Unsec. Sub. Medium-Term Euro Notes, 5.68%(c) | | GBP | 170,000 | | | | 210,751 | |
|
| France–4.14% | |
Électricité de France S.A., REGS, Jr. Unsec. Sub. Medium-Term Euro Notes, 4.13%(b)(c) | | EUR | 200,000 | | | | 221,304 | |
French Republic Government Bond OAT, REGS, Unsec. Euro Bonds, 1.75%, 05/25/2066(b) | | EUR | 1,000,000 | | | | 1,166,777 | |
Orange S.A., REGS, Jr. Unsec. Sub. Euro Notes, 5.88%(b)(c) | | GBP | 200,000 | | | | 264,366 | |
TOTAL S.A., REGS, Jr. Unsec. Sub. Medium-Term Euro Notes, 2.63%(b)(c) | | EUR | 200,000 | | | | 211,015 | |
| | | | | | | | 1,863,462 | |
|
| Germany–4.12% | |
EnBW Energie Baden-Wuerttemberg AG, REGS, Jr. Unsec. Sub. Medium-Term Euro Notes, 7.38%, 04/02/2072(b) | | EUR | 120,000 | | | | 135,442 | |
| | | | | | | | |
| | | Principal
Amount | | | Value | |
| Germany–(continued) | |
HeidelbergCement Finance Luxembourg S.A., REGS, Sr. Unsec. Gtd. Medium-Term Euro Notes, 3.25%,
10/21/2021(b) | | EUR | 100,000 | | | $ | 122,262 | |
KfW, Sr. Unsec. Gtd. Global Notes, 2.05%, 02/16/2026 | | JPY | 100,000,000 | | | | 1,155,789 | |
RWE AG, REGS, Jr. Unsec. Sub. Euro Notes, 7.00%(b)(c) | | GBP | 200,000 | | | | 257,325 | |
Volkswagen International Finance N.V., REGS, Jr. Unsec. Gtd. Sub. Euro Bonds, 3.88%(b)(c) | | EUR | 160,000 | | | | 180,031 | |
| | | | | | | | 1,850,849 | |
| | |
| Ireland–4.79% | | | | | | | | |
Ireland Government Bond, REGS, Unsec. Euro Bonds, 1.00%, 05/15/2026(b) | | EUR | 1,900,000 | | | | 2,154,810 | |
| | |
| Italy–9.03% | | | | | | | | |
Italy Buoni Poliennali Del Tesoro, Unsec. Euro Bonds, 1.60%, 06/1/2026 | | EUR | 3,700,000 | | | | 4,061,712 | |
| | |
| Japan–2.72% | | | | | | | | |
Government of Japan Forty Year Bond, Series 8, Sr. Unsec. Bonds, 1.40%, 03/20/2055 | | JPY | 100,000,000 | | | | 1,224,597 | |
| | |
| Mexico–3.74% | | | | | | | | |
Mexican Bonos, Series M, Sr. Unsec. Bonds, 5.00%, 12/11/2019 | | MXN | 25,000,000 | | | | 1,295,215 | |
Petróleos Mexicanos, REGS, Sr. Unsec. Gtd. Medium-Term Euro Notes, 2.75%,
04/21/2027(b) | | EUR | 400,000 | | | | 387,754 | |
| | | | | | | | 1,682,969 | |
| | |
| Netherlands–3.98% | | | | | | | | |
Achmea B.V., Series 1, Jr. Unsec. Sub. Medium-Term Euro Notes, 6.00%(c) | | EUR | 500,000 | | | | 568,989 | |
Coöperatieve Rabobank U.A., REGS, Jr. Unsec. Sub. Euro | | | | | | | | |
Bonds, 5.50%(b)(c) | | EUR | 200,000 | | | | 221,609 | |
Unsec. Sub. Euro Bonds, | | | | | | | | |
3.88%, 07/25/2023(b) | | EUR | 600,000 | | | | 765,500 | |
Koninklijke KPN N.V., REGS, Jr. Unsec. Sub. Euro Notes, 6.13%(b)(c) | | EUR | 200,000 | | | | 236,016 | |
| | | | | | | | 1,792,114 | |
|
| Norway–0.62% | |
DNB Bank ASA, REGS, Unsec. Sub. Medium-Term Euro Notes, 4.75%, 03/8/2022(b) | | EUR | 250,000 | | | | 279,053 | |
See accompanying Notes to Financial Statements which are an integral part of the financial statements.
10 Invesco International Total Return Fund
| | | | | | | | |
| | | Principal
Amount | | | Value | |
| Russia–2.13% | |
Russian Federal Bond — OFZ, Series 6214, Unsec. Bonds, 6.40%, 05/27/2020 | | RUB | 65,000,000 | | | $ | 960,012 | |
|
| South Korea–2.64% | |
Korea Treasury Bond, Series 2403, Sr. Unsec. Bonds, 3.50%, 03/10/2024 | | KRW | 1,200,000,000 | | | | 1,186,985 | |
|
| Spain–5.13% | |
Spain Government Bond, REGS, Sr. Unsec. Euro Bonds, | | | | | | | | |
1.30%, 10/31/2026(b) | | EUR | 600,000 | | | | 664,181 | |
5.90%, 07/30/2026(b) | | EUR | 970,000 | | | | 1,526,752 | |
Telefónica Europe B.V., REGS, Jr. Unsec. Gtd. Sub. Euro Bonds, 6.50%(b)(c) | | EUR | 100,000 | | | | 117,298 | |
| | | | | | | | 2,308,231 | |
|
| Supranational–3.49% | |
Asian Development Bank, Series 339-00-1, Sr. Unsec. Medium-Term Global Notes, 2.35%,
06/21/2027 | | JPY | 130,000,000 | | | | 1,567,948 | |
|
| United Kingdom–8.17% | |
AA Bond Co. Ltd., REGS, Sec. Second Lien Euro Notes, 5.50%, 07/31/2022(b) | | GBP | 200,000 | | | | 244,582 | |
Boparan Finance PLC, REGS, Sr. Sec. Gtd. First Lien Euro Notes, 5.50%, 07/15/2021(b) | | GBP | 200,000 | | | | 224,567 | |
Direct Line Insurance Group PLC, REGS, Unsec. Gtd. Sub. Euro Notes, 9.25%,
04/27/2042(b) | | GBP | 150,000 | | | | 223,434 | |
Moto Finance PLC, REGS, Sec. Gtd. Second Lien Euro Notes, 6.38%, 09/1/2020(b) | | GBP | 200,000 | | | | 255,779 | |
Nationwide Building Society, Jr. Unsec. Sub. Euro Bonds, 6.00%(c) | | GBP | 200,000 | | | | 245,704 | |
NGG Finance PLC, REGS, Unsec. Gtd. Sub. Euro Notes, 5.63%, 06/18/2073(b) | | GBP | 250,000 | | | | 342,282 | |
Scottish Widows Ltd., REGS, Unsec. Sub. Euro Notes, 5.50%, 06/16/2023(b) | | GBP | 150,000 | | | | 194,297 | |
United Kingdom Gilt, REGS, Unsec. Bonds, 1.50%, 07/22/2026(b) | | GBP | 1,550,000 | | | | 1,942,377 | |
| | | | | | | | 3,673,022 | |
|
| United States–2.99% | |
Apple Inc., REGS, Sr. Unsec. Medium-Term Notes, 3.70%, 08/28/2022(b) | | AUD | 1,100,000 | | | | 870,284 | |
Goldman Sachs Group, Inc. (The), REGS, Sr. Unsec. Medium-Term DIP Notes, 5.00%,
08/8/2018(b) | | AUD | 600,000 | | | | 473,006 | |
| | | | | | | | 1,343,290 | |
Total Non U.S. Dollar Denominated Bonds & Notes
(Cost $30,762,749) | | | | 30,342,283 | |
| | | | | | | | |
| | | Principal
Amount | | | Value | |
U.S. Dollar Denominated Bonds & Notes–23.85% | |
| Bahrain–1.01% | |
Bahrain Government International Bond, Sr. Unsec. Bonds, 7.00%, 10/12/2028(b) | | $ | 440,000 | | | $ | 454,300 | |
|
| Brazil–2.44% | |
BRF GmbH, Sr. Unsec. Gtd. Notes, 4.35%, 09/29/2026(b) | | | 200,000 | | | | 194,500 | |
Minerva Luxembourg S.A., Sr. Unsec. Gtd. Notes, 6.50%, 09/20/2026(b) | | | 471,000 | | | | 464,510 | |
Odebrecht Finance Ltd., REGS, Sr. Unsec. Gtd. Euro Notes, 5.25%, 06/27/2029(b) | | | 200,000 | | | | 98,000 | |
Petrobras Global Finance B.V., Sr. Unsec. Gtd. Global Notes, 8.75%, 05/23/2026 | | | 300,000 | | | | 338,625 | |
| | | | | | | | 1,095,635 | |
|
| Canada–0.48% | |
Air Canada Pass Through Trust, Series 2015-1, Class B, Sec. Second Lien Pass Through Ctfs., 3.88%, 03/15/2023(b) | | | 220,795 | | | | 215,849 | |
|
| Colombia–0.53% | |
Avianca Holdings S.A./ Avianca Leasing LLC/ Grupo Taca Holdings, REGS, Sr. Unsec. Gtd. Euro Notes, 8.38%, 05/10/2020(b) | | | 200,000 | | | | 198,000 | |
Pacific Exploration & Production Corp., REGS, Sr. Unsec. Gtd. Euro Notes, 5.63%, 01/19/2025(b)(d) | | | 200,000 | | | | 41,000 | |
| | | | | | | | 239,000 | |
|
| Georgia–0.66% | |
BGEO Group JSC, Sr. Unsec. Bonds, 6.00%, 07/26/2023(b) | | | 285,000 | | | | 294,045 | |
|
| India–1.14% | |
Delhi International Airport (Pvt.) Ltd., Sr. Sec. First Lien Bonds, 6.13%, 10/31/2026(b) | | | 500,000 | | | | 514,424 | |
|
| Indonesia–0.61% | |
Listrindo Capital B.V., Sr. Unsec. Gtd. Notes, 4.95%, 09/14/2026(b) | | | 271,000 | | | | 274,248 | |
|
| Jamaica–0.40% | |
Digicel Group Ltd., REGS, Sr. Unsec. Gtd. Euro Notes, 6.75%,
03/1/2023(b) | | | 200,000 | | | | 180,440 | |
|
| Kuwait–0.89% | |
Equate Petrochemical B.V., Sr. Unsec. Gtd. Notes, 4.25%, 11/3/2026(b) | | | 405,000 | | | | 402,262 | |
See accompanying Notes to Financial Statements which are an integral part of the financial statements.
11 Invesco International Total Return Fund
| | | | | | | | |
| | | Principal
Amount | | | Value | |
| Mexico–1.82% | |
Mexico City Airport Trust, Sr. Sec. Notes, 4.25%, 10/31/2026(b) | | $ | 219,000 | | | $ | 223,565 | |
SixSigma Networks México, S.A. de C.V., REGS, Sr. Unsec. Gtd. Euro Notes, 8.25%, 11/7/2021(b) | | | 200,000 | | | | 196,500 | |
Unifin Financiera, S.A.B. de C.V., SOFOM, E.N.R., Sr. Unsec. Gtd. Bonds, 7.25%, 09/27/2023(b) | | | 400,000 | | | | 399,578 | |
| | | | | | | | 819,643 | |
|
| Netherlands–1.43% | |
AerCap Global Aviation Trust, Jr. Unsec. Gtd. Sub. Notes, 6.50%, 06/15/2045(b) | | | 267,000 | | | | 275,010 | |
GTH Finance B.V., Sr. Unsec. Gtd. Notes, 7.25%, 04/26/2023(b) | | | 343,000 | | | | 368,296 | |
| | | | | | | | 643,306 | |
|
| Pakistan–1.14% | |
Third Pakistan International Sukuk Co. Ltd. (The), Sr. Unsec. Bonds, 5.50%,
10/13/2021(b) | | | 500,000 | | | | 510,658 | |
|
| Russia–1.56% | |
Credit Bank of Moscow Via CBOM Finance PLC, Sr. Unsec. Notes, 5.88%, 11/7/2021(b) | | | 400,000 | | | | 400,000 | |
Polyus Gold International Ltd., Sr. Unsec. Gtd. Bonds, 4.70%, 03/28/2022(b) | | | 300,000 | | | | 300,000 | |
| | | | | | | | 700,000 | |
|
| South Africa–1.72% | |
Eskom Holdings SOC Ltd., REGS, Sr. Unsec. Euro Notes, 7.13%, 02/11/2025(b) | | | 360,000 | | | | 373,424 | |
MTN (Mauritius) Investments Ltd., Sr. Unsec. Gtd. Notes, 6.50%, 10/13/2026(b) | | | 394,000 | | | | 401,388 | |
| | | | | | | | 774,812 | |
|
| Sri Lanka–0.85% | |
Sri Lanka Government International Bond, Sr. Unsec. Bonds, 6.83%, 07/18/2026(b) | | | 362,000 | | | | 383,303 | |
|
| Switzerland–0.45% | |
UBS AG, REGS, Unsec. Sub. Medium-Term Euro Notes, 7.25%,
02/22/2022(b) | | | 200,000 | | | | 203,203 | |
|
| United States–6.72% | |
Ally Financial Inc., Unsec. Sub. Global Notes, 5.75%, 11/20/2025 | | | 143,000 | | | | 147,648 | |
AMC Entertainment Holdings, Inc., Sr. Unsec. Sub. Notes, 5.88%, 11/15/2026(b) | | | 75,000 | | | | 75,750 | |
| | | | | | | | |
| | | Principal
Amount | | | Value | |
| United States–(continued) | |
Antero Midstream Partners LP/Antero Midstream Finance Corp., Sr. Unsec. Gtd. Notes, 5.38%, 09/15/2024(b) | | $ | 110,000 | | | $ | 111,375 | |
BMC East, LLC, Sr. Sec. Gtd. First Lien Notes, 5.50%, 10/1/2024(b) | | | 87,000 | | | | 88,958 | |
Callon Petroleum Co., Sr. Unsec. Gtd. Notes, 6.13%, 10/1/2024(b) | | | 170,000 | | | | 175,950 | |
Cantor Fitzgerald, L.P., Unsec. Notes, 6.50%, 06/17/2022(b) | | | 246,000 | | | | 266,446 | |
Centene Corp., Sr. Unsec. Notes, 4.75%, 01/15/2025 | | | 92,000 | | | | 92,230 | |
EarthLink Holdings Corp., Sr. Unsec. Gtd. Global Notes, 8.88%, 05/15/2019 | | | 69,000 | | | | 70,725 | |
JPMorgan Chase & Co., Series Z, Jr. Unsec. Sub. Global Notes, 5.30%(c) | | | 300,000 | | | | 304,500 | |
Micron Technology, Inc., Series G, Sr. Unsec. Conv. Global Bonds, 3.00%, 11/15/2028(e) | | | 250,000 | | | | 221,719 | |
Navios Maritime Acquisition Corp./ Navios Acquisition Finance U.S. Inc., Sr. Sec. Gtd. First Lien Mortgage Notes, 8.13%, 11/15/2021 (Acquired 08/21/2015; Cost $192,500)(b) | | | 200,000 | | | | 151,500 | |
RSP Permian, Inc., Sr. Unsec. Gtd. Global Notes, 6.63%, 10/1/2022 | | | 200,000 | | | | 212,000 | |
Sirius XM Radio Inc., Sr. Unsec. Gtd. Notes, 5.38%, 07/15/2026(b) | | | 200,000 | | | | 204,000 | |
TransDigm Inc., Sr. Unsec. Gtd. Sub. Notes, 6.38%, 06/15/2026(b) | | | 192,000 | | | | 197,520 | |
United Rentals (North America), Inc., Sr. Unsec. Gtd. Notes, 3.45%, 05/15/2027 | | | 150,000 | | | | 150,750 | |
Wabtec Corp., Sr. Unsec. Gtd. Notes, 3.45%, 11/15/2026(b) | | | 227,000 | | | | 226,921 | |
Wells Fargo & Co., Series U, Jr. Unsec. Sub. Global Notes, 5.88%(c) | | | 300,000 | | | | 322,125 | |
| | | | | | | | 3,020,117 | |
Total U.S. Dollar Denominated Bonds & Notes
(Cost $10,586,428) | | | | 10,725,245 | |
|
Collateralized Mortgage Obligations–3.66% | |
| United States–3.66% | | | | | | | | |
Bear Stearns Adjustable Rate Mortgage Trust, Series 2005-2, Class A1, Floating Rate Pass Through Ctfs., 2.92%, 03/25/2035(f) | | | 143,962 | | | | 145,035 | |
See accompanying Notes to Financial Statements which are an integral part of the financial statements.
12 Invesco International Total Return Fund
| | | | | | | | |
| | | Principal
Amount | | | Value | |
| United States–(continued) | |
BLCP Hotel Trust, Series 2014-CLRN, Class C, Floating Rate Pass Through Ctfs., 2.49%,
08/15/2029(b)(f) | | $ | 450,000 | | | $ | 444,947 | |
GMACM Mortgage Loan Trust, Series 2006-AR1, Class 1A1, Variable Rate Pass Through Ctfs., 3.41%, 04/19/2036(f) | | | 208,566 | | | | 186,976 | |
JP Morgan Mortgage Trust Series 2007-A1, Class 2A2, Variable Rate Pass Through Ctfs., 3.06%, 07/25/2035(f) | | | 215,881 | | | | 211,831 | |
Series 2007-A4, Class 3A1, | | | | | | | | |
Variable Rate Pass Through Ctfs., 4.64%, 06/25/2037(f) | | | 226,348 | | | | 200,602 | |
Merrill Lynch Mortgage Investors Trust, Series 2005-3, Class 3A, Floating Rate Pass Through Ctfs. 2.85%, 11/25/2035(f) | | | 136,232 | | | | 135,018 | |
WaMu Mortgage Pass-Through Trust, Series 2005-AR12, Class 1A8, Variable Rate Pass Through Ctfs., 2.74%, 10/25/2035(f) | | | 205,966 | | | | 200,871 | |
| | | | | | | | |
| | | Principal
Amount | | | Value | |
| United States–(continued) | |
Wells Fargo Mortgage Backed Securities Trust, Series 2005-AR14, Class A1, Variable Rate Pass Through Ctfs., 3.01%, 08/25/2035(f) | | $ | 121,515 | | | $ | 122,170 | |
Total Collateralized Mortgage Obligations
(Cost $1,657,592) | | | | 1,647,450 | |
|
Money Market Funds–2.18% | |
Government & Agency Portfolio–Institutional Class, 0.29%(g) | | | 587,197 | | | | 587,197 | |
Treasury Portfolio–Institutional Class, 0.22%(g) | | | 391,464 | | | | 391,464 | |
Total Money Market Funds (Cost $978,661) | | | | | | | 978,661 | |
TOTAL INVESTMENTS–97.15%
(Cost $43,985,430) | | | | 43,693,639 | |
OTHER ASSETS LESS LIABILITIES–2.85% | | | | 1,283,760 | |
NET ASSETS–100.00% | | | $ | 44,977,399 | |
Investment Abbreviations:
| | |
| AUD | | – Australian Dollar |
| CAD | | – Canadian Dollar |
| Conv. | | – Convertible |
| Ctfs. | | – Certificates |
| DIP | | – Debtor-in-possession |
| EUR | | – Euro |
| GBP | | – British Pound Sterling |
| Gtd. | | – Guaranteed |
| JPY | | – Japanese Yen |
| Jr. | | – Junior |
| KRW | | – South Korean Won |
| MXN | | – Mexican New Peso |
| REGS | | – Regulation S |
| RUB | | – Russian Ruble |
| Sec. | | – Secured |
| Sr. | | – Senior |
| Sub. | | – Subordinated |
| Unsec. | | – Unsecured |
Notes to Schedule of Investments:
| (a) | Foreign denominated security. Principal amount is denominated in the currency indicated. |
| (b) | Security purchased or received in a transaction exempt from registration under the Securities Act of 1933, as amended (the “1933 Act”). The security may be resold pursuant to an exemption from registration under the 1933 Act, typically to qualified institutional buyers. The aggregate value of these securities at October 31, 2016 was $25,200,894, which represented 56.03% of the Fund’s Net Assets. |
| (c) | Perpetual bond with no specified maturity date. |
| (d) | Defaulted security. Currently, the issuer is in default with respect to principal and/or interest payments. The value of this security at October 31, 2016 represented less than 1% of the Fund’s Net Assets. |
| (e) | Security has an irrevocable call by the issuer or mandatory put by the holder. Maturity date reflects such call or put. |
| (f) | Interest or dividend rate is redetermined periodically. Rate shown is the rate in effect on October 31, 2016. |
| (g) | The money market fund and the Fund are affiliated by having the same investment adviser. The rate shown is the 7-day SEC standardized yield as of October 31, 2016. |
See accompanying Notes to Financial Statements which are an integral part of the financial statements.
13 Invesco International Total Return Fund
Statement of Assets and Liabilities
October 31, 2016
| | | | |
Assets: | |
Investments, at value (Cost $43,006,769) | | $ | 42,714,978 | |
Investments in affiliated money market funds, at value and cost | | | 978,661 | |
Total investments, at value (Cost $43,985,430) | | | 43,693,639 | |
Foreign currencies, at value (Cost $112,038) | | | 111,483 | |
Receivable for: | | | | |
Deposits with brokers for open futures contracts and swap agreements | | | 380,591 | |
Investments sold | | | 3,075,627 | |
Variation margin — futures | | | 4,567 | |
Fund shares sold | | | 171,673 | |
Dividends and interest | | | 473,698 | |
Fund expenses absorbed | | | 13,404 | |
Swaps receivables | | | 1,029 | |
Premiums paid on swap agreements | | | 408,475 | |
Investment for trustee deferred compensation and retirement plans | | | 34,754 | |
Unrealized appreciation on forward foreign currency contracts outstanding | | | 947,318 | |
Other assets | | | 24,641 | |
Total assets | | | 49,340,899 | |
|
Liabilities: | |
Payable for: | | | | |
Investments purchased | | | 2,912,259 | |
Fund shares reacquired | | | 185,521 | |
Swaps payable | | | 5,135 | |
Variation margin — centrally cleared swap agreements | | | 3,263 | |
Accrued fees to affiliates | | | 33,745 | |
Accrued trustees’ and officers’ fees and benefits | | | 1,755 | |
Accrued other operating expenses | | | 67,887 | |
Trustee deferred compensation and retirement plans | | | 36,854 | |
Unrealized depreciation on forward foreign currency contracts outstanding | | | 962,826 | |
Unrealized depreciation on swap agreements — OTC | | | 154,255 | |
Total liabilities | | | 4,363,500 | |
Net assets applicable to shares outstanding | | $ | 44,977,399 | |
|
Net assets consist of: | |
Shares of beneficial interest | | $ | 45,735,995 | |
Undistributed net investment income | | | (114,802 | ) |
Undistributed net realized gain (loss) | | | (122,341 | ) |
Net unrealized appreciation (depreciation) | | | (521,453 | ) |
| | | $ | 44,977,399 | |
| | | | |
Net Assets: | |
Class A | | $ | 28,870,017 | |
Class B | | $ | 465,847 | |
Class C | | $ | 5,120,828 | |
Class Y | | $ | 10,509,083 | |
Class R5 | | $ | 846 | |
Class R6 | | $ | 10,778 | |
|
Shares outstanding, $0.01 par value per share,
with an unlimited number of shares authorized: | |
Class A | | | 2,764,519 | |
Class B | | | 44,671 | |
Class C | | | 491,496 | |
Class Y | | | 1,006,956 | |
Class R5 | | | 81 | |
Class R6 | | | 1,032 | |
Class A: | | | | |
Net asset value per share | | $ | 10.44 | |
Maximum offering price per share | | | | |
(Net asset value of $10.44 ¸ 95.75%) | | $ | 10.90 | |
Class B: | | | | |
Net asset value and offering price per share | | $ | 10.43 | |
Class C: | | | | |
Net asset value and offering price per share | | $ | 10.42 | |
Class Y: | | | | |
Net asset value and offering price per share | | $ | 10.44 | |
Class R5: | | | | |
Net asset value and offering price per share | | $ | 10.44 | |
Class R6: | | | | |
Net asset value and offering price per share | | $ | 10.44 | |
See accompanying Notes to Financial Statements which are an integral part of the financial statements.
14 Invesco International Total Return Fund
Statement of Operations
For the year ended October 31, 2016
| | | | |
Investment income: | |
Interest (net of foreign withholding taxes of $5,581) | | $ | 1,562,146 | |
Dividends from affiliated money market funds | | | 4,181 | |
Total investment income | | | 1,566,327 | |
| |
Expenses: | | | | |
Advisory fees | | | 294,471 | |
Administrative services fees | | | 50,000 | |
Custodian fees | | | 38,213 | |
Distribution fees: | | | | |
Class A | | | 68,528 | |
Class B | | | 6,650 | |
Class C | | | 52,110 | |
Transfer agent fees — A, B, C and Y | | | 115,591 | |
Transfer agent fees — R6 | | | 86 | |
Trustees’ and officers’ fees and benefits | | | 20,164 | |
Registration and filing fees | | | 74,640 | |
Reports to shareholders | | | 29,854 | |
Professional services fees | | | 54,177 | |
Other | | | 25,966 | |
Total expenses | | | 830,450 | |
Less: Fees waived, expenses reimbursed and expense offset arrangement(s) | | | (320,155 | ) |
Net expenses | | | 510,295 | |
Net investment income | | | 1,056,032 | |
| |
Realized and unrealized gain (loss) from: | | | | |
Net realized gain (loss) from: | | | | |
Investment securities | | | (532,427 | ) |
Foreign currencies | | | (133,567 | ) |
Forward foreign currency contracts | | | 777,322 | |
Futures contracts | | | 98,438 | |
Option contracts written | | | 31,354 | |
Swap agreements | | | (429,648 | ) |
| | | | (188,528 | ) |
Change in net unrealized appreciation (depreciation) of: | | | | |
Investment securities | | | 2,126,267 | |
Foreign currencies | | | (12,133 | ) |
Forward foreign currency contracts | | | 16,428 | |
Futures contracts | | | 33,097 | |
Option contracts written | | | (9,698 | ) |
Swap agreements | | | (261,995 | ) |
| | | | 1,891,966 | |
Net realized and unrealized gain | | | 1,703,438 | |
Net increase in net assets resulting from operations | | $ | 2,759,470 | |
See accompanying Notes to Financial Statements which are an integral part of the financial statements.
15 Invesco International Total Return Fund
Statement of Changes in Net Assets
For the years ended October 31, 2016 and 2015
| | | | | | | | |
| | | 2016 | | | 2015 | |
Operations: | | | | | |
Net investment income | | $ | 1,056,032 | | | $ | 977,757 | |
Net realized gain (loss) | | | (188,528 | ) | | | (3,538,480 | ) |
Change in net unrealized appreciation (depreciation) | | | 1,891,966 | | | | (564,679 | ) |
Net increase (decrease) in net assets resulting from operations | | | 2,759,470 | | | | (3,125,402 | ) |
| | |
Return of Capital: | | | | | | | | |
Class A | | | (180,952 | ) | | | (334,679 | ) |
Class B | | | (4,447 | ) | | | (5,037 | ) |
Class C | | | (34,564 | ) | | | (22,195 | ) |
Class Y | | | (38,737 | ) | | | (34,332 | ) |
Class R5 | | | (5 | ) | | | (404 | ) |
Class R6 | | | (42,369 | ) | | | (234,598 | ) |
Total return of capital | | | (301,074 | ) | | | (631,245 | ) |
| | |
Distributions to shareholders from net investment income: | | | | | | | | |
Class A | | | (230,285 | ) | | | — | |
Class B | | | (274 | ) | | | — | |
Class C | | | (5,811 | ) | | | — | |
Class Y | | | (75,009 | ) | | | — | |
Class R5 | | | (10 | ) | | | — | |
Class R6 | | | (30,564 | ) | | | — | |
Total distributions from net investment income | | | (341,953 | ) | | | — | |
| | |
Distributions to shareholders from net realized gains: | | | | | | | | |
Class A | | | — | | | | (424,234 | ) |
Class B | | | — | | | | (23,164 | ) |
Class C | | | — | | | | (82,956 | ) |
Class Y | | | — | | | | (58,822 | ) |
Class R5 | | | — | | | | (1,571 | ) |
Class R6 | | | — | | | | (190,546 | ) |
Total distributions from net realized gains | | | — | | | | (781,293 | ) |
| | |
Share transactions–net: | | | | | | | | |
Class A | | | 853,114 | | | | (3,774,867 | ) |
Class B | | | (473,800 | ) | | | (848,162 | ) |
Class C | | | (196,968 | ) | | | (969,761 | ) |
Class Y | | | 8,535,582 | | | | (3,026,142 | ) |
Class R5 | | | — | | | | (113,619 | ) |
Class R6 | | | (19,308,820 | ) | | | 8,002,329 | |
Net increase (decrease) in net assets resulting from share transactions | | | (10,590,892 | ) | | | (730,222 | ) |
Net increase (decrease) in net assets | | | (8,474,449 | ) | | | (5,268,162 | ) |
| | |
Net assets: | | | | | | | | |
Beginning of year | | | 53,451,848 | | | | 58,720,010 | |
End of year (includes undistributed net investment income of $(114,802) and $(171,343), respectively) | | $ | 44,977,399 | | | $ | 53,451,848 | |
Notes to Financial Statements
October 31, 2016
NOTE 1—Significant Accounting Policies
Invesco International Total Return Fund (the “Fund”) is a series portfolio of AIM Investment Funds (Invesco Investment Funds) (the “Trust”). The Trust is organized as a Delaware statutory trust and is registered under the Investment Company Act of 1940, as amended (the “1940 Act”), as an open-end
16 Invesco International Total Return Fund
series management investment company consisting of twenty-two separate series portfolios, each authorized to issue an unlimited number of shares of beneficial interest. The assets, liabilities and operations of each portfolio are accounted for separately. Information presented in these financial statements pertains only to the Fund. Matters affecting each portfolio or class will be voted on exclusively by the shareholders of such portfolio or class.
The Fund’s investment objective is total return, comprised of current income and capital appreciation.
The Fund currently consists of six different classes of shares: Class A, Class B, Class C, Class Y, Class R5 and Class R6. Class Y shares are available only to certain investors. Class A shares are sold with a front-end sales charge unless certain waiver criteria are met and under certain circumstances load waived shares may be subject to contingent deferred sales charges (“CDSC”). Class C shares are sold with a CDSC. Class Y, Class R5 and Class R6 shares are sold at net asset value. Effective November 30, 2010, new or additional investments in Class B shares are no longer permitted. Existing shareholders of Class B shares may continue to reinvest dividends and capital gains distributions in Class B shares until they convert to Class A shares. Also, shareholders in Class B shares will be able to exchange those shares for Class B shares of other Invesco Funds offering such shares until they convert to Class A shares. Generally, Class B shares will automatically convert to Class A shares on or about the month-end, which is at least eight years after the date of purchase. Redemption of Class B shares prior to the conversion date will be subject to a CDSC.
The following is a summary of the significant accounting policies followed by the Fund in the preparation of its financial statements.
| A. | Security Valuations — Securities, including restricted securities, are valued according to the following policy. |
Debt obligations (including convertible securities) and unlisted equities are fair valued using an evaluated quote provided by an independent pricing service. Evaluated quotes provided by the pricing service may be determined without exclusive reliance on quoted prices, and may reflect appropriate factors such as institution-size trading in similar groups of securities, developments related to specific securities, dividend rate (for unlisted equities), yield (for debt obligations), quality, type of issue, coupon rate (for debt obligations), maturity (for debt obligations), individual trading characteristics and other market data. Debt obligations are subject to interest rate and credit risks. In addition, all debt obligations involve some risk of default with respect to interest and/or principal payments.
A security listed or traded on an exchange (except convertible securities) is valued at its last sales price or official closing price as of the close of the customary trading session on the exchange where the security is principally traded, or lacking any sales or official closing price on a particular day, the security may be valued at the closing bid price on that day. Securities traded in the over-the-counter market are valued based on prices furnished by independent pricing services or market makers. When such securities are valued by an independent pricing service they may be considered fair valued. Futures contracts are valued at the final settlement price set by an exchange on which they are principally traded. Listed options are valued at the mean between the last bid and asked prices from the exchange on which they are principally traded. Options not listed on an exchange are valued by an independent source at the mean between the last bid and asked prices. For purposes of determining net asset value (“NAV”) per share, futures and option contracts generally are valued 15 minutes after the close of the customary trading session of the New York Stock Exchange (“NYSE”).
Investments in open-end and closed-end registered investment companies that do not trade on an exchange are valued at the end-of-day net asset value per share. Investments in open-end and closed-end registered investment companies that trade on an exchange are valued at the last sales price or official closing price as of the close of the customary trading session on the exchange where the security is principally traded.
Swap agreements are fair valued using an evaluated quote, if available, provided by an independent pricing service. Evaluated quotes provided by the pricing service are valued based on a model which may include end-of-day net present values, spreads, ratings, industry, company performance and returns of referenced assets.
Foreign securities’ (including foreign exchange contracts) prices are converted into U.S. dollar amounts using the applicable exchange rates as of the close of the NYSE. If market quotations are available and reliable for foreign exchange-traded equity securities, the securities will be valued at the market quotations. Because trading hours for certain foreign securities end before the close of the NYSE, closing market quotations may become unreliable. If between the time trading ends on a particular security and the close of the customary trading session on the NYSE, events occur that the Adviser determines are significant and make the closing price unreliable, the Fund may fair value the security. If the event is likely to have affected the closing price of the security, the security will be valued at fair value in good faith using procedures approved by the Board of Trustees. Adjustments to closing prices to reflect fair value may also be based on a screening process of an independent pricing service to indicate the degree of certainty, based on historical data, that the closing price in the principal market where a foreign security trades is not the current value as of the close of the NYSE. Foreign securities’ prices meeting the approved degree of certainty that the price is not reflective of current value will be priced at the indication of fair value from the independent pricing service. Multiple factors may be considered by the independent pricing service in determining adjustments to reflect fair value and may include information relating to sector indices, American Depositary Receipts and domestic and foreign index futures. Foreign securities may have additional risks including exchange rate changes, potential for sharply devalued currencies and high inflation, political and economic upheaval, the relative lack of issuer information, relatively low market liquidity and the potential lack of strict financial and accounting controls and standards.
Securities for which market prices are not provided by any of the above methods may be valued based upon quotes furnished by independent sources. The last bid price may be used to value equity securities. The mean between the last bid and asked prices is used to value debt obligations, including corporate loans.
Securities for which market quotations are not readily available or became unreliable are valued at fair value as determined in good faith by or under the supervision of the Trust’s officers following procedures approved by the Board of Trustees. Issuer specific events, market trends, bid/asked quotes of brokers and information providers and other market data may be reviewed in the course of making a good faith determination of a security’s fair value.
The Fund may invest in securities that are subject to interest rate risk, meaning the risk that the prices will generally fall as interest rates rise and, conversely, the prices will generally rise as interest rates fall. Specific securities differ in their sensitivity to changes in interest rates depending on their individual characteristics. Changes in interest rates may result in increased market volatility, which may affect the value and/or liquidity of certain Fund investments.
Valuations change in response to many factors including the historical and prospective earnings of the issuer, the value of the issuer’s assets, general economic conditions, interest rates, investor perceptions and market liquidity. Because of the inherent uncertainties of valuation, the values reflected in the financial statements may materially differ from the value received upon actual sale of those investments.
17 Invesco International Total Return Fund
| B. | Securities Transactions and Investment Income — Securities transactions are accounted for on a trade date basis. Realized gains or losses on sales are computed on the basis of specific identification of the securities sold. Interest income (net of withholding tax, if any) is recorded on the accrual basis from settlement date. Dividend income (net of withholding tax, if any) is recorded on the ex-dividend date. Bond premiums and discounts are amortized and/or accreted for financial reporting purposes. |
The Fund may periodically participate in litigation related to Fund investments. As such, the Fund may receive proceeds from litigation settlements. Any proceeds received are included in the Statement of Operations as realized gain (loss) for investments no longer held and as unrealized gain (loss) for investments still held.
Brokerage commissions and mark ups are considered transaction costs and are recorded as an increase to the cost basis of securities purchased and/or a reduction of proceeds on a sale of securities. Such transaction costs are included in the determination of net realized and unrealized gain (loss) from investment securities reported in the Statement of Operations and the Statement of Changes in Net Assets and the net realized and unrealized gains (losses) on securities per share in the Financial Highlights. Transaction costs are included in the calculation of the Fund’s net asset value and, accordingly, they reduce the Fund’s total returns. These transaction costs are not considered operating expenses and are not reflected in net investment income reported in the Statement of Operations and the Statement of Changes in Net Assets, or the net investment income per share and the ratios of expenses and net investment income reported in the Financial Highlights, nor are they limited by any expense limitation arrangements between the Fund and the investment adviser.
The Fund allocates income and realized and unrealized capital gains and losses to a class based on the relative net assets of each class.
| C. | Country Determination — For the purposes of making investment selection decisions and presentation in the Schedule of Investments, the investment adviser may determine the country in which an issuer is located and/or credit risk exposure based on various factors. These factors include the laws of the country under which the issuer is organized, where the issuer maintains a principal office, the country in which the issuer derives 50% or more of its total revenues and the country that has the primary market for the issuer’s securities, as well as other criteria. Among the other criteria that may be evaluated for making this determination are the country in which the issuer maintains 50% or more of its assets, the type of security, financial guarantees and enhancements, the nature of the collateral and the sponsor organization. Country of issuer and/or credit risk exposure has been determined to be the United States of America, unless otherwise noted. |
| D. | Distributions — Distributions from net investment income, if any, are declared and paid quarterly and are recorded on the ex-dividend date. Distributions from net realized capital gain, if any, are generally declared and paid annually and recorded on the ex-dividend date. The Fund may elect to treat a portion of the proceeds from redemptions as distributions for federal income tax purposes. |
| E. | Federal Income Taxes — The Fund intends to comply with the requirements of Subchapter M of the Internal Revenue Code of 1986, as amended (the “Internal Revenue Code”), necessary to qualify as a regulated investment company and to distribute substantially all of the Fund’s taxable earnings to shareholders. As such, the Fund will not be subject to federal income taxes on otherwise taxable income (including net realized capital gain) that is distributed to shareholders. Therefore, no provision for federal income taxes is recorded in the financial statements. |
The Fund recognizes the tax benefits of uncertain tax positions only when the position is more likely than not to be sustained. Management has analyzed the Fund’s uncertain tax positions and concluded that no liability for unrecognized tax benefits should be recorded related to uncertain tax positions. Management is not aware of any tax positions for which it is reasonably possible that the total amounts of unrecognized tax benefits will change materially in the next 12 months.
The Fund files tax returns in the U.S. Federal jurisdiction and certain other jurisdictions. Generally, the Fund is subject to examinations by such taxing authorities for up to three years after the filing of the return for the tax period.
| F. | Expenses — Fees provided for under the Rule 12b-1 plan of a particular class of the Fund are charged to the operations of such class. Transfer agency fees and expenses and other shareholder recordkeeping fees and expenses attributable to Class R5 and Class R6 are allocated to each share class based on relative net assets. Sub-accounting fees attributable to Class R5 are charged to the operations of the class. Transfer agency fees and expenses and other shareholder recordkeeping fees and expenses relating to all other classes are allocated among those classes based on relative net assets. All other expenses are allocated among the classes based on relative net assets. |
| G. | Accounting Estimates — The preparation of financial statements in conformity with accounting principles generally accepted in the United States of America (“GAAP”) requires management to make estimates and assumptions that affect the reported amounts of assets and liabilities at the date of the financial statements and the reported amounts of revenues and expenses during the reporting period including estimates and assumptions related to taxation. Actual results could differ from those estimates by a significant amount. In addition, the Fund monitors for material events or transactions that may occur or become known after the period-end date and before the date the financial statements are released to print. |
| H. | Indemnifications — Under the Trust’s organizational documents, each Trustee, officer, employee or other agent of the Trust is indemnified against certain liabilities that may arise out of the performance of their duties to the Fund. Additionally, in the normal course of business, the Fund enters into contracts, including the Fund’s servicing agreements, that contain a variety of indemnification clauses. The Fund’s maximum exposure under these arrangements is unknown as this would involve future claims that may be made against the Fund that have not yet occurred. The risk of material loss as a result of such indemnification claims is considered remote. |
| I. | Foreign Currency Translations — Foreign currency is valued at the close of the NYSE based on quotations posted by banks and major currency dealers. Portfolio securities and other assets and liabilities denominated in foreign currencies are translated into U.S. dollar amounts at date of valuation. Purchases and sales of portfolio securities (net of foreign taxes withheld on disposition) and income items denominated in foreign currencies are translated into U.S. dollar amounts on the respective dates of such transactions. The Fund does not separately account for the portion of the results of operations resulting from changes in foreign exchange rates on investments and the fluctuations arising from changes in market prices of securities held. The combined results of changes in foreign exchange rates and the fluctuation of market prices on investments (net of estimated foreign tax withholding) are included with the net realized and unrealized gain or loss from investments in the Statement of Operations. Reported net realized foreign currency gains or losses arise from (1) sales of foreign currencies, (2) currency gains or losses realized between the trade and settlement dates on securities transactions, and (3) the difference between the amounts of dividends, interest, and foreign withholding taxes recorded on the Fund’s books and the U.S. dollar equivalent of the amounts actually received or paid. Net unrealized foreign currency gains and losses arise from changes in the fair values of assets and liabilities, other than investments in securities at fiscal period end, resulting from changes in exchange rates. |
18 Invesco International Total Return Fund
The Fund may invest in foreign securities, which may be subject to foreign taxes on income, gains on investments or currency repatriation, a portion of which may be recoverable. Foreign taxes, if any, are recorded based on the tax regulations and rates that exist in the foreign markets in which the Fund invests and are shown in the Statement of Operations.
| J. | Forward Foreign Currency Contracts — The Fund may engage in foreign currency transactions either on a spot (i.e. for prompt delivery and settlement) basis, or through forward foreign currency contracts, to manage or minimize currency or exchange rate risk. |
The Fund may also enter into forward foreign currency contracts for the purchase or sale of a security denominated in a foreign currency in order to “lock in” the U.S. dollar price of that security, or the Fund may also enter into forward foreign currency contracts that do not provide for physical settlement of the two currencies, but instead are settled by a single cash payment calculated as the difference between the agreed upon exchange rate and the spot rate at settlement based upon an agreed upon notional amount (non-deliverable forwards). The Fund will set aside liquid assets in an amount equal to the daily mark-to-market obligation for forward foreign currency contracts.
A forward foreign currency contract is an obligation between two parties (“Counterparties”) to purchase or sell a specific currency for an agreed-upon price at a future date. The use of forward foreign currency contracts does not eliminate fluctuations in the price of the underlying securities the Fund owns or intends to acquire but establishes a rate of exchange in advance. Fluctuations in the value of these contracts are measured by the difference in the contract date and reporting date exchange rates and are recorded as unrealized appreciation (depreciation) until the contracts are closed. When the contracts are closed, realized gains (losses) are recorded. Realized and unrealized gains (losses) on the contracts are included in the Statement of Operations. The primary risks associated with forward foreign currency contracts include failure of the Counterparty to meet the terms of the contract and the value of the foreign currency changing unfavorably. These risks may be in excess of the amounts reflected in the Statement of Assets and Liabilities.
| K. | Futures Contracts — The Fund may enter into futures contracts to manage exposure to interest rate, equity and market price movements and/or currency risks. A futures contract is an agreement between Counterparties to purchase or sell a specified underlying security, currency or commodity (or delivery of a cash settlement price, in the case of an index future) for a fixed price at a future date. The Fund currently invests only in exchange-traded futures and they are standardized as to maturity date and underlying financial instrument. Initial margin deposits required upon entering into futures contracts are satisfied by the segregation of specific securities or cash as collateral at the futures commission merchant (broker). During the period the futures contracts are open, changes in the value of the contracts are recognized as unrealized gains or losses by recalculating the value of the contracts on a daily basis. Subsequent or variation margin payments are received or made depending upon whether unrealized gains or losses are incurred. These amounts are reflected as receivables or payables on the Statement of Assets and Liabilities. When the contracts are closed or expire, the Fund recognizes a realized gain or loss equal to the difference between the proceeds from, or cost of, the closing transaction and the Fund’s basis in the contract. The net realized gain (loss) and the change in unrealized gain (loss) on futures contracts held during the period is included on the Statement of Operations. The primary risks associated with futures contracts are market risk and the absence of a liquid secondary market. If the Fund were unable to liquidate a futures contract and/or enter into an offsetting closing transaction, the Fund would continue to be subject to market risk with respect to the value of the contracts and continue to be required to maintain the margin deposits on the futures contracts. Futures contracts have minimal Counterparty risk since the exchange’s clearinghouse, as Counterparty to all exchange-traded futures, guarantees the futures against default. Risks may exceed amounts recognized in the Statement of Assets and Liabilities. |
| L. | Call Options Purchased and Written — The Fund may write call options and/or buy call options. A covered call option gives the purchaser of such option the right to buy, and the writer the obligation to sell, the underlying security or foreign currency at the stated exercise price during the option period. An uncovered call option exists without the ownership of the underlying security. Options written by the Fund normally will have expiration dates between three and nine months from the date written. The exercise price of a call option may be below, equal to, or above the current market value of the underlying security at the time the option is written. |
Additionally, the Fund may enter into an option on a swap agreement, also called a “swaption”. A swaption is an option that gives the buyer the right, but not the obligation, to enter into a swap on a future date in exchange for paying a market-based premium. A receiver swaption gives the owner the right to receive the total return of a specified asset, reference rate or index. Swaptions also include options that allow an existing swap to be terminated or extended by one of the Counterparties.
When the Fund writes a covered call option, an amount equal to the premium received by the Fund is recorded as an asset and an equivalent liability in the Statement of Assets and Liabilities. The amount of the liability is subsequently “marked-to-market” to reflect the current market value of the option written. If a written covered call option expires on the stipulated expiration date, or if the Fund enters into a closing purchase transaction, the Fund realizes a gain (or a loss if the closing purchase transaction exceeds the premium received when the option was written) without regard to any unrealized gain or loss on the underlying security, and the liability related to such option is extinguished. If a written covered call option is exercised, the Fund realizes a gain or a loss from the sale of the underlying security and the proceeds of the sale are increased by the premium originally received. Realized and unrealized gains and losses on these contracts are included in the Statement of Operations. A risk in writing a covered call option is that the Fund gives up the opportunity for profit if the market price of the security increases and the option is exercised. The risk in writing an uncovered call option is that the Fund may incur significant losses if the value of the written security exceeds the exercise price of the option.
When the Fund buys a call option, an amount equal to the premium paid by the Fund is recorded as an investment on the Statement of Assets and Liabilities. The amount of the investment is subsequently “marked-to-market” to reflect the current value of the option purchased. Realized and unrealized gains and losses on these contracts are included in the Statement of Operations. A risk in buying an option is that the Fund pays a premium whether or not the option is exercised. In addition, there can be no assurance that a liquid secondary market will exist for any option purchased.
| M. | Put Options Purchased and Written — The Fund may purchase and write put options including options on securities indexes, or foreign currency and/or futures contracts. By purchasing a put option, the Fund obtains the right (but not the obligation) to sell the option’s underlying instrument at a fixed strike price. In return for this right, the Fund pays an option premium. The option’s underlying instrument may be a security, securities index, or a futures contract. |
Additionally, the Fund may enter into an option on a swap agreement, also called a “swaption”. A swaption is an option that gives the buyer the right, but not the obligation, to enter into a swap on a future date in exchange for paying a market-based premium. A receiver swaption gives the
19 Invesco International Total Return Fund
owner the right to receive the total return of a specified asset, reference rate or index. Swaptions also include options that allow an existing swap to be terminated or extended by one of the Counterparties.
Put options may be used by the Fund to hedge securities it owns by locking in a minimum price at which the Fund can sell. If security prices fall, the put option could be exercised to offset all or a portion of the Fund’s resulting losses. At the same time, because the maximum the Fund has at risk is the cost of the option, purchasing put options does not eliminate the potential for the Fund to profit from an increase in the value of the underlying portfolio securities. The Fund may write put options to earn additional income in the form of option premiums if it expects the price of the underlying instrument to remain stable or rise during the option period so that the option will not be exercised. The risk in this strategy is that the price of the underlying securities may decline by an amount greater than the premium received. Put options written are reported as a liability in the Statement of Assets and Liabilities. Realized and unrealized gains and losses on put options purchased and put options written are included in the Statement of Operations as Net realized gain (loss) from and Change in net unrealized appreciation (depreciation) of Investment securities and Option contracts written, respectively. A risk in buying an option is that the Fund pays a premium whether or not the option is exercised. In addition, there can be no assurance that a liquid secondary market will exist for any option purchased.
| N. | Swap Agreements — The Fund may enter into various swap transactions, including interest rate, total return, index, currency and credit default swap contracts (“CDS”) for investment purposes or to manage interest rate, currency or credit risk. Such transactions are agreements between Counterparties. A swap agreement may be negotiated bilaterally and traded over-the-counter (“OTC”) between two parties (“uncleared/OTC”) or, in some instances, must be transacted through a future commission merchant (“FCM”) and cleared through a clearinghouse that serves as a central Counterparty (“centrally cleared swap”). These agreements may contain among other conditions, events of default and termination events, and various covenants and representations such as provisions that require the Fund to maintain a pre-determined level of net assets, and/or provide limits regarding the decline of the Fund’s NAV over specific periods of time. If the Fund were to trigger such provisions and have open derivative positions at that time, the Counterparty may be able to terminate such agreement and request immediate payment in an amount equal to the net liability positions, if any. |
Interest rate, total return, index, and currency swap agreements are two-party contracts entered into primarily to exchange the returns (or differentials in rates of returns) earned or realized on particular predetermined investments or instruments. The gross returns to be exchanged or “swapped” between the parties are calculated with respect to a notional amount, i.e., the return on or increase in value of a particular dollar amount invested at a particular interest rate or return of an underlying asset, in a particular foreign currency, or in a “basket” of securities representing a particular index.
In a centrally cleared swap, the Fund’s ultimate Counterparty is a central clearinghouse. The Fund initially will enter into centrally cleared swaps through an executing broker. When a fund enters into a centrally cleared swap, it must deliver to the central Counterparty (via the FCM) an amount referred to as “initial margin.” Initial margin requirements are determined by the central Counterparty, but an FCM may require additional initial margin above the amount required by the central Counterparty. Initial margin deposits required upon entering into centrally cleared swaps are satisfied by cash or securities as collateral at the FCM. Securities deposited as initial margin are designated on the Schedule of Investments and cash deposited is recorded on the Statement of Assets and Liabilities. During the term of a cleared swap agreement, a “variation margin” amount may be required to be paid by the Fund or may be received by the Fund, based on the daily change in price of the underlying reference instrument subject to the swap agreement and is recorded as a receivable or payable for variation margin in the Statement of Assets and Liabilities until the centrally cleared swap is terminated at which time a realized gain or loss is recorded.
A CDS is an agreement between Counterparties to exchange the credit risk of an issuer. A buyer of a CDS is said to buy protection by paying a fixed payment over the life of the agreement and in some situations an upfront payment to the seller of the CDS. If a defined credit event occurs (such as payment default or bankruptcy), the Fund as a protection buyer would cease paying its fixed payment, the Fund would deliver eligible bonds issued by the reference entity to the seller, and the seller would pay the full notional value, or the “par value”, of the referenced obligation to the Fund. A seller of a CDS is said to sell protection and thus would receive a fixed payment over the life of the agreement and an upfront payment, if applicable. If a credit event occurs, the Fund as a protection seller would cease to receive the fixed payment stream, the Fund would pay the buyer “par value” or the full notional value of the referenced obligation, and the Fund would receive the eligible bonds issued by the reference entity. In turn, these bonds may be sold in order to realize a recovery value. Alternatively, the seller of the CDS and its Counterparty may agree to net the notional amount and the market value of the bonds and make a cash payment equal to the difference to the buyer of protection. If no credit event occurs, the Fund receives the fixed payment over the life of the agreement. As the seller, the Fund would effectively add leverage to its portfolio because, in addition to its total net assets, the Fund would be subject to investment exposure on the notional amount of the CDS. In connection with these agreements, cash and securities may be identified as collateral in accordance with the terms of the respective swap agreements to provide assets of value and recourse in the event of default under the swap agreement or bankruptcy/insolvency of a party to the swap agreement. If a Counterparty becomes bankrupt or otherwise fails to perform its obligations due to financial difficulties, the Fund may experience significant delays in obtaining any recovery in a bankruptcy or other reorganization proceeding. The Fund may obtain only limited recovery or may obtain no recovery in such circumstances. The Fund’s maximum risk of loss from Counterparty risk, either as the protection seller or as the protection buyer, is the value of the contract. The risk may be mitigated by having a master netting arrangement between the Fund and the Counterparty and by the designation of collateral by the Counterparty to cover the Fund’s exposure to the Counterparty.
Implied credit spreads represent the current level at which protection could be bought or sold given the terms of the existing CDS contract and serve as an indicator of the current status of the payment/performance risk of the CDS. An implied spread that has widened or increased since entry into the initial contract may indicate a deteriorating credit profile and increased risk of default for the reference entity. A declining or narrowing spread may indicate an improving credit profile or decreased risk of default for the reference entity. Alternatively, credit spreads may increase or decrease reflecting the general tolerance for risk in the credit markets.
An interest rate swap is an agreement between Counterparties pursuant to which the parties exchange a floating rate payment for a fixed rate payment based on a specified notional amount.
Changes in the value of centrally cleared and OTC swap agreements are recognized as unrealized gains (losses) in the Statement of Operations by “marking to market” on a daily basis to reflect the value of the swap agreement at the end of each trading day. Payments received or paid at the beginning of the agreement are reflected as such on the Statement of Assets and Liabilities and may be referred to as upfront payments. The Fund accrues for the fixed payment stream and amortizes upfront payments, if any, on swap agreements on a daily basis with the net amount, recorded as
20 Invesco International Total Return Fund
a component of realized gain (loss) on the Statement of Operations. A liquidation payment received or made at the termination of a swap agreement is recorded as realized gain (loss) on the Statement of Operations. The Fund segregates cash or liquid securities having a value at least equal to the amount of the potential obligation of a Fund under any swap transaction. Cash held as collateral is recorded as deposits with brokers on the Statement of Assets and Liabilities. Entering into these agreements involves, to varying degrees, lack of liquidity and elements of credit, market, and Counterparty risk in excess of amounts recognized on the Statement of Assets and Liabilities. Such risks involve the possibility that a swap is difficult to sell or liquidate; the Counterparty does not honor its obligations under the agreement and unfavorable interest rates and market fluctuations. It is possible that developments in the swaps market, including potential government regulation, could adversely affect the Fund’s ability to terminate existing swap agreements or to realize amounts to be received under such agreements. A short position in a security poses more risk than holding the same security long. As there is no limit on how much the price of the security can increase, the Fund’s exposure is unlimited.
Notional amounts of each individual credit default swap agreement outstanding as of October 31, 2016 for which the Fund is the seller of protection are disclosed in the open swap agreements table. These potential amounts would be partially offset by any recovery values of the respective referenced obligations, upfront payments received upon entering into the agreement, or net amounts received from the settlement of buy protection credit default swap agreements entered into by the Fund for the same referenced entity or entities.
| O. | Leverage Risk — Leverage exists when the Fund can lose more than it originally invests because it purchases or sells an instrument or enters into a transaction without investing an amount equal to the full economic exposure of the instrument or transaction. |
| P. | Collateral — To the extent the Fund has designated or segregated a security as collateral and that security is subsequently sold, it is the Fund’s practice to replace such collateral no later than the next business day. |
NOTE 2—Advisory Fees and Other Fees Paid to Affiliates
The Trust has entered into a master investment advisory agreement with Invesco Advisers, Inc. (the “Adviser” or “Invesco”). Under the terms of the investment advisory agreement, the Fund pays an advisory fee to the Adviser based on the annual rate of the Fund’s average daily net assets as follows:
| | | | | | | | |
| Average Daily Net Assets | | Rate | |
First $250 million | | | 0 | .65% | | | | |
Next $250 million | | | 0 | .59% | | | | |
Next $500 million | | | 0 | .565% | | | | |
Next $1.5 billion | | | 0 | .54% | | | | |
Next $2.5 billion | | | 0 | .515% | | | | |
Next $5 billion | | | 0 | .49% | | | | |
Over $10 billion | | | 0 | .465% | | | | |
For the year ended October 31, 2016, the effective advisory fees incurred by the Fund was 0.65%.
Under the terms of a master sub-advisory agreement between the Adviser and each of Invesco Asset Management Deutschland GmbH, Invesco Asset Management Limited, Invesco Asset Management (Japan) Limited, Invesco Hong Kong Limited, Invesco Senior Secured Management, Inc. and Invesco Canada Ltd. (collectively, the “Affiliated Sub-Advisers”) the Adviser, not the Fund, will pay 40% of the fees paid to the Adviser to any such Affiliated Sub-Adviser(s) that provide(s) discretionary investment management services to the Fund based on the percentage of assets allocated to such Affiliated Sub-Adviser(s).
The Adviser has contractually agreed, through at least February 28, 2017, to waive advisory fees and/or reimburse expenses to the extent necessary to limit total annual fund operating expenses after fee waiver and/or expense reimbursement (excluding certain items discussed below) of Class A, Class B, Class C, Class Y, Class R5 and Class R6 shares to 1.10%, 1.85%, 1.85%, 0.85%, 0.85% and 0.85%, respectively, of the Fund’s average daily net assets (the “expense limits”). In determining the Adviser’s obligation to waive advisory fees and/or reimburse expenses, the following expenses are not taken into account, and could cause total annual fund operating expenses after fee waiver and/or expense reimbursement to exceed the numbers reflected above: (1) interest; (2) taxes; (3) dividend expense on short sales; (4) extraordinary or non-routine items, including litigation expenses; and (5) expenses that the Fund has incurred but did not actually pay because of an expense offset arrangement. Unless Invesco continues the fee waiver agreement, it will terminate on February 28, 2017. During its term, the fee waiver agreement cannot be terminated or amended to increase the expense limits without approval of the Board of Trustees.
Further, the Adviser has contractually agreed, through at least June 30, 2018, to waive the advisory fee payable by the Fund in an amount equal to 100% of the net advisory fees the Adviser receives from the affiliated money market funds on investments by the Fund of uninvested cash in such affiliated money market funds.
For the year ended October 31, 2016, the Adviser waived advisory fees of $204,477 and reimbursed class level expenses of $80,139, $1,944, $15,234, $17,545 and $86 of Class A, Class B, Class C, Class Y and Class R6 shares, respectively.
The Trust has entered into a master administrative services agreement with Invesco pursuant to which the Fund has agreed to pay Invesco for certain administrative costs incurred in providing accounting services to the Fund. For the year ended October 31, 2016, expenses incurred under the agreement are shown in the Statement of Operations as Administrative services fees.
The Trust has entered into a transfer agency and service agreement with Invesco Investment Services, Inc. (“IIS”) pursuant to which the Fund has agreed to pay IIS a fee for providing transfer agency and shareholder services to the Fund and reimburse IIS for certain expenses incurred by IIS in the course of providing such services. IIS may make payments to intermediaries that provide omnibus account services, sub-accounting services and/or networking services. All fees payable by IIS to intermediaries that provide omnibus account services or sub-accounting are charged back to the Fund, subject to certain limitations approved by the Trust’s Board of Trustees. For the year ended October 31, 2016, expenses incurred under the agreement are shown in the Statement of Operations as Transfer agent fees.
The Trust has entered into master distribution agreements with Invesco Distributors, Inc. (“IDI”) to serve as the distributor for the Class A, Class B, Class C, Class Y, Class R5 and Class R6 shares of the Fund. The Trust has adopted plans pursuant to Rule 12b-1 under the 1940 Act with respect to
21 Invesco International Total Return Fund
the Fund’s Class A, Class B and Class C shares (collectively, the “Plans”). The Fund, pursuant to the Plans, pays IDI compensation at the annual rate of 0.25% of the Fund’s average daily net assets of Class A shares and 1.00% of the average daily net assets of Class B and Class C shares. Of the Plan payments, up to 0.25% of the average daily net assets of each class of shares may be paid to furnish continuing personal shareholder services to customers who purchase and own shares of such classes. Any amounts not paid as a service fee under the Plans would constitute an asset-based sales charge. Rules of the Financial Industry Regulatory Authority (“FINRA”) impose a cap on the total sales charges, including asset-based sales charges, that may be paid by any class of shares of the Fund. For the year ended October 31, 2016, expenses incurred under the Plans are shown in the Statement of Operations as Distribution fees.
Front-end sales commissions and CDSC (collectively, the “sales charges”) are not recorded as expenses of the Fund. Front-end sales commissions are deducted from proceeds from the sales of Fund shares prior to investment in Class A shares of the Fund. CDSC are deducted from redemption proceeds prior to remittance to the shareholder. During the year ended October 31, 2016, IDI advised the Fund that IDI retained $4,775 in front-end sales commissions from the sale of Class A shares and $28, $320 and $160 from Class A, Class B and Class C shares, respectively, for CDSC imposed on redemptions by shareholders.
Certain officers and trustees of the Trust are officers and directors of the Adviser, IIS and/or IDI.
NOTE 3—Additional Valuation Information
GAAP defines fair value as the price that would be received to sell an asset or paid to transfer a liability in an orderly transaction between market participants at the measurement date, under current market conditions. GAAP establishes a hierarchy that prioritizes the inputs to valuation methods, giving the highest priority to readily available unadjusted quoted prices in an active market for identical assets (Level 1) and the lowest priority to significant unobservable inputs (Level 3), generally when market prices are not readily available or are unreliable. Based on the valuation inputs, the securities or other investments are tiered into one of three levels. Changes in valuation methods may result in transfers in or out of an investment’s assigned level:
| | Level 1 — | Prices are determined using quoted prices in an active market for identical assets. |
| | Level 2 — | Prices are determined using other significant observable inputs. Observable inputs are inputs that other market participants may use in pricing a security. These may include quoted prices for similar securities, interest rates, prepayment speeds, credit risk, yield curves, loss severities, default rates, discount rates, volatilities and others. |
| | Level 3 — | Prices are determined using significant unobservable inputs. In situations where quoted prices or observable inputs are unavailable (for example, when there is little or no market activity for an investment at the end of the period), unobservable inputs may be used. Unobservable inputs reflect the Fund’s own assumptions about the factors market participants would use in determining fair value of the securities or instruments and would be based on the best available information. |
The following is a summary of the tiered valuation input levels, as of October 31, 2016. The level assigned to the securities valuations may not be an indication of the risk or liquidity associated with investing in those securities. Because of the inherent uncertainties of valuation, the values reflected in the financial statements may materially differ from the value received upon actual sale of those investments.
| | | | | | | | | | | | | | | | |
| | | Level 1 | | | Level 2 | | | Level 3 | | | Total | |
Non U.S. Denominated Bonds & Notes | | $ | | | | $ | 30,342,283 | | | $ | — | | | $ | 30,342,283 | |
U.S. Denominated Bonds & Notes | | | | | | | 10,725,245 | | | | — | | | | 10,725,245 | |
Collateralized Mortgage Obligations | | | — | | | | 1,647,450 | | | | — | | | | 1,647,450 | |
Money Market Funds | | | 978,661 | | | | — | | | | — | | | | 978,661 | |
| | | | 978,661 | | | | 42,714,978 | | | | — | | | | 43,693,639 | |
Forward Foreign Currency Contracts* | | | — | | | | (15,508 | ) | | | — | | | | (15,508 | ) |
Futures Contracts* | | | 53,023 | | | | — | | | | — | | | | 53,023 | |
Swap Agreements* | | | — | | | | (261,995 | ) | | | — | | | | (261,995 | ) |
Total Investments | | $ | 1,031,684 | | | $ | 42,437,475 | | | $ | — | | | $ | 43,469,159 | |
| * | Forward foreign currency contracts, futures contracts and swap agreements are valued at unrealized appreciation (depreciation). |
NOTE 4—Derivative Investments
The Fund may enter into an International Swaps and Derivatives Association Master Agreement (“ISDA Master Agreement”) under which a Fund may trade OTC derivatives. An OTC transaction entered into under an ISDA Master Agreement typically involves a collateral posting arrangement, payment netting provisions and close-out netting provisions. These netting provisions allow for reduction of credit risk through netting of contractual obligations. The enforceability of the netting provisions of the ISDA Master Agreement depends on the governing law of the ISDA Master Agreement, among other factors.
For financial reporting purposes, the Fund does not offset OTC derivative assets or liabilities that are subject to ISDA Master Agreements in the Consolidated Statement of Assets and Liabilities.
22 Invesco International Total Return Fund
Value of Derivative Investments at Period-End
The table below summarizes the value of the Fund’s derivative investments, detailed by primary risk exposure, held as of October 31, 2016:
| | | | | | | | | | | | | | | | | | | | |
| | | Value | |
| Derivative Assets | | Credit Risk | | | Currency
Risk | | | Equity
Risk | | | Interest
Rate Risk | | | Total | |
Unrealized appreciation on futures contracts — Exchange-Traded(a) | | $ | — | | | $ | — | | | $ | — | | | $ | 53,023 | | | $ | 53,023 | |
Unrealized appreciation on forward foreign currency contracts outstanding(b) | | | — | | | | 947,318 | | | | — | | | | — | | | | 947,318 | |
Total Derivative Assets | | $ | — | | | $ | 947,318 | | | $ | — | | | $ | 53,023 | | | | 1,000,341 | |
Derivatives not subject to master netting agreements | | | — | | | | — | | | | — | | | | (53,023 | ) | | | (53,023 | ) |
Total Derivative Assets subject to master netting agreements | | $ | — | | | $ | 947,318 | | | $ | — | | | $ | — | | | $ | 947,318 | |
| | | | | |
| | | | | | | | | | | | | | | | | | | | |
| | | Value | |
| Derivative Liabilities | | Credit
Risk | | | Currency
Risk | | | Equity
Risk | | | Interest
Rate Risk | | | Total | |
Unrealized depreciation on swap agreements — OTC(c) | | $ | (142,908 | ) | | $ | — | | | $ | (11,347 | ) | | $ | — | | | $ | (154,255 | ) |
Unrealized depreciation forward foreign currency contracts outstanding(b) | | | — | | | | (962,826 | ) | | | — | | | | — | | | | (962,826 | ) |
Unrealized depreciation on swap agreements — Centrally Cleared(d) | | | (15,508 | ) | | | — | | | | — | | | | (92,232 | ) | | | (107,740 | ) |
Total Derivative Liabilities | | $ | (158,416 | ) | | $ | (962,826 | ) | | $ | (11,347 | ) | | $ | (92,232 | ) | | $ | (1,224,821 | ) |
Derivatives not subject to master netting agreements | | | 15,508 | | | | — | | | | — | | | | 92,232 | | | | 107,740 | |
Total Derivative Liabilities subject to master netting agreements | | $ | (142,908 | ) | | $ | (962,826 | ) | | $ | (11,347 | ) | | $ | — | | | $ | (1,117,081 | ) |
| (a) | Includes cumulative appreciation on futures contracts. Only current day’s variation margin receivable is reported within the Statement of Assets and Liabilities. |
| (b) | Values are disclosed on the Statement of Assets and Liabilities under the captions Unrealized appreciation on forward foreign currency contracts outstanding and Unrealized depreciation on forward foreign currency contracts outstanding. |
| (c) | Values are disclosed on the Statement of Assets and Liabilities under the caption Unrealized depreciation on swap agreements — OTC. |
| (d) | Includes cumulative appreciation (depreciation) on swap agreements. Only current day’s variation margin receivable (payable) is reported within the Statement of Assets and Liabilities. |
Offsetting Assets and Liabilities
The table below reflects the Fund’s exposure to Counterparties subject to either and ISDA Master Agreement or other agreement for OTC derivative transactions as of October 31, 2016.
| | | | | | | | | | | | | | | | | | | | | | | | | | | | | | | | | | | | | | | | |
| | | Financial Derivative Assets | | | Financial Derivative Liabilities | | | | | | Collateral
(Received)/
Pledged | | | Net
amount | |
| Counterparty | | Forward
foreign
currency
contracts | | | Swap
agreements | | | Total
assets | | | Forward
foreign
currency
contracts | | | Swap
agreements | | | Total
liabilities | | | Net value
of
derivatives | | | Non-Cash | | | Cash | | |
Barclays Bank PLC | | $ | — | | | $ | 93,727 | | | $ | 93,727 | | | $ | — | | | $ | (20,736 | ) | | $ | (20,736 | ) | | $ | 72,991 | | | $ | — | | | $ | — | | | $ | 72,991 | |
Citibank, N.A. | | | — | | | | 1,029 | | | | 1,029 | | | | — | | | | (11,347 | ) | | | (11,347 | ) | | | (10,318 | ) | | | — | | | | — | | | | (10,318 | ) |
Citigroup Global Markets Inc. | | | 137,768 | | | | — | | | | 137,768 | | | | (165,849 | ) | | | — | | | | (165,849 | ) | | | (28,081 | ) | | | — | | | | — | | | | (28,081 | ) |
Deutsche Bank Securities | | | 110,231 | | | | — | | | | 110,231 | | | | (117,917 | ) | | | — | | | | (117,917 | ) | | | (7,686 | ) | | | — | | | | — | | | | (7,686 | ) |
Goldman Sachs International | | | 492,003 | | | | 314,748 | | | | 806,751 | | | | (476,226 | ) | | | (127,307 | ) | | | (603,533 | ) | | | 203,218 | | | | — | | | | — | | | | 203,218 | |
JPMorgan Chase Bank, N.A. | | | 56,077 | | | | — | | | | 56,077 | | | | (97,568 | ) | | | — | | | | (97,568 | ) | | | (41,491 | ) | | | — | | | | — | | | | (41,491 | ) |
Merrill Lynch International | | | 85,354 | | | | — | | | | 85,354 | | | | (89,104 | ) | | | — | | | | (89,104 | ) | | | (3,750 | ) | | | — | | | | — | | | | (3,750 | ) |
Morgan Stanley & Co. LLC | | | 14,025 | | | | — | | | | 14,025 | | | | (11,915 | ) | | | — | | | | (11,915 | ) | | | 2,110 | | | | — | | | | — | | | | 2,110 | |
RBC Capital Markets Corp. | | | 36,352 | | | | — | | | | 36,352 | | | | — | | | | — | | | | — | | | | 36,352 | | | | — | | | | — | | | | 36,352 | |
TD Bank, N.A. | | | 15,508 | | | | — | | | | 15,508 | | | | (4,247 | ) | | | — | | | | (4,247 | ) | | | 11,261 | | | | — | | | | — | | | | 11,261 | |
Total | | $ | 947,318 | | | $ | 409,504 | | | $ | 1,356,822 | | | $ | (962,826 | ) | | $ | (159,390 | ) | | $ | (1,122,216 | ) | | $ | 234,606 | | | $ | — | | | $ | — | | | $ | 234,606 | |
23 Invesco International Total Return Fund
Effect of Derivative Investments for the year ended October 31, 2016
The table below summarizes the gains (losses) on derivative investments, detailed by primary risk exposure, recognized in earnings during the period:
| | | | | | | | | | | | | | | | | | | | |
| | | Location of Gain (Loss) on
Statement of Operations | |
| | Credit
Risk | | | Currency
Risk | | | Equity
Risk | | | Interest
Rate Risk | | | Total | |
Realized Gain (Loss): | | | | | | | | | | | | | | | | | | | | |
Forward foreign currency contracts | | $ | — | | | $ | 777,322 | | | $ | — | | | $ | — | | | $ | 777,322 | |
Futures contracts | | | — | | | | — | | | | — | | | | 98,438 | | | | 98,438 | |
Options purchased(a) | | | — | | | | (9,790 | ) | | | — | | | | (38,500 | ) | | | (48,290 | ) |
Options written | | | — | | | | 22,104 | | | | — | | | | 9,250 | | | | 31,354 | |
Swap agreements | | | (65,449 | ) | | | — | | | | (116,182 | ) | | | (248,017 | ) | | | (429,648 | ) |
Change in Net Unrealized Appreciation (Depreciation): | | | | | | | | | | | | | | | | | | | | |
Forward foreign currency contracts | | | — | | | | 16,428 | | | | — | | | | — | | | | 16,428 | |
Futures contracts | | | — | | | | — | | | | — | | | | 33,097 | | | | 33,097 | |
Options purchased(a) | | | — | | | | 4,849 | | | | — | | | | — | | | | 4,849 | |
Options written | | | — | | | | (9,698 | ) | | | — | | | | — | | | | (9,698 | ) |
Swap agreements | | | (158,416 | ) | | | — | | | | (11,347 | ) | | | (92,232 | ) | | | (261,995 | ) |
Total | | $ | (223,865 | ) | | $ | 801,215 | | | $ | (127,529 | ) | | $ | (237,964 | ) | | $ | 211,857 | |
| (a) | Options purchased are included in the net realized gain (loss) from investment securities and the change in net unrealized appreciation (depreciation) of investment securities. |
The table below summarizes the twelve month average notional value of forward foreign currency contracts, the eleven month average notional value of futures contracts, the four month average notional value of options purchased, the seven month average notional value of options written and the twelve month average notional value of swap agreements outstanding during the period.
| | | | | | | | | | | | | | | | | | | | |
| | | Forward
Foreign
Currency
Contracts | | | Futures
Contracts | | | Options
Purchased | | | Options
Written | | | Swap
Agreements | |
Average notional value | | $ | 65,916,412 | | | $ | 3,138,768 | | | $ | 2,781,030 | | | $ | 2,392,146 | | | $ | 14,368,867 | |
| | | | | | | | | | | | | | | | | | | | | | | | | | |
| Open Forward Foreign Currency Contracts | |
Settlement Date | | Counterparty | | Contract to | | | Notional
Value | | | Unrealized
Appreciation
(Depreciation) | |
| | | Deliver | | | | | | Receive | | | |
11/21/16 | | Goldman Sachs International | | | CNY | | | | 3,500,000 | | | | USD | | | | 529,728 | | | $ | 515,851 | | | $ | 13,877 | |
11/21/16 | | TD Bank, N.A. | | | USD | | | | 520,098 | | | | CNY | | | | 3,500,000 | | | | 515,851 | | | | (4,247 | ) |
11/30/16 | | Citigroup Global Markets Inc. | | | EUR | | | | 2,000,000 | | | | USD | | | | 2,241,501 | | | | 2,198,123 | | | | 43,378 | |
11/30/16 | | Citigroup Global Markets Inc. | | | EUR | | | | 405,835 | | | | GBP | | | | 350,000 | | | | 456,138 | | | | (17,464 | ) |
11/30/16 | | Citigroup Global Markets Inc. | | | GBP | | | | 1,300,000 | | | | USD | | | | 1,665,396 | | | | 1,591,843 | | | | 73,553 | |
11/30/16 | | Citigroup Global Markets Inc. | | | PLN | | | | 7,600,000 | | | | USD | | | | 1,921,868 | | | | 1,935,830 | | | | (13,962 | ) |
11/30/16 | | Citigroup Global Markets Inc. | | | PLN | | | | 3,755,000 | | | | EUR | | | | 867,415 | | | | 985,861 | | | | (3,110 | ) |
11/30/16 | | Citigroup Global Markets Inc. | | | SGD | | | | 1,000,000 | | | | USD | | | | 739,835 | | | | 718,998 | | | | 20,837 | |
11/30/16 | | Citigroup Global Markets Inc. | | | USD | | | | 6,091,437 | | | | EUR | | | | 5,491,809 | | | | 6,035,834 | | | | (55,603 | ) |
11/30/16 | | Citigroup Global Markets Inc. | | | USD | | | | 918,447 | | | | GBP | | | | 700,000 | | | | 857,146 | | | | (61,301 | ) |
11/30/16 | | Citigroup Global Markets Inc. | | | USD | | | | 2,510,610 | | | | PLN | | | | 9,800,000 | | | | 2,496,201 | | | | (14,409 | ) |
11/30/16 | | Deutsche Bank Securities Inc. | | | GBP | | | | 473,819 | | | | USD | | | | 626,972 | | | | 580,189 | | | | 46,783 | |
11/30/16 | | Deutsche Bank Securities Inc. | | | KRW | | | | 2,000,000,000 | | | | USD | | | | 1,762,504 | | | | 1,747,694 | | | | 14,810 | |
11/30/16 | | Deutsche Bank Securities Inc. | | | RUB | | | | 47,000,000 | | | | USD | | | | 701,134 | | | | 735,691 | | | | (34,557 | ) |
11/30/16 | | Deutsche Bank Securities Inc. | | | TWD | | | | 30,000,000 | | | | USD | | | | 939,644 | | | | 949,758 | | | | (10,114 | ) |
11/30/16 | | Deutsche Bank Securities Inc. | | | USD | | | | 941,620 | | | | TWD | | | | 30,000,000 | | | | 949,758 | | | | 8,138 | |
11/30/16 | | Deutsche Bank Securities Inc. | | | USD | | | | 625,673 | | | | GBP | | | | 473,819 | | | | 580,189 | | | | (45,484 | ) |
11/30/16 | | Deutsche Bank Securities Inc. | | | USD | | | | 898,311 | | | | KRW | | | | 1,000,000,000 | | | | 873,847 | | | | (24,464 | ) |
11/30/16 | | Deutsche Bank Securities Inc. | | | USD | | | | 713,025 | | | | RUB | | | | 47,000,000 | | | | 735,690 | | | | 22,665 | |
11/30/16 | | Goldman Sachs International | | | AUD | | | | 300,000 | | | | USD | | | | 227,415 | | | | 228,015 | | | | (600 | ) |
11/30/16 | | Goldman Sachs International | | | CAD | | | | 2,300,000 | | | | USD | | | | 1,734,315 | | | | 1,715,153 | | | | 19,162 | |
11/30/16 | | Goldman Sachs International | | | CHF | | | | 600,000 | | | | USD | | | | 602,343 | | | | 607,255 | | | | (4,912 | ) |
11/30/16 | | Goldman Sachs International | | | CLP | | | | 500,000,000 | | | | USD | | | | 742,666 | | | | 763,685 | | | | (21,019 | ) |
24 Invesco International Total Return Fund
| | | | | | | | | | | | | | | | | | | | | | | | | | |
| Open Forward Foreign Currency Contracts — (continued) | |
Settlement Date | | Counterparty | | Contract to | | | Notional
Value | | | Unrealized
Appreciation
(Depreciation) | |
| | | Deliver | | | | | | Receive | | | |
11/30/16 | | Goldman Sachs International | | | COP | | | | 3,760,000,000 | | | | USD | | | | 1,232,203 | | | $ | 1,244,300 | | | $ | (12,097 | ) |
11/30/16 | | Goldman Sachs International | | | EUR | | | | 1,500,000 | | | | USD | | | | 1,660,234 | | | | 1,648,591 | | | | 11,643 | |
11/30/16 | | Goldman Sachs International | | | GBP | | | | 1,750,000 | | | | USD | | | | 2,280,006 | | | | 2,142,865 | | | | 137,141 | |
11/30/16 | | Goldman Sachs International | | | HUF | | | | 515,000,000 | | | | USD | | | | 1,841,886 | | | | 1,830,981 | | | | 10,905 | |
11/30/16 | | Goldman Sachs International | | | IDR | | | | 12,600,000,000 | | | | USD | | | | 942,293 | | | | 962,934 | | | | (20,641 | ) |
11/30/16 | | Goldman Sachs International | | | MXN | | | | 85,000,000 | | | | USD | | | | 4,501,340 | | | | 4,480,723 | | | | 20,617 | |
11/30/16 | | Goldman Sachs International | | | MYR | | | | 3,000,000 | | | | USD | | | | 731,243 | | | | 713,874 | | | | 17,369 | |
11/30/16 | | Goldman Sachs International | | | NZD | | | | 1,300,000 | | | | USD | | | | 934,135 | | | | 928,486 | | | | 5,649 | |
11/30/16 | | Goldman Sachs International | | | PLN | | | | 9,800,000 | | | | USD | | | | 2,531,211 | | | | 2,496,202 | | | | 35,009 | |
11/30/16 | | Goldman Sachs International | | | SEK | | | | 15,000,000 | | | | USD | | | | 1,770,656 | | | | 1,662,997 | | | | 107,659 | |
11/30/16 | | Goldman Sachs International | | | TRY | | | | 7,400,000 | | | | USD | | | | 2,418,513 | | | | 2,376,366 | | | | 42,147 | |
11/30/16 | | Goldman Sachs International | | | USD | | | | 227,910 | | | | AUD | | | | 300,000 | | | | 228,015 | | | | 105 | |
11/30/16 | | Goldman Sachs International | | | USD | | | | 456,781 | | | | CAD | | | | 600,000 | | | | 447,431 | | | | (9,350 | ) |
11/30/16 | | Goldman Sachs International | | | USD | | | | 606,006 | | | | CHF | | | | 600,000 | | | | 607,255 | | | | 1,249 | |
11/30/16 | | Goldman Sachs International | | | USD | | | | 306,748 | | | | CLP | | | | 200,000,000 | | | | 305,474 | | | | (1,274 | ) |
11/30/16 | | Goldman Sachs International | | | USD | | | | 936,776 | | | | COP | | | | 2,760,000,000 | | | | 913,369 | | | | (23,407 | ) |
11/30/16 | | Goldman Sachs International | | | USD | | | | 560,071 | | | | EUR | | | | 500,000 | | | | 549,531 | | | | (10,540 | ) |
11/30/16 | | Goldman Sachs International | | | USD | | | | 2,188,648 | | | | GBP | | | | 1,749,966 | | | | 2,142,824 | | | | (45,824 | ) |
11/30/16 | | Goldman Sachs International | | | USD | | | | 1,866,867 | | | | HUF | | | | 515,000,000 | | | | 1,830,980 | | | | (35,887 | ) |
11/30/16 | | Goldman Sachs International | | | USD | | | | 530,504 | | | | IDR | | | | 7,000,000,000 | | | | 534,964 | | | | 4,460 | |
11/30/16 | | Goldman Sachs International | | | USD | | | | 730,674 | | | | INR | | | | 50,000,000 | | | | 746,491 | | | | 15,817 | |
11/30/16 | | Goldman Sachs International | | | USD | | | | 2,751,371 | | | | MXN | | | | 51,800,000 | | | | 2,730,607 | | | | (20,764 | ) |
11/30/16 | | Goldman Sachs International | | | USD | | | | 927,642 | | | | NZD | | | | 1,300,000 | | | | 928,486 | | | | 844 | |
11/30/16 | | Goldman Sachs International | | | USD | | | | 3,581,952 | | | | PLN | | | | 13,855,000 | | | | 3,529,068 | | | | (52,884 | ) |
11/30/16 | | Goldman Sachs International | | | USD | | | | 1,746,589 | | | | SEK | | | | 15,000,000 | | | | 1,662,997 | | | | (83,592 | ) |
11/30/16 | | Goldman Sachs International | | | USD | | | | 735,927 | | | | SGD | | | | 1,000,000 | | | | 718,998 | | | | (16,929 | ) |
11/30/16 | | Goldman Sachs International | | | USD | | | | 1,882,059 | | | | TRY | | | | 5,700,000 | | | | 1,830,444 | | | | (51,615 | ) |
11/30/16 | | Goldman Sachs International | | | USD | | | | 1,121,631 | | | | ZAR | | | | 15,700,000 | | | | 1,157,493 | | | | 35,862 | |
11/30/16 | | Goldman Sachs International | | | ZAR | | | | 23,600,000 | | | | USD | | | | 1,678,664 | | | | 1,739,925 | | | | (61,261 | ) |
11/30/16 | | JPMorgan Chase Bank, N.A. | | | AUD | | | | 2,000,000 | | | | USD | | | | 1,528,338 | | | | 1,520,100 | | | | 8,238 | |
11/30/16 | | JPMorgan Chase Bank, N.A. | | | JPY | | | | 170,000,000 | | | | USD | | | | 1,662,978 | | | | 1,622,702 | | | | 40,276 | |
11/30/16 | | JPMorgan Chase Bank, N.A. | | | NZD | | | | 600,000 | | | | USD | | | | 427,861 | | | | 428,532 | | | | (671 | ) |
11/30/16 | | JPMorgan Chase Bank, N.A. | | | USD | | | | 1,535,921 | | | | AUD | | | | 2,000,000 | | | | 1,520,100 | | | | (15,821 | ) |
11/30/16 | | JPMorgan Chase Bank, N.A. | | | USD | | | | 694,503 | | | | CAD | | | | 900,000 | | | | 671,147 | | | | (23,356 | ) |
11/30/16 | | JPMorgan Chase Bank, N.A. | | | USD | | | | 1,674,749 | | | | JPY | | | | 170,000,000 | | | | 1,622,702 | | | | (52,047 | ) |
11/30/16 | | JPMorgan Chase Bank, N.A. | | | USD | | | | 428,779 | | | | NZD | | | | 600,000 | | | | 428,532 | | | | (247 | ) |
11/30/16 | | Merrill Lynch International | | | AUD | | | | 2,489,000 | | | | USD | | | | 1,865,716 | | | | 1,891,764 | | | | (26,048 | ) |
11/30/16 | | Merrill Lynch International | | | GBP | | | | 370,000 | | | | USD | | | | 450,570 | | | | 453,063 | | | | (2,493 | ) |
11/30/16 | | Merrill Lynch International | | | JPY | | | | 360,000,000 | | | | USD | | | | 3,474,669 | | | | 3,436,311 | | | | 38,358 | |
11/30/16 | | Merrill Lynch International | | | NOK | | | | 4,500,000 | | | | EUR | | | | 499,961 | | | | 560,606 | | | | 4,859 | |
11/30/16 | | Merrill Lynch International | | | NOK | | | | 19,110,018 | | | | USD | | | | 2,270,660 | | | | 2,312,855 | | | | (42,195 | ) |
11/30/16 | | Merrill Lynch International | | | SEK | | | | 3,000,000 | | | | USD | | | | 346,889 | | | | 332,599 | | | | 14,290 | |
11/30/16 | | Merrill Lynch International | | | USD | | | | 822,744 | | | | AUD | | | | 1,080,000 | | | | 820,855 | | | | (1,889 | ) |
11/30/16 | | Merrill Lynch International | | | USD | | | | 416,357 | | | | IDR | | | | 5,600,000,000 | | | | 427,971 | | | | 11,614 | |
11/30/16 | | Merrill Lynch International | | | USD | | | | 12,980,769 | | | | JPY | | | | 1,361,611,320 | | | | 12,997,002 | | | | 16,233 | |
11/30/16 | | Merrill Lynch International | | | USD | | | | 2,872,129 | | | | NOK | | | | 23,610,018 | | | | 2,857,482 | | | | (14,647 | ) |
11/30/16 | | Merrill Lynch International | | | USD | | | | 334,431 | | | | SEK | | | | 3,000,000 | | | | 332,599 | | | | (1,832 | ) |
11/30/16 | | RBC Capital Markets Corp. | | | CAD | | | | 2,143,534 | | | | USD | | | | 1,634,825 | | | | 1,598,473 | | | | 36,352 | |
11/30/16 | | TD Bank, N.A. | | | USD | | | | 360,766 | | | | ZAR | | | | 5,000,000 | | | | 368,628 | | | | 7,862 | |
12/02/16 | | JPMorgan Chase Bank, N.A. | | | BRL | | | | 1,500,000 | | | | USD | | | | 472,843 | | | | 465,280 | | | | 7,563 | |
12/02/16 | | JPMorgan Chase Bank, N.A. | | | USD | | | | 470,706 | | | | BRL | | | | 1,500,000 | | | | 465,280 | | | | (5,426 | ) |
01/20/17 | | Goldman Sachs International | | | USD | | | | 927,835 | | | | PHP | | | | 45,000,000 | | | | 924,205 | | | | (3,630 | ) |
01/23/17 | | Morgan Stanley & Co. LLC | | | CNY | | | | 10,836,001 | | | | USD | | | | 1,600,000 | | | | 1,586,367 | | | | 13,633 | |
25 Invesco International Total Return Fund
| | | | | | | | | | | | | | | | | | | | | | | | | | |
| Open Forward Foreign Currency Contracts — (continued) | |
Settlement Date | | Counterparty | | Contract to | | | Notional
Value | | | Unrealized
Appreciation
(Depreciation) | |
| | | Deliver | | | | | | Receive | | | |
01/23/17 | | Morgan Stanley & Co. LLC | | | USD | | | | 1,598,136 | | | | CNY | | | | 10,835,000 | | | $ | 1,586,221 | | | $ | (11,915 | ) |
04/28/17 | | Deutsche Bank Securities Inc. | | | CNY | | | | 5,664,200 | | | | USD | | | | 841,358 | | | | 823,523 | | | | 17,835 | |
04/28/17 | | Deutsche Bank Securities Inc. | | | USD | | | | 400,000 | | | | CNY | | | | 2,728,519 | | | | 396,702 | | | | (3,298 | ) |
04/28/17 | | Goldman Sachs International | | | CNY | | | | 12,500,000 | | | | USD | | | | 1,829,874 | | | | 1,817,386 | | | | 12,488 | |
04/28/17 | | Morgan Stanley & Co. LLC | | | GBP | | | | 244,520 | | | | USD | | | | 300,644 | | | | 300,416 | | | | 228 | |
04/28/17 | | Morgan Stanley & Co. LLC | | | USD | | | | 300,000 | | | | GBP | | | | 244,315 | | | | 300,164 | | | | 164 | |
04/28/17 | | TD Bank, N.A. | | | CNY | | | | 9,700,000 | | | | USD | | | | 1,417,937 | | | | 1,410,291 | | | | 7,646 | |
Total Forward Foreign Currency Contracts — Currency Risk | | | $ | (15,508 | ) |
Currency Abbreviations:
| | |
| AUD | | – Australian Dollar |
| BRL | | – Brazilian Real |
| CAD | | – Canadian Dollar |
| CNY | | – Chinese Yuan |
| CHF | | – Swiss Franc |
| CLP | | – Chilean Peso |
| COP | | – Colombian Peso |
| | |
| EUR | | – Euro |
| GBP | | – British Pound Sterling |
| HUF | | – Hungarian Forint |
| IDR | | – Indonesian Rupiah |
| INR | | – Indian Rupee |
| JPY | | – Japanese Yen |
| KRW | | – South Korean Won |
| | |
| MXN | | – Mexican Peso |
| MYR | | – Malaysian Ringgit |
| NOK | | – Norwegian Krone |
| NZD | | – New Zealand Dollar |
| PLN | | – Polish Zloty |
| PHP | | – Philippine Peso |
| RUB | | – Russian Rouble |
| | |
| SEK | | – Swedish Krona |
| SGD | | – Singapore Dollar |
| TRY | | – Turkish Lira |
| TWD | | – Taiwan Dollar |
| USD | | – U.S. Dollar |
| ZAR | | – South African Rand |
| | | | | | | | | | | | | | | | | | | | |
| Open Futures Contracts — Interest Rate Risk(a) | |
| Futures Contracts | | Type of
Contract | | | Number of
Contracts | | | Expiration Month | | | Notional Value | | | Unrealized
Appreciation | |
Euro Bonds | | | Short | | | | 16 | | | | December-2016 | | | $ | (2,433,668 | ) | | $ | 53,023 | |
| (a) | Futures contracts collateralized by $80,591 cash held with Bank of America Merrill Lynch, the futures commission merchant. |
| | | | | | | | | | | | | | | | | | | | | | | | | | | | | | | | |
| Options Written Transactions | |
| | | Call Options | | | Put Options | |
| | | Notional Value | | | Premiums
Received | | | Notional
Value | | | Notional
Value | | | Premiums
Received | |
Beginning of period | | | USD | | | | 2,500,000 | | | $ | 16,222 | | | | EUR | | | | — | | | | USD | | | | — | | | $ | — | |
Written | | | USD | | | | 3,600,000 | | | | 18,254 | | | | EUR | | | | 400 | | | | USD | | | | 5,000,000 | | | | 9,776 | |
Closed | | | USD | | | | (3,500,000 | ) | | | (23,905 | ) | | | EUR | | | | (400 | ) | | | USD | | | | — | | | | (526 | ) |
Exercised | | | USD | | | | — | | | | — | | | | EUR | | | | — | | | | USD | | | | — | | | | — | |
Expired | | | USD | | | | (2,600,000 | ) | | | (10,571 | ) | | | EUR | | | | — | | | | USD | | | | (5,000,000 | ) | | | (9,250 | ) |
End of period | | | USD | | | | — | | | $ | — | | | | EUR | | | | — | | | | USD | | | | — | | | $ | — | |
| | | | | | | | | | | | | | | | | | | | | | | | | | |
| Open Centrally Cleared Interest Rate Swap Agreements(b) | |
| Counterparty/Clearinghouse | | Pay/Receive
Floating Rate | | Floating Rate
Index | | | Fixed
Rate | | | Termination
Date | | | Notional Value | | | Unrealized
Appreciation (Depreciation) | |
Credit Suisse Securities (USA) LLC/CME | | Pay | | | 1 Month LIBOR | | | | 4.90 | % | | | 06/29/2018 | | | | MXN | | | | 45,500,000 | | | $ | (33,526 | ) |
Credit Suisse Securities (USA) LLC/CME | | Receive | | | 3 Month LIBOR | | | | 1.38 | | | | 05/26/2021 | | | | USD | | | | (9,000,000 | ) | | | (27,228 | ) |
Credit Suisse Securities (USA) LLC/CME | | Receive | | | 3 Month LIBOR | | | | 1.64 | | | | 11/19/2020 | | | | USD | | | | (2,000,000 | ) | | | (31,478 | ) |
Total Interest Rate Swap Agreements — Interest Rate Risk | | | $ | (92,232 | ) |
| | | | | | | | | | | | | | | | | | | | | | | | | | | | | | |
| Open Centrally Cleared Credit Default Swap Agreements — Credit Risk(b) | |
| Counterparty/Clearinghouse | | Reference Entity | | Buy/Sell Protection | | | (Pay)/Receive Fixed Rate | | | Expiration
Date | | | Implied
Credit
Spread(b) | | | Notional Value | | | Upfront
Payments | | | Unrealized Appreciation (Depreciation) | |
Credit Suisse Securities (USA) LLC/ICE | | Markit CDX Emerging Markets Index, Series 25, Version 1 | | | Buy | | | | (1.00 | )% | | | 06/20/2021 | | | | 2.43 | % | | $ | (2,800,000 | ) | | $ | 190,749 | | | $ | (15,508 | ) |
Abbreviations:
| | |
| CME | | – Chicago Mercantile Exchange |
| EUR | | – Euro |
| | |
| ICE | | – Intercontinental Exchange |
| LIBOR | | – London interbank offer rate |
| | |
| MXN | | – Mexican Peso |
| USD | | – U.S. Dollar |
| (b) | Centrally Cleared Interest Rate Swap Agreements are collateralized by $300,000 cash held with Credit Suisse Securities, the swap agreements merchant. |
26 Invesco International Total Return Fund
| | | | | | | | | | | | | | | | | | | | | | | | | | | | | | |
| Open Over-The-Counter Credit Default Swap Agreements | |
| Counterparty | | Reference Entity | | Buy/Sell Protection | | | (Pay)/Receive Fixed Rate | | | Expiration
Date | | | Implied
Credit
Spread(a) | | | Notional Value | | | Upfront
Payments | | | Unrealized Appreciation (Depreciation) | |
Barclays Bank, PLC | | Republic of South Africa | | | Buy | | | | (1.00 | )% | | | 06/20/2021 | | | | 2.22 | % | | $ | (1,400,000 | ) | | $ | 93,727 | | | $ | (19,101 | ) |
Goldman Sachs International | | Federative Republic of Brazil | | | Buy | | | | (1.00 | ) | | | 06/20/2021 | | | | 2.47 | | | | (3,000,000 | ) | | | 314,748 | | | | (123,807 | ) |
Total Credit Default Swap Agreements — Credit Risk | | | | | | | $ | 408,475 | | | $ | (142,908 | ) |
| (a) | Implied credit spreads represent the current level as of October 31, 2016 at which protection could be bought or sold given the terms of the existing credit default swap contract and serve as an indicator of the current status of the payment/performance risk of the credit default swap contract. An implied credit spread that has widened or increased since entry into the initial contract may indicate a deteriorating credit profile and increased risk of default for the reference entity. A declining or narrowing spread may indicate an improving credit profile or decreased risk of default for the reference entity. Alternatively, credit spreads may increase or decrease reflecting the general tolerance for risk in the credit markets generally. |
| | | | | | | | | | | | | | | | | | | | | | | | | | |
| Open Over-The-Counter Total Return Swap Agreements — Equity Risk | |
| Counterparty | | Pay/Receive | | | Reference Entity | | Fixed/ Floating Rate | | | Number of
Contracts | | | Termination
Date | | | Notional
Value | | | Unrealized
Appreciation
(Depreciation) | |
Citibank, N.A. | | | Pay | | | iBoxx USD Liquid High Yield Index | | | 3 Month USD LIBOR | | | | 10,000 | | | | 12/21/2016 | | | $ | 1,000,000 | | | $ | (11,347 | ) |
NOTE 5—Expense Offset Arrangement(s)
The expense offset arrangement is comprised of transfer agency credits which result from balances in demand deposit accounts used by the transfer agent for clearing shareholder transactions. For the year ended October 31, 2016, the Fund received credits from this arrangement, which resulted in the reduction of the Fund’s total expenses of $730.
NOTE 6—Trustees’ and Officers’ Fees and Benefits
Trustees’ and Officers’ Fees and Benefits include amounts accrued by the Fund to pay remuneration to certain Trustees and Officers of the Fund. Trustees have the option to defer compensation payable by the Fund, and Trustees’ and Officers’ Fees and Benefits also include amounts accrued by the Fund to fund such deferred compensation amounts. Those Trustees who defer compensation have the option to select various Invesco Funds in which their deferral accounts shall be deemed to be invested. Finally, certain current Trustees were eligible to participate in a retirement plan that provided for benefits to be paid upon retirement to Trustees over a period of time based on the number of years of service. The Fund may have certain former Trustees who also participate in a retirement plan and receive benefits under such plan. Trustees’ and Officers’ Fees and Benefits include amounts accrued by the Fund to fund such retirement benefits. Obligations under the deferred compensation and retirement plans represent unsecured claims against the general assets of the Fund.
NOTE 7—Cash Balances
The Fund may borrow for leveraging in an amount up to 5% of the Fund’s total assets (excluding the amount borrowed) at the time the borrowing is made. In doing so, the Fund is permitted to temporarily carry a negative or overdrawn balance in its account with State Street Bank and Trust Company, the custodian bank. Such balances, if any at period end, are shown in the Statement of Assets and Liabilities under the payable caption Amount due custodian. To compensate the custodian bank for such overdrafts, the overdrawn Fund may either (1) leave funds as a compensating balance in the account so the custodian bank can be compensated by earning the additional interest; or (2) compensate by paying the custodian bank at a rate agreed upon by the custodian bank and Invesco, not to exceed the contractually agreed upon rate. The Fund may not purchase additional securities when any borrowings from banks exceed 5% of the Fund’s total assets.
27 Invesco International Total Return Fund
NOTE 8—Distributions to Shareholders and Tax Components of Net Assets
Tax Character of Distributions to Shareholders Paid During the Fiscal Years Ended October 31, 2016 and 2015:
| | | | | | | | |
| | | 2016 | | | 2015 | |
Ordinary income | | $ | 185,147 | | | $ | 767,377 | |
Long-term capital gain | | | 156,806 | | | | — | |
Return of capital | | | 301,074 | | | | 645,161 | |
Total distributions | | $ | 643,027 | | | $ | 1,412,538 | |
Tax Components of Net Assets at Period-End:
| | | | |
| | | 2016 | |
Net unrealized appreciation (depreciation) — investments | | $ | (430,535 | ) |
Net unrealized appreciation (depreciation) — other investments | | | (291,577 | ) |
Temporary book/tax differences | | | (36,484 | ) |
Shares of beneficial interest | | | 45,735,995 | |
Total net assets | | $ | 44,977,399 | |
The difference between book-basis and tax-basis unrealized appreciation (depreciation) is due to differences in the timing of recognition of gains and losses on investments for tax and book purposes. The Fund’s net unrealized appreciation (depreciation) difference is attributable primarily to wash sales.
The temporary book/tax differences are a result of timing differences between book and tax recognition of income and/or expenses. The Fund’s temporary book/tax differences are the result of the trustee deferral of compensation and retirement plan benefits.
Capital loss carryforward is calculated and reported as of a specific date. Results of transactions and other activity after that date may affect the amount of capital loss carryforward actually available for the Fund to utilize. Capital losses generated in years beginning after December 22, 2010 can be carried forward for an unlimited period, whereas previous losses expire in eight tax years. Capital losses with an expiration period may not be used to offset capital gains until all net capital losses without an expiration date have been utilized. Capital loss carryforwards with no expiration date will retain their character as either short-term or long-term capital losses instead of as short-term capital losses as under prior law. The ability to utilize capital loss carryforwards in the future may be limited under the Internal Revenue Code and related regulations based on the results of future transactions.
The Fund does not have a capital loss carryforward as of October 31, 2016.
NOTE 9—Investment Securities
The aggregate amount of investment securities (other than short-term securities, U.S. Treasury obligations and money market funds, if any) purchased and sold by the Fund during the year ended October 31, 2016 was $105,785,461 and $114,131,713, respectively. Cost of investments on a tax basis includes the adjustments for financial reporting purposes as of the most recently completed federal income tax reporting period-end.
| | | | |
| Unrealized Appreciation (Depreciation) of Investment Securities on a Tax Basis | |
Aggregate unrealized appreciation of investment securities | | $ | 1,244,931 | |
Aggregate unrealized (depreciation) of investment securities | | | (1,675,466 | ) |
Net unrealized appreciation (depreciation) of investment securities | | $ | (430,535 | ) |
Cost of investments for tax purposes is $44,124,174.
NOTE 10—Reclassification of Permanent Differences
Primarily as a result of differing book/tax treatment of return of capital, foreign currency transactions, options, paydowns, swaps, dividends, distributions and net operating loss, on October 31, 2016, undistributed net investment income was decreased by $356,464, undistributed net realized gain (loss) was increased by $657,539 and shares of beneficial interest was decreased by $301,075. This reclassification had no effect on the net assets of the Fund.
28 Invesco International Total Return Fund
NOTE 11—Share Information
| | | | | | | | | | | | | | | | |
| | | Summary of Share Activity | |
| | | Years ended October 31, | |
| | | 2016(a) | | | 2015 | |
| | | Shares | | | Amount | | | Shares | | | Amount | |
Sold: | | | | | | | | | | | | | | | | |
Class A | | | 981,590 | | | $ | 10,283,740 | | | | 559,131 | | | $ | 5,613,328 | |
Class B | | | 5,051 | | | | 51,039 | | | | 2,353 | | | | 23,757 | |
Class C | | | 215,278 | | | | 2,170,817 | | | | 140,867 | | | | 1,399,589 | |
Class Y | | | 1,491,034 | | | | 15,491,121 | | | | 50,488 | | | | 513,631 | |
Class R5 | | | — | | | | — | | | | 540 | | | | 5,481 | |
Class R6 | | | 129,251 | | | | 1,243,370 | | | | 757,993 | | | | 7,670,289 | |
| | | | |
Issued as reinvestment of dividends: | | | | | | | | | | | | | | | | |
Class A | | | 36,686 | | | | 380,582 | | | | 69,310 | | | | 709,542 | |
Class B | | | 425 | | | | 4,396 | | | | 2,631 | | | | 27,181 | |
Class C | | | 3,461 | | | | 36,065 | | | | 9,824 | | | | 101,226 | |
Class Y | | | 9,101 | | | | 95,884 | | | | 6,150 | | | | 63,098 | |
Class R5 | | | — | | | | — | | | | 188 | | | | 1,953 | |
Class R6 | | | 7,558 | | | | 72,784 | | | | 41,767 | | | | 425,144 | |
| | | | |
Automatic conversion of Class B shares to Class A shares: | | | | | | | | | | | | | | | | |
Class A | | | 36,838 | | | | 372,595 | | | | 34,527 | | | | 347,816 | |
Class B | | | (36,896 | ) | | | (372,595 | ) | | | (34,569 | ) | | | (347,816 | ) |
| | | | |
Reacquired: | | | | | | | | | | | | | | | | |
Class A | | | (984,775 | ) | | | (10,183,803 | ) | | | (1,040,878 | ) | | | (10,445,553 | ) |
Class B | | | (15,599 | ) | | | (156,640 | ) | | | (54,554 | ) | | | (551,284 | ) |
Class C | | | (237,901 | ) | | | (2,403,850 | ) | | | (247,025 | ) | | | (2,470,576 | ) |
Class Y | | | (668,294 | ) | | | (7,051,423 | ) | | | (350,943 | ) | | | (3,602,871 | ) |
Class R5 | | | — | | | | — | | | | (11,766 | ) | | | (121,053 | ) |
Class R6(b) | | | (2,114,835 | ) | | | (20,624,974 | ) | | | (9,013 | ) | | | (93,104 | ) |
Net increase (decrease) in share activity | | | (1,142,027 | ) | | $ | (10,590,892 | ) | | | (72,979 | ) | | $ | (730,222 | ) |
| (a) | There are entities that are record owners of more than 5% of the outstanding shares of the Fund and in the aggregate own 41% of the outstanding shares of the Fund. IDI has an agreement with these entities to sell Fund shares. The Fund, Invesco and/or Invesco affiliates may make payments to these entities, which are considered to be related to the Fund, for providing services to the Fund, Invesco and/or Invesco affiliates including but not limited to services such as securities brokerage, distribution, third party record keeping and account servicing. The Fund has no knowledge as to whether all or any portion of the shares owned of record by these entities are also owned beneficially. |
| (b) | On February 18, 2016, 2,112,864 Class R6 shares valued at $20,600,421 were redeemed by affiliated mutual funds. |
29 Invesco International Total Return Fund
NOTE 12—Financial Highlights
The following schedule presents financial highlights for a share of the Fund outstanding throughout the periods indicated.
| | | | | | | | | | | | | | | | | | | | | | | | | | | | | | | | | | | | | | | | | | | | | | | | | | | | | | | | | | | | |
| | | Net asset
value,
beginning
of period | | | Net
investment
income(a) | | | Net gains
(losses)
on securities
(both
realized and
unrealized) | | | Total from
investment
operations | | | Dividends
from net
investment
income | | | Distributions
from net
realized
gains | | | Return of
Capital | | | Total
distributions | | | Net asset
value, end
of period(b) | | | Total
return(c) | | | Net assets,
end of period
(000’s omitted) | | | Ratio of
expenses
to average
net assets
with fee waivers
and/or expenses
absorbed | | | Ratio of
expenses
to average net
assets without
fee waivers
and/or expenses
absorbed | | | Ratio of net
investment
income
to average
net assets | | | Portfolio
turnover(d) | |
Class A | | | | | | | | | | | | | | | | | | | | | | | | | | | | | | | | | | | | | | | | | | | | | | | | | | | | | | | | | | | | |
Year ended 10/31/16 | | $ | 9.81 | | | $ | 0.25 | | | $ | 0.54 | | | $ | 0.79 | | | $ | (0.08 | ) | | $ | — | | | $ | (0.08 | ) | | $ | (0.16 | ) | | $ | 10.44 | | | | 8.02 | % | | $ | 28,870 | | | | 1.10 | %(e) | | | 1.84 | %(e) | | | 2.36 | %(e) | | | 246 | % |
Year ended 10/31/15 | | | 10.63 | | | | 0.18 | | | | (0.74 | ) | | | (0.56 | ) | | | — | | | | (0.14 | ) | | | (0.12 | ) | | | (0.26 | ) | | | 9.81 | | | | (5.38 | ) | | | 26,426 | | | | 1.10 | | | | 1.72 | | | | 1.79 | | | | 135 | |
Year ended 10/31/14 | | | 11.07 | | | | 0.20 | | | | (0.30 | ) | | | (0.10 | ) | | | (0.12 | ) | | | (0.22 | ) | | | — | | | | (0.34 | ) | | | 10.63 | | | | (0.97 | ) | | | 32,668 | | | | 1.10 | | | | 1.68 | | | | 1.83 | | | | 237 | |
Year ended 10/31/13 | | | 11.37 | | | | 0.18 | | | | (0.37 | ) | | | (0.19 | ) | | | (0.11 | ) | | | — | | | | — | | | | (0.11 | ) | | | 11.07 | | | | (1.68 | ) | | | 33,019 | | | | 1.10 | | | | 1.68 | | | | 1.65 | | | | 233 | |
Year ended 10/31/12 | | | 11.63 | | | | 0.16 | | | | 0.20 | | | | 0.36 | | | | (0.39 | ) | | | (0.12 | ) | | | (0.11 | ) | | | (0.62 | ) | | | 11.37 | | | | 3.42 | | | | 40,771 | | | | 1.10 | | | | 1.57 | | | | 1.46 | | | | 119 | |
Class B | | | | | | | | | | | | | | | | | | | | | | | | | | | | | | | | | | | | | | | | | | | | | | | | | | | | | | | | | | | | |
Year ended 10/31/16 | | | 9.79 | | | | 0.16 | | | | 0.56 | | | | 0.72 | | | | (0.05 | ) | | | — | | | | (0.03 | ) | | | (0.08 | ) | | | 10.43 | | | | 7.35 | | | | 466 | | | | 1.85 | (e) | | | 2.59 | (e) | | | 1.61 | (e) | | | 246 | |
Year ended 10/31/15 | | | 10.62 | | | | 0.10 | | | | (0.75 | ) | | | (0.65 | ) | | | — | | | | (0.14 | ) | | | (0.04 | ) | | | (0.18 | ) | | | 9.79 | | | | (6.19 | ) | | | 898 | | | | 1.85 | | | | 2.47 | | | | 1.04 | | | | 135 | |
Year ended 10/31/14 | | | 11.05 | | | | 0.12 | | | | (0.30 | ) | | | (0.18 | ) | | | (0.03 | ) | | | (0.22 | ) | | | — | | | | (0.25 | ) | | | 10.62 | | | | (1.63 | ) | | | 1,867 | | | | 1.85 | | | | 2.43 | | | | 1.08 | | | | 237 | |
Year ended 10/31/13 | | | 11.36 | | | | 0.10 | | | | (0.38 | ) | | | (0.28 | ) | | | (0.03 | ) | | | — | | | | — | | | | (0.03 | ) | | | 11.05 | | | | (2.50 | ) | | | 2,850 | | | | 1.85 | | | | 2.43 | | | | 0.90 | | | | 233 | |
Year ended 10/31/12 | | | 11.61 | | | | 0.08 | | | | 0.20 | | | | 0.28 | | | | (0.30 | ) | | | (0.12 | ) | | | (0.11 | ) | | | (0.53 | ) | | | 11.36 | | | | 2.72 | | | | 4,430 | | | | 1.85 | | | | 2.32 | | | | 0.71 | | | | 119 | |
Class C | | | | | | | | | | | | | | | | | | | | | | | | | | | | | | | | | | | | | | | | | | | | | | | | | | | | | | | | | | | | |
Year ended 10/31/16 | | | 9.79 | | | | 0.17 | | | | 0.54 | | | | 0.71 | | | | (0.05 | ) | | | — | | | | (0.03 | ) | | | (0.08 | ) | | | 10.42 | | | | 7.24 | | | | 5,121 | | | | 1.85 | (e) | | | 2.59 | (e) | | | 1.61 | (e) | | | 246 | |
Year ended 10/31/15 | | | 10.61 | | | | 0.10 | | | | (0.74 | ) | | | (0.64 | ) | | | — | | | | (0.14 | ) | | | (0.04 | ) | | | (0.18 | ) | | | 9.79 | | | | (6.10 | ) | | | 4,998 | | | | 1.85 | | | | 2.47 | | | | 1.04 | | | | 135 | |
Year ended 10/31/14 | | | 11.04 | | | | 0.12 | | | | (0.30 | ) | | | (0.18 | ) | | | (0.03 | ) | | | (0.22 | ) | | | — | | | | (0.25 | ) | | | 10.61 | | | | (1.63 | ) | | | 6,441 | | | | 1.85 | | | | 2.43 | | | | 1.08 | | | | 237 | |
Year ended 10/31/13 | | | 11.35 | | | | 0.10 | | | | (0.38 | ) | | | (0.28 | ) | | | (0.03 | ) | | | — | | | | — | | | | (0.03 | ) | | | 11.04 | | | | (2.50 | ) | | | 5,562 | | | | 1.85 | | | | 2.43 | | | | 0.90 | | | | 233 | |
Year ended 10/31/12 | | | 11.61 | | | | 0.07 | | | | 0.20 | | | | 0.27 | | | | (0.30 | ) | | | (0.12 | ) | | | (0.11 | ) | | | (0.53 | ) | | | 11.35 | | | | 2.63 | | | | 8,016 | | | | 1.85 | | | | 2.32 | | | | 0.71 | | | | 119 | |
Class Y | | | | | | | | | | | | | | | | | | | | | | | | | | | | | | | | | | | | | | | | | | | | | | | | | | | | | | | | | | | | |
Year ended 10/31/16 | | | 9.80 | | | | 0.27 | | | | 0.55 | | | | 0.82 | | | | (0.07 | ) | | | — | | | | (0.11 | ) | | | (0.18 | ) | | | 10.44 | | | | 8.40 | | | | 10,509 | | | | 0.85 | (e) | | | 1.59 | (e) | | | 2.61 | (e) | | | 246 | |
Year ended 10/31/15 | | | 10.63 | | | | 0.21 | | | | (0.76 | ) | | | (0.55 | ) | | | — | | | | (0.14 | ) | | | (0.14 | ) | | | (0.28 | ) | | | 9.80 | | | | (5.23 | ) | | | 1,716 | | | | 0.85 | | | | 1.47 | | | | 2.04 | | | | 135 | |
Year ended 10/31/14 | | | 11.06 | | | | 0.23 | | | | (0.30 | ) | | | (0.07 | ) | | | (0.14 | ) | | | (0.22 | ) | | | — | | | | (0.36 | ) | | | 10.63 | | | | (0.63 | ) | | | 4,989 | | | | 0.85 | | | | 1.43 | | | | 2.08 | | | | 237 | |
Year ended 10/31/13 | | | 11.37 | | | | 0.21 | | | | (0.39 | ) | | | (0.18 | ) | | | (0.13 | ) | | | — | | | | — | | | | (0.13 | ) | | | 11.06 | | | | (1.52 | ) | | | 982 | | | | 0.85 | | | | 1.43 | | | | 1.90 | | | | 233 | |
Year ended 10/31/12 | | | 11.63 | | | | 0.19 | | | | 0.20 | | | | 0.39 | | | | (0.42 | ) | | | (0.12 | ) | | | (0.11 | ) | | | (0.65 | ) | | | 11.37 | | | | 3.68 | | | | 1,105 | | | | 0.85 | | | | 1.32 | | | | 1.71 | | | | 119 | |
Class R5 | | | | | | | | | | | | | | | | | | | | | | | | | | | | | | | | | | | | | | | | | | | | | | | | | | | | | | | | | | | | |
Year ended 10/31/16 | | | 9.81 | | | | 0.27 | | | | 0.54 | | | | 0.81 | | | | (0.07 | ) | | | — | | | | (0.11 | ) | | | (0.18 | ) | | | 10.44 | | | | 8.29 | | | | 1 | | | | 0.85 | (e) | | | 1.30 | (e) | | | 2.61 | (e) | | | 246 | |
Year ended 10/31/15 | | | 10.64 | | | | 0.21 | | | | (0.76 | ) | | | (0.55 | ) | | | — | | | | (0.14 | ) | | | (0.14 | ) | | | (0.28 | ) | | | 9.81 | | | | (5.23 | ) | | | 1 | | | | 0.85 | | | | 1.16 | | | | 2.04 | | | | 135 | |
Year ended 10/31/14 | | | 11.07 | | | | 0.23 | | | | (0.30 | ) | | | (0.07 | ) | | | (0.14 | ) | | | (0.22 | ) | | | — | | | | (0.36 | ) | | | 10.64 | | | | (0.63 | ) | | | 118 | | | | 0.85 | | | | 1.15 | | | | 2.08 | | | | 237 | |
Year ended 10/31/13 | | | 11.37 | | | | 0.21 | | | | (0.38 | ) | | | (0.17 | ) | | | (0.13 | ) | | | — | | | | — | | | | (0.13 | ) | | | 11.07 | | | | (1.43 | ) | | | 282 | | | | 0.85 | | | | 1.16 | | | | 1.90 | | | | 233 | |
Year ended 10/31/12 | | | 11.63 | | | | 0.19 | | | | 0.20 | | | | 0.39 | | | | (0.42 | ) | | | (0.12 | ) | | | (0.11 | ) | | | (0.65 | ) | | | 11.37 | | | | 3.68 | | | | 221 | | | | 0.85 | | | | 1.07 | | | | 1.71 | | | | 119 | |
Class R6 | | | | | | | | | | | | | | | | | | | | | | | | | | | | | | | | | | | | | | | | | | | | | | | | | | | | | | | | | | | | |
Year ended 10/31/16 | | | 9.81 | | | | 0.25 | | | | 0.56 | | | | 0.81 | | | | (0.07 | ) | | | — | | | | (0.11 | ) | | | (0.18 | ) | | | 10.44 | | | | 8.29 | | | | 11 | | | | 0.85 | (e) | | | 1.30 | (e) | | | 2.61 | (e) | | | 246 | |
Year ended 10/31/15 | | | 10.63 | | | | 0.20 | | | | (0.74 | ) | | | (0.54 | ) | | | — | | | | (0.14 | ) | | | (0.14 | ) | | | (0.28 | ) | | | 9.81 | | | | (5.14 | ) | | | 19,413 | | | | 0.85 | | | | 1.16 | | | | 2.04 | | | | 135 | |
Year ended 10/31/14 | | | 11.07 | | | | 0.23 | | | | (0.31 | ) | | | (0.08 | ) | | | (0.14 | ) | | | (0.22 | ) | | | — | | | | (0.36 | ) | | | 10.63 | | | | (0.72 | ) | | | 12,637 | | | | 0.85 | | | | 1.14 | | | | 2.08 | | | | 237 | |
Year ended 10/31/13 | | | 11.37 | | | | 0.21 | | | | (0.38 | ) | | | (0.17 | ) | | | (0.13 | ) | | | — | | | | — | | | | (0.13 | ) | | | 11.07 | | | | (1.43 | ) | | | 8,752 | | | | 0.85 | | | | 1.16 | | | | 1.90 | | | | 233 | |
Year ended 10/31/12(f) | | | 11.40 | | | | 0.02 | | | | (0.05 | ) | | | (0.03 | ) | | | — | | | | — | | | | — | | | | — | | | | 11.37 | | | | (0.26 | ) | | | 5,493 | | | | 0.85 | (g) | | | 1.10 | (g) | | | 1.71 | (g) | | | 119 | |
| (a) | Calculated using average shares outstanding. |
| (b) | Includes redemption fees added to shares of beneficial interest for Class A, Class B, Class C, Class Y and Class R5 shares which were less than $0.005 per share for the year ended October 31, 2012. |
| (c) | Includes adjustments in accordance with accounting principles generally accepted in the United States of America and as such, the net asset value for financial reporting purposes and the returns based upon those net asset values may differ from the net asset value and returns for shareholder transactions. Does not include sales charges and is not annualized for periods less than one year, if applicable. |
| (d) | Portfolio turnover is calculated at the fund level and is not annualized for periods less than one year, if applicable. |
| (e) | Ratios are based on average daily net assets (000’s omitted) of $27,411, $665, $5,511, $6,001, $1, and $6,014 for Class A, Class B, Class C, Class Y, Class R5 and Class R6 shares, respectively. |
| (f) | Commencement date of September 24, 2012. |
NOTE 13—Subsequent Event
Effective December 1, 2016, the Fund changed its principal investment strategies in connection with the repositioning of the Fund as a globally diverse fixed income fund, including adding certain derivative capabilities and changing the Fund’s name to Invesco World Bond Fund. Further, the Fund changed its distribution frequency from quarterly to monthly.
In addition, effective December 1, 2016, the Adviser reduced the expense limits of Class A, Class B, Class C, Class Y, Class R5 and Class R6 shares to 0.94%, 1.69%, 1.69%, 0.69%, 0.69% and 0.69%, respectively, of the Fund’s average daily net assets.
30 Invesco International Total Return Fund
Report of Independent Registered Public Accounting Firm
To the Board of Trustees
and Shareholders of the Invesco World Bond Fund:
In our opinion, the accompanying statement of assets and liabilities, including the schedule of investments, and the related statements of operations and of changes in net assets and the financial highlights present fairly, in all material respects, the financial position of the Invesco World Bond Fund (formerly, Invesco International Total Return Fund, the “Fund”) as of October 31, 2016, the results of its operations for the year then ended, the changes in its net assets for each of the two years in the period then ended and the financial highlights for each of the five years in the period then ended, in conformity with accounting principles generally accepted in the United States of America. These financial statements and financial highlights (hereafter referred to as “financial statements”) are the responsibility of the Fund’s management. Our responsibility is to express an opinion on these financial statements based on our audits. We conducted our audits of these financial statements in accordance with the standards of the Public Company Accounting Oversight Board (United States). Those standards require that we plan and perform the audit to obtain reasonable assurance about whether the financial statements are free of material misstatement. An audit includes examining, on a test basis, evidence supporting the amounts and disclosures in the financial statements, assessing the accounting principles used and significant estimates made by management, and evaluating the overall financial statement presentation. We believe that our audits, which included confirmation of securities as of October 31, 2016 by correspondence with the custodian and brokers, and the application of alternative auditing procedures where confirmation of security purchases have not been received, provide a reasonable basis for our opinion.
PRICEWATERHOUSECOOPERS LLP
Houston, Texas
December 21, 2016
31 Invesco International Total Return Fund
Calculating your ongoing Fund expenses
Example
As a shareholder of the Fund, you incur two types of costs: (1) transaction costs, which may include sales charges (loads) on purchase payments or contingent deferred sales charges on redemptions, if any; and (2) ongoing costs, including management fees, distribution and/or service (12b-1) fees, and other Fund expenses. This example is intended to help you understand your ongoing costs (in dollars) of investing in the Fund and to compare these costs with ongoing costs of investing in other mutual funds. The example is based on an investment of $1,000 invested at the beginning of the period and held for the entire period May 1, 2016 through October 31, 2016.
Actual expenses
The table below provides information about actual account values and actual expenses. You may use the information in this table, together with the amount you invested, to estimate the expenses that you paid over the period. Simply divide your account value by $1,000 (for example, an $8,600 account value divided by $1,000 = 8.6), then multiply the result by the number in the table under the heading entitled “Actual Expenses Paid During Period” to estimate the expenses you paid on your account during this period.
Hypothetical example for comparison purposes
The table below also provides information about hypothetical account values and hypothetical expenses based on the Fund’s actual expense ratio and an assumed rate of return of 5% per year before expenses, which is not the Fund’s actual return.
The hypothetical account values and expenses may not be used to estimate the actual ending account balance or expenses you paid for the period. You may use this information to compare the ongoing costs of investing in the Fund and other funds. To do so, compare this 5% hypothetical example with the 5% hypothetical examples that appear in the shareholder reports of the other funds.
Please note that the expenses shown in the table are meant to highlight your ongoing costs only and do not reflect any transaction costs, such as sales charges (loads) on purchase payments or contingent deferred sales charges on redemptions, if any. Therefore, the hypothetical information is useful in comparing ongoing costs only, and will not help you determine the relative total costs of owning different funds. In addition, if these transaction costs were included, your costs would have been higher.
| | | | | | | | | | | | | | | | | | | | | | | | |
| Class | | Beginning
Account Value
(05/01/16) | | | ACTUAL | | | HYPOTHETICAL
(5% annual return before
expenses) | | | Annualized
Expense
Ratio | |
| | | Ending
Account Value
(10/31/16)1 | | | Expenses
Paid During
Period2,3 | | | Ending
Account Value
(10/31/16) | | | Expenses
Paid During
Period2,4 | | |
| A | | $ | 1,000.00 | | | $ | 992.00 | | | $ | 5.51 | | | $ | 1,019.61 | | | $ | 5.58 | | | | 1.10 | % |
| B | | | 1,000.00 | | | | 988.30 | | | | 9.25 | | | | 1,015.84 | | | | 9.37 | | | | 1.85 | |
| C | | | 1,000.00 | | | | 988.30 | | | | 9.25 | | | | 1,015.84 | | | | 9.37 | | | | 1.85 | |
| Y | | | 1,000.00 | | | | 993.30 | | | | 4.26 | | | | 1,020.86 | | | | 4.32 | | | | 0.85 | |
| R5 | | | 1,000.00 | | | | 993.30 | | | | 4.26 | | | | 1,020.86 | | | | 4.32 | | | | 0.85 | |
| R6 | | | 1,000.00 | | | | 993.30 | | | | 4.26 | | | | 1,020.86 | | | | 4.32 | | | | 0.85 | |
| 1 | The actual ending account value is based on the actual total return of the Fund for the period May 1, 2016 through October 31, 2016, after actual expenses and will differ from the hypothetical ending account value which is based on the Fund’s expense ratio and a hypothetical annual return of 5% before expenses. |
| 2 | Expenses are equal to the Fund’s annualized expense ratio as indicated above multiplied by the average account value over the period, multiplied by 184/366 to reflect the most recent fiscal half year. Effective December 1, 2017, the Fund’s Adviser has contractually agreed to waive advisory fees and/or reimburse expenses to the extent necessary to limit total annual fund operating expenses of Class A, Class B, Class C, Class Y, Class R5 and Class R6 shares to 0.94%, 1.69%, 1.69%, 0.69%, 0.69% and 0.69% of average daily net assets, respectively. The annualized expense ratios restated as if these agreements had been in effect throughout the entire most recent fiscal half year are 0.94%, 1.69%, 1.69%, 0.69%, 0.69% and 0.69% for Class A, Class B and Class C, Class Y, Class R5 and Class R6 shares, respectively. |
| 3 | The actual expenses paid restated as if the changes discussed above had been in effect throughout the entire most recent fiscal half year are $4.71, $8.45, $8.45, $3.46, $3.46 and $3.46 for Class A, Class B, Class C, Class Y, Class R5 and Class R6 shares, respectively. |
| 4 | The hypothetical expenses paid restated as if the changes discussed above had been in effect throughout the entire most recent fiscal half year are $4.77, $8.57, $8.57, $3.51, $3.51 and $3.51 for Class A, Class B, Class C, Class Y, Class R5 and Class R6 shares, respectively. |
32 Invesco International Total Return Fund
Approval of Investment Advisory and Sub-Advisory Contracts
The Board of Trustees (the Board) of AIM Investment Funds (Invesco Investment Funds) is required under the Investment Company Act of 1940, as amended, to approve annually the renewal of Invesco International Total Return Fund’s (the Fund) investment advisory agreements. During contract renewal meetings held on June 7-8, 2016, the Board as a whole, and the disinterested or “independent” Trustees, who comprise over 75% of the Board, voting separately, approved the continuance for the Fund of the Master Investment Advisory Agreement with Invesco Advisers, Inc. (Invesco Advisers and the investment advisory agreement) and the Master Intergroup Sub-Advisory Contract for Mutual Funds with Invesco Asset Management Deutschland GmbH, Invesco Asset Management Limited, Invesco Asset Management (Japan) Limited, Invesco Hong Kong Limited, Invesco Senior Secured Management, Inc. and Invesco Canada Ltd. (collectively, the Affiliated Sub-Advisers and the sub-advisory contracts) for another year, effective July 1, 2016.
In evaluating the fairness and reasonableness of compensation under the Fund’s investment advisory agreement and sub-advisory contracts, the Board considered, among other things, the factors discussed below. The Board determined that continuation of the Fund’s investment advisory agreement and the sub-advisory contracts is in the best interest of the Fund and its shareholders and that the compensation payable to Invesco Advisers and the Affiliated Sub-Advisers under the agreements is fair and reasonable.
The Board’s Fund Evaluation Process
The Board’s Investments Committee has established three Sub-Committees, which meet throughout the year to review the performance of funds advised by Invesco Advisers (the Invesco Funds). Over the course of each year, the Sub-Committees meet with portfolio managers for their assigned Invesco Funds and other members of management to review the performance, investment objective(s), policies, strategies, limitations and investment risks of these funds. The Board had the benefit of reports from the Sub-Committees and Investments Committee throughout the year in considering approval of the continuance of each Invesco Fund’s investment advisory agreement and sub-advisory contracts for another year.
During the contract renewal process, the Board receives comparative performance and fee data regarding the Invesco Funds prepared by Invesco Advisers and Broadridge Financial Solutions, Inc. (Broadridge), an independent provider of investment company data. The Board also receives an independent written evaluation from the Senior Officer, an officer of the Invesco Funds who reports directly to the independent Trustees. The Senior Officer’s
evaluation is prepared as part of his responsibility to manage the process by which the Invesco Funds’ proposed management fees are negotiated during the annual contract renewal process to ensure they are negotiated in a manner that is at arms’ length and reasonable. In addition to meetings with Invesco Advisers and fund counsel, the independent Trustees also discuss the continuance of the investment advisory agreement and sub-advisory contracts in separate sessions with the Senior Officer and with independent legal counsel.
The Trustees recognized that the advisory fee rates for the Invesco Funds are, in many cases, the result of years of review and negotiation. The Trustees’ deliberations and conclusions in a particular year may be based in part on their deliberations and conclusions regarding these arrangements throughout the year and in prior years. The Trustees’ review and conclusions are based on the comprehensive consideration of all information presented to them and are not the result of any single determinative factor. Moreover, one Trustee may have weighed a particular piece of information or factor differently than another Trustee.
The discussion below is a summary of the Senior Officer’s independent written evaluation with respect to the Fund’s investment advisory agreement as well as a discussion of the material factors and related conclusions that formed the basis for the Board’s approval of the Fund’s investment advisory agreement and sub-advisory contracts. Unless otherwise stated, this information is current as of June 8, 2016, and does not reflect consideration of factors that became known to the Board after that date.
Factors and Conclusions and Summary of Independent Written Fee Evaluation
| A. | Nature, Extent and Quality of Services Provided by Invesco Advisers and the Affiliated Sub-Advisers |
The Board reviewed the advisory services provided to the Fund by Invesco Advisers under the Fund’s investment advisory agreement, the performance of Invesco Advisers in providing these services, and the credentials and experience of the officers and employees of Invesco Advisers who provide these services, including the Fund’s portfolio manager or managers. The Board’s review of the qualifications of Invesco Advisers to provide advisory services included the Board’s consideration of Invesco Advisers’ investment process oversight, independent credit analysis and investment risk management. The Board also considered non-advisory services that Invesco Advisers and its affiliates provide to the Invesco Funds such as various back office support functions, trading operations, internal audit, valuation and legal and compliance.
In determining whether to continue the Fund’s investment advisory agreement, the Board considered the benefits of reapproving an existing relationship and the greater uncertainty that may be associated with entering into a new relationship. The Board concluded that the nature, extent and quality of the services provided to the Fund by Invesco Advisers are appropriate and satisfactory and consistent with the terms of the Fund’s investment advisory agreement.
The Board reviewed the services that may be provided by the Affiliated Sub-Advisers under the sub-advisory contracts and the credentials and experience of the officers and employees of the Affiliated Sub-Advisers who provide these services. The Board noted that the Affiliated Sub-Advisers have offices and personnel that are located in financial centers around the world. As a result, the Board noted that the Affiliated Sub-Advisers can provide research and investment analysis on the markets and economies of various countries in which the Fund may invest, make recommendations regarding securities and assist with security trades. The Board concluded that the sub-advisory contracts may benefit the Fund and its shareholders by permitting Invesco Advisers to use the resources and talents of the Affiliated Sub-Advisers in managing the Fund. The Board concluded that the nature, extent and quality of the services that may be provided by the Affiliated Sub-Advisers are appropriate and satisfactory and consistent with the terms of the Fund’s sub-advisory contracts.
The Board considered Fund performance as a relevant factor in considering whether to approve the investment advisory agreement as well as the sub-advisory contracts for the Fund, as Invesco Asset Management Limited currently manages assets of the Fund.
The Board compared the Fund’s performance during the past one, three and five calendar years to the performance of funds in the Broadridge performance universe and against the Lipper International Income Funds Index. The Board noted that performance of Class A shares of the Fund was in the third quintile of its performance universe for the one, three and five year periods (the first quintile being the best performing funds and the fifth quintile being the worst performing funds). The Board noted that performance of Class A shares of the Fund was below the performance of the Index for the one, three and five year periods. Invesco Advisers noted that performance of the Fund was mostly driven by performance of the U.S. dollar relative to other currencies. The Trustees also reviewed more recent Fund performance and this review did not change their conclusions.
33 Invesco International Total Return Fund
| C. | Advisory and Sub-Advisory Fees |
The Board compared the Fund’s contractual management fee rate to the contractual management fee rates of funds in the Fund’s Broadridge expense group at a common asset level. The Board noted that the contractual management fee rate for Class A shares of the Fund was below the median contractual management fee rate of funds in its expense group. The Board noted that the term “contractual management fee” for funds in the expense group may include both advisory and certain administrative services fees, but that Broadridge does not provide information on a fund by fund basis as to what is included. The Board noted that Invesco Advisers does not separately charge the Invesco Funds for the administrative services included in the term as defined by Broadridge. The Board also reviewed the methodology used by Broadridge in providing expense group information, which includes using each fund’s contractual management fee schedule (including any applicable breakpoints) as reported in the most recent prospectus or statement of additional information for each fund in the expense group.
The Board noted that Invesco Advisers has contractually agreed to waive fees and/or limit expenses of the Fund through at least February 28, 2017 in an amount necessary to limit total annual operating expenses to a specified percentage of average daily net assets for each class of the Fund.
The Board noted that Invesco Advisers and the Affiliated Sub-Advisers do not manage other mutual funds or client accounts with investment strategies comparable to those of the Fund.
The Board also considered the services that may be provided by the Affiliated Sub-Advisers pursuant to the sub-advisory contracts, as well as the fees payable by Invesco Advisers to the Affiliated Sub-Advisers pursuant to the sub-advisory contracts. The Board noted that Invesco Advisers retains overall responsibility for, and provides services to, sub-advised Invesco Funds, including oversight of the Affiliated Sub-Advisers as well as the additional services described herein other than day-to-day portfolio management. The Board also noted that the sub-advisory fees are not paid directly by the Fund, but rather, are payable by Invesco Advisers to the Affiliated Sub-Advisers.
| D. | Economies of Scale and Breakpoints |
The Board considered the extent to which there are economies of scale in the provision of advisory services to the Fund. The Board also considered whether the Fund benefits from economies of scale through contractual breakpoints in the Fund’s advisory fee schedule. The Board also noted that the Fund shares directly in economies of scale through lower fees charged by third party service providers based on the combined size of the Invesco Funds and other clients advised by Invesco Advisers.
| E. | Profitability and Financial Resources |
The Board reviewed information from Invesco Advisers concerning the costs of the advisory
and other services that Invesco Advisers and its affiliates provide to the Fund and the Invesco Funds and the profitability of Invesco Advisers and its affiliates in providing these services. The Board received information from Invesco Advisers and a report from an independent consultant engaged by the Senior Officer about the methodology used to prepare the profitability information. The Board noted that Invesco Advisers continues to operate at a net profit from services Invesco Advisers and its affiliates provide to the Invesco Funds. The Board noted that although Invesco Advisers received a minimal amount of revenues from advising the Fund, Invesco Advisers and its subsidiaries did not make a profit from managing the Fund. The Board received and accepted information from Invesco Advisers demonstrating that Invesco Advisers and each Affiliated Sub-Adviser are financially sound and have the resources necessary to perform their obligations under the investment advisory agreement and sub-advisory contracts.
| F. | Collateral Benefits to Invesco Advisers and its Affiliates |
The Board considered various other benefits received by Invesco Advisers and its affiliates from the relationship with the Fund, including the fees received for providing transfer agency and distribution services to the Fund. The Board considered comparative information regarding fees charged for these services, including information provided by Broadridge and other independent sources. The Board considered the performance of Invesco Advisers and its affiliates in providing these services and the organizational structure employed to provide these services. The Board also considered that these services are provided to the Fund pursuant to written contracts that are reviewed and approved on an annual basis by the Board; and that the services are required for the operation of the Fund.
The Board considered the benefits realized by Invesco Advisers and the Affiliated Sub-Advisers as a result of portfolio brokerage transactions executed through “soft dollar” arrangements. Invesco Advisers noted that the Fund does not execute brokerage transactions through “soft dollar” arrangements to any significant degree.
The Board considered that the Fund’s uninvested cash and cash collateral from any securities lending arrangements may be invested in money market funds advised by Invesco Advisers pursuant to procedures approved by the Board. The Board noted that Invesco Advisers receives advisory fees from these affiliated money market funds attributable to such investments, although Invesco Advisers has contractually agreed to waive through varying periods the advisory fees payable by the Invesco Funds with respect to certain investments in the affiliated money market funds. The waiver is in an amount equal to 100% of the net advisory fee Invesco Advisers receives from the affiliated money market funds with respect to the Fund’s investment in the affiliated money market funds
of uninvested cash, but not cash collateral. The Board concluded that the amount of advisory fees received by Invesco Advisors from the Fund’s investment of cash collateral from any securities lending arrangements in the affiliated money market funds is fair and reasonable.
34 Invesco International Total Return Fund
Tax Information
Form 1099-DIV, Form 1042-S and other year-end tax information provide shareholders with actual calendar year amounts that should be included in their tax returns. Shareholders should consult their tax advisors.
The following distribution information is being provided as required by the Internal Revenue Code or to meet a specific state’s requirement.
The Fund designates the following amounts or, if subsequently determined to be different, the maximum amount allowable for its fiscal year ended October 31, 2016:
| | | | |
Federal and State Income Tax | |
Long-Term Capital Gain Distributions | | $ | 156,806 | |
Qualified Dividend Income* | | | 0 | % |
Corporate Dividends Received Deduction* | | | 0 | % |
U.S. Treasury Obligations* | | | 0 | % |
| | * | The above percentages are based on ordinary income dividends paid to shareholders during the Fund’s fiscal year. |
| | | | |
Non-Resident Alien Shareholders | |
Qualified Short-Term Gains | | $ | 185,147 | |
35 Invesco International Total Return Fund
Trustees and Officers
The address of each trustee and officer is AIM Investment Funds (Invesco Investment Funds) (the “Trust”), 11 Greenway Plaza, Suite 1000, Houston, Texas 77046-1173. The trustees serve for the life of the Trust, subject to their earlier death, incapacitation, resignation, retirement or removal as more specifically provided in the Trust’s organizational documents. Each officer serves for a one year term or until their successors are elected and qualified. Column two below includes length of time served with predecessor entities, if any.
| | | | | | | | |
Name, Year of Birth and
Position(s) Held with the Trust | | Trustee and/
or Officer Since | | Principal Occupation(s)
During Past 5 Years | | Number of
Funds in Fund
Complex
Overseen by
Trustee | | Other Directorship(s)
Held by Trustee During
Past 5 Years |
| Interested Persons | | | | | | | | |
| Martin L. Flanagan1 — 1960 Trustee | | 2007 | | Executive Director, Chief Executive Officer and President, Invesco Ltd. (ultimate parent of Invesco and a global investment management firm); Advisor to the Board, Invesco Advisers, Inc. (formerly known as Invesco Institutional (N.A.), Inc.); Trustee, The Invesco Funds; Vice Chair, Investment Company Institute; and Member of Executive Board, SMU Cox School of Business Formerly: Chairman and Chief Executive Officer, Invesco Advisers, Inc. (registered investment adviser); Director, Chairman, Chief Executive Officer and President, Invesco Holding Company (US) Inc. (formerly IVZ Inc.) (holding company), Invesco Group Services, Inc. (service provider) and Invesco North American Holdings, Inc. (holding company); Director, Chief Executive Officer and President, Invesco Holding Company Limited (parent of Invesco and a global investment management firm); Director, Invesco Ltd.; Chairman, Investment Company Institute and President, Co-Chief Executive Officer, Co-President, Chief Operating Officer and Chief Financial Officer, Franklin Resources, Inc. (global investment management organization) | | 146 | | None |
| Philip A. Taylor2 — 1954 Trustee and Senior Vice President | | 2006 | | Head of the Americas and Senior Managing Director, Invesco Ltd.; Director, Co-Chairman, Co-President and Co-Chief Executive Officer, Invesco Advisers, Inc. (formerly known as Invesco Institutional (N.A.), Inc.) (registered investment adviser); Director, Chairman, Chief Executive Officer and President, Invesco Management Group, Inc. (formerly known as Invesco AIM Management Group, Inc.) (financial services holding company); Director and Chairman, Invesco Investment Services, Inc. (formerly known as Invesco AIM Investment Services, Inc.) (registered transfer agent) Chief Executive Officer, Invesco Corporate Class Inc. (corporate mutual fund company) Director, Chairman and Chief Executive Officer, Invesco Canada Ltd. (formerly known as Invesco Trimark Ltd./Invesco Trimark Ltèe) (registered investment adviser and registered transfer agent); Trustee and Senior Vice President, The Invesco Funds; Director, Invesco Investment Advisers LLC (formerly known as Van Kampen Asset Management). Formerly: Director, Chief Executive Officer and President, Van Kampen Exchange Corp.; President and Principal Executive Officer, The Invesco Funds (other than AIM Treasurer’s Series Trust (Invesco Treasurer’s Series Trust), Short-Term Investments Trust and Invesco Management Trust); Executive Vice President, The Invesco Funds (AIM Treasurer’s Series Trust (Invesco Treasurer’s Series Trust), Short-Term Investments Trust and Invesco Management Trust only); Director and President, INVESCO Funds Group, Inc. (registered investment adviser and registered transfer agent); Director and Chairman, IVZ Distributors, Inc. (formerly known as INVESCO Distributors, Inc.) (registered broker dealer); Director, President and Chairman, Invesco Inc. (holding company), Invesco Canada Holdings Inc. (holding company), Trimark Investments Ltd./Placements Trimark Ltèe and Invesco Financial Services Ltd/Services Financiers Invesco Ltèe; Chief Executive Officer, Invesco Canada Fund Inc. (corporate mutual fund company); Director and Chairman, Van Kampen Investor Services Inc.; Director, Chief Executive Officer and President, 1371 Preferred Inc. (holding company) and Van Kampen Investments Inc.; Director and President, AIM GP Canada Inc. (general partner for limited partnerships) and Van Kampen Advisors, Inc.; Director and Chief Executive Officer, Invesco Trimark Dealer Inc. (registered broker dealer); Director, Invesco Distributors, Inc. (formerly known as Invesco AIM Distributors, Inc.) (registered broker dealer); Manager, Invesco PowerShares Capital Management LLC; Director, Chief Executive Officer and President, Invesco Advisers, Inc.; Director, Chairman, Chief Executive Officer and President, Invesco AIM Capital Management, Inc.; President, Invesco Trimark Dealer Inc. and Invesco Trimark Ltd./Invesco Trimark Ltèe; Director and President, AIM Trimark Corporate Class Inc. and AIM Trimark Canada Fund Inc.; Senior Managing Director, Invesco Holding Company Limited; Director and Chairman, Fund Management Company (former registered broker dealer); President and Principal Executive Officer, The Invesco Funds (AIM Treasurer’s Series Trust (Invesco Treasurer’s Series Trust), and Short-Term Investments Trust only); President, AIM Trimark Global Fund Inc. and AIM Trimark Canada Fund Inc. | | 146 | | None |
| 1 | Mr. Flanagan is considered an interested person (within the meaning of Section 2(a)(19) of the 1940 Act) of the Trust because he is an officer of the Adviser to the Trust, and an officer and a director of Invesco Ltd., ultimate parent of the Adviser. |
| 2 | Mr. Taylor is considered an interested person (within the meaning of Section 2(a)(19) of the 1940 Act) of the Trust because he is an officer and a director of the Adviser. |
T-1 Invesco International Total Return Fund
Trustees and Officers—(continued)
| | | | | | | | |
Name, Year of Birth and
Position(s) Held with the Trust | | Trustee and/
or Officer Since | | Principal Occupation(s) During Past 5 Years | | Number of
Funds in Fund
Complex
Overseen by
Trustee | | Other Directorship(s)
Held by Trustee During
Past 5 Years |
| Independent Trustees | | | | | | | | |
Bruce L. Crockett — 1944 Trustee and Chair | | 2001 | | Chairman, Crockett Technologies Associates (technology consulting company) Formerly: Director, Captaris (unified messaging provider); Director, President and Chief Executive Officer, COMSAT Corporation; Chairman, Board of Governors of INTELSAT (international communications company); ACE Limited (insurance company); Independent Directors Council and Investment Company Institute | | 146 | | ALPS (Attorneys Liability Protection Society) (insurance company) and Globe Specialty Metals, Inc. (metallurgical company); Member of the Audit Committee, Ferroglobe PLC and Investment Company Institute; Member of the Executive Committee and Chair of the Governance Committee, Independent Directors Council |
David C. Arch — 1945 Trustee | | 2010 | | Chairman of Blistex Inc., a consumer health care products manufacturer | | 146 | | Board member of the Illinois Manufacturers’ Association; Member of the Board of Visitors, Institute for the Humanities, University of Michigan |
James T. Bunch — 1942 Trustee | | 2003 | | Managing Member, Grumman Hill Group LLC (family office/private equity investments) Formerly: Chairman of the Board, Denver Film Society, Chairman of the Board of Trustees, Evans Scholarship Foundation; Chairman, Board of Governors, Western Golf Association | | 146 | | Trustee, Evans Scholarship Foundation |
Albert R. Dowden — 1941 Trustee | | 2001 | | Director of a number of public and private business corporations, including Nature’s Sunshine Products, Inc. Formerly: Director, The Boss Group, Ltd. and Reich & Tang Funds (5 portfolios) (registered investment company); Director, Homeowners of America Holding Corporation/Homeowners of America Insurance Company (property casualty company); Director, Continental Energy Services, LLC (oil and gas pipeline service); Director, CompuDyne Corporation (provider of product and services to the public security market) and Director, Annuity and Life Re (Holdings), Ltd. (reinsurance company); Director, President and Chief Executive Officer, Volvo Group North America, Inc.; Senior Vice President, AB Volvo; Director of various public and private corporations; Chairman, DHJ Media, Inc.; Director, Magellan Insurance Company; and Director, The Hertz Corporation, Genmar Corporation (boat manufacturer), National Media Corporation; Advisory Board of Rotary Power International (designer, manufacturer, and seller of rotary power engines); and Chairman, Cortland Trust, Inc. (registered investment company) | | 146 | | Director of Nature’s Sunshine Products, Inc. |
Jack M. Fields — 1952 Trustee | | 2001 | | Chief Executive Officer, Twenty First Century Group, Inc. (government affairs company); and Discovery Learning Alliance (non-profit) Formerly: Owner and Chief Executive Officer, Dos Angeles Ranch L.P. (cattle, hunting, corporate entertainment); Director, Insperity, Inc. (formerly known as Administaff); Chief Executive Officer, Texana Timber LP (sustainable forestry company); Director of Cross Timbers Quail Research Ranch (non-profit); and member of the U.S. House of Representatives | | 146 | | None |
Eli Jones — 1961 Trustee | | 2016 | | Professor and Dean, Mays Business School — Texas A&M University Formerly: Professor and Dean, Walton College of Business, University of Arkansas and E.J. Ourso College of Business, Louisiana State University and Director, Arvest Bank | | 146 | | Director of Insperity, Inc. (formerly known as Administaff) |
Prema Mathai-Davis — 1950 Trustee | | 2001 | | Retired. Formerly: Chief Executive Officer, YWCA of the U.S.A. | | 146 | | None |
Larry Soll — 1942 Trustee | | 2003 | | Retired. Formerly: Chairman, Chief Executive Officer and President, Synergen Corp. (a biotechnology company) | | 146 | | None |
Raymond Stickel, Jr. — 1944 Trustee | | 2005 | | Retired. Formerly: Director, Mainstay VP Series Funds, Inc. (25 portfolios) and Partner, Deloitte & Touche | | 146 | | None |
Robert C. Troccoli — 1949 Trustee | | 2016 | | Adjunct Professor, University of Denver — Daniels College of Business Formerly: Senior Partner, KPMG LLP | | 146 | | None |
T-2 Invesco International Total Return Fund
Trustees and Officers—(continued)
| | | | | | | | |
Name, Year of Birth and
Position(s) Held with the Trust | | Trustee and/
or Officer Since | | Principal Occupation(s) During Past 5 Years | | Number of
Funds in Fund
Complex
Overseen by
Trustee | | Other Directorship(s)
Held by Trustee During
Past 5 Years |
| Independent Trustees—(continued) |
Suzanne H. Woolsey — 1941 Trustee | | 2014 | | Retired. Formerly: Chief Executive Officer of Woolsey Partners LLC | | 146 | | Director, SunShare LLC; Trustee, Ocean Conservancy; Emeritus Chair of the Board of Trustees of the Institute for Defense Analyses and of Colorado College; Trustee, Chair, Business and Finance Committee of California Institute of Technology; Prior to 2014, Director of Fluor Corp.; Prior to 2010, Trustee of the German Marshall Fund of the United States; Prior to 2010, Trustee of the Rocky Mountain Institute |
| Other Officers | | | | | | | | |
Sheri Morris — 1964 President, Principal Executive Officer and Treasurer | | 1999 | | President, Principal Executive Officer and Treasurer, The Invesco Funds; Vice President, Invesco Advisers, Inc. (formerly known as Invesco Institutional (N.A.), Inc.) (registered investment adviser); and Vice President, PowerShares Exchange-Traded Fund Trust, PowerShares Exchange-Traded Fund Trust II, PowerShares India Exchange-Traded Fund Trust, PowerShares Actively Managed Exchange-Traded Fund Trust, and PowerShares Actively Managed Exchange-Traded Commodity Fund Trust Formerly: Vice President and Principal Financial Officer, The Invesco Funds; Vice President, Invesco AIM Advisers, Inc., Invesco AIM Capital Management, Inc. and Invesco AIM Private Asset Management, Inc.; Assistant Vice President and Assistant Treasurer, The Invesco Funds and Assistant Vice President, Invesco Advisers, Inc., Invesco AIM Capital Management, Inc. and Invesco AIM Private Asset Management, Inc.; and Treasurer, PowerShares Exchange-Traded Fund Trust, PowerShares Exchange-Traded Fund Trust II, PowerShares India Exchange-Traded Fund Trust and PowerShares Actively Managed Exchange-Traded Fund Trust | | N/A | | N/A |
Russell C. Burk — 1958 Senior Vice President and Senior Officer | | 2005 | | Senior Vice President and Senior Officer, The Invesco Funds | | N/A | | N/A |
John M. Zerr — 1962 Senior Vice President, Chief Legal Officer and Secretary | | 2006 | | Director, Senior Vice President, Secretary and General Counsel, Invesco Management Group, Inc. (formerly known as Invesco AIM Management Group, Inc.; Senior Vice President, Invesco Advisers, Inc. (formerly known as Invesco Institutional (N.A.), Inc.) (registered investment adviser); Senior Vice President and Secretary, Invesco Distributors, Inc. (formerly known as Invesco AIM Distributors, Inc.); Director, Vice President and Secretary, Invesco Investment Services, Inc. (formerly known as Invesco AIM Investment Services, Inc.) Senior Vice President, Chief Legal Officer and Secretary, The Invesco Funds; Managing Director, Invesco PowerShares Capital Management LLC; Director, Secretary and General Counsel, Invesco Investment Advisers LLC (formerly known as Van Kampen Asset Management); Secretary and General Counsel, Invesco Capital Markets, Inc. (formerly known as Van Kampen Funds Inc.) and Chief Legal Officer, PowerShares Exchange-Traded Fund Trust, PowerShares Exchange-Traded Fund Trust II, PowerShares India Exchange-Traded Fund Trust, PowerShares Actively Managed Exchange-Traded Fund Trust, and PowerShares Actively Managed Exchange-Traded Commodity Fund Trust Formerly: Director, Secretary, General Counsel and Senior Vice President, Van Kampen Exchange Corp.; Director, Vice President and Secretary, IVZ Distributors, Inc. (formerly known as INVESCO Distributors, Inc.); Director and Vice President, INVESCO Funds Group, Inc.; Director and Vice President, Van Kampen Advisors Inc.; Director, Vice President, Secretary and General Counsel, Van Kampen Investor Services Inc.; Director, Invesco Distributors, Inc. (formerly known as Invesco AIM Distributors, Inc.); Director, Senior Vice President, General Counsel and Secretary, Invesco AIM Advisers, Inc. and Van Kampen Investments Inc.; Director, Vice President and Secretary, Fund Management Company; Director, Senior Vice President, Secretary, General Counsel and Vice President, Invesco AIM Capital Management, Inc.; Chief Operating Officer and General Counsel, Liberty Ridge Capital, Inc. (an investment adviser); Vice President and Secretary, PBHG Funds (an investment company) and PBHG Insurance Series Fund (an investment company); Chief Operating Officer, General Counsel and Secretary, Old Mutual Investment Partners (a broker-dealer); General Counsel and Secretary, Old Mutual Fund Services (an administrator) and Old Mutual Shareholder Services (a shareholder servicing center); Executive Vice President, General Counsel and Secretary, Old Mutual Capital, Inc. (an investment adviser); and Vice President and Secretary, Old Mutual Advisors Funds (an investment company) | | N/A | | N/A |
T-3 Invesco International Total Return Fund
Trustees and Officers—(continued)
| | | | | | | | |
Name, Year of Birth and
Position(s) Held with the Trust | | Trustee and/
or Officer Since | | Principal Occupation(s) During Past 5 Years | | Number of
Funds in Fund
Complex
Overseen by
Trustee | | Other Directorship(s)
Held by Trustee During
Past 5 Years |
| Other Officers—(continued) | | | | | | | | |
| Karen Dunn Kelley — 1960 Senior Vice President | | 2004 | | Senior Managing Director, Investments, Invesco Ltd.; Director, Co-President, Co-Chief Executive Officer, and Co-Chairman, Invesco Advisers, Inc. (formerly known as Invesco Institutional (N.A.), Inc.) (registered investment adviser); Chairman and Director, Invesco Senior Secured Management, Inc.; Senior Vice President, Invesco Management Group, Inc. (formerly known as Invesco AIM Management Group, Inc.); Executive Vice President, Invesco Distributors, Inc. (formerly known as Invesco AIM Distributors, Inc.); Director, Invesco Mortgage Capital Inc. and Invesco Management Company Limited; Senior Vice President, The Invesco Funds Formerly: Vice President, The Invesco Funds (other than AIM Treasurer’s Series Trust (Invesco Treasurer’s Series Trust), Short-Term Investments Trust and Invesco Management Trust); and President and Principal Executive Officer, The Invesco Funds (AIM Treasurer’s Series Trust (Invesco Treasurer’s Series Trust), Short-Term Investments Trust and Invesco Management Trust only); Director and President, INVESCO Asset Management (Bermuda) Ltd., Director, INVESCO Global Asset Management DAC (formerly known as INVESCO Global Asset Management Limited) and INVESCO Management S.A.; Senior Vice President, Van Kampen Investments Inc. and Invesco Advisers, Inc. (formerly known as Invesco Institutional (N.A.), Inc.) (registered investment adviser); Director and President, Fund Management Company; Chief Cash Management Officer, Director of Cash Management, Senior Vice President, and Managing Director, Invesco AIM Capital Management, Inc.; Director of Cash Management, Senior Vice President, and Vice President, Invesco Advisers, Inc. and Vice President, The Invesco Funds (AIM Treasurer’s Series Trust (Invesco Treasurer’s Series Trust), and Short-Term Investments Trust only) | | N/A | | N/A |
Kelli Gallegos — 1970 Vice President, Principal Financial Officer and Assistant Treasurer | | 2008 | | Vice President, Principal Financial Officer and Assistant Treasurer, The Invesco Funds; Assistant Treasurer, Invesco PowerShares Capital Management LLC, PowerShares Exchange-Traded Fund Trust, PowerShares Exchange-Traded Fund Trust II, PowerShares India Exchange-Traded Fund Trust, PowerShares Actively Managed Exchange-Traded Fund Trust, and PowerShares Actively Managed Exchange-Traded Commodity Fund Trust Formerly: Assistant Vice President, The Invesco Funds | | N/A | | N/A |
Tracy Sullivan — 1962 Vice President, Chief Tax Officer and Assistant Treasurer | | 2008 | | Vice President, Chief Tax Officer and Assistant Treasurer, The Invesco Funds; Assistant Treasurer, Invesco PowerShares Capital Management LLC, PowerShares Exchange-Traded Fund Trust, PowerShares Exchange-Traded Fund Trust II, PowerShares India Exchange-Traded Fund Trust, PowerShares Actively Managed Exchange-Traded Fund Trust, and PowerShares Actively Managed Exchange-Traded Commodity Fund Trust Formerly: Assistant Vice President, The Invesco Funds | | N/A | | N/A |
Crissie M. Wisdom — 1969 Anti-Money Laundering Compliance Officer | | 2013 | | Anti-Money Laundering Compliance Officer, Invesco Advisers, Inc. (formerly known as Invesco Institutional (N.A.), Inc.) (registered investment adviser), Invesco Capital Markets, Inc. (formerly known as Van Kampen Funds Inc.), Invesco Distributors, Inc., Invesco Investment Services, Inc., Invesco Management Group, Inc., The Invesco Funds, and PowerShares Exchange-Traded Fund Trust, PowerShares Exchange-Traded Fund Trust II, PowerShares India Exchange-Traded Fund Trust, PowerShares Actively Managed Exchange-Traded Fund Trust and PowerShares Actively Managed Exchange-Traded Commodity Fund Trust; Anti-Money Laundering Compliance Officer and Bank Secrecy Act Officer, INVESCO National Trust Company and Invesco Trust Company; and Fraud Prevention Manager and Controls and Risk Analysis Manager for Invesco Investment Services, Inc. Formerly: Anti-Money Laundering Compliance Officer, Van Kampen Exchange Corp. | | N/A | | N/A |
Robert R. Leveille — 1969 Chief Compliance Officer | | 2016 | | Chief Compliance Officer, Invesco Advisers, Inc. (registered investment adviser); and Chief Compliance Officer, The Invesco Funds Formerly: Chief Compliance Officer, Putnam Investments and the Putnam Funds | | N/A | | N/A |
The Statement of Additional Information of the Trust includes additional information about the Fund’s Trustees and is available upon request, without charge, by calling 1.800.959.4246. Please refer to the Fund’s Statement of Additional Information for information on the Fund’s sub-advisers.
| | | | | | |
Office of the Fund 11 Greenway Plaza, Suite 1000 Houston, TX 77046-1173 | | Investment Adviser Invesco Advisers, Inc. 1555 Peachtree Street, N.E. Atlanta, GA 30309 | | Distributor Invesco Distributors, Inc. 11 Greenway Plaza, Suite 1000 Houston, TX 77046-1173 | | Auditors PricewaterhouseCoopers LLP 1000 Louisiana Street, Suite 5800 Houston, TX 77002-5678 |
| | | |
| | | | | | |
Counsel to the Fund Stradley Ronon Stevens & Young, LLP 2005 Market Street, Suite 2600 Philadelphia, PA 19103-7018 | | Counsel to the Independent Trustees Goodwin Procter LLP 901 New York Avenue, N.W. Washington, D.C. 20001 | | Transfer Agent Invesco Investment Services, Inc. 11 Greenway Plaza, Suite 1000 Houston, TX 77046-1173 | | Custodian State Street Bank and Trust Company 225 Franklin Street Boston, MA 02110-2801 |
T-4 Invesco International Total Return Fund
Explore High-Conviction Investing with Invesco

Invesco mailing information
Send general correspondence to Invesco Investment Services, Inc., P.O. Box 219078, Kansas City, MO 64121-9078.
Important notice regarding delivery of security holder documents
To reduce Fund expenses, only one copy of most shareholder documents may be mailed to shareholders with multiple accounts at the same address (Householding). Mailing of your shareholder documents may be householded indefinitely unless you instruct us otherwise. If you do not want the mailing of these documents to be combined with those for other members of your household, please contact Invesco Investment Services, Inc. at 800 959 4246 or contact your financial institution. We will begin sending you individual copies for each account within 30 days after receiving your request.
Fund holdings and proxy voting information
The Fund provides a complete list of its holdings four times in each fiscal year, at the quarter ends. For the second and fourth quarters, the lists appear in the Fund’s semiannual and annual reports to shareholders. For the first and third quarters, the Fund files the lists with the Securities and Exchange Commission (SEC) on Form N-Q. The most recent list of portfolio holdings is available at invesco.com/completeqtrholdings. Shareholders can also look up the Fund’s Forms N-Q on the SEC website at sec.gov. Copies of the Fund’s Forms N-Q may be reviewed and copied at the SEC Public Reference Room in Washington, D.C. You can obtain information on the operation of the Public Reference Room, including information about duplicating fee charges, by calling 202 551 8090 or 800 732 0330, or by electronic request at the following email address: publicinfo@sec.gov. The SEC file numbers for the Fund are shown below.
A description of the policies and procedures that the Fund uses to determine how to vote proxies relating to portfolio securities is available without charge, upon request, from our Client Services department at 800 959 4246 or at invesco.com/proxyguidelines. The information is also available on the SEC website, sec.gov.
| | |
Information regarding how the Fund voted proxies related to its portfolio securities during the most recent 12-month period ended June 30 is available at invesco.com/proxysearch. The information is also available on the SEC website, sec.gov. Invesco Advisers, Inc. is an investment adviser; it provides investment advisory services to individual and institutional clients and does not sell securities. Invesco Distributors, Inc. is the US distributor for Invesco Ltd.’s retail mutual funds, exchange-traded funds and institutional money market funds. Both are wholly owned, indirect subsidiaries of Invesco Ltd. | |  |
SEC file numbers: 811-05426 and 033-19338 WBD-AR-1 Invesco Distributors, Inc.
There were no amendments to the Code of Ethics (the “Code”) that applies to the Registrant’s Principal Executive Officer (“PEO”) and Principal Financial Officer (“PFO”) during the period covered by the report. The Registrant did not grant any waivers, including implicit waivers, from any provisions of the Code to the PEO or PFO during the period covered by this report.
| ITEM 3. | AUDIT COMMITTEE FINANCIAL EXPERT. |
The Board of Trustees has determined that the Registrant has at least one audit committee financial expert serving on its Audit Committee. The Audit Committee financial expert is Raymond Stickel, Jr. Mr. Stickel is “independent” within the meaning of that term as used in Form N-CSR.
| ITEM 4. | PRINCIPAL ACCOUNTANT FEES AND SERVICES. |
PricewaterhouseCoopers LLP informed the Trust that it has identified an issue related to its independence under Rule 2-01(c)(1)(ii)(A) of Regulation S-X (referred to as the Loan Rule). The Loan Rule prohibits accounting firms, such as PricewaterhouseCoopers LLP, from being deemed independent if they have certain financial relationships with their audit clients or certain affiliates of those clients. The Trust is required under various securities laws to have its financial statements audited by an independent accounting firm.
The Loan Rule specifically provides that an accounting firm would not be independent if it receives a loan from a lender that is a record or beneficial owner of more than ten percent of an audit client’s equity securities. For purposes of the Loan Rule, audit clients include the Funds as well as all registered investment companies advised by the Adviser and its affiliates, including other subsidiaries of the Adviser’s parent company, Invesco Ltd. (collectively, the Invesco Fund Complex). PricewaterhouseCoopers LLP informed the Trust it has relationships with lenders who hold, as record owner, more than ten percent of the shares of certain funds within the Invesco Fund Complex. These relationships call into question PricewaterhouseCoopers LLP’s independence under the Loan Rule with respect to those funds, as well as all other funds in the Invesco Fund Complex.
On June 20, 2016, the SEC Staff issued a “no-action” letter to another mutual fund complex (see Fidelity Management & Research Company et al., No-Action Letter) related to the audit independence issue described above. In that letter, the SEC confirmed that it would not recommend enforcement action against a fund that relied on audit services performed by an audit firm that was not in compliance with the Loan Rule in certain specified circumstances. In October 2016, in connection with its annual communication, PricewaterhouseCoopers LLP communicated, as contemplated by the no-action letter, that it believes that it remains objective and impartial and that a reasonable investor possessing all the facts would conclude that PricewaterhouseCoopers LLP is able to exhibit the requisite objectivity and impartiality to report on the Funds’ financial statements as the independent registered public accounting firm. PricewaterhouseCoopers LLP also represented that it has complied with PCAOB Rule 3526(b)(1) and (2), which are conditions to the Funds relying on the no action letter, and affirmed that it is an independent accountant within the meaning of PCAOB Rule 3520. Therefore, the Adviser, the Funds and PricewaterhouseCoopers LLP concluded that PricewaterhouseCoopers LLP could continue to serve as the Funds’ independent registered public accounting firm. The Invesco Fund Complex relied upon the no-action letter in reaching this conclusion.
If in the future the independence of PricewaterhouseCoopers LLP is called into question under the Loan Rule by circumstances that are not addressed in the SEC’s no-action letter, the Fund will need to take other action in order for the Fund’s filings with the SEC containing financial statements to be deemed compliant with applicable securities laws. Such additional actions could result in additional costs, impair
the ability of the Funds to issue new shares or have other material adverse effects on the Funds. In addition, the SEC has indicated that the no-action relief will expire 18 months from its issuance after which the Invesco Funds will no longer be able rely on the letter unless its term is extended or made permanent by the SEC Staff
(a) to (d)
Fees Billed by PWC Related to the Registrant
PWC billed the Registrant aggregate fees for services rendered to the Registrant for the last two fiscal years as follows:
| | | | | | | | | | | | |
| | | Fees Billed for Services Rendered to the Registrant for fiscal year end 2016 | | | | Fees Billed for Services Rendered to the Registrant for fiscal year end 2015 |
| | | |
Audit Fees | | | $ | 931,700 | | | | | | $ | 931,700 | |
Audit-Related Fees(1) | | | $ | 4,000 | | | | | | $ | 0 | |
Tax Fees(2) | | | $ | 318,830 | | | | | | $ | 376,200 | |
All Other Fees | | | $ | 0 | | | | | | $ | 0 | |
| | | | | | | | | | | | |
Total Fees | | | $ | 1,254,530 | | | | | | $ | 1,307,900 | |
(g) PWC billed the Registrant aggregate non-audit fees of $322,830for the fiscal year ended 2016, and $376,200 for the fiscal year ended 2015, for non-audit services rendered to the Registrant.
| | (1) | Audit-Related fees for the fiscal year ended October 31, 2016 includes fees billed for agreed upon procedures related to regulatory filings. |
| | (2) | Tax fees for the fiscal year end October 31, 2016 includes fees billed for reviewing tax returns and/or services related to tax compliance. Tax fees for fiscal year end October 31, 2015 includes fees billed for reviewing tax returns and/or services related to tax compliance. |
Fees Billed by PWC Related to Invesco and Invesco Affiliates
PWC billed Invesco Advisers, Inc. (“Invesco”), the Registrant’s adviser, and any entity controlling, controlled by or under common control with Invesco that provides ongoing services to the Registrant (“Invesco Affiliates”) aggregate fees for pre-approved non-audit services rendered to Invesco and Invesco Affiliates for the last two fiscal years as follows:
| | | | | | | | | | | | |
| | | Fees Billed for
Non-Audit
Services Rendered
to Invesco and
Invesco Affiliates
for fiscal year end
2016 That Were
Required
to be Pre-
Approved
by the Registrant’s
Audit Committee | | | | Fees Billed for
Non-Audit
Services Rendered
to Invesco and
Invesco Affiliates
for fiscal year end
2015 That Were
Required
to be Pre-
Approved
by the Registrant’s
Audit Committee |
| | | |
Audit-Related Fees | | | $ | 635,000 | | | | | | $ | 574,000 | |
Tax Fees | | | $ | 0 | | | | | | $ | 0 | |
All Other Fees | | | $ | 2,193,000 | | | | | | $ | 3,750,000 | |
| | | | | | | | | | | | |
Total Fees(1) | | | $ | 2,828,000 | | | | | | $ | 4,324,000 | |
| (1) | Audit-Related fees for the year end 2016 include fees billed related to reviewing controls at a service organization. Audit-Related fees for the year end 2015 include fees billed related to reviewing controls at a service organization. |
| | All other fees for the year end 2016 include fees billed related to the identification of structural and organizational alternatives, informed by industry practices, for certain of the company’s administrative activities and functions. All other fees for the year end 2015 include fees billed related to reviewing the operating effectiveness of strategic projects. |
| | (e)(2) There were no amounts that were pre-approved by the Audit Committee pursuant to the de minimus exception under Rule 2-01 of Regulation S-X. |
| | (g) Including the fees for services not required to be pre-approved by the registrant’s audit committee, PWC billed Invesco and Invesco Affiliates aggregate non-audit fees of $5,032,000 for the fiscal year ended October 31, 2016, and $9,083,000 for the fiscal year ended October 31, 2015, for non-audit services rendered to Invesco and Invesco Affiliates. |
| | PWC provided audit services to the Investment Company complex of approximately $22 million. |
| | (h) The Audit Committee also has considered whether the provision of non-audit services that were rendered to Invesco and Invesco Affiliates that were not required to be pre-approved pursuant to SEC regulations, if any, is compatible with maintaining PWC’s independence. |
(e)(1)
PRE-APPROVAL OF AUDIT AND NON-AUDIT SERVICES
POLICIES AND PROCEDURES
As adopted by the Audit Committees
of the Invesco Funds (the “Funds”)
Last Amended May 4, 2016
| | I. | Statement of Principles |
The Audit Committees (the “Audit Committee”) of the Boards of Trustees of the Funds (the “Board”) have adopted these policies and procedures (the “Procedures”) with respect to the pre-approval of audit and non-audit services to be provided by the Funds’ independent auditor (the “Auditor”) to the Funds, and to the Funds’ investment adviser(s) and any entity controlling, controlled by, or under common control with the investment adviser(s) that provides ongoing services to the Funds (collectively, “Service Affiliates”).
Under Section 202 of the Sarbanes-Oxley Act of 2002, all audit and non-audit services provided to the Funds by the Auditor must be preapproved by the Audit Committee. Rule 2-01 of Regulation S-X requires that the Audit Committee also pre-approve a Service Affiliate’s engagement of the Auditor for non-audit services if the engagement relates directly to the operations and financial reporting of the Funds (a “Service Affiliate’s Covered Engagement”).
These Procedures set forth the procedures and the conditions pursuant to which the Audit Committee may pre-approve audit and non-audit services for the Funds and a Service Affiliate’s Covered Engagement pursuant to rules and regulations of the Securities and Exchange Commission (“SEC”) and other organizations and regulatory bodies applicable to the Funds (“Applicable Rules”).1 They address both general pre-approvals without consideration of specific case-by-case services (“general pre-approvals”) and pre-approvals on a case-by-case basis (“specific pre-approvals”). Any services requiring pre-approval that are not within the scope of general pre-approvals hereunder are subject to specific pre-approval. These Procedures also address the delegation by the Audit Committee of pre-approval authority to the Audit Committee Chair or Vice Chair.
| | II. | Pre-Approval of Fund Audit Services |
The annual Fund audit services engagement, including terms and fees, is subject to specific pre-approval by the Audit Committee. Audit services include the annual financial statement audit and other procedures required to be performed by an independent auditor to be able to form an opinion on the Funds’ financial statements. The Audit Committee will receive, review and consider sufficient information concerning a proposed Fund audit engagement to make a reasonable evaluation of the Auditor’s qualifications and independence. The Audit Committee will oversee the Fund audit services engagement as necessary, including approving any changes in terms, audit scope, conditions and fees.
In addition to approving the Fund audit services engagement at least annually and specifically approving any changes, the Audit Committee may generally or specifically pre-approve engagements for other audit services, which are those services that only an independent auditor reasonably can provide. Other audit services may include services associated with SEC registration statements, periodic reports and other documents filed with the SEC.
1 Applicable Rules include, for example, New York Stock Exchange (“NYSE”) rules applicable to closed-end funds managed by Invesco and listed on NYSE.
| | III. | General and Specific Pre-Approval of Non-Audit Fund Services |
The Audit Committee will consider, at least annually, the list of General Pre-Approved Non-Audit Services which list may be terminated or modified at any time by the Audit Committee. To inform the Audit Committee’s review and approval of General Pre-Approved Non-Audit Services, the Funds’ Treasurer (or his or her designee) and Auditor shall provide such information regarding independence or other matters as the Audit Committee may request.
Any services or fee ranges that are not within the scope of General Pre-Approved Non-Audit Services have not received general pre-approval and require specific pre-approval. Each request for specific pre-approval by the Audit Committee for services to be provided by the Auditor to the Funds must be submitted to the Audit Committee by the Funds’ Treasurer (or his or her designee) and must include detailed information about the services to be provided, the fees or fee ranges to be charged, and other relevant information sufficient to allow the Audit Committee to consider whether to pre-approve such engagement, including evaluating whether the provision of such services will impair the independence of the Auditor and is otherwise consistent with Applicable Rules.
| | IV. | Non-Audit Service Types |
The Audit Committee may provide either general or specific pre-approval of audit-related, tax or other services, each as described in more detail below.
“Audit-related services” are assurance and related services that are reasonably related to the performance of the audit or review of the Fund’s financial statements or that are traditionally performed by an independent auditor. Audit-related services include, among others, accounting consultations related to accounting, financial reporting or disclosure matters not classified as “Audit services”; assistance with understanding and implementing new accounting and financial reporting guidance from rulemaking authorities; services related to mergers, acquisitions or dispositions; compliance with ratings agency requirements and interfund lending activities; and assistance with internal control reporting requirements.
“Tax services” include, but are not limited to, the review and signing of the Funds’ federal tax returns, the review of required distributions by the Funds and consultations regarding tax matters such as the tax treatment of new investments or the impact of new regulations. The Audit Committee will not approve proposed services of the Auditor which the Audit Committee believes are to be provided in connection with a service or transaction initially recommended by the Auditor, the sole business purpose of which may be tax avoidance and the tax treatment of which may not be supported in the Internal Revenue Code and related regulations. The Audit Committee will consult with the Funds’ Treasurer (or his or her designee) and may consult with outside counsel or advisers as necessary to ensure the consistency of tax services rendered by the Auditor with the foregoing policy. The Auditor shall not represent any Fund or any Service Affiliate before a tax court, district court or federal court of claims.
Each request to provide tax services under either the general or specific pre-approval of the Audit Committee will include a description from the Auditor in writing of (i) the scope of the service, the fee structure for the engagement, and any side letter or other amendment to the engagement letter, or any other agreement (whether oral, written, or otherwise) between the Auditor and the Funds, relating to the service; and (ii) any compensation arrangement or other agreement, such as a referral agreement, a referral fee or fee-sharing arrangement, between the Auditor (or an affiliate of the Auditor) and any
person (other than the Funds or Service Affiliates receiving the services) with respect to the promoting, marketing, or recommending of a transaction covered by the service. The Auditor will also discuss with the Audit Committee the potential effects of the services on the independence of the Auditor, and document the substance of its discussion with the Audit Committee.
The Audit Committee may pre-approve other non-audit services so long as the Audit Committee believes that the service will not impair the independence of the Auditor. Appendix I includes a list of services that the Auditor is prohibited from performing by the SEC rules. Appendix I also includes a list of services that would impair the Auditor’s independence unless the Audit Committee reasonably concludes that the results of the services will not be subject to audit procedures during an audit of the Funds’ financial statements.
| | V. | Pre-Approval of Service Affiliate’s Covered Engagements |
Rule 2-01 of Regulation S-X requires that the Audit Committee pre-approve a Service Affiliate’s engagement of the Auditor for non-audit services if the engagement relates directly to the operations and financial reporting of the Funds, defined above as a “Service Affiliate’s Covered Engagement”.
The Audit Committee may provide either general or specific pre-approval of any Service Affiliate’s Covered Engagement, including for audit-related, tax or other services, as described above, if the Audit Committee believes that the provision of the services to a Service Affiliate will not impair the independence of the Auditor with respect to the Funds. Any Service Affiliate’s Covered Engagements that are not within the scope of General Pre-Approved Non-Audit Services have not received general pre-approval and require specific pre-approval.
Each request for specific pre-approval by the Audit Committee of a Service Affiliate’s Covered Engagement must be submitted to the Audit Committee by the Funds’ Treasurer (or his or her designee) and must include detailed information about the services to be provided, the fees or fee ranges to be charged, a description of the current status of the pre-approval process involving other audit committees in the Invesco investment company complex (as defined in Rule 2-201 of Regulation S-X) with respect to the proposed engagement, and other relevant information sufficient to allow the Audit Committee to consider whether the provision of such services will impair the independence of the Auditor from the Funds. Additionally, the Funds’ Treasurer (or his or her designee) and the Auditor will provide the Audit Committee with a statement that the proposed engagement requires pre-approval by the Audit Committee, the proposed engagement, in their view, will not impair the independence of the Auditor and is consistent with Applicable Rules, and the description of the proposed engagement provided to the Audit Committee is consistent with that presented to or approved by the Invesco audit committee.
Information about all Service Affiliate engagements of the Auditor for non-audit services, whether or not subject to pre-approval by the Audit Committee, shall be provided to the Audit Committee at least quarterly, to allow the Audit Committee to consider whether the provision of such services is compatible with maintaining the Auditor’s independence from the Funds. The Funds’ Treasurer and Auditor shall provide the Audit Committee with sufficiently detailed information about the scope of services provided and the fees for such services, to ensure that the Audit Committee can adequately consider whether the provision of such services is compatible with maintaining the Auditor’s independence from the Funds.
| | VI. | Pre-Approved Fee Levels or Established Amounts |
Pre-approved fee levels or ranges for audit and non-audit services to be provided by the Auditor to the Funds, and for a Service Affiliate’s Covered Engagement, under general pre-approval or specific pre-approval will be set periodically by the Audit Committee. Any proposed fees exceeding 110% of the maximum pre-approved fee levels or ranges for such services or engagements will be promptly presented to the Audit Committee and will require specific pre-approval by the Audit Committee before payment of any additional fees is made.
The Audit Committee may from time to time delegate specific pre-approval authority to its Chair and/or Vice Chair, so that the Chair or, in his or her absence, Vice Chair may grant specific pre-approval for audit and non-audit services by the Auditor to the Funds and/or a Service Affiliate’s Covered Engagement between Audit Committee meetings. Any such delegation shall be reflected in resolutions adopted by the Audit Committee and may include such limitations as to dollar amount(s) and/or scope of service(s) as the Audit Committee may choose to impose. Any such delegation shall not preclude the Chair or Vice Chair from declining, on a case by case basis, to exercise his or her delegated authority and instead convening the Audit Committee to consider and pre-approve any proposed services or engagements.
Notwithstanding the foregoing, any non-audit services to be provided to the Funds for which the fees are estimated to exceed $500,000 and any Service Affiliate’s Covered Engagement for which the fees are estimated to exceed $500,000 must be pre-approved by the Audit Committee and may not be delegated to the Chair or Vice Chair.
| | VIII. | Compliance with Procedures |
Notwithstanding anything herein to the contrary, failure to pre-approve any services or engagements that are not required to be pre-approved pursuant to the de minimis exception provided for in Rule 2-01(c)(7)(i)(C) of Regulation S-X shall not constitute a violation of these Procedures. The Audit Committee has designated the Funds’ Treasurer to ensure services and engagements are pre-approved in compliance with these Procedures. The Funds’ Treasurer will immediately report to the Chair of the Audit Committee, or the Vice Chair in his or her absence, any breach of these Procedures that comes to the attention of the Funds’ Treasurer or any services or engagements that are not required to be pre-approved pursuant to the de minimis exception provided for in Rule 2-01(c)(7)(i)(C) of Regulation S-X.
On at least an annual basis, the Auditor will provide the Audit Committee with a summary of all non-audit services provided to any entity in the investment company complex (as defined in section 2-01(f)(14) of Regulation S-X, including the Funds and Service Affiliates) that were not pre-approved, including the nature of services provided and the associated fees.
| | IX. | Amendments to Procedures |
All material amendments to these Procedures must be approved in advance by the Audit Committee. Non-material amendments to these Procedures may be made by the Legal and Compliance Departments and will be reported to the Audit Committee at the next regularly scheduled meeting of the Audit Committee.
Appendix I
Non-Audit Services That May Impair the Auditor’s Independence
The Auditor is not independent if, at any point during the audit and professional engagement, the Auditor provides the following non-audit services:
| | • | | Broker-dealer, investment adviser, or investment banking services ; |
| | • | | Expert services unrelated to the audit; |
| | • | | Any service or product provided for a contingent fee or a commission; |
| | • | | Services related to marketing, planning, or opining in favor of the tax treatment of confidential transactions or aggressive tax position transactions, a significant purpose of which is tax avoidance; |
| | • | | Tax services for persons in financial reporting oversight roles at the Fund; and |
| | • | | Any other service that the Public Company Oversight Board determines by regulation is impermissible. |
An Auditor is not independent if, at any point during the audit and professional engagement, the Auditor provides the following non-audit services unless it is reasonable to conclude that the results of the services will not be subject to audit procedures during an audit of the Funds’ financial statements:
| | • | | Bookkeeping or other services related to the accounting records or financial statements of the audit client; |
| | • | | Financial information systems design and implementation; |
| | • | | Appraisal or valuation services, fairness opinions, or contribution-in-kind reports; |
| | • | | Actuarial services; and |
| | • | | Internal audit outsourcing services |
| ITEM 5. | AUDIT COMMITTEE OF LISTED REGISTRANTS. |
Not applicable.
| ITEM 6. | SCHEDULE OF INVESTMENTS. |
Investments in securities of unaffiliated issuers is included as part of the reports to stockholders filed under Item 1 of this Form.
| ITEM 7. | DISCLOSURE OF PROXY VOTING POLICIES AND PROCEDURES FOR CLOSED-END MANAGEMENT INVESTMENT COMPANIES. |
Not applicable.
| ITEM 8. | PORTFOLIO MANAGERS OF CLOSED-END MANAGEMENT COMPANIES. |
Not applicable.
| ITEM 9. | PURCHASES OF EQUITY SECURITIES BY CLOSED-END MANAGEMENT INVESTMENT COMPANY AND AFFILIATED PURCHASERS. |
Not applicable.
| ITEM 10. | SUBMISSION OF MATTERS TO A VOTE OF SECURITY HOLDERS. |
None
| ITEM 11. | CONTROLS AND PROCEDURES. |
| (a) | As of November 21, 2016, an evaluation was performed under the supervision and with the participation of the officers of the Registrant, including the PEO and PFO, to assess the effectiveness of the Registrant’s disclosure controls and procedures, as that term is defined in Rule 30a-3(c) under the Investment Company Act of 1940 (the “Act”), as amended. Based on that evaluation, the Registrant’s officers, including the PEO and PFO, concluded that, as of November 21, 2016, the Registrant’s disclosure controls and procedures were reasonably designed to ensure: (1) that information required to be disclosed by the Registrant on Form N-CSR is recorded, processed, summarized and reported within the time periods specified by the rules and forms of the Securities and Exchange Commission; and (2) that material information relating to the Registrant is made known to the PEO and PFO as appropriate to allow timely decisions regarding required disclosure. |
| (b) | There have been no changes in the Registrant’s internal control over financial reporting (as defined in Rule 30a-3(d) under the Act) that occurred during the second fiscal quarter of the period covered by this report that have materially affected, or are reasonably likely to materially affect, the Registrant’s internal control over financial reporting. |
| 12(a) (2) | Certifications of principal executive officer and principal financial officer as required by Rule 30a-2(a) under the Investment Company Act of 1940. |
| 12(b) | Certifications of principal executive officer and principal financial officer as required by Rule 30a-2(b) under the Investment Company Act of 1940. |
SIGNATURES
Pursuant to the requirements of the Securities Exchange Act of 1934 and the Investment Company Act of 1940, the Registrant has duly caused this report to be signed on its behalf by the undersigned, thereunto duly authorized.
Registrant: AIM Investment Funds (Invesco Investment Funds)
| | |
| |
| By: | | /s/ Sheri Morris |
| | Sheri Morris |
| | Principal Executive Officer |
| |
| Date: | | January 6, 2017 |
Pursuant to the requirements of the Securities and Exchange Act of 1934 and the Investment Company Act of 1940, this report has been signed below by the following persons on behalf of the Registrant and in the capacities and on the dates indicated.
| | |
| |
| By: | | /s/ Sheri Morris |
| | Sheri Morris |
| | Principal Executive Officer |
| |
| Date: | | January 6, 2017 |
| | |
| |
| By: | | /s/ Kelli Gallegos |
| | Kelli Gallegos |
| | Principal Financial Officer |
| |
| Date: | | January 6, 2017 |
EXHIBIT INDEX
| | |
| 12(a) (1) | | Code of Ethics. |
| |
| 12(a) (2) | | Certifications of principal executive officer and principal financial officer as required by Rule 30a-2(a) under the Investment Company Act of 1940. |
| |
| 12(a) (3) | | Not applicable. |
| |
| 12(b) | | Certifications of principal executive officer and principal financial officer as required by Rule 30a-2(b) under the Investment Company Act of 1940. |